Embed Size (px)
Citation preview

NRC Publications Archive (NPArC)Archives des publications du CNRC (NPArC)
Publisher’s version / la version de l'éditeur: International Journal on Intelligent Data Analysis, 1, 1, 1997
Data Pre-Processing and Intelligent Data AnalysisFamili, Fazel; Shen, W.-M.; Weber, R.; Simoudis, E.
Contact us / Contactez nous: [email protected].
http://nparc.cisti-icist.nrc-cnrc.gc.ca/npsi/jsp/nparc_cp.jsp?lang=frL’accès à ce site Web et l’utilisation de son contenu sont assujettis aux conditions présentées dans le site
Web page / page Web
http://nparc.cisti-icist.nrc-cnrc.gc.ca/npsi/ctrl?action=rtdoc&an=5765066&lang=enhttp://nparc.cisti-icist.nrc-cnrc.gc.ca/npsi/ctrl?action=rtdoc&an=5765066&lang=fr
LISEZ CES CONDITIONS ATTENTIVEMENT AVANT D’UTILISER CE SITE WEB.
READ THESE TERMS AND CONDITIONS CAREFULLY BEFORE USING THIS WEBSITE.
Access and use of this website and the material on it are subject to the Terms and Conditions set forth athttp://nparc.cisti-icist.nrc-cnrc.gc.ca/npsi/jsp/nparc_cp.jsp?lang=en
Data Preprocessing and Intelligent Data Analysis Submitted to Intelligent Data Analysis Journal
24 March 1997 28
[52] R. Weber, Fuzzy-ID3: A Class of Models for Automatic Knowledge Acquisition,Proceedings of the 2nd International Conference on Fuzzy Logic and Neural Networks,Tisuka, Japan (1992), 265-268.
[53] S.M. Weiss and C.A. Kulikowski,Computer Systems That Learn, MorganKaufmann Publishers, California, (1991).
[54] J. Wnek and R.S. Michalski, Hypothesis-Driven Constructive Induction in AQ17-HCI: A Method and Experiments,Machine Learning, 14 (2), (1994), 139-168.
[55] A. Wu and J. Meador, Data Driven Neural-Based Measurement Discrimination forIC Parametric Faults Diagnosis, Design, Test and Application,ASICS and Systems-on-a-Chip: Digest of Papers-IEEE VLSI Test Symposium, Atlantic City, NJ. (1992), 194-197.
[56] S.M. Yarling, Time Series Modelling as an Approach to Automatic Feedback Con-trol of Robotic Positioning Errors,Proceedings of IEEE International Symposium onElectronics Manufacturing Technology, (1993), 443-449.
[57] H.J. Zimmermann,Fuzzy Set Theory and Its Applications. Third Edition, KluwerAcademic Publishers, Boston, (1996).
Data Preprocessing and Intelligent Data Analysis Submitted to Intelligent Data Analysis Journal
24 March 1997 27
[38] P. Riddle, R. Segal, and O. Etzioni, Representation Design and Brute-Force Induc-tion in a Boeing Manufacturing Domain,Applied Artificial Intelligence, 8 (1994), 125-147.
[39] A. Rieger, Data Preparation for Inductive Learning in Robotics,IJCAI Workshopon Data Engineering for Inductive Learning, Montreal, Canada (1995), 70-78.
[40] P. Rubel, J. Fayn, P.W. Macfarlane, and J.L. Willems, Development of a Concep-tual Reference Model for Digital ECG Data Storage,Proceedings of Computers in Car-diology Conference, (1991), 109-112.
[41] Y. Senol and M.P. Gouch, The Application of Transputers to a Sounding RocketInstrumentation: On-Board Autocorrelators with Neural Network Data Analysis,Paral-lel Computing and Transputer Applications (First Ed), (1992), 798-806.
[42] J. Sjoberg, Regularization as a Substitute for Preprocessing of Data in Neural Net-work Training,Artificial Intelligence in Real-Time Control (First Ed.), (1992), 31-35.
[43] S. Smith, C. Gordon, Rapid Yield Learning Through Data Integration,Semicon-ductor International, 19(10), (1996), 97-102.
[44] H.W. Sorenson,Kalman Filtering: Theory and Application, IEEE Press, NewYork, (1985).
[45] K. Staenz, Quality Assessment and Preprocessing of Data Acquired with the Pro-grammable Multispectral Imager,Canadian Journal of Remote Sensing,17(3), (1991),231-239.
[46] R. Stein, Preprocessing Data for Neural Networks,AI Expert(1993), 32-38.
[47] G.D. Tattersall, K. Chichlowski, and R. Limb, Preprocessing and Visualization ofDecision Support Data for Enhanced Machine Classification,Proceedings First Inter-national Conference on Intelligent Systems Engineering,Edinburgh, England (1991),275-280.
[48] P. Thirion, Direct Extraction of Boundaries from Computed Tomography Scans,IEEE Transactions on Medical Imaging,13(2), (1994), 322-328.
[49] P. Turney, Data Engineering for the Analysis of Semiconductor ManufacturingData,IJCAI Workshop on Data Engineering for Inductive Learning,Montreal, Canada(1995), 50-59.
[50] M.R. Versaggi, Understanding Conflicting Data,AI Expert (April 1995), 21-25.
[51] J.T.W.E. Vogels, A.C. Tas, F. van den Berg and J. van der Greef, A New Methodfor Classification of Wines Based on Proton and Carbon-13 NMR Spectroscopy inCombination with Pattern Recognition Techniques,Chemometrics and Intelligent Lab-oratory Systems:Laboratory Information Management, 21 (1993), 249-258.
Data Preprocessing and Intelligent Data Analysis Submitted to Intelligent Data Analysis Journal
24 March 1997 26
[24] B. Marangelli, Data Preprocessing for Adaptive Vector Quantization,Image andVision Computing,9(6), (1991), 347-352.
[25] C. Matheus,Feature Construction: An Analytic Framework and Application toDecision Trees, Ph.D. Dissertation, University of Illinois, Computer Science Depart-ment, Urbana-Champaign, (1989).
[26] A.D. McAulay and J. Li, Wavelet Data Compression for Neural Network Preproc-essing, Signal Processing,Sensor Fusion and Target Recognition SPIE 1699 (1992),356-365.
[27] W. Meier, R. Weber, and H.J. Zimmermann, Fuzzy Data Analysis - Methods andIndustrial Applications,Fuzzy Sets and Systems, (61), (1994), 19-28.
[28] J.R. Mekemson, User Interface for FHWA's TRAF-FRESIM Model,Proceedingsof 4th International Conference on Microcomputers in Transportation, Baltimore, Mar-yland (1992), 516-527.
[29] J.D. Meng and J.E. Katz, Using a Digital Signal Processor as a Data Stream Con-troller in Digital Subtraction Angiography,Proceedings of IEEE Nuclear Science Sym-posium and Medical Imaging Conference, Santa Fe, New Mexico (1991), 1839-1843.
[30] R.S. Michalski,et al, The Multi-Purpose Incremental Learning System AQ15 andits Testing Application to Three Medical Domains, Proceedings of AAAI-86, Philadel-phia, PA. AAAI Press, (1986), 1041-1045.
[31] G. Murphy,Similitude in Engineering, The Ronald Press Company, New York,(1950).
[32] V. Nedeljkovic and M. Milosavljevic, On the Influence of the Training Set DataPreprocessing on Neural Networks Training,Proceedings of 11th IAPR InternationalConference on Pattern Recognition (1992), 33-36.
[33] D. Nikolayev and K. Ullemeyer, A Note on Preprocessing of Diffraction Pole-den-sity Data,Journal of Applied Crystallography,27 (1994), 517-520.
[34] G. Noriega and S. Pasupathy, Application of Kalman Filtering to Real-Time Pre-processing of Geophysical Data,IEEE Transactions on Geoscience and Remote Sens-ing, 30,5(1980), 897-910.
[35] M. Ohta, E. Uchinol, and O. Nagano, A New State Estimation Method with Pre-fixed Algorithmic Form Matched to Effective Data Processing,Acustica, 77(1992),165-175.
[36] G. Pagallo, Learning DNF by Decision Trees,Proceedings of International JointConference on Artificial Intelligence, Morgan Kaufmann, Palo Alto, CA, Vol. I, (1989),639-644.
[37] J. R. Quinlan,C4.5: Programs for Machine Learning,Morgan Kaufmann Publish-ers, San Mateo, CA, (1993).
Data Preprocessing and Intelligent Data Analysis Submitted to Intelligent Data Analysis Journal
24 March 1997 25
[12] Z. Duszak and W.W. Loczkodaj,Using Principal Component Transformation inMachine Learning, Proceedings of International Conference on Systems Research,Informatics and Cybernetics, Baden-Baden Germany, (1994), 125-129.
[13] W. Emde, C.U. Habel, and C.R. Rollinger, The Discovery of the Equator or Con-cept Driven Learning,Proceedings of IJCAI-83,Sydney Australia, Morgan Kaufmann(1983), 455-458.
[14] B. C. Falkenhainer and R.S. Michalski, Integrating Quantitative and QualitativeDiscovery in the ABACUS System, In Y. Kodratoff and R.S. Michalski, eds.,MachineLearning: An Artificial Intelligence Approach, III, Morgan Kaufmann, Palo Alto, CA,(1990), 153-190.
[15] A. Famili, and P. Turney, Intelligently Helping Human Planner in Industrial Pro-cess Planning,AIEDAM, 5(2), (1991), 109-124.
[16] U. Fayyad, G. Piatetsky-Shapiro, and P. Smyth, From Data Mining to KnowledgeDiscovery, In U. Fayyadetal, eds., Advances in Knowledge Discovery and Data Min-ing, AAAI/MIT Press, Menlo Park, CA, (1996), 1-34.
[17] L. Hesselink, Research Issues in Vector and Tensor Field Visualization,Proceed-ings of IEEE Workshop on Visualization and Machine Vision, Seattle, WA. (1994), 104-105.
[18] S. Iwasaki, Clustering of Experimental Data and its Applications to Nuclear DataEvaluation,Proceedings of the Symposium on Nuclear Data, Tokai, Japan (1992), 211-221.
[19] M. Ke and M. Ali, MLS, A Machine Learning System for Engine Fault Diagnosis,Proceedings of the 1st International Conference on IEA/AIE, Tullahoma, TN. (1988),24-30.
[20] P.M. Kelly and J.W. White, Preprocessing Remotely-Sensed Data for EfficientAnalysis and Classification, Applications of Artificial Intelligence,Proceedings ofSPIE-The International Society for Optical Engineering-1963, Orlando, FL. (1993),24-30.
[21] P. Langley, G.L. Bradshaw, and H.A. Simon, Rediscovering Chemistry with theBacon System, In R.S. Michalski, J.G. Carbonell, and T.M. Mitchell, eds.,MachineLearning: An Artificial Intelligence Approach, Morgan Kaufmann, Los Altos, CA,(1983), 307-326.
[22] N. Lavrac, D. Gamberger, and P. Turney, Cost-Sensitive Feature ReductionApplied to a Hybrid Genetic Algorithm,Proceedings of the 7th International Workshopon Algorithmic Learning Theory, Sydney, Australia (1996), 1-12.
[23] D.B. Lenat, Learning from Observation and Discovery, In R.S. Michalski, J.G.Carbonell, and T.M. Mitchell, eds.,Machine Learning: An Artificial IntelligenceApproach, Morgan Kaufmann, Palo Alto, CA, (1983), 243-306.
Data Preprocessing and Intelligent Data Analysis Submitted to Intelligent Data Analysis Journal
24 March 1997 24
Acknowledgements:
The authors would like to thank Sylvain Létourneau for providing comments on an ear-lier version of this paper.
References
[1] M.R. Azimi-Sadjadi and S.A. Stricker, Detection and Classification of Buried Die-lectric Anomalies Using Neural Networks - Further Results,IEEE Trans. on Instrumen-tations and Measurement, 43(1) (1994), 34-39.
[2] J.C. Bezdek and S.K. Pal,Fuzzy Models for Pattern Recognition, IEEE Press, NewYork (1992).
[3] D.G. Bobrow and D.A. Norman, Some principles of Memory Schemata, in D.G.Bobrow and A. Collins, Eds.,Representation and Understanding: Studies in CognitiveScience, Academic Press, New York (1975), 138-140.
[4] E. Bontrager,et al, GAIT-ER-AID: An Expert System for Analysis of Gait withAutomatic Intelligent Pre-processing of Data,4th Annual Symposium on ComputerApplications in MED CARE (1990), 625-629.
[5] R.L. Chen and C.J. Spanos, Statistical Data Pre-processing for Fuzzy Modelling ofSemiconductor Manufacturing Process,Proc. 3rd Intl. Conf. on Industrial Fuzzy Con-trol and Intelligent Systems, Houston, Texas (1993), 6-11.
[6] J.J. Clark,Data Fusion for Sensory Information Processing Systems, Kluwer Aca-demic Publishers, (1990).
[7] C. Cortes, L.D. Jackel, and W.P. Chiang, Limits on Learning Machine AccuracyImposed by Data Quality,Proceedings of the First International Conference on Knowl-edge Discovery & Data Mining, Montreal, Canada (1995), 57-62.
[8] V.G. Dabija. et al, Learning to Learn Decision Trees,Proceedings of the NinthAmerican Conference on Artificial Intelligence, San Jose, CA. (1992), 88-95.
[9] J.F. Davis, B. Bakshik, K. Kosanovich, and M. Piovoso, Process Monitoring, DataAnalysis and Data Interpretation,Proceedings of the Intelligent Systems in ProcessEngineering Conference, Snowmass, CO. (1995), 1-12.
[10] O.E. de Noord, The Influence of Data Preprocessing on the Robustness and Parsi-mony of Multivariate Calibration Models,Chemometrics and Intelligent LaboratorySystems, 23 (1) (1994), 65-70.
[11] J. DeWitt, Adaptive Filtering Network for Associative Memory Data Preprocess-ing, World Congress on Neural Networks, San Diego, CA (1994), IV34-IV38.
Data Preprocessing and Intelligent Data Analysis Submitted to Intelligent Data Analysis Journal
24 March 1997 23
5.0 Concluding Remarks and Challenges
In this paper we have provided an overview of problems with the real world data. Wehave also discussed a number of data preprocessing techniques. These are techniquesthat are applied in order to: (i) solve data problems, (ii) understand the nature of thedata, and (iii) perform a more in-depth data analysis. Two real world applications, thatcontain a number of data problems, were given and the approaches taken to solve dataproblems were explained.
The following are some of the important issues to be considered when data has to bepreprocessed for data analysis:
(i) Although data preprocessing is useful and in many applications necessary in order toperform a meaningful data analysis, if proper techniques are not selected, it may resultin loss or change of useful information to be discovered during the analysis.
(ii) To perform a meaningful data preprocessing, either the domain expert should be amember of the data analysis team or the domain should be extensively studied beforethe data is preprocessed. Involvement of the domain expert would result in some usefulfeedback to verify and validate the use of particular data preprocessing techniques.
(iii) In most applications, data preprocessing may be iterative. This means that certainpreprocessing techniques, such as data elimination or data selection, may be used in anumber of iterations until the best data analysis results are obtained.
One of the most important problems in data preprocessing is how do we know what val-uable information exists in the raw data so that we can make sure it is preserved. Thismay depend upon our definition of data preprocessing. Some may argue that data pre-processing is not a completely “pre” process of data analysis. It needs feedback fromthe main data analysis process. After all, the ultimate judgement whether one has donea good job for data preprocessing is to see if the “valuable information” has been foundin the later data analysis process.
Of the most important challenges in this area of research is development of a tool boxor an expert system that can provide proper advice for selection and use of the best datapreprocessing technique. Given some preliminary information about the data and thedomain and all the data analysis objectives, one should be able to develop:
(i) An expert system that can look at a sample of data and some additional informationpresented by the user to provide some advice as the best data preprocessing strategy tobe applied.
(ii) A tool box containing all data preprocessing techniques with examples that can beused as required. A possible link between the expert system and the tool box can dem-onstrate how particular data preprocessing techniques can influence the results of dataanalysis.
Data Preprocessing and Intelligent Data Analysis Submitted to Intelligent Data Analysis Journal
24 March 1997 22
data analysis algorithms given the data status. In addition, we had to select the data setsfrom the following levels of granularity:
• fleet level where we had to select the data sets that contained relevant parameters forthe entire fleet of aircraft,
• aircraft level where the selection was for data sets that contained parameters for aparticular aircraft,
• engine level where we had to select the data sets that contained relevant parametersfor particular engine of an aircraft,
• operation level where the selection was for data sets that contained parameters repre-senting specific duration of aircraft operation.
Data Preprocessing and Intelligent Data Analysis Submitted to Intelligent Data Analysis Journal
24 March 1997 21
Out-of-range data is the most difficult problem to detect. This is for cases in which thedata for particular parameters does not contain a meaningful value, whether it is a sen-sor measurement or the value of a parameter that is automatically generated by a soft-ware under certain conditions. In addition, some technical background (domainknowledge) may be required to understand the proper range of some parameters, as forcertain parameters a range may be acceptable under certain conditions and not accepta-ble under others. Two methods that we applied to identify some of the out-of-range datawere data visualization and preliminary analysis of statistical information of numericparameters.
(iv) Incomplete records
In parametric data, we encountered cases (data records) in which a substantial numberof parameters were not available. For example, in engine divergence reports, that aregenerated when certain engine parameters exceed a threshold, some records did notcontain all snap shots of engine parameters. This caused a problem so that in small timewindows that only 50 records were available, if 20% of them had incomplete records,the remaining ones were not sufficient for the data analysis.
4.2.2 Use of Data Preprocessing Techniques
There were two objectives for using data preprocessing techniques in the aerospaceapplication: (i) to solve problems in the data, and (ii) to learn more about the nature ofthe data.
For missing parameters, after identifying the percent of missing attributes in eachrecord, records containing more than 20% were eliminated and the ones with 20% orless, were kept for data analysis. Of the two analysis engines [15, 36] used for decisiontree induction, one handled missing attributes by replacing them with values derivedfrom the existing ones.
For improper data types, we treated this problem in two ways: (i) we eliminated all therecords that contained improper data types. This was in the cases where a large numberof parameters (> 20%) were of improper types. This obviously caused loss of some use-ful data, (ii) we replaced improper data types by N/A’s that were treated similar to miss-ing attributes.
For range checking, ideally there should be a data range file set up so that all the dataare filtered for out-of-range values before they are used. After identifying data sets andrecords with out-of-range data, we treated the out-of-range attribute values the sameway as corrupt ones.
Handling incomplete records required some additional work. This was for particulardata sets that contained up to 8 pairs of snap shots. Data subsets representing recordswith up to 4, 6 and 8 snapshots were created and analysed separately.
This application required an in-depth understanding of the domain and handling datafrom different levels of granularity. We had to know the domain knowledge for the pur-pose of: (i) filtering data for corrupt and out-of-range attributes, (ii) selecting proper
Data Preprocessing and Intelligent Data Analysis Submitted to Intelligent Data Analysis Journal
24 March 1997 20
4.2 Aerospace Domain
This application is related to the analysis of operation and maintenance data collectedby a commercial airline that operates a number of highly sophisticated aircraft. Thegoal of the analysis was to generate decision trees that can explain either performanceor component failures in the operation of the aircraft. Performance failures are particu-lar cases of aircraft operation in which a performance parameter is below or above anacceptable level (e.g. engine-exhaust-temperature > 700). Component failures are casesin which a particular component fails, it is replaced and the problem is rectified (e.g.temperature sensor failure).
The data is generated from the aircraft when it is either on the ground or in a flight. Thedata consists of several groups, three of which are: (i) logs of aircraft operation prob-lems or snags (e.g. replaced #2 engine LPTCC), (ii) failure/warning messages (descrip-tive text) generated by on-board computers when certain parameters exceed a threshold(e.g. engine 2 exhaust gas temperature over limit), (iii) parametric data of various sen-sor measurements collected during different phases of aircraft operation (e.g. engineexhaust gas temperature, shaft speed). Parametric data comes in several groups, gener-ated at different stages of aircraft operation. Examples are engine cruise and enginedivergence data sets that are generated at different frequencies. Each group consists of100-300 parameters of numeric and symbolic attributes. For certain groups, such asengine divergence data, each record may contain up to 16 snap shots of divergencerelated parameters, each representing data measured atx number of seconds before orafter occurrence of the incident.
4.2.1 Problems with the Data
Data from the real world is never perfect. The aerospace application discussed in thispaper was not an exception. The extracted Snags and warning/failure messages seemedrelatively clean and complete. However, the parametric group of data, that representsvarious conditions of the aircraft and its operation (such as engine parameters) con-tained several forms of improper and incomplete data. Following are classes of prob-lems that we observed:
(i) Missing attributes and missing attribute values
Each record in parametric group of data consists of several numeric and non-numericparameters. We noticed that, within each record, a number of parameters had not beenmeasured, recorded, or transferred properly. As a result, the final converted data hadrecords with missing attributes or missing attribute values.
(ii) Improper types (numeric/symbolic data)
For an efficient and meaningful data analysis, the parameter values in each field have tobe of the same type (numeric or non-numeric). In this application, it was noticed in sev-eral cases, that the parameter types were not consistent.
(iii) Out-of-range data
Data Preprocessing and Intelligent Data Analysis Submitted to Intelligent Data Analysis Journal
24 March 1997 19
Sensors within a plasma etcher measure several hundred parameters. A subset of theseparameters are periodically captured (approximately once a second) and made availableas in-process data. This constitutes the time sequence data. In a typical scenario, a wafercan spend more than 200 seconds in an etcher. A hundred parameters measured once asecond yield a maximum of 20,000 measurements for a single wafer. The large amountof time sequenced data make this a particularly interesting application of machinelearning techniques. Many commercial products exist for this process [43]
Technically, the task we face is that given a set of positive and negative wafer etchingoperation examples, each being represented as about 100 data sequences (one sequenceper parameter) with more than 200 time steps, to induce a set of probabilistic rules thatcan detect defective wafers during their manufacture process in real-time. Such detec-tion may occur even before a manufacturing operation is completed so that timely cor-rections can be made to the process to minimize the loss of productivity.
4.1.1 Problems with the Data
Data problems in semiconductor manufacturing are due to many reasons. Examples are:(i) sensor related failures at the time of parameter measurements, conversion and trans-mission, (ii) operator related errors at various stages, (iii) software related errors, suchas data acquisition and others. Following are descriptions of some of these errors:
(i) Incomplete Records with missing information for certain parameters of a lot (a lotconsists of a number of bins each with 20-24 wafers).
(ii) Out-of-range data, especially parametric data where probers measure certain param-eters on the wafer.
(iii) Corrupt data due to various reasons in the data acquisition, software or hardware.
4.1.2 Use of Data Preprocessing Techniques
The data collected from any semiconductor manufacturing does not normally showproblems at the first glance. However, when large amounts of data is collected, there isalways a chance of having some problems with the data. Use of proper techniques tosolve data problems is very important. This is due to the information contents of theremaining fields.
Use of a data filtering mechanism is the most common method in dealing with semicon-ductor manufacturing data. Most companies develop their own “range file” whichdepends on the product class, product design, and production process. In other words,data within certain range is only accepted for certain classes of products or processesand rejected for others.
Use of data visualization and some statistical techniques are also common. These tech-niques only allow the process engineers and data analysts to learn about the process(e.g. sensor failure conditions). It would also help in a more accurate analysis of datafor yield analysis [43] or process optimizations (e.g. for proper thresholds for depend-ent parameters and problem definitions).
Data Preprocessing and Intelligent Data Analysis Submitted to Intelligent Data Analysis Journal
24 March 1997 18
4.0 Real World Applications
In this section we provide two examples that include data problems from real worldapplications and the use of some of the techniques discussed in previous section. Thetechniques discussed are related to data transformation and information gathering tech-niques that have been incorporated into a data analysis tool [15] or have been used aspart of a data analysis activity.
4.1 Semiconductor Manufacturing
This application is related to the problem of plasma process faulty detection. The datato be analysed are time sequences from the manufacture of semiconductor wafers. Likemany other industrial processes, semiconductor wafer manufacturing requires verytight process control, yet contains some element of “black art”. The extremely highcosts of the manufacturing equipment and infrastructure, as well as the nature of theindustry provide strong motivation for improving the efficiency of the process, the qual-ity of the products, and yield.
Semiconductor wafer manufacture consists of four main operations performed severaltimes over. These operations are: growth or deposition, patterning or photolithography,etching, and diffusion or implantation. Each operation consists of multiple steps duringwhich the wafer is subject to specific physical and chemical conditions according to arecipe. Testing the unfinished product between manufacturing steps is expensive anddifficult. Reworking a bad product is almost impossible. This leads to two problems.First, when a problem occurs at a particular step, it may go undetected till final test isperformed, thereby tying up downstream processing on a product that has already beendoomed to be scraped. Second, when final test indicates that a product is of bad quality,it is usually difficult to determine which single step in the manufacturing process is thesource of the problem.
Both of these problems would be solved if it were possible to collect the physical andchemical conditions (called in-process data) of wafer processing, and to automaticallydetermine the success or failure of each manufacturing step by inspecting this data.Until recently, it was difficult to access the in-process data for most semiconductormanufacturing operations. Recent efforts by semiconductor equipment manufacturersand semiconductor wafer manufacturers have resulted in the establishment of a com-mon interface (SECS: Semiconductor Equipment Communications Standard) throughwhich different manufacturing tools can make their in-process data available.
The thrust of this work is to specifically study metal etch using reactive ion etch tech-niques in plasma etchers.
A reactive ion etching operation is a process in which reactive gas plasma ions areaccelerated to the wafer surface where both chemical reaction and sputtering take placein a controlled manner to produce the desired etch profile. Typically, etch follows a pho-tolithography operation. In the case of metal etch, a wafer is covered with metal in ametalization step. Then the desired patterns are drawn using photolithography. Finally,etching is used to remove the excess metal, leaving behind the required patterns ofmetal.
Data Preprocessing and Intelligent Data Analysis Submitted to Intelligent Data Analysis Journal
24 March 1997 17
laps with Knowledge Driven Constructive Induction [54] in which domain knowledgeis used to construct a new representation space.
3.3.5 Dimensional Analysis
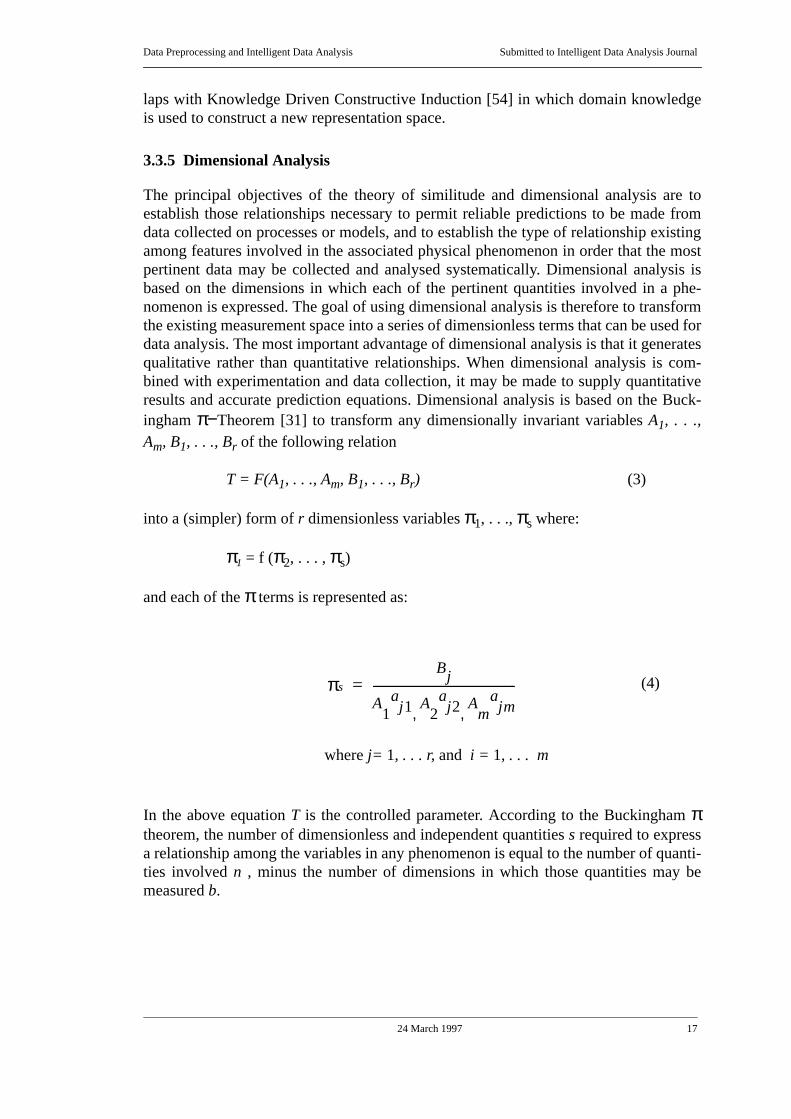
The principal objectives of the theory of similitude and dimensional analysis are toestablish those relationships necessary to permit reliable predictions to be made fromdata collected on processes or models, and to establish the type of relationship existingamong features involved in the associated physical phenomenon in order that the mostpertinent data may be collected and analysed systematically. Dimensional analysis isbased on the dimensions in which each of the pertinent quantities involved in a phe-nomenon is expressed. The goal of using dimensional analysis is therefore to transformthe existing measurement space into a series of dimensionless terms that can be used fordata analysis. The most important advantage of dimensional analysis is that it generatesqualitative rather than quantitative relationships. When dimensional analysis is com-bined with experimentation and data collection, it may be made to supply quantitativeresults and accurate prediction equations. Dimensional analysis is based on the Buck-inghamπ−Theorem [31] to transform any dimensionally invariant variablesA1, . . .,Am, B1, . . ., Br of the following relation
T = F(A1, . . ., Am, B1, . . ., Br) (3)
into a (simpler) form ofr dimensionless variablesπ1, . . .,πs where:
π1 = f (π2, . . . ,πs)
and each of theπ terms is represented as:
In the above equationT is the controlled parameter. According to the Buckinghamπtheorem, the number of dimensionless and independent quantitiess required to expressa relationship among the variables in any phenomenon is equal to the number of quanti-ties involvedn , minus the number of dimensions in which those quantities may bemeasuredb.
πs
Bj
1A j1
a2
A j2a
mA jm
a, ,
-----------------------------------------------------= (4)
wherej= 1, . . . r,and i = 1, . . . m
Data Preprocessing and Intelligent Data Analysis Submitted to Intelligent Data Analysis Journal
24 March 1997 16
Other forms of creating new attributes is in the form of building high level attributes[36]. For example, for machine learning applications, appropriate high level attributesmay be defined a priori or during the data analysis process. A priori attributes aredefined as combinations of the primary attributes of a fixed type and size.
3.3.2 Time Series Analysis
When data exhibits too much variation or non-stationary behaviour, the use of timeseries models from the data may provide a more reliable approach than some othertechniques such as traditional control charting techniques. Variation is present in datafrom most application domains. For example, in industrial processes, this variationcould be due to: (i) process equipment, (ii) raw material used in the process, (iii) proc-ess environment, (iv) human operating procedures and (v) individual decisions or proc-ess plans [56]. In most process monitoring applications, time series analysis meanstransforming data into a static collection of features that represent a view of the opera-tion at some time. This is done during the data interpretation phase in which labels areassigned based on some discriminant relative to the extracted features. Time seriesanalysis may also be applied to transform temporal data into a new form that temporallyrelated events (e.g. records in the data set) that contain trends (e.g. increasing/decreas-ing) be represented into a single record.
3.3.3 Data Fusion
Many types of sensors may be used to gather information on the surrounding environ-ments. Examples are: visual, thermal (infrared), proximity, and tactile sensors, ultra-sonic and laser range finders. In these cases, different sensors are designed based ondifferent physical principles, operate on a wide range of spectrum and possess distinctcharacteristics. Individual parameters measured by each of these sensors operatingalone provide limited sensing range and are inherently unreliable due to the operationalerrors. However a synergistic operation of many sensors provides a rich body of infor-mation on the measured parameters and makes the data analysis more reliable andmeaningful. This means that the measurements form different sensors is fused to pro-vide single parameters that are more meaningful and create accurate results [6]. Someof these data fusion techniques may only be due to the corrections that have to be madeon certain measurements.
3.3.4 Data Simulation
Data simulation deals with the problem of immeasurable or unavailable parameters inlarge measurement spaces. When the model of a process is known but all the parame-ters are not available, it may be possible to simulate those parameters and incorporatethem into the entire measurement space so that the effects of those parameters can beinvestigated. An example is recording some parameters from ambient conditions in acomplex manufacturing process (e.g. semi-conductor manufacturing) that may be eitherdifficult or expensive to measure. However, the effects of these parameters on the proc-ess are known, it may be justifiable to measure and control these parameters asrequired. When the goal of induction is to induce decision trees, data simulation over-
Data Preprocessing and Intelligent Data Analysis Submitted to Intelligent Data Analysis Journal
24 March 1997 15
• Data-Driven in which a data analysis tool analyzes and explores the data focusing oninterrelationships among parameters in a data set and on that basis suggests changesto the representation space in the form of new attributes. BACON [21] and ABA-CUS [14] are examples of systems built based on this approach.
• Knowledge-Driven where the system applies expert provided domain knowledge toconstruct and/or verify new representation space. Use of process knowledge for datacorrection and creation of new features (e.g. use of thermodynamic properties forcorrection of jet engine parameters) are examples of knowledge driven operation.AM [23] and AQ15 [30] are examples of systems based on this approach.
• Hypothesis-Driven where a system incrementally transforms the representationspace by analysing generated results in one iteration of data analysis and using thedetected patterns in the results as attributes for the next iterations. BLIP [13] andCITRE [25] are two systems that incorporate Hypothesis-Driven induction capabil-ity.
If rule-based fuzzy systems are used for data analysis, several parameters have to beestablished which do not exist in conventional rule-based systems. Fuzzy rules are mostoften formulated as “If-Then statements” where theIf-part is called the premisewhereas theThen-part builds the conclusion [57]. TheIf-part consists of an aggrega-tion of vaguely described expressions which are defined by membership functions.Their shape has to be established before such a rule-based fuzzy system can be applied.Hence, this determination of membership functions based on given data sets belongs tothe step of preprocessing. There are several ways how this task can be done. Here weshow how fuzzy clustering approaches can be used for this determination.
In fuzzy clustering objects are grouped into several classes where each object isdescribed by its feature vector [2]. The assignment of objects to classes, however, isdone in a fuzzy sense rather than in a crisp one, i.e. for each object a degree of classmembership is computed. One algorithm which is widely used for fuzzy clustering isFuzzy C-Means [27]. This algorithm is described in more detail in [2].
If for the construction of rule-based fuzzy systems membership functions are needed todefine the vagueness in terms of specific linguistic variables, like high temperature,such fuzzy clustering algorithms can be employed in the following way. The objects tobe clustered are the objects given for the main step of data analysis. As one task of pre-processing their feature values for the respective linguistic variable (e.g. temperature)are taken as the only feature values for clustering. The number of terms of the linguisticvariable determines the number of classes to be found by clustering. By classifyingobjects in this one-dimensional feature space membership values are given as clusterresults. Based on these membership values, the entire membership function can bederived from the given data set. In this way fuzzy clustering supports the task of build-ing a rule-based fuzzy system by automatically generating membership functions.
Generation of membership functions is done as part of the definition of the rule basewhen a rule-based fuzzy system is used for data analysis. Establishing such a rule baseconsists of defining linguistic variables and their terms which are modelled by member-ship functions [2]. Techniques to select proper linguistic variables for rule-based fuzzysystems have been suggested in machine learning applications [52].
Data Preprocessing and Intelligent Data Analysis Submitted to Intelligent Data Analysis Journal
24 March 1997 14
retically, selectingX attributes (fromY) is equivalent to selectingX basis vectors, span-ning the subspace on theseX vectors and projecting the database onto this space.Therefore, identifying principal components allows us to reduce the dimensionality of adatabase in which there are large number of interrelated variables, while retaining asmuch as possible of the variation present in the database. This reduction is achieved bytransforming to a new set of variables, calledprincipal components, which are highlyuncorrelated, and which are ordered so that the first few retain most of the variationpresent in all of the original variables.
Identifying principal components involves checking the linear dependency among inde-pendent variables in a set of data attributes. Whether this is done automatically as partof the data analysis or separate from the analysis process, use of principal componentsrequires domain knowledge. The reason being the importance of parameters reported indata analysis process. For example, if principal components analysis is combined withdecision tree induction for analyzing data from a particular industrial process in whichall process parameters are not controlled and adjusted at the same expense, the resultsof principal components analysis should be carefully reviewed by process engineers sothat parameters are properly selected for decision tree induction.
3.2.5 Data Sampling
Of particular importance to data sampling are cases in which the algorithm used fordata analysis requires a subset of the entire data, either for splitting the data for training/testing or evaluating the performance of the data analysis algorithm through iterativeprocess of varying the sample size such as neural networks applications. The importantissue here is the correct choice of samples (e.g. training/testing) in order to obtain andpreserve the best possible performance for the algorithm in use. For example, in neuralnetworks applications, one usually has only a small set of correctly classified patterns,known as the training set. The main question is: does the given training set fairly repre-sent the underlying class conditional probability density functions? A number of sam-pling techniques have been proposed [32, 53].
3.3 Generation of New Information
Most data analysis applications involve solving problems that are common in day-to-day operation of an enterprise (e.g. a semiconductor wafer fabrication operation). How-ever, within the same enterprise, there are always goals for in-depth analysis of data(e.g. research and development and process optimization). In this case, the goal is to putsome additional effort for an in-depth data analysis and discovery of all valuable infor-mation that may exist in the data.
3.3.1 Adding New Features
Adding new features overlaps with a number of areas such as constructive induction[53] and definition of membership functions (fuzzy clustering). The main operation inconstructive induction is to manually or automatically derive new features in terms ofthe existing ones. The three common forms of constructive induction are:
Data Preprocessing and Intelligent Data Analysis Submitted to Intelligent Data Analysis Journal
24 March 1997 13
3.2.1 Data Visualization
Visualization of data have progressively evolved from techniques that mimic experi-mental methods to more abstract depictions of the data. There are at least two reasonsfor this evolution. First, many important quantitative parameters are not directly meas-urable [17]. Second, proper representation of highly multivariate data contained in vec-tor fields, while at the same time avoiding visual clutter, requires simplification of thedisplay by extracting and rendering only the relevant features of the data.
3.2.2 Data Elimination
In preprocessing the data through data elimination, sometimes two objectives areachieved:
• the volume of the data is reduced substantially. Examples are image data analysis[20].
• the data is partially classified. Examples are associating similar image pixels withone another.
Other form of data elimination is through Univariate Limit Checking methods such as“absolute value check”:
if (Xi,min < Xi(t) < Xi,max) then classwj
where,X(t) is the value of the measured variable at any timet andXmin andXmax are thelower and upper mapping limits, respectively.
3.2.3 Data Selection
To solve the problem of large amounts of data, several researchers have developedmethods for accurately analyzing and categorizing data on much smaller data sets. Bypreprocessing large data sets by a technique known as vector quantization or clustering,computational requirements necessary for data analysis and manipulation are greatlyreduced. Advantages to data selection on large data sets are numerous. Many timesworking with multispectral data, our goal is grouping together sets of similar data -something that clustering algorithms do automatically. Kelly and White [20] developeda clustering technique to analyze large amounts of image data. The basic principle ofclustering in this work is to take an original image and represent the same image usingonly a small number of unique pixel values. In some cases, this resulted in reduction ofthe data by a factor of seven.
Other forms of data selection for digital data is DSP preprocessing of the raw data toreduce the raw data volume by a large factor and potentially producing real-time sub-tracted images for immediate display.
3.2.4 Principal Components Analysis
The use of principal components has been extensively studied [12]. The main goal ofidentifying principal components is to select proper attributes for data analysis. Theo-
Data Preprocessing and Intelligent Data Analysis Submitted to Intelligent Data Analysis Journal
24 March 1997 12
either entered by the people who fill the questionnaires or the staff at a statistics centre.Data editing requires extensive domain knowledge as any incorrect editing of data mayresult in loss of useful information. Proper data editing is also important for natural lan-guage processing and applications in which data is extracted from on-line text in orderto create assertions for a data base.
3.1.4 Noise Modelling
Noise in the data can be attributed to several sources, noise added by amplifiers and sig-nal conditioning circuitry, aperture error and jittering in the sampling device, nonlinear-ities and quantization noise in the analog-to-digital (A/D) converter, extraneous noisepicked up from the environment [40], and data transmissions between channels andsensor thresholds (upper/lower).
Fourier transform is among the most common methods of noise modelling for data pre-processing. Classic Fourier transform analyzes signals in terms of frequency compo-nents among the whole spatial domain, which loses time localization. Fourier transformis therefore appropriate for long time periodic signals. Short time window Fourier trans-form uses a set of window functions to restrict transform length and can be used to pro-vide better time localization. Window size is normally determined by the lowestfrequency.
Several adaptive schemes have been proposed for noise estimation. These methods areclassified into Bayesian, maximum likelihood, correlation, and covariance matching.The first two assume time-invariance of noise statistics and are computationallydemanding. In correlation methods some linear processing of the output is autocorre-lated, and a set of equations is derived that relates these functions to the unknownparameters. Covariance matching techniques attempt to make the filter residuals con-sistent with their theoretical covariances.
Other forms of noise modelling and smoothing, are obtained by data compression,through omitting low frequency components of the data. Data compression can enhanceand improve interpolation which results in better classifications on the testing data sets[26]. Smoothing the data, which is quite sensitive to data reliability, may allow thereduction of measuring time in experiments such as diffraction [33].
One of the most important strengths of noise modelling is that it can help in selection ofrelevant data and proper set up of thresholds in data classifications.
3.2 Information Gathering
We can picture a data analysis tool as a system that can unknowingly analyse data thatare clean and sufficient for a given data analysis task. Limited or incomplete results areobtained when all data characteristics are not known, data analysis is not properlyguided, or different internal parameters within a data analysis tool are not properly set.Our emphasis in this section is to discuss interactive techniques that are applied to thedata so that we can: (i) better understand the nature of the data and (ii) use a given dataanalysis tool more efficiently.
Data Preprocessing and Intelligent Data Analysis Submitted to Intelligent Data Analysis Journal
24 March 1997 11
proper techniques to rectify the problems. Following are a number of techniques thathave been developed and applied to transform data from various domains.
3.1.1 Data Filtering
Data filtering is broad. At one end of the spectrum, data filtering deals with simpleproblems such as corrupt data. At the other end, it deals with noisy data. A number ofdata preprocessing techniques are based on data filtering to remove undesirable data inthe time domain, frequency domain or time-frequency domain. The ideal filtering tech-nique should remove irrelevant features with minimal distortion of the relevant signalfeatures. Of the most common filtering techniques are: (i) time domain filtering, wherethe mean or median of the measured data in a window of predetermined size is taken,(ii) frequency domain filtering, where data is transformed via Fourier analysis and highfrequency contributions are eliminated from the data, (iii) time-frequency domain filter-ing, where the measured data is transformed simultaneously in the time and frequencydomain and provides the ability to capture a wide variety of signal features in a compu-tationally efficient manner. The basic assumption in data filtering is that sufficientamount of domain knowledge is available so that useful information is not lost.
The most common technique is Kalman filtering, which provides the optimum linearrecursive estimator (in the mean-squared form) of the state X(j) at some time tj, givenmeasurements Z(1) through Z(k), wherek > j. Traditional approaches are documentedin [44]. The use of Kalman filtering requires the complete knowledge of noise statistics,which in some real world applications may not be possible. In addition, in Kalman fil-tering, the linearity of the system, the Gaussian distribution properties of the systemnoise and the observation (background) noise are all assumed at the very beginning ofthe analysis [35].
3.1.2 Data Ordering
The most common forms of data ordering are in applications where data are stored inrelational or network database management systems. The main objective here is toorganize data in proper locations (tables) for further retrieval and analysis. A concep-tual data model (e.g. entity relationship) is usually prepared first. Entities and relation-ships are identified. Attributes within the entities are listed and the type of relationships(1-1, 1-n or n-1) are labelled. An example of data ordering for real world application[39] is automatic preprocessing of patient data from ECG (electrocardiogram) processwhere large amounts of data have to be properly ordered for: (i) short-term prior to bereviewed by a physician, (ii) long-term with the perspective of its future use, particu-larly for comparison and other forms of data analysis. Data ordering requires a model ofthe process or system from which the data is acquired and may overlap with data ware-housing.
3.1.3 Data Editing
Data editing is applied in preprocessing text or symbolic data types where the data ele-ments consist of one or more string of characters representing unique information for aparticular attribute. Examples are census related data where data elements have been
Data Preprocessing and Intelligent Data Analysis Submitted to Intelligent Data Analysis Journal
24 March 1997 10
3.1 Data Transformation
The basic limitations in data collection and data analysis are due to the quality and com-pleteness of the data [7]. Inaccuracies in the measurements of input or incorrect feedingof the data to a data analysis tool (e.g. a classifier) could cause various problems. It istherefore the primary task in data analysis to identify these insufficiencies and select
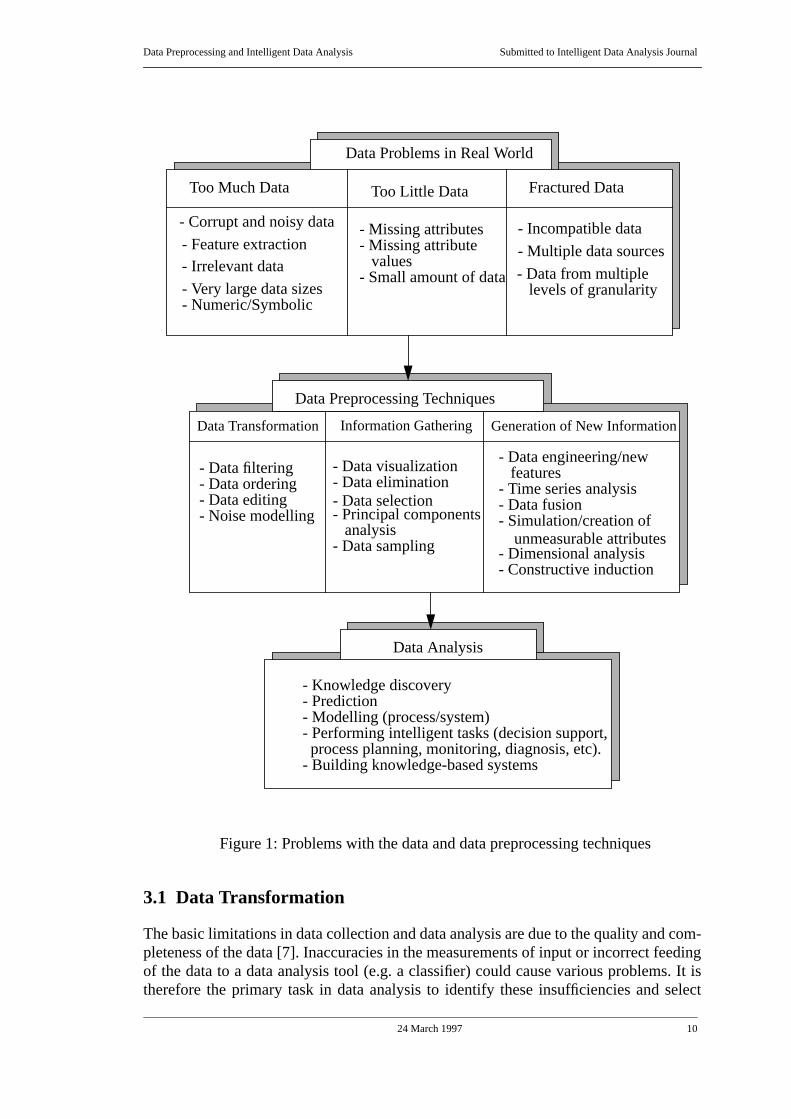
Figure 1: Problems with the data and data preprocessing techniques
- Missing attributes - Incompatible data- Corrupt and noisy data
- Multiple data sources
- Very large data sizes
- Irrelevant data
Data Preprocessing Techniques
Data Transformation Information Gathering Generation of New Information
- Data filtering- Data ordering- Data editing- Noise modelling
- Data visualization- Data elimination- Data selection- Principal components analysis
- Data engineering/new features- Time series analysis- Data fusion- Simulation/creation of unmeasurable attributes- Data sampling
Data Analysis
- Knowledge discovery- Prediction- Modelling (process/system)- Performing intelligent tasks (decision support, process planning, monitoring, diagnosis, etc).
Data Problems in Real World
Too Much Data Too Little Data Fractured Data
- Feature extraction
- Data from multiple levels of granularity
- Dimensional analysis
- Building knowledge-based systems
- Constructive induction
- Missing attribute values- Small amount of data
- Numeric/Symbolic

Data Preprocessing and Intelligent Data Analysis Submitted to Intelligent Data Analysis Journal
24 March 1997 9
applications, such as neural networks, is the accuracy versus simplicity of the results[26]. In most real world applications, there is a need for at least one form of data pre-processing. Almost all applications of inductive techniques require a well planned useof data preprocessing techniques. Fayyad, Piatetsky-Shapiro, and Smyth [16] empha-size use of data preprocessing techniques as an essential part of any knowledge discov-ery from data base project.
To provide a context for presenting a comprehensive listing of data preprocessing tech-niques, we will first look at the definitions and requirements of these techniques. Wewill then present a framework for the existing techniques that have been reported in theliterature. Each technique may have several strengths and weaknesses. In addition, onemust also be aware of the assumptions to properly apply each of these techniques. Forexample, of the techniques related totoo much data, data filtering and data eliminationthrow away data while others like data sampling, help to select the important data sets,yet others like noise modelling and principal component analysis assist in summarizing/compressing the data.
Data Preprocessing and Intelligent Data Analysis Submitted to Intelligent Data Analysis Journal
24 March 1997 8
2.2 Preparation for Data Analysis
When problems with the data are solved and the data is prepared, there are still anumber of steps that can be followed before the actual data analysis starts. All actionstaken to understand the nature of data and advanced techniques to perform in-depthdata analysis are in this category.
2.2.1 Understanding the Nature of Data
When all known problems with the data are solved, understanding the nature of datawould be useful in many ways:
• Proper use of most data analysis tools and interpretation of large and complex datasets are beyond the capability of human brain. It is therefore useful to perform someform of data preprocessing for better understanding of the data. Examples are datavisualization and principal component analysis.
• Most data analysis tools have some limitations related to data characteristics. Itwould therefore be useful to know these characteristics for proper selection and setup of data analysis process. An example is percent of missing attribute values in theentire data set.
• Sensor problems cannot be identified if some form of data preprocessing is not per-formed. Sensor/measurement problems cause unusual data distribution and inaccu-rate data representations. Examples are Analog-to-Digital and Digital-to-Analogconversion processes used in measurements of Analog and Digital Signals.
2.2.2 Data Preprocessing for In-depth Data Analysis
Ordinary data analysis tools and techniques provide means of analyzing data up to alevel that may not be sufficient in all applications. In-depth data analysis requires addi-tional support facilities for data preprocessing, that have to be properly used before theactual data analysis starts. For example, if the data is analyzed for inducing rules andthe data is taken as records representing single events, temporal and other forms oftrends in the data would not be properly recognized through the induction process.However, if the data is transformed so that records represent trends rather than singleevents, the results of data analysis would be more meaningful.
Other forms of data preprocessing for in-depth data analysis are: (i) manual or auto-matic addition of new features that are derived from the existing ones, which overlapswith constructive induction, (ii) data simulation for creating parameters that are not nor-mally measured, (iii) data fusion which is performed for integrating data from multiplesources, and (iv) dimensional analysis which provides support for creation and use ofqualitative rather than quantitative relationships.
3.0 Data Preprocessing Techniques
Data preprocessing is beneficial in many ways. In classifications with neural networks,one can eliminate irrelevant data to produce faster learning due to smaller data sets anddue to reduction of confusion caused by irrelevant data. The common trade-off in many
Data Preprocessing and Intelligent Data Analysis Submitted to Intelligent Data Analysis Journal
24 March 1997 7
contain very useful information. Traditionally if more than 20% of attribute values aremissing, the entire record is eliminated.
iii Small amount of data
In this case, although all data attributes are available, the main problem is that the totalamount of data is not sufficient for all kinds of data analysis. For example, most dataanalysis algorithms require around 100 examples of training data to be properly trainedto classify future examples. The reliability of the concepts learned or rules generatedmay not be sufficient if enough examples are not available.
2.1.3 Fractured data
i. Incompatible data
Data compatibility becomes important when data is collected by several groups. This isspecially true in domains where sensor data are collected and analyzed. Sensor dataconsists of a lot of text and symbolic attributes where groups of data have to be com-bined. The incompatibility problems could be due to human way of representing thetext or even use of natural language understanding/processing capabilities in the datacollection process.
ii. Multiple sources of data
In large enterprises, data could be scattered in a number of departments and on differentplatforms. In most cases, the data is even acquired and maintained using different soft-ware systems. The goal, depth and standard of data collection may vary across theenterprise. As a result, when data from more than one group is required for data analy-sis, problems related to the use of data from multiple sources may arise.
iii. Data from multiple levels of granularity
In some real world applications data comes from more than one level of granularity.Examples are semiconductor manufacturing and aerospace. In semiconductor manufac-turing, data is collected at all stages of production. At the lowest level, data may be col-lected from each integrated circuit on a wafer. These represent measurements for eachunit of production (a typical wafer may contain over 200 integrated circuits). These rep-resent all the measurements that have to be done on all wafer production units. At thenext level, data could come from particular sites on a wafer that are called test sites.This data is collected to estimate similar properties of all the sites on a wafer. Other lev-els are wafer level and bin (batch) level. At the wafer level, the data represent an entirewafer, whether before the production stage such as raw properties of a wafer or after theproduction stage, such as overall thickness [48]. The bin level is the highest level wherethe data represent parameters for a group of wafers in a container (bin).
Similarly, in aerospace domain where data for a large fleet of aircraft are analysed, lev-els of granularity may consist of: (i) fleet level (e.g. all aircraft of a particular type), (ii)aircraft level (e.g. a particular fin-number), (iii) system level (e.g. a particular engine ofan aircraft), and (iv) system operation level (e.g. operation of the engine for a particularduration or cycle).
Data Preprocessing and Intelligent Data Analysis Submitted to Intelligent Data Analysis Journal
24 March 1997 6
In many domains such as space (e.g. image data) and telecommunications (e.g. largenetwork operations), the volume of data and the rate at which data are produced may bea limiting factor on performing on-time data analysis. The amount of data is sometimesbeyond the capability of the available hardware and software used for data analysis. Forexample, interpreting remotely-sensed data requires expensive, specialized computingmachinery capable of storing and manipulating large amounts of data quickly.
vi. Numeric/Symbolic data
When data is organized for analysis, it generally consists of two types:
• numerical data that result from measuring parameters that can be represented by anumber. Numeric data may be either discrete or continuous.
• symbolic or categorical data that result from measuring process or system character-istics. This class of data is usually qualitative.
Analysing data involving both numeric and symbolic parameters is a complex task thatrequires attention during data preprocessing and proper use of the data analysis tool.
2.1.2 Too little data
i. Missing attributes
Missing or insufficient attributes are examples of data problems that may complicatedata analysis tasks such as learning and hinder accurate performance of most data anal-ysis systems. For example in the case of learning, these data insufficiencies limit theperformance on any learning algorithm or a statistical tool applied to the collected data- no matter how complex the algorithm is or how much data is used. On the other hand,the data could look perfect at a glance but may be out-of-range, due to improper sensormeasurements, data conversion/transmission problems. Most factory management soft-ware systems, have access to data range tables which are used to filter out-of-rangedata.
Corrupt and missing attributes create several problems. Following are two examplesfocusing on induction as the data analysis process:
(i) In decision tree induction, missing attributes cause vectors to be of unequal length.This results in a bias when either the information value of the two vectors representingtwo attributes is compared or a test is to be performed on the values of an attribute.
(ii) Many data analysis applications involve splitting the data into training and testingsets. Although the splitting process may be iterated several times, missing attributesmay cause inaccurate evaluation of the results.
ii. Missing attribute values
In this case, the data records are not all complete, some contain missing attribute values.These data records cannot be eliminated because on one hand the total amount of datamay not be sufficient and on the other hand the remaining values in the data record may
Data Preprocessing and Intelligent Data Analysis Submitted to Intelligent Data Analysis Journal
24 March 1997 5
2.1.1 Too much data
i. Corrupt and noisy data
Corrupt data could be due to reasons such as sensor failure, data transmission orimproper data entry, many of them may be unknown at the time of data collection.Noise in the data can be attributed to several reasons:
• data measurement or transmission errors,
• inherent reasons such as characteristics of processes or systems from which data iscollected.
Regardless of the reason, corruptness and noise in the data have to be correctly identi-fied and proper solutions have be found to deal with the problem. In general, noise inthe data would weaken the predictive capability of the features. For any given applica-tion, data sets may be completely noisy, to somewhat noisy, to completely free of noise.On the other hand, data sets that may look noisy on their own and through data visuali-zation, may be highly predictive and noise free.
ii. Feature extraction
In complex on-line data analysis applications, such as chemical processes or pulp andpaper applications, although there may be hundreds of measurements, relatively fewevents may be occurring. The data from these measurements must therefore be mappedinto meaningful descriptions of event(s). This is a difficult task without proper data pre-processing facilities. Preprocessing the data for proper interpretation is a form featureextraction that conditions the input data to allow easier subsequent feature extractionand increased resolution [9]. An example of feature extraction is numeric-symbolicinterpretation where numeric data from a process are mapped into useful labels. Theproblem boundary is defined backwards from the label of interest so that feature extrac-tion is associated only with the input requirements to generate the label.
iii. Irrelevant data
Many data analysis applications require extraction of meaningful data from large datasets. When human beings are in the loop, they select the relevant data by focusing onkey pieces of information and sometimes using the rest of the data only for confirma-tion or to clear up ambiguities. On-line expert systems used for data analysis are exam-ples in which one has to be able to extract relevant information from raw data [4]. Themain goal of eliminating irrelevant data is to narrow the search space in data analysis.
Complexity may be significantly reduced if irrelevant data are eliminated, and only themost relevant features are used for data analysis. Reducing the dimensionality (througheliminating irrelevant data) may also improve the performance of a data analysis tool,since the number of training examples, needed to achieve a desired error rate increaseswith the number of measured variables or features.
iv. Very large data-sizes
Data Preprocessing and Intelligent Data Analysis Submitted to Intelligent Data Analysis Journal
24 March 1997 4
2.0 Data Preprocessing
Data preprocessing consists of all the actions taken before the actual data analysis proc-ess starts. It is essentially a transformationT that transforms the raw real world datavectorsXik to a set of new data vectorsYij
Yij = T (Xik) (1)
such that: (i)Yij preserves the “valuable information” inXik, (ii) Yij eliminates at leastone of the problems inXik and (iii)Yij is more useful thanXik. In the above relation:
i = 1, . . . n wheren = number of objects,
j = 1, . . . m where m = number of features after preprocessing,
k = 1, . . . l where l = number of attributes/features before preprocessing,
and in general,m≠ l.
Valuable information are components of knowledge that exist in the data (e.g. meaning-ful patterns) and it is the goal of data analysis to discover and present them in a mean-ingful way. Fayyad, Piatetsky-Shapiro, and Smyth [16] define four attributes forvaluable information. These are: valid, novel, potentially useful, and ultimately under-standable. Data problems are situations which prevent efficient use of any data analysistool or they may result in generating unacceptable results.
Data preprocessing may be performed on the data for the following reasons:
• solving data problems that may prevent us from performing any type of analysis onthe data,
• understanding the nature of the data and performing a more meaningful data analy-sis, and
• extracting more meaningful knowledge from a given set of data.
In most applications, there is a need for more than one form of data preprocessing.Identification of the type of data preprocessing, is therefore a crucial task.
2.1 Problems with the Data
There are always problems with the real world data. These are best shown in Figure 1and discussed below. The nature and severity of problems depend on many reasons thatare sometimes beyond the control of human operators. Our concern is due to the effectsof these problems on the results of data analysis, the goal being to either rectify the dataproblems ahead of time or recognize the effects of data problems on the results. Dataproblems can be classified into three groups of: too much data, too little data, and frac-tured data which will be discussed in the following.
Data Preprocessing and Intelligent Data Analysis Submitted to Intelligent Data Analysis Journal
24 March 1997 3
In practice, the first operation on any sets of data is preprocessing. Data preprocessingis a time consuming task, which in many cases is semi-automatic. Growing amounts ofdata produced by modern process monitoring and data acquisition systems has resultedin correspondingly large data processing requirements, and therefore, efficient tech-niques for automatic data preprocessing are important [34]. Our goal in this paper is todiscuss problems that we normally encounter with the data, methods we apply to over-come these problems and how we benefit from data preprocessing using these tech-niques.
This paper first provides a brief overview of data preprocessing, focusing on the reasonsas why it is needed. We then discuss a number of frequently encountered real worldproblems in data analysis. These are problems, related to data collected from the realworld, that may have to be dealt with through data preprocessing. We then explain whatadditional forms of data preprocessing are performed to understand the nature of thedata and to perform an in-depth data analysis. Various forms of data preprocessing tech-niques are explained in Section 3.0. Section 4.0 includes two examples of real worldapplications in which data has to be preprocessed. The paper ends with concludingremarks and a list of challenges specific to real world applications.
Data Preprocessing and Intelligent Data Analysis Submitted to Intelligent Data Analysis Journal
24 March 1997 2
1.0 Introduction
Data analysis is the basis for investigations in many fields of knowledge, from scienceto engineering and from management to process control. Data on a particular topic areacquired in the form of symbolic and numeric attributes. The source of these data variesfrom human beings to sensors with different degrees of complexity and reliability.Analysis of these data gives a better understanding of the phenomenon of interest. Themain objective of any data analysis is therefore to discover knowledge that will be usedto solve problems or make decisions. However problems with the data may preventthis. In most cases, imperfections with the data are not noticed until the data analysisstarts. For example, in the development of knowledge based systems, the data analysisis performed to discover and generate new knowledge for building a reliable and com-prehensive knowledge base. The reliability of that portion of the knowledge base that isgenerated through data analysis techniques such as induction, therefore, depends on thedata.
Many efforts are being made to analyse data using commercially available tools or bydeveloping an analysis tool that meets the requirements of a particular application.Some of these efforts have ignored the fact that problems exist with the real world dataand some form of data preprocessing is usually required to intelligently analyse thedata. This means commercial or research tools should provide data preprocessing facil-ities to be used before or during the actual data analysis process. Various objectives mayexist in data preprocessing. In addition to solving data problems, such as corrupt data,irrelevant or missing attributes in the data sets, one may be interested in learning moreabout the nature of the data, or changing the structure of data (e.g. levels of granularity)in order to prepare the data for a more efficient data analysis.
In comparing data preprocessing with human way of processing information, Bobrowand Norman [3] make a similar comparison:
“Consider the human information processing system. Sensory data arrivethrough the sense organs to be processed. Low level computational structuresperform the first stages of analysis and then the results are passed to otherprocessing structures. ... The processing system can be driven either conceptu-ally or by events. Conceptually driven processing tends to be top-down, drivenby motives and goals, and fitting input into expectations: event driven process-ing tends to be bottom-up, finding structures in which to embed the input.”
Various explanations have been given to the role and the need for data preprocessing. Inthe case of modelling, variations in the data which are caused by the changes in processor system conditions, as well as in data collection/transmission can be modelled in con-junction with the target information. Proper data preprocessing can eliminate theseeffects beforehand, which result in more parsimonious models. These models may notnecessarily have better predictive abilities, but are expected to be more robust [10].Data preprocessing would therefore lead to a smaller number of phenomena to be mod-elled, but it may also result in an increase in variance because of estimation errors. Inthe case of learning, data preprocessing would let the users to decide on how to repre-sent the data, which concepts to learn and how to present the results of data analysis sothat it’s easier to interpret and apply them in real world.
Data Preprocessing and Intelligent Data Analysis Submitted to Intelligent Data Analysis Journal
24 March 1997 1
Data Preprocessing and Intelligent Data Analysis
A. Famili (1), Wei-Min Shen(2), Richard Weber(3), Evangelos Simoudis(4)
(1) Institute for Information Technology, National Research Council Canada, Ottawa,Ontario, K1A 0R6 Canada [email protected](2) Information Sciences Institute, University of Southern California, 4676 AdmiraltyWay, Marina del Rey, CA, 90292, USA [email protected](3) Management Intelligenter Technologien GmbH, Promenade 9, 52076 Aachen,Germany [email protected](4) IBM Almaden Research Center, 650 Harry Road, San Jose, CA 95120-6099, [email protected]
Abstract
This paper first provides an overview of data preprocessing focusing on problems of thereal world data. These are primarily problems that have to be carefully understood andsolved before any data analysis process starts. The paper discusses in detail, two mainreasons for performing data preprocessing: (i) problems with the data and (ii) prepara-tion for data analysis. The paper continues with details of data preprocessing techniquesto achieve each of the above mentioned objectives. A total of 14 techniques are dis-cussed. Two examples of data preprocessing applications from two of the most data richdomains are given at the end. The applications are related to semiconductor manufac-turing and aerospace domains where large amounts of data are available and they arefairly reliable. Future directions and some challenges are discussed at the end.
Keywords: data preprocessing, data analysis, data mining.
NRCC#40166


