Embed Size (px)
Citation preview
1
Analyzing and interpreting Analyzing and interpreting datadata
Matt Calvert, UW-Extension Matt Calvert, UW-Extension Youth Development SpecialistYouth Development Specialist
PDAC Wisline WebPDAC Wisline Web February 5, 2009 February 5, 2009
“There’s a world of difference between truth and facts. Facts can obscure the truth.”
- Maya Angelou
2
True or False?True or False?• Complex analysis impresses people.
• I am generally able to analyze and interpret the program data I gather
3
Data analysis and Data analysis and interpretationinterpretation
• Think about analysis EARLY• Start with a plan• Code, enter, clean• Analyze• Interpret• Reflect
– What did we learn?– What conclusions can we draw?– What are our recommendations?– What are the limitations of our analysis?
4
Why do I need an analysis plan?Why do I need an analysis plan?
• To make sure the questions and your data collection instrument will get the information you want.
• To align your desired “report” with the results of analysis and interpretation.
• To improve reliability--consistent measures over time.
5
Key components of a data Key components of a data analysis plananalysis plan• Purpose of the evaluation• Questions• What you hope to learn from the question
• Analysis technique • How data will be presented
6
Analyzing and Interpreting Analyzing and Interpreting Quantitative DataQuantitative Data
• Quantitative Data isPresented in a numerical formatCollected in a standardized mannere.g. surveys, closed-ended interviews, tests
Analyzed using statistical techniques
7
True or False?True or False?
• Quantitative data we gather in Extension are more generalizable than qualitative data.
• Stating limitations weakens the evaluation
8
Analyzing Survey DataAnalyzing Survey DataDo you want to report… • how many people answered a, b, c, d?
• the average number or score?• a change in score between two points in time?
• how people compared?• how many people reached a certain level?
9
Common descriptive statisticsCommon descriptive statistics
• Count (frequencies)• Percentage• Mean• Mode• Median• Range• Standard deviation• Variance• Ranking
10
Other StatisticsOther Statistics
• Statistical Significance• Factor Analysis• Etc.
• Not often used in Extension program evaluation—generally require randomization, large samples, and/or control groups
11
Getting your data readyGetting your data ready
• Assign a unique identifier• Organize and keep all forms (questionnaires, interviews, testimonials)
• Check for completeness and accuracy
• Remove those that are incomplete or do not make sense
12
Data entryData entry
• You can enter your data – By hand– By computer
•http://learningstore.uwex.edu/Using-Excel-for-Analyzing-Survey-Questionnaires-P1030C0.aspx
13
Data entry by computerData entry by computer
• By Computer – Excel (spreadsheet)– Microsoft Access (database mngt)– Quantitative analysis: SPSS (statistical software)
– Qualitative analysis: Epi info (CDC data management and analysis program: www.cdc.gov/epiinfo); In ViVo, etc.
14
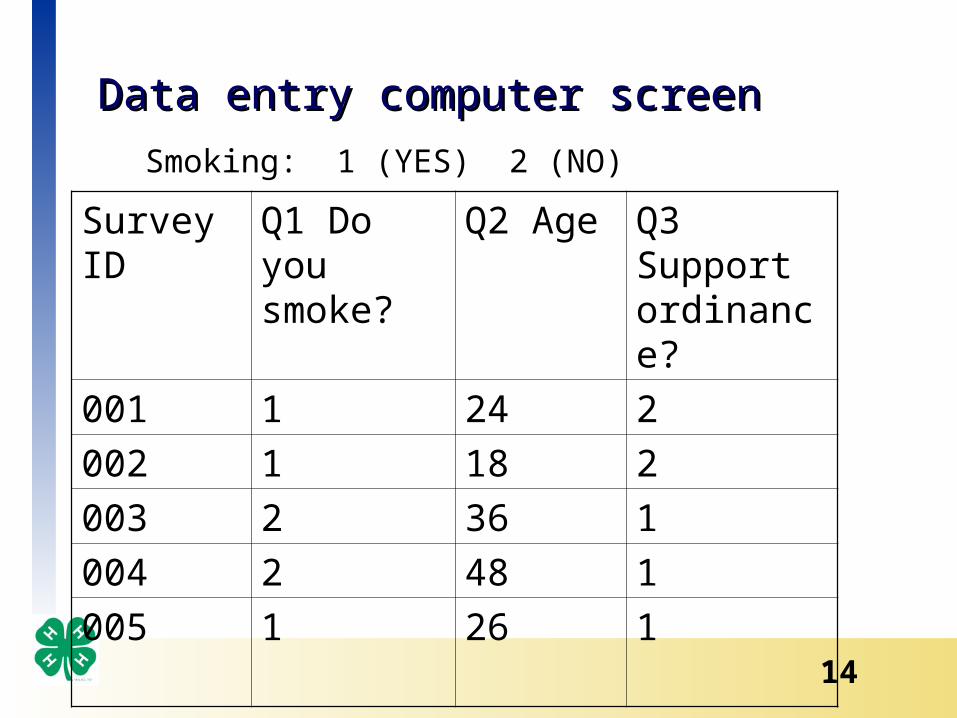
Data entry computer screenData entry computer screen
Survey ID
Q1 Do you smoke?
Q2 Age Q3 Support ordinance?
001 1 24 2002 1 18 2003 2 36 1004 2 48 1005 1 26 1
Smoking: 1 (YES) 2 (NO)
15
Dig deeperDig deeper
• Did different groups show different results?
• Were there findings that surprised you?
• Are there things you don’t understand very well – further study needed?
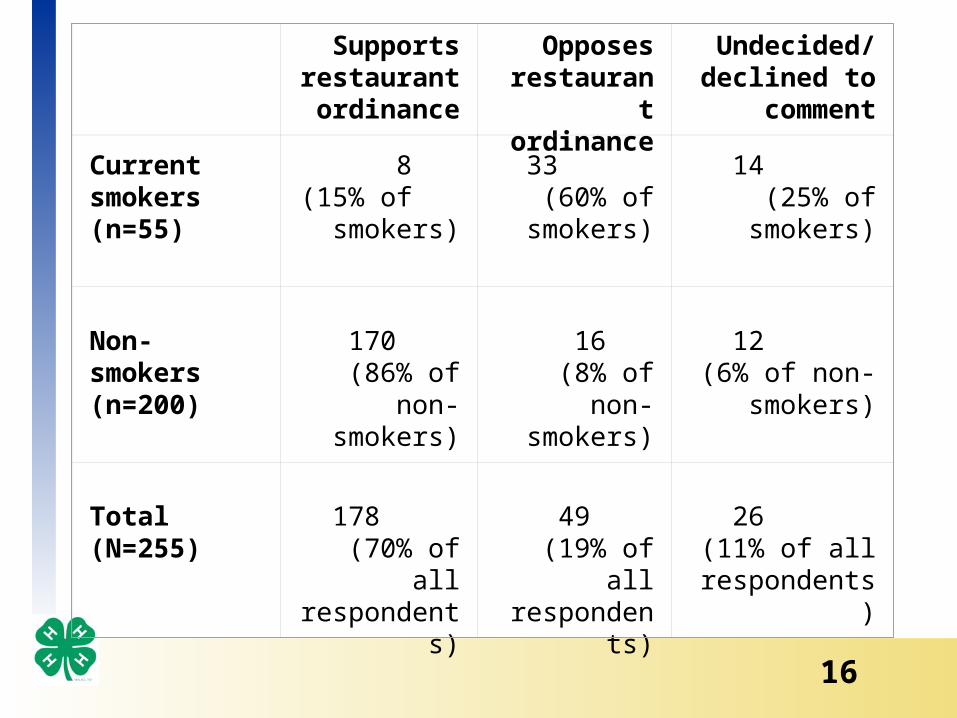
16
Supports restaurant ordinance
Opposes restauran
t ordinance
Undecided/ declined to
comment Current smokers(n=55)
8
(15% of smokers)
33 (60% of
smokers)
14 (25% of
smokers)
Non-smokers(n=200)
170 (86% of
non-smokers)
16 (8% of non-
smokers)
12
(6% of non-smokers)
Total (N=255)
178 (70% of
all respondent
s)
49 (19% of
all responden
ts)
26
(11% of all respondents
)
17
Pre-post or post-then-pre DataPre-post or post-then-pre Data
• Check data—any individual not responding to both pre and post should be discarded
• Decide: – Report individual change or combined change?
– Compare to a standard?
• See PD&E Evaluation Quick Tip 30
18
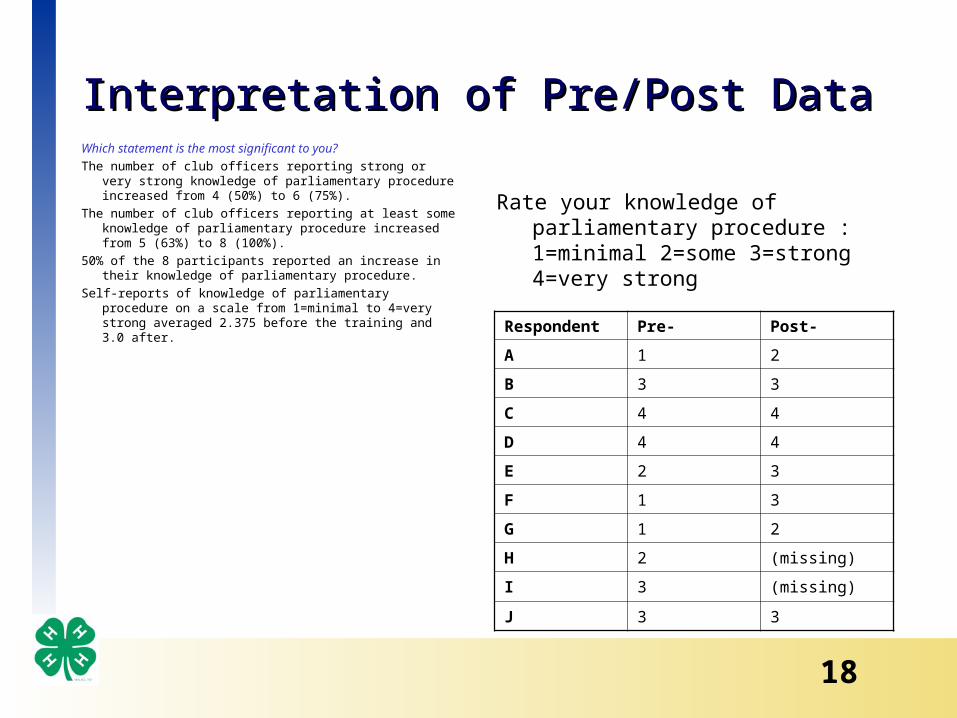
Interpretation of Pre/Post DataInterpretation of Pre/Post DataWhich statement is the most significant to you?The number of club officers reporting strong or
very strong knowledge of parliamentary procedure increased from 4 (50%) to 6 (75%).
The number of club officers reporting at least some knowledge of parliamentary procedure increased from 5 (63%) to 8 (100%).
50% of the 8 participants reported an increase in their knowledge of parliamentary procedure.
Self-reports of knowledge of parliamentary procedure on a scale from 1=minimal to 4=very strong averaged 2.375 before the training and 3.0 after.
Rate your knowledge of parliamentary procedure : 1=minimal 2=some 3=strong 4=very strong
Respondent Pre- Post-A 1 2B 3 3C 4 4D 4 4E 2 3F 1 3G 1 2H 2 (missing)I 3 (missing)J 3 3
19
Discussing limitationsDiscussing limitationsWritten reports: • Be explicit about your limitationsOral reports: • Be prepared to discuss limitations• Be honest about limitations• Know the claims you cannot make
– Do not claim causation without a true experimental design
– Do not generalize to the population without random sample and quality administration (e.g., <60% response rate on a survey)
20
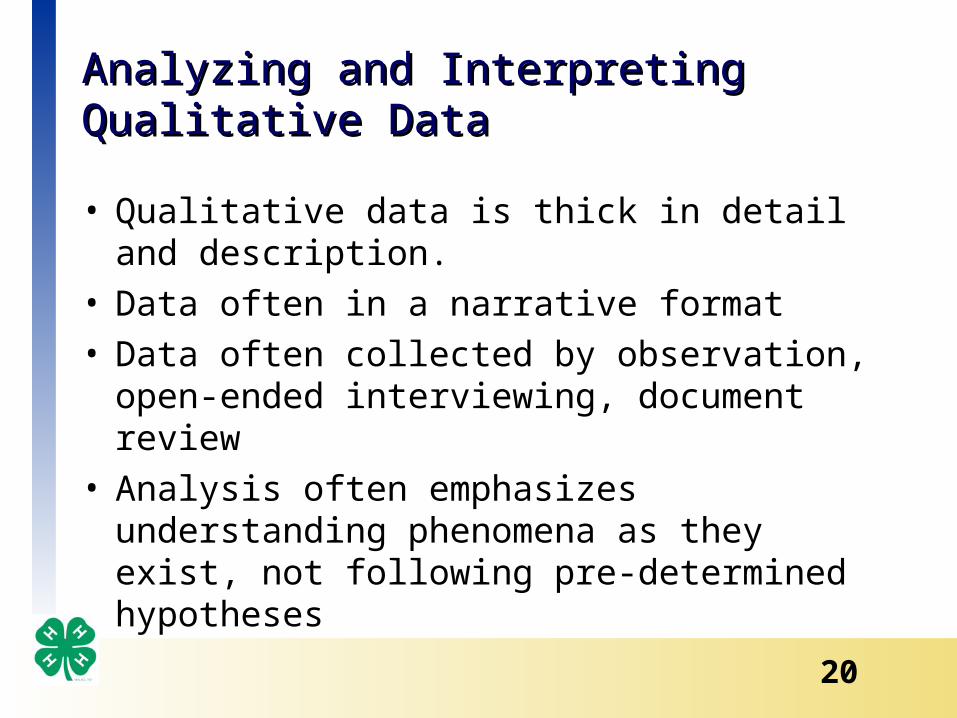
Analyzing and Interpreting Analyzing and Interpreting Qualitative DataQualitative Data
• Qualitative data is thick in detail and description.
• Data often in a narrative format• Data often collected by observation, open-ended interviewing, document review
• Analysis often emphasizes understanding phenomena as they exist, not following pre-determined hypotheses
21
QuizQuiz
• Data have their own meaning• Qualitative analysis is easier than quantitative analysis
22
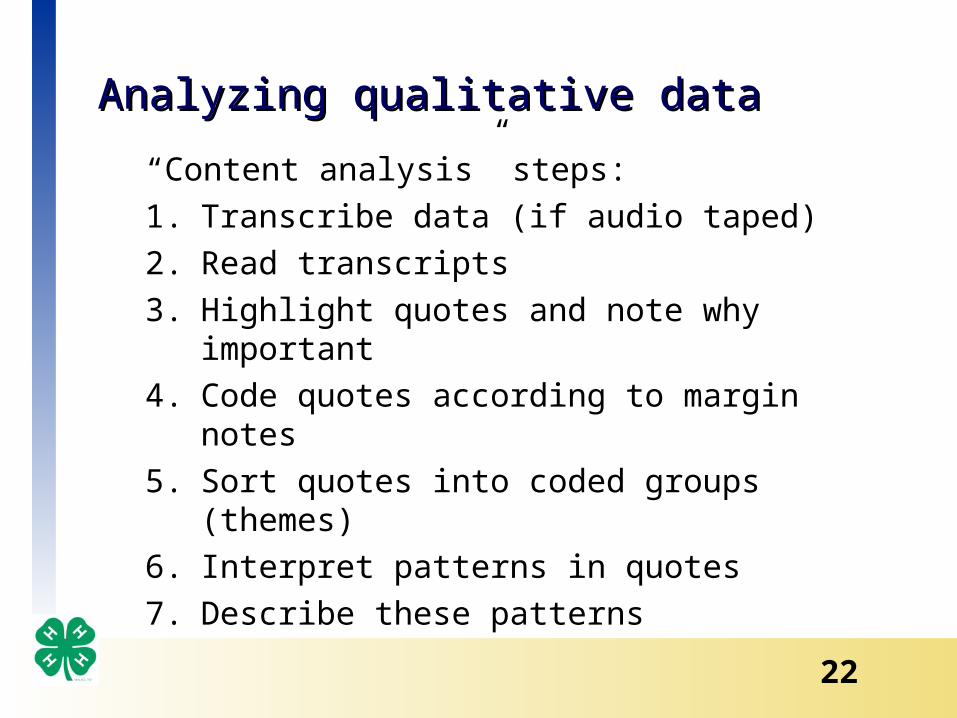
Analyzing qualitative dataAnalyzing qualitative data“Content analysis” steps: 1. Transcribe data (if audio taped)2. Read transcripts3. Highlight quotes and note why
important4. Code quotes according to margin
notes5. Sort quotes into coded groups
(themes)6. Interpret patterns in quotes7. Describe these patterns
23
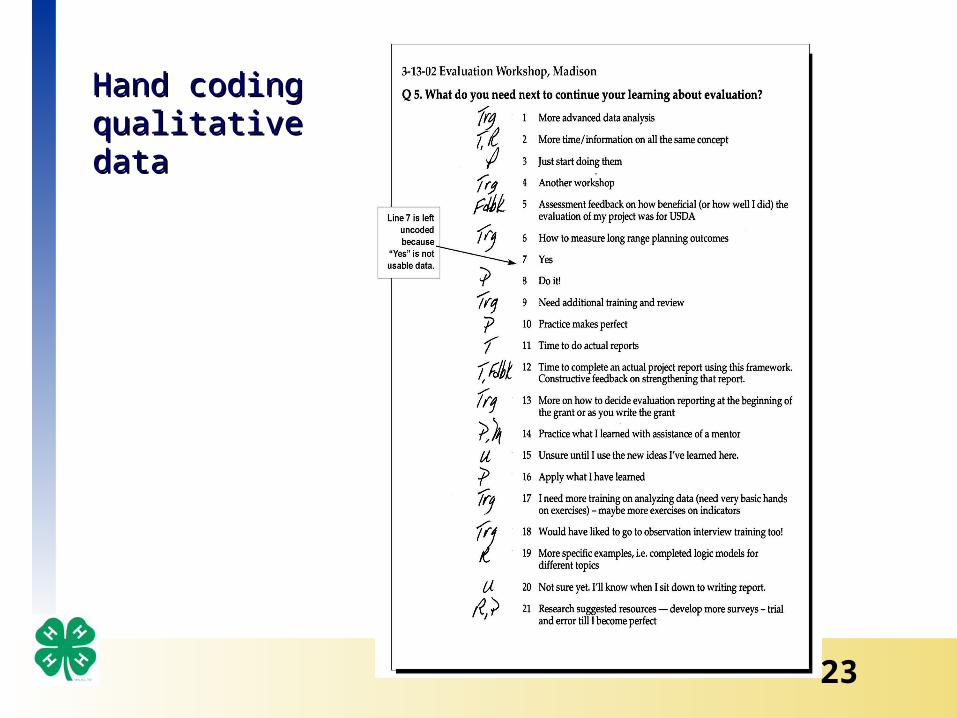
Hand coding Hand coding qualitative qualitative datadata
24
Emergent or pre-conceived Emergent or pre-conceived categories?categories?
• Consider this section—what themes emerge related to arts and communications programs?
25
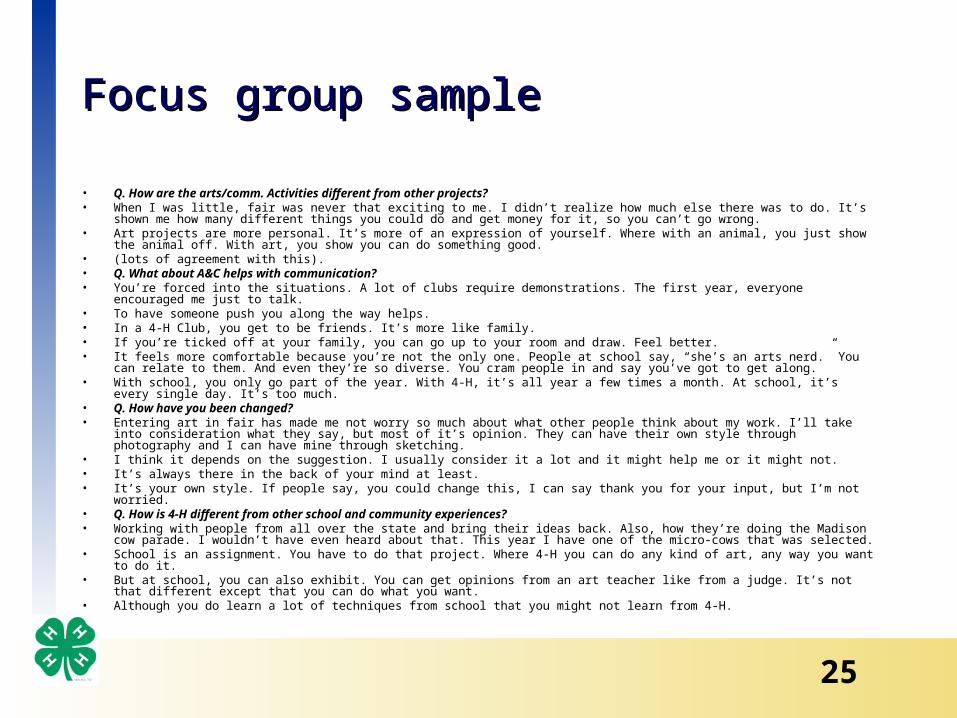
Focus group sampleFocus group sample
• Q. How are the arts/comm. Activities different from other projects?• When I was little, fair was never that exciting to me. I didn’t realize how much else there was to do. It’s
shown me how many different things you could do and get money for it, so you can’t go wrong.• Art projects are more personal. It’s more of an expression of yourself. Where with an animal, you just show
the animal off. With art, you show you can do something good.• (lots of agreement with this).• Q. What about A&C helps with communication?• You’re forced into the situations. A lot of clubs require demonstrations. The first year, everyone
encouraged me just to talk.• To have someone push you along the way helps.• In a 4-H Club, you get to be friends. It’s more like family.• If you’re ticked off at your family, you can go up to your room and draw. Feel better.• It feels more comfortable because you’re not the only one. People at school say, “she’s an arts nerd.” You
can relate to them. And even they’re so diverse. You cram people in and say you’ve got to get along.• With school, you only go part of the year. With 4-H, it’s all year a few times a month. At school, it’s
every single day. It’s too much.• Q. How have you been changed?• Entering art in fair has made me not worry so much about what other people think about my work. I’ll take
into consideration what they say, but most of it’s opinion. They can have their own style through photography and I can have mine through sketching.
• I think it depends on the suggestion. I usually consider it a lot and it might help me or it might not.• It’s always there in the back of your mind at least.• It’s your own style. If people say, you could change this, I can say thank you for your input, but I’m not
worried.• Q. How is 4-H different from other school and community experiences?• Working with people from all over the state and bring their ideas back. Also, how they’re doing the Madison
cow parade. I wouldn’t have even heard about that. This year I have one of the micro-cows that was selected.• School is an assignment. You have to do that project. Where 4-H you can do any kind of art, any way you want
to do it.• But at school, you can also exhibit. You can get opinions from an art teacher like from a judge. It’s not
that different except that you can do what you want.• Although you do learn a lot of techniques from school that you might not learn from 4-H.
26
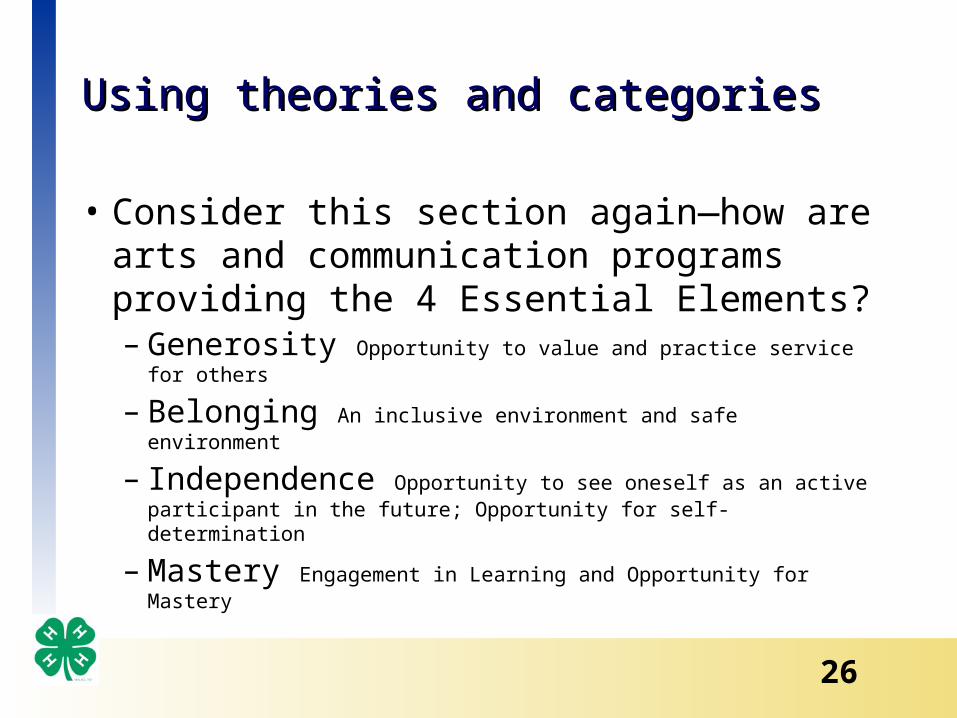
Using theories and categoriesUsing theories and categories
• Consider this section again—how are arts and communication programs providing the 4 Essential Elements?– Generosity Opportunity to value and practice service
for others– Belonging An inclusive environment and safe
environment– Independence Opportunity to see oneself as an active
participant in the future; Opportunity for self-determination
– Mastery Engagement in Learning and Opportunity for Mastery
27
Ensuring Validity in Ensuring Validity in Qualitative AnalysisQualitative Analysis
• Be systematic• Use multiple raters• Attend to context (e.g. keep track of who said what)
• Account for outlying and surprising statements
• Triangulate
28
ResourcesResources
• Building Capacity in Evaluating Outcomes Curriculum and Training (October 2009)
http://www.uwex.edu/ces/pdande/evaluation/bceo/index.html