Embed Size (px)
Citation preview

CITY OF STATESBORO,
GEORGIA
Annual Comprehensive Financial Report
For the Fiscal Year Ending June 30, 2021
CITY OF STATESBORO, GEORGIA
Annual Comprehensive Financial Report
FY 2021
Prepared by Cindy West, Finance Director,
and the Finance Department
City of Statesboro, Georgia Annual Comprehensive Financial Report
For The Year Ended June 30, 2021
i
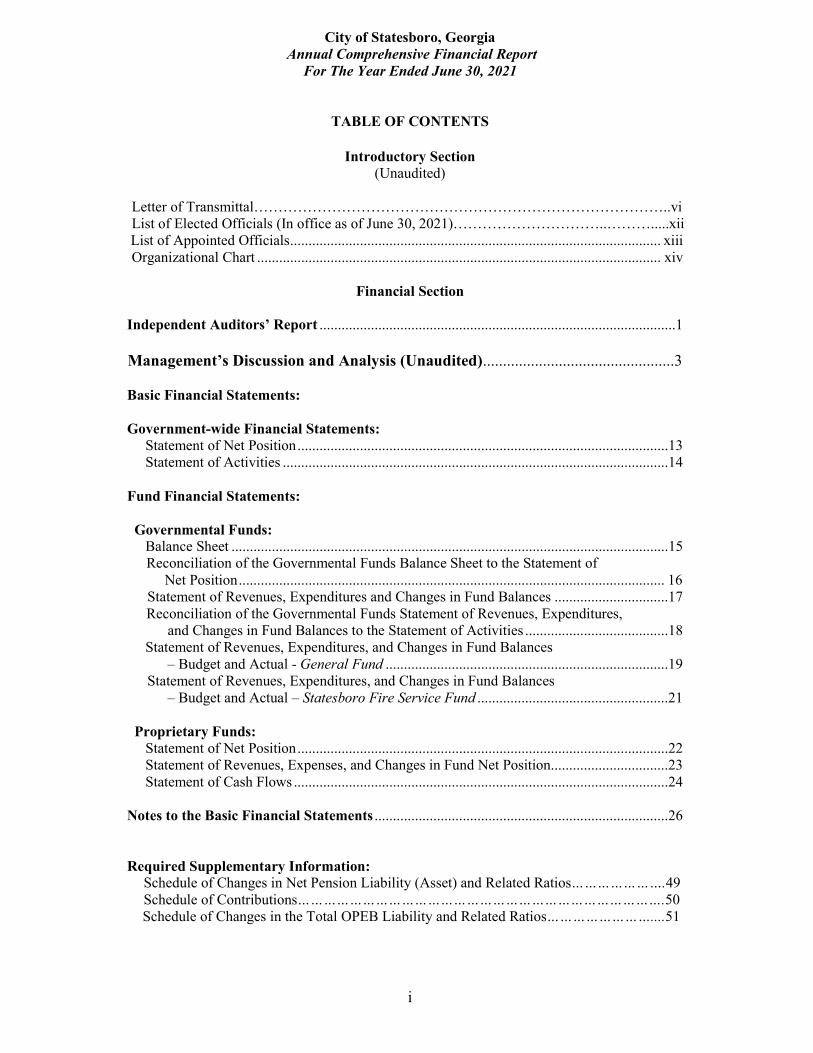
TABLE OF CONTENTS
Introductory Section (Unaudited)
Letter of Transmittal…………………………………………………………………………..vi List of Elected Officials (In office as of June 30, 2021)…………………………..……….....xii List of Appointed Officials ..................................................................................................... xiii Organizational Chart .............................................................................................................. xiv
Financial Section
Independent Auditors’ Report .................................................................................................1
Management’s Discussion and Analysis (Unaudited) ................................................3
Basic Financial Statements:
Government-wide Financial Statements: Statement of Net Position .....................................................................................................13 Statement of Activities .........................................................................................................14
Fund Financial Statements:
Governmental Funds: Balance Sheet .......................................................................................................................15
Reconciliation of the Governmental Funds Balance Sheet to the Statement of Net Position .................................................................................................................... 16
Statement of Revenues, Expenditures and Changes in Fund Balances ...............................17 Reconciliation of the Governmental Funds Statement of Revenues, Expenditures, and Changes in Fund Balances to the Statement of Activities .......................................18 Statement of Revenues, Expenditures, and Changes in Fund Balances – Budget and Actual - General Fund .............................................................................19 Statement of Revenues, Expenditures, and Changes in Fund Balances – Budget and Actual – Statesboro Fire Service Fund ....................................................21
Proprietary Funds: Statement of Net Position .....................................................................................................22 Statement of Revenues, Expenses, and Changes in Fund Net Position ................................23 Statement of Cash Flows ......................................................................................................24
Notes to the Basic Financial Statements ................................................................................26
Required Supplementary Information: Schedule of Changes in Net Pension Liability (Asset) and Related Ratios………………….49
Schedule of Contributions………………………………………………………………………….50 Schedule of Changes in the Total OPEB Liability and Related Ratios……………………....51

City of Statesboro, Georgia Annual Comprehensive Financial Report
For The Year Ended June 30, 2021
ii
Supplementary Information
Individual Fund Statements and Schedules:
Governmental Funds
Nonmajor Governmental Funds – By Fund Type: Combining Balance Sheet……………………………………………….………………….……....52
Combining Statement of Revenues, Expenditures and Changes in Fund Balances………..53
General Fund: Comparative Balance Sheet ………………………………………………………………….…….54 Comparative Statement of Revenues, Expenditures and Changes in Fund Balances……….55
Major Capital Projects Funds: 2013 SPLOST Fund Comparative Balance Sheet ...………………………………………….…………………..……..57 Comparative Statement of Revenues, Expenditures and Changes in Fund Balances……....58
2018 TSPLOST Fund Comparative Balance Sheet …………………………………….……….…………………….…..59 Comparative Statement of Revenues, Expenditures and Changes in Fund Balances.……...60 2019 SPLOST Fund Comparative Balance Sheet …………………………………….……….…………………..……..61 Comparative Statement of Revenues, Expenditures and Changes in Fund Balances………..62
LMIG-Akins Boulevard Fund Balance Sheet………………………………………………………………………………..63
Statement of Revenues, Expenditures, and Changes in Fund Balance……………………...64
Nonmajor Capital Projects Funds: Combining Balance Sheet ……………………………………………………………………….…65 Combining Statement of Revenues, Expenditures and Changes in Fund Balances………...66
Capital Improvements Program Fund Comparative Balance Sheet ………………………………………………………………..……...67
Comparative Statement of Revenues, Expenditures and Changes in Fund Balances……....68 2019 CDBG Fund
Comparative Balance Sheet ………………………………………………………………………..69 Comparative Statement of Revenues, Expenditures and Changes in Fund Balances……... 70
Major Special Revenue Funds: Statesboro Fire Service Fund
Comparative Balance Sheet ……………………………………………………...…..……71 Comparative Statement of Revenues, Expenditures and Changes in Fund Balances………72
Nonmajor Special Revenue Funds: Combining Balance Sheet ……………………………………………………………..................73
Combining Statement of Revenues, Expenditures and Changes in Fund Balances……. ....74
Confiscated Asset Fund Comparative Balance Sheet ……………………………………………………………………….75 Schedule of Revenues, Expenditures and Changes in Fund Balances - Budget and Actual...........................................................................................................76

City of Statesboro, Georgia Annual Comprehensive Financial Report
For The Year Ended June 30, 2021
iii
Community Development Block Grant Fund Comparative Balance Sheet …………………………………………………………………….....77
Schedule of Revenues, Expenditures and Changes in Fund Balances - Budget and Actual……………………………………………………………………………….78 Department of Justice Fund Comparative Balance Sheet ……………………………………………………………………..…79 Schedule of Revenues, Expenditures and Changes in Fund Balances - Budget and Actual……………………………………………………………………………......80 Hotel/Motel Tax Fund Comparative Balance Sheet …………………………………………………….…………...……..81 Schedule of Revenues, Expenditures and Changes in Fund Balances - Budget and Actual ............................................................................................... … …..82 Multiple Grant Fund Comparative Balance Sheet .................................................................................................83 Schedule of Revenues, Expenditures and Changes in Fund Balances - Budget and Actual ...........................................................................................................84 Technology Fee Fund Comparative Balance Sheet .................................................................................................85 Schedule of Revenues, Expenditures and Changes in Fund Balances - Budget and Actual ............................................................................................................86 South Main Tax Allocation District Fund Comparative Balance Sheet .................................................................................................87 Schedule of Revenues, Expenditures and Changes in Fund Balances - Budget and Actual ............................................................................................................88 Old Register Tax Allocation District Fund Comparative Balance Sheet ……… .. ……………………………………………...…..…89 Schedule of Revenues, Expenditures and Changes in Fund Balances… ..................... …..90 - Budget and Actual
Proprietary Funds:
Enterprise Funds:
Major Enterprise Funds: Water and Sewer Operating Fund Comparative Statement of Net Position .......................................................................91
Comparative Statement of Revenues, Expenses and Changes in Fund Net Position .....................................................................................................92 Gas Operating Fund Comparative Statement of Net Position .......................................................................93
Comparative Statement of Revenues, Expenses and Changes in Fund Net Position .....................................................................................................94 Solid Waste Collection Fund Comparative Statement of Net Position .......................................................................95
Comparative Statement of Revenues, Expenses and Changes in Fund Net Position .....................................................................................................96 Solid Waste Disposal Fund Comparative Statement of Net Position .......................................................................97
Comparative Statement of Revenues, Expenses and Changes in Fund Net Position .....................................................................................................98 Nonmajor Enterprise Funds: Stormwater Operating Fund
City of Statesboro, Georgia Annual Comprehensive Financial Report
For The Year Ended June 30, 2021
iv
Comparative Statement of Net Position ……………………………………..……….……99 Comparative Statement of Revenues, Expenses and Changes in
Fund Net Position…………………………………………………………………...….…100 Internal Service Funds: Combining Statement of Net Position………………………………………………………….101 Combining Statement of Revenues, Expenses, and Changes in Fund Net Position……...102 Combining Statement of Cash Flows…………………………………………………………..103 Health Insurance Fund Comparative Statement of Net Position …………………………………………………. 105
Comparative Statement of Revenues, Expenses and Changes in Fund Net Position…………………………………………………………………………106 Fleet Management Fund Comparative Statement of Net Position ……………………………………………….…107
Comparative Statement of Revenues, Expenses and Changes in Fund Net Position…………………………………………………………………………108 Wellness Program Fund Comparative Statement of Net Position ………………………………………………….109
Comparative Statement of Revenues, Expenses and Changes in Fund Net Position…………………………………………………………………………110
Central Services Fund Comparative Statement of Net Position ………………………………………………….111
Comparative Statement of Revenues, Expenses and Changes in Fund Net Position…………………………………………………………………………112
Component Unit-Downtown Statesboro Development Authority Comparative Statement of Net Position…………………………………………………………..113 Comparative Statement of Revenues, Expenses and Changes in Fund Net Position……….114 Statement of Cash Flows……………………………………………………………………………115
Schedule of Source and Application of CDBG Funds..…………………………………… ….117
Schedule of Project Costs for CDBG Funds……………………………… …………………….118
Schedule of SPLOST Expenditures………………………………….…………………………….119
Schedule of TSPLOST Expenditures………………………………..…………………………….121
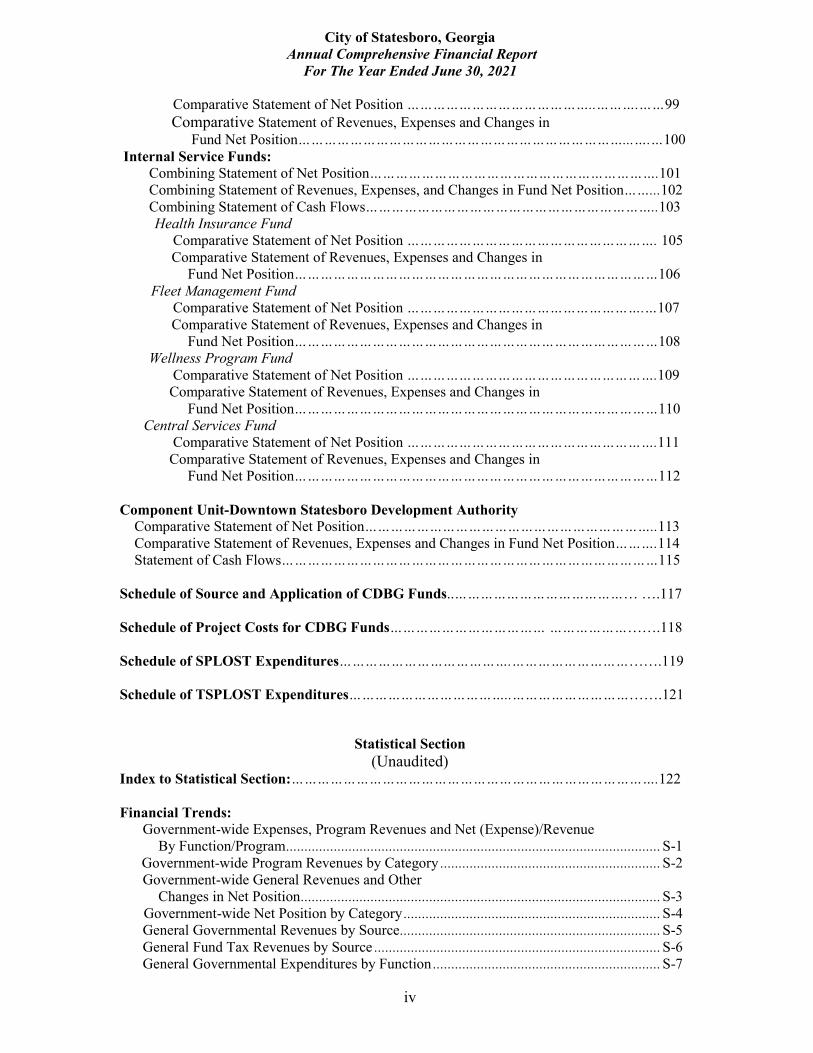
Statistical Section (Unaudited)
Index to Statistical Section:………………………………………………………………………….122
Financial Trends: Government-wide Expenses, Program Revenues and Net (Expense)/Revenue By Function/Program ...................................................................................................... S-1 Government-wide Program Revenues by Category ............................................................ S-2 Government-wide General Revenues and Other Changes in Net Position .................................................................................................. S-3 Government-wide Net Position by Category ...................................................................... S-4 General Governmental Revenues by Source ....................................................................... S-5 General Fund Tax Revenues by Source .............................................................................. S-6 General Governmental Expenditures by Function .............................................................. S-7
City of Statesboro, Georgia Annual Comprehensive Financial Report
For The Year Ended June 30, 2021
v
Changes in Fund Balances of Governmental Funds........................................................... S-8 Governmental Fund – Fund Balances ................................................................................. S-9
Revenue Capacity: Taxable Assessed Value and Estimated Actual Value of Property .................................. S-10 Direct and Overlapping Property Tax Rates .................................................................... S-11 Property Tax Levies and Collections................................................................................ S-12 Principal Property Taxpayers ........................................................................................... S-13 Sales Tax Rates – Overlapping Governments .................................................................. S-14 Water and Sewer Rates – Fiscal Years 2012 - 2021 ........................................................ S-15 Water Sold by Type of Customer ..................................................................................... S-17
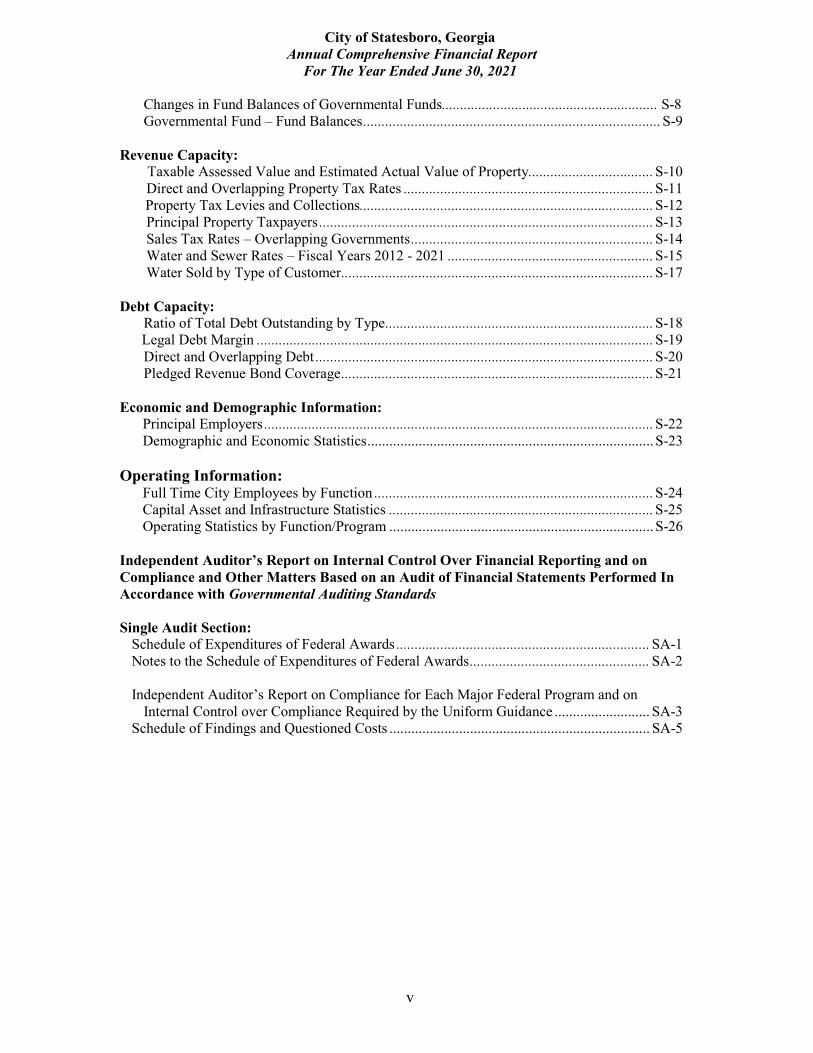
Debt Capacity: Ratio of Total Debt Outstanding by Type ......................................................................... S-18
Legal Debt Margin ............................................................................................................ S-19 Direct and Overlapping Debt ............................................................................................ S-20
Pledged Revenue Bond Coverage ..................................................................................... S-21
Economic and Demographic Information: Principal Employers .......................................................................................................... S-22 Demographic and Economic Statistics .............................................................................. S-23
Operating Information: Full Time City Employees by Function ............................................................................ S-24 Capital Asset and Infrastructure Statistics ........................................................................ S-25 Operating Statistics by Function/Program ........................................................................ S-26
Independent Auditor’s Report on Internal Control Over Financial Reporting and on Compliance and Other Matters Based on an Audit of Financial Statements Performed In Accordance with Governmental Auditing Standards
Single Audit Section: Schedule of Expenditures of Federal Awards ..................................................................... SA-1
Notes to the Schedule of Expenditures of Federal Awards ................................................. SA-2
Independent Auditor’s Report on Compliance for Each Major Federal Program and on Internal Control over Compliance Required by the Uniform Guidance .......................... SA-3 Schedule of Findings and Questioned Costs ....................................................................... SA-5

Introduction

vi
CITY OF STATESBORO
COUNCIL Phil Boyum Jonathan McCollar, Mayor Paulette Chavers Charles Penny, City Manager Venus Mack Leah Harden, City Clerk Shari Barr John Riggs
50 EAST MAIN STREET P.O. BOX 348STATESBORO, GEORGIA 30459-0348
December 29, 2021
To The Honorable Mayor, City Council, and Citizens of the City of Statesboro:
The Annual Comprehensive Financial Report (ACFR) of the City of Statesboro, Georgia for the fiscal year ended June 30, 2021 is submitted herewith. This report was prepared by the City's Finance Department. Responsibility for the completeness and accuracy of the report rests with the City’s management. We believe the data presented is accurate in all material aspects; that it is presented in a manner designed to fairly set forth the financial position, results of operations and cash flows of the City as measured by the financial activity of its various funds; that the statements and underlying financial data have been prepared in conformity with generally accepted accounting principles (GAAP) and that all disclosures necessary to enable the reader to gain the maximum understanding of the City's financial affairs have been included.
City management’s narrative on the financial activities of the City for the fiscal year ended June 30, 2021, is included in the Management’s Discussion and Analysis (MD&A) section of this report, immediately following the independent auditor’s report. The letter of transmittal is written to compliment the MD&A and the financial statements, and should be read from that perspective and in conjunction with all other ACFR sections.
PROFILE OF THE CITY
The City of Statesboro was created by an act of the General Assembly of the State of Georgia on December 19, 1803. The City operates under the Council/Manager form of government, providing the following services as authorized by its charter: public safety (police and fire), streets and drainage, community development, community services and general administrative services. The City also operates four public utilities (a water and sewer system, a stormwater system and a natural gas distribution system) and provides sanitation collection and disposal services. The City and Bulloch County jointly operate a transfer station for transport of solid waste and an inert landfill.
The City reports a 2021 estimated population of 33,438, which is based upon the April 2020 US Census. This is less than 1% of the total State of Georgia population. Statesboro ranks high with a 41.83% poverty level while Bulloch County poverty rate is 21.9% and National poverty rate is 11.5%. However, this number is impacted by the fact that university students, when filling out census

vii
forms, do not have significant earned income. Georgia Southern University’s Bureau of Business Research and Economic Development in a study confirmed that the non-student population has a much higher per capita income than the census for this reason; and, the university student population has a considerable amount of disposable income, though little earned income, as they are predominantly supported financially by parents. In January 2017, the University System of Georgia Board of Regents voted to consolidate Armstrong State University and Georgia Southern University. The new, 26,949 student university formed in January 2018 and is named Georgia Southern University with the first entering class in Fall 2018. The university now consists of 3 campuses with the Armstrong campus located in Savannah enrolling 5,248 students, the Liberty campus located in Hinesville enrolling 518 students and Statesboro campus enrolling 18,828 students, not including 2,355 enrolled online.
The City of Statesboro is the county seat of Bulloch County, Georgia, located in the southeastern corner of the state. It is included on the southern leg of the Savannah River Parkway, a four-lane connector between Savannah and Augusta. It is located 53 miles west of Savannah, 76 miles south of Augusta, 121 miles east of Macon, 144 miles southwest of Charleston, SC, 168 miles north of Jacksonville, FL, and 199 miles southeast of Atlanta. Statesboro is 10 miles from Interstate 16, and is located on US Highways 301, 80, and 25, and State Routes 73, 46, 67, and 24.
The City is approximately 15.22 square miles with an average elevation of 253 feet above sea level, the terrain being mostly flat. The climate is seasonal, but moderate, with mild winters and warm, humid summers. The average high is 62 degrees in January and 93 degrees in July. The average annual rainfall is 46.8” and the relative humidity is 66% in January and 70% in July.
Statesboro is served by the Heart of Georgia Railway Company and numerous common freight carriers. The City and Bulloch County jointly own the Statesboro Municipal Airport that is located approximately 30 minutes from Interstate 16. It is 45 minutes from the Savannah/Hilton Head International Airport, which is serviced by 5 major airlines. The City of Statesboro also is located approximately fifty miles from the Georgia Ports Authority’s Savannah terminal, and is within a reasonable distance of the ports of Charleston, Beaufort, Brunswick, and Jacksonville.
There are three institutions of higher learning located in the greater Statesboro area: Georgia Southern University (GSU) within the city limits, and Ogeechee Technical College, and East Georgia State College located just outside the city on US Highway 301 South. Accredited by the Southern Association of Colleges and Schools and Georgia’s largest and most comprehensive center of higher education south of Atlanta, Georgia Southern offers 2246 courses for undergraduate and graduate degree programs through the doctoral level in its current ten Colleges. The University’s 26,949 students come from 50 states, the District of Columbia, Puerto Rico, the Virgin Islands, and more than 102 nations.
East Georgia State College-Statesboro (EGSC-S) provides students an opportunity to complete college level course work and transfer to another university-level institution or state college to complete their chosen degrees. EGSC-S students are able to take advantage of many of the benefits of Georgia Southern University, including library use, cultural events, campus meal plans, intramural sports, fitness extension facilities, athletic tickets, marching band, and more. Students

viii
attending EGSC-S are also eligible to enroll in health and physical education classes through Georgia Southern University.
Ogeechee Technical College is accredited by the Commission of the Council on Occupational Education and adheres to statewide curriculum standards established by the Georgia Department of Technical and Adult Education. OTC offers 124 programs of study including 37 diploma programs, 67 certificate programs, and 20 Associate degrees in conjunction with Georgia Southern University and East Georgia State College. Ogeechee Technical College gave over 1779 program awards to 1059 graduating students in 2021 with 1552 students enrolled at Ogeechee Technical College in 2021 being from Bulloch County. There are 15 public schools, 3 private and parochial schools, 1 home school association, and 1 charter school in Bulloch County educating the county’s more than 10,900 students.
Statesboro is a leader in health care in southeast Georgia with East Georgia Regional Medical Center, equipped with 149 patient rooms, employing approximately 900 staff and over 112 physicians representing a wide range of specialties. The hospital is accredited by the Joint Commission on Accreditation of Healthcare Organizations, a distinction that is awarded only to those healthcare facilities that maintain the highest standards of quality.
The City is served by 6 local radio stations, WHKN, WMCD, WPMX, WPTB, WWNS and WVGS, and one newspaper, the Statesboro Herald. In addition, the Savannah Morning News reports on the news in Statesboro. Statesboro is covered locally by Northland Cable TV, which is located in the city. Three television stations in Savannah also cover Statesboro regularly: WTOC (CBS), WJCL (ABC), and WSAV (NBC).
The City has 124.76 miles of roads of which 124.3 are paved. Natural gas is sold to 3,873 customers while water and sewer service is provided by the City to over 13,316 customers with an average daily water consumption of 3.560 million gallons. Statesboro has 203.6 miles of sanitary sewer and 251.4 miles of water mains with 1690 fire hydrants. The City maintains a Class 2/2Y ISO rating with 2 fire stations.
Utilities are provided by the following within the City: City of Statesboro Water and Sewer, Sanitation, Natural Gas and Stormwater Excelsior EMC Electricity Georgia Power Company Electricity Frontier Communications Telecommunications Bulloch Solutions Telecommunications Vyve Broadband Telecommunications
ECONOMIC CONDITION AND OUTLOOK
Statesboro has an economy comprised of an industrial base, a growing university, expanding retail activity, and a regional medical center. The City has a highly diversified economy with several major industries located in the area and is a regional shopping center and health care provider for eight surrounding Georgia counties (Effingham, Screven, Jenkins, Emanuel, Candler, Evans, Tattnall, and Toombs).

ix
The 2021 Statesboro median household income was $29,203 or 87% of the State of Georgia per capita income. Per capita income is total personal income (including wages, dividends, interest, rent, and government payments) divided by the total population. It is commonly used as an indicator of the quality of consumer markets and the economic wellbeing of a community. As noted above, this figure is actually skewed lower by the high number of university students who do not report earned income, but have considerable disposable income.
The area offers many educational and vocational opportunities that provide a competitive advantage for a strong workforce. The March 2021 unemployment rate was 5.70%, higher than the State of Georgia rate at 4.5% and below the national rate of 6.2%. Approximately 28.6% of the Bulloch County civilian labor force is employed by the government sector including one of the City’s largest employers, Georgia Southern University. Other government employers include Bulloch County, Bulloch County Board of Education, Ogeechee Technical College, and the City of Statesboro. The major private sector employers in the City include East Georgia Regional Medical Center and Wal-Mart Supercenter.
The City and County are experiencing moderate growth with the City approving 133 new building permits in 2020, and 110 in 2021. The cost of housing in Bulloch County is among the lowest in the nation. The average residential listing price is $213,500. The median value of owner occupied units was $140,700.
MAJOR INITIATIVES
For The Year. In FY 2021, The Public Works and Engineering Departments expended $3,273,778 in TSPLOST and SPLOST funds to finance street repaving, street striping, installation and repairs of sidewalks, roadway improvements and traffic calming measures, as well as stormwater drainage improvements projects.
The City expended $3,288,486 in SPLOST funds for improvement to two city parks. The improvements include a therapy pool, new playground equipment and a covered basketball court.
The City expended $573,720 in SPLOST funds for police vehicles and conversions, fire vehicles, personal protection equipment and dispatch equipment.
For The Future. Public Safety has budgeted $1,508,000 for police vehicles and conversions, fire engine, facilities upgrades and renovations, and personal protection equipment.
The Natural Gas Department has budgeted $655,000 for vehicles and system expansion.
The Solid Waste Collection fund has budgeted $403,479 of SPLOST and operating funds for a front loading garbage truck and bulk waste roll-off containers/compactors.
The engineering department has budgeted $5,535,000 of TSPLOST funds, 2013 SPLOST funds and 2019 SPLOST funds for street resurfacing, sidewalks, traffic calming measures, intersection improvements and parking improvements and the implementation of a limited transit system.
The waste water department has budgeted $1,995,000 of SPLOST and operating funds for water and sewer upgrades and a sewer main extension.
x
The storm water department has budgeted $1,400,000 of SPLOST funds for a detention facility, drainage improvements and culvert replacement.
FINANCIAL INFORMATION
In developing and evaluating the City's accounting system, consideration is given to the adequacy of the internal control structure. Internal accounting controls are designed to provide reasonable, but not absolute, assurance regarding the safeguarding of assets against loss from unauthorized use or disposition, the reliability of financial statements, and maintaining accountability for assets. The concept of reasonable assurance recognizes that the cost of control should not exceed the benefits likely to be derived; and the evaluation of costs and benefits requires estimates and judgments by management. All internal control evaluations occur within the above framework. We believe that the City's internal control structure adequately safeguards assets and provides reasonable assurance of proper recording of financial transactions.
The City's accounting records for general governmental operations are maintained on a modified accrual basis and reported on the same basis at the fund financial reporting level. However, at the government-wide financial reporting level, these activities are presented on the accrual basis.
The City’s enterprise funds account for the cost of services using an "economic resources" measurement focus. This means that all assets and liabilities (whether current or non-current) associated with the funds are included on their balance sheets. Their operating statements present increases (revenues) and decreases (expenses) in net total assets. The accrual basis of accounting is used for the proprietary funds.
Budgeting Controls. Budgets have been adopted and appropriated at the fund level for each City governmental fund. Budgetary control is maintained at the line-item level by the rendering of monthly reports of revenues and expenditures. Major variances between budget and actual are reviewed monthly with the City Council on an exceptions basis. Unexpended appropriations lapse at year-end for budgetary purposes and are subject to re-appropriation in the following year.
Long-term Financial Planning. The City of Statesboro maintains a flexible, yet thorough six year capital improvement plan whereby capital needs are identified several years before funding and implementation, to allow adequate time for planning. This plan also provides for the orderly replacement of facilities and equipment. The City’s current six year plan has identified $83,069,479 in projected expenditures through FY 2027. In FY 2022, the City has budgeted $20,157,979 in projected expenditures, with $2,556,279 being funded from the 2013 Special Purpose Local Option Sales Tax and $3,949,200 being funded from the 2019 Special Purpose Local Option Sales Tax. The projects funded from the 2013 SPLOST include $19,000 for government building projects, $413,000 for economic development projects, $1,400,000 for stormwater projects, $28,479 for solid waste collection projects and $695,000 for water and sewer projects. The projects funded from the 2019 SPLOST include $306,200 for streets and parks projects, $425,000 government buildings, $1,300,000 for water and sewer projects, $408,000 for police projects, $1,025,000 for fire projects, and $150,000 for natural gas projects. $5,075,000 is being funded from the 2018 TSPLOST for streets projects.
OTHER INFORMATION
Independent Audit. State law requires annual audits of the accounting records by independent certified public accountants selected by the City Council. This requirement has been met, and the auditor’s opinion is included in this report. The goal of the independent audit is to provide

Government Finance Officers Association
Certificate of Achievementfor Excellence
in Financial Reporting
Presented to
City of StatesboroGeorgia
For its Annual ComprehensiveFinancial Report
For the Fiscal Year Ended
June 30, 2020
Executive Director/CEO

xii
C��� �� S���������, G������M���� ��� C������
In office since January 2020Current term expires December 2023
In office since January 2020Current term expires December 2023
In office since January 2013Current term expires December 2021
In office since January 2018Current term expires December 2021
Venus MackDistrict 3
Paulette ChaversDistrict 2
Phil BoyumDistrict 1
Shari BarrDistrict 5
In office since January 2010Current term expires December 2021
John RiggsDistrict 4
Jonathan M. McCollarMayor
In office since January 2020Current term expires December 2023
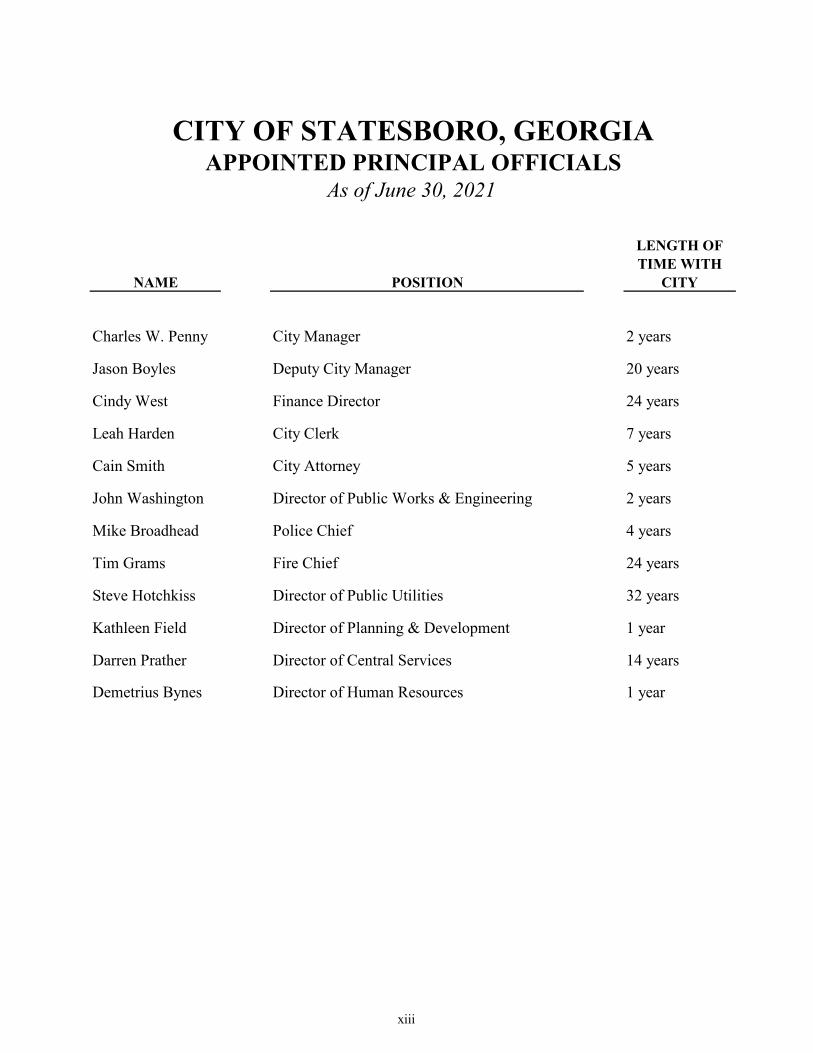
NAME POSITION
LENGTH OF
TIME WITH
CITY
Charles W. Penny City Manager 2 years
Jason Boyles Deputy City Manager 20 years
Cindy West Finance Director 24 years
Leah Harden City Clerk 7 years
Cain Smith City Attorney 5 years
John Washington Director of Public Works & Engineering 2 years
Mike Broadhead Police Chief 4 years
Tim Grams Fire Chief 24 years
Steve Hotchkiss Director of Public Utilities 32 years
Kathleen Field Director of Planning & Development 1 year
Darren Prather Director of Central Services 14 years
Demetrius Bynes Director of Human Resources 1 year
CITY OF STATESBORO, GEORGIAAPPOINTED PRINCIPAL OFFICIALS
As of June 30, 2021
xiii

xiv
ORGANIZATIONAL CHARTFOR THE CITY OF STATESBORO
Director of Central ServicesGeographical Information Systems
Information TechnologyRisk Management
PurchasingGovernmental Buildings
Citizens
City ClerkProperty Taxes
Business LicensesRecords Management
Elections
Police ChiefPolice Administration
Police Operations BureauPolice Patrol Bureau
Director of Public Works and Engineering
EngineeringStormwater
Keep Statesboro-Bulloch BeautifulStreets DivisionParks Division
Solid Waste CollectionSolid Waste Disposal
Fleet Management
Director of Planning and Development
Planning & ZoningDevelopment Regulation
Code ComplianceProtective Inspections
Director of FinanceFinance
AccountingPayroll
Municipal CourtCustomer Service
Utility Billing
Director of Public UtilitiesNatural Gas SystemWater DistributionSewer Collection
Wastewater TreatmentReclaimed Water
Director of Human Resources PersonnelBenefits
Municipal Court Judge City Attorney/SolicitorMayor and Council
City Manager
Assistant City Manager
Fire ChiefFire SuppressionFire Prevention
Inspections
Public Information Officer
Assistant to the City Manager

Financial
1
INDEPENDENT AUDITOR’S REPORT
To the City Council City of Statesboro, Georgia
Report on the Financial Statements
We have audited the accompanying financial statements of the governmental activities, the business-type activities, the aggregate discretely presented component unit, each major fund, and the aggregate remaining fund information of the City of Statesboro, Georgia, as of and for the year ended June 30, 2021, and the related notes to the financial statements, which collectively comprise the City’s basic financial statements as listed in the table of contents.
Management’s Responsibility for the Financial Statements
Management is responsible for the preparation and fair presentation of these financial statements in accordance with accounting principles generally accepted in the United States of America; this includes the design, implementation, and maintenance of internal control relevant to the preparation and fair presentation of financial statements that are free from material misstatement, whether due to fraud or error.
Auditor’s Responsibility
Our responsibility is to express opinions on these financial statements based on our audit. We conducted our audit in accordance with auditing standards generally accepted in the United States of America and the standards applicable to financial audits contained in Government Auditing Standards, issued by the Comptroller General of the United States. Those standards require that we plan and perform the audit to obtain reasonable assurance about whether the financial statements are free from material misstatement.
An audit involves performing procedures to obtain audit evidence about the amounts and disclosures in the financial statements. The procedures selected depend on the auditor’s judgment, including the assessment of the risks of material misstatement of the financial statements, whether due to fraud or error. In making those risk assessments, the auditor considers internal control relevant to the entity’s preparation and fair presentation of the financial statements in order to design audit procedures that are appropriate in the circumstances, but not for the purpose of expressing an opinion on the effectiveness of the entity’s internal control. Accordingly, we express no such opinion. An audit also includes evaluating the appropriateness of accounting policies used and the reasonableness of significant accounting estimates made by management, as well as evaluating the overall presentation of the financial statements.
We believe that the audit evidence we have obtained is sufficient and appropriate to provide a basis for our audit opinions.
Opinions
In our opinion, the financial statements referred to above present fairly, in all material respects, the respective financial position of the governmental activities, the business-type activities, the aggregate discretely presented component unit, each major fund, and the aggregate remaining fund information of the City of Statesboro, Georgia, as of June 30, 2021, and the respective changes in financial position, and, where applicable, cash flows thereof, and the respective budgetary comparison for the General Fund and Statesboro Fire Service Special Revenue Fund for the year then ended in accordance with accounting principles generally accepted in the United States of America.
LANIER, DEAL & PROCTOR
CERTIFIED PUBLIC ACCOUNTANTS
201 SOUTH ZETTEROWER AVENUE
P.O. BOX 505
STATESBORO, GEORGIA 30459
PHONE (912) 489-8756
FAX (912) 489-1243
MEMBERS
AMERICAN INSITUTE OF CERTIFIED
PUBLIC ACCOUNTANTS
GEORGIA SOCIETY OF CERTIFIED
PUBLIC ACCOUNTANTS
WILLIAM RUSSELL LANIER, CPA
RICHARD N. DEAL, CPA, CGMA
KAY S. PROCTOR, CPA, CFE, CGMA
WILLIAM BLAKE BLOSER, CPA
TIFFANY D. JENKINS, CPA, CGMA
RICHARD N. DEAL II, CPA

2
Other Matters
Required Supplementary Information
Accounting principles generally accepted in the United States of America require that the management’s discussion and analysis on pages 3 through 12 and other required supplementary information, as listed in the table of contents, be presented to supplement the basic financial statements. Such information, although not a part of the basic financial statements, is required by the Governmental Accounting Standards Board, who considers it to be an essential part of financial reporting for placing the basic financial statements in an appropriate operational, economic, or historical context. We have applied certain limited procedures to the required supplementary information in accordance with auditing standards generally accepted in the United States of America, which consisted of inquiries of management about the methods of preparing the information and comparing the information for consistency with management’s responses to our inquiries, the basic financial statements, and other knowledge we obtained during our audit of the basic financial statements. We do not express an opinion or provide any assurance on the information because the limited procedures do not provide us with sufficient evidence to express an opinion or provide any assurance.
Other Information
Our audit was conducted for the purpose of forming opinions on the financial statements that collectively comprise City of Statesboro, Georgia’s basic financial statements. The introductory section, combining and individual fund financial statements and schedules, schedule of SPLOST expenditures, schedule of TSPLOST expenditures, and statistical section are presented for purposes of additional analysis and are not a required part of the basic financial statements. The schedule of expenditures of federal awards is presented for purposes of additional analysis as required by Title 2 U.S. Code of Federal Regulations Part 200, Uniform Administrative Requirements, Cost Principles, and Audit Requirements for Federal Awards, and is also not a required part of the basic financial statements.
The combining and individual fund financial statements and schedules, schedule of SPLOST expenditures, schedule of TSPLOST expenditures, and schedule of expenditures of federal awards are the responsibility of management and were derived from and relate directly to the underlying accounting and other records used to prepare the basic financial statements. Such information has been subjected to the auditing procedures applied in the audit of the basic financial statements and certain additional procedures, including comparing and reconciling such information directly to the underlying accounting and other records used to prepare the basic financial statements or to the basic financial statements themselves, and other additional procedures in accordance with auditing standards generally accepted in the United States of America. In our opinion, the combining and individual fund financial statements and schedules, schedule of SPLOST expenditures, schedule of TSPLOST expenditures, and schedule of expenditures of federal awards are fairly stated in all material respects in relation to the basic financial statements as a whole.
The introductory and statistical sections have not been subjected to the auditing procedures applied in the audit of the basic financial statements and, accordingly, we do not express an opinion or provide any assurance on them.
Other Reporting Required by Government Auditing Standards
In accordance with Government Auditing Standards, we have also issued our report dated December 29, 2021, on our consideration of the City of Statesboro, Georgia’s internal control over financial reporting and on our tests of its compliance with certain provisions of laws, regulations, contracts, and grant agreements and other matters. The purpose of that report is to describe the scope of our testing of internal control over financial reporting and compliance and the results of that testing, and not to provide an opinion on the effectiveness of the City of Statesboro, Georgia’s internal control over financial reporting or on compliance. That report is an integral part of an audit performed in accordance with Government Auditing Standards in considering City of Statesboro, Georgia’s internal control over financial reporting and compliance.
Statesboro, Georgia December 29, 2021

Management’s Discussion and Analysis

MANAGEMENT'S DISCUSSION AND ANALYSIS (Unaudited) City of Statesboro, Georgia June 30, 2021
MANAGEMENT’S DISCUSSION AND ANALYSIS
Within this section of the City of Statesboro, Georgia’s (the City’s) annual financial report, the City’s management is pleased to provide this narrative discussion and analysis of the financial activities of the City for the fiscal year ended June 30, 2021. The City’s financial performance is discussed and analyzed within the context of the accompanying financial statements and disclosures following this section.
Financial Highlights
The City had total net position (assets exceeded liabilities) of $120,973,189 at 2021 fiscal year-end. That is $13,139,759 or 12.2%, higher than the total net position of $107,833,430 at 2020 fiscal year-end. Fiscal year 2019 had seen a $317,483 or .3%, increase in total net position.
Total net position is comprised of the following:
(1) Net investment in capital assets, of $78,765,596 include property and equipment, net of accumulated depreciation, and reduced for outstanding debt related to the purchase or construction of capital assets. The figure for fiscal year 2020 was $77,753,377. That is an increase of $1,012,219 or 1.3%. There was an increase of $2,463,409 or 3.3% for fiscal year 2020.
(2) Net position of $26,946,583 is restricted by constraints imposed from outside the City such as debt covenants, grantors, laws, or regulations. That is $8,660,271 or 47.3%, more than the fiscal year 2020 amount of $18,286,312. That was $4,292,024 (or 30.7%) more than fiscal year 2019’s $13,994,288.
(3) Unrestricted net position of $15,261,010 represents the portion available to maintain the City’s continuing obligations to citizens and creditors. This is a $3,467,269 (or 29.4%) increase over the fiscal year 2020 total of $11,793,741. That amount was a $6,437,950 (or 35.3%) decrease over fiscal year 2019’s figure of $18,231,691. FY 2019 had seen a $3,298,766 (or 22.1%) increase over FY 2018’s amount. In fiscal year 2021, unrestricted net position for business-type activities increased by $2,690,202 or 20.6%. The unrestricted net position for the governmental activities in fiscal year 2021 increased by $777,067 or 60.3%.
The City’s governmental funds reported total ending fund balance of $36,707,983, compared to $26,767,350 in fiscal year 2020. This is a $9,940,633 (or 37.1%) increase. The fiscal year 2019 ending fund balance for governmental funds showed an increase of $7,174,218 (or 36.6%).
At the end of the current fiscal year, unassigned fund balance for the General Fund was $7,355,500. That compares to $6,072,346 for fiscal year 2020 and $5,704,733 for fiscal year 2019.
The above financial highlights are explained in more detail in the “financial analysis” section of this document.
Overview of the Financial Statements
This Management Discussion and Analysis document introduces the City’s basic financial statements. The basic financial statements include: (1) government-wide financial statements, (2) fund financial statements, and (3) notes to the basic financial statements. The City also includes in this report additional information to supplement the basic financial statements.
Government-wide Financial Statements
The City’s annual report includes two government-wide financial statements. These statements provide both long-term and short-term information about the City's overall financial status. Financial reporting at this level uses a perspective similar to that found in the private sector with its basis in accrual accounting and elimination or reclassification of activities between funds.
The first of these government-wide statements is the Statement of Net Position. This is the government-wide statement of net position presenting information that includes all of the City’s assets and liabilities, with the difference between them reported as net position.Over time, increases or decreases in net position may serve as a useful indicator of whether the financial position of the City as a whole
3

MANAGEMENT'S DISCUSSION AND ANALYSIS (Unaudited) City of Statesboro, Georgia June 30, 2021
is improving or deteriorating. Evaluation of the overall health of the City would extend to other non-financial factors such as diversification of the taxpayer base or the condition of City infrastructure, in addition to the financial information provided in this report.
The second government-wide statement is the Statement of Activities, which reports how the City’s net position changed during the current fiscal year. All current year revenues and expenses are included regardless of when cash is received or paid. An important purpose of the design of the statement of activities is to show the financial reliance of the City's distinct activities or functions on revenues provided by the City's taxpayers.
Both government-wide financial statements distinguish governmental activities of the City that are principally supported by sales and property taxes from business-type activities that are intended to recover all or a significant portion of their costs through user fees and charges. Governmental activities include general government, public safety, and public works. Business-type activities include the natural gas distribution system, the water and wastewater systems, and the solid waste collection and disposal systems.
The government-wide financial statements are presented on pages 13 & 14 of this report.
Fund Financial Statements
A fund is an accountability unit used to maintain control over resources segregated for specific activities or objectives. The City uses funds to ensure and demonstrate compliance with finance-related laws and regulations. Within the basic financial statements, fund financial statements focus on the City’s most significant funds rather than the City as a whole. Major funds are separately reported while all other (non-major) funds are combined into a single, aggregated presentation. Individual fund data for non-major funds is provided in the form of combining statements in a later section of this report.
The City has two kinds of funds:
1. Governmental funds are reported in the fund financial statements and encompass the same functions reported as governmental activities in the government-wide financial statements. However, the focus is very different with fund statements providing a distinctive view of the City’s governmental funds. These statements report short-term fiscal accountability focusing on the use of spendable resources and balances of spendable resources available at the end of the year. They are useful in evaluating annual financing requirements of governmental programs and the commitment of spendable resources for the near-term.
Since the government-wide focus includes the long-term view, comparisons between these two perspectives may provide insight into the long-term impact of short-term financing decisions. Both the governmental fund balance sheet and the governmental fund operating statement provide a reconciliation to assist in understanding the differences between these two perspectives.
The basic governmental fund financial statements are presented on pages 15-21 of this report.
Individual fund information for non-major governmental funds is found in combining statements in a later section of this report.
2. Proprietary funds are reported in the fund financial statements and generally report services for which the City charges customers a fee. The City’s proprietary funds are classified as enterprise funds. These enterprise funds essentially encompass the same functions reported as business-type activities in the government-wide statements. Services are provided to customers external to the City organization for gas, water and wastewater utilities; and for solid waste collection and disposal systems.
The basic enterprise fund financial statements are presented on pages 22-25 of this report.
Notes to the Basic Financial Statements
The accompanying notes to the financial statements provide information essential to a full understanding of the government-wide and fund financial statements. The notes to the financial statements begin on page 26 of this report.
Supplementary Information
In addition to the basic financial statements and accompanying note disclosures, this report also presents certain required supplementary information concerning the City's budget presentations and information on its pension plan and other post-employment benefits plan.
4

MANAGEMENT'S DISCUSSION AND ANALYSIS (Unaudited) City of Statesboro, Georgia June 30, 2021
The budgetary comparison statement is included as a basic financial statement for the General Fund and the Statesboro Fire Service Fund. Budgetary comparison schedules for all other governmental funds can be found in a later section of this report. These statements and schedules demonstrate compliance with the City’s adopted and final revised budget. During the fiscal year, the Mayor and City Council adopted by resolution three budget amendments, or revision, to the original budget resolution.
As discussed, the City reports major funds in the basic financial statements. Combining and individual statements and schedules for non-major funds are presented in this section of this report beginning on page 52.
Financial Analysis of the City as a Whole
The City’s net position at fiscal year 2021 was $120,973,189, compared to the fiscal year 2020 figure of $107,833,430. The following table provides a summary of the City’s net position:
The current ratio divides the current assets by the current liabilities, and is an indication of the ability to pay current obligations. For fiscal year 2021, the current ratio for governmental activities is 8.7 and 7.1 for business type activities. For fiscal year 2020, the current ratio for governmental activities was 12.6 and for business type activities 6.7. For the City, overall, the current ratio for fiscal year 2021 is 8.1, compared to 9.4 for fiscal year 2020. For fiscal year 2019, the current ratio for governmental activities was 11.8 and for business type activities 5.8.
Net position for fiscal year 2021 increased by $10,564,329 for governmental activities, and increased by $2,575,430 for business-type activities. Net position for fiscal year 2020 increased by $920,814 for governmental activities and decreased by $603,331 for business type activities.
Note that in fiscal year 2021, 51.7%, and in fiscal year 2020, 61.5% of the governmental activities’ net position were invested in capital assets. On the business type activities, the City has spent 76.2% of its net position in fiscal year 2021, and 79.4% in fiscal year 2020 on capital assets. This is not unusual, as the business type activities are primarily utilities, which are very capital-intensive operations. Expansion of these systems is necessary for the continued growth of the City and for its financial position, as these utility systems generate
2021 2020 2021 2020 2021 2020
Assets:
Current assets 42,487,410$ 31,233,231$ 21,725,176$ 18,718,949$ 64,212,586$ 49,952,180$
Capital assets 36,673,772 30,964,140 61,057,505 62,015,602 97,731,277 92,979,742
Other Noncurrent assets - - 1,834,470 1,745,267 1,834,470 1,745,267
Total Assets 79,161,182 62,197,371 84,617,151 82,479,818 163,778,333 144,677,189
Deferred Outflows of Revenues 2,971,335 1,149,066 1,086,855 476,537 4,058,190 1,625,603
Liabilities:
Current liabilities 4,893,747 2,486,568 3,047,122 2,813,046 7,940,869 5,299,614
Long-term liabilities 21,099,666 15,664,253 15,813,483 15,989,754 36,913,149 31,654,007
Total Liabilities 25,993,413 18,150,821 18,860,605 18,802,800 44,854,018 36,953,621
Deferred Inflows of Resources 1,377,058 997,899 632,258 517,842 2,009,316 1,515,741
Net Position:
Net Investment in capital assets 28,327,254 27,200,263 50,438,342 50,553,114 78,765,596 77,753,377
Restricted 26,946,583 18,286,312 - - 26,946,583 18,286,312
Unrestricted (511,791) (1,288,858) 15,772,801 13,082,599 15,261,010 11,793,741
Total net position 54,762,046$ 44,197,717$ 66,211,143$ 63,635,713$ 120,973,189$ 107,833,430$
TotalGovernmental Activities Business-type Activities
Summary of Net Position
5

MANAGEMENT'S DISCUSSION AND ANALYSIS (Unaudited) City of Statesboro, Georgia June 30, 2021
considerable revenues for all the City’s operations 65.1% in fiscal year 2021, and 72.1% in fiscal year 2020 of the City’s total net position were invested in capital assets.
The following table provides a summary of the changes in net position, with comparative data for both fiscal years 2021 and 2020:
GOVERNMENTAL REVENUES
Bulloch County (including the City of Statesboro) is one of only eight counties out of 159 in Georgia that do not receive any of the 1% Local Option Sales Tax (LOST). A local Constitutional Amendment was passed by the Georgia General Assembly in the 1981 Session (Georgia Laws, 1981, p. 1931) which called for a referendum on the question of whether or not the local option sales tax should go to the Bulloch County Board of Education, with a dollar for dollar reduction in the school property tax. (Boards of Education in Georgia are limited to a maximum millage rate of 20.) The referendum passed on November 2, 1982. Since that time, this money has gone to the Board of Education. Since most Georgia counties and cities negotiate a formula to distribute this sales tax among the county and city governments in that county, this puts both the City of Statesboro and Bulloch County government at a distinct disadvantage relative to almost all the other cities and counties in the state. It means that we have to rely more heavily on the local property tax and user fees
Governmental Business Percentage Governmental Business Percentage
Activities Activities Total of Total Activities Activities Total of Total
Revenues:
Program:
Charges for services 3,610,630$ 24,124,080$ 27,734,710$ 49% 3,437,893$ 22,987,047$ 26,424,940$ 53%
Operating grants 1,868,415 - 1,868,415 3% 7,914 - 7,914 0%
Capital grants and contributions 14,233,204 577,459 14,810,663 26% 11,341,513 485,727 11,827,240 24%
General:
Taxes 11,910,076 - 11,910,076 21% 11,351,480 - 11,351,480 23%
Other 122,773 63,319 186,092 1% 100,046 74,465 174,511 0%
Total revenues 31,745,098 24,764,858 56,509,956 100% 26,238,846 23,547,239 49,786,085 100%
Program Expenses:
General government 2,099,937 - 2,099,937 5% 2,760,181 - 2,760,181 6%
Municipal court 486,596 - 486,596 1% 646,415 - 646,415 1%
Public safety 12,965,179 - 12,965,179 30% 16,740,347 - 16,740,347 33%
Public works 4,436,784 - 4,436,784 10% 4,017,087 - 4,017,087 8%
Community development 984,389 - 984,389 2% 813,332 - 813,332 2%
Parks and cemetries 456,764 - 456,764 1% 566,597 - 566,597 1%
Engineering 390,608 - 390,608 1% 397,071 - 397,071 1%
Planning and zoning 506,163 - 506,163 1% 423,640 - 423,640 1%
Community services 484,643 - 484,643 1% 261,159 - 261,159 1%
Interest 187,346 - 187,346 1% 144,933 - 144,933 0%
Water and sewer - 8,836,206 8,836,206 21% - 10,978,277 10,978,277 22%
Stormwater - 934,807 934,807 2% - 1,265,921 1,265,921 3%
Gas - 3,149,497 3,149,497 7% - 3,015,049 3,015,049 6%
Solid waste collection - 3,462,941 3,462,941 8% - 3,624,436 3,624,436 7%
Solid waste disposal - 3,988,337 3,988,337 9% - 3,814,157 3,814,157 8%
Total expenses 22,998,409 20,371,788 43,370,197 100% 26,770,762 22,697,840 49,468,602 100%
Excess 8,746,689 4,393,070 13,139,759 (531,916) 849,399 317,483
Transfers 1,817,640 (1,817,640) - 1,452,730 (1,452,730) -
Change in net position 10,564,329 2,575,430 13,139,759 920,814 (603,331) 317,483
Beginning net position 44,197,717 63,635,713 107,833,430 43,276,903 64,239,044 107,515,947
Ending net position 54,762,046$ 66,211,143$ 120,973,189$ 44,197,717$ 63,635,713$ 107,833,430$
Summary of Changes in Net Position
20202021
6

MANAGEMENT'S DISCUSSION AND ANALYSIS (Unaudited) City of Statesboro, Georgia June 30, 2021
than these other cities and counties. For example, if the City and County had equally split this approximately $13,647,248 in local option sales taxes in fiscal year 2021, the City would have had $6,823,624. That is more than the City collected in property taxes.
However, the City of Statesboro and Bulloch County (and the other cities in the county) do share the proceeds of a 1% Special Purpose Local Option Sales Tax (SPLOST), which has passed referendum in 2018 for a six-year term. In fiscal year 2021, sales taxes of $6,871,340 out of $32,355,406 in total governmental funds revenues, or 21.2% were received from the 2019 SPLOST. $1,782,999 in 2013 SPLOST funds and $358,589 in 2019 SPLOST funds were transferred to the business-type funds for capital projects (water and sewer, gas and solid waste collection and disposal systems). Similarly, in fiscal year 2020, $5,149,751 in sales taxes represented 20.2% of the $25,550,243 in governmental funds revenues.
The City of Statesboro and Bulloch County (and the other cities in the county) also share the proceeds of a 1% Transportation Special Purpose Local Option Sales Tax (TSPLOST), which was passed by referendum in the spring of 2018 for a five-year term with collections beginning in the fall of 2018. In fiscal year 2021, sales taxes of $6,205,066 out of $32,355,406 in total governmental funds revenues, or 19.2%, were received from the 2018 TSPLOST.
The City is heavily reliant on taxes to support governmental activities operations. In total, taxes make up 37.5% of revenues as compared to 43.3% in fiscal year 2020. Property taxes provided $6,259,255 or 19.3% of the City’s total governmental activities revenue as compared to 22.6% in fiscal year 2020.
Also, note that program revenues covered 85.7% in fiscal year 2021, and 55.2% in fiscal year 2020 of governmental operating expenses. This means that the government’s taxpayers and the City’s other general revenues funded the remaining 14.3% in fiscal year 2021, and 44.8% in fiscal year 2020 of the governmental activities. As this documents, the general economy and the local businesses have a major impact on the City’s revenue streams.
GOVERNMENTAL FUNCTIONAL EXPENSES
The public safety function comprises 56.4% of the City’s total governmental activity expenses and 29.9% of the total City expenses in fiscal year 2021. In fiscal year 2020, the figures were 62.5% and 33.8% respectively. In fiscal year 2021, general government totaled 9.1% of the total governmental activity expense, and 4.8% of the total City expenses. In fiscal year 2019, general government totaled 10.3% of the total governmental activity expenses, and 5.6% of the total City expenses. Of the total $23 million of governmental expenses, depreciation is 11.8% of that total. In fiscal year 2020, the numbers were $26.77 million and 9.4% respectively
The following table presents the cost of each of the City’s programs, including the net costs (i.e., total cost less revenues generated by the activities). The net costs illustrate the financial burden that was placed on the City’s taxpayers by each of these functions.
Total Cost of Net Cost of Total Cost of Net Cost of
Services Services Services Services
General Government 2,099,937$ 1,224,330$ 2,760,181$ 1,766,733$
Municipal Court 486,596 486,596 646,415 646,415
Public Safety 12,965,179 6,776,201 16,740,347 13,504,082
Public Works 4,436,784 (7,473,566) 4,017,087 (6,074,189)
Community Development 984,389 655,074 813,332 590,827
Parks and Cemeteries 456,764 412,764 566,597 535,478
Engineering 390,608 244,856 397,071 359,785
Planning and Zoning 506,163 287,916 423,640 248,219
Community Services 484,643 484,643 261,159 261,159
Interest 187,346 187,346 144,933 144,933
Total 22,998,409$ 3,286,160$ 26,770,762$ 11,983,442$
20202021
Governmental Activities
7
MANAGEMENT'S DISCUSSION AND ANALYSIS (Unaudited) City of Statesboro, Georgia June 30, 2021
For fiscal year 2021 and 2020, all functions required a subsidy from general revenues except for public works. In fiscal year 2021 and 2020, $4,778,452 and $3,900,168 respectively, in SPLOST revenue received from the County was included in program revenue for public works. Also in fiscal year 2021 and 2020, $6,205,066 and $5,522,961, respectively, in TSPLOST revenue received from the county was included in the program revenue for public works.
BUSINESS-TYPE ACTIVITIES
Revenues vs. Expenses
For fiscal year 2019, operating revenues for utility funds were 2.4% higher than 2018 and operating expenses were 4.5% higher than fiscal year 2018. Within the total business type activities of the City, the activities reported $4,277,686 in operating income, or a decrease of 6.2% compared to the fiscal year 2018. After transfer in and out between other funds, those funds reported a gain of $1,807,336 or a decrease of $1,334,775 compared to the fiscal year 2018. The primary reasons for this decrease was an increase in purchased services and depreciation expense. Also net transfers out to other funds increased in fiscal year 2019.
For fiscal year 2020, operating revenues for utility funds were 2.6% lower than 2019 and operating expenses were 12.0% higher than fiscal year 2019. Within the total business type activities of the City, the activities reported $1,356,960 in operating income, or a decrease of 68.3% compared to the fiscal year 2019. After transfer in and out between other funds, those funds reported a loss of $350,657 or a decrease of $2.157,993 compared to the fiscal year 2019. The primary reasons for this decrease was an increase in retirement expense. The City changed its retirement plan in fiscal year 2020 to allow employees to retire after 30 years of services instead of the age requirement of 65 years old and 5 years of service. The modifier was also changed from 1.25% to 2%.
For fiscal year 2021, operating revenues for utility funds were 4.9% higher than 2020 and operating expenses were 8.4% lower than fiscal year 2020. Within the total business type activities of the City, the activities reported $4,302,021 in operating income, or an increase of 217% compared to the fiscal year 2020. After transfer in and out between other funds, those funds reported an income of $2,878,510 or an increase of $3.229,167 compared to the fiscal year 2020. The primary reasons for this increase was a decrease in retirement expense. The City changed its retirement plan in fiscal year 2020 to allow employees to retire after 30 years of services instead of the age requirement of 65 years old and 5 years of service. The modifier was also changed from 1.25% to 2%.
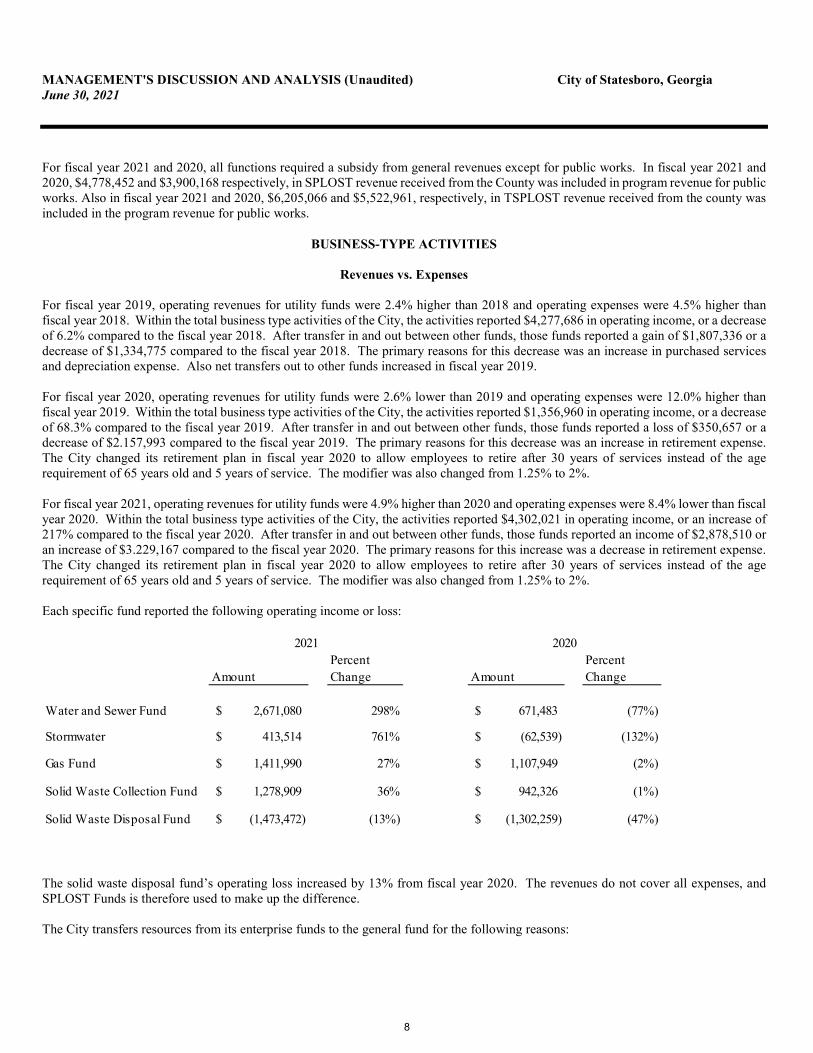
Each specific fund reported the following operating income or loss:
The solid waste disposal fund’s operating loss increased by 13% from fiscal year 2020. The revenues do not cover all expenses, and SPLOST Funds is therefore used to make up the difference.
The City transfers resources from its enterprise funds to the general fund for the following reasons:
Percent Percent
Amount Change Amount Change
Water and Sewer Fund 2,671,080$ 298% 671,483$ (77%)
Stormwater 413,514$ 761% (62,539)$ (132%)
Gas Fund 1,411,990$ 27% 1,107,949$ (2%)
Solid Waste Collection Fund 1,278,909$ 36% 942,326$ (1%)
Solid Waste Disposal Fund (1,473,472)$ (13%) (1,302,259)$ (47%)
2021 2020
8

MANAGEMENT'S DISCUSSION AND ANALYSIS (Unaudited) City of Statesboro, Georgia June 30, 2021
Since the City does partial indirect cost allocation, the transfers help cover the General Fund’s indirect costs that could be charged to the enterprise funds as indirect costs. These costs include the various staff divisions, such as personnel, finance, and records, as well as part of the City Manager's time.
If these enterprise funds were privately owned, the City would be entitled to a franchise fee equal to 5% of the gross revenues, similar to CATV, electricity, or telephone service providers. These transfers offset some of these costs.
If these enterprise funds were privately owned, the City would be entitled to property taxes on the property in service, net of accumulated depreciation, similar to CATV, electricity, or telephone service providers. These transfers are made in lieu of property taxes.
If these enterprise funds were privately owned, their approved rate tariffs would include a reasonable return on shareholder equity. Since the City’s taxpayers are in fact the investors who started and financed these operations, they are being rewarded with a comparable return on equity in the form of lower property taxes. This return can be made while still maintaining retail rates that are at or below the surrounding market prices offered by private utility companies. For example, the City’s natural gas system rates are considerably lower than any investor-owned utility or private gas marketer in our geographic area.
Hosting a sizable regional university, as well as being the county seat, results in a considerable amount of state and county property not being subject to property taxation. However, services such as police, fire, street repair and cleaning, and traffic signalization must be provided and expanded as needed, and must be funded from general revenues. Transfers from the enterprise funds help offset this burden, while sharing it more equitably among all citizens and institutions.
The solid waste disposal fund recognized a transfer in from the 2013 SPLOST fund of $1,215,620 and $311,185 from the 2019 SPLOST fund of, which was used for the purchase of landfill space (air rights) in the Wayne County Solid Waste Landfill, for post-closure costs for our Lakeview Landfill, and equipment for the Transfer Station.
Financial Analysis of the City’s Funds
Governmental Funds
Governmental funds are reported in the fund statements with a short-term, inflow and outflow of spendable resources focus. This information is useful in assessing resources available at the end of the year in comparison with upcoming financing requirements. Governmental funds reported ending fund balances of $36,707,983 in fiscal year 2021, compared to $26,767,350 in fiscal year 2020, and $19,593,132 in fiscal year 2019. Of these year-end totals, $28,135,199 (or 76.6%) in fiscal year 2021 and $19,704,501 (or 73.6%) in fiscal year 2020 were restricted for specific purposes and not available for continuing city service requirements.
The total ending fund balances of governmental funds show an increase in fiscal year 2021 of $9,940,633 or 37.1% compared to an increase in fiscal year 2020 of $7,174,218 or 36.6%. The fiscal year 2021 increase is primarily the result of more SPLOST and TSPLOST funds received than spent on capital projects for the fiscal year.
Major Governmental Funds
The General Fund is the City’s primary operating fund and the largest source of day-to-day service delivery. The General Fund’s fund balance increased by $1,435,221 in fiscal year 2021. The General Fund’s fund balance increased by $720,311 in fiscal year 2020, and increased by $1,156,306 in fiscal year 2019. One of the main reasons for the increase was the receipt of CARES grant funds for reimbursement of police salaries.
Total taxes for the general fund were $10,842,880, or 5.6% higher than in fiscal year 2020. Total property taxes in fiscal year 2021 were $5,937,551 compared to $5,502,652 in fiscal year 2020. In fiscal year 2020, total taxes were $10,267,694 or 1.6% higher than the $10,102,826 in fiscal year 2019.
The general fund’s total expenditures increased by $1,329,814 in fiscal year 2021 compared to an increase of $528,122 in fiscal year 2020.
9
MANAGEMENT'S DISCUSSION AND ANALYSIS (Unaudited) City of Statesboro, Georgia June 30, 2021
The General Fund’s ending unassigned fund balance of $7,355,500 represents the equivalent of 40.6% of the $18,107,686 in annual expenditures and transfers out budgeted for the next fiscal year. The City's overall cash flow varies little from month to month. The only real peak is in the December-February timeframe, when property taxes become due, then delinquent. The reason for this is that the utility revenues are consistent on a monthly basis, and other General Fund revenues come in during months when property taxes do not. Given this relatively stable cash flow environment, the City has set a target for unassigned fund balance in the General Fund of 25% of the next fiscal year's budgeted General Fund expenditures and transfers out. This provides more than adequate cash flow to handle these monthly fluctuations, while providing a cushion against any major unexpected events. The unassigned fund balance is at 40.6%, above the 25% target set for unassigned fund balance. The governing body has adopted a conservative General Fund budget for fiscal year 2022.
The Statesboro Fire Service Fund was created in fiscal year 2008. This fund accounts for the operations of the Statesboro Fire Department, which serves all the citizens of Statesboro and county citizens within the five-mile fire district. This fund had a fund balance of $1,503,758 at year-end compared to $831,872 at the end of fiscal year 2020. This represents a $671,886 or 80.8% increase. The increase is mainly due to reimbursement of Fire salaries from the CARES Act grant funds.
The 2013 SPLOST fund’s ending restricted fund balance was $5,717,992 for fiscal year 2021. This is a decrease of $1,793,960 from fiscal year 2020. The collection of the 1% sales tax for the 2013 SPLOST ended September 2019. Therefore, the fund balance will continue to decrease until all money is spent.
The new 2019 SPLOST fund had an ending fund balance of $10,563,896. Fiscal Year 2021 was the first full year of 2019 SPLOST collections.
The Proprietary Funds
The proprietary funds statements share the same focus as the government-wide statements, reporting both short-term and long-term information about financial status. Each of the fund statements give detailed information about their financial condition.
Budgetary Highlights
The General Fund – Overall, the City recognized revenues equal to 105.9% of budgeted revenues in the final appropriated budget. Overall, the City recognized expenditures equal to $1,008,235 less than, or 93.3% of budgeted expenditures in the final appropriated budget. In summary, the budget was underspent by 6.7% while revenue estimates were 5.9% over.
On the revenue side of the budget, automobile taxes came in $186,234 more than budgeted. Intergovernmental revenue came in $ 143,863 more than budgeted. Property taxes came in $139,317 more than budgeted. Licenses and permits came in $193,107 more than budgeted. Fines and Forfeitures came in $95,178 less than budgeted. In total, General Fund revenues came in $800,321 more than the budgeted amount.
On the expenditure side, Municipal Court, Parks and Cemeteries, Police, Streets and Public Works, and Engineering costs were considerably below the budgeted amounts. Overall, the General Fund expenditures were $1,008,235 less than budgeted.
Fund Balance was budgeted to decrease by $394,635. However, the fund balance increased by $1,435,221, which was $1,829,856 more than budgeted.
Capital Assets and Debt Administration
Capital Assets
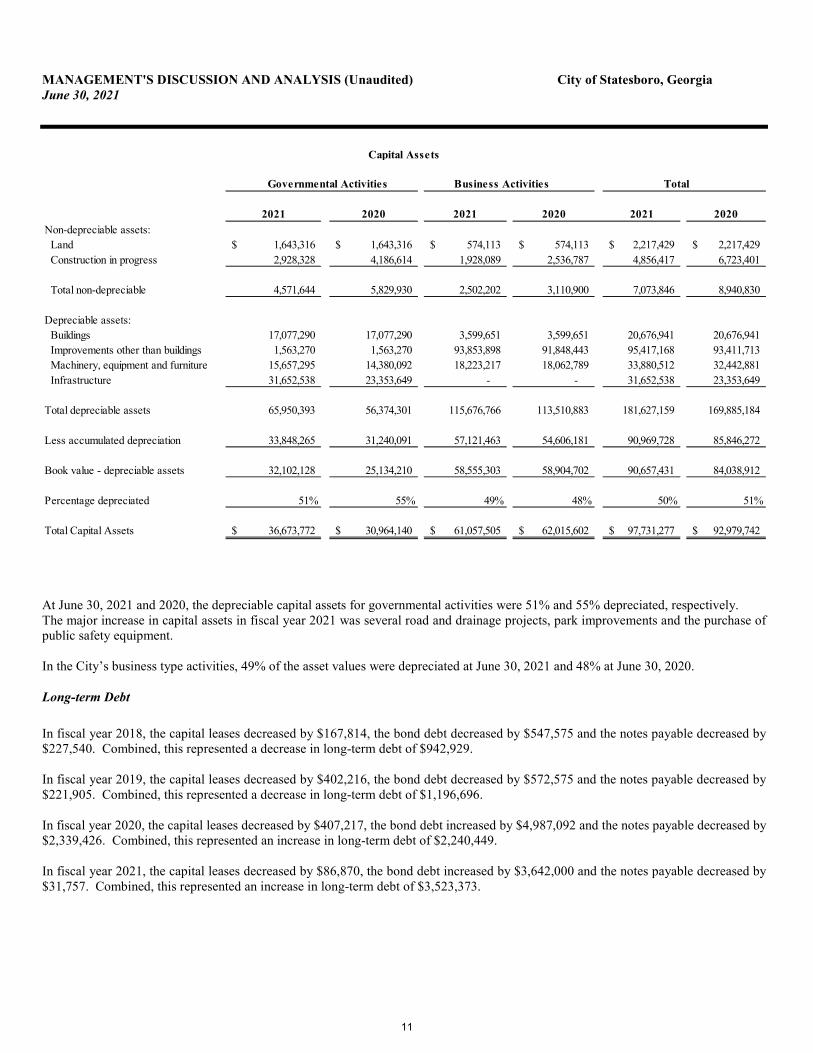
The City's investment in capital assets, net of accumulated depreciation, for governmental (including the fleet management and central service internal service funds) and business-type activities as of June 30, 2021 was $36,673,772 and $61,057,505 respectively, for a total of $97,731,277. That compares to fiscal year 2020 numbers of $30,964,140 and $62,015,602 respectively, for a total of $92,979,742. The fiscal year 2021 totals in this net investment were an 18% increase for governmental and a 1.5% decrease for business-type activities. See Note 3D for additional information about changes in capital assets during the fiscal year and outstanding at the end of the year. The following table provides a summary of capital asset activity.
10
MANAGEMENT'S DISCUSSION AND ANALYSIS (Unaudited) City of Statesboro, Georgia June 30, 2021
At June 30, 2021 and 2020, the depreciable capital assets for governmental activities were 51% and 55% depreciated, respectively. The major increase in capital assets in fiscal year 2021 was several road and drainage projects, park improvements and the purchase of public safety equipment.
In the City’s business type activities, 49% of the asset values were depreciated at June 30, 2021 and 48% at June 30, 2020.
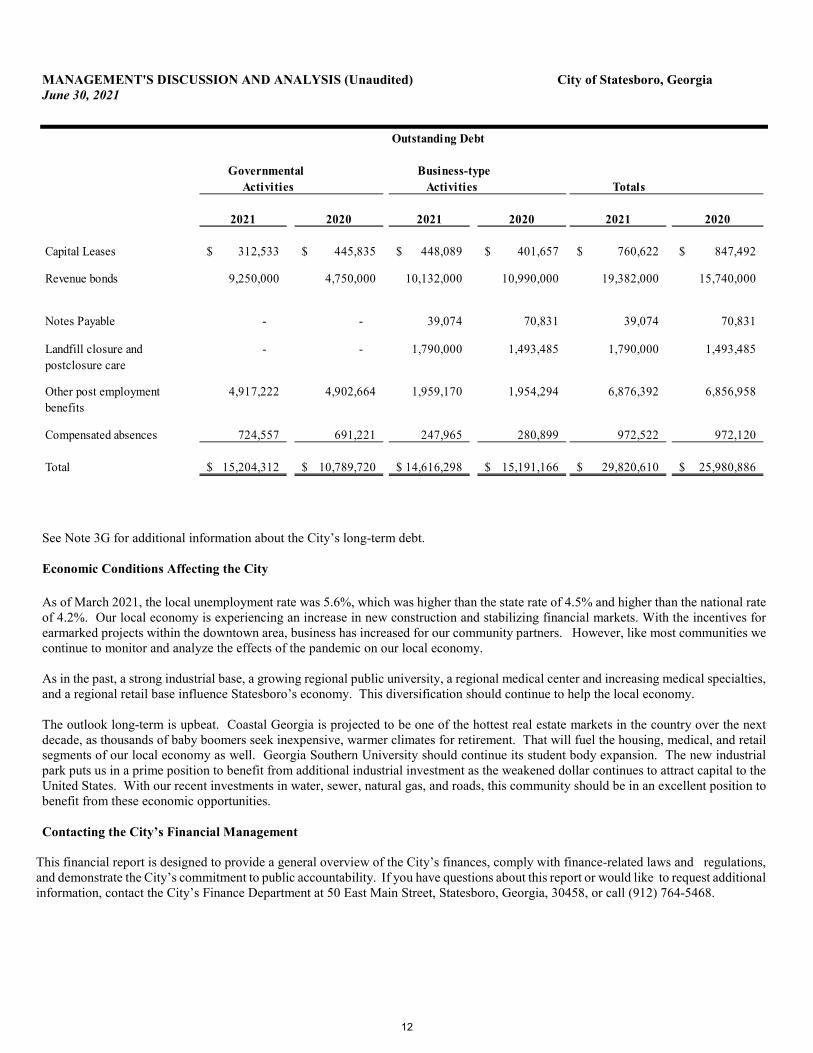
Long-term Debt
In fiscal year 2018, the capital leases decreased by $167,814, the bond debt decreased by $547,575 and the notes payable decreased by $227,540. Combined, this represented a decrease in long-term debt of $942,929.
In fiscal year 2019, the capital leases decreased by $402,216, the bond debt decreased by $572,575 and the notes payable decreased by $221,905. Combined, this represented a decrease in long-term debt of $1,196,696.
In fiscal year 2020, the capital leases decreased by $407,217, the bond debt increased by $4,987,092 and the notes payable decreased by $2,339,426. Combined, this represented an increase in long-term debt of $2,240,449.
In fiscal year 2021, the capital leases decreased by $86,870, the bond debt increased by $3,642,000 and the notes payable decreased by $31,757. Combined, this represented an increase in long-term debt of $3,523,373.
Governmental Activities Business Activities Total
2021 2020 2021 2020 2021 2020
Non-depreciable assets:
Land 1,643,316$ 1,643,316$ 574,113$ 574,113$ 2,217,429$ 2,217,429$
Construction in progress 2,928,328 4,186,614 1,928,089 2,536,787 4,856,417 6,723,401
Total non-depreciable 4,571,644 5,829,930 2,502,202 3,110,900 7,073,846 8,940,830
Depreciable assets:
Buildings 17,077,290 17,077,290 3,599,651 3,599,651 20,676,941 20,676,941
Improvements other than buildings 1,563,270 1,563,270 93,853,898 91,848,443 95,417,168 93,411,713
Machinery, equipment and furniture 15,657,295 14,380,092 18,223,217 18,062,789 33,880,512 32,442,881
Infrastructure 31,652,538 23,353,649 - - 31,652,538 23,353,649
Total depreciable assets 65,950,393 56,374,301 115,676,766 113,510,883 181,627,159 169,885,184
Less accumulated depreciation 33,848,265 31,240,091 57,121,463 54,606,181 90,969,728 85,846,272
Book value - depreciable assets 32,102,128 25,134,210 58,555,303 58,904,702 90,657,431 84,038,912
Percentage depreciated 51% 55% 49% 48% 50% 51%
Total Capital Assets 36,673,772$ 30,964,140$ 61,057,505$ 62,015,602$ 97,731,277$ 92,979,742$
Capital Assets
11
MANAGEMENT'S DISCUSSION AND ANALYSIS (Unaudited) City of Statesboro, Georgia June 30, 2021
See Note 3G for additional information about the City’s long-term debt.
Economic Conditions Affecting the City
As of March 2021, the local unemployment rate was 5.6%, which was higher than the state rate of 4.5% and higher than the national rate of 4.2%. Our local economy is experiencing an increase in new construction and stabilizing financial markets. With the incentives for earmarked projects within the downtown area, business has increased for our community partners. However, like most communities we continue to monitor and analyze the effects of the pandemic on our local economy.
As in the past, a strong industrial base, a growing regional public university, a regional medical center and increasing medical specialties, and a regional retail base influence Statesboro’s economy. This diversification should continue to help the local economy.
The outlook long-term is upbeat. Coastal Georgia is projected to be one of the hottest real estate markets in the country over the next decade, as thousands of baby boomers seek inexpensive, warmer climates for retirement. That will fuel the housing, medical, and retail segments of our local economy as well. Georgia Southern University should continue its student body expansion. The new industrial park puts us in a prime position to benefit from additional industrial investment as the weakened dollar continues to attract capital to the United States. With our recent investments in water, sewer, natural gas, and roads, this community should be in an excellent position to benefit from these economic opportunities.
Contacting the City’s Financial Management
This financial report is designed to provide a general overview of the City’s finances, comply with finance-related laws and regulations, and demonstrate the City’s commitment to public accountability. If you have questions about this report or would like to request additional information, contact the City’s Finance Department at 50 East Main Street, Statesboro, Georgia, 30458, or call (912) 764-5468.
Outstanding Debt
Governmental Business-type
Activities Activities Totals
2021 2020 2021 2020 2021 2020
Capital Leases 312,533$ 445,835$ 448,089$ 401,657$ 760,622$ 847,492$
Revenue bonds 9,250,000 4,750,000 10,132,000 10,990,000 19,382,000 15,740,000
Notes Payable - - 39,074 70,831 39,074 70,831
Landfill closure and - - 1,790,000 1,493,485 1,790,000 1,493,485
postclosure care
Other post employment 4,917,222 4,902,664 1,959,170 1,954,294 6,876,392 6,856,958
benefits
Compensated absences 724,557 691,221 247,965 280,899 972,522 972,120
Total 15,204,312$ 10,789,720$ 14,616,298$ 15,191,166$ 29,820,610$ 25,980,886$
12

Basic Financial Statements

Primary GovernmentGovernmental Business-type Component
Activities Activities Total UnitAssetsCurrent Assets Cash and cash equivalents 38,428,919$ 17,280,038$ 55,708,957$ 570,301$ Certificates of deposit 250,000 250,000 500,000 - Receivables: Accounts 222,987 3,607,381 3,830,368 - Taxes 181,862 - 181,862 - Hotel/motel taxes 77,227 - 77,227 - Intergovernmental 2,242,869 - 2,242,869 32,125 Notes 146,224 - 146,224 - Internal balances 679,799 (679,799) - - Inventory 160,900 429,016 589,916 - Prepaid items 96,623 35,464 132,087 4,703 Restricted assets - Cash and cash equivalents - 803,076 803,076 - Total Current Assets 42,487,410 21,725,176 64,212,586 607,129 Noncurrent Assets Restricted assets - Cash and cash equivalents - 1,834,470 1,834,470 - Capital Assets: Nondepreciable capital assets 4,571,644 2,502,202 7,073,846 308,198 Depreciable capital assets, net 32,102,128 58,555,303 90,657,431 411,225 Total Noncurrent Assets 36,673,772 62,891,975 99,565,747 719,423
Total Assets 79,161,182 84,617,151 163,778,333 1,326,552
Deferred Outflows of Resources Resources related to pensions 1,849,656 674,220 2,523,876 - Resources related to other post employment benefits 1,121,679 412,635 1,534,314 -
Total Deferred Outflows of Resources 2,971,335 1,086,855 4,058,190 -
LiabilitiesCurrent Liabilities Accounts payable 3,069,616 606,717 3,676,333 3,122 Accrued payroll and payroll taxes 580,444 190,296 770,740 5,720 Intergovernmental payable - 42,519 42,519 - Accrued interest payable - 54,449 54,449 - Claims payable 260,000 - 260,000 - Other liabilities 258,850 - 258,850 - Compensated absences payable 144,911 49,593 194,504 - Capital leases payable 229,926 210,069 439,995 - Notes payable - 32,720 32,720 17,220 Revenue bonds payable 350,000 878,000 1,228,000 - Customer deposits - 803,076 803,076 - Landfill post-closure care costs - 179,683 179,683 - Total Current Liabilities 4,893,747 3,047,122 7,940,869 26,062 Long-Term Liabilities: Compensated absences payable (net of current portion) 579,646 198,372 778,018 - Other post employment benefits payable 4,917,222 1,959,170 6,876,392 - Net pension obligation 6,620,191 2,547,250 9,167,441 - Capital leases payable (net of current portion) 82,607 238,020 320,627 - Revenue bonds payable (net of current portion) 8,900,000 9,254,000 18,154,000 - Notes payable (net of current portion) - 6,354 6,354 256,152 Landfill post-closure care costs (net of current portion) - 1,610,317 1,610,317 - Total Long-Term Liabilities 21,099,666 15,813,483 36,913,149 256,152
Total Liabilities 25,993,413 18,860,605 44,854,018 282,214
Deferred Inflows of Resources Unamortized premium on refunded bonds - 147,758 147,758 - Resources related to pensions 443,969 152,533 596,502 - Resources related to other post employment benefits 933,089 331,967 1,265,056 -
Total Deferred Inflows of Resources 1,377,058 632,258 2,009,316 -
Net PositionNet investment in capital assets 28,327,254 50,438,342 78,765,596 446,051 Restricted for: Capital projects 24,227,201 - 24,227,201 - Program purposes 2,719,382 - 2,719,382 - Unrestricted (511,791) 15,772,801 15,261,010 598,287
Total Net Position 54,762,046$ 66,211,143$ 120,973,189$ 1,044,338$
See accompanying notes to the basic financial statements
City of Statesboro, GeorgiaStatement of Net Position
June 30, 2021
13
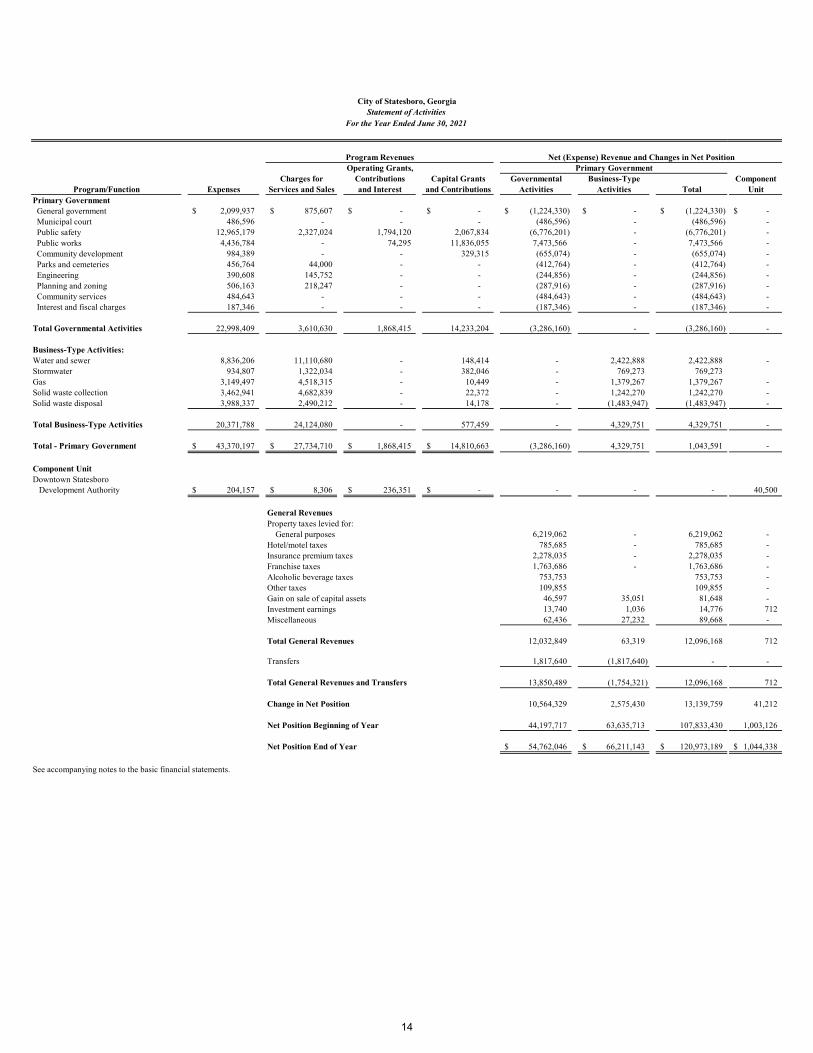
Program Revenues
Operating Grants, Primary Government
Charges for Contributions Capital Grants Governmental Business-Type Component
Program/Function Expenses Services and Sales and Interest and Contributions Activities Activities Total Unit
Primary Government General government 2,099,937$ 875,607$ -$ -$ (1,224,330)$ -$ (1,224,330)$ -$
Municipal court 486,596 - - - (486,596) - (486,596) -
Public safety 12,965,179 2,327,024 1,794,120 2,067,834 (6,776,201) - (6,776,201) -
Public works 4,436,784 - 74,295 11,836,055 7,473,566 - 7,473,566 -
Community development 984,389 - - 329,315 (655,074) - (655,074) -
Parks and cemeteries 456,764 44,000 - - (412,764) - (412,764) -
Engineering 390,608 145,752 - - (244,856) - (244,856) -
Planning and zoning 506,163 218,247 - - (287,916) - (287,916) -
Community services 484,643 - - - (484,643) - (484,643) -
Interest and fiscal charges 187,346 - - - (187,346) - (187,346) -
Total Governmental Activities 22,998,409 3,610,630 1,868,415 14,233,204 (3,286,160) - (3,286,160) -
Business-Type Activities:
Water and sewer 8,836,206 11,110,680 - 148,414 - 2,422,888 2,422,888 -
Stormwater 934,807 1,322,034 - 382,046 - 769,273 769,273
Gas 3,149,497 4,518,315 - 10,449 - 1,379,267 1,379,267 -
Solid waste collection 3,462,941 4,682,839 - 22,372 - 1,242,270 1,242,270 -
Solid waste disposal 3,988,337 2,490,212 - 14,178 - (1,483,947) (1,483,947) -
Total Business-Type Activities 20,371,788 24,124,080 - 577,459 - 4,329,751 4,329,751 -
Total - Primary Government 43,370,197$ 27,734,710$ 1,868,415$ 14,810,663$ (3,286,160) 4,329,751 1,043,591 -
Component Unit
Downtown Statesboro Development Authority 204,157$ 8,306$ 236,351$ -$ - - - 40,500
General Revenues
Property taxes levied for:
General purposes 6,219,062 - 6,219,062 -
Hotel/motel taxes 785,685 - 785,685 -
Insurance premium taxes 2,278,035 - 2,278,035 -
Franchise taxes 1,763,686 - 1,763,686 -
Alcoholic beverage taxes 753,753 753,753 -
Other taxes 109,855 109,855 -
Gain on sale of capital assets 46,597 35,051 81,648 -
Investment earnings 13,740 1,036 14,776 712
Miscellaneous 62,436 27,232 89,668 -
Total General Revenues 12,032,849 63,319 12,096,168 712
Transfers 1,817,640 (1,817,640) - -
Total General Revenues and Transfers 13,850,489 (1,754,321) 12,096,168 712
Change in Net Position 10,564,329 2,575,430 13,139,759 41,212
Net Position Beginning of Year 44,197,717 63,635,713 107,833,430 1,003,126
Net Position End of Year 54,762,046$ 66,211,143$ 120,973,189$ 1,044,338$
See accompanying notes to the basic financial statements.
Net (Expense) Revenue and Changes in Net Position
City of Statesboro, Georgia
Statement of Activities
For the Year Ended June 30, 2021
14
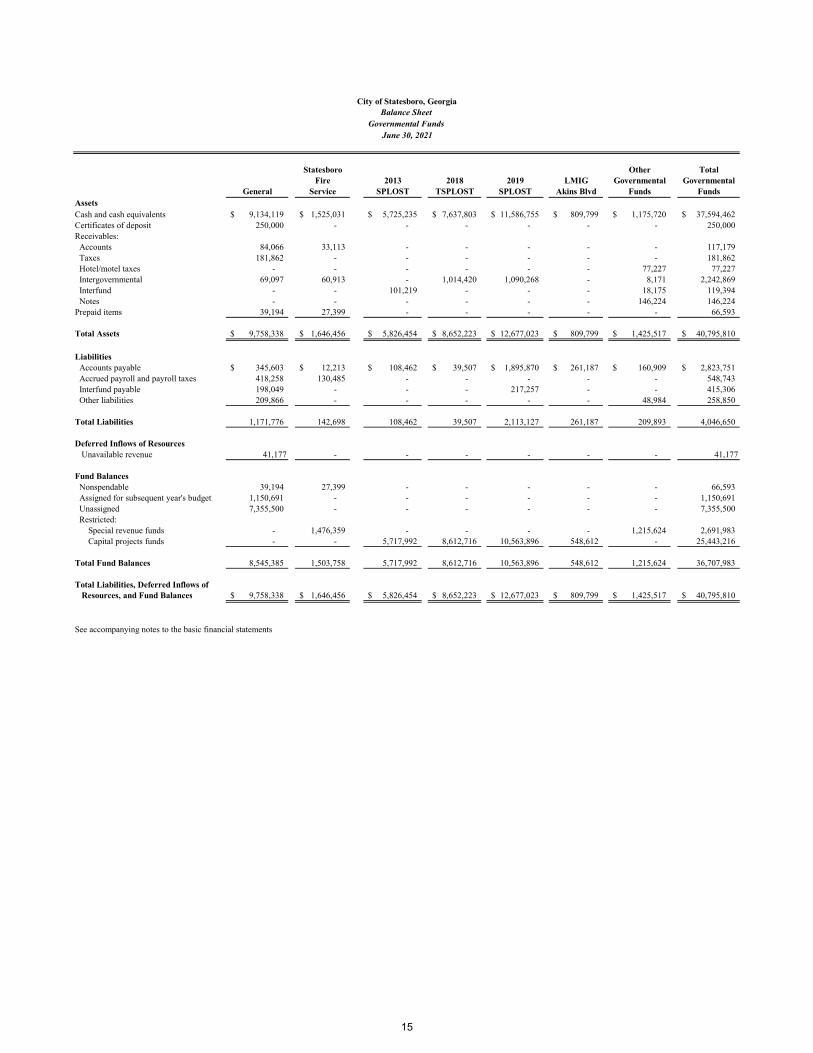
Statesboro Other Total
Fire 2013 2018 2019 LMIG Governmental Governmental
General Service SPLOST TSPLOST SPLOST Akins Blvd Funds Funds
Assets
Cash and cash equivalents 9,134,119$ 1,525,031$ 5,725,235$ 7,637,803$ 11,586,755$ 809,799$ 1,175,720$ 37,594,462$
Certificates of deposit 250,000 - - - - - - 250,000
Receivables:
Accounts 84,066 33,113 - - - - - 117,179
Taxes 181,862 - - - - - - 181,862
Hotel/motel taxes - - - - - - 77,227 77,227
Intergovernmental 69,097 60,913 - 1,014,420 1,090,268 - 8,171 2,242,869
Interfund - - 101,219 - - - 18,175 119,394
Notes - - - - - - 146,224 146,224
Prepaid items 39,194 27,399 - - - - - 66,593
Total Assets 9,758,338$ 1,646,456$ 5,826,454$ 8,652,223$ 12,677,023$ 809,799$ 1,425,517$ 40,795,810$
Liabilities
Accounts payable 345,603$ 12,213$ 108,462$ 39,507$ 1,895,870$ 261,187$ 160,909$ 2,823,751$
Accrued payroll and payroll taxes 418,258 130,485 - - - - - 548,743
Interfund payable 198,049 - - - 217,257 - - 415,306
Other liabilities 209,866 - - - - - 48,984 258,850
Total Liabilities 1,171,776 142,698 108,462 39,507 2,113,127 261,187 209,893 4,046,650
Deferred Inflows of Resources
Unavailable revenue 41,177 - - - - - - 41,177
Fund Balances
Nonspendable 39,194 27,399 - - - - - 66,593
Assigned for subsequent year's budget 1,150,691 - - - - - - 1,150,691
Unassigned 7,355,500 - - - - - - 7,355,500
Restricted:
Special revenue funds - 1,476,359 - - - - 1,215,624 2,691,983
Capital projects funds - - 5,717,992 8,612,716 10,563,896 548,612 - 25,443,216
Total Fund Balances 8,545,385 1,503,758 5,717,992 8,612,716 10,563,896 548,612 1,215,624 36,707,983
Total Liabilities, Deferred Inflows of Resources, and Fund Balances 9,758,338$ 1,646,456$ 5,826,454$ 8,652,223$ 12,677,023$ 809,799$ 1,425,517$ 40,795,810$
See accompanying notes to the basic financial statements
City of Statesboro, Georgia
Balance Sheet
Governmental Funds
June 30, 2021
15

June 30, 2021
Amounts Reported for Governmental Activities in the Statement of Net Position Are Different Because:
Total Governmental Fund Balances 36,707,983$
Capital assets used in governmental activities (excludes internal service funds)are not financial resources and therefore are not reported in the funds:
Cost 68,651,132$ Less accumulated depreciation (32,734,937) 35,916,195
Other long-term assets are not available to pay for current period expendituresand therefore are reported as unavailable revenue in the funds:
Property taxes 41,177
The net pension obligation is not a liability for govermental funds and thereforeis not reported in the funds. (6,233,512)
Deferred outflows and deferred inflows related to pensions is not reported in the governmental funds:
Deferred outflows of revenues 1,743,931$ Deferred inflows of revenues (411,010) 1,332,921
Deferred outflows and deferred inflows related to post employment benefitsis not reported in the governmental funds:
Deferred outflows of revenues 1,052,216Deferred inflows of revenues (877,342) 174,874
The internal service funds are used by management to chargethe costs of the operation and maintenance of the vehicle fleet,information technology, health insurance, and wellness program to individual funds. Certain assets and liabilities of the internalservice funds are included in governmental activitiescolumns in the statement of net position. 1,671,903
Interfund receivables and payables between governmental funds are reportedon the fund balance sheet but eliminated on the government-wide statement of net position:
Interfund receivables 119,394$ Interfund payables (119,394) -
Long-term liabilities, including capital leases, revenue bonds payable, compensated absences, and other post employment benefits payable are not due and payable in the current period and therefore are not reported in the funds but are reported on the statement of net position:
Capital leases payable (302,488)$ Revenue bonds payable (9,250,000)Other post employment benefits payable (4,621,083)Compensated absences (675,924) (14,849,495)
Net Position Of Governmental Activities 54,762,046$
See accompanying notes to the basic financial statements
Reconciliation of Governmental Funds Balance Sheet
to the Statement of Net Position
City of Statesboro, Georgia
16

Statesboro Other Total
Fire 2013 2018 2019 LMIG Governmental Governmental
General Service SPLOST TSPLOST SPLOST Akins Blvd Funds Funds
Revenues
Property taxes 5,937,551$ -$ -$ -$ -$ -$ 321,704$ 6,259,255$ Insurance premium taxes 2,278,035 - - - - - - 2,278,035Franchise taxes 1,763,686 - - - - - - 1,763,686
Other taxes 863,608 - - - - - - 863,608
Hotel/motel taxes - - - - - - 785,685 785,685
Intergovernmental 1,271,918 738,524 101,219 6,205,066 6,871,340 1,398,401 131,079 16,717,547
Licenses and permits 1,039,632 - - - - - - 1,039,632
Fines and forfeitures 650,822 - - - - - 88,990 739,812
Charges for services 429,107 1,402,079 - - - - - 1,831,186
Investment earnings 13,289 - 438 346 - - 451 14,524
Miscellaneous 23,703 11,655 - - - - 27,078 62,436
Total Revenues 14,271,351 2,152,258 101,657 6,205,412 6,871,340 1,398,401 1,354,987 32,355,406
Expenditures
Current: General government 1,922,511 - - - - - - 1,922,511 Municipal court 450,259 - - - - - - 450,259 Public safety 7,694,881 3,664,527 - - - - 86,643 11,446,051 Public works 2,075,483 - - - - - 1,405,404 3,480,887 Community development 80,562 - - - - - 883,898 964,460
Parks and cemeteries 359,061 - - - - - - 359,061
Engineering 333,203 - - - - - - 333,203
Planning and zoning 483,597 - - - - - - 483,597
Community services 386,863 - - - - - - 386,863
Capital Outlay - - 112,618 3,058,882 3,780,202 849,789 244,707 8,046,198
Debt Service:
Bond issuance cost - - - - 76,003 - - 76,003
Principal retirement 203,800 - - - - - - 203,800
Interest and fiscal charges 6,816 - - - - - 104,527 111,343
Total Expenditures 13,997,036 3,664,527 112,618 3,058,882 3,856,205 849,789 2,725,179 28,264,236
Excess (Deficiency) of Revenues Over
(Under) Expenditures 274,315 (1,512,269) (10,961) 3,146,530 3,015,135 548,612 (1,370,192) 4,091,170
Other Financing Sources (Uses)
Sale of capital assets 47,287 - - - - - 8,726 56,013
Issuance of revenue bond - - - - 4,500,000 - - 4,500,000
Issuance of capital lease - - - - - - 75,520 75,520
Transfers in 2,868,635 2,269,000 - - - - 138,271 5,275,906
Transfers out (1,755,016) (84,845) (1,782,999) - (358,589) - (76,527) (4,057,976)
Total Other Financing Sources (Uses) 1,160,906 2,184,155 (1,782,999) - 4,141,411 - 145,990 5,849,463
Net Change in Fund Balances 1,435,221 671,886 (1,793,960) 3,146,530 7,156,546 548,612 (1,224,202) 9,940,633
Fund Balances Beginning of Year 7,110,164 831,872 7,511,952 5,466,186 3,407,350 - 2,439,826 26,767,350
Fund Balances End of Year 8,545,385$ 1,503,758$ 5,717,992$ 8,612,716$ 10,563,896$ 548,612$ 1,215,624$ 36,707,983$
See accompanying notes to the basic financial statements
City of Statesboro, GeorgiaStatement of Revenues, Expenditures and Changes in Fund Balances
Governmental Funds
For the Year Ended June 30, 2021
17

Amounts Reported for Governmental Activities in the Statement of Activities are Different Because:
Net Change In Fund Balance - Total Governmental Funds 9,940,633$
Governmental funds report capital outlays as expenditures.However, in the statement of activities, the cost of those assets is allocated over their estimated useful lives asdepreciation expense. This is the amount by which capitalized capital outlayexceeded depreciation expense in the current period.
Depreciation expense (2,563,041)$ Capital outlay 8,404,127 5,841,086
Revenues in the statement of activities that do not providecurrent financial resources are not reported as revenuesin the funds.
Property taxes/SPLOST revenueUnavailable revenue @ 6/30/21 41,177$ Unavailable revenue @ 6/30/20 (698,082) (656,905)
Elimination of transfers between governmental funds:Transfers in 1,621,555$ Transfers out (1,621,555) -
Governmental funds do not report the cost of disposed capital assets but the costis reported on the statement of activities. (9,416)
Captial assets contributed by enterprise funds are not recorded in the governmental funds. -
The internal service funds used by management to charge thethe costs of self-insurance, fleet management and informationtechnology to individual funds are not reported in the government-wide statement of activities. Governmental fund expendituresand related internal service fund revenues are eliminated. (175,668)
Other financing sources for the issuance of revenue bonds and capital leases are reported on the fund level operating statement but are reported as a liability on the governmental-wide financial statements. (4,575,520)
Repayment of capital lease principal is an expenditure in thegovernmental funds, but the repayment reduces long-termliabilities in the statement of net position. 203,800
The change in the net pension obligation and pension related deferred outflows anddeferred inflows is reported on the government-wide statement ofactivities but not in the governmental funds. 182,998
The change in the other post employment benefits payable and related deferred outflows and deferred inflows is reported on the government-wide statement ofactivities but not in the governmental funds. (154,702)
Compensated absences reported in the statement of activities do not require the use of currentfinancial resources and therefore are not reported as expendituresin governmental funds.
Compensated absences liability @ 6/30/21 (675,924)$ Compensated absences liability @ 6/30/20 643,947 (31,977)
Change In Net Position of Governmental Activities 10,564,329$
See accompanying notes to the basic financial statements
For the Year Ended June 30, 2021
City of Statesboro, GeorgiaReconciliation of the Governmental Funds Statement of Revenues, Expenditures
and Changes in Fund Balances to the Statement of Activities
18

VarianceOriginal Final Positive
Budget Budget Actual (Negative)RevenuesTaxes: Property 5,162,000$ 5,162,000$ 5,301,317$ 139,317$ Automobiles 450,000 450,000 636,234 186,234 Franchise 1,706,000 1,706,000 1,763,686 57,686 Insurance premium 2,250,000 2,250,000 2,278,035 28,035 Alcoholic beverage 696,000 696,000 753,753 57,753 Other 95,000 95,000 109,855 14,855Licenses and permits 846,525 846,525 1,039,632 193,107Intergovernmental - 1,128,055 1,271,918 143,863Charges for services 374,350 374,350 429,107 54,757Fines and forfeitures 746,000 746,000 650,822 (95,178)Investment earnings - - 13,289 13,289Miscellaneous 17,100 17,100 23,703 6,603
Total Revenues 12,342,975 13,471,030 14,271,351 800,321
ExpendituresCurrent: General government Governing body 187,520 187,520 150,195 37,325 City manager's office 408,396 409,896 362,790 47,106 City clerk's office 215,156 216,656 178,039 38,617 Elections 1,825 1,825 - 1,825 Financial administration 491,515 497,012 487,322 9,690 Public information 114,015 159,515 140,440 19,075 Legal 154,772 155,272 148,269 7,003 Human resources 254,496 255,996 228,909 27,087 Government buildings 162,684 163,684 179,382 (15,698) General administration fees 47,125 47,170 47,165 5
Total general government 2,037,504 2,094,546 1,922,511 172,035
Municipal court 516,285 517,785 450,259 67,526
(continued)
City of Statesboro, Georgia General Fund
Statement of Revenues, Expenditures and
For the Year Ended June 30, 2021Changes in Fund Balance - Budget and Actual
19

(continued)
VarianceOriginal Final Positive
Budget Budget Actual (Negative) Public safety Police 7,896,373$ 8,055,118$ 7,625,306$ 429,812$ Emergency management 5,000 5,000 5,000 - Animal control 55,000 55,000 64,575 (9,575)
Total public safety 7,956,373 8,115,118 7,694,881 420,237
Streets/public works 2,221,103 2,232,603 2,075,483 157,120
Parks and cemeteries 433,255 436,755 359,061 77,694
Engineering 375,171 377,671 333,203 44,468
Planning and zoning 501,383 504,383 483,597 20,786
Community services Arts Center 130,755 130,755 129,478 1,277 Other 34,000 284,000 257,385 26,615
Total community services 164,755 414,755 386,863 27,892
Community development 80,850 80,850 80,562 288
Debt Service: Principal retirement 224,000 224,000 203,800 20,200 Interest and fiscal charges 6,805 6,805 6,816 (11)
Total Debt Service 230,805 230,805 210,616 20,189
Total Expenditures 14,517,484 15,005,271 13,997,036 1,008,235
Excess (Deficiency) of Revenues Over (Under)
Expenditures (2,174,509) (1,534,241) 274,315 1,808,556
Other Financing Sources (Uses)Transfers in 2,859,351 2,859,351 2,868,635 9,284Transfers out (1,589,745) (1,719,745) (1,755,016) (35,271)Sale of capital assets - - 47,287 47,287
Total Other Financing Sources (Uses) 1,269,606 1,139,606 1,160,906 21,300
Net Change in Fund Balances $ (904,903) $ (394,635) 1,435,221 $ 1,829,856
Fund Balances Beginning of Year 7,110,164
Fund Balances End of Year 8,545,385$
See accompanying notes to the basic financial statements.
City of Statesboro, Georgia General Fund
Statement of Revenues, Expenditures and
For the Year Ended June 30, 2021Changes in Fund Balances - Budget and Actual
20

VarianceOriginal Final Positive
Budget Budget Actual (Negative)RevenuesLicenses and permits 14,000$ 14,000$ -$ (14,000)$ Charges for services 1,350,365 1,369,280 1,402,079 32,799Intergovernmental - 671,805 738,524 66,719Miscellaneous - - 11,655 11,655
Total Revenues 1,364,365 2,055,085 2,152,258 97,173
ExpendituresCurrent:Public safety - Fire 3,560,520 3,800,590 3,664,527 136,063
Deficiency of Revenues Under Expenditures (2,196,155) (1,745,505) (1,512,269) 233,236
Other Financing Sources (Uses)Transfers in 2,269,000 2,269,000 2,269,000 -Transfers out (72,845) (72,845) (84,845) (12,000)
Total Other Financing Sources (Uses) 2,196,155 2,196,155 2,184,155 (12,000)
Net Change in Fund Balances $ - $ 450,650 671,886 $ 221,236
Fund Balances Beginning of Year 831,872
Fund Balances End of Year 1,503,758$
See accompanying notes to the basic financial statements.
City of Statesboro, GeorgiaStatesboro Fire Service Fund
Statement of Revenues, Expenditures and
For the Year Ended June 30, 2021Changes in Fund Balances - Budget and Actual
21

City of Statesboro, Georgia
Statement of Net Position
Proprietary Funds
June 30, 2021
Business-type Activities -
Enterprise Funds Governmental
Activities -
Water and Solid Waste Solid Waste Non-Major Internal Service
Sewer Gas Collection Disposal Stormwater Total Funds
Assets
Current Assets:
Cash and cash equivalents 8,450,413$ 4,060,752$ 3,221,793$ 1,075,882$ 471,198$ 17,280,038$ 834,457$
Certificates of deposit 125,000 125,000 - - - 250,000 -
Receivables:
Accounts 524,446 149,125 238,039 18,412 50,352 980,374 105,808
Unbilled accounts 1,436,307 474,011 384,382 224,381 107,926 2,627,007 -
Interfund - - - 217,257 - 217,257 78,655
Inventory 282,831 131,632 - - 14,553 429,016 160,900
Prepaid items 12,430 7,545 9,203 3,616 2,670 35,464 30,030
Restricted assets - Cash and cash equivalents 508,952 101,595 192,529 - - 803,076 -
Total Current Assets 11,340,379 5,049,660 4,045,946 1,539,548 646,699 22,622,232 1,209,850
Noncurrent Assets:
Restricted assets - Cash and cash equivalents 1,834,470 - - - - 1,834,470 -
Capital Assets:
Land 352,981 78,004 - 123,425 19,703 574,113 -
Construction in progress 418,647 207,429 - - 1,302,013 1,928,089 -
Depreciable capital assets, net 48,936,809 4,923,234 1,171,491 1,486,851 2,036,918 58,555,303 757,577
Total Noncurrent Assets 51,542,907 5,208,667 1,171,491 1,610,276 3,358,634 62,891,975 757,577
Total Assets 62,883,286 10,258,327 5,217,437 3,149,824 4,005,333 85,514,207 1,967,427
Deferred Outflows of Resources
Resources related to pensions 380,832 65,081 121,932 52,660 53,715 674,220 105,725
Resources related to other post employment benefits 229,388 43,209 75,143 30,778 34,117 412,635 69,463
Totala Deferred Outflows of Resources 610,220 108,290 197,075 83,438 87,832 1,086,855 175,188
Liabilities
Current Liabilities:
Accounts payable 203,663 156,564 42,453 191,730 12,307 606,717 245,865
Accrued payroll 101,923 21,713 36,660 14,323 15,677 190,296 31,701
Intergovernmental payable - 42,519 - - - 42,519 -
Compensated absences payable 25,045 7,806 9,209 4,207 3,326 49,593 9,727
Notes payable - 32,720 - - - 32,720 -
Capital leases payable - - - - 210,069 210,069 10,045
Revenue bonds payable 878,000 - - - - 878,000 -
Customer deposits 508,952 101,595 192,529 - - 803,076 -
Landfill post-closure care costs - - - 179,683 - 179,683 -
Accrued interest payable 54,206 243 - - - 54,449 -
Claims payable - - - - - - 260,000
Total Current Liabilities 1,771,789 363,160 280,851 389,943 241,379 3,047,122 557,338
Long-Term Liabilities:
Net pension obligation 1,447,116 226,728 440,496 198,875 234,035 2,547,250 386,679
Compensated absences payable (net of current portion) 100,181 31,223 36,838 16,826 13,304 198,372 38,906
Other post employment benefits payable 1,168,220 207,873 333,674 151,108 98,295 1,959,170 296,139
Landfill post-closure care costs (net of current portion) - - - 1,610,317 - 1,610,317 -
Capital leases payable (net of current portion) - - - - 238,020 238,020 -
Notes payable (net of current portion) - - - - 6,354 6,354 -
Revenue bonds payable (net of current portion) 9,254,000 - - - - 9,254,000 -
Total Long-Term Liabilities 11,969,517 465,824 811,008 1,977,126 590,008 15,813,483 721,724
Total Liabilities 13,741,306 828,984 1,091,859 2,367,069 831,387 18,860,605 1,279,062
Deferred Inflows of Resources
Unamortized premium on refunded bonds 147,758 - - - - 147,758 -
Resources related to pension 90,193 22,564 28,257 10,690 829 152,533 32,959
Resources related to other post employment benefits 185,386 32,714 61,665 23,851 28,351 331,967 55,747
Total Deferred Inflows of Resources 423,337 55,278 89,922 34,541 29,180 632,258 88,706
Net Position
Net investment in capital assets 39,576,437 5,175,947 1,171,491 1,610,276 2,904,191 50,438,342 757,577
Unrestricted 9,752,426 4,306,408 3,061,240 (778,624) 328,407 16,669,857 17,270
Total Net Position 49,328,863$ 9,482,355$ 4,232,731$ 831,652$ 3,232,598$ 67,108,199 774,847$
Some amounts reported for business-type activities in the statement of
net position are different because certain internal service fund assets and
liabilities are included with business-type activities. (897,056)
Net position of business-type activities 66,211,143$
See accompanying notes to the basic financial statements
22
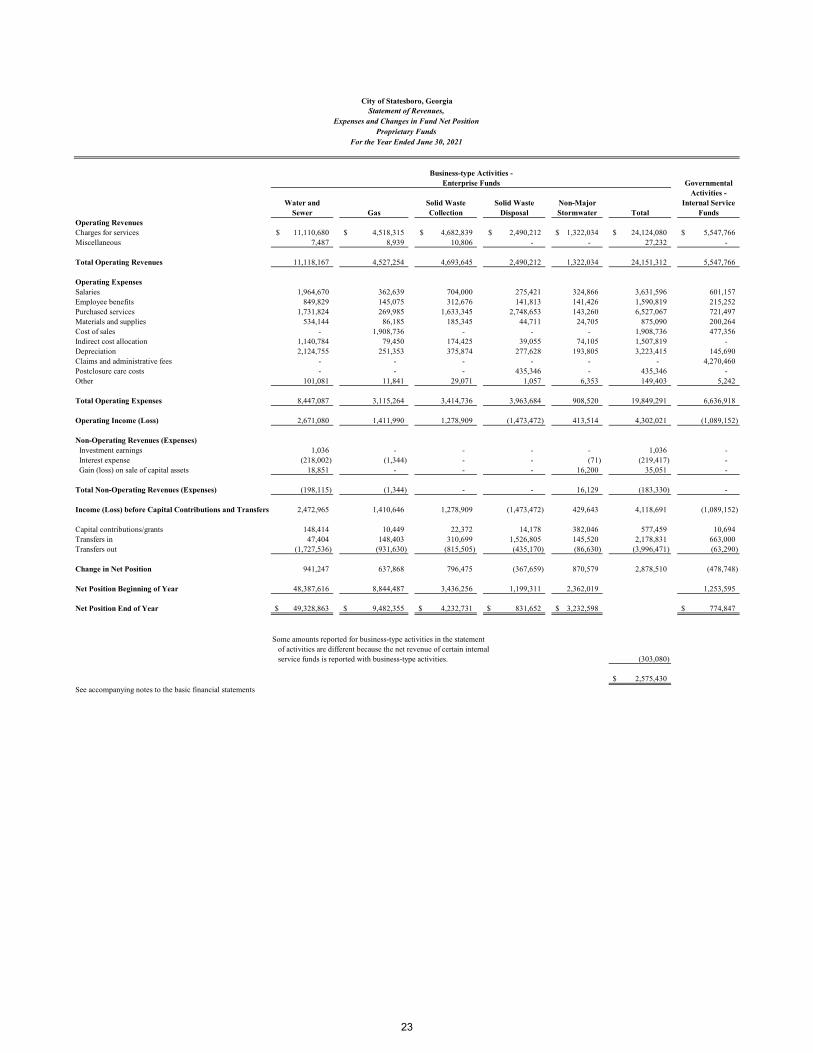
Statement of Revenues,
Expenses and Changes in Fund Net Position
For the Year Ended June 30, 2021
Enterprise Funds Governmental
Activities -
Water and Solid Waste Solid Waste Non-Major Internal Service
Sewer Gas Collection Disposal Stormwater Total Funds
Operating Revenues
Charges for services 11,110,680$ 4,518,315$ 4,682,839$ 2,490,212$ 1,322,034$ 24,124,080$ 5,547,766$
Miscellaneous 7,487 8,939 10,806 - - 27,232 -
Total Operating Revenues 11,118,167 4,527,254 4,693,645 2,490,212 1,322,034 24,151,312 5,547,766
Operating Expenses
Salaries 1,964,670 362,639 704,000 275,421 324,866 3,631,596 601,157
Employee benefits 849,829 145,075 312,676 141,813 141,426 1,590,819 215,252
Purchased services 1,731,824 269,985 1,633,345 2,748,653 143,260 6,527,067 721,497
Materials and supplies 534,144 86,185 185,345 44,711 24,705 875,090 200,264
Cost of sales - 1,908,736 - - - 1,908,736 477,356
Indirect cost allocation 1,140,784 79,450 174,425 39,055 74,105 1,507,819 -
Depreciation 2,124,755 251,353 375,874 277,628 193,805 3,223,415 145,690
Claims and administrative fees - - - - - - 4,270,460
Postclosure care costs - - - 435,346 - 435,346 -
Other 101,081 11,841 29,071 1,057 6,353 149,403 5,242
Total Operating Expenses 8,447,087 3,115,264 3,414,736 3,963,684 908,520 19,849,291 6,636,918
Operating Income (Loss) 2,671,080 1,411,990 1,278,909 (1,473,472) 413,514 4,302,021 (1,089,152)
Non-Operating Revenues (Expenses)
Investment earnings 1,036 - - - - 1,036 -
Interest expense (218,002) (1,344) - - (71) (219,417) -
Gain (loss) on sale of capital assets 18,851 - - - 16,200 35,051 -
Total Non-Operating Revenues (Expenses) (198,115) (1,344) - - 16,129 (183,330) -
Income (Loss) before Capital Contributions and Transfers 2,472,965 1,410,646 1,278,909 (1,473,472) 429,643 4,118,691 (1,089,152)
Capital contributions/grants 148,414 10,449 22,372 14,178 382,046 577,459 10,694
Transfers in 47,404 148,403 310,699 1,526,805 145,520 2,178,831 663,000
Transfers out (1,727,536) (931,630) (815,505) (435,170) (86,630) (3,996,471) (63,290)
Change in Net Position 941,247 637,868 796,475 (367,659) 870,579 2,878,510 (478,748)
Net Position Beginning of Year 48,387,616 8,844,487 3,436,256 1,199,311 2,362,019 1,253,595
Net Position End of Year 49,328,863$ 9,482,355$ 4,232,731$ 831,652$ 3,232,598$ 774,847$
Some amounts reported for business-type activities in the statement
of activities are different because the net revenue of certain internal
service funds is reported with business-type activities. (303,080)
2,575,430$
See accompanying notes to the basic financial statements
City of Statesboro, Georgia
Business-type Activities -
Proprietary Funds
23
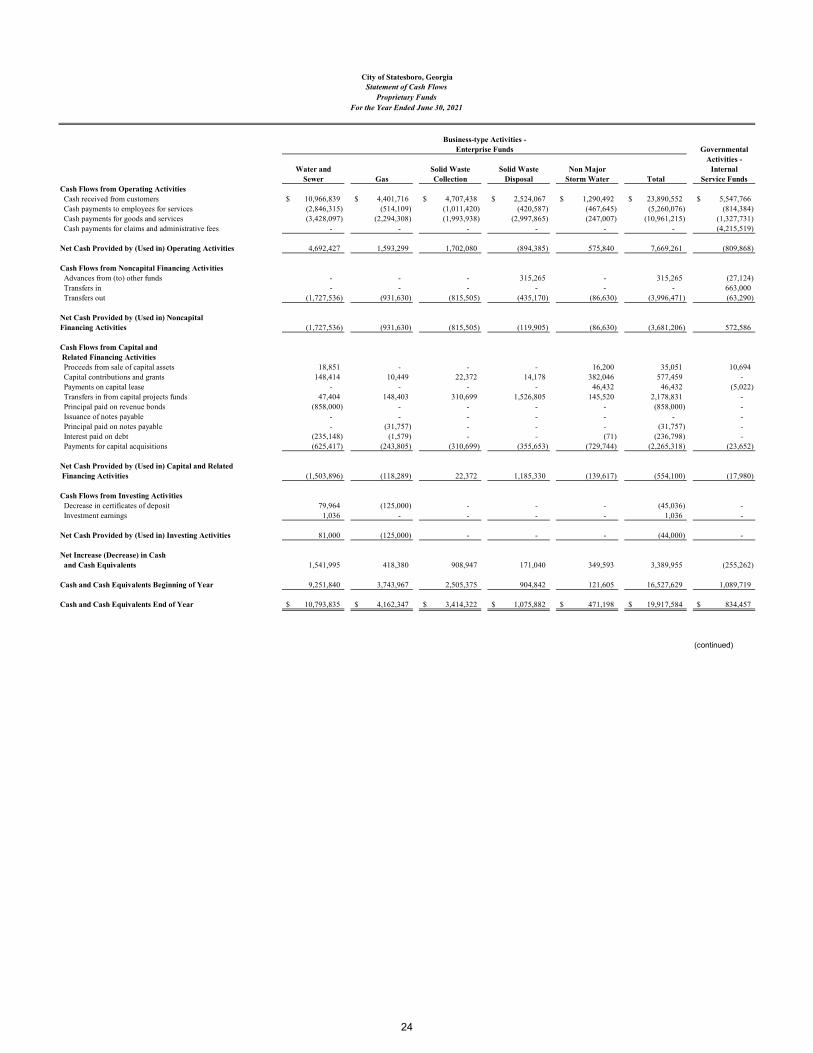
City of Statesboro, GeorgiaStatement of Cash Flows
Proprietary Funds
For the Year Ended June 30, 2021
Enterprise Funds Governmental
Activities -
Water and Solid Waste Solid Waste Non Major Internal
Sewer Gas Collection Disposal Storm Water Total Service Funds
Cash Flows from Operating Activities
Cash received from customers 10,966,839$ 4,401,716$ 4,707,438$ 2,524,067$ 1,290,492$ 23,890,552$ 5,547,766$
Cash payments to employees for services (2,846,315) (514,109) (1,011,420) (420,587) (467,645) (5,260,076) (814,384)
Cash payments for goods and services (3,428,097) (2,294,308) (1,993,938) (2,997,865) (247,007) (10,961,215) (1,327,731)
Cash payments for claims and administrative fees - - - - - - (4,215,519)
Net Cash Provided by (Used in) Operating Activities 4,692,427 1,593,299 1,702,080 (894,385) 575,840 7,669,261 (809,868)
Cash Flows from Noncapital Financing Activities
Advances from (to) other funds - - - 315,265 - 315,265 (27,124)
Transfers in - - - - - - 663,000
Transfers out (1,727,536) (931,630) (815,505) (435,170) (86,630) (3,996,471) (63,290)
Net Cash Provided by (Used in) Noncapital
Financing Activities (1,727,536) (931,630) (815,505) (119,905) (86,630) (3,681,206) 572,586
Cash Flows from Capital and
Related Financing Activities
Proceeds from sale of capital assets 18,851 - - - 16,200 35,051 10,694
Capital contributions and grants 148,414 10,449 22,372 14,178 382,046 577,459 -
Payments on capital lease - - - - 46,432 46,432 (5,022)
Transfers in from capital projects funds 47,404 148,403 310,699 1,526,805 145,520 2,178,831 -
Principal paid on revenue bonds (858,000) - - - - (858,000) -
Issuance of notes payable - - - - - - -
Principal paid on notes payable - (31,757) - - - (31,757) -
Interest paid on debt (235,148) (1,579) - - (71) (236,798) -
Payments for capital acquisitions (625,417) (243,805) (310,699) (355,653) (729,744) (2,265,318) (23,652)
Net Cash Provided by (Used in) Capital and Related
Financing Activities (1,503,896) (118,289) 22,372 1,185,330 (139,617) (554,100) (17,980)
Cash Flows from Investing Activities
Decrease in certificates of deposit 79,964 (125,000) - - - (45,036) -
Investment earnings 1,036 - - - - 1,036 -
Net Cash Provided by (Used in) Investing Activities 81,000 (125,000) - - - (44,000) -
Net Increase (Decrease) in Cash
and Cash Equivalents 1,541,995 418,380 908,947 171,040 349,593 3,389,955 (255,262)
Cash and Cash Equivalents Beginning of Year 9,251,840 3,743,967 2,505,375 904,842 121,605 16,527,629 1,089,719
Cash and Cash Equivalents End of Year 10,793,835$ 4,162,347$ 3,414,322$ 1,075,882$ 471,198$ 19,917,584$ 834,457$
(continued)
Business-type Activities -
24

City of Statesboro, GeorgiaStatement of Cash Flows
Proprietary Funds
For the Year Ended June 30, 2021
Enterprise Funds Governmental
Activities -
Water and Solid Waste Solid Waste Non-Major Internal
Sewer Gas Collection Disposal Stormwater Total Service Funds
Reconciliation of Operating Income (Loss) to Net Cash
Provided by (Used in) Operating Activities
Operating Income (Loss) 2,671,080$ 1,411,990$ 1,278,909$ (1,473,472)$ $413,514 4,302,021$ (1,089,152)$
Adjustments:
Depreciation 2,124,755 251,353 375,874 277,628 193,805 3,223,415 145,690
(Increase) Decrease in Assets and Deferred
Outflows of Resources:
Accounts receivable (175,319) (130,628) 159 33,855 (31,542) (303,475) (102,814)
Intergovernmental receivable - - - 2,017 - 2,017 -
Materials and supplies inventory 25,774 4,819 - - (4,879) 25,714 6,902
Prepaid items (986) 802 (932) (1,322) (602) (3,040) (848)
Deferred outflows related to pensions (269,767) (49,794) (96,666) (37,818) (44,607) (498,652) (82,544)
Deferred outflows related to other post employment benefits (60,410) (11,151) (21,647) (8,469) (9,989) (111,666) (18,484)
Increase (Decrease) in Liabilities and Deferred
Inflows of Resources:
Accounts payable 52,310 44,128 29,180 (26,253) 6,897 106,262 78,329
Accrued payroll (1,357) (971) 9,775 (500) 1,009 7,956 2,330
Compensated absences payable (22,386) (4,421) (2,572) (2,091) (1,464) (32,934) 1,359
Other post employment benefits payable 2,638 487 945 370 436 4,876 807
Deferred inflows related to pensions (18,741) (3,458) (6,715) (2,627) (3,098) (34,639) (5,735)
Deferred inflows related to other post employment benefits 87,440 16,140 31,333 12,258 14,459 161,630 26,754
Sales taxes payable - 12,140 - - - 12,140 -
Customer deposits 23,991 5,090 13,634 - - 42,715 -
Accrued landfill postclosure costs - - - 296,515 - 296,515 -
Net pension obligation 253,405 46,773 90,803 35,524 41,901 468,406 77,538
Claims payable - - - - - - 150,000
Net Cash Provided by (Used in) Operating Activities 4,692,427$ 1,593,299$ 1,702,080$ (894,385)$ 575,840$ 7,669,261$ (809,868)$
See accompanying notes to the basic financial statements
Business-type Activities -
25

Notes to the Basic Financial Statements

City of Statesboro, Georgia Notes to the Basic Financial Statements
For the Year Ended June 30, 2021
Index
Summary of Significant Accounting Policies ......................................................................... 1Reporting Entity ............................................................................................................................ 1-A Basis of Presentation ..................................................................................................................... 1-B Measurement Focus ...................................................................................................................... 1-C Basis of Accounting ...................................................................................................................... 1-D Assets, Liabilities and Fund Equity............................................................................................... 1-E Cash, Cash Equivalents and Investments……………………………………………………....1-E-1 Receivables………………………………………………………... .......................................... 1-E-2 Interfund Balances ..................................................................................................................... 1-E-3 Consumable Inventories ............................................................................................................. 1-E-4 Prepaid Items ............................................................................................................................. 1-E-5 Restricted Assets ........................................................................................................................ 1-E-6 Capital Assets ............................................................................................................................. 1-E-7 Deferred Outflows/Inflows of Resources……………………………………...……………….1-E-8 Compensated Absences .............................................................................................................. 1-E-9 Accrued Liabilities and Long-term Obligations ....................................................................... 1-E-10 Bond Premiums, Discounts and Issuance Costs ....................................................................... 1-E-11 Fund Equity .............................................................................................................................. 1-E-12 Operating Revenues and Expenses .......................................................................................... 1-E-13 Contributions of Capital ........................................................................................................... 1-E-14 Interfund Activity ..................................................................................................................... 1-E-15 Estimates .................................................................................................................................. 1-E-16 Comparative Data .................................................................................................................... 1-E-17
Stewardship, Compliance and Accountability ....................................................................... 2 Budgetary Information…………………………………………………………………… ….......2-A Excess of Expenditures over Appropriations……………………………………………. ……....2-B
Detailed Notes on All Funds .................................................................................................. 3 Deposits ........................................................................................................................................ 3-A Receivables ................................................................................................................................... 3-B Property Taxes .............................................................................................................................. 3-C Capital Assets ................................................................................................................................ 3-D Interfund Balances and Transfers .................................................................................................. 3-E Landfill Closure and Postclosure Care .......................................................................................... 3-F Long-Term Debt ........................................................................................................................... 3-G Pensions ........................................................................................................................................ 3-H Other Post–Employment Benefits………………………………………………………………...3-I Defined Contribution Plan ............................................................................................................. 3-J Fund Equity…………………………………………………………………………………..…...3-K
Other Notes .......................................................................................................................... 4 Risk Management ......................................................................................................................... 4-A Contingent Liabilities .................................................................................................................... 4-B Joint Ventures ............................................................................................................................... 4-C Hotel/Motel Lodging Tax ............................................................................................................. 4-D Subsequent Events………………………………………………………………………..……....4-E
26
City of Statesboro, Georgia Notes to the Basic Financial Statements
For the Year Ended June 30, 2021
The City of Statesboro (the “City”) was chartered by an act of the General Assembly of the State of Georgia. The City operates under a Council/Manager form of government and provides the following services as authorized by its charter: public safety (police and fire), streets, community development, community services and general administrative services. The City also operates four public utilities (water and sewer system, gas system and storm water system) and provides sanitation services. The City and Bulloch County jointly operate a transfer station for transport of solid waste and an inert landfill.
Note 1 - Summary of Significant Accounting Policies
The financial statements of the City have been prepared in conformity with accounting principles generally accepted in the United States (GAAP) as applied to governments. The Governmental Accounting Standards Board (GASB) is the accepted standard-setting body for governmental accounting and financial reporting. The City also applies Financial Accounting Standards Board (FASB) statements and interpretations issued on or before November 30, 1989, to its governmental and business-type activities at the government-wide financial reporting level and to its enterprise funds at the fund reporting level, provided they do not conflict with or contradict GASB pronouncements.
The most significant of the City’s accounting policies are described below.
1-A. Reporting Entity
The reporting entity is comprised of the primary government, component units and other organizations that are included to ensure that the financial statements are not misleading. The primary government of the City consists of all funds, departments, boards and agencies that are not legally separate from the City.
Component units are legally separate organizations for which the City is financially accountable. The City is financially accountable for an organization if the City appoints a voting majority of the organization's governing board and (1) the City is able to significantly influence the programs or services performed or provided by the organizations; or (2) the City is legally entitled to or can otherwise access the organization's resources; the City is legally obligated or has otherwise assumed the responsibility to finance the deficits of, or provide financial support to, the organization; or the City is obligated for the debt of the organization. Component units also may include organizations that are fiscally dependent on the City in that the City approves the budget, levies their taxes or issues their debt.
The component unit columns included on the government-wide financial statements identify the financial data of the City’s discretely presented component unit. It is reported separately to emphasize that it is legally separate from the City.
A brief description of the City’s discretely presented component unit follows:
Downtown Statesboro Development Authority (the Authority) – The Authority is a public corporation created in 1981. The primary purpose of the Authority is to promote industry and trade in the downtown area. The City Council appoints one board member and provides its primary funding. The Authority is fiscally dependent on the City and the City has a financial burden relationship with the Authority. There are no separate financial statements for the Authority.
Related OrganizationsThe Housing Authority of the City of Statesboro, Georgia is considered a related organization based upon the criteria in GASB Statement 14. The Housing Authority is a legally separate entity and the City does not appoint any of its board members. The City of Statesboro, Georgia is not able to impose its will upon the Housing Authority and a financial benefit/burden relationship does not exist between them. Therefore, based upon the criteria above, the Housing Authority of the City of Statesboro, Georgia is a related organization and is excluded from the reporting entity.
1-B. Basis of Presentation
The City’s basic financial statements consist of government-wide statements, including a statement of net position and a statement of activities and fund financial statements, which provide a more detailed level of financial information.
Government-wide Financial Statements - The government-wide financial statements include the statement of net position and the statement of activities. These statements report financial information for the City as a whole. The primary government and the component unit are presented separately within these financial statements with the focus on the primary government.
27

City of Statesboro, Georgia Notes to the Basic Financial Statements
For the Year Ended June 30, 2021
Note 1 - Summary of Significant Accounting Policies (continued)
Individual funds are not displayed but the statements distinguish governmental activities, generally supported by taxes and grants and City’s general revenues, from business-type activities, generally financed in whole or in part with service charges to external customers.
The statement of net position presents the financial position of the governmental and business-type activities of the City.
The statement of activities presents a comparison between direct expenses and program revenues for each function of the City’s governmental activities and for each identifiable activity of the business-type activities of the City. Direct expenses are those that are specifically associated with a function and therefore clearly identifiable to that particular function. The City does not allocate indirect expenses to functions in the statement of activities.
The statement of activities reports the expenses of a given function offset by program revenues directly connected with the functional program. A function is an assembly of similar activities and may include portions of a fund or summarize more than one fund to capture the expenses and program revenues associated with a distinct functional activity. Program revenues include: (1) charges for services that report fees and other charges to users of the City's services; (2) operating grants and contributions, which finance annual operating activities including restricted investment income; and (3) capital grants and contributions, which fund the acquisition, construction, or rehabilitation of capital assets. These revenues are subject to externally imposed restrictions to these program uses. For identifying to which function program revenue pertains, the determining factor for charges for services is which function generates the revenue. For grants and contributions, the determining factor is to which function the revenues are restricted.
Other revenue sources not properly included with program revenues are reported as general revenues of the City. The comparison of direct expenses with program revenues identifies the extent to which each governmental function and each identifiable business activity is self-financing or draws from the general revenues of the City.
Fund Financial Statements - During the year, the City segregates transactions related to certain City functions or activities in separate funds in order to aid financial management and to demonstrate legal compliance. Fund financial statements are designed to present financial information of the City at this more detailed level. Fund financial statements are provided for governmental and proprietary funds.
Major individual governmental and proprietary funds are reported in separate columns.
Fund Accounting - The City uses funds to maintain its financial records during the year. A fund is a fiscal and accounting entity with a self-balancing set of accounts. The City uses two categories of funds: governmental and proprietary.
Governmental Funds - Government funds are those through which most governmental functions typically are financed. Governmental fund reporting focuses on the sources, uses and balances of current financial resources. Expendable assets are assigned to the various governmental funds according to the purposes for which they may or must be used. Fund liabilities are assigned to the fund from which they will be liquidated. The City reports the difference between governmental fund assets and liabilities as fund balance. The following are the City's major governmental funds:
The General Fund – The general fund accounts for all financial resources except those required to be accounted for in another fund. The general fund’s fund balance is available to the City for any purpose provided it is expended or transferred according to the general laws of the State of Georgia.
Statesboro Fire Service Fund – This fund accounts for revenues collected from city taxpayers and taxpayers in the county’s five-mile fire district used to fund the City’s fire department.
2013 SPLOST Fund – This fund accounts for the special purpose local option sales tax collected pursuant to a 2013 referendum for various capital improvements within the City.
LMIG Akins Boulevard Fund – This fund accounts for the Local Maintenance Improvement Grant for the construction of an extension of Akins Boulevard.
28

City of Statesboro, Georgia Notes to the Basic Financial Statements
For the Year Ended June 30, 2021
Note 1 Summary of Significant Accounting Policies (Continued)
2018 TSPLOST Fund – This fund accounts for the transportation special purpose local option sales tax collected pursuant to a 2018 referendum for transportation capital improvements within the City.
2019 SPLOST Fund – This fund accounts for the special purpose local option sales tax collected pursuant to a 2019 referendum for various capital improvements within the City.
Proprietary Funds - Proprietary fund reporting focuses on the determination of operating income, changes in net position, financial position and cash flows. The proprietary funds are classified as enterprise funds and internal service funds. The City’s major enterprise funds consist of:
Water and Sewer Operating Fund – This fund accounts for the water and sewer provided to the City’s constituents.
Gas Operating Fund – This fund accounts for the gas services provided to the City’s constituents.
Solid Waste Collection Fund – This fund accounts for the solid waste collection program.
Solid Waste Disposal Fund – This fund accounts for the solid waste disposal program.
The City’s internal service funds account for the City’s health insurance, wellness program, fleet management, and central services programs.
1-C. Measurement Focus
Government-wide Financial Statements - The government-wide financial statements are prepared using the economic resources measurement focus. All assets and all liabilities associated with the operation of the City are included on the statement of net position. The statement of activities reports revenues and expenses.
Fund Financial Statements - All governmental funds are accounted for using a flow of current financial resources measurement focus. With this measurement focus, only current assets and current liabilities generally are included on the balance sheet. The statement of revenues, expenditures and changes in fund balances reports the sources (i.e., revenues and other financing sources) and uses (i.e., expenditures and other financing uses) of current financial resources. This approach differs from the manner in which the governmental activities of the government-wide financial statements are prepared. Governmental fund financial statements therefore include reconciliation with brief explanations to better identify the relationship between the government-wide statements and the governmental fund statements.
Like the government-wide statements, all proprietary fund types are accounted for on a flow of economic resources measurement focus on both financial reporting levels. All assets and all liabilities associated with the operation of these funds are included on the statements of net position. The statements of changes in fund net position present increases (i.e., revenues) and decreases (i.e., expenses) in net total position. The statement of cash flows provides information about how the City finances and meets the cash flow needs of its proprietary activities.
1-D. Basis of Accounting
Basis of accounting determines when transactions are recorded in the financial records and reported on the financial statements. Government-wide financial statements are prepared using the accrual basis of accounting. At the fund reporting level, the governmental funds use the modified accrual basis of accounting. Proprietary funds use the accrual basis of accounting at both reporting levels. Differences in the accrual and the modified accrual basis of accounting arise in the recognition of revenue, the recording of unearned revenue, and in the presentation of expenses versus expenditures.
Revenues – Exchange Transactions - Revenue resulting from exchange transactions, in which each party gives and receives essentially equal value is recorded on the accrual basis when the exchange takes place. On the modified accrual basis, revenue is recorded when the exchange takes place and in the fiscal year in which the resources are measurable and become available. Available means that the resources will be collected within the current fiscal year or are expected to be collected soon enough thereafter to be used to pay liabilities of the current fiscal year. For the City, the phrase “available for exchange transactions” means expected to be received within 60 days of year-end.
29

City of Statesboro, Georgia Notes to the Basic Financial Statements
For the Year Ended June 30, 2021
Note 1 Summary of Significant Accounting Policies (Continued)
Revenues - Non-exchange Transactions - Non-exchange transactions in which the City receives value without directly giving equal value in return, include sales taxes, property taxes, grants and donations. On an accrual basis, revenue from sales taxes is recognized in the period in which the taxable sale takes place. Revenue from property taxes is recognized in the fiscal year for which the taxes are levied. Revenue from grants and donations is recognized in the fiscal year in which all eligibility requirements have been satisfied. Eligibility requirements include timing requirements, which specify the year when the resources are required to be used or the year when use is first permitted, matching requirements, in which the City must provide local resources to be used for a specified purpose, and expenditure requirements, in which the resources are provided to the City on a reimbursement basis. On a modified accrual basis, revenue from non-exchange transactions also must be available (i.e., collected within 60 days) before it can be recognized.
Under the modified accrual basis, the following revenue sources are considered to be susceptible to accrual: property taxes, sales taxes, interest and federal and state grants.
Expenses/Expenditures - On the accrual basis of accounting, expenses are recognized at the time they are incurred. On the modified accrual basis, expenditures generally are recognized in the accounting period in which the related fund liability is incurred and due, if measurable.
1-E. Assets, Liabilities, Deferred Outflows/Inflows of Resources and Fund Equity
1-E-1 Cash, Cash Equivalents, and Investments
Cash and cash equivalents include amounts in demand deposits as well as short-term investments with a maturity date within three months of the date acquired by the City.
Investments are stated at fair value based on quoted market prices.
Georgia law authorizes the City to invest in the following type of obligations:
Obligations of the State of Georgia or of any other states Obligations of the United States Government Obligations fully insured or guaranteed by the United States Government or United States Government agency Obligations of any corporation of the United States Government Prime bankers' acceptances The State of Georgia local government investment pool (i.e., Georgia Fund I) Repurchase agreements Obligations of the other political subdivisions of the State of Georgia
1-E-2 Receivables
All trade and property tax receivables are reported net of an allowance for uncollectable, where applicable. Unbilled water, sewer, stormwater, gas, and solid waste charges are accrued as receivables and revenue at June 30, 2021.
1-E-3 Interfund Balances
On the fund financial statements, receivables and payables resulting from short-term interfund loans are classified as "interfund receivables/interfund payables." These amounts are eliminated in the governmental and business-type activities columns on the statement of net position, except for any net residual amounts due between governmental and business-type activities, which are reclassified and presented as internal balances on this statement. These amounts are ultimately eliminated from the total column on the statement of net position.
1-E-4 Consumable Inventories
On the government-wide and the proprietary fund financial statements, inventories are presented at the lower of cost or market on a first-in, first-out basis and are expensed when used (i.e., the consumption method).
30

City of Statesboro, Georgia Notes to the Basic Financial Statements
For the Year Ended June 30, 2021
Note 1 Summary of Significant Accounting Policies (Continued)
1-E-5 Prepaid Items
Payments made to vendors for services that will benefit periods beyond June 30, 2021, are recorded as prepaid items using the consumption method by recording an asset for the prepaid amount and reflecting the expenditure/expense in the year in which services are consumed. At the fund reporting level, an equal amount of fund balance is reported as nonspendable, as this amount is not available for general appropriation.
1-E-6 Restricted Assets
Restricted assets represent customer utility deposits, funds held specifically for water and sewer system improvements, and funds designated for capital purchases.
1-E-7 Capital Assets
General capital assets are those assets not specifically related to activities reported in the proprietary funds. These assets generally result from expenditures in governmental funds. The City reports these assets in the governmental activities column of the government-wide statement of net position but does not report these assets in the City fund financial statements.
Capital assets utilized by proprietary funds are reported both in the business-type activities column of the government-wide statement of net position and in the proprietary funds’ statement of net position.
All capital assets are capitalized at cost (or estimated historical cost) and updated for additions and retirements during the year. Donated capital assets are recorded at their fair market values as of the date received. The City maintains a capitalization threshold of fifteen thousand dollars. The City’s infrastructure consists of roads, bridges, water and sewer lines and gas lines. The City has capitalized all general infrastructure assets (roads and bridges) acquired after June 30, 1980. Water and sewer lines and gas lines are classified as “improvements other than buildings”. Improvements to capital assets are capitalized. The costs of normal maintenance and repairs that do not add to the value of the asset or materially extend an asset’s life are expensed.
All reported capital assets are depreciated except for land, right-of-ways and construction in progress. Improvements are depreciated over the remaining useful lives of the related capital assets. Useful lives for infrastructure were estimated based on the City’s historical records of necessary improvements and replacement. Depreciation is computed using the straight-line method over the following useful lives:
Description
Governmental Activities
Estimated Lives
Business-Type Activities
Estimated Lives
Buildings 15 – 40 years 15 - 40 years
Improvements other than buildings 8 – 40 years 15 – 50 years
Machinery and equipment 5 – 20 years 5 – 15 years
Infrastructure 12 – 25 years ---
At the inception of capital leases at the governmental fund reporting level, expenditures and an “other financing source” of an equal amount are reported at the net present value of future minimum lease payments.
1-E-8 Deferred Outflows/Inflows of Resources
In addition to assets, the statement of financial position will sometimes report a separate section for deferred outflows of resources. This separate financial statement element, deferred outflows of resources, represents a consumption of net position that applies to a future period(s) and so will not be recognized as an outflow of resources (expenses/expenditure) until then. The City has deferred outflows of resources related to pensions and other post employment benefits reported at the government-wide level for governmental and business-type activities and at the fund level for proprietary funds.
31
City of Statesboro, Georgia Notes to the Basic Financial Statements
For the Year Ended June 30, 2021
Note 1 - Summary of Significant Accounting Policies (Continued)
In addition to liabilities, the statement of financial position will sometimes report a separate section for deferred inflows of resources. This separate financial statement element, deferred inflows of resources, represents an acquisition of net position that applies to a future period(s) and so will not be recognized as an inflow of resources (revenue) until that time. The City has an item which arises only under a modified accrual basis of accounting that qualifies for reporting in this category. Accordingly, the item, unavailable revenue, is reported only in the governmental funds balance sheet. The governmental funds report unavailable revenue from property taxes. This amount is deferred and recognized as an inflow of resources in the period that the amount becomes available. The City also has deferred inflows of resources related to its pension plan and other post employment benefits reported at the government-wide level for governmental and business-type activities and at the fund level for proprietary funds.
1-E-9 Compensated Absences
Vacation benefits are accrued as a liability as the benefits are earned if the employees' rights to receive compensation are attributable to services already rendered and it is probable that the employer will compensate the employees for the benefits through paid time off or some other means.
All compensated absence liabilities include salary-related payments, where applicable.
The total compensated absence liability is reported on the government-wide financial statements. Proprietary funds report the total compensated liability in each individual fund at the fund reporting level. Governmental funds report the compensated absence liability at the fund reporting level only “when due.”
1-E-10 Accrued Liabilities and Long-term Obligations
All payables, accrued liabilities and long-term obligations are reported in the government-wide financial statements.
In general, governmental fund payables and accrued liabilities that, once incurred, are paid in a timely manner and in full from current financial resources, are reported as obligations of those funds. However, compensated absences that will be paid from governmental funds are reported as a liability in the fund financial statements only to the extent that they are “due for payment” during the current year. Capital leases are recognized as a liability in the governmental fund financial statements when due.
1-E-11 Bond Premiums, Discounts and Issuance Costs
On the government-wide statement of net position and the proprietary fund type statement of net position, bond premiums and discounts are netted against bonds payable and bond issuance costs are expensed when incurred. On the government-wide and proprietary fund type statement of activities, bond premiums and discounts are amortized over the life of the bonds using the effective interest method.
At the governmental fund reporting level, bond premiums and discounts are reported as other financing sources and uses, separately from the face amount of the bonds issued. Bond issuance costs are reported as an expenditure.
1-E-12 Fund Equity
Fund equity at the governmental fund financial reporting level is classified as “fund balance”. Fund equity for all other reporting is classified as “net position”.
Fund Balance – Generally, fund balance represents the difference between the current assets and current liabilities. In the fund financial statements, governmental funds report fund classifications that comprise a hierarchy based primarily on the extent to which the City is bound to honor constraints on the specific purposes for which amounts in those funds can be spent. Fund balances are classified as follows:
Nonspendable – Fund balances are reported as nonspendable when amounts cannot be spent because they are either (a) not in spendable form (i.e. items that are not expected to be converted to cash) or (b) legally or contractually required to be maintained intact.
32

City of Statesboro, Georgia Notes to the Basic Financial Statements
For the Year Ended June 30, 2021
Note 1 - Summary of Significant Accounting Policies (Continued)
Restricted – Fund balances are reported as restricted when there are limitations imposed on their use either through the enabling legislation adopted by the City or through external restrictions imposed by creditors, grantors or laws or regulations of other governments.
Committed– Fund balances are reported as committed when they can be used only for specific purposes pursuant to constraints imposed by formal action of the City Council through the adoption of a resolution. Only the City Council also may modify or rescind the commitment.
Assigned– Fund balances are reported as assigned when amounts are constrained by the City Council’s intent to be used for specific purposes, but are neither restricted nor committed. Through resolution, the City Council has authorized the City’s finance director to assign balances.
Unassigned– Fund balances are reported as unassigned as the residual amount when the balances do not meet any of the above criterion. The City reports positive unassigned fund balance only in the general fund. Negative unassigned fund balances may be reported in all funds.
Flow Assumptions – When both restricted and unrestricted amounts of fund balance are available for use for expenditures incurred, it is the City’s policy to use restricted amounts first and then unrestricted amounts as they are needed. For unrestricted amounts of fund balance, it is the City’s policy to use fund balance in the following order:
Committed Assigned Unassigned
Net Position - Net position represents the difference between assets and liabilities. Net investment in capital assets, consists of capital assets, net of accumulated depreciation, reduced by the outstanding balances of any borrowing used for the acquisition, construction or improvement of those assets. Net position is reported as restricted when there are limitations imposed on its use either through the enabling legislation adopted by the City or through external restrictions imposed by creditors, grantors or laws or regulations of other governments. All other net position is reported as unrestricted.
The City applies restricted resources first when an expense is incurred for purposes for which both restricted and unrestricted net position are available.
1-E-13 Operating Revenues and Expenses
Operating revenues are those revenues that are generated directly from the primary activity of the proprietary funds. For the City, these revenues are charges for services for water, sewer, gas, solid waste, stormwater, and the insurance benefits, information technology, and fleet management programs. Operating expenses are necessary costs incurred to provide the good or service that are the primary activity of each fund and include administrative expenses and depreciation on capital assets. All revenues and expenses not meeting this definition are reported as nonoperating revenues and expenses.
1-E-14 Contributions of Capital
Contributions of capital in proprietary fund financial statements arise from outside contributions of capital assets, tap-in fees to the extent they exceed the cost of the connection to the system, or from grants or outside contributions of resources restricted to capital acquisition and construction.
1-E-15 Interfund Activity
Exchange transactions between funds are reported as revenues in the seller funds and as expenditures/expenses in the purchaser funds. Flows of cash or goods from one fund to another without a requirement for repayment are reported as interfund transfers. Interfund transfers are reported as other financing sources/uses in governmental funds and after the non-operating revenues/expenses section in proprietary funds. Repayments from funds responsible for particular expenditures/expenses to the funds that initially paid for them are not presented on the financial statements (i.e., they are netted).
Transfers between governmental and business-type activities on the government-wide statement of activities are reported as general revenues. Transfers between funds reported in the governmental activities column are eliminated. Transfers between
33

City of Statesboro, Georgia Notes to the Basic Financial Statements
For the Year Ended June 30, 2021
Note 1 - Summary of Significant Accounting Policies (Continued)
funds reported in the business type activities column are eliminated. Transfers between governmental and business-type activities are eliminated from the total column.
1-E-16 Estimates
The preparation of the financial statements in conformity with accounting principles generally accepted in the United States requires management to make estimates and assumptions that affect the amounts reported in the financial statements and accompanying notes. Actual results may differ from those estimates.
1-E-17 Comparative Data
Comparative total data for the prior year have been presented only for individual funds in the fund financial statements in order to provide an understanding of the changes in the financial position and operations of these funds. Also, certain amounts presented in the prior year data have been reclassified to be consistent with the current year’s presentation.
Note 2 – Stewardship, Compliance and Accountability
2-A. Budgetary Information – The City adopts an annual operating budget for the general fund and each special revenue fund. A project budget is adopted for each capital projects fund. The budget resolution reflects the total of each department’s appropriation in each fund.
All budgets are adopted on a basis consistent with GAAP.
The legal level of control (the level at which expenditures may not legally exceed appropriations) for each adopted annual operating budget generally is the department level within each individual fund. The City Manager may approve budget transfers within departments. Any change in total to a fund or departmental appropriation within a fund requires City Council approval.
During the year, the City Council approved budget revisions.
All unexpended annual appropriations lapse at year-end.
2-B. Excess of Expenditures over Appropriations
For the year ended June 30, 2021, expenditures exceeded appropriations for the following departments within the general fund:
Government Buildings $15,698 Animal Control 9,575
These over expenditures were funded primarily by under expenditures in other departments.
Expenditures exceed appropriations by $66,201 for the Hotel/Motel Tax special revenue fund which was funded by excess revenue over amounts budgeted.
34

City of Statesboro, Georgia Notes to the Basic Financial Statements
For the Year Ended June 30, 2021
Note 3 - Detailed Notes on All Funds
3-A. Deposits
At June 30, 2021, the carrying amount of the City’s deposits (i.e., checking and certificates of deposits) was $58,846,503 and the bank balance was $58,752,632. Of the bank balance, $500,000 was covered by federal depository insurance and $58,252,672 was collateralized with securities held by the pledging financial institution’s trust department or agent in the City’s name.
Deposits Reconciliation:
3-B. Receivables
Receivables at June 30, 2021, consisted of taxes, interest, and accounts (billings for user charges, including, unbilled utility receivables).
Receivables and payables are recorded on the City’s financial statements to the extent that the amounts are determined to be material and substantiated not only by supporting documentation, but also by a reasonable, systematic method of determining their existence, completeness, valuation, and in the case of receivables, collectability. The allowances for uncollectables netted against receivables at June 30, 2021 follow:
3-C. Property Taxes
Property taxes attach an enforceable lien on property as of January 1. Taxes are levied in September each year and are due and payable within 60 days of the tax bill mailing date. The City bills and collects its own property taxes. Property tax revenues at the fund reporting level are recognized when levied to the extent that they result in current receivables (i.e. collectible in 60 days). For the year ended June 30, 2021, property taxes were levied on September 15, 2020 and were due December 20, 2020.
Deposits
Fund Reporting Level:
Governmental Funds - Balance Sheet 37,844,462$
Enterprise Fund Statement of Net Position 17,530,038
Enterprise Fund Statement of Net Position - Restricted 2,637,546
Internal Service Fund Statement of Net Position 834,457
Total 58,846,503$
Allowance
For
Fund Uncollectibles
Water and Sewer 400,000$
Storm Water 18,000
Gas 135,000
Solid Waste Collection 125,000
Solid Waste Disposal 24,000
35

City of Statesboro, Georgia Notes to the Basic Financial Statements
For the Year Ended June 30, 2021
Note 3 - Detailed Notes on All Funds (Continued)
3-D. Capital Assets
Capital asset activity (including the fleet management and central services internal service funds) for the year ended June 30, 2021, was as follows:
Balance Balance
7/1/2020 Additions Deductions 6/30/2021
Governmental activities:
Capital assets not being depreciated:
Land 1,643,316$ -$ -$ 1,643,316$
Construction in progress 4,186,614 2,915,193 4,173,479 2,928,328
Total capital assets not being depreciated: 5,829,930 2,915,193 4,173,479 4,571,644
Capital assets being depreciated
Buildings 17,077,290 - - 17,077,290
Improvements other than buildings 1,563,270 - - 1,563,270
Machinery and equipment 14,380,092 1,605,033 327,830 15,657,295
Infrastructure 23,353,649 8,298,889 - 31,652,538
Total capital assets being depreciated 56,374,301 9,903,922 327,830 65,950,393
Total capital assets 62,204,231 12,819,115 4,501,309 70,522,037
Accumulated depreciation:
Buildings 6,407,615 406,534 - 6,814,149
Improvements other than buildings 579,346 74,023 - 653,369
Machinery and equipment 11,034,838 1,258,774 318,414 11,975,198
Infrastructure 13,218,292 1,187,257 - 14,405,549
Total accumulated depreciation 31,240,091 2,926,588 318,414 33,848,265
Governmental activities capital assets, net 30,964,140$ 9,892,527$ 4,182,895$ 36,673,772$
Governmental activities depreciation expense:
General government 55,335$
Municipal court 20,712
Public safety 997,287
Public works 1,264,332
Parks and cemeteries 79,262
Engineering 28,404
Community development 19,929
Community services 97,780
Central services internal service fund 93,961
Fleet management internal service fund 51,729
Total depreciation expense 2,708,731$
36

City of Statesboro, Georgia Notes to the Basic Financial Statements
For the Year Ended June 30, 2021
Note 3 - Detailed Notes on All Funds (Continued)
The following table presents the changes in capital assets for the City’s enterprise funds:
The following table presents the changes in capital assets for the City’s component unit:
Balance Balance
7/1/2020 Additions Deductions 6/30/2021
Business-type activities:
Capital assets not being depreciated:
Land 574,113$ -$ -$ 574,113$
Construction in progress 2,536,787 1,214,052 1,822,750 1,928,089- -
Total capital assets not being depreciated 3,110,900 1,214,052 1,822,750 2,502,202
Capital assets being depreciated
Buildings 3,599,651 - - 3,599,651
Improvements other than buildings 91,848,443 2,005,455 - 93,853,898
Machinery and equipment 18,062,789 868,561 708,133 18,223,217-
Total capital assets being depreciated 113,510,883 2,874,016 708,133 115,676,766
Total capital assets 116,621,783 4,088,068 2,530,883 118,178,968
Accumulated depreciation:
Buildings 1,925,036 98,011 - 2,023,047
Improvements other than buildings 39,764,949 2,082,090 - 41,847,039
Machinery and equipment 12,916,196 1,043,314 708,133 13,251,377
Total accumulated depreciation 54,606,181 3,223,415 708,133 57,121,463
Business-type activities capital assets, net 62,015,602$ 864,653$ 1,822,750$ 61,057,505$
Balance Balance
7/1/2020 Additions Deductions 6/30/2021
Component Unit - Downtown Statesboro
Development Authority:
Capital assets not being depreciated:
Property held for sale 354,041$ -$ 45,843$ 308,198$
Total capital assets not being depreciated 354,041 - 45,843 308,198
Capital assets being depreciated:
Buildings 415,748 - - 415,748
Machinery and equipment 35,343 - - 35,343
Total capital assets being depreciated 451,091 - - 451,091
Total Capital Assets 805,132 - 45,843 759,289
Accumulated depreciation:
Buildings 9,528 10,394 - 19,922
Machinery and equipment 15,193 4,751 - 19,944
Total accumulated depreciation 24,721 15,145 - 39,866
Component unit capital assets, net 780,411$ (15,145)$ 45,843$ 719,423$
37

City of Statesboro, Georgia Notes to the Basic Financial Statements
For the Year Ended June 30, 2021
Note 3 - Detailed Notes on All Funds (Continued)
3-E. - Interfund Balances and Transfers
Interfund balances at June 30, 2021, consisted of the following amounts and represent charges for services or reimbursable expenses. These remaining balances resulted from the time lag between the dates that (1) interfund goods or services are provided or reimbursable expenditures occur, (2) transactions are recorded in the accounting period, and (3) payments between funds are made. The City expects to repay all interfund balances within one year.
Interfund transfers for the year ended June 30, 2021, consisted of the following:
Transfers are used to report revenues from the fund that statute or budget requires to collect them to the fund that statute or budget requires to expend them, to segregate money for anticipated capital projects (e.g., SPLOST approved projects); to report enterprise fund transfers for the equivalent of franchise fees and property taxes as if the utility funds were privately owned; and to return money to the fund from which it was originally provided once a project is completed.
Receivable Fund Payable Fund Amount
Old Register Tax Allocation District General Fund 18,175$
Solid Waste Disposal 2019 SPLOST Fund 217,257
Central Services General Fund 78,655
2013 SPLOST General Fund 101,219
415,306$
Transfer to: General Fund Fire Fund
Hotel Motel
Tax Fund
2013 SPLOST
Fund
2019 SPLOST
Fund
2019 CDBG
Fund
Water and
Sewer
Operating
Fund
General Fund -$ -$ 39,284$ -$ -$ -$ 810,351$
Statesboro Fire Service Fund 1,444,000 - - - - - 825,000
Capital Improvements Fund 138,271 - - - - - -
Water and Sewer Operating Fund - - - - 47,404 - -
Stormwater Operating Fund - - - 108,277 - 37,243 -
Natural Gas Fund - - - 148,403 - - -
Solid Waste Collection Fund 310,699 -
Solid Waste Disposal Fund - - - 1,215,620 311,185 - -
Health Insurance Fund 101,745 28,845 - - - - 36,185
Central Services Fund 71,000 56,000 - - - - 56,000
1,755,016$ 84,845$ 39,284$ 1,782,999$ 358,589$ 37,243$ 1,727,536$
Transfer to:
Stormwater
Fund
Gas
Operating
Fund
Solid Waste
Collection
Fund
Solid Waste
Disposal Fund
Fleet
Management
Fund
Central
Services Fund Total
General Fund 25,000$ 870,000$ 750,000$ 374,000$ -$ -$ 2,868,635$
Statesboro Fire Service Fund - - - - - - 2,269,000
Capital Improvements Fund - - - - - - 138,271
Water and Sewer Operating Fund - - - - - - 47,404
Stormwater Operating Fund - - - - - - 145,520
Natural Gas Fund - - - - - - 148,403
Solid Waste Collection Fund - - - - - - 310,699
Solid Waste Disposal Fund - - - - - - 1,526,805
Health Insurance Fund 5,630 5,630 9,505 5,170 3,875 3,415 200,000
Central Services Fund 56,000 56,000 56,000 56,000 56,000 - 463,000
86,630$ 931,630$ 815,505$ 435,170$ 59,875$ 3,415$ 8,117,737$
Transfers From:
Transfers From:
38

City of Statesboro, Georgia Notes to the Basic Financial Statements
For the Year Ended June 30, 2021
Note 3 - Detailed Notes on All Funds (Continued)
All City transfers either occur on a regular basis or are consistent with the purpose of the fund making the transfer.
3-F. Landfill Closure and Postclosure Care
State and federal laws and regulations required the City to place a final cover on its landfill site when it stopped accepting waste and to perform certain maintenance and monitoring functions at the site for thirty years after closure. Effective July 1, 1997, the City stopped accepting waste into its landfill. The remaining accrued landfill postclosure care costs liability at June 30, 2021 was $1,790,000. This amount is based on what it would cost to perform all postclosure care in 2021. Actual costs may be higher due to inflation, unexpected mitigation requirements, changes in technology, or changes in regulations.
3-G. Long-Term Debt
Water and Sewer Refunding Revenue Bonds - During the fiscal year ended June 30, 2020, the City issued revenue bonds of $11,631,000. The City issued the Series 2020 Water and Sewer Refunding Revenue Bonds to advance refund Water and Sewer Revenue Refunding Bonds, Series 2010, with an outstanding balance of $9,401,000, and four Georgia Environmental Facilities Authority (GEFA) notes with an outstanding balance of $2,194,637. The amount of outstanding bonds at June 30, 2021 was $10,132,000.
The City pledges income derived from the constructed or acquired assets to pay debt service. The revenue bonds have interest rates of 2.14 percent. The bonds require principal payments each April 1 and interest is payable semiannually on April 1 and October 1 each year.
Tax Allocation District Revenue Bonds - During the fiscal year ended June 30, 2020, the City issued the $4,750,000 Series 2019 Tax Allocation District Revenue Bond to (i) provide for the cost of constructing certain public infrastructure improvements within Tax Allocation District #2, Old Register; (ii) capitalize interest during construction; and, (iii) pay for the costs of issuance associated with the 2019 Bond. The amount of outstanding bonds at June 30, 2021 was $4,750,000.
The City pledges income derived from the increase in property taxes in the Tax Allocation District #2, Old Register to pay debt service. The revenue bond has an interest rate of 2.19 percent. The bond requires interest payments on February 15 and August 15 each year with the principal and final interest payment due on August 15, 2023.
2019 SPLOST Bonds – During the fiscal year ended June 30, 2021 the City’s Urban Redevelopment Agency issued $4,500,000 Series 2021 SPLOST Bonds to provide funds for the City to renovate, construct and equip certain improvements to Grady Street Park and Luetta Moore Park, and to pay certain costs of issuing the bond. The amount outstanding at June 30, 2021 was $4,500,000.
The City, in partnership with Bulloch County, pledges income derived from the 2019 SPLOST to pay the debt service. The revenue bond has an interest rate of 1.47 percent. The bond requires principal payments each October 1 and interest is payable semiannually on April 1 and October 1 each year.
Annual debt service requirements to amortize all obligations outstanding, as of June 30, 2021 follow:
Year Principal Interest Total Year Principal Interest Total
2022 350,000 171,279 521,279 2022 878,000 216,825 1,094,825
2023 360,000 162,385 522,385 2023 899,000 198,036 1,097,036
2024 5,115,000 157,056 5,272,056 2024 922,000 178,798 1,100,798
2025 370,000 47,628 417,628 2025 937,000 159,066 1,096,066
2026 375,000 42,152 417,152 2026 951,000 139,014 1,090,014
2027-2031 2,680,000 99,593 2,779,593 2027-2031 4,290,000 396,242 4,686,242
Total 9,250,000$ 680,093$ 9,930,093$ 2032-2033 1,255,000 37,021 1,292,021
Total 10,132,000$ 1,325,002$ 11,457,002$
Business Type ActivitiesGovernmental Activities
39
City of Statesboro, Georgia Notes to the Basic Financial Statements
For the Year Ended June 30, 2021
Note 3 - Detailed Notes on All Funds (Continued)
Notes Payable – The City has a notes payable to One Georgia Authority, payable in quarterly installments of $8,334 including interest at 3% through April 1, 2022. The note balance at June 30, 2021 was $32,720.
During the year ended June 30, 2020, the City obtained a loan for $15,559,000 from the Georgia Environmental Finance Authority for stormwater improvements. Only $6,354 has been drawn on the loan as of June 30, 2021. The loan requires monthly principal and interest payments beginning May 1, 2022 based on an interest rate of 2.25%. The loan has a maturity date of May 1, 2052.
Annual debt service requirements to amortize all notes payable outstanding as of June 30, 2021 follow:
Capital Leases – The City currently has the following outstanding capital leases.
Capital Lease – City Hall - In 1995 the Downtown Statesboro Development Authority provided for the issuance of a Revenue Bond in the amount of $1,500,000 to provide for the acquisition, renovation, and equipping of the old Jaeckel Hotel for the purpose of converting it to the new Statesboro City Hall.
The Bond bears an interest rate of 70% of the prime rate but can never be less than 4.2% or more than 10.5%. Interest on the Bond is paid to Synovus Bank by the City of Statesboro semi-annually on the first day of June and the first day of December beginning June 1, 1997. Principal payments are made in annual installments on December 1, each year beginning in 1997 and ending in 2022.
Upon payment in full of the debt the Downtown Statesboro Development Authority will convey the property to the City without further consideration.
The total cost for the project under the capital lease was $1,733,719. Depreciation expense on the building for the year was $43,343 and accumulated depreciation was $1,235,275 at June 30, 2021.
The lease requires annual payments as follows:
Capital Lease – Georgia Municipal Association (GMA) –The City has entered into lease agreements with GMA to purchase various equipment costing $909,011. Depreciation expense on the equipment for the year was $139,234 and accumulated depreciation was $473,465 at June 30, 2021.
Year Principal Interest Total
2022 32,720$ 617$ 33,337$
2023 6,354 143 6,497
Total 39,074$ 617$ 39,691$
Business Type Activities
Year Principal Interest Total
2022 110,000$ 2,310$ 112,310$
Governmental Activities
40

City of Statesboro, Georgia Notes to the Basic Financial Statements
For the Year Ended June 30, 2021
Note 3 - Detailed Notes on All Funds (Continued)
The leases require annual payments without interest as follows:
Changes in Long-term Debt - Changes in the City’s long-term obligations consisted of the following for the year ended June 30, 2021:
The capital lease obligations for governmental funds will be paid from the General Fund and SPLOST Funds and for proprietary funds from the fund which incurred the capital lease obligation. The compensated absences and other post-employment benefits liability for governmental funds will be paid from the General Fund and for business-type activities from the fund from which the employees' salaries are paid. Principal and interest payments related to revenue bonds for governmental funds will be paid from SPLOST funds and the Old Register Tax Allocation District fund. Principal and interest payments related to revenue bonds for the City’s Water and Sewer System are financed from income derived from the operation of the Water and Sewer System. Principal and interest payments related to notes payable for the City’s gas system are financed from income derived from this system. The landfill post-closure care liability will be retired from the solid waste disposal fund.
3-H. Pensions
Plan Description - The City’s defined benefit pension plan, the City of Statesboro Retirement Plan (the “Plan”), provides retirement and disability benefits and death benefits to plan members and beneficiaries. The Plan is affiliated with the Georgia Municipal Employees Benefit System (the GMEBS), an agent multiple-employer public employee retirement system that acts as a common investment and administrative agent for cities in the State of Georgia.
Governmental
Activities
Business Type
Activities
Year Principal Principal Total
2022 119,926$ 210,069$ 329,995$
2023 37,295 109,770 147,065
2024 15,104 42,750 57,854
2025 15,104 42,750 57,854
2026 15,104 42,750 57,854
Total 202,533$ 448,089$ 650,622$
Primary Government Outstanding Outstanding Amounts DueGovernmental Activities 7/1/2020 Additions Reductions 6/30/2021 in One Year
Capital lease - City Hall 214,000$ -$ 104,000$ 110,000$ 110,000$
Revenue bonds payable 4,750,000 4,500,000 - 9,250,000 350,000
Capital lease - GMA 231,835 75,520 104,822 202,533 119,926
Other post employment benefits 4,902,664 14,558 - 4,917,222 -
Compensated absences 691,221 44,650 11,314 724,557 144,911
Total Governmental Activities 10,789,720$ 4,634,728$ 220,136$ 15,204,312$ 724,837$
Business-Type Activities
Water and sewer revenue bonds 10,990,000$ -$ 858,000$ 10,132,000$ 878,000$
Notes payable - gas fund 64,477 - 31,757 32,720 32,720
Notes payable - stormwater fund 6,354 - - 6,354 -
Capital lease - GMA 401,657 213,751 167,319 448,089 210,069
Landfill closure and
post-closure care 1,493,485 435,346 138,831 1,790,000 179,683
Other post employment benefits 1,954,294 4,876 - 1,959,170 -
Compensated absences 280,899 - 32,934 247,965 49,593
Total Business-Type Activities 4,201,166$ 653,973$ 370,841$ 14,616,298$ 472,065$
41

City of Statesboro, Georgia Notes to the Basic Financial Statements
For the Year Ended June 30, 2021
Note 3 - Detailed Notes on All Funds (Continued)
The City is assigned the authority to establish and amend benefit provisions of the Plan. The GMEBS issues a publicly available financial report that includes financial statements and required supplementary information. The report can be obtained by writing to Georgia Municipal Association, Risk Management and Employee Benefit Services, 201 Pryor Street, SW, Atlanta, Georgia 30303 or by calling (404) 688-0472.
Benefits provided - The classes of eligible employees for retirement benefits are regular employees with the exception of part-time firefighters employed or reemployed on or after June 20, 2012, elected or appointed members of the governing authority, and the City Attorney employed on December 13, 2001 meeting the eligibility requirements of the Plan that are applicable to eligible regular employees. Normal retirement qualifications for regular employees are attainment of age 65 and the completion of 5 years of total credited service. Alternate normal retirement qualifications is 30 years of total creditable service regardless of participant’s age. Normal retirement qualifications for Public Safety employees only are attainment of age 55 and completion of 25 years of total credited service. The regular employee formula is 1/12 of Final Average Earnings multiplied by years of Total Credited Service as an Eligible Regular Employee. Unless otherwise specified in an addendum to the adoption agreement, Final Average Earnings is defined as the monthly average of Earnings paid to a participant by the City for the 60 consecutive months of Credited Service preceding the participant’s most recent termination in which the participant’s earnings were the highest, multiplied by 12. The formula for elected or appointed members of the governing authority is $35 per month for each year of total credited service as an elected or appointed member of the governing authority or municipal legal officer or major fraction thereof (6 months and 1 day). The City elects to provide for a variable annual cost-of-living adjustment not to exceed 5%. Disability retirement benefits shall be computed in the same manner as the Normal Retirement benefit, based upon the participant’s accrued benefit as of his disability retirement date. In-service death benefits are payable to the participant’s pre-retirement beneficiary, actuarially equivalent to the reserve required for the participant’s anticipated normal retirement benefit, provided the participant meets eligibility conditions. Terminated vested death benefits are payable to the participant’s pre-retirement beneficiary, equal to the decreased monthly retirement benefit that would have otherwise been payable to the participant had he elected a 100% joint and survivor benefit, under the plan.
Employees covered by benefit terms – At June 30, 2021, the following employees were covered by the benefit terms:
Contributions - The Plan is subject to minimum funding standards of the Public Retirement Systems Standards Law (Georgia Code Section 47-20-10). The estimated minimum annual contribution under these standards is $1,451,365. This minimum contribution has been determined as the sum of 1) the normal cost (including administrative expenses), 2) the 30-year level percentage of payroll amortization of the unfunded actuarial accrued liability or the 10-year level percentage of payroll amortization of the surplus, and 3) interest on these amounts from the valuation date to the date contributions are paid (assumed monthly). The GMEBS Board of Trustees has adopted an actuarial funding policy that requires a different funding level than the estimated minimum annual contribution to minimize fluctuations in annual contribution amounts and to accumulate sufficient funds to secure benefits under the Plan. If the employer contributes the recommended contribution developed under the actuarial funding policy each year, the Plan will meet applicable state funding standards.
Net Pension Liability
The City’s net pension liability was measured as of September 30, 2020, and the total pension liability used to calculate the net pension liability was determined by an actuarial valuation as of January 1, 2021.
Actuarial assumptions - The total pension liability (asset) in the January 1, 2021 actuarial valuation was determined using the following actuarial assumptions, applied to all periods included in the measurement:
Pension Benefits
Inactive employees or beneficiaries currently receiving benefits 126
Inactive employees entitled to but not receiving benefits 147
Active employees 290
563
Inflation 2.25 percent
Salary increases 2.25 percent, average, including inflation
Investment rate of return 7.375 percent, net of pension plan investment expense, including inflation
42
City of Statesboro, Georgia Notes to the Basic Financial Statements
For the Year Ended June 30, 2021
Note 3 - Detailed Notes on All Funds (Continued)
Mortality rates were based on the sex-distinct Pri-2012 head-count weighted Healthy Retiree Mortality Table with rates multiplied by 1.25.
The actuarial assumptions used in the January 1, 2021 valuation were based on the results of an actuarial experience study for the period January 1, 2015 to June 30, 2019.
The long-term expected rate of return on pension plan investments was determined using a building-block method in which best-estimate ranges of expected future real rates of return (expected returns, net of pension plan investment expense and inflation) are developed for each major asset class. These ranges are combined to produce the long-term expected rate of return by weighting the expected future real rates of return by the target asset allocation percentage and by adding expected inflation. The target allocation and best estimates of arithmetic real rates return for each major asset class are summarized in the following table:
Discount rate - The discount rate used to measure the total pension liability was 7.375 percent. The projection of cash flows used to determine the discount rate assumed that City contributions will be made at rates equal to the actuarially determined contribution rates. Based on those assumptions, the pension plan’s fiduciary net position was projected to be available to make all projected future benefit payments of current active and inactive employees. Therefore, the long-term expected rate of return on pension plan investments was applied to all periods of projected benefit payments to determine the total pension liability.
Changes in the Net Pension Liability
Sensitivity of the net pension liability to changes in the discount rate - The following presents the net pension liability of the City, calculated using the discount rate of 7.375 percent, as well as what the City’s net pension liability would be if it were calculated using a discount rate that is one percentage-point lower (6.375 percent) or one percentage-point higher (8.375 percent) than the current rate.
Asset Class Target Allocation
Domestic equity 45% 6.40%
International equity 20% 7.05%
Domestic Fixed income 20% 1.15%
Global Fixed Income 5% 1.25%
Real estate 10% 4.50%
Cash - -
Total 100%
Long-Term Expected
Real Rate of Return
Total Pension Fiduciary Net Net Pension
Liability Position Liability
(a) (b) (a) - (b)
35,744,106$ 28,443,663$ 7,300,443$
Service cost 709,853 - 709,853
Interest 2,644,529 - 2,644,529
Differences between expected and actual experience 1,519,209 - 1,519,209
Contributions - employer - 372,330 (372,330)
Contributions - employee - 14,542 (14,542)
Net investment income - 2,680,637 (2,680,637)
Benefit payments (1,191,864) (1,191,864) -
Administrative expense - (60,916) 60,916
Other changes - - -
Net changes 3,681,727 1,814,729 1,866,998
Balances at September 30, 2020 39,425,833$ 30,258,392$ 9,167,441$
Balances at September 30, 2019
Changes for the year:
Increases (Decrease)
43
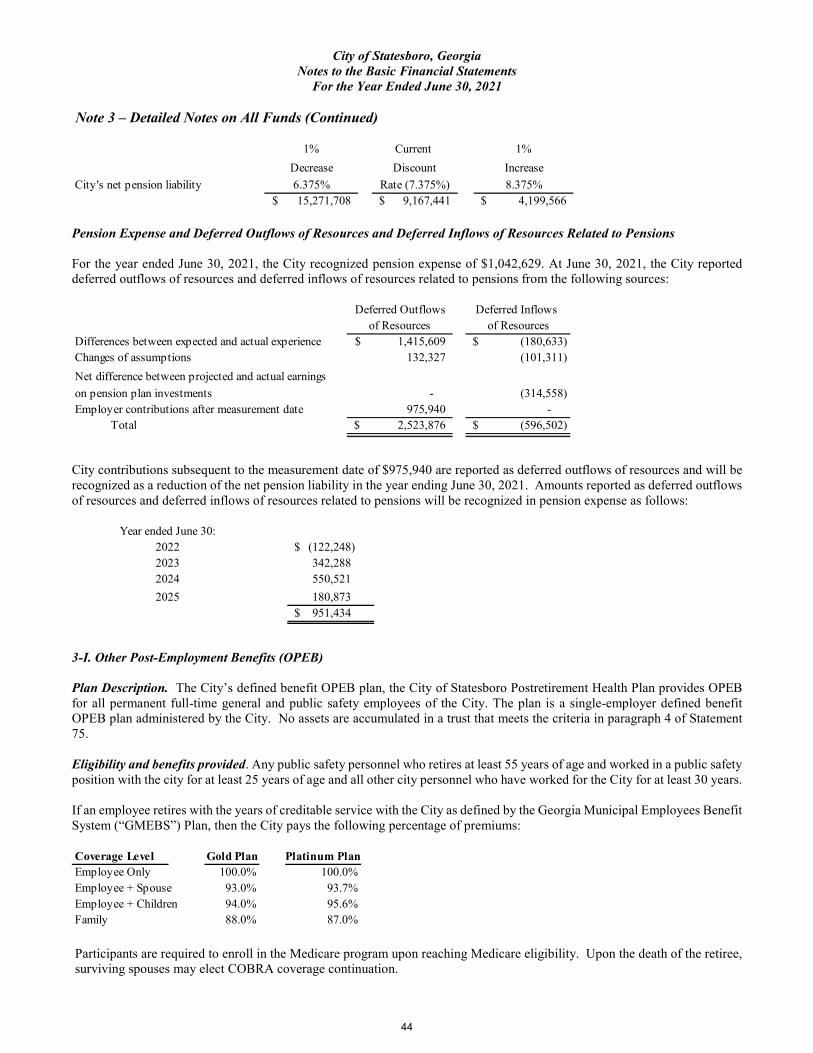
City of Statesboro, Georgia Notes to the Basic Financial Statements
For the Year Ended June 30, 2021
Note 3 – Detailed Notes on All Funds (Continued)
Pension Expense and Deferred Outflows of Resources and Deferred Inflows of Resources Related to Pensions
For the year ended June 30, 2021, the City recognized pension expense of $1,042,629. At June 30, 2021, the City reported deferred outflows of resources and deferred inflows of resources related to pensions from the following sources:
City contributions subsequent to the measurement date of $975,940 are reported as deferred outflows of resources and will be recognized as a reduction of the net pension liability in the year ending June 30, 2021. Amounts reported as deferred outflows of resources and deferred inflows of resources related to pensions will be recognized in pension expense as follows:
3-I. Other Post-Employment Benefits (OPEB)
Plan Description. The City’s defined benefit OPEB plan, the City of Statesboro Postretirement Health Plan provides OPEB for all permanent full-time general and public safety employees of the City. The plan is a single-employer defined benefit OPEB plan administered by the City. No assets are accumulated in a trust that meets the criteria in paragraph 4 of Statement 75.
Eligibility and benefits provided. Any public safety personnel who retires at least 55 years of age and worked in a public safety position with the city for at least 25 years of age and all other city personnel who have worked for the City for at least 30 years.
If an employee retires with the years of creditable service with the City as defined by the Georgia Municipal Employees Benefit System (“GMEBS”) Plan, then the City pays the following percentage of premiums:
Participants are required to enroll in the Medicare program upon reaching Medicare eligibility. Upon the death of the retiree, surviving spouses may elect COBRA coverage continuation.
1% Current 1%
Decrease Discount Increase
City's net pension liability 6.375% Rate (7.375%) 8.375%
15,271,708$ 9,167,441$ 4,199,566$
Differences between expected and actual experience
Changes of assumptions
Net difference between projected and actual earnings
on pension plan investments
Employer contributions after measurement date
Total
(101,311)
(314,558)
(596,502)$
132,327
-
2,523,876$
975,940 -
Deferred Outflows
of Resources
Deferred Inflows
of Resources
1,415,609$ (180,633)$
(122,248)$
342,288
550,521
180,873
951,434$
2022
2023
Year ended June 30:
2024
2025
Coverage Level Gold Plan Platinum Plan
Employee Only 100.0% 100.0%
Employee + Spouse 93.0% 93.7%
Employee + Children 94.0% 95.6%
Family 88.0% 87.0%
44

City of Statesboro, Georgia Notes to the Basic Financial Statements
For the Year Ended June 30, 2021
Note 3 – Detailed Notes on All Funds (Continued)
Employees covered by benefit terms. At June 30, 2021, the following employees were covered by the benefit terms:
Total OPEB Liability. The City’s total OPEB liability of $6,876,392 was measured as of June 30, 2021, and was determined by an actuarial valuation performed as of July 1, 2020.
Actuarial assumptions and other inputs. The total OPEB liability as of June 30, 2021 was determined using the following actuarial assumptions and other inputs, applied to all periods included in the measurement, unless otherwise specified:
The discount rate was based on the S & P Municipal Bond 20-Year High-Grade Rate Index.
Mortality rates were based on the Pub-2010 Public Retirement Plans Mortality Tables.
Changes in the Total OPEB Liability
Sensitivity of the total OPEB liability to changes in the discount rate. The following presents the total OPEB liability of the City, as well as what the City’s total OPEB liability would be if it were calculated using a discount rate that is 1-percentage-point lower (1.18 percent) or 1-percentage-point higher (3.18 percent) than the current discount rate:
Sensitivity of the total OPEB liability to changes in the healthcare cost trend rates. The following presents the total OPEB liability of the City, as well as what the City’s total OPEB liability would be if it were calculated using healthcare cost trend rates that are 1-percentage-point lower (3.50 percent) or 1-percentage-point higher (5.50 percent) than the current healthcare cost trend rates:
5
-
261
266
Inactive employees or beneficiaries currently receiving benefit payments
Inactive employees entitled to but not yet receiving benefit payments
Active employees
Inflation 2.50 percent
Salary increases 3.50 percent, average, including inflation
Discount rate 2.18 percent
Healthcare cost trend rates 4.50 percent
Total OPEB
Liability
Balance at 6/30/20 6,856,958$
Changes for the year:
Service cost 240,845
Interest 181,236
Changes of benefit terms (195,530)
Differences between expected and actual experience (812,427)
Changes in assumptions or other inputs 692,481
Other changes -
Benefit payments (87,171)
Net changes 19,434
Balance at 6/30/21 6,876,392$
Discount Rate
1% Decrease Valuation Rate 1% Increase
1.18% 2.18% 3.18%
Total OPEB Liability 7,695,798$ 6,876,392$ 6,155,945$
45

City of Statesboro, Georgia Notes to the Basic Financial Statements
For the Year Ended June 30, 2021
Note 3 – Detailed Notes on All Funds (Continued)
OPEB Expense and Deferred Outflows of Resources and Deferred Inflows of Resources Related to OPEB
For the year ended June 30, 2021, the City recognized OPEB expense of $305,751. At June 30, 2021, the City reported deferred outflows of resources and deferred inflows of resources related to OPEB from the following sources:
Amounts reported as deferred outflows of resources and deferred inflows of resources related to OPEB will be recognized in OPEB expense as follows:
3-J. Defined Contribution Plan
The City sponsors a defined contribution retirement plan qualified under Section 401(a) of the Internal Revenue Code for the City Manager, Municipal Court Judge, and the City Attorney. The plan is administered by the Georgia Municipal Association. The City Council is responsible and has authority to amend the plan provisions. The City contributes 4 percent of salary to the plan. The employees are not required to contribute to the plan. The City made $12,605 in contributions to the plan during the year ended June 30, 2021.
3-K. Fund Equity
As of June 30, 2021, governmental fund balances are composed of the following:
Health Care Cost Trend
1% Decrease Rates 1% Increase
3.50% 4.50% 5.50%
Total OPEB Liability 6,030,653$ 6,876,392$ 7,882,203$
Deferred Outflows Deferred Inflows
of Resources of Resources
Differences between expected and actual experience - 935,440$
Changes of assumptions or other inputs 1,534,314$ 329,616
Total 1,534,314$ 1,265,056$
Year ended June 30:
2022 79,199$
2023 79,199
2024 79,199
2025 79,199
2026 23,986
Thereafter (71,524)
269,258$
General Fund
Statesboro Fire
Service 2013 SPLOST 2018 TSPLOST 2019 SPLOST
LMIG
Akins Blvd
Other
Governmental
Funds
Total
Governmental
Funds
Nonspendable:
Prepaid items 39,194$ 27,399$ -$ -$ -$ -$ -$ 66,593$
Restricted: -
Capital projects - - 5,717,992 8,612,716 10,563,896 548,612 - 25,443,216
Fire protection - 1,476,359 - - - - - 1,476,359
Police - - - - - - 96,629 96,629
Community development - - - - - - 1,118,995 1,118,995
Assigned:
Subsequent year's budget 1,150,691 - - - - - - 1,150,691
Unassigned 7,355,500 - - - - - - 7,355,500
Total fund balances 8,545,385$ 1,503,758$ 5,717,992$ 8,612,716$ 10,563,896$ 548,612$ 1,215,624$ 36,707,983$
46

City of Statesboro, Georgia Notes to the Basic Financial Statements
For the Year Ended June 30, 2021
Note 3 – Detailed Notes on All Funds (Continued)
Net investment in capital assets on the government-wide statement of net position as of June 30, 2021 is as follows:
Note 4 – Other Notes
4-A. Risk Management
The City is exposed to various risks of loss related to torts; theft of, damage to and destruction of assets; errors and omissions; worker’s compensation claims; and natural disasters for which the city carries commercial insurance.
In January 1991 the City elected to establish a self-insurance fund (an internal service fund) to cover all employee health insurance claims. The City makes payments to this fund on a monthly basis based on estimated premiums provided by the third party administrator to fund this program. Amounts are also withheld from employees by payroll deduction and paid to the self-insurance fund.
A third party administrator pays all claims from funds provided to them from the self-insurance fund’s bank account. The City carries specific reinsurance for claims from one individual within one year exceeding $60,000.
The claims liability of $260,000 reported at June 30, 2021, for the Health Insurance Fund represents known claims incurred on or prior to June 30, 2021, and an estimate for claims that have been incurred but not reported. Changes in the claims liability for the year ended June 30, 2021, were as follows:
There were no significant reductions in insurance coverage from the prior year, and there have been no settlements that exceed the City’s insurance coverage during the past three years.
4-B. Contingent Liabilities
The City has received federal and state grants for specific purposes that are subject to review and audit by the grantor agencies or their designee. These audits could result in a request for reimbursement to the grantor agency for costs disallowed under terms of the grant. Based on prior experience, the City believes such disallowances, if any, will be immaterial.
The City was a defendant in several lawsuits at June 30, 2021. In the opinion of City management, the outcome of these contingencies will not have a material effect on the financial position of the City.
4-C. Joint Ventures
Under Georgia law, the City, in conjunction with other cities and counties in the ten county coastal Georgia area, is a member of the Coastal Regional Commission of Georgia (RC) and is required to pay annual dues thereto. During the year ended June 30, 2021, the City paid $36,949 in such dues. Membership in an RC is required by the Official Code of Georgia Annotated (OCGA) Section 50-8-33, which provides for the organizational structure of the RC in Georgia. The RC Board membership
Cost of capital assets 70,522,037$ 118,178,968$ 759,289$
Less accumulated depreciation 33,848,265 57,121,463 39,866
Book value 36,673,772 61,057,505 719,423
Less capital related debt 9,562,533 10,619,163 273,372
Plus unspent bond proceeds 1,216,015 - -
Net investment in capital assets 28,327,254$ 50,438,342$ 446,051$
Governmental
Activities
Business Type
Activities Component Unit
Beginning of Current Year End of
Fiscal Year Claims and Changes Claim Fiscal Year
Date Liability in Estimates Payments Liability
2019 446,321 3,644,092 3,830,947 259,466
2020 259,466 3,742,559 3,892,025 110,000
2021 110,000 4,270,460 4,120,460 260,000
47

City of Statesboro, Georgia Notes to the Basic Financial Statements
For the Year Ended June 30, 2021
Note 4 – Other Notes (Continued)
includes the chief elected official of each county and municipality of the area. OCGA 50-8-39 provides that the member governments are liable for any debts or obligations of an RC. Separate financial statements may be obtained from the Coastal Regional Commission of Georgia, 1181 Coastal Drive SW, Darien, Georgia 31305.
4-D. Hotel-Motel Lodging Tax
The City has levied a 6% lodging tax. A summary of the transactions for the year ended June 30, 2021 follows:
All expenditures were for promotion of tourism as required by O.C.G.A. 48-13-51
4-E. Subsequent Events Management has evaluated subsequent events through December 29, 2021, the date that the financial statements were available for issue. No subsequent events were noted.
Percentage of
tax receipts
Lodging tax receipts 785,685$
Disbursements to the:
Statesboro Convention and Visitors Bureau (392,844) 50.00%
for promotion of tourism
Statesboro Arts Council for (197,206) 25.10%
performing arts center
Downtown Statesboro Development Authority (156,351) 19.90%
for promotion of tourism
City of Statesboro for administrative costs (39,284) 5.00%
Total -$ 100%
48

Required Supplementary Information

2021 (1) 2020 (1) 2019 (1) 2018 (1) 2017 (1) 2016 (1) 2015 (1)
Total pension liability
Service cost 709,853$ 379,550$ 375,769$ 409,949$ 406,149$ 442,204$ 435,063$
Interest 2,644,529 1,819,622 1,764,167 1,747,276 1,677,669 1,558,936 1,490,160
Changes of benefit items - 9,627,362 - - - - -
Differences between expected and actual experience 1,519,209 333,733 (394,447) (114,276) (355,323) 275,342 94,118
Changes of assumptions - 220,543 - (506,553) - - (445,667)
Benefit payments, including refunds of employee contributions (1,191,864) (1,037,553) (982,193) (888,681) (771,999) (716,890) (655,592)
Other - - - - - - -
Net change in total pension liability 3,681,727 11,343,257 763,296 647,715 956,496 1,559,592 918,082
Total pension liability-beginning 35,744,106 24,400,849 23,637,553 22,989,838 22,033,342 20,473,750 19,555,668
Total pension liability-ending (a) 39,425,833$ 35,744,106$ 24,400,849$ 23,637,553$ 22,989,838$ 22,033,342$ 20,473,750$
Plan fiduciary net position
Contributions-employer 372,330$ 61,862$ 528,386$ 568,247$ 659,671$ 548,293$ 556,107$
Contributions-employee 14,542 - - - - - -
Net investment income 2,680,637 816,830 2,619,196 3,503,486 2,363,828 245,378 2,183,124
Benefit payments, including refunds of employee contributions (1,191,864) (1,037,553) (982,193) (888,681) (771,999) (716,890) (655,592)
Administrative expense (60,916) (58,379) (62,140) (65,063) (40,051) (44,696) (34,589)
Other - - - - - - -
Net change in plan fiduciary net position 1,814,729 (217,240) 2,103,249 3,117,989 2,211,449 32,085 2,049,050
Plan fiduciary net position-beginning 28,443,663 28,660,903 26,557,654 23,439,665 21,228,216 21,196,131 19,147,081
Plan fiduciary net position-ending (b) 30,258,392$ 28,443,663$ 28,660,903$ 26,557,654$ 23,439,665$ 21,228,216$ 21,196,131$
Net pension liability (asset)-ending (a)-(b) 9,167,441$ 7,300,443$ (4,260,054)$ (2,920,101)$ (449,827)$ 805,126$ (722,381)$
Plan fiduciary net position as a percentage of the total pension liability 76.75% 79.58% 117.46% 112.35% 101.96% 96.35% 103.53%
Covered payroll 12,951,743$ 12,410,165$ 10,402,605$ 10,864,231$ 11,032,951$ 10,987,945$ 10,848,107$
Net pension liability as a percentage of covered payroll 70.78% 58.83% -40.95% -26.88% -4.08% 7.33% -6.66%
Notes to Schedule:
Changes of assumptions
Amounts reported for the fiscal year ending in 2020 and later reflect the following assumption changes based on an actuarial study conducted in November and December of 2019:
- The mortality table for healthy retirees and beneficiaries was changed from the sex-distinct RP-2000 Combined Healthy Mortality Table, set forward two years in age for males and one year for
females to the sex-distinct Pri-2012 head-count weighted Healthy Retiree Mortality Table with rates multiplied by 1.25.
- The mortality table for disabled participants was changed from the sex-distinct RP-2000 Disabled Retiree Mortality Table to the sex-distinct Pri-2012 head-count weighted Disabled Retiree
Mortality Table with rates multiplied by 1.25.
- The mortality table for active participants, terminated vested participants, and deferred beneficiaries was changed from the sex-distinct RP-2000 Combined Healthy Mortality Table, set forward two years in age for
males and one year for females to the sex-distinct Pri-2012 head-count weighted Employee Mortality Table.
- Future mortality improvement is based on projecting generationally from 2012 using 60% of the sex-distinct Scale SSA2019. Previously future mortality improvements were not explicitly projected.
- The prior retirement assumption was based on the Plan's normal retirement eligibility. If normal retirement eligibility was only available on or after age 65, the prior assumption was 60% at ages
65 to 69 and 100% at age 70 and older. If normal retirement eligibility was available prior to age 65, the rates were 10% at ages 55 to 59, 20% at age 60, 25% at age 61, 35% at age 62, 40% at age
63, 45% at age 64, 50% at ages 65 to 69, and 100% at age 70 and older as long as a participant was at least eligible for early retirement.
- The new assumption relates to when a given participant is eligible for normal retirement (either regular normal retirement or alternative normal retirement). Retirement rates do not apply if a
participant is not eligible for either early or normal retirement. The retirement rates where normal retirement is available on or after age 65 are 5% at ages 55 to 59, 7% at ages 60 and 61,
20% at age 62, 10% at ages 63 and 64, 35% at age 65, 25% at ages 66 to 71 and 100% at ages 72 and older.
- Where normal retirement is available to a given participant at age 62, 63 or 64, the new retirement rates are 3% when first eligible for early retirement through age 60, 10% at ages 61-64, 35% at age
65, 25% at ages 66 to 71 and 100% at ages 72 and older. In addition, in the first year a participant is eligible for normal retirement, the rate is increased by 30%.
- Where normal retirement is available at age 60 or 61, the new retirement rates are 3% when first eligible for early retirement through age 59, 10% at ages 60-64, 35% at age 65, 25% at ages 66 to 71
and 100% at ages 72 and older. In addition, in the first year a participant is eligible for normal retirement, the rate is increased by 20%.
- Where normal retirement is available prior to age 60, the new retirement rates are 3% when first eligible for early retirement through the year prior to normal retirement eligibility, 10% from normal
retirement eligibility through age 59, 20% at age 60, 25% at age 61, 35% at age 62, 40% at age 63, 45% at age 64, 50% at age 65, 25% at ages 66 to 71 and 100% at ages 72 and older. In addition, in the
first year a participant is eligible for normal retirement, the rate is increased by 10%.
- The turnover rates were changed from the greater of age-based rates and select rates for the first five years of service followed by age-based rates thereafter to service-based rates only.
- The disability rates were changed to 50% of the rates in the prior age-based table.
- The inflation assumption was decreased from 2.75% to 2.25%.
- The salary increase assumption was changed from a service-based salary scale starting at 8.25% for the first two years of service with an ultimate rate of 3.25% at ten years of service to a service-based
scale starting at 8.5% for the first two years of service with an ultimate rate of 3.00% at 15 years of service.
- The investment return assumption was decreased from 7.5% to 7.375%.
- The cost-of-living assumption was decreased from 2.75% to 2.25%.
Benefit changes
Amounts reported for fiscal years ending in 2020 and later reflect that effective January 1, 2020, the benefit multiplier for Employees was changed to 2% while employees hired or rehired on or after
January 1, 2020 are required to contribute at a 3% rate. In addition, all Employees are eligible for Alternative Normal Retirement at any age with 30 years of service and all unused sick leave
counts for benefit computation purposes.
(1) Only fiscal year 2021, 2020, 2019, 2018, 2017, 2016 and 2015 was available. The City will continue to present information for years available until a full 10-year trend is compiled.
City of Statesboro, Georgia
Required Supplementary Information
Schedule of Changes in the Net Pension Liability (Asset) and Related Ratios
For the Year Ended June 30, 2021
49

2021 2020 2019 2018 2017 2016 2015
Actuarially determined contribution * 62,689$ 61,586$ 615,587$ 620,865$ 605,346$ 596,536$
Contributions in relation to the actuarially determined contribution * 62,689 112,885 616,027 569,126 606,396 596,536
Contribution deficiency (excess) * - (51,299) (440) 51,739 (1,050) -
Covered payroll * 12,410,165 10,402,605 10,864,231 11,032,951 10,987,945 10,848,107
Contributions as a percentage of covered payroll * 0.51% 1.09% 5.67% 5.16% 5.52% 5.50%
*2021 information will be determined after fiscal year end and will be included in the 2021 valuation report
Notes to Schedule:
Valuation Date
Methods and assumptions used to determine contribution rates:
Actuarial Cost Method Projected Unit Credit
Amortization Method Closed level dollar for remaining unfunded liability
Remaining Amortization Period Remaining amortization period varies for the bases, with a net effective amortization period of 20 years.
Asset Valuation Method
Actuarial Assumptions:
Net Investment Rate of Return 7.375%
Projected Salary Increases 2.25% plus service based merit increases
Cost of Living Adjustments 2.25%
Retirement Age
Mortality
Sum of actuarial value at beginning of year and the cash flow during the year plus the assumed investment return, adjusted by 10% of the amount that the value exceeds or is
less than the market value at end of year. The actuarial value is adjusted, if necessary, to be within 20% of market value.
See changes of assumptions in the Notes to Schedule of Changes in the Net Pension Liability (Asset)
Sex-distinct Pri-2012 head-count weighted Healthy Retiree Mortality Table with rates multiplied by 1.25.
City of Statesboro
Required Supplemental Information
Schedule of Contributions
For the Year Ended June 30, 2021
The actuarially determined contribution rate was determined as of January 1, 2021, with an interest adjustment to the fiscal year. Contributions in relation to this actuarially
determined contribution rate will be reported for the fiscal year ending June 30, 2022.
50

2021 (1) 2020 (1) 2019 (1) 2018 (1) 2017 (1)
Total OPEB liability
Service cost 240,845$ 294,140$ 251,484$ 251,655$ 238,840$
Interest 181,236 175,328 190,743 172,519 143,097
Changes of benefit terms (195,530) - - - -
Differences between expected and actual experience (812,427) - (281,869) - (19,053)
Changes in assumptions or other inputs 692,481 143,600 (74,273) 50,685 392,842
Other changes - 8,701 (83,751) 387,130 305,798
Benefit payments (87,171) (97,958) (139,820) (95,433) (98,018)
Net change in total OPEB liability 19,434 523,811 (137,486) 766,556 963,506
Total OPEB liability-beginning 6,856,958 6,333,147 6,470,633 5,704,077 4,740,614
Total OPEB liability-ending 6,876,392$ 6,856,958$ 6,333,147$ 6,470,633$ 5,704,077$
Covered-employee payroll 11,944,070$ 11,308,002$ 11,308,002$ 9,814,896$ 9,814,896$
Total OPEB liability as a percentage of covered-employee payroll 57.57% 60.64% 56.01% 65.93% 58.12%
Notes to Schedule:
Changes of assumptions
(1) Only fiscal year 2021, 2020, 2019, 2018 and 2017 was available. The City will continue to present information for years available until a full 10-year trend is compiled.
Changes of assumptions and other inputs reflect the effects of changes in the discount rate, changes in the health care trend rates, and a change in the mortality rate assumption.
City of Statesboro
Required Supplemental Information
Schedule of Changes in the Total OPEB Liability and Related Ratios
For the Year Ended June 30, 2021
51

Supplementary Information

Nonmajor Governmental Funds

Nonmajor Nonmajor TotalSpecial Capital NonmajorRevenue Projects Governmental
Funds Funds FundsAssetsCash and cash equivalents 1,175,720$ -$ 1,175,720$ Receivables: Hotel/motel taxes 77,227 - 77,227 Intergovernmental - 8,171 8,171 Interfund 18,175 18,175 Notes 146,224 - 146,224
Total Assets 1,417,346$ 8,171$ 1,425,517$
Liabilities and Fund Balances
LiabilitiesAccounts payable 152,738$ 8,171$ 160,909$ Other 48,984 - 48,984
Total Liabilities 201,722 8,171 209,893
Fund Balances Restricted 1,215,624 - 1,215,624
Total Liabilities and Fund Balances 1,417,346$ 8,171$ 1,425,517$
City of Statesboro, Georgia
Combining Balance Sheet
Nonmajor Governmental Funds - By Fund Type
June 30, 2021
52
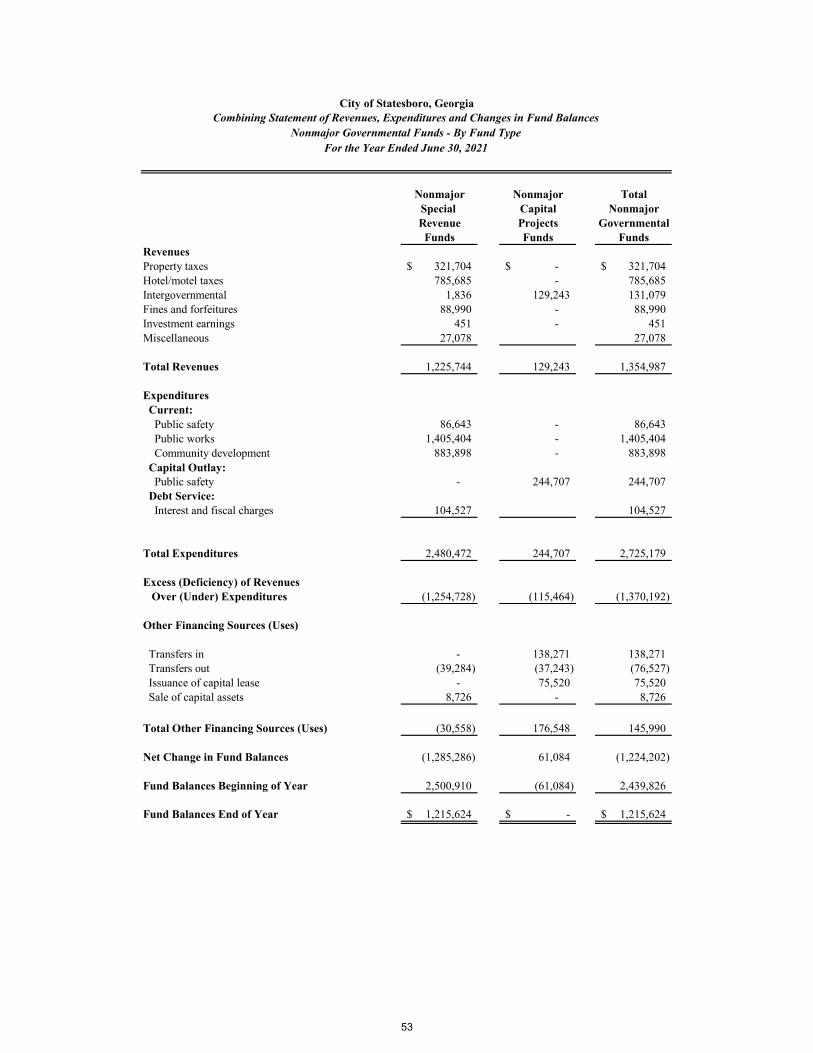
Nonmajor Nonmajor TotalSpecial Capital Nonmajor
Revenue Projects GovernmentalFunds Funds Funds
Revenues
Property taxes 321,704$ -$ 321,704$ Hotel/motel taxes 785,685 - 785,685
Intergovernmental 1,836 129,243 131,079Fines and forfeitures 88,990 - 88,990Investment earnings 451 - 451
Miscellaneous 27,078 27,078
Total Revenues 1,225,744 129,243 1,354,987
Expenditures
Current:
Public safety 86,643 - 86,643
Public works 1,405,404 - 1,405,404
Community development 883,898 - 883,898
Capital Outlay: Public safety - 244,707 244,707
Debt Service: Interest and fiscal charges 104,527 104,527
Total Expenditures 2,480,472 244,707 2,725,179
Excess (Deficiency) of Revenues Over (Under) Expenditures (1,254,728) (115,464) (1,370,192)
Other Financing Sources (Uses)
Transfers in - 138,271 138,271 Transfers out (39,284) (37,243) (76,527) Issuance of capital lease - 75,520 75,520
Sale of capital assets 8,726 - 8,726
Total Other Financing Sources (Uses) (30,558) 176,548 145,990
Net Change in Fund Balances (1,285,286) 61,084 (1,224,202)
Fund Balances Beginning of Year 2,500,910 (61,084) 2,439,826
Fund Balances End of Year 1,215,624$ -$ 1,215,624$
City of Statesboro, GeorgiaCombining Statement of Revenues, Expenditures and Changes in Fund Balances
Nonmajor Governmental Funds - By Fund Type
For the Year Ended June 30, 2021
53

General Fund

2021 2020AssetsCash and cash equivalents 9,134,119$ 7,874,121$ Certificates of deposit 250,000 -Receivables: Taxes 181,862 175,489 Accounts 84,066 23,596 Intergovernmental 69,097 49,205 Interfund - 21,579Prepaid items 39,194 30,413
Total Assets 9,758,338$ 8,174,403$
Liabilities Accounts payable 345,603$ 231,593$ Accrued payroll and payroll taxes 418,258 374,995 Other liabilities 209,866 177,386 Interfund payable 198,049 198,895
Total Liabilities 1,171,776 982,869
Deferred Inflows of Resources Unavailable revenue - property taxes 41,177 81,370
Fund Balances Nonspendable 39,194 30,413 Assigned for subsequent year's budget 1,150,691 1,007,405 Unassigned 7,355,500 6,072,346
Total Fund Balances 8,545,385 7,110,164
Total Liabilities, Deferred Inflows of Resources, and Fund Balances 9,758,338$ 8,174,403$
City of Statesboro, GeorgiaGeneral Fund
Comparative Balance SheetJune 30, 2021 and 2020
54

2021 2020RevenuesTaxes: Property 5,301,317$ 5,026,785$ Automobiles 636,234 475,867 Franchise 1,763,686 1,816,587 Insurance premium 2,278,035 2,160,324 Alcoholic beverage 753,753 705,752 Other 109,855 82,379Licenses and permits 1,039,632 1,026,408Intergovernmental 1,271,918 -Charges for services 429,107 356,502Fines and forfeitures 650,822 678,580Investment earnings 13,289 1,705Miscellaneous 23,703 54,299
Total Revenues 14,271,351 12,385,188
ExpendituresCurrent: General government Governing body 150,195 171,568 City manager's office 362,790 391,301 City clerk's office 178,039 264,577 Elections - 56 Financial administration 487,322 500,251 Public information 140,440 - Legal 148,269 127,311 Human resources 228,909 229,479 Government buildings 179,382 135,102 General administration fees 47,165 46,538
Total general government 1,922,511 1,866,183
Municipal court 450,259 457,608
Public safety: Police 7,625,306 6,889,526 Emergency management 5,000 5,000 Animal control 64,575 64,197
Total public safety 7,694,881 6,958,723
(continued)
City of Statesboro, Georgia General Fund
Comparative Statement of Revenues, Expenditures and
For the Years Ended June 30, 2021 and 2020Changes in Fund Balances
55
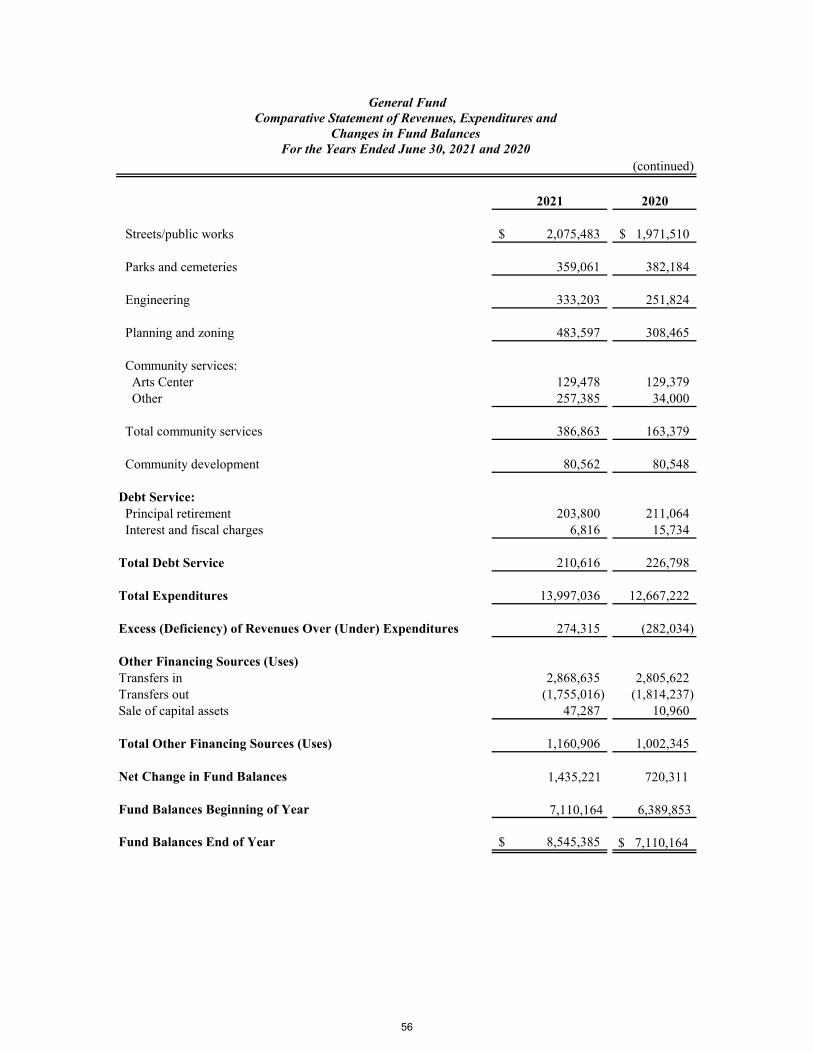
(continued)
2021 2020
Streets/public works 2,075,483$ 1,971,510$
Parks and cemeteries 359,061 382,184
Engineering 333,203 251,824
Planning and zoning 483,597 308,465
Community services: Arts Center 129,478 129,379 Other 257,385 34,000
Total community services 386,863 163,379
Community development 80,562 80,548
Debt Service: Principal retirement 203,800 211,064 Interest and fiscal charges 6,816 15,734
Total Debt Service 210,616 226,798
Total Expenditures 13,997,036 12,667,222
Excess (Deficiency) of Revenues Over (Under) Expenditures 274,315 (282,034)
Other Financing Sources (Uses)Transfers in 2,868,635 2,805,622Transfers out (1,755,016) (1,814,237)Sale of capital assets 47,287 10,960
Total Other Financing Sources (Uses) 1,160,906 1,002,345
Net Change in Fund Balances 1,435,221 720,311
Fund Balances Beginning of Year 7,110,164 6,389,853
Fund Balances End of Year 8,545,385$ $ 7,110,164
General FundComparative Statement of Revenues, Expenditures and
For the Years Ended June 30, 2021 and 2020Changes in Fund Balances
56

Major Capital Projects Funds

2021 2020AssetsCash and cash equivalents 5,725,235$ 8,393,200$ Interfund receivable 101,219 -
Total Assets 5,826,454$ 8,393,200$
Liabilities and Fund Balances
LiabilitiesAccounts payable 108,462$ 348,726$ Interfund payable - 532,522
Total Liabilities 108,462 881,248
Fund BalancesRestricted 5,717,992 7,511,952
Total Liabilities and Fund Balances 5,826,454$ 8,393,200$
City of Statesboro, Georgia
2013 SPLOST Fund
Comparative Balance Sheet
June 30, 2021 and 2020
57

2021 2020RevenuesIntergovernmental 101,219$ 1,552,784$ Investment earnings 438 908
Total Revenues 101,657 1,553,692
ExpendituresCapital outlay: Public safety 6,000 422,631 Public works 106,618 324,644
Total Expenditures 112,618 747,275
Excess (Deficit) of Revenues Over Expenditures (10,961) 806,417
Other Financing UsesTransfers out (1,782,999) (2,443,267)
Net Change in Fund Balances (1,793,960) (1,636,850)
Fund Balances Beginning of Year 7,511,952 9,148,802
Fund Balances End of Year 5,717,992$ 7,511,952$
City of Statesboro, Georgia 2013 SPLOST Fund
Comparative Statement of Revenues, Expenditures and
For the Years Ended June 30, 2021 and 2020Changes in Fund Balances
58

2021 2020AssetsCash and cash equivalents 7,637,803$ 4,839,663$ Intergovernmental receivable 1,014,420 907,953
Total Assets 8,652,223$ 5,747,616$
Liabilities and Fund Balances
LiabilitiesAccounts payable 39,507$ 259,851$ Interfund payable - 21,579
Total Liabilities 39,507 281,430
Fund BalancesRestricted 8,612,716 5,466,186
Total Liabilities and Fund Balances 8,652,223$ 5,747,616$
City of Statesboro, Georgia
2018 TSPLOST Fund
Comparative Balance Sheet
June 30, 2021 and 2020
59
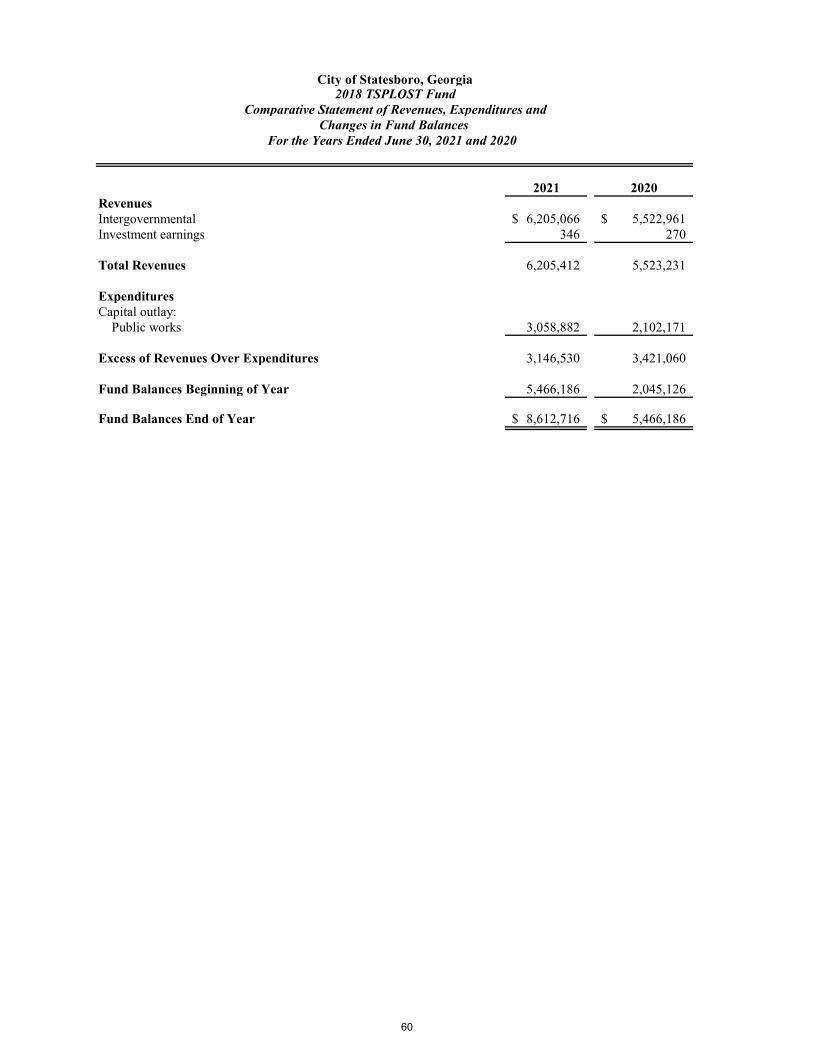
2021 2020RevenuesIntergovernmental 6,205,066$ 5,522,961$ Investment earnings 346 270
Total Revenues 6,205,412 5,523,231
ExpendituresCapital outlay: Public works 3,058,882 2,102,171
Excess of Revenues Over Expenditures 3,146,530 3,421,060
Fund Balances Beginning of Year 5,466,186 2,045,126
Fund Balances End of Year 8,612,716$ 5,466,186$
City of Statesboro, Georgia 2018 TSPLOST Fund
Comparative Statement of Revenues, Expenditures andChanges in Fund Balances
For the Years Ended June 30, 2021 and 2020
60
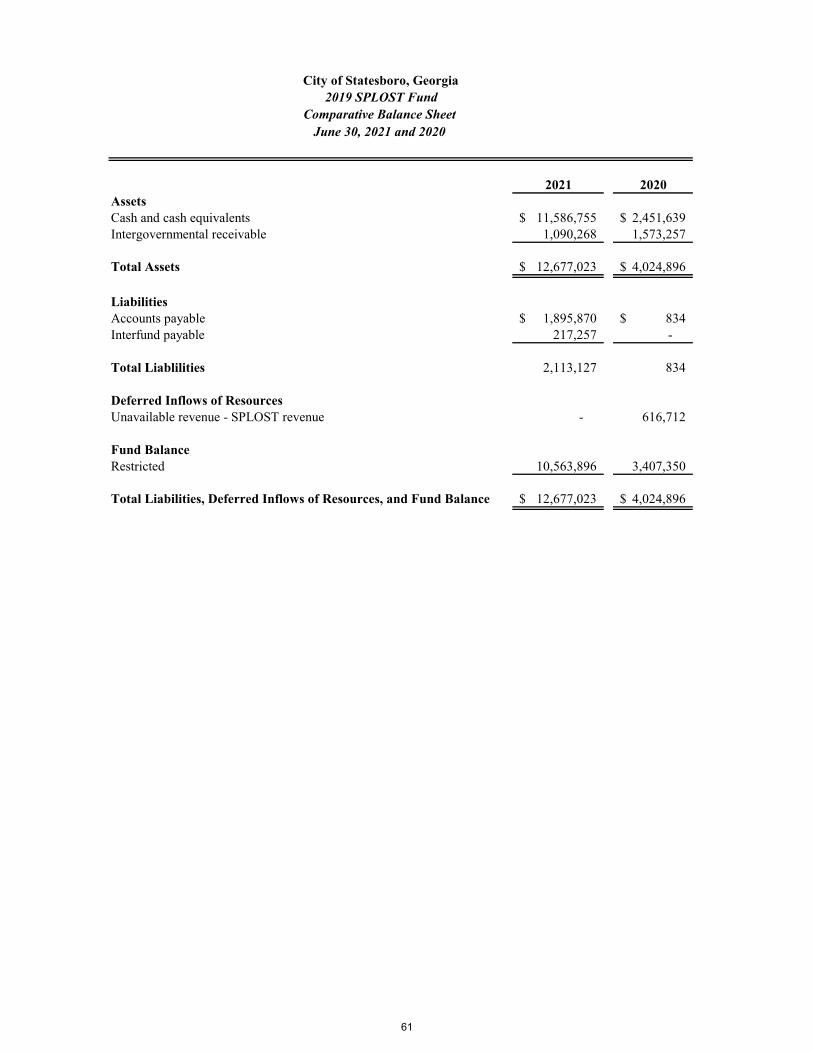
2021 2020AssetsCash and cash equivalents 11,586,755$ 2,451,639$ Intergovernmental receivable 1,090,268 1,573,257
Total Assets 12,677,023$ 4,024,896$
LiabilitiesAccounts payable 1,895,870$ 834$ Interfund payable 217,257 -
Total Liablilities 2,113,127 834
Deferred Inflows of ResourcesUnavailable revenue - SPLOST revenue - 616,712
Fund BalanceRestricted 10,563,896 3,407,350
Total Liabilities, Deferred Inflows of Resources, and Fund Balance 12,677,023$ 4,024,896$
City of Statesboro, Georgia
2019 SPLOST Fund
Comparative Balance Sheet
June 30, 2021 and 2020
61

2021 2020RevenuesIntergovernmental 6,871,340$ 3,596,967$
ExpendituresCapital outlay: Public safety 567,720 189,617 Parks 3,212,482 -Debt Service:Bond issuance cost 76,003 -
Total Expenditures 3,856,205 189,617
Excess of Revenues Over Expenditures 3,015,135 3,407,350
Other Financing Sources (Uses)Issuance of revenue bond 4,500,000 -Transfers out (358,589) -
Total Other Financing Sources (Uses) 4,141,411 -
Net Change in Fund Balance 7,156,546 3,407,350
Fund Balances Beginning of Year 3,407,350 -
Fund Balances End of Year 10,563,896$ 3,407,350$
City of Statesboro, Georgia 2019 SPLOST Fund
Comparative Statement of Revenues, Expenditures andChanges in Fund Balances
For the Years Ended June 30, 2021 and 2020
62

2021AssetsCash and cash equivalents 809,799$
LiabilitiesAccounts payable 261,187$
Fund BalanceRestricted 548,612
Total Liabilities and Fund Balance 809,799$
City of Statesboro, Georgia
LMIG Akins Boulevard Fund
Balance Sheet
June 30, 2021
63

2021RevenuesIntergovernmental 1,398,401$
ExpendituresCapital outlay: Public works 849,789
Excess of Revenues Over Expenditures 548,612
Fund Balances Beginning of Year -
Fund Balances End of Year 548,612$
City of Statesboro, GeorgiaLMIG Akins Boulevard Fund
Statement of Revenues, Expenditures andChanges in Fund Balances
For the Year Ended June 30, 2021
64

Nonmajor Capital Projects Funds

City of Statesboro, GeorgiaCombining Balance Sheet
Nonmajor Capital Projects Funds
June 30, 2021
TotalCapital 2019 Nonmajor
Improvements CDBG Capital ProjectsProgram Fund Fund Funds
Assets Intergovernmental receivable -$ 8,171$ 8,171$
Liabilities and Fund Balances
Liabilities Accounts payable -$ 8,171$ 8,171$
Fund Balances Restricted - - - Unassigned - - -
Total Fund Balances - - -
Total Liabilities and Fund Balances -$ 8,171$ 8,171$
65
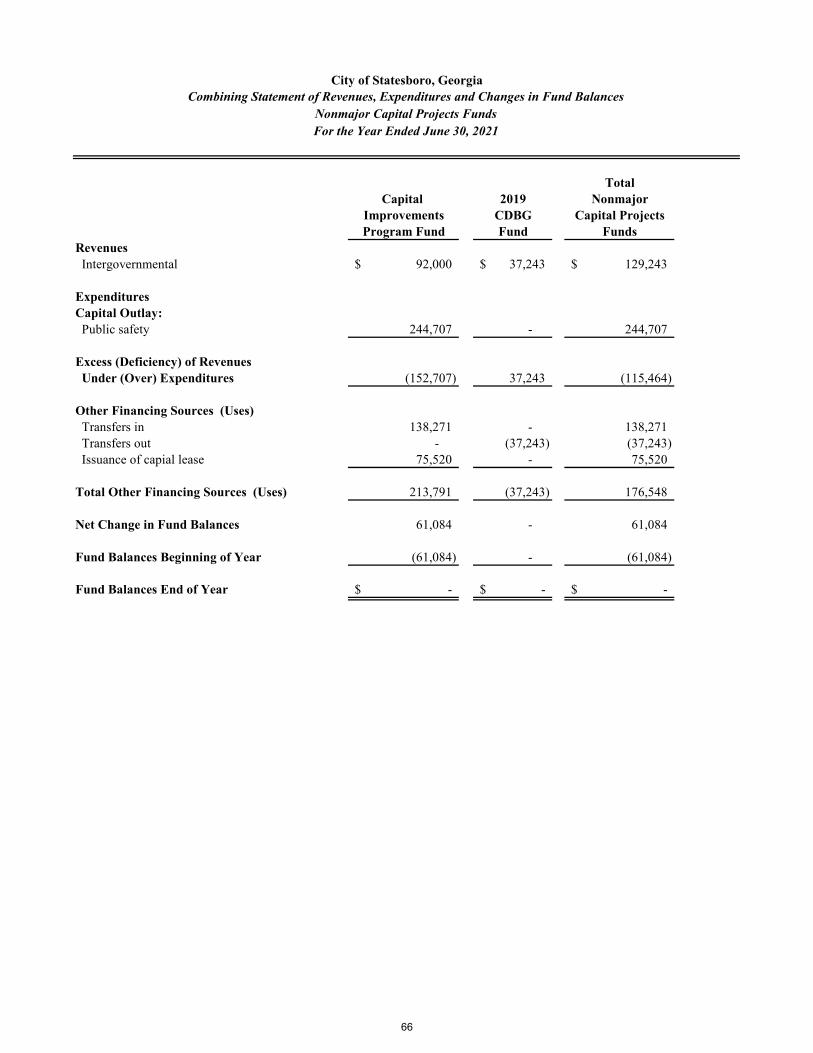
Total
Capital 2019 Nonmajor
Improvements CDBG Capital Projects
Program Fund Fund Funds
Revenues
Intergovernmental 92,000$ 37,243$ 129,243$
Expenditures
Capital Outlay:
Public safety 244,707 - 244,707
Excess (Deficiency) of Revenues
Under (Over) Expenditures (152,707) 37,243 (115,464)
Other Financing Sources (Uses)
Transfers in 138,271 - 138,271
Transfers out - (37,243) (37,243)
Issuance of capial lease 75,520 - 75,520
Total Other Financing Sources (Uses) 213,791 (37,243) 176,548
Net Change in Fund Balances 61,084 - 61,084
Fund Balances Beginning of Year (61,084) - (61,084)
Fund Balances End of Year -$ -$ -$
City of Statesboro, Georgia
Combining Statement of Revenues, Expenditures and Changes in Fund Balances
Nonmajor Capital Projects Funds
For the Year Ended June 30, 2021
66

2021 2020Assets Cash and cash equivalents -$ 106,436$
Liabilities and Fund Balances
Liabilities Accounts payable -$ 167,520$
Fund Balance Restricted - - Unassigned - (61,084)
Total Fund Balances - (61,084)
Total Liabilities and Fund Balances -$ 106,436$
City of Statesboro, GeorgiaCapital Improvements Program Fund
Comparative Balance Sheet June 30, 2021 and 2020
67

2021 2020
RevenuesIntergovernmental 92,000$ -$
ExpendituresCapital Outlay
Public safety 244,707 220,276Public works - 64,537Parks and cemeteries - 37,760
Total Expenditures 244,707 322,573
Deficiency of Revenues Under Expenditures (152,707) (322,573)
Other Financing SourcesTransfers in 138,271 150,000Issuance of capital lease 75,520 -
Total Other Financing Sources 213,791 150,000
Net Change in Fund Balances 61,084 (172,573)
Fund Balances Beginning of Year (61,084) 111,489
Fund Balances End of Year -$ (61,084)$
City of Statesboro, Georgia Capital Improvements Program Fund
Comparative Statement of Revenues, Expenditures and
For the Years Ended June 30, 2021 and 2020Changes in Fund Balances
68
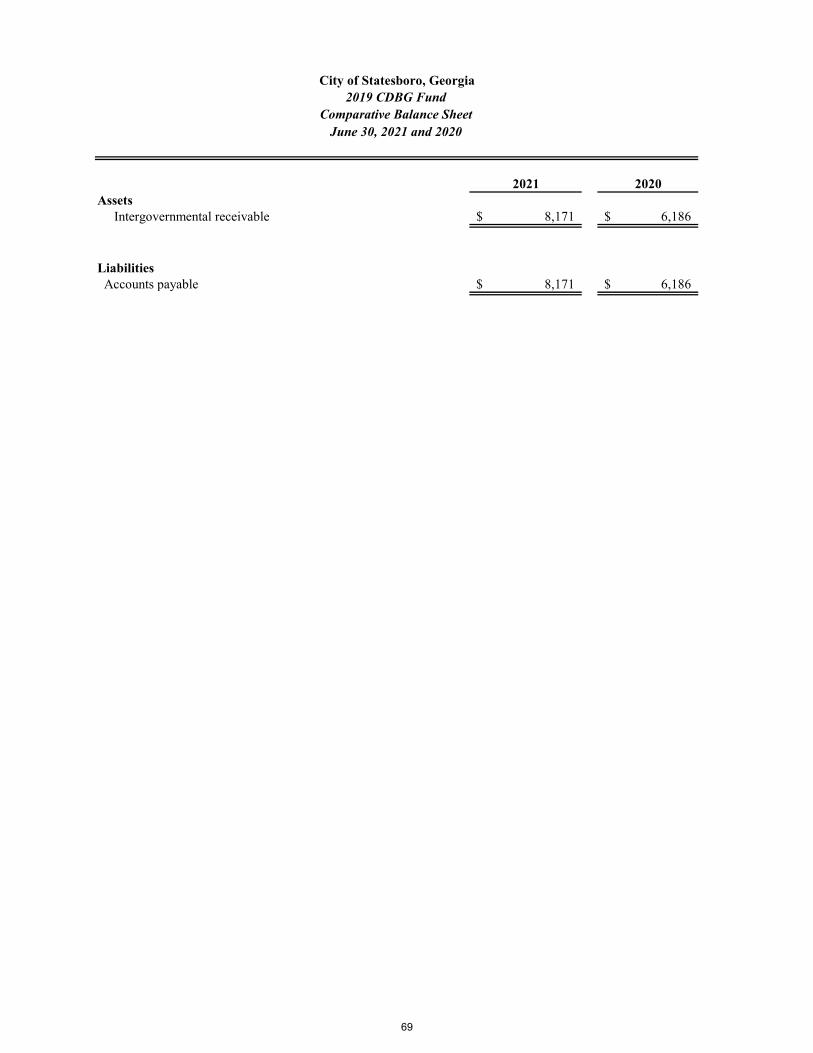
2021 2020Assets Intergovernmental receivable 8,171$ 6,186$
Liabilities Accounts payable 8,171$ 6,186$
City of Statesboro, Georgia
2019 CDBG Fund
Comparative Balance Sheet
June 30, 2021 and 2020
69

2021 2020RevenuesIntergovernmental 37,243$ 50,257$
Other Financing Uses Transfers out 37,243 50,257
Excess of Revenues Over Expenditures - -
Fund Balance Beginning of Year - -
Fund Balance End of Year -$ -$
City of Statesboro, Georgia 2019 CDBG Fund
Comparative Statement of Revenues, Expenditures andChanges in Fund Balances
For the Years Ended June 30, 2021 and 2020
70

Major Special Revenue Funds

2021 2020AssetsCash and cash equivalents 1,525,031$ 849,188$ Receivables: Accounts 33,113 37,284 Intergovernmental 60,913 72,879 Prepaid items 27,399 13,769
Total Assets 1,646,456$ 973,120$
Liabilities and Fund Balances
Liabilities Accounts payable 12,213$ 26,480$ Accrued payroll 130,485 114,768
Total Liabilities 142,698 141,248
Fund Balances Nonspendable 27,399 13,769 Restricted 1,476,359 818,103
Total Fund Balances 1,503,758 831,872
Total Liabilities and Fund Balances 1,646,456$ 973,120$
City of Statesboro, GeorgiaStatesboro Fire Service FundComparative Balance Sheet
June 30, 2021 and 2020
71
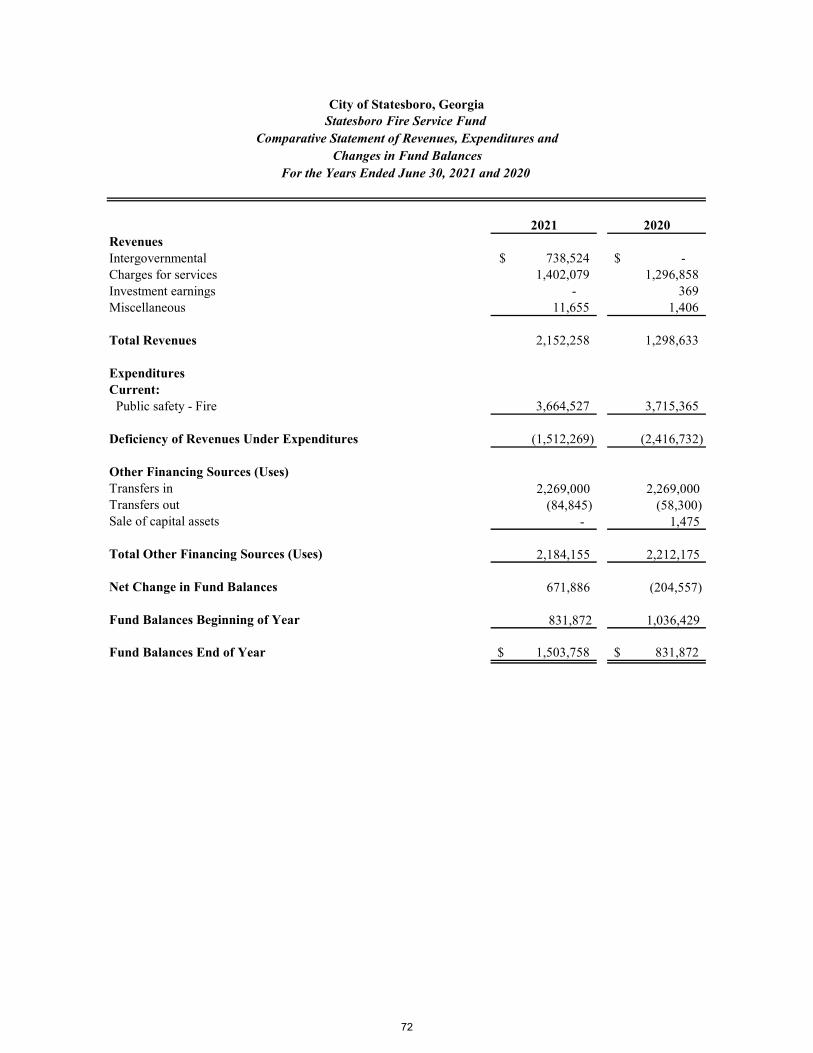
2021 2020RevenuesIntergovernmental 738,524$ -$ Charges for services 1,402,079 1,296,858 Investment earnings - 369 Miscellaneous 11,655 1,406
Total Revenues 2,152,258 1,298,633
ExpendituresCurrent: Public safety - Fire 3,664,527 3,715,365
Deficiency of Revenues Under Expenditures (1,512,269) (2,416,732)
Other Financing Sources (Uses)Transfers in 2,269,000 2,269,000 Transfers out (84,845) (58,300)Sale of capital assets - 1,475
Total Other Financing Sources (Uses) 2,184,155 2,212,175
Net Change in Fund Balances 671,886 (204,557)
Fund Balances Beginning of Year 831,872 1,036,429
Fund Balances End of Year 1,503,758$ 831,872$
Comparative Statement of Revenues, Expenditures and
For the Years Ended June 30, 2021 and 2020
City of Statesboro, GeorgiaStatesboro Fire Service Fund
Changes in Fund Balances
72

Nonmajor Special Revenue Funds

City of Statesboro, GeorgiaCombining Balance Sheet
Nonmajor Special Revenue Funds June 30, 2021
TotalSouth Main Old Register Nonmajor
Confiscated Department of Hotel/Motel Multiple Technology Tax Allocation Tax Allocation Special RevenueAssets CDBG Justice Grant Tax Grant Fee Fund District District Funds
AssetsCash and cash equivalents 50,539$ 14,718$ 92,113$ 75,509$ -$ 2,963$ 939,878$ -$ 1,175,720$ Receivables: Hotel/motel taxes - - - 77,227 - - - - 77,227 Interfund - - - - - - - 18,175 18,175 Notes - 146,224 - - - - - - 146,224
Total Assets 50,539$ 160,942$ 92,113$ 152,736$ -$ 2,963$ 939,878$ 18,175$ 1,417,346$
Liabilities and Fund Balances
Liabilities Accounts payable -$ -$ 2$ 152,736$ -$ -$ -$ -$ 152,738$ Other 48,984 - - - - - - - 48,984
Total Liabilities 48,984 - 2 152,736 - - - - 201,722
Fund Balances Restricted 1,555 160,942 92,111 - - 2,963 939,878 18,175 1,215,624
Total Liabilities and Fund Balances 50,539$ 160,942$ 92,113$ 152,736$ -$ 2,963$ 939,878$ 18,175$ 1,417,346$
73

Total South Main Old Register Nonmajor
Confiscated Department of Hotel/Motel Multiple Technology Tax Allocation Tax Allocation Special RevenueAssets CDBG Justice Grant Tax Grant Fee Fund District District Funds
RevenuesProperty taxes -$ -$ -$ -$ -$ -$ 303,529$ 18,175$ 321,704$ Hotel/motel taxes - - - 785,685 - - - - 785,685 Intergovernmental - - - - 1,836 - - - 1,836 Fines and forfeitures - - 26,027 - - 62,963 - - 88,990 Investment earnings - - - - - - 67 384 451 Miscellaneous - 1,502 - - - - - 25,576 27,078
Total Revenues - 1,502 26,027 785,685 1,836 62,963 303,596 44,135 1,225,744
ExpendituresCurrent: Public safety - - 24,807 - 1,836 60,000 - - 86,643 Public works - - - - - - - 1,405,404 1,405,404 Community development - 67,344 - 746,401 - - 70,153 - 883,898 Debt Service:Interest and fiscal charges - - - - - - - 104,527 104,527
Total Expenditures - 67,344 24,807 746,401 1,836 60,000 70,153 1,509,931 2,480,472
Excess (Deficiency) of Revenues Over (Under) Expenditures - (65,842) 1,220 39,284 - 2,963 233,443 (1,465,796) (1,254,728)
Other Financing Sources (Uses)Transfers out - - - (39,284) - - - - (39,284) Sale of capital assests - - 8,726 - - - - - 8,726
Total Other Financing Sources (Uses) - - 8,726 (39,284) - - - - (30,558)
Net Change in Fund Balances - (65,842) 9,946 - - 2,963 233,443 (1,465,796) (1,285,286)
Fund Balances Beginning of Year 1,555 226,784 82,165 - - - 706,435 1,483,971 2,500,910
Fund Balances End of Year 1,555$ 160,942$ 92,111$ -$ -$ 2,963$ 939,878$ 18,175$ 1,215,624$
City of Statesboro, GeorgiaCombining Statement of Revenues, Expenditures and Changes in Fund Balances
Nonmajor Special Revenue FundsFor the Year Ended June 30, 2021
74
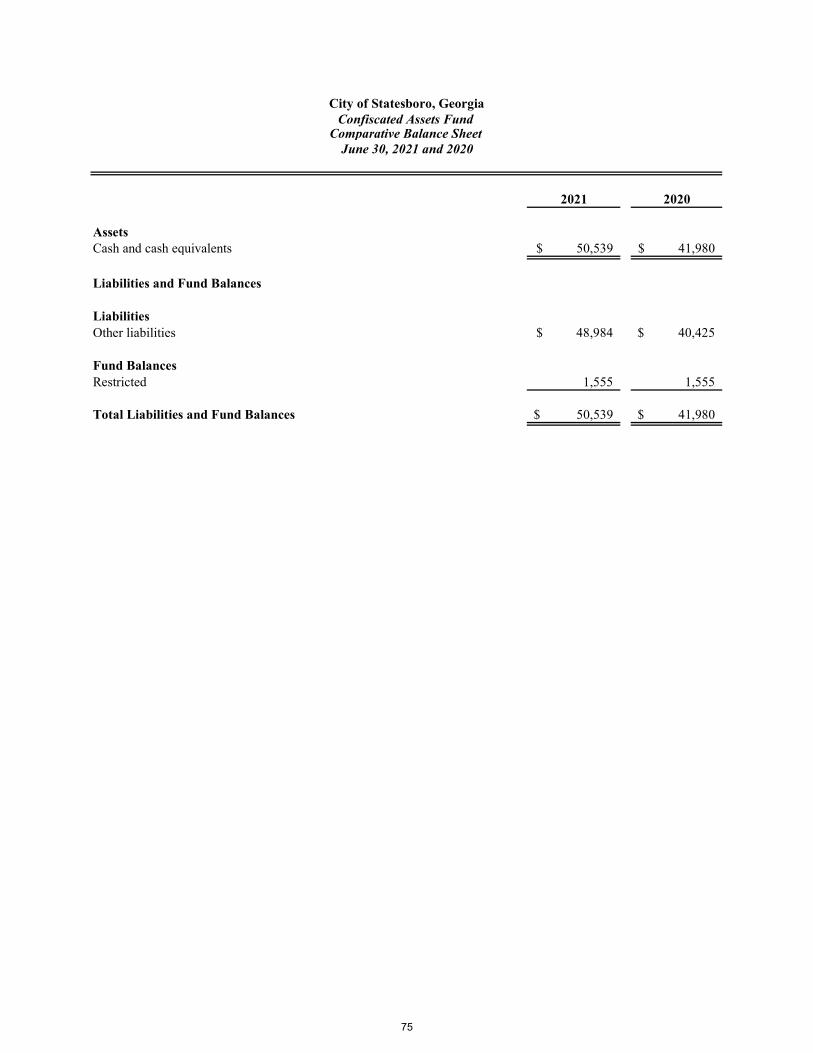
2021 2020
AssetsCash and cash equivalents 50,539$ 41,980$
Liabilities and Fund Balances
LiabilitiesOther liabilities 48,984$ 40,425$
Fund BalancesRestricted 1,555 1,555
Total Liabilities and Fund Balances 50,539$ 41,980$
City of Statesboro, GeorgiaConfiscated Assets Fund
Comparative Balance Sheet June 30, 2021 and 2020
75
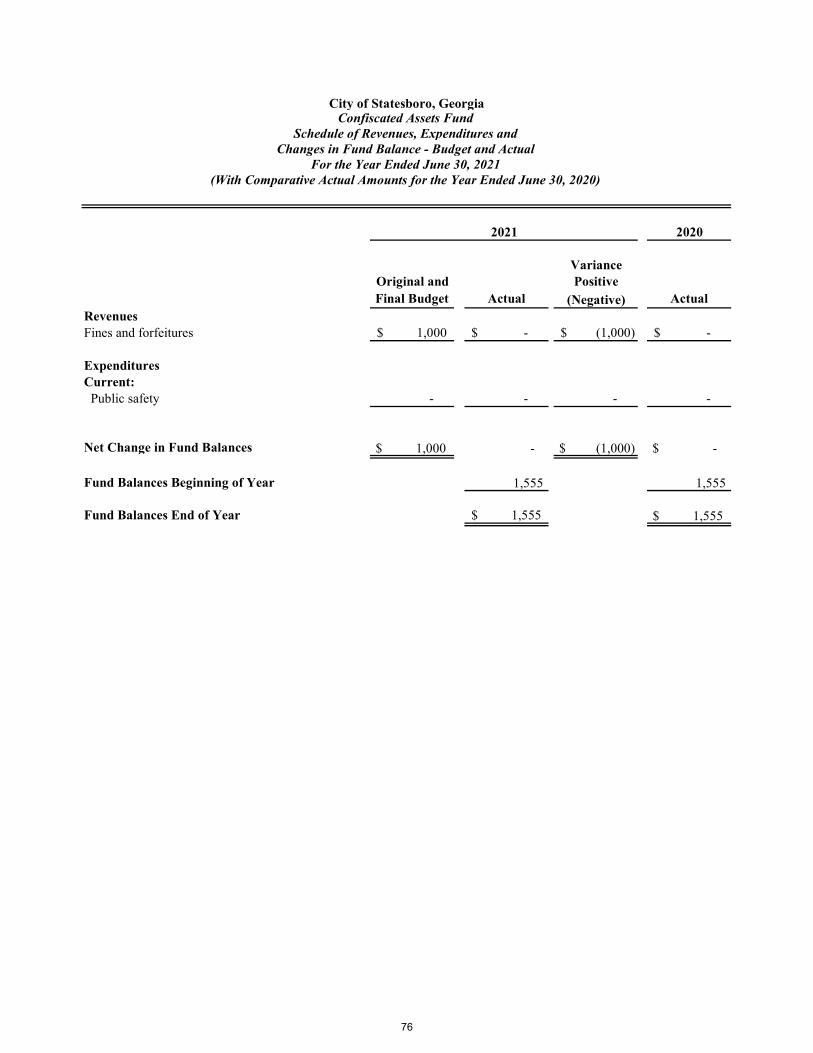
2020
VarianceOriginal and PositiveFinal Budget Actual (Negative) Actual
RevenuesFines and forfeitures 1,000$ -$ (1,000)$ -$
ExpendituresCurrent: Public safety - - - -
Net Change in Fund Balances $ 1,000 - $ (1,000) $ -
Fund Balances Beginning of Year 1,555 1,555
Fund Balances End of Year 1,555$ $ 1,555
2021
City of Statesboro, GeorgiaConfiscated Assets Fund
Schedule of Revenues, Expenditures and
For the Year Ended June 30, 2021(With Comparative Actual Amounts for the Year Ended June 30, 2020)
Changes in Fund Balance - Budget and Actual
76
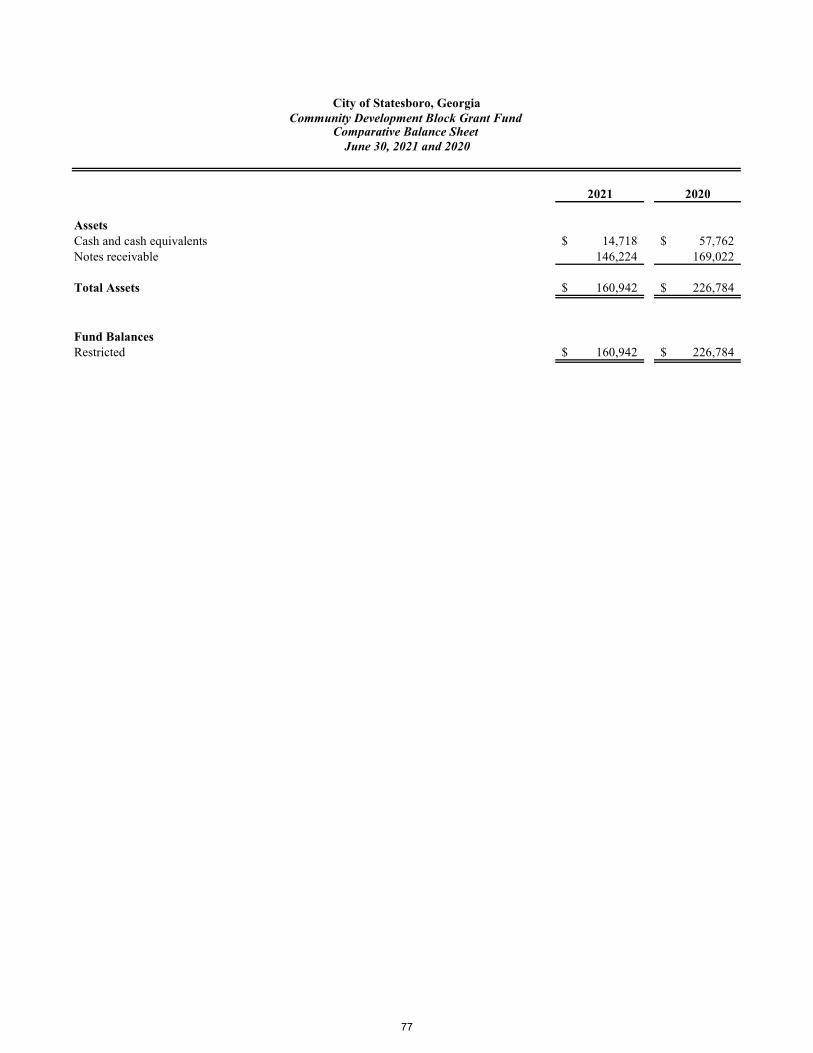
2021 2020
AssetsCash and cash equivalents 14,718$ 57,762$ Notes receivable 146,224 169,022
Total Assets 160,942$ 226,784$
Fund BalancesRestricted 160,942$ 226,784$
City of Statesboro, GeorgiaCommunity Development Block Grant Fund
Comparative Balance Sheet June 30, 2021 and 2020
77
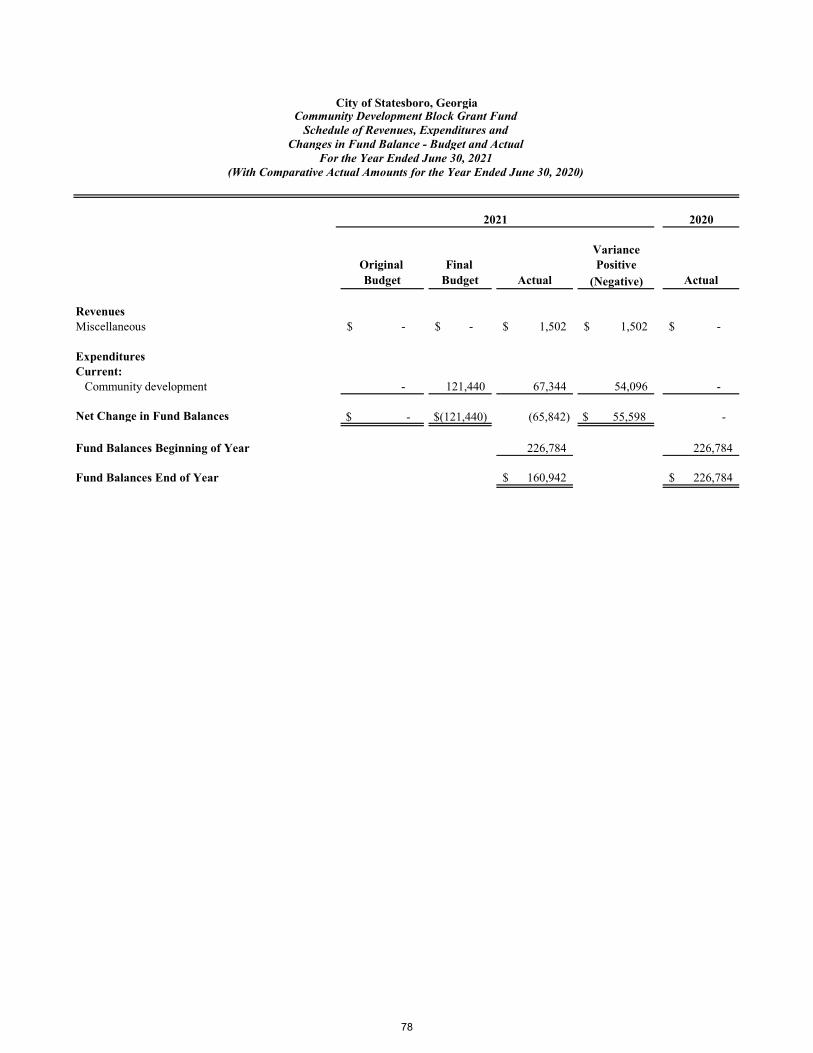
2020
VarianceOriginal Final PositiveBudget Budget Actual (Negative) Actual
RevenuesMiscellaneous -$ -$ 1,502$ 1,502$ -$
ExpendituresCurrent: Community development - 121,440 67,344 54,096 -
Net Change in Fund Balances $ - $(121,440) (65,842) $ 55,598 -
Fund Balances Beginning of Year 226,784 226,784
Fund Balances End of Year 160,942$ 226,784$
2021
City of Statesboro, GeorgiaCommunity Development Block Grant Fund
Schedule of Revenues, Expenditures and
For the Year Ended June 30, 2021(With Comparative Actual Amounts for the Year Ended June 30, 2020)
Changes in Fund Balance - Budget and Actual
78

2021 2020
AssetsCash and cash equivalents 92,113$ 89,304$
Liabilities and Fund Balances
LiabilitiesAccounts payable 2$ 7,139$
Fund BalancesRestricted 92,111 82,165
Total Liabilities and Fund Balances 92,113$ 89,304$
City of Statesboro, GeorgiaDepartment of Justice Grant Fund
Comparative Balance Sheet June 30, 2021 and 2020
79

2020
VarianceOriginal Final Positive Budget Budget Actual (Negative) Actual
RevenuesFines and forfeitures 5,000$ 21,575$ 26,027$ 4,452$ 16,742$
ExpendituresCurrent: Public safety 52,500 63,575 24,807 38,768 130,887
Excess (Deficiency) of Revenues Over (Under) Expenditures (47,500) (42,000) 1,220 43,220 (114,145)
Other Financing Sources Sale of capital assets - - 8,726 8,726 6,000
Net Change in Fund Balances (47,500)$ (42,000)$ 9,946 51,946$ (108,145)
Fund Balances Beginning of Year 82,165 190,310
Fund Balances End of Year 92,111$ 82,165$
(With Comparative Actual Amounts for the Year Ended June 30, 2020)
2021
City of Statesboro, GeorgiaDepartment of Justice Grant Fund
Schedule of Revenues, Expenditures and
For the Year Ended June 30, 2021Changes in Fund Balance - Budget and Actual
80

2021 2020AssetsCash 75,509$ 30,700$ Taxes receivable 77,227 45,992
Total Assets 152,736$ 76,692$
LiabilitiesAccounts payable 152,736$ 76,692$
City of Statesboro, Georgia Hotel/Motel Tax Fund
Comparative Balance Sheet June 30, 2021 and 2020
81

2020
VarianceOriginal Final Positive Budget Budget Actual (Negative) Actual
RevenuesHotel/motel taxes 600,000$ 716,000$ 785,685$ 69,685$ 749,767$
ExpendituresCurrent: Community development 570,000 680,200 746,401 (66,201) 712,279
Excess (Deficiency) of Revenues Over (Under) Expenditures 30,000 35,800 39,284 3,484 37,488
Other Financing Sources (Uses)Transfers out (30,000) (35,800) (39,284) (3,484) (37,488)
Net Change in Fund Balances -$ -$ - -$ -
Fund Balances Beginning of Year - -
Fund Balances End of Year -$ -$
2021
City of Statesboro, Georgia Hotel/Motel Tax Fund
Schedule of Revenues, Expenditures and
For the Year Ended June 30, 2021(With Comparative Actual Amounts for the Year Ended June 30, 2020)
Changes in Fund Balance - Budget and Actual
82

2021 2020AssetsCash -$ -$
LiabilitiesUnearned revenue -$ -$
City of Statesboro, GeorgiaMultiple Grant Fund
Comparative Balance Sheet June 30, 2021 and 2020
83

2020
VarianceOriginal Final Positive Budget Budget Actual (Negative) Actual
RevenuesIntergovernmental -$ 1,840$ 1,836$ (4)$ 7,914$
Expenditures Current: Public safety - 1,840 1,836 4 7,914
Net Change in Fund Balances $ - $ - - $ - -
Fund Balances Beginning of Year - -
Fund Balances End of Year -$ -$
(With Comparative Actual Amounts for the Year Ended June 30, 2020)
2021
City of Statesboro, Georgia Multiple Grant Fund
Schedule of Revenues, Expenditures and
For the Year Ended June 30, 2021Changes in Fund Balance - Budget and Actual
84
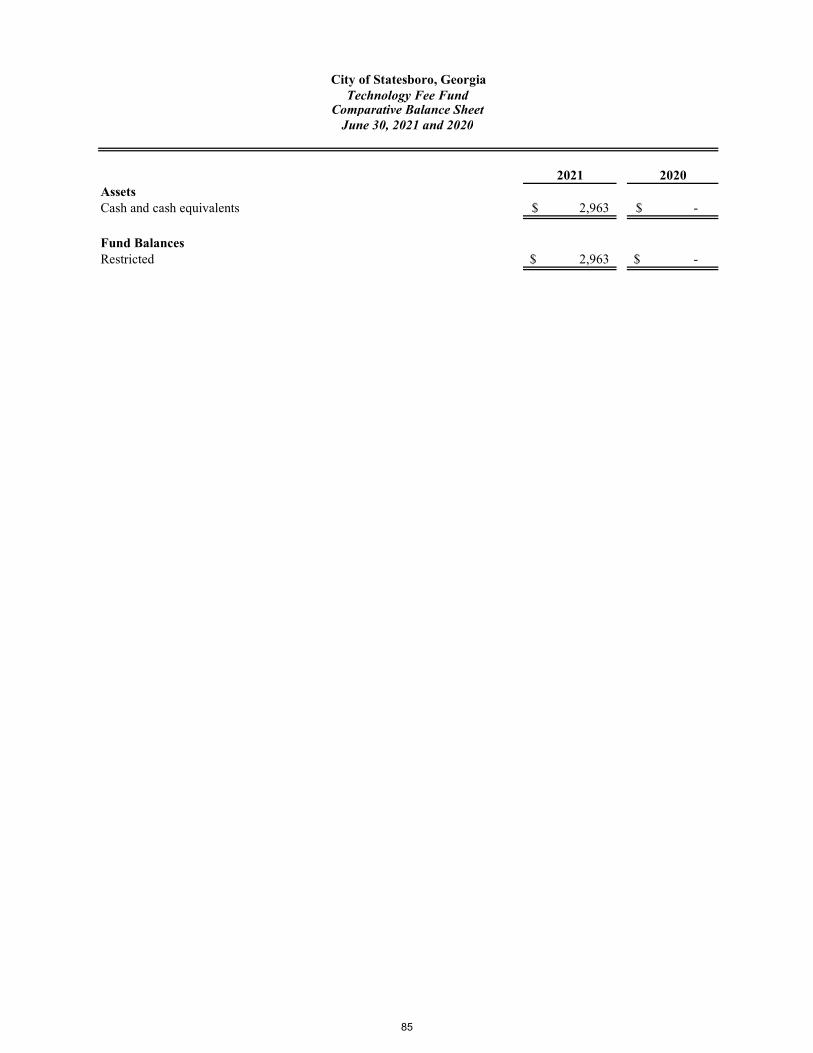
2021 2020AssetsCash and cash equivalents 2,963$ -$
Fund BalancesRestricted 2,963$ -$
City of Statesboro, GeorgiaTechnology Fee Fund
Comparative Balance SheetJune 30, 2021 and 2020
85

2020
VarianceOriginal Final Positive Budget Budget Actual (Negative) Actual
RevenuesFines and forfeitures 60,000$ 60,000$ 62,963$ 2,963$ 62,803$
ExpendituresPublic safety - 60,000 60,000 - 77,433
Net Change in Fund Balances $ 60,000 $ - 2,963 $ 2,963 (14,630)
Fund Balances Beginning of Year - 14,630
Fund Balances End of Year 2,963$ -$
2021
City of Statesboro, GeorgiaTechnology Fee Fund
Schedule of Revenues, Expenditures and
For the Year Ended June 30, 2021(With Comparative Actual Amounts for the Year Ended June 30, 2020)
Changes in Fund Balance - Budget and Actual
86

2021 2020AssetsCash and cash equivalents 939,878$ 559,071$ Interfund receivable - 147,364
Total Assets 939,878$ 706,435$
Fund BalancesRestricted 939,878$ 706,435$
City of Statesboro, GeorgiaSouth Main Tax Allocation District Fund
Comparative Balance Sheet June 30, 2021 and 2020
87

2020
VarianceOriginal Final PositiveBudget Budget Actual (Negative) Actual
RevenuesProperty taxes 268,700$ 268,700$ 303,529$ 34,829$ 278,248$ Investment earnings - - 67 67 42
Total Revenues 268,700 268,700 303,596 34,896 278,290
ExpendituresCommunity development - 185,000 70,153 114,847 -
Net Change in Fund Balances $ 268,700 $ 83,700 233,443 $ 149,743 278,290
Fund Balances Beginning of Year 706,435 428,145
Fund Balances End of Year 939,878$ 706,435$
2021
City of Statesboro, GeorgiaSouth Main Tax Allocation District FundSchedule of Revenues, Expenditures and
For the Year Ended June 30, 2021(With Comparative Actual Amounts for the Year Ended June 30, 2020)
Changes in Fund Balance - Budget and Actual
88

2021 2020AssetsCash and cash equivalents -$ 1,483,971$ Interfund receivable 18,175 -
Total Assets 18,175$ 1,483,971$
Fund BalancesRestricted 18,175$ 1,483,971$
City of Statesboro, GeorgiaOld Register Tax Allocation District Fund
Comparative Balance SheetJune 30, 2021 and 2020
89
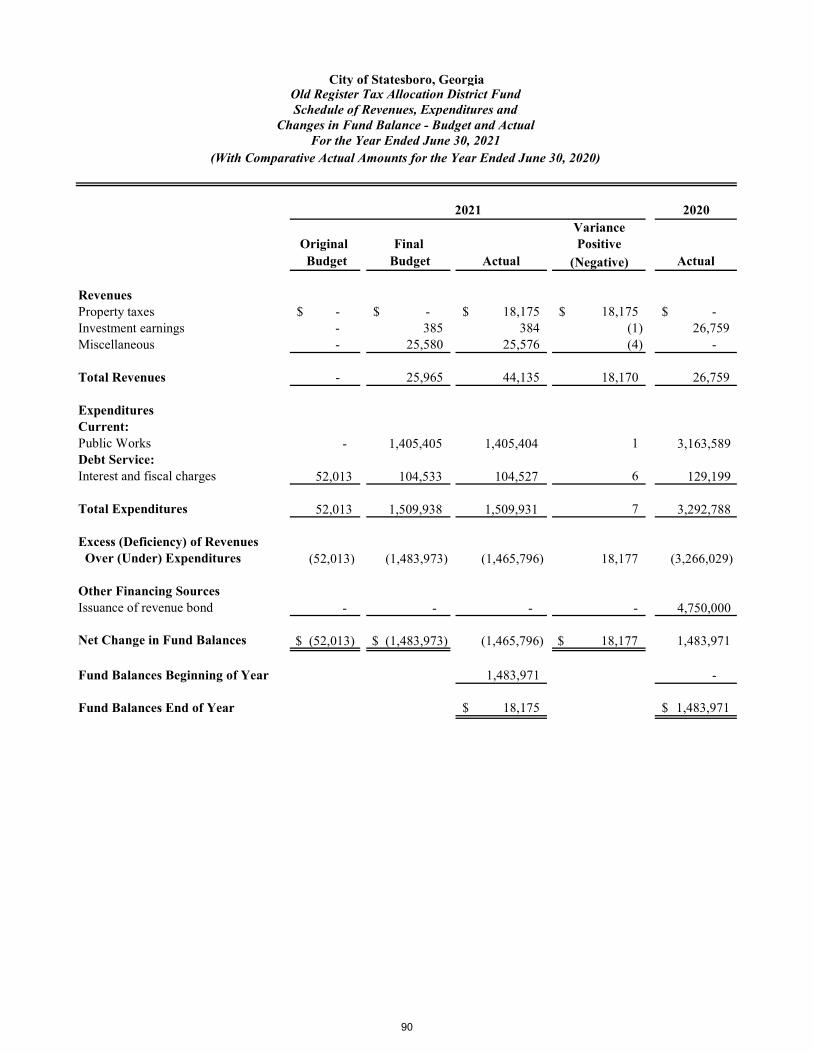
2020Variance
Original Final Positive Budget Budget Actual (Negative) Actual
RevenuesProperty taxes -$ -$ 18,175$ 18,175$ -$ Investment earnings - 385 384 (1) 26,759 Miscellaneous - 25,580 25,576 (4) -
Total Revenues - 25,965 44,135 18,170 26,759
ExpendituresCurrent:Public Works - 1,405,405 1,405,404 1 3,163,589 Debt Service:Interest and fiscal charges 52,013 104,533 104,527 6 129,199
Total Expenditures 52,013 1,509,938 1,509,931 7 3,292,788
Excess (Deficiency) of Revenues Over (Under) Expenditures (52,013) (1,483,973) (1,465,796) 18,177 (3,266,029)
Other Financing SourcesIssuance of revenue bond - - - - 4,750,000
Net Change in Fund Balances $ (52,013) $ (1,483,973) (1,465,796) $ 18,177 1,483,971
Fund Balances Beginning of Year 1,483,971 -
Fund Balances End of Year 18,175$ 1,483,971$
2021
City of Statesboro, GeorgiaOld Register Tax Allocation District FundSchedule of Revenues, Expenditures and
Changes in Fund Balance - Budget and ActualFor the Year Ended June 30, 2021
(With Comparative Actual Amounts for the Year Ended June 30, 2020)
90

Major Enterprise Funds

2021 2020AssetsCurrent Assets: Cash and cash equivalents 8,450,413$ 7,021,908$ Certificates of deposit 125,000 204,964 Receivables: Accounts 524,446 669,905 Unbilled accounts 1,436,307 1,115,529 Materials and supplies inventory 282,831 308,605 Prepaid items 12,430 11,444 Restricted assets - Cash and cash equivalents 508,952 484,665
Total Current Assets 11,340,379 9,817,020
Noncurrent Assets: Restricted Assets: Cash and cash equivalents 1,834,470 1,745,267
Capital Assets: Land 352,981 352,981 Buildings 1,202,241 1,202,241 Improvements other than buildings 83,822,080 81,938,495 Machinery and equipment 7,997,902 7,910,551 Less accumulated depreciation (44,085,414) (41,990,143) Construction in progress 418,647 1,793,650
Total Capital Assets 49,708,437 51,207,775
Total Noncurrent Assets 51,542,907 52,953,042
Total Assets 62,883,286 62,770,062
Deferred Outflows of Resources Resources related to pensions 380,832 111,065 Resources related to other post employment benefits 229,388 168,978
Total Deferred Outflows of Resources 610,220 280,043
LiabilitiesCurrent Liabilities: Accounts payable 203,663 151,353 Accrued payroll 101,923 103,280 Accrued interest payable 54,206 58,777 Current portion of revenue bonds payable 878,000 858,000 Customer deposits 508,952 484,961 Compensated absences payable 25,045 29,522
Total Current Liabilities 1,771,789 1,685,893
Long-Term Liabilities: Net pension obligation 1,447,116 1,193,711 Compensated absences payable (net of current portion) 100,181 118,090 Other post employment benefits payable 1,168,220 1,165,582 Revenue bonds payable, net of unamortized premium (net of current portion) 9,254,000 10,132,000
Total Long-Term Liabilites 11,969,517 12,609,383
Total Liabilities 13,741,306 14,295,276
Deferred Inflows of Resources Unamortized premium on refunded bonds 147,758 160,333 Resources related to pensions 90,193 108,934 Resources related to other post employment benefits 185,386 97,946
Total Deferred Inflows of Resources 423,337 367,213
Net PositionNet investment in capital assets 39,576,437 40,217,775 Unrestricted 9,752,426 8,169,841
Total Net Position 49,328,863$ 48,387,616$
Comparative Statement of Net Position
City of Statesboro, Georgia
June 30, 2021 and 2020
Water and Sewer Operating Fund
91

Comparative Statement of Revenues,Expenses and Changes in Fund Net PositionFor the Years Ended June 30, 2021 and 2020
2021 2020Operating Revenues Water sales 4,983,038$ 4,788,286$ Reclaimed water sales 52,932 53,064 Sewer charges 5,101,862 4,928,628 Penalties 107,098 102,975 Reconnecting charges 250,686 227,652 Service fees 131,830 375,926 Tap fees 223,210 205,018 Rental income 260,024 249,044 Miscellaneous 7,487 20
Total Operating Revenues 11,118,167 10,930,613
Operating ExpensesSalaries 1,964,670 2,171,516 Employee benefits 849,829 2,318,390 Purchased services: Training 17,946 14,911 Dues and certification 11,858 4,520 Repairs and maintenance 350,817 487,522 Inspections 71,829 74,569 Contracted services 65,277 167,174 Laboratory services 31,922 20,538 Electricity 729,204 789,852 Telephone 77,047 76,238 Insurance 111,965 104,623 Equipment rental 4,149 5,788 Engineering fees 19,733 23,917 Tippage fees 225,897 274,714 Travel 10,394 12,416 Advertising 2,164 2,014 Postage 1,622 5,908 Enforcement monitoring - 778 Materials and supplies: Uniforms 19,596 22,582 Materials and supplies 291,185 286,749 Chemicals 134,171 136,493 Gasoline, oil, etc. 55,643 57,076 Small equipment 33,549 109,717 Indirect cost allocation 1,140,784 917,750 Depreciation 2,124,755 2,122,823 Bad debts 80,283 45,437 Other 20,798 5,115
Total Operating Expenses 8,447,087 10,259,130
Operating Income 2,671,080 671,483
Non-Operating Revenues (Expenses) Investment earnings 1,036 8,315 Gain (loss) on sale of capital assets 18,851 20,043 Bond issuance costs - (159,569) Interest expense (218,002) (464,713)
Total Non-Operating Revenues (Expenses) (198,115) (595,924)
Income Before Capital Contributions and Transfers 2,472,965 75,559
Capital contributions/grants 148,414 81,797 Transfers in 47,404 667,154 Transfers out (1,727,536) (1,695,819)
Change in Net Position 941,247 (871,309)
Net Position Beginning of Year 48,387,616 49,258,925
Net Position End of Year 49,328,863$ 48,387,616$
City of Statesboro, GeorgiaWater and Sewer Operating Fund
92

2021 2020AssetsCurrent Assets: Cash and cash equivalents 4,060,752$ 3,647,462$ Certificates of deposit 125,000 - Receivables: Accounts 149,125 154,875 Unbilled accounts 474,011 337,633 Inventory 131,632 136,451 Prepaid items 7,545 8,347 Restricted assets - Cash and cash equivalents 101,595 96,505
Total Current Assets 5,049,660 4,381,273
Noncurrent Assets: Capital Assets: Land 78,004 78,004 Buildings 317,389 317,389 Improvements other than buildings 8,126,442 8,004,573 Machinery and equipment 863,417 863,417 Less accumulated depreciation (4,384,014) (4,132,661) Construction in progress 207,429 85,493
Total Capital Assets 5,208,667 5,216,215
Total Assets 10,258,327 9,597,488
Deferred Outflows of Resources Resources related to pensions 65,081 15,287 Resources related to other post employment benefits 43,209 32,058
Total Deferred Outflows of Resources 108,290 47,345
LiabilitiesCurrent Liabilities: Accounts payable 156,564 112,436 Accrued payroll 21,713 22,684 Accrued interest payable 243 478 Compensated absences payable 7,806 8,690 Sales tax payable 42,519 30,379 Customer deposits 101,595 96,505 Notes payable 32,720 31,757
Total Current Liabilities 363,160 302,929
Long-Term Liabilities: Net pension obligation 226,728 179,955 Compensated absences payable (net of current portion) 31,223 34,760 Other post employment benefits payable 207,873 207,386 Notes payable (net of current portion) - 32,720
Total Long-Term Liabilities 465,824 454,821
Total Liabilities 828,984 757,750
Deferred Inflows of Resources Resources related to pensions 22,564 26,022 Resources related to other post employment benefits 32,714 16,574
Total Deferred Inflows of Resources 55,278 42,596
Net PositionNet investment in capital assets 5,175,947 5,151,738 Unrestricted 4,306,408 3,692,749
Total Net Position 9,482,355$ 8,844,487$
Comparative Statement of Net Position
City of Statesboro, Georgia
June 30, 2021 and 2020
Gas Operating Fund
93
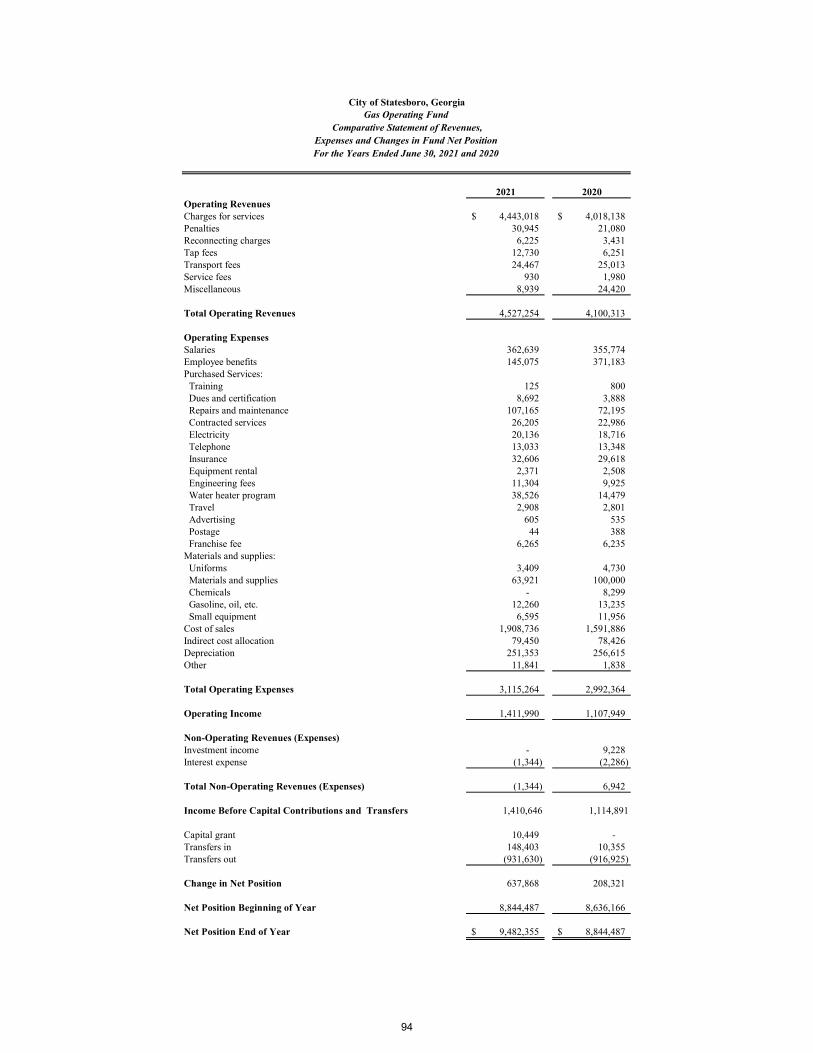
Comparative Statement of Revenues,Expenses and Changes in Fund Net PositionFor the Years Ended June 30, 2021 and 2020
2021 2020Operating RevenuesCharges for services 4,443,018$ 4,018,138$ Penalties 30,945 21,080 Reconnecting charges 6,225 3,431 Tap fees 12,730 6,251 Transport fees 24,467 25,013 Service fees 930 1,980 Miscellaneous 8,939 24,420
Total Operating Revenues 4,527,254 4,100,313
Operating ExpensesSalaries 362,639 355,774 Employee benefits 145,075 371,183 Purchased Services: Training 125 800 Dues and certification 8,692 3,888 Repairs and maintenance 107,165 72,195 Contracted services 26,205 22,986 Electricity 20,136 18,716 Telephone 13,033 13,348 Insurance 32,606 29,618 Equipment rental 2,371 2,508 Engineering fees 11,304 9,925 Water heater program 38,526 14,479 Travel 2,908 2,801 Advertising 605 535 Postage 44 388 Franchise fee 6,265 6,235 Materials and supplies: Uniforms 3,409 4,730 Materials and supplies 63,921 100,000 Chemicals - 8,299 Gasoline, oil, etc. 12,260 13,235 Small equipment 6,595 11,956 Cost of sales 1,908,736 1,591,886 Indirect cost allocation 79,450 78,426 Depreciation 251,353 256,615 Other 11,841 1,838
Total Operating Expenses 3,115,264 2,992,364
Operating Income 1,411,990 1,107,949
Non-Operating Revenues (Expenses)Investment income - 9,228 Interest expense (1,344) (2,286)
Total Non-Operating Revenues (Expenses) (1,344) 6,942
Income Before Capital Contributions and Transfers 1,410,646 1,114,891
Capital grant 10,449 - Transfers in 148,403 10,355 Transfers out (931,630) (916,925)
Change in Net Position 637,868 208,321
Net Position Beginning of Year 8,844,487 8,636,166
Net Position End of Year 9,482,355$ 8,844,487$
City of Statesboro, GeorgiaGas Operating Fund
94

2021 2020AssetsCurrent Assets: Cash and cash equivalents 3,221,793$ 2,326,480$ Receivables: Accounts 238,039 248,473 Unbilled accounts 384,382 374,107 Prepaid items 9,203 8,271 Restricted assets - Cash and cash equivalents 192,529 178,895
Total Current Assets 4,045,946 3,136,226
Noncurrent Assets: Capital Assets: Buildings 483,020 483,020 Machinery and equipment 5,071,682 5,172,667 Less accumulated depreciation (4,383,211) (4,419,021)
Total Capital Assets 1,171,491 1,236,666
Total Assets 5,217,437 4,372,892
Deferred Outflows of Resources Resources related to pensions 121,932 25,266 Resources related to other post employment benefits 75,143 53,496
Total Deferred Outflows of Resources 197,075 78,762
LiabilitiesCurrent Liabilities Accounts payable 42,453 13,273 Accrued payroll 36,660 26,885 Compensated absences payable 9,209 9,724 Customer deposits 192,529 178,895
Total Current Liabilities 280,851 228,777
Long-Term Liabilities: Net pension obligation 440,496 349,693 Compensated absences payable (net of current portion) 36,838 38,895 Other post employment benefits payable 333,674 332,729
Total Long-Term Liabilities 811,008 721,317
Total Liabilities 1,091,859 950,094
Deferred Inflows of Resources Resources related to pensions 28,257 34,972 Resources related to other post employment benefits 61,665 30,332
Total Deferred Inflows of Resources 89,922 65,304
Net PositionNet investment in capital assets 1,171,491 1,236,666 Unrestricted 3,061,240 2,199,590
Total Net Position 4,232,731$ 3,436,256$
Comparative Statement of Net Position
City of Statesboro, Georgia
June 30, 2021 and 2020
Solid Waste Collection Fund
95

Comparative Statement of Revenues,Expenses and Changes in Fund Net PositionFor the Years Ended June 30, 2021 and 2020
2021 2020Operating RevenuesSanitation charges 4,619,545$ 4,423,134$ Penalties 63,294 55,432 Miscellaneous 10,806 8,372
Total Operating Revenues 4,693,645 4,486,938
Operating ExpensesSalaries 704,000 705,487 Employee benefits 312,676 699,997 Purchases services: Training 798 325 Dues and certification 1,281 1,388 Repairs and maintenance 397,867 386,838 Contracted services 2,910 2,480 Electricity 8,570 8,416 Telephone 18,467 16,906 Insurance 55,080 53,509 Tippage fees 1,148,292 847,739 Travel - 1,208 Advertising 80 1,130 Postage - 110 Materials and supplies: Uniforms 9,428 9,067 Materials and supplies 75,278 157,728 Gasoline, oil, etc. 98,310 86,840 Chemicals 2,329 3,394 Indirect cost allocation 174,425 163,895 Depreciation 375,874 380,554 Bad debts 23,108 9,218 Other 5,963 8,383
Total Operating Expenses 3,414,736 3,544,612
Operating Income 1,278,909 942,326
Non-Operating Revenues (Expenses)Investment earnings - 2,216
Total Non-Operating Revenues (Expenses) - 2,216
Income Before Capital Contributions and Transfers 1,278,909 944,542
Capital grant 22,372 - Transfer in 310,699 - Transfers out (815,505) (898,920)
Change in Net Position 796,475 45,622
Net Position Beginning of Year 3,436,256 3,390,634
Net Position End of Year 4,232,731$ 3,436,256$
City of Statesboro, GeorgiaSolid Waste Collection Fund
96

2021 2020AssetsCurrent Assets: Cash and cash equivalents 1,075,882$ 904,842$ Receivables: Accounts 18,412 62,768 Intergovernmental - 2,017 Unbilled accounts 224,381 213,880 Interfund 217,257 532,522 Prepaid items 3,616 2,294
Total Current Assets 1,539,548 1,718,323
Noncurrent Assets: Capital Assets: Land 123,425 123,425 Buildings 1,441,390 1,441,390 Improvements other than buildings 309,857 309,857 Infrastructure 225,697 225,697 Machinery and equipment 2,357,731 2,219,936 Less accumulated depreciation (2,847,824) (2,788,054)
Total Capital Assets 1,610,276 1,532,251
Total Assets 3,149,824 3,250,574
Deferred Outflows of Resources Resources related to pensions 52,660 14,842 Resources related to other post employment benefits 30,778 22,309
Total Deferred Outflows of Resources 83,438 37,151
LiabilitiesCurrent Liabilities: Accounts payable 191,730 217,983 Accrued payroll 14,323 14,823 Compensated absences payable 4,207 4,625 Landfill postclosure care costs 179,683 167,000
Total Current Liabilities 389,943 404,431
Long-Term Liabilities: Net pension obligation 198,875 163,351 Compensated absences payable 16,826 18,499 Other post employment benefits payable 151,108 150,738 Landfill postclosure care costs (net of current portion) 1,610,317 1,326,485
Total Long-Term Liabilities 1,977,126 1,659,073
Total Liabilities 2,367,069 2,063,504
Deferred Inflows of Resources Resources related to pensions 10,690 13,317 Resources related to other post employment benefits 23,851 11,593
Deferred Inflows of Resources 34,541 24,910
Net PositionNet investment in capital assets 1,610,276 1,532,251 Unrestricted (778,624) (332,940)
Total Net Position 831,652$ 1,199,311$
Comparative Statement of Net Position
City of Statesboro, Georgia
June 30, 2021 and 2020
Solid Waste Disposal Fund
97
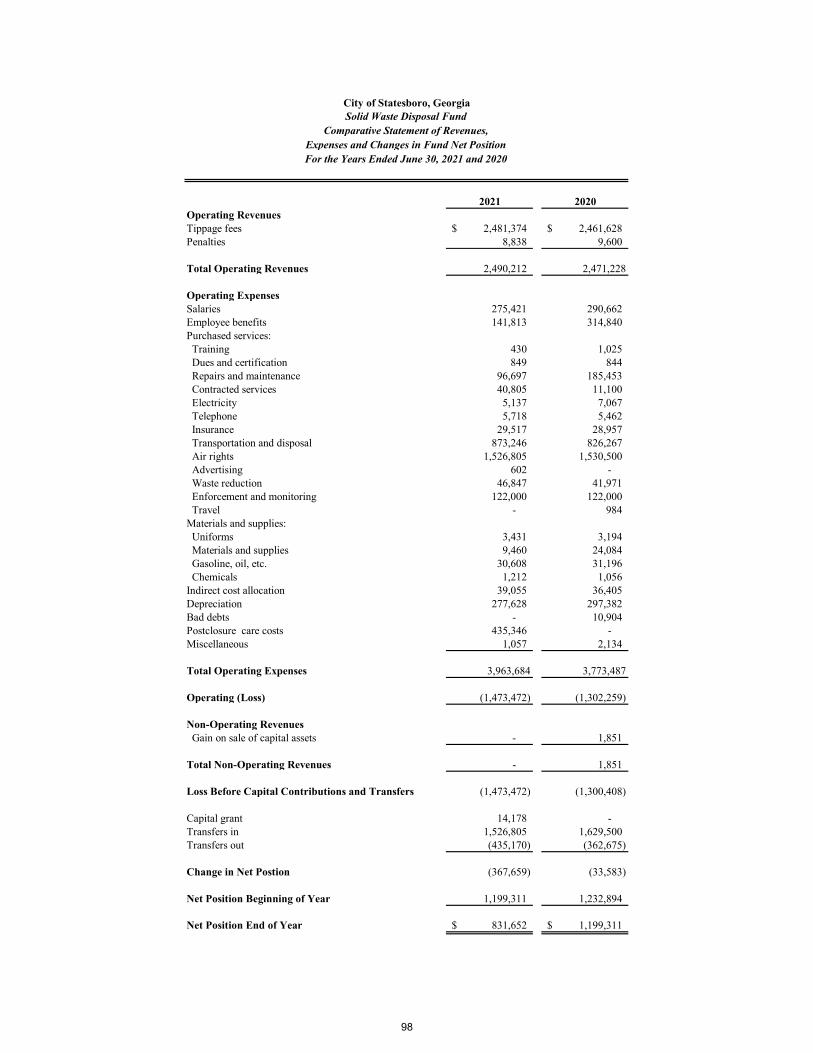
Comparative Statement of Revenues,Expenses and Changes in Fund Net PositionFor the Years Ended June 30, 2021 and 2020
2021 2020Operating RevenuesTippage fees 2,481,374$ 2,461,628$ Penalties 8,838 9,600
Total Operating Revenues 2,490,212 2,471,228
Operating ExpensesSalaries 275,421 290,662 Employee benefits 141,813 314,840 Purchased services: Training 430 1,025 Dues and certification 849 844 Repairs and maintenance 96,697 185,453 Contracted services 40,805 11,100 Electricity 5,137 7,067 Telephone 5,718 5,462 Insurance 29,517 28,957 Transportation and disposal 873,246 826,267 Air rights 1,526,805 1,530,500 Advertising 602 - Waste reduction 46,847 41,971 Enforcement and monitoring 122,000 122,000 Travel - 984 Materials and supplies: Uniforms 3,431 3,194 Materials and supplies 9,460 24,084 Gasoline, oil, etc. 30,608 31,196 Chemicals 1,212 1,056 Indirect cost allocation 39,055 36,405 Depreciation 277,628 297,382 Bad debts - 10,904 Postclosure care costs 435,346 - Miscellaneous 1,057 2,134
Total Operating Expenses 3,963,684 3,773,487
Operating (Loss) (1,473,472) (1,302,259)
Non-Operating Revenues Gain on sale of capital assets - 1,851
Total Non-Operating Revenues - 1,851
Loss Before Capital Contributions and Transfers (1,473,472) (1,300,408)
Capital grant 14,178 - Transfers in 1,526,805 1,629,500 Transfers out (435,170) (362,675)
Change in Net Postion (367,659) (33,583)
Net Position Beginning of Year 1,199,311 1,232,894
Net Position End of Year 831,652$ 1,199,311$
City of Statesboro, GeorgiaSolid Waste Disposal Fund
98

Nonmajor Enterprise Funds

2021 2020AssetsCurrent Assets: Cash and cash equivalents 471,198$ 121,605$ Receivables Accounts 50,352 42,393 Unbilled accounts 107,926 84,343 Inventory 14,553 9,674 Prepaid items 2,670 2,068
Total Current Assets 646,699 260,083
Noncurrent Assets: Capital Assets: Land 19,703 19,703 Buildings 155,611 155,611 Improvements other than buildings 1,369,821 1,369,821 Machinery and equipment 1,932,487 1,896,221 Less accumulated depreciation (1,421,001) (1,276,305) Construction in progress 1,302,013 657,644
Total Capital Assets 3,358,634 2,822,695
Total Assets 4,005,333 3,082,778
Deferred Outflows of Resources Resources related to pensions 53,715 9,108 Resources related to other post employment benefits 34,117 24,128
Deferred Outflows of Resources 87,832 33,236
LiabilitiesCurrent Liabilities: Accounts payable 12,307 5,410 Accrued payroll 15,677 14,668 Compensated absences payable 3,326 3,619 Capital leases payable 210,069 167,319
Total Current Liabilities 241,379 191,016
Long-Term Liabilities: Net pension obligation 234,035 192,134 Compensated absences payable (net of current portion) 13,304 14,475 Capital leases payable (net of current portion) 238,020 234,338 Other post employment benefits payable 98,295 97,859 Notes payable (net of current portion) 6,354 6,354
Total Long-Term Liabilities 590,008 545,160
Total Liabilities 831,387 736,176
Deferred Inflows of Resources Resources related to pensions 829 3,927 Resources related to other post employment benefits 28,351 13,892
Total Deferred Inflows of Resources 29,180 17,819
Net PositionNet investment in capital assets 2,904,191 2,414,684Unrestricted 328,407 (52,665)
Total Net Position 3,232,598$ 2,362,019$
City of Statesboro, GeorgiaStormwater Operating Fund
Comparative Statement of Net Position
June 30, 2021 and 2020
99

2021 2020Operating RevenuesCharges for services 1,308,587$ 1,021,805$ Penalties 13,447 8,962
Total Operating Revenues 1,322,034 1,030,767
Operating ExpensesSalaries 324,866 325,679Employee benefits 141,426 342,542Purchased Services: Training 523 919 Dues and certification 1,608 1,480 Repairs and maintenance 79,656 59,816 Contracted services 21,418 12,009 Electricity 1,624 1,334 Telephone 6,612 6,411 Insurance 20,000 18,127 Tippage fees 10,863 7,292 Travel 304 923 Advertising 652 290Materials and supplies: Uniforms 2,589 1,798 Materials and supplies 3,058 26,518 Gasoline, oil, etc. 17,591 17,630 Small equipment 1,467 6,145Indirect cost allocation 74,105 69,600Depreciation 193,805 189,296Bad debts 4,727 4,598Other 1,626 899
Total Operating Expenses 908,520 1,093,306
Operating Income (Loss) 413,514 (62,539)
Non-Operating Revenues (Expenses)Gain on sale of assets 16,200 -Debt issuance costs - (155,590)Interest expense (71) (109)
Total Non-Operating Revenues (Expenses) 16,129 (155,699)
Income (Loss) before Capital Contributions and Transfers 429,643 (218,238)
Capital gramts 382,046 403,930Transfers in 145,520 186,515Transfers out (86,630) (71,915)
Change in Net Position 870,579 300,292
Net Position Beginning of Year 2,362,019 2,061,727
Net Position End of Year 3,232,598$ 2,362,019$
Expenses and Changes in Fund Net Position
For the Years Ended June 30, 2021 and 2020
City of Statesboro, GeorgiaStormwater Operating Fund
Comparative Statement of Revenues,
100

Internal Service Funds

Health Fleet Wellness CentralInsurance Management Program Services Total
AssetsCurrent Assets: Cash and cash equivalents 593,068$ 89,003$ 33,836$ 118,550$ 834,457$ Accounts receivable 105,808 - - - 105,808 Interfund receivable - - - 78,655 78,655 Inventory - 160,900 - - 160,900 Prepaid items - 2,211 - 27,819 30,030
Total Current Assets 698,876 252,114 33,836 225,024 1,209,850
Noncurrent Assets: Capital Assets: Depreciable capital assets, net - 542,773 - 214,804 757,577
Total Noncurrent Assets - 542,773 - 214,804 757,577
Total Assets 698,876 794,887 33,836 439,828 1,967,427
Deferred Outflows of Resources Resources related to pensions - 50,168 - 55,557 105,725 Resources related to other post employment benefits - 34,184 - 35,279 69,463
Total Deferred Outflows of Resources - 84,352 - 90,836 175,188
LiabilitiesCurrent Liabilities: Accounts payable 79,208 77,081 3,076 86,500 245,865 Accrued payroll - 14,587 - 17,114 31,701 Claims payable 260,000 - - - 260,000 Compensated absences payable - 3,785 - 5,942 9,727 Capital lease payable - 10,045 - - 10,045
Total Current Liabilities 339,208 105,498 3,076 109,556 557,338
Long-Term Liabilities Net pension obligation - 173,148 - 213,531 386,679 Compensated absences payable (net of current portion) - 15,138 - 23,768 38,906 Other post employment benefits payable - 157,676 - 138,463 296,139
Total Long-Term Liabilities - 345,962 - 375,762 721,724
Total Liabilities 339,208 451,460 3,076 485,318 1,279,062
Deferred Inflows of Resources Resources related to pensions - 17,119 - 15,840 32,959 Resources related to other post employment benefits - 26,849 - 28,898 55,747
Total Deferred Inflows of Resources - 43,968 - 44,738 88,706
Net PositionNet investment in capital assets - 542,773 - 214,804 757,577 Unrestricted 359,668 (158,962) 30,760 (214,196) 17,270
Total Net Position 359,668$ 383,811$ 30,760$ 608$ 774,847$
City of Statesboro, GeorgiaCombining Statement of Net Position
Internal Service FundsFor the Year Ended June 30, 2021
101
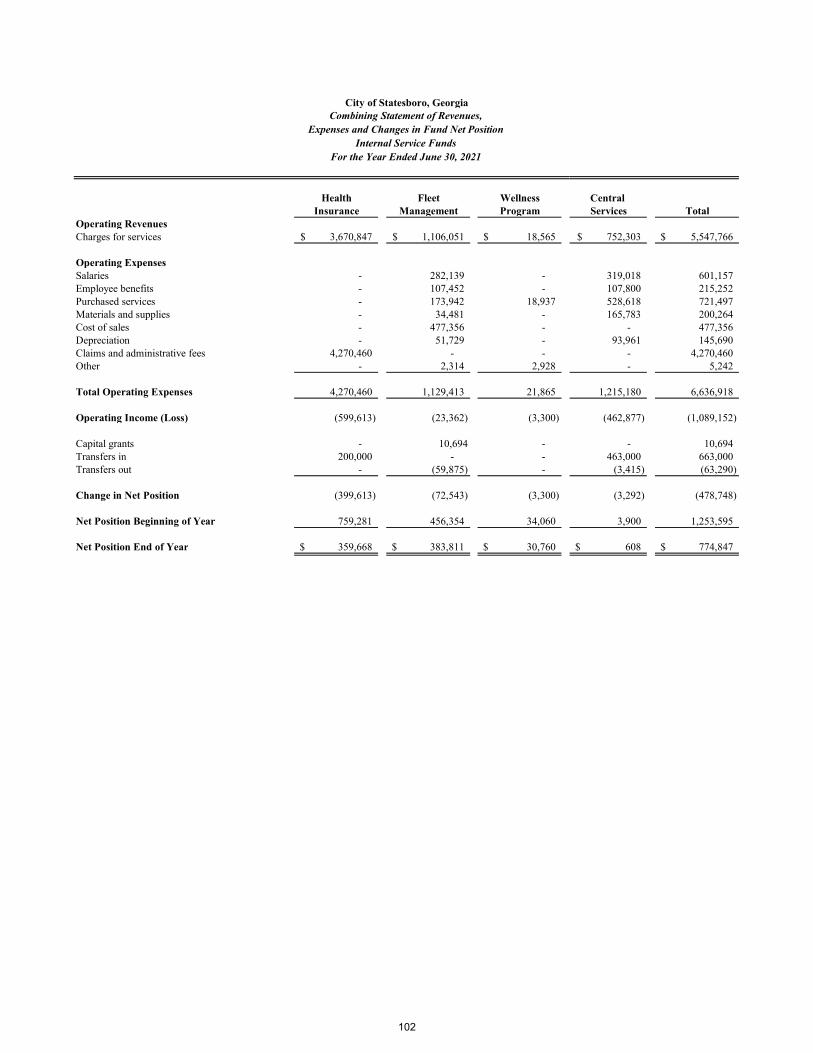
Health Fleet Wellness Central Insurance Management Program Services Total
Operating RevenuesCharges for services 3,670,847$ 1,106,051$ 18,565$ 752,303$ 5,547,766$
Operating ExpensesSalaries - 282,139 - 319,018 601,157 Employee benefits - 107,452 - 107,800 215,252 Purchased services - 173,942 18,937 528,618 721,497 Materials and supplies - 34,481 - 165,783 200,264 Cost of sales - 477,356 - - 477,356 Depreciation - 51,729 - 93,961 145,690 Claims and administrative fees 4,270,460 - - - 4,270,460 Other - 2,314 2,928 - 5,242
Total Operating Expenses 4,270,460 1,129,413 21,865 1,215,180 6,636,918
Operating Income (Loss) (599,613) (23,362) (3,300) (462,877) (1,089,152)
Capital grants - 10,694 - - 10,694 Transfers in 200,000 - - 463,000 663,000 Transfers out - (59,875) - (3,415) (63,290)
Change in Net Position (399,613) (72,543) (3,300) (3,292) (478,748)
Net Position Beginning of Year 759,281 456,354 34,060 3,900 1,253,595
Net Position End of Year 359,668$ 383,811$ 30,760$ 608$ 774,847$
City of Statesboro, GeorgiaCombining Statement of Revenues,
Expenses and Changes in Fund Net Position
For the Year Ended June 30, 2021Internal Service Funds
102

Health Fleet Wellness Central Insurance Management Program Services Total
Cash Flows from Operating Activities Cash received from customers 3,670,847$ 1,106,051$ 18,565$ 752,303$ 5,547,766$ Cash payments to employees for services - (389,717) - (424,667) (814,384) Cash payments for goods and services - (671,564) (19,622) (636,545) (1,327,731) Cash payments for claims and administrative fees (4,215,519) - - - (4,215,519)
Net Cash Provided by (Used in) Operating Activities (544,672) 44,770 (1,057) (308,909) (809,868)
Cash Flows from Noncapital Financing Activities Advances from (to) other funds - - - (27,124) (27,124) Transfers in (out) 200,000 (59,875) - 459,585 599,710
Net Cash Provided by (Used in) Noncapital Financing Activities 200,000 (59,875) - 432,461 572,586
Cash Flows from Capital and Related Financing Activities Capital grants - 10,694 - - 10,694 Payments for capital acquisitions - - - (23,652) (23,652) Payments on capital lease - (5,022) - - (5,022)
Net Cash Provided by (Used in) Capital and Related - 5,672 - (23,652) (17,980) Financing Activities
Net Increase (Decrease) in Cash and Cash Equivalents (344,672) (9,433) (1,057) 99,900 (255,262)
Cash and Cash Equivalents Beginning of Year 937,740 98,436 34,893 18,650 1,089,719
Cash and Cash Equivalents End of Year 593,068$ 89,003$ 33,836$ 118,550$ 834,457$
City of Statesboro, GeorgiaCombining Statement of Cash Flows
Internal Service FundsFor the Year Ended June 30, 2021
103
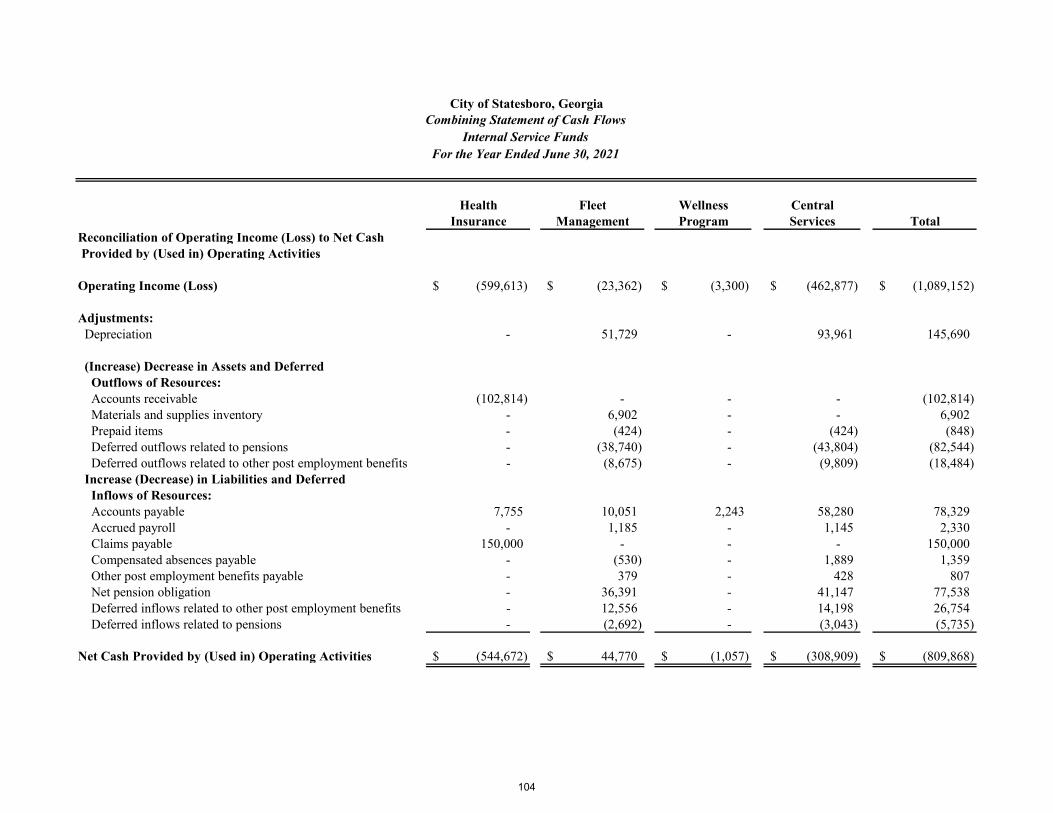
Health Fleet Wellness CentralInsurance Management Program Services Total
Reconciliation of Operating Income (Loss) to Net Cash Provided by (Used in) Operating Activities
Operating Income (Loss) (599,613)$ (23,362)$ (3,300)$ (462,877)$ (1,089,152)$
Adjustments: Depreciation - 51,729 - 93,961 145,690
(Increase) Decrease in Assets and Deferred Outflows of Resources: Accounts receivable (102,814) - - - (102,814) Materials and supplies inventory - 6,902 - - 6,902 Prepaid items - (424) - (424) (848) Deferred outflows related to pensions - (38,740) - (43,804) (82,544) Deferred outflows related to other post employment benefits - (8,675) - (9,809) (18,484) Increase (Decrease) in Liabilities and Deferred Inflows of Resources: Accounts payable 7,755 10,051 2,243 58,280 78,329 Accrued payroll - 1,185 - 1,145 2,330 Claims payable 150,000 - - - 150,000 Compensated absences payable - (530) - 1,889 1,359 Other post employment benefits payable - 379 - 428 807 Net pension obligation - 36,391 - 41,147 77,538 Deferred inflows related to other post employment benefits - 12,556 - 14,198 26,754 Deferred inflows related to pensions - (2,692) - (3,043) (5,735)
Net Cash Provided by (Used in) Operating Activities (544,672)$ 44,770$ (1,057)$ (308,909)$ (809,868)$
City of Statesboro, GeorgiaCombining Statement of Cash Flows
Internal Service FundsFor the Year Ended June 30, 2021
104

2021 2020AssetsCurrent Assets: Cash and cash equivalents 593,068$ 937,740$ Accounts receivable 105,808 2,994
Total Current Assets 698,876 940,734
LiabilitiesCurrent Liabilities: Accounts payable 79,208 71,453 Claims payable 260,000 110,000
Total Current Liabilities 339,208 181,453
Net Position Unrestricted 359,668$ 759,281$
Comparative Statement of Net Position
City of Statesboro, Georgia
June 30, 2021 and 2020
Health Insurance Fund
105
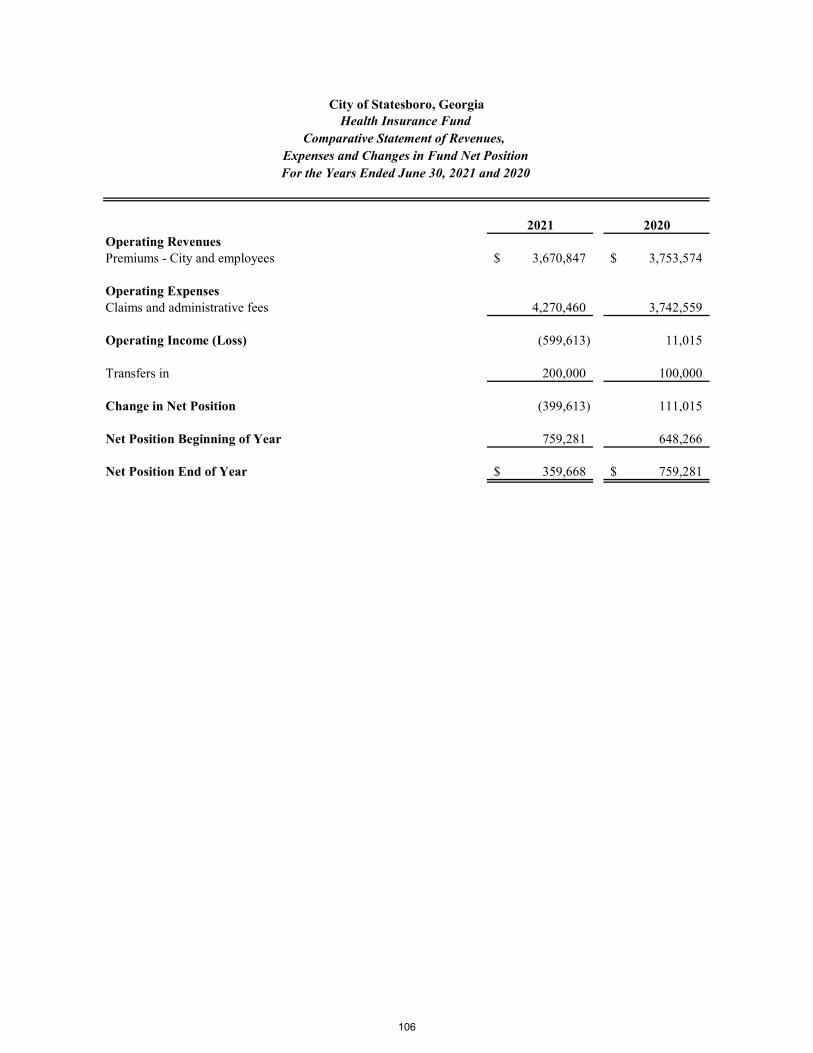
Comparative Statement of Revenues,
2021 2020Operating RevenuesPremiums - City and employees 3,670,847$ 3,753,574$
Operating ExpensesClaims and administrative fees 4,270,460 3,742,559
Operating Income (Loss) (599,613) 11,015
Transfers in 200,000 100,000
Change in Net Position (399,613) 111,015
Net Position Beginning of Year 759,281 648,266
Net Position End of Year 359,668$ 759,281$
City of Statesboro, GeorgiaHealth Insurance Fund
Expenses and Changes in Fund Net PositionFor the Years Ended June 30, 2021 and 2020
106

2021 2020AssetsCurrent Assets: Cash and cash equivalents 89,003$ 98,436$ Inventory 160,900 167,802 Prepaid items 2,211 1,787
Total Current Assets 252,114 268,025
Noncurrent Assets: Capital Assets: Buildings 555,295 555,295 Equipment 557,447 557,447 Less accumulated depreciation (569,969) (518,240)
Total Capital Assets 542,773 594,502
Total Assets 794,887 862,527
Deferred Outflows of Resources Resources related to pensions 50,168 11,428 Resources related to other post employment benefits 34,184 25,509
Total Deferred Outflows of Resources 84,352 36,937
LiabilitiesCurrent Liabilities: Accounts payable 77,081 67,030 Accrued payroll 14,587 13,402 Compensated absences payable 3,785 3,891 Capital lease payable 10,045 15,067
Total Current Liabilities 105,498 99,390
Long-Term Liabilities Net pension obligation 173,148 136,757 Compensated absences payable (net of current portion) 15,138 15,562 Other post employment benefits payable 157,676 157,297
Total Long-Term Liabilities 345,962 309,616
Total Liabilites 451,460 409,006
Deferred Inflows of Resources Resources related to pensions 17,119 19,811 Resources related to other post employment benefits 26,849 14,293
Total Deferred Inflows of Resources 43,968 34,104
Net PositionNet investment in capital assets 542,773 594,502 Unrestricted (158,962) (138,148)
Total Net Position 383,811$ 456,354$
City of Statesboro, GeorgiaFleet Management Fund
Comparative Statement of Net Position June 30, 2021 and 2020
107

Comparative Statement of Revenues,
2021 2020Operating RevenuesParts sales and labor charges 1,106,051$ 1,133,585$
Operating ExpensesSalaries 282,139 274,065 Employee benefits 107,452 281,028 Purchased services: Training 2,320 2,953 Dues and certification 828 957 Repairs and maintenance 21,697 21,932 Contracted services 111,060 149,156 Electricity 17,411 18,563 Telephone 3,056 3,068 Insurance 16,404 16,634 Equipment rental 1,166 1,108 Travel - 3,880 Materials and supplies: Uniforms 2,597 2,410 Materials and supplies 25,740 32,853 Gasoline, oil, etc. 6,144 8,018 Cost of sales 477,356 460,008 Depreciation 51,729 58,806 Other 2,314 2,221
Total Operating Expenses 1,129,413 1,337,660
Operating Income (Loss) (23,362) (204,075)
Capital grant 10,694 - Transfer in - 100,000 Transfers out (59,875) (45,765)
Change in Net Position (72,543) (149,840)
Net Position Beginning of Year 456,354 606,194
Net Position End of Year 383,811$ 456,354$
City of Statesboro, GeorgiaFleet Management Fund
Expenses and Changes in Fund Net PositionFor the Years Ended June 30, 2021 and 2020
108
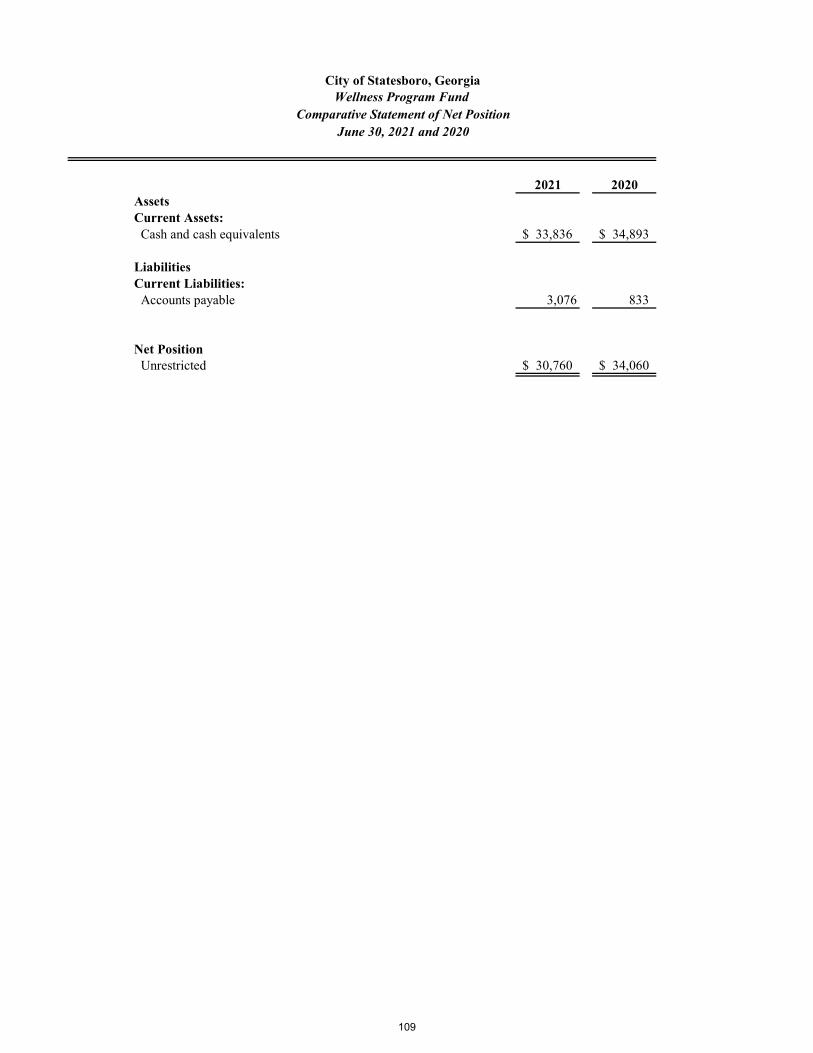
2021 2020AssetsCurrent Assets: Cash and cash equivalents 33,836$ 34,893$
LiabilitiesCurrent Liabilities: Accounts payable 3,076 833
Net Position Unrestricted 30,760$ 34,060$
City of Statesboro, GeorgiaWellness Program Fund
Comparative Statement of Net Position June 30, 2021 and 2020
109

Comparative Statement of Revenues, Expenses and Changes in Fund Net Position
2021 2020Operating RevenuesWellness dues 18,565$ 17,601$
Operating ExpensesPurchased services: Training 10,000 409 Repairs and maintenance 2,616 330 Electricity 6,321 6,718 Small equipment - 7,003 Other 2,928 -
Total Operating Expenses 21,865 14,460
Change in Net Position (3,300) 3,141
Net Position Beginning of Year 34,060 30,919
Net Position End of Year 30,760$ 34,060$
City of Statesboro, GeorgiaWellness Program Fund
For the Years Ended June 30, 2021 and 2020
110

2021 2020AssetsCurrent Assets: Cash and cash equivalents 118,550$ 18,650$ Prepaid items 27,819 27,395 Interfund receivable 78,655 51,531
Total Current Assets 225,024 97,576
Noncurrent Assets: Capital Assets: Improvements other than buildings 271,001 271,001 Machinery and equipment 401,614 377,962 Less accumulated depreciation (457,811) (363,850)
Total Capital Assets 214,804 285,113
Total Assets 439,828 382,689
Deferred Outflows of Resources Resources related to pensions 55,557 11,753 Resources related to other post employment benefits 35,279 25,470
Total Deferred Outflows of Resources 90,836 37,223
LiabilitiesCurrent Liabilities: Accounts payable 86,500 28,220 Accrued payroll 17,114 15,969 Compensated absences payable 5,942 5,564
Total Current Liabilities 109,556 49,753
Long-Term Liabilities Net pension obligation 213,531 172,384 Compensated absences payable (net of current portion) 23,768 22,257 Other post employment benefits payable 138,463 138,035
Total Long-Term Liabilities 375,762 332,676
Total Liabilites 485,318 382,429
Deferred Inflows of Resources Resources related to pensions 15,840 18,883 Resources related to other post employment benefits 28,898 14,700
Total Deferred Inflows of Resources 44,738 33,583
Net PositionNet investment in capital assets 214,804 285,113 Unrestricted (214,196) (281,213)
Total Net Position 608$ 3,900$
City of Statesboro, GeorgiaCentral Services Fund
Comparative Statement of Net Position June 30, 2021 and 2020
111
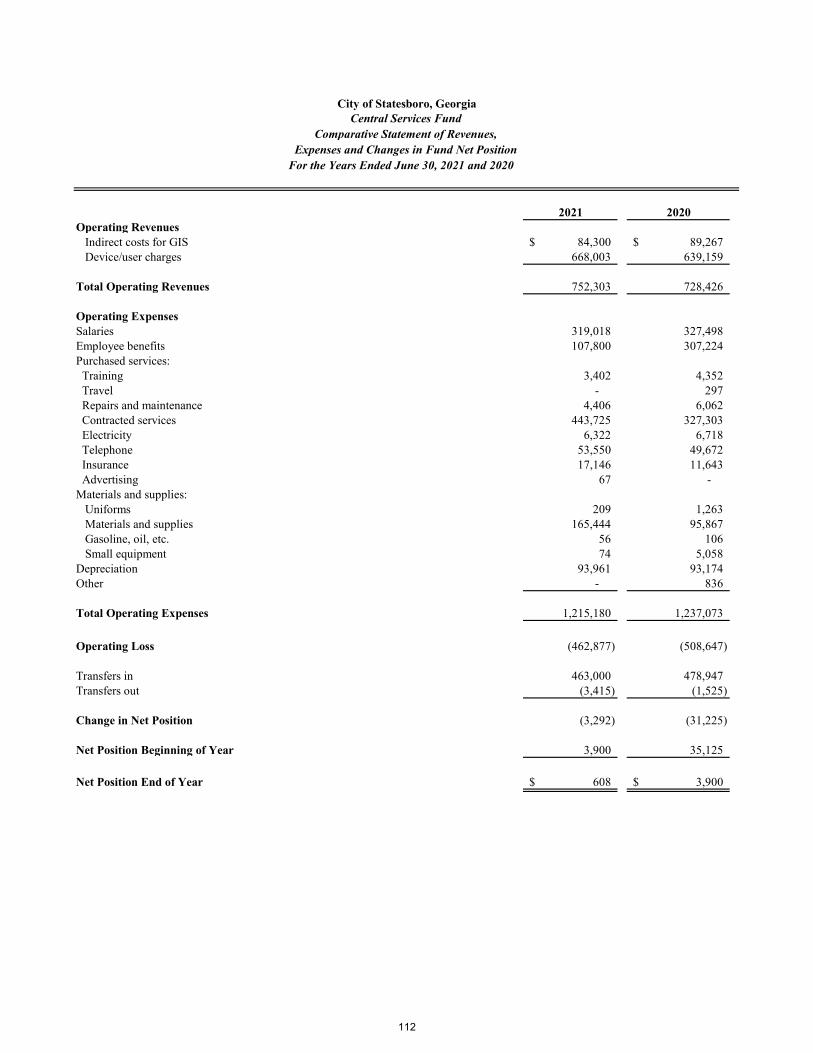
Comparative Statement of Revenues, Expenses and Changes in Fund Net Position
2021 2020Operating Revenues Indirect costs for GIS 84,300$ 89,267$ Device/user charges 668,003 639,159
Total Operating Revenues 752,303 728,426
Operating ExpensesSalaries 319,018 327,498 Employee benefits 107,800 307,224 Purchased services: Training 3,402 4,352 Travel - 297 Repairs and maintenance 4,406 6,062 Contracted services 443,725 327,303 Electricity 6,322 6,718 Telephone 53,550 49,672 Insurance 17,146 11,643 Advertising 67 - Materials and supplies: Uniforms 209 1,263 Materials and supplies 165,444 95,867 Gasoline, oil, etc. 56 106 Small equipment 74 5,058 Depreciation 93,961 93,174 Other - 836
Total Operating Expenses 1,215,180 1,237,073
Operating Loss (462,877) (508,647)
Transfers in 463,000 478,947 Transfers out (3,415) (1,525)
Change in Net Position (3,292) (31,225)
Net Position Beginning of Year 3,900 35,125
Net Position End of Year 608$ 3,900$
City of Statesboro, GeorgiaCentral Services Fund
For the Years Ended June 30, 2021 and 2020
112

Downtown Statesboro Development
Authority
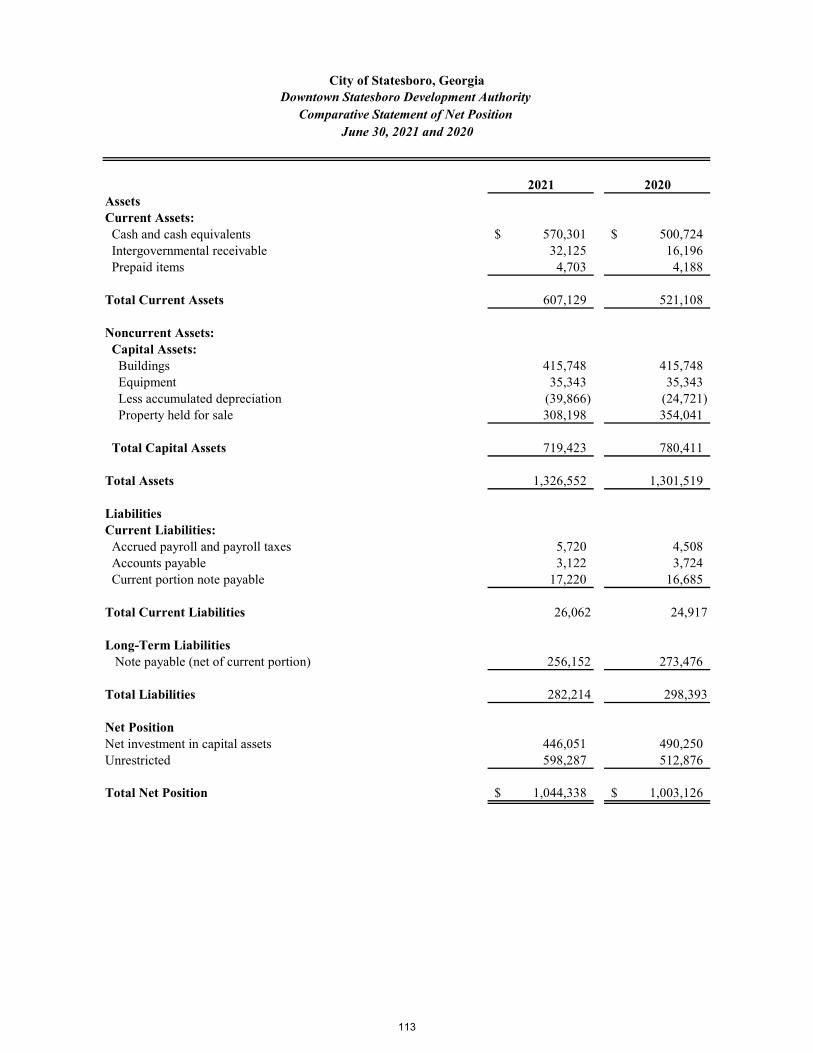
2021 2020AssetsCurrent Assets: Cash and cash equivalents 570,301$ 500,724$ Intergovernmental receivable 32,125 16,196 Prepaid items 4,703 4,188
Total Current Assets 607,129 521,108
Noncurrent Assets: Capital Assets: Buildings 415,748 415,748 Equipment 35,343 35,343 Less accumulated depreciation (39,866) (24,721) Property held for sale 308,198 354,041
Total Capital Assets 719,423 780,411
Total Assets 1,326,552 1,301,519
LiabilitiesCurrent Liabilities: Accrued payroll and payroll taxes 5,720 4,508 Accounts payable 3,122 3,724 Current portion note payable 17,220 16,685
Total Current Liabilities 26,062 24,917
Long-Term Liabilities Note payable (net of current portion) 256,152 273,476
Total Liabilities 282,214 298,393
Net PositionNet investment in capital assets 446,051 490,250 Unrestricted 598,287 512,876
Total Net Position 1,044,338$ 1,003,126$
City of Statesboro, GeorgiaDowntown Statesboro Development Authority
Comparative Statement of Net Position June 30, 2021 and 2020
113
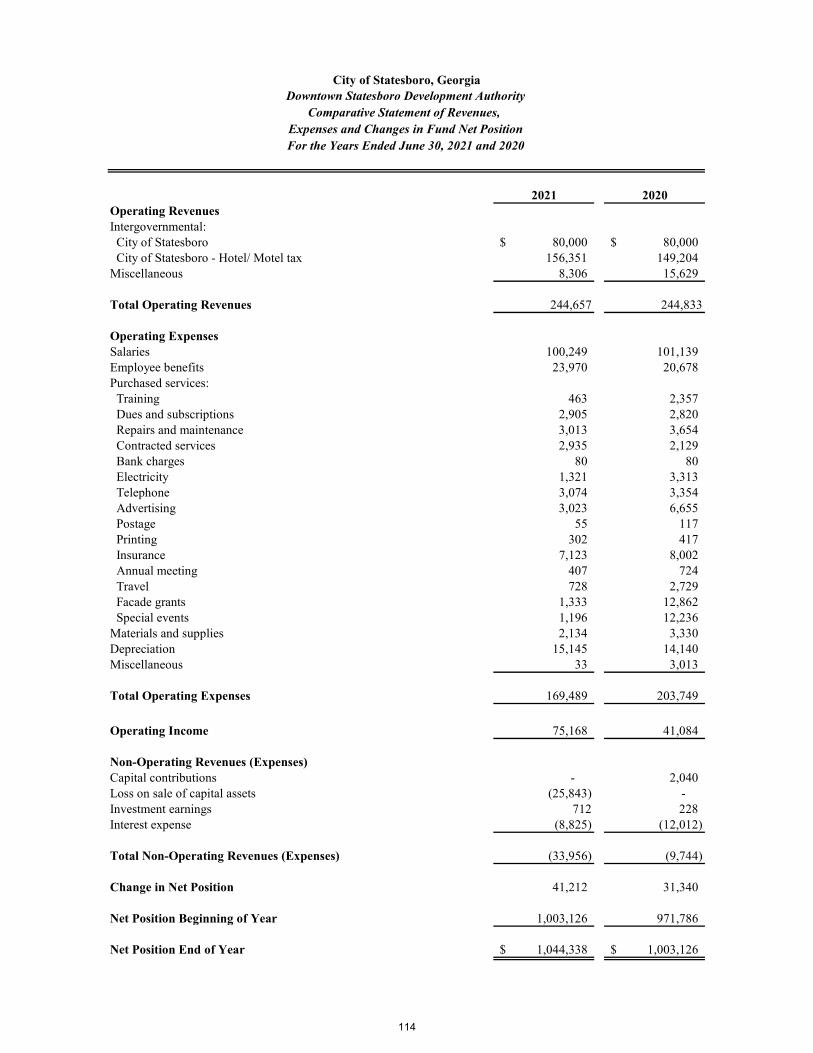
Comparative Statement of Revenues, Expenses and Changes in Fund Net PositionFor the Years Ended June 30, 2021 and 2020
2021 2020Operating RevenuesIntergovernmental: City of Statesboro 80,000$ 80,000$ City of Statesboro - Hotel/ Motel tax 156,351 149,204 Miscellaneous 8,306 15,629
Total Operating Revenues 244,657 244,833
Operating ExpensesSalaries 100,249 101,139 Employee benefits 23,970 20,678 Purchased services: Training 463 2,357 Dues and subscriptions 2,905 2,820 Repairs and maintenance 3,013 3,654 Contracted services 2,935 2,129 Bank charges 80 80 Electricity 1,321 3,313 Telephone 3,074 3,354 Advertising 3,023 6,655 Postage 55 117 Printing 302 417 Insurance 7,123 8,002 Annual meeting 407 724 Travel 728 2,729 Facade grants 1,333 12,862 Special events 1,196 12,236 Materials and supplies 2,134 3,330 Depreciation 15,145 14,140 Miscellaneous 33 3,013
Total Operating Expenses 169,489 203,749
Operating Income 75,168 41,084
Non-Operating Revenues (Expenses)Capital contributions - 2,040 Loss on sale of capital assets (25,843) - Investment earnings 712 228 Interest expense (8,825) (12,012)
Total Non-Operating Revenues (Expenses) (33,956) (9,744)
Change in Net Position 41,212 31,340
Net Position Beginning of Year 1,003,126 971,786
Net Position End of Year 1,044,338$ 1,003,126$
City of Statesboro, GeorgiaDowntown Statesboro Development Authority
114

Cash Flows from Operating Activities Cash received from City of Statesboro 220,422$ Other cash receipts 8,306 Cash payments to employees for services (123,007) Cash payments for goods and services (31,242)
Net Cash Provided by (Used in) Operating Activities 74,479
Cash Flows from Capital and Related Financing Activities Interest paid on debt (8,825) Principal paid on notes payable (16,789) Proceeds from sale of capital assets 20,000
Net Cash Provided by (Used in) Capital and Related Financing Activities (5,614)
Cash Flows from Investing Activities Investment earnings 712
Net Cash Provided by (Used in) Investing Activities 712
Net Increase (Decrease) in Cash and Cash Equivalents 69,577
Cash and Cash Equivalents Beginning of Year 500,724
Cash and Cash Equivalents End of Year 570,301$
City of Statesboro, Georgia
Statement of Cash FlowsFor the Year Ended June 30, 2021
Downtown Statesboro Development Authority
115
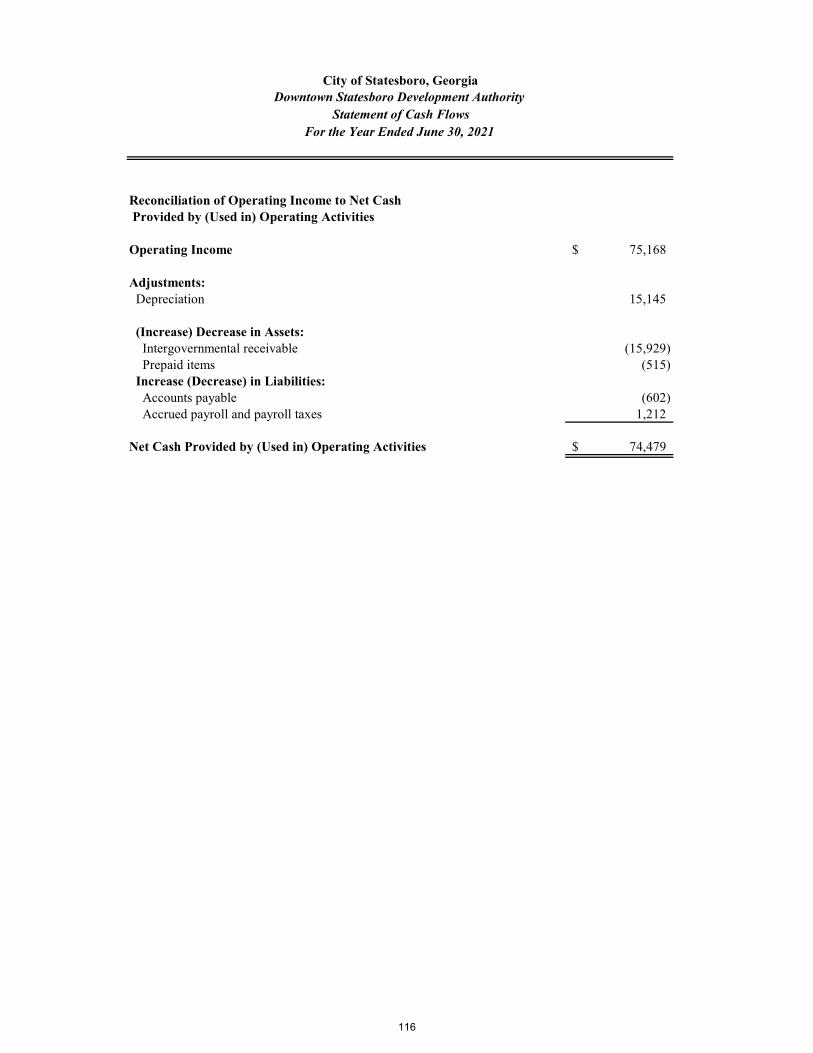
Reconciliation of Operating Income to Net Cash Provided by (Used in) Operating Activities
Operating Income 75,168$
Adjustments: Depreciation 15,145
(Increase) Decrease in Assets: Intergovernmental receivable (15,929) Prepaid items (515) Increase (Decrease) in Liabilities: Accounts payable (602) Accrued payroll and payroll taxes 1,212
Net Cash Provided by (Used in) Operating Activities 74,479$
City of Statesboro, Georgia
Statement of Cash FlowsFor the Year Ended June 30, 2021
Downtown Statesboro Development Authority
116

TOTAL PROGRAM YEAR 2018 FUNDS ALLOCATED TO RECIPIENT 750,000$
LESS: TOTAL PROGRAM YEAR 2018 FUNDS DRAWN BY RECIPIENT 87,500
FUNDS STILL AVAILABLE FROM PROGRAM YEAR 2018 RESOURCES 662,500$
TOTAL PROGRAM YEAR 2018 FUNDS DRAWN AND RECEIVED BY
RECIPIENT 87,500$
LESS: FUNDS APPLIED AND EXPENDED ON PROGRAM YEAR 2018 COSTS 87,500
TOTAL PROGRAM YEAR 2018 FUNDS HELD BY RECIPIENT -$
FOR THE YEAR ENDED JUNE 30, 2021
CITY OF STATESBORO, GEORGIA
COMMUNITY DEVELOPMENT BLOCK GRANT
18p-x-016-2-6090
SOURCE AND APPLICATION OF FUNDS SCHEDULE
117

APPROVED CUMULATIVE
PROGRAM ACTIVITY BUDGET EXPENDITURES
ACTIVITY NUMBER CDBG FUNDS CDBG FUNDS
Engineering -Street Improvements/Flood Drainage T-03K-00 50,000$ 50,000$
Street improvements P-03K-01 55,000 -
Flood & Drainage Facilities P-03K-02 600,000 -
Administration A-21A-00 45,000 37,500
Total 750,000$ 87,500$
CITY OF STATESBORO, GEORGIA
COMMUNITY DEVELOPMENT BLOCK GRANT
18p-x-016-2-6090
PROJECT COST SCHEDULE
FOR THE YEAR ENDED JUNE 30, 2021
118

Original Current EstimatedEstimated Estimated Prior Current Percentage of
Costs Costs Years Year Total Completion
Roads / Streets $7,370,012 $7,370,012 2,971,523$ 214,895$ 3,186,418$ 43%
Public Safety Facilities and Equipment 5,771,142 5,771,142 4,254,260 6,000 4,260,260 74%
Facility Improvements 587,190 587,190 319,998 - 319,998 54%
Water / Sewer Projects 9,000,000 9,000,000 3,974,699 - 3,974,699 44%
Natural Gas Projects 2,677,500 2,677,500 1,523,287 148,403 1,671,690 62%
Solid Waste Handling Equipment 1,350,000 1,350,000 659,894 310,699 970,593 72%
Economic Development 2,160,000 2,160,000 1,137,787 - 1,137,787 53%
Joint City/County Solid Waste Disposal 10,775,000 10,775,000 9,198,727 1,215,620 10,414,347 97%
$39,690,844 $39,690,844 $24,040,175 1,895,617$ 25,935,792$ 65%
Reconciliation of current year expenditures to Statement of Revenues, Expenditures and Changes in Fund Balances:
Total 2013 SPLOST fund expenditures per Statement of Revenues, Expenditures and Changes in Fund Balances 112,618$ Transfer to other funds 1,782,999 Total current year expenditures per above 1,895,617$
City of Statesboro, GeorgiaSchedule of SPLOST Expenditures
From Inception and for the Fiscal Year Ended June 30, 2021
2013 SPLOST
Expenditures
119

Original Current EstimatedEstimated Estimated Prior Current Percentage of
Costs Costs Years Year Total Completion
Public Works Capital Outlay Projects and Equipment $625,000 $625,000 -$ -$ -$ 0%
Public Safety Facilities and Equipment 5,758,400 5,758,400 189,617 567,720 757,337 13%
Facility Improvements 1,150,000 1,150,000 - - - 0%
Water / Sewer Projects 3,830,000 3,830,000 - 47,404 47,404 1%
Natural Gas Projects 1,000,000 1,000,000 - - - 0%
Solid Waste Facilities Equipment 250,000 250,000 - - - 0%
Economic Development 1,000,000 1,000,000 - - - 0%
Information Technology 160,000 160,000 - - - 0%
Cultural Facility Improvements 270,000 270,000 - - - 0%
Capital Outlay for Development of Parks, Trails and Greenspace 1,100,000 1,100,000 - 4,500 4,500 0%
Joint City/County Solid Waste Disposal 11,800,000 11,800,000 - 311,185 311,185 3%
$26,943,400 $26,943,400 189,617$ 930,809$ 1,120,426$ 4%
Reconciliation of current year expenditures to Statement of Revenues, Expenditures and Changes in Fund Balances:
Total 2019 SPLOST fund expenditures per Statement of Revenues, Expenditures and Changes in Fund Balances 3,856,205$ Transfer to other funds 358,589 Less amouns spend from proceeds from revenue bond (3,283,985) Total current year expenditures per above 930,809$
City of Statesboro, GeorgiaSchedule of SPLOST Expenditures
From Inception and for the Fiscal Year Ended June 30, 2021
2019 SPLOST
Expenditures
120

Original Current EstimatedEstimated Estimated Prior Current Percentage of
Costs Costs Years Year Total Completion
Roads, Streets and Bridges $25,350,000 $25,350,000 2,353,705$ 3,058,882$ 5,412,587$ 21%
Public Transportation 450,000 450,000 98,031 - 98,031 22%
$25,800,000 $25,800,000 2,451,736$ 3,058,882$ 5,510,618$ 21%
City of Statesboro, GeorgiaSchedule of TSPLOST Expenditures
From Inception and for the Fiscal Year Ended June 30, 2021
2018 TSPLOST
Expenditures
121

Statistical Section
City of Statesboro, Georgia
Statistical Section
(Unaudited)
This part of the City of Statesboro's comprehensive annual financial report presents detailed
information as a context for understanding this year's financial statements, not disclosures, and
supplementary information. This information has not been audited by the independent auditor.
Contents Page
Financial Trends S-1
These tables contain trend information that may assist the reader in assessing
the City's current financial performance by placing it in historical perspective.
Revenue Capacity S-10
These tables contain information that may assist the reader in assessing the
City's two most significant local revenue sources, the property and sales
taxes.
Debt Capacity S-18
These tables present information that may assist the reader in analyzing the
affordability of the City's current levels of outstanding debt and the City's
ability to issue additional debt in the future.
Economic & Demographic Information S-22
This table offers economic and demographic indicators that are commonly
used for financial analysis and that can inform one's understanding the
City's present and ongoing financial status.
Operating Information S-24
These tables contain service and infrastructure indicators that can inform one's
understanding how the information in the City's financial statements relates to
the services the City provides and the activities it performs.
Source:
Unless otherwise noted, the information in these tables is derived from the annual
financial reports for the relevant year.
122

Program Net (Expense)/ Program Net (Expense)/ Program Net (Expense)/ Program Net (Expense)/ Program Net (Expense)/
Expenses Revenues Revenue 1 Expenses Revenues Revenue 1 Expenses Revenues Revenue 1 Expenses Revenues Revenue 1 Expenses Revenues Revenue 1
Function/Program
Governmental Activities General government 2,099,937$ 875,607$ (1,224,330)$ 2,760,181$ 993,448$ (1,766,733)$ 1,709,051$ 849,022$ (860,029)$ 1,818,731$ 890,847$ (927,884)$ 1,968,975$ 813,324$ (1,155,651)$ Municipal court 486,596 (486,596) 646,415 - (646,415) 389,130 - (389,130) 436,950 - (436,950) 508,188 - (508,188) Public safety 12,965,179 6,188,978 (6,776,201) 16,740,347 3,236,265 (13,504,082) 11,015,343 3,375,104 (7,640,239) 10,863,589 3,065,147 (7,798,442) 10,718,966 3,306,804 (7,412,162) Public works 4,436,784 11,910,350 7,473,566 4,017,087 10,091,276 6,074,189 3,175,497 7,830,305 4,654,808 3,364,470 5,198,176 1,833,706 3,451,180 4,700,693 1,249,513 Community development 984,389 329,315 (655,074) 813,332 222,505 (590,827) 918,264 296,482 (621,782) 855,871 279,774 (576,097) 921,965 409,649 (512,316) Parks and cemeteries 456,764 44,000 (412,764) 566,597 31,119 (535,478) 428,833 29,842 (398,991) 483,201 37,000 (446,201) 515,643 - (515,643) Engineering 390,608 145,752 (244,856) 397,071 37,286 (359,785) 448,206 77,992 (370,214) 364,744 60,188 (304,556) 282,548 33,772 (248,776) Planning and zoning 506,163 218,247 (287,916) 423,640 175,421 (248,219) 357,835 265,306 (92,529) 342,988 197,202 (145,786) 326,708 155,547 (171,161) Community services 484,643 - (484,643) 261,159 - (261,159) 262,467 - (262,467) 261,311 - (261,311) 265,623 - (265,623) Interest on long-term debt 187,346 - (187,346) 144,933 - (144,933) 28,130 - (28,130) 44,936 - (44,936) 19,806 - (19,806)
Subtotal Governmental Activities 22,998,409 19,712,249 (3,286,160) 26,770,762 14,787,320 (11,983,442) 18,732,756 12,724,053 (6,008,703) 18,836,791 9,728,334 (9,108,457) 18,979,602 9,419,789 (9,559,813)
Business-type ActivitiesWater and sewer 8,836,206 11,259,094 2,422,888 10,978,277 11,012,390 34,113 9,079,979 11,528,411 2,448,432 8,814,790 11,126,198 2,311,408 8,674,680 11,439,597 2,764,917Reclaimed Water - - - - - - - - - 41,255 53,115 11,860 44,256 53,033 8,777Stormwater 934,807 1,704,080 769,273 1,265,921 1,434,697 168,776 819,027 1,019,711 200,684 740,278 1,122,107 381,829 610,552 1,105,033 494,481Gas 3,149,497 4,528,764 1,379,267 3,015,049 4,075,893 1,060,844 3,533,403 4,653,603 1,120,200 3,279,916 4,713,000 1,433,084 3,318,781 4,674,025 1,355,244Solid waste collection 3,462,941 4,705,211 1,242,270 3,624,436 4,478,566 854,130 3,115,725 4,076,782 961,057 2,995,140 3,969,547 974,407 2,972,290 4,014,950 1,042,660Solid waste disposal 3,988,337 2,504,390 (1,483,947) 3,814,157 2,471,228 (1,342,929) 3,372,658 2,490,409 (882,249) 3,239,186 2,363,895 (875,291) 3,565,151 2,452,478 (1,112,673)
Subtotal Business-type Activities 20,371,788 24,701,539 4,329,751 22,697,840 23,472,774 774,934 19,920,792 23,768,916 3,848,124 19,110,565 23,347,862 4,237,297 19,185,710 23,739,116 4,553,406
Total Primary Government 43,370,197$ 44,413,788$ 1,043,591$ 49,468,602$ 38,260,094$ (11,208,508)$ 38,653,548$ 36,492,969$ (2,160,579)$ 37,947,356$ 33,076,196$ (4,871,160)$ 38,165,312$ 33,158,905$ (5,006,407)$
Fiscal Year 2016 Fiscal Year 2015 Fiscal Year 2014 Fiscal Year 2013 Fiscal Year 2012Program Net (Expense)/ Program Net (Expense)/ Program Net (Expense)/ Program Net (Expense)/ Program Net (Expense)/
Expenses Revenues Revenue 1 Expenses Revenues Revenue 1 Expenses Revenues Revenue 1 Expenses Revenues Revenue 1 Expenses Revenues Revenue 1
Function/Program
Governmental Activities General government 1,707,991$ 768,875$ (939,116)$ 1,590,793$ 719,912$ (870,881)$ 2,095,218$ 766,610$ (1,328,608)$ 1,961,130$ 678,909$ (1,282,221)$ 1,934,249$ 656,558$ (1,277,691)$ Municipal court 553,858 - (553,858) 567,015 - (567,015) 565,829 - (565,829) 567,964 - (567,964) 556,554 - (556,554) Public safety 10,677,711 3,241,053 (7,436,658) 10,146,941 3,286,228 (6,860,713) 9,607,582 3,262,755 (6,344,827) 9,098,016 3,535,427 (5,562,589) 9,119,781 3,750,528 (5,369,253) Public works 3,217,005 4,698,391 1,481,386 3,016,792 4,909,455 1,892,663 3,047,404 3,860,595 813,191 2,732,868 4,480,151 1,747,283 2,807,901 4,159,318 1,351,417 Community development 799,087 322,313 (476,774) 727,449 288,232 (439,217) 941,487 94,258 (847,229) 864,315 - (864,315) 622,364 12,859 (609,505) Parks and cemeteries 462,575 - (462,575) 443,169 - (443,169) 459,438 - (459,438) 442,998 - (442,998) 427,882 - (427,882) Engineering 232,815 95,275 (137,540) 411,919 104,615 (307,304) 316,680 42,621 (274,059) 439,610 482,485 42,875 437,128 375,947 (61,181) Planning and zoning 321,222 263,951 (57,271) 374,778 246,840 (127,938) 380,512 144,327 (236,185) 308,038 - (308,038) 273,996 - (273,996) Community services 258,312 - (258,312) 297,890 - (297,890) 281,110 - (281,110) 264,449 100,000 (164,449) 269,663 - (269,663) Interest on long-term debt 20,231 - (20,231) 24,249 - (24,249) 51,909 - (51,909) 22,064 - (22,064) 27,512 - (27,512)
Subtotal Governmental Activities 18,250,807 9,389,858 (8,860,950) 17,600,995 9,555,282 (8,045,713) 17,747,169 8,171,166 (9,576,003) 16,701,452 9,276,972 (7,424,480) 16,477,030 8,955,210 (7,521,820)
Business-type ActivitiesWater and sewer 9,090,967 10,902,715 1,811,748 8,803,476 13,023,723 4,220,247 8,795,084 12,834,245 4,039,161 8,695,892 10,262,621 1,566,729 8,177,825 8,771,522 593,697Reclaimed Water 24,585 52,252 27,667 40,145 43,560 3,415 23,748 15,543 (8,205) 23,376 26,606 3,230 21,359 26,149 4,790Stormwater 401,735 905,185 503,450 - - - - - - - - - - - -Gas 2,750,175 4,473,004 1,722,829 3,551,858 5,226,644 1,674,786 4,273,768 5,662,963 1,389,195 3,718,441 5,131,134 1,412,693 3,528,771 4,597,727 1,068,956Solid waste collection 2,874,268 3,508,278 634,010 2,793,705 3,586,026 792,321 2,612,595 3,403,698 791,103 2,339,949 3,222,984 883,035 2,183,140 2,900,086 716,946Solid waste disposal 2,795,044 2,176,252 (618,792) 2,956,029 2,323,665 (632,364) 3,710,838 2,123,632 (1,587,206) 2,931,680 2,156,748 (774,932) 2,884,566 1,959,947 (924,619)
Subtotal Business-type Activities 17,936,774 22,017,686 4,080,912 18,145,213 24,203,618 6,058,405 19,416,033 24,040,081 4,624,048 17,709,338 20,800,093 3,090,755 16,795,661 18,255,431 1,459,770
Total Primary Government 36,187,581$ 31,407,544$ (4,780,038)$ 35,746,208$ 33,758,900$ (1,987,308)$ 37,163,202$ 32,211,247$ (4,951,955)$ 34,410,790$ 30,077,065$ (4,333,725)$ 33,272,691$ 27,210,641$ (6,062,050)$
Notes:
Fiscal Year 2019Fiscal Year 2020
1 Net (expense)/revenue is the difference between the expenses and program revenues of a function or program. It indicates the degree to which a function or program supports itself with its own fees and grants versus its relianceupon funding from taxes and other general revenues. A number in parentheses are net expenses, indicating that expenses were greater than program revenues and therefore general revenues were needed to finance that functionor program. Numbers without parentheses are net revenues, meaning that program revenues were more than sufficient to cover expenses.
Fiscal Year 2021 Fiscal Year 2017
City of Statesboro, GeorgiaGovernment-wide Expenses, Program Revenues and
Net (Expense)/Revenue by Function/Program
Last Ten Fiscal Years
(accrual basis of accounting)
Fiscal Year 2018
S-1

Fiscal Year 2021 Fiscal Year 2020 Fiscal Year 2019 Fiscal Year 2018 Fiscal Year 2017Governmental Activities
Charges for Services: General Government 875,607$ 993,448$ 849,022$ 890,847$ 813,324$ Public Safety 2,327,024 2,201,273 2,582,959 2,210,729 2,409,325 Public Works - - - - 90 Parks and Cemeteries 44,000 31,119 29,842 37,000 - Engineering 145,752 36,632 77,992 42,412 33,772 Planning and Zoning 218,247 175,421 265,306 197,202 155,547Operating Grants and Contributions 1,868,415 7,914 8,889 141,356 206,242Capital Grants and Contributions 14,233,204 11,341,513 8,910,043 6,208,788 5,801,489
Subtotal Governmental Activities Program Revenues 19,712,249 14,787,320 12,724,053 9,728,334 9,419,789
Business-type ActivitiesCharges for Services: Water and Sewer 11,110,680 10,930,593 11,361,925 11,000,076 11,291,289 Reclaimed Water System - - - 53,115 53,033 Stormwater 1,322,034 1,030,767 1,019,711 1,008,301 1,105,033 Gas 4,518,315 4,075,893 4,653,603 4,713,000 4,674,025 Solid Waste Collection 4,682,839 4,478,566 4,076,782 3,906,436 3,857,359 Solid Waste Disposal 2,490,212 2,471,228 2,490,409 2,363,895 2,452,478Operating Grants and Contributions - - - 86,058 165,594Capital Grants and Contributions 577,459 485,727 166,486 216,981 140,305
Subtotal Business-type Activities Program Revenues 24,701,539 23,472,774 23,768,916 23,347,862 23,739,116
Primary GovernmentCharges for Services 27,734,710$ 26,424,940$ 27,407,551$ 26,423,013$ 26,845,275$ Operating Grants and Contributions 1,868,415 7,914 8,889 227,414 371,836Capital Grants and Contributions 14,810,663 11,827,240 9,076,529 6,425,769 5,941,794
Total Primary Government Program Revenues 44,413,788$ 38,260,094$ 36,492,969$ 33,076,196$ 33,158,905$
Governmental Activities Fiscal Year 2016 Fiscal Year 2015 Fiscal Year 2014 Fiscal Year 2013 Fiscal Year 2012Charges for Services: General Government 768,875$ 719,912$ 766,610$ 678,909$ 656,558$ Public Safety 2,564,600 2,490,943 2,598,100 2,329,080 2,468,175Public Works - - - - -Parks and Cemeteries - - - - - Engineering 95,275 104,615 42,621 482,485 375,947Planning and Zoning 263,951 246,840 144,327 - -Operating Grants and Contributions - 25,181 50,339 127,208 196,009Capital Grants and Contributions 5,697,157 5,967,791 4,569,169 5,659,290 5,258,521
Subtotal Governmental Activities Program Revenues 9,389,858 9,555,282 8,171,166 9,276,972 8,955,210
Business-type ActivitiesCharges for Services: Water and Sewer 10,747,337 10,403,692 9,177,683 9,542,530 8,561,971 Reclaimed Water 52,252 43,560 15,543 26,606 26,149
Stormwater 905,185 - - - -Gas 4,473,004 5,226,644 5,662,963 5,131,134 4,597,727
Solid Waste Collection 3,508,278 3,509,785 3,403,698 3,222,984 2,900,086 Solid Waste Disposal 2,176,252 2,323,665 2,123,632 2,156,748 1,959,947Operating Grants and Contributions - - - - -Capital Grants and Contributions 155,378 2,696,272 3,656,562 720,091 209,551
Subtotal Business-type Activities Program Revenues 22,017,686 24,203,618 24,040,081 20,800,093 18,255,431
Primary GovernmentCharges for Services 25,555,009$ 25,069,656$ 23,935,177 23,570,476 21,546,560Operating Grants and Contributions - 25,181 50,339 127,208 196,009Capital Grants and Contributions 5,852,535 8,664,063 8,225,731 6,379,381 5,468,072
Total Primary Government Program Revenues 31,407,544$ 33,758,900$ 32,211,247$ 30,077,065$ 27,210,641$
Notes:1
Program revenues are related to specific activities of the City. Their sources are either fees, fines, charges for services or grants restricted to a specific purpose.
City of Statesboro, Georgia
Government-wide Program Revenues1
by Category
Last Ten Fiscal Years
(accrual basis of accounting)
S-2

City of Statesboro, Georgia
Government-wide General Revenues and Other Changes in Net Position
Last Ten Fiscal Years
(accrual basis of accounting)
Fiscal Year 2021 Fiscal Year 2020 Fiscal Year 2019 Fiscal Year 2018 Fiscal Year 2017 Fiscal Year 2016 Fiscal Year 2015 Fiscal Year 2014 Fiscal Year 2013 Fiscal Year 2012
Net (Expense), Total Primary Government (see page S-1)
Governmental activities (3,286,160)$ (11,983,442)$ (6,008,703)$ (9,108,457)$ (9,559,813)$ (8,860,950)$ (8,045,713)$ (9,576,003)$ (7,424,480)$ (7,521,820)$
Business activities 4,329,751 774,932 3,848,125 4,237,297 4,553,406 4,080,913 6,058,405 4,624,048 3,090,755 1,459,770
Total Primary Government 1,043,591 (11,208,510) (2,160,578) (4,871,160) (5,006,407) (4,780,037) (1,987,308) (4,951,955) (4,333,725) (6,062,050)
General revenues and other changes in net position
Governmental Activities:
Taxes
Property taxes levied for general purposes 6,219,062 5,836,671 5,681,980 5,267,213 4,523,095 4,467,095 4,432,213 4,130,721 3,816,182 3,845,135
Hotel/motel taxes 785,685 749,767 869,748 856,407 923,788 814,263 774,064 728,017 553,966 526,504
Insurance premium taxes 2,278,035 2,160,324 2,034,135 1,886,162 1,773,061 1,636,651 1,531,963 1,466,120 1,415,987 1,333,111
Franchise taxes 1,763,686 1,816,587 1,807,785 1,734,055 1,845,269 1,898,393 1,765,369 1,740,726 1,897,448 1,974,408
Other taxes 863,608 788,131 822,831 800,842 818,972 818,739 793,086 776,577 798,934 818,160
Gain (loss) on sale of capital assets 46,597 15,466 39,777 - 48,572 37,789 19,355 (61,690) 28,465 16,597
Investment earnings 13,740 28,875 324 12 12 - - - - -
Miscellaneous 62,436 55,705 48,833 46,210 85,644 51,967 84,127 39,141 37,437 39,801
Transfers from (to) business-type activities 1,817,640 1,452,730 2,053,380 1,174,333 343,359 521,193 506,355 603,046 (2,311,318) 676,249
Subtotal Governmental Activities 13,850,489 12,904,256 13,358,793 11,765,234 10,361,772 10,246,090 9,906,532 9,422,658 6,237,101 9,229,965
Business-type Activities:
Gain (loss) on the sale of capital assets 35,051 21,894 (9,274) 55,667 17,045 106,888 35,384 224,935 190,287 16,839
Investment earnings 1,036 19,759 151 164 289 315 344 1,045 4,411 11,822
Miscellaneous 27,232 32,812 25,123 28,118 65,876 7,246 24,545 43,608 69,463 94,586
Transfers from (to) governmental activities (1,817,640) (1,452,730) (2,053,380) (1,174,333) (343,359) (521,193) (506,355) (603,046) 2,311,318 (676,249)
Subtotal Business-type Activities (1,754,321) (1,378,265) (2,037,380) (1,090,384) (260,149) (406,744) (446,082) (333,458) 2,575,479 (553,002)
Change in Net Position
Governmental activities 10,564,329 920,814 7,350,090 2,656,777 801,959 1,385,140 1,860,819 (153,345) (1,187,379) 1,708,145
Business-type activities 2,575,430 (603,331) 1,810,745 3,146,912 4,293,257 3,674,169 5,612,322 4,290,590 5,666,234 906,768
Total Primary Government 13,139,759$ 317,483$ 9,160,835$ 5,803,689$ 5,095,216$ 5,059,309$ 7,473,141$ 4,137,245$ 4,478,855$ 2,614,913$
S-3
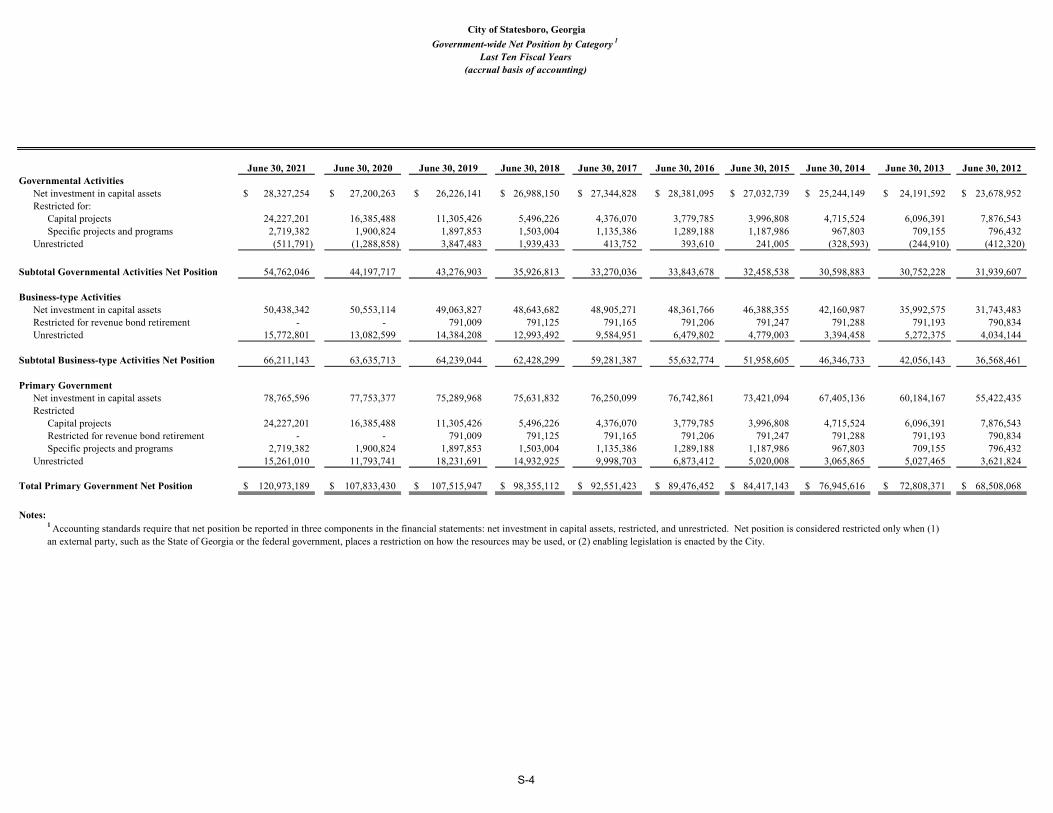
City of Statesboro, Georgia
Government-wide Net Position by Category 1
Last Ten Fiscal Years
(accrual basis of accounting)
June 30, 2021 June 30, 2020 June 30, 2019 June 30, 2018 June 30, 2017 June 30, 2016 June 30, 2015 June 30, 2014 June 30, 2013 June 30, 2012
Governmental Activities
Net investment in capital assets 28,327,254$ 27,200,263$ 26,226,141$ 26,988,150$ 27,344,828$ 28,381,095$ 27,032,739$ 25,244,149$ 24,191,592$ 23,678,952$
Restricted for:
Capital projects 24,227,201 16,385,488 11,305,426 5,496,226 4,376,070 3,779,785 3,996,808 4,715,524 6,096,391 7,876,543
Specific projects and programs 2,719,382 1,900,824 1,897,853 1,503,004 1,135,386 1,289,188 1,187,986 967,803 709,155 796,432
Unrestricted (511,791) (1,288,858) 3,847,483 1,939,433 413,752 393,610 241,005 (328,593) (244,910) (412,320)
Subtotal Governmental Activities Net Position 54,762,046 44,197,717 43,276,903 35,926,813 33,270,036 33,843,678 32,458,538 30,598,883 30,752,228 31,939,607
Business-type Activities
Net investment in capital assets 50,438,342 50,553,114 49,063,827 48,643,682 48,905,271 48,361,766 46,388,355 42,160,987 35,992,575 31,743,483
Restricted for revenue bond retirement - - 791,009 791,125 791,165 791,206 791,247 791,288 791,193 790,834
Unrestricted 15,772,801 13,082,599 14,384,208 12,993,492 9,584,951 6,479,802 4,779,003 3,394,458 5,272,375 4,034,144
Subtotal Business-type Activities Net Position 66,211,143 63,635,713 64,239,044 62,428,299 59,281,387 55,632,774 51,958,605 46,346,733 42,056,143 36,568,461
Primary Government
Net investment in capital assets 78,765,596 77,753,377 75,289,968 75,631,832 76,250,099 76,742,861 73,421,094 67,405,136 60,184,167 55,422,435
Restricted
Capital projects 24,227,201 16,385,488 11,305,426 5,496,226 4,376,070 3,779,785 3,996,808 4,715,524 6,096,391 7,876,543
Restricted for revenue bond retirement - - 791,009 791,125 791,165 791,206 791,247 791,288 791,193 790,834
Specific projects and programs 2,719,382 1,900,824 1,897,853 1,503,004 1,135,386 1,289,188 1,187,986 967,803 709,155 796,432
Unrestricted 15,261,010 11,793,741 18,231,691 14,932,925 9,998,703 6,873,412 5,020,008 3,065,865 5,027,465 3,621,824
Total Primary Government Net Position 120,973,189$ 107,833,430$ 107,515,947$ 98,355,112$ 92,551,423$ 89,476,452$ 84,417,143$ 76,945,616$ 72,808,371$ 68,508,068$
Notes:1 Accounting standards require that net position be reported in three components in the financial statements: net investment in capital assets, restricted, and unrestricted. Net position is considered restricted only when (1)
an external party, such as the State of Georgia or the federal government, places a restriction on how the resources may be used, or (2) enabling legislation is enacted by the City.
S-4

Source 2012 2013 2014 2015 2016 2017 2018 2019 2020 2021
Taxes 8,529,072$ 8,472,005$ 8,870,477$ 9,303,278$ 9,628,162$ 9,880,326$ 10,544,387$ 11,206,457$ 11,295,709$ 11,950,269$
Intergovernmental 5,445,203 5,748,585 4,611,692 5,988,720 5,637,313 5,868,040 6,330,377 8,918,048 10,730,883 16,717,547
Licenses and permits 941,669 1,071,307 861,217 982,677 1,013,905 869,805 956,063 1,012,160 1,026,408 1,039,632
Fines and forfeitures 1,469,610 1,246,407 1,382,420 1,318,504 1,285,361 1,129,784 895,373 1,047,519 758,125 739,812
Charges for services 1,089,401 1,172,760 1,308,021 1,261,129 1,393,435 1,412,469 1,526,754 1,745,442 1,653,360 1,831,186
Investment earnings 9,327 10,871 7,816 4,253 2,712 1,613 2,003 1,208 30,053 14,524Miscellaneous 39,801 64,479 39,141 84,127 109,099 223,734 46,210 48,833 55,705 62,436
Total revenues 17,524,083$ 17,786,414$ 17,080,784$ 18,942,688$ 19,069,987$ 19,385,771$ 20,301,167$ 23,979,667$ 25,550,243$ 32,355,406$
% change from prior year -0.9% 1.5% -4.0% 10.9% 0.7% 1.7% 4.7% 18.1% 6.5% 26.6%
City of Statesboro, Georgia General Governmental Revenues by Source
Last Ten Fiscal Years
(modified accrual basis of accounting)
S-5
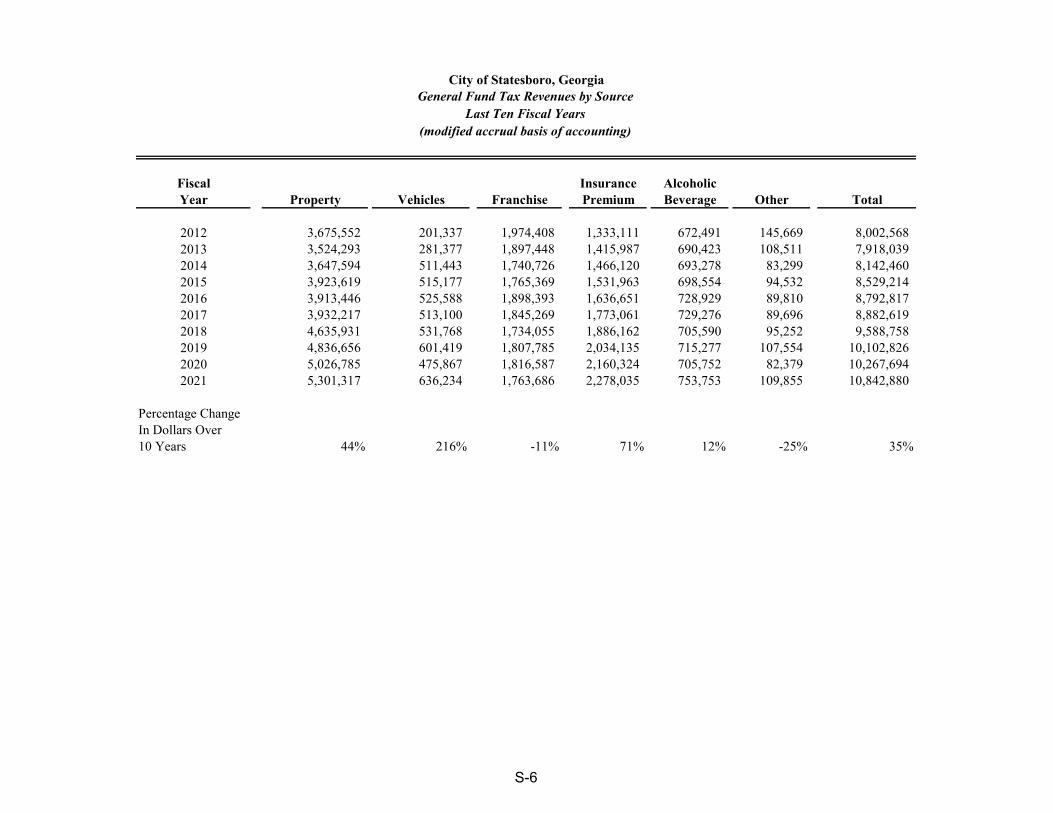
Fiscal Insurance AlcoholicYear Property Vehicles Franchise Premium Beverage Other Total
2012 3,675,552 201,337 1,974,408 1,333,111 672,491 145,669 8,002,568
2013 3,524,293 281,377 1,897,448 1,415,987 690,423 108,511 7,918,039
2014 3,647,594 511,443 1,740,726 1,466,120 693,278 83,299 8,142,460
2015 3,923,619 515,177 1,765,369 1,531,963 698,554 94,532 8,529,214
2016 3,913,446 525,588 1,898,393 1,636,651 728,929 89,810 8,792,817
2017 3,932,217 513,100 1,845,269 1,773,061 729,276 89,696 8,882,619
2018 4,635,931 531,768 1,734,055 1,886,162 705,590 95,252 9,588,758
2019 4,836,656 601,419 1,807,785 2,034,135 715,277 107,554 10,102,826
2020 5,026,785 475,867 1,816,587 2,160,324 705,752 82,379 10,267,694
2021 5,301,317 636,234 1,763,686 2,278,035 753,753 109,855 10,842,880
Percentage ChangeIn Dollars Over 10 Years 44% 216% -11% 71% 12% -25% 35%
General Fund Tax Revenues by SourceCity of Statesboro, Georgia
Last Ten Fiscal Years
(modified accrual basis of accounting)
S-6

Function 2012 2013 2014 2015 2016 2017 2018 2019 2020 2021
Current:
General government 1,762,517$ 1,838,780$ 1,839,076$ 1,514,518$ 1,515,172$ 1,808,797$ 1,737,183$ 1,653,976$ 1,866,183$ 1,922,511$
Municipal court 541,681 569,468 555,185 576,371 526,926 478,322 426,030 366,249 457,608 450,259
Public safety 8,135,532 8,192,129 8,456,060 9,259,590 9,240,059 9,577,021 9,887,126 10,128,329 10,890,322 11,446,051
Streets/public works 1,917,899 1,940,179 1,987,420 2,030,080 1,965,707 2,067,443 1,866,452 1,867,850 5,135,099 3,480,887
Parks and cemeteries 338,438 377,665 369,113 367,113 346,163 402,194 379,011 346,030 382,184 359,061
Engineering 396,485 403,009 410,968 366,351 202,100 243,844 330,604 412,615 251,824 333,203
Planning and zoning 260,767 314,132 366,749 367,044 294,395 300,439 325,620 345,004 308,465 483,597
Community services 171,883 166,669 169,058 182,010 160,532 167,843 163,531 164,687 163,379 386,863
Community development 622,364 857,758 927,358 703,722 776,956 877,751 822,829 861,833 792,827 964,460
Total Current 14,147,566 14,659,789 15,080,987 15,366,799 15,028,010 15,923,654 15,938,386 16,146,573 20,247,891 19,826,892
% Change From Prior Year -5.0% 3.6% 2.9% 1.9% -2.2% 6.0% 0.1% 1.3% 25.4% -2.1%
Capital Outlay 1,232,555 3,961,860 3,011,216 3,236,507 3,103,395 1,492,751 2,072,021 1,596,958 3,361,645 8,046,198
% Change From Prior Year -21.8% 221.4% -24.0% 7.5% -4.1% -51.9% 38.8% -22.9% 110.5% 139.4%
Debt Service
Bond issuance cost - - - - - - - - - 76,003
Principal 278,869 223,853 486,759 469,498 420,441 410,540 489,751 206,064 211,064 203,800
Interest 27,512 22,064 51,909 24,249 20,231 19,806 44,936 28,130 144,933 111,343
Total Debt Service 306,381 245,917 538,668 493,747 440,672 430,346 534,687 234,194 355,997 391,146
% Change From Prior Year -18.1% -19.7% 119.0% -8.3% -10.7% -2.3% 24.2% -56.2% 52.0% 9.9%
Total Expenditures 15,686,502$ 18,867,566$ 18,630,871$ 19,097,053$ 18,572,077$ 17,846,751$ 18,545,094$ 17,977,725$ 23,965,533$ 28,264,236$
% Change From Prior Year -6.8% 20.3% -1.3% 2.5% -2.7% -3.9% 3.9% -3.1% 33.3% 17.9%
Debt Service as a
Percentage of TotalNoncapital Expenditures 2.1% 1.6% 3.4% 3.1% 2.8% 2.6% 3.2% 1.4% 1.7% 1.9%
City of Statesboro, GeorgiaGeneral Governmental Expenditures by Function
Last Ten Fiscal Years
(modified accrual basis of accounting)
S-7

2012 2013 2014 2015 2016 2017 2018 2019 2020 2021
Total Revenues 17,524,083$ 17,786,414$ 17,080,784$ 18,942,688$ 19,069,987$ 19,385,771$ 20,301,167$ 23,979,667$ 25,550,243$ 32,355,406$
Total Expenditures 15,686,502 18,867,566 18,630,871 19,097,053 18,572,077 17,846,751 18,545,094 17,977,725 23,965,533 28,264,236
Excess (Deficiency) of Revenues Over (Under) Expenditures 1,837,581 (1,081,152) (1,550,087) (154,365) 497,910 1,539,020 1,756,073 6,001,942 1,584,710 4,091,170
Other Financing Sources (Uses) 773,443 (800,814) 680,585 182,324 476,428 502,958 903,557 1,403,772 5,589,508 5,849,463
Net Change in Fund Balances 2,611,024 (1,881,966) (869,502) 27,959 974,338 2,041,978 2,659,630 7,405,714 7,174,218 9,940,633
City of Statesboro, GeorgiaChanges in Fund Balances of Governmental Funds
Last Ten Fiscal Years
(modified accrual basis of accounting)
S-8

2012 2013 2014 2015 2016 2017 2018 2019 2020 2021
General Fund
Nonspendable 211,929$ 233,964$ 185,417$ 255,626$ 263,632$ 42,374$ 36,770$ 31,690$ 30,413$ 39,194$
Assigned - - - - - - - 653,430 1,007,405 1,150,691
Unassigned 290,475 313,505 614,769 1,387,427 2,501,862 4,089,876 5,196,777 5,704,733 6,072,346 7,355,500
Subtotal General Fund 502,404 547,469 800,186 1,643,053 2,765,494 4,132,250 5,233,547 6,389,853 7,110,164 8,545,385
General Fund Percentage Change 176.9% 9.0% 46.2% 105.3% 68.3% 49.4% 26.7% 22.1% 11.3% 20.2%
All Other Governmental Funds
Nonspendable 23,792 31,726 42,708 39,390 46,827 42,348 38,488 40,519 13,769 27,399
Assigned 59,602 - 16,513 29,593 - - - - - -
Unassigned - (256,988) (405,267) (316,375) (348,657) (116,668) (45,359) - (61,084) -
Restricted
Special Revenue Funds 772,640 934,417 1,330,362 1,148,596 1,242,361 1,093,788 1,464,516 1,857,334 3,319,013 2,691,983
Capital Projects Fund 7,876,543 6,096,391 4,699,011 3,967,215 3,779,785 4,376,070 5,496,226 11,305,426 16,385,488 25,443,216
Subtotal All Other
Governmental Funds 8,732,577 6,805,546 5,683,327 4,868,419 4,720,316 5,395,538 6,953,871 13,203,279 19,657,186 28,162,598
Total Governmental Funds
Nonspendable 235,721 265,690 228,125 295,016 310,459 84,722 75,258 72,209 44,182 66,593
Assigned 59,602 - 16,513 29,593 - - - 653,430 1,007,405 1,150,691
Restricted 8,649,183 7,030,808 6,029,373 5,115,811 5,022,146 5,469,858 6,960,742 13,162,760 19,704,501 28,135,199
Unassigned 290,475 56,517 209,502 1,071,052 2,153,205 3,973,208 5,151,418 5,704,733 6,011,262 7,355,500
Total Governmental Funds 9,234,981$ 7,353,015$ 6,483,513$ 6,511,472$ 7,485,810$ 9,527,788$ 12,187,418$ 19,593,132$ 26,767,350$ 36,707,983$
All Governmental Funds Percentage Change 39.4% -20.4% -11.8% 0.4% 15.0% 27.3% 27.9% 60.8% 36.6% 37.1%
Governmental Fund - Fund BalancesCity of Statesboro, Georgia
Last Ten Fiscal Years
(modified accrual basis of accounting)
S-9

Motor TotalConservation Vehicles Less: Total Taxable Direct Estimated Annual
Fiscal Residential Commercial Industrial Agricultural Use Utility and Mobile Other Tax Exempt Assessed Tax Actual Percentage
Year Property Property Property Property Property Property Homes Property Property Value1
Rate2
Value Change
2012 187,609,087 371,446,074 10,948,474 808,861 1,017,661 14,301,419 28,656,965 - 8,662,633 606,125,908 6.358 1,536,971,353 -0.4%2013 173,205,402 366,085,868 12,311,779 712,904 1,017,608 14,727,479 30,116,302 - 9,396,663 588,780,679 6.358 1,495,443,355 -2.7%2014 170,620,330 376,645,879 11,862,370 722,925 998,417 15,091,201 32,391,960 - 8,865,865 599,467,217 6.358 1,520,832,705 1.7%2015 171,698,992 426,599,183 13,124,317 839,776 919,170 14,825,297 27,318,326 7,300 8,950,361 646,382,000 6.358 1,638,330,903 7.7%2016 180,065,696 464,110,200 13,706,737 820,403 1,292,307 14,650,801 19,474,631 - 10,466,933 683,653,842 6.358 1,735,301,938 5.9%2017 179,502,378 436,409,738 16,756,554 807,030 919,170 14,782,713 14,397,997 11,031 10,385,454 653,201,157 6.358 1,658,966,528 -4.4%2018 184,614,357 443,388,584 13,269,868 811,361 911,599 15,204,106 10,852,688 9,485 6,607,436 662,454,612 7.308 1,672,655,120 0.8%2019 192,894,932 473,282,787 12,266,725 818,950 914,195 15,895,392 8,351,701 6,908 9,665,735 694,765,855 7.308 1,761,078,975 5.3%2020 207,371,995 491,445,329 16,436,570 911,223 982,000 16,363,783 7,384,278 81,128 11,104,223 729,872,083 7.308 1,852,440,765 5.2%2021 210,870,249 510,848,360 15,571,014 803,897 982,000 16,575,917 6,423,979 - 10,577,357 751,498,059 7.308 1,905,188,540 2.8%
2012 30.5% 60.4% 1.8% 0.1% 0.2% 2.3% 4.7% 0.0% 1.4% 98.6%2013 29.0% 61.2% 2.1% 0.1% 0.2% 2.5% 5.0% 0.0% 1.6% 98.4%2014 28.0% 61.9% 1.9% 0.1% 0.2% 2.5% 5.3% 0.0% 1.5% 98.5%2015 26.2% 65.1% 2.0% 0.1% 0.1% 2.3% 4.2% 0.0% 1.4% 98.6%2016 25.9% 66.9% 2.0% 0.1% 0.2% 2.1% 2.8% 0.0% 1.5% 98.5%2017 27.1% 65.8% 2.5% 0.1% 0.1% 2.2% 2.2% 0.0% 1.6% 98.4%2018 27.6% 66.3% 2.0% 0.1% 0.1% 2.3% 1.6% 0.0% 1.0% 99.0%2019 27.4% 67.2% 1.7% 0.1% 0.1% 2.3% 1.2% 0.0% 1.4% 98.6%2020 28.0% 66.3% 2.2% 0.1% 0.1% 2.2% 1.0% 0.0% 1.5% 98.5%2021 27.7% 67.0% 2.0% 0.1% 0.1% 2.2% 0.8% 0.0% 1.4% 98.6%
Source:
Georgia Department of Revenue, Tax Digest Consolidation SummaryBulloch County Consolidation & Evaluation of Digest submitted to City Tax Office
1 All property is assessed at 40% of fair market value.2 Tax rates expressed in rate per $1,000
Notes:
City of Statesboro, GeorgiaTaxable Assessed Value and Estimated Actual Value of Property
Last Ten Fiscal Years
Amounts
Percentages
S-10

City Bulloch TotalFiscal Direct Bulloch County State of Total OverlappingYear Rate County Schools Georgia2
Overlapping and Direct
2012 6.358 10.440 9.450 0.250 20.140 26.4982013 6.358 10.440 9.950 0.200 20.590 26.9482014 6.358 10.440 9.950 0.200 20.590 26.9482015 6.358 10.440 9.950 0.200 20.590 26.9482016 6.358 10.440 9.950 0.200 20.590 26.9482017 6.358 10.440 9.950 0.200 20.590 26.9482018 7.308 12.340 9.685 0.200 22.225 29.5332019 7.308 12.340 9.685 0.200 22.225 29.5332020 7.308 11.833 9.685 0.200 21.718 29.0262021 7.308 11.833 8.918 0.200 20.951 28.259
Source:
Georgia Department of Revenue, Property Tax Division
1 Overlapping rates are those of Bulloch County governments and the State of Georgia
that apply to property owners within the City of Statesboro.2 The State of Georgia levies one fifth of one mill on each county's taxable property to help finance their certification of each Georgia county's tax digests.
Overlapping Rates 1
Notes:
City of Statesboro, GeorgiaDirect and Overlapping Property Tax Rates
Last Ten Fiscal Years
(rate per $1,000 of assessed taxable value)
S-11

Taxes Levied CollectionsFiscal for the Percentage in Subsequent Percentage PercentageYear Fiscal Year Amount of Levy Years Amount of Levy Amount of Levy
2012 3,691,019 3,675,552 99.58% 15,386 3,690,938 100.00% 81 0.00%2013 3,559,927 3,524,293 99.00% 35,152 3,559,445 99.99% 482 0.01%2014 3,722,640 3,647,594 97.98% 74,897 3,722,491 100.00% 149 0.00%2015 3,935,960 3,923,619 99.69% 12,341 3,935,960 100.00% - 0.00%2016 3,971,469 3,913,446 98.54% 36,531 3,949,977 99.46% 21,492 0.54%2017 4,061,440 4,006,140 98.64% 48,728 4,054,868 99.84% 6,572 0.16%2018 4,726,898 4,677,005 98.94% 48,369 4,725,374 99.97% 1,524 0.03%2019 4,949,303 4,875,197 98.50% 67,863 4,943,060 99.87% 6,243 0.13%2020 5,194,220 5,122,148 98.61% 61,479 5,183,627 99.80% 10,593 0.20%2021 5,378,029 5,329,250 99.09% - 5,329,250 99.09% 48,779 0.91%
Source:
City of Statesboro Tax Office
Fiscal Year of the Levy Total Collections to Date Uncollected Taxes
City of Statesboro, GeorgiaProperty Tax Levies and Collections
Last Ten Fiscal Years
Collected Within the Total
S-12

Percentage Percentageof Total City of Total City
Taxable Taxable Taxable TaxableAssessed Assessed Assessed Assessed
Principal Taxpayer Value Value Principal Taxpayer Value Value
Cottage Row Development, LLC 17,527,605$ 2.33% Statesboro HMA, Inc. 16,468,393$ 2.72%Statesboro HMA Inc. 17,117,617 2.28% Diamond URS Statesboro LLC 11,974,282 1.98%The Hamptons Statesboro LLC 12,750,090 1.70% Executive Assistant of Finance 10,764,102 1.78%Monarch 301 Apts, LLC 11,425,730 1.52% Frontier Communications of GA, Inc. 7,463,914 1.23%Georgia Power 10,963,608 1.46% Claude Howard Lumber Co Inc 7,141,346 1.18%Vesper Forum at Statesboro LLC 10,170,951 1.35% Georgia Power Co. 6,633,708 1.09%Diamond URS Statesboro LLC 9,765,835 1.30% Layton Land LLC & Bonnie Screws 6,253,633 1.03%Layton Land LLC & Bonnie Screws 8,901,918 1.18% Campus Crest at Statesboro 6,251,982 1.03%Centurion Property III South LLC 8,540,299 1.14% Layton Land LLC 5,753,418 0.95%Claude Howard Lumber Co. Inc. 8,260,748 1.10% Statesboro Crossing LLC 5,753,376 0.95%
Total Principal Taxpayers 115,424,401 15.36% Total Principal Taxpayers 84,458,154 13.93%
All Other Taxpayers 636,073,658 84.64% All Other Taxpayers 521,667,754 86.07%
Total 751,498,059$ 100.00% Total 606,125,908$ 100.00%
Source:
City of Statesboro Tax Office
City of Statesboro, Georgia
Principal Property TaxpayersFor the Fiscal Year Ended June 30, 2021 and Nine Years Ago
20122021
S-13
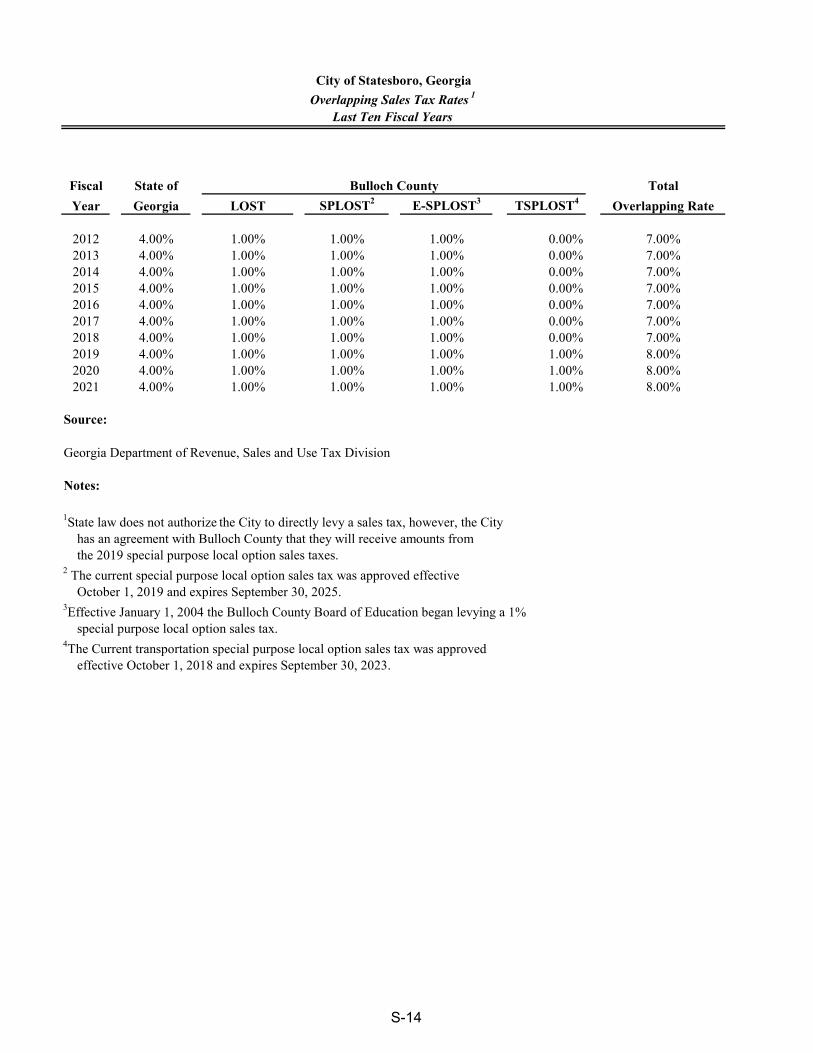
Fiscal State of Total
Year Georgia LOST SPLOST2 E-SPLOST3 TSPLOST4Overlapping Rate
2012 4.00% 1.00% 1.00% 1.00% 0.00% 7.00%2013 4.00% 1.00% 1.00% 1.00% 0.00% 7.00%2014 4.00% 1.00% 1.00% 1.00% 0.00% 7.00%2015 4.00% 1.00% 1.00% 1.00% 0.00% 7.00%2016 4.00% 1.00% 1.00% 1.00% 0.00% 7.00%2017 4.00% 1.00% 1.00% 1.00% 0.00% 7.00%2018 4.00% 1.00% 1.00% 1.00% 0.00% 7.00%2019 4.00% 1.00% 1.00% 1.00% 1.00% 8.00%2020 4.00% 1.00% 1.00% 1.00% 1.00% 8.00%2021 4.00% 1.00% 1.00% 1.00% 1.00% 8.00%
Source:
Georgia Department of Revenue, Sales and Use Tax Division
Notes:
1State law does not authorize the City to directly levy a sales tax, however, the City has an agreement with Bulloch County that they will receive amounts from the 2019 special purpose local option sales taxes.2 The current special purpose local option sales tax was approved effective October 1, 2019 and expires September 30, 2025.3Effective January 1, 2004 the Bulloch County Board of Education began levying a 1% special purpose local option sales tax.4The Current transportation special purpose local option sales tax was approved effective October 1, 2018 and expires September 30, 2023.
City of Statesboro, Georgia
Overlapping Sales Tax Rates 1
Last Ten Fiscal Years
Bulloch County
S-14

If a Customer Has Both Water and Sewer Services, the Rates Are:
Rate per Rate perFiscal Inside Rate per 10,000-19,000 20,000-49,000 50,000 GallonsYear Base Rate 0-9000 Gallons Gallons Gallons and up2012 6.50 2.25 2.35 2.60 3.152013 6.50 2.25 2.35 2.60 3.152014 6.50 2.25 2.35 2.60 3.152015 6.50 2.25 2.35 2.60 3.152016 6.50 2.25 2.35 2.60 3.152017 7.50 2.25 2.35 2.60 3.152018 7.50 2.25 2.35 2.60 3.152019 7.50 2.25 2.35 2.60 3.152020 7.50 2.25 2.35 2.60 3.152021 7.50 2.25 2.35 2.60 3.15
Outside Rate per Rate perFiscal Base Rate per 10,000-19,000 20,000-49,000 50,000 GallonsYear Rate 0-9000 Gallons Gallons Gallons and up2012 13.00 4.50 4.70 5.20 6.302013 13.00 4.50 4.70 5.20 6.302014 13.00 4.50 4.70 5.20 6.302015 13.00 4.50 4.70 5.20 6.302016 13.00 4.50 4.70 5.20 6.302017 15.00 4.50 4.70 5.20 6.302018 15.00 4.50 4.70 5.20 6.302019 15.00 4.50 4.70 5.20 6.302020 15.00 4.50 4.70 5.20 6.302021 15.00 4.50 4.70 5.20 6.30
Inside Rate per Rate perFiscal Base Rate per 10,000-49,000 50,000 GallonsYear Rate 0-9000 Gallons Gallons and up2012 6.50 2.70 2.80 2.902013 6.50 2.70 2.80 2.902014 6.50 2.70 2.80 2.902015 6.50 2.70 2.80 2.902016 6.50 2.70 2.80 2.902017 7.50 2.70 2.80 2.902018 7.50 2.70 2.80 2.902019 7.50 2.70 2.80 2.902020 7.50 2.70 2.80 2.902021 7.50 2.70 2.80 2.90
Outside Rate per Rate perFiscal Base Rate per 10,000-49,000 50,000 GallonsYear Rate 0-9000 Gallons Gallons and up2012 13.00 5.40 5.60 5.802013 13.00 5.40 5.60 5.802014 13.00 5.40 5.60 5.802015 13.00 5.40 5.60 5.802016 13.00 5.40 5.60 5.802017 15.00 5.40 5.60 5.802018 15.00 5.40 5.60 5.802019 15.00 5.40 5.60 5.802020 15.00 5.40 5.60 5.802021 15.00 5.40 5.60 5.80
Note: Rates are based on 5/8" meter, which is the standard household meter size. (continued)
City of Statesboro, GeorgiaWater and Sewer Rates
Fiscal Years 2012 - 2021
Water
S-15

(continued)
If a Residential Customer Has Water Service Only, The Rates Are:
Rate per Rate per Rate perFiscal Inside Rate per 10,000-49,000 20,000-49,000 50,000 GallonsYear Base Rate 0-9000 Gallons Gallons and up and up2012 13.00 2.25 2.35 2.60 3.152013 13.00 2.25 2.35 2.60 3.152014 13.00 2.25 2.35 2.60 3.152015 13.00 2.25 2.35 2.60 3.152016 13.00 2.25 2.35 2.60 3.152017 15.00 2.25 2.35 2.00 3.152018 15.00 2.25 2.35 2.00 3.152019 15.00 2.25 2.35 2.00 4.152020 15.00 2.25 2.35 2.60 3.152021 15.00 2.25 2.35 2.60 3.15
Outside Rate per Rate per Rate perFiscal Base Rate per 10,000-49,000 20,000-49,000 50,000 GallonsYear Rate 0-9000 Gallons Gallons Gallons and up2012 26.00 4.50 4.70 5.20 6.302013 26.00 4.50 4.70 5.20 6.302014 26.00 4.50 4.70 5.20 6.302015 26.00 4.50 4.70 5.20 6.302016 26.00 4.50 4.70 5.20 6.302017 30.00 4.50 4.70 5.20 6.302018 30.00 4.50 4.70 5.20 6.302019 30.00 4.50 4.70 5.20 7.302020 30.00 4.50 4.70 5.20 6.302021 30.00 4.50 4.70 5.20 6.30
If a Customer Has Sewer Service Only, The Rates Are:
Inside Rate per Rate perFiscal Base Rate per 10,000-49,000 50,000 GallonsYear Rate 0-9000 Gallons Gallons and up2012 13.00 2.70 2.80 2.902013 13.00 2.70 2.80 2.902014 13.00 2.70 2.80 2.902015 13.00 2.70 2.80 2.902016 13.00 2.70 2.80 2.902017 15.00 2.70 2.80 2.902018 15.00 2.70 2.80 2.902019 15.00 2.70 2.80 2.902020 15.00 2.70 2.80 2.902021 15.00 2.70 2.80 2.90
Outside Rate per Rate perFiscal Base Rate per 10,000-49,000 50,000 GallonsYear Rate 0-9000 Gallons Gallons and up2012 26.00 5.40 5.60 5.802013 26.00 5.40 5.60 5.802014 26.00 5.40 5.60 5.802015 26.00 5.40 5.60 5.802016 26.00 5.40 5.60 5.802017 30.00 5.40 5.60 5.802018 30.00 5.40 5.60 5.802019 30.00 5.40 5.60 5.802020 30.00 5.40 5.60 5.802021 30.00 5.40 5.60 5.80
Sewer
Note: Rates are based on 5/8" meter, which is the standard household meter size.
City of Statesboro, GeorgiaWater and Sewer Rates
Fiscal Years 2012 - 2021
Water
S-16

Type of Customer Gallons % Gallons % Gallons % Gallons % Gallons %
Residential 527.3 47% 565.8 51% 557.7 51% 554.9 50% 582.9 52%Industrial 159.7 14% 55.9 5% 65.0 6% 81.0 7% 75.0 7%Commercial 255.5 23% 258.8 23% 241.5 22% 239.8 21% 231.4 21%Government 178.5 16% 239.7 21% 233.1 21% 240.6 22% 221.0 20%
Total 1,121.0 100% 1,120.2 100% 1,097.3 100% 1,116.3 100% 1,110.3 100%
Type of Customer Gallons % Gallons % Gallons % Gallons % Gallons %
Residential 596.0 52.3% 573.6 50.3% 567.1 51% 642.7 53% 678.5 53%Industrial 85.2 7.5% 91.9 8.1% 91.6 8% 69.9 6% 65.5 5%Commercial 247.8 21.7% 237.2 20.8% 249.7 23% 257.0 21% 263.7 21%Government 211.2 18.5% 236.8 20.8% 194.4 18% 245.5 20% 261.5 21%
Total 1,140.2 100% 1,139.5 100% 1,102.8 100% 1,215.1 100% 1,269.2 100%
City of Statesboro, Georgia
(in millions of gallons)
Last Ten Fiscal Years
Fiscal Year Fiscal Year Fiscal Year Fiscal YearFiscal Year
Fiscal Year2015 2016
Fiscal Year2012 2013
Fiscal Year2014
Fiscal Year Fiscal Year
2019
Water Sold by Type of Customer
202120202017 2018
S-17
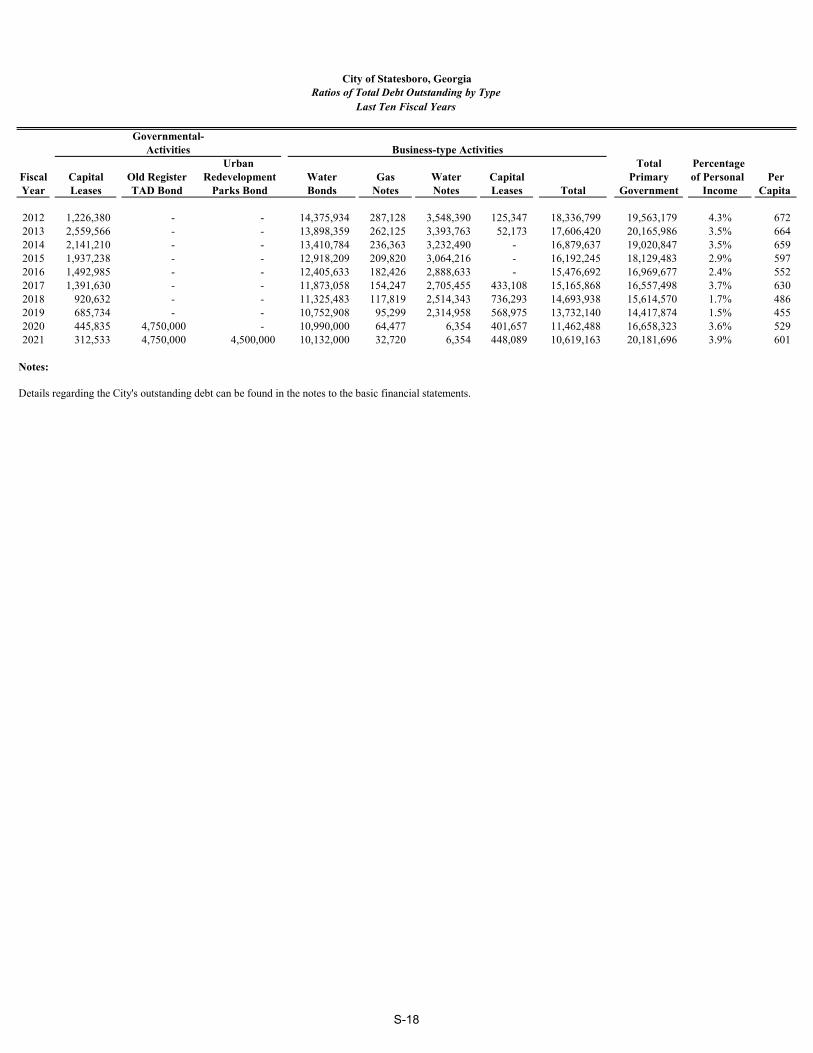
Urban Total Percentage Fiscal Capital Old Register Redevelopment Water Gas Water Capital Primary of Personal PerYear Leases TAD Bond Parks Bond Bonds Notes Notes Leases Total Government Income Capita
2012 1,226,380 - - 14,375,934 287,128 3,548,390 125,347 18,336,799 19,563,179 4.3% 6722013 2,559,566 - - 13,898,359 262,125 3,393,763 52,173 17,606,420 20,165,986 3.5% 6642014 2,141,210 - - 13,410,784 236,363 3,232,490 - 16,879,637 19,020,847 3.5% 6592015 1,937,238 - - 12,918,209 209,820 3,064,216 - 16,192,245 18,129,483 2.9% 5972016 1,492,985 - - 12,405,633 182,426 2,888,633 - 15,476,692 16,969,677 2.4% 5522017 1,391,630 - - 11,873,058 154,247 2,705,455 433,108 15,165,868 16,557,498 3.7% 6302018 920,632 - - 11,325,483 117,819 2,514,343 736,293 14,693,938 15,614,570 1.7% 4862019 685,734 - - 10,752,908 95,299 2,314,958 568,975 13,732,140 14,417,874 1.5% 4552020 445,835 4,750,000 - 10,990,000 64,477 6,354 401,657 11,462,488 16,658,323 3.6% 5292021 312,533 4,750,000 4,500,000 10,132,000 32,720 6,354 448,089 10,619,163 20,181,696 3.9% 601
Notes:
Details regarding the City's outstanding debt can be found in the notes to the basic financial statements.
Business-type Activities
City of Statesboro, GeorgiaRatios of Total Debt Outstanding by Type
Last Ten Fiscal Years
ActivitiesGovernmental-
S-18
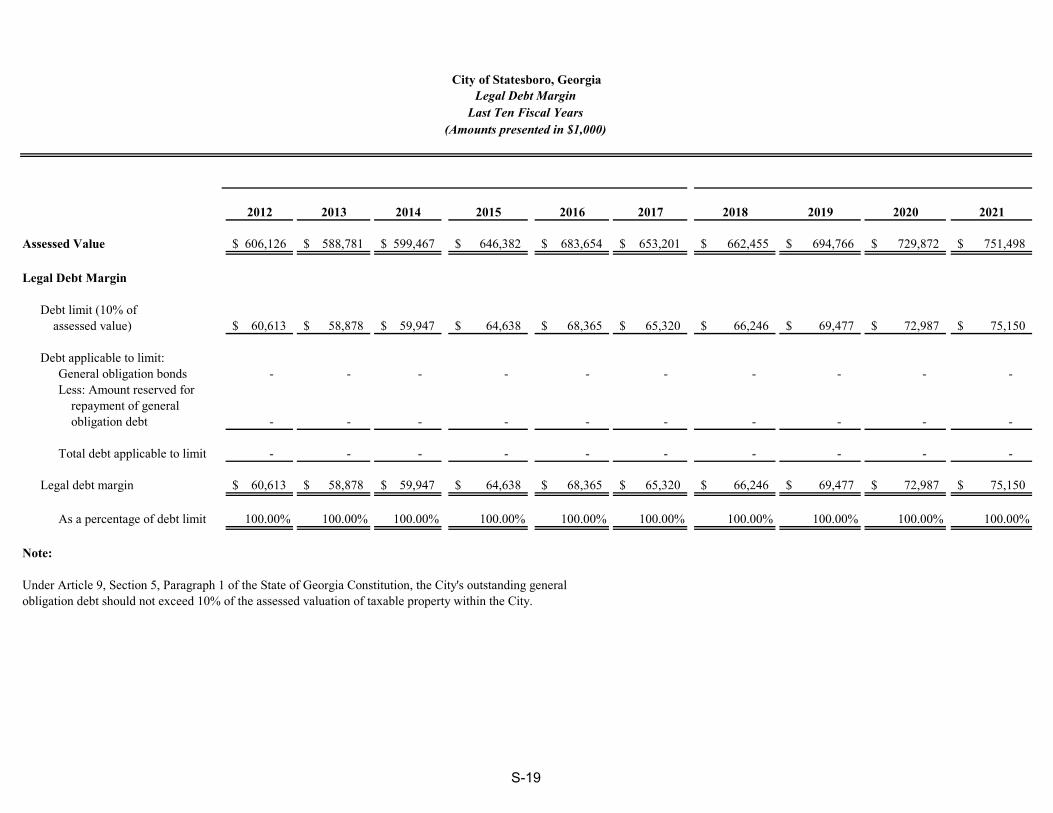
2012 2013 2014 2015 2016 2017 2018 2019 2020 2021
Assessed Value 606,126$ 588,781$ 599,467$ 646,382$ 683,654$ 653,201$ 662,455$ 694,766$ 729,872$ 751,498$
Legal Debt Margin
Debt limit (10% of assessed value) 60,613$ 58,878$ 59,947$ 64,638$ 68,365$ 65,320$ 66,246$ 69,477$ 72,987$ 75,150$
Debt applicable to limit:General obligation bonds - - - - - - - - - -Less: Amount reserved for repayment of general obligation debt - - - - - - - - - -
Total debt applicable to limit - - - - - - - - - -
Legal debt margin 60,613$ 58,878$ 59,947$ 64,638$ 68,365$ 65,320$ 66,246$ 69,477$ 72,987$ 75,150$
As a percentage of debt limit 100.00% 100.00% 100.00% 100.00% 100.00% 100.00% 100.00% 100.00% 100.00% 100.00%
Note:
Under Article 9, Section 5, Paragraph 1 of the State of Georgia Constitution, the City's outstanding general obligation debt should not exceed 10% of the assessed valuation of taxable property within the City.
City of Statesboro, GeorgiaLegal Debt Margin
Last Ten Fiscal Years
(Amounts presented in $1,000)
S-19

AmountEstimated Applicable to
Debt Percentage Primary
Governmental Unit Outstanding Applicable Government
Debt Repaid With Property Taxes
Bulloch County Board of Education1 24,500,000$ 100.0% 24,500,000$
City Direct Debt 312,533
Total Direct and Overlapping Debt 24,812,533$
Source:
1 Bulloch County Board of Education
Notes:
2 Overlapping governments are those that coincide, at least in part, with the geographic boundaries of the City.3 For debt repaid with property taxes, the percentage of overlapping debt applicable is estimated using assessed property values. Applicable percentages were estimated by determining the portion of another government unit's assessed value that is within the City's boundaries and dividing it by each unit's total assessed value.
City of Statesboro, GeorgiaDirect and Overlapping Debt
June 30, 2021
S-20
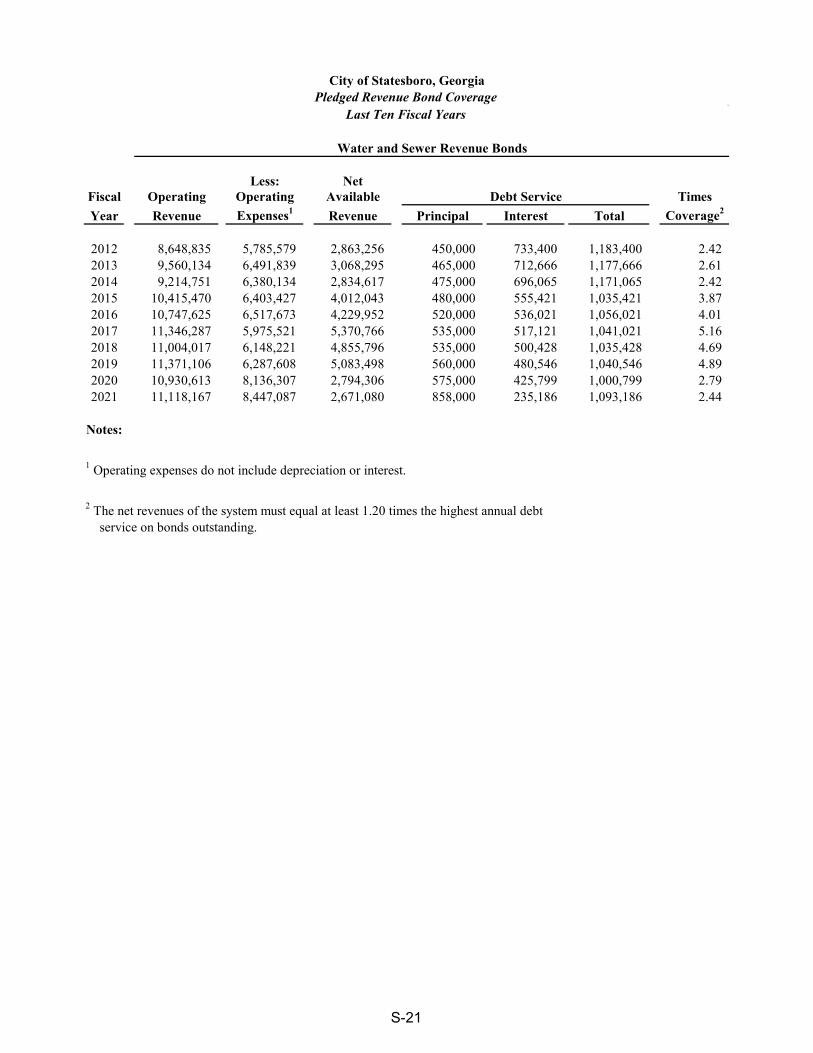
Less: NetFiscal Operating Operating Available Times
Year Revenue Expenses1Revenue Principal Interest Total Coverage2
2012 8,648,835 5,785,579 2,863,256 450,000 733,400 1,183,400 2.422013 9,560,134 6,491,839 3,068,295 465,000 712,666 1,177,666 2.612014 9,214,751 6,380,134 2,834,617 475,000 696,065 1,171,065 2.422015 10,415,470 6,403,427 4,012,043 480,000 555,421 1,035,421 3.872016 10,747,625 6,517,673 4,229,952 520,000 536,021 1,056,021 4.012017 11,346,287 5,975,521 5,370,766 535,000 517,121 1,041,021 5.162018 11,004,017 6,148,221 4,855,796 535,000 500,428 1,035,428 4.692019 11,371,106 6,287,608 5,083,498 560,000 480,546 1,040,546 4.892020 10,930,613 8,136,307 2,794,306 575,000 425,799 1,000,799 2.792021 11,118,167 8,447,087 2,671,080 858,000 235,186 1,093,186 2.44
Notes:
1 Operating expenses do not include depreciation or interest.
2 The net revenues of the system must equal at least 1.20 times the highest annual debt service on bonds outstanding.
Debt Service
City of Statesboro, GeorgiaPledged Revenue Bond Coverage
Last Ten Fiscal Years
Water and Sewer Revenue Bonds
S-21

Percentage PercentageNumber of of Total City Number of of Total City
Employer Employees Employment Employer Employees Employment
Georgia Southern University 4,993 36.96% Georgia Southern University 2,340 21.47%Bulloch County Board of Education 1,699 12.57% Bulloch County Board of Education 1,390 12.75%Bulloch County Board of Commissioners 948 7.02% East Georgia Regional Medical Center 615 5.64%East Georgia Regional Medical Center 962 7.12% Wal-Mart Supercenter 550 5.05%Pineland Area Community Service Board 372 2.75% Bulloch County Board of Commissioners 370 3.40%Wal-Mart Supercenter 363 2.69% City of Statesboro 264 2.42%City of Statesboro 311 2.30% Lowe's Home Center 120 1.10%Lowe's Home Center 225 1.67% Belk 110 1.01%Sizemore 122 0.90% Braswells 99 0.91%Claude Howard Lumber 190 1.41% Statesboro Herald 75 0.69%
Total Principal Employers 10,185 75.38% Total Principal Employers 5,933 54.44%
Other Employers 3,326 24.62% Other Employers 4,965 45.56%
Total All Employers 13,511 100.00% Total All Employers 10,898 100.00%
Source: All Employers H/R DepartmentDepartment of Labor - StatesboroBulloch County Board of EducationBulloch County Board of CommissionersEast Georgia Medical Center Human Resource DepartmentWal-Mart Super Center People DepartmentChamber of Commerce
2021
City of Statesboro, GeorgiaPrincipal Employers
For the Fiscal Year Ended June 30, 2021 and Nine Years Ago
2012
S-22

PerEstimated Personal Capita Median School Unemployment
Year Population Income Income Age Enrollment Rate
2012 29,104 457,049,216 15,704 29 9,890 10.2%2013 30,382 577,744,112 19,016 22 9,858 14.3%2014 28,844 548,728,256 19,024 22 9,861 12.0%2015 30,367 635,854,613 20,939 23 10,342 8.9%2016 30,721 699,302,123 22,763 23 10,185 8.9%2017 31,238 798,849,374 25,573 23 10,533 6.5%2018 32,101 912,438,824 28,424 23 10,473 5.1%
2019 31,667 945,829,956 29,868 22 10,634 4.5%2020 31,495 465,464,605 14,779 23 11,100 5.3%2021 33,604 523,953,568 15,592 22 10,900 7.0%
Sources:Suburbanstats.org/statesboro/gaZoomprospector.com/communitydetail.Georgia Department of Education Department of Laborcensus.gov/quickfacts
City of Statesboro, GeorgiaDemographic and Economic Statistics
Last Ten Years
S-23
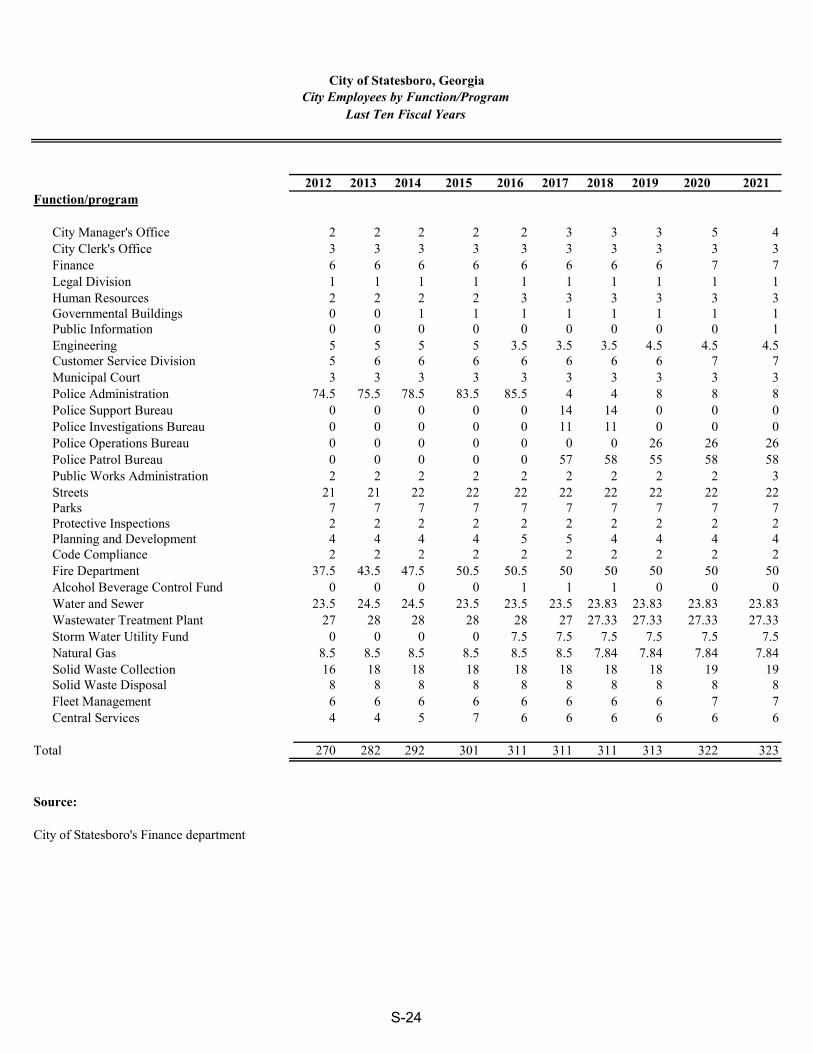
2012 2013 2014 2015 2016 2017 2018 2019 2020 2021Function/program
City Manager's Office 2 2 2 2 2 3 3 3 5 4City Clerk's Office 3 3 3 3 3 3 3 3 3 3Finance 6 6 6 6 6 6 6 6 7 7Legal Division 1 1 1 1 1 1 1 1 1 1Human Resources 2 2 2 2 3 3 3 3 3 3Governmental Buildings 0 0 1 1 1 1 1 1 1 1Public Information 0 0 0 0 0 0 0 0 0 1Engineering 5 5 5 5 3.5 3.5 3.5 4.5 4.5 4.5Customer Service Division 5 6 6 6 6 6 6 6 7 7Municipal Court 3 3 3 3 3 3 3 3 3 3Police Administration 74.5 75.5 78.5 83.5 85.5 4 4 8 8 8Police Support Bureau 0 0 0 0 0 14 14 0 0 0Police Investigations Bureau 0 0 0 0 0 11 11 0 0 0Police Operations Bureau 0 0 0 0 0 0 0 26 26 26Police Patrol Bureau 0 0 0 0 0 57 58 55 58 58Public Works Administration 2 2 2 2 2 2 2 2 2 3Streets 21 21 22 22 22 22 22 22 22 22Parks 7 7 7 7 7 7 7 7 7 7Protective Inspections 2 2 2 2 2 2 2 2 2 2Planning and Development 4 4 4 4 5 5 4 4 4 4Code Compliance 2 2 2 2 2 2 2 2 2 2Fire Department 37.5 43.5 47.5 50.5 50.5 50 50 50 50 50Alcohol Beverage Control Fund 0 0 0 0 1 1 1 0 0 0Water and Sewer 23.5 24.5 24.5 23.5 23.5 23.5 23.83 23.83 23.83 23.83Wastewater Treatment Plant 27 28 28 28 28 27 27.33 27.33 27.33 27.33Storm Water Utility Fund 0 0 0 0 7.5 7.5 7.5 7.5 7.5 7.5Natural Gas 8.5 8.5 8.5 8.5 8.5 8.5 7.84 7.84 7.84 7.84Solid Waste Collection 16 18 18 18 18 18 18 18 19 19Solid Waste Disposal 8 8 8 8 8 8 8 8 8 8Fleet Management 6 6 6 6 6 6 6 6 7 7Central Services 4 4 5 7 6 6 6 6 6 6
Total 270 282 292 301 311 311 311 313 322 323
Source:
City of Statesboro's Finance department
City of Statesboro, GeorgiaCity Employees by Function/Program
Last Ten Fiscal Years
S-24
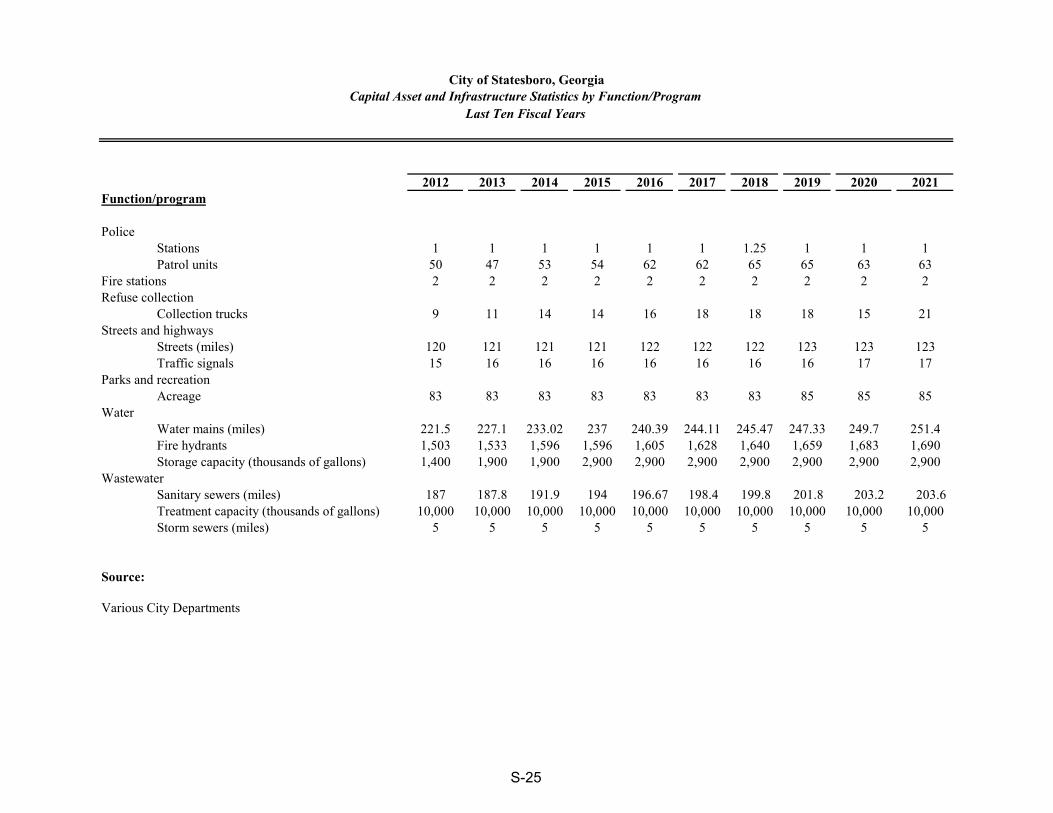
2012 2013 2014 2015 2016 2017 2018 2019 2020 2021Function/program
PoliceStations 1 1 1 1 1 1 1.25 1 1 1Patrol units 50 47 53 54 62 62 65 65 63 63
Fire stations 2 2 2 2 2 2 2 2 2 2Refuse collection
Collection trucks 9 11 14 14 16 18 18 18 15 21Streets and highways
Streets (miles) 120 121 121 121 122 122 122 123 123 123Traffic signals 15 16 16 16 16 16 16 16 17 17
Parks and recreationAcreage 83 83 83 83 83 83 83 85 85 85
WaterWater mains (miles) 221.5 227.1 233.02 237 240.39 244.11 245.47 247.33 249.7 251.4Fire hydrants 1,503 1,533 1,596 1,596 1,605 1,628 1,640 1,659 1,683 1,690Storage capacity (thousands of gallons) 1,400 1,900 1,900 2,900 2,900 2,900 2,900 2,900 2,900 2,900
WastewaterSanitary sewers (miles) 187 187.8 191.9 194 196.67 198.4 199.8 201.8 203.2 203.6Treatment capacity (thousands of gallons) 10,000 10,000 10,000 10,000 10,000 10,000 10,000 10,000 10,000 10,000Storm sewers (miles) 5 5 5 5 5 5 5 5 5 5
Source:
Various City Departments
City of Statesboro, GeorgiaCapital Asset and Infrastructure Statistics by Function/Program
Last Ten Fiscal Years
S-25
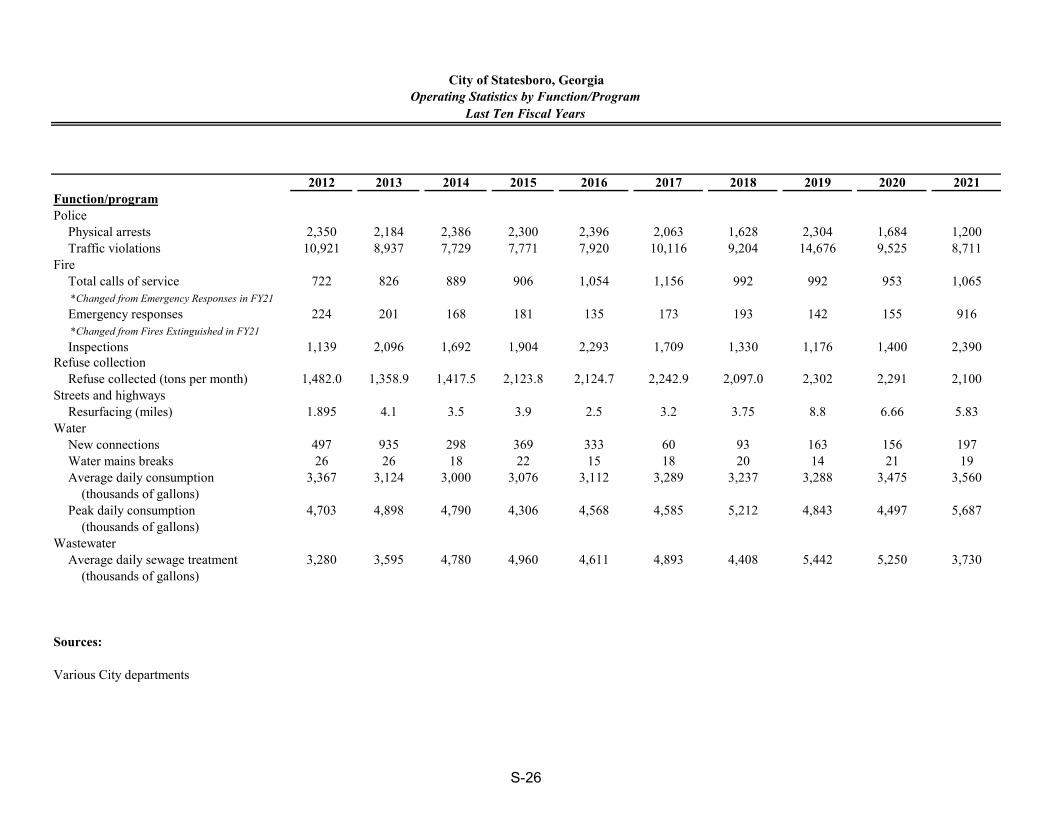
2012 2013 2014 2015 2016 2017 2018 2019 2020 2021Function/programPolice
Physical arrests 2,350 2,184 2,386 2,300 2,396 2,063 1,628 2,304 1,684 1,200Traffic violations 10,921 8,937 7,729 7,771 7,920 10,116 9,204 14,676 9,525 8,711
FireTotal calls of service 722 826 889 906 1,054 1,156 992 992 953 1,065 *Changed from Emergency Responses in FY21
Emergency responses 224 201 168 181 135 173 193 142 155 916 *Changed from Fires Extinguished in FY21
Inspections 1,139 2,096 1,692 1,904 2,293 1,709 1,330 1,176 1,400 2,390Refuse collection
Refuse collected (tons per month) 1,482.0 1,358.9 1,417.5 2,123.8 2,124.7 2,242.9 2,097.0 2,302 2,291 2,100Streets and highways
Resurfacing (miles) 1.895 4.1 3.5 3.9 2.5 3.2 3.75 8.8 6.66 5.83Water
New connections 497 935 298 369 333 60 93 163 156 197Water mains breaks 26 26 18 22 15 18 20 14 21 19Average daily consumption 3,367 3,124 3,000 3,076 3,112 3,289 3,237 3,288 3,475 3,560 (thousands of gallons)Peak daily consumption 4,703 4,898 4,790 4,306 4,568 4,585 5,212 4,843 4,497 5,687 (thousands of gallons)
WastewaterAverage daily sewage treatment 3,280 3,595 4,780 4,960 4,611 4,893 4,408 5,442 5,250 3,730 (thousands of gallons)
Sources:
Various City departments
City of Statesboro, GeorgiaOperating Statistics by Function/Program
Last Ten Fiscal Years
S-26

LANIER, DEAL & PROCTOR
INDEPENDENT AUDITOR’S REPORT ON INTERNAL CONTROL OVER FINANCIAL REPORTING AND ON COMPLIANCE AND OTHER MATTERS BASED
ON AN AUDIT OF FINANCIAL STATEMENTS PERFORMED IN ACCORDANCE WITH GOVERNMENT AUDITING STANDARDS
To the City Council City of Statesboro, Georgia
We have audited, in accordance with the auditing standards generally accepted in the United States of America and the standards applicable to financial audits contained in Government Auditing Standards issued by the Comptroller General of the United States, the financial statements of the governmental activities, the business-type activities, the discretely presented component unit, each major fund, and the aggregate remaining fund information of City of Statesboro, Georgia, as of and for the year ended June 30, 2021, and the related notes to the financial statements, which collectively comprise the City of Statesboro’s basic financial statements and have issued our report thereon dated December 29, 2021.
Internal Control Over Financial Reporting
In planning and performing our audit, we considered the City of Statesboro, Georgia’s internal control over financial reporting (internal control) to determine the audit procedures that are appropriate in the circumstances for the purpose of expressing our opinions on the financial statements, but not for the purpose of expressing an opinion on the effectiveness of City of Statesboro’s internal control. Accordingly, we do not express an opinion on the effectiveness of City of Statesboro, Georgia’s internal control.
A deficiency in internal control exists when the design or operation of a control does not allow management or employees, in the normal course of performing their assigned functions, to prevent, or detect and correct misstatements on a timely basis. A material weakness is a deficiency, or a combination of deficiencies, in internal control such that there is a reasonable possibility that a material misstatement of the entity’s financial statements will not be prevented, or detected and corrected on a timely basis. A significant deficiency is a deficiency, or a combination of deficiencies, in internal control that is less severe than a material weakness, yet important enough to merit attention by those charged with governance.
CERTIFIED PUBLIC ACCOUNTANTS
201 SOUTH ZETTEROWER AVENUE
P.O. BOX 505
STATESBORO, GEORGIA 30459
PHONE (912) 489-8756
FAX (912) 489-1243
MEMBERS
AMERICAN INSITUTE OF CERTIFIED
PUBLIC ACCOUNTANTS
GEORGIA SOCIETY OF CERTIFIED
PUBLIC ACCOUNTANTS
WILLIAM RUSSELL LANIER, CPA
RICHARD N. DEAL, CPA, CGMA
KAY S. PROCTOR, CPA, CFE, CGMA
WILLIAM BLAKE BLOSER, CPA
TIFFANY D. JENKINS, CPA, CGMA
RICHARD N. DEAL II, CPA
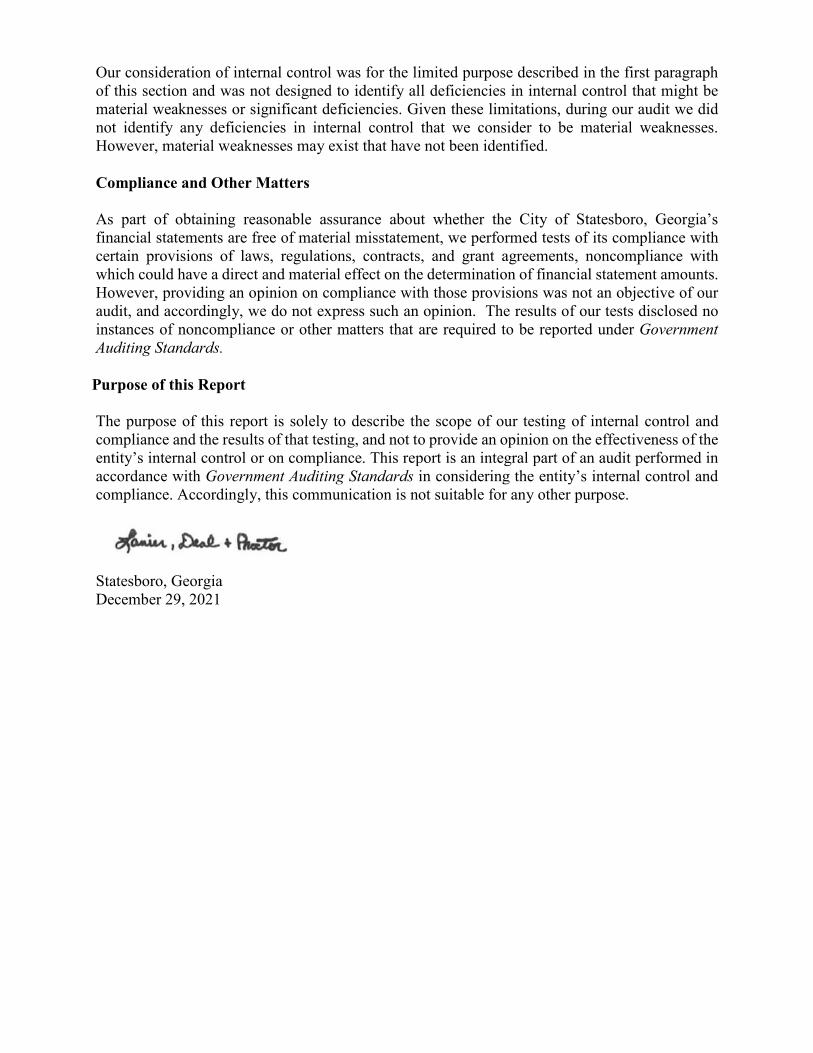
Our consideration of internal control was for the limited purpose described in the first paragraph of this section and was not designed to identify all deficiencies in internal control that might be material weaknesses or significant deficiencies. Given these limitations, during our audit we did not identify any deficiencies in internal control that we consider to be material weaknesses. However, material weaknesses may exist that have not been identified.
Compliance and Other Matters
As part of obtaining reasonable assurance about whether the City of Statesboro, Georgia’s financial statements are free of material misstatement, we performed tests of its compliance with certain provisions of laws, regulations, contracts, and grant agreements, noncompliance with which could have a direct and material effect on the determination of financial statement amounts. However, providing an opinion on compliance with those provisions was not an objective of our audit, and accordingly, we do not express such an opinion. The results of our tests disclosed no instances of noncompliance or other matters that are required to be reported under Government Auditing Standards.
Purpose of this Report
The purpose of this report is solely to describe the scope of our testing of internal control and compliance and the results of that testing, and not to provide an opinion on the effectiveness of the entity’s internal control or on compliance. This report is an integral part of an audit performed in accordance with Government Auditing Standards in considering the entity’s internal control and compliance. Accordingly, this communication is not suitable for any other purpose.
Statesboro, Georgia December 29, 2021

Single Audit Section
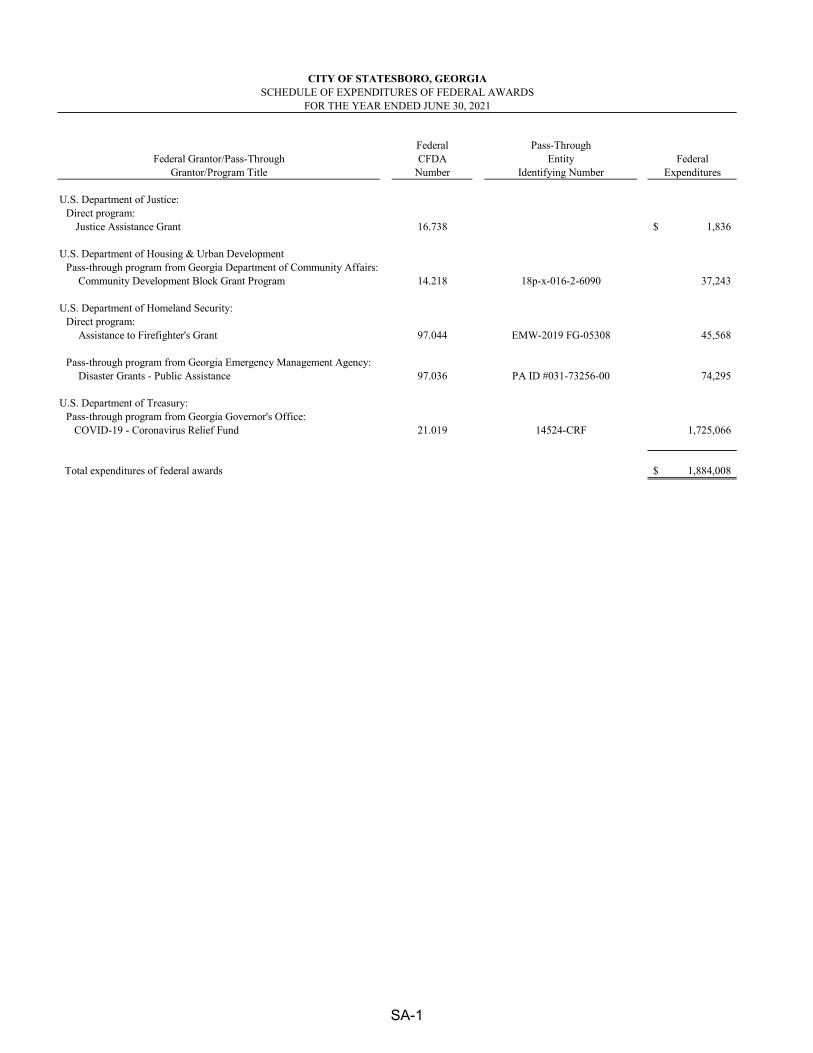
Federal Pass-Through
Federal Grantor/Pass-Through CFDA Entity Federal
Grantor/Program Title Number Identifying Number Expenditures
U.S. Department of Justice:
Direct program:
Justice Assistance Grant 16.738 1,836$
U.S. Department of Housing & Urban Development
Pass-through program from Georgia Department of Community Affairs:
Community Development Block Grant Program 14.218 18p-x-016-2-6090 37,243
U.S. Department of Homeland Security:Direct program:
Assistance to Firefighter's Grant 97.044 EMW-2019 FG-05308 45,568
Pass-through program from Georgia Emergency Management Agency:
Disaster Grants - Public Assistance 97.036 PA ID #031-73256-00 74,295
U.S. Department of Treasury:Pass-through program from Georgia Governor's Office:
COVID-19 - Coronavirus Relief Fund 21.019 14524-CRF 1,725,066
Total expenditures of federal awards 1,884,008$
CITY OF STATESBORO, GEORGIA
SCHEDULE OF EXPENDITURES OF FEDERAL AWARDS
FOR THE YEAR ENDED JUNE 30, 2021
SA-1
SA-2
CITY OF STATESBORO, GEORGIA NOTES TO SCHEDULE OF EXPENDITURES OF FEDERAL AWARDS
FOR THE YEAR ENDED JUNE 30, 2021
NOTE A – BASIS OF PRESENTATION
The accompanying schedule of expenditures of federal awards (the Schedule) includes the federal award activity of the City of Statesboro, Georgia under programs of the federal government for the year ended June 30, 2021. The information in this schedule is presented in accordance with the requirements of Title 2 U.S. Code of Federal Regulations Part 200, Uniform Administrative Requirements, Cost Principles, and Audit Requirements for Federal Awards (Uniform Guidance). Because the Schedule presents only a selected portion of the operations of the City of Statesboro, Georgia, it is not intended to and does not present the financial position, changes in net position, or cash flows of the City of Statesboro, Georgia.
NOTE B – SUMMARY OF SIGNIFICANT ACCOUNTING POLICIES
1. Expenditures reported on the Schedule are reported on the accrual basis of accounting. Such expenditures are recognized following the cost principles contained in the Uniform Guidance, wherein certain types of expenditures are not allowable or are limited as to reimbursement.
2. City of Statesboro, Georgia has not elected to use the ten percent de minimis indirect cost rate as allowed under the Uniform Guidance.

INDEPENDENT AUDITOR’S REPORT ON COMPLIANCE FOR EACH MAJOR PROGRAM AND ON INTERNAL CONTROL OVER COMPLIANCE REQUIRED BY
THE UNIFORM GUIDANCE
To the City Council City of Statesboro, Georgia
Report on Compliance for Each Major Federal Program
We have audited City of Statesboro, Georgia’s compliance with the types of compliance requirements described in the OMB Compliance Supplement that could have a direct and material effect on each of City of Statesboro, Georgia’s major federal programs for the year ended June 30, 2021. City of Statesboro, Georgia’s major federal programs are identified in the summary of auditor’s results section of the accompanying schedule of findings and questioned costs.
Management’s Responsibility
Management is responsible for compliance with federal statutes, regulations, and the terms and conditions of its federal awards applicable to its federal programs.
Auditor’s Responsibility
Our responsibility is to express an opinion on compliance for each of City of Statesboro, Georgia’s major federal programs based on our audit of the types of compliance requirements referred to above. We conducted our audit of compliance in accordance with auditing standards generally accepted in the United States of America; the standards applicable to financial audits contained in Government Auditing Standards, issued by the Comptroller General of the United States; and the audit requirements of Title 2 U.S. Code of Federal Regulations Part 200, Uniform Administrative Requirements, Cost Principles, and Audit Requirements for Federal Awards (Uniform Guidance). Those standards and the Uniform Guidance require that we plan and perform the audit to obtain reasonable assurance about whether noncompliance with the types of compliance requirements referred to above that could have a direct and material effect on a major federal program occurred. An audit includes examining, on a test basis, evidence about the City of Statesboro, Georgia’s compliance with those requirements and performing such other procedures as we considered necessary in the circumstances.
We believe that our audit provides a reasonable basis for our opinion on compliance for each major federal program. However, our audit does not provide a legal determination of City of Statesboro, Georgia’s compliance.
LANIER, DEAL & PROCTOR
CERTIFIED PUBLIC ACCOUNTANTS
201 SOUTH ZETTEROWER AVENUE
P.O. BOX 505
STATESBORO, GEORGIA 30459
PHONE (912) 489-8756
FAX (912) 489-1243
MEMBERS
AMERICAN INSITUTE OF CERTIFIED
PUBLIC ACCOUNTANTS
GEORGIA SOCIETY OF CERTIFIED
PUBLIC ACCOUNTANTS
WILLIAM RUSSELL LANIER, CPA
RICHARD N. DEAL, CPA, CGMA
KAY S. PROCTOR, CPA, CFE, CGMA
WILLIAM BLAKE BLOSER, CPA
TIFFANY D. JENKINS, CPA, CGMA
RICHARD N. DEAL II, CPA
SA-3

Opinion on Each Major Federal Program
In our opinion, City of Statesboro, Georgia complied, in all material respects, with the types of compliance requirements referred to above that could have a direct and material effect on each of its major federal programs for the year ended June 30, 2021.
Report on Internal Control over Compliance
Management of City of Statesboro, Georgia is responsible for establishing and maintaining effective internal control over compliance with the types of compliance requirements referred to above. In planning and performing our audit of compliance, we considered City of Statesboro, Georgia’s internal control over compliance with the types of requirements that could have a direct and material effect on each major federal program to determine the auditing procedures that are appropriate in the circumstances for the purpose of expressing an opinion on compliance for each major federal program and to test and report on internal control over compliance in accordance with the Uniform Guidance, but not for the purpose of expressing an opinion on the effectiveness of internal control over compliance. Accordingly, we do not express an opinion on the effectiveness of City of Statesboro, Georgia’s internal control over compliance.
A deficiency in internal control over compliance exists when the design or operation of a control over compliance does not allow management or employees, in the normal course of performing their assigned functions, to prevent, or detect and correct, noncompliance with a type of compliance requirement of a federal program on a timely basis. A material weakness in internal control over compliance is a deficiency, or combination of deficiencies, in internal control over compliance, such that there is a reasonable possibility that material noncompliance with a type of compliance requirement of a federal program will not be prevented, or detected and corrected, on a timely basis. A significant deficiency in internal control over compliance is a deficiency, or a combination of deficiencies, in internal control over compliance with a type of compliance requirement of a federal program that is less severe than a material weakness in internal control over compliance, yet important enough to merit attention by those charged with governance.
Our consideration of internal control over compliance was for the limited purpose described in the first paragraph of this section and was not designed to identify all deficiencies in internal control over compliance that might be material weaknesses or significant deficiencies. We did not identify any deficiencies in internal control over compliance that we consider to be material weaknesses. However, material weaknesses may exist that have not been identified.
The purpose of this report on internal control over compliance is solely to describe the scope of our testing of internal control over compliance and the results of that testing based on the requirements of the Uniform Guidance. Accordingly, this report is not suitable for any other purpose.
Statesboro, Georgia December 29, 2021
SA-4

CITY OF STATESBORO, GEORGIASCHEDULE OF FINDINGS AND QUESTIONED COSTS
YEAR ENDED JUNE 30, 2021
SUMMARY OF AUDITOR’S RESULTS
1. The auditor’s report expresses an unmodified opinion on the financial statements of City of Statesboro, Georgia.
2. No significant deficiencies were disclosed during the audit of the financial statements in the Report on Internal Control Over Financial Reporting and on Compliance and Other Matters Based on an Audit of Financial Statements Performed in Accordance with Government Auditing Standards.
3. No instances of noncompliance material to the financial statements of City of Statesboro, Georgia were disclosed during the audit.
4. No significant deficiencies in internal control over major federal award programs were reported in the Report on Compliance for Each Major Program and on Internal Control Over Compliance Required by the Uniform Guidance.
5. The auditor’s report on compliance for the major federal award programs for City of Statesboro, Georgia expresses an unmodified opinion on all major federal programs.
6. No audit findings relative to the major federal award programs for City of Statesboro, Georgia are reported in this schedule.
7. The program tested as a major program was: COVID-19 Coronavirus Relief Fund, CFDA number 21.019.
8. The threshold used for distinguishing between Type A and B programs was $750,000.
9. City of Statesboro, Georgia was determined not to be a low-risk auditee.
SA-5

CITY OF STATESBORO, GEORGIASCHEDULE OF FINDINGS AND QUESTIONED COSTS
FINDINGS – FINANCIAL STATEMENTS AUDIT
None reported.
FINDINGS AND QUESTIONED COSTS – MAJOR FEDERAL AWARD PROGRAMS AUDIT
None reported.
SA-6
50 East Main Street
Statesboro, GA 30458
www.statesboroga.gov