Embed Size (px)
Citation preview

Research ReportNumber 653
Reviewed January 2010

Carrot Production and Processing in GeorgiaA. Estes Reynolds, Editor
Table of Contents
Carrot Production and Processing in Georgia . . . . . . . . . . . . . . . . . . . . . . . . . . . . . . . . . . . . . . . . . . . . . . . . . . . 7A. Estes Reynolds
Carrot Production Research and Potential for Carrot Production in Georgia . . . . . . . . . . . . . . . . . . . . . . . . . 9Sharad C. Phatak, Jimmy M. Hornbuckle, and Anthony G. Bateman
Georgia Sweet Carrot Project . . . . . . . . . . . . . . . . . . . . . . . . . . . . . . . . . . . . . . . . . . . . . . . . . . . . . . . . . . . . . . . . 13Rick Reed
Effect of Land Preparation on Carrot Production . . . . . . . . . . . . . . . . . . . . . . . . . . . . . . . . . . . . . . . . . . . . . . . 15Sharad C. Phatak, Anthony G. Bateman, and Ernest Cravey
Effect of Early Planting on Carrot Production . . . . . . . . . . . . . . . . . . . . . . . . . . . . . . . . . . . . . . . . . . . . . . . . . . 17Sharad C. Phatak, Anthony G. Bateman, and Ernest Cravey
Germination of Carrot Seed According to the Mass of the Seed . . . . . . . . . . . . . . . . . . . . . . . . . . . . . . . . . . . 19Bryan Maw, Dewayne Dales, Sharad C. Phatak, and Wayne Guerke
Effect of Plant Spacing on Carrot Production . . . . . . . . . . . . . . . . . . . . . . . . . . . . . . . . . . . . . . . . . . . . . . . . . . 25Sharad C. Phatak, Anthony G. Bateman, and Ernest Cravey
Managing Weeds in Carrots . . . . . . . . . . . . . . . . . . . . . . . . . . . . . . . . . . . . . . . . . . . . . . . . . . . . . . . . . . . . . . . . . 27Greg MacDonald
Seedling Diseases of Carrots in South Georgia, 1996-1997 . . . . . . . . . . . . . . . . . . . . . . . . . . . . . . . . . . . . . . . . 29Donald R. Sumner and Sharad C. Phatak
Disease Management in Carrots . . . . . . . . . . . . . . . . . . . . . . . . . . . . . . . . . . . . . . . . . . . . . . . . . . . . . . . . . . . . . . 31J. Danny Gay
Tift County Carrot Variety Trials . . . . . . . . . . . . . . . . . . . . . . . . . . . . . . . . . . . . . . . . . . . . . . . . . . . . . . . . . . . . 33Sharad C. Phatak, Anthony G. Bateman, and Ernest Cravey
Jeff Davis and Wayne County Carrot Variety Trials . . . . . . . . . . . . . . . . . . . . . . . . . . . . . . . . . . . . . . . . . . . . . 39William Terry Kelley, Sharad C. Phatak, Rick Reed, James R. Reid, Randy Franks,Anthony G. Bateman, and Ernest Cravey
Post Harvest Handling of Carrots . . . . . . . . . . . . . . . . . . . . . . . . . . . . . . . . . . . . . . . . . . . . . . . . . . . . . . . . . . . . 47Bill Hurst
Carrot Packinghouse Quality Control System . . . . . . . . . . . . . . . . . . . . . . . . . . . . . . . . . . . . . . . . . . . . . . . . . . 49Stanley Prussia, Wojciech Florkowski, and Zhikang You
Soluble Solids and pH of Supermarket Carrots . . . . . . . . . . . . . . . . . . . . . . . . . . . . . . . . . . . . . . . . . . . . . . . . . 61Sharad C. Phatak, Anthony G. Bateman, and Ernest Cravey
Consumer Acceptance and Physicochemical Measurements of Quality of Georgia Carrots . . . . . . . . . . . . . 63Anna V. A. Resurreccion, William C. Hurst, A. Estes Reynolds, and Sharad Phatak
Value-Added Produce -- Market Niche or Future Staple? . . . . . . . . . . . . . . . . . . . . . . . . . . . . . . . . . . . . . . . . 75Bill Mizelle
Economics . . . . . . . . . . . . . . . . . . . . . . . . . . . . . . . . . . . . . . . . . . . . . . . . . . . . . . . . . . . . . . . . . . . . . . . . . . . . . . . . 81George Westberry
Section I: Progress Report of Georgia Sweet Carrot, Inc., Rodney E. BennettSection II: Cost and Returns, George O. Westberry

List of Participants and Address/Phone ListAlma
Rodney E. BennettBoard of DirectorsGeorgia Sweet Carrot, Inc.Alma, GA
Athens
Bill HurstFPRDL, Department of Food Science &Technology211 Food Science BuildingAthens, GA 30602Phone: 706/542-0993
Bill MizelleDepartment of Ag & Applied EconomicsUniversity of GeorgiaAthens, GA 30602Phone: 706/542-9081
A. Estes ReynoldsFPRDL, Department of Food Science &Technology211 Food Science BuildingAthens, GA 30602706/542-2574
Coffee County
Rick Reed, CEC709 East Ward StreetDouglas, GA 31633-3916Phone: 912/384-1402
Denton
James E. Tate, Sr.Tate FarmsRoute 1, Box 135 Denton, GA 31532
James E. Tate, Jr.Tate FarmsRoute 1, Box 98Denton, GA 31532
Georgia Department of Agriculture
Franklin Fountain411 South Johnson StreetMt. Vernon, GA 30445
Wayne GuerkeGeorgia Department of Agriculture, Seed LabTifton, GA 31793
Griffin
Wojciech FlorkowskiDepartment of Bio & Ag EngineeringGriffin Experiment Station1109 Experiment StreetGriffin, GA 30223-1797770/228-7231
Stanley PrussiaDepartment of Bio & Ag EngineeringGriffin Experiment Station1109 Experiment Street Griffin, GA 30223-1797Phone: 770/228-7217
Anna V. A. ResurreccionCFSQE, Department of Food Science & TechnologyGriffin Experiment StationGriffin, GA 30223770/412-4736
Zhikang YouDepartment of Bio & Ag EngineeringGriffin Experiment Station1109 Experiment StreetGriffin, GA 30223
Jeff Davis County
James Reid, CECP.O. Box 643Hazelhurst, GA 31539-0643Phone: 912/375-6648912/3756648
Screven
Billy BurchBurch Farms1556 Stanfield RdScreven, GA 31560-9499
Tifton
Anthony G. BatemanDepartment of HorticultureCoastal Plains Experiment StationP.O. Box 748Tifton, GA 31793912/3863355
(Tifton continued)
Earnest CraveyDepartment of HorticultureCoastal Plains Experiment StationP.O. Box 748Tifton, GA 31793912/386-3355
Dewayne DalesDepartment of Crop & Soil SciencesCoastal Plains Experiment StationP.O. Box 748Tifton, GA 31793912/386-3353
J. Danny GayDepartment of Plant PathologyRural Development CenterP.O. Box 1209Tifton, GA 31793-1209Phone: 912/386-7495
Jimmy M. HornbuckleDepartment of HorticultureCoastal Plains Experiment StationP.O. Box 748Tifton, GA 31793
William Terry KelleyDepartment of HorticultureRural Development CenterP.O. Box 1209Tifton, GA 31793Phone: 912/386-3442
Greg MacDonaldDepartment of Crop & Soil SciencesRural Development CenterP.O. Box 1209Tifton, GA 31793-1209Phone: 912/386-3194
Bryan MawDepartment of Bio & Ag EngineeringCoastal Plains Experiment StationP.O. Box 748Tifton, GA 31793912/386-3377
Sharad C. PhatakDepartment of HorticultureCoastal Plain Experiment StationP.O. Box 748Tifton, GA 31793-0748Phone: 912/386-3901
Donald R. SumnerDepartment of Plant PathologyCoastal Plains Experiment StationP.O. Box 748Tifton, GA 31793912/386-3158
George O. WestberryDepartment of Ag & Applied EconomicsRural Development CenterP.O. Box 1209Tifton, GA 31793Phone: 912/386-3512
Wayne County
Randy Franks, CECP.O. Box 509Jesup, GA 31545912/427-6865
List of Future Research Needs, etc.
Prussia et al.: Several actions are needed to ensure that carrot marketing next year builds on the successes fromthis year. Expansion of the brand name and enhancement of the reputation of the cooperativedepends on the delivery of shipments with consistent quality. Obtaining consistency depends onthe development and following of procedures, especially for actions that do not show any resultsfor several days. Thus, written procedures and records verifying completion of tasks are veryimportant. Actions needed include:
1. Assign a person with responsibility for Quality Control.2. Develop written procedures for operations as done this year with changes based on
experience.3. Develop a Quality Control Manual with sections in addition to operating procedures.4. Obtain feed-back on marketing from the broker, customers, and consumers.5. Improve measurement methods for quality attributes.
James Reid:Having adequate wind breaks in the fields. Better fertility and water management to improve theproduction problems. Improving knowledge and experience with the planter.
Phatak et al.:Information on Total Carrot Production System, including planting dates, varieties, plantingdensities, row spacing, rotations, and pest management will be needed. Information on marketing,packaging, developing value-added products will increase a market share of Georgia carrots.
Research needs to develop Total Carrot Production System
Tillage: to develop minimum-till systemsFertility: to develop fertility program which minimizes root crackingPlanting Dates: Problems associated with planting dates will be identified and addressed.Will help to provide information on maintaining continuity of supply of carrots.Planting Densities: Proper spacing will reduce culls and thereby increase growers margin ofprofits.Row Spacing: Optimum spacing will be determined for the specific harvest equipment usedby growers; this will help increase marketable yield.Crop Rotations: Rotations are important in reducing diseases, nematodes, weeds, and insectproblems; it is also important in fertility management.Soilborne Diseases: To control the diseases.Nematodes: alternative method of control to reduce production costs.Variety Trials: evaluate various seeds for their adaptability.
Maw, Dales, Phatak:It would be beneficial to determine the mass of seed that is most likely to produce a viableplant.

7
Carrot Production andProcessing in Georgia
Executive Summary
A. Estes ReynoldsDepartment of Food Science and Technology
Athens, Georgia
Carrots have been successfully produced and marketed in Georgia for the past five or six years. Bothfresh carrots for the retail market and processing carrots for baby food and other processed products havebeen produced with significant yields of over 25,000 lb per acre. Success has varied due to a variety ofproduction and marketing problems. Information on planting dates, varieties, planting densities, row spacing,and pest management have been needed to maximize production and reduce input cost.
One essential part of carrot production and marketing is the need to define the quality standardsnecessary for consumer acceptance. Product physical defects can be readily measured, but the flavor andsweetness characteristics must be defined and the parameters affecting these important factors understood.
Georgia Sweet Carrots, Inc.
In the 1996-1997 production year the Georgia Sweet Carrot, Inc. formed a cooperative to producecarrots in Georgia. Approximately 400 acres were planted, and over 360 acres were harvested. The companywas able to pack out about 60% of the production with returns that yielded a profit. They are planning for800 acres for 1997-1998 and 1000 acres for 1998-1999. This production had an economic impact of$1,000,000 in 1996-1997, but should increase to $4,800,000 in 1997-1998.
The potential for producing carrots for the fresh market may be significantly influenced by actionstaken in Florida to return 18,000 acres of muck land to wildlife. This area currently is used for carrotproduction and represents 8% of the U.S. carrots produced. The 1997-1998 production year will be the lastyear this land is available for carrot production. The total U.S. carrot production is valued at $311 million.Georgia farmers can capture 10% of this market over the next 10 years, with potential yearly increases of$1,000,000. This was demonstrated by the present Georgia Sweet Carrot Cooperative’s success in the firstyear, marketing over $500,000 in carrots. The current study’s results indicate that the Georgia carrots werepreferred by consumers over Florida carrots in all areas of acceptability, sweetness, flavor, and texture; thisputs the Georgia carrot industry in a very competitive position.

8
Value Added Carrot Products
Value-added carrot products also have the potential for providing stability to the production of freshmarket carrots. Presently 150 to 200 acres of carrots are produced in Georgia for cooked carrot products suchas baby food. Carrot segments were successfully marketed by the Georgia Sweet Carrot Cooperative, Inc.in their first year of packing. Frozen processed carrots in the form of diced carrots, coins, or bits haveconsiderable market potential in the processed vegetable market. Fresh shredded carrots, carrot sticks, smallpeeled carrots, segments, and match sticks are presently purchased by Georgia firms for retail sales and usein salads and fast food entrees. Processing provides a stability outlet for downgrades and physical appearanceof defective products that cannot be marketed as fresh whole carrots. These product outlets provide incometo increase the value of the total production, thereby making carrot production profitable.
Georgia vs Florida: Consumer Preference
Consumer preferences for carrots were studied on the Georgia varieties selected from the variety fieldtrials and compared to market samples of Florida and California carrots. Consumers preferred the Californiacarrots in flavor and sweetness, but two Georgia carrot varieties were comparable in flavor and quality.Georgia carrots were preferred in all measured traits over the Florida carrots, especially in flavor andsweetness. Among the Georgia carrots, ‘XPH 3973’ and ‘VitaSweet 711’ were most preferred. The ‘XPH3973’ can compete with the California carrots on overall acceptability. Defining the factors that affect theflavor and sweetness of Georgia carrots is important in determining the quality standards necessary tocompete in the market.
Variety Trials and Production Management Practices
The first year’s variety trials provided considerable experience with carrot diseases, weed control,planting practices, germination and land preparation. Significant progress was made in understanding theoptimum production practices needed for Georgia carrot production. Much additional information is needed,however, on tillage, fertility, planting dates, planting densities, row spacing, crop rotation, nematodes, andplant diseases. Several varieties are presently used, while new varieties show promise, especially in the areaof yield and consumer acceptance.
Additional research is needed on a Total Carrot Production System to ensure that the developmentand production of quality carrots will be available to compete with other states in the production of thiscommodity. Quality control, mechanization, marketing and product development lie ahead as areas of neededresearch.
1 Carrot Research was successful because of the hard work and dedicated participation of the late Jimmy M. Hornbuckle.
9
Carrot Production ResearchAnd Potential for Carrot Production in Georgia
Sharad C. Phatak, Jimmy M. Hornbuckle1 and Anthony G. BatemanDepartment of Horticulture, University of Georgia Coastal Plain
Experiment Station, Tifton, GA 31793-0748
Background:
In the late sixties and early seventies, extensive research on carrot production was conducted byCampbell’s Soup Company at its farm in Cairo, Georgia. The objective of the research was to grow carrotsfor processing. Campbell’s factories needed carrots during the spring, from April through June. This researchinformation was not distributed outside of the Campbell’s establishment. Thus, findings of that research werenot available to others. Campbell’s never produced carrots in Georgia commercially.
In October 1975, carrots were planted at the Coastal Plain Experiment Station. All cultivars plantedwere baby carrots. These carrot cultivars produced high quality carrots during the winter months. Due to thesmall size of the carrots, however, yields were less than eight tons per acre. After two to three years ofresearch on baby carrots, it was determined that baby carrot production in Georgia was uneconomical dueto lower yields. After a period of two years, Southern Frozen Food indicated an interest in processing carrots.We were able to produce carrots that met their quality requirements. However, Southern Frozen Foodsdecided to continue bringing carrots from Texas.
During the early nineties there was renewed interest in carrot production in Georgia. This time interestwas in fresh markets as well as in processing carrots. We conducted fresh market and processing cultivartrials for three years. The carrot variety ‘Choctaw’ used by the Georgia growers was one of the best in ourtrial three years in row. It has sufficient top growth for machine harvesting, excellent internal and externalcolor, and essentially no bolting in spring. We also conducted fertility and plant population trials, as wellas many other trials, in order to develop production practices that are currently being used by the Georgiagrowers. These production practices need fine tuning.
Potential for Carrot Production:
Georgia is one of the five leading fresh market vegetable states. In 1994, Georgia ranked fourth inarea harvested and fifth in production and value. Georgia ranks high in the production of watermelons,cabbage, onions, cantaloupes, cucumbers, etc. In 1994, California continued to lead all states in fresh marketvegetables.
10
In 1994, total U.S. production of carrots was $274.9 million ($274,927,000) for fresh market and$35.5 million ($35,534,000) for processing. California lead the nation in fresh market, accounting for over66% of the value, while Washington lead the nation with over 40% of the value for processing carrots.
Soil and climatic conditions in South Georgia are ideal for the production of quality carrots. SouthGeorgia’s sandy soils are better for uniform carrot growth than heavy clay soils. During fall and winter,daytime temperatures are warmer and nights are cooler. These conditions promote sugar storage in carrots,making carrots produced in south Georgia sweeter and having better color than others grown anywhere elsein the continental United States. Carrots grown in Georgia do not have a bitter taste or strong aroma. Thus,on the basis of quality we can compete with carrots from Arizona, Florida, Texas or California. Productiontime in other leading states, such as Michigan, Colorado, Washington, and most other states will not coincidewith Georgia production. Thus, there will be no direct competition.
We have the potential for producing and marketing Georgia carrots all over the eastern United Statesand Canada. At present, carrots are produced in 8 to 10 Georgia counties, and the total carrot crop productionin Georgia is valued at $2.5 million. Presently, Georgia growers have markets for all they are able toproduce. Within the next ten years, with appropriate production and marketing strategies, Georgia can easilycapture 10% of the total market, which is currently worth $311 million. According to many conservativeestimates, there is a potential for $1,000,000 yearly increases in the farm value of carrots for the next 10years. Success, however, will depend on producing and marketing quality carrots.
Georgia growers produce 150 to 200 acres of carrots for Gerber Foods. Campbell’s Soup and Heinz USAare also interested in carrots from Georgia, and their representatives are watching developments in Georgiaclosely.
The short-term goal should be to market the best quality Georgia Carrots from mid-Decemberthrough mid-June. In the future it should be possible to produce, store, and market Georgia carrots through-out the year.
Research:
To achieve these goals, information on a Total Carrot Production System, including planting dates,varieties, planting densities, row spacing, rotations, and pest management will be needed. At present thisinformation has been provided by extrapolating some of the small-scale research which has been conductedat the Coastal Plain Experiment Station off-and-on during the past 20 years. Presently many fresh marketand processing varieties suitable for Georgia climates are available. Breeders from seed companies arereleasing new varieties on a regular basis. Seed companies will develop varieties for Georgia when acreageincreases. Information on marketing, packaging, and research on developing value-added products willincrease a market share of Georgia carrots.
Research on a limited scale may be continued with present support. Carrots are a specialty-crop andrequire special equipment. Research may be expanded with the financial support to purchase new equipmentfor planting, tillage, and harvesting. Equipment needed is available on the market and, thus, there is no needto design new equipment.
11
Problems for Carrot Production in Georgia
1. Lack of uniform stands.2. Loss of stands due to seedling diseases in carrots planted during August and September.3. Loss of stands due to sandblasting.4. Root knot nematodes.5. Maintaining uniform size and length.6. Cracking of roots.7. Southern blight (white mold) in May-June. 8. Maintaining high marketable tonnage (need 10-12 tons per acre to break even).9. Maintaining continuity of supply from mid-December to mid-June (potential through July-end).10. New varieties are introduced by seed companies regularly. Information of performance of these varieties
under Georgia conditions is needed.11. Losses during harvest.12. Weed control.
An ultimate goal should be to market best quality Georgia Carrots from mid-December through mid-June (potential through July-end).
Research Needs to Develop: Total Carrot Production System
Tillage: Research will be conducted to develop minimum-till systems for carrot production. This researchwill help reduce stand reduction from sandblasting and cracking of roots caused by excess nitrogen andfertility imbalance. This research will increase marketable yields and increase growers’ profits.
Fertility: We have a general idea of the fertility requirement of carrots. However, root cracking appears tobe related to excess nitrogen and nutrient imbalance. Objectives of this research include developing afertility program which helps minimize root cracking, probably with reduced fertilizer input. Grower profitswill benefit from this research with increase in marketable yields.
Planting Dates: Carrots will be planted every two weeks beginning August 15 to determine the feasibilityof maintaining continuity of supply of quality carrots from December 15 through June 15 (maybe July 15).Problems associated with planting dates will be identified, and research to solve those problems will beconducted. This research will provide information on maintaining continuity of supply of carrots fromDecember 15 through June 15.
Planting Densities: Various spacing between rows and within rows to maximize marketable yield will beevaluated. Spacing will be adjusted according to the carrot size requirements of the market. Proper spacingwill reduce culls and thereby increase growers margin of profits.
Row Spacing: Harvesting equipment varies greatly and influences row spacing. Optimum row spacing willbe determined for the harvest equipment used by the growers. This research will help increase marketableyield.
12
Crop Rotations: Rotations are important in reducing soilborne diseases, nematodes, weeds, and insectproblems. Rotations are also important in fertility management. Various crop rotations will be studied, withobjectives to reduce pest-disease complex.
Soilborne Diseases: Seedling diseases (pythium, rhizoctonia) reduce stands of carrots planted duringAugust-September. Research will be conducted to control these diseases with fungicides and rotations.Similarly, southern blight (white mold, Sclerotium rolfsii) causes root-rots in carrots harvested during May-June. Crop rotations and fungicides will be studied to reduce this problem.
Nematodes: Carrots are very susceptible to root-knot nematodes. Thus, management of nematodes isimportant for profitable carrot production. Telone is used by growers to control nematodes but it increasescost of production substantially. We plan to study crop rotations to reduce nematodes and reduce productioncosts.
Variety Trials: Varieties developed by seed companies and public institutions will be evaluated for theiradaptability.
13
Georgia Sweet Carrot Project
Rick Reed, County Extension Coordinator, Coffee County
In the fall of 1995, Bill Elliott (SunTrust Bank, Vice-president and a board member of the GeorgiaAg. Business Council) asked me if there were any projects or areas of growth that area growers neededassistance in pursuing. Tommy Irvin (Georgia Commissioner of Agriculture) had said this would be a goodtime to develop support for such an effort. Working with vegetable growers in the Coffee County area forthe past 10 years, I already knew that growers were looking for a crop that could be grown during the wintergrowing season on irrigated land. After much work and discussion, carrots were identified as being that crop.It had already been proven that carrots could be successfully grown in south Georgia. The growers, however,had not been totally satisfied with the marketing effort.
On the evening of December 7,1995, a group of growers and agricultural leaders met in theconference room of the Coffee County Ag Center to discuss the feasibility of growing and marketing carrotsin the southern region of Georgia.
After a number of grower meetings and much discussion, a group of growers from Coffee, JeffDavis, Wayne, Tift, and, later, Bacon counties, was invited by then State Representative Van Street and thenSenator Walter Ray in February of 1996 to meet with their elected state officials in the Georgia GeneralAssembly. The proposed grower co-op was very well received, and the growers were invited to present theseideas again the next week to the House and Senate leadership and with the House Agriculture and ConsumerAffairs Committee to discuss the details on funding proposals to help foster this new commercial ventureto fruition.
The state, through the Ag Committee’s New Crop Budget, funded the carrot harvesting and process-ing equipment. This money went to the University of Georgia School of Agricultural and EnvironmentalSciences to purchase the needed equipment. This equipment was in turn leased to the growers to helpestablish the Georgia Sweet Carrot Growers Cooperative. In the fall of 1996, the growers in the co-op plantedtheir first 350-plus acres of carrots.
To aid these producers, a research team was formed to support the growers’ efforts. This team wascomposed of University of Georgia research scientists, Cooperative Extension Service specialists, andGeorgia Department of Agriculture Vegetable Marketing Division representatives. Their mission was to helpgrowers produce, harvest, and market their carrots; to evaluate their production, harvesting, and marketingpractices; and to identify areas where additional research and support were needed.

14

15
Effect of Land Preparation on Carrot Production
Sharad C. Phatak, Anthony G. Bateman, and Ernest CraveyDepartment of Horticulture, University of Georgia Coastal Plain
Experiment Station, Tifton, GA 31793-0748
Materials and Methods:
Carrots were planted September 10, 1996, on five raised beds 250 ft long using a Monosem planterwith three twin-row planters set 18 in. apart with 0.54 in. (22 seed/ft) seed spacing. Three beds were tilledand allowed to sit 14 days before planting; and two beds were tilled the day of planting. The variety Choctawwas used. Following planting 10-10-10 (150 lbs/A), CAB (gallon/A), and Epson salt (magnesium sulfate,3 lbs/A) were applied four times at two-week intervals when needed. Also, 1.5 in. irrigation was applied tomaintain moisture levels during dry periods. Weeds were controlled using two applications of Lorox (1.5lbs/A).
Samples were taken from four of the five beds from 18 ft2 plots (6 ft wide by 3 ft long) based on acompletely randomized block design with two replications. All carrots within the sampling area were used.In the lab, samples were rinsed, green tops removed, and excess water drained. They were then graded,counted, and weighed. The grades were: (marketable fruit) regular, large, and small; (unmarketable fruit)split, rot, and other. These grades were based on external appearance and size using local supermarket carrotsas a standard.
The standard carrot was 9 to 10 in. long, 1 in. in diameter, orange in color, and fairly smooth.Regular carrots were equal to or exceeded the standard in length by 1 in. or diameter by 0.25 in. Large carrotswere greater than the standard in length (> 1 in. but # 3 in.) or diameter ($ 0.5 in. but # 1 in.). Small carrotswere 2 in. less than the standard in length or 0.25 in. less in diameter. Split and rot carrots were based onphysical damage. Other carrots were either too small or large, poor in color, rough, or deformed.
Refractometer readings were used to measure soluble solids. Three carrots of marketable grade fromeach bed, one per double row, were used in each sampling. These carrots were topped, rinsed, peeled, and1 in. discarded from either end. The samples were then blended to a mulch and juiced using a kitchen sieveand pestle. The juice was filtered using doubled coffee filters. All sampling was done on three different dateswith one week intervals between dates.
Results and Discussion:
The two methods of land preparation were chosen to decide which provided the best growth forcarrots. Land tilled 14 days before planting provided a firm and compact planting surface whereas land tilledthe day of planting had a fluffy unsettled surface. Analysis of data (Table 1) showed significant differencesbetween the two methods. The number (#/A) of marketable, unmarketable, regular, small, and other carrotswas significantly higher for carrots planted on land tilled 14 days before planting. The yield (lbs/A) of small,

16
other, and unmarketable carrots was also significantly higher for carrots planted on land tilled 14 days beforeplanting.
There were no significant differences between the two methods for total marketable yield and solublesolids. However, land tilled 14 days before planting may be the best method for growing carrots because ofthe greater numbers of regular, small, and total marketable carrots.
Table 1. Yield and soluble solids in carrots produced on land tilled 14 daysbefore planting and land tilled the day of planting.
Parameters
Land Preparation
Tilled 14 daysbefore planting
Tilled 0 daysbefore planting
(#/Acre)
Regular 41140* 19763
Large 88733 76633
Small 10487* 1613
Split 403 0
Rot 0 0
Other 32670* 10890
Total marketable 60500* 29040
Total unmarketable 33073* 10890
(Lbs/A)
Regular 14399 8611
Large 5163 5606
Small 1315* 182
Split 242 0
Rot 0 0
Other 7684* 2843
Total marketable 20877 14399
Total unmarketable 7925* 2843
(Brix)
Percent solids 9.75 9.67
* Significantly different according to Duncan’s Multiple Range Test (p=0.05).
17
Effect of Early PlantingOn Carrot Production
Sharad C. Phatak, Anthony G. Bateman, and Ernest Cravey,Department of Horticulture, University of Georgia Coastal Plain
Experiment Station, Tifton, GA 31793-0748
Materials and Methods:
The planting, samples, standard carrot, and refractometer reading procedures and methods followedin this study were identical to those followed as stated in the study by Phatak et al., Effect of LandPreparation on Carrot Production, except that the carrots were planted August 20, 1996, samples were takenfrom two of the five beds with four replications, and for refractometer readings, three carrots of marketablegrade from four of the five beds were used in each sampling.
Results and Discussion:
Three harvest dates were chosen to decide the best time to harvest. The dates were approximatelyone week apart except the third date, which was later due to the holidays. Data analysis (Table 1) showssignificant differences among grade number (#/A) and yields (lb/A) on different dates. Soluble solids werenot significantly different. The number of carrots for each grade did vary with each harvest, but the totalnumber of marketable and unmarketable carrots was not significantly different. By grade, there were nosignificant differences in the number of regular, split, and other carrots; however, the number of large carrotswas significantly different on the third harvest, smalls on the first and third harvest, and rots on the thirdharvest. The yield of regular, small, split, rot, and other carrots was not significantly different, but the yieldof large carrots was on the third harvest. The total yield of marketable carrots was significantly different onthe third harvest, and the total yield of unmarketable carrots was significantly different on the first and thirdharvest. The first harvest date seems acceptable if a greater number of smaller carrots is desired. However,if a greater number of larger carrots is desired, then the third harvest date would be more acceptable.

18
Table 1. Yield and soluble solids in carrots planted August 20, 1996, and harvested on three differentdates.
ParametersHarvest Dates
December 11, 1996 December 17, 1996 January 3, 1997
(#/Acre)
Regular 111,925.0 102,245.0 107,690.0
Large 3,933.0 6,353.0 12,402.0*
Small 40,611.0* 34,258.0 23,595.0*
Split 3,630.0 2,117.0 3,328.0
Rot 0.0 0.0 907.5*
Other 43,182.0 41,669.0 41,443.0
Total marketable 156,468.0 142,856.0 143,687.0
Total unmarketable 46,812.0 43,787.0 45,677.0
(Lbs/A)
Regular 25,879.0 25,349.0 29,418.0
Large 1,724.2 3,115.7 6,609.6*
Small 2,659.4 2,457.7 1,714.1
Split 741.1 620.1 1,421.7
Rot 0.0 0.0 175.5
Other 5,841.0 7,313.0 8,783.0
Total marketable 30,262.0 30,923.0 37,742.0*
Total unmarketable 6,582.0* 7,933.0 10,380.0*
(Brix)
Percent solids 9.0 9.5 9.5
* Significantly different according to Duncan’s Multiple Range Test (p=0.05).

19
Germination of Carrot SeedAccording to the Mass of the Seed
Bryan Maw and Dewayne DalesDepartment of Biological and Agricultural Engineering
Sharad C. Phatak, Department of HorticultureUniversity of Georgia Coastal Plains Experiment Station, Tifton, GA,
and Wayne Guerke, Georgia Department of Agriculture Seed Lab
Introduction:
Approximately 350 acres of carrots, Daucus carota subspecies sativus, were harvested during thespring of 1997 under a co-operative program introducing to Georgia a crop of potential economic merit. Thecarrots are being marketed as sweet carrots to be grown and harvested at a time of the year when carrots ofthis type are needed on the U.S. market. Drilled directly into a seed-bed during the fall of 1996 and grownduring the winter of 1996, the carrots were harvested during March, April, and May of 1997.
Growers experienced several different hindrances to full production. One hindrance was the lack ofa uniform stand of carrots as the seed germinated and the plants grew on the bed. Carrot seed has, by nature,an extended term of germination such that different seed in the same batch can germinate over a period ofdays rather than on the same day. The minimum germination standard required for sale of seed in Georgiais only 55% (Georgia Seed Law, 1997). Seed merchants are likely to give the germination for the seed theyare supplying, but this can vary from one batch to the next. It would be helpful if the window of germinationcould be narrowed and the percentage of viable seed in a sample could be increased as a contribution towardan improved stand. Carrot seed is often sold as sized seed, based upon the physical dimensions of the seed.However, size may not completely signify the viability of the seed.
As well as by size, seed may be sorted by density. One method of sorting by density is to aspiratethe seed and use the buoyancy of the seed in an airstream to determine which seed are carried by theairstream and which remain (Gamiely et al., 1990; Smittle et al., 1976; Smittle and Williamson, 1977 and1978; and Smittle, 1982). Radish, cucumber, snap bean, and onion seed were sorted by these authors. Furtherwork (unpublished) has been conducted by Phatak on turnip seed. In each case, even though having the samesize, seed of different densities once sown showed a variation in germination, growth, yield and sometimesa varying response to nitrogen and seed bed compaction. Even when removing as little as 20% of the seedby aspiration, the mean thickness and weight of the remaining seed was increased and beneficial effectsrealized once the seed was sown.
Objectives:
To establish how the density of carrot seed is influential in the germination of the seed and thus theuniformity of stand after drilling the seed.

20
Materials and Methods:
Carrot seed was sorted by means of a vacuum seed separator designed and built at the Biological andAgricultural Engineering Department, Coastal Plain Experiment Station, Tifton, Georgia. It works on theprinciple of extracting seed of a required density by creating an airstream through the seed mass and carryingthose seed of critical buoyancy from the mass.
The squirrel cage fan was 320 mm (13.0 in.) in diameter and 140 mm (5.5 in.) in width. The speedof the fan was consistently held at 2083 rpm (Extech Instrument Stroboscope tachometer, Digital InstrumentPI21205, Davis Instrumentation, 1-800-368-2516), being driven by a 1.12 kW (1.5 hp), 1725 rpm singlephase electric motor. Airflow for seed separation was generated by leaving the exhaust of the fan open to theatmosphere and providing air to the inlet of the fan through a 101 mm (4 in.) diameter flexible duct. This ductwas attached to a cyclone mounted 2.5 m (8 ft) above the ground. Leading into the cyclone from below wasa vertical composite aluminum and plexiglass straight tube 101 mm (4 in.) in diameter and 2.1 m (7 ft) high,feeding into the base of the cyclone. Seed was placed on a fine mesh drawer and slid horizontally into a spacethrough the wall of the plexiglass tube. Air to the inlet of the fan was drawn up through the seed, into thecyclone, and on into the fan. Seed that was lifted from the mesh by virtue of its buoyancy in the airstreamentered the cyclone and separated from the airstream only to fall down a 0.9 m (3 ft) long tube 50 mm (2in) diameter, into a collecting cup attached by a screw thread onto the base of the tube. The speed of the airpassing through the seed was regulated by controlling the area of the orifice at the base of the aluminum tubebelow the mesh of seed. Depending upon the area of the orifice, less dense seed could be separated from theentire seed mass present upon the mesh. A variable shutter was used to control the area of the orifice.
The seed was of three varieties: ‘Choctaw’ (Sun Seed), ‘Prelude’ (Peto Seed)and ‘Six Pak F1’(Harris Moran). All seed passed through a number 10 mesh (2 mm) sieve and the ‘Six Pak F1’ was specifiedas a size 3 (through a 1.39 mm (7/128 in.) and held on a 1.19 mm (3/64 in.) screen. The ‘Choctaw’ and‘Prelude’ were coated with a thin film of inert material in order to increase the size of the seed for ease ofseed separation during drilling. The ‘Six Pak F1’ was raw, noncoated seed.
For each variety, 32 g of seed as supplied from the seed merchant were place upon the mesh in thedrawer. During pre-testing, positions on the shutter were marked when no seed would be drawn off and thenwhen all the seed would be drawn off the mesh. Multiple positions between those two marks were chosento provide the required levels of seed separation. At each level of airflow, the fan was run for 3 minutes,during which time a percentage of the seed was observed to be withdrawn from the parent mass andtransferred over to the collecting cup. Beginning with the minimum orifice size for seed separation, the sizewas increased for each treatment until all seed had been withdrawn. After each treatment, the seed that wasremoved was weighed (Electronic analytical balance, Denver Instrument Company, 6542 Fig Street, Arvada,Colorado, 80004-1042) in order to calculate by weight the percentage of seed removed. The remaining seedwas also weighed. Of those seed collected at each treatment, 500 were counted, weighed, and later shippedto the Georgia Department of Agriculture seed laboratory at Tifton, Georgia, for testing according to the(Association of Official Seed Analysts, 1993). The remaining seed were kept separate by variety andtreatment, and were stored in a cold room at 34 degrees F.
Once at the seed laboratory, the seed was divided into lots of 25 seed per replication, with 16replications per treatment. The seed was maintained in a dark growth chamber at conditions specified bythe rules for testing seed (Association of Official Seed Analysts, 1993), at a temperature of 20 degrees C for16 h and 30 degrees C for 8 h each day, the seed resting in a petri dish on blotting paper moistened with

21
water. The first count of germination was taken after 6 days and the final count after 14 days, from whicha percentage of germination was calculated.
Results and Discussion:
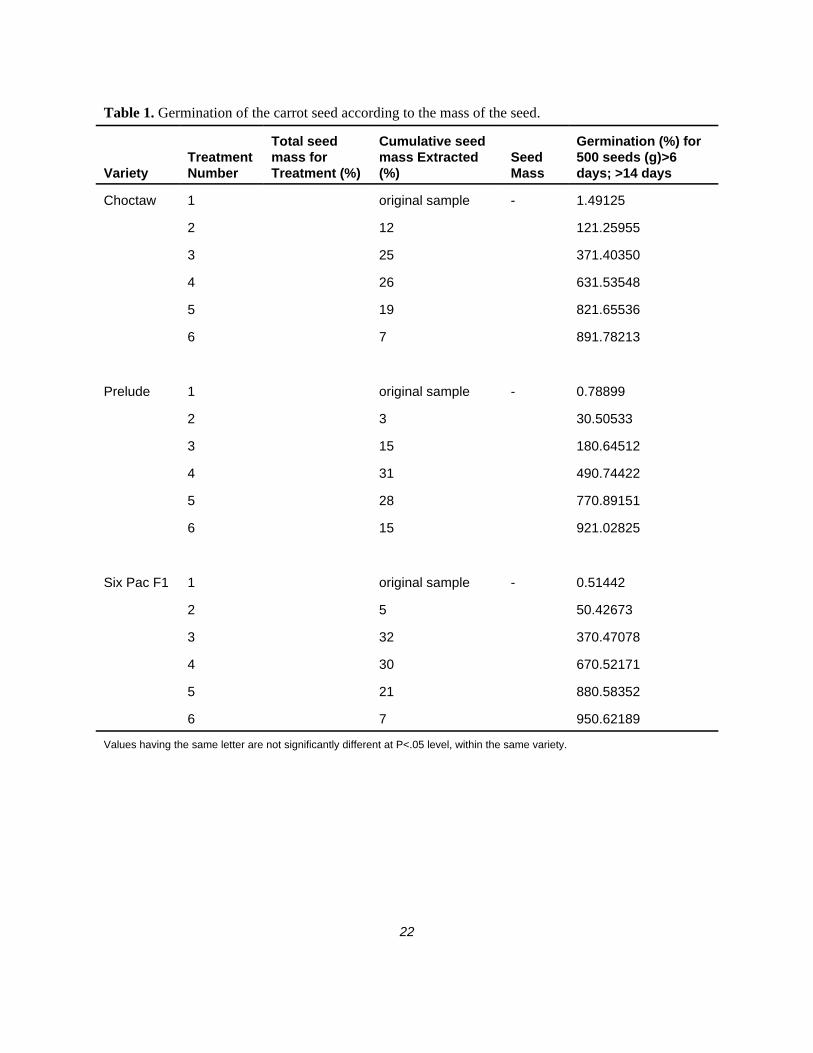
Germination of the seed according to treatment is given in Table 1. In general, heavier seed germ-inated earlier (Table 2).
Future Research:
As many as 36 varieties of carrot seed are under surveillance as to their suitability for the soilconditions, climate, and market being considered. For each of the varieties of promise, it would be beneficialto determine the mass of seed that is most likely to produce a viable plant. Seed needs to be tested not justfor germination, but for vigor of growth after germination, which requires greenhouse tests and field tests.
Acknowledgments:
Appreciation is expressed to Denne Bertrand for laboratory assistance during the seed germinationtests and to Benjamin Mullinix for additional statistical analysis.
References:
Georgia Seed Law and Rules and regulations. 1997. Official Code of Georgia Annotated, 2-11-20 thru 2-11-77; rule sections 40-12-1 thru 40-12-8.
Sayed Gamiely, D.A. Smittle and H.A. Mills. 1990. Onion seed size, weight and elemental content affectgermination and bulb yield. Hortscience. 25(5):522-523.
Smittle, D.A., R.E. Williamson and J.R. Stansell. 1976. Response of snap bean to seed separation byaerodynamic properties. Hortscience. 11(5):469-471.
Smittle, D.A. and R.E. Williamson. 1977. Influence of seed characteristics on snap bean growth and yieldresponse. Hortscience. 12(4):317-319.
Smittle, D.A. 1982. Radish (Raphanus sativus) growth and yield responses to seed grading by size andaspiration. Seed Sci. and Technol., 10, 199-205.
Smittle, D.A. and R.E. Williamson. 1978. Modification of cucumber response to seed grading and nitrogensource by compaction. J. Amer. Soc. Hort. Sci. 103(4):439-441.
22
Table 1. Germination of the carrot seed according to the mass of the seed.
VarietyTreatmentNumber
Total seedmass forTreatment (%)
Cumulative seedmass Extracted(%)
SeedMass
Germination (%) for500 seeds (g)>6days; >14 days
Choctaw 1 original sample - 1.49125
2 12 121.25955
3 25 371.40350
4 26 631.53548
5 19 821.65536
6 7 891.78213
Prelude 1 original sample - 0.78899
2 3 30.50533
3 15 180.64512
4 31 490.74422
5 28 770.89151
6 15 921.02825
Six Pac F1 1 original sample - 0.51442
2 5 50.42673
3 32 370.47078
4 30 670.52171
5 21 880.58352
6 7 950.62189
Values having the same letter are not significantly different at P<.05 level, within the same variety.

23
Table 2. Carrot percent germination.
Variety TreatmentEarly1
Normal NormalFinal2
Abnormal Dead
Choctaw 1 44.50 88.25 2.50 9.25
2 33.91 82.67 3.22 14.10
3 41.44 84.12 4.22 11.66
4 55.03 91.96 3.02 5.03
5 55.10 90.37 2.72 6.91
6 58.81 93.05 1.49 5.46
Prelude 1 75.06 88.26 0.73 11.00
2 78.43 87.50 0.98 11.52
3 79.25 90.75 0.25 9.00
4 82.89 88.26 0.98 10.76
5 72.75 88.75 0.50 10.75
6 76.00 85.75 1.00 13.25
Six Pack II 1 73.75 89.50 1.75 8.75
2 62.00 91.50 1.50 7.00
3 63.50 91.75 2.50 5.75
4 70.25 93.50 0.75 5.75
5 66.00 88.75 1.00 10.25
6 61.00 84.00 2.25 13.75
1Early count at 6 days.2Final count at 14 days.

24

25
Effect of Plant SpacingOn Carrot Production
Sharad C. Phatak, Anthony G. Bateman, and Ernest CraveyDepartment of Horticulture, University of Georgia Coastal Plain
Experiment Station, Tifton, GA 31793-0748
Materials and Methods:
The planting, samples, standard carrot, and refractometer reading procedures and methods followedin this study were identical to those followed as stated in the study by Phatak et al., Effect of LandPreparation on Carrot Production, except the fact that the carrots were planted December 10, 1996, on eightraised beds with eight different seed spacings. Samples were taken from 18 ft2 plots (6 ft wide by 3 ft long)based on a randomized block design with three replications.
Results and Discussion:
Eight plant spacings were chosen to determine which spacing is best for carrot growth. There weresignificant differences (Table 1) between spacings. The number (#/A) of regular carrots for spacings C4, C5,C6, B5, and B6 was significantly more than for C2, and C6 was also more than for C1 and C3. The numberof large carrots for spacings C1, C2, C3, and B6 was significantly more than for C4, C5, C6, and B5. Thenumber of small carrots for spacings C5 and C6 were more than for C1, C2, C3, B5, and B6; the number forC4 was significantly more than for C2 and C3. For the number of carrots of the unmarketable grade, C2 andC3 were significantly more than C6 and C5 for splits; for rots, C1 was more than C4; and for other, therewere no significant differences. No significant differences were found for the total number of unmarketablecarrots, but spacings C4, C5, and C6 were significantly more than C1, C2, and C3 for the total number ofmarketable carrots.
Regular carrot yields for spacing B5 were significantly more than for C1, C2, and C3; yields for C4,C6, and B6 were more than for C2. Large yields for C2 and C3 were significantly more than C4, C5, C6, andB5; and small yields for C4, C5, and C6 were more than C2 and C3. For carrot yields of the unmarketablegrade, spacings C2 and C3 splits were greater than C5, C6, B5, and B6; for rots, C1 was greater than C4; andfor other, there were no significant differences. Total marketable yield for C4, C6, B5, and B6 wassignificantly greater than for C2, whereas total unmarketable yield for C1 was significantly greater than forC6 and B5. Based on statistical findings, C6 may be the best spacing for carrots and C2 the worst.

Table 1. Yield in carrots produced at different plant spacings.
Parameters
Plant Spacings *
C1 C2 C3 C4 C5 C6 B5 B6
(#/Acre)
Regular 79053 BC 67760 C 79860 BC 116967 AB 112127 AB 121000 A 118580 AB 112933 AB
Large 4033 AB 10487 A 12100 A 807 B 0 B 0 B 0 B 4840 AB
Small 25007 BC 10487 C 12907 C 45980 AB 66953 A 58080 A 28233 BC 32267 BC
Split 9680 AB 14520 A 12907 A 8067 AB 7260 AB 3227 B 3227 B 5647 AB
Rot 12100 A 4840 AB 6453 AB 0 B 4840 AB 1613 AB 4033 AB 6453 AB
Other 35493 A 31460 A 25813 A 44367 A 60500 A 54853 A 25813 A 34687 A
Total marketable 108093 BC 88733 C 104867 BC 163753 A 179080 A 179080 A 146813 AB 150040 AB
Total unmarketable 57273 A 50820 A 45173 A 52433 A 72600 A 59693 A 33073 A 46787 A
(Lb/A)
Regular 23635 BC 19199 C 23716 BC 30774 AB 26741 ABC 30250 AB 35251 A 32146 AB
Large 2501 AB 5848 A 6413 A 484 B 0 B 0 B 0 B 2944 AB
Small 3751 BC 1331 C 1775 C 6332 AB 8309 A 6897 AB 3832 BC 4074 BC
Split 3428 ABC 5808 A 4719 AB 2420 BC 1613 C 887 C 1452 C 1008 C
Rot 3227 A 1654 AB 2581 AB 0 B 766 AB 403 AB 645 AB 1855 AB
Other 7502 A 6050 A 4598 A 6171 A 4880 A 5082 A 4517 A 7583 A
Total marketable 29887 AB 26378 B 31904 AB 37591 A 35050 AB 37147 A 39083 A 39164 A
Total unmarketable 14157 A 13512 AB 11898 AB 8591 AB 7260 AB 6373 B 6615 B 10446 AB
*Means within a row with the same letter are not significantly different, according to Duncan’s Multiple Range Test (p=0.05).
27
Managing Weeds in Carrots
Greg MacDonald, Department of Plant PathologyUniversity of Georgia Coastal Plains Experiment Station
Tifton, Georgia
Weed control in carrots (Daucus carota var. sativus L.) is an essential component of producing ahigh-yield, high-quality crop. Weeds compete with carrots for light, water, nutrients, and physical space. Inaddition, many weeds may impair the harvesting process, either through improper digging or contaminationof the harvested crop. Weeds can also harbor deleterious insects and diseases. The presence of plant residuefrom weeds or other plants during fumigation can also decrease the effectiveness of most soil fumigationmaterials, thus increasing the problems associated with nematodes.
Most of the fumigants used in carrots grown in Georgia will not provide adequate weed control,therefore additional weed control measures must be employed. Carrot growers face a multitude of weedproblems including both summer and winter annual broadleaf weeds and grasses. These may includesicklepod (Cassia obtusifolia), crabgrass (Digitaria spp.), pigweeds (Amaranthus spp.), carpetweed (Mollugoverticillata), lambsquarters (Chenopodium album), wild radish (Raphanus raphinistrum), cutleaf eveningprimrose (Oenthera lanceolata), and several others.
Prevention is the first step in managing weeds in carrot cultivars. Avoiding areas that contain heavyinfestations of perennial weeds such as bermudagrass and nutsedge is an important first step. Proper tillage,insect and disease control, and fertility will help to ensure a healthy crop. Proper planting density will alsoallow the carrots to out-compete many weeds. Mechanical cultivation is generally not used in carrot produc-tion due to the tight row spacing (several rows on a bed).
Chemical weed control is often used in carrot production and relies heavily on the herbicide linuron(Lorox, others). Linuron provides excellent control of most weeds found in carrots and is used post-emergence over-the-top. Although good control of large weeds can be achieved with this product, it is criticalto eliminate the weeds at an early stage to reduce the deleterious effects of competition. The rates of linuronrange from 0.75 to 1.5 lbs-ai/A. The lower rate should be used on smaller carrots (< 2-4 inches) and duringwarmer weather. A crop oil (1 qt/A) may be added to improve control of larger weeds, although this mayincrease the chance of crop injury. The best rule of thumb is to avoid the use of crop oil on smaller carrots.
Sencor (metribuzin) can also be used for post-emergence weed control, but certain carrot varietiesmay be injured by this herbicide. Due to the limited use of this herbicide in Georgia, a list of sensitive carrotvarieties has not been developed to date. The rate for metribuzin is 0.25 lbs-ai/A. Trifluralin (Treflan) at 0.5lbs-ai/A can also be used as a pre-plant incorporated treatment for the control of most annual grasses andseveral small-seeded broadleaf weeds. This herbicide should be applied before planting and soil incorporatedto a depth of 2-3 inches. Trifluralin may provide early season weed suppression, allowing the carrots toemerge and begin seedling growth in the absence of heavy weed competition. Fluazifop-methyl (Fusilade)can be used for post-emergence weed control at 0.19 lbs-ai/A, and it provides good control of most annualand perennial grasses.
28
One of the worst weeds in carrots and most other crops is nutsedge. Most infestations are limited toyellow nutsedge (Cyperus esculentus), which is found throughout Georgia. Linuron and metribuzin mayprovide some temporary suppression, while trifluralin and fluazifop have no effect. Nutsedge causes thegreatest problem in the early fall, during carrot emergence and seedling growth. The small carrot size duringthe fall limits the use of higher rates of linuron for suppression of nutsedge. Unfortunately, the lower ratesgive no control. The stale seed-bed technique may provide some control and can be effectively used in carrotsfor nutsedge, because nutsedge will emerge before the carrots. A non-selective material such as Roundup (1-2lbs-ai/A) or Gramoxone Extra (0.25-0.5 lbs-ai/A) is commonly used. As with most weed managementstrategies, proper weed identification, site selection, and timing are the critical issues in controlling weedsin carrots.
29
Seedling Diseases of CarrotsIn South Georgia, 1996-1997
Donald R. Sumner, Department of Plant Pathology, and Sharad C. PhatakDepartment of Horticulture, University of Georgia Coastal Plain
Experiment Station, Tifton, GA 31793-0748
Materials and Methods:
Carrot was seeded with a Monosem planter at various time intervals from August 23 to December17, 1996. Fungi were isolated from root and hypocotyl tissues in plantings August 23, September 10, andDecember 17. Tissues were washed in running tap water for 0.5 to 1 hour, blotted dry on sterile filter paper,incubated on water agar, and hyphal tips were transferred to potato dextrose agar and identified. Selectedisolates of fungi were tested for pathogenicity to the carrot grown in a greenhouse.
In the last planting, a seed treatment experiment was run with the variety Pak More F-1. Arandomized complete block design with four replications was used. Treatments were nontreated seed or seedtreated with Actinovate Plus (Streptomyces WYEC 108), 4 g mixed with 1 lb of seed in a plastic bag beforeseed was placed into the planter. Each plot was 3 rows 18 in. apart on a raised bed 50 ft long. In a laboratorytest at planting, germination of treated and nontreated seed was 63% and 64%, respectively. Soil sampleswere collected at each planting and assayed on selective media for Rhizoctonia spp., and Pythium spp. wereassayed in the December planting.
Stand counts were taken on 30-cm sections of the middle row 3, 6, 9, and 12 m into each plotJanuary 6, 13, 22, and 27; and February 8, 1997. Seedlings were collected at random January 6 and 14, andevaluated for root and hypocotyl discoloration and decay. Fungi were isolated and identified. Carrots froma 3-ft section of all three rows (18 ft2) were harvested and graded May 2, 1997.
Results and Discussion:
Numerous fungi were associated with roots of seedlings in the August and September plantings.Alternaria spp., Curvularia spp., Fusarium spp., Phoma spp., F. solani, Macrophomina phaseolina, andNigrospora spp., in order, were isolated most frequently from seedlings. Most of the fungi were probablysaprophytes living in the rhizosphere or on the surface of the roots. In the December planting, Pythiumspp.(primarily P. irregulare), Phoma spp., Alternaria spp., and Fusarium spp. were isolated most frequentlyfrom seedlings. Rhizoctonia spp. were not detected in any of the soil samples, and populations of Pythiumspp. were low or nondetectable in soil in December. In the greenhouse experiment, Rhizoctonia solanianastomosis group (AG)-4, Pythium irregulare, and Rhizoctonia spp. caused severe pre-emergence damping-off and reduction in final stand. In contrast, F. solani and Phoma spp. were not pathogenic on carrotseedlings.
Carrots grown from seed treated with Actinovate Plus and nontreated seed were similar (Table 1).Data were analyzed statistically, and there were no significant differences (P = 0.05). No differences were

30
observed in plant stand, and there was no moderate or severe root and hypocotyl discoloration and decay onseedlings 20 or 28 days after seeding. However, there was approximately 13% post-emergence damping-offin both treated and nontreated plots. No phytotoxicity was observed in plots treated with Actinovate Plus.
Carrot yield and quality were similar in treated and nontreated plots (Table 1). Average yields of reg-ular carrots from treated and nontreated plots were 22,140 lb/A and 25,860 lb/A, respectively. Because carrotis a cool season crop, and soil temperatures were cool at planting, seedling diseases were probably not assevere as would be expected in late-summer plantings. According to Coastal Plain Experiment Station rec-ords, soil temperatures 2 inches deep ranged from 41 degrees to 66 degrees F December 17-31, 1996. In con-trast, soil temperatures at the same depth August 23 to 31, 1996, ranged from 75 degrees to 93 degrees F.Soil temperatures 0.5 inches deep in dry soil may exceed 100 degrees F in southern Georgia in late summer.
Table 1. Emergence, plant stands, root disease, and yield in carrot treated with Actinovate Plus atseeding December 17, 1996.
Parameters
Seed Treatments
Actinovate Plus None
Emergence, 20 daysx 43 46
Plant stand, 36 days 40 42
Plant stand, 53 days 38 40
Plants with slight root discoloration, 20 days (%)y 37 50
Plants with slight root discoloration, 28 days (%) 55 55
Marketable carrots, regular, numberz 45 49
Marketable carrots, regular, weight (lb) 9.15 10.68
Marketable carrots, small, number 31.2 20.5
Marketable carrots, small, weight (lb) 3.08 2.20
Nonmarketable, split, number 0.5 1.0
Nonmarketable, split, weight (lb) 0.06 0.20
Nonmarketable, decayed, number 6.0 5.5
Nonmarketable, decayed, weight (lb) 0.91 1.11
Nonmarketable, other, number 21.5 19.2
Nonmarketable, other, weight (lb) 1.46 1.92
x Plant counts are for 1.2 m of row.y Plants with 1-10% root discoloration and decay. No plants had moderate (10-15%) or severe (>50%) discoloration and decay.z All plants in the rows 3 ft long (18 ft2, 0.0004 acre) were harvested and graded.

31
Disease Management in Carrots
J. Danny GayDepartment of Extension Plant Pathology
University of Georgia Coastal Plains Experiment StationTifton, GA 31793
Disease management in carrots is necessary to produce high yields of high quality carrots. The majorconcern is the production of a disease-free, cosmetically clean carrot root. The main problems associatedwith the carrot root are root-knot nematodes and diseases caused by fungi, primarily Pythium and SouthernBlight. Pythium root rot can usually be controlled by rotation and incorporation of Ridomil 2E. SouthernBlight is best controlled by deep turning and following a rotational program that decreases the amount ofsouthern blight in the soil. Rotation is a key factor in preventing these diseases as well as timely soil assaysfor nematodes. The root-knot nematode can be very destructive to carrots, causing stunting as well as rootdistortion. The root-knot nematode must be controlled for successful carrot production.
Carrot foliage is susceptible to a number of diseases, primarily Alternaria and Cercospora. In mostcases, these diseases never require any type of fungicide application. Under certain weather conditions,however, fungicide application may be necessary. We have adequate fungicides for managing the above-ground diseases.
Broadcast Row
NEMATODES:
Telone II * 9 to 18 gal/Acre 52 to 106 fl. ozs/1,000 ft
Telone C-17 10.3 to 17.1 gal/Acre 30.3 to 50.2 fl. ozs/1,000 ft
Vapam 75 to 100 gal/Acre
SOIL DISEASES:
Ridomil 2E * 4 to 8 pts incorporated top 2 inches
FOLIAGE DISEASES:
Chlorothalonil Example: *Bravo 720 @ 1 1/2 to 2 pts/Acre (Alternaria, Cercospora)
Rovral 1 to 2 lbs/Acre (Alternaria)
Ridomil-Copper 70W * 2 lbs/Acre (Alternaria, Cercospora)
* Recommended Treatments

32

33
Tift County Carrot Variety Trials
Sharad C. Phatak, Anthony G. Bateman, and Ernest CraveyDepartment of Horticulture, University of Georgia Coastal Plain
Experiment Station, Tifton, GA 31793-0748
Materials and Methods:
The planting, samples, and standard carrot procedures and methods followed in this study wereidentical to those followed as stated in the study by Phatak et al., Effect of Land Preparation on CarrotProduction, except the fact that the carrots were planted December 10, 1996, on 22 raised beds, 22 carrotvarieties were planted, and samples were taken May 28, 1997, from 18 ft2 plots (6 ft wide by 3 ft long) basedon a randomized block design with two replications.
Samples were taken again on June 17, 1997. Soluble solids, pH, and core color of these carrots werecompared using the variety Choctaw as the standard. A Fisherbrand hand-held refractometer was used tomeasure soluble solids; an Orion portable pH/mV temperature meter was used to measure pH, and an in-vestigator was assigned to visually rate core color. Two to three carrots of marketable grade from eachsample were sampled depending on carrot size. These carrots were rinsed, towel dried, and approximately1 to 2 in. discarded from each end.
The carrots were first rated for core color (0 to 10 rating, with 0 being very poor and 10 excellent)by making a cross sectional cut mid-length of the carrot. The samples were then juiced using a Waringcommercial juice extractor. The juice was filtered using a single filter sheet in the strainer basket of theextractor and a single coffee filter over the recovery container, a 9 oz plastic cup. Refractometer readingswere taken from the juiced sample, followed by pH measurements. The pH electrode was triple rinsedbetween samples using distilled water, 70% ethanol, and distilled water again. The 70% ethanol was usedto prevent a film from forming on the electrode bulb.
Results and Discussion:
Data were analyzed statistically, and each variety was rated using ‘Choctaw’ as the standard (Tables1, 2, and 3). The results of several varieties were affected by poor weed control in sample plots, but thesevarieties are noted with special emphasis in this discussion. As for the number of marketable fruit per acre(Table 1), regular carrots from varieties ‘Cheyenne,’ ‘Sugarsnax 54,’ and ‘Navajo’ were significantly higherthan ‘Choctaw,’ and the varieties from weedy plots were significantly lower. ‘Tripleplay 58’ large carrotswere significantly higher, while all others were not significantly different. There were no varieties withsignificant differences in the number of smalls and splits. However, ‘Choctaw’ rots were significantly higherthan all but six varieties. ‘Cheyenne,’ ‘Sugarsnax 54,’ and ‘Prelude’ other carrots were significantly higherthan ‘Choctaw,’ while all others were not significantly different. Overall, only the ‘Cheyenne’ total numberof unmarketable carrots was significantly higher than ‘Choctaw,’ while six varieties grown in weedy plotswere significantly lower. ‘Sugarsnax 54’ and ‘Cheyenne’ total number of marketable carrots was signif-icantly higher than ‘Choctaw,’ and most varieties from weedy plots were significantly lower.
For fruit yield, lb/A (Table 2), ‘Cheyenne’ regular carrots were greater than ‘Choctaw,’ while weedyvarieties were less. There were no significant differences for large, split, and other carrots among the
34
varieties, but ‘Sugarsnax 54’ small carrots were greater than ‘Choctaw.’ Also, ‘Choctaw’ rots were onlysignificantly greater than a few weedy varieties. Finally, only the weedy varieties showed significantdifferences in total marketable yield. There were no significant differences in total unmarketable yield.
When rated for color, there were no varieties superior to ‘Choctaw,’ but 10 varieties were similarto ‘Choctaw’ in core color (Table 3). Four varieties’ (Cheyenne, XPH 3916, Navajo, and Dawn Dee) overallinternal color rating was equal to that of ‘Choctaw.’ Also, there were greater differences in soluble solidsamong the varieties, but readings were good for all varieties. Varieties with soluble solid readings 0.5 orhigher than ‘Choctaw’ were rated greater than ‘Choctaw,’ while readings equal to or no more than 0.5 below‘Choctaw’ were rated equal to ‘Choctaw.’ Five varieties (Vita Sweet #781, Navajo, XPH 3918, Pacific Gold,and Six Pak) were superior to ‘Choctaw,’ while 12 varieties equaled ‘Choctaw.’ Only ‘Primecut 59,’ ‘VitaSweet #691,’ ‘XPH 3916,’ and ‘Vita Sweet #711’ were rated lower than ‘Choctaw.’
Also, pH varied greatly among the varieties. Varieties with pH measurements 0.06 or greater than‘Choctaw’ were rated superior while varieties with measurements equal to or +/- 0.05 than ‘Choctaw’ wererated equal to ‘Choctaw.’ There were no varieties rated superior to ‘Choctaw,’ but 3 varieties (Cheyenne,Tripleplay 58, and Dawn Dee) equaled ‘Choctaw.’ Eighteen varieties rated inferior to ‘Choctaw’ with one,‘Primecut 59,’ having a pH reading below 6.00.
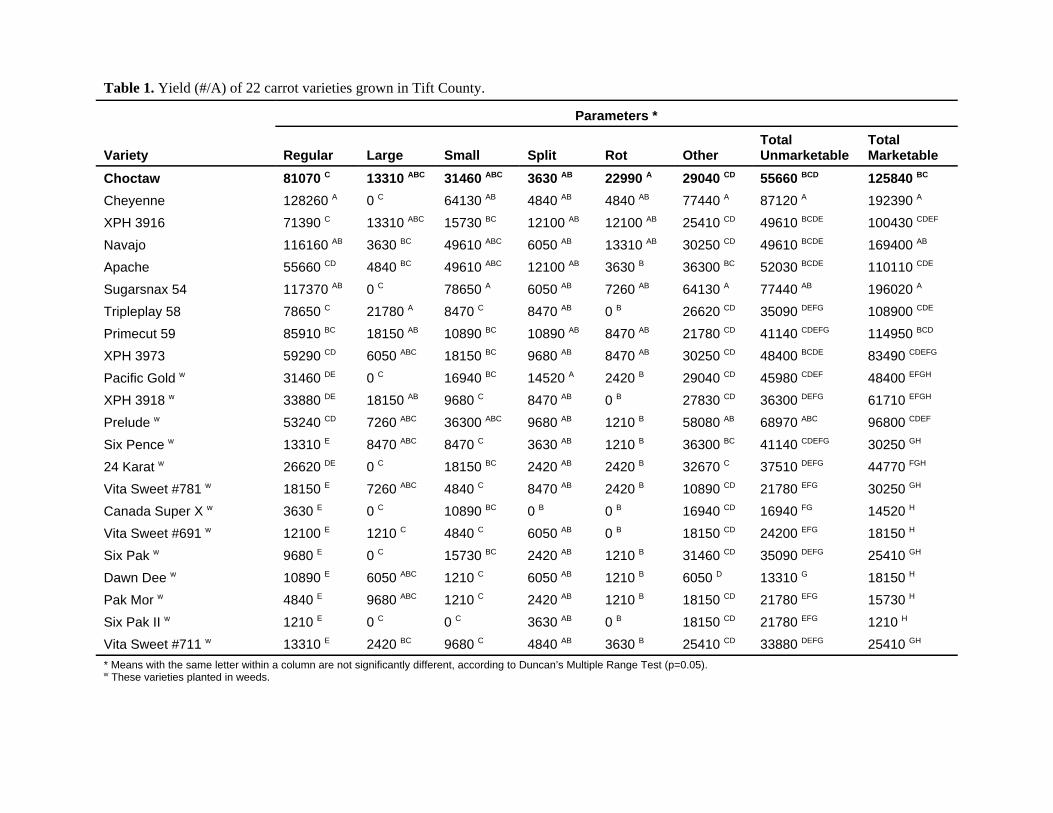
Table 1. Yield (#/A) of 22 carrot varieties grown in Tift County.
Variety
Parameters *
Regular Large Small Split Rot OtherTotalUnmarketable
TotalMarketable
Choctaw 81070 C 13310 ABC 31460 ABC 3630 AB 22990 A 29040 CD 55660 BCD 125840 BC
Cheyenne 128260 A 0 C 64130 AB 4840 AB 4840 AB 77440 A 87120 A 192390 A
XPH 3916 71390 C 13310 ABC 15730 BC 12100 AB 12100 AB 25410 CD 49610 BCDE 100430 CDEF
Navajo 116160 AB 3630 BC 49610 ABC 6050 AB 13310 AB 30250 CD 49610 BCDE 169400 AB
Apache 55660 CD 4840 BC 49610 ABC 12100 AB 3630 B 36300 BC 52030 BCDE 110110 CDE
Sugarsnax 54 117370 AB 0 C 78650 A 6050 AB 7260 AB 64130 A 77440 AB 196020 A
Tripleplay 58 78650 C 21780 A 8470 C 8470 AB 0 B 26620 CD 35090 DEFG 108900 CDE
Primecut 59 85910 BC 18150 AB 10890 BC 10890 AB 8470 AB 21780 CD 41140 CDEFG 114950 BCD
XPH 3973 59290 CD 6050 ABC 18150 BC 9680 AB 8470 AB 30250 CD 48400 BCDE 83490 CDEFG
Pacific Gold w 31460 DE 0 C 16940 BC 14520 A 2420 B 29040 CD 45980 CDEF 48400 EFGH
XPH 3918 w 33880 DE 18150 AB 9680 C 8470 AB 0 B 27830 CD 36300 DEFG 61710 EFGH
Prelude w 53240 CD 7260 ABC 36300 ABC 9680 AB 1210 B 58080 AB 68970 ABC 96800 CDEF
Six Pence w 13310 E 8470 ABC 8470 C 3630 AB 1210 B 36300 BC 41140 CDEFG 30250 GH
24 Karat w 26620 DE 0 C 18150 BC 2420 AB 2420 B 32670 C 37510 DEFG 44770 FGH
Vita Sweet #781 w 18150 E 7260 ABC 4840 C 8470 AB 2420 B 10890 CD 21780 EFG 30250 GH
Canada Super X w 3630 E 0 C 10890 BC 0 B 0 B 16940 CD 16940 FG 14520 H
Vita Sweet #691 w 12100 E 1210 C 4840 C 6050 AB 0 B 18150 CD 24200 EFG 18150 H
Six Pak w 9680 E 0 C 15730 BC 2420 AB 1210 B 31460 CD 35090 DEFG 25410 GH
Dawn Dee w 10890 E 6050 ABC 1210 C 6050 AB 1210 B 6050 D 13310 G 18150 H
Pak Mor w 4840 E 9680 ABC 1210 C 2420 AB 1210 B 18150 CD 21780 EFG 15730 H
Six Pak II w 1210 E 0 C 0 C 3630 AB 0 B 18150 CD 21780 EFG 1210 H
Vita Sweet #711 w 13310 E 2420 BC 9680 C 4840 AB 3630 B 25410 CD 33880 DEFG 25410 GH
* Means with the same letter within a column are not significantly different, according to Duncan’s Multiple Range Test (p=0.05).w These varieties planted in weeds.

36
Table 2. Yield (Lbs/A) of 22 carrot varieties grown in Tift County.
Variety
Parameters *
Regular Large Small Split Rot OtherTotalUnmarketable
TotalMarketable
Choctaw 23474 BCD 7018 ABC 3811 BC 968 AB 4658 A 3630 ABC 9256 ABCD 34303 ABC
Cheyenne 34364 A 0 C 6776 AB 1633 AB 1512 AB 7683 ABC 10829 ABCD 41140 A
XPH 3916 22627 BCD 7260 ABC 2480 BC 6413 A 3811 AB 5747 ABC 15972 AB 32367 ABC
Navajo 32670 AB 2299 BC 7018 AB 2057 AB 4174 AB 4658 ABC 10890 ABCD 41987 A
Apache 17847 CDEF 3206 ABC 6171 ABC 4416 AB 786 AB 6836 ABC 12039 ABCD 27225 BCD
Sugarsnax 54 31520 AB 0 C 10285 A 1633 AB 1270 AB 8349 ABC 11253 ABCD 41805 A
Tripleplay 58 26075 ABC 11434 A 1149 BC 3448 AB 0 B 7381 ABC 10829 ABCD 38659 A
Primecut 59 25349 ABCD 9498 AB 1573 BC 3872 AB 2964 AB 4658 ABC 11495 ABCD 36421 AB
XPH 3973 18573 CDE 3327 ABC 2662 BC 4235 AB 2722 AB 9982 AB 16940 A 24563 DC
Pacific Gold w 8227 EFG 0 C 2420 BC 5445 AB 786 AB 4416 ABC 10648 ABCD 11192 EF
XPH 3918 w 10043 EFG 9014 AB 1210 BC 5021 AB 0 B 6231 ABC 11253 ABCD 20267 DE
Prelude w 15669 DEF 3085 ABC 4961 ABC 3085 AB 302 AB 8228 ABC 11616 ABCD 23716 DC
Six Pence w 4174 G 4537 ABC 1270 BC 2359 AB 181 AB 9801 AB 12342 ABC 9982 EF
24 Karat w 7986 FG 0 C 2359 BC 605 B 605 AB 6836 ABC 8046 ABCD 10345 EF
Vita Sweet #781 w 4598 G 3146 ABC 665 BC 3146 AB 1270 AB 2964 BC 7381 ABCD 8409 F
Canada Super X w 1149 G 0 C 1512 BC 0 B 0 B 2541 C 2541 D 2662 F
Vita Sweet #691 w 2964 G 968 BC 847 BC 2117 AB 0 B 4719 ABC 6836 BCD 4779 F
Six Pak w 1936 G 0 C 1875 BC 665 B 605 AB 4840 ABC 6110 CD 3811 F
Dawn Dee w 4356 G 3993 ABC 181 C 4053 AB 847 AB 1936 C 6836 BCD 8530 F
Pak Mor w 1391 G 5324 ABC 181 C 1694 AB 484 AB 6413 ABC 8591 ABCD 6897 F
Six Pak II w 605 G 0 C 0 C 2843 AB 0 B 10466 A 13310 ABC 605 F
Vita Sweet #711 w 3811 G 1452 BC 1331 BC 1694 AB 1391 AB 5626 ABC 8712 ABCD 6594 F
* Means with the same letter within a column are not significantly different, according to Duncan’s Multiple Range Test (p=0.05).w These varieties planted in weeds.

37
Table 3. Tift County Carrot Variety Trials.
# VarietyCoreColor
Overall InternalColor % Solids pH
1 Choctaw 8 8 8.7 6.25
2 Cheyenne 8 8 9.0 6.21
3 XPH 3916 8 8 8.0 6.09
4 Navajo 8 8 9.6 6.14
5 Apache 6 6 9.0 6.14
6 Sugarsnax 54 8 7 9.1 6.15
7 Tripleplay 58 8 7 9.0 6.21
8 Primecut 59 8 7 8.1 5.97
9 XPH 3973 7 7 9.0 6.03
10 Pacific Gold* 7 7 9.5 6.10
11 XPH 3918* 8 7 9.5 6.03
12 Prelude* 7 7 8.5 6.14
13 Six Pence* 8 7 9.0 6.05
14 24 Karat* 6 6 8.5 6.00
15 Vita Sweet #781* 7 6 9.6 6.12
16 Canada Super X* 6 6 8.7 6.09
17 Vita Sweet #691* 8 7 8.0 6.12
18 Six Pak* 7 6 9.4 6.11
19 Dawn Dee* 8 8 9.0 6.20
20 Pak Mor* 7 6 8.5 6.14
21 Six Pak II* 7 7 9.0 6.19
22 Vita Sweet #711* 7 7 8.0 6.12
* These varieties planted in weeds.

38

39
Jeff Davis and Wayne CountyCarrot Variety Trials
Terry Kelley, Sharad Phatak, Rick Reed, James ReidRandy Franks, Anthony Bateman, and Ernest Cravey
Introduction:
Carrot variety trial studies were conducted in three different locations at various times during the1996-1997 growing season. Seed for the trials was supplied by 10 different seed companies. Approximately80 acres of carrots were planted, with approximately 70 acres being harvested. Although a number ofvarieties of carrots are available for commercial planting in Georgia, the adaptability of most of thesevarieties to the Georgia farm land has not been tested locally.
As an initial test, 23 varieties were planted at the Tate Farm in Jeff Davis County on October 1,1996. A second planting of 16 varieties was conducted on November 4, 1996, at the Burch Farm in WayneCounty. A third planting of 36 varieties was at the Tate Farm again on November 24, 1996.
Most of the planting was later than desired because of the late arrival of the planter. Reduced standand low pack out per acre was caused by lack of knowledge and experience with the planter, inadequatewindbreaks, inclement weather following planting or during the germination period, and poor fertility andwater management. Tip rot and splitting at the soil line were also major factors in the low pack out per acre.As these problems are addressed, pack out per acre numbers will increase.
Variety Trials
Methodology:
The ‘Choctaw’ variety was used as the standard to compare the quality characteristics (visualattractiveness) of the other carrot varieties. Approximately 50 carrots from each variety were harvested andlaid out on the ground in their respective groups. University of Georgia extension, research personnel, andgrowers, using ‘Choctaw’ as the standard, rated each variety visually on a scale from 1 to 10, with 10 beingthe most desirable rating. Each variety was rated for external color, growth of the top, smoothness of thecarrot, length of the carrot, and overall marketability of the carrot. Growth of the top was rated on thesufficiency of the top growth for machine harvesting of the carrot. Overall marketability was rated on thepercent of usable, visually attractive carrots in the group. All other quality characteristics were rated bycomparison to the ‘Choctaw’ standard carrot. Unless otherwise noted, two representative plots from eachvariety were evaluated and their scores averaged. Some carrots were further analyzed in a lab to rate theirinternal color, core color, % soluble solids, pH, and sugar content.
40
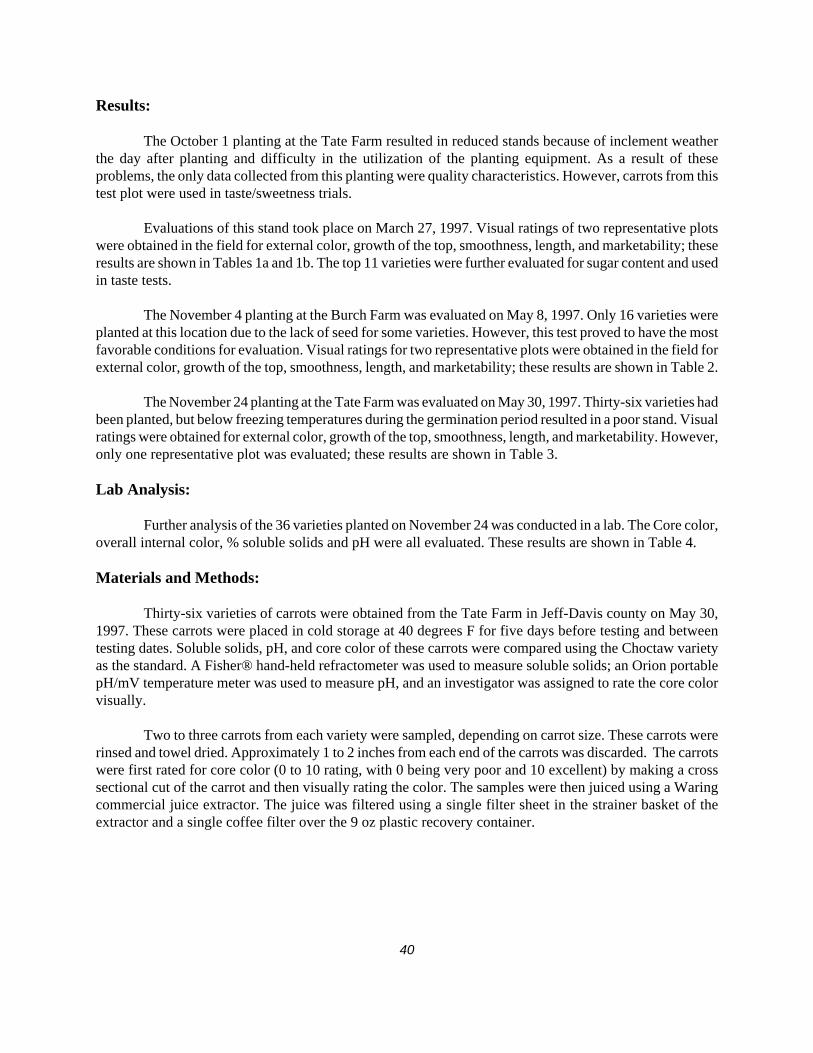
Results:
The October 1 planting at the Tate Farm resulted in reduced stands because of inclement weatherthe day after planting and difficulty in the utilization of the planting equipment. As a result of theseproblems, the only data collected from this planting were quality characteristics. However, carrots from thistest plot were used in taste/sweetness trials.
Evaluations of this stand took place on March 27, 1997. Visual ratings of two representative plotswere obtained in the field for external color, growth of the top, smoothness, length, and marketability; theseresults are shown in Tables 1a and 1b. The top 11 varieties were further evaluated for sugar content and usedin taste tests.
The November 4 planting at the Burch Farm was evaluated on May 8, 1997. Only 16 varieties wereplanted at this location due to the lack of seed for some varieties. However, this test proved to have the mostfavorable conditions for evaluation. Visual ratings for two representative plots were obtained in the field forexternal color, growth of the top, smoothness, length, and marketability; these results are shown in Table 2.
The November 24 planting at the Tate Farm was evaluated on May 30, 1997. Thirty-six varieties hadbeen planted, but below freezing temperatures during the germination period resulted in a poor stand. Visualratings were obtained for external color, growth of the top, smoothness, length, and marketability. However,only one representative plot was evaluated; these results are shown in Table 3.
Lab Analysis:
Further analysis of the 36 varieties planted on November 24 was conducted in a lab. The Core color,overall internal color, % soluble solids and pH were all evaluated. These results are shown in Table 4.
Materials and Methods:
Thirty-six varieties of carrots were obtained from the Tate Farm in Jeff-Davis county on May 30,1997. These carrots were placed in cold storage at 40 degrees F for five days before testing and betweentesting dates. Soluble solids, pH, and core color of these carrots were compared using the Choctaw varietyas the standard. A Fisher® hand-held refractometer was used to measure soluble solids; an Orion portablepH/mV temperature meter was used to measure pH, and an investigator was assigned to rate the core colorvisually.
Two to three carrots from each variety were sampled, depending on carrot size. These carrots wererinsed and towel dried. Approximately 1 to 2 inches from each end of the carrots was discarded. The carrotswere first rated for core color (0 to 10 rating, with 0 being very poor and 10 excellent) by making a crosssectional cut of the carrot and then visually rating the color. The samples were then juiced using a Waringcommercial juice extractor. The juice was filtered using a single filter sheet in the strainer basket of theextractor and a single coffee filter over the 9 oz plastic recovery container.

41
Refractometer readings were taken from the juiced sample followed by pH measurements. The pHelectrode was rinsed three times between samples using distilled water, 70% ethanol and distilled wateragain. The 70% ethanol was used to prevent a film from forming on the electrode bulb.
Results and Discussion:
Thirty-six carrot varieties were sampled, including ‘Choctaw’ (the standard). The sample’s corecolor and overall internal color as judged through a cross sectional view were rated for color quality. Threevarieties, ‘Indiana,’ ‘KXPC 037,’ and ‘Canada Super X,’ were superior to ‘Choctaw’ in core color (Table1), while 17 varieties were equal to ‘Choctaw,’ and 15 varieties inferior. Varieties ‘Six Pak 316,’‘Zanahoria,’ and ‘Sugarsnax 54’s’ core colors were notably different. For overall internal color, only‘Canada Super X’ exceeded ‘Choctaw,’ while 16 varieties equaled ‘Choctaw,’ and 18 varieties were inferior.‘Vita Sweet 781,’ ‘Six Pak EZ,’ ‘Sugarsnax 54,’ ‘Zanahoria,’ and ‘Six Pak 316’s’ overall internal colorswere notably different from ‘Choctaw.’
There were greater differences among the varieties in soluble solids readings, but readings were goodfor all varieties. Varieties with soluble solid readings higher than ‘Choctaw’ by 0.5 or more were ratedgreater than ‘Choctaw,’ while readings +/- 0.5 that of ‘Choctaw’ were rated equal to ‘Choctaw.’ Based onthis rating scheme, there were no varieties with readings greater than ‘Choctaw.’ However, There were 7varieties (‘Terminator,’ ‘XPH 3918,’ ‘Six Pak 316,’ ‘Carrotte Hybrid,’ ‘Six Pence,’ ‘Zanahoria,’ and ‘XPH397’) equal to ‘Choctaw.’ Also, there were 28 varieties that, although good, rated below ‘Choctaw.’ ‘KXPC037’ and ‘24 Karat’ had the lowest soluble solids readings.
Varieties also varied greatly in pH measurements. High pH measurements often correlated to highsoluble solid readings. Varieties with pH measurements greater than ‘Choctaw’ by 0.06 or more were ratedsuperior, while varieties with measurements +/- 0.05 than ‘Choctaw’ were rated equal to ‘Choctaw.’ CarrotteHybrid was rated superior, while varieties (10 in all) ‘Ivanhoe,’ ‘Vita Sweet 691,’ ‘Prelude,’ ‘KXP 022,’‘Zanahoria,’ ‘XPH 3916,’ ‘Vita Sweet 711,’ ‘XPH 3918,’ ‘Navajo,’ and ‘Canada Super X’ were equal to‘Choctaw.’ There were 24 varieties with pH measurements less than ‘Choctaw,’ and 8 of that 24 hadmeasurements less than 6.00.
This data should only be interpreted using yield and grade information to select favorable varieties.

Jeff Davis County Carrot Variety TrialsTABLE 1
Results of the quality evaluation of the Tate Farm cultivar
Variety Rep I Rep II Average
Smooth Top Color Length Market Smooth Top Color Length Market of Reps
Sixpack 10 6 10 5 8 9 10 10 10 9 8.7
Pakmor 10 6 10 8 8 5 8 10 10 7 8.2
XPH3916 10 5 10 8 8 10 5 10 7 7 8.5
Navajo 9 8 10 8 6 9 7 10+ 9 8 8.4
VitaSW691 8 8 10 7 6 10 7 7 9 9 8.4
Sixpence 8 7 10 8 9 10 7 10 7 6 7.9
Australia 9 6 10 9 8 9 8 10 10 9 8.7
Prelude 9 6 10 6 8 10 8 10 8 8 8.3
XPH3918 9 7 7 8 9 7 7 10 9 5 7.8
Nashville 9 7 10 5 7 8 9 10 10 7 8.2
VitaSW781 9 7 10 8 8 10 6 10 7 8 8.3
XPH3973 9 8 9 8 8 8 8 10 9 8 8.5
Sixpack 11 10 7 10 7 8 10 6 10 6 7 8.0
Zanahoria 10 8 9 7 6 10 6 10 6 7 7.9
Choctaw 9 8 10 8 7 -- -- -- -- -- 8.4
Cheyenne 9 9 10 10 7 10 8 10 9 9 9.1
VitaSW711 9 9 10 9 9 9 10 10 10 8 9.3
Apache 10 8 10+ 8 9 8 9 10 10 8 9.0
Pacific Gold 10 7 10 10 8 8 8 10 8 7 8.5
Can SuperX 10 5 10 8 7 8 6 10 7 5 7.5
Ireland 9 10 10 9 9 8 7 10 8 7 8.7
Ivanhoe 7 9 10 9 6 9 9 10 8 8 8.5
Indiana 9 8 10 9 7 8 9 10 9 8 8.6
Planted October 1, 1996Evaluated March 27, 1997Smooth=Smoothness; Market=MarketabilityTop=Sufficiency of top for machine harvestRatings on 1-10 scale with 10=most desirable

43
Wayne County Carrot Variety TrialsTABLE 2
Results of quality evaluation of the Burch Farm cultivar
Variety Rep I Rep II Average
Smooth Top Color Length Market Smooth Top Color Length Market of Reps
XPH 3973 7 8 10 7 7 6 8 9 6 5 7.3
First Class 9 7 10 7 7 7 6 10 6 7 7.6
CanadaSuper X
8 5 9 6 7 9 4 9 6 8 7.1
Vita Sweet711
9 8 10 8 9 7 7 10 8 8 8.4
XPH 3918 9 8 10 7 9 8 8 10 8 8 8.5
Vita Sweet781
7 7 10 8 8 9 7 10 8 9 8.2
Prelude 7 10 10 7 8 7 9 10 7 6 8.2
XPH 3916 9 8 10 9 8 6 7 10 7 7 8.1
Navaho 6 9 10 8 6 8 9 10 7 9 8.2
Premium 6 6 10 7 7 8 4 10 7 7 7.2
Dawn Doe 9 7 10 9 8 8 7 10+ 7 8 8.2
Cheyenne 10 8 10 8 6 10 9 10 8 8 8.7
Pak Mor 8 10 10 8 6 9 9 9 9 8 8.6
Apache 8 6 10+ 7 7 7 8 9 7 6 7.5
Vita Sweet681
6 8 10 4 6 7 9 10 7 7 7.4
Choctaw 10 10 10 8 8 10 10 10 9 10 9.5
Planted November 4, 1996Evaluated May 8, 1997Smooth=Smoothness; Market=MarketabilityTop=Sufficiency of top for machine harvestRatings on 1-10 scale with 10=most desirable

Jeff Davis County Carrot Variety TrialsTABLE 3
Results of the quality evaluation of the Tate Farm cultivar
Variety Only 1 Rep Average
Smooth Top Color Length Market
Apache 5 7 9 10 5 7.2
VitaSW711 7 10 10 10 8 9.0
Choctaw 9 10 10 10 9 9.6
VitaSw781 8 5 7 5 5 6.0
VitaSW691 10 10 10 9 8 9.4
Sixpence F1 9 8 8 9 8 8.4
24 Karat 8 6 8 7 5 6.8
Crusader 8 10 10 10 7 9.0
Terminator 8 5 10 10 8 8.2
Cheyenne 8 6 9 8 6 7.4
Carrotte Hybrid 9 8 9 9 8 8.6
Zanahoria 9 4 10 10 9 8.4
XPH 3916 8 8 9 9 7 8.2
Navajo 9 9 9 9 8 8.8
Prelude 8 8 10 7 7 8.0
Gladiator 7 5 7 9 5 6.6
Ivanhoe 8 8 10 7 6 7.8
Nashville 8 9 10 6 6 7.8
Dawn Doe 6 6 10 9 6 7.4
Canada SuperX 8 6 8 8 6 7.2
XPH 3973 6 8 9 7 5 7.0
Tripleplay 58 8 9 10 7 6 8.0
Primecut 59 9 8 10 8 8 8.6
Sugarsnak 54 7 9 8 10 8 8.4
Ireland 7 9 8 8 5 9.4
Indiana 8 9 10 10 7 8.8
KXPC-030 8 10 10 9 7 8.8
XPH 3918 7 7 10 7 7 7.6
Pak Mor 1303 9 10 8 10 8 9.0
Sixpack 316 8 8 8 7 7 7.6
Sixpack 11 9 9 8 6 5 7.4
Pacific Gold 7 9 8 7 6 7.4
Sixpack EZ 9 6 9 8 8 8.0
KXPC 020 5 10 9 8 4 7.2
KXP-022 7 10 10 4 8 7.8
KXPC-037 7 8 9 10 7 8.2Planted November 24, 1996; Evaluated May 30, 1997Smooth=Smoothness; Market=Marketability; Top=Sufficiency of top for machine harvestRatings on 1-10 scale with 10=most desirable

45
Jeff Davis County Carrot Variety Trials Lab AnalysisTABLE 4
Results of the lab analysis of the Tate Farm cultivar
Variety Core Color Internal Color % Solids pH
Terminator 7 8 12.5 6.06
Choctaw 8 8 12.4 6.16
XPH 3918 7 7 12.3 6.14
Carrotte Hybrid 8 7 12.0 6.23
Zanahoria 6 6 12.0 6.17
Six Pack 316 6 5 12.0 6.04
Six Pence 7 7 12.0 6.03
XPH 397 8 7 11.9 6.10
KXP - 022 7 7 11.8 6.19
Pak Mor 1303 8 7 11.8 6.07
Apache 8 8 11.7 5.93
Six Pack II 1317 8 7 11.6 5.93
Vita SW 711 7 8 11.5 6.14
Indiana 9 8 11.5 6.06
Navajo 8 8 11.5 6.13
Canada Super X 9 9 11.4 6.13
XPH 3916 7 7 11.4 6.15
Six Pack EZ 7 6 11.2 5.93
Nashville 8 8 11.2 5.92
Vita SW 781 7 6 11.1 6.02
Pacific Gold 8 8 11.0 5.93
Crusader 8 8 11.0 5.91
Primecut 8 8 11.0 6.09
Prelude 7 7 10.9 6.19
Dawn Doe 8 8 10.8 6.06
Vita SW 691 8 8 10.6 6.19
Ireland 8 8 10.6 6.06
Sugarsnax 54 6 6 10.5 5.83
Ivanhoe 8 8 10.5 6.19
KXPC - 030 8 8 10.5 6.01
Tripleplay 58 8 8 10.2 5.89
Cheyenne 8 7 10.0 6.05
Gladiator 7 7 10.0 6.09
KXFC - 020 7 7 10.0 6.04
KXPC - 037 9 8 9.7 6.08
24 Karat 7 7 9.5 6.03

46

47
Post-Harvest Handling of CarrotsDr. William C. Hurst
Department of Food Science and Technology, Athens, GA
Introduction:
Fresh Georgia carrots were harvested before reaching full maturity. These carrots averaged 7 to 9inches in length, 1.5 inches in diameter, had a mild, sweet flavor and a bright external color. All Georgiacarrots are machine harvested.
Harvesting and Packaging:
Machine harvested carrots are loosened under the row by pull-like devices and elevated out of thesoil onto belts that grasp the carrot tops. These tops are cut mechanically and allowed to fall back into thefield while the trimmed roots are elevated to trucks for bulk transport to the packing house. At the packinghouse, carrots are off-loaded into a dry dump tank, conveyed through a cylindrical revolving cleaner toremove dirt and sand, and then enter a revolving drum washer with spray nozzles. Washed carrots thenproceed through a series of sizing belts, where they are sorted by length and diameter. Diverging rollers areused to separate roots for diameter, and an inclined, vibrating platform with graduated hole sizes separatesroots according to length. Sized carrots drop onto conveyor belts for hand grading to remove culls and arethen hand packed into one, two, three and five pound polyethylene bags, which are subsequently palletizedinto 50 pound, heavy polyethylene master bags.
Mechanical damage to the roots can be minimized by the proper operation of all harvesting, sizing,and grading equipment. Excessive speed or overloading of equipment will result in an increase of mechanicaldamage to the carrots. Such bruising or cutting will open up avenues for greater water loss and the invasionof decay microorganisms.
Precooling and Chlorination:
Carrots have a high rate of respiration, which means field heat must be removed before densepackaging and storage. Precooling is accomplished by using cold water in the revolving drum washer.Temperatures should be kept at 40 degrees F. Water used in cleaning and cooling should be chlorinated ata concentration of 75 to 100 ppm of free chlorine. Chlorination can be accomplished using a gas injectionsystem, adding bleach, or using calcium hypochlorate tablets. Chlorination levels in the water should bemonitored frequently during operation through the use of chlorine litmus paper, or more accurately with achlorine test kit.

48
Storage Requirements:
Topped fresh market carrots are very perishable and rapidly transpire moisture from even trimmedroots. Wilting symptoms become evident with as little as a 3% weight loss. Therefore, high humidity (95-100%) is imperative in storage. Free moisture, if allowed to condense on carrots, will promote decay;therefore, good air movement is necessary to prevent decay during storage. Topped carrots should be heldat 32 degrees F. If the above conditions are met, the shelf life of immature, topped carrots is four to sixweeks.
Quality Defects:
One of the most common signs of visual quality loss is a lack of firmness: Carrots become limp andsoft, flabby, and/or shriveled. Other quality defects causing carrots to be downgraded by the buyer or dueto a USDA inspection include the following: Non-uniform shape, growth cracks, insect damage, poor color,roughness, green core, sunburn injury, poor trimming, evidence of freeze damage, and decay.
Mixed Load/Storage Compatibility:
Carrots have the same storage requirements as beets, broccoli, brussel sprouts, cabbage, cauliflower,celery, collards, sweet corn, endive, greens, lettuce, green onions, parsley, parsnips, peas, radishes, snowpeas, spinach, and watercress. Therefore, these crops can be stored together without deleterious effects.However, carrots should not be stored with ethylene-producing crops such as cantaloupes, apples, etc.Carrots are sensitive to as little as 0.5 ppm ethylene. This will impart a perceptible bitter flavor to the carrots.
Postharvest Decay:
Postharvest decay organisms are obligate parasites and therefore, do not normally enter the productthrough healthy, exterior tissue. These organisms require mechanical damage or weakening of tissue beforethey can enter. Spoilage losses can be minimized if the following precautions are observed: Use new ordisinfected storage containers, handle carrots carefully to prevent injuries, precool roots properly, andmaintain carrots at a constant temperature slightly above 32 degrees F.
The most important decays of carrots in storage are gray mold rot (Botrytis), watery soft rot (Scler-otinia), crater rot (Rhizoctonia), fusarium rot, rhizopus soft rot, bacterial soft rot, black rot (Stemphylium),and sour rot (Geotrichuim).
49
Carrot Packinghouse Quality Control System
Stanley Prussia, Wojciech Florkowski, and Zhikang YouDepartment of Biological and Agricultural Engineering, University of Georgia
Griffin Experiment Station, Griffin, Georgia 30223
Quality control procedures were developed for a new carrot packinghouse. Special efforts were madeto establish a good reputation for the brand label, Georgia Sweet Carrot. To support the brand namedevelopment and to assure the economic sustainability of the venture written, quality managementprocedures and specialized forms for record keeping were prepared.
The objective of this work is to ensure that the carrots shipped from the packinghouse are con-sistently high in quality. This objective is met by developing applicable yet essential quality control policyand procedures based on International Standard ISO 9004 and the U.S. Department of Agriculture standardsfor fresh carrot grades. The quality management procedures include those directly related to the handlingof fresh carrots. The need to meet quality standards requires the development of a record keeping system.
Results from a survey of Atlanta area consumers are shown in tables 1, 2, and 3. It is evident thatconsumers pay moderate attention to the country of origin when buying fresh vegetables, because consumersbelieve origin influences quality (Table 1.) Consumer preference for vegetables of USA origin ranked high(36 first, 60 second, 2 third, and 1 fourth in table 2). The ranking for Georgia origin was even higher (69 first,28 second, 3 third, and 0 fourth). Table 3 shows consumers purchase carrots because they like the taste andbelieve they are good.
During the past season, we focused on the: (1) procurement and receiving inspection of carrots; (2)packingline inspection; (3) cooler inventory recording; and (4) packinghouse sanitation and personalhygiene.
Procurement and Receiving Inspection of Raw Carrots
The policy and procedures for carrot receiving was developed. The written policy and proceduresdetail the responsibilities and duties of co-op members, the packinghouse manager, assigned assistant, andpackingline employees upon receiving carrots from the fields.
A form entitled “Carrot Receiving and Packing Report” was developed and used in the past harvestseason. This form records: (1) arrival time, farmer name or number, and the lot number of the carrotsreceived; (2) labor used and cost for grading and packing; (3) categorized final products; and (4) locationof carrot sample storage for the lot. Detailed instructions for completing the form were provided to the pack-inghouse manager. A sample of the form and the instructions for completing it are shown in Appendix A.

50
Packingline Inspection
The quality of carrots coming off the line was measured and recorded on the Packingline InspectionRecord form that was developed. Detailed procedures for packingline inspection were written. These pro-cedures included five parts: (1) sample selection; (2) recording of basic sample information; (3) inspectionof packing and labeling; (4) test of sweetness and bitterness; and (5) inspection of carrot appearance basedon USDA standards.
Each grade had a separate form entitled Packingline Inspection Record for U.S. No. 1, U.S. No. 1Jumbo, and U.S. No. 2, which were developed and used in the past harvest season. USDA standards andsample tolerance information were incorporated into the form based on the standards for each grade. Allow-able tolerances were provided for each attribute and for the total sample. Procedures for measuring sweetnessand other attributes were provided. Detailed instructions for inspection and form preparation were provided.
Cooler Inventory Recording
A form titled Cooler Inventory was developed and used in the past season. The form recordedvolume, bag size, and date of final carrots received in the cooler; volume and date of carrots shipped tocustomers; and the balance of cooler inventory for each grade and bag size. Instructions for preparing theform were provided.
Packinghouse Sanitation and Personal Hygiene
Policy and requirements for packinghouse sanitation and personal hygiene were written.Responsibilities and the role of employer and employees were specified. Packinghouse sanitation includedplant and grounds, carrot handling and storage upon arrival, final carrot handling and storage, waste disposal,and pest control. Personal hygiene guidelines included facilities and employee hygiene. The preliminaryguidelines and instructions are shown in Appendix B.
Preparing for Next Year
Several actions will be needed to make sure that carrot marketing next year builds on successes fromthis year. Expansion of the brand name and enhancement of the reputation of the cooperative depends ondelivery of shipments with consistent quality. Obtaining consistency depends on developing and followingprocedures, especially for actions that do not show any results for several days. Thus, written procedures andrecords verifying the completion of a task are very important. Actions needed include:
(1) Assign a person responsible for Quality Control.(2) Develop written procedures for operations (as done this year, with changes based on experience)(3) Develop a Quality Control Manual with sections in addition to operating procedures.(4) Obtain feed back on marketing from the broker, customers, and consumers.(5) Improve measurement methods for quality attributes.

51
Plans have been made to expand the number of written procedures relating to quality management.The foreword in Appendix C and the proposed preface in Appendix D give an overall description of theapproach suggested for developing a Quality System. The Table of Contents in Appendix E indicates someof the materials that have been prepared in anticipation of expansion of the materials described above. Thecomplete Quality Control Manual will demonstrate the determination of the growers and the packinghouseto adhere to the highest standards recognized on the U.S. and international fresh vegetable market.
The reputation of Georgia Sweet Carrots will continue to grow as consistent quality carrots areshipped. The written procedures, forms, and records will help to ensure quality remains consistently high.The commitment to quality by the Georgia carrot growers enhances opportunities for increasing revenuesin the future.

52
APPENDIX A
Georgia Sweet Carrot CooperativeCarrot Receiving and Packing Report
Arrival date Farmer
Arrival time Variety/Lot #
Start time for grading
End time for grading
Task# of
workers Hours# of
workers Hours# of
workers HoursTotal work
hours
Grading
Packing
Other
Total labor cost
Final product (masters) 1 lb 2 lb 3 lb 5 lb 25 lb 50 lb Total
U.S. No. 1
U.S. No. 1 Jumbo
U.S. No. 2
Increment
Dehydrated
Other
Weight of culls
Sample location
Inspector
Date
Notes:

53
Instructions for Completing Carrot Receiving and Packing Report
Arrival date: Record the date that carrots are received.
Arrival time: Record the time that carrots are received.
Farmer: Write down the name of the farmer whose carrots are received.
Variety/Lot#: Record the variety of the carrots or the lot number where receivedcarrots were planted.
Start time for grading: Record the time that grading starts.
End time for grading: Record the time that grading is completed.
# of workers and Hours: Record the number of workers for grading, packing, and other tasksand hours they work, respectively.
Total work hours: Calculate and record the total number of hours for grading, packingand other tasks.
Total labor cost: Calculate and record the labor cost for grading, packing and othertasks.
Final product: Report the number of the master bags (1 Master = 50 lbs) of finalproducts from the delivery of carrots in this report separatelyaccording to bag size and grade.
Increment: Record the amount of increment.
Dehydrated: Record the amount of dehydrated carrots.
Weight of culls: Record the amount of culls.
Sample location: Record the cooler location where samples representing this lot arelocated.
Inspector: The inspector who completed this report signs.
Date: Write the date this report is completed and signed.

54
Employees Will Create and Maintain aSanitary Packinghouse.
APPENDIX B
Packinghouse Sanitation and Personal Hygiene
Packinghouse sanitation and personal hygiene are important to prevent and avoid contamination of theproduct by pests, microorganism, dust and other foreign materials.
Packinghouse Sanitation
Plant and GroundsC Keep the grounds surrounding the
facility free of standing water, rodent harborage, debris, excessive dust, weeds, and insect-breedingmaterials.
C Clean floors, walls, and ceilings periodically and keep them free of debris.C Sanitize floors, walls, and ceilings regularly.
Raw Carrot Handling and StorageC Clean and, if necessary, sanitize raw carrot handling equipments before use.C Clean raw carrot storage areas periodically, and keep them free of debris, rodents, insects or other
pests.
Finished Carrot Handling and StorageC Clean/sanitize carrot processing and packing equipment before use.C Avoid cross-contamination between raw and processed carrots.C Keep packaging materials in a clean location.C Store finished carrots in clean and properly maintained areas.C Never store raw carrots and processed carrots together.
Waste DisposalC Pick up dropped carrots immediately and place them in the appropriate container.C Put rejected carrots in waste bins, and discard them away from the packinghouse when bins are full
or at the end of the day.
Pest ControlC Plant should be well equipped to keep vermin out.C Frequently clean and properly maintain working, storage, and rest areas so pests do not have food,
water, and shelter.C Promptly destroy pests if found.C The assigned employee must keep chemicals and other hazardous substances in a safe area.
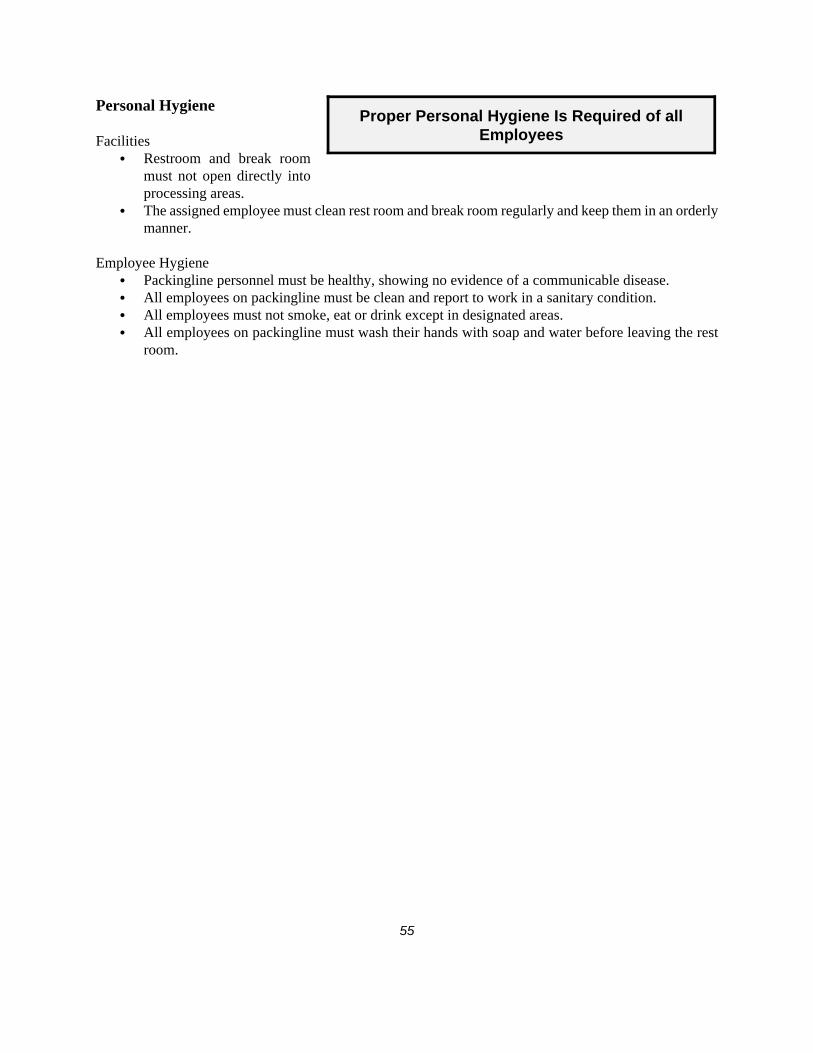
55
Proper Personal Hygiene Is Required of allEmployees
Personal Hygiene
FacilitiesC Restroom and break room
must not open directly intoprocessing areas.
C The assigned employee must clean rest room and break room regularly and keep them in an orderlymanner.
Employee HygieneC Packingline personnel must be healthy, showing no evidence of a communicable disease.C All employees on packingline must be clean and report to work in a sanitary condition.C All employees must not smoke, eat or drink except in designated areas.C All employees on packingline must wash their hands with soap and water before leaving the rest
room.

56
APPENDIX C
Proposed Foreword
This QUALITY ASSURANCE MANUAL FOR SWEET CARROT PACKINGHOUSE wasprepared as a proposed model program for a sweet carrot packinghouse. The overall approach and thecontents are based on International Standard ISO 9004.
Changes to this proposed model will be made according to input received from the packinghousemanager and co-op members. The resulting manual will then be published with the intention that changeswill be made as needed.
The proposed model manual was made realistic by writing it as though the authors were the actualowner and manager of a sweet carrot packinghouse.
A management program is a tool for helping to ensure that the quality of the carrots is consistentlyat the level selected. Writing out the plans and procedures unique to your packinghouse will help clarify andcommunicate your expectations.
It is also critical that this manual include only the statements and activities that you fully intend tocomplete. Omit any activity you are not convinced should be implemented.
Format of the Manual:
The Table of Contents includes a revision number for each section. The revision number at thebottom of the Table of Contents page indicates the current revision for the complete manual. Each manualshould be numbered and a record kept of its location, so all copies can be updated when a section is revised.
At the bottom of the first page for each section in the manual is a signature block for managementto show their approval of the section. Any future revisions will be signed in the same way.
Benefits:
• A consistent and progressively improved level of quality.• A recognized unique product, and improved marketing ability.• Well-defined procedures, responsibilities, and authorities.
57
APPENDIX D
Proposed Preface
As the packinghouse manager of Georgia Sweet Carrot Cooperative, I believe that long term successdepends on the quality of the carrots we ship. We are confident the management program described in thismanual provides the tools necessary for consistently delivering to our customers quality sweet carrots atcompetitive prices.
We realize this packinghouse is one link in the chain for delivering sweet carrots to the tables ofconsumers. Thus, we are especially committed to the extra management effort needed to ensure propercompletion of tasks that do not show any immediate impact but are critical to maintaining the quality of ourcarrots at later links in the chain.
This manual describes the management program we developed for controlling the activities andfactors affecting the quality of our carrot shipments. The elements of the program are based on internationalstandard ISO 9004, Quality Management and Quality System Elements - Guidelines. The purpose of thismanual is to communicate details of our management policies, plans, and procedures to all employees.
The process of organizing our plans and operations into a written manual was useful for clarifyingthe responsibilities of each employee and for identifying the communications necessary among variousdepartments. Viewing the packinghouse as a complete system resulted in changes that will improve operatingefficiency as well as product quality.
After implementing this program, we will be in a position to build on the foundation begun by thisfirst written QUALITY ASSURANCE MANUAL. Continual improvements are expected as we expand ourinitial efforts.

58
APPENDIX E
Proposed Table of Contents
Section Revision Effective Date
Title Page -0- 15 June 97
Foreword -0- 15 June 97
1 Preface -0- 15 June 97
2 Contents -0- 15 June 97
3 Quality Policy -0- 15 June 97
4 Organization -0- 15 June 97
5 Quality Assurance -0- 15 June 97
6 Marketing -0- 15 June 97
7 Specifications and Designs -0- 15 June 97
8 Packinghouse Operations -0- 15 June 97
9 Procurement and Receiving Assessment -0- 15 June 97
10 Final Product Inspection -0- 15 June 97
11 Cooler Inventory -0- 15 June 97
12 Packinghouse Sanitation and Personal Hygiene -0- 15 June 97
13 Personnel -0- 15 June 97
14 Safety and Liability -0- 15 June 97

59
The quality policy of the co-op, packinghouse manager, and workers atGeorgia Sweet Carrot Cooperative is to continuously improve managementpractices as a means to make consistently superior sweet carrots available
to the consumers at costs resulting in long-run profits for the co-op.
APPENDIX F
Proposed Quality Policy
This section describes the quality policy and objectives to be fulfilled.
Our quality policy will be achieved by accomplishing the following objectives:
• To implement the policy, plans, procedures, and other quality system activities described in this manual.• To maintain evidence that carrots were grown, harvested, packed, handled, and shipped in ways that
ensure consumers receive carrots that are: extra sweet, safe, wholesome, and high in value.• To invest the resources necessary to minimize quality losses during packing and shipment.• To develop improved marketing policies and procedures.• To evaluate this management program after one year and to enhance it as necessary.
Table 1. Atlanta Consumer Survey - December 1994
Carrot buying frequency
Do you pay attention to the country of origin of fresh vegetableswhen you buy them?
Never Sometimes Most of the time Always
- - - - - - - - - - - - - - - - - - - percent - - - - - - - - - - - - - - - - - - -
Often 24 51 22 2
Very often 22 45 16 17
Total sample 25 49 17 9
Do you think the place of vegetable origin influences qualityperception?
No Yes Don’t know
- - - - - - - - - - - - - - - - - - - percent - - - - - - - - - - - - - - - - - - -
Often 10 63 27
Very often 10 70 20
Total sample 10 67 23
Source: W. J. Florkowski and C. L. Huang, Department of Agricultural and Applied Economics, The University of Georgia, Collegeof Agricultural and Environmental Sciences, Griffin Campus, Griffin, Georgia.

Table 2. Preferences for the Origin of Vegetables Reported in the Atlanta Consumer Survey -December 1994
Carrot buying frequency
Percent of respondents assigning the rank
1 2 3 4
USA
Often 27 68 3 2
Very often 41 57 2 0
Total sample 36 60 2 1
GEORGIA
Often 79 21 0 0
Very often 66 31 3 0
Total sample 69 28 3 0Source: W. J. Florkowski and C. L. Huang, Department of Agricultural and Applied Economics, The University of Georgia, Collegeof Agricultural and Environmental Sciences, Griffin Campus, Griffin, Georgia.
Table 3. Atlanta Consumer Survey - December 1994Reason for eating fresh vegetables Carrot purchase frequency Total for both
frequenciesOften Very often
percent
Like taste
Agree 14 13 27
Strongly agree 21 51 72
Inexpensive
Agree 2 9 11
Strongly agree 18 37 55
Easy to prepare
Agree 23 34 57
Strongly agree 4 22 26
Vegetables are good
Agree 19 14 33
Strongly Agree 16 50 66
Vegetables are a source of vitamins
Agree 17 15 32
Strongly agree 18 47 65Note: The figures do not add to 100 percent because the remaining respondents selected from among other options: “somewhat agree,” “disagree,”and “don’t know.”Source: W. J. Florkowski and C. L. Huang, Department of Agricultural and Applied Economics, The University of Georgia, College of Agriculturaland Environmental Sciences, Griffin Campus, Griffin, Georgia.

61
Soluble Solids and pH of Supermarket Carrots
Sharad C. Phatak, Anthony G. Bateman, and Ernest CraveyDepartment of Horticulture, University of Georgia Coastal Plain
Experiment Station, Tifton, GA 31793-0748
Materials and Methods:
Carrots were obtained from five local supermarkets. Soluble solids and pH measurements of thesecarrots were compared by type – fresh market or baby carrots – and state. Locally-grown carrots, variety‘Choctaw’ (planted September 10, 1996), and carrots from a Michigan storage company (carrots stored sinceNovember 1996) were used to gauge carrot quality. The carrots were obtained February 13, 1997, and weresampled twice on two different dates. All samples were placed in cold storage at 40 degrees F for 5 daysbefore testing and between testing dates.
A Fisherbrand hand held refractometer was used to measure soluble solids, and an Orion portablepH/mV temperature meter was used to measure pH. From the fresh market carrots, three carrots from eachsample were sampled; from the baby carrots, only a third of each sample was used. These carrots were peeledand 1 in. discarded from each end, fresh market carrots only. The samples were then blended to a mulch andjuiced using a kitchen sieve and pestle. The juice was filtered using doubled coffee filters. The pH electrodewas triple rinsed between samples using distilled water, 70% ethanol, and distilled water. The 70% ethanolwas used to prevent a film from forming on the electrode bulb.
Results and Discussion:
In Trial #1 (February 18), soluble solid and pH readings in the fresh type carrots were higher thanin the baby type carrots (Table 1). While soluble solid readings in fresh carrots ranged from 7.0 to 10.0 andpH measurements were from 6.17 to 6.44, the baby carrot’s soluble solids readings were 6.5 to 8.5 and pHmeasurements from 4.97 to 6.4. By state/region, the California carrots’ (fresh type) soluble solid and pHreadings were higher on average followed by Florida (soluble solids) and Canada (pH).
In Trial #2 (March 20), the soluble solid and most pH readings were lower; only carrots from Floridashowed an increase in pH. However, fresh carrots’ readings (6.9 to 9.5 soluble solids and 5.95 to 6.63 pH)were still higher than baby carrots’ (7.2 to 8.4 soluble solids and 5.52 to 6.34 pH). Also, California carrotswere still averaging higher soluble solids readings than Florida and Canada, but Florida’s pH readings werehigher.
From the carrots used to gauge the quality of these carrots, pH and soluble solid readings were highat the beginning of storage and began to decrease after extended storage. These findings were consistent withthe supermarket carrot findings.

Table 1. pH and Soluble Solids of Supermarket Carrots
# Vendor Type Producer Location
February 18, 1997 March 20, 1997
% Solids pH % Solids pH
1 CPES, Hort. Fresh CPES, Horticulture Dept. Tifton, GA 9.5 6.59 8.5 6.34
2 Michigan Storage Processing Michigan Storage Michigan 9.0 6.24 8.7 6.23
15 Winn Dixie Baby Kern Ridge Growers, LLC Arvin, CA 8.5 6.40 8.4 6.34
11 Piggly Wiggly Baby Grimmway Farms Bakersfield, CA 8.0 6.18 7.2 5.94
16 Winn Dixie Baby Taylor Packing, Inc. Lamont, CA 7.7 6.43 7.7 6.42
9 Food Lion Baby Fresh 1 Marketing, Inc. Los Angeles, CA 7.5 6.26 7.5 5.59
7 FoodMax Baby Grimmway Farms Bakersfield, CA 7.5 6.40 7.5 5.98
3 Harveys Baby Dole Fresh Veg., Inc. Salinas, CA 7.2 5.86 7.7 5.52
14 Winn Dixie Baby Peter Rabbit Farms Coachella, CA 6.5 4.97 -- --
8 FoodMax Fresh Grimmway Farms Bakersfield, CA 9.5 6.33 8.5 6.13
10 Food Lion Fresh Fresh 1 Marketing, Inc. Los Angeles, CA 9.0 6.33 8.4 6.06
12 Piggly Wiggly Fresh Grimmway Farms Bakersfield, CA 8.2 6.35 8.1 6.23
13 Piggly Wiggly Fresh A. Duda and Sons, Inc. Oviedo, FL 10.0 6.41 9.2 6.48
19 Winn Dixie Fresh Growers Precoolers, Inc. Apoka, FL 8.5 6.20 8.0 6.49
17 Winn Dixie Fresh A. Duda and Sons, Inc. Oviedo, FL 8.5 6.19 9.5 6.63
5 Harveys Fresh Zellwinn Farms Co. Zellwood, FL 8.2 6.36 7.5 6.04
18 Winn Dixie Fresh Zellwinn Farms Co. Zellwood, FL 8.0 6.29 8.4 6.44
20 Winn Dixie Fresh Long Farms, Inc. Apoka, FL 7.0 6.17 6.9 6.27
6 Harveys Fresh Carron Farms Limited Bradford, CAN 9.0 6.44 8.1 5.95
4 Harveys Fresh Exeter Produce & Storage Holland Landing, CAN 7.5 6.34 7.5 6.12

63
Consumer Acceptance and Physicochemical MeasurementsOf Quality of Georgia Carrots
Dr. Anna V.A. Resurreccion, Department of Food Science and TechnologyUniversity of Georgia, Georgia Experiment Station, Griffin, GA 30223-1797
Dr. William C. Hurst and Dr. A. Estes Reynolds Department of Food Science and Technology, University of Georgia, Athens, GA
Dr. Sharad Phatak, Department of Horticulture, University of GeorgiaCoastal Plains Experiment Station, Tifton, GA
Introduction:
To be competitive in the carrot industry, Georgia carrots should be acceptable to consumers. Qualityis important in the selection of carrots. The perceived quality of carrots at the market place influences itspurchase by consumers. Once purchased, the carrots must have the eating quality that is expected or theconsumers will not purchase the carrots again. Much research has been conducted on characterizing thequality of raw carrots. These studies have been conducted to compare carrots grown in several statesincluding California, Florida, and Texas; however, no studies have been conducted on the quality of Georgiacarrots.
The objective of this study was to compare Georgia cultivars with market samples of California andFlorida carrots. Specific objectives were to:
1. measure overall acceptability and hedonic ratings for color, flavor, sweetness, tenderness/hardness and fibrousness/pithiness/woodiness, and
2. determine the relations between oBrix, percent total sugars, moisture content and selectedsensory attributes of Georgia, California and Florida carrots.
Materials and Methods:
Samples
Two studies were conducted on Georgia carrots grown in Jefferson and Wayne counties, Georgia,planted on October 1, 1996, and November 4, 1996, and harvested on March 27, 1997, and May 8, 1997, res-pectively. Carrot cultivars were screened for oBrix and percent total solids content and production data.Production and quality parameters were used to select 10 cultivars.
Carrots with the highest oBrix and percent total solids content were used to select 5 cultivars. Thesecarrots were stored for approximately two weeks at 0 degrees C, 65% relative humidity and 2.2 degrees C,80% relative humidity, respectively. Market samples of carrots from Bakersfield, CA, and Apopka, FL, werepurchased and stored under identical conditions as the Georgia samples used in study 1, and samples fromBakersfield, CA, and Oviedo, FL, used in study 2. The samples evaluated during the two studies are shownin Table 1.
64
Consumer Sensory Evaluations:
Consumers evaluated a total of nine carrot samples consisting of five Georgia carrots, two Californiacarrots, and two Florida carrots in each of two sessions. On the test date, carrots were taken out of storage,dipped in a chlorine solution, then rinsed and dried. Samples were prepared by peeling, then slicing themiddle third portion of the carrot into 0.5 cm slices. Two to three pieces, approximately 8 g, were placed intoa 60 ml capacity plastic cup with lid, pre-labeled with a three digit random number. Ten to sixteen cups ofsamples were prepared for each cultivar, the cups were placed in a plastic bag and held in the refrigeratoruntil served to consumers. Two replications of the studies were conducted.
A total of 135 consumers were recruited to obtain a minimum of 100 responses. Consumers wererecruited by telephone according to a recruitment screener from a consumer database maintained at the Cen-ter for Food Safety and Quality Enhancement at the Georgia Experiment Station in Griffin, GA, or from atelephone directory. Additional participants were recruited at central locations such as grocery and retailstores, fast-food establishments and through referrals. Qualifications for participation were that panelists (1)be between 18-65 years old, (2) not be allergic to carrots, and (3) eat raw carrots at least twice a month.
During the test, consumers were asked to register and instructed to fill out consent forms,honorarium forms, and a demographic questionnaire. A brief orientation was given to consumers to instructthem on the use of the signal lights, which minimize contact between themselves and servers. Consumersevaluated samples while in partitioned booths, which help to minimize communication between themselvesand other panelists. Panelists evaluated samples under incandescent lights and environmentally controlledconditions. A balance sequential monadic presentation was used to serve carrot samples to consumers. Dur-ing each evaluation session, consumers evaluated five samples, had a compulsory three-minute break, andthen evaluated another four samples. Consumers were instructed to rinse their mouths out with waterbetween samples.
The sensory ballots used in the evaluation of carrots were developed using the Sensorex (Version4.03, Softex, Inc., Lancaster, PA) software program for automated data entry. A 9-point hedonic scale, with1= dislike extremely and 9= like extremely, was used for evaluating carrots for overall acceptance, color,flavor, sweetness, tenderness/hardness, and fibrousness/pithiness/woodiness.
oBrix Measurements:
Three carrots of each replication were selected for measurements of oBrix and percent total sugars.Approximately 2" was cut off from each end and the middle portion was used for analysis. The samples wereblended into a puree using a retail juicer and filtered through Whatman #1 filter paper to remove particulates.The filtrate was used to obtain measurements of oBrix and percent total sugar. oBrix measurements wereobtained from 3-4 drops of the carrot juice placed on the refractometer stage using a Pasteur pipette anddirectly recorded.
Total Sugars:
A 2 ml filtrate was pipetted into centrifuge tubes and 30 ml of 100% ethanol was added to each tubeimmediately followed by addition of Celite, a settling agent. The tubes were then shaken to ensure properdistribution of ethanol and Celite, and steamed 10 minutes in a 55 - 80-degree C water bath. The tubes wereweighed and balanced with 100% ethanol to ensure no more than 0.5g difference in weight between samples.

65
The tubes were centrifuged at 15,000 rpm for 10 minutes, then decanted through Whatman #1 filter paperinto 100 ml volumetric flasks. The centrifuge tubes with Celite were then refilled with 30 ml of 60% ethanol,steamed and centrifuged as previously described. After the second centrifugation, the 60% ethanol wasfiltered and filtrate added to the filtrate in the volumetric flask. The volumetric flask was filled to volumewith 100% ethanol then shaken to ensure even distribution.
Two (2) ml of solution from each 100 ml volumetric flask were pipetted into each of three centrifugetubes. One (1) ml of 5% phenol and 5 ml of 95.5% concentrated sulfuric acid were added to each tube andthen allowed to stand 10 min, followed by gentle shaking to obtain equal reactivity throughout the tube. Thetubes were then placed in a 30-degree C water bath for 15 minutes. Dilutions were made to enable accuratereadings on a spectrophotometer. It was determined that a dilution of 1:4 would be required, or 3 ml of theprepared acid/phenol extract from each tube to 9 ml of distilled water. The diluted mixture was shaken usinga test tube shaker. An aliquot of the diluted mixture was then poured into clean, dry spectrophotometer tubes.A “blank” was prepared with 2 ml distilled water, 1 ml phenol, and 5 ml sulfuric acid. Absorbance was readat 490 nm. To determine the percent sugar, the average absorbence readings were calculated and comparedwith a standard curve, which was prepared using 1 ml of 5% phenol, 5 ml sulfuric acid and 10, 25, 50, 75and 100 mg glucose. Glucose was diluted and made to volume with distilled water. Using values obtainedfrom the glucose standards, values were estimated for the carrots using absorbence readings in comparisonwith the glucose samples. Values obtained from the curve, representing the mg/ml glucose in the carrotsamples was used for further calculations (mg/ml glucose x 0.1 x 0.25). The final calculation represents thepercent sugar for each determination.
Moisture:
Moisture was measured using a vacuum oven. One (1)g of unfiltered carrot puree was weighed intodry, pre-weighed aluminum dishes and placed in the oven set to 20 psi with an internal temperature of 80degrees C. The samples were allowed to dry 24 hr, cooled, and then weighed.
Results:
Demographic Characteristics:
Demographic characteristics of participants. A total of 111 and 104 consumers participated instudy 1 and study 2 , respectively. Their demographic characteristics are presented in tables 2 and 3.
Consumer Sensory Evaluations:
Consumer acceptance ratings are shown in Tables 4 and 5 for study 1 and 2, respectively. Meanscores for overall acceptance, color, flavor, sweetness, tenderness/hardness, and fibrousness/pithiness/woodiness are shown for the nine samples tested in each study.
Overall acceptance. In study 1 (Table 4), mean ratings for overall acceptance from California 1 and2 and Georgia cultivar ‘XPH 3973’ were rated at least a 6 or like slightly by consumers. No significantdifferences between these three samples were found. ‘Vitasweet 711’ was found not significantly differentfrom ‘XPH 3973’ but significantly lower than California 1 and 2. No significant differences were foundbetween ‘Six Pack F1,’ ‘Choctaw,’ and ‘Ireland.’ Carrots from Florida were least accepted by consumers.
66
In study 2, California carrots had the highest overall acceptance ratings, while Florida carrots hadthe lowest ratings. The Georgia cultivars had intermediate ratings.
Color. Although the color of all the carrot samples were found to be acceptable in study 1, the colorof California, ‘Vitasweet 711’ and ‘Ireland’ carrots received the highest ratings (7 = “like moderately” orhigher). In study 2, all Georgia and California carrots had an acceptable color. The color of Florida carrotswas not acceptable to consumers.
Flavor. In both studies 1 and 2, flavor of California carrots was most preferred by consumers andthat of Florida carrots were least preferred. The Georgia cultivars were preferred less than the Californiacarrots and more than Florida carrots. In both studies, ‘Choctaw’ had the least acceptable flavor, which wassignificantly rated lowest in study 1, and was significantly lower than both California samples and ‘DawnDee’ in study 2.
Sweetness. In both studies, California carrots had the highest sweetness acceptance ratings, whileFlorida carrots had the lowest. Georgia carrots received intermediate ratings for sweetness that weresignificantly lower than the California carrots but higher than the Florida carrots. ‘Choctaw’ was the leastsweet among Georgia cultivars in study 1, but in study 2 was not found less sweet than other Georgia carrots.
Tenderness/Hardness. The tenderness/hardness of both California carrots was preferred in studies1 and 2. ‘Cheyenne’ was preferred as much as the California carrots in Study 1. Florida carrots were giventhe lowest ratings for tenderness and hardness in study 1, but in study 2 were not less accepted than‘Choctaw,’ ‘Vitasweet 711,’ and ‘Asgrow 3016.’
Fibrousness/Pithiness/Woodiness. In studies 1 and 2, California cultivars were most preferred,indicating that they were not fibrous, pithy or woody. ‘XPH 3973’ received the same ratings (study 1).Florida carrots received low acceptance ratings for fibrousness, which were not different from ‘Choctaw’and ‘Six Pack F1’ ratings in study 1. In study 2, however, Florida carrots received the lowest acceptanceratings for fibrousness and all Georgia cultivars received ratings intermediate to California and Floridacultivars.
oBrix, Total Sugars and Moisture Contents:
oBrix, total sugars and moisture content are shown in Tables 6 and 7 for studies 1 and 2, respectively.oBrix reading of the California carrots were highest and Florida carrots lowest in study 1. Georgia carrotshad intermediate oBrix readings. ‘XPH3973,’ ‘Choctaw’ and ‘Ireland’ had the highest readings among theGeorgia carrots. In study 2, ‘Dawn Dee’ had the highest oBrix reading followed by ‘California 2’ and‘Choctaw.’ ‘Cheyenne’ and ‘Florida 2’ had lowest readings; however, ‘Florida 2’ was not significantlydifferent from ‘Vitasweet,’ ‘Asgrow’ and ‘Florida 1.’
‘California 2’ had the highest total sugar and Florida 1 and 2 had the lowest total sugar in study 1.‘California 1’ and all Georgia carrots had intermediate total sugar readings. In study 2, ‘California 2’ hadthe highest total sugar, followed by ‘Choctaw’ and ‘Florida 2,’ while ‘Asgrow’ had the lowest. However,there were no differences between ‘Asgrow’ and ‘Florida 1,’ which was similar to several other carrots.

67
Relations Between Compositional and Sensory Measurements:
Correlation coefficients between oBrix, total sugars, moisture content and sensory ratings are shownin Table 6. The correlation coefficients between oBrix, total sugars and moisture content are significant (p# 0.05). However, the magnitude of the correlations are too low to be considered important (correlation of1.00 = very highly correlated; 0.00 = no correlation). This indicates that while oBrix may be an indicator ofthe soluble solids (includes sugars) in the sample, perceived sweetness and overall acceptance may be ratedlower when the carrots contain flavor compounds such as those contributing harsh, carroty, bitter andastringent flavors, which may affect the perception of sweetness.
Discussion:
In general, the acceptability of California carrots was highest, followed by Georgia carrots thenFlorida carrots. In most instances, some Georgia cultivars were not as acceptable as the California carrots,but were more acceptable than Florida carrots. Some Georgia cultivars were either more or less acceptablethan the other Georgia carrots.
Among the Georgia carrots, ‘XPH 3973’ and ‘Vitasweet 711’ were most preferred. The ‘XPH 3973’can compete with the California carrots on overall acceptance. The flavor of ‘Choctaw’ carrots deleteriouslyinfluenced its acceptance as demonstrated in both studies. ‘Choctaw’ was found least sweet among theGeorgia carrots. Although ‘Choctaw’ had a high sugar content, its perceived sweetness does not reflect thisin study 1.
‘Choctaw’ is the cultivar that is most widely grown throughout Georgia. Although our results arebased on two studies, they indicate that there are cultural conditions that may influence the overallacceptability of the carrots. Conversely, other conditions may result in cultivars such as ‘XPH 3973’receiving overall acceptance ratings as high as the California cultivars.
It is extremely important to quantify the quality of Georgia carrots that are high yielding and todetermine the cultural conditions that influence their variability. Likewise, it is important to conduct studiesthat will help to determine what cultural and post-harvest handling practices require sufficient controls toproduce Georgia carrots that are high in consumer acceptability.

68
Table 1. Samples evaluated during two harvest studies.
Sample Code Cultivated/Market Sample
Study 1
GA 1 Six Pack F1
GA 2 XPH 3973
GA 3 Choctaw
GA 4 Vitasweet 711
GA 5 Ireland
CA 1 California 1 (Bakersfield, CA)
CA 2 California 2 (Bakersfield, CA)
FL 1 Florida 1 (Apopka, FL)
FL 2 Florida 2 (Apopka, FL)
Study 2
GA 1 Choctaw
GA 2 Cheyenne
GA 3 Vitasweet 711
GA 4 Dawn Dee
GA 5 Asgrow
CA 1 California 1 (Bakersfield, CA)
CA 2 California 2 (Arvin, CA)
FL 1 Florida 1 (Oviedo, FL)
FL 1 Florida 2 (Oviedo, FL)
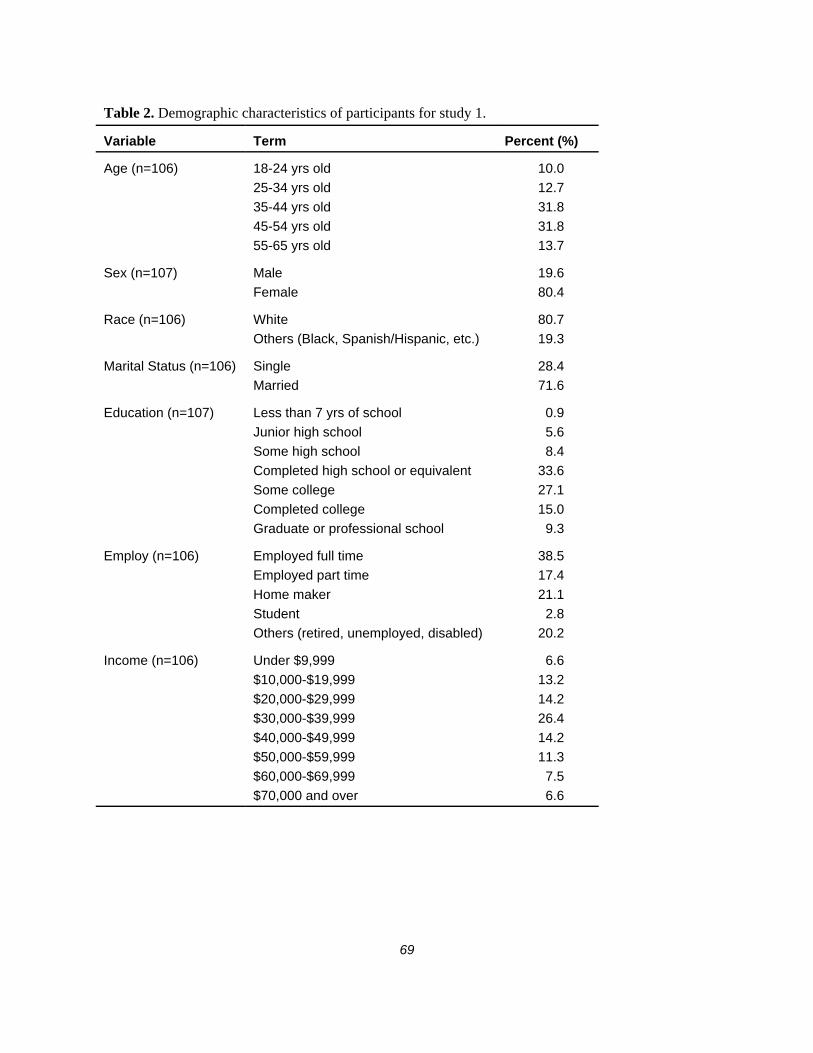
69
Table 2. Demographic characteristics of participants for study 1.
Variable Term Percent (%)
Age (n=106) 18-24 yrs old 10.025-34 yrs old 12.735-44 yrs old 31.845-54 yrs old 31.855-65 yrs old 13.7
Sex (n=107) Male 19.6Female 80.4
Race (n=106) White 80.7Others (Black, Spanish/Hispanic, etc.) 19.3
Marital Status (n=106) Single 28.4Married 71.6
Education (n=107) Less than 7 yrs of school 0.9Junior high school 5.6Some high school 8.4Completed high school or equivalent 33.6Some college 27.1Completed college 15.0Graduate or professional school 9.3
Employ (n=106) Employed full time 38.5Employed part time 17.4Home maker 21.1Student 2.8Others (retired, unemployed, disabled) 20.2
Income (n=106) Under $9,999 6.6$10,000-$19,999 13.2$20,000-$29,999 14.2$30,000-$39,999 26.4$40,000-$49,999 14.2$50,000-$59,999 11.3$60,000-$69,999 7.5$70,000 and over 6.6

70
Table 3. Demographic characteristics of participants for study 2.
Variable Term Percent (%)
Age (n=104) 18-24 yrs old 25.025-34 yrs old 15.435-44 yrs old 21.245-54 yrs old 22.155-65 yrs old 16.3
Sex (n=104) Male (n=60) 43.3Female (n=61) 56.7
Race (n=103) White 79.6Others (Black, Spanish/Hispanic, etc.) 20.4
Marital Status (n=104) Single 27.0Married 73.0
Education (n=104) Less than 7 yrs of school 1.0Junior high school 2.9Some high school 7.7Completed high school or equivalent 25.0Some college 43.3Completed college 11.5Graduate or professional school 8.7
Employ (n=104) Employed full time 34.6Employed part time 12.5Home maker 12.5Student 14.4Others (retired, unemployed, disabled) 26.0
Income (n=101) Under $9,999 5.0$10,000-$19,999 12.9$20,000-$29,999 17.8$30,000-$39,999 23.8$40,000-$49,999 10.9$50,000-$59,999 11.9$60,000-$69,999 6.9$70,000 and over 10.9
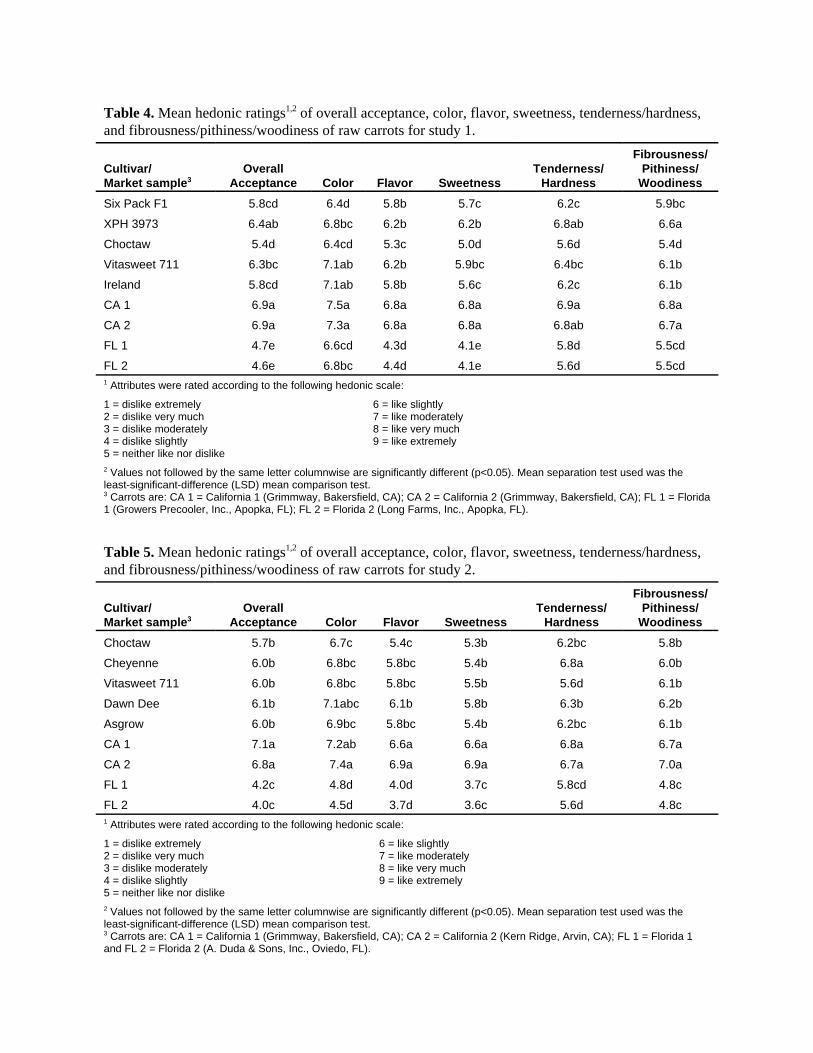
Table 4. Mean hedonic ratings1,2 of overall acceptance, color, flavor, sweetness, tenderness/hardness,and fibrousness/pithiness/woodiness of raw carrots for study 1.
Cultivar/Market sample3
OverallAcceptance Color Flavor Sweetness
Tenderness/Hardness
Fibrousness/Pithiness/
Woodiness
Six Pack F1 5.8cd 6.4d 5.8b 5.7c 6.2c 5.9bc
XPH 3973 6.4ab 6.8bc 6.2b 6.2b 6.8ab 6.6a
Choctaw 5.4d 6.4cd 5.3c 5.0d 5.6d 5.4d
Vitasweet 711 6.3bc 7.1ab 6.2b 5.9bc 6.4bc 6.1b
Ireland 5.8cd 7.1ab 5.8b 5.6c 6.2c 6.1b
CA 1 6.9a 7.5a 6.8a 6.8a 6.9a 6.8a
CA 2 6.9a 7.3a 6.8a 6.8a 6.8ab 6.7a
FL 1 4.7e 6.6cd 4.3d 4.1e 5.8d 5.5cd
FL 2 4.6e 6.8bc 4.4d 4.1e 5.6d 5.5cd1 Attributes were rated according to the following hedonic scale:
1 = dislike extremely2 = dislike very much3 = dislike moderately4 = dislike slightly5 = neither like nor dislike
6 = like slightly7 = like moderately8 = like very much9 = like extremely
2 Values not followed by the same letter columnwise are significantly different (p<0.05). Mean separation test used was theleast-significant-difference (LSD) mean comparison test.3 Carrots are: CA 1 = California 1 (Grimmway, Bakersfield, CA); CA 2 = California 2 (Grimmway, Bakersfield, CA); FL 1 = Florida1 (Growers Precooler, Inc., Apopka, FL); FL 2 = Florida 2 (Long Farms, Inc., Apopka, FL).
Table 5. Mean hedonic ratings1,2 of overall acceptance, color, flavor, sweetness, tenderness/hardness,and fibrousness/pithiness/woodiness of raw carrots for study 2.
Cultivar/Market sample3
OverallAcceptance Color Flavor Sweetness
Tenderness/Hardness
Fibrousness/Pithiness/
Woodiness
Choctaw 5.7b 6.7c 5.4c 5.3b 6.2bc 5.8b
Cheyenne 6.0b 6.8bc 5.8bc 5.4b 6.8a 6.0b
Vitasweet 711 6.0b 6.8bc 5.8bc 5.5b 5.6d 6.1b
Dawn Dee 6.1b 7.1abc 6.1b 5.8b 6.3b 6.2b
Asgrow 6.0b 6.9bc 5.8bc 5.4b 6.2bc 6.1b
CA 1 7.1a 7.2ab 6.6a 6.6a 6.8a 6.7a
CA 2 6.8a 7.4a 6.9a 6.9a 6.7a 7.0a
FL 1 4.2c 4.8d 4.0d 3.7c 5.8cd 4.8c
FL 2 4.0c 4.5d 3.7d 3.6c 5.6d 4.8c1 Attributes were rated according to the following hedonic scale:
1 = dislike extremely2 = dislike very much3 = dislike moderately4 = dislike slightly5 = neither like nor dislike
6 = like slightly7 = like moderately8 = like very much9 = like extremely
2 Values not followed by the same letter columnwise are significantly different (p<0.05). Mean separation test used was theleast-significant-difference (LSD) mean comparison test.3 Carrots are: CA 1 = California 1 (Grimmway, Bakersfield, CA); CA 2 = California 2 (Kern Ridge, Arvin, CA); FL 1 = Florida 1and FL 2 = Florida 2 (A. Duda & Sons, Inc., Oviedo, FL).

72
Table 6. Mean ratings1 of Brix (o) and sugar content (%) measured before and during sensoryevaluation and moisture content (%) measured during sensory evaluation of raw carrots for study 1.
Cultivar
Before sensory evaluation During sensory evaluation
Brix Sugar Brix Sugar Moisture
Six Pack F1 9.16bc 7.81bc 8.74c 6.84e 90.59d
XPH 3973/1 9.08bc 8.13b 9.34b 6.03e 90.52d
Choctaw/1 9.53a 10.81a 9.22b 7.63d 89.44f
Vitasweet 9.0c 7.50bc 8.64c 8.42c 91.33c
Ireland/1 9.33ab 7.05c 9.52b 6.28e 90.52d
CA 1 ---- ---- 10.13a 10.42b 89.88e
CA 2 ---- ---- 10.53a 11.78a 89.36f
FL 1 ---- ---- 7.07d 4.56f 92.89a
FL 2 ---- ---- 7.53d 5.03f 92.34b
1 Values not followed by the same letter columnwise are significantly different (p<0.05). Mean separation test used was least-significant-difference (LSD) mean comparison test.
Table 7. Mean ratings1 of Brix (o) and sugar content (%) measured before and during sensoryevaluation and moisture content (%) measured during sensory evaluation of raw carrots for study 2.
Cultivar
Before sensory evaluation During sensory evaluation
Brix Sugar Brix Sugar Moisture
Dawn Dee 9.40c 6.73c 10.00a 8.71d 90.00d
Asgrow 9.63c 7.67b 7.80d 7.04fg 91.38a
Choctaw 10.47a 8.89a 9.04b 9.72b 89.94d
Cheyenne 9.47c 8.57a 8.07d 7.93de 90.70bc
VitaSweet 9.93b 7.78b 8.55c 9.54c 90.59c
CA 1 ---- ---- 8.53c 8.58cde 91.38a
CA 2 ---- ---- 9.30b 11.41a 89.86d
FL 1 ---- ---- 8.60c 7.71ef 90.99b
FL 2 ---- ---- 8.14cd 6.17g 91.58a
1 Values not followed by the same letter columnwise are significantly different (p<0.05). Mean separation test used was least-significant-difference (LSD) mean comparison test.

73
Table 8. Correlation coefficient of Brix (o) measurement, total sugar content (%), moisture content(%), and sensory attributes of overall acceptance, flavor, and sweetness for carrot samples afterharvested and during sensory evaluation period.
Brix (o) Total sugar content Moisture
Sensory AttributeCorrelationCoefficient p-value
CorrelationCoefficient p-value
CorrelationCoefficient p-value
Overall Acceptance 0.49 0.009 0.53 0.004 -0.45 0.016
Flavor 0.53 0.004 0.50 0.006 -0.47 0.011
Sweetness 0.57 0.002 0.53 0.004 -0.50 0.007

74

2Adapted from an article by Gerry Rakobowchuk
75
Value-Added Produce - Market Niche or Future Staple?2
William O. Mizelle, Jr., Extension Economist
Market Trends:
Recent studies reveal that today’s consumer is looking for high-quality, healthful products that canbe prepared quickly. The trend toward healthier eating is resulting in increased consumption of fresh fruitsand vegetables. The convenience factor is also helping to stimulate produce sales. With more two-incomefamilies, preparation time, and quality of the product appear to be more important than price in determiningwhat products consumers buy. As well, the demographic shift toward smaller families and more singles andseniors means smaller quantities of all products are desired. Together, the health, convenience, and qualityconsiderations are increasing demand for portion-packs of branded, pre-cut fruits and vegetables.
Adding Value:
One way of increasing profits is to cater to the consumer’s need for healthful, convenient food byadding value to items in the produce department. Retailers are doing this by pre-cutting fruits and vegetablesand either selling them in bulk or packaging them in shrink-wrap to maintain freshness.
Branded Produce:
Brand fruits have been around a long time. For example, Sunkist brand oranges have been aroundsince 1907. However, branded vegetables, on a large scale, are newer arrivals and are experiencing slow butsteady growth. Produce giant Dole Food Co. is aggressively marketing branded vegetables. Dole lettuce,celery and cauliflower are becoming familiar sights on retail counters. Del Monte now packages pre-cutcelery and carrot sticks, broccoli and cauliflower florets, washed spinach, and coleslaw in retail stores.Executives interviewed by Supermarket News agreed that consumers are buying these products for thequality more than for the brand. Yet the fact that these companies, with a reputation for quality, put theirname on a product and back it with advertising is establishing consumer confidence and steady growth.
Branded produce is a growing market, already accounting for $4.5 billion of the $37 billion produceindustry. Many products have met consumer demands while proving to be quite profitable. In response toconsumer demands for a variety of fresh fruits and vegetables, some distributors are marketing exotic andorganic produce and charging premiums for Israeli tomatoes, Sun World International’s seedless water-melons and other such items. Obviously, there is a lucrative market for precut, cleaned, and efficiently pack-aged fruits and vegetables.

76
Foodservice:
The dramatic growth of the fast-food industry, along with the ever-increasing cost of labor, createda demand for pre-cut salad vegetables and fruits. Pre-cut iceberg lettuce was introduced in the late 1960s andhas become a staple in the food-service industry.
Pre-cut produce offers operators many advantages over bulk. Most importantly, it significantlylowers labor costs, since most pre-cut products are ready to eat or prepare. Because the product is less bulky,it is packed in smaller boxes and takes up less space in storage, thus decreasing packaging and warehousingcosts. As well, the entire product is used, meaning less waste and reduced garbage disposal costs to thebuyer.
Food-service buyers are turning to branded produce for its consistent quality, higher yield, andsupplier reputation. Large shippers are marketing packaged salad mixes, pre-cut french fries, coleslaw, andspinach for the food-service and consumer markets.
Summary:
Sales of value-added produce, including those that are pre-cut and branded, are growing in both theretail and food-service markets. There is evidence that pre-cut fruits and vegetables, whether branded or not,increase overall sales in the produce department. The retailers feel that there is a market for both pre-cut andbulk fruits and vegetables. Retailers still cut up and package fresh fruits and vegetables and have begun tocarry more name-brand products.
Outlook:
Changing demographics should continue to increase sales of value-added produce. Busy consumerswill still look for healthful products that are easy to prepare. Older people will continue to eat more freshfruits and vegetables, yet require smaller quantities, and to prefer individual portions or pre-cut products toavoid waste. Lastly, as labor costs continue to increase, more food-service operators will buy products thatrequire minimum preparation time. These trends provide an opportunity for higher profits at all levels of thefood industry by adding value to traditional products.
Carrots:
U. S. vegetable production increased 5 percent in 1996. Most of the gain was in fresh market. Percapita use increased for most items in 1996, with most of the gain in watermelon, cantaloup, carrots, bellpeppers and sweet corn. The surging popularity of baby-cut and fresh-cut carrots continues to drive freshcarrot use higher. In 1996, fresh carrot use rose 13 percent to 10.2 pounds, compared with an average of7.5 pounds in the 1980s. (Source: USDA, ERS, July 24, 1997)
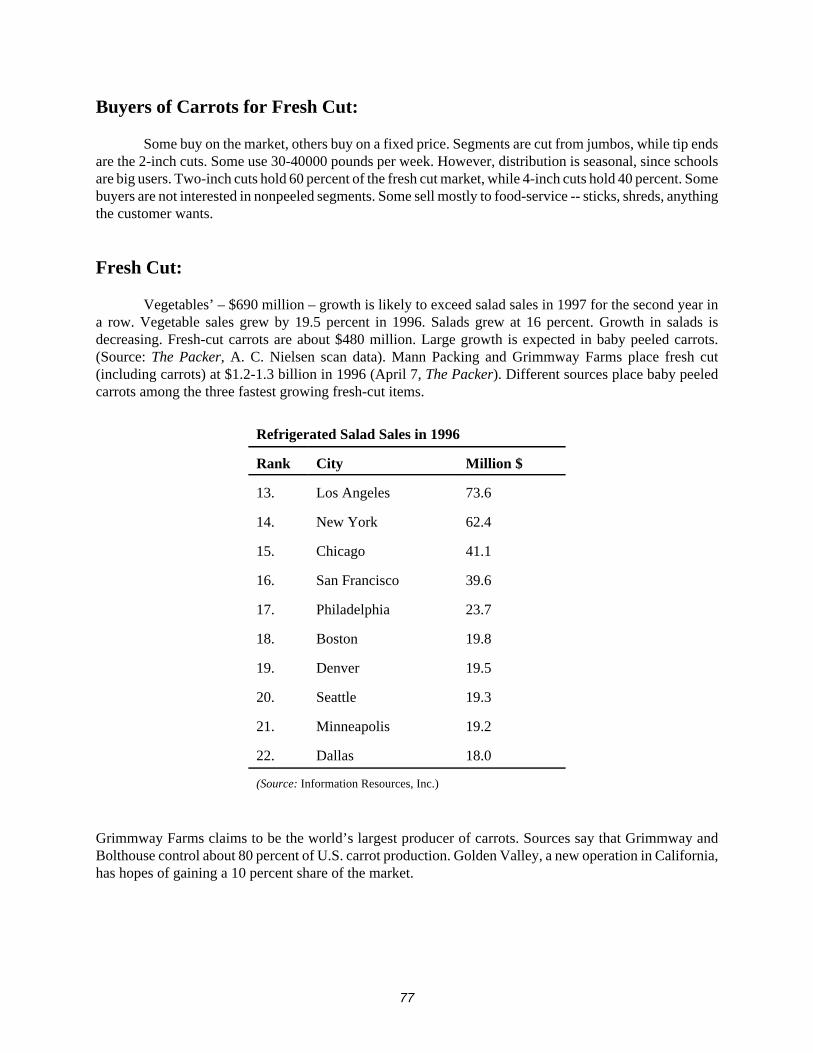
77
Buyers of Carrots for Fresh Cut:
Some buy on the market, others buy on a fixed price. Segments are cut from jumbos, while tip endsare the 2-inch cuts. Some use 30-40000 pounds per week. However, distribution is seasonal, since schoolsare big users. Two-inch cuts hold 60 percent of the fresh cut market, while 4-inch cuts hold 40 percent. Somebuyers are not interested in nonpeeled segments. Some sell mostly to food-service -- sticks, shreds, anythingthe customer wants.
Fresh Cut:
Vegetables’ – $690 million – growth is likely to exceed salad sales in 1997 for the second year ina row. Vegetable sales grew by 19.5 percent in 1996. Salads grew at 16 percent. Growth in salads isdecreasing. Fresh-cut carrots are about $480 million. Large growth is expected in baby peeled carrots.(Source: The Packer, A. C. Nielsen scan data). Mann Packing and Grimmway Farms place fresh cut(including carrots) at $1.2-1.3 billion in 1996 (April 7, The Packer). Different sources place baby peeledcarrots among the three fastest growing fresh-cut items.
Refrigerated Salad Sales in 1996
Rank City Million $
13. Los Angeles 73.6
14. New York 62.4
15. Chicago 41.1
16. San Francisco 39.6
17. Philadelphia 23.7
18. Boston 19.8
19. Denver 19.5
20. Seattle 19.3
21. Minneapolis 19.2
22. Dallas 18.0
(Source: Information Resources, Inc.)
Grimmway Farms claims to be the world’s largest producer of carrots. Sources say that Grimmway andBolthouse control about 80 percent of U.S. carrot production. Golden Valley, a new operation in California,has hopes of gaining a 10 percent share of the market.
78
Shipping Containers:
50 lb. table carton48 1-lb. carton25 lb. table poly bags 24 2-lb. cartons16 3-lb. cartons10 5-lb. carton
Baby-peeled24 1-lb. cartons20 1-lb. cartons10 2-lb. cartons8 5-lb. cartons73 3-oz carton
Food-service50 and 25 lb. poly jumbo
Consumer packs1, 2, 3, 5, and 10 lb. bags
Value added packsCartons of 4 5-lb. bags of shredded carrots, carrot sticks and match sticks (Julienne-cut). Other cuts
available are crinkle-cut sticks, diced, sliced, whole peeled or coined.
Charts Below
The first two charts show Florida f.o.b. spring carrots prices for 1997 and average spring prices.Georgia volume is not sufficient at this time for official price quotes. The second set of charts consumptiontrends and the size of California’s carrot industry relative to the total U. S. supplies.
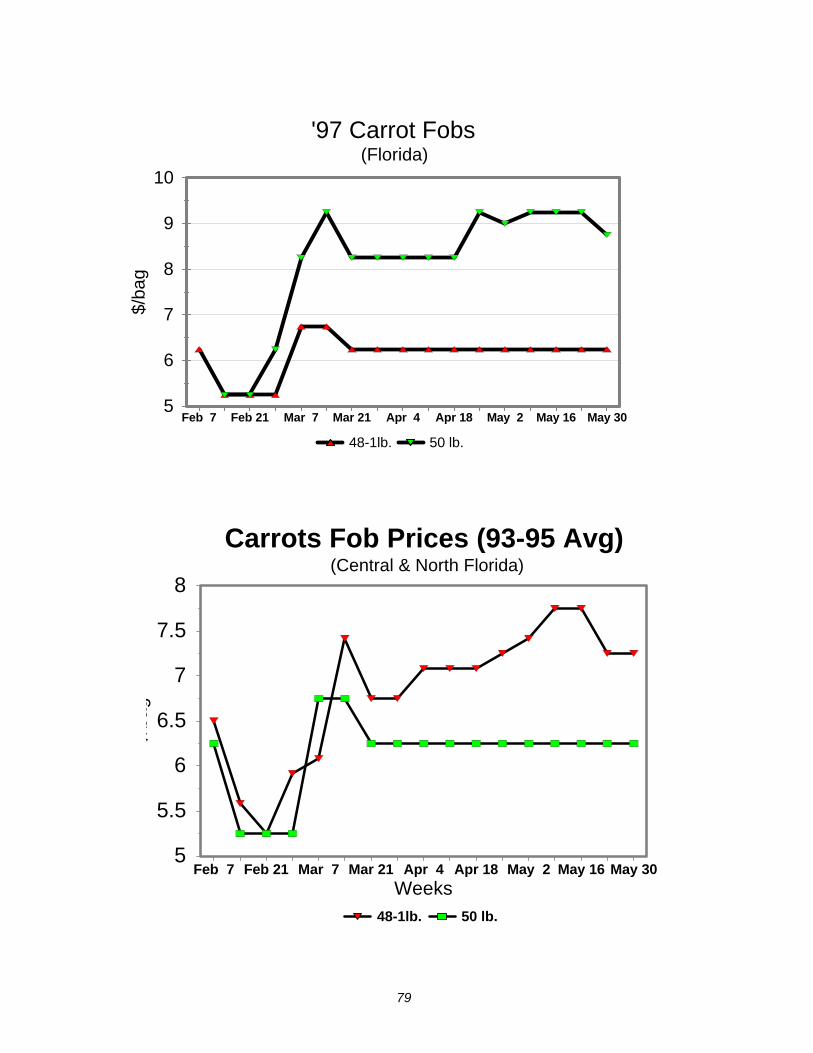
79
5
6
7
8
9
10
$/ba
g
Feb 7 Feb 21 Mar 7 Mar 21 Apr 4 Apr 18 May 2 May 16 May 30
48-1lb. 50 lb.
'97 Carrot Fobs(Florida)
5
5.5
6
6.5
7
7.5
8
$/ba
g
Feb 7 Feb 21 Mar 7 Mar 21 Apr 4 Apr 18 May 2 May 16 May 30Weeks
48-1lb. 50 lb.
Carrots Fob Prices (93-95 Avg)(Central & North Florida)

80
4
6
8
10
12
14
16
lbs/
pers
on
75 76 77 78 79 80 81 82 83 84 85 86 87 88 89 90 91 92 93 94 95 96
Carrots, all Fresh
Carrot Consumption
300
350
400
450
500
550
600
650
1000
cw
ts
Jan Feb Mar Apr May June July Aug Sep Oct Nov Dec
Total California
Carrot ArrivalsTotal and California

81
Economics
This chapter is divided into two sections. Section I is essentially a progress report to the Board ofDirectors of Georgia Sweet Carrot, Inc., by Mr. Rodney E. Bennett. Section II is a summary and analysisof the costs and returns from carrots.
SECTION I:
Progress Report of Georgia Sweet Carrot, Inc.
Rodney E. Bennett
My observation is that the initial year of operation has been eminently successful. The harvestseason began on March 14, 1997. The last carrots were processed on June 6, 1997. Preliminary data indicatethat in excess of 85,000 (50 Lbs.) masters were shipped. All masters processed for shipment were deliveredto an end user. None were left over and none left in storage.
Carrot Quality/Marketing:
The farmers planted approximately 400 acres for the 1996/97 crop year. All of the acreage washarvested and processed except for a few acres that were graded unsatisfactory in the field. Those were tooold or of such poor quality, they did not meet grading standards. Most were not worth harvesting due todisease or poor cultural practices.
The company experienced only one shipment of returned merchandise. Apparently one batchshipped to Canada had a high content of nitrogen that caused discoloration during shipment. The companyreplaced those carrots to that purchaser, who was one of the largest single buyers.
Carrot sales were in excess of $500,000.00 in operating revenue. Preliminary data indicate the pricerealized from sale of masters was a low of $4.50 to a high of $9.25, with an average of approximately $6.10.
Carrot Culture:
It has become increasingly apparent that farmers who use good cultural practices can produce asuperior quality carrot. Tests conducted by the University of Georgia revealed that Georgia-grown carrotsare of superior quality, second only to certain carrots grown in California. The difference is hard to detect.The carrots were well received by a widely diverse market.Carrot quality is directly influenced by field practices. Too much or too little fertilizer and/or water, or lackof weed or disease control, will affect the quality and the quantity of carrots produced. As one might expect,the largest farmer produced the best and most carrots.
82
The one returned shipment was made up of carrots that had been heavily fertilized but not irrigateddue to pump failure in the field. Upon discovery of the problem, the harvester was immediately moved toanother field, so as not to interrupt production. The harvester was moved back to that field after rain, andthe carrots were determined to be of good quality.
Fortunately, few natural enemies attack carrots; they are grown in the cool season when most pestsare dormant.The Cooperative Extension Service has supported the planting and process operation withresearch and continues monitoring the crop and packing effort. Solutions have been developed for eachproblem, and further research is assured.
Accordingly, it appears that area farmers including the stockholders of Georgia Sweet Carrot, Inc.,may plant as many as 800 acres in the 1997/98 crop year and as many as 1,000 acres in the 1998/99. If thatoccurs, the processing plant will need to operate longer hours and potentially with additional capacity.
Georgia sweet carrots were shipped by truck mostly along the Eastern seaboard and Canada, witha few going as far away as the state of Washington. There was a diverse market. Carrots are shipped in assmall as one-pound bags with others in 2-, 3-, 5-, 10- and up to 50-pound bags. Some are processed into 50-pound bags of processed increments for further preparation. Significant amounts of market-ready packageswere shipped to Winn Dixie, Ingles, J. H. Harvey stores, and Publix. There were remarkable numbers ofreorders from each of these large users. Carrots were sold to approximately 180 customers.
Trademark:
The company designed a distinctive logo that was printed on the packing bags. The logo featuresa bunny holding a carrot. The process to register the trade name Georgia Sweet Carrots and the logo wasinitiated through a special attorney. Approval is expected immediately.
Finances:
The company borrowed funds with which to purchase equipment and provide operating capital. TheBacon County Development Authority committed additional operating capital.
The company sold merchandise through Sy Katz Produce Company. That company committed topay for carrots shipped after 21 days. It honored that commitment. All funds have been collected. All laborhas been paid and the bulk of other operating costs have been paid as accrued. The major unpaid item is thefarmers themselves. They have been paid a portion of their accrued costs and have been willing to wait onfurther payment. Their philosophy is to leave sufficient capital in the company to assure an orderlyoperation.
In April, the farmers determined that there would be a need for increased capital. They respondedby injecting capital to avoid other borrowing.
83
Equipment:
The company has purchased equipment with which to plant, harvest, and process/pack carrots. Itoperated from a previously under-utilized building, owned and subleased to them through the Bacon CountyDevelopment Authority; that building served the needs of the company very well for the initial year.
The University of Georgia furnished via lease certain equipment used along with the purchasedequipment. Accordingly, the company has benefited from several favorable conditions that relieved theneed for massive borrowing and large real estate debt. All lease payments have been met out of cash flow.
A question has been raised about the value of some items of equipment. Several items, whenreceived, were in pieces that required assembly. These were not usable and indeed are of little value untilassembled and attached to other sections of the assembly line. The labor to assemble is a real cost andshould be considered in the final evaluation. The company can account for every dollar spent on equipmentwhether for initial parts, labor to assemble, labor to attach, or ancillary parts that furnish power, water, etc.,needed to operate. Management has produced a reliable list that delineates leased from purchase equipment.
During the operating season, it became clear that modifications will be needed to the in-plantproduction equipment to increase the efficiency and capacity of the operation. Lack of dependable laborsuggests a need for an automatic bagger. A ready market for processed increments suggests a need for abetter cutter. Some of the conveyors are too slow for the rest of the equipment. An ever-increasing need forsanitation mandates the installation of better personal hygiene equipment and better waste watermanagement.
Effective operation of mechanized harvest equipment requires specific planting. The planter mustdeliver seeds at a specific rate, depth, and spacing. There were problems in the field that were attributedinitially to the harvester. These later were determined to be a result of inexperience and inaccurate use ofthe planter. Accordingly, management and the board is cognizant of the need for planned equipmentmodification.
Waste and Spoilage:
Previous experience had taught the principles that they could expect a large volume of carrots thatwere not suitable for the fresh market. Indeed, while edible, as many as 30% to 40% are usually sorted outbecause of minor blemishes and lack of shelf appeal. A relationship was developed with a neighbor businessthat produces dried fruit as an aside to blueberry processing. The goal is to develop a market-ready productfrom cull carrots. The finished product produced during trials, which includes a sugar-infused ready to eatcarrot as well as a totally dried animal feed, appears marketable. However, the relationship has been lessthan satisfactory due to the other company’s inability to reach a level of production that would make itprofitable to dry carrots. The carrot company purchased a dicer, peeler, and blancher to assist with theresearch and development project. That equipment may be used in other production efforts if the driedproduct does not work out. The sugar-infused product is attractive and tastes very good.
The volume of waste indicates a need to develop a market for cull carrots both as is and processed.Specialty animal keepers, such as zoos, are being considered as a target market next season. It is felt thatcarrot juice may be a viable product.
84
Future Plans:
The company is composed of a group of farmers who wish to gain a value added price to theproduce they grow. They were willing to invest cash capital and personally guarantee large notes to providea facility to process carrots. The success experienced this initial year indicates their faith was and continuesto be well founded. One year does not a success make. Ultimate success cannot be claimed until they haveexperienced several years of profitable operation. It is the stated goal of the company to continue carrotculture, product development, market expansion and through possible use of a cooperative styled organ-ization, to expand the production of carrots with farmers other than stockholders. An internal brokerageservice may be viable in the future.
Continual development of carrot variety bodes well for the grower. A carrot that will grow inwinter, survive drought, hold in the field for extended times, resist disease and rot, maintain sweetness, andforgive mismanagement would be welcome. An extended storage facility could offer year round sales.
Economic Benefits:
Most of the production labor staff was low to moderate income personnel with limited skill levels.Many were migrants who lived within a 30-mile radius. The company purchased, to the extent possible, allsupplies locally. The more than $500,000.00 in sales provided an economic impact of more than$1,000,000.00 on the economy of the area.
Conclusion:
It is very gratifying to be able to report the considerable success of any company, much less a brandnew company.

85
SECTION II
Cost and Returns
George O. WestberryExtension Agricultural Economist
Analyzing costs and returns for a new enterprise may be a troubling task. If only actual numbersare used, the situation can look bad. If numbers are used reflecting what should be expected, an unrealisticpicture may be shown. Following is an attempt to show a realistic picture of the production cost for carrots.
Yields for new growers of any crop can be expected to be lower than those of experienced growers.The group of growers observed in this study had many of the problems one would expect; however, theypossess the ability to correct problems and increase yield potential. Observation of this group allowed forthe development of cost and returns scenarios.
The first scenario is for a median yield of 500 masters (50 lb. bag) per acre. Table 1 shows thisexample in detail.
Table 2 shows what should be expected of this group in future years. A yield of 700 masters mayreasonably be expected by good, experienced growers. Achieving this level of production creates anopportunity for a profitable situation, assuming the market price remains stable.
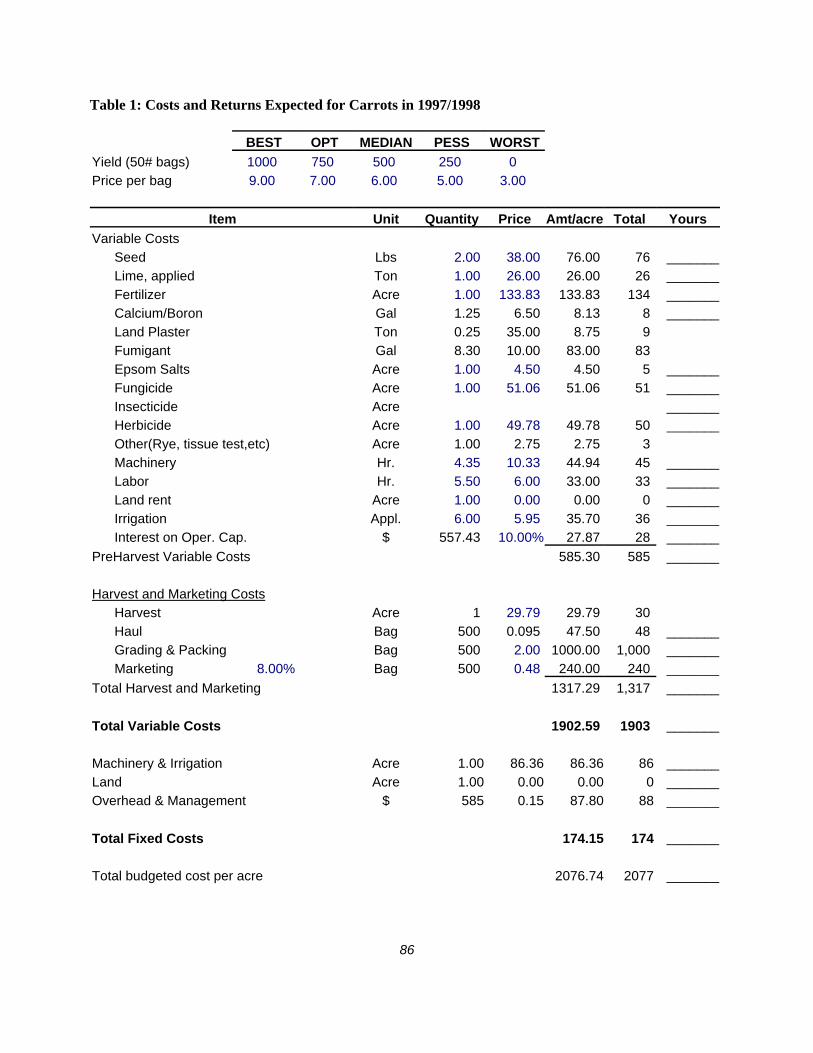
86
Table 1: Costs and Returns Expected for Carrots in 1997/1998
BEST OPT MEDIAN PESS WORSTYield (50# bags) 1000 750 500 250 0 Price per bag 9.00 7.00 6.00 5.00 3.00
Item Unit Quantity Price Amt/acre Total YoursVariable Costs
Seed Lbs 2.00 38.00 76.00 76 _______Lime, applied Ton 1.00 26.00 26.00 26 _______Fertilizer Acre 1.00 133.83 133.83 134 _______Calcium/Boron Gal 1.25 6.50 8.13 8 _______Land Plaster Ton 0.25 35.00 8.75 9 Fumigant Gal 8.30 10.00 83.00 83 Epsom Salts Acre 1.00 4.50 4.50 5 _______Fungicide Acre 1.00 51.06 51.06 51 _______Insecticide Acre _______Herbicide Acre 1.00 49.78 49.78 50 _______Other(Rye, tissue test,etc) Acre 1.00 2.75 2.75 3 Machinery Hr. 4.35 10.33 44.94 45 _______Labor Hr. 5.50 6.00 33.00 33 _______Land rent Acre 1.00 0.00 0.00 0 _______Irrigation Appl. 6.00 5.95 35.70 36 _______Interest on Oper. Cap. $ 557.43 10.00% 27.87 28 _______
PreHarvest Variable Costs 585.30 585 _______
Harvest and Marketing CostsHarvest Acre 1 29.79 29.79 30 Haul Bag 500 0.095 47.50 48 _______Grading & Packing Bag 500 2.00 1000.00 1,000 _______Marketing 8.00% Bag 500 0.48 240.00 240 _______
Total Harvest and Marketing 1317.29 1,317 _______
Total Variable Costs 1902.59 1903 _______
Machinery & Irrigation Acre 1.00 86.36 86.36 86 _______Land Acre 1.00 0.00 0.00 0 _______Overhead & Management $ 585 0.15 87.80 88 _______
Total Fixed Costs 174.15 174 _______
Total budgeted cost per acre 2076.74 2077 _______
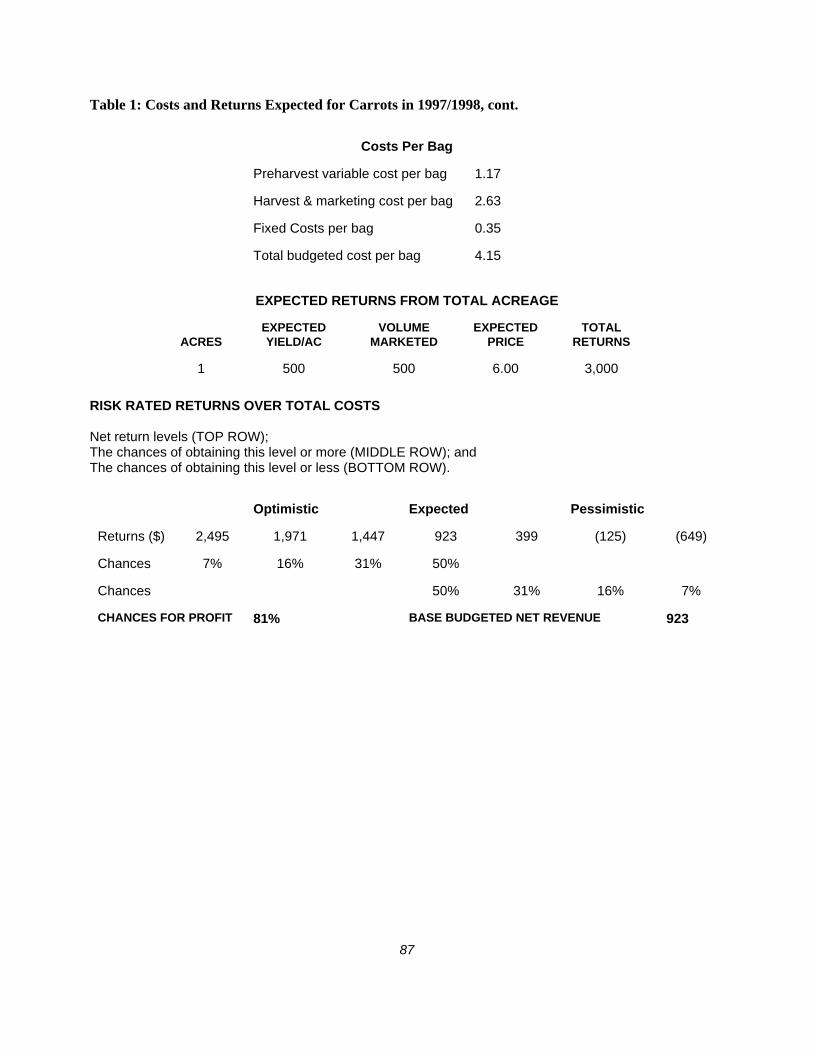
87
Table 1: Costs and Returns Expected for Carrots in 1997/1998, cont.
Costs Per Bag
Preharvest variable cost per bag 1.17
Harvest & marketing cost per bag 2.63
Fixed Costs per bag 0.35
Total budgeted cost per bag 4.15
EXPECTED RETURNS FROM TOTAL ACREAGE
ACRESEXPECTEDYIELD/AC
VOLUMEMARKETED
EXPECTEDPRICE
TOTALRETURNS
1 500 500 6.00 3,000
RISK RATED RETURNS OVER TOTAL COSTS
Net return levels (TOP ROW);The chances of obtaining this level or more (MIDDLE ROW); andThe chances of obtaining this level or less (BOTTOM ROW).
Optimistic Expected Pessimistic
Returns ($) 2,495 1,971 1,447 923 399 (125) (649)
Chances 7% 16% 31% 50%
Chances 50% 31% 16% 7%
CHANCES FOR PROFIT 81% BASE BUDGETED NET REVENUE 923

88
Investment and Annual Fixed Costs
Number of acres of this crop 70 Interest rate = 0.10
Equipment Costs for this crop
Item% of time for
This crop CostSalvageValue
Yrs. ofLife Depr. Int. Tax & Ins FC/Ac.
Tractor 10% 60000 12000 15 320 360 50.40 10.43 Plow 2% 6600 1320 12 9 8 1.11 0.25 Disk 2% 12000 2400 12 16 14 2.02 0.46 Appl. Herb 2% 1700 340 10 3 2 0.29 0.07 Rototiller 18% 5000 1000 10 70 53 7.35 1.86 Planter 18% 12000 2400 10 168 126 17.64 4.45 Cultivator 0% 3500 700 10 0 0 0.00 0.00 Sprayer 5% 32000 6400 12 107 96 13.44 3.09 Wagons 18% 2000 400 10 28 21 2.94 0.74 Harvester 18% 45000 9000 15 420 473 66.15 14 Irrigation 50% 59000 11800 15 1573 1770 247.80 51.30
Total 48706 9741 2714 2922 409 86
Interest on Investment (Ave. Inv. X Int. Rate) 2922.36 Taxes and Insurance (Ave. Inv. X .014) 409.13
Total Annual Fixed Costs 6045 Total Annual Fixed Costs Per Acre 86.4

89
Table 2. Costs and returns expected for carrots in the future years.
BEST OPT MEDIAN PESS WORST
Yield (50# bags) 1200 950 700 350 0
Price per bag 9.00 7.00 6.00 5.00 3.00
Item Unit Quantity Price Amt/Acre Total Yours
Variable Costs
Seed Lbs 2 38.00 76.00 76 _______
Lime, applied Ton 1 26.00 26.00 26 _______
Fertilizer Acre 1 133.83 133.83 134 _______
Calcium/Boron Gal 1 6.50 8.13 8 _______
Land Plaster Ton 0.25 35.00 8.75 9 _______
Fumigant Gal 8.3 10.00 83.00 83 _______
Epsom Salts Acre 1 4.50 4.50 5 _______
Fungicide Acre 1 51.06 51.06 51 _______
Insecticide Acre _______
Herbicide Acre 1 49.78 49.78 50 _______
Other (rye, tissue test, etc.) Acre 1 2.75 2.75 3 _______
Machinery Hr. 4 10.33 44.94 45 _______
Labor Hr. 6 6.00 33.00 33 _______
Land rent Acre 1 0.00 0.00 0 _______
Irrigation Appl. 6 5.95 34.70 36 _______
Interest on operatingcapital
$ 557 10.00% 27.87 28 _______
PreHarvest Variable Costs 585.30 585 _______
Harvest and Marketing Costs
Harvest Acre 1 29.79 29.79 30 _______
Haul Bag 700 0.10 66.50 67 _______
Grading and packing Bag 700 2.00 1400.00 1400 _______
Marketing Bag 700 0.48 336.00 336 _______
1832.29 1832 _______
Total Variable Costs 2417.59 2418 _______

90
Machinery Acre 1 86.36 86.36 86 _______
Land Acre 1 0.00 0.00 0 _______
Overhead & Management $ 585 0.15 87.80 88 _______
Total Fixed Costs 174.15 174 _______
Total budgeted cost per acre 2591.74 2592 _______
Costs Per Bag
Preharvest variable cost per bag 0.88
Harvest & marketing cost per bag 2.75
Fixed costs per bag 0.26
Total budgeted cost per bag 3.89
EXPECTED RETURNS FROM TOTAL ACREAGE
ACRES EXPECTEDYIELD/AC
VOLUMEMARKETED
EXPECTEDPRICE
TOTALRETURNS
1 667 667 6 4002
RISK RATED RETURNS OVER TOTAL COSTS
Net return levels (TOP ROW);The chances of obtaining this level or more (MIDDLE ROW); andThe chances of obtaining this level or less (BOTTOM ROW).
Optimistic Expected Pessimistic
Returns ($) 3185 2563 1941 1320 657 -6 -669
Chances 6% 16% 32% 51%
Chances 49% 30% 16% 7%
CHANCES FOR PROFIT 84% BASE BUDGETED NET REVENUE 1608
Investments and Annual Fixed Costs same as Table 1.

Georgia Experiment Stations