Embed Size (px)
Citation preview
COFACE COUNTRY RISK CONFERENCE 2014 / 12 NOVEMBER 2014 1
China: Carrot-and-Stick
Rocky TUNG,Economist, Asia-Pacific Region, Coface
In the Search of Growth Momentum
/
Content
Macroeconomic environment
Sectoral development
Property
Steel
Conclusion
2COFACE COUNTRY RISK CONFERENCE 2014 / 12 NOVEMBER 2014
/
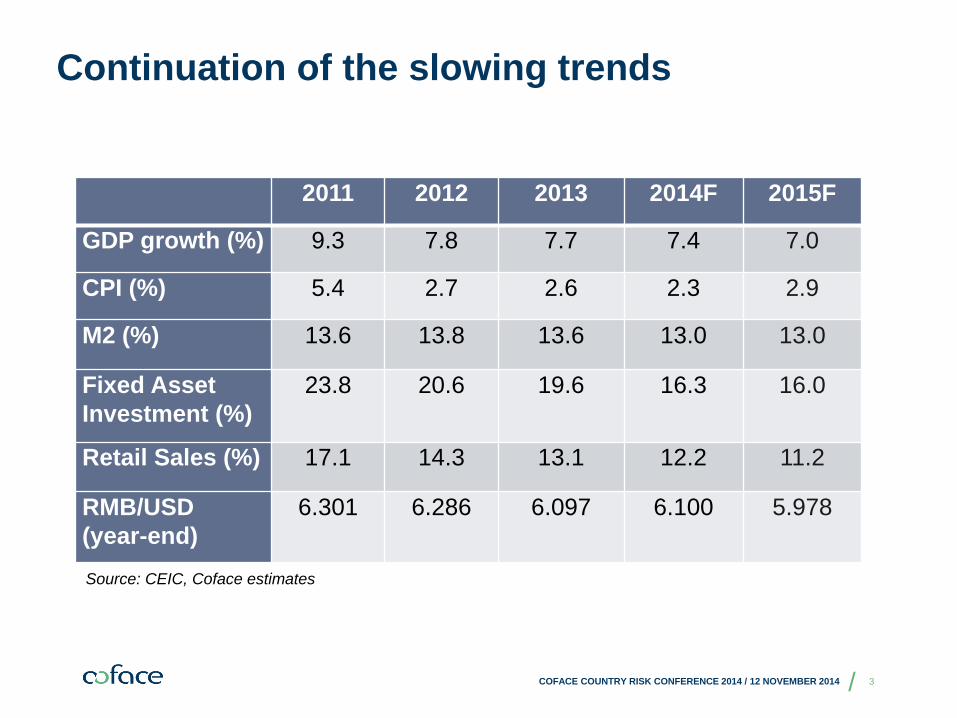
2011 2012 2013 2014F 2015F
GDP growth (%) 9.3 7.8 7.7 7.4 7.0
CPI (%) 5.4 2.7 2.6 2.3 2.9
M2 (%) 13.6 13.8 13.6 13.0 13.0
Fixed Asset Investment (%)
23.8 20.6 19.6 16.3 16.0
Retail Sales (%) 17.1 14.3 13.1 12.2 11.2
RMB/USD (year-end)
6.301 6.286 6.097 6.100 5.978
Source: CEIC, Coface estimates
Continuation of the slowing trends
3COFACE COUNTRY RISK CONFERENCE 2014 / 12 NOVEMBER 2014
/
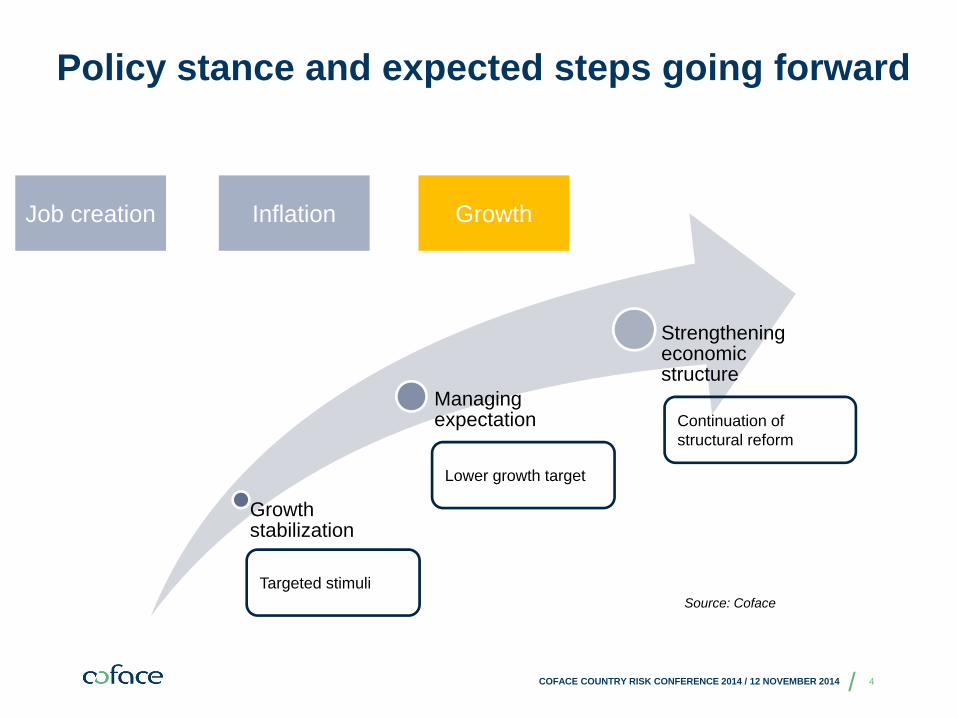
Policy stance and expected steps going forward
4COFACE COUNTRY RISK CONFERENCE 2014 / 12 NOVEMBER 2014
Growth stabilization
Managing expectation
Strengthening economic structure
Targeted stimuli
Lower growth target
Continuation of structural reform
Job creation Inflation Growth
Source: Coface
/
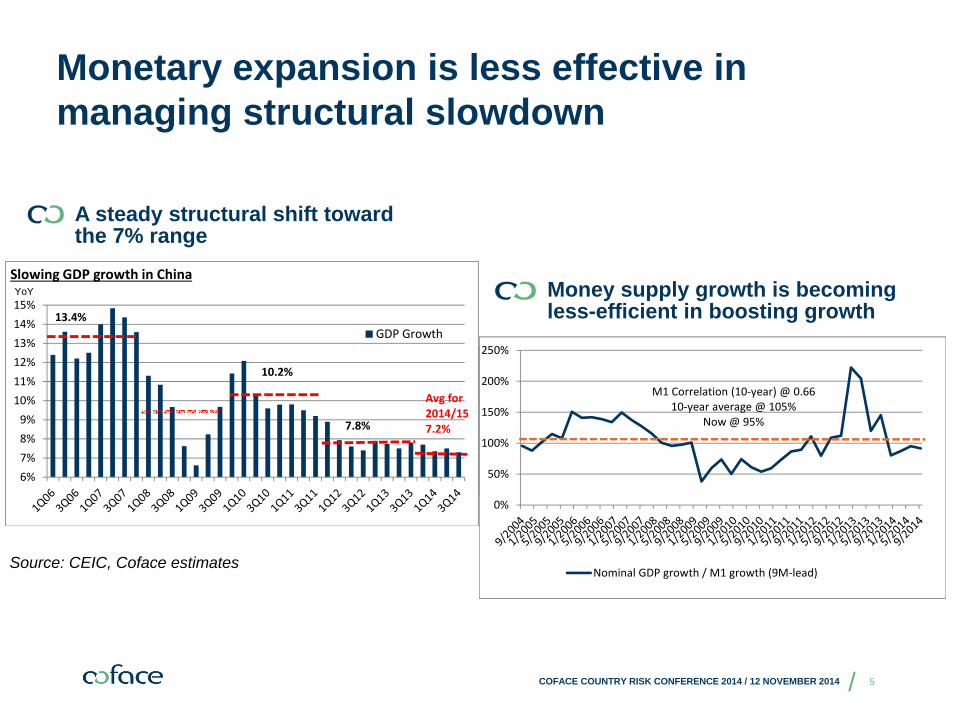
Monetary expansion is less effective in managing structural slowdown
COFACE COUNTRY RISK CONFERENCE 2014 / 12 NOVEMBER 2014 5
Source: CEIC, Coface estimates
Money supply growth is becoming less-efficient in boosting growth
A steady structural shift toward the 7% range
Nominal GD M0 M1 M21Yr lead 0.1109 0.3961 0.5847 0.34063Q-lead 0.3552 0.4965 0.6556 0.23012Q-lead 0.6068 0.5783 0.6074 0.08441Q-lead 0.8353 0.4529 0.4233 -0.1410Simultaneous 1.0000 0.4811 0.1991 -0.2671
Nominal GDP/ Money Supply
6%7%8%9%
10%11%12%13%14%15%
Slowing GDP growth in China
GDP Growth
YoY
13.4%
10.2%
7.8%
Avg for 2014/15 7.2%
0%
50%
100%
150%
200%
250%
Nominal GDP growth / M1 growth (9M‐lead)
M1 Correlation (10‐year) @ 0.6610‐year average @ 105%
Now @ 95%
/
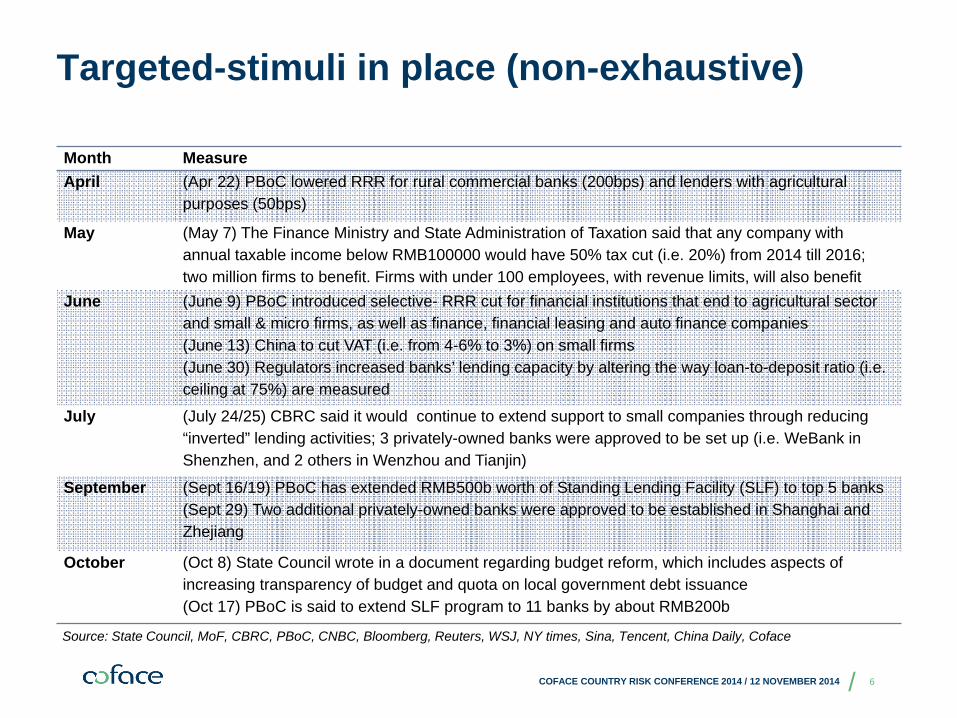
Month MeasureApril (Apr 22) PBoC lowered RRR for rural commercial banks (200bps) and lenders with agricultural
purposes (50bps)
May (May 7) The Finance Ministry and State Administration of Taxation said that any company with annual taxable income below RMB100000 would have 50% tax cut (i.e. 20%) from 2014 till 2016;two million firms to benefit. Firms with under 100 employees, with revenue limits, will also benefit
June (June 9) PBoC introduced selective- RRR cut for financial institutions that end to agricultural sector and small & micro firms, as well as finance, financial leasing and auto finance companies(June 13) China to cut VAT (i.e. from 4-6% to 3%) on small firms (June 30) Regulators increased banks’ lending capacity by altering the way loan-to-deposit ratio (i.e. ceiling at 75%) are measured
July (July 24/25) CBRC said it would continue to extend support to small companies through reducing “inverted” lending activities; 3 privately-owned banks were approved to be set up (i.e. WeBank in Shenzhen, and 2 others in Wenzhou and Tianjin)
September (Sept 16/19) PBoC has extended RMB500b worth of Standing Lending Facility (SLF) to top 5 banks(Sept 29) Two additional privately-owned banks were approved to be established in Shanghai and Zhejiang
October (Oct 8) State Council wrote in a document regarding budget reform, which includes aspects of increasing transparency of budget and quota on local government debt issuance(Oct 17) PBoC is said to extend SLF program to 11 banks by about RMB200b
Targeted-stimuli in place (non-exhaustive)
COFACE COUNTRY RISK CONFERENCE 2014 / 12 NOVEMBER 2014
Source: State Council, MoF, CBRC, PBoC, CNBC, Bloomberg, Reuters, WSJ, NY times, Sina, Tencent, China Daily, Coface
6
/
Content
Macroeconomic environment
Sectoral development
Property
Steel
Conclusion
7COFACE COUNTRY RISK CONFERENCE 2014 / 12 NOVEMBER 2014

/
Sectoral Risk Assessment (non-exhaustive)
8COFACE COUNTRY RISK CONFERENCE 2014 / 12 NOVEMBER 2014
Source: Datastream data, Coface (September 2014)

/
Property
A key part of the Chinese government’s urbanization plan
An important source of government revenue
A huge downstream market for other sectors like steel and cement, and thus iron ore, coal and other commodities
9COFACE COUNTRY RISK CONFERENCE 2014 / 12 NOVEMBER 2014
Source: Coface
Why do we talk about it?
/
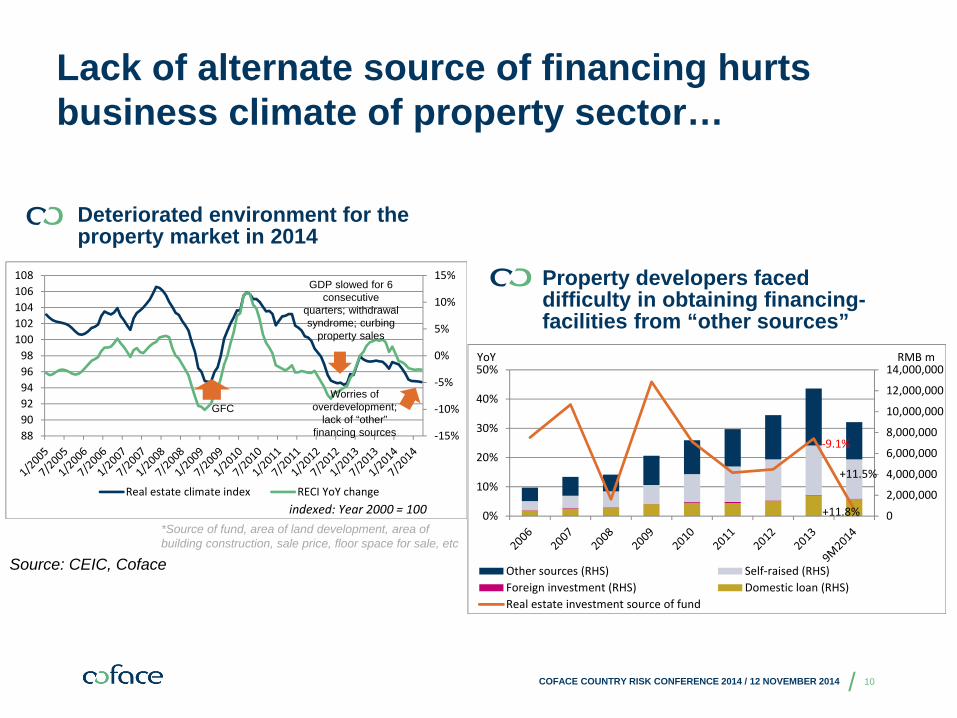
Lack of alternate source of financing hurts business climate of property sector…
Source: CEIC, Coface
COFACE COUNTRY RISK CONFERENCE 2014 / 12 NOVEMBER 2014
Deteriorated environment for the property market in 2014
*Source of fund, area of land development, area of building construction, sale price, floor space for sale, etc
Property developers faced difficulty in obtaining financing-facilities from “other sources”
10
0
2,000,000
4,000,000
6,000,000
8,000,000
10,000,000
12,000,000
14,000,000
0%
10%
20%
30%
40%
50%
Other sources (RHS) Self‐raised (RHS)Foreign investment (RHS) Domestic loan (RHS)Real estate investment source of fund
YoY RMB m
‐9.1%
+11.5%
+11.8%
‐15%
‐10%
‐5%
0%
5%
10%
15%
889092949698
100102104106108
Real estate climate index RECI YoY changeindexed: Year 2000 = 100
GDP slowed for 6 consecutive
quarters; withdrawal syndrome; curbing
property sales
GFCWorries of
overdevelopment; lack of “other”
financing sources
/
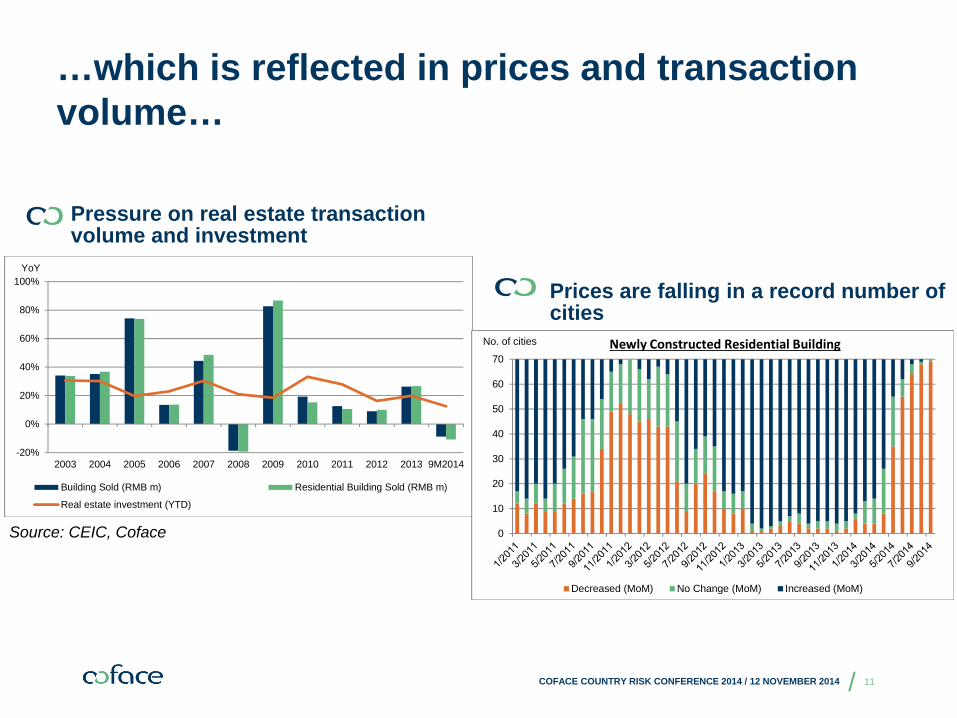
…which is reflected in prices and transaction volume…
COFACE COUNTRY RISK CONFERENCE 2014 / 12 NOVEMBER 2014
Pressure on real estate transaction volume and investment
Source: CEIC, Coface
Prices are falling in a record number of cities
11
-20%
0%
20%
40%
60%
80%
100%
2003 2004 2005 2006 2007 2008 2009 2010 2011 2012 2013 9M2014
Building Sold (RMB m) Residential Building Sold (RMB m)
Real estate investment (YTD)
YoY
0
10
20
30
40
50
60
70
Decreased (MoM) No Change (MoM) Increased (MoM)
No. of cities Newly Constructed Residential Building
/
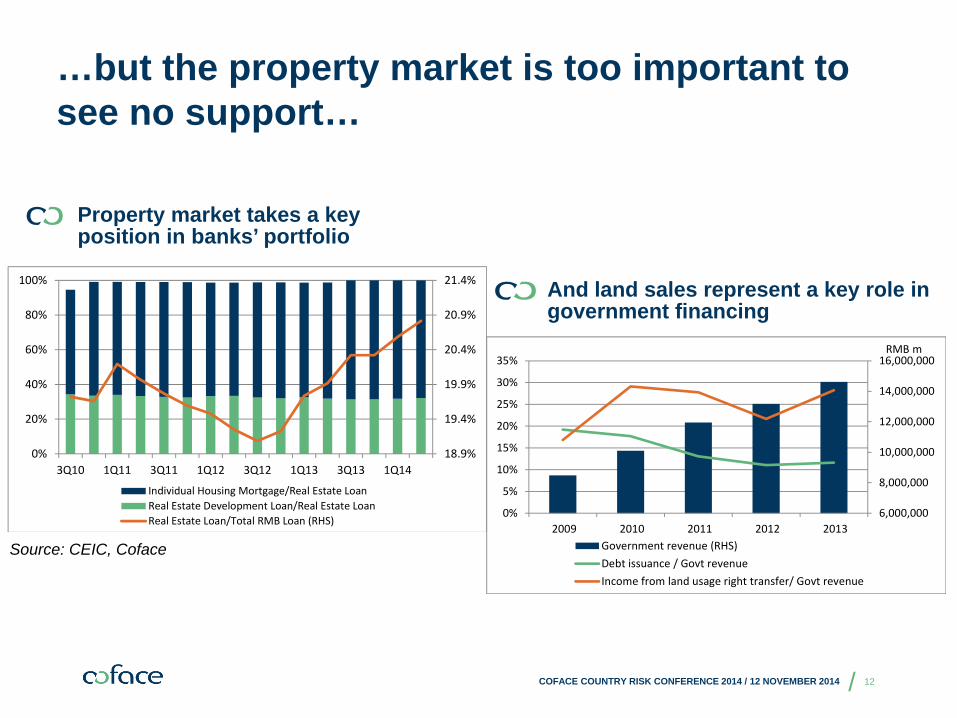
…but the property market is too important to see no support…
And land sales represent a key role in government financing
Property market takes a key position in banks’ portfolio
Source: CEIC, Coface
12COFACE COUNTRY RISK CONFERENCE 2014 / 12 NOVEMBER 2014
18.9%
19.4%
19.9%
20.4%
20.9%
21.4%
0%
20%
40%
60%
80%
100%
3Q10 1Q11 3Q11 1Q12 3Q12 1Q13 3Q13 1Q14
Individual Housing Mortgage/Real Estate LoanReal Estate Development Loan/Real Estate LoanReal Estate Loan/Total RMB Loan (RHS)
6,000,000
8,000,000
10,000,000
12,000,000
14,000,000
16,000,000
0%
5%
10%
15%
20%
25%
30%
35%
2009 2010 2011 2012 2013Government revenue (RHS)Debt issuance / Govt revenueIncome from land usage right transfer/ Govt revenue
RMB m

/
Steel
A barometer for the other sectors in China (property, construction, shipping, automobile, electronics, etc.)
A traditionally important industry that is facing tremendous pressure – provides indication of government policy direction
Arguably a price-setter for the regional market
13COFACE COUNTRY RISK CONFERENCE 2014 / 12 NOVEMBER 2014
Source: Coface
Why do we talk about it?
/
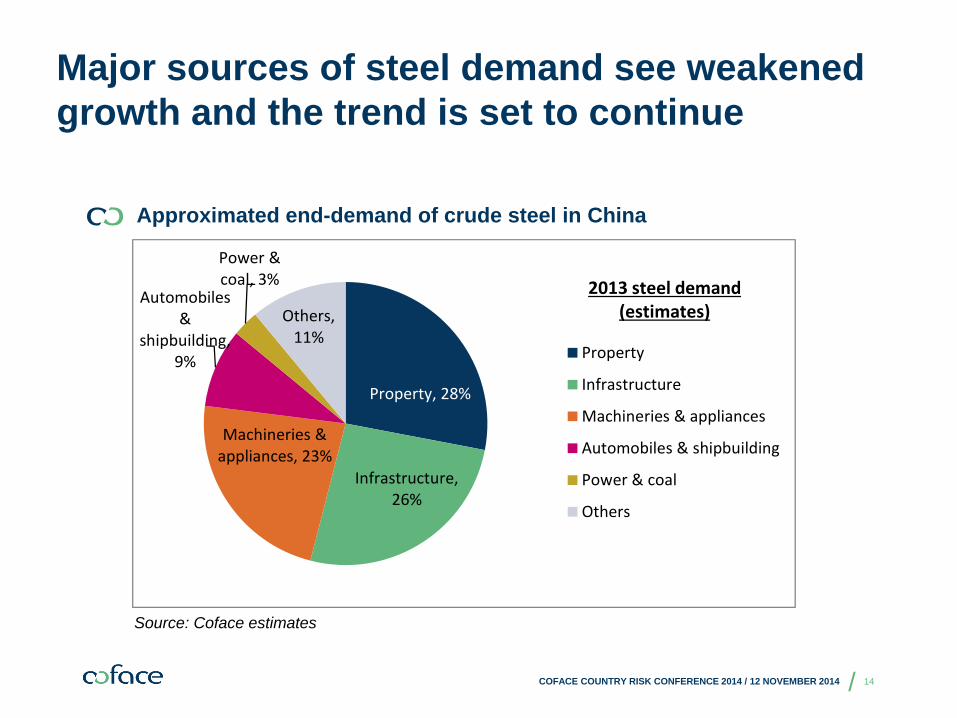
Major sources of steel demand see weakened growth and the trend is set to continue
14COFACE COUNTRY RISK CONFERENCE 2014 / 12 NOVEMBER 2014
Approximated end-demand of crude steel in China
Source: Coface estimates
Property, 28%
Infrastructure, 26%
Machineries & appliances, 23%
Automobiles &
shipbuilding, 9%
Power & coal, 3%
Others, 11%
Property
Infrastructure
Machineries & appliances
Automobiles & shipbuilding
Power & coal
Others
2013 steel demand (estimates)
/
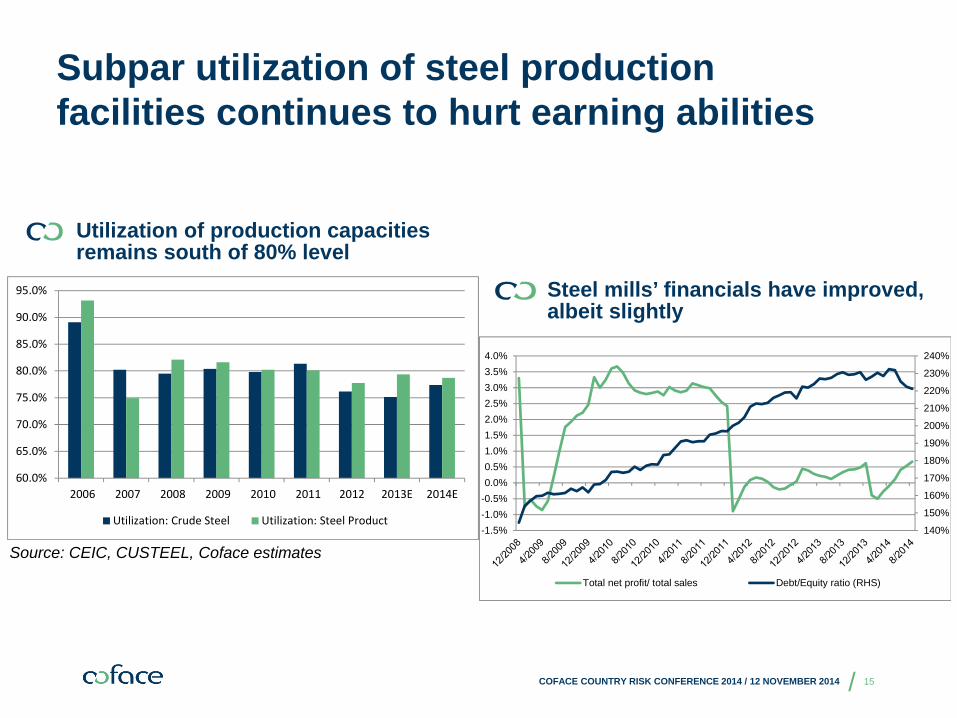
Subpar utilization of steel production facilities continues to hurt earning abilities
15COFACE COUNTRY RISK CONFERENCE 2014 / 12 NOVEMBER 2014
Steel mills’ financials have improved, albeit slightly
Utilization of production capacities remains south of 80% level
140%
150%
160%
170%
180%
190%
200%
210%
220%
230%
240%
-1.5%-1.0%-0.5%0.0%0.5%1.0%1.5%2.0%2.5%3.0%3.5%4.0%
Total net profit/ total sales Debt/Equity ratio (RHS)
Source: CEIC, CUSTEEL, Coface estimates
60.0%
65.0%
70.0%
75.0%
80.0%
85.0%
90.0%
95.0%
2006 2007 2008 2009 2010 2011 2012 2013E 2014E
Utilization: Crude Steel Utilization: Steel Product
/
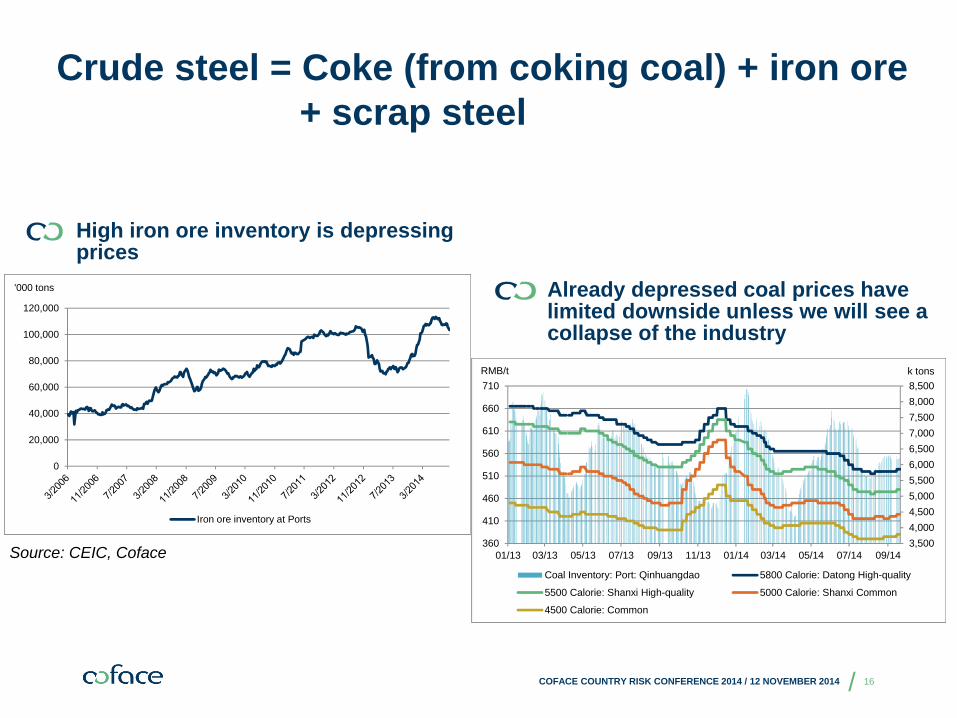
Crude steel = Coke (from coking coal) + iron ore + scrap steel
16COFACE COUNTRY RISK CONFERENCE 2014 / 12 NOVEMBER 2014
Already depressed coal prices have limited downside unless we will see a collapse of the industry
High iron ore inventory is depressing prices
Source: CEIC, Coface
0
20,000
40,000
60,000
80,000
100,000
120,000
Iron ore inventory at Ports
'000 tons
3,5004,0004,5005,0005,5006,0006,5007,0007,5008,0008,500
360
410
460
510
560
610
660
710
01/13 03/13 05/13 07/13 09/13 11/13 01/14 03/14 05/14 07/14 09/14
Coal Inventory: Port: Qinhuangdao 5800 Calorie: Datong High-quality
5500 Calorie: Shanxi High-quality 5000 Calorie: Shanxi Common
4500 Calorie: Common
RMB/t k tons
/
Content
Macroeconomic environment
Sectoral development
Property
Steel
Conclusion
17COFACE COUNTRY RISK CONFERENCE 2014 / 12 NOVEMBER 2014
/
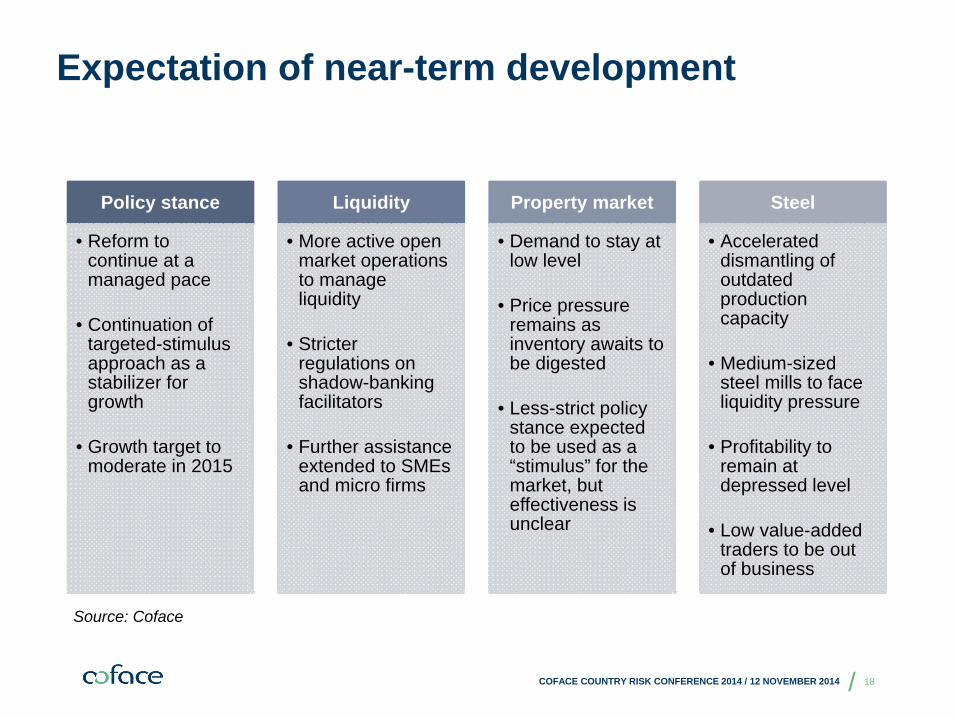
Expectation of near-term development
Policy stance
• Reform to continue at a managed pace
• Continuation of targeted-stimulus approach as a stabilizer for growth
• Growth target to moderate in 2015
Liquidity
• More active open market operations to manage liquidity
• Stricter regulations on shadow-banking facilitators
• Further assistance extended to SMEs and micro firms
Property market
• Demand to stay at low level
• Price pressure remains as inventory awaits to be digested
• Less-strict policy stance expected to be used as a “stimulus” for the market, but effectiveness is unclear
Steel
• Accelerated dismantling of outdated production capacity
• Medium-sized steel mills to face liquidity pressure
• Profitability to remain at depressed level
• Low value-added traders to be out of business
COFACE COUNTRY RISK CONFERENCE 2014 / 12 NOVEMBER 2014
Source: Coface
18

/
Conclusion
Continued growth
stabilization
Effective policy
execution
Ongoing structural
reformSustainable development
19COFACE COUNTRY RISK CONFERENCE 2014 / 12 NOVEMBER 2014
Source: Coface
Average growth rate of 7.2% in 2014/15; continuation of targeted-stimuli approach
Effective investment and well-planned urbanization;
reduction in pollution
Dismantling outdated capacity; continuation of anti-corruption scheme; liquidity management
Become less-reliant on fiscal & monetary stimuli;
RMB internationalization
2014 Coface Country RiskConference
Coffee Break
Please return to your seat at 10:50am


