Embed Size (px)
Citation preview
Prepared for the City of Statesboro by
Connetics Transportation Group
Transit Feasibility Study for the
City of Statesboro, Georgia
Draft Final Report
Statesboro, Georgia
May 7, 2019
Draft
Revision 2

This Page Intentionally Left Blank
May 7, 2019 Page i
Statesboro Transit Feasibility Study
Final Report
Contents Executive Summary ....................................................................................................................................................................................... ES-1
Needs Assessment Findings ...................................................................................................................................................................... ES-1
Alternative Public Transportation Strategies ...................................................................................................................................... ES-3
Funding and Implementation Considerations ................................................................................................................................... ES-7
1. Introduction .................................................................................................................................................................................................. 1
2. Existing Conditions Assessment ........................................................................................................................................................... 2
2.1. Transit Market Analysis ...................................................................................................................................................................... 2
2.2. Summary of Existing Public Transportation Services ........................................................................................................... 27
3. Peer Analysis ............................................................................................................................................................................................... 31
4. Summary Public Engagement Activities .......................................................................................................................................... 36
4.1. Project Steering Committee........................................................................................................................................................... 36
4.2. Stakeholder Interviews ..................................................................................................................................................................... 38
4.3. Public Surveys ...................................................................................................................................................................................... 40
4.4. Community Open Houses .............................................................................................................................................................. 45
5. Purpose and Needs Assessment, Goals, and Objectives .......................................................................................................... 49
5.1. Purpose .................................................................................................................................................................................................. 49
5.2. Needs Assessment ............................................................................................................................................................................. 49
5.3. Goals, Objectives, and Evaluation Metrics ................................................................................................................................ 52
6. Definition and Evaluation of Transit Service Alternatives ......................................................................................................... 54
6.1. Overview of Potential Service Types and Design Principles.............................................................................................. 54
6.2. Definition of Alternative Service Strategies ............................................................................................................................. 58
6.3. Evaluation and Refinement of Initial Service Alternatives ................................................................................................. 66
7. Final Service Alternatives ....................................................................................................................................................................... 68
7.1. Description of Final Service Alternatives................................................................................................................................... 68
7.2. Proposed Baseline Service Plans and Annual Operating Requirements ...................................................................... 74
7.3. Operations and Maintenance (O&M) Cost Estimates ......................................................................................................... 76
7.4. Capital Cost Estimates ...................................................................................................................................................................... 78
7.5. Ridership Estimates ........................................................................................................................................................................... 82
7.6. Evaluation of Final Service Alternatives ..................................................................................................................................... 84
7.7. Potential Future Service Improvements .................................................................................................................................... 87
8. Funding and Implementation .............................................................................................................................................................. 92
8.1. Potential Funding Sources and Financial Plan Scenarios ................................................................................................... 92
8.2. Service Delivery Options .............................................................................................................................................................. 103
8.3. Implementation Plan ..................................................................................................................................................................... 105
Appendix ............................................................................................................................................................................................................. 108
Appendix A: Stakeholder Interview Results ........................................................................................................................................... 109
Appendix B: Public Survey #1 Results ...................................................................................................................................................... 111
Appendix C: Public Survey #2 Results ..................................................................................................................................................... 134
Appendix D: Public Meeting #2 Feedback ............................................................................................................................................. 188
Appendix E: Detailed Operating Statistics by Route .......................................................................................................................... 190
May 7, 2019 Page ii
Statesboro Transit Feasibility Study
Final Report
Tables
Table ES-1: Alternative Public Transportation Service Strategies ............................................................................................................. ES-3
Table ES-2: Cost and Ridership Estimates for Final Alternatives (2019 $) ............................................................................................. ES-7
Table 2-1: Bulloch County and Statesboro Population Change, 1990 - 2017 ........................................................................................... 4
Table 2-2: Bull5och County and Statesboro Population Density Change, 1990 - 2017........................................................................ 4
Table 2-3: Bulloch County and Statesboro Employment Change, 2006 - 2015 ....................................................................................... 7
Table 2-4: Bulloch County and Statesboro Employment Density Change, 2006 - 2010 ...................................................................... 7
Table 2-5: Top Employers in Greater Statesboro (Statesboro Chamber of Commerce, 2018) ........................................................ 11
Table 2-6: Common Density Thresholds to Support Transit Level of Service ......................................................................................... 12
Table 2-7: Bulloch County Density Threshold Analysis Results ..................................................................................................................... 12
Table 2-8: Transit Propensity Index Variables and Weighting ....................................................................................................................... 14
Table 2-9 Bulloch County Transit Propensity Analysis Results ...................................................................................................................... 16
Table 2-10: Statesboro Major Activity Generators and Essential Services ................................................................................................ 22
Table 2-11: Statesboro Area Uber and Lyft Fare Structures ........................................................................................................................... 30
Table 3-1: Peer City Selection Criteria ..................................................................................................................................................................... 31
Table 3-2: Peer City Transit Data ............................................................................................................................................................................... 35
Table 4-1: Public Survey 2 Route Preference Results ........................................................................................................................................ 44
Table 4-2: Community Open House #1 Stations ................................................................................................................................................ 46
Table 4-3: Public Open House #2 Stations ............................................................................................................................................................ 47
Table 4-4: Public Open House #2: Route Preference Results ........................................................................................................................ 48
Table 5-1: Transit Feasibility Study Goals ............................................................................................................................................................... 52
Table 5-2: Transit Feasibility Study Goals, Objectives, and Evaluation Metrics ...................................................................................... 53
Table 6-1: Range of Possible Service Options ...................................................................................................................................................... 54
Table 6-2: Summary of Transit Service Types ....................................................................................................................................................... 55
Table 6-3: Initial Service Alternative Evaluation Matrix .................................................................................................................................... 66
Table 6-4: Initial Route Evaluation Results ............................................................................................................................................................. 67
Table 7-1: Proposed Baseline Service Plans Summary ..................................................................................................................................... 74
Table 7-2: Annual Baseline Operating Requirements by Alternative .......................................................................................................... 75
Table 7-3: Bus and Demand Response Expense Allocations .......................................................................................................................... 76
Table 7-4: Peer Bus and Demand Response O&M Unit Costs (FY2017 Dollars) .................................................................................... 77
Table 7-5: Estimated Annual O&M Costs by Alternative ................................................................................................................................. 77
Table 7-6: Estimated Vehicle Unit Costs ................................................................................................................................................................. 78
Table 7-7: Estimated Capital Costs by Alternative .............................................................................................................................................. 81
Table 7-8: Peer Ridership Productivity Data (Source: 2017 NTD Report) ................................................................................................. 82
Table 7-9: Ridersip Estimation Framework ............................................................................................................................................................ 83
Table 7-10: Estimated Annual Ridership and Fare Revenue by Alternative ............................................................................................. 83
Table 7-11: Evaluation of Final Service Alternatives .......................................................................................................................................... 84
Table 7-12: Evaluation Summary of Final Alternatives...................................................................................................................................... 86
Table 7-13: Estimated Annual Operating Statistics, Costs, Revenue, and Ridership by Alternative .............................................. 90
Table 7-14: Estimated Capital Costs by Alternative ........................................................................................................................................... 91
Table 8-1: Potential Federal Funding Sources for Operations and Capital Uses ................................................................................... 94
Table 8-2: GDOT Section 5311 Evaluation Criteria ............................................................................................................................................. 98
Table 8-3: Capital Funding Financial Plan Scenarios (2019 $) .................................................................................................................... 102
Table 8-4: Operations Funding Plan Scenarios (2019 $) ............................................................................................................................... 102
Table 8-5: Transit Service Implementation Work Plan Tasks ...................................................................................................................... 107
May 7, 2019 Page iii
Statesboro Transit Feasibility Study
Final Report
Figures Figure ES-1: Alternative 1 – Demand Response Service within City Limits .......................................................................................... ES-4
Figure ES-2: Alternative 2 – Orange Fixed-Route Service............................................................................................................................ ES-5
Figure ES-3: Alternatives 3 and 4 – Red and Blue Fixed-Route / Flex-Route Service ....................................................................... ES-6
Figure 2-1: Components of Transit Demand .......................................................................................................................................................... 2
Figure 2-2: Bulloch County and Statesboro Population Change, 1990 – 2017 ........................................................................................ 4
Figure 2-3: Total Population (2016 ACS) .................................................................................................................................................................. 5
Figure 2-4: Population Density (2016 ACS) ............................................................................................................................................................. 6
Figure 2-5: Bulloch County and Statesboro Employment Change, 2006 – 2015 ..................................................................................... 7
Figure 2-6: Total Employment (2016 ACS) ............................................................................................................................................................... 8
Figure 2-7: Employment Density (2016 ACS) .......................................................................................................................................................... 9
Figure 2-8: Bulloch County and Statesboro Employment by Industry (2015) ......................................................................................... 10
Figure 2-9: Bulloch Coutny and Statesboro Jobs by Earnings ....................................................................................................................... 11
Figure 2-10: Bulloch County Density Threshold Analysis ................................................................................................................................ 13
Figure 2-11: Transit Propensity Index for Bulloch County ............................................................................................................................... 15
Figure 2-12: Senior Population Density (2016) .................................................................................................................................................... 17
Figure 2-13: Youth Population Density (2016) ..................................................................................................................................................... 18
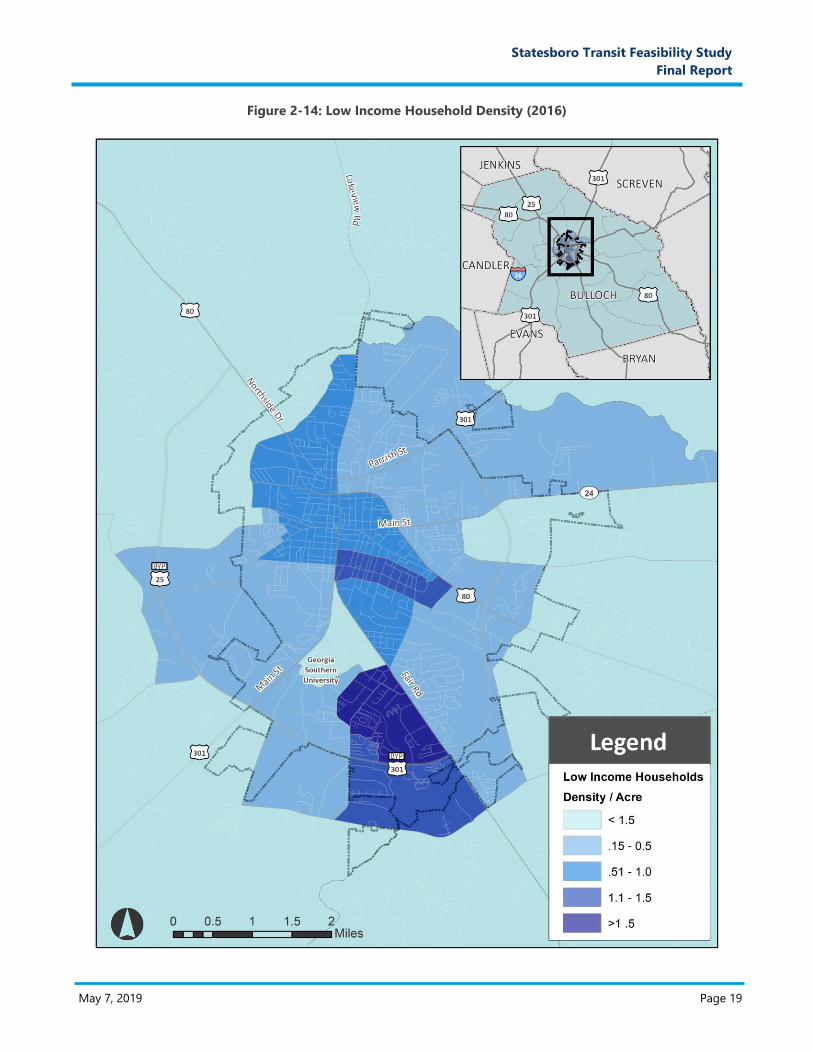
Figure 2-14: Low Income Household Density (2016) ........................................................................................................................................ 19
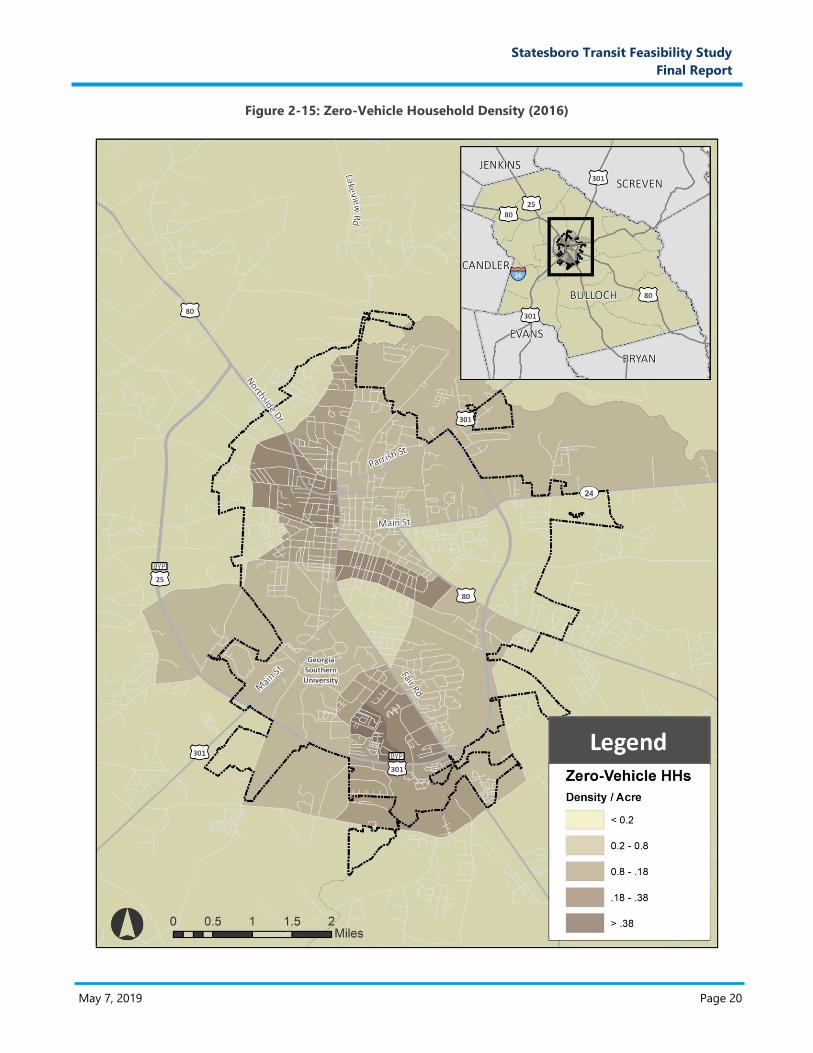
Figure 2-15: Zero-Vehicle Household Density (2016) ....................................................................................................................................... 20
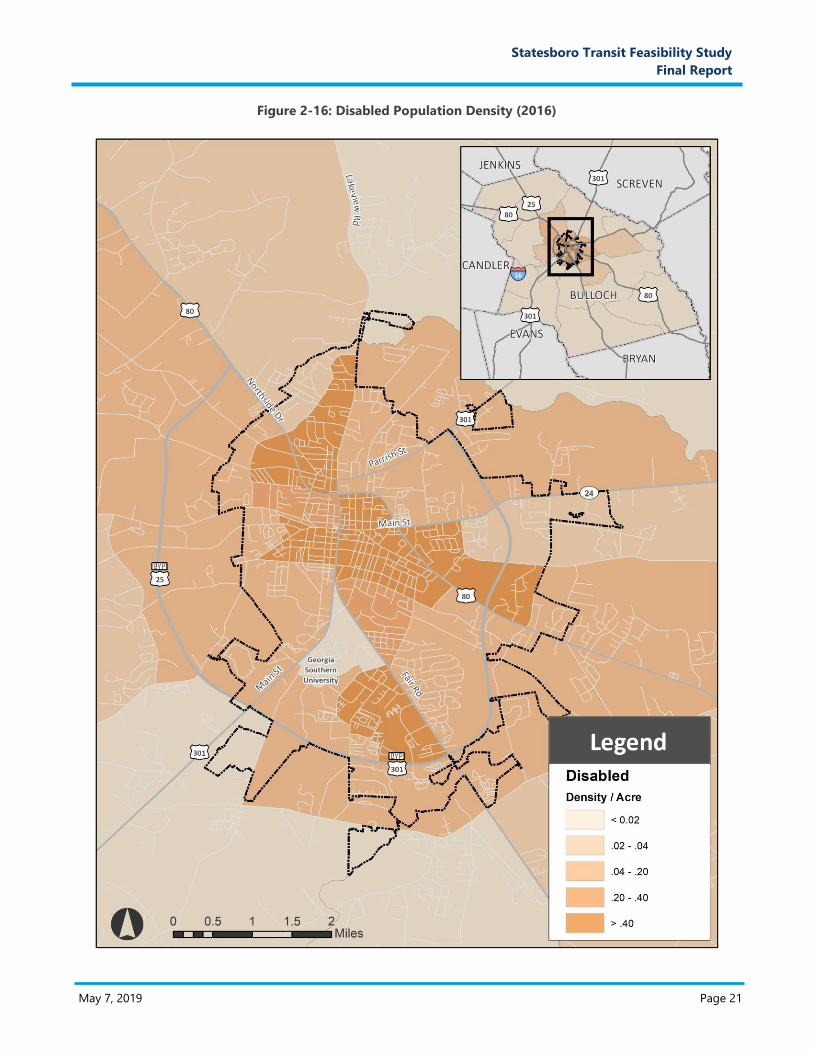
Figure 2-16: Disabled Population Density (2016) ............................................................................................................................................... 21
Figure 2-17: City of Statesboro Potential Major Transit Generators ........................................................................................................... 23
Figure 2-18: Statesboro Home-Based Work Travel Flows (2015 LEHD) .................................................................................................... 24
Figure 2-19: Home and Work Locations of Accommodation/Food Service, Retail, and Healthcare Workers (2015 LEHD) 25
Figure 2-20: Home and Work Locations of Workers by Earnings (2015 LEHD) ..................................................................................... 26
Figure 2-21: Coastal Regional Coaches Bus and Service Area....................................................................................................................... 27
Figure 2-22: GSU Southern Express Route Network .......................................................................................................................................... 29
Figure 4-1: Steering Committee #1 .......................................................................................................................................................................... 37
Figure 4-2: Public Open House #1 ............................................................................................................................................................................ 46
Figure 4-3: Public Open House #2 ............................................................................................................................................................................ 47
Figure 5-1: Transit Feasibility Study Guiding Principles ................................................................................................................................... 52
Figure 6-1: Service Frequency versus Service Coverage .................................................................................................................................. 56
Figure 6-2: Deviating Alignment versus Direct Alignment.............................................................................................................................. 57
Figure 6-3: Loop Alignments versus Bi-Directional Alignments ................................................................................................................... 57
Figure 6-4: Service Strategy Development and Evaluation Framework ..................................................................................................... 58
Figure 6-5: Network Concept A.................................................................................................................................................................................. 61
Figure 6-6: Network Concept B .................................................................................................................................................................................. 63
Figure 6-7: Route Concept C ....................................................................................................................................................................................... 65
Figure 7-1: Alternative 1 – Demand Response Service within City Limits ................................................................................................. 69
Figure 7-2: Alternative 2 – Orange Fixed-Route Service .................................................................................................................................. 71
Figure 7-3: Alternatives 3 and 4 – Red and Blue Fixed-Route / Flex-Route Service ............................................................................. 73
Figure 7-4: Alternative 3 with Purple Route .......................................................................................................................................................... 89

This Page Intentionally Left Blank
May 7, 2019 Page ES-1
Statesboro Transit Feasibility Study
Final Report
Executive Summary Bulloch County and Statesboro have experienced substantial growth in recent years. With this growth comes an
increased demand for mobility within the community, especially for segments of the population that lack
transportation options due to financial or physical limitations. Recognizing this potential need and building on a
successful Bulloch County TSPLOST referendum in April 2018 that set aside funding for transit, the City of Statesboro
initiated a Transit Feasibility Study (TFS) to determine the viability of a new public transportation system.
The purpose of the TFS is to evaluate public transportation needs based on market data and input from the
community, develop and evaluate alternatives, and identify potential funding sources and implementation
strategies. The City hired a consultant team led by Connetics Transportation Group (CTG), a public transit planning
consulting firm based in Atlanta, Georgia, to conduct the study in coordination with the City and stakeholder
representatives throughout the community.
The study was delivered in three phases. The first phase involved a public transit needs assessment that considered
the demand for transit in Statesboro relative to existing public and private services. The second phase encompassed
the development and evaluation of potential service alternatives to address the identified needs. In the third and
final phase, an implementation and funding plan was prepared to serve as a roadmap for future system
development. A robust stakeholder and public engagement program guided each phase of the study.
This executive summary is a companion to the full TFS Final Report and provides a high-level overview of the study’s
findings and recommendations.
Needs Assessment Findings
The market analysis and public and stakeholder engagement process revealed several key needs and opportunities
regarding public transportation in Statesboro. These are summarized below.
Rapid Population and Employment Growth: The need for expanded mobility options in Statesboro is
being driven by the rapid population and employment growth that has occurred across the region in recent
years. Since 2000, the City has experienced a 38% increase in population while employment has increased
17% since 2006. This growth is anticipated to continue into the future. According to updated forecasts cited
in the Coastal Regional Commission’s (CRC) 2015 Regional Assessment of Coastal Georgia the City can
expect to add another 4,500 to 6,000 residents by 2020, and as many as 13,500 to 17,000 by 2030. As the
City continues to add new residents and jobs in the coming years, investments in transportation
infrastructure and services will be required to manage the accompanying demand for travel.
Large Transportation Disadvantaged Population: Findings from the transit market analysis, public
survey, and stakeholder interviews indicate that a large segment of the Statesboro population is
transportation disadvantaged due to financial or physical limitations. The market analysis indicated that
more than 6,500 households with annual incomes below $35,000 are located in areas with high levels of
transit propensity and sufficient density to support scheduled transit service, and 1,000 of these households
do not have access to a vehicle. These areas also include 2,200 seniors, nearly 20,000 school and college-
age students, and 3,000 disabled individuals. In terms of employment, areas of highest transit potential in
Statesboro encompass nearly 18,000 total jobs. More than 5,000 of those jobs are in the retail and service
sectors, and more than 6,000 are low-wage jobs. These figures represent a market segment that is
potentially underserved by the existing public transportation services.
May 7, 2019 Page ES-2
Statesboro Transit Feasibility Study
Final Report
Lack of Mobility Options Available to General Public and Low Existing Transit Utilization: Existing
ridership on the Coastal Regional Coaches (CRC) demand-response service in Bulloch County is relatively
low, totaling about 10,000 one-way trips in FY2016, or about 40 trips per average weekday. In terms of
service consumed by the general public in Bulloch County, this equates to about 0.13 annual passenger
trips per capita, which is roughly half the rate reported by all demand response operators in Georgia in
2017 and one-third of the rate reported by all demand response operators located in the southeastern
United States with service area populations less than 100,000 residents. Given the magnitude of the
transportation disadvantaged population in Statesboro, this relatively low transit utilization rate may
represent untapped demand. This notion is supported by results from the public survey conducted during
the first phase of this study, in which nearly 90% of respondents indicated that they have used transit in
other cities, but only 20% have used transit in Statesboro. The lack of transit usage among the general
public in Bulloch County can likely be attributed to a number of factors, including a lack of awareness or
understanding of how to use the CRC service; scheduling, cost, or reliability concerns; or a poor perception
of public transportation. Evidence from similar-size cities across the southeast indicates that providing a
reliable alternative may reveal latent demand for transit in Statesboro. Of all cities that provide fixed or
flex-route bus service, the average per capita annual ridership is more than 10. While factors such as service
levels influence total ridership demand, this figure provides a general indication of typical service
consumption in similar-size communities to Statesboro.
Access to Employment and Activity Centers: Providing access to jobs, education, shopping, and essential
services is a key function of public transportation. Data reported by CRC for FY2016 indicates that only 8%
of its daily passenger trips served in Bulloch County were for employment purposes, or less than four trips
per day. While more than 50% of its daily trips provided were for educational, medical, shopping, or
nutrition purposes, these only account for about 22 trips served per day. Given the population and
employment growth in Statesboro, there is a need to ensure that reliable transportation alternatives are
available to provide all residents the opportunity to access employment, shopping, and medical and social
services. This need was commonly cited by stakeholders and the public alike during the initial phase of
engagement. Moreover, several stakeholders framed the need for improved access to jobs and shopping
opportunities in terms of promoting economic development throughout the community
Inter-Campus and Campus-Community Connectivity: Interviews with stakeholders and findings from
the public survey revealed a need to provide better connectivity between the three college campuses in
Statesboro, as well as between those campuses and retail centers. While EGSC currently provides a shuttle
linking the three campuses and GSU provides circulators on its campus, these services are limited to
students and faculty and do not provide connectivity to the broader community. Given that GSU’s Southern
Express service carries more than 1.5 million passengers per year, this well-established market segment
may be inclined to use an expanded transit service to access off-campus retail and services, especially those
students who may not have access to a vehicle.
Public and Stakeholder Support for Transit: Despite low existing transit ridership outside of GSU’s
campus-oriented service, the public survey indicated significant public support for transit. Approximately
80% of survey respondents indicated that transit is needed in Statesboro. Based on the survey, the public’s
goals for transit are oriented towards promoting equity and serving transportation disadvantaged
populations. This sentiment is consistent with the findings of the market analysis that suggest the market
for transit in Statesboro will largely be driven by the transportation disadvantaged community. Moreover,
previous plans, including the 2009 LRTP and 2014 Comprehensive Plan update, cited public and stakeholder
support for exploring expanded transit options.
May 7, 2019 Page ES-3
Statesboro Transit Feasibility Study
Final Report
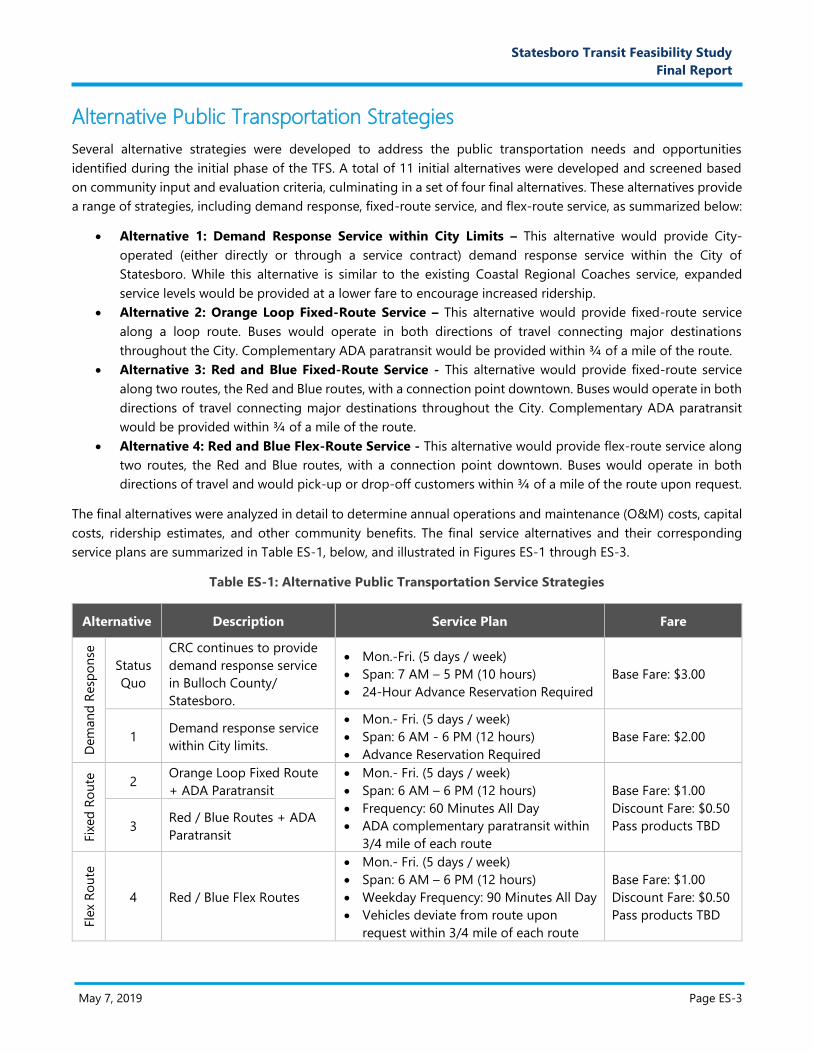
Alternative Public Transportation Strategies
Several alternative strategies were developed to address the public transportation needs and opportunities
identified during the initial phase of the TFS. A total of 11 initial alternatives were developed and screened based
on community input and evaluation criteria, culminating in a set of four final alternatives. These alternatives provide
a range of strategies, including demand response, fixed-route service, and flex-route service, as summarized below:
Alternative 1: Demand Response Service within City Limits – This alternative would provide City-
operated (either directly or through a service contract) demand response service within the City of
Statesboro. While this alternative is similar to the existing Coastal Regional Coaches service, expanded
service levels would be provided at a lower fare to encourage increased ridership.
Alternative 2: Orange Loop Fixed-Route Service – This alternative would provide fixed-route service
along a loop route. Buses would operate in both directions of travel connecting major destinations
throughout the City. Complementary ADA paratransit would be provided within ¾ of a mile of the route.
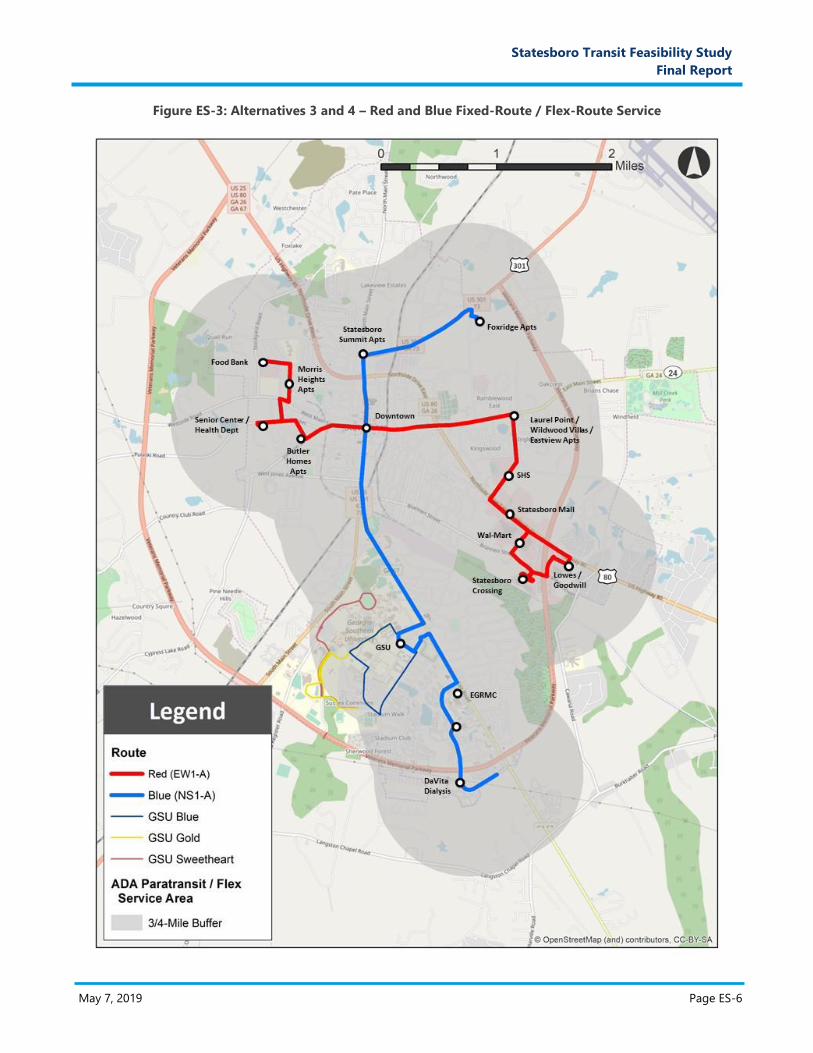
Alternative 3: Red and Blue Fixed-Route Service - This alternative would provide fixed-route service
along two routes, the Red and Blue routes, with a connection point downtown. Buses would operate in both
directions of travel connecting major destinations throughout the City. Complementary ADA paratransit
would be provided within ¾ of a mile of the route.
Alternative 4: Red and Blue Flex-Route Service - This alternative would provide flex-route service along
two routes, the Red and Blue routes, with a connection point downtown. Buses would operate in both
directions of travel and would pick-up or drop-off customers within ¾ of a mile of the route upon request.
The final alternatives were analyzed in detail to determine annual operations and maintenance (O&M) costs, capital
costs, ridership estimates, and other community benefits. The final service alternatives and their corresponding
service plans are summarized in Table ES-1, below, and illustrated in Figures ES-1 through ES-3.
Table ES-1: Alternative Public Transportation Service Strategies
Alternative Description Service Plan Fare
Dem
an
d R
esp
on
se
Status
Quo
CRC continues to provide
demand response service
in Bulloch County/
Statesboro.
Mon.-Fri. (5 days / week)
Span: 7 AM – 5 PM (10 hours)
24-Hour Advance Reservation Required
Base Fare: $3.00
1 Demand response service
within City limits.
Mon.- Fri. (5 days / week)
Span: 6 AM - 6 PM (12 hours)
Advance Reservation Required
Base Fare: $2.00
Fix
ed
Ro
ute
2 Orange Loop Fixed Route
+ ADA Paratransit
Mon.- Fri. (5 days / week)
Span: 6 AM – 6 PM (12 hours)
Frequency: 60 Minutes All Day
ADA complementary paratransit within
3/4 mile of each route
Base Fare: $1.00
Discount Fare: $0.50
Pass products TBD 3 Red / Blue Routes + ADA
Paratransit
Fle
x R
ou
te
4 Red / Blue Flex Routes
Mon.- Fri. (5 days / week)
Span: 6 AM – 6 PM (12 hours)
Weekday Frequency: 90 Minutes All Day
Vehicles deviate from route upon
request within 3/4 mile of each route
Base Fare: $1.00
Discount Fare: $0.50
Pass products TBD

May 7, 2019 Page ES-4
Statesboro Transit Feasibility Study
Final Report
Figure ES-1: Alternative 1 – Demand Response Service within City Limits
May 7, 2019 Page ES-5
Statesboro Transit Feasibility Study
Final Report
Figure ES-2: Alternative 2 – Orange Fixed-Route Service
May 7, 2019 Page ES-6
Statesboro Transit Feasibility Study
Final Report
Figure ES-3: Alternatives 3 and 4 – Red and Blue Fixed-Route / Flex-Route Service
May 7, 2019 Page ES-7
Statesboro Transit Feasibility Study
Final Report
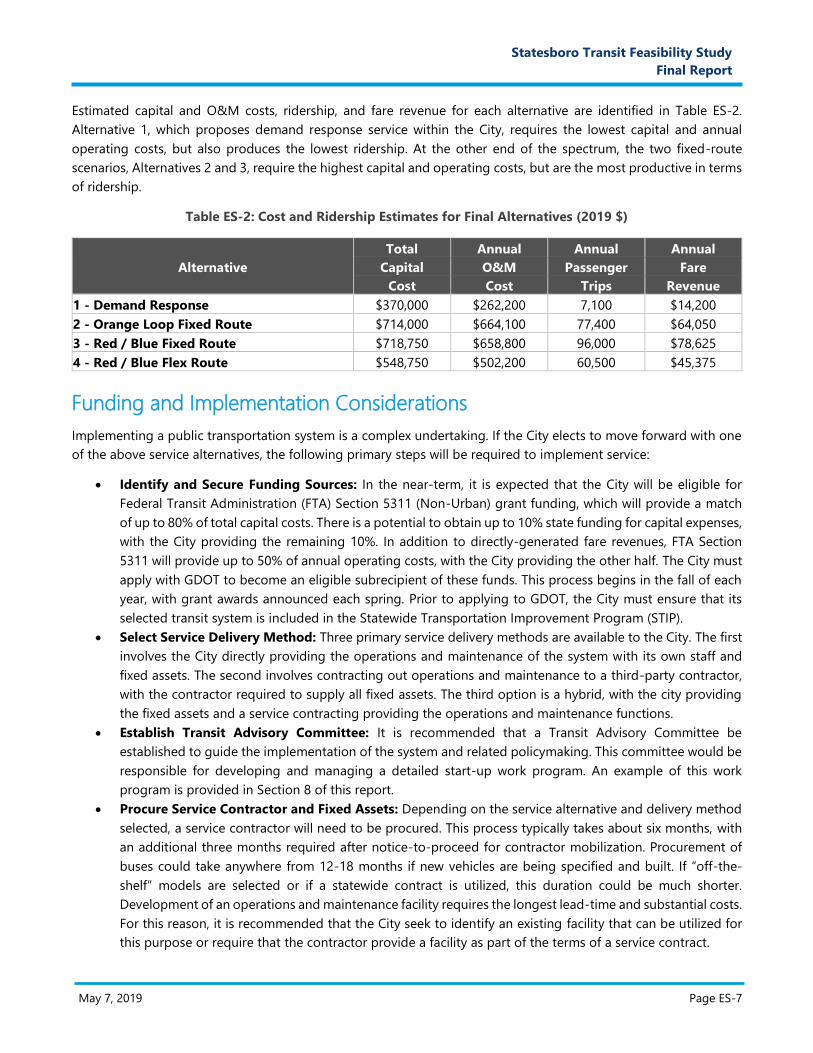
Estimated capital and O&M costs, ridership, and fare revenue for each alternative are identified in Table ES-2.
Alternative 1, which proposes demand response service within the City, requires the lowest capital and annual
operating costs, but also produces the lowest ridership. At the other end of the spectrum, the two fixed-route
scenarios, Alternatives 2 and 3, require the highest capital and operating costs, but are the most productive in terms
of ridership.
Table ES-2: Cost and Ridership Estimates for Final Alternatives (2019 $)
Alternative
Total Annual Annual Annual
Capital O&M Passenger Fare
Cost Cost Trips Revenue
1 - Demand Response $370,000 $262,200 7,100 $14,200
2 - Orange Loop Fixed Route $714,000 $664,100 77,400 $64,050
3 - Red / Blue Fixed Route $718,750 $658,800 96,000 $78,625
4 - Red / Blue Flex Route $548,750 $502,200 60,500 $45,375
Funding and Implementation Considerations
Implementing a public transportation system is a complex undertaking. If the City elects to move forward with one
of the above service alternatives, the following primary steps will be required to implement service:
Identify and Secure Funding Sources: In the near-term, it is expected that the City will be eligible for
Federal Transit Administration (FTA) Section 5311 (Non-Urban) grant funding, which will provide a match
of up to 80% of total capital costs. There is a potential to obtain up to 10% state funding for capital expenses,
with the City providing the remaining 10%. In addition to directly-generated fare revenues, FTA Section
5311 will provide up to 50% of annual operating costs, with the City providing the other half. The City must
apply with GDOT to become an eligible subrecipient of these funds. This process begins in the fall of each
year, with grant awards announced each spring. Prior to applying to GDOT, the City must ensure that its
selected transit system is included in the Statewide Transportation Improvement Program (STIP).
Select Service Delivery Method: Three primary service delivery methods are available to the City. The first
involves the City directly providing the operations and maintenance of the system with its own staff and
fixed assets. The second involves contracting out operations and maintenance to a third-party contractor,
with the contractor required to supply all fixed assets. The third option is a hybrid, with the city providing
the fixed assets and a service contracting providing the operations and maintenance functions.
Establish Transit Advisory Committee: It is recommended that a Transit Advisory Committee be
established to guide the implementation of the system and related policymaking. This committee would be
responsible for developing and managing a detailed start-up work program. An example of this work
program is provided in Section 8 of this report.
Procure Service Contractor and Fixed Assets: Depending on the service alternative and delivery method
selected, a service contractor will need to be procured. This process typically takes about six months, with
an additional three months required after notice-to-proceed for contractor mobilization. Procurement of
buses could take anywhere from 12-18 months if new vehicles are being specified and built. If “off-the-
shelf” models are selected or if a statewide contract is utilized, this duration could be much shorter.
Development of an operations and maintenance facility requires the longest lead-time and substantial costs.
For this reason, it is recommended that the City seek to identify an existing facility that can be utilized for
this purpose or require that the contractor provide a facility as part of the terms of a service contract.
May 7, 2019 Page 1
Statesboro Transit Feasibility Study
Final Report
1. Introduction Bulloch County and Statesboro have experienced substantial growth in recent years. With this growth comes an
increased demand for mobility within the community, especially for segments of the population that lack
transportation options due to financial or physical limitations. Recognizing this potential need and building on a
successful Bulloch County TSPLOST referendum in April 2018 that set aside funding for transit, the City of Statesboro
initiated a Transit Feasibility Study (TFS) to determine the viability of a new public transportation system.
The purpose of the TFS is to evaluate public transportation needs based on market data and input from the
community, develop and evaluate alternatives, and identify potential funding sources and implementation
strategies. The City hired a consultant team led by Connetics Transportation Group (CTG), a public transit planning
consulting firm based in Atlanta, Georgia, to conduct the study in coordination with the City and stakeholder
representatives throughout the community.
The study was delivered in three phases. The first phase involved a public transit needs assessment that considered
the demand for transit in Statesboro relative to existing public and private services. The second phase encompassed
the development and evaluation of potential service alternatives to address the identified needs. In the third and
final phase, an implementation and funding plan was prepared to serve as a roadmap for future system
development. A robust stakeholder and public engagement program guided each phase of the study.
This final report documents the technical analyses and findings of the TFS. The report is organized into seven
subsequent sections, as outlined below.
Section 2: Existing Conditions Assessment provides an overview of the existing conditions within
Statesboro and Bulloch County that influence the demand for transit. This section also documents the public
and private transportation options that currently exist.
Section 3: Peer Analysis provides a summary of three comparable peer cities that operate various forms
of public transportation.
Section 4: Summary of Public Engagement Activities describes the stakeholder and community
involvement activities that occurred throughout the study.
Section 5: Purpose and Needs Assessment, Goals, and Objectives describes the purpose of the project
and transportation needs that were revealed through the market analysis and public engagement process.
This section also establishes the guiding principles, goals, objectives, and evaluation metrics for the study
alternatives based on identified needs.
Section 6: Definition and Evaluation of Initial Transit Service Alternatives documents the development,
evaluation, and screening of the initial service alternatives and selection of final service alternatives for
further evaluation.
Section 7: Final Service Alternatives provides a detailed assessment of the costs and benefits of the final
service alternatives. Future service improvements are also identified.
Section 8: Implementation Plan provides an overview of the potential funding opportunities for public
transit, defines the various management models available to the City, and describes the implementation
tasks required to launch a new transit system.
May 7, 2019 Page 2
Statesboro Transit Feasibility Study
Final Report
2. Existing Conditions Assessment This section provides an assessment of the existing market and transportation conditions in Statesboro that
influence the demand for public transit. A market analysis is provided summarizing the demographic and
socioeconomic conditions of the Statesboro community followed by an overview of the existing public and private
transportation alternatives that are currently available.
2.1. Transit Market Analysis
To understand the need and feasibility of public transportation services in Statesboro and surrounding areas of
Bulloch County, a transit market analysis was prepared to evaluate the community characteristics and travel patterns
that influence the potential demand for transit service. The following sections provide an overview of the
components of transit demand, an analysis of the observed population and employment characteristics in the study
area, and key travel patterns.
2.1.1. Estimating the Demand for Transit
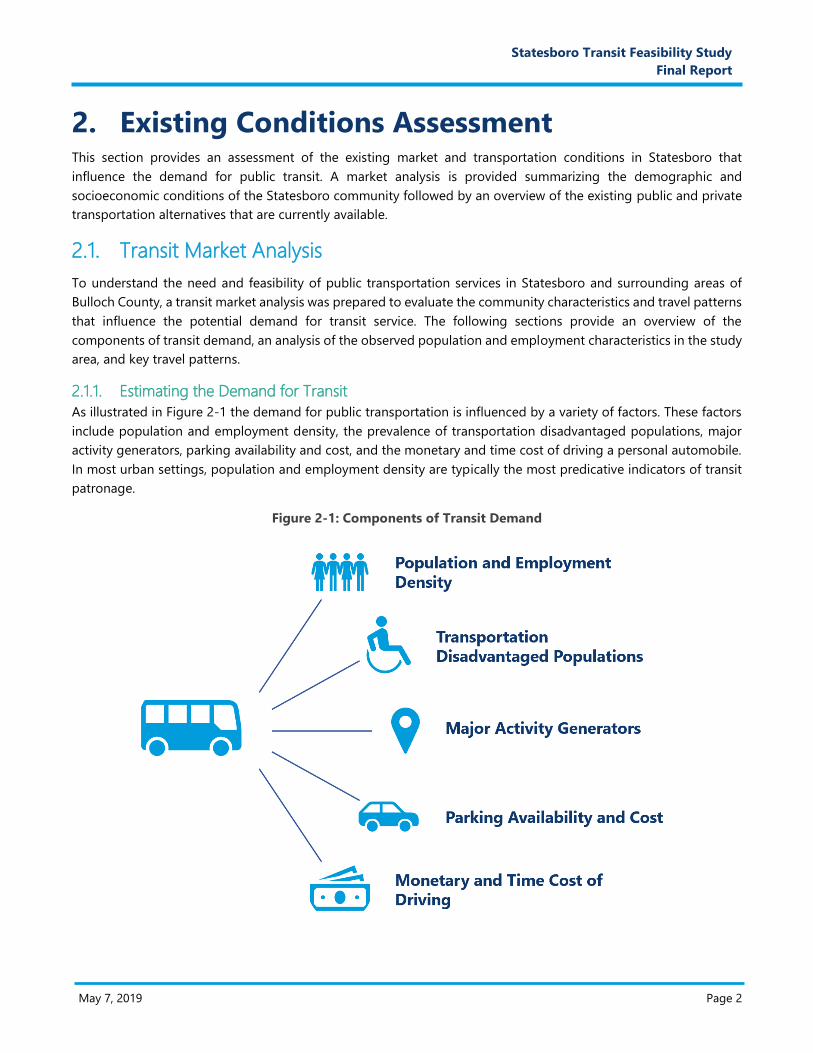
As illustrated in Figure 2-1 the demand for public transportation is influenced by a variety of factors. These factors
include population and employment density, the prevalence of transportation disadvantaged populations, major
activity generators, parking availability and cost, and the monetary and time cost of driving a personal automobile.
In most urban settings, population and employment density are typically the most predicative indicators of transit
patronage.
Figure 2-1: Components of Transit Demand
May 7, 2019 Page 3
Statesboro Transit Feasibility Study
Final Report
In addition to population and employment, other factors help distinguish transit markets in a community. Transit
markets are commonly grouped into two categories:
Discretionary riders are those who have adequate financial and physical means to operate a private
automobile but choose to ride transit as a personal choice or out of convenience. Discretionary riders are
more commonplace in high-density metropolitan areas, where factors such parking availability and the cost
of driving due to long commutes or traffic congestion increase the advantage of riding transit versus driving.
Transit dependent riders are those who utilize transit services due to lack of financial resources or physical
ability to own or operate a personal automobile. Compared to discretionary riders, transit dependent riders
tend to use transit for a larger variety of trip purposes beyond work commuting, including shopping,
medical appointments, and social activities.
In smaller urban settings like Statesboro, the demand for transit is largely driven by transit dependent riders,
although major activity and employment centers can significantly influence demand in specific locations. Other
factors that would otherwise attract choice riders, such as parking availability and the cost of driving, are less
common in Statesboro. A notable exception, however, is Georgia Southern University (GSU), where limited parking
availability and the pedestrian-oriented environment creates a strong market for transit in and around campus.
May 7, 2019 Page 4
Statesboro Transit Feasibility Study
Final Report
2.1.2. Population and Employment
As noted above, population and employment are key determinants of transit demand. The following sections
describe population and employment characteristics and trends in Statesboro and Bulloch County.
Population Characteristics
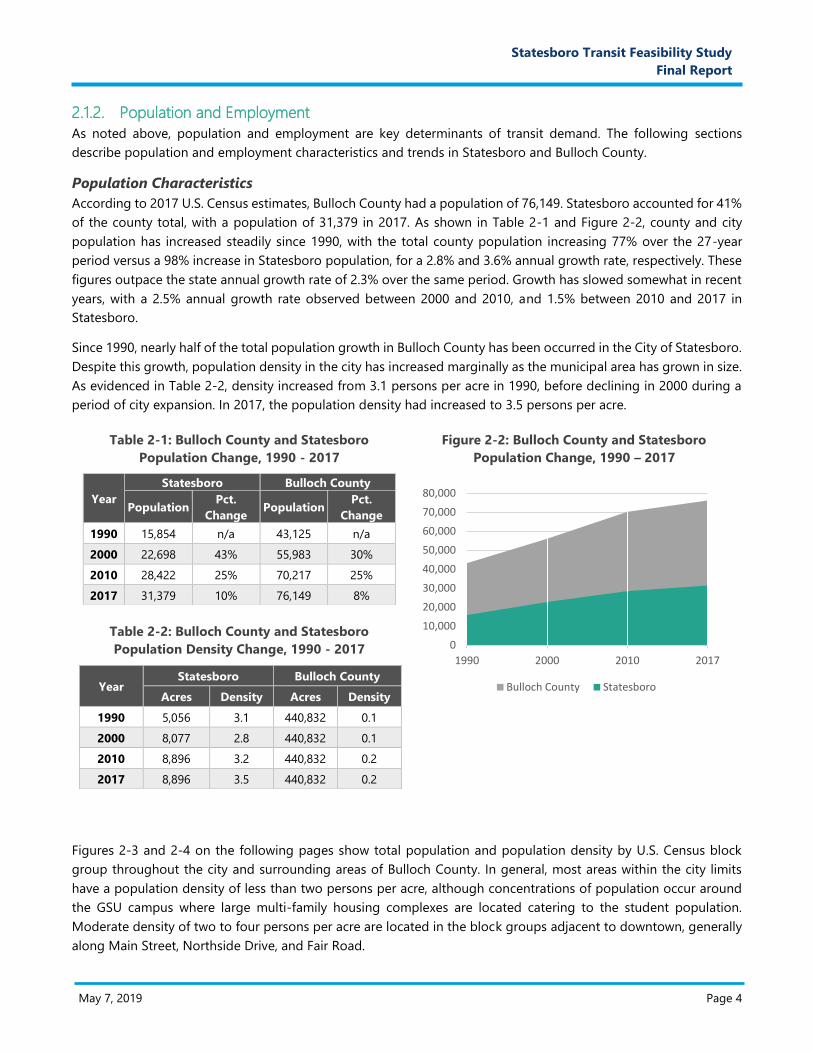
According to 2017 U.S. Census estimates, Bulloch County had a population of 76,149. Statesboro accounted for 41%
of the county total, with a population of 31,379 in 2017. As shown in Table 2-1 and Figure 2-2, county and city
population has increased steadily since 1990, with the total county population increasing 77% over the 27-year
period versus a 98% increase in Statesboro population, for a 2.8% and 3.6% annual growth rate, respectively. These
figures outpace the state annual growth rate of 2.3% over the same period. Growth has slowed somewhat in recent
years, with a 2.5% annual growth rate observed between 2000 and 2010, and 1.5% between 2010 and 2017 in
Statesboro.
Since 1990, nearly half of the total population growth in Bulloch County has been occurred in the City of Statesboro.
Despite this growth, population density in the city has increased marginally as the municipal area has grown in size.
As evidenced in Table 2-2, density increased from 3.1 persons per acre in 1990, before declining in 2000 during a
period of city expansion. In 2017, the population density had increased to 3.5 persons per acre.
Table 2-1: Bulloch County and Statesboro
Population Change, 1990 - 2017
Year
Statesboro Bulloch County
Population Pct.
Change Population
Pct.
Change
1990 15,854 n/a 43,125 n/a
2000 22,698 43% 55,983 30%
2010 28,422 25% 70,217 25%
2017 31,379 10% 76,149 8%
Figure 2-2: Bulloch County and Statesboro
Population Change, 1990 – 2017
Table 2-2: Bulloch County and Statesboro
Population Density Change, 1990 - 2017
Year Statesboro Bulloch County
Acres Density Acres Density
1990 5,056 3.1 440,832 0.1
2000 8,077 2.8 440,832 0.1
2010 8,896 3.2 440,832 0.2
2017 8,896 3.5 440,832 0.2
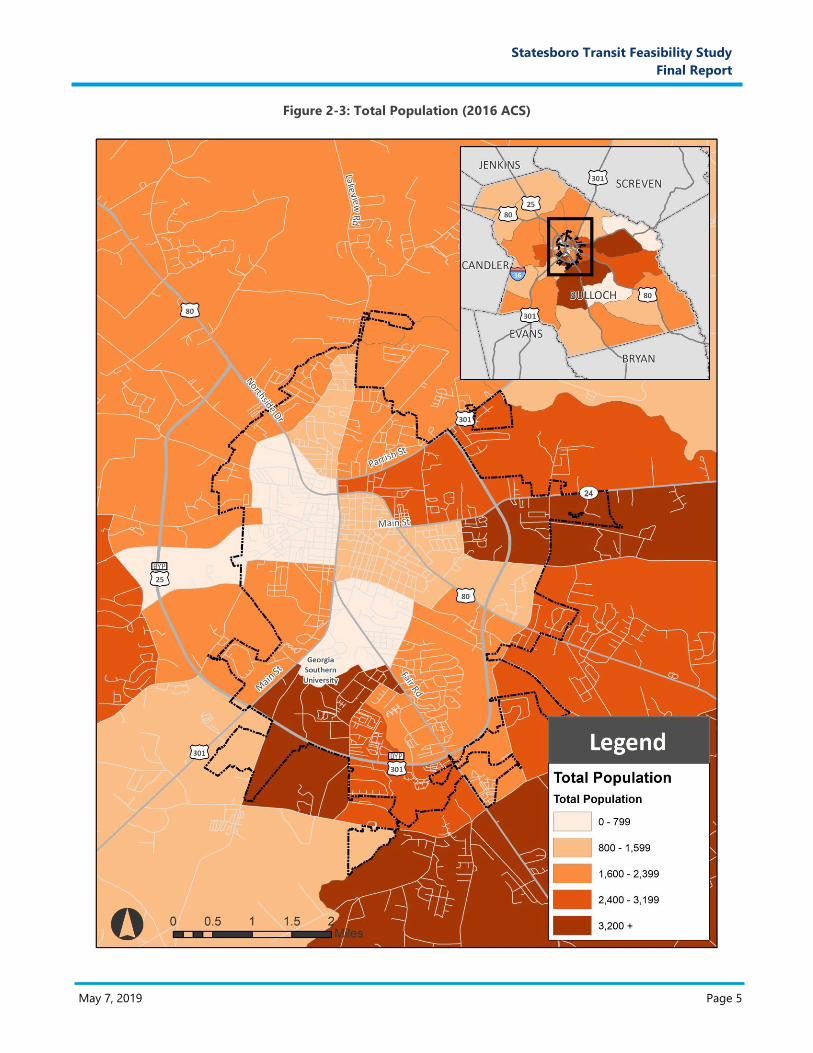
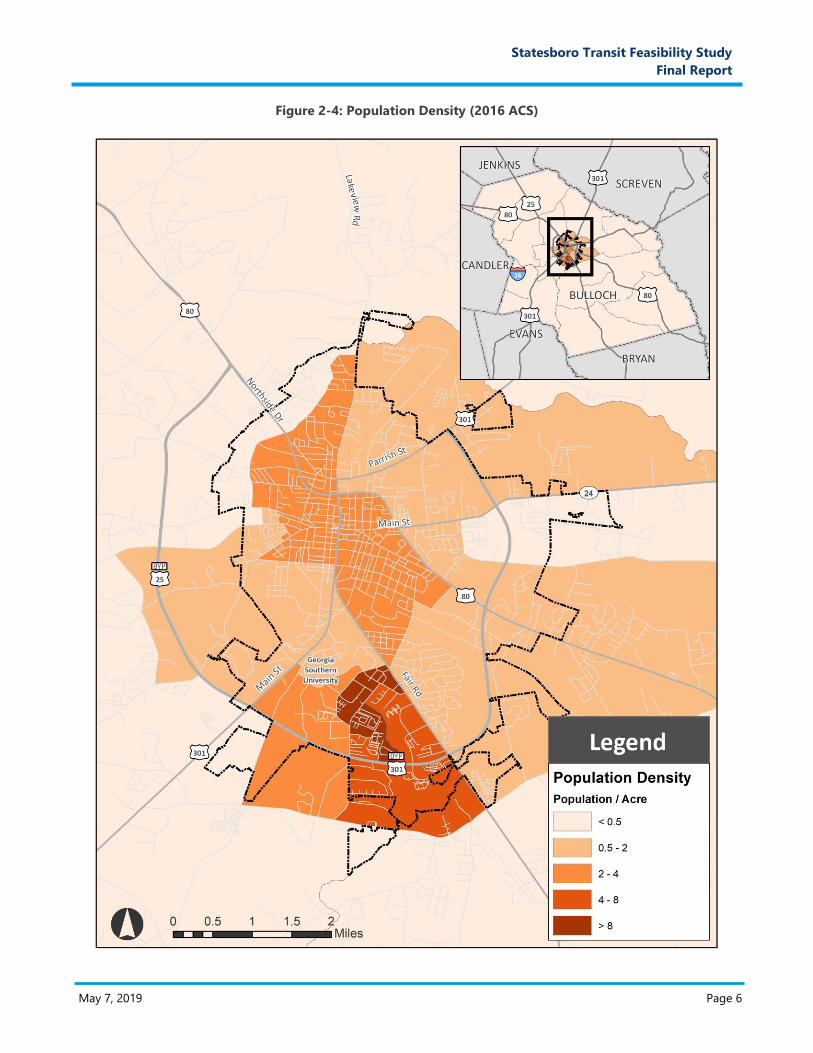
Figures 2-3 and 2-4 on the following pages show total population and population density by U.S. Census block
group throughout the city and surrounding areas of Bulloch County. In general, most areas within the city limits
have a population density of less than two persons per acre, although concentrations of population occur around
the GSU campus where large multi-family housing complexes are located catering to the student population.
Moderate density of two to four persons per acre are located in the block groups adjacent to downtown, generally
along Main Street, Northside Drive, and Fair Road.
0
10,000
20,000
30,000
40,000
50,000
60,000
70,000
80,000
1990 2000 2010 2017
Bulloch County Statesboro
May 7, 2019 Page 5
Statesboro Transit Feasibility Study
Final Report
Figure 2-3: Total Population (2016 ACS)
May 7, 2019 Page 6
Statesboro Transit Feasibility Study
Final Report
Figure 2-4: Population Density (2016 ACS)
May 7, 2019 Page 7
Statesboro Transit Feasibility Study
Final Report
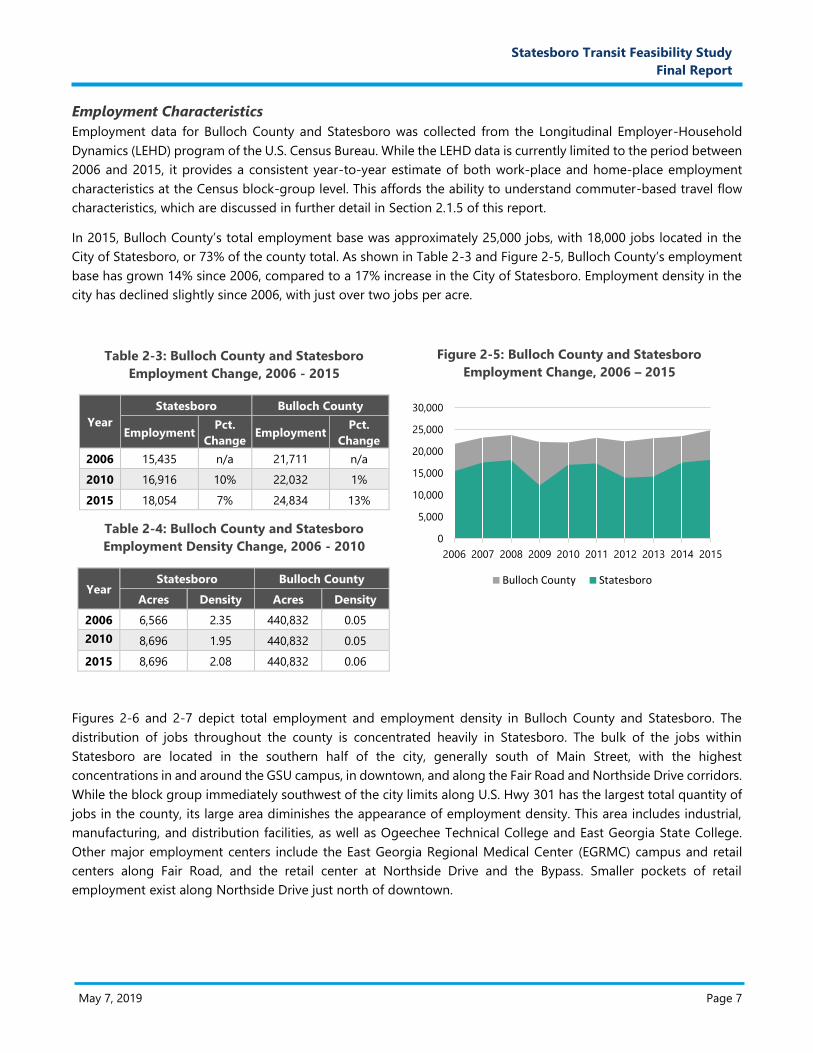
Employment Characteristics
Employment data for Bulloch County and Statesboro was collected from the Longitudinal Employer-Household
Dynamics (LEHD) program of the U.S. Census Bureau. While the LEHD data is currently limited to the period between
2006 and 2015, it provides a consistent year-to-year estimate of both work-place and home-place employment
characteristics at the Census block-group level. This affords the ability to understand commuter-based travel flow
characteristics, which are discussed in further detail in Section 2.1.5 of this report.
In 2015, Bulloch County’s total employment base was approximately 25,000 jobs, with 18,000 jobs located in the
City of Statesboro, or 73% of the county total. As shown in Table 2-3 and Figure 2-5, Bulloch County’s employment
base has grown 14% since 2006, compared to a 17% increase in the City of Statesboro. Employment density in the
city has declined slightly since 2006, with just over two jobs per acre.
Table 2-3: Bulloch County and Statesboro
Employment Change, 2006 - 2015
Year
Statesboro Bulloch County
Employment Pct.
Change Employment
Pct.
Change
2006 15,435 n/a 21,711 n/a
2010 16,916 10% 22,032 1%
2015 18,054 7% 24,834 13%
Figure 2-5: Bulloch County and Statesboro
Employment Change, 2006 – 2015
Table 2-4: Bulloch County and Statesboro
Employment Density Change, 2006 - 2010
Year Statesboro Bulloch County
Acres Density Acres Density
2006 6,566 2.35 440,832 0.05
2010 8,696 1.95 440,832 0.05
2015 8,696 2.08 440,832 0.06
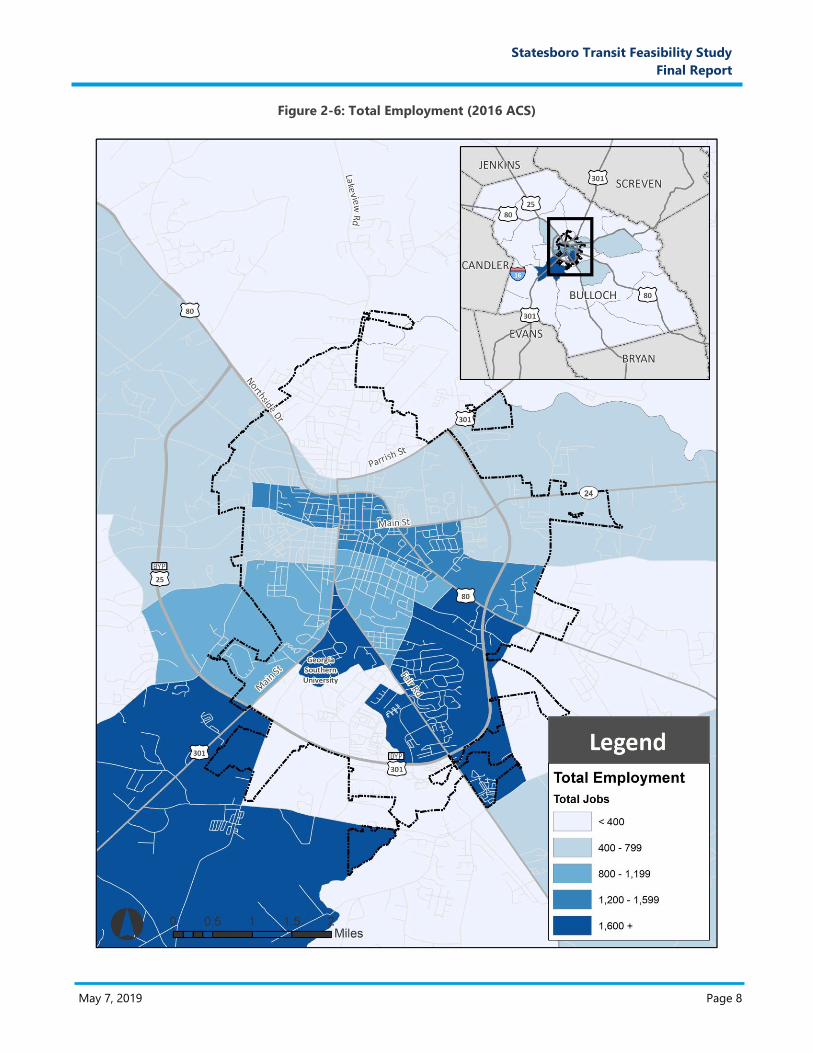
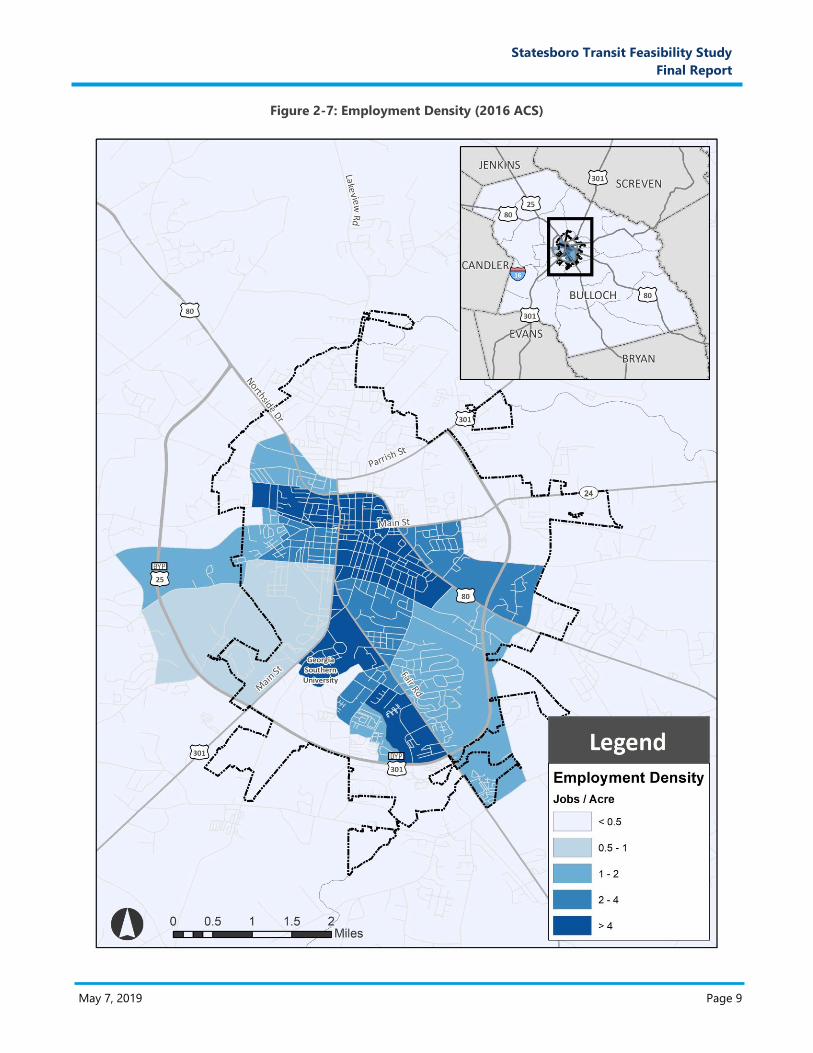
Figures 2-6 and 2-7 depict total employment and employment density in Bulloch County and Statesboro. The
distribution of jobs throughout the county is concentrated heavily in Statesboro. The bulk of the jobs within
Statesboro are located in the southern half of the city, generally south of Main Street, with the highest
concentrations in and around the GSU campus, in downtown, and along the Fair Road and Northside Drive corridors.
While the block group immediately southwest of the city limits along U.S. Hwy 301 has the largest total quantity of
jobs in the county, its large area diminishes the appearance of employment density. This area includes industrial,
manufacturing, and distribution facilities, as well as Ogeechee Technical College and East Georgia State College.
Other major employment centers include the East Georgia Regional Medical Center (EGRMC) campus and retail
centers along Fair Road, and the retail center at Northside Drive and the Bypass. Smaller pockets of retail
employment exist along Northside Drive just north of downtown.
0
5,000
10,000
15,000
20,000
25,000
30,000
2006 2007 2008 2009 2010 2011 2012 2013 2014 2015
Bulloch County Statesboro
May 7, 2019 Page 8
Statesboro Transit Feasibility Study
Final Report
Figure 2-6: Total Employment (2016 ACS)
May 7, 2019 Page 9
Statesboro Transit Feasibility Study
Final Report
Figure 2-7: Employment Density (2016 ACS)
May 7, 2019 Page 10
Statesboro Transit Feasibility Study
Final Report
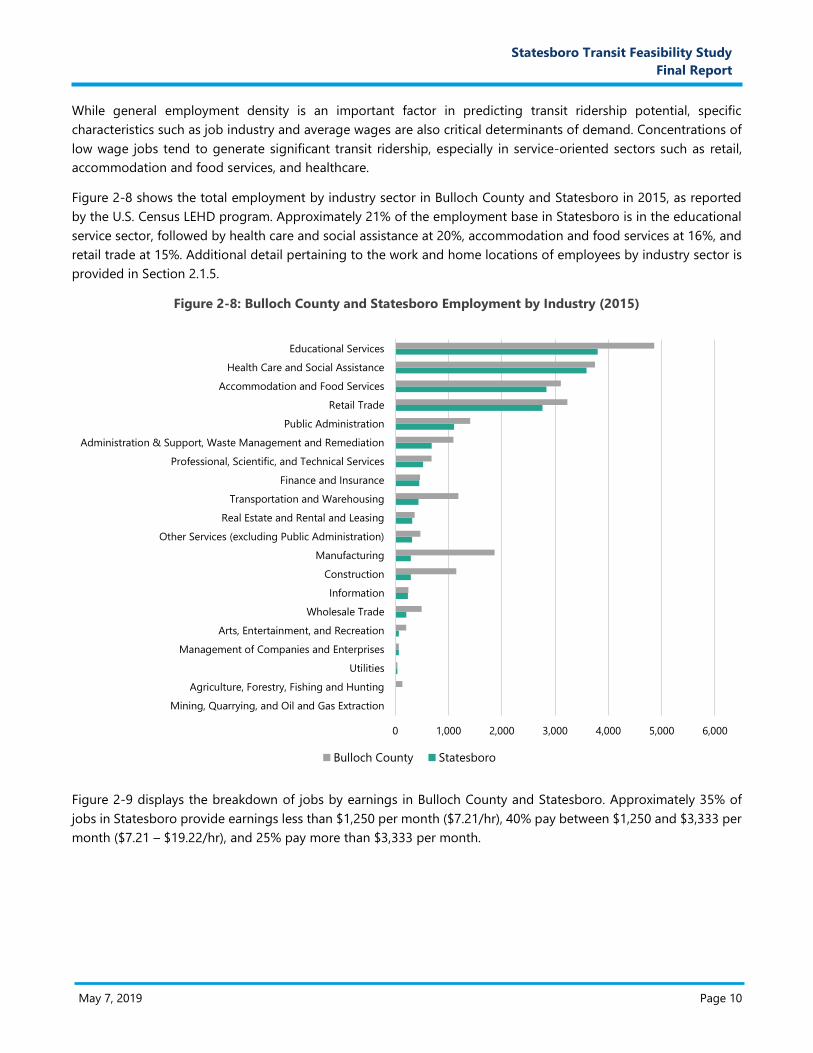
While general employment density is an important factor in predicting transit ridership potential, specific
characteristics such as job industry and average wages are also critical determinants of demand. Concentrations of
low wage jobs tend to generate significant transit ridership, especially in service-oriented sectors such as retail,
accommodation and food services, and healthcare.
Figure 2-8 shows the total employment by industry sector in Bulloch County and Statesboro in 2015, as reported
by the U.S. Census LEHD program. Approximately 21% of the employment base in Statesboro is in the educational
service sector, followed by health care and social assistance at 20%, accommodation and food services at 16%, and
retail trade at 15%. Additional detail pertaining to the work and home locations of employees by industry sector is
provided in Section 2.1.5.
Figure 2-8: Bulloch County and Statesboro Employment by Industry (2015)
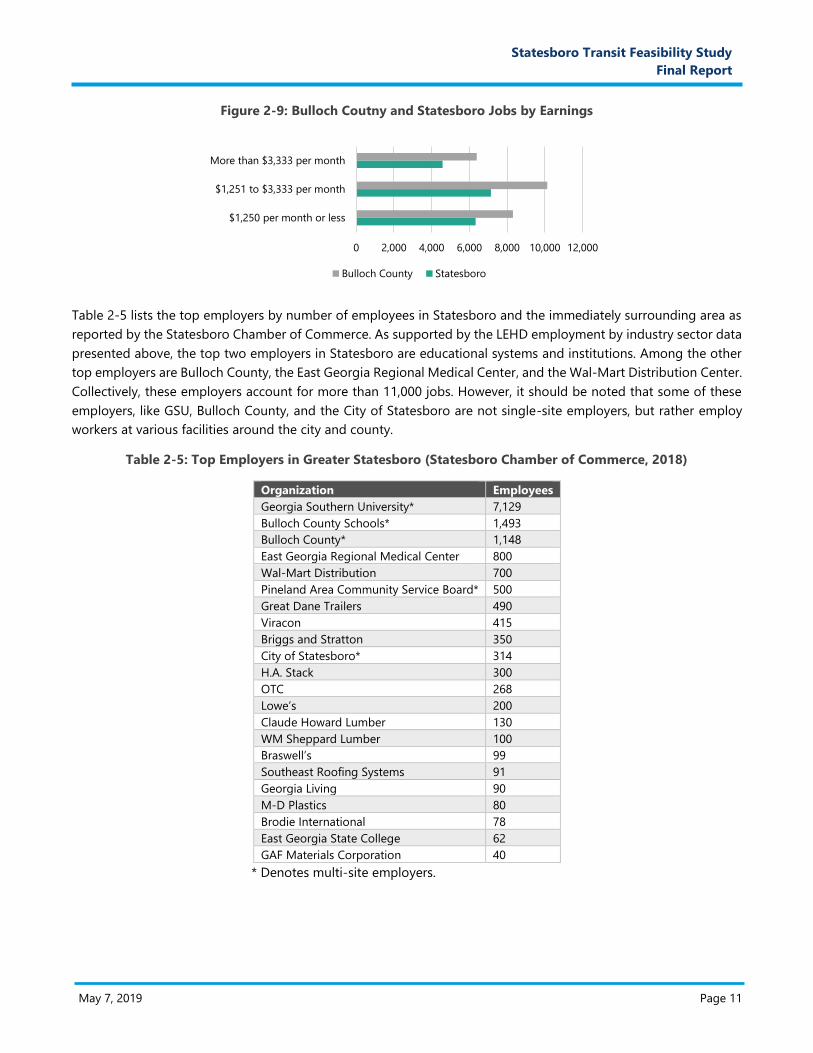
Figure 2-9 displays the breakdown of jobs by earnings in Bulloch County and Statesboro. Approximately 35% of
jobs in Statesboro provide earnings less than $1,250 per month ($7.21/hr), 40% pay between $1,250 and $3,333 per
month ($7.21 – $19.22/hr), and 25% pay more than $3,333 per month.
0 1,000 2,000 3,000 4,000 5,000 6,000
Mining, Quarrying, and Oil and Gas Extraction
Agriculture, Forestry, Fishing and Hunting
Utilities
Management of Companies and Enterprises
Arts, Entertainment, and Recreation
Wholesale Trade
Information
Construction
Manufacturing
Other Services (excluding Public Administration)
Real Estate and Rental and Leasing
Transportation and Warehousing
Finance and Insurance
Professional, Scientific, and Technical Services
Administration & Support, Waste Management and Remediation
Public Administration
Retail Trade
Accommodation and Food Services
Health Care and Social Assistance
Educational Services
Bulloch County Statesboro
May 7, 2019 Page 11
Statesboro Transit Feasibility Study
Final Report
Figure 2-9: Bulloch Coutny and Statesboro Jobs by Earnings
Table 2-5 lists the top employers by number of employees in Statesboro and the immediately surrounding area as
reported by the Statesboro Chamber of Commerce. As supported by the LEHD employment by industry sector data
presented above, the top two employers in Statesboro are educational systems and institutions. Among the other
top employers are Bulloch County, the East Georgia Regional Medical Center, and the Wal-Mart Distribution Center.
Collectively, these employers account for more than 11,000 jobs. However, it should be noted that some of these
employers, like GSU, Bulloch County, and the City of Statesboro are not single-site employers, but rather employ
workers at various facilities around the city and county.
Table 2-5: Top Employers in Greater Statesboro (Statesboro Chamber of Commerce, 2018)
Organization Employees
Georgia Southern University* 7,129
Bulloch County Schools* 1,493
Bulloch County* 1,148
East Georgia Regional Medical Center 800
Wal-Mart Distribution 700
Pineland Area Community Service Board* 500
Great Dane Trailers 490
Viracon 415
Briggs and Stratton 350
City of Statesboro* 314
H.A. Stack 300
OTC 268
Lowe’s 200
Claude Howard Lumber 130
WM Sheppard Lumber 100
Braswell’s 99
Southeast Roofing Systems 91
Georgia Living 90
M-D Plastics 80
Brodie International 78
East Georgia State College 62
GAF Materials Corporation 40
* Denotes multi-site employers.
0 2,000 4,000 6,000 8,000 10,000 12,000
$1,250 per month or less
$1,251 to $3,333 per month
More than $3,333 per month
Bulloch County Statesboro
May 7, 2019 Page 12
Statesboro Transit Feasibility Study
Final Report
Density Threshold Analysis
Development patterns and density are a primary driver of transit demand. Most riders walk to access transit;
therefore, the typical market capture area of a local bus route is generally limited to approximately ¼ to ½ mile. As
a result, population and employment densities along a route determine how many people will be able to access
transit and ultimately influence the level of service that can be efficiently supported in a given area. Areas with
higher densities support greater frequencies of service, while lower density areas are typically better suited to lower-
frequency fixed-route service or alternative modes such as flexible routes or on-demand service.
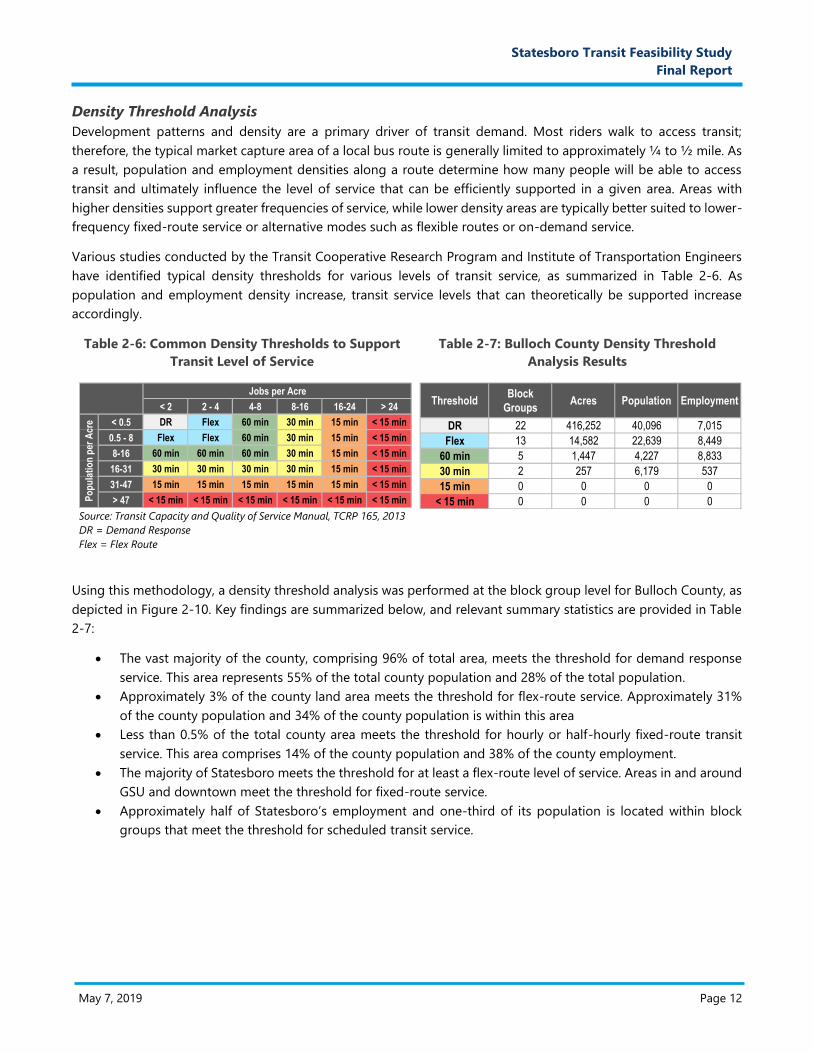
Various studies conducted by the Transit Cooperative Research Program and Institute of Transportation Engineers
have identified typical density thresholds for various levels of transit service, as summarized in Table 2-6. As
population and employment density increase, transit service levels that can theoretically be supported increase
accordingly.
Table 2-6: Common Density Thresholds to Support
Transit Level of Service
Source: Transit Capacity and Quality of Service Manual, TCRP 165, 2013
DR = Demand Response
Flex = Flex Route
Table 2-7: Bulloch County Density Threshold
Analysis Results
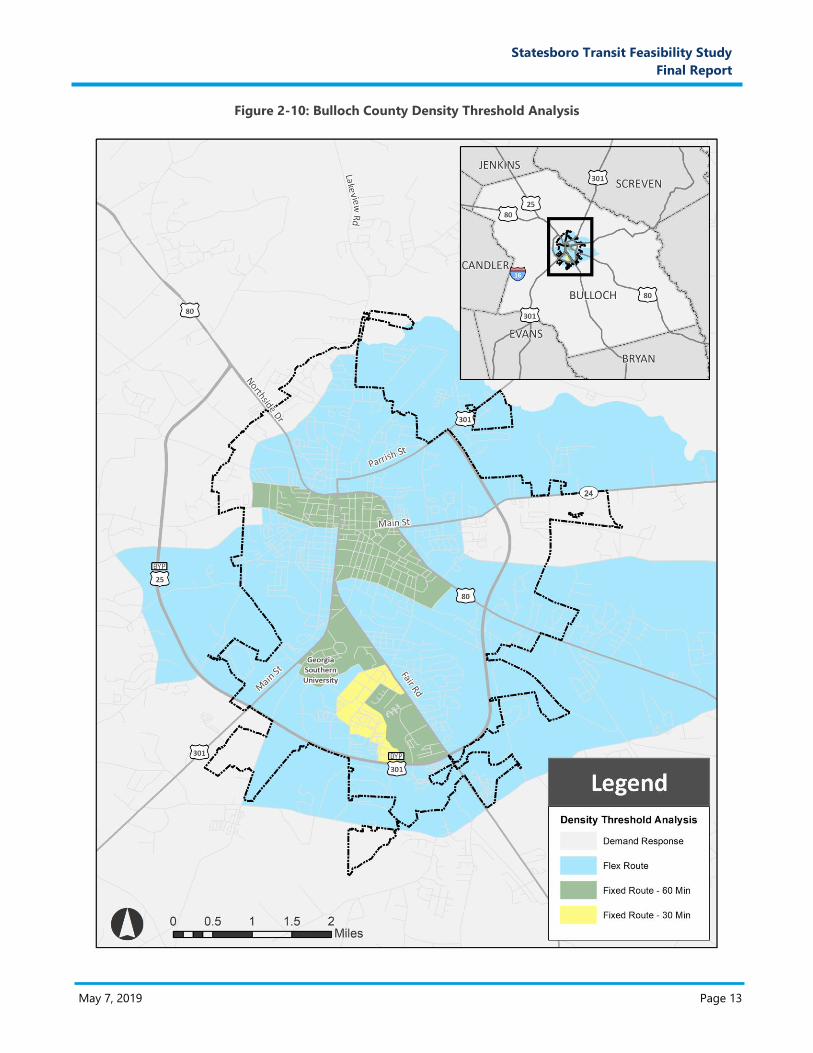
Using this methodology, a density threshold analysis was performed at the block group level for Bulloch County, as
depicted in Figure 2-10. Key findings are summarized below, and relevant summary statistics are provided in Table
2-7:
The vast majority of the county, comprising 96% of total area, meets the threshold for demand response
service. This area represents 55% of the total county population and 28% of the total population.
Approximately 3% of the county land area meets the threshold for flex-route service. Approximately 31%
of the county population and 34% of the county population is within this area
Less than 0.5% of the total county area meets the threshold for hourly or half-hourly fixed-route transit
service. This area comprises 14% of the county population and 38% of the county employment.
The majority of Statesboro meets the threshold for at least a flex-route level of service. Areas in and around
GSU and downtown meet the threshold for fixed-route service.
Approximately half of Statesboro’s employment and one-third of its population is located within block
groups that meet the threshold for scheduled transit service.
< 2 2 - 4 4-8 8-16 16-24 > 24
< 0.5 DR Flex 60 min 30 min 15 min < 15 min
0.5 - 8 Flex Flex 60 min 30 min 15 min < 15 min
8-16 60 min 60 min 60 min 30 min 15 min < 15 min
16-31 30 min 30 min 30 min 30 min 15 min < 15 min
31-47 15 min 15 min 15 min 15 min 15 min < 15 min
> 47 < 15 min < 15 min < 15 min < 15 min < 15 min < 15 minPo
pu
lati
on
per
Acr
e
Jobs per AcreThreshold
Block
GroupsAcres Population Employment
DR 22 416,252 40,096 7,015
Flex 13 14,582 22,639 8,449
60 min 5 1,447 4,227 8,833
30 min 2 257 6,179 537
15 min 0 0 0 0
< 15 min 0 0 0 0
May 7, 2019 Page 13
Statesboro Transit Feasibility Study
Final Report
Figure 2-10: Bulloch County Density Threshold Analysis
May 7, 2019 Page 14
Statesboro Transit Feasibility Study
Final Report
2.1.3. Transit Propensity
Aside from concentration of population and employment, socioeconomic characteristics such as household income,
access to automobiles, age, and physical disabilities are typically significant determinants of home-based demand
for public transportation. Evidence from comparable communities to Statesboro indicate that these traditionally
transportation-disadvantaged populations, especially low-income households and those without access to
automobiles, have the highest rates of transit patronage. The development of a Transit Propensity Index (TPI)
provides a dataset that synthesizes these variables to help inform service development decision-making.
Transit Propensity Index Methodology
The TPI estimates areas with the highest likelihood of generating transit ridership based on socioeconomic
indicators that are typically strongly correlated with demand for service. The TPI was developed at the census block
group level using 2011-2016 American Community Survey (ACS) data. The study area defined for this analysis
encompasses the entirety of Bulloch County.
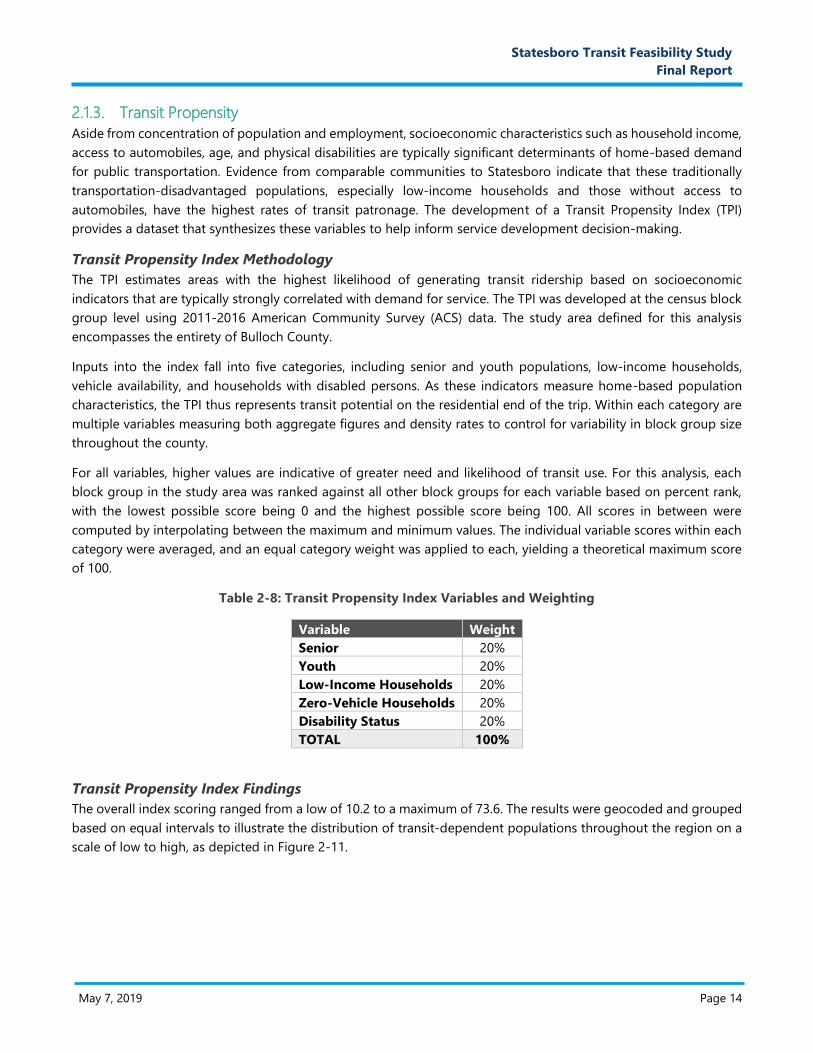
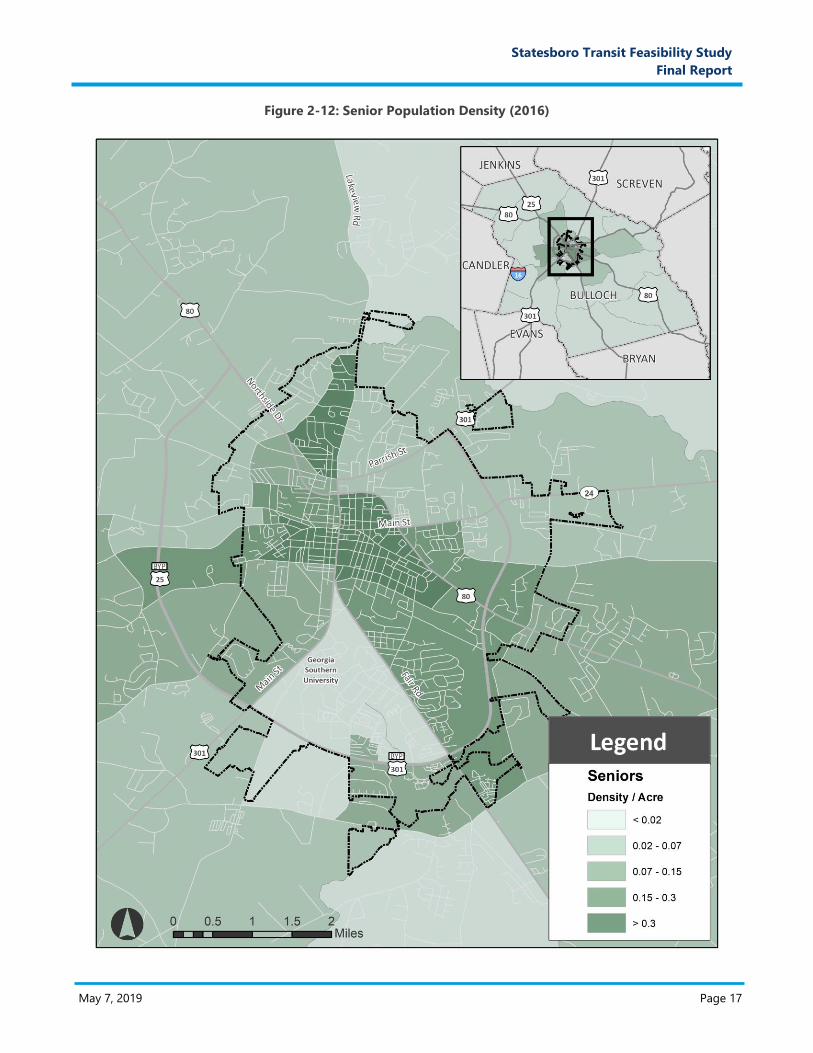
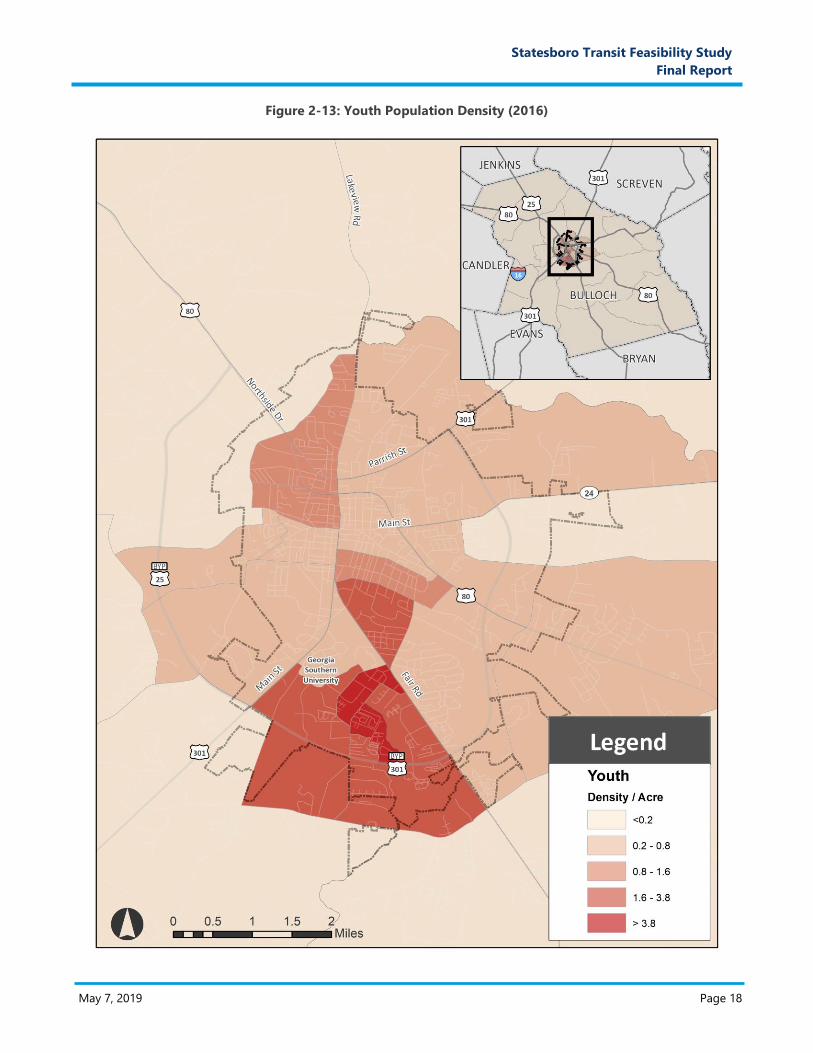
Inputs into the index fall into five categories, including senior and youth populations, low-income households,
vehicle availability, and households with disabled persons. As these indicators measure home-based population
characteristics, the TPI thus represents transit potential on the residential end of the trip. Within each category are
multiple variables measuring both aggregate figures and density rates to control for variability in block group size
throughout the county.
For all variables, higher values are indicative of greater need and likelihood of transit use. For this analysis, each
block group in the study area was ranked against all other block groups for each variable based on percent rank,
with the lowest possible score being 0 and the highest possible score being 100. All scores in between were
computed by interpolating between the maximum and minimum values. The individual variable scores within each
category were averaged, and an equal category weight was applied to each, yielding a theoretical maximum score
of 100.
Table 2-8: Transit Propensity Index Variables and Weighting
Variable Weight
Senior 20%
Youth 20%
Low-Income Households 20%
Zero-Vehicle Households 20%
Disability Status 20%
TOTAL 100%
Transit Propensity Index Findings
The overall index scoring ranged from a low of 10.2 to a maximum of 73.6. The results were geocoded and grouped
based on equal intervals to illustrate the distribution of transit-dependent populations throughout the region on a
scale of low to high, as depicted in Figure 2-11.
May 7, 2019 Page 15
Statesboro Transit Feasibility Study
Final Report
Figure 2-11: Transit Propensity Index for Bulloch County
May 7, 2019 Page 16
Statesboro Transit Feasibility Study
Final Report
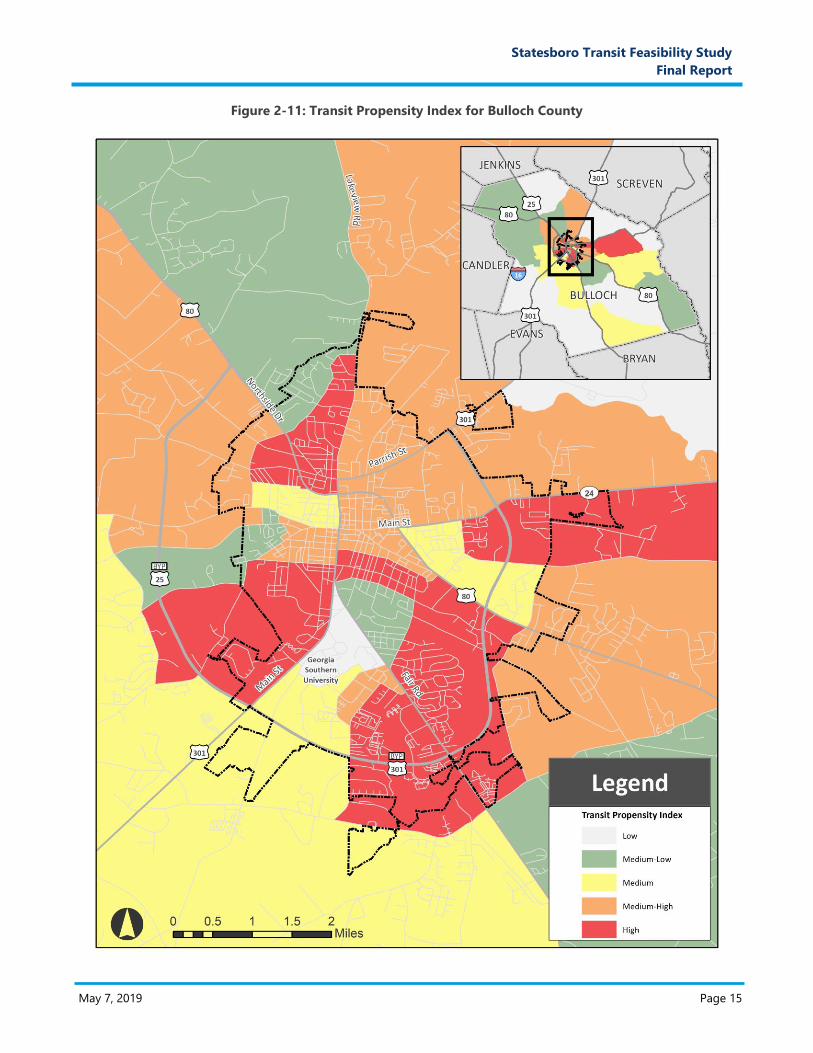
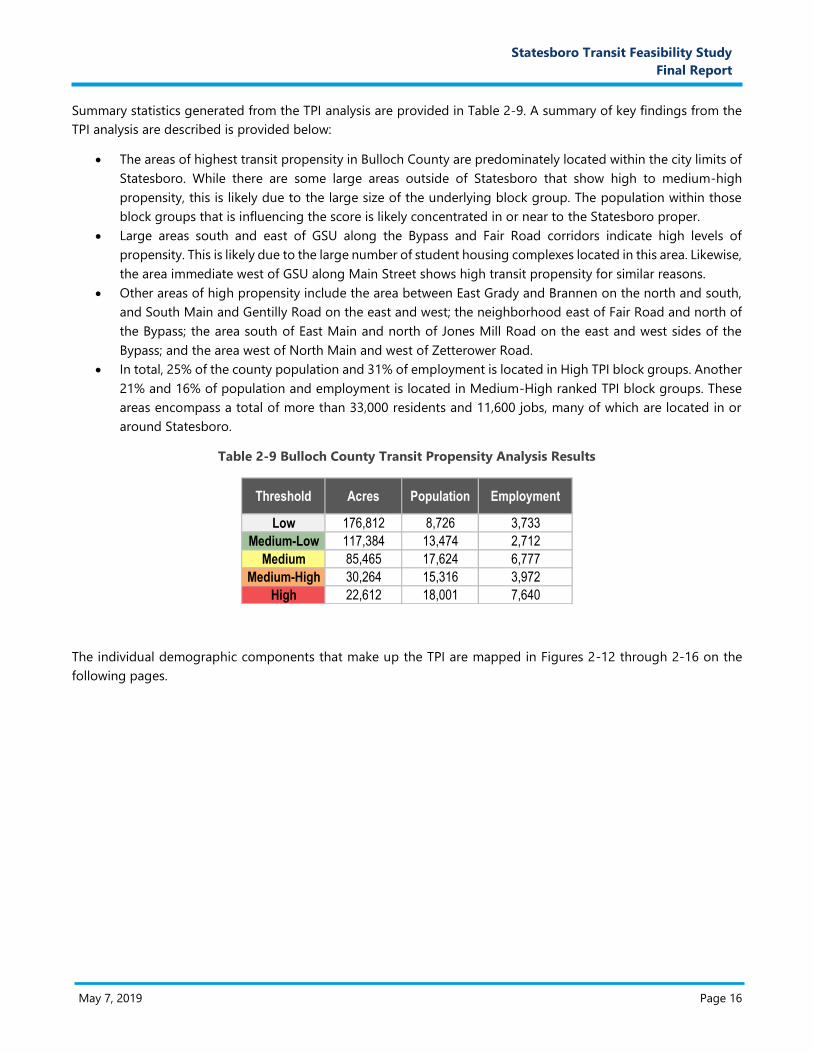
Summary statistics generated from the TPI analysis are provided in Table 2-9. A summary of key findings from the
TPI analysis are described is provided below:
The areas of highest transit propensity in Bulloch County are predominately located within the city limits of
Statesboro. While there are some large areas outside of Statesboro that show high to medium-high
propensity, this is likely due to the large size of the underlying block group. The population within those
block groups that is influencing the score is likely concentrated in or near to the Statesboro proper.
Large areas south and east of GSU along the Bypass and Fair Road corridors indicate high levels of
propensity. This is likely due to the large number of student housing complexes located in this area. Likewise,
the area immediate west of GSU along Main Street shows high transit propensity for similar reasons.
Other areas of high propensity include the area between East Grady and Brannen on the north and south,
and South Main and Gentilly Road on the east and west; the neighborhood east of Fair Road and north of
the Bypass; the area south of East Main and north of Jones Mill Road on the east and west sides of the
Bypass; and the area west of North Main and west of Zetterower Road.
In total, 25% of the county population and 31% of employment is located in High TPI block groups. Another
21% and 16% of population and employment is located in Medium-High ranked TPI block groups. These
areas encompass a total of more than 33,000 residents and 11,600 jobs, many of which are located in or
around Statesboro.
Table 2-9 Bulloch County Transit Propensity Analysis Results
The individual demographic components that make up the TPI are mapped in Figures 2-12 through 2-16 on the
following pages.
Threshold Acres Population Employment
Low 176,812 8,726 3,733
Medium-Low 117,384 13,474 2,712
Medium 85,465 17,624 6,777
Medium-High 30,264 15,316 3,972
High 22,612 18,001 7,640
May 7, 2019 Page 17
Statesboro Transit Feasibility Study
Final Report
Figure 2-12: Senior Population Density (2016)
May 7, 2019 Page 18
Statesboro Transit Feasibility Study
Final Report
Figure 2-13: Youth Population Density (2016)
May 7, 2019 Page 19
Statesboro Transit Feasibility Study
Final Report
Figure 2-14: Low Income Household Density (2016)
May 7, 2019 Page 20
Statesboro Transit Feasibility Study
Final Report
Figure 2-15: Zero-Vehicle Household Density (2016)
May 7, 2019 Page 21
Statesboro Transit Feasibility Study
Final Report
Figure 2-16: Disabled Population Density (2016)
May 7, 2019 Page 22
B. Proposal Narrative A. Proposal Narrative
Statesboro Transit Feasibility Study
Technical Memorandum 1
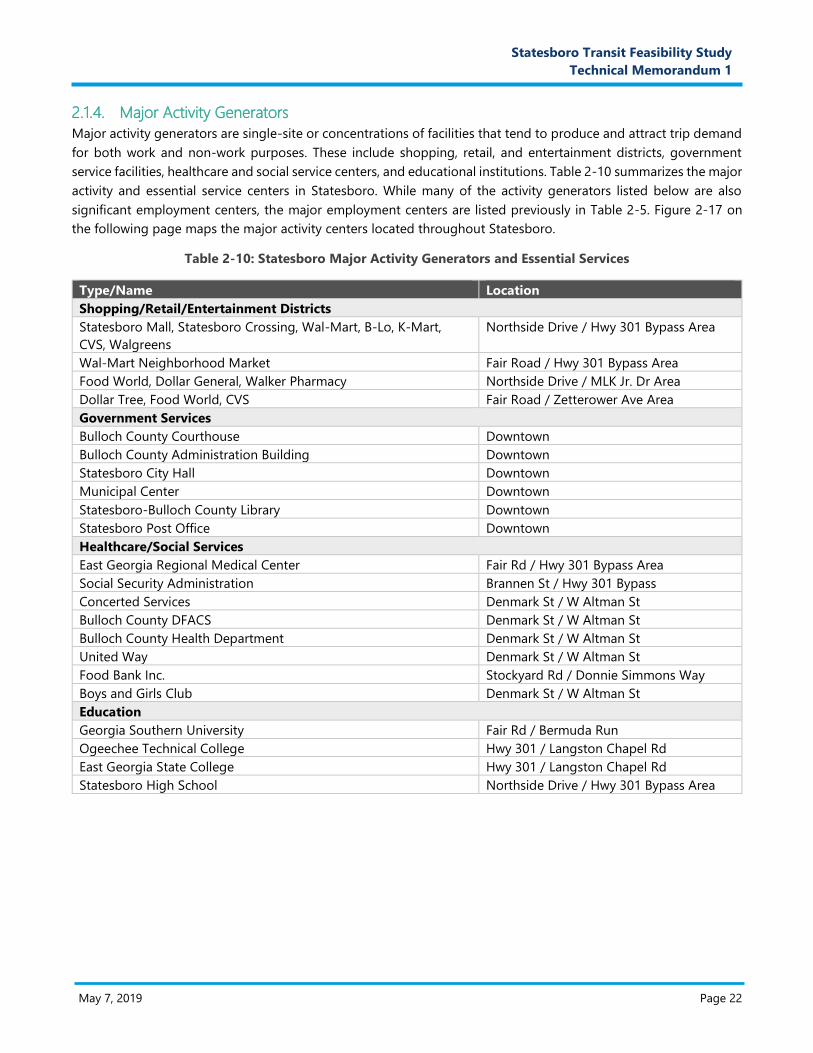
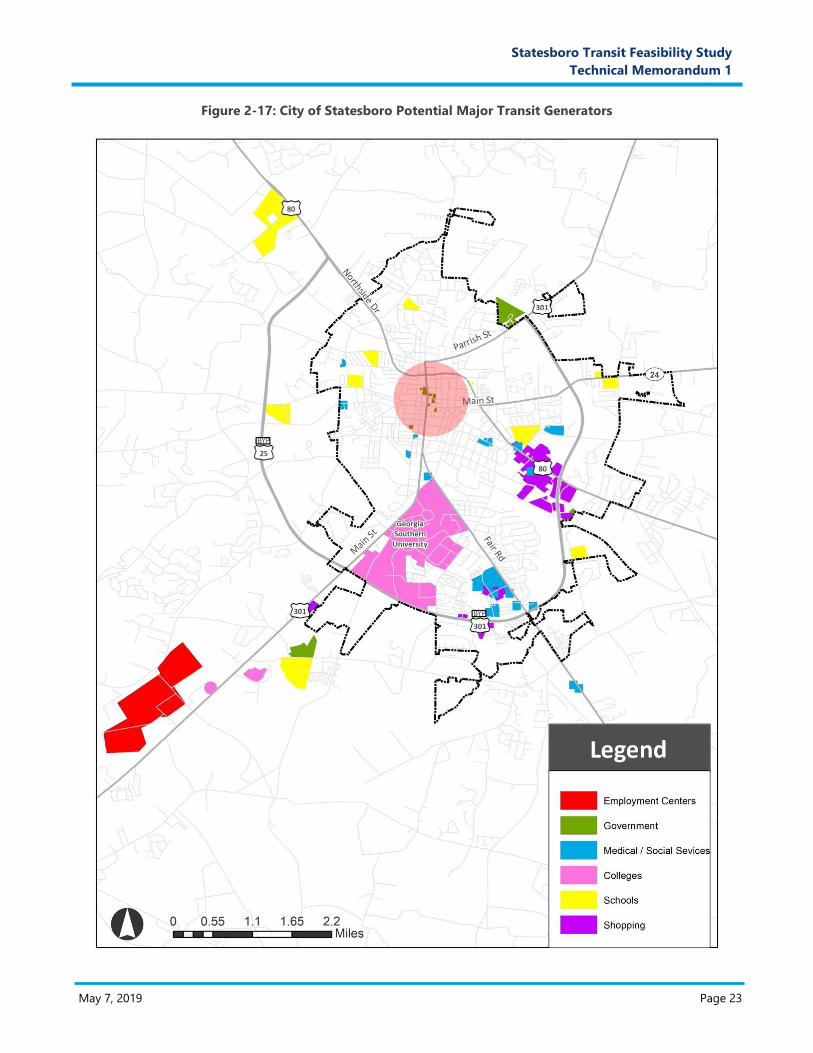
2.1.4. Major Activity Generators
Major activity generators are single-site or concentrations of facilities that tend to produce and attract trip demand
for both work and non-work purposes. These include shopping, retail, and entertainment districts, government
service facilities, healthcare and social service centers, and educational institutions. Table 2-10 summarizes the major
activity and essential service centers in Statesboro. While many of the activity generators listed below are also
significant employment centers, the major employment centers are listed previously in Table 2-5. Figure 2-17 on
the following page maps the major activity centers located throughout Statesboro.
Table 2-10: Statesboro Major Activity Generators and Essential Services
Type/Name Location
Shopping/Retail/Entertainment Districts
Statesboro Mall, Statesboro Crossing, Wal-Mart, B-Lo, K-Mart,
CVS, Walgreens
Northside Drive / Hwy 301 Bypass Area
Wal-Mart Neighborhood Market Fair Road / Hwy 301 Bypass Area
Food World, Dollar General, Walker Pharmacy Northside Drive / MLK Jr. Dr Area
Dollar Tree, Food World, CVS Fair Road / Zetterower Ave Area
Government Services
Bulloch County Courthouse Downtown
Bulloch County Administration Building Downtown
Statesboro City Hall Downtown
Municipal Center Downtown
Statesboro-Bulloch County Library Downtown
Statesboro Post Office Downtown
Healthcare/Social Services
East Georgia Regional Medical Center Fair Rd / Hwy 301 Bypass Area
Social Security Administration Brannen St / Hwy 301 Bypass
Concerted Services Denmark St / W Altman St
Bulloch County DFACS Denmark St / W Altman St
Bulloch County Health Department Denmark St / W Altman St
United Way Denmark St / W Altman St
Food Bank Inc. Stockyard Rd / Donnie Simmons Way
Boys and Girls Club Denmark St / W Altman St
Education
Georgia Southern University Fair Rd / Bermuda Run
Ogeechee Technical College Hwy 301 / Langston Chapel Rd
East Georgia State College Hwy 301 / Langston Chapel Rd
Statesboro High School Northside Drive / Hwy 301 Bypass Area
May 7, 2019 Page 23
B. Proposal Narrative A. Proposal Narrative
Statesboro Transit Feasibility Study
Technical Memorandum 1
Figure 2-17: City of Statesboro Potential Major Transit Generators
May 7, 2019 Page 24
B. Proposal Narrative A. Proposal Narrative
Statesboro Transit Feasibility Study
Technical Memorandum 1
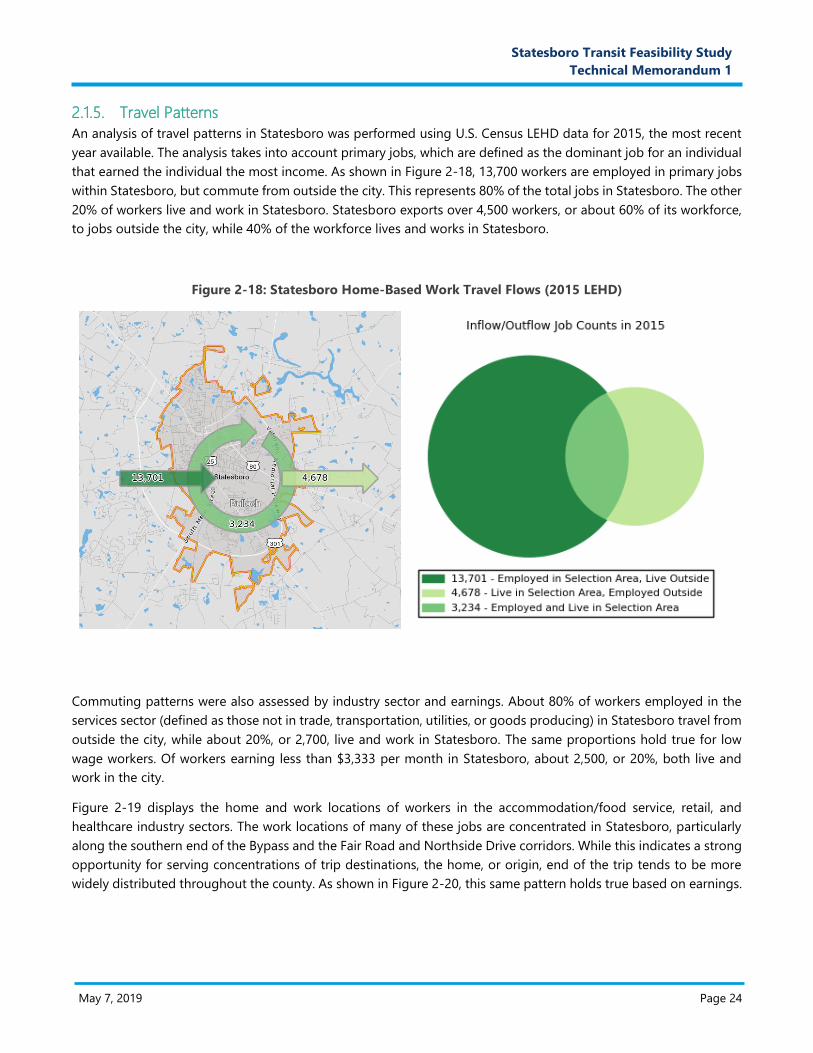
2.1.5. Travel Patterns
An analysis of travel patterns in Statesboro was performed using U.S. Census LEHD data for 2015, the most recent
year available. The analysis takes into account primary jobs, which are defined as the dominant job for an individual
that earned the individual the most income. As shown in Figure 2-18, 13,700 workers are employed in primary jobs
within Statesboro, but commute from outside the city. This represents 80% of the total jobs in Statesboro. The other
20% of workers live and work in Statesboro. Statesboro exports over 4,500 workers, or about 60% of its workforce,
to jobs outside the city, while 40% of the workforce lives and works in Statesboro.
Figure 2-18: Statesboro Home-Based Work Travel Flows (2015 LEHD)
Commuting patterns were also assessed by industry sector and earnings. About 80% of workers employed in the
services sector (defined as those not in trade, transportation, utilities, or goods producing) in Statesboro travel from
outside the city, while about 20%, or 2,700, live and work in Statesboro. The same proportions hold true for low
wage workers. Of workers earning less than $3,333 per month in Statesboro, about 2,500, or 20%, both live and
work in the city.
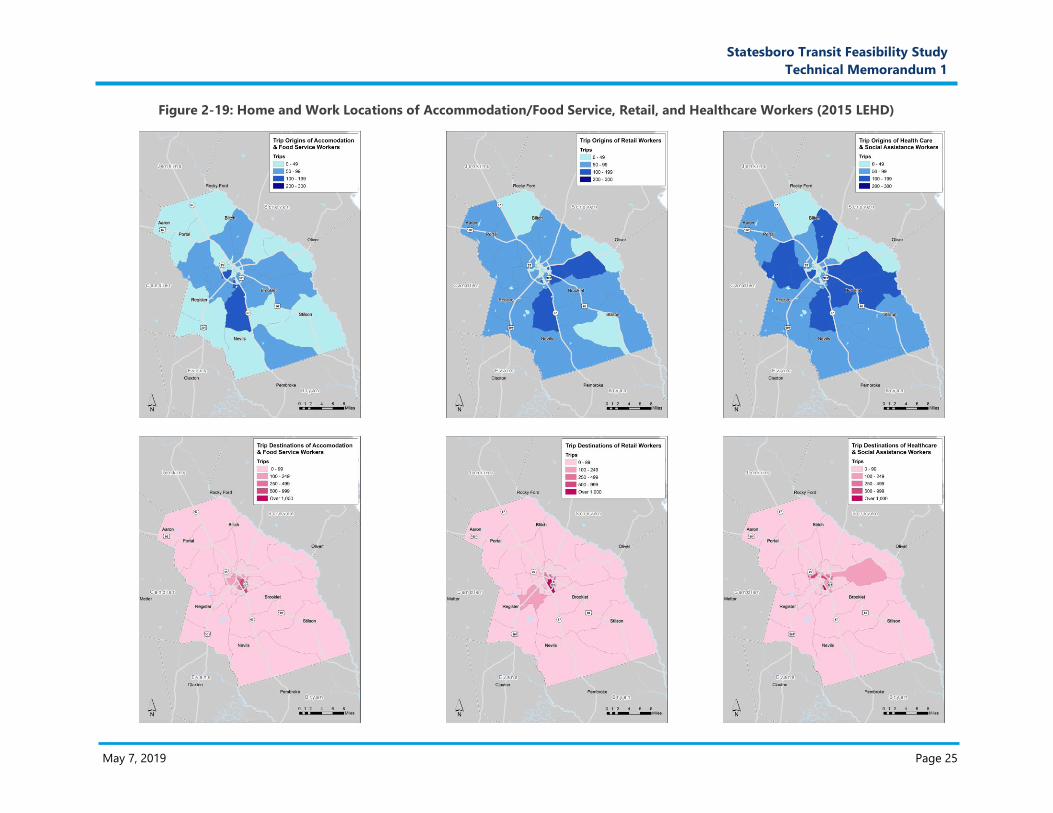
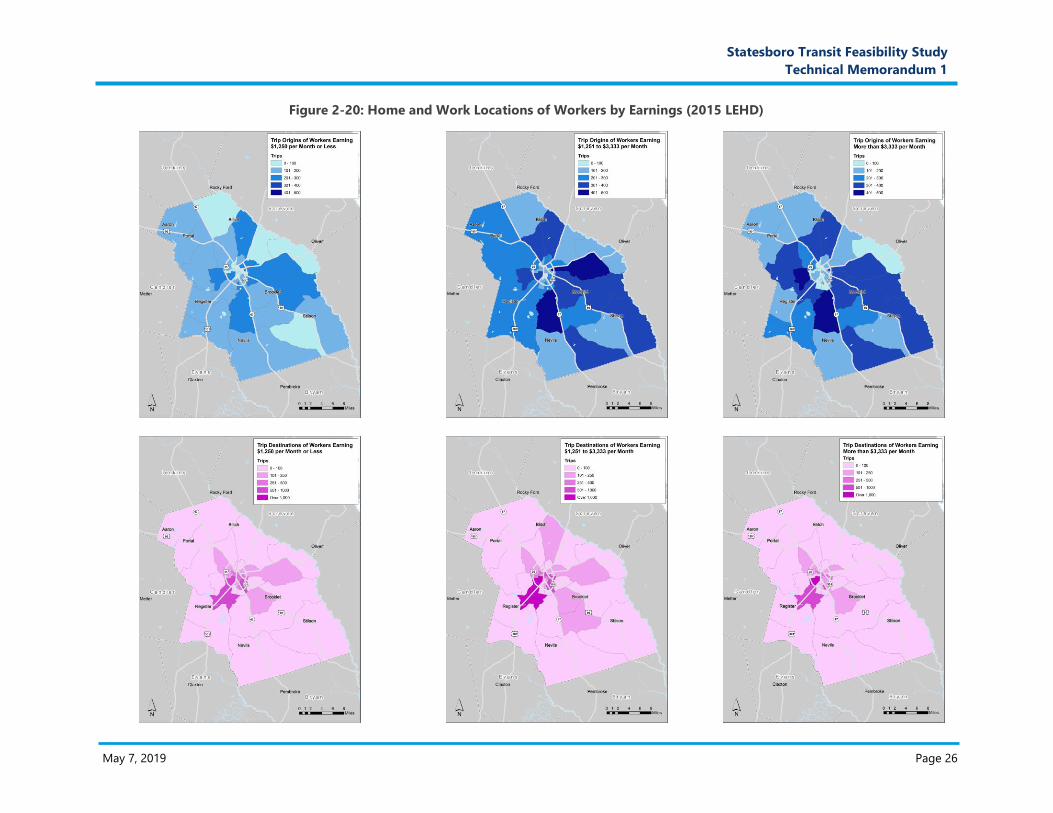
Figure 2-19 displays the home and work locations of workers in the accommodation/food service, retail, and
healthcare industry sectors. The work locations of many of these jobs are concentrated in Statesboro, particularly
along the southern end of the Bypass and the Fair Road and Northside Drive corridors. While this indicates a strong
opportunity for serving concentrations of trip destinations, the home, or origin, end of the trip tends to be more
widely distributed throughout the county. As shown in Figure 2-20, this same pattern holds true based on earnings.
May 7, 2019 Page 25
C. Proposal Narrative
Statesboro Transit Feasibility Study
Technical Memorandum 1
Figure 2-19: Home and Work Locations of Accommodation/Food Service, Retail, and Healthcare Workers (2015 LEHD)
May 7, 2019 Page 26
C. Proposal Narrative
Statesboro Transit Feasibility Study
Technical Memorandum 1
Figure 2-20: Home and Work Locations of Workers by Earnings (2015 LEHD)
May 7, 2019 Page 27
D. Proposal Narrative
Statesboro Transit Feasibility Study
Final Report
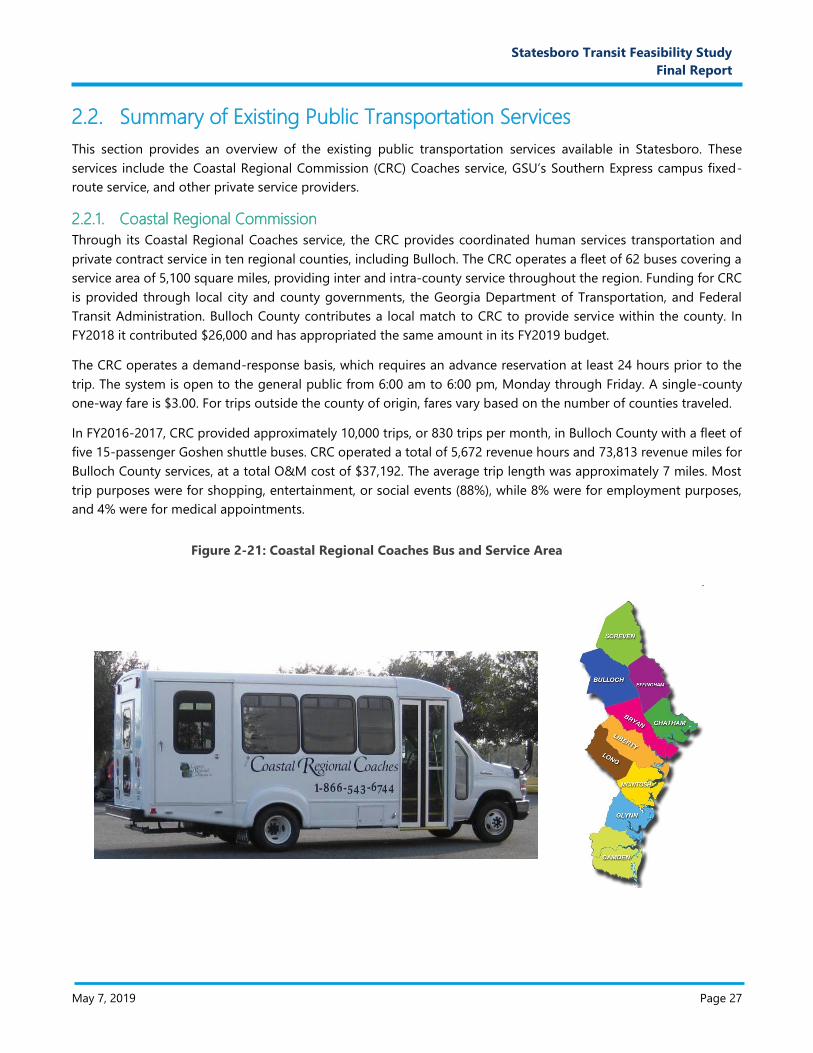
2.2. Summary of Existing Public Transportation Services
This section provides an overview of the existing public transportation services available in Statesboro. These
services include the Coastal Regional Commission (CRC) Coaches service, GSU’s Southern Express campus fixed-
route service, and other private service providers.
2.2.1. Coastal Regional Commission
Through its Coastal Regional Coaches service, the CRC provides coordinated human services transportation and
private contract service in ten regional counties, including Bulloch. The CRC operates a fleet of 62 buses covering a
service area of 5,100 square miles, providing inter and intra-county service throughout the region. Funding for CRC
is provided through local city and county governments, the Georgia Department of Transportation, and Federal
Transit Administration. Bulloch County contributes a local match to CRC to provide service within the county. In
FY2018 it contributed $26,000 and has appropriated the same amount in its FY2019 budget.
The CRC operates a demand-response basis, which requires an advance reservation at least 24 hours prior to the
trip. The system is open to the general public from 6:00 am to 6:00 pm, Monday through Friday. A single-county
one-way fare is $3.00. For trips outside the county of origin, fares vary based on the number of counties traveled.
In FY2016-2017, CRC provided approximately 10,000 trips, or 830 trips per month, in Bulloch County with a fleet of
five 15-passenger Goshen shuttle buses. CRC operated a total of 5,672 revenue hours and 73,813 revenue miles for
Bulloch County services, at a total O&M cost of $37,192. The average trip length was approximately 7 miles. Most
trip purposes were for shopping, entertainment, or social events (88%), while 8% were for employment purposes,
and 4% were for medical appointments.
Figure 2-21: Coastal Regional Coaches Bus and Service Area
May 7, 2019 Page 28
D. Proposal Narrative
Statesboro Transit Feasibility Study
Final Report
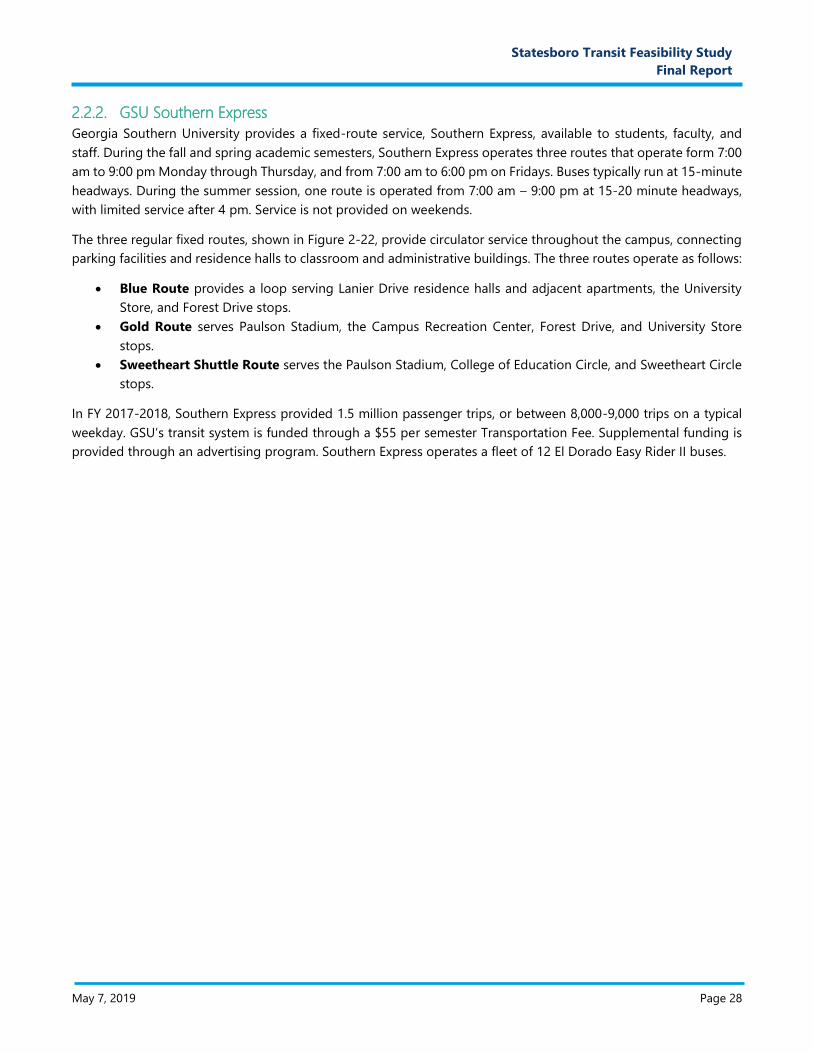
2.2.2. GSU Southern Express
Georgia Southern University provides a fixed-route service, Southern Express, available to students, faculty, and
staff. During the fall and spring academic semesters, Southern Express operates three routes that operate form 7:00
am to 9:00 pm Monday through Thursday, and from 7:00 am to 6:00 pm on Fridays. Buses typically run at 15-minute
headways. During the summer session, one route is operated from 7:00 am – 9:00 pm at 15-20 minute headways,
with limited service after 4 pm. Service is not provided on weekends.
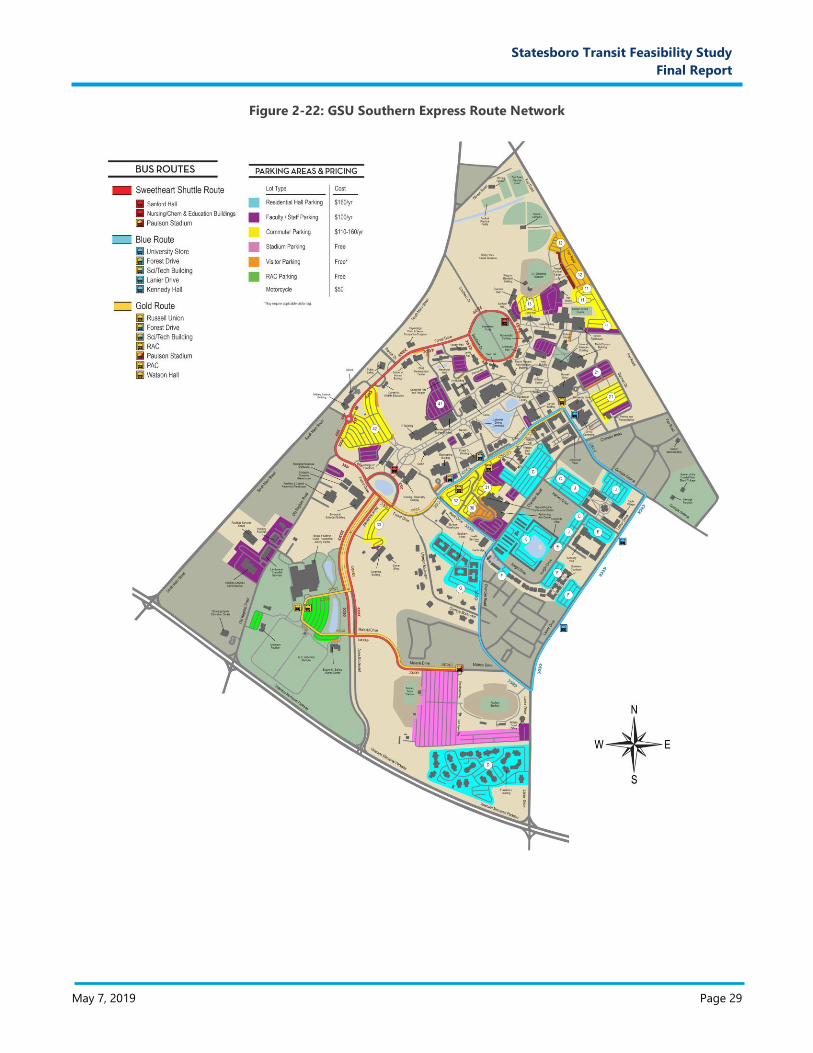
The three regular fixed routes, shown in Figure 2-22, provide circulator service throughout the campus, connecting
parking facilities and residence halls to classroom and administrative buildings. The three routes operate as follows:
Blue Route provides a loop serving Lanier Drive residence halls and adjacent apartments, the University
Store, and Forest Drive stops.
Gold Route serves Paulson Stadium, the Campus Recreation Center, Forest Drive, and University Store
stops.
Sweetheart Shuttle Route serves the Paulson Stadium, College of Education Circle, and Sweetheart Circle
stops.
In FY 2017-2018, Southern Express provided 1.5 million passenger trips, or between 8,000-9,000 trips on a typical
weekday. GSU’s transit system is funded through a $55 per semester Transportation Fee. Supplemental funding is
provided through an advertising program. Southern Express operates a fleet of 12 El Dorado Easy Rider II buses.
May 7, 2019 Page 29
D. Proposal Narrative
Statesboro Transit Feasibility Study
Final Report
Figure 2-22: GSU Southern Express Route Network
May 7, 2019 Page 30
D. Proposal Narrative
Statesboro Transit Feasibility Study
Final Report
2.2.3. Other Providers
Other public and private entities provide transportation service throughout the Statesboro community. These
services are described below.
East Georgia States College Shuttle
East Georgia State College (EGSC) provides a bus service to students attending EGSC-Statesboro and Ogeechee
Technical College (OTC). The service provides connections between the two campuses and GSU. The bus route
begins at Paulson Stadium on the GSU campus and stops at EGSC and OTC, then returns to Paulson Stadium. Bus
stops are located as follows:
EGSC-Statesboro: Entrance of the Bishop Building.
OTC: Traffic circle in front of the Health Science North building.
GSU: Paulson Stadium
The service operates between 7:30 a.m. to 7:00 p.m. Monday through Thursday, and from 7:30 a.m. to noon on
Fridays. Service is not offered on the weekends. The bus runs on 30-minute headways. Funding for the service is
provided through a student Parking and Transportation fee assessed each semester.
Private Apartment Shuttles
Several apartment complexes catering to the student market offer private shuttle buses to and from the GSU
campus. These services are limited to apartment residents and provided at no extra cost. Web research indicated
that the following apartment complexes in Statesboro offer a complementary shuttle service to GSU:
The Connection at Statesboro
Copper Beech Townhomes
Aspen Heights
The Vault at Statesboro
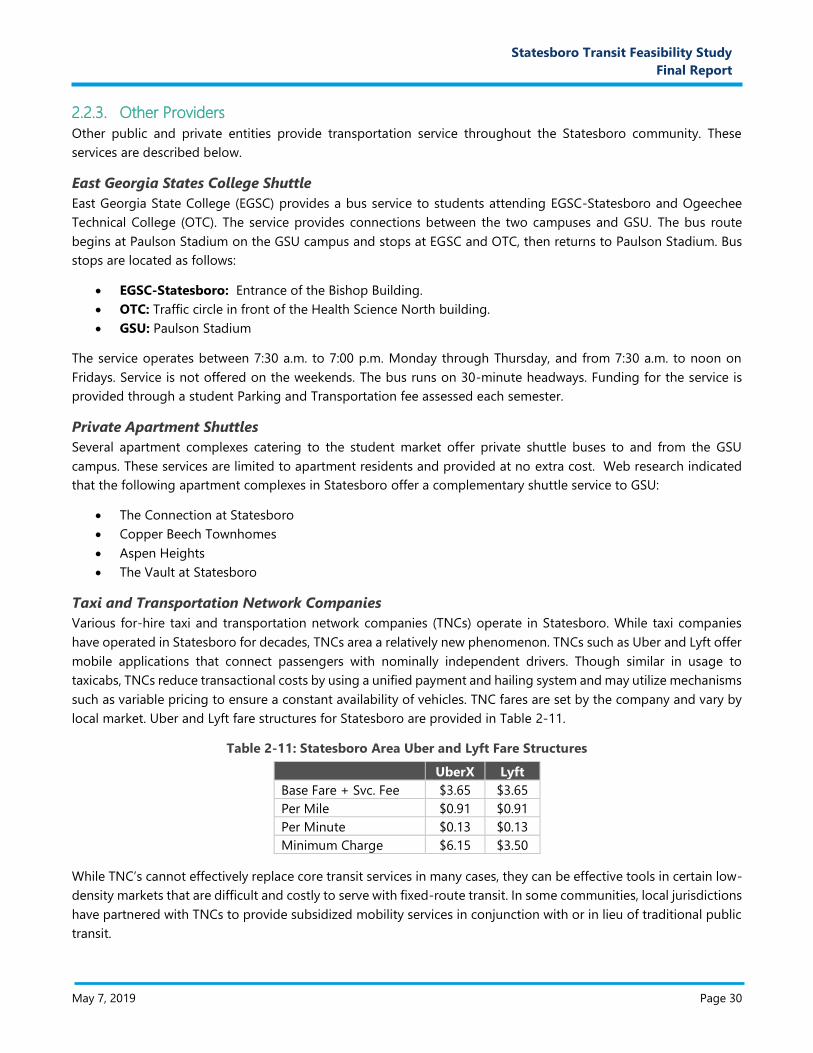
Taxi and Transportation Network Companies
Various for-hire taxi and transportation network companies (TNCs) operate in Statesboro. While taxi companies
have operated in Statesboro for decades, TNCs area a relatively new phenomenon. TNCs such as Uber and Lyft offer
mobile applications that connect passengers with nominally independent drivers. Though similar in usage to
taxicabs, TNCs reduce transactional costs by using a unified payment and hailing system and may utilize mechanisms
such as variable pricing to ensure a constant availability of vehicles. TNC fares are set by the company and vary by
local market. Uber and Lyft fare structures for Statesboro are provided in Table 2-11.
Table 2-11: Statesboro Area Uber and Lyft Fare Structures
UberX Lyft
Base Fare + Svc. Fee $3.65 $3.65
Per Mile $0.91 $0.91
Per Minute $0.13 $0.13
Minimum Charge $6.15 $3.50
While TNC’s cannot effectively replace core transit services in many cases, they can be effective tools in certain low-
density markets that are difficult and costly to serve with fixed-route transit. In some communities, local jurisdictions
have partnered with TNCs to provide subsidized mobility services in conjunction with or in lieu of traditional public
transit.
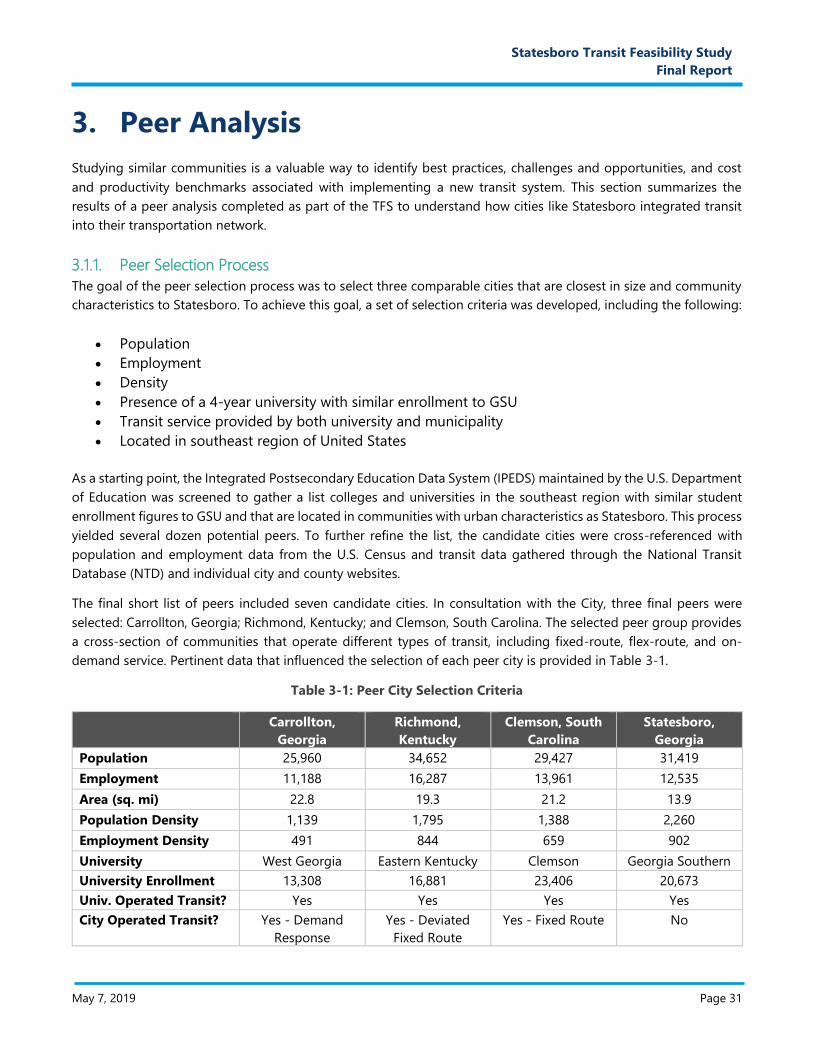
May 7, 2019 Page 31
D. Proposal Narrative
Statesboro Transit Feasibility Study
Final Report
3. Peer Analysis
Studying similar communities is a valuable way to identify best practices, challenges and opportunities, and cost
and productivity benchmarks associated with implementing a new transit system. This section summarizes the
results of a peer analysis completed as part of the TFS to understand how cities like Statesboro integrated transit
into their transportation network.
3.1.1. Peer Selection Process
The goal of the peer selection process was to select three comparable cities that are closest in size and community
characteristics to Statesboro. To achieve this goal, a set of selection criteria was developed, including the following:
Population
Employment
Density
Presence of a 4-year university with similar enrollment to GSU
Transit service provided by both university and municipality
Located in southeast region of United States
As a starting point, the Integrated Postsecondary Education Data System (IPEDS) maintained by the U.S. Department
of Education was screened to gather a list colleges and universities in the southeast region with similar student
enrollment figures to GSU and that are located in communities with urban characteristics as Statesboro. This process
yielded several dozen potential peers. To further refine the list, the candidate cities were cross-referenced with
population and employment data from the U.S. Census and transit data gathered through the National Transit
Database (NTD) and individual city and county websites.
The final short list of peers included seven candidate cities. In consultation with the City, three final peers were
selected: Carrollton, Georgia; Richmond, Kentucky; and Clemson, South Carolina. The selected peer group provides
a cross-section of communities that operate different types of transit, including fixed-route, flex-route, and on-
demand service. Pertinent data that influenced the selection of each peer city is provided in Table 3-1.
Table 3-1: Peer City Selection Criteria
Carrollton,
Georgia
Richmond,
Kentucky
Clemson, South
Carolina
Statesboro,
Georgia
Population 25,960 34,652 29,427 31,419
Employment 11,188 16,287 13,961 12,535
Area (sq. mi) 22.8 19.3 21.2 13.9
Population Density 1,139 1,795 1,388 2,260
Employment Density 491 844 659 902
University West Georgia Eastern Kentucky Clemson Georgia Southern
University Enrollment 13,308 16,881 23,406 20,673
Univ. Operated Transit? Yes Yes Yes Yes
City Operated Transit? Yes - Demand
Response
Yes - Deviated
Fixed Route
Yes - Fixed Route No
May 7, 2019 Page 32
D. Proposal Narrative
Statesboro Transit Feasibility Study
Final Report
3.1.2. Peer Characteristics
A description of each peer city and its respective transit services is provided in the following sections.
Carrollton, Georgia
Carrollton, Georgia is located in the northwest region of the state, about 45 miles west of Atlanta near the Alabama
state line. Carrollton is the county seat of Carroll County, and has a population of approximately 26,500 and an
employment base of approximately 21,500 jobs. Carrollton is home to a four-year university, the University of West
Georgia (UWG), and a vocational college, West Georgia Technical College (WGTC). UWG has an enrollment of 13,300,
while WGTC has an enrollment of 7,300.
Coordinated human services transportation in Carrollton and Carroll County was historically provided by the Three
Rivers Regional Commission (TRRC) through a demand-response program covering its entire 10-county service area.
In 2018, Carroll County entered into a contract with TRRC to provide a dedicated transit service in Carroll County.
Named the Carroll Connection, this service provides demand-response service to the general public throughout
Carroll County and the City of Carrollton. In addition to this new service, UWG operates a campus fixed-route shuttle
system limited to students, faculty, and staff. The UWG service offers two routes that provide circulation between
academic buildings, residence halls, and parking facilities located on the periphery of the campus. A third shuttle
route is provided between the main campus in Carrollton and the Newnan campus.
Carroll Connection
The Carroll Connection demand response service launched in July 2018 through a partnership with TRRC. The service
operates between 8:00 a.m. and 5:00 p.m., Monday through Friday, with no service offered on weekends. To access
the service, customers must make a reservation at least 24-hours in advance of the scheduled trip. Reservations can
be made on a subscription (recurring) or one-time basis. A one-way fare is $3.00. Trips are provided between any
origin and destination within Carroll County. While no ridership data for the new system is available, the predecessor
service operated by TRRC provided an average of 415 trips per month in Carroll County in FY 2017. Of those trips,
41% were for senior citizen-related activities, 29% were employment-related, and 30% were for other purposes. The
Carroll Connection uses a fleet of six 10-passenger vans, which it purchased directly in 2018.
The Carroll Connection service is primarily funded through FTA Section 5311 (non-urban) grant funding, passed
through from the state to TRRC. Carroll County provides an annual local match of $35,000. The County contracts
directly with TRRC to manage service, which TRRC subcontracts to a third-party contractor to operate the service.
Richmond, Kentucky
Richmond is located in the Bluegrass region of Kentucky, approximately 30 miles south of Lexington. Richmond is
the seat of Madison County, and has a population of nearly 35,000 and an employment base of approximately
16,000 jobs. Eastern Kentucky University (EKU), a regional four-year institution with an enrollment of nearly 17,000
students, is located adjacent to downtown Richmond.
Public transportation in Richmond is provided by the Kentucky River Foothills Development Council (KRFDC). KRFDC
operates a variety of demand response, intercity, and local transit services across its four-county service area. In
Richmond, KRFDC operates both the local and university bus services. The local service provides two routes and is
open to the general public, while the EKU service provides six fixed routes but limits access to students, faculty, and
staff.
May 7, 2019 Page 33
D. Proposal Narrative
Statesboro Transit Feasibility Study
Final Report
Foothills Express
Richmond’s local bus service is operated as a deviated-fixed, or flex, route model. Passengers can access the service
at any stop along the route, or request an off-route pick-up or drop off. Riders can request an off-route stop by
calling dispatch 24-hours in advance. All off-route stop requests must be within ¾ of a mile of a route. The service
operates from 8:00 a.m. to 5:00 p.m. Monday through Friday, with no weekend service provided. Both routes operate
in a one-way loop configuration with one vehicle assigned to each route. The “A” route operates on a 90-minute
headway and the “B” route operates on a 60-minute headway. Both routes serve a variety of shopping, social
service, government and healthcare facilities throughout Richmond. In FY 2017 - 2018, Foothills Express operated
48,465 revenue miles on its Richmond routes and provided 12,642 passenger trips.
Fares for the Richmond flex-route service are $1.00 per one-way trip for the general public and $0.50 per trip for
college students with a valid ID. Ten-trip multi-ride passes are offered for $7.00. Children eight years and under ride
free.
KRFDC’s transit services covering its four-county region are funded through local and federal sources. The City of
Richmond contributes $80,000 from its general fund to the transit service. While the federal funding allocation for
the Richmond service is not readily available, it can be reasonably assumed that it is consistent with KRFDC’s overall
budget, which is funding with approximately 50% federal (Section 5311) sources.
Clemson, South Carolina
Clemson is located in Pickens and Anderson counties in the Appalachian region of northwest South Carolina. The
City of Clemson has a population of nearly 14,000 residents and an employment base of 7,000 jobs. Clemson is
home to Clemson University, a major research institution with an enrollment of nearly 17,000 students. Clemson is
located in close proximity to three smaller towns, Seneca, Pendleton, and Central, which collectively have a total
population of nearly 30,000 and employment base of 14,000 jobs.
Transit service in Clemson and the surrounding communities of Seneca, Central, and Pendleton is provided by
Clemson Area Transit (CAT). CAT provides service to the general public as well as Clemson University. However,
Clemson University also operates a number of on-campus routes and intercity shuttles to its satellite campuses.
Clemson Area Transit (CAT)
Clemson Area Transit was founded in 1996 and provides service in the City of Clemson. The service is jointly operated
by the City of Clemson and Clemson University, and notably does not charge fares. The network encompasses nine
routes, with five routes serving the Clemson University campus and surrounding areas. Dedicated local routes are
provided within the cities of Seneca and Central.
CAT provided 1.7 million passenger trips in FY 2017 using a fleet of 31 standard and articulated buses. It operates
19 buses in peak service. In FY 2017 CAT operated over 53,700 revenue hours and 685,000 revenue miles.
CAT is funded through a mix of local sources and federal formula funds. Approximately 60% of its operations funding
comes from local sources including contributions the City of Clemson’s Transit Enterprise Fund and
intergovernmental transfers from the cities of Seneca, Pendleton, Central, Anderson County, and Clemson University.
The remaining 40% of its operating funds come from federal sources, including FTA Sections 5307 (Urban Area
Formula), 5311 (Non-Urban Formula), and 5303 (Metropolitan Planning).
May 7, 2019 Page 34
D. Proposal Narrative
Statesboro Transit Feasibility Study
Final Report
3.1.3. Peer Analysis Key Findings
Key findings from the peer analysis are summarized below and in Table 3-2 on the following page.
Funding and Governance: The three peer systems offer a diverse array of funding and governance models.
Richmond’s local transit service is operated by its regional commission and funded through a roughly 50-
50 split of local and federal sources. Transit service in Carrollton was previously funded and provided by its
regional commission until Carroll County implemented its own county-based service in 2018. Carroll County
funds its service through a local general fund contribution that is supplemented with federal sources
allocated to its regional commission. The City of Clemson operates its system jointly with Clemson
University. The City of Clemson funds its system through a transit enterprise fund, with significant
intergovernmental contributions from Clemson University and the municipalities of Seneca, Pendleton, and
Central. Because Clemson is part of the Greenville urbanized area, it receives an allocation of federal urban
formula funding. It also receives a small allocation of non-urban funding to account for its service area that
is outside of the urbanized area.
Service Delivery Models: Of the three peers, two, Clemson and Richmond, operate service directly with
agency staff. One peer, Carrollton/Carroll County, contracts service through a regional commission which
subcontracts out the operations and maintenance of the system.
University Coordination: The three peer cities are unique in their approach to coordinating their local and
university transit services. Clemson’s service is fully integrated and available to both the general public and
university customers. In Richmond, the regional commission that operates the general public service also
operates the university fixed-route service, however the university service is restricted to those with a valid
university ID. The general public service is designed to provide transfers at select locations, though
university customers are required to pay a small ($0.50) fare to use the public service. In Carrollton, there is
no formal coordination between the county-operated demand-response service and the university-
operated fixed-route service.
Service Types: While each of the three peer cities are home to universities that operate fixed-route transit
catering to campus transportation needs, the service types operated by the local jurisdictions are unique.
Richmond provides a deviated fixed-route service, Carrollton/Carroll County provides a demand response
service, and Clemson operates a fixed-route service.
Level of Service Provided: Each of the peer cities provide general public on weekdays, generally during
normal working hours. One peer, Clemson, offers service on weekends and during the evening and
late/night periods on select routes. Richmond, which offers a flex-route service, provides service at 60 to
90-minute headways.
Fare Structure: One-way fares range from free (Clemson) to $3.00 per one-way trip (Carrollton). Richmond
charges a fare of $1.00 per one-way trip.
Fleet: Transit service in Richmond is provided using two 14-passenger cutaway buses. Carrollton/Carroll
County uses a fleet of six 10-passenger vans. Clemson utilizes a mixed fleet of 31 standard and articulated
buses, six of which are battery-powered. Each agency uses fully-ADA accessible vehicles.
Ridership Productivity: Clemson operates the largest system among the three peers, and accordingly has
the largest annual ridership at over 1.7 million passenger trips in FY 2017. Richmond provided approximately
12,600 passenger trips in FY 2017. While ridership data was not available for the new Carroll County system
that launched in 2018, its predecessor service operated by TRRC provided nearly 5,000 trips in the county
in FY 2017.
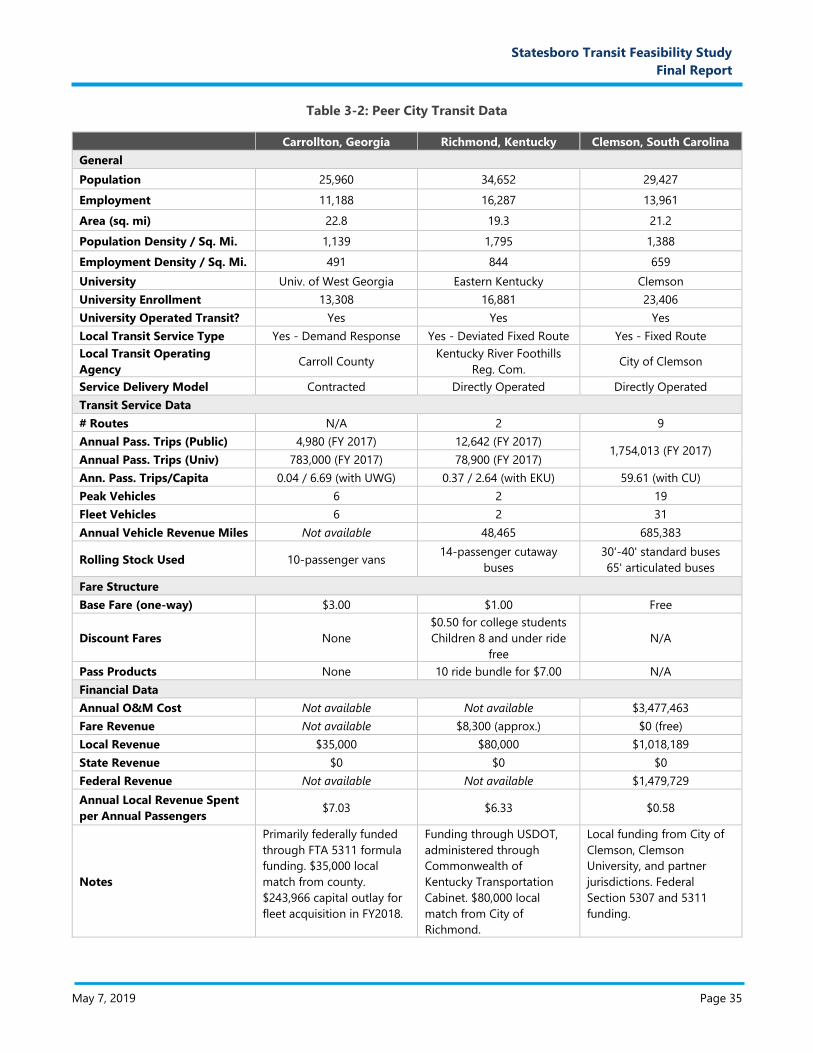
May 7, 2019 Page 35
F. Proposal Narrative E. Proposal Narrative
Statesboro Transit Feasibility Study
Final Report
Table 3-2: Peer City Transit Data
Carrollton, Georgia Richmond, Kentucky Clemson, South Carolina
General
Population 25,960 34,652 29,427
Employment 11,188 16,287 13,961
Area (sq. mi) 22.8 19.3 21.2
Population Density / Sq. Mi. 1,139 1,795 1,388
Employment Density / Sq. Mi. 491 844 659
University Univ. of West Georgia Eastern Kentucky Clemson
University Enrollment 13,308 16,881 23,406
University Operated Transit? Yes Yes Yes
Local Transit Service Type Yes - Demand Response Yes - Deviated Fixed Route Yes - Fixed Route
Local Transit Operating
Agency Carroll County
Kentucky River Foothills
Reg. Com. City of Clemson
Service Delivery Model Contracted Directly Operated Directly Operated
Transit Service Data
# Routes N/A 2 9
Annual Pass. Trips (Public) 4,980 (FY 2017) 12,642 (FY 2017) 1,754,013 (FY 2017)
Annual Pass. Trips (Univ) 783,000 (FY 2017) 78,900 (FY 2017)
Ann. Pass. Trips/Capita 0.04 / 6.69 (with UWG) 0.37 / 2.64 (with EKU) 59.61 (with CU)
Peak Vehicles 6 2 19
Fleet Vehicles 6 2 31
Annual Vehicle Revenue Miles Not available 48,465 685,383
Rolling Stock Used 10-passenger vans 14-passenger cutaway
buses
30'-40' standard buses
65' articulated buses
Fare Structure
Base Fare (one-way) $3.00 $1.00 Free
Discount Fares None
$0.50 for college students
Children 8 and under ride
free
N/A
Pass Products None 10 ride bundle for $7.00 N/A
Financial Data
Annual O&M Cost Not available Not available $3,477,463
Fare Revenue Not available $8,300 (approx.) $0 (free)
Local Revenue $35,000 $80,000 $1,018,189
State Revenue $0 $0 $0
Federal Revenue Not available Not available $1,479,729
Annual Local Revenue Spent
per Annual Passengers $7.03 $6.33 $0.58
Notes
Primarily federally funded
through FTA 5311 formula
funding. $35,000 local
match from county.
$243,966 capital outlay for
fleet acquisition in FY2018.
Funding through USDOT,
administered through
Commonwealth of
Kentucky Transportation
Cabinet. $80,000 local
match from City of
Richmond.
Local funding from City of
Clemson, Clemson
University, and partner
jurisdictions. Federal
Section 5307 and 5311
funding.
May 7, 2019 Page 36
F. Proposal Narrative E. Proposal Narrative
Statesboro Transit Feasibility Study
Final Report
4. Summary Public Engagement Activities The public engagement program for the City of Statesboro TFS will be implemented in two phases. Phase 1, which
was conducted in November and December 2018, involved initial stakeholder outreach and interviews, development
of a steering committee and first committee meeting, and a community open house. The goal of the first phase was
to gather input regarding needs and opportunities pertaining to public transportation. Phase 2 will be conducted
following the development of service concept alternatives, with the goal of soliciting feedback from the steering
committee, stakeholders, and general public to support the selection of a preferred alternative.
The following sections describe the purpose, scope, and outcome of the Phase 1 engagement activities as they
pertain to the overall goals of the TFS.
4.1. Project Steering Committee
A project steering committee was established to help guide the TFS process. The roles and responsibilities of the
steering committee encompass the following:
Provide technical guidance and input throughout the study
Facilitate data and information sharing between the project team and various community organizations
Provide insight into the transportation needs of members’ respective clients and constituents
Assist with coordinating public and stakeholder outreach, including identifying specific communities for
further engagement and helping distribute project information
The steering committee is comprised of eleven members representing various organizations throughout Statesboro
and Bulloch County. Steering committee members include the following individuals:
Janet Tanner, Transportation Supervisor, Bulloch County Schools
Bill Herring, Statesboro Citizen
Mike Jones, Executive Director, Bulloch County Boys and Girls Club
Craig Carroll, Membership and Wellness Director, Statesboro Family YMCA
Tom Couch, County Manager, Bulloch County
Derrick Davis, Director of Parking and Transportation, Georgia Southern University
Don Masisak, Transportation Director, Coastal Regional Commission
Carey Melton, Executive Director, United Way of Southeast Georgia
Steve Price, Area Manager, Georgia Department of Transportation
Kiara Ahmed, Civil Engineer, City of Statesboro
Owen Dundee, City Planner II, City of Statesboro
4.1.1. Steering Committee Meeting #1
The first project steering committee meeting was conducted on November 13th, 2018 at Joe Brannen Hall in
downtown Statesboro. At this meeting, the consultant team provided an overview of the project scope and schedule,
discussed project opportunities and challenges, and reviewed initial findings of a transit market analysis and
conceptual service delivery models that have potential applicability in Statesboro. The committee was also provided
flyers to be distributed in advance of the public open house that contained a link to the online survey.
A break-out session was conducted to gather input from the committee regarding potential transit needs
throughout the community and priorities for transit in Statesboro. The first activity involved committee members
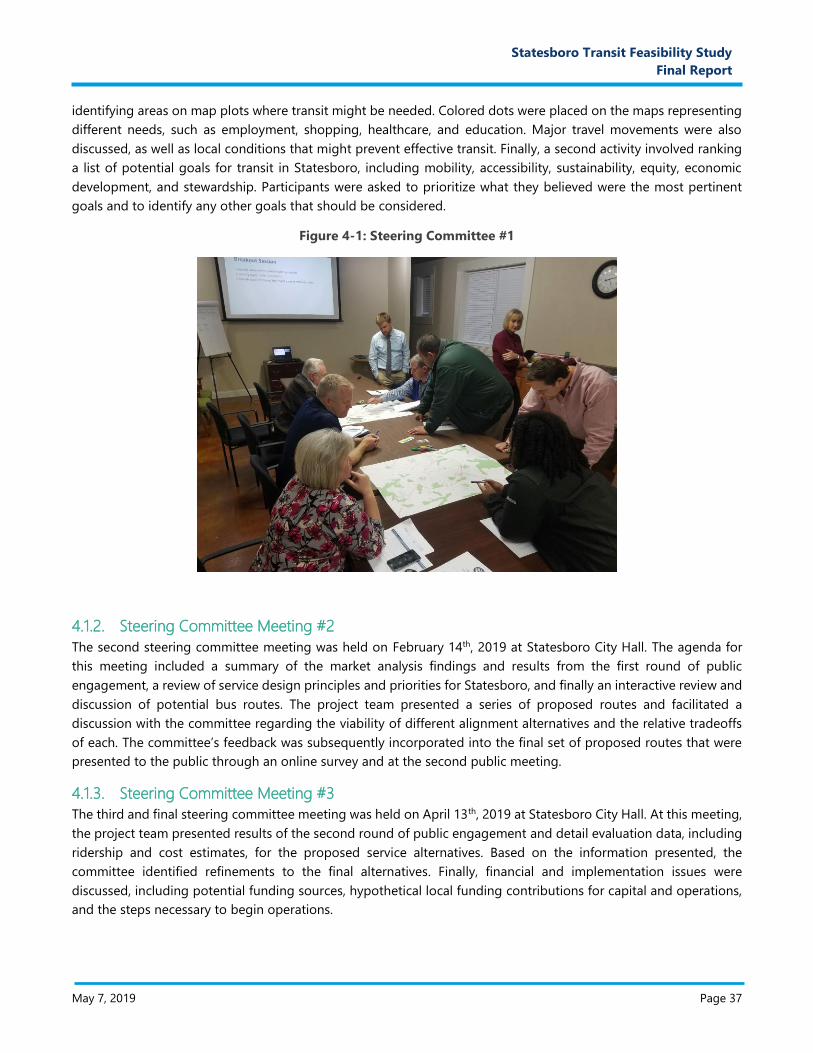
May 7, 2019 Page 37
F. Proposal Narrative E. Proposal Narrative
Statesboro Transit Feasibility Study
Final Report
identifying areas on map plots where transit might be needed. Colored dots were placed on the maps representing
different needs, such as employment, shopping, healthcare, and education. Major travel movements were also
discussed, as well as local conditions that might prevent effective transit. Finally, a second activity involved ranking
a list of potential goals for transit in Statesboro, including mobility, accessibility, sustainability, equity, economic
development, and stewardship. Participants were asked to prioritize what they believed were the most pertinent
goals and to identify any other goals that should be considered.
Figure 4-1: Steering Committee #1
4.1.2. Steering Committee Meeting #2
The second steering committee meeting was held on February 14th, 2019 at Statesboro City Hall. The agenda for
this meeting included a summary of the market analysis findings and results from the first round of public
engagement, a review of service design principles and priorities for Statesboro, and finally an interactive review and
discussion of potential bus routes. The project team presented a series of proposed routes and facilitated a
discussion with the committee regarding the viability of different alignment alternatives and the relative tradeoffs
of each. The committee’s feedback was subsequently incorporated into the final set of proposed routes that were
presented to the public through an online survey and at the second public meeting.
4.1.3. Steering Committee Meeting #3
The third and final steering committee meeting was held on April 13th, 2019 at Statesboro City Hall. At this meeting,
the project team presented results of the second round of public engagement and detail evaluation data, including
ridership and cost estimates, for the proposed service alternatives. Based on the information presented, the
committee identified refinements to the final alternatives. Finally, financial and implementation issues were
discussed, including potential funding sources, hypothetical local funding contributions for capital and operations,
and the steps necessary to begin operations.
May 7, 2019 Page 38
F. Proposal Narrative E. Proposal Narrative
Statesboro Transit Feasibility Study
Final Report
4.2. Stakeholder Interviews
The purpose of the stakeholder interviews was to brief key leaders in the community on the TFS and to gain insight
into their perspectives on transit needs and potential markets and on the desired role of transit in Statesboro and
Bulloch County. The stakeholder interview process was an initial step in the public involvement process for the
feasibility study. It was not intended to be all-inclusive and is not presented here as a representative sampling of
public opinion. However, it does provide important insight into the views of leaders in Statesboro area. In addition,
because the group was relatively small, it was possible to obtain more detailed information than would have been
possible through a much broader attempt to sample public opinion.
4.2.1. Stakeholder Interview List
Stakeholders were initially identified cooperatively by the consultant team and City of Statesboro staff, with some
additions made at the suggestion of stakeholders. The list of interviewees includes public officials, business leaders,
civic leaders, education leaders, and officials of social service organizations. In total, 13 stakeholders were selected
as interview participants for this study. The participants interviewed, along with their title and affiliation, are
identified below:
Jonathan McCollar, Mayor, City of Statesboro
Roy Thompson, Chairman, Bulloch County
Robert L. Whitaker, Vice President for Business and Finance, Georgia Southern University
Lori Durden, President, Ogeechee Technical College
Jessica Williamson, Director of Business Operations, East Georgia College
Allen Muldrew, Executive Director, Downtown Development Authority
Phyllis Thompson, Executive Director, Chamber of Commerce
Diane Hardee, Executive Director, Department of Family and Children’s Services
Alex Smith, Executive Director, Concerted Services
Curtis Woody, Chairman, Statesboro Works Commission
Keith Wilkey, School Social Worker and Homeless Liaison, Bulloch County Schools
Benjy Thompson, Executive Director, Bulloch County Development Authority
Don Masisak, Director of Transportation, Coastal Regional Commission
4.2.2. Summary of Stakeholder Questions and Interview Responses
A list of 13 questions was prepared and used to provide some structure and focus to the interviews. The interview
script and summary of responses by question is provided in Appendix A. An abbreviated summary of findings from
the stakeholder interviews is organized around several key issues:
Is some form of transit needed in the Statesboro area?
How high a priority is transit for the Statesboro area?
Who are the people that most need to be served by transit?
What trip needs and destinations could be served by transit?
What types of transportation options should be considered?
What level of service should be provided?
What should the role of transit in Statesboro be?
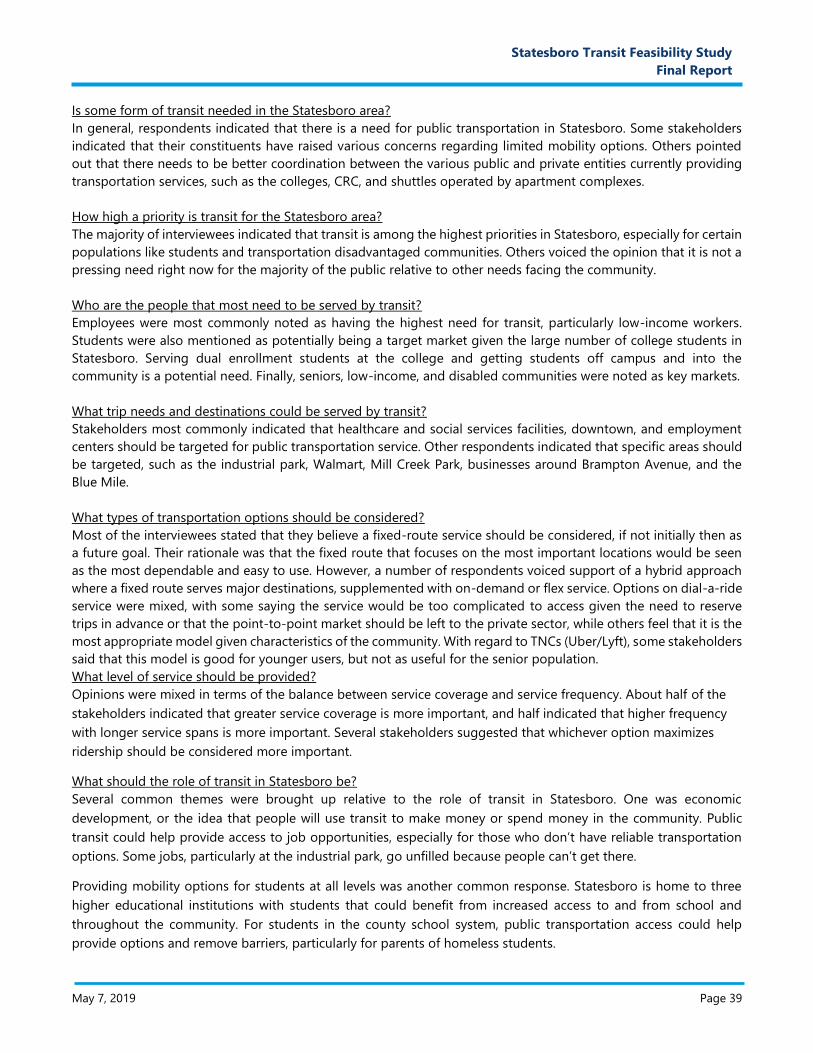
May 7, 2019 Page 39
F. Proposal Narrative E. Proposal Narrative
Statesboro Transit Feasibility Study
Final Report
Is some form of transit needed in the Statesboro area?
In general, respondents indicated that there is a need for public transportation in Statesboro. Some stakeholders
indicated that their constituents have raised various concerns regarding limited mobility options. Others pointed
out that there needs to be better coordination between the various public and private entities currently providing
transportation services, such as the colleges, CRC, and shuttles operated by apartment complexes.
How high a priority is transit for the Statesboro area?
The majority of interviewees indicated that transit is among the highest priorities in Statesboro, especially for certain
populations like students and transportation disadvantaged communities. Others voiced the opinion that it is not a
pressing need right now for the majority of the public relative to other needs facing the community.
Who are the people that most need to be served by transit?
Employees were most commonly noted as having the highest need for transit, particularly low-income workers.
Students were also mentioned as potentially being a target market given the large number of college students in
Statesboro. Serving dual enrollment students at the college and getting students off campus and into the
community is a potential need. Finally, seniors, low-income, and disabled communities were noted as key markets.
What trip needs and destinations could be served by transit?
Stakeholders most commonly indicated that healthcare and social services facilities, downtown, and employment
centers should be targeted for public transportation service. Other respondents indicated that specific areas should
be targeted, such as the industrial park, Walmart, Mill Creek Park, businesses around Brampton Avenue, and the
Blue Mile.
What types of transportation options should be considered?
Most of the interviewees stated that they believe a fixed-route service should be considered, if not initially then as
a future goal. Their rationale was that the fixed route that focuses on the most important locations would be seen
as the most dependable and easy to use. However, a number of respondents voiced support of a hybrid approach
where a fixed route serves major destinations, supplemented with on-demand or flex service. Options on dial-a-ride
service were mixed, with some saying the service would be too complicated to access given the need to reserve
trips in advance or that the point-to-point market should be left to the private sector, while others feel that it is the
most appropriate model given characteristics of the community. With regard to TNCs (Uber/Lyft), some stakeholders
said that this model is good for younger users, but not as useful for the senior population.
What level of service should be provided?
Opinions were mixed in terms of the balance between service coverage and service frequency. About half of the
stakeholders indicated that greater service coverage is more important, and half indicated that higher frequency
with longer service spans is more important. Several stakeholders suggested that whichever option maximizes
ridership should be considered more important.
What should the role of transit in Statesboro be?
Several common themes were brought up relative to the role of transit in Statesboro. One was economic
development, or the idea that people will use transit to make money or spend money in the community. Public
transit could help provide access to job opportunities, especially for those who don’t have reliable transportation
options. Some jobs, particularly at the industrial park, go unfilled because people can’t get there.
Providing mobility options for students at all levels was another common response. Statesboro is home to three
higher educational institutions with students that could benefit from increased access to and from school and
throughout the community. For students in the county school system, public transportation access could help
provide options and remove barriers, particularly for parents of homeless students.
May 7, 2019 Page 40
F. Proposal Narrative E. Proposal Narrative
Statesboro Transit Feasibility Study
Final Report
The most common response was providing mobility to traditionally disadvantaged communities- the low-income,
disabled, and elderly. A critical need is providing options for people to get to essential services like the grocery
store, medical facilities and the health department, and social service facilities. Public transportation could promote
equity and level the playing field for disadvantaged persons.
4.3. Public Surveys
Two public surveys were administered throughout the course of the Transit Feasibility Study. The first survey was
conducted shortly after project kick-off in November 2018 to gather input regarding overall support and goals for
transit in Statesboro and to gain insight into key destinations and travel patterns throughout the community. The
second survey was conducted in February and March 2019 during the service alternative evaluation phase to collect
feedback regarding various potential service options. The results of these surveys are detailed in the following
sections.
4.3.1. Public Survey #1
The first online survey was administered to gather input from the general public and gauge support for a new public
transportation option in Statesboro. Using the online survey platform Survey Monkey, a 21-question public opinion
survey was developed and administered between November 9th and December 18th, 2018. A total of 506 responses
were received, with 454 respondents completing the survey in its entirety for a 90% response rate. The following
sections provide an overview of the survey design and results.
Survey Design
The survey questions covered a range of topics and were developed to gain an understanding of citizens’ current
travel habits, need and support for public transportation in Statesboro, and desired scope an objectives of a
potential transit system. The survey questions are summarized below:
Transit Preferences
1. Have you ever used public transit?
2. Do you think a public transit system is needed in Statesboro?
3. If you think a public transit system is needed, please rank the following in order of importance to you, with
1 being most important.
4. If you were able to use public transit in Statesboro, where would you be going?
5. Which destinations in Statesboro would you most likely use transit services to get to?
6. What aspects of transit service would most influence your decision to use it in Statesboro?
7. If public transit was available in Statesboro, how often do you think you would use it?
Travel Habits / Preferences
8. Which of the following types of transportation do you use most often on a daily basis?
9. How often do you use a ridesharing service such as Uber or Lyft to travel in Statesboro?
10. What is your typical work schedule?
General Demographics
11. What is your age?
12. Are you a college student?
13. Where do you live?
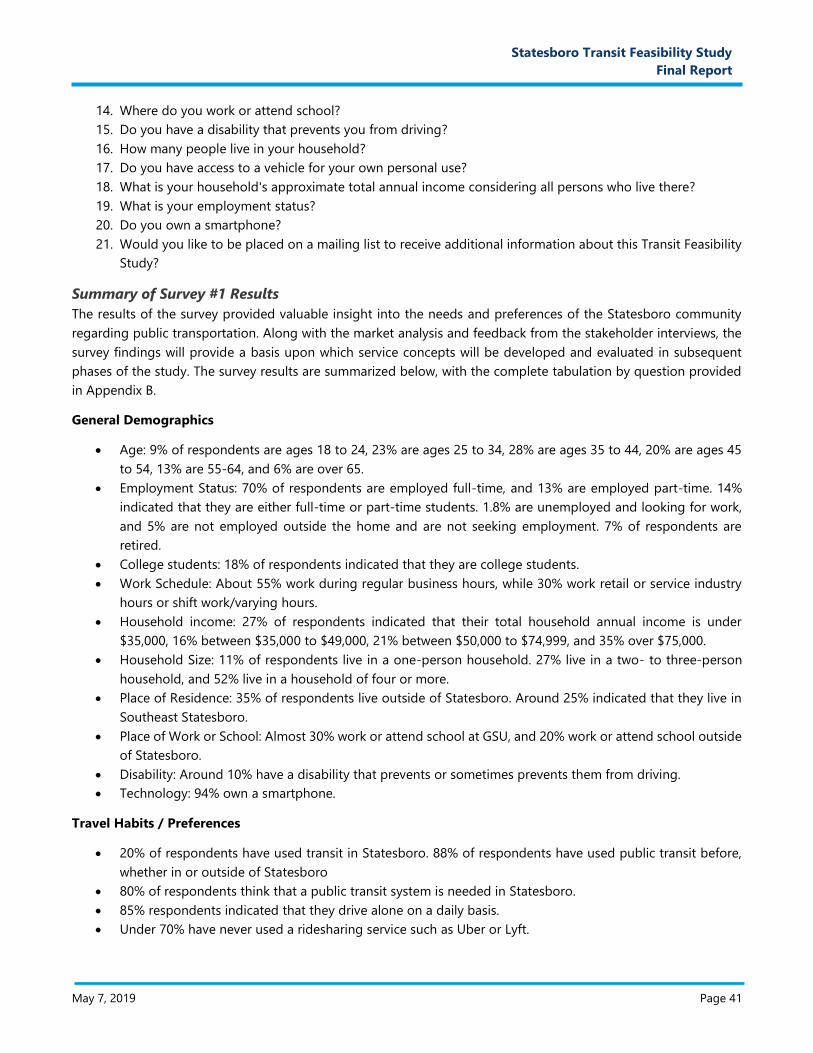
May 7, 2019 Page 41
F. Proposal Narrative E. Proposal Narrative
Statesboro Transit Feasibility Study
Final Report
14. Where do you work or attend school?
15. Do you have a disability that prevents you from driving?
16. How many people live in your household?
17. Do you have access to a vehicle for your own personal use?
18. What is your household's approximate total annual income considering all persons who live there?
19. What is your employment status?
20. Do you own a smartphone?
21. Would you like to be placed on a mailing list to receive additional information about this Transit Feasibility
Study?
Summary of Survey #1 Results
The results of the survey provided valuable insight into the needs and preferences of the Statesboro community
regarding public transportation. Along with the market analysis and feedback from the stakeholder interviews, the
survey findings will provide a basis upon which service concepts will be developed and evaluated in subsequent
phases of the study. The survey results are summarized below, with the complete tabulation by question provided
in Appendix B.
General Demographics
Age: 9% of respondents are ages 18 to 24, 23% are ages 25 to 34, 28% are ages 35 to 44, 20% are ages 45
to 54, 13% are 55-64, and 6% are over 65.
Employment Status: 70% of respondents are employed full-time, and 13% are employed part-time. 14%
indicated that they are either full-time or part-time students. 1.8% are unemployed and looking for work,
and 5% are not employed outside the home and are not seeking employment. 7% of respondents are
retired.
College students: 18% of respondents indicated that they are college students.
Work Schedule: About 55% work during regular business hours, while 30% work retail or service industry
hours or shift work/varying hours.
Household income: 27% of respondents indicated that their total household annual income is under
$35,000, 16% between $35,000 to $49,000, 21% between $50,000 to $74,999, and 35% over $75,000.
Household Size: 11% of respondents live in a one-person household. 27% live in a two- to three-person
household, and 52% live in a household of four or more.
Place of Residence: 35% of respondents live outside of Statesboro. Around 25% indicated that they live in
Southeast Statesboro.
Place of Work or School: Almost 30% work or attend school at GSU, and 20% work or attend school outside
of Statesboro.
Disability: Around 10% have a disability that prevents or sometimes prevents them from driving.
Technology: 94% own a smartphone.
Travel Habits / Preferences
20% of respondents have used transit in Statesboro. 88% of respondents have used public transit before,
whether in or outside of Statesboro
80% of respondents think that a public transit system is needed in Statesboro.
85% respondents indicated that they drive alone on a daily basis.
Under 70% have never used a ridesharing service such as Uber or Lyft.
May 7, 2019 Page 42
F. Proposal Narrative E. Proposal Narrative
Statesboro Transit Feasibility Study
Final Report
90% of respondents indicated that they have access to a vehicle for personal use that they either own or
share with someone in their household. Around 3% have a vehicle they can borrow and 7% do not own a
vehicle.
Transit Preferences
Respondents most frequently indicated that they would use public transit for social/entertainment or
recreational events and work/work-related activities.
Almost 30% indicated that they would use transit 1-3 days per week, and more than 20% indicated they
would use it 4 or more days per week. Over 20% indicated that they would not use transit.
Overall, respondents consider equity to be the most important for a public transit system.
Overall, respondents indicated that service coverage would most influence their decision to use transit in
Statesboro.
4.3.2. Public Survey #2
The second public survey was administered between February 18th, 2019 and March 24th, 2019. A total of 500
responses were collected through the online survey instrument through Survey Monkey. The survey was advertised
on the City website, through the City’s social media channels, and via email to the project distribution list. Various
print and TV news outlets including the Statesboro Herald distributed information regarding the survey. The survey
questions and results are summarized below.
Survey Design
The second survey was intended to gather feedback regarding various route options that were proposed by the
project team as part of the alternative development phase of the study. Respondents were asked to rank various
network and individual route concepts and provide open-ended comments to aide in the refinement of alternatives
and ultimate selection of a preferred alternative. Other questions were asked concerning service policy issues such
as service span, frequency, and fares. The survey questions included the following:
Network Concepts
1. Based on the three concepts presented above, which route network would be most useful to you or people
you know? Please rank in order of most useful to least useful, with 1 being most useful.
Concept A Route Preferences
2. Based on the routes presented above, which would be most useful to you or people you know? Please rank
in order of most useful to least useful, with 1 being most useful.
3. Do you have any comments to help us improve one or more of these routes?
Concept B Route Preferences
4. Based on the routes presented above, which would be most useful to you or people you know? Please rank
in order of most useful to least useful, with 1 being most useful.
5. Do you have any comments to help us improve one or more of these routes?
Bus Fares
6. If one or more of these routes were implemented, would you be willing to pay to use the service?
May 7, 2019 Page 43
F. Proposal Narrative E. Proposal Narrative
Statesboro Transit Feasibility Study
Final Report
7. If you are willing to pay a fare to use the service, what is the maximum fare you would be willing to pay for
a one-way trip?
Transit Service Funding
8. If one or more of these routes were implemented, would you be willing to pay for an increase in taxes to
fund the service?
Flex-Route Service and Fares
9. Would you be more willing to use one or more of these routes if they were operated as “flex” routes?
10. Would you be willing to pay more for a flex service?
11. How much would you be willing to pay for a one-way flex service trip?
General Service Preferences
12. How often would the bus need to arrive for this service to be useful to you?
13. What hours would the bus need to run in order to be useful to you during a typical weekday?
General Demographics
14. Do you live in Statesboro?
15. What is your age?
16. How many people live in your household?
17. Do you have access to a vehicle for your own personal use?
18. What is your household's approximate total annual income considering all persons who live there?
19. Are you a college student?
20. Please provide any other general comments regarding the transit feasibility study.
Summary of Survey #2 Results
The results of the second survey are summarized below. A complete breakdown of results for each question is
provided in Appendix C.
General Demographics
Compared to the first survey, respondents to the second survey tended to be younger, with a much higher response
rate from college students, particularly from GSU. Accordingly, the income distribution tended to skew lower
compared to the first survey. Specifically,
85% of respondents live in Statesboro
More than 50% are age 18-24
78% live in households of 2 or more.
21% do not have access to a vehicle.
60% have a household income less than $35k/year
59% college students (55% GSU Students)
Route Preferences
Questions concerning the network and route concepts yielded insights into community preferences for specific
route alignments. Respondents were asked to rank the individual routes within each concept from 1 to 4, with 1
being the most useful and 4 being the least useful. As shown in Table 4-1, in terms of individual routes, the North-
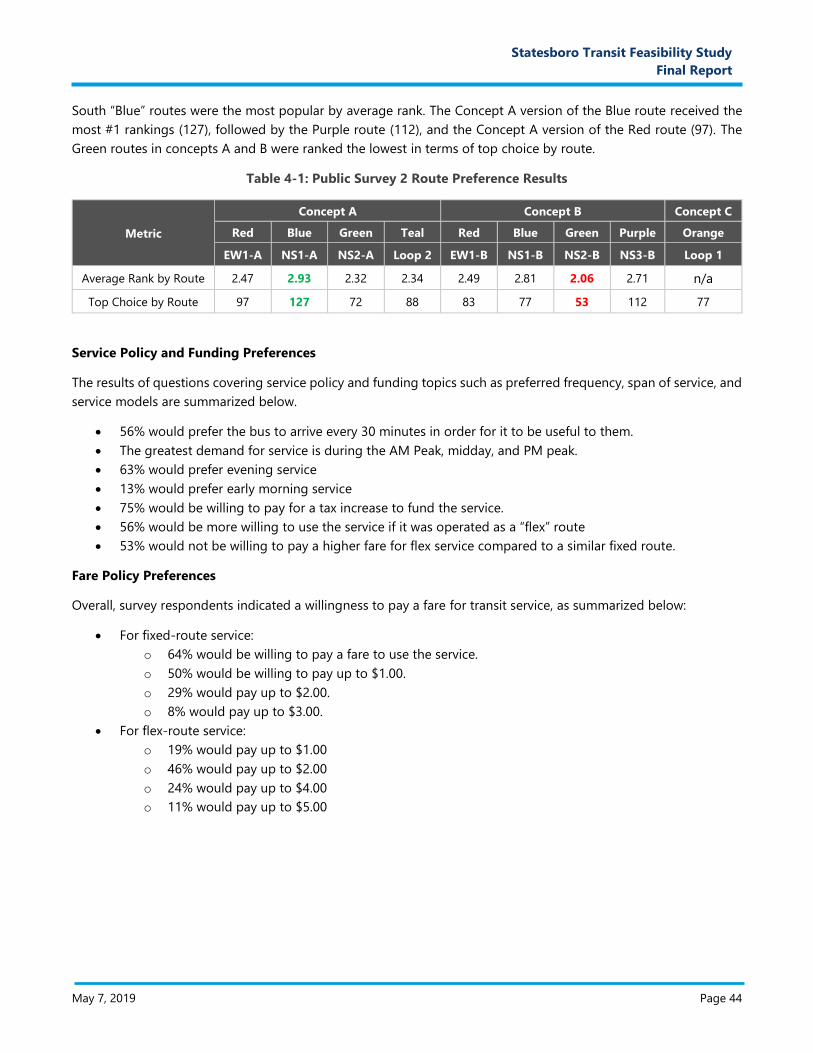
May 7, 2019 Page 44
F. Proposal Narrative E. Proposal Narrative
Statesboro Transit Feasibility Study
Final Report
South “Blue” routes were the most popular by average rank. The Concept A version of the Blue route received the
most #1 rankings (127), followed by the Purple route (112), and the Concept A version of the Red route (97). The
Green routes in concepts A and B were ranked the lowest in terms of top choice by route.
Table 4-1: Public Survey 2 Route Preference Results
Metric
Concept A Concept B Concept C
Red Blue Green Teal Red Blue Green Purple Orange
EW1-A NS1-A NS2-A Loop 2 EW1-B NS1-B NS2-B NS3-B Loop 1
Average Rank by Route 2.47 2.93 2.32 2.34 2.49 2.81 2.06 2.71 n/a
Top Choice by Route 97 127 72 88 83 77 53 112 77
Service Policy and Funding Preferences
The results of questions covering service policy and funding topics such as preferred frequency, span of service, and
service models are summarized below.
56% would prefer the bus to arrive every 30 minutes in order for it to be useful to them.
The greatest demand for service is during the AM Peak, midday, and PM peak.
63% would prefer evening service
13% would prefer early morning service
75% would be willing to pay for a tax increase to fund the service.
56% would be more willing to use the service if it was operated as a “flex” route
53% would not be willing to pay a higher fare for flex service compared to a similar fixed route.
Fare Policy Preferences
Overall, survey respondents indicated a willingness to pay a fare for transit service, as summarized below:
For fixed-route service:
o 64% would be willing to pay a fare to use the service.
o 50% would be willing to pay up to $1.00.
o 29% would pay up to $2.00.
o 8% would pay up to $3.00.
For flex-route service:
o 19% would pay up to $1.00
o 46% would pay up to $2.00
o 24% would pay up to $4.00
o 11% would pay up to $5.00
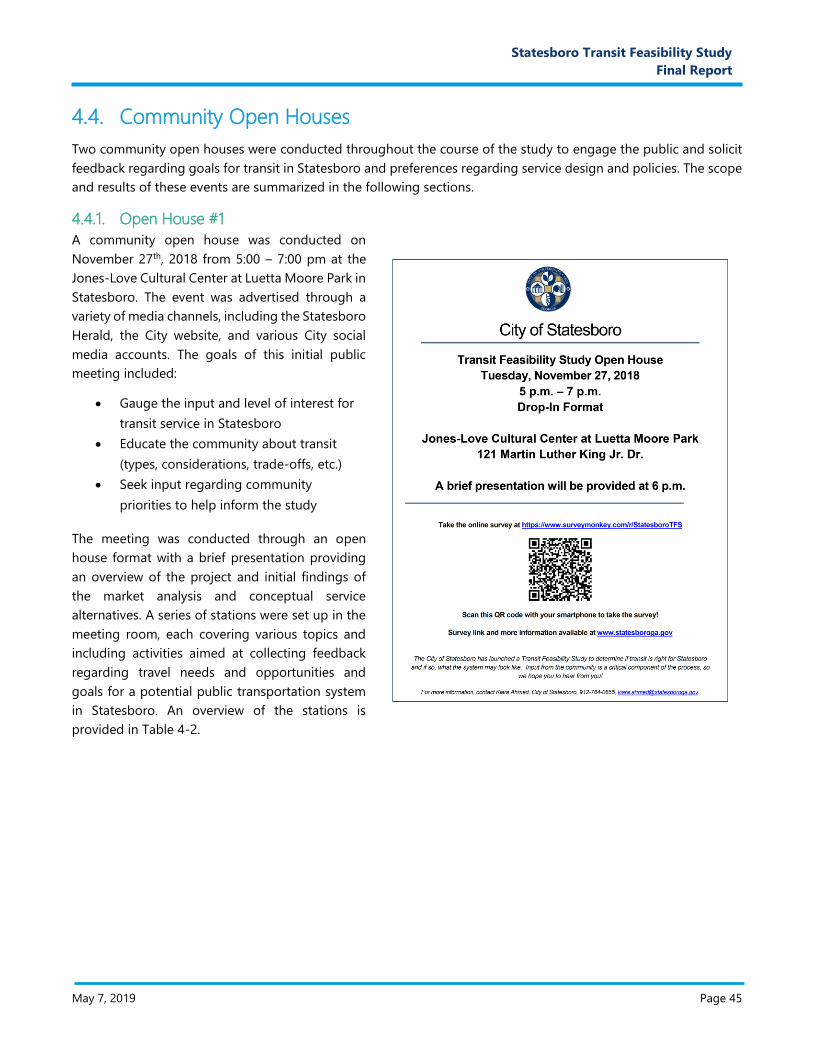
May 7, 2019 Page 45
F. Proposal Narrative E. Proposal Narrative
Statesboro Transit Feasibility Study
Final Report
4.4. Community Open Houses
Two community open houses were conducted throughout the course of the study to engage the public and solicit
feedback regarding goals for transit in Statesboro and preferences regarding service design and policies. The scope
and results of these events are summarized in the following sections.
4.4.1. Open House #1
A community open house was conducted on
November 27th, 2018 from 5:00 – 7:00 pm at the
Jones-Love Cultural Center at Luetta Moore Park in
Statesboro. The event was advertised through a
variety of media channels, including the Statesboro
Herald, the City website, and various City social
media accounts. The goals of this initial public
meeting included:
Gauge the input and level of interest for
transit service in Statesboro
Educate the community about transit
(types, considerations, trade-offs, etc.)
Seek input regarding community
priorities to help inform the study
The meeting was conducted through an open
house format with a brief presentation providing
an overview of the project and initial findings of
the market analysis and conceptual service
alternatives. A series of stations were set up in the
meeting room, each covering various topics and
including activities aimed at collecting feedback
regarding travel needs and opportunities and
goals for a potential public transportation system
in Statesboro. An overview of the stations is
provided in Table 4-2.
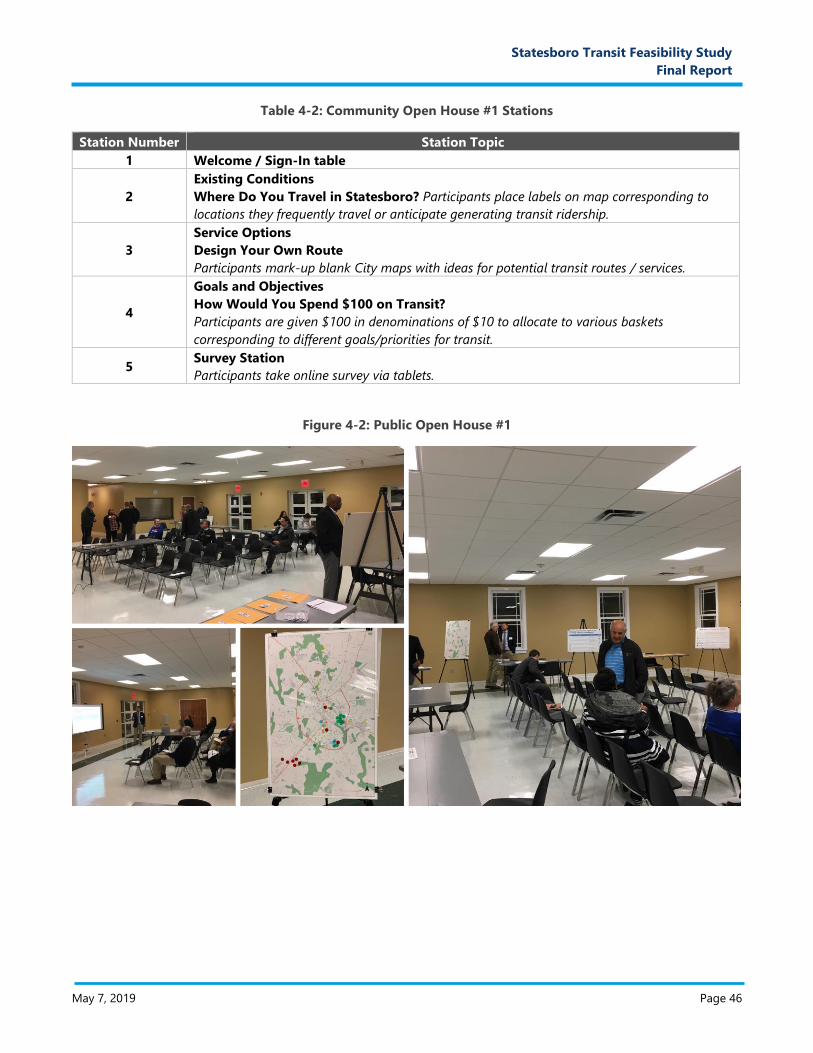
May 7, 2019 Page 46
F. Proposal Narrative E. Proposal Narrative
Statesboro Transit Feasibility Study
Final Report
Table 4-2: Community Open House #1 Stations
Station Number Station Topic
1 Welcome / Sign-In table
2
Existing Conditions
Where Do You Travel in Statesboro? Participants place labels on map corresponding to
locations they frequently travel or anticipate generating transit ridership.
3
Service Options
Design Your Own Route
Participants mark-up blank City maps with ideas for potential transit routes / services.
4
Goals and Objectives
How Would You Spend $100 on Transit?
Participants are given $100 in denominations of $10 to allocate to various baskets
corresponding to different goals/priorities for transit.
5 Survey Station
Participants take online survey via tablets.
Figure 4-2: Public Open House #1
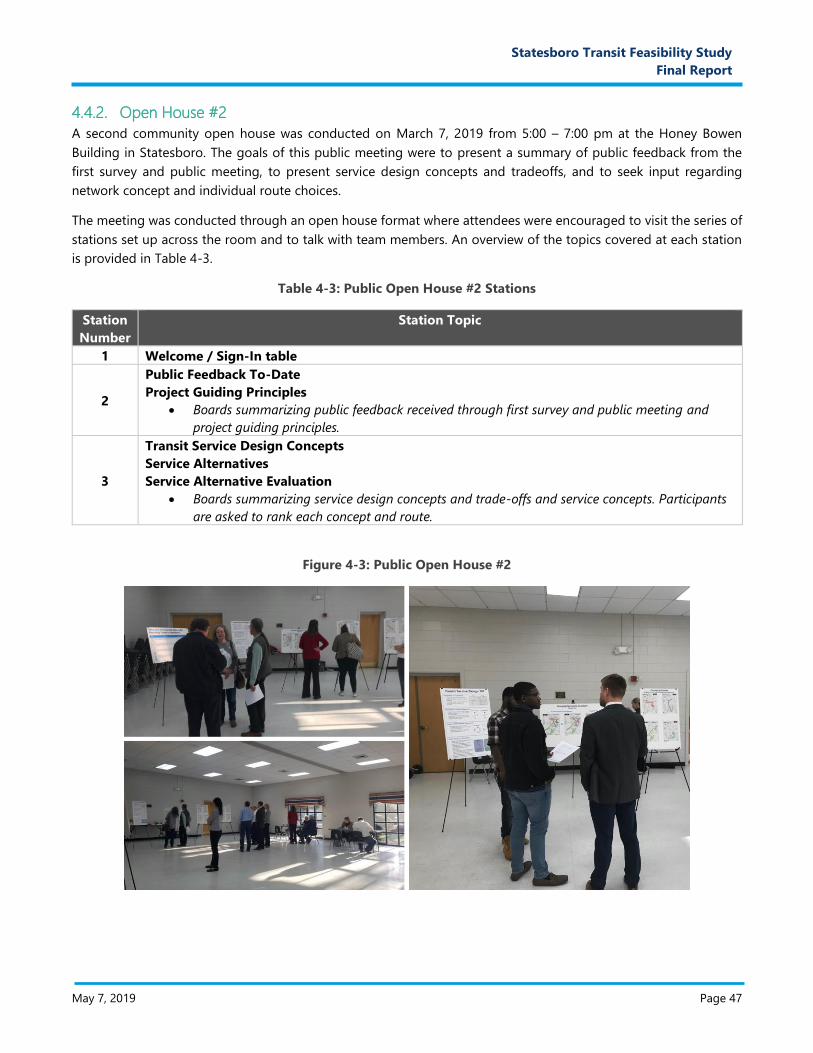
May 7, 2019 Page 47
F. Proposal Narrative E. Proposal Narrative
Statesboro Transit Feasibility Study
Final Report
4.4.2. Open House #2
A second community open house was conducted on March 7, 2019 from 5:00 – 7:00 pm at the Honey Bowen
Building in Statesboro. The goals of this public meeting were to present a summary of public feedback from the
first survey and public meeting, to present service design concepts and tradeoffs, and to seek input regarding
network concept and individual route choices.
The meeting was conducted through an open house format where attendees were encouraged to visit the series of
stations set up across the room and to talk with team members. An overview of the topics covered at each station
is provided in Table 4-3.
Table 4-3: Public Open House #2 Stations
Station
Number
Station Topic
1 Welcome / Sign-In table
2
Public Feedback To-Date
Project Guiding Principles
Boards summarizing public feedback received through first survey and public meeting and
project guiding principles.
3
Transit Service Design Concepts
Service Alternatives
Service Alternative Evaluation
Boards summarizing service design concepts and trade-offs and service concepts. Participants
are asked to rank each concept and route.
Figure 4-3: Public Open House #2

May 7, 2019 Page 48
H. Prop
osal
Narra
tive
G. Prop
osal
Narra
tive
Statesboro Transit Feasibility Study
Final Report
At the final station, attendees were asked to rank each potential route and network concept. The results of these
rankings are shown in Table 4-4.
Table 4-4: Public Open House #2: Route Preference Results
Metric
Concept A Concept B Concept C
Red Blue Green Teal Red Blue Green Purple Orange
EW1-
A
NS1-
A
NS2-
A
Loop
2
EW1-
B
NS1-
B
NS2-
B NS3-B Loop 1
Average Rank by Route 3.14 2.93 2.47 1.40 3.33 2.38 2.23 2.23 n/a
Top Choice by Route 8 5 1 0 7 4 1 1 13
Each attendee also had the opportunity to complete a comment card to provide feedback on each network concept,
individual route concepts, service span and frequency, fares, and flex service. A summary of feedback regarding
each route is provided in Appendix D and service-policy related feedback is summarized below.
All attendees indicated they would be willing to pay a fare for the service
90% would be willing to pay $1.00 or more
All attendees indicated they would be willing to pay for an increase in taxes to fund the service
Half of attendees indicated they would be more willing to use the service if it was a “flex” service, and most
would be willing to pay a higher fare for this flexibility.
The majority of attendees would prefer the bus to operate during normal working hours and arrive at least
twice an hour for it to be useful to them
May 7, 2019 Page 49
H. Prop
osal
Narra
tive
G. Prop
osal
Narra
tive
Statesboro Transit Feasibility Study
Final Report
5. Purpose and Needs Assessment, Goals, and
Objectives This section documents the purpose and need of a potential public transportation investment in the City of
Statesboro. The purpose and need statement frames the transportation challenges that need to be addressed and
serves as a cornerstone for the development and evaluation of alternatives.
5.1. Purpose
The purpose of a public transportation investment in Statesboro is to address the current and future mobility needs
of the community, especially for those who lack access to reliable transportation options. Public transportation was
identified in the 2009 Bulloch County / City of Statesboro 2035 Long-Range Transportation Plan (LRTP) and 2014
City of Statesboro Comprehensive Plan as a potential strategy to address growing mobility needs in Statesboro.
5.2. Needs Assessment
Through the market analysis and public and stakeholder engagement conducted during Phase 1 of this study, the
following themes emerged that reinforce the need for a public transportation investment in Statesboro:
Rapid Population and Employment Growth
Large Transportation Disadvantaged Population
Lack of Mobility Options Available to General Public and Low Existing Transit Utilization
Access to Employment and Activity Centers
Inter-Campus and Campus-Community Connectivity
Public Support for Transit
These themes are explored in greater detail in the following sections.
5.2.1. Rapid Population and Employment Growth
The need for expanded mobility options is being driven by the rapid population and employment growth that has
occurred across the region in recent years. Since 2000, Bulloch County’s population has increased 36%, adding more
than 20,000 residents, with 43% of that growth occurring in Statesboro alone. The most recent U.S. Census
population estimates for 2017 indicate that Bulloch County has already exceeded its 2020 growth forecast
documented in the 2009 LRTP. Likewise, Statesboro has also exceeded its 2020 forecasted population established
in the 2009 Comprehensive Plan and is on pace to eclipse its 2030 forecast within the next several years.
Employment has also grown substantially, with over 3,000 jobs added in Bulloch County between 2006 and 2015, a
14% increase. Employment growth has also been heavily concentrated in Statesboro, with nearly 84% of new county
jobs added within the city.
This growth is anticipated to continue into the future. According to updated forecasts cited in the Coastal Regional
Commission’s (CRC) 2015 Regional Assessment of Coastal Georgia, Bulloch County’s population is expected to grow
to 88,000 in 2020 and to nearly 110,000 in 2030. This equates to an increase of 16% and 44%, respectively, over
Bulloch County’s 2017 population. Assuming past development trends continue with 40-50% of the total future
county growth occurring in Statesboro, the city can expect to add an additional 4,500 to 6,000 residents by 2020,
and 13,500 to 17,000 residents by 2030. As the City of Statesboro continues to add new residents and jobs in the
May 7, 2019 Page 50
H. Prop
osal
Narra
tive
G. Prop
osal
Narra
tive
Statesboro Transit Feasibility Study
Final Report
coming years, investments in transportation infrastructure and services will be required to manage the
accompanying demand for travel.
5.2.2. Large Transportation Disadvantaged Population
Findings from the transit market analysis, public survey, and stakeholder interviews indicate that a large segment of
the Statesboro population is transportation disadvantaged due to financial or physical limitations. The market
analysis indicated that more than 6,500 households with annual incomes below $35,000 are located in areas with
high levels of transit propensity and sufficient density to support scheduled transit service, and 1,000 of these
households do not have access to a vehicle. These areas also include 2,200 seniors, nearly 20,000 school and college-
age students, and 3,000 disabled individuals. In terms of employment, areas of highest transit potential in Statesboro
encompass nearly 18,000 total jobs. More than 5,000 of those jobs are in the retail and service sectors, and more
than 6,000 are low-wage jobs. These figures represent a market segment that is potentially underserved by the
existing public transportation services.
5.2.3. Lack of Mobility Options Available to General Public and Low Existing Transit Utilization
Existing ridership on the Coastal Regional Coaches (CRC) demand-response service in Bulloch County is relatively
low, totaling about 10,000 one-way trips in FY2016, or about 40 trips per average weekday. In terms of service
consumed by the general public in Bulloch County, this equates to about 0.13 annual passenger trips per capita,
which is roughly half the rate reported by all demand response operators in Georgia in 2017 and one-third of the
rate reported by all demand response operators located in the southeastern United States with service area
populations less than 100,000 residents.1
Given the magnitude of the transportation disadvantaged population in Statesboro, this relatively low transit
utilization rate may represent untapped demand. This notion is supported by results from the public survey
conducted during the first phase of this study, in which nearly 90% of respondents indicated that they have used
transit in other cities, but only 20% have used transit in Statesboro. The lack of transit usage among the general
public in Bulloch County can likely be attributed to a number of factors, including a lack of awareness or
understanding of how to use the CRC service; scheduling, cost, or reliability concerns; or a poor perception of public
transportation. Evidence from similar-size cities across the southeast indicates that providing a reliable alternative
may reveal latent demand for transit in Statesboro. Of all cities that provide fixed or flex-route bus service, the
average per capita annual ridership is more than 10.2 While factors such as service levels influence total ridership
demand, this figure provides a general indication of typical service consumption in similar-size communities to
Statesboro.
5.2.4. Access to Employment and Activity Centers
Providing access to jobs, education, shopping, and essential services is a key function of public transportation. Data
reported by CRC for FY2016 indicates that only 8% of its daily passenger trips served in Bulloch County were for
employment purposes, or less than four trips per day. While more than 50% of its daily trips provided were for
educational, medical, shopping, or nutrition purposes, these only account for about 22 trips served per day. Given
the population and employment growth in Statesboro, there is a need to ensure that reliable transportation
alternatives are available to provide all residents the opportunity to access employment, shopping, and medical and
1 As reported by “Full Reporters” to the National Transit Database (NTD). Small and rural agencies are not required to submit full
reports inclusive of service area population data. 2 Based on data reported to NTD for all transit systems located in southeastern U.S. cities with service area population between
20,000 and 40,000 residents.
May 7, 2019 Page 51
H. Prop
osal
Narra
tive
G. Prop
osal
Narra
tive
Statesboro Transit Feasibility Study
Final Report
social services. This need was commonly cited by stakeholders and the public alike during the initial phase of
engagement. Moreover, several stakeholders framed the need for improved access to jobs and shopping
opportunities in terms of promoting economic development throughout the community.
5.2.5. Inter-Campus and Campus-Community Connectivity
Interviews with stakeholders and findings from the public survey revealed a need to provide better connectivity
between the three college campuses in Statesboro, as well as between those campuses and retail centers. While
EGSC currently provides a shuttle linking the three campuses and GSU provides circulators on its campus, these
services are limited to students and faculty and do not provide connectivity to the broader community. Given that
GSU’s Southern Express service carries more than 1.5 million passengers per year, this well-established market
segment may be inclined to use an expanded transit service to access off-campus retail and services, especially
those students who may not have access to a vehicle.
5.2.6. Public Support for Transit
Despite low existing transit ridership outside of GSU’s campus-oriented service, the public survey indicated
significant public support for transit. Approximately 80% of survey respondents indicated that transit is needed in
Statesboro. Based on the survey, the public’s goals for transit are oriented towards promoting equity and serving
transportation disadvantaged populations. This sentiment is consistent with the findings of the market analysis that
suggest the market for transit in Statesboro will largely be driven by the transportation disadvantaged community.
Moreover, previous plans, including the 2009 LRTP and 2014 Comprehensive Plan update, cited public and
stakeholder support for exploring expanded transit options.
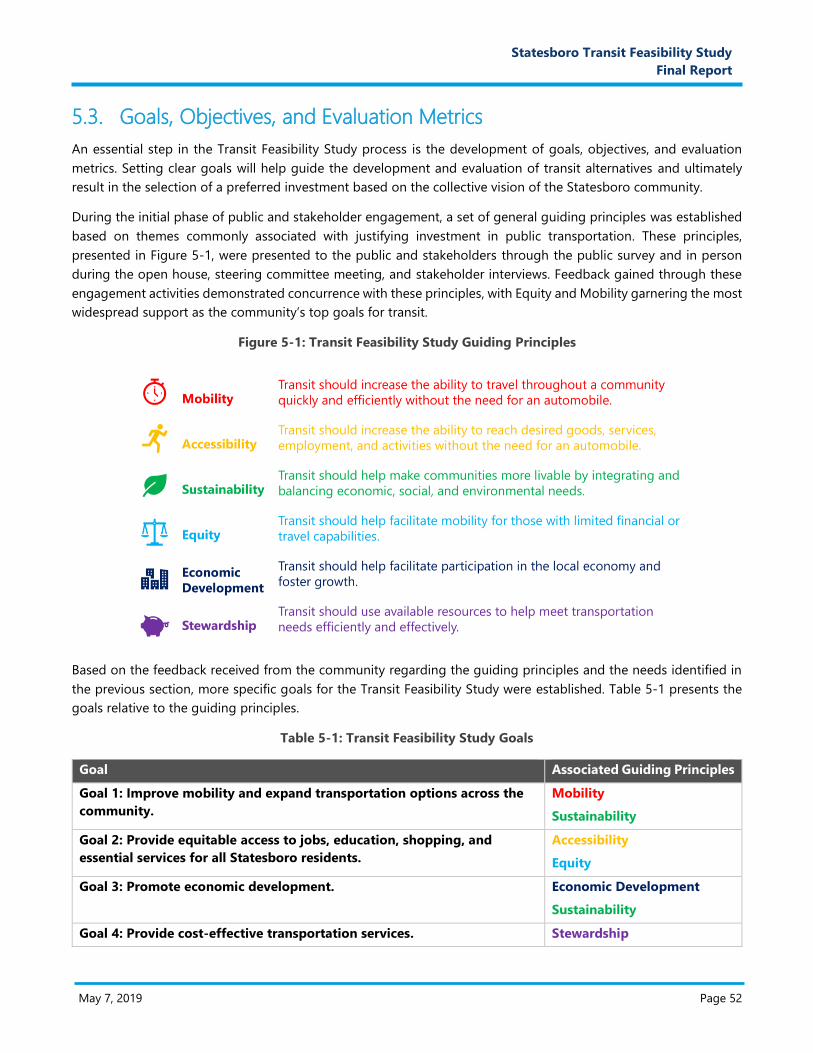
May 7, 2019 Page 52
H. Prop
osal
Narra
tive
G. Prop
osal
Narra
tive
Statesboro Transit Feasibility Study
Final Report
5.3. Goals, Objectives, and Evaluation Metrics
An essential step in the Transit Feasibility Study process is the development of goals, objectives, and evaluation
metrics. Setting clear goals will help guide the development and evaluation of transit alternatives and ultimately
result in the selection of a preferred investment based on the collective vision of the Statesboro community.
During the initial phase of public and stakeholder engagement, a set of general guiding principles was established
based on themes commonly associated with justifying investment in public transportation. These principles,
presented in Figure 5-1, were presented to the public and stakeholders through the public survey and in person
during the open house, steering committee meeting, and stakeholder interviews. Feedback gained through these
engagement activities demonstrated concurrence with these principles, with Equity and Mobility garnering the most
widespread support as the community’s top goals for transit.
Figure 5-1: Transit Feasibility Study Guiding Principles
Based on the feedback received from the community regarding the guiding principles and the needs identified in
the previous section, more specific goals for the Transit Feasibility Study were established. Table 5-1 presents the
goals relative to the guiding principles.
Table 5-1: Transit Feasibility Study Goals
Goal Associated Guiding Principles
Goal 1: Improve mobility and expand transportation options across the
community.
Mobility
Sustainability
Goal 2: Provide equitable access to jobs, education, shopping, and
essential services for all Statesboro residents.
Accessibility
Equity
Goal 3: Promote economic development. Economic Development
Sustainability
Goal 4: Provide cost-effective transportation services. Stewardship
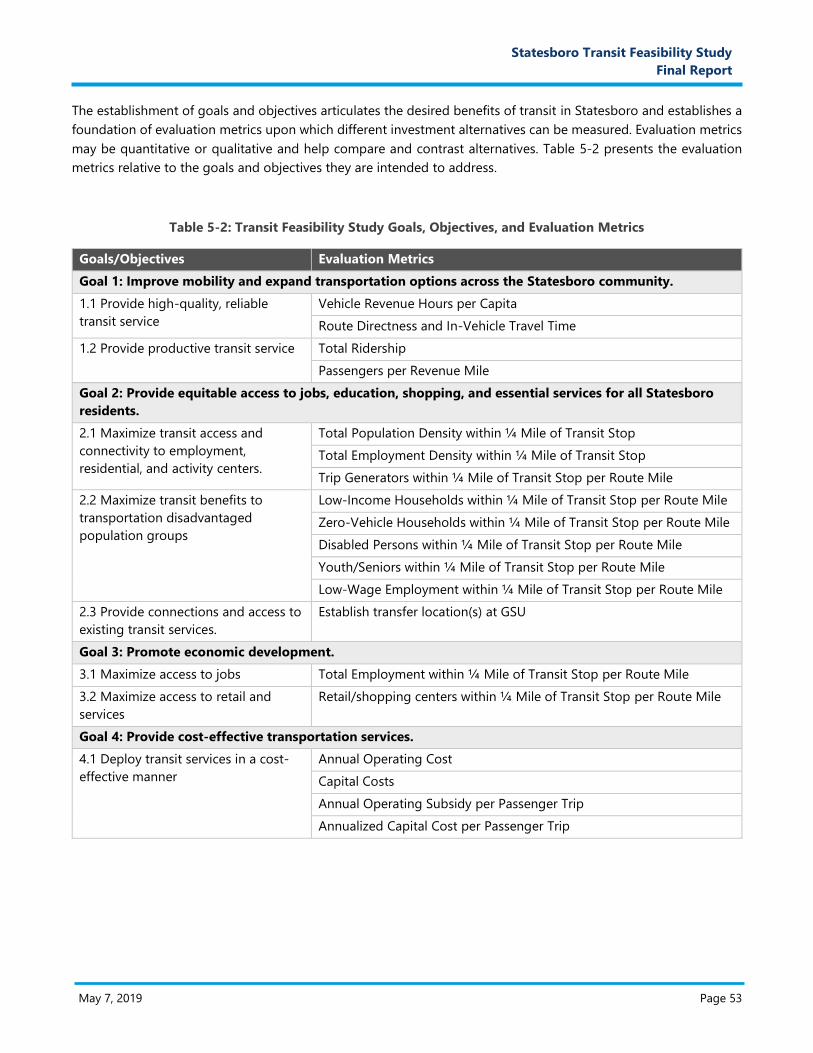
May 7, 2019 Page 53
H. Prop
osal
Narra
tive
G. Prop
osal
Narra
tive
Statesboro Transit Feasibility Study
Final Report
The establishment of goals and objectives articulates the desired benefits of transit in Statesboro and establishes a
foundation of evaluation metrics upon which different investment alternatives can be measured. Evaluation metrics
may be quantitative or qualitative and help compare and contrast alternatives. Table 5-2 presents the evaluation
metrics relative to the goals and objectives they are intended to address.
Table 5-2: Transit Feasibility Study Goals, Objectives, and Evaluation Metrics
Goals/Objectives Evaluation Metrics
Goal 1: Improve mobility and expand transportation options across the Statesboro community.
1.1 Provide high-quality, reliable
transit service
Vehicle Revenue Hours per Capita
Route Directness and In-Vehicle Travel Time
1.2 Provide productive transit service Total Ridership
Passengers per Revenue Mile
Goal 2: Provide equitable access to jobs, education, shopping, and essential services for all Statesboro
residents.
2.1 Maximize transit access and
connectivity to employment,
residential, and activity centers.
Total Population Density within ¼ Mile of Transit Stop
Total Employment Density within ¼ Mile of Transit Stop
Trip Generators within ¼ Mile of Transit Stop per Route Mile
2.2 Maximize transit benefits to
transportation disadvantaged
population groups
Low-Income Households within ¼ Mile of Transit Stop per Route Mile
Zero-Vehicle Households within ¼ Mile of Transit Stop per Route Mile
Disabled Persons within ¼ Mile of Transit Stop per Route Mile
Youth/Seniors within ¼ Mile of Transit Stop per Route Mile
Low-Wage Employment within ¼ Mile of Transit Stop per Route Mile
2.3 Provide connections and access to
existing transit services.
Establish transfer location(s) at GSU
Goal 3: Promote economic development.
3.1 Maximize access to jobs Total Employment within ¼ Mile of Transit Stop per Route Mile
3.2 Maximize access to retail and
services
Retail/shopping centers within ¼ Mile of Transit Stop per Route Mile
Goal 4: Provide cost-effective transportation services.
4.1 Deploy transit services in a cost-
effective manner
Annual Operating Cost
Capital Costs
Annual Operating Subsidy per Passenger Trip
Annualized Capital Cost per Passenger Trip
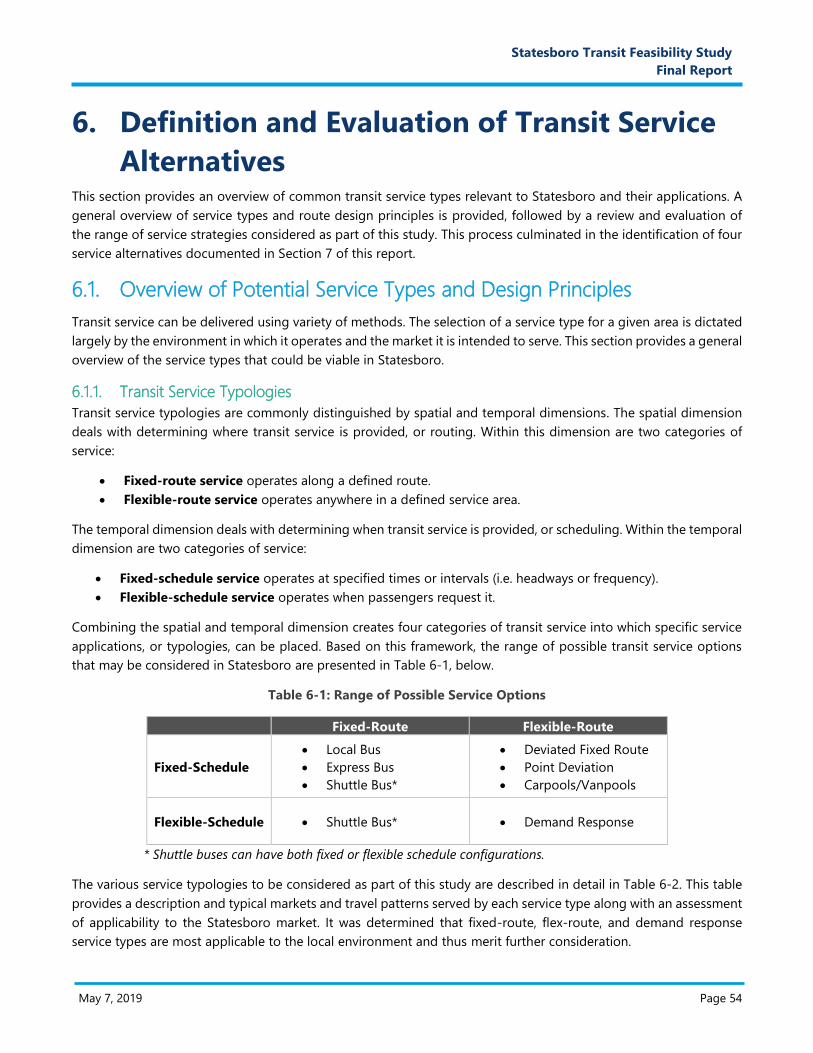
May 7, 2019 Page 54
H. Prop
osal
Narra
tive
G. Prop
osal
Narra
tive
Statesboro Transit Feasibility Study
Final Report
6. Definition and Evaluation of Transit Service
Alternatives This section provides an overview of common transit service types relevant to Statesboro and their applications. A
general overview of service types and route design principles is provided, followed by a review and evaluation of
the range of service strategies considered as part of this study. This process culminated in the identification of four
service alternatives documented in Section 7 of this report.
6.1. Overview of Potential Service Types and Design Principles
Transit service can be delivered using variety of methods. The selection of a service type for a given area is dictated
largely by the environment in which it operates and the market it is intended to serve. This section provides a general
overview of the service types that could be viable in Statesboro.
6.1.1. Transit Service Typologies
Transit service typologies are commonly distinguished by spatial and temporal dimensions. The spatial dimension
deals with determining where transit service is provided, or routing. Within this dimension are two categories of
service:
Fixed-route service operates along a defined route.
Flexible-route service operates anywhere in a defined service area.
The temporal dimension deals with determining when transit service is provided, or scheduling. Within the temporal
dimension are two categories of service:
Fixed-schedule service operates at specified times or intervals (i.e. headways or frequency).
Flexible-schedule service operates when passengers request it.
Combining the spatial and temporal dimension creates four categories of transit service into which specific service
applications, or typologies, can be placed. Based on this framework, the range of possible transit service options
that may be considered in Statesboro are presented in Table 6-1, below.
Table 6-1: Range of Possible Service Options
Fixed-Route Flexible-Route
Fixed-Schedule
Local Bus
Express Bus
Shuttle Bus*
Deviated Fixed Route
Point Deviation
Carpools/Vanpools
Flexible-Schedule Shuttle Bus* Demand Response
* Shuttle buses can have both fixed or flexible schedule configurations.
The various service typologies to be considered as part of this study are described in detail in Table 6-2. This table
provides a description and typical markets and travel patterns served by each service type along with an assessment
of applicability to the Statesboro market. It was determined that fixed-route, flex-route, and demand response
service types are most applicable to the local environment and thus merit further consideration.
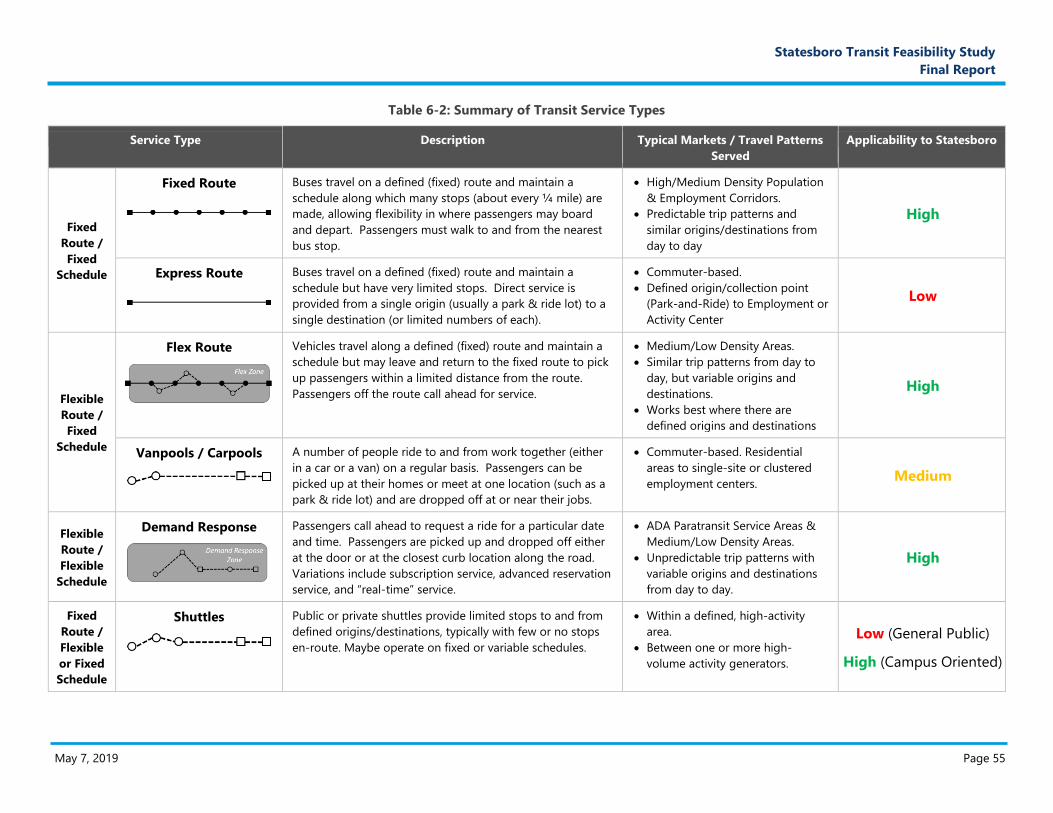
May 7, 2019 Page 55
I. Prop
osal
Narra
tive
Statesboro Transit Feasibility Study
Final Report
Table 6-2: Summary of Transit Service Types
Service Type Description Typical Markets / Travel Patterns
Served
Applicability to Statesboro
Fixed
Route /
Fixed
Schedule
Fixed Route
Buses travel on a defined (fixed) route and maintain a
schedule along which many stops (about every ¼ mile) are
made, allowing flexibility in where passengers may board
and depart. Passengers must walk to and from the nearest
bus stop.
High/Medium Density Population
& Employment Corridors.
Predictable trip patterns and
similar origins/destinations from
day to day
High
Express Route
Buses travel on a defined (fixed) route and maintain a
schedule but have very limited stops. Direct service is
provided from a single origin (usually a park & ride lot) to a
single destination (or limited numbers of each).
Commuter-based.
Defined origin/collection point
(Park-and-Ride) to Employment or
Activity Center
Low
Flexible
Route /
Fixed
Schedule
Flex Route
Vehicles travel along a defined (fixed) route and maintain a
schedule but may leave and return to the fixed route to pick
up passengers within a limited distance from the route.
Passengers off the route call ahead for service.
Medium/Low Density Areas.
Similar trip patterns from day to
day, but variable origins and
destinations.
Works best where there are
defined origins and destinations
High
Vanpools / Carpools
A number of people ride to and from work together (either
in a car or a van) on a regular basis. Passengers can be
picked up at their homes or meet at one location (such as a
park & ride lot) and are dropped off at or near their jobs.
Commuter-based. Residential
areas to single-site or clustered
employment centers. Medium
Flexible
Route /
Flexible
Schedule
Demand Response
Passengers call ahead to request a ride for a particular date
and time. Passengers are picked up and dropped off either
at the door or at the closest curb location along the road.
Variations include subscription service, advanced reservation
service, and “real-time” service.
ADA Paratransit Service Areas &
Medium/Low Density Areas.
Unpredictable trip patterns with
variable origins and destinations
from day to day.
High
Fixed
Route /
Flexible
or Fixed
Schedule
Shuttles
Public or private shuttles provide limited stops to and from
defined origins/destinations, typically with few or no stops
en-route. Maybe operate on fixed or variable schedules.
Within a defined, high-activity
area.
Between one or more high-
volume activity generators.
Low (General Public)
High (Campus Oriented)
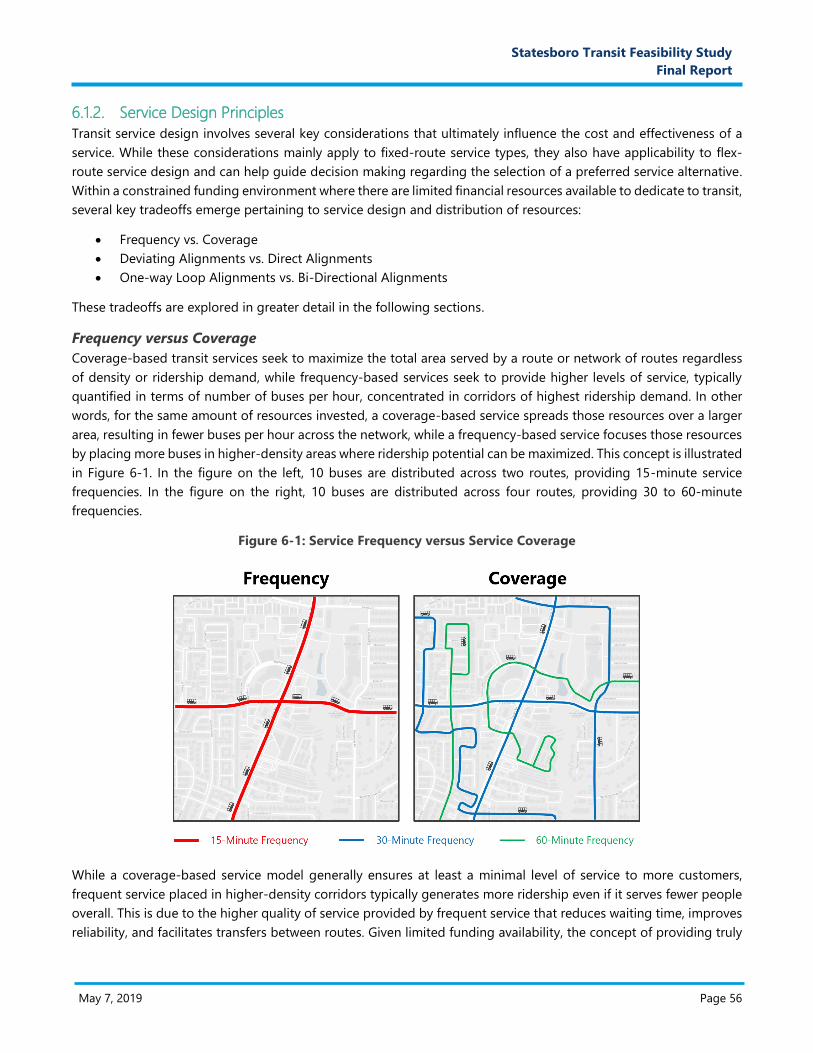
May 7, 2019 Page 56
J. Prop
osal
Narra
tive
Statesboro Transit Feasibility Study
Final Report
6.1.2. Service Design Principles
Transit service design involves several key considerations that ultimately influence the cost and effectiveness of a
service. While these considerations mainly apply to fixed-route service types, they also have applicability to flex-
route service design and can help guide decision making regarding the selection of a preferred service alternative.
Within a constrained funding environment where there are limited financial resources available to dedicate to transit,
several key tradeoffs emerge pertaining to service design and distribution of resources:
Frequency vs. Coverage
Deviating Alignments vs. Direct Alignments
One-way Loop Alignments vs. Bi-Directional Alignments
These tradeoffs are explored in greater detail in the following sections.
Frequency versus Coverage
Coverage-based transit services seek to maximize the total area served by a route or network of routes regardless
of density or ridership demand, while frequency-based services seek to provide higher levels of service, typically
quantified in terms of number of buses per hour, concentrated in corridors of highest ridership demand. In other
words, for the same amount of resources invested, a coverage-based service spreads those resources over a larger
area, resulting in fewer buses per hour across the network, while a frequency-based service focuses those resources
by placing more buses in higher-density areas where ridership potential can be maximized. This concept is illustrated
in Figure 6-1. In the figure on the left, 10 buses are distributed across two routes, providing 15-minute service
frequencies. In the figure on the right, 10 buses are distributed across four routes, providing 30 to 60-minute
frequencies.
Figure 6-1: Service Frequency versus Service Coverage
While a coverage-based service model generally ensures at least a minimal level of service to more customers,
frequent service placed in higher-density corridors typically generates more ridership even if it serves fewer people
overall. This is due to the higher quality of service provided by frequent service that reduces waiting time, improves
reliability, and facilitates transfers between routes. Given limited funding availability, the concept of providing truly
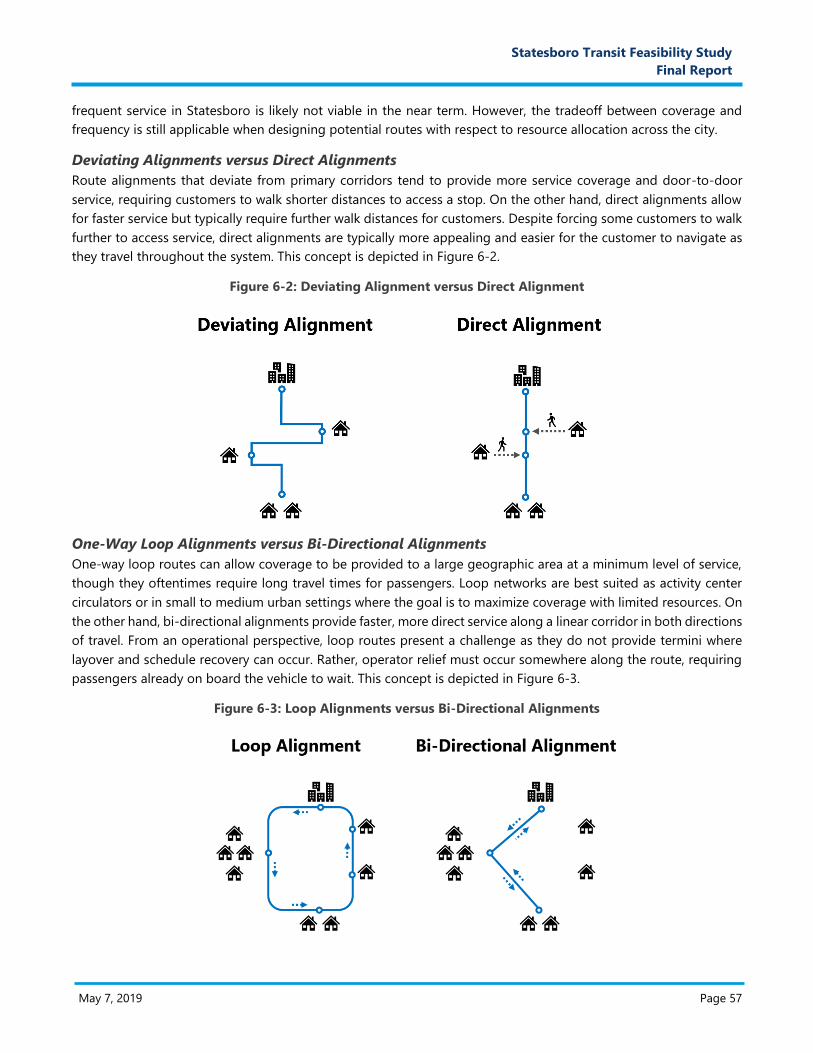
May 7, 2019 Page 57
J. Prop
osal
Narra
tive
Statesboro Transit Feasibility Study
Final Report
frequent service in Statesboro is likely not viable in the near term. However, the tradeoff between coverage and
frequency is still applicable when designing potential routes with respect to resource allocation across the city.
Deviating Alignments versus Direct Alignments
Route alignments that deviate from primary corridors tend to provide more service coverage and door-to-door
service, requiring customers to walk shorter distances to access a stop. On the other hand, direct alignments allow
for faster service but typically require further walk distances for customers. Despite forcing some customers to walk
further to access service, direct alignments are typically more appealing and easier for the customer to navigate as
they travel throughout the system. This concept is depicted in Figure 6-2.
Figure 6-2: Deviating Alignment versus Direct Alignment
One-Way Loop Alignments versus Bi-Directional Alignments
One-way loop routes can allow coverage to be provided to a large geographic area at a minimum level of service,
though they oftentimes require long travel times for passengers. Loop networks are best suited as activity center
circulators or in small to medium urban settings where the goal is to maximize coverage with limited resources. On
the other hand, bi-directional alignments provide faster, more direct service along a linear corridor in both directions
of travel. From an operational perspective, loop routes present a challenge as they do not provide termini where
layover and schedule recovery can occur. Rather, operator relief must occur somewhere along the route, requiring
passengers already on board the vehicle to wait. This concept is depicted in Figure 6-3.
Figure 6-3: Loop Alignments versus Bi-Directional Alignments
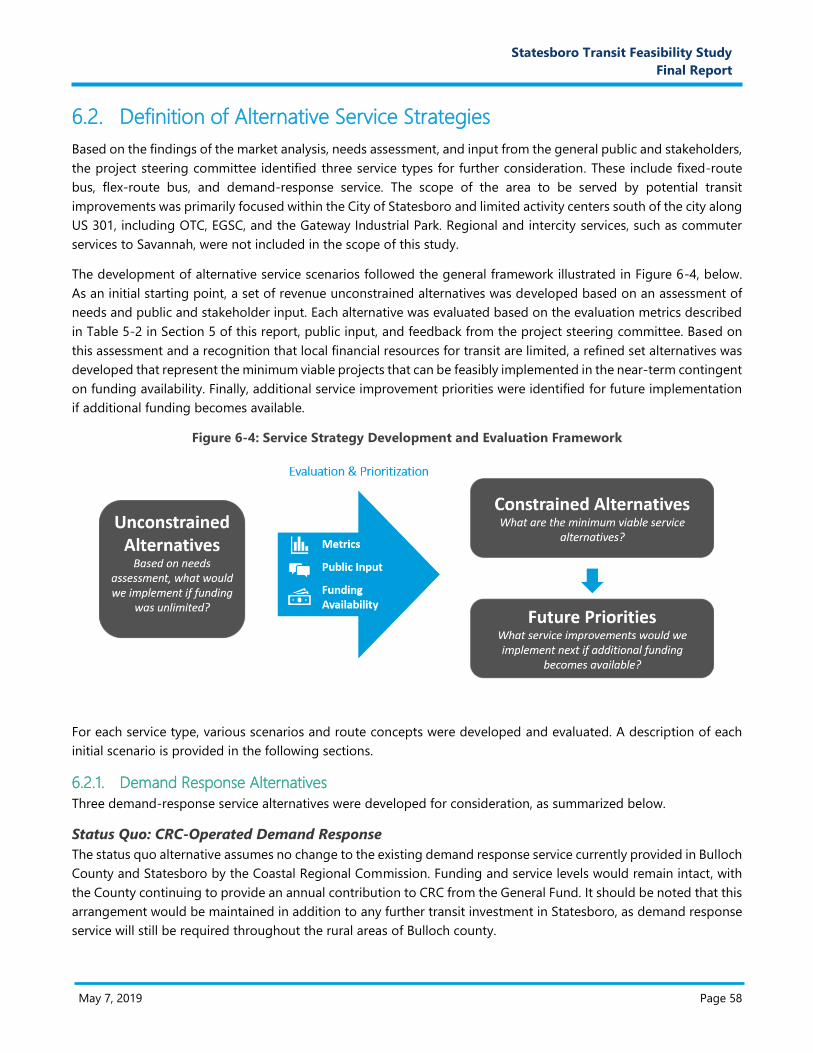
May 7, 2019 Page 58
J. Prop
osal
Narra
tive
Statesboro Transit Feasibility Study
Final Report
6.2. Definition of Alternative Service Strategies
Based on the findings of the market analysis, needs assessment, and input from the general public and stakeholders,
the project steering committee identified three service types for further consideration. These include fixed-route
bus, flex-route bus, and demand-response service. The scope of the area to be served by potential transit
improvements was primarily focused within the City of Statesboro and limited activity centers south of the city along
US 301, including OTC, EGSC, and the Gateway Industrial Park. Regional and intercity services, such as commuter
services to Savannah, were not included in the scope of this study.
The development of alternative service scenarios followed the general framework illustrated in Figure 6-4, below.
As an initial starting point, a set of revenue unconstrained alternatives was developed based on an assessment of
needs and public and stakeholder input. Each alternative was evaluated based on the evaluation metrics described
in Table 5-2 in Section 5 of this report, public input, and feedback from the project steering committee. Based on
this assessment and a recognition that local financial resources for transit are limited, a refined set alternatives was
developed that represent the minimum viable projects that can be feasibly implemented in the near-term contingent
on funding availability. Finally, additional service improvement priorities were identified for future implementation
if additional funding becomes available.
Figure 6-4: Service Strategy Development and Evaluation Framework
For each service type, various scenarios and route concepts were developed and evaluated. A description of each
initial scenario is provided in the following sections.
6.2.1. Demand Response Alternatives
Three demand-response service alternatives were developed for consideration, as summarized below.
Status Quo: CRC-Operated Demand Response
The status quo alternative assumes no change to the existing demand response service currently provided in Bulloch
County and Statesboro by the Coastal Regional Commission. Funding and service levels would remain intact, with
the County continuing to provide an annual contribution to CRC from the General Fund. It should be noted that this
arrangement would be maintained in addition to any further transit investment in Statesboro, as demand response
service will still be required throughout the rural areas of Bulloch county.
May 7, 2019 Page 59
J. Prop
osal
Narra
tive
Statesboro Transit Feasibility Study
Final Report
City-Operated Demand Response
This alternative assumes a new stand-alone demand response service would be provided within the City of
Statesboro. The City would operate this service directly or through a third-party contract. This service would provide
door-to-door service to the general public upon demand with advance reservation. While similar in function to the
existing CRC dial-a-ride service, this arrangement would allow the City to set its own policies, schedules, and levels
of service.
Taxi / Transportation Network Company (TNC) Voucher Program
Voucher programs are a common strategy to provide mobility options in communities of all sizes, either
independently or complementary to existing public transportation services. This alternative would involve the City
establishing partnerships with local taxi companies and/or Transportation Network Companies (TNCs) such as Uber
or Lyft. Through the partnership agreement, the City would establish a max subsidy per trip that would be
reimbursed to the provider, with the balance of the fare being paid for by the customer.
6.2.2. Fixed and Flex-Route Alternatives
A series of route alternatives were developed based on the findings of the market analysis and input from the public
and stakeholders. Nine total route alternatives were developed based on three network concepts to illustrate how
different route options could function together as a cohesive network. Concepts A and B include networks of four
bi-directional routes, and Concept C includes one loop route. For the purpose of the initial concept evaluation, it is
assumed that each route could be operated in either a fixed-route or flex-route configuration. Each route alternative
is described below.
Concept A
Concept A provides a network of four bi-directional trunk routes along major corridors throughout Statesboro,
connecting the primary retail commercial, employment, and government centers to residential concentrations
throughout the city. Concept A provides connectivity to points south of Statesboro along US 301, including OTC,
EGSC, and the Gateway Industrial Park. Specific alignments and points of interest for each route are described below
and illustrated in Figure 6-5.
Red Route (EW1-A): The Concept A version of the Red route facilitates east-west travel across Statesboro
from the Food Bank in West Statesboro to the retail node at Northside Drive and Veterans Memorial
Parkway via Main Street. The route serves the social services facilities along Denmark Street, downtown
Statesboro, Statesboro High School, and the Statesboro Mall and surrounding shopping centers. In the
eastbound direction of travel, the route begins at the Food Bank at 400 Donnie Simmons Way, travels east
on Donnie Simmons Way, turns right on Morris Street, right on Proctor Street, left on North Foss Street,
Right on Denmark Street before turning around at the Outreach Center, travels east on Denmark Street,
right on Johnson Lane, left on Johnson Street, right on West Main Street, right on Lester Road, left on
Northside Drive, right into the Goodwill/Lowes parking lot, left on Bernard Lane, right on Brannen Street,
left on Henry Boulevard before turning around at Statesboro Crossing, left on Brannen Street, and right at
the Wal-Mart parking lot access road. In the westbound direction, the bus exits Wal-Mart and turns left on
Northside Drive before following the same path back to the Food Bank.
Blue Route (NS1-A): The Concept A version of the Blue Route facilitates north-south movement across
Statesboro from the Pinewood Manor Apartments (previously Fox Ridge Apartments), through downtown,
GSU, the EGRMC complex and surrounding retail area, to the DaVita Dialysis center and Garden District
Apartments at Veterans Memorial Parkway and Fair Road. In the southbound direction, the route travels
from the Pinewood Manor Apartments at 66 Packinghouse Road, north on Packinghouse Road, left on East
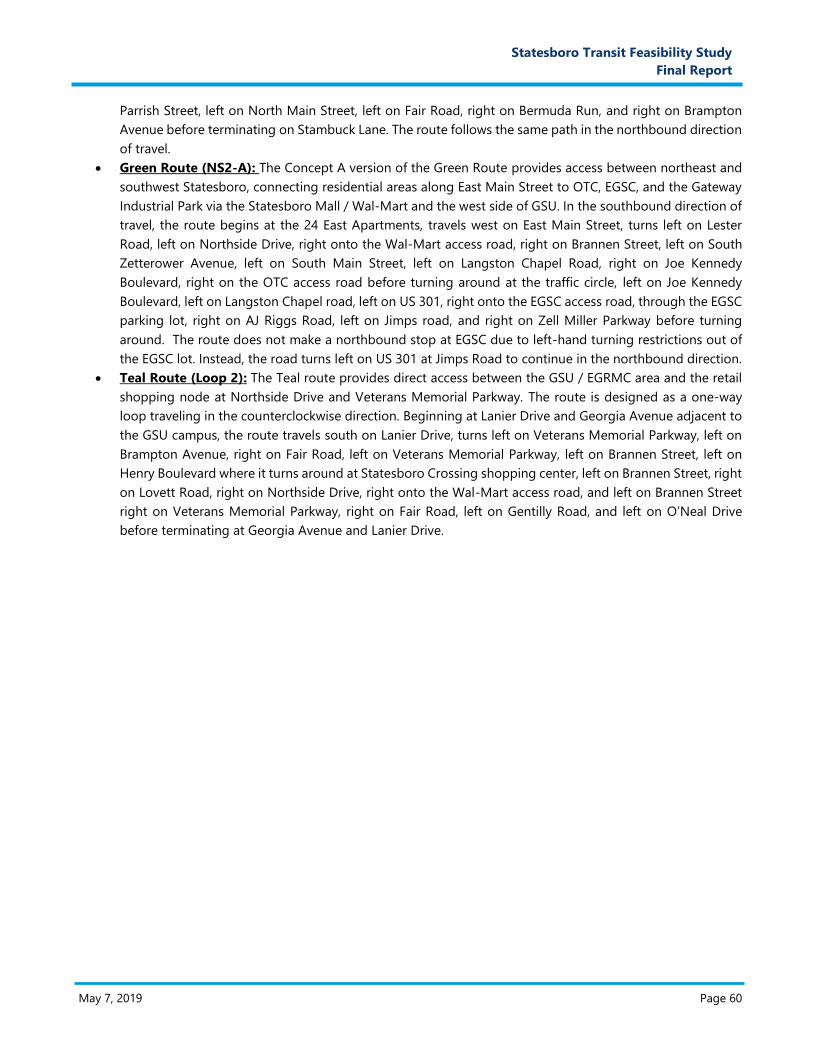
May 7, 2019 Page 60
J. Prop
osal
Narra
tive
Statesboro Transit Feasibility Study
Final Report
Parrish Street, left on North Main Street, left on Fair Road, right on Bermuda Run, and right on Brampton
Avenue before terminating on Stambuck Lane. The route follows the same path in the northbound direction
of travel.
Green Route (NS2-A): The Concept A version of the Green Route provides access between northeast and
southwest Statesboro, connecting residential areas along East Main Street to OTC, EGSC, and the Gateway
Industrial Park via the Statesboro Mall / Wal-Mart and the west side of GSU. In the southbound direction of
travel, the route begins at the 24 East Apartments, travels west on East Main Street, turns left on Lester
Road, left on Northside Drive, right onto the Wal-Mart access road, right on Brannen Street, left on South
Zetterower Avenue, left on South Main Street, left on Langston Chapel Road, right on Joe Kennedy
Boulevard, right on the OTC access road before turning around at the traffic circle, left on Joe Kennedy
Boulevard, left on Langston Chapel road, left on US 301, right onto the EGSC access road, through the EGSC
parking lot, right on AJ Riggs Road, left on Jimps road, and right on Zell Miller Parkway before turning
around. The route does not make a northbound stop at EGSC due to left-hand turning restrictions out of
the EGSC lot. Instead, the road turns left on US 301 at Jimps Road to continue in the northbound direction.
Teal Route (Loop 2): The Teal route provides direct access between the GSU / EGRMC area and the retail
shopping node at Northside Drive and Veterans Memorial Parkway. The route is designed as a one-way
loop traveling in the counterclockwise direction. Beginning at Lanier Drive and Georgia Avenue adjacent to
the GSU campus, the route travels south on Lanier Drive, turns left on Veterans Memorial Parkway, left on
Brampton Avenue, right on Fair Road, left on Veterans Memorial Parkway, left on Brannen Street, left on
Henry Boulevard where it turns around at Statesboro Crossing shopping center, left on Brannen Street, right
on Lovett Road, right on Northside Drive, right onto the Wal-Mart access road, and left on Brannen Street
right on Veterans Memorial Parkway, right on Fair Road, left on Gentilly Road, and left on O’Neal Drive
before terminating at Georgia Avenue and Lanier Drive.
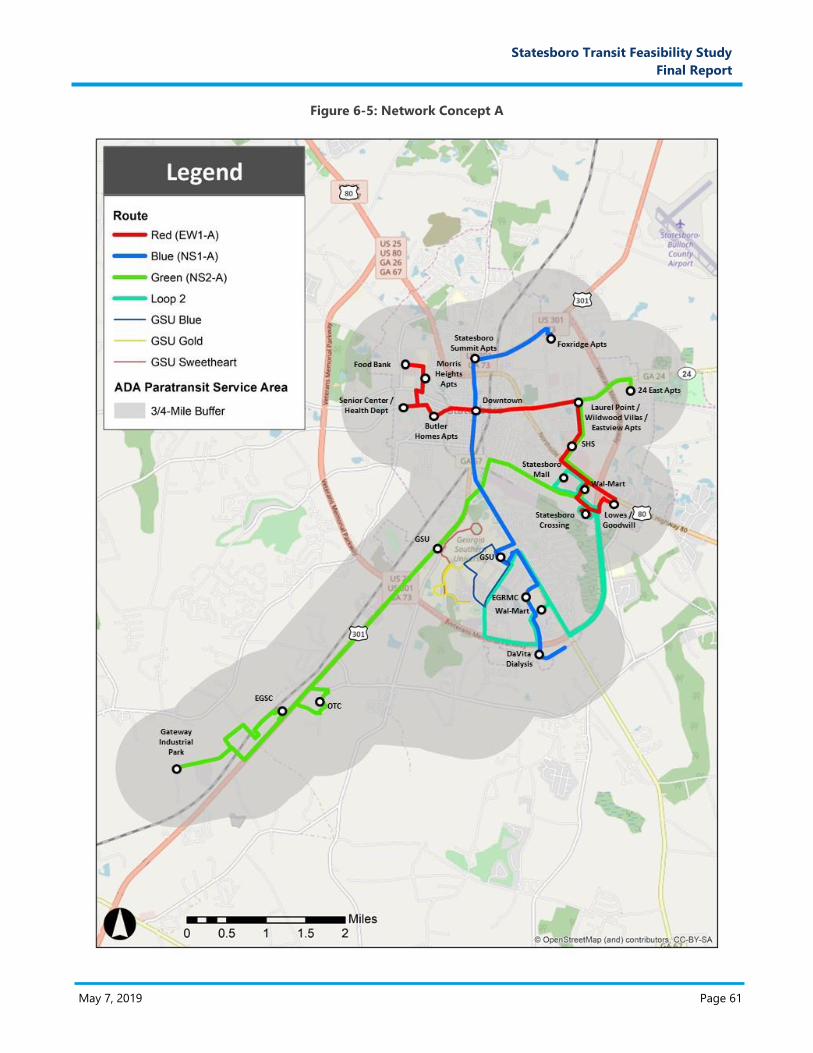
May 7, 2019 Page 61
J. Prop
osal
Narra
tive
Statesboro Transit Feasibility Study
Final Report
Figure 6-5: Network Concept A
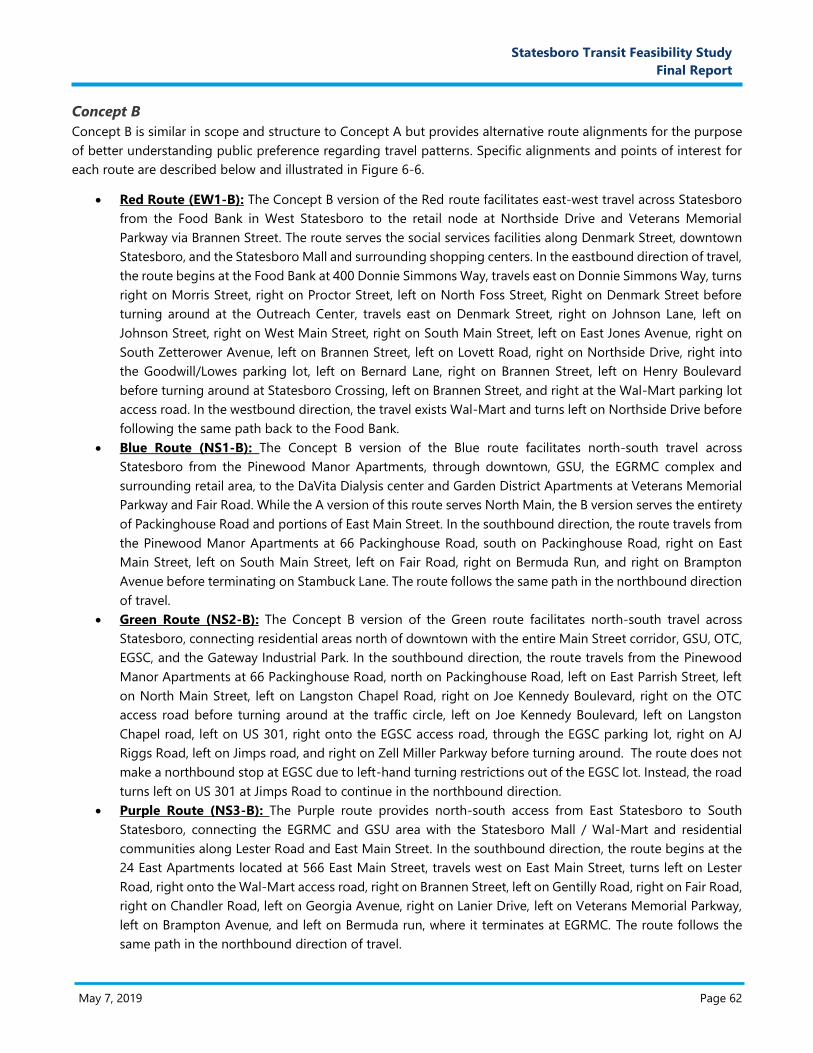
May 7, 2019 Page 62
J. Prop
osal
Narra
tive
Statesboro Transit Feasibility Study
Final Report
Concept B
Concept B is similar in scope and structure to Concept A but provides alternative route alignments for the purpose
of better understanding public preference regarding travel patterns. Specific alignments and points of interest for
each route are described below and illustrated in Figure 6-6.
Red Route (EW1-B): The Concept B version of the Red route facilitates east-west travel across Statesboro
from the Food Bank in West Statesboro to the retail node at Northside Drive and Veterans Memorial
Parkway via Brannen Street. The route serves the social services facilities along Denmark Street, downtown
Statesboro, and the Statesboro Mall and surrounding shopping centers. In the eastbound direction of travel,
the route begins at the Food Bank at 400 Donnie Simmons Way, travels east on Donnie Simmons Way, turns
right on Morris Street, right on Proctor Street, left on North Foss Street, Right on Denmark Street before
turning around at the Outreach Center, travels east on Denmark Street, right on Johnson Lane, left on
Johnson Street, right on West Main Street, right on South Main Street, left on East Jones Avenue, right on
South Zetterower Avenue, left on Brannen Street, left on Lovett Road, right on Northside Drive, right into
the Goodwill/Lowes parking lot, left on Bernard Lane, right on Brannen Street, left on Henry Boulevard
before turning around at Statesboro Crossing, left on Brannen Street, and right at the Wal-Mart parking lot
access road. In the westbound direction, the travel exists Wal-Mart and turns left on Northside Drive before
following the same path back to the Food Bank.
Blue Route (NS1-B): The Concept B version of the Blue route facilitates north-south travel across
Statesboro from the Pinewood Manor Apartments, through downtown, GSU, the EGRMC complex and
surrounding retail area, to the DaVita Dialysis center and Garden District Apartments at Veterans Memorial
Parkway and Fair Road. While the A version of this route serves North Main, the B version serves the entirety
of Packinghouse Road and portions of East Main Street. In the southbound direction, the route travels from
the Pinewood Manor Apartments at 66 Packinghouse Road, south on Packinghouse Road, right on East
Main Street, left on South Main Street, left on Fair Road, right on Bermuda Run, and right on Brampton
Avenue before terminating on Stambuck Lane. The route follows the same path in the northbound direction
of travel.
Green Route (NS2-B): The Concept B version of the Green route facilitates north-south travel across
Statesboro, connecting residential areas north of downtown with the entire Main Street corridor, GSU, OTC,
EGSC, and the Gateway Industrial Park. In the southbound direction, the route travels from the Pinewood
Manor Apartments at 66 Packinghouse Road, north on Packinghouse Road, left on East Parrish Street, left
on North Main Street, left on Langston Chapel Road, right on Joe Kennedy Boulevard, right on the OTC
access road before turning around at the traffic circle, left on Joe Kennedy Boulevard, left on Langston
Chapel road, left on US 301, right onto the EGSC access road, through the EGSC parking lot, right on AJ
Riggs Road, left on Jimps road, and right on Zell Miller Parkway before turning around. The route does not
make a northbound stop at EGSC due to left-hand turning restrictions out of the EGSC lot. Instead, the road
turns left on US 301 at Jimps Road to continue in the northbound direction.
Purple Route (NS3-B): The Purple route provides north-south access from East Statesboro to South
Statesboro, connecting the EGRMC and GSU area with the Statesboro Mall / Wal-Mart and residential
communities along Lester Road and East Main Street. In the southbound direction, the route begins at the
24 East Apartments located at 566 East Main Street, travels west on East Main Street, turns left on Lester
Road, right onto the Wal-Mart access road, right on Brannen Street, left on Gentilly Road, right on Fair Road,
right on Chandler Road, left on Georgia Avenue, right on Lanier Drive, left on Veterans Memorial Parkway,
left on Brampton Avenue, and left on Bermuda run, where it terminates at EGRMC. The route follows the
same path in the northbound direction of travel.
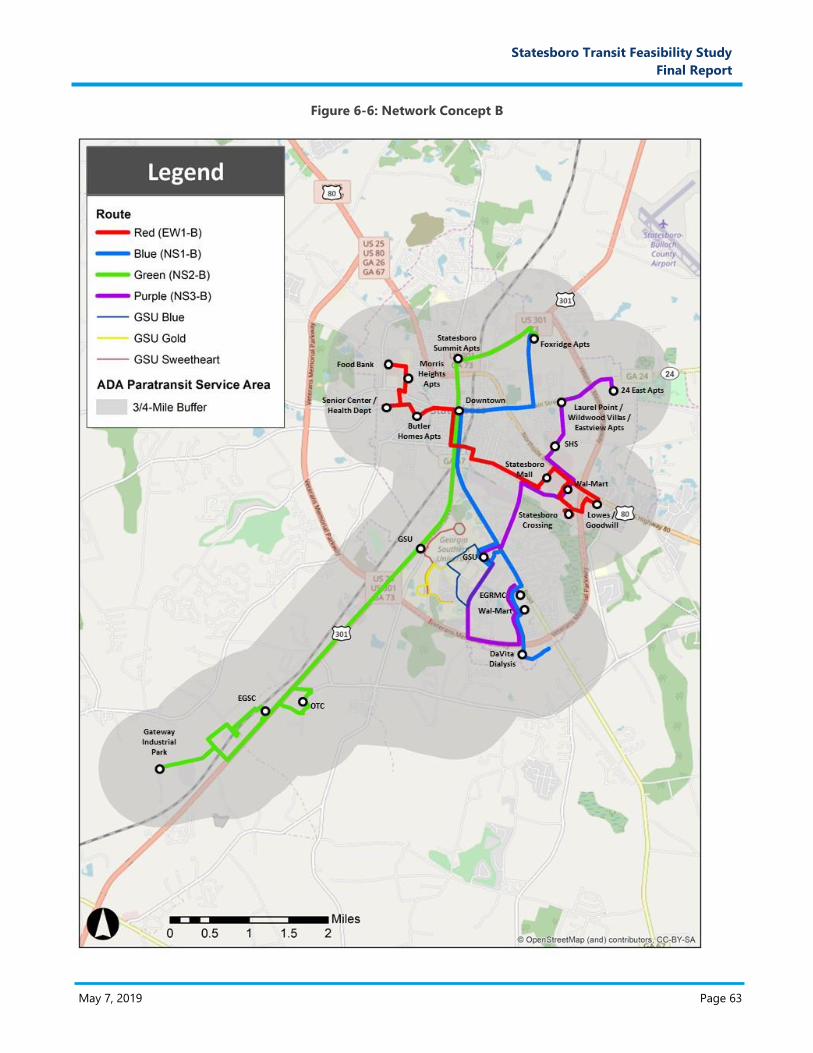
May 7, 2019 Page 63
J. Prop
osal
Narra
tive
Statesboro Transit Feasibility Study
Final Report
Figure 6-6: Network Concept B
May 7, 2019 Page 64
J. Prop
osal
Narra
tive
Statesboro Transit Feasibility Study
Final Report
Concept C
Concept C consists of a single loop, the Orange route, assumed to operated in both directions of travel. The Orange
route serves residential areas in both east and west Statesboro and connects to the major employment and
commercial nodes throughout the core of Statesboro, including downtown, GSU, Statesboro Mall and surrounding
retail areas at Northside Drive and Veterans Memorial Parkway, and the EGRMC and surrounding retail areas at Fair
Road and Veterans Memorial Parkway. Concept C is illustrated in Figure 6-7.
In the clockwise direction, the route would begin at the Statesboro Convention and Visitors Bureau at 222 South
Main Street, travel North on South Main, turn left on West Grady Street, left on Institute Street, right on West Jones
Avenue, right on Johnson Street, right on West Main Street, left on Martin Luther King Jr. Drive, right on Church
Street, right on North Main Street, left on Elm Street, left on North College Street, left on West Main Street, right on
Lester Road, left on Northside Drive, right on Lovett Road, left into the Statesboro Mall parking lot, right onto
Northside Drive, right into the Goodwill/Lowes parking lot, left on Bernard Lane, right onto Brannen Street, left onto
Buckhead Drive, left onto Henry Boulevard, right onto Veterans Memorial Parkway, right onto Fair Road, left onto
Brampton Avenue, right onto Bermuda Run, left onto Fair Road, left onto Herty Drive, left onto Fair Road, and right
onto Main Street before returning to the Statesboro Convention and Visitors Bureau. The route would generally
follow the same path in the opposite direction.

May 7, 2019 Page 65
J. Prop
osal
Narra
tive
Statesboro Transit Feasibility Study
Final Report
Figure 6-7: Route Concept C
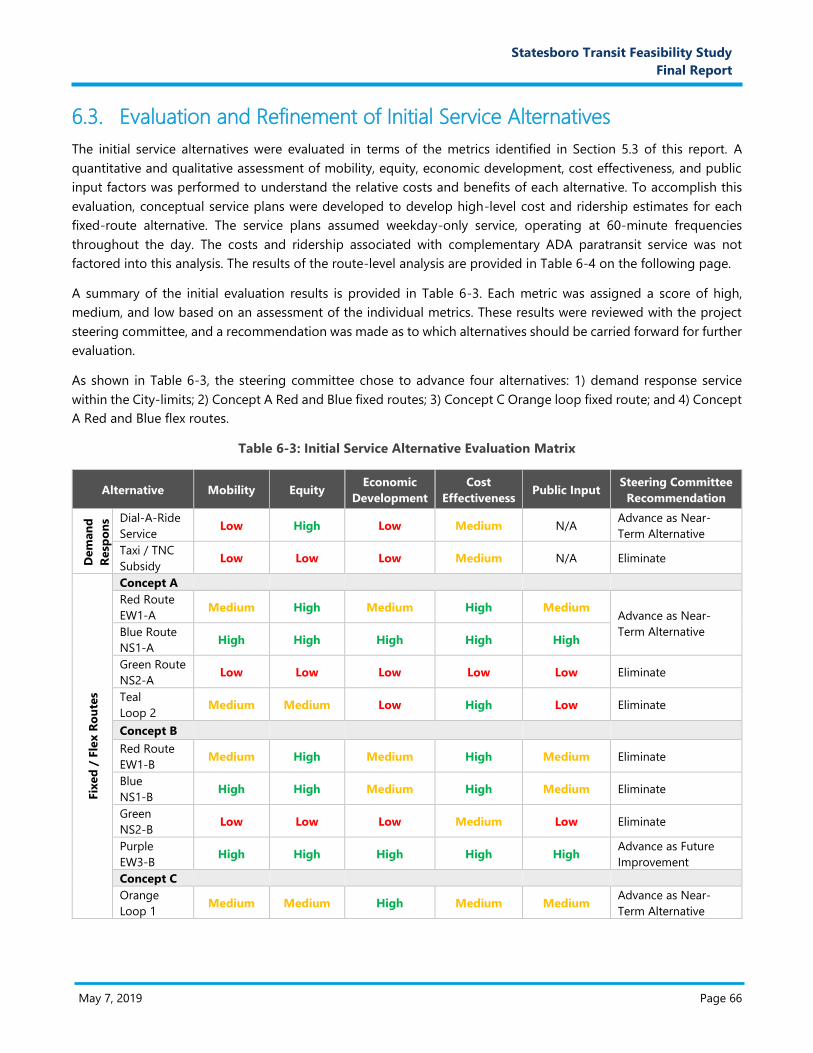
May 7, 2019 Page 66
J. Prop
osal
Narra
tive
Statesboro Transit Feasibility Study
Final Report
6.3. Evaluation and Refinement of Initial Service Alternatives
The initial service alternatives were evaluated in terms of the metrics identified in Section 5.3 of this report. A
quantitative and qualitative assessment of mobility, equity, economic development, cost effectiveness, and public
input factors was performed to understand the relative costs and benefits of each alternative. To accomplish this
evaluation, conceptual service plans were developed to develop high-level cost and ridership estimates for each
fixed-route alternative. The service plans assumed weekday-only service, operating at 60-minute frequencies
throughout the day. The costs and ridership associated with complementary ADA paratransit service was not
factored into this analysis. The results of the route-level analysis are provided in Table 6-4 on the following page.
A summary of the initial evaluation results is provided in Table 6-3. Each metric was assigned a score of high,
medium, and low based on an assessment of the individual metrics. These results were reviewed with the project
steering committee, and a recommendation was made as to which alternatives should be carried forward for further
evaluation.
As shown in Table 6-3, the steering committee chose to advance four alternatives: 1) demand response service
within the City-limits; 2) Concept A Red and Blue fixed routes; 3) Concept C Orange loop fixed route; and 4) Concept
A Red and Blue flex routes.
Table 6-3: Initial Service Alternative Evaluation Matrix
Alternative Mobility Equity Economic
Development
Cost
Effectiveness Public Input
Steering Committee
Recommendation
Dem
an
d
Resp
on
s
e
Dial-A-Ride
Service Low High Low Medium N/A
Advance as Near-
Term Alternative
Taxi / TNC
Subsidy Low Low Low Medium N/A Eliminate
Fix
ed
/ F
lex R
ou
tes
Concept A
Red Route
EW1-A Medium High Medium High Medium
Advance as Near-
Term Alternative Blue Route
NS1-A High High High High High
Green Route
NS2-A Low Low Low Low Low Eliminate
Teal
Loop 2 Medium Medium Low High Low Eliminate
Concept B
Red Route
EW1-B Medium High Medium High Medium Eliminate
Blue
NS1-B High High Medium High Medium Eliminate
Green
NS2-B Low Low Low Medium Low Eliminate
Purple
EW3-B High High High High High
Advance as Future
Improvement
Concept C
Orange
Loop 1 Medium Medium High Medium Medium
Advance as Near-
Term Alternative
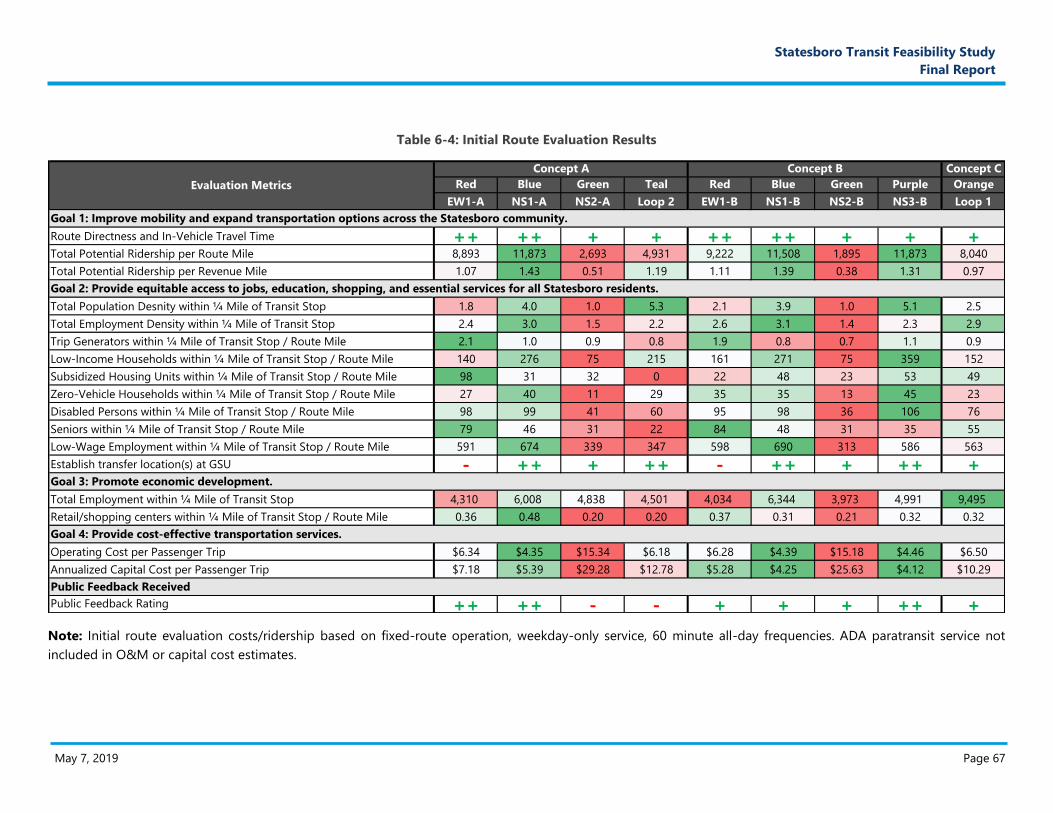
May 7, 2019 Page 67
Statesboro Transit Feasibility Study
Final Report
Table 6-4: Initial Route Evaluation Results
Note: Initial route evaluation costs/ridership based on fixed-route operation, weekday-only service, 60 minute all-day frequencies. ADA paratransit service not
included in O&M or capital cost estimates.
Concept C
Red Blue Green Teal Red Blue Green Purple Orange
EW1-A NS1-A NS2-A Loop 2 EW1-B NS1-B NS2-B NS3-B Loop 1
Route Directness and In-Vehicle Travel Time ++ ++ + + ++ ++ + + +Total Potential Ridership per Route Mile 8,893 11,873 2,693 4,931 9,222 11,508 1,895 11,873 8,040
Total Potential Ridership per Revenue Mile 1.07 1.43 0.51 1.19 1.11 1.39 0.38 1.31 0.97
Total Population Desnity within ¼ Mile of Transit Stop 1.8 4.0 1.0 5.3 2.1 3.9 1.0 5.1 2.5
Total Employment Density within ¼ Mile of Transit Stop 2.4 3.0 1.5 2.2 2.6 3.1 1.4 2.3 2.9
Trip Generators within ¼ Mile of Transit Stop / Route Mile 2.1 1.0 0.9 0.8 1.9 0.8 0.7 1.1 0.9
Low-Income Households within ¼ Mile of Transit Stop / Route Mile 140 276 75 215 161 271 75 359 152
Subsidized Housing Units within ¼ Mile of Transit Stop / Route Mile 98 31 32 0 22 48 23 53 49
Zero-Vehicle Households within ¼ Mile of Transit Stop / Route Mile 27 40 11 29 35 35 13 45 23
Disabled Persons within ¼ Mile of Transit Stop / Route Mile 98 99 41 60 95 98 36 106 76
Seniors within ¼ Mile of Transit Stop / Route Mile 79 46 31 22 84 48 31 35 55
Low-Wage Employment within ¼ Mile of Transit Stop / Route Mile 591 674 339 347 598 690 313 586 563
Establish transfer location(s) at GSU - ++ + ++ - ++ + ++ +
Total Employment within ¼ Mile of Transit Stop 4,310 6,008 4,838 4,501 4,034 6,344 3,973 4,991 9,495
Retail/shopping centers within ¼ Mile of Transit Stop / Route Mile 0.36 0.48 0.20 0.20 0.37 0.31 0.21 0.32 0.32
Operating Cost per Passenger Trip $6.34 $4.35 $15.34 $6.18 $6.28 $4.39 $15.18 $4.46 $6.50
Annualized Capital Cost per Passenger Trip $7.18 $5.39 $29.28 $12.78 $5.28 $4.25 $25.63 $4.12 $10.29
Public Feedback Rating ++ ++ - - + + + ++ +
Evaluation Metrics
Goal 1: Improve mobility and expand transportation options across the Statesboro community.
Goal 2: Provide equitable access to jobs, education, shopping, and essential services for all Statesboro residents.
Goal 3: Promote economic development.
Goal 4: Provide cost-effective transportation services.
Public Feedback Received
Concept A Concept B
May 7, 2019 Page 68
K. Prop
osal
Narra
tive
Statesboro Transit Feasibility Study
Final Report
7. Final Service Alternatives Based on the results of the initial screening, the project steering committee recommended four alternatives to be
studied in further detail. The overarching objective when developing these alternatives was to design a basic service
framework that meet the community’s travel needs while minimizing initial capital outlay and ongoing annual
operating costs. The preferred final service alternatives include the following:
Alternative 1: Demand Response Service within City Limits
Alternative 2: Orange Loop Fixed-Route Service
Alternative 3: Red and Blue Fixed-Route Service
Alternative 4: Red and Blue Flex-Route Service
If the selected alternative proves successful, future improvements could be implemented to expand services levels
or scope of the network. Moreover, a phased approach could also be achieved through implementation of a less
cost-intensive alternative in the near-term, such as expanded demand response service, followed by a migration to
a fixed or flex-route network in the future.
This section details the service plans, operating requirements and costs, capital costs, and ridership estimates for
each final alternative. Finally, an evaluation of the alternatives and a summary of potential future service
enhancements is provided along with corresponding costs and estimated ridership impacts.
7.1. Description of Final Service Alternatives
7.1.1. Alternative 1: Demand Response Service within City Limits
Alternative 1 would provide an expanded demand response service within the Statesboro city limits. This service
would function similar to the existing CRC dial-a-ride service, but would give the City flexibility to set its own service
policies and operating schedules. It is envisioned that the service would initially be provided on weekdays between
6:00 AM and 6:00 PM. Depending on the reservation and dispatching procedures and software systems used, this
reservation window could be anywhere from less than an hour to up to a day in advance. The service area for
Alternative 1 is illustrated in Figure 7-1.
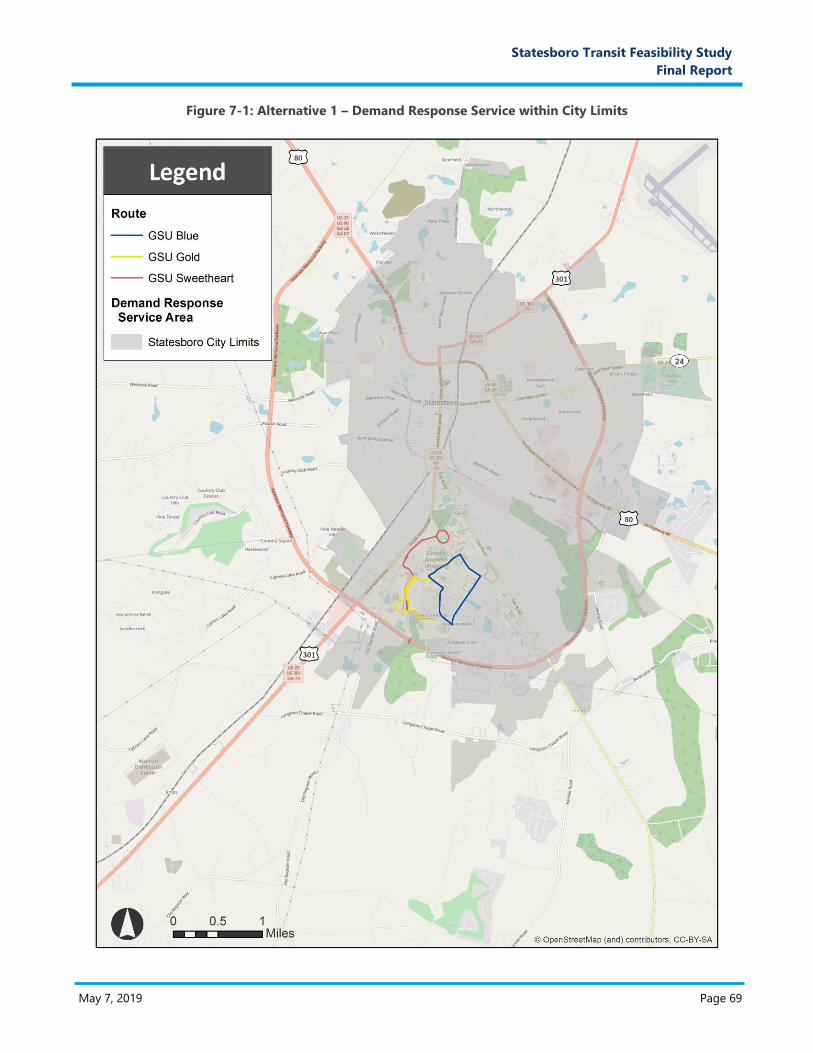
May 7, 2019 Page 69
K. Prop
osal
Narra
tive
Statesboro Transit Feasibility Study
Final Report
Figure 7-1: Alternative 1 – Demand Response Service within City Limits
May 7, 2019 Page 70
K. Prop
osal
Narra
tive
Statesboro Transit Feasibility Study
Final Report
7.1.2. Alternative 2: Orange Loop Fixed-Route Service
Alternative 2 would provide bi-directional fixed-route service along the Orange loop route. The service would
operate on weekdays, from 6:00 AM to 6:00 PM. Buses would arrive every 60 minutes in both directions. In addition
to the fixed-route service, complementary ADA paratransit service would be provided within a three-quarter mile
zone on either side of the route as required per federal regulations. Alternative 2 is illustrated in Figure 7-2. Note
that the stops shown on the map indicate major destinations and do not reflect all potential or planned stop
locations.
As described in Section 6.2.2, the Orange route provides broad coverage throughout Statesboro, connecting a
number of residential neighborhoods with the primary retail, service, and employment nodes throughout the City.
The route is envisioned to serve the GSU campus via Herty Drive, but it should be noted that coordination will need
to occur with the university before this alignment is finalized. Other key destinations served include downtown,
Statesboro Mall / Wal-Mart, Statesboro Crossing, the Market District / Neighborhood Wal-Mart, EGRMC, and a
portion of the Blue Mile. Stops would be provided approximately every quarter mile, with several scheduled
timepoints located along the route.
Potential variations of the Orange route could involve providing on-demand flex service at select locations to serve
destinations off the route including the senior center and health department on Denmark Road and/or the
apartment complexes located on Packinghouse Road.

May 7, 2019 Page 71
K. Prop
osal
Narra
tive
Statesboro Transit Feasibility Study
Final Report
Figure 7-2: Alternative 2 – Orange Fixed-Route Service
May 7, 2019 Page 72
K. Prop
osal
Narra
tive
Statesboro Transit Feasibility Study
Final Report
7.1.3. Alternative 3: Red and Blue Fixed-Route Service
Alternative 3 would provide bi-directional fixed-route service along two routes, the Red and Blue lines, with a
transfer point in downtown Statesboro. Like the Orange route, this service would operate on weekdays, from 6:00
AM to 6:00 PM. Buses would arrive every 60 minutes in both directions. Stops would be provided approximately
every quarter mile, with several scheduled timepoints located along each route. In addition to the fixed-route
service, complementary ADA paratransit service would be provided within a three-quarter mile zone on either side
of the route. Alternative 3 is illustrated in Figure 7-3.
The Red route would provide east-west service across the city through downtown, connecting the Food Bank on
the west end of the route with the retail node at Northside Drive and Veterans Memorial Parkway at the east end.
The route serves a large segment of the East and West Main Street corridor and provides access to a number of
residential neighborhoods, including several subsidized apartment complexes, to employment, shopping, and
educational opportunities. Due to a one-way restriction on Bernard near Lowes and Goodwill, the route makes a
one-way loop Lane at the east end of the route. It is envisioned that the route would terminate in or around the
Wal-Mart parking lot before beginning the westbound trip due to the presence of a traffic signal exiting Wal-Mart
onto Northside Drive. However, coordination would be required with the property owner to facilitate access and
consideration would need to be given to traffic volumes through this area. If this is not deemed feasible, an
alternative alignment could involve traveling west on Brannen Street after departing Statesboro Crossing and right
on Lovett Road before joining the original alignment on Northside Drive.
The Blue route provides north-south access between Pinewood Manor Apartments in north Statesboro and the
DaVita Dialysis Center on Stambuck Lane in south Statesboro, just south of the EGRMC complex and Market District
retail area. The route provides service along a large segment of North and South Main Street and Fair Road corridors,
connecting downtown, GSU, and the hospital. The route also serves a portion of the Blue Mile along South Main
Street. Access to GSU is provided via Chandler Road and Georgia Avenue where a connection is made to the Blue
and Gold GSU campus routes.
As noted earlier, this alternative contemplates a transfer point in the downtown vicinity. While this study did not
identify or assess specific candidate sites, the selected location of this transfer location will dictate the final route
alignments through downtown. Further discussion of this topic and general requirements for a transfer center is
provided in Section 7.4.2.
7.1.4. Alternative 4: Red and Blue Flex-Route Service
Alternative 4 provides service along the same route alignments as Alternative 3, but offers flexible access to points
up to three-quarters of a mile off the route upon demand. Less frequent scheduled service would be provided due
to the time burden resulting from providing flexible service, with 90-minute headways provided throughout the day.
Like the fixed routes, the Red/Blue flex-route service would initially operate on weekdays only from 6:00 AM to 6:00
PM. Because this alternative provides access throughout the service area, ADA paratransit is not required. Alternative
4 is illustrated in Figure 7-3.
It is envisioned that this service would function as a deviated fixed route, meaning that buses would arrive at several
scheduled timepoints across each route, but would make on-demand stops off the routes in between timepoints.
This requires additional time to be built into the schedule and provides less predictability for customers waiting at
stops in between timepoints. Passengers would be required to reserve on-demand pick-ups and drop-offs ahead
of time. Depending on the reservation and dispatching procedures and software systems used, this reservation
window could be anywhere from less than an hour to up to a day in advance.
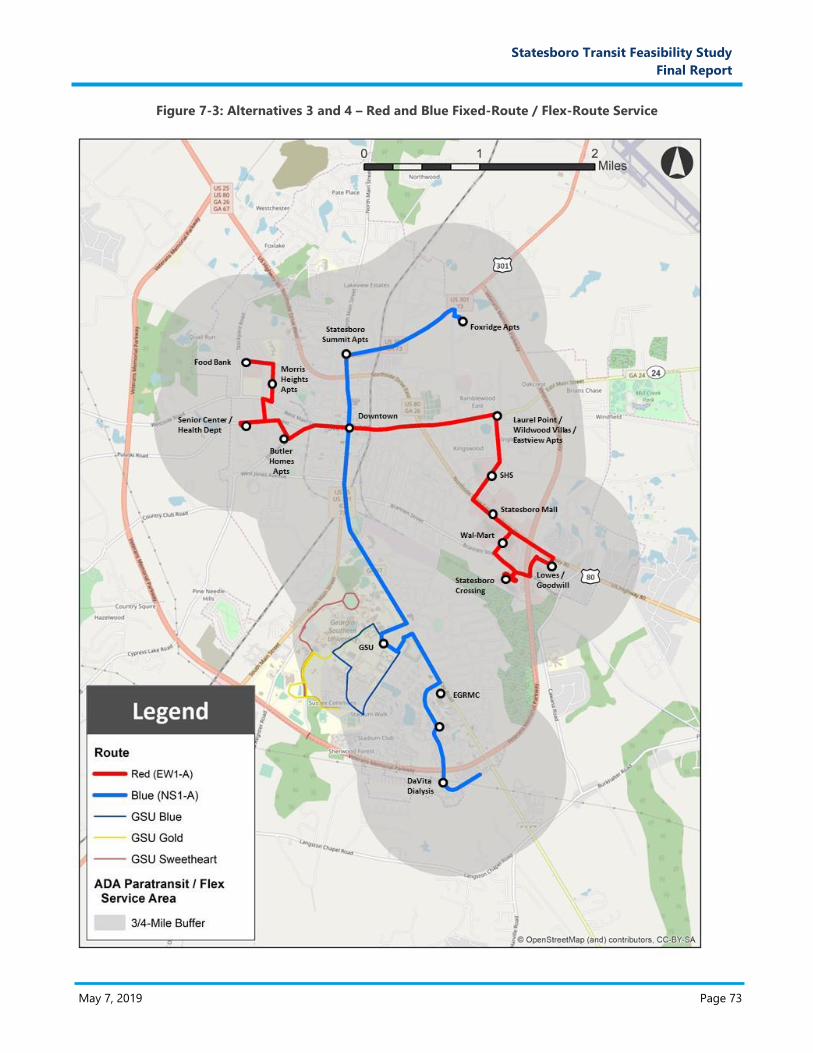
May 7, 2019 Page 73
K. Prop
osal
Narra
tive
Statesboro Transit Feasibility Study
Final Report
Figure 7-3: Alternatives 3 and 4 – Red and Blue Fixed-Route / Flex-Route Service
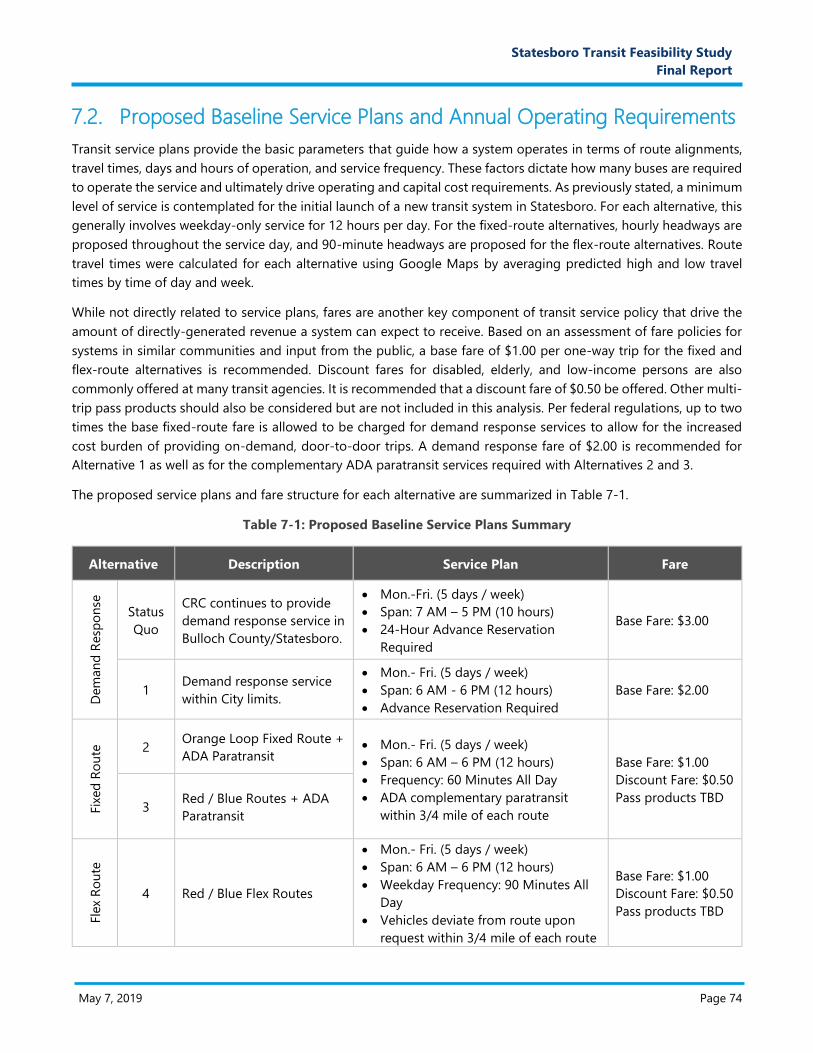
May 7, 2019 Page 74
K. Prop
osal
Narra
tive
Statesboro Transit Feasibility Study
Final Report
7.2. Proposed Baseline Service Plans and Annual Operating Requirements
Transit service plans provide the basic parameters that guide how a system operates in terms of route alignments,
travel times, days and hours of operation, and service frequency. These factors dictate how many buses are required
to operate the service and ultimately drive operating and capital cost requirements. As previously stated, a minimum
level of service is contemplated for the initial launch of a new transit system in Statesboro. For each alternative, this
generally involves weekday-only service for 12 hours per day. For the fixed-route alternatives, hourly headways are
proposed throughout the service day, and 90-minute headways are proposed for the flex-route alternatives. Route
travel times were calculated for each alternative using Google Maps by averaging predicted high and low travel
times by time of day and week.
While not directly related to service plans, fares are another key component of transit service policy that drive the
amount of directly-generated revenue a system can expect to receive. Based on an assessment of fare policies for
systems in similar communities and input from the public, a base fare of $1.00 per one-way trip for the fixed and
flex-route alternatives is recommended. Discount fares for disabled, elderly, and low-income persons are also
commonly offered at many transit agencies. It is recommended that a discount fare of $0.50 be offered. Other multi-
trip pass products should also be considered but are not included in this analysis. Per federal regulations, up to two
times the base fixed-route fare is allowed to be charged for demand response services to allow for the increased
cost burden of providing on-demand, door-to-door trips. A demand response fare of $2.00 is recommended for
Alternative 1 as well as for the complementary ADA paratransit services required with Alternatives 2 and 3.
The proposed service plans and fare structure for each alternative are summarized in Table 7-1.
Table 7-1: Proposed Baseline Service Plans Summary
Alternative Description Service Plan Fare
Dem
an
d R
esp
on
se
Status
Quo
CRC continues to provide
demand response service in
Bulloch County/Statesboro.
Mon.-Fri. (5 days / week)
Span: 7 AM – 5 PM (10 hours)
24-Hour Advance Reservation
Required
Base Fare: $3.00
1 Demand response service
within City limits.
Mon.- Fri. (5 days / week)
Span: 6 AM - 6 PM (12 hours)
Advance Reservation Required
Base Fare: $2.00
Fix
ed
Ro
ute
2 Orange Loop Fixed Route +
ADA Paratransit Mon.- Fri. (5 days / week)
Span: 6 AM – 6 PM (12 hours)
Frequency: 60 Minutes All Day
ADA complementary paratransit
within 3/4 mile of each route
Base Fare: $1.00
Discount Fare: $0.50
Pass products TBD 3
Red / Blue Routes + ADA
Paratransit
Fle
x R
ou
te
4 Red / Blue Flex Routes
Mon.- Fri. (5 days / week)
Span: 6 AM – 6 PM (12 hours)
Weekday Frequency: 90 Minutes All
Day
Vehicles deviate from route upon
request within 3/4 mile of each route
Base Fare: $1.00
Discount Fare: $0.50
Pass products TBD
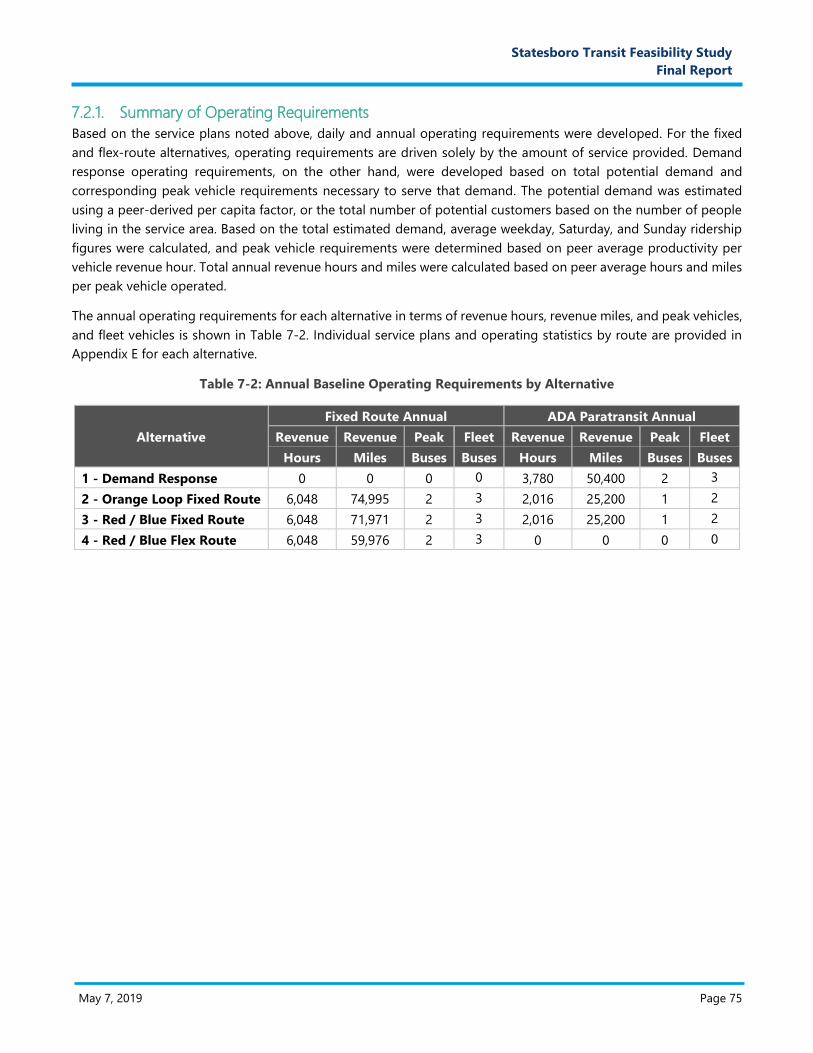
May 7, 2019 Page 75
K. Prop
osal
Narra
tive
Statesboro Transit Feasibility Study
Final Report
7.2.1. Summary of Operating Requirements
Based on the service plans noted above, daily and annual operating requirements were developed. For the fixed
and flex-route alternatives, operating requirements are driven solely by the amount of service provided. Demand
response operating requirements, on the other hand, were developed based on total potential demand and
corresponding peak vehicle requirements necessary to serve that demand. The potential demand was estimated
using a peer-derived per capita factor, or the total number of potential customers based on the number of people
living in the service area. Based on the total estimated demand, average weekday, Saturday, and Sunday ridership
figures were calculated, and peak vehicle requirements were determined based on peer average productivity per
vehicle revenue hour. Total annual revenue hours and miles were calculated based on peer average hours and miles
per peak vehicle operated.
The annual operating requirements for each alternative in terms of revenue hours, revenue miles, and peak vehicles,
and fleet vehicles is shown in Table 7-2. Individual service plans and operating statistics by route are provided in
Appendix E for each alternative.
Table 7-2: Annual Baseline Operating Requirements by Alternative
Alternative
Fixed Route Annual ADA Paratransit Annual
Revenue Revenue Peak Fleet Revenue Revenue Peak Fleet
Hours Miles Buses Buses Hours Miles Buses Buses
1 - Demand Response 0 0 0 0 3,780 50,400 2 3
2 - Orange Loop Fixed Route 6,048 74,995 2 3 2,016 25,200 1 2
3 - Red / Blue Fixed Route 6,048 71,971 2 3 2,016 25,200 1 2
4 - Red / Blue Flex Route 6,048 59,976 2 3 0 0 0 0
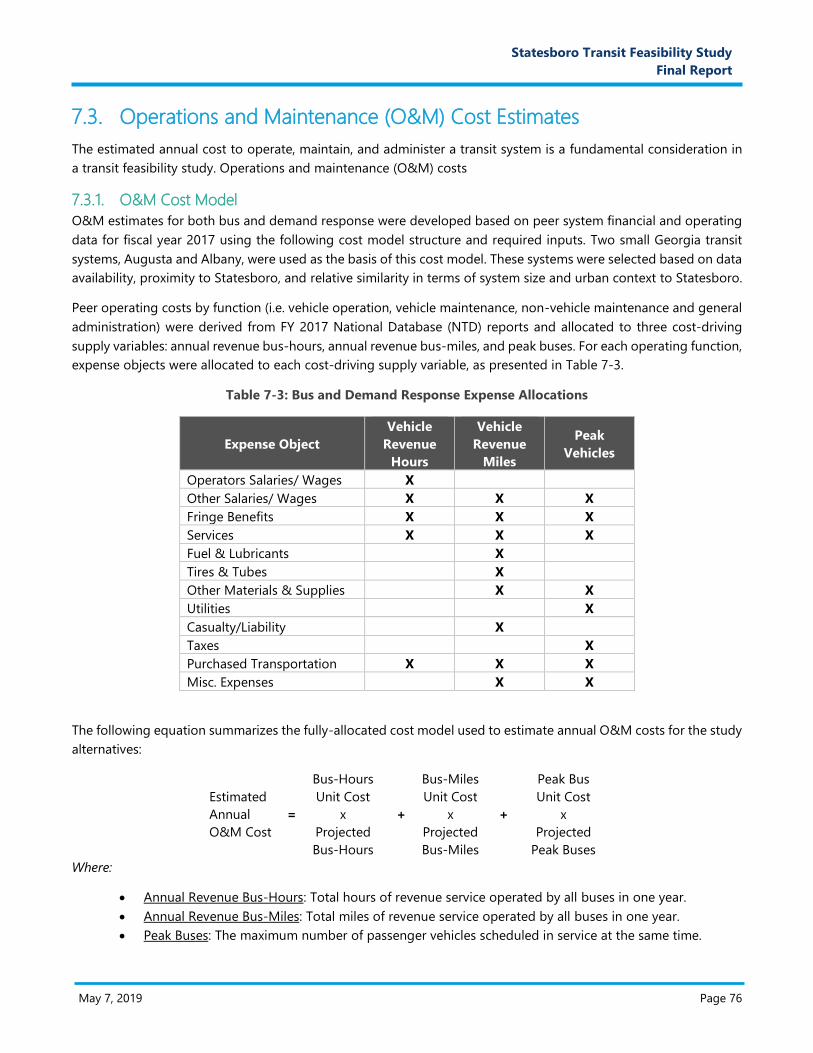
May 7, 2019 Page 76
K. Prop
osal
Narra
tive
Statesboro Transit Feasibility Study
Final Report
7.3. Operations and Maintenance (O&M) Cost Estimates
The estimated annual cost to operate, maintain, and administer a transit system is a fundamental consideration in
a transit feasibility study. Operations and maintenance (O&M) costs
7.3.1. O&M Cost Model
O&M estimates for both bus and demand response were developed based on peer system financial and operating
data for fiscal year 2017 using the following cost model structure and required inputs. Two small Georgia transit
systems, Augusta and Albany, were used as the basis of this cost model. These systems were selected based on data
availability, proximity to Statesboro, and relative similarity in terms of system size and urban context to Statesboro.
Peer operating costs by function (i.e. vehicle operation, vehicle maintenance, non-vehicle maintenance and general
administration) were derived from FY 2017 National Database (NTD) reports and allocated to three cost-driving
supply variables: annual revenue bus-hours, annual revenue bus-miles, and peak buses. For each operating function,
expense objects were allocated to each cost-driving supply variable, as presented in Table 7-3.
Table 7-3: Bus and Demand Response Expense Allocations
Expense Object
Vehicle
Revenue
Hours
Vehicle
Revenue
Miles
Peak
Vehicles
Operators Salaries/ Wages X
Other Salaries/ Wages X X X
Fringe Benefits X X X
Services X X X
Fuel & Lubricants X
Tires & Tubes X
Other Materials & Supplies X X
Utilities X
Casualty/Liability X
Taxes X
Purchased Transportation X X X
Misc. Expenses X X
The following equation summarizes the fully-allocated cost model used to estimate annual O&M costs for the study
alternatives:
Estimated
Annual
O&M Cost
=
Bus-Hours
Unit Cost
x
Projected
Bus-Hours
+
Bus-Miles
Unit Cost
x
Projected
Bus-Miles
+
Peak Bus
Unit Cost
x
Projected
Peak Buses
Where:
Annual Revenue Bus-Hours: Total hours of revenue service operated by all buses in one year.
Annual Revenue Bus-Miles: Total miles of revenue service operated by all buses in one year.
Peak Buses: The maximum number of passenger vehicles scheduled in service at the same time.
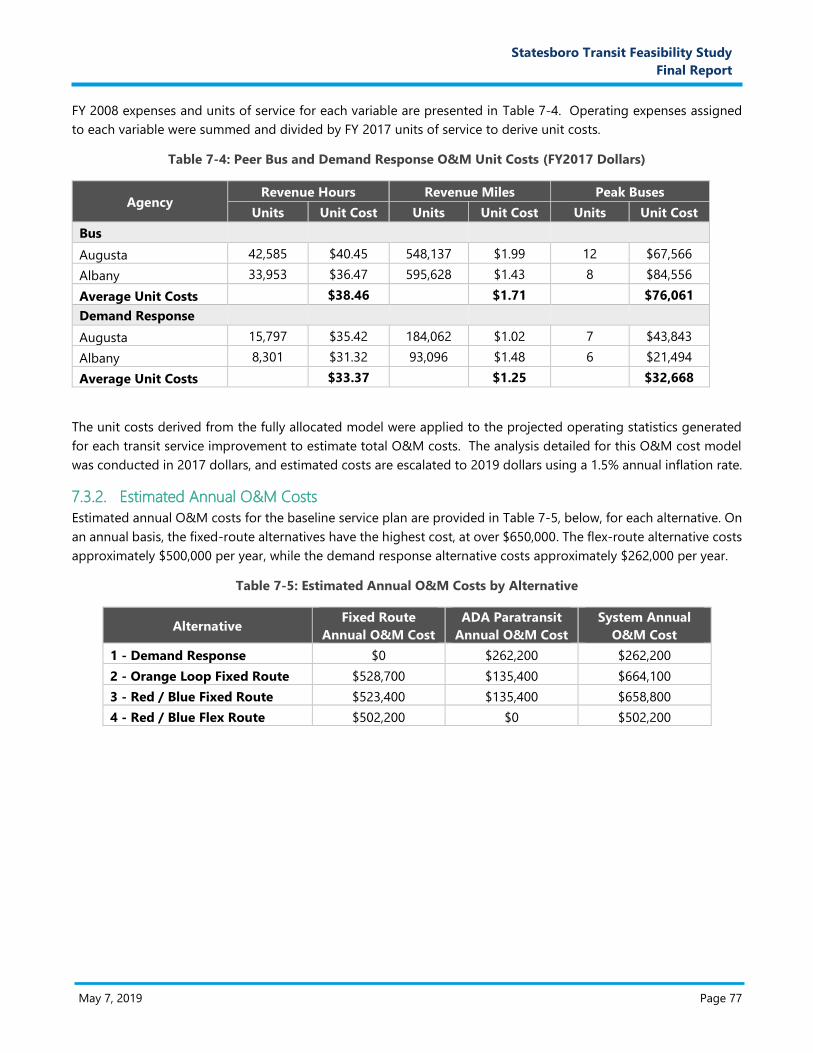
May 7, 2019 Page 77
K. Prop
osal
Narra
tive
Statesboro Transit Feasibility Study
Final Report
FY 2008 expenses and units of service for each variable are presented in Table 7-4. Operating expenses assigned
to each variable were summed and divided by FY 2017 units of service to derive unit costs.
Table 7-4: Peer Bus and Demand Response O&M Unit Costs (FY2017 Dollars)
Agency Revenue Hours Revenue Miles Peak Buses
Units Unit Cost Units Unit Cost Units Unit Cost
Bus
Augusta 42,585 $40.45 548,137 $1.99 12 $67,566
Albany 33,953 $36.47 595,628 $1.43 8 $84,556
Average Unit Costs $38.46 $1.71 $76,061
Demand Response
Augusta 15,797 $35.42 184,062 $1.02 7 $43,843
Albany 8,301 $31.32 93,096 $1.48 6 $21,494
Average Unit Costs $33.37 $1.25 $32,668
The unit costs derived from the fully allocated model were applied to the projected operating statistics generated
for each transit service improvement to estimate total O&M costs. The analysis detailed for this O&M cost model
was conducted in 2017 dollars, and estimated costs are escalated to 2019 dollars using a 1.5% annual inflation rate.
7.3.2. Estimated Annual O&M Costs
Estimated annual O&M costs for the baseline service plan are provided in Table 7-5, below, for each alternative. On
an annual basis, the fixed-route alternatives have the highest cost, at over $650,000. The flex-route alternative costs
approximately $500,000 per year, while the demand response alternative costs approximately $262,000 per year.
Table 7-5: Estimated Annual O&M Costs by Alternative
Alternative Fixed Route
Annual O&M Cost
ADA Paratransit
Annual O&M Cost
System Annual
O&M Cost
1 - Demand Response $0 $262,200 $262,200
2 - Orange Loop Fixed Route $528,700 $135,400 $664,100
3 - Red / Blue Fixed Route $523,400 $135,400 $658,800
4 - Red / Blue Flex Route $502,200 $0 $502,200
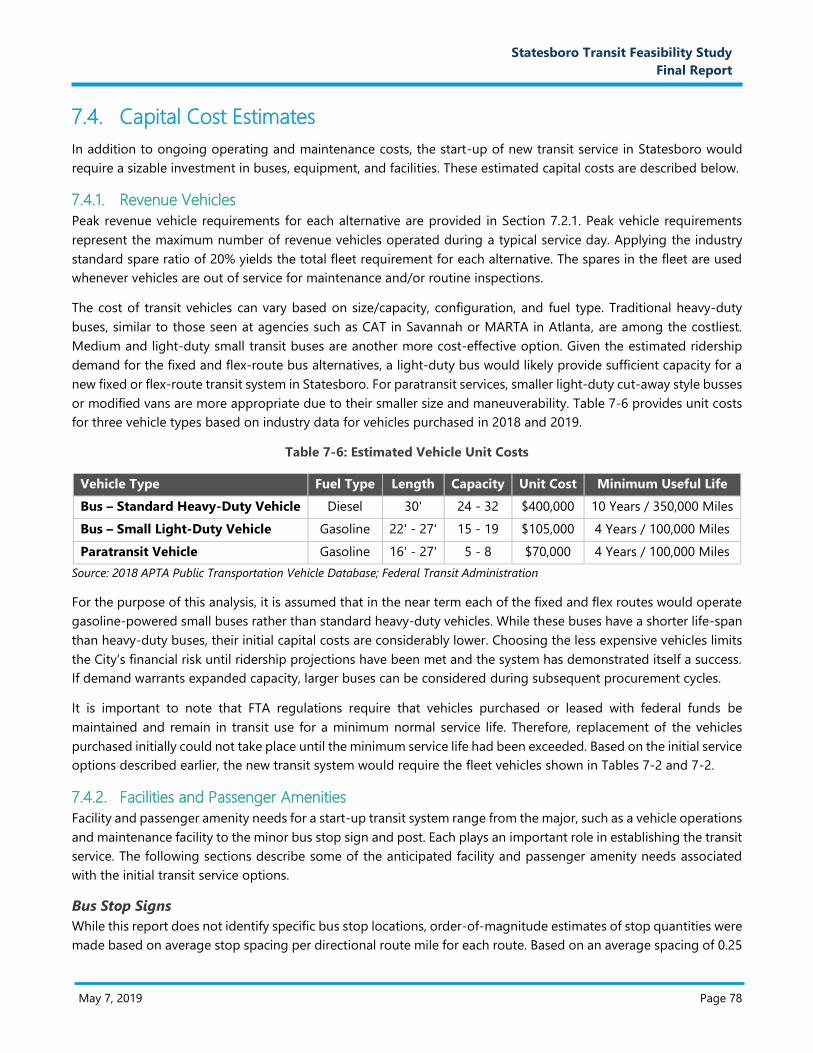
May 7, 2019 Page 78
K. Prop
osal
Narra
tive
Statesboro Transit Feasibility Study
Final Report
7.4. Capital Cost Estimates
In addition to ongoing operating and maintenance costs, the start-up of new transit service in Statesboro would
require a sizable investment in buses, equipment, and facilities. These estimated capital costs are described below.
7.4.1. Revenue Vehicles
Peak revenue vehicle requirements for each alternative are provided in Section 7.2.1. Peak vehicle requirements
represent the maximum number of revenue vehicles operated during a typical service day. Applying the industry
standard spare ratio of 20% yields the total fleet requirement for each alternative. The spares in the fleet are used
whenever vehicles are out of service for maintenance and/or routine inspections.
The cost of transit vehicles can vary based on size/capacity, configuration, and fuel type. Traditional heavy-duty
buses, similar to those seen at agencies such as CAT in Savannah or MARTA in Atlanta, are among the costliest.
Medium and light-duty small transit buses are another more cost-effective option. Given the estimated ridership
demand for the fixed and flex-route bus alternatives, a light-duty bus would likely provide sufficient capacity for a
new fixed or flex-route transit system in Statesboro. For paratransit services, smaller light-duty cut-away style busses
or modified vans are more appropriate due to their smaller size and maneuverability. Table 7-6 provides unit costs
for three vehicle types based on industry data for vehicles purchased in 2018 and 2019.
Table 7-6: Estimated Vehicle Unit Costs
Vehicle Type Fuel Type Length Capacity Unit Cost Minimum Useful Life
Bus – Standard Heavy-Duty Vehicle Diesel 30' 24 - 32 $400,000 10 Years / 350,000 Miles
Bus – Small Light-Duty Vehicle Gasoline 22' - 27' 15 - 19 $105,000 4 Years / 100,000 Miles
Paratransit Vehicle Gasoline 16' - 27' 5 - 8 $70,000 4 Years / 100,000 Miles
Source: 2018 APTA Public Transportation Vehicle Database; Federal Transit Administration
For the purpose of this analysis, it is assumed that in the near term each of the fixed and flex routes would operate
gasoline-powered small buses rather than standard heavy-duty vehicles. While these buses have a shorter life-span
than heavy-duty buses, their initial capital costs are considerably lower. Choosing the less expensive vehicles limits
the City’s financial risk until ridership projections have been met and the system has demonstrated itself a success.
If demand warrants expanded capacity, larger buses can be considered during subsequent procurement cycles.
It is important to note that FTA regulations require that vehicles purchased or leased with federal funds be
maintained and remain in transit use for a minimum normal service life. Therefore, replacement of the vehicles
purchased initially could not take place until the minimum service life had been exceeded. Based on the initial service
options described earlier, the new transit system would require the fleet vehicles shown in Tables 7-2 and 7-2.
7.4.2. Facilities and Passenger Amenities
Facility and passenger amenity needs for a start-up transit system range from the major, such as a vehicle operations
and maintenance facility to the minor bus stop sign and post. Each plays an important role in establishing the transit
service. The following sections describe some of the anticipated facility and passenger amenity needs associated
with the initial transit service options.
Bus Stop Signs
While this report does not identify specific bus stop locations, order-of-magnitude estimates of stop quantities were
made based on average stop spacing per directional route mile for each route. Based on an average spacing of 0.25
May 7, 2019 Page 79
K. Prop
osal
Narra
tive
Statesboro Transit Feasibility Study
Final Report
to 0.33 miles, it is estimated that between 76 and 95 stops will be required, depending on the selected alternative.
A unit cost of $250 per individual stop was assumed to cover the manufacturing and installation of bus stop signage.
Transfer Centers
Appropriate transfer locations will need to be identified to facilitate passenger movement from one route to another.
Based on the near-term alternatives identified, a single transfer center will be required for Alternatives 3 and 4,
which both include two routes that connect downtown. Initially, it is recommended that the transfer center consist
simply of a passenger waiting shelter and spaces for buses to temporarily stop. At a minimum, the transfer center
should accommodate the potential staging of two buses and a waiting area for passengers. While a precise location
for the downtown transfer center was not identified as part of this study, a small site in or around downtown will
need to be selected prior to initiating service. Candidate sites should have convenient access and egress points and
adequate space for vehicle circulation and layover. It is assumed in the near-term that an existing property or on
street right-of-way will be utilized for this purpose with no substantial site modifications required with the exception
of the procurement and installation of a passenger waiting shelter. Ideally, a city or county-owned parcel or public
right-of-way would be used for this purpose. If none can be identified, the City should seek to identify a private
entity with surplus parking lot capacity or another paved location and establish a use agreement to allow transit
buses to regularly access the property.
For the purpose of this analysis, it is assumed that no additional cost will be required in the near-term for a transfer
facility. If the City elects to expand the system in the future, it may be necessary to construct a permanent dedicated
transfer center with bus bays and passenger waiting amenities. Order-of-magnitude bus bay costs range from
$20,000 to $30,000 per bay, but may be higher or lower depending on final design. Assuming three bus bays, the
additional cost would be approximately $60,000 to $90,000.
Passenger Waiting Shelters
As noted above, the downtown transfer center will require a passenger waiting shelter to provide passengers refuge
from the elements while waiting for the bus to arrive. In addition to the downtown transfer center, other stops at
activity centers such as GSU, Wal-Mart and/or Statesboro Mall, and EGRMC may be candidates for passenger waiting
shelters depending on right-of-way availability and ridership volume. However, it is prudent to wait until ridership
patterns are developed to pursue further shelter installation.
Passenger shelters can vary in cost, depending on the size and aesthetic appeal. On average, a good basic transit
shelter costs approximately $10,000 to purchase and install. One shelter is assumed for the initial near-term service
plans for each fixed and flex-route alternative.
Operations and Maintenance Facility
Until a service provider has been selected, the cost of a vehicle operations and maintenance facility is still largely an
unknown. If an established provider is selected, such as Coastal Regional Commission or GSU, the facility may
already exist. In either of these cases, it may be a matter of minor expansion to accommodate the addition of
vehicles for City service. On the other hand, if a new facility is required, the capital cost outlay would be in the
millions if building on an undeveloped site.
To help control these costs, turnkey or near turnkey sites should be considered. Former car dealerships often have
the basic infrastructure in place to serve as a transit operating and maintenance facility. The only needs may be to
adjust service bay doors and install larger capacity vehicle lifts. As a recent example, when Liberty County Transit
began operations, its maintenance facility was located at a former car dealership leased by the service contractor.
Another option is to investigate City or County maintenance facilities as well as Bulloch County Schools’ school bus
May 7, 2019 Page 80
K. Prop
osal
Narra
tive
Statesboro Transit Feasibility Study
Final Report
maintenance facility. Both are accustomed to maintaining trucks, buses and/or other heavy-duty vehicles and could
very well prove to be a cost-effective option for contracting the entire maintenance operation.
It is assumed for the near-term service alternatives that maintenance, storage, and fueling functions could be
accommodated at an existing fleet maintenance facility owned by the City or County, or, if service is contracted out,
at a facility provided by the contractor. It is important to note, however, that if a service contractor had to acquire
or expand a maintenance facility, facility costs would be passed on in the contractor’s hourly rates.
Eventually, however, local officials may determine that construction of an operations and maintenance facility is
necessary. The construction cost of an operations and maintenance facility can vary significantly, depending on the
location and size. Order-of-magnitude capital costs for new operations and maintenance facilities range from
$200,000 to $500,000 per vehicle. Applying the number of estimated vehicles required for the four near-term
alternatives, a potential O&M facility cost could range from $600,000 to $1.5 million for Alternative 1, to $1.0 to $2.5
million for alternatives 2, 3, and 4.
7.4.3. Miscellaneous Costs
Several other miscellaneous costs will be incurred with the start-up of a new transit system in Statesboro.
Bus-Related Equipment
Typically, revenue vehicle unit costs do not include ancillary equipment such as fare boxes, destination signs and
radios. An additional order-of-magnitude cost of about $15,000 per bus should be added for each local and
paratransit vehicle to account for these purchases.
Maintenance Tools and Equipment
Likewise, revenue vehicle unit costs do not include special tools and equipment needed to maintain the buses. An
order-of-magnitude cost estimate for these maintenance items is $50,000. If a service contractor is used to operate
and maintain the vehicles, these costs would likely be passed on in the contractor’s hourly rates.
Information Technology / Computer Systems
Dispatching and data collection systems for internal operations and accounting and external reporting purposes.
An order-of-magnitude cost of $50,000 should be applied to each scenario to account for these costs.
7.4.4. Estimated Capital Costs
Estimated capital needs and costs for each alternative are provided in Table 7-7 on the following page. Capital cost
requirements range from a low of $370,000 for Alternative 1 to a high of $718,750 for Alternative 3. In general, the
demand response alternative requires the lowest capital cost, while the fixed-route alternatives require the highest
up-front capital outlay due to the need to purchase a separate paratransit fleet in addition to fixed-route buses.
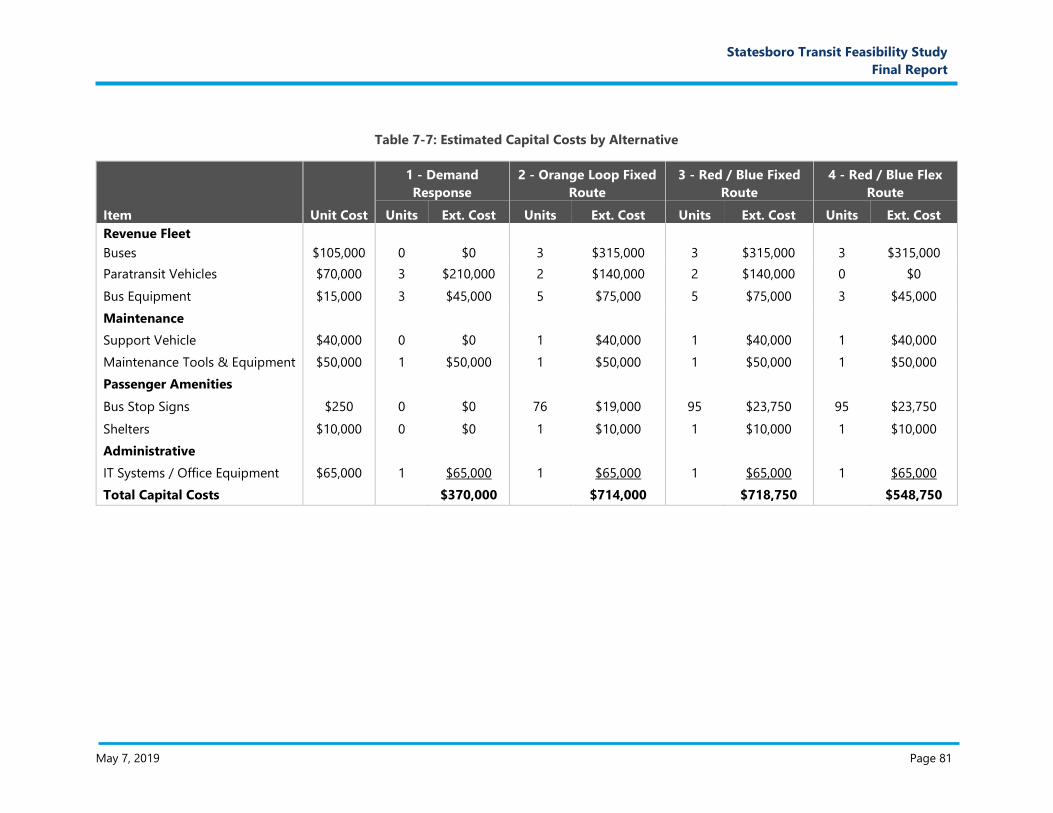
May 7, 2019 Page 81
Statesboro Transit Feasibility Study
Final Report
Table 7-7: Estimated Capital Costs by Alternative
Item Unit Cost
1 - Demand
Response
2 - Orange Loop Fixed
Route
3 - Red / Blue Fixed
Route
4 - Red / Blue Flex
Route
Units Ext. Cost Units Ext. Cost Units Ext. Cost Units Ext. Cost
Revenue Fleet
Buses $105,000 0 $0 3 $315,000 3 $315,000 3 $315,000
Paratransit Vehicles $70,000 3 $210,000 2 $140,000 2 $140,000 0 $0
Bus Equipment $15,000 3 $45,000 5 $75,000 5 $75,000 3 $45,000
Maintenance
Support Vehicle $40,000 0 $0 1 $40,000 1 $40,000 1 $40,000
Maintenance Tools & Equipment $50,000 1 $50,000 1 $50,000 1 $50,000 1 $50,000
Passenger Amenities
Bus Stop Signs $250 0 $0 76 $19,000 95 $23,750 95 $23,750
Shelters $10,000 0 $0 1 $10,000 1 $10,000 1 $10,000
Administrative
IT Systems / Office Equipment $65,000 1 $65,000 1 $65,000 1 $65,000 1 $65,000
Total Capital Costs $370,000 $714,000 $718,750 $548,750
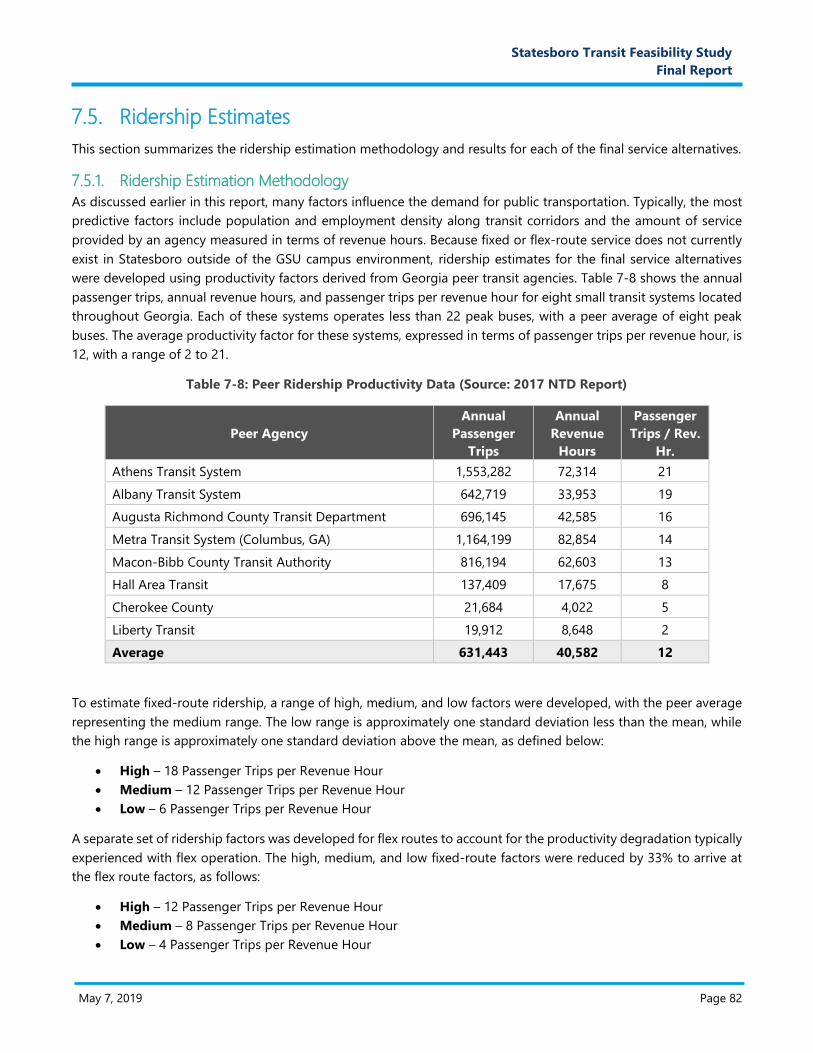
May 7, 2019 Page 82
L. Prop
osal
Narra
tive
Statesboro Transit Feasibility Study
Final Report
7.5. Ridership Estimates
This section summarizes the ridership estimation methodology and results for each of the final service alternatives.
7.5.1. Ridership Estimation Methodology
As discussed earlier in this report, many factors influence the demand for public transportation. Typically, the most
predictive factors include population and employment density along transit corridors and the amount of service
provided by an agency measured in terms of revenue hours. Because fixed or flex-route service does not currently
exist in Statesboro outside of the GSU campus environment, ridership estimates for the final service alternatives
were developed using productivity factors derived from Georgia peer transit agencies. Table 7-8 shows the annual
passenger trips, annual revenue hours, and passenger trips per revenue hour for eight small transit systems located
throughout Georgia. Each of these systems operates less than 22 peak buses, with a peer average of eight peak
buses. The average productivity factor for these systems, expressed in terms of passenger trips per revenue hour, is
12, with a range of 2 to 21.
Table 7-8: Peer Ridership Productivity Data (Source: 2017 NTD Report)
Peer Agency
Annual
Passenger
Trips
Annual
Revenue
Hours
Passenger
Trips / Rev.
Hr.
Athens Transit System 1,553,282 72,314 21
Albany Transit System 642,719 33,953 19
Augusta Richmond County Transit Department 696,145 42,585 16
Metra Transit System (Columbus, GA) 1,164,199 82,854 14
Macon-Bibb County Transit Authority 816,194 62,603 13
Hall Area Transit 137,409 17,675 8
Cherokee County 21,684 4,022 5
Liberty Transit 19,912 8,648 2
Average 631,443 40,582 12
To estimate fixed-route ridership, a range of high, medium, and low factors were developed, with the peer average
representing the medium range. The low range is approximately one standard deviation less than the mean, while
the high range is approximately one standard deviation above the mean, as defined below:
High – 18 Passenger Trips per Revenue Hour
Medium – 12 Passenger Trips per Revenue Hour
Low – 6 Passenger Trips per Revenue Hour
A separate set of ridership factors was developed for flex routes to account for the productivity degradation typically
experienced with flex operation. The high, medium, and low fixed-route factors were reduced by 33% to arrive at
the flex route factors, as follows:
High – 12 Passenger Trips per Revenue Hour
Medium – 8 Passenger Trips per Revenue Hour
Low – 4 Passenger Trips per Revenue Hour
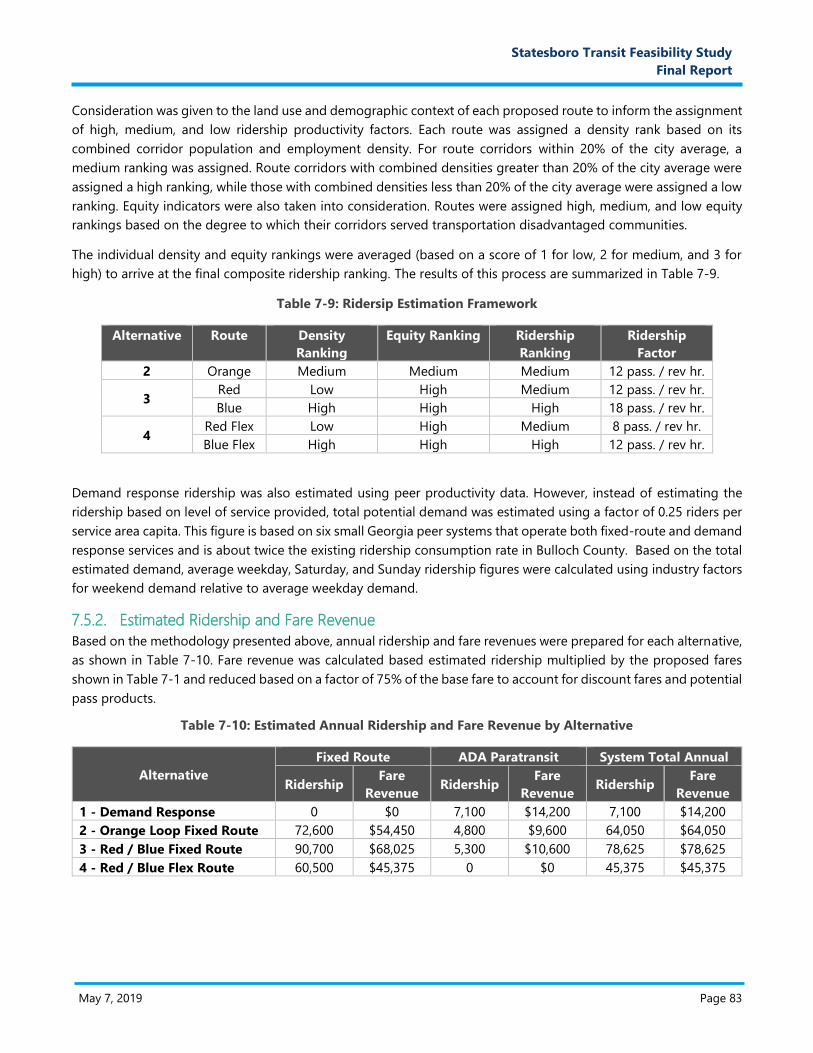
May 7, 2019 Page 83
L. Prop
osal
Narra
tive
Statesboro Transit Feasibility Study
Final Report
Consideration was given to the land use and demographic context of each proposed route to inform the assignment
of high, medium, and low ridership productivity factors. Each route was assigned a density rank based on its
combined corridor population and employment density. For route corridors within 20% of the city average, a
medium ranking was assigned. Route corridors with combined densities greater than 20% of the city average were
assigned a high ranking, while those with combined densities less than 20% of the city average were assigned a low
ranking. Equity indicators were also taken into consideration. Routes were assigned high, medium, and low equity
rankings based on the degree to which their corridors served transportation disadvantaged communities.
The individual density and equity rankings were averaged (based on a score of 1 for low, 2 for medium, and 3 for
high) to arrive at the final composite ridership ranking. The results of this process are summarized in Table 7-9.
Table 7-9: Ridersip Estimation Framework
Alternative Route Density
Ranking
Equity Ranking Ridership
Ranking
Ridership
Factor
2 Orange Medium Medium Medium 12 pass. / rev hr.
3 Red Low High Medium 12 pass. / rev hr.
Blue High High High 18 pass. / rev hr.
4 Red Flex Low High Medium 8 pass. / rev hr.
Blue Flex High High High 12 pass. / rev hr.
Demand response ridership was also estimated using peer productivity data. However, instead of estimating the
ridership based on level of service provided, total potential demand was estimated using a factor of 0.25 riders per
service area capita. This figure is based on six small Georgia peer systems that operate both fixed-route and demand
response services and is about twice the existing ridership consumption rate in Bulloch County. Based on the total
estimated demand, average weekday, Saturday, and Sunday ridership figures were calculated using industry factors
for weekend demand relative to average weekday demand.
7.5.2. Estimated Ridership and Fare Revenue
Based on the methodology presented above, annual ridership and fare revenues were prepared for each alternative,
as shown in Table 7-10. Fare revenue was calculated based estimated ridership multiplied by the proposed fares
shown in Table 7-1 and reduced based on a factor of 75% of the base fare to account for discount fares and potential
pass products.
Table 7-10: Estimated Annual Ridership and Fare Revenue by Alternative
Alternative
Fixed Route ADA Paratransit System Total Annual
Ridership Fare
Revenue Ridership
Fare
Revenue Ridership
Fare
Revenue
1 - Demand Response 0 $0 7,100 $14,200 7,100 $14,200
2 - Orange Loop Fixed Route 72,600 $54,450 4,800 $9,600 64,050 $64,050
3 - Red / Blue Fixed Route 90,700 $68,025 5,300 $10,600 78,625 $78,625
4 - Red / Blue Flex Route 60,500 $45,375 0 $0 45,375 $45,375
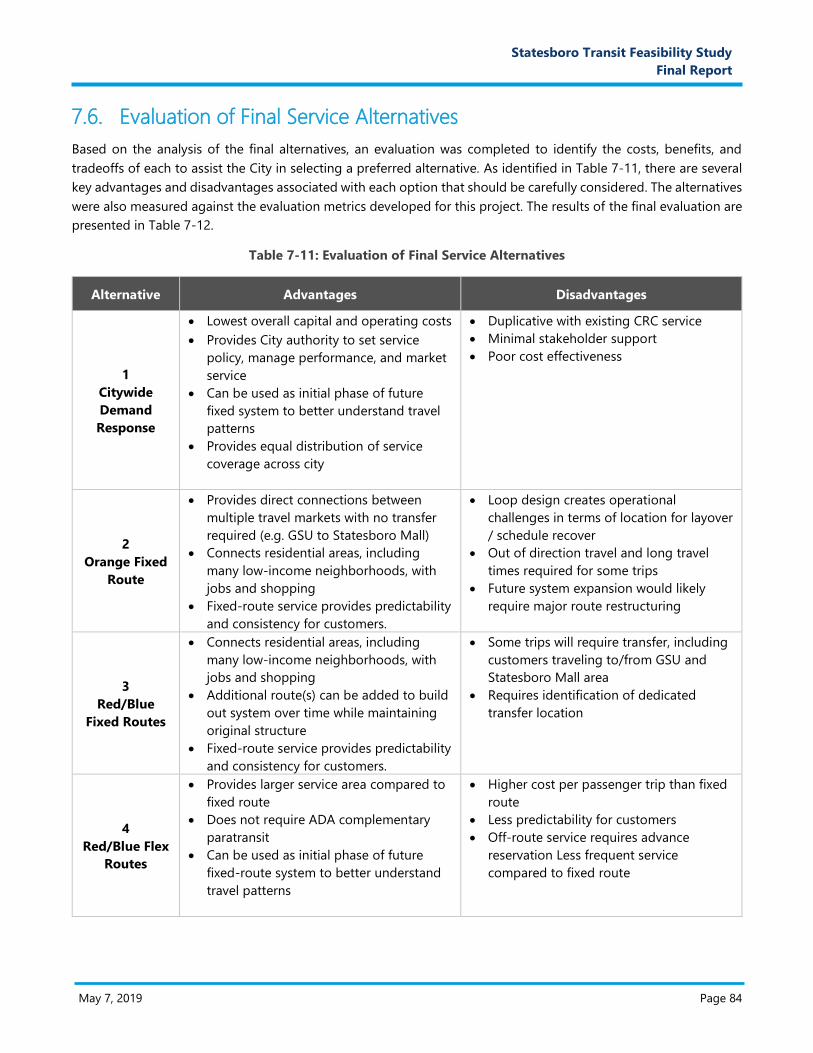
May 7, 2019 Page 84
L. Prop
osal
Narra
tive
Statesboro Transit Feasibility Study
Final Report
7.6. Evaluation of Final Service Alternatives
Based on the analysis of the final alternatives, an evaluation was completed to identify the costs, benefits, and
tradeoffs of each to assist the City in selecting a preferred alternative. As identified in Table 7-11, there are several
key advantages and disadvantages associated with each option that should be carefully considered. The alternatives
were also measured against the evaluation metrics developed for this project. The results of the final evaluation are
presented in Table 7-12.
Table 7-11: Evaluation of Final Service Alternatives
Alternative Advantages Disadvantages
1
Citywide
Demand
Response
Lowest overall capital and operating costs
Provides City authority to set service
policy, manage performance, and market
service
Can be used as initial phase of future
fixed system to better understand travel
patterns
Provides equal distribution of service
coverage across city
Duplicative with existing CRC service
Minimal stakeholder support
Poor cost effectiveness
2
Orange Fixed
Route
Provides direct connections between
multiple travel markets with no transfer
required (e.g. GSU to Statesboro Mall)
Connects residential areas, including
many low-income neighborhoods, with
jobs and shopping
Fixed-route service provides predictability
and consistency for customers.
Loop design creates operational
challenges in terms of location for layover
/ schedule recover
Out of direction travel and long travel
times required for some trips
Future system expansion would likely
require major route restructuring
3
Red/Blue
Fixed Routes
Connects residential areas, including
many low-income neighborhoods, with
jobs and shopping
Additional route(s) can be added to build
out system over time while maintaining
original structure
Fixed-route service provides predictability
and consistency for customers.
Some trips will require transfer, including
customers traveling to/from GSU and
Statesboro Mall area
Requires identification of dedicated
transfer location
4
Red/Blue Flex
Routes
Provides larger service area compared to
fixed route
Does not require ADA complementary
paratransit
Can be used as initial phase of future
fixed-route system to better understand
travel patterns
Higher cost per passenger trip than fixed
route
Less predictability for customers
Off-route service requires advance
reservation Less frequent service
compared to fixed route

May 7, 2019 Page 85
L. Prop
osal
Narra
tive
Statesboro Transit Feasibility Study
Final Report
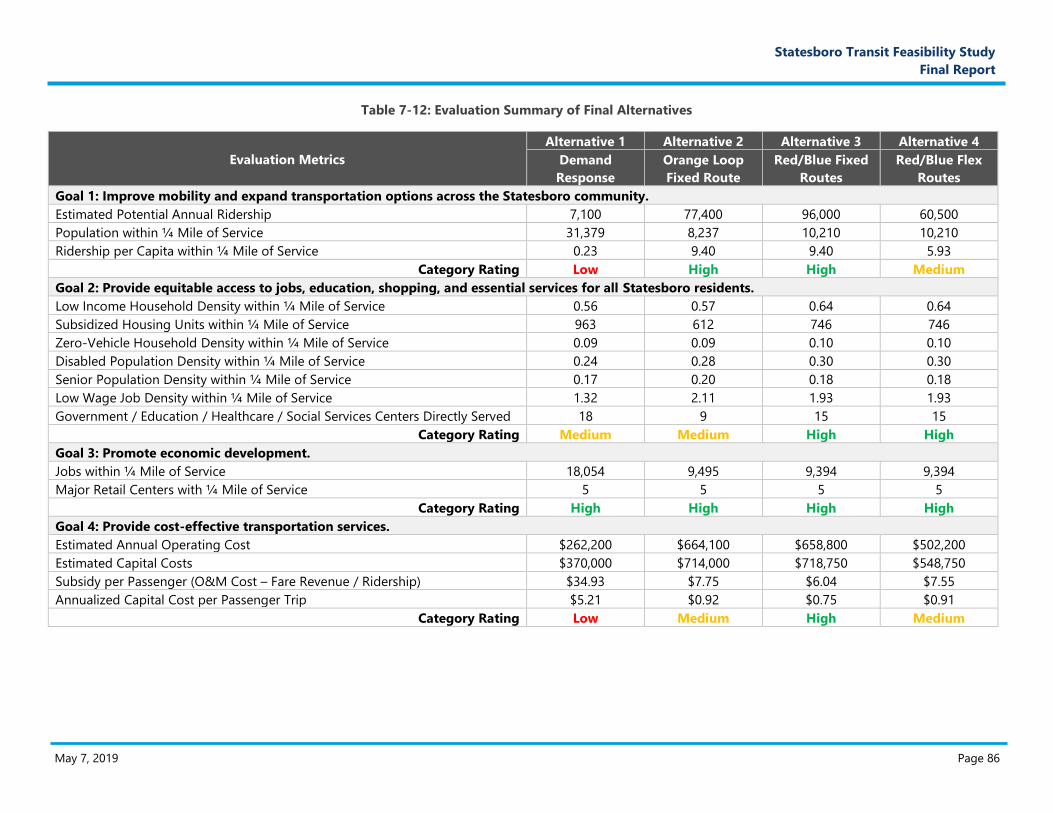
May 7, 2019 Page 86
M. Prop
osal
Narra
tive
Statesboro Transit Feasibility Study
Final Report
Table 7-12: Evaluation Summary of Final Alternatives
Evaluation Metrics
Alternative 1 Alternative 2 Alternative 3 Alternative 4
Demand
Response
Orange Loop
Fixed Route
Red/Blue Fixed
Routes
Red/Blue Flex
Routes
Goal 1: Improve mobility and expand transportation options across the Statesboro community.
Estimated Potential Annual Ridership 7,100 77,400 96,000 60,500
Population within ¼ Mile of Service 31,379 8,237 10,210 10,210
Ridership per Capita within ¼ Mile of Service 0.23 9.40 9.40 5.93
Category Rating Low High High Medium
Goal 2: Provide equitable access to jobs, education, shopping, and essential services for all Statesboro residents.
Low Income Household Density within ¼ Mile of Service 0.56 0.57 0.64 0.64
Subsidized Housing Units within ¼ Mile of Service 963 612 746 746
Zero-Vehicle Household Density within ¼ Mile of Service 0.09 0.09 0.10 0.10
Disabled Population Density within ¼ Mile of Service 0.24 0.28 0.30 0.30
Senior Population Density within ¼ Mile of Service 0.17 0.20 0.18 0.18
Low Wage Job Density within ¼ Mile of Service 1.32 2.11 1.93 1.93
Government / Education / Healthcare / Social Services Centers Directly Served 18 9 15 15
Category Rating Medium Medium High High
Goal 3: Promote economic development.
Jobs within ¼ Mile of Service 18,054 9,495 9,394 9,394
Major Retail Centers with ¼ Mile of Service 5 5 5 5
Category Rating High High High High
Goal 4: Provide cost-effective transportation services.
Estimated Annual Operating Cost $262,200 $664,100 $658,800 $502,200
Estimated Capital Costs $370,000 $714,000 $718,750 $548,750
Subsidy per Passenger (O&M Cost – Fare Revenue / Ridership) $34.93 $7.75 $6.04 $7.55
Annualized Capital Cost per Passenger Trip $5.21 $0.92 $0.75 $0.91
Category Rating Low Medium High Medium
May 7, 2019 Page 87
N. Prop
osal
Narra
tive
Statesboro Transit Feasibility Study
Final Report
7.7. Potential Future Service Improvements
While the service alternatives presented and evaluated in this section represent viable near-term transit initiatives,
consideration was given to potential future improvements that could be phased in over time if an initial system
proves successful. The consideration of future improvements should be predicated on service performance
monitoring of the initial system. This section outlines the framework for a performance monitoring program and
provides a menu of potential service improvements that may be considered in the future.
7.7.1. Performance Monitoring
Typically, transit service takes 12 to 24 months before its full ridership potential is realized. This initiation period
allows riders to develop seasonal ridership patterns and planners to collect enough data to identify month to month
variations associated with summer and holiday periods. During this startup period, ridership data should be
collected daily at a route level and summarized each month. Periodic trip and stop level data that records the
number of boardings and alightings should also be collected to better identify productive (and nonproductive) trips
and route segments. Besides raw ridership data, route productivity should also be measured through a variety of
criteria, including:
Passenger boardings per hour
Passenger boardings per mile
Passenger boardings per trip
Farebox recover percentage
Subsidy per passenger trip
These performance measures can be calculated at a system level to compare with the industry peers. However, it is
also important to calculate these performance measures at the route level so that corrective adjustments can be
made to poorer performing routes while additional investments are targeted toward stronger routes.
7.7.2. Potential Service Improvements
Several future service improvements were identified and costed. The improvements described below are not listed
in a rank order and no recommendation is made regarding prioritization. As noted above, these improvements
should be considered and tailored according to observed demand, funding availability, and community input, once
the system has been operating for some time.
Saturday Service: The base service plan recommends that the initial service operate Monday through
Fridays. However, many potential riders are employment in service and medical fields that also require
availability to work on Saturdays. Moreover, Saturday service would provide opportunities for customers to
access shopping and activities that they are unable to accomplish during the week. Thus, this service
improvement would provide ten hours of service, from 8:00 AM to 6:00 PM on Saturdays, operating on 60-
minute headways.
Sunday Service: While many smaller agencies do not offer Sunday service for financial purposes or low
demand, the City may identify a future need to operate seven days per week. Like Saturdays, providing
Sunday service offers service sector employees the ability to access jobs and others the opportunity to
access shopping, recreation, or religious activities. To meet this need, Sunday service could be offered on
the same schedule as Saturdays, from 8:00 AM to 6:00 PM, operating on 60-minute headways. Depending
on demand, this service span could be reduced accordingly.
May 7, 2019 Page 88
N. Prop
osal
Narra
tive
Statesboro Transit Feasibility Study
Final Report
Add Weekday 30-Minute Peak Period Service: Increasing frequency during peak travel periods (generally
6:00 AM to 9:00 AM and 3:00 PM to 6:00 PM) on weekdays would provide customers additional flexibility
and provide additional system capacity if necessary. This improvement would increase peak frequency on
weekdays from one bus per hour to two buses per hour, with a vehicle arriving at each stop every 30
minutes.
Add Additional Route: An additional route could be considered for implementation in the future to expand
the Alternative 3 (Red and Blue routes) network. The Purple route described in Section 6.2.2. would be the
next logical candidate for implementation due to its strong rating according to the evaluation metrics and
public support. While the Red/Blue network provides basic coverage and connectivity across the
community, it requires a transfer for customers wishing to travel from GSU to the Statesboro Mall retail
area. This Purple route expands the network to provide a direct link between east Statesboro, the Statesboro
Mall area, GSU, and the EGRMC / Market District area. This concept is illustrated in Figure 7-4. This
improvement could be implemented in conjunction with or independent of the improvements noted above.
However, for the purpose of this analysis this strategy is costed assuming seven days per week service and
30-minute peak headways.
Costs and ridership benefits associated with each of these improvements are provided in Tables 7-13 and 7-14
according to each corresponding alternative. For the fixed-route improvements, it is assumed that complementary
ADA paratransit service would be provided accordingly.
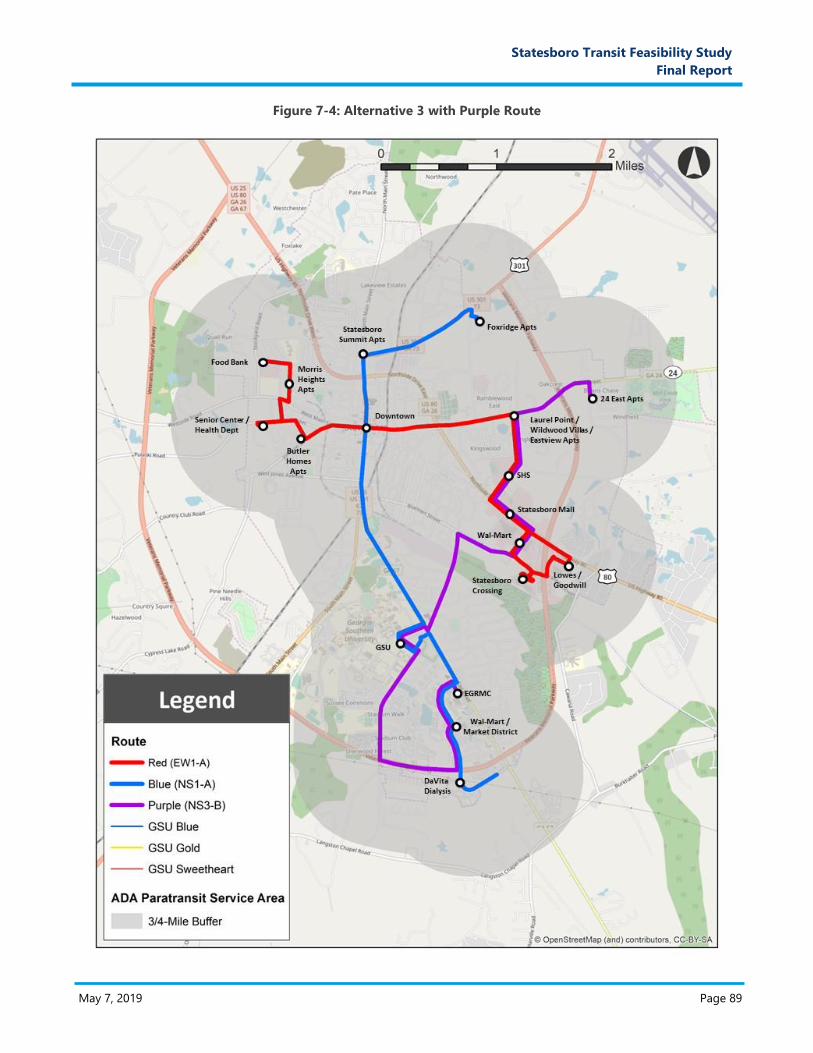
May 7, 2019 Page 89
N. Prop
osal
Narra
tive
Statesboro Transit Feasibility Study
Final Report
Figure 7-4: Alternative 3 with Purple Route
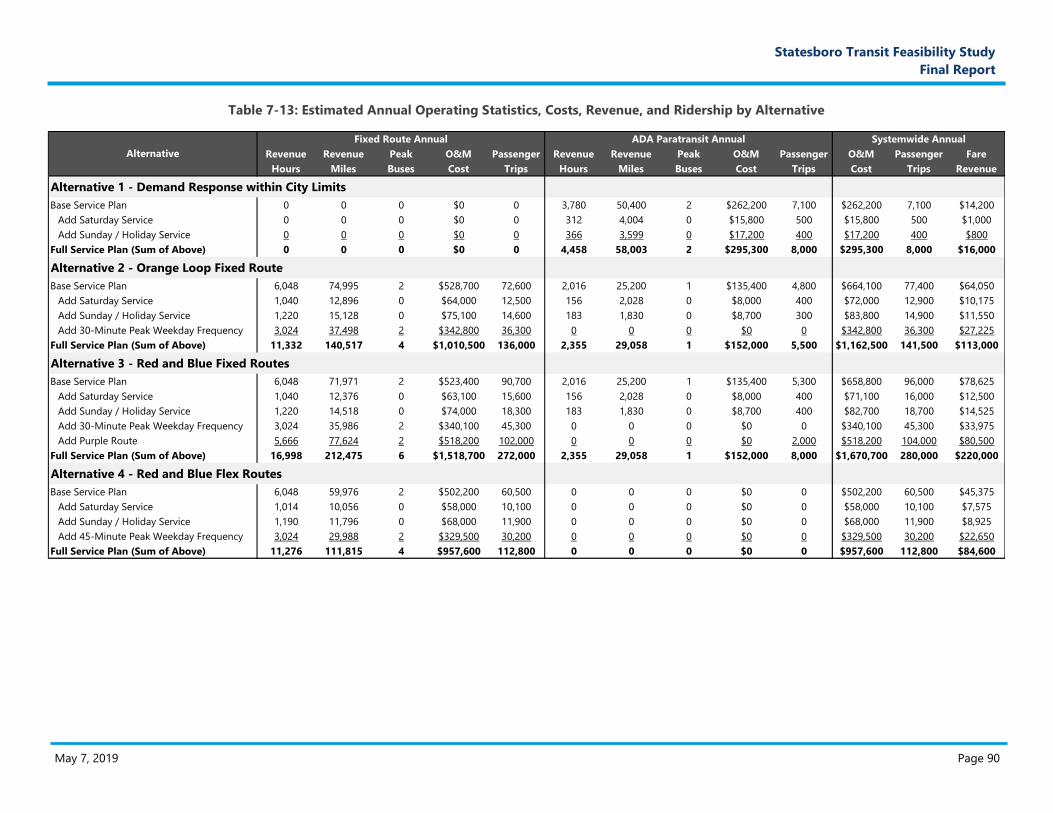
May 7, 2019 Page 90
O. Prop
osal
Narra
tive
Statesboro Transit Feasibility Study
Final Report
Table 7-13: Estimated Annual Operating Statistics, Costs, Revenue, and Ridership by Alternative
Revenue Revenue Peak O&M Passenger Revenue Revenue Peak O&M Passenger O&M Passenger Fare
Hours Miles Buses Cost Trips Hours Miles Buses Cost Trips Cost Trips Revenue
Alternative 1 - Demand Response within City Limits
Base Service Plan 0 0 0 $0 0 3,780 50,400 2 $262,200 7,100 $262,200 7,100 $14,200
Add Saturday Service 0 0 0 $0 0 312 4,004 0 $15,800 500 $15,800 500 $1,000
Add Sunday / Holiday Service 0 0 0 $0 0 366 3,599 0 $17,200 400 $17,200 400 $800
Full Service Plan (Sum of Above) 0 0 0 $0 0 4,458 58,003 2 $295,300 8,000 $295,300 8,000 $16,000
Alternative 2 - Orange Loop Fixed Route
Base Service Plan 6,048 74,995 2 $528,700 72,600 2,016 25,200 1 $135,400 4,800 $664,100 77,400 $64,050
Add Saturday Service 1,040 12,896 0 $64,000 12,500 156 2,028 0 $8,000 400 $72,000 12,900 $10,175
Add Sunday / Holiday Service 1,220 15,128 0 $75,100 14,600 183 1,830 0 $8,700 300 $83,800 14,900 $11,550
Add 30-Minute Peak Weekday Frequency 3,024 37,498 2 $342,800 36,300 0 0 0 $0 0 $342,800 36,300 $27,225
Full Service Plan (Sum of Above) 11,332 140,517 4 $1,010,500 136,000 2,355 29,058 1 $152,000 5,500 $1,162,500 141,500 $113,000
Alternative 3 - Red and Blue Fixed Routes
Base Service Plan 6,048 71,971 2 $523,400 90,700 2,016 25,200 1 $135,400 5,300 $658,800 96,000 $78,625
Add Saturday Service 1,040 12,376 0 $63,100 15,600 156 2,028 0 $8,000 400 $71,100 16,000 $12,500
Add Sunday / Holiday Service 1,220 14,518 0 $74,000 18,300 183 1,830 0 $8,700 400 $82,700 18,700 $14,525
Add 30-Minute Peak Weekday Frequency 3,024 35,986 2 $340,100 45,300 0 0 0 $0 0 $340,100 45,300 $33,975
Add Purple Route 5,666 77,624 2 $518,200 102,000 0 0 0 $0 2,000 $518,200 104,000 $80,500
Full Service Plan (Sum of Above) 16,998 212,475 6 $1,518,700 272,000 2,355 29,058 1 $152,000 8,000 $1,670,700 280,000 $220,000
Alternative 4 - Red and Blue Flex Routes
Base Service Plan 6,048 59,976 2 $502,200 60,500 0 0 0 $0 0 $502,200 60,500 $45,375
Add Saturday Service 1,014 10,056 0 $58,000 10,100 0 0 0 $0 0 $58,000 10,100 $7,575
Add Sunday / Holiday Service 1,190 11,796 0 $68,000 11,900 0 0 0 $0 0 $68,000 11,900 $8,925
Add 45-Minute Peak Weekday Frequency 3,024 29,988 2 $329,500 30,200 0 0 0 $0 0 $329,500 30,200 $22,650
Full Service Plan (Sum of Above) 11,276 111,815 4 $957,600 112,800 0 0 0 $0 0 $957,600 112,800 $84,600
Alternative
Fixed Route Annual ADA Paratransit Annual Systemwide Annual
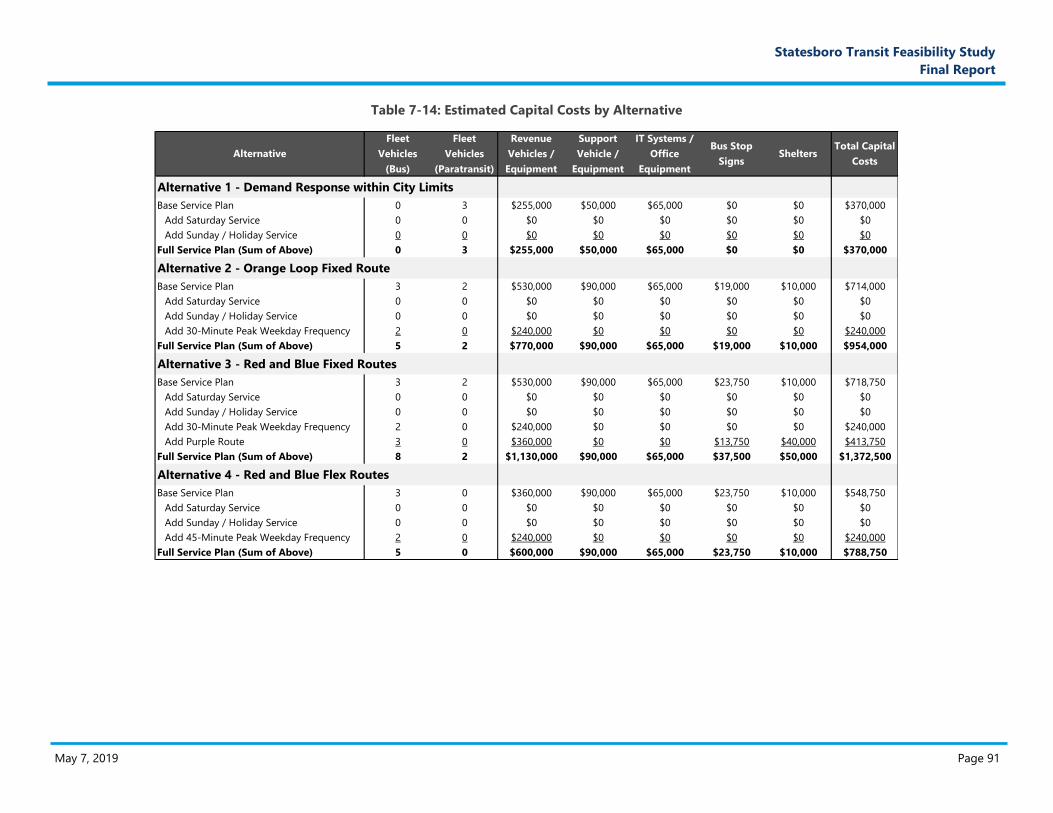
May 7, 2019 Page 91
O. Prop
osal
Narra
tive
Statesboro Transit Feasibility Study
Final Report
Table 7-14: Estimated Capital Costs by Alternative
Alternative 1 - Demand Response within City Limits
Base Service Plan 0 3 $255,000 $50,000 $65,000 $0 $0 $370,000
Add Saturday Service 0 0 $0 $0 $0 $0 $0 $0
Add Sunday / Holiday Service 0 0 $0 $0 $0 $0 $0 $0
Full Service Plan (Sum of Above) 0 3 $255,000 $50,000 $65,000 $0 $0 $370,000
Alternative 2 - Orange Loop Fixed Route
Base Service Plan 3 2 $530,000 $90,000 $65,000 $19,000 $10,000 $714,000
Add Saturday Service 0 0 $0 $0 $0 $0 $0 $0
Add Sunday / Holiday Service 0 0 $0 $0 $0 $0 $0 $0
Add 30-Minute Peak Weekday Frequency 2 0 $240,000 $0 $0 $0 $0 $240,000
Full Service Plan (Sum of Above) 5 2 $770,000 $90,000 $65,000 $19,000 $10,000 $954,000
Alternative 3 - Red and Blue Fixed Routes
Base Service Plan 3 2 $530,000 $90,000 $65,000 $23,750 $10,000 $718,750
Add Saturday Service 0 0 $0 $0 $0 $0 $0 $0
Add Sunday / Holiday Service 0 0 $0 $0 $0 $0 $0 $0
Add 30-Minute Peak Weekday Frequency 2 0 $240,000 $0 $0 $0 $0 $240,000
Add Purple Route 3 0 $360,000 $0 $0 $13,750 $40,000 $413,750
Full Service Plan (Sum of Above) 8 2 $1,130,000 $90,000 $65,000 $37,500 $50,000 $1,372,500
Alternative 4 - Red and Blue Flex Routes
Base Service Plan 3 0 $360,000 $90,000 $65,000 $23,750 $10,000 $548,750
Add Saturday Service 0 0 $0 $0 $0 $0 $0 $0
Add Sunday / Holiday Service 0 0 $0 $0 $0 $0 $0 $0
Add 45-Minute Peak Weekday Frequency 2 0 $240,000 $0 $0 $0 $0 $240,000
Full Service Plan (Sum of Above) 5 0 $600,000 $90,000 $65,000 $23,750 $10,000 $788,750
Total Capital
Costs
Fleet
Vehicles
(Paratransit)
Revenue
Vehicles /
Equipment
Support
Vehicle /
Equipment
IT Systems /
Office
Equipment
Bus Stop
SignsSheltersAlternative
Fleet
Vehicles
(Bus)
May 7, 2019 Page 92
P. Prop
osal
Narra
tive
Statesboro Transit Feasibility Study
Final Report
8. Funding and Implementation If the City of Statesboro elects to move forward with development of a new public transit system, the next steps will
involve identifying and securing adequate funding sources, selecting and establishing a management framework,
and executing a comprehensive start-up program. This section provides an overview of the potential funding
opportunities for public transit, defines the various management models available to the City, and describes the
implementation tasks required to launch a new transit system.
8.1. Potential Funding Sources and Financial Plan Scenarios
A feasible public transit service proposal depends upon the identification of secure funding sources with sufficient
revenue capacity to support its implementation and operation. This section outlines potential sources of revenue
that could be used to fund the capital and operating costs of the service alternatives.
8.1.1. Fare Revenues
Most transit agencies charge passengers a fare to use the public transit system. However, fares are not set simply
based on the cost of each trip. Very few public transit systems around the world generate enough revenue from
fares to cover operating expenses, and therefore have a high reliance on government subsidies.
For FY 2017, the National Transit Database reported that, on average across all modes and all transit systems in
the United States, passenger fares funded 32% of public transit operations. That is, for each dollar spent in
operating costs per trip, 32 cents were recovered through fares.
The fare box recovery ratio is the percent of a trip’s operating costs recovered through passenger fares. This ratio
varies by mode and each transit operator. It is typical, for example, to see lower recovery ratios for fixed-route bus
services than rail services. In FY 2017 across the U.S., fares covered 23.5% of local fixed-route bus operations.
Farebox recovery ratios for demand response services are generally even lower (7.5% in FY 2017).3 Thus, while
farebox revenues will cover some operating costs, other funding mechanisms will need to be identified to fund the
operating costs of the system and assist in matching federal funds.
8.1.2. Federal Funding Sources
The City of Statesboro is eligible to receive both formula and discretionary (competitive) grants from the Federal
Transit Administration (FTA). These grants are funded through federal transportation authorizations. Congress
establishes the legal authority to commence and continue FTA programs through authorizing legislation covering
several years.
On December 4, 2015, President Barack Obama signed the Fixing America’s Surface Transportation (FAST) Act,
reauthorizing surface transportation programs over the five-year period from FY 2016 through FY 2020. The FAST
Act authorizes a total of $305 billion for transportation, with $61.1 billion of this dedicated to public
transportation. The law generally avoids discretionary programs, favoring formula-based programs which supply
more predictable funding streams, enable grantees to identify and plan projects to meet priority needs, and
provide a broader and more equitable distribution of funds.
3 Federal Transit Administration, Office of Budget and Policy, National Transit Database, 2017 National Transit Summary and
Trends, October 2018.
May 7, 2019 Page 93
P. Prop
osal
Narra
tive
Statesboro Transit Feasibility Study
Final Report
FTA funds are generally available for three years after the fiscal year in which the amount is apportioned. The
Governor of a state has flexibility to transfer funds within the State after consulting with local officials and public
transportation operators in each area for which the amount originally was apportioned.
Another funding consideration is that most federal grants require non-federal matching funds. The non-federal
match funding requirements and possible sources vary by the locality’s Census-designated area type, by federal
funding program, and by purpose (i.e., capital vs. operating). For most capital expenses, the federal share is 80% of
the total project cost. In Georgia, the remaining non-federal share of 20% could be required to come exclusively
from local funding or could be split with state funding (i.e., 10% state and 10% local). For most operating expenses
in non-urbanized and small urbanized areas of Georgia, the federal share is 50% of the net project cost. Net
project cost is that portion of the cost of a project that cannot be reasonably financed from fare revenues. The
remaining 50% of the net project cost generally must come from local sources, as Georgia does not currently
provide funds for operating expenses.
The primary programs that could provide planning, operational, and capital funding under the FAST Act include
Planning Programs (Section 5303/5304), Urbanized Area Formula Grants (Section 5307), Enhanced Mobility of
Seniors and Individuals with Disabilities (Section 5310), Formula Grants for Rural Areas (Section 5311), Bus and Bus
Facilities Grant Section 5339(a-c). Table 8-1 and the sections below outline the potential federal funding sources
for capital and operations that are most applicable to Statesboro and Bulloch County.
As discussed above, a locality’s Census-designated area type is important in determining which FTA federal
funding programs are applicable. The Census Bureau identifies two types of urban areas:
Urbanized Areas of 50,000 or more people;
Urban Clusters of at least 2,500 and less than 50,000 people.
“Rural” encompasses all population, housing, and territory not included within an urban area.
The USDOT, including the FTA, however, only classifies areas with 50,000 or more people as being urban. Areas
with less than 50,000 people, including Urban Clusters, are classified as rural by the USDOT. The USDOT further
categorizes Urbanized Areas (UZAs) as small urbanized areas (under 200,000 population) and large urbanized
areas (200,000 or more population).
Why is this important for this discussion of federal funding sources? Based on the 2010 Census, Statesboro is
currently classified as being in an Urban Cluster. The FTA, however, considers it to be rural. This classification has
implications on FTA funding sources available to Statesboro for transit.
Further, when the Census 2020 Urbanized Areas are announced (likely in 2022), the possibility exists that
Statesboro may become a small urbanized area. In fact, a study completed in late 2018 by the Georgia Institute of
Technology identified the Statesboro Urban Cluster as one of four urban clusters in Georgia that may transition to
a small urbanized area via population growth following the 2020 Census.4 The summary of applicable FTA funding
programs that follows, therefore, includes discussion of programs available in both urban and rural areas.
4 Dr. Laurie Garrow, Dr. Thomas Douthat, Anna Nord, Sara Douglass, Trending Urban Urbanization’s Impacts on Federal Funding
in Georgia, www.dot.ga.gov/InvestSmart/Transit/Documents/Presentations/Subrecipient%20Training/Trending%20Urban.pdf
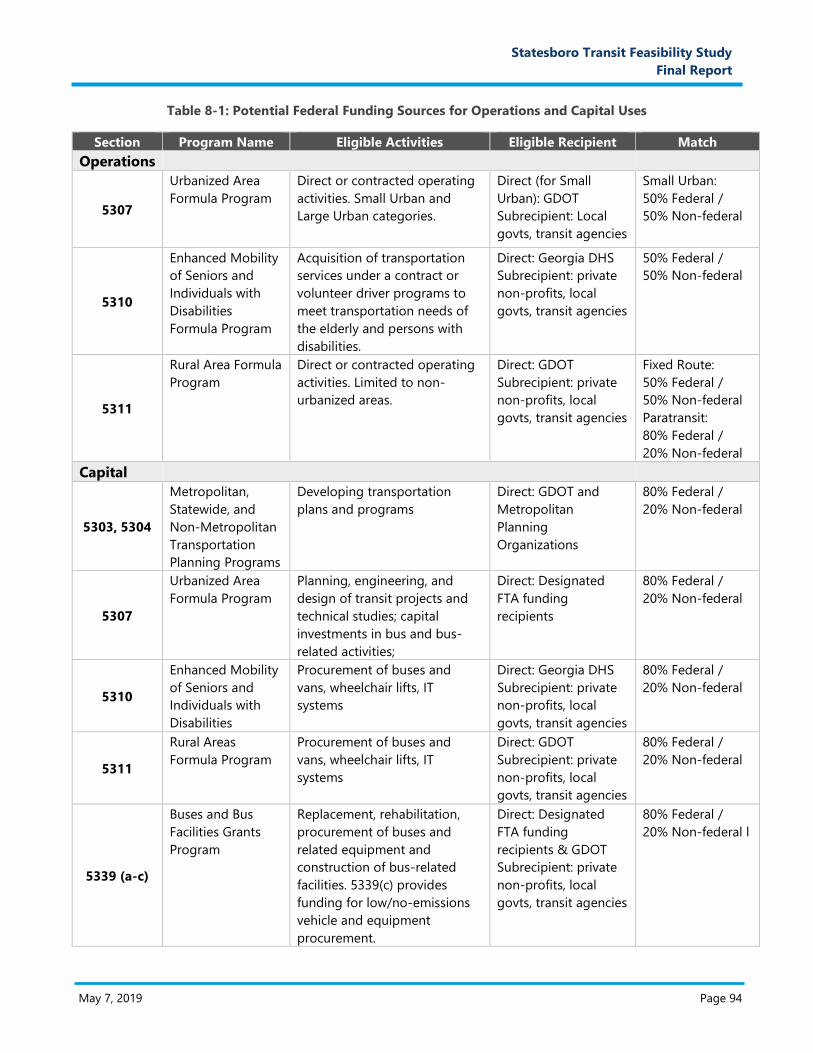
May 7, 2019 Page 94
P. Prop
osal
Narra
tive
Statesboro Transit Feasibility Study
Final Report
Table 8-1: Potential Federal Funding Sources for Operations and Capital Uses
Section Program Name Eligible Activities Eligible Recipient Match
Operations
5307
Urbanized Area
Formula Program
Direct or contracted operating
activities. Small Urban and
Large Urban categories.
Direct (for Small
Urban): GDOT
Subrecipient: Local
govts, transit agencies
Small Urban:
50% Federal /
50% Non-federal
5310
Enhanced Mobility
of Seniors and
Individuals with
Disabilities
Formula Program
Acquisition of transportation
services under a contract or
volunteer driver programs to
meet transportation needs of
the elderly and persons with
disabilities.
Direct: Georgia DHS
Subrecipient: private
non-profits, local
govts, transit agencies
50% Federal /
50% Non-federal
5311
Rural Area Formula
Program
Direct or contracted operating
activities. Limited to non-
urbanized areas.
Direct: GDOT
Subrecipient: private
non-profits, local
govts, transit agencies
Fixed Route:
50% Federal /
50% Non-federal
Paratransit:
80% Federal /
20% Non-federal
Capital
5303, 5304
Metropolitan,
Statewide, and
Non-Metropolitan
Transportation
Planning Programs
Developing transportation
plans and programs
Direct: GDOT and
Metropolitan
Planning
Organizations
80% Federal /
20% Non-federal
5307
Urbanized Area
Formula Program
Planning, engineering, and
design of transit projects and
technical studies; capital
investments in bus and bus-
related activities;
Direct: Designated
FTA funding
recipients
80% Federal /
20% Non-federal
5310
Enhanced Mobility
of Seniors and
Individuals with
Disabilities
Procurement of buses and
vans, wheelchair lifts, IT
systems
Direct: Georgia DHS
Subrecipient: private
non-profits, local
govts, transit agencies
80% Federal /
20% Non-federal
5311
Rural Areas
Formula Program
Procurement of buses and
vans, wheelchair lifts, IT
systems
Direct: GDOT
Subrecipient: private
non-profits, local
govts, transit agencies
80% Federal /
20% Non-federal
5339 (a-c)
Buses and Bus
Facilities Grants
Program
Replacement, rehabilitation,
procurement of buses and
related equipment and
construction of bus-related
facilities. 5339(c) provides
funding for low/no-emissions
vehicle and equipment
procurement.
Direct: Designated
FTA funding
recipients & GDOT
Subrecipient: private
non-profits, local
govts, transit agencies
80% Federal /
20% Non-federal l
May 7, 2019 Page 95
P. Prop
osal
Narra
tive
Statesboro Transit Feasibility Study
Final Report
FTA Sections 5303/5304 Metropolitan, Statewide and Non-Metropolitan Transportation Planning
The Planning Program (Sections 5303/5304) provides funding for the development of transportation long-range
plans and short-range programs, the design and evaluation of public transportation projects, and technical studies
related to public transportation. Planning and programming documents are developed through a continuous,
comprehensive, and cooperative process between states and local officials to meet current needs and prepare for
future challenges.
Eligible recipients are States and Metropolitan Planning Organizations (MPOs). Funds are first allocated by formula
to States, which then allocate the funding to MPOs by a formula based on population, individual planning needs,
and minimum distribution. The federal share is 80% of the cost of projects funded under the program. In Georgia,
the state generally provides 10% of the non-federal match, with the remaining 10% coming from local sources.
Section 5303 funds support transportation planning in urbanized (metropolitan) areas. GDOT provides Section
5303 planning funds to MPOs to carry out transportation system planning activities that comply with the
established USDOT planning factors.
Section 5304 funds support transportation planning statewide. GDOT uses these funds to develop the statewide
Long-Range Transportation Plan (LRTP), as well as the Statewide Strategic Transportation Plan (SSTP) required by
the Georgia Legislature.
Additionally, for the rural areas of Georgia, GDOT provides a portion of its Section 5304 statewide transit planning
apportionment to regional commissions for transportation/transit planning based on their rural area population
as a percentage of the total rural area population of Georgia. GDOT uses a funding formula to allocate these
funds to Georgia’s regional commissions. For the Statesboro area, the Coastal Regional Commission (CRC) is the
sub-recipient for the Section 5304 funds. GDOT generally provides one-half of the 20% non-federal share (i.e.,
10%).
FTA Section 5307 Urbanized Area Formula Program
This program provides funding to urbanized areas for public transit capital, planning, and job access and reverse
commute projects, as well as operating assistance in certain circumstances. Funding is apportioned on the basis
of legislative formulas. For small urbanized areas (50,000 to 199,999 in population), the formula is based on
population and population density. For large urbanized areas (populations of 200,000 and more), the formula is
based on a combination of bus revenue vehicle miles, bus passenger miles, fixed guideway revenue vehicle miles,
and fixed guideway route miles as well as population and population density.
For small urbanized areas in Georgia (e.g., Hinesville), the designated (direct) recipient of funding is GDOT, which
then apportions funding based on local needs and arrangements, in coordination with MPOs. For large urbanized
areas, funds are apportioned and flow directly to a designated recipient selected locally to apply for and receive
FTA funds (e.g., Chatham Area Transit Authority is the designated recipient for the Savannah urbanized area).
The federal share for planning and capital assistance projects is generally 80% of the net project cost. Eligible
purposes are planning, engineering design, and capital investments in bus, fixed guideway systems and related
equipment and facilities. All preventive maintenance and some Americans with Disabilities Act (ADA)
complementary paratransit service are considered capital costs. There are some exceptions to the 80% federal
share for capital projects. For example, a 90% federal share is allowed for the cost of vehicle-related equipment to
comply with ADA and may also be 90% for projects or portions of projects related to bicycles.
May 7, 2019 Page 96
P. Prop
osal
Narra
tive
Statesboro Transit Feasibility Study
Final Report
In small urbanized areas, operating assistance is an eligible expense. The federal share is limited to 50% of the net
project cost. In Georgia, the remaining 50% of the net project cost must come from local sources. In large
urbanized areas, operating assistance is generally not an eligible expense, with limited exceptions for transit
systems operating less than 100 buses.
Section 5307 also includes a provision called the Small Transit Intensive Cities (STIC) program. Under the formula
for STIC, funds are apportioned to small urbanized areas that meet or exceed the average level of service for all
large urbanized areas in one or more of six performance categories.
FTA Section 5310 Enhanced Mobility of Senior and Individuals with Disabilities
Section 5310 provides formula funding to expand mobility options and to meet special transportation needs for
seniors and individuals with disabilities beyond traditional public transportation services and ADA paratransit
services. It provides federal grant assistance to private non‐profit corporations, private companies, or public
agencies to provide safe, efficient and coordinated transportation services for elderly individuals and individuals
with disabilities for whom public transportation is otherwise unavailable, insufficient, or inappropriate. It allows for
the procurement of accessible vans and buses, communication equipment, computer hardware and software, and
Intelligent Transportation System (ITS) equipment for eligible applicants.
Based on Census data, the formula funds are apportioned to each State based on the number of older adults and
individuals with disabilities and allocated by area:
Large UZAs: 60%
Small UZAs: 20%
Rural: 20%
States can transfer small urban or rural allocations to large UZA’s but not the other way around.
In Georgia, the Department of Human Services (DHS) Coordinated Transportation System manages the State’s
Section 5310 funding program. The system is designed to provide transportation services to customers of DHS,
many of whom are elderly, disabled or clients of programs for low income households. Section 5310 projects must
be included in a coordinated human services transportation plan or “locally coordinated plan” (LCP).
At least 55% of program funds must be used on capital or “traditional” projects, which may include: buses and
vans, wheelchair lifts, ramps, securement devises, transit-related IT systems, and mobility management programs.
The remaining 45% is for “nontraditional” projects. Examples include travel training, volunteer driver programs,
building accessible paths to bus stops, improving signage or way-finding technology, incremental cost of
providing same day service or door-to-door service, and purchasing vehicles to support new accessible taxi, rides
sharing and/or vanpooling programs.
The federal share is 80% for eligible capital costs and 50% for operating assistance.
FTA Section 5311 Formula Grants for Rural Areas
This program provides capital, planning, and operating assistance to support public transportation in rural areas
with populations below 50,000. Eligible activities include planning, capital, operating, job access and reverse
commute projects, and the acquisition of public transportation services.
May 7, 2019 Page 97
P. Prop
osal
Narra
tive
Statesboro Transit Feasibility Study
Final Report
FTA apportions funds to states using the formula below:
83.15% of funds apportioned based on land area and population in rural areas;
16.85% of funds apportioned based on land area, revenue-vehicle miles, and low-income individuals in
rural areas.
The federal share is:
80% for capital projects,
80% for ADA complementary paratransit service, using up to 10% of a recipient’s apportionment (20%
under certain conditions), and
50% for operating assistance.
GDOT generally provides one-half of the 20% non-federal share (i.e., 10%) for capital projects and ADA
complementary paratransit service. The non-federal 50% match for operating assistance must come from local
sources.
GDOT is the designated recipient and administers the Section 5311 program for the State of Georgia. Eligible
subrecipients include state or local governmental authorities, non-profit organizations, public transportation
operators, or intercity bus service that receives funds indirectly through a recipient.
Section 5311 supports the maintenance of existing public transportation services and the expansion of rural public
transportation services through the following program goals:
Enhancing access in rural areas to health care, shopping, education, employment, public services, and
recreation;
Assisting in the maintenance, development, improvement, and use of public transportation systems in
rural areas;
Encouraging and facilitating the most efficient use of all transportation funds used to provide passenger
transportation in rural areas through the coordination of programs and services;
Providing financial assistance to help carry out national goals related to mobility for all, including seniors,
individuals with disabilities, and low‐income individuals;
Increasing availability of transportation options through investments in intercity bus services making
meaningful connections to and from rural areas;
Assisting in the development and support of intercity bus transportation;
Encouraging mobility management, employment‐related transportation alternatives, joint development
practices, and transit‐oriented development; and
Providing for the participation of private transportation providers in rural public transportation.
GDOT has established several specific objectives designed to meet the Section 5311 program goals. These
objectives include:
Facilitate cooperative working relationships among local, regional and private sector agencies and
promote adequate cost effective rural public transportation services.
Meet the needs of rural public transportation for the general public by providing resources to increase
capacity and frequency of rural transit services where appropriate.
Coordinate rural transit services and ensure that all program recipients comply with all federal program
guidelines and regulations.
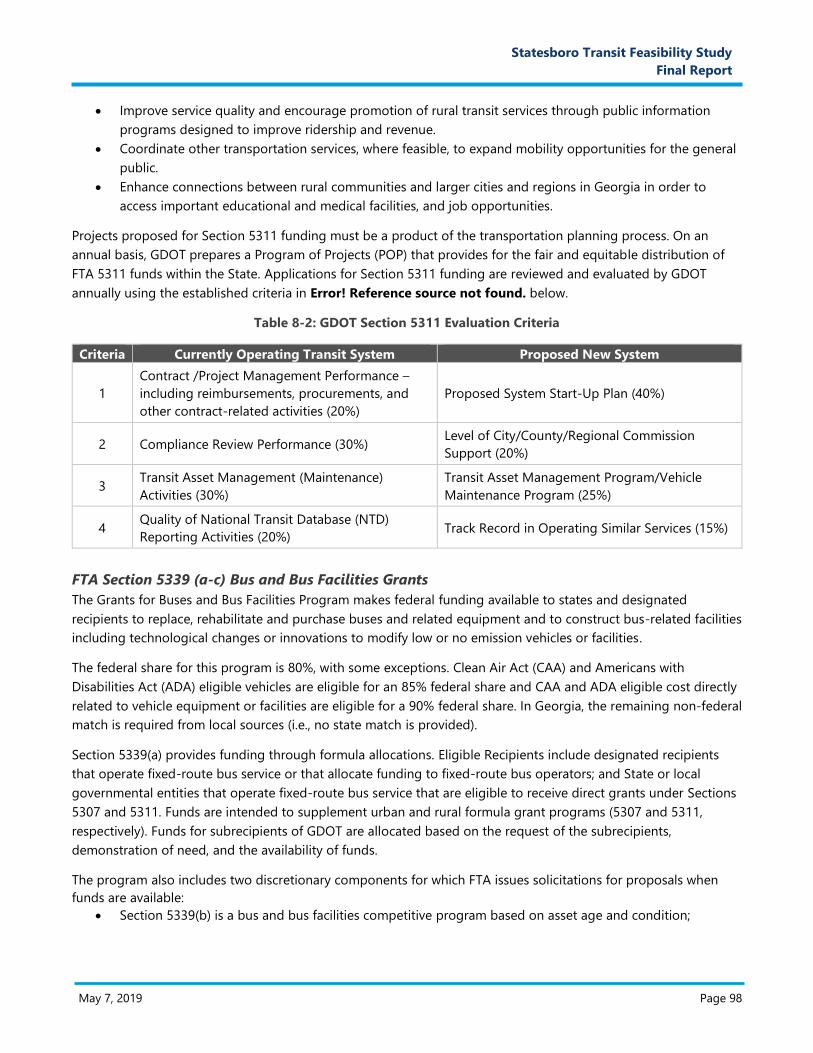
May 7, 2019 Page 98
P. Prop
osal
Narra
tive
Statesboro Transit Feasibility Study
Final Report
Improve service quality and encourage promotion of rural transit services through public information
programs designed to improve ridership and revenue.
Coordinate other transportation services, where feasible, to expand mobility opportunities for the general
public.
Enhance connections between rural communities and larger cities and regions in Georgia in order to
access important educational and medical facilities, and job opportunities.
Projects proposed for Section 5311 funding must be a product of the transportation planning process. On an
annual basis, GDOT prepares a Program of Projects (POP) that provides for the fair and equitable distribution of
FTA 5311 funds within the State. Applications for Section 5311 funding are reviewed and evaluated by GDOT
annually using the established criteria in Error! Reference source not found. below.
Table 8-2: GDOT Section 5311 Evaluation Criteria
Criteria Currently Operating Transit System Proposed New System
1
Contract /Project Management Performance –
including reimbursements, procurements, and
other contract-related activities (20%)
Proposed System Start-Up Plan (40%)
2 Compliance Review Performance (30%) Level of City/County/Regional Commission
Support (20%)
3 Transit Asset Management (Maintenance)
Activities (30%)
Transit Asset Management Program/Vehicle
Maintenance Program (25%)
4 Quality of National Transit Database (NTD)
Reporting Activities (20%) Track Record in Operating Similar Services (15%)
FTA Section 5339 (a-c) Bus and Bus Facilities Grants
The Grants for Buses and Bus Facilities Program makes federal funding available to states and designated
recipients to replace, rehabilitate and purchase buses and related equipment and to construct bus-related facilities
including technological changes or innovations to modify low or no emission vehicles or facilities.
The federal share for this program is 80%, with some exceptions. Clean Air Act (CAA) and Americans with
Disabilities Act (ADA) eligible vehicles are eligible for an 85% federal share and CAA and ADA eligible cost directly
related to vehicle equipment or facilities are eligible for a 90% federal share. In Georgia, the remaining non-federal
match is required from local sources (i.e., no state match is provided).
Section 5339(a) provides funding through formula allocations. Eligible Recipients include designated recipients
that operate fixed-route bus service or that allocate funding to fixed-route bus operators; and State or local
governmental entities that operate fixed-route bus service that are eligible to receive direct grants under Sections
5307 and 5311. Funds are intended to supplement urban and rural formula grant programs (5307 and 5311,
respectively). Funds for subrecipients of GDOT are allocated based on the request of the subrecipients,
demonstration of need, and the availability of funds.
The program also includes two discretionary components for which FTA issues solicitations for proposals when
funds are available:
Section 5339(b) is a bus and bus facilities competitive program based on asset age and condition;
May 7, 2019 Page 99
P. Prop
osal
Narra
tive
Statesboro Transit Feasibility Study
Final Report
Section 5339(c) is a low or no emissions bus and bus facility competitive program focused on deployment
of the cleanest and most energy efficient transit buses not yet widely deployed in transit fleets.
Eligible applicants for both 5339(b) and 5339(c) include direct recipients of FTA grants under the Section 5307
Urbanized Area Formula program and States. Proposals for projects in rural (non-urbanized) areas must be
submitted as part of a consolidated State proposal.
For Section 5339(b), FTA is required to “consider the age and condition of buses, bus fleets, related equipment,
and bus-related facilities” in selecting projects for funding. Accordingly, FTA prioritizes projects that demonstrate
how they will address significant repair and maintenance needs, improve the safety of transit systems, deploy
connective projects that include advanced technologies to connect bus systems with other networks, and support
the creation of ladders of opportunity.
The Section 5339(c) “Low No” Program provides funding through a competitive process to States and transit
agencies to purchase or lease low or no emission transit buses and related equipment, or to lease, construct, or
rehabilitate facilities to support low or no emission transit buses. The program provides funding to support the
wider deployment of advanced propulsion technologies within the nation’s transit fleet. No emission examples
include electric, hydrogen, or fuel cell vehicles. Low emission examples include CNG and hybrid vehicles. Because of
the program’s emphasis on clean fuels, the higher federal shares of 85% for vehicles and 90% for vehicle equipment
and facilities apply.
8.1.3. Local Funding Sources
Local funds will be necessary to provide the local match share of the federal capital grants and the operating costs
not covered by the passenger farebox revenue and federal operating assistance. There are a number of different
mechanisms to raise local funding for transit service. While general fund appropriations, property taxes or sales
taxes are the most common sources to fund transit systems, the possibilities are virtually endless. Below is a
summary of some of the more common local transit funding sources.
General Fund Appropriations
The additional costs of the public transit service are often covered by reallocating funds within local general funds.
Historically, the use of the general funds for transit service reduces the long-term reliability of transit funding,
especially when down economies result in fewer available funds.
Property Taxes
Property tax revenues are common sources for funding transit operations and capital investments. Local
governments in the Statesboro area could elect to increase property taxes and dedicate the additional revenue to
public transit services.
Special Purpose Local Option Sales Taxes (SPLOST)
Georgia law allows local jurisdictions to use SPLOST proceeds for capital improvement projects that would
otherwise be paid for with general funds and property tax revenues. For example, Athens-Clarke County has
utilized SPLOST funding to finance a bus shelter program, construct a Multi-Modal Transportation Center, and
purchase and replace transit vehicles.
Transportation Special Purpose Local Option Sales Taxes (T-SPLOST)
A 58.7 percent majority of Bulloch County voters approved the Transportation Special Purpose Local Option Sales
Tax in a May 22, 2018 referendum. Statesboro is projected to receive $20.64 million to $25.8 million in T-SPLOST
May 7, 2019 Page 100
P. Prop
osal
Narra
tive
Statesboro Transit Feasibility Study
Final Report
revenue over the next five years. Of this, $450,000 over the life of the T-SPLOST is earmarked for public
transportation in Statesboro.
Other Local Taxes
Other potential sources of local taxes that could be used for transit include:
A dedicated tax or fee on the sale or registration of vehicles
Several fuel tax options (above and beyond the current federal, state, and local taxes) on motor fuels
purchased in Bulloch County
Occupational taxes
Selective taxes applied to specific items such as tobacco, alcohol, and tourism related activities such as
hotels or rental cars
Advertising Revenues
While usually a very small component of operating costs, most transit agencies do gain some revenue from
advertising. Transit systems now sell the rights for companies to advertise on buses, benches, shelters, transfer
facilities, kiosks, schedules, transfers, passes, system maps, etc. The transit system can realize cash revenue, or be
compensated in trade (e.g., getting “free” advertising on radio stations that are advertising on the bus).
Non-DOT Federal Funds as Local Match
In recent federal transportation authorizations, it has become possible for applicants to use non-DOT federal
funds as local match, creating the possibility of local communities implementing transit projects with 100% federal
funding. Use of non-DOT federal funds as local match is now possible under the following FTA programs:
Section 5307 (Urbanized Area Formula Program),
Section 5310 (Enhance Mobility for Seniors and Individuals with Disabilities), and
Section 5311(Formula Grants for Rural Areas).
In recent years, U.S. Department of Health and Human Services, U.S Department of Labor, and U.S Department of
Housing and Urban Development are some agencies whose funds have been used as local match. One example is
Older Americans Act (OAA) Title IIIB Supportive Services Funds.
8.1.4. State Funding
The Georgia Public Transportation Code authorizes GDOT to participate in providing public transportation services
in Georgia. However, the State of Georgia does not have any funds specifically designated for transit purposes.
GDOT has provided some funding for transit capital projects, such as park & ride lots, and for assistance with the
non-federal matching share of capital and preventive maintenance projects. GDOT provides this funding through
State General Fund budget requests. Typically, GDOT is able to request State General Funds for one-half of the
non-federal match (or 10%) required for capital projects with an 80% federal share.
The State funds are administered by the GDOT Office of Intermodal Programs. The City would need to work
closely with GDOT to include the transit projects in the Statewide Transportation Improvement Program (STIP)
prior to requesting state funds, as well as work with GDOT and the local legislative delegation during upcoming
sessions of the Georgia General Assembly to secure the State funding.
8.1.5. Process for Obtaining Federal and State Funding
As discussed earlier in this section, FTA funding requests for rural and small urbanized areas in Georgia are made
through the GDOT Office of Intermodal Programs. Each fall, GDOT issues a call for projects under the FTA Section
May 7, 2019 Page 101
P. Prop
osal
Narra
tive
Statesboro Transit Feasibility Study
Final Report
5303, 5304, 5307, 5311 and 5339 programs for the following state fiscal year. Each year GDOT staff receive
approximately 115 applications requesting financial assistance from FTA programs listed above. If Statesboro
pursues Section 5311 funds, it is worth noting that the Coastal Regional Commission (CRC) is the established
subrecipient for the 10-county region that includes Statesboro and Bulloch County. It would be out of the ordinary,
but not impossible, for GDOT to provide Section 5311 funding to more than one sub-recipient for a particular
jurisdiction.
A critical path item to be aware of is that all proposed project activities submitted in the applications must be derived
from an approved Statewide Transportation Improvement Program (STIP) or, in the case of urbanized areas, a
Transportation Improvement Program (TIP) prepared by the MPO for the urbanized area. The STIP is Georgia’s four-
year transportation and capital improvements program. It lists all federally-funded transportation projects that are
located outside MPO boundaries and incorporates each MPO’s TIP by reference. The STIP is developed in
coordination with the citizens of Georgia, interested stakeholders, and in direct cooperation with local governments.
The next call for projects will take place in October 2019 for projects to be funding in state FY 2021 (July 1, 2020
through June 30, 2021). The general timeline for the application process is outlined below.
November:
o Applications are due.
December through February:
o GDOT reviews and evaluates applications utilizing the scoring criteria outlined in the application.
o The review also considers the projected amount of funding available under each respective
program against the total requested.
March 30:
o State Legislative session ends and the state budget for the next fiscal year is approved.
o GDOT submits all grant applications for submittal in FTA’s grant system. The completion of FTA
grant applications must also consider the approved Governor’s Budget which includes 10% state
match for various FTA programs.
April through May:
o FTA reviews all GDOT grant applications
o GDOT issues “Notice of Intent to Award (NOIA),” contingent upon receipt of grant funds from FTA
to allow subrecipients to begin preparations for the upcoming fiscal year.
o GDOT prepares Contract Authorization Requests (CARs) for each of the anticipated contracts,
detailing the amount of federal, state and local funds.
June:
o FTA issues grant awards.
o GDOT prepares electronic contract documents.
July 1:
o GDOT begins issuing electronic contract documents for the fiscal year.
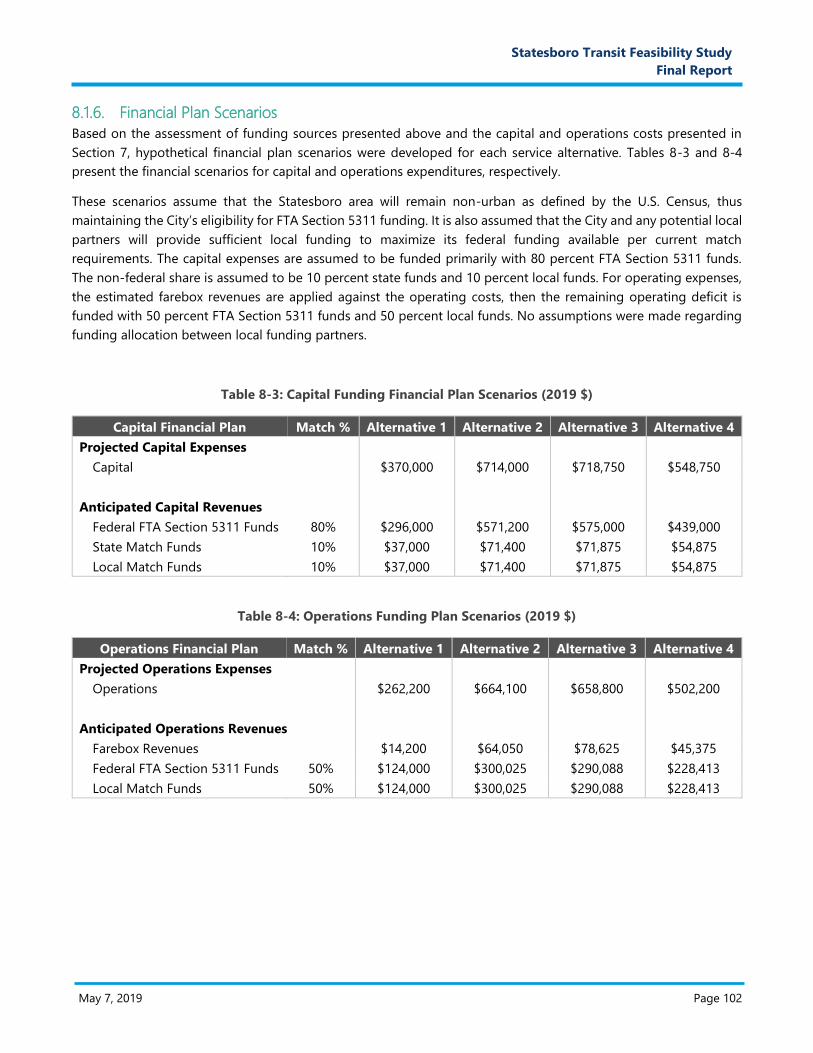
May 7, 2019 Page 102
P. Prop
osal
Narra
tive
Statesboro Transit Feasibility Study
Final Report
8.1.6. Financial Plan Scenarios
Based on the assessment of funding sources presented above and the capital and operations costs presented in
Section 7, hypothetical financial plan scenarios were developed for each service alternative. Tables 8-3 and 8-4
present the financial scenarios for capital and operations expenditures, respectively.
These scenarios assume that the Statesboro area will remain non-urban as defined by the U.S. Census, thus
maintaining the City’s eligibility for FTA Section 5311 funding. It is also assumed that the City and any potential local
partners will provide sufficient local funding to maximize its federal funding available per current match
requirements. The capital expenses are assumed to be funded primarily with 80 percent FTA Section 5311 funds.
The non-federal share is assumed to be 10 percent state funds and 10 percent local funds. For operating expenses,
the estimated farebox revenues are applied against the operating costs, then the remaining operating deficit is
funded with 50 percent FTA Section 5311 funds and 50 percent local funds. No assumptions were made regarding
funding allocation between local funding partners.
Table 8-3: Capital Funding Financial Plan Scenarios (2019 $)
Capital Financial Plan Match % Alternative 1 Alternative 2 Alternative 3 Alternative 4
Projected Capital Expenses
Capital $370,000 $714,000 $718,750 $548,750
Anticipated Capital Revenues
Federal FTA Section 5311 Funds 80% $296,000 $571,200 $575,000 $439,000
State Match Funds 10% $37,000 $71,400 $71,875 $54,875
Local Match Funds 10% $37,000 $71,400 $71,875 $54,875
Table 8-4: Operations Funding Plan Scenarios (2019 $)
Operations Financial Plan Match % Alternative 1 Alternative 2 Alternative 3 Alternative 4
Projected Operations Expenses
Operations $262,200 $664,100 $658,800 $502,200
Anticipated Operations Revenues
Farebox Revenues $14,200 $64,050 $78,625 $45,375
Federal FTA Section 5311 Funds 50% $124,000 $300,025 $290,088 $228,413
Local Match Funds 50% $124,000 $300,025 $290,088 $228,413
May 7, 2019 Page 103
P. Prop
osal
Narra
tive
Statesboro Transit Feasibility Study
Final Report
8.2. Service Delivery Options
This section evaluates the various service delivery options available to the City of Statesboro to implement and
operate a new transit service. Each option has distinct advantages and disadvantages that can vary significantly
depending on the City’s objectives, the type(s) of service to be provided, financial resources, accountability, ease of
implementation, legal impacts, and other issues.
Three management options were defined, representing different types of involvement by the City. Opportunities for
the City to contract out the transit services were given special attention. One benefit from contracting service is
obtaining a lower cost through competitive bidding. The competitive process would give bidders an incentive to
offer their services at the lowest possible cost. A second benefit is flexibility in dealing with employees and workplace
issues. Where public employees provide public services, it can be difficult to make major changes, such as major
expansion or reduction in the amount of service provided. By contrast, when a service provider is retained by
contract to provide service, the contracts can be structured to be periodically reviewed, or to require regular renewal
or renegotiations at which time changes can be made. Also, if any of the new proposed transit services proved to
be unsuccessful, the public agency likely could more easily discontinue that service if it was contracted out.
A broad outline of potential management options for providing the public transit services are presented below.
Each of these options assume a primary role by the City of Statesboro, given the proposed focus of the service area
on City, although Bulloch County could also function as a funding partner.
Option A – City Owned & Operated. The City of Statesboro would have the primary responsibility to plan,
finance and operate the recommended public transportation services. The City would purchase vehicles and
employ all personnel required for service delivery.
Option B – Turnkey Contracted Service. This option would involve the City of Statesboro delegating all
aspects of the operations and maintenance of the transit system to a third-party service contractor. The City
would assume overall authority of the system, but its primary functions would be limited to contract
management, oversight of the contractor, and other administrative functions such as planning, grants
management, and compliance. Under this approach, the City would most likely issue a Request for Proposals
(RFP) to qualified operators who would develop technical and cost proposals for a pre-determined level of
service specified in the RFP. Then, the City would receive proposals, evaluate, and select the best qualified
service provider based on a set of predetermined evaluation criteria. It is important to note that the service
provider could be private or public. Thus, the CRC or any one of the numerous companies providing contract
transit services could propose and be selected to provide the services. As previously discussed, the CRC is
already providing service in the area and a private operator currently provides campus transit services on
behalf of GSU. Under this turnkey scenario, it is assumed that the City would require that the contractor
provide capital assets including revenue and non-revenue fleet vehicles and a transit operations and
maintenance facility.
Option C – City-Owned Assets / Contracted Operations and Maintenance. This approach hybrid of the
two options described above. The City would have administrative responsibility for the system and would
purchase and own the vehicles, and perhaps, the vehicle operations and maintenance facility. Then, a service
provider would be retained by contract to hire the employees, operate, and maintain the transit services.
May 7, 2019 Page 104
P. Prop
osal
Narra
tive
Statesboro Transit Feasibility Study
Final Report
8.2.1. Evaluation of Service Delivery Options
The management options discussed above were analyzed with respect to three concerns: finance and legal issues,
functional criteria, and compatibility with alternative service plans.
Finance and Legal: Each of the management options potentially requires some action by the local
governments within the transit service area. An additional legal requirement could be for a voter referendum
dependent on financing options that may be considered. The Georgia Constitution prohibits a county from
incurring any new debt without the assent of a majority of voters voting in an election held for that purpose.
A fiscal liability that cannot be discharged by taxes levied within the year in which the liability is undertaken
is considered “debt,” although multi-year vehicle leases are specifically exempted from this requirement by
state law. Thus, Option B would provide the most flexibility to acquire the assets required to operate the
service without having to take on or gain approval for new debt.
Functional Criteria. The functional criteria that the public entities take responsibility for is an important
concern. With Option A, it is assumed that the City would take on all functional responsibilities. At the other
extreme with Option B, the City could rely on a contract to provide all services including the direct
operations, the acquisition of fixed assets (buses, operations and maintenance facility, bus stops and
shelters), and marketing and customer service. In between with Option C, the City can retain all
responsibilities except for the “pure” transportation and maintenance functions (i.e., for drivers and vehicle
maintenance). Where in this spectrum the public entities will eventually choose to position themselves will
depend on a number of considerations, including knowledge and experience of staff, assumption of risk,
and implementation time.
Compatibility with Alternative Service Plans. Regardless of the level of investment in services that the
public entities decide to pursue, Option B or C would offer a new public service without significantly
increasing the number of City employees and affecting their associated expertise with both the delivery and
maintenance of a transit system.
May 7, 2019 Page 105
P. Prop
osal
Narra
tive
Statesboro Transit Feasibility Study
Final Report
8.3. Implementation Plan
This section provides a description of the major implementation tasks and a general schedule to implement a new
transit service in Statesboro. For the purpose of this discussion, it is assumed that management Option C: City-
Owned Assets / Contracted O&M would be the preferred service delivery model. However, regardless of the selected
organizational and management structure, most of the same key activities described in this section would still be
applicable.
8.3.1. Implementation Planning Tasks and Schedule
Once the City decides to move forward with implementation, the first 12 months will involve activities to secure the
necessary capital and operations funding (including interagency funding agreement, Statewide Transportation
Improvement Program [STIP], FTA grants, and State funding commitment and contract, and local funding
commitments) for the system. A first step would involve establishing and hiring a dedicated staff position to plan,
coordinate, and oversee the transit program. The person selected for this position would immediately initiate start-
up activities for the transit program. During year 1, it is also recommended that the City establish a Transit Advisory
Committee to provide guidance to assist with the transit implementation process and policy issues. Other key tasks
in the near-term include ADA paratransit application and procedures, adoption of fare structure, and development
of a marketing/ promotion/ informational campaign.
Adequate lead times would be particularly critical for 1) procurement of the buses, 2) procurement of the service
provider, and 3) construction/renovation of facilities, such as transfer centers and an operations & maintenance
(O&M) facility. A period of 12-18 months could be required for procurement, manufacture, and delivery of the buses
and paratransit vehicles. However, this duration could be much shorter if the vehicles are able to be purchased from
a statewide contract. As applicable, a Request for Proposals (RFP) to contract with a service provider would be
developed and issued. Procurement of a service contractor generally requires a minimum of 6 months. From the
signing of the service contract to the first day of operations could take approximately 3 additional months.
The development of major transit facilities will likely require the longest lead times. Perhaps the most critical facility
need will be the O&M facility. Facility functions typically include vehicle maintenance and fueling, parts storage,
overnight vehicle storage, and administration and transportation areas (such as drivers’ room and lockers). Generally,
transit agencies prefer to develop and own their O&M facility so that over the long-term, operations costs can be
minimized and effective preventive maintenance can be maximized. However, facility implementation timelines
often require three to five years. In the short-term, it is assumed that maintenance, storage, and fueling functions
could be accommodated at an existing fleet maintenance facility owned by the local government, or, if service is
contracted out, at a facility provided by the contractor.
Depending on the location selected for the downtown transfer center, site-access and use agreements with property
owners may be required at a minimum, however full lease agreements could also be required. Other locations
throughout the system where the bus will enter private property may also require such agreements, including Wal-
Mart, Statesboro Mall, the Food Bank, and EGRMC. Sites must be identified and agreements negotiated with
property owners well in advance of the start of transit service.
Considering the above discussion, the implementation schedule for the first day of revenue service primarily will be
driven by the 24 to 30-month time period required to secure funding, procure, manufacture, and receive delivery of
the buses and procure a service contractor.
May 7, 2019 Page 106
P. Prop
osal
Narra
tive
Statesboro Transit Feasibility Study
Final Report
Typically, the start-up of new transit service requires several months to reach a stable period of operation. During
the transitional period, the City will need to monitor sufficiency of the service, customer response, operations &
maintenance performance, and vehicle performance and will make adjustments as required.
8.3.2. Implementation Work Program
Implementation of a start-up transit system is a complex endeavor, which typically requires close coordination with
multiple agencies and private businesses, adherence to a detailed project schedule, maximizing and securing
funding commitments, procuring multiple capital items and services, and hiring transit staff. For that reason, it is
anticipated that the next step in moving forward with a transit system start-up would be to initiate an
implementation planning program. That process should begin with the development of an Implementation Work
Plan. The Implementation Work Plan would further detail and define implementation tasks and subtasks, assign
responsibilities, and develop detailed schedules, milestones, and a financial plan. Table 8-5 summarizes major tasks
that may be required for the initial year rollout of public transit service. Each task is notated to indicate applicable
service alternatives and delivery models, as the final selection of these key decision points will dictate the final scope
of the work plan.
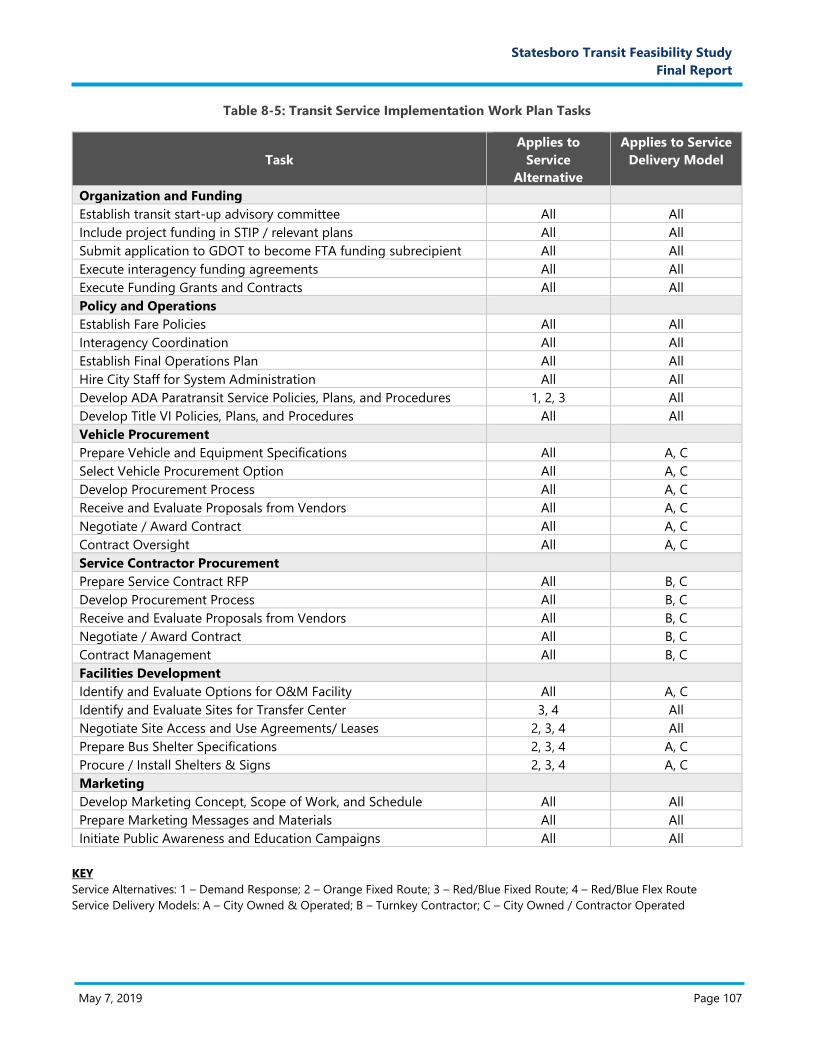
May 7, 2019 Page 107
P. Prop
osal
Narra
tive
Statesboro Transit Feasibility Study
Final Report
Table 8-5: Transit Service Implementation Work Plan Tasks
Task
Applies to
Service
Alternative
Applies to Service
Delivery Model
Organization and Funding
Establish transit start-up advisory committee All All
Include project funding in STIP / relevant plans All All
Submit application to GDOT to become FTA funding subrecipient All All
Execute interagency funding agreements All All
Execute Funding Grants and Contracts All All
Policy and Operations
Establish Fare Policies All All
Interagency Coordination All All
Establish Final Operations Plan All All
Hire City Staff for System Administration All All
Develop ADA Paratransit Service Policies, Plans, and Procedures 1, 2, 3 All
Develop Title VI Policies, Plans, and Procedures All All
Vehicle Procurement
Prepare Vehicle and Equipment Specifications All A, C
Select Vehicle Procurement Option All A, C
Develop Procurement Process All A, C
Receive and Evaluate Proposals from Vendors All A, C
Negotiate / Award Contract All A, C
Contract Oversight All A, C
Service Contractor Procurement
Prepare Service Contract RFP All B, C
Develop Procurement Process All B, C
Receive and Evaluate Proposals from Vendors All B, C
Negotiate / Award Contract All B, C
Contract Management All B, C
Facilities Development
Identify and Evaluate Options for O&M Facility All A, C
Identify and Evaluate Sites for Transfer Center 3, 4 All
Negotiate Site Access and Use Agreements/ Leases 2, 3, 4 All
Prepare Bus Shelter Specifications 2, 3, 4 A, C
Procure / Install Shelters & Signs 2, 3, 4 A, C
Marketing
Develop Marketing Concept, Scope of Work, and Schedule All All
Prepare Marketing Messages and Materials All All
Initiate Public Awareness and Education Campaigns All All
KEY
Service Alternatives: 1 – Demand Response; 2 – Orange Fixed Route; 3 – Red/Blue Fixed Route; 4 – Red/Blue Flex Route
Service Delivery Models: A – City Owned & Operated; B – Turnkey Contractor; C – City Owned / Contractor Operated
May 7, 2019 Page 108
P. Prop
osal
Narra
tive
Statesboro Transit Feasibility Study
Final Report
Appendix
May 7, 2019 Page 109
P. Prop
osal
Narra
tive
Statesboro Transit Feasibility Study
Final Report
Appendix A: Stakeholder Interview Results
1. Is some form of public transportation needed in Statesboro, beyond the human services transportation
provided by the Coastal Regional Commission (CRC) and campus shuttles provided by Georgia
Southern University (GSU)? (If yes, go to question #2. If no, go to question #11)
Response Summary: In general, respondents indicated that there is a need for public transportation in
Statesboro. Some stakeholders indicated that their constituents have raised various concerns regarding
limited mobility options. Others pointed out that there needs to be better coordination between the various
public and private entities current providing transportation services, such as the colleges, CRC, and shuttles
operated by apartment complexes.
2. On a scale of 1 to 5 (with 1 as a low priority, 5 as high), how high a priority is public transportation for
the Statesboro area?
Response Summary: Seven respondents indicated that transit is a high priority, ranking it a “5” as being
among the highest priorities in Statesboro. Others ranked it lower on the scale, ranking it a 1 or 2 relative to
other needs facing the community.
3. How would public transportation be beneficial to the area, and in particular to your clients or
constituents?
Response Summary: The responses were categorized into several recurring themes:
Economic Development: Six respondents indicated that public transportation would connect workers and
consumers to important employment and commercial centers. Two respondents indicated that there would be
limited benefits.
Mobility for Students: Several respondents indicated that public transportation would improve access to
education, particularly for lower income students who are more limited by a lack of transportation options.
Mobility for Disadvantaged Communities: Four respondents indicated that lower income students and workers
would benefit from reliable public transportation to their schools and places of employment.
General Mobility: Three respondents indicated that public transportation would give people more
transportation options and expand access to vital human and health services, medical facilities, shopping
centers, and grocery stores.
4. How would you prioritize public transportation service needs for different segments of the population,
such as workers, college students, seniors, youth, or persons with disabilities?
Response Summary: Seven respondents indicated that workers are among the top priority for transportation
needs. The transportation needs of seniors, low-income persons, college students, youth, and persons with
disabilities were also among the top mentioned priorities.
5. What locations in Statesboro should be targeted for public transportation service? For example,
employment centers, educational campuses, health care facilities, or shopping centers?
Response Summary: Respondents most commonly indicated that healthcare facilities, downtown, and
employment centers should be targeted for public transportation service. Other respondents indicated that
specific areas should be targeted, such as the industrial park, Walmart, Mill Creek Park, businesses around
Brampton Road.
May 7, 2019 Page 110
P. Prop
osal
Narra
tive
Statesboro Transit Feasibility Study
Final Report
6. During what days and times should transit service be prioritized? Do you think it is important to
provide service in the evenings?
Response Summary: Five respondents indicated that weekdays should be prioritized over weekends with
service operating at peak hours or during work hours, ranging from 6am to 7pm. Four respondents indicated
that Saturday transit service should also be prioritized.
7. What types of public transportation options should be considered? For example, fixed route versus on-
demand options such as flexible routes, dial-a-ride service, or ridesharing (e.g. Uber, Lyft).
Response Summary: Eight respondents indicated that a fixed route service should be considered. Five
respondents indicated that dial-a-ride, rideshare, or flex serviced should be considered. Two respondents
indicated that fixed route service should be supplemented with on-demand service.
8. Given limited financial resources available to operate public transportation, do you think it is more
important to:
a. Provide service coverage across a larger area of the city, even if that means service frequency
will be lower, or
b. Provide higher frequency service / longer service spans in the areas of the city that are most
likely to generate demand for transit (e.g. retail/employment centers, GSU, etc.)
Response Summary: Six respondents indicated that greater service coverage is more important, and five
respondents indicated that higher frequency with longer service spans is more important. Two respondents
indicated that whichever option maximizes ridership should be considered more important.
9. Would you use the service? Do you believe the people you know and associate with would use the
service?
Response Summary: Five stakeholders responded that they would use the service, four responded they
would not use it, and two indicated that it was possible or they were unsure that they would use it. When
asked if people they know or associate with would use the service, three respondents said yes and three
responded no.
10. If the answer to question #1 is no:
a. What do you think are the most critical transportation problems facing the area?
b. What is the best way to provide transportation for people who do not or cannot drive?
c. Do you think Statesboro will ever need public transit?
Response Summary: Not Applicable – No Respondents Answered “No” to Question 1
11. Are there other organizations or individuals you think we should talk to about this study?
Response Summary: Seven respondents indicated organizations or individuals that should be contacted such
as the Chamber of Commerce, Development Authority of Bulloch County, large employers, faith-based
communities, and senior citizens.

May 7, 2019 Page 111
P. Prop
osal
Narra
tive
Statesboro Transit Feasibility Study
Final Report
Appendix B: Public Survey #1 Results

May 7, 2019 Page 134
P. Prop
osal
Narra
tive
Statesboro Transit Feasibility Study
Final Report
Appendix C: Public Survey #2 Results
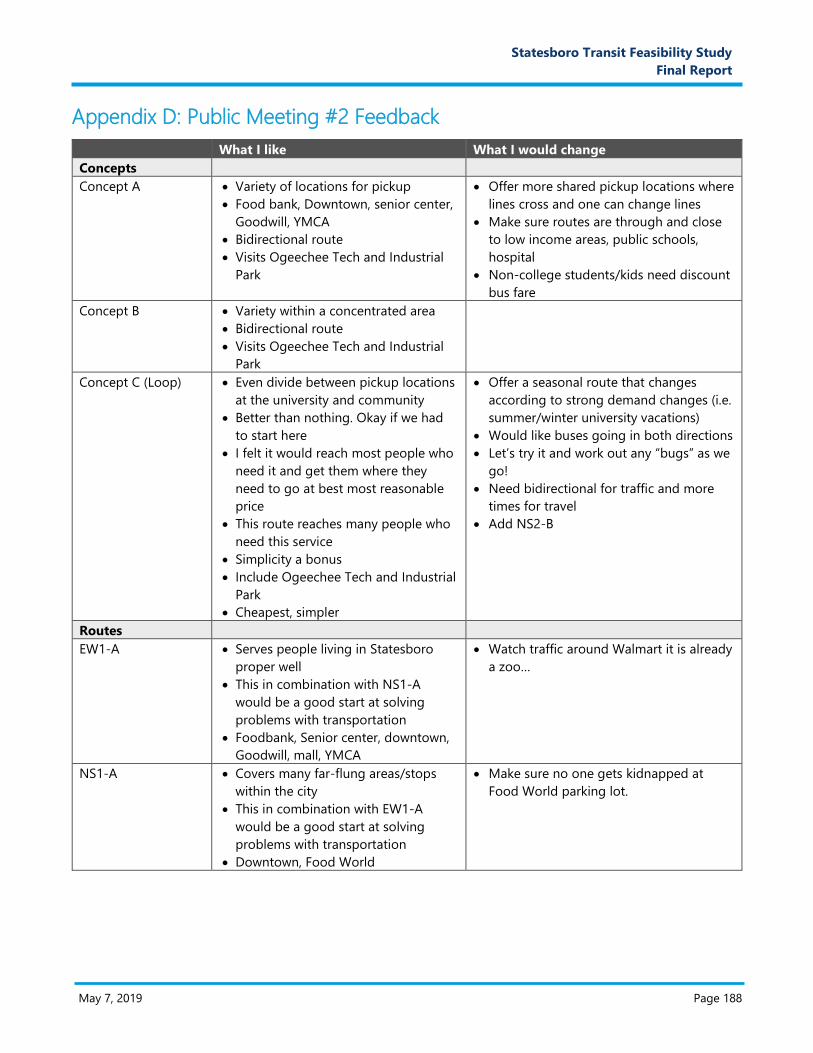
May 7, 2019 Page 188
P. Prop
osal
Narra
tive
Statesboro Transit Feasibility Study
Final Report
Appendix D: Public Meeting #2 Feedback
What I like What I would change
Concepts
Concept A Variety of locations for pickup
Food bank, Downtown, senior center,
Goodwill, YMCA
Bidirectional route
Visits Ogeechee Tech and Industrial
Park
Offer more shared pickup locations where
lines cross and one can change lines
Make sure routes are through and close
to low income areas, public schools,
hospital
Non-college students/kids need discount
bus fare
Concept B Variety within a concentrated area
Bidirectional route
Visits Ogeechee Tech and Industrial
Park
Concept C (Loop) Even divide between pickup locations
at the university and community
Better than nothing. Okay if we had
to start here
I felt it would reach most people who
need it and get them where they
need to go at best most reasonable
price
This route reaches many people who
need this service
Simplicity a bonus
Include Ogeechee Tech and Industrial
Park
Cheapest, simpler
Offer a seasonal route that changes
according to strong demand changes (i.e.
summer/winter university vacations)
Would like buses going in both directions
Let’s try it and work out any “bugs” as we
go!
Need bidirectional for traffic and more
times for travel
Add NS2-B
Routes
EW1-A Serves people living in Statesboro
proper well
This in combination with NS1-A
would be a good start at solving
problems with transportation
Foodbank, Senior center, downtown,
Goodwill, mall, YMCA
Watch traffic around Walmart it is already
a zoo…
NS1-A Covers many far-flung areas/stops
within the city
This in combination with EW1-A
would be a good start at solving
problems with transportation
Downtown, Food World
Make sure no one gets kidnapped at
Food World parking lot.

May 7, 2019 Page 189
P. Prop
osal
Narra
tive
Statesboro Transit Feasibility Study
Final Report
What I like What I would change
NS2-A Covers many areas on the outskirts of
Statesboro proper
Extends past “Statesboro Circle”
Walmart
Too restrictive
Don’t use this one it ignores a whole 75%
of Statesboro
Walmart not only grocery store in
Statesboro.
Loop 2 Serves well the needs of the area
surrounding the GS university
Both Walmarts
Too restrictive
Even more exclusive than NS2-A.
Walmart not only grocery store in
Statesboro.
EW1-B Would serve best as a central serving
city line
Combining EW1-B and NS1-B would
be a good start
Food bank, senior center, Downtown,
YMCA, Lowes, Goodwill
Too much horizontal transit. Need more
routes all around.
NS1-B Bisects Statesboro city well from
North to South
Combining EW1-B and NS1-B would
be a good start
Downtown, Food World
NS2-B Serves the city outskirts well
Extends past Veterans Memorial
NS3-B Works well for High frequency areas
Offers short runs between stops
Close to Mill Creek stop
Less inclusive route
Additional Comments
My support of mass transit for Statesboro are based on meeting the needs of citizens who have no other
means of transportation. My priorities are: handicapped, wheelchair bound folks; folks without personal
transportation to be able to get to Dr Appts and shopping.
Shops that are accessible
Getting public transportation and the immediate area would help less fortunate people, business and
commerce. It will give people a chance at bettering themselves. After establishment it can be expanded
based on needs.
This needs to serve the most people who really need this service.
Things to add to routes: hospital stop, Mill Creek Park stop, soccer stadium (future) stop, “regional grocery
store”, stops for public schools for kids who miss their school bus or can’t get there.
Things to consider: fair road traffic, “The Creek” planning, that trash intersection where “The Creek” is supposed
to go so buses are not driving over train tracks, if you run buses past 6pm need to consider football traffic,
safety and human trafficking, reduced senior and kid fares
Do these plans include New Tormenta Stadium, new “regional grocery store” or “The Creek”
I think it is very important to include all post-secondary institutions on the routes. Education is key to
developing our workforce and everyone should have access to it.
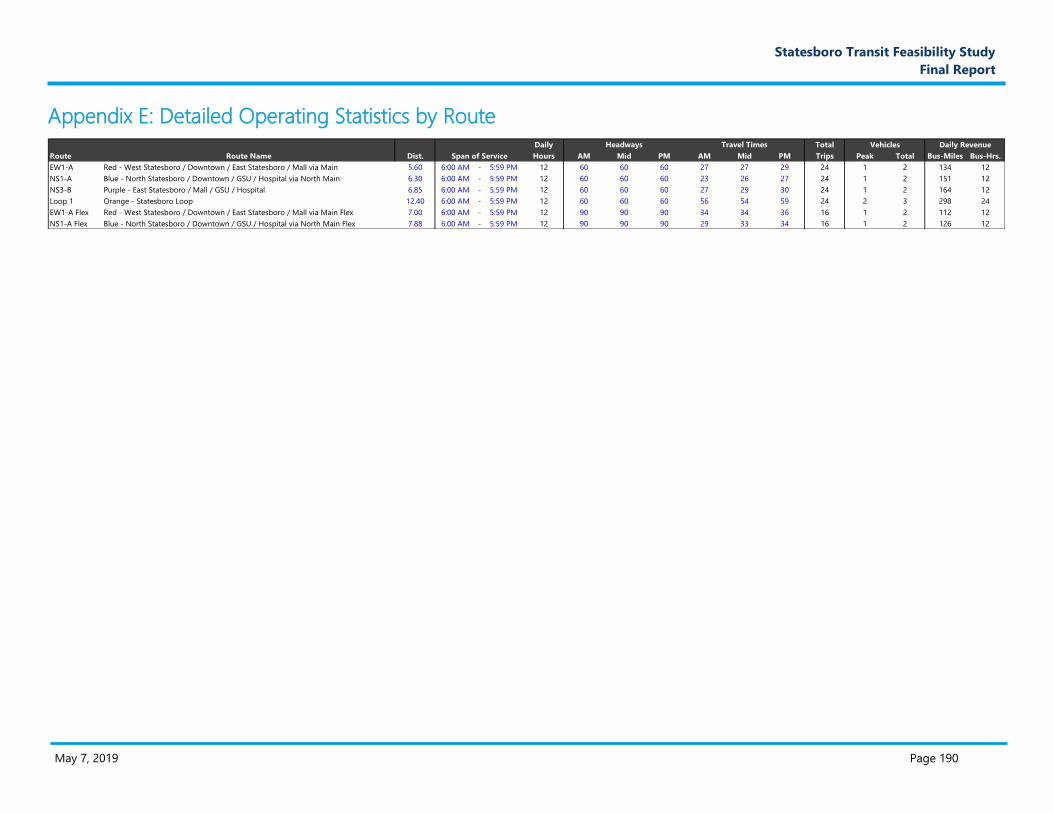
May 7, 2019 Page 190
Q. Prop
osal
Narra
tive
Statesboro Transit Feasibility Study
Final Report
Appendix E: Detailed Operating Statistics by Route
Daily Total Vehicles Daily Revenue
Route Route Name Dist. Span of Service Hours AM Mid PM AM Mid PM Trips Peak Total Bus-Miles Bus-Hrs.
EW1-A Red - West Statesboro / Downtown / East Statesboro / Mall via Main 5.60 6:00 AM - 5:59 PM 12 60 60 60 27 27 29 24 1 2 134 12
NS1-A Blue - North Statesboro / Downtown / GSU / Hospital via North Main 6.30 6:00 AM - 5:59 PM 12 60 60 60 23 26 27 24 1 2 151 12
NS3-B Purple - East Statesboro / Mall / GSU / Hospital 6.85 6:00 AM - 5:59 PM 12 60 60 60 27 29 30 24 1 2 164 12
Loop 1 Orange - Statesboro Loop 12.40 6:00 AM - 5:59 PM 12 60 60 60 56 54 59 24 2 3 298 24
EW1-A Flex Red - West Statesboro / Downtown / East Statesboro / Mall via Main Flex 7.00 6:00 AM - 5:59 PM 12 90 90 90 34 34 36 16 1 2 112 12
NS1-A Flex Blue - North Statesboro / Downtown / GSU / Hospital via North Main Flex 7.88 6:00 AM - 5:59 PM 12 90 90 90 29 33 34 16 1 2 126 12
Headways Travel Times

6600 Peachtree Dunwoody Rd., Embassy Row 600, Suite 255 | Atlanta, GA 30328 | www.ctgconsult.com