Embed Size (px)
Citation preview
CARDIFF AND ENCINITAS
SEWER MASTER PLAN UPDATE
Prepared For:
Prepared By:
605 Third Street
Encinitas, CA 92024
April 2011
City of Encinitas 505 South Vulcan Avenue
Encinitas, CA 92024

INTENTIONALLY LEFT BLANK
Cardiff and Encinitas DUDEK SEWER MASTER PLAN UPDATE i April 2011
Acknowledgments
Dudek & Associates would like to express its sincere appreciation for the assistance and cooperation provided by the management and staff of the City of Encinitas during the completion and preparation of this Master Plan Update. In particular, the efforts of the following individuals are acknowledged and greatly appreciated: Bill Wilson ....................................................................................................... Project Manager/Management Analyst Larry Watt ................................................................................................................................. Public Works Director Bryce Wilson ................................................................................................................... Public Works Senior Analyst Kipp Hefner ............................................................................................................................. Associate Civil Engineer Shawn Atherton ........................................................................................................................ WWC Superintendent Ben Taylor ...................................................................................................................... Field Maintenance Supervisor Kerry Kusiak .......................................................................................................................................... Senior Planner II Wendy Flynn ............................................................................................................................................. GIS Supervisor Megan Cervantes ........................................................................................................................................... GIS Analyst
DUDEK TEAM MEMBERS Russ Bergholz ......................................................................................................................................... Project Manager Steve Deering ..................................................................................................................................... Principal Engineer Saurabh Thapar ..................................................................................................................................... Project Engineer Dale Gruel ............................................................................................................................................ Principal Engineer Jerod Coleman ........................................................................................................................................ Senior Engineer Taryn Dunbar .................................................................................................................................... Associate Engineer
Cardiff and Encinitas DUDEK SEWER MASTER PLAN UPDATE ii April 2011
Table of Contents
EXECUTIVE SUMMARY............................................................................................................. ES-1 ES-1 INTRODUCTION ............................................................................................................................ ES-1 ES-2 ENCINITAS SANITARY DIVISION .............................................................................................. ES-1 ES-3 CARDIFF SANITARY DIVISION ................................................................................................... ES-5 ES-4 EXISTING FACILITIES ..................................................................................................................... ES-7 ES-5 FLOW GENERATION AND HYDRAULIC MODEL DEVELOPMENT .............................. ES-7 ES-6 CAPACITY ANALYSIS ..................................................................................................................... ES-8 ES-7 CONDITION ASSESSMENT ......................................................................................................... ES-10 ES-8 OTS ALTERNATIVE ANALYSIS................................................................................................... ES-11 ES-9 JOINT FACILITIES/ TREATMENT PLANTS .............................................................................. ES-11 ES-10 RECOMMENDED CAPITAL IMPROVEMENT PROJECTS ................................................... ES-12
CHAPTER 1 - INTRODUCTION ................................................................................................ 1-1 1.1 BACKGROUND ................................................................................................................................ 1-1
1.1.1 The City of Encinitas ........................................................................................................... 1-1 1.1.2 Cardiff Sanitary Division (CSD) ........................................................................................ 1-5 1.1.3 Encinitas Sanitary Division (ESD) ..................................................................................... 1-5 1.1.4 Encina Wastewater Authority (EWA) ............................................................................ 1-6 1.1.5 San Elijo Joint Powers Authority (SEJPA) ....................................................................... 1-6 1.1.6 Rancho Santa Fe Community Services District (RSFCSD) ........................................ 1-7 1.1.7 City of Solana Beach ........................................................................................................... 1-7 1.1.8 Leucadia Wastewater District (LWD) ........................................................................... 1-8
1.2 SERVICE AREA OVERVIEW ............................................................................................................ 1-8 1.3 GENERAL LAND USE ...................................................................................................................... 1-8
1.3.1 CSD Land Use ...................................................................................................................... 1-9 1.3.2 ESD Land Use ...................................................................................................................... 1-13
1.4 PURPOSE OF THE STUDY ............................................................................................................ 1-13 CHAPTER 2 - EXISTING SYSTEM FACILITIES AND FLOWS .............................................. 2-1
2.1 EXISTING FACILITIES ...................................................................................................................... 2-1 2.1.1 Trunk Sewers........................................................................................................................ 2-1 2.1.2 Pump Stations and Force Mains ....................................................................................... 2-6 2.1.3 Collector System ................................................................................................................. 2-8
2.2 ESD JOINT TRANSMISSION FACILITIES ................................................................................... 2-8 2.2.1 Batiquitos Pump Station and Related Facilities ............................................................. 2-8
2.3 INTERAGENCY AGREEMENTS .................................................................................................... 2-9 2.4 HISTORICAL WASTEWATER FLOWS ...................................................................................... 2-10 2.5 EXISTING DRY WEATHER FLOWS ........................................................................................... 2-13 2.6 INFLOW AND INFILTRATION ................................................................................................... 2-15 2.7 EXISTING FLOW SUMMARY ....................................................................................................... 2-17
CHAPTER 3 - EXISTING SYSTEM CAPACITY EVALUATION ............................................ 3-1 3.1 DESIGN CRITERIA ............................................................................................................................ 3-1
Cardiff and Encinitas DUDEK SEWER MASTER PLAN UPDATE iii April 2011
3.2 PIPELINE EVALUATION .................................................................................................................. 3-2 3.3 EXISTING SYSTEM HYDRAULIC MODEL ................................................................................. 3-2
3.3.1 Physical Data Input .............................................................................................................. 3-3 3.3.2 Dry Weather Flow Loading .............................................................................................. 3-3 3.3.3 Model Verification .............................................................................................................. 3-12 3.3.4 Wet Weather Flow Loading ............................................................................................ 3-12
3.4 CAPACITY ANALYSIS RESULTS .................................................................................................. 3-13 3.4.1 CSD ........................................................................................................................................ 3-13 3.4.2 ESD ......................................................................................................................................... 3-15
CHAPTER 4 - CONDITION ASSESSMENTS ............................................................................ 4-1 4.1 ESD CCTV PIPELINE INSPECTIONS ........................................................................................... 4-1
4.1.1 Downtown Encinitas Trunk Sewer ................................................................................. 4-1 4.1.2 Clark Avenue/Cottonwood Creek Park Sewer ........................................................... 4-1
4.2 OTS MANHOLE INSPECTIONS ................................................................................................... 4-7 4.3 PUMP STATION FIELD REVIEWS ................................................................................................ 4-11
CHAPTER 5 - ULTIMATE FLOW PROJECTIONS AND ANALYSIS .................................... 5-1 5.1 WASTEWATER FLOW GENERATION FACTORS ................................................................. 5-1 5.2 FUTURE WASTEWATER CONNECTIONS .............................................................................. 5-1
5.2.1 Specific Planned Developments ........................................................................................ 5-5 5.2.2 Build-Out of Vacant and Underdeveloped Parcels ...................................................... 5-6 5.2.3 Connection of Parcels with Septic Systems .................................................................. 5-6 5.2.4 RSFCSD Ultimate Flows .................................................................................................... 5-7
5.3 PROJECTED ULTIMATE FLOWS .................................................................................................. 5-7 5.4 ULTIMATE SYSTEM HYDRAULIC MODEL ............................................................................... 5-8 5.5 HYDRAULIC ANALYSIS RESULTS ............................................................................................... 5-8
5.5.1 Cardiff Trunk/Cardiff Relief Trunk Sewer ..................................................................... 5-9 5.5.2 Cardiff Gravity Trunk Sewer ............................................................................................ 5-9 5.5.3 Encinitas Trunk Sewer ........................................................................................................ 5-9 5.5.4 Olivenhain Trunk Sewer .................................................................................................... 5-9 5.5.5 Pump Stations ...................................................................................................................... 5-12
5.6 BATIQUITOS PUMP STATION CAPACITY ANALYSIS ........................................................ 5-13 5.7 OLIVENHAIN TRUNK SEWER ALTERNATIVES ANALYSIS ............................................... 5-13 5.8 TREATMENT CAPACITY ASSESSMENTS ................................................................................. 5-15
5.8.1 Encina WPCF ....................................................................................................................... 5-15 5.8.2 SEWRF .................................................................................................................................. 5-15
CHAPTER 6 - RECOMMENDATIONS ....................................................................................... 6-1 6.1 PIPELINE IMPROVEMENTS ............................................................................................................. 6-1 6.2 PIPELINE REHABILITATION .......................................................................................................... 6-1
6.2.1 Pump Station Improvements ............................................................................................. 6-2 6.3 SEWER PROGRAMS ......................................................................................................................... 6-3 6.4 REDUNDANCY PROJECTS ........................................................................................................... 6-9 6.5 LWD/ESD JOINTLY OWNED FACILITIES IMPROVEMENTS .............................................. 6-9 6.6 TREATMENT CAPACITY ASSESSMENTS ................................................................................. 6-10
Cardiff and Encinitas DUDEK SEWER MASTER PLAN UPDATE iv April 2011
6.6.1 Encina WPCF ....................................................................................................................... 6-10 6.6.2 SEWRF .................................................................................................................................. 6-10
6.7 RECOMMENDED CAPITAL IMPROVEMENT PROJECTS .................................................... 6-11
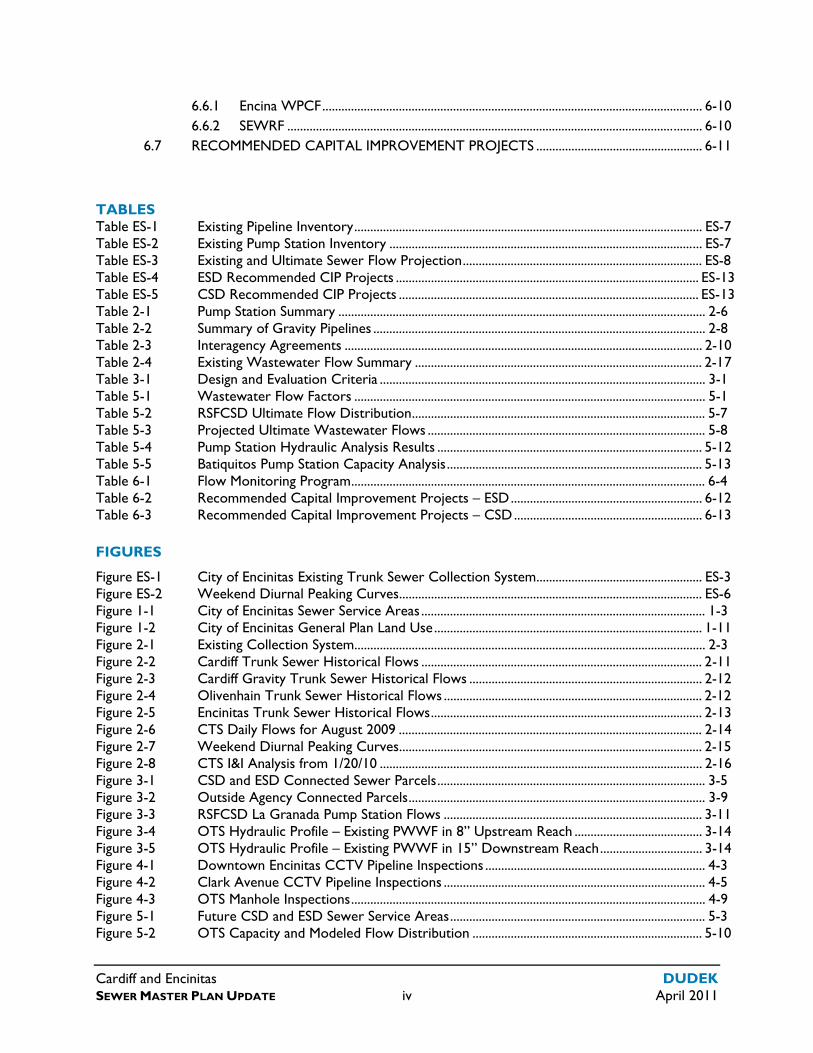
TABLES Table ES-1 Existing Pipeline Inventory ............................................................................................................. ES-7 Table ES-2 Existing Pump Station Inventory .................................................................................................. ES-7 Table ES-3 Existing and Ultimate Sewer Flow Projection ........................................................................... ES-8 Table ES-4 ESD Recommended CIP Projects ............................................................................................... ES-13 Table ES-5 CSD Recommended CIP Projects .............................................................................................. ES-13 Table 2-1 Pump Station Summary ................................................................................................................... 2-6 Table 2-2 Summary of Gravity Pipelines ........................................................................................................ 2-8 Table 2-3 Interagency Agreements ................................................................................................................ 2-10 Table 2-4 Existing Wastewater Flow Summary .......................................................................................... 2-17 Table 3-1 Design and Evaluation Criteria ...................................................................................................... 3-1 Table 5-1 Wastewater Flow Factors .............................................................................................................. 5-1 Table 5-2 RSFCSD Ultimate Flow Distribution ............................................................................................ 5-7 Table 5-3 Projected Ultimate Wastewater Flows ....................................................................................... 5-8 Table 5-4 Pump Station Hydraulic Analysis Results ................................................................................... 5-12 Table 5-5 Batiquitos Pump Station Capacity Analysis ................................................................................ 5-13 Table 6-1 Flow Monitoring Program ............................................................................................................... 6-4 Table 6-2 Recommended Capital Improvement Projects – ESD ............................................................ 6-12 Table 6-3 Recommended Capital Improvement Projects – CSD ........................................................... 6-13 FIGURES
Figure ES-1 City of Encinitas Existing Trunk Sewer Collection System .................................................... ES-3 Figure ES-2 Weekend Diurnal Peaking Curves ............................................................................................... ES-6 Figure 1-1 City of Encinitas Sewer Service Areas ......................................................................................... 1-3 Figure 1-2 City of Encinitas General Plan Land Use .................................................................................... 1-11 Figure 2-1 Existing Collection System.............................................................................................................. 2-3 Figure 2-2 Cardiff Trunk Sewer Historical Flows ........................................................................................ 2-11 Figure 2-3 Cardiff Gravity Trunk Sewer Historical Flows ......................................................................... 2-12 Figure 2-4 Olivenhain Trunk Sewer Historical Flows ................................................................................. 2-12 Figure 2-5 Encinitas Trunk Sewer Historical Flows ..................................................................................... 2-13 Figure 2-6 CTS Daily Flows for August 2009 ............................................................................................... 2-14 Figure 2-7 Weekend Diurnal Peaking Curves ............................................................................................... 2-15 Figure 2-8 CTS I&I Analysis from 1/20/10 ..................................................................................................... 2-16 Figure 3-1 CSD and ESD Connected Sewer Parcels .................................................................................... 3-5 Figure 3-2 Outside Agency Connected Parcels ............................................................................................. 3-9 Figure 3-3 RSFCSD La Granada Pump Station Flows ................................................................................. 3-11 Figure 3-4 OTS Hydraulic Profile – Existing PWWF in 8” Upstream Reach ........................................ 3-14 Figure 3-5 OTS Hydraulic Profile – Existing PWWF in 15” Downstream Reach ................................ 3-14 Figure 4-1 Downtown Encinitas CCTV Pipeline Inspections ..................................................................... 4-3 Figure 4-2 Clark Avenue CCTV Pipeline Inspections .................................................................................. 4-5 Figure 4-3 OTS Manhole Inspections ............................................................................................................... 4-9 Figure 5-1 Future CSD and ESD Sewer Service Areas ................................................................................ 5-3 Figure 5-2 OTS Capacity and Modeled Flow Distribution ........................................................................ 5-10
Cardiff and Encinitas DUDEK SEWER MASTER PLAN UPDATE v April 2011
Figure 5-3 OTS 8” Diameter Surcharged Area – Ultimate PWWF ........................................................ 5-11 Figure 5-4 OTS Hydraulic Profile – Ultimate PWWF in Downstream Portion ................................... 5-12 Figure 6-1 Flow Monitoring Plan Phase 1 ........................................................................................................ 6-5 Figure 6-2 Flow Monitoring Plan Phase 2 ........................................................................................................ 6-7 Figure 6-3 Recommended Capital Improvement Projects ......................................................................... 6-15
APPENDICES A FLOW METER DATA B HYDRAULIC MODEL OUTPUT C MANHOLE INSPECTION REPORTS D PUMP STATION FIELD REVIEW REPORTS E OLIVENHAIN TRUNK SEWER ALTERNATIVE ANALYSIS F CARDIFF AND COAST PUMP STATION ANALYSIS

Cardiff and Encinitas DUDEK SEWER MASTER PLAN UPDATE vi April 2011
INTENTIONALLY LEFT BLANK
Cardiff and Encinitas DUDEK SEWER MASTER PLAN UPDATE vii April 2011
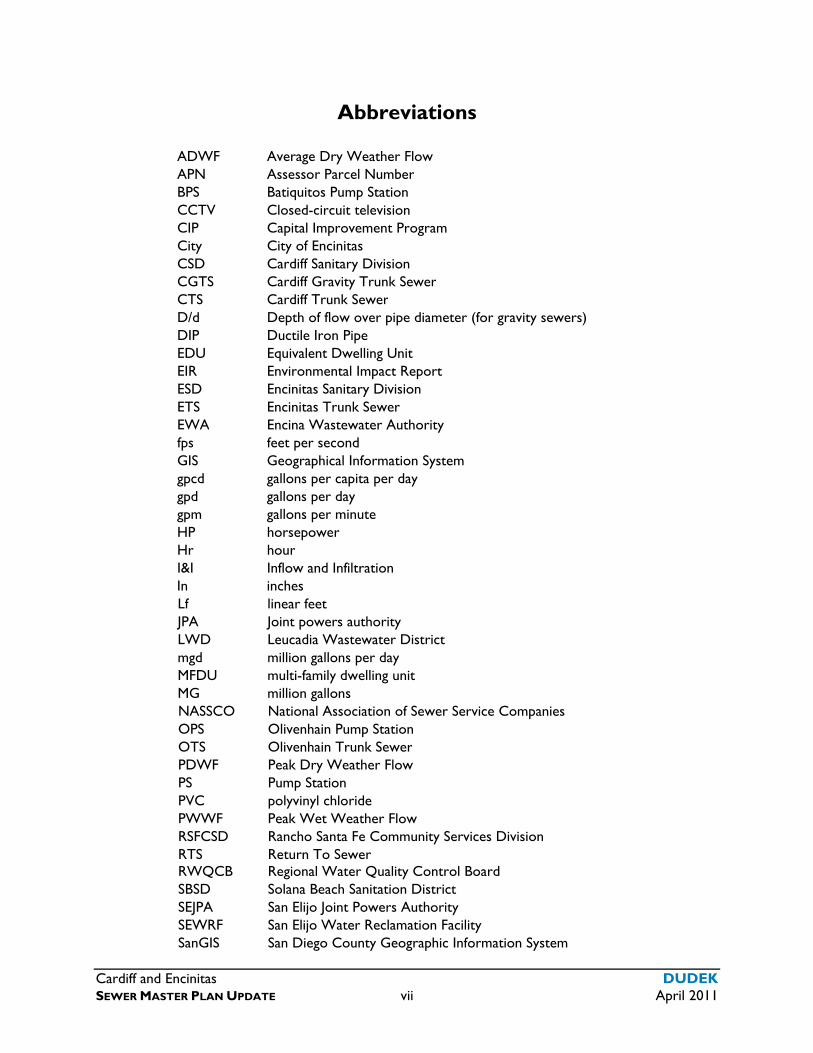
Abbreviations
ADWF Average Dry Weather Flow APN Assessor Parcel Number BPS Batiquitos Pump Station CCTV Closed-circuit television CIP Capital Improvement Program City City of Encinitas CSD Cardiff Sanitary Division CGTS Cardiff Gravity Trunk Sewer CTS Cardiff Trunk Sewer D/d Depth of flow over pipe diameter (for gravity sewers) DIP Ductile Iron Pipe EDU Equivalent Dwelling Unit EIR Environmental Impact Report ESD Encinitas Sanitary Division ETS Encinitas Trunk Sewer EWA Encina Wastewater Authority fps feet per second GIS Geographical Information System gpcd gallons per capita per day gpd gallons per day gpm gallons per minute HP horsepower Hr hour I&I Inflow and Infiltration In inches Lf linear feet JPA Joint powers authority LWD Leucadia Wastewater District mgd million gallons per day MFDU multi-family dwelling unit MG million gallons NASSCO National Association of Sewer Service Companies OPS Olivenhain Pump Station OTS Olivenhain Trunk Sewer PDWF Peak Dry Weather Flow PS Pump Station PVC polyvinyl chloride PWWF Peak Wet Weather Flow RSFCSD Rancho Santa Fe Community Services Division RTS RWQCB
Return To Sewer Regional Water Quality Control Board
SBSD Solana Beach Sanitation District SEJPA San Elijo Joint Powers Authority SEWRF San Elijo Water Reclamation Facility SanGIS San Diego County Geographic Information System
Cardiff and Encinitas DUDEK SEWER MASTER PLAN UPDATE viii April 2011
SFDU SSO
Single Family Dwelling Unit Sanitary Sewer Overflow
USGS United States Geologic Survey VCP Vitrified Clay Pipe VFD Variable Frequency Drive WPCF Water Pollution Control Facility WRP Water Recycling or Reclamation Plant
Cardiff and Encinitas DUDEK SEWER MASTER PLAN UPDATE ES-1 April 2011
EXECUTIVE SUMMARY
ES-1 INTRODUCTION
The purpose of this Sewer Master Plan Update is to evaluate the City of Encinitas (City) existing and future sewer facility needs, make recommendations and prepare a preliminary opinion of probable cost for each of the proposed improvements. This Master Plan evaluates the condition and capacity of the major elements of the existing wastewater collection systems within both the Cardiff and Encinitas Sanitary Divisions, and makes recommendations for future system improvements.
The primary components of the Master Plan include the following Sections and Evaluations
1. Documentation of existing facilities;
2. Sewer flow generation analysis and evaluation of the existing system;
3. Projection of ultimate sewer flows and evaluation of future infrastructure needs;
4. Alternative Analysis for addressing capacity issues within the Olivenhain Trunk Sewer (OTS);
5. Review of existing CCTV pipeline inspection video and provide recommendations;
6. Condition assessment of the OTS manholes;
7. Field review of existing sewer pump stations; and
8. Preparation of recommended Capital Improvement Program projects.
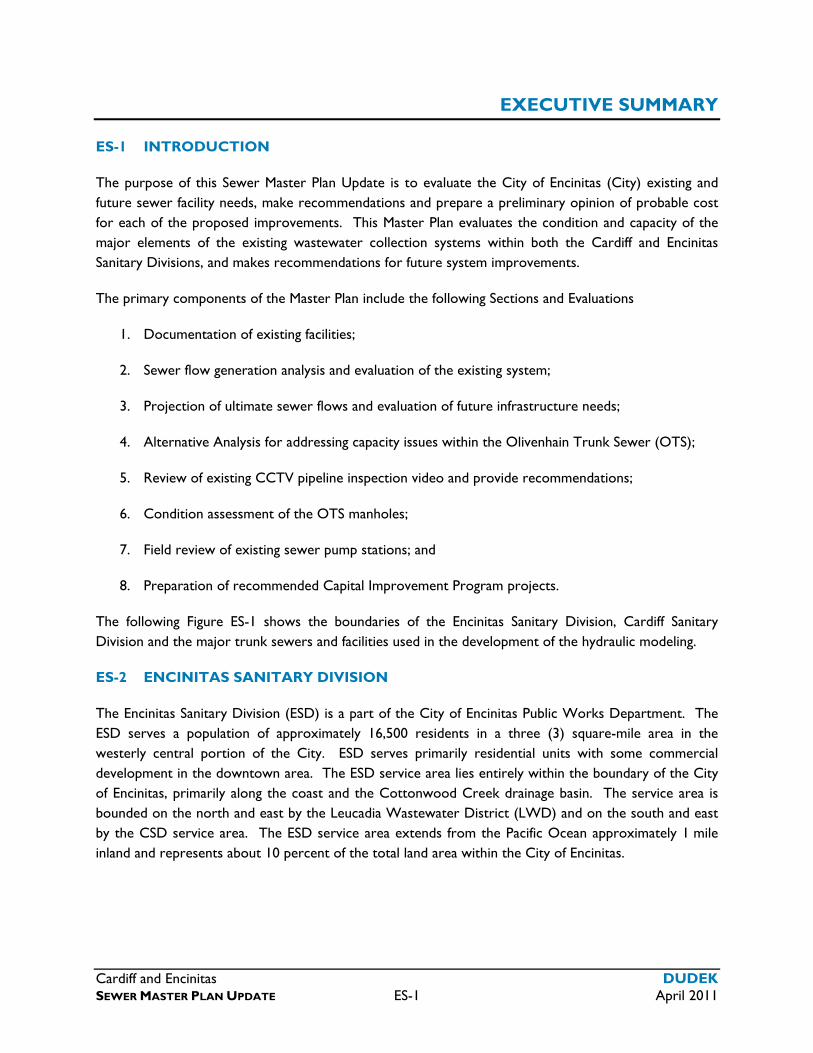
The following Figure ES-1 shows the boundaries of the Encinitas Sanitary Division, Cardiff Sanitary Division and the major trunk sewers and facilities used in the development of the hydraulic modeling.
ES-2 ENCINITAS SANITARY DIVISION
The Encinitas Sanitary Division (ESD) is a part of the City of Encinitas Public Works Department. The ESD serves a population of approximately 16,500 residents in a three (3) square-mile area in the westerly central portion of the City. ESD serves primarily residential units with some commercial development in the downtown area. The ESD service area lies entirely within the boundary of the City of Encinitas, primarily along the coast and the Cottonwood Creek drainage basin. The service area is bounded on the north and east by the Leucadia Wastewater District (LWD) and on the south and east by the CSD service area. The ESD service area extends from the Pacific Ocean approximately 1 mile inland and represents about 10 percent of the total land area within the City of Encinitas.

Cardiff and Encinitas DUDEK SEWER MASTER PLAN UPDATE ES-2 April 2011
INTENTIONALLY LEFT BLANK
Encin
itas B
lvd
Manchester Ave
Leuc
adia
Blvd
Santa
Fe D
r
S Coast Highway 101
San Elijo Ave
N Vulcan AveThird St
Lone
Jack
Rd
Lake Dr
S El Camino Real
N El Camino Real
Quail Gardens Dr
N Rancho Santa Fe Rd
N Coast Highway 101
Balour Dr
Olive
nhain
Rd
Birmin
gham Dr
S Vulcan Ave
Requ
eza S
t
Nardo Rd
Glen Arbor Dr
El Ca
mino D
el Nort
e
Village Park Way
K St
Villa Cardiff Dr
Saxony Rd
Westlake St Mackinnon Ave
Rancho Santa Fe Rd
W B
St
S San Elijo Ave
Saxony Rd
SAN
ELIJO
LAGO
ON
FIGUR
E ES-1
CITY
OF E
NCIN
ITAS
EXIST
ING
TRUN
K SE
WER
CO
LLEC
TION
SYST
EM
Lege
nd SA
N E
LIJ
O W
AT
ER
RE
CL
AM
AT
ION
FA
CIL
ITY
EX
IST
ING
LIF
T S
TA
TIO
NS
EXIST
ING
TRUN
K GR
AVITY
MAI
NS (M
ODEL
ED)
CA
RD
IFF
GR
AV
ITY
TR
UN
K S
EW
ER
(C
SD
)C
AR
DIF
F R
EL
IEF
TR
UN
K S
EW
ER
(C
SD
)C
AR
DIF
F T
RU
NK
SE
WE
R (
CS
D)
OL
IVE
NH
AIN
TR
UN
K S
EW
ER
(C
SD
)E
NC
INIT
AS
TR
UN
K S
EW
ER
(E
SD
)E
XIS
TIN
G F
OR
CE
MA
INS
CITY
OF E
NCIN
ITAS
CA
RD
IFF
SA
NIT
AR
Y D
IVIS
ION
EN
CIN
ITA
S S
AN
ITA
RY
DIV
ISIO
NW
AT
ER
BO
DIE
SM
AJO
R R
OA
D
Cardi
ff and
Encin
itas
SEW
ER M
ASTE
R PLA
N UP
DATE
DUDE
KAp
ril 20
11
03,5
001,7
50Fee
t
CARD
IFF
PUM
P ST
ATIO
NOL
IVEN
HAIN
PU
MP
STAT
ION
RANC
HO SA
NTA
FE
COM
MUNI
TY SE
RVIC
ES D
ISTR
ICT
LEUC
ADIA
W
ASTE
WAT
ER
DIST
RICT
CARD
IFF
SANI
TARY
DI
VISI
ON
ENCI
NITA
SSA
NITA
RY
DIVI
SION
PACI
FIC
OCEA
N
5CO
AST
PUM
P ST
ATIO
N
5
MOON
LIGH
T BE
ACH
PUM
P ST
ATIO
N

THIS PAGE INTENTIONALLY LEFT BLANK
Cardiff and Encinitas DUDEK SEWER MASTER PLAN UPDATE ES-5 April 2011
The majority of flows generated within the Encinitas Sanitary Division are collected in the Encinitas
Boulevard Trunk Sewer, described below. All flow from the ESD drains into the Moonlight Pump
Station, which is pumped through a forcemain to the Batiquitos Pump Station, a joint facility with
Leucadia Wastewater District (LWD), and then pumped together with flow from LWD to the Encina
Wastewater Authority (EWA).
ES-2.1 Encinitas Boulevard Trunk Sewer (ETS)
The ETS begins at Sweet Alice Lane and flows west in Encinitas Boulevard. East of I-5 it collects flow
from the western portion of Encinitas Ranch, and miscellaneous commercial and residential areas along
both sides of Encinitas Boulevard. West of I-5 the ETS picks up flows from the community of Leucadia
and Old Encinitas, including the downtown commercial area. The ETS terminates just west of Highway
101 at the Moonlight Beach Pump Station. Flows from areas west of Highway 101 enter the pump
station directly from the west. Pipelines in the ETS range from 8 to 15-inches in diameter. Portions of
ETS were recently replaced to increase capacity, as recommended in the 2003 Master Plan.
ES-3 CARDIFF SANITARY DIVISION
Similar to the ESD, The Cardiff Sanitary Division (CSD) is a part of the City of Encinitas Public Works
Department. The CSD services a population of approximately 19,600 residents in a 12 square-mile area
in the southern and easterly portions of the City. There are approximately 84 miles of sewer mains and
600 manholes in the collection system. CSD serves primarily residential units, with some commercial
such as stores, restaurants, offices, and medical buildings, including Scripps Hospital.
Flows generated within the Cardiff Sanitary Division are collected in one of four trunk sewer systems
and then pumped or conveyed by gravity to the San Elijo Water Reclamation Facility (SEWRF). The
following section describes the four trunk sewer systems.
ES-3.1 Cardiff Trunk Sewer (CTS) and Cardiff Relief Sewer
The original CTS was constructed in the early 1950’s to serve the community of Cardiff-by-the-Sea.
Pipeline sizes range from 8 to 15-inches in diameter. As development increased in the Cardiff area, flat
sections of the CTS started flowing full. A new sewer was constructed through central Cardiff to
intercept flows from eastern portions of the service area and discharge the flows to more steeply sloped
sections of CTS further downstream.
ES-3.2 Cardiff Gravity Trunk Sewer (CGTS)
The Cardiff Gravity Trunk Sewer (CGTS) collects flows from residential areas east of I-5, and from
apartment complexes along the west side of I-5. The pipelines are 8 and 10-inches in diameter. The
CGTS was previously termed the “backdoor” gravity sewer, since flow enters the plant from the
backside and not from the front entrance, like the other trunk sewer systems.
Cardiff and Encinitas DUDEK SEWER MASTER PLAN UPDATE ES-6 April 2011
ES-3.3 Olivenhain Trunk Sewer (OTS)
The original 1972 OTS extends as a 21-inch sewer from the Olivenhain Pump Station (OPS) upstream along Manchester Ave to El Camino Real and then continues upstream in an alignment between Escondido Creek and Rancho Santa Fe Road ending as a 10-inch sewer at El Camino Del Norte. Going upstream from Manchester and El Camino Real, OTS is located in open space easements within the 100 year frequency flood plain of San Elijo Lagoon and Escondido Creek and crosses sensitive and protected wetlands and wetlands habitat. Along OTS, there is one short section of three 10-inch diameter inverted siphon pipelines crossing under a now-abandoned irrigation pipeline. There are four connections to OTS by formal agreement with Rancho Santa Fe Community Services District (RSFCSD) between El Camino Real and El Camino Del Norte. A newer extension of OTS continues northerly from El Camino Del Norte as an 8-inch sewer parallel to Lone Jack Road and extending up into the Copper Creek rural development area. Rehabilitation of portions of the OTS has been completed to offset higher than normal flow during wet weather conditions, however, high wet weather flow continues to be a concern today.
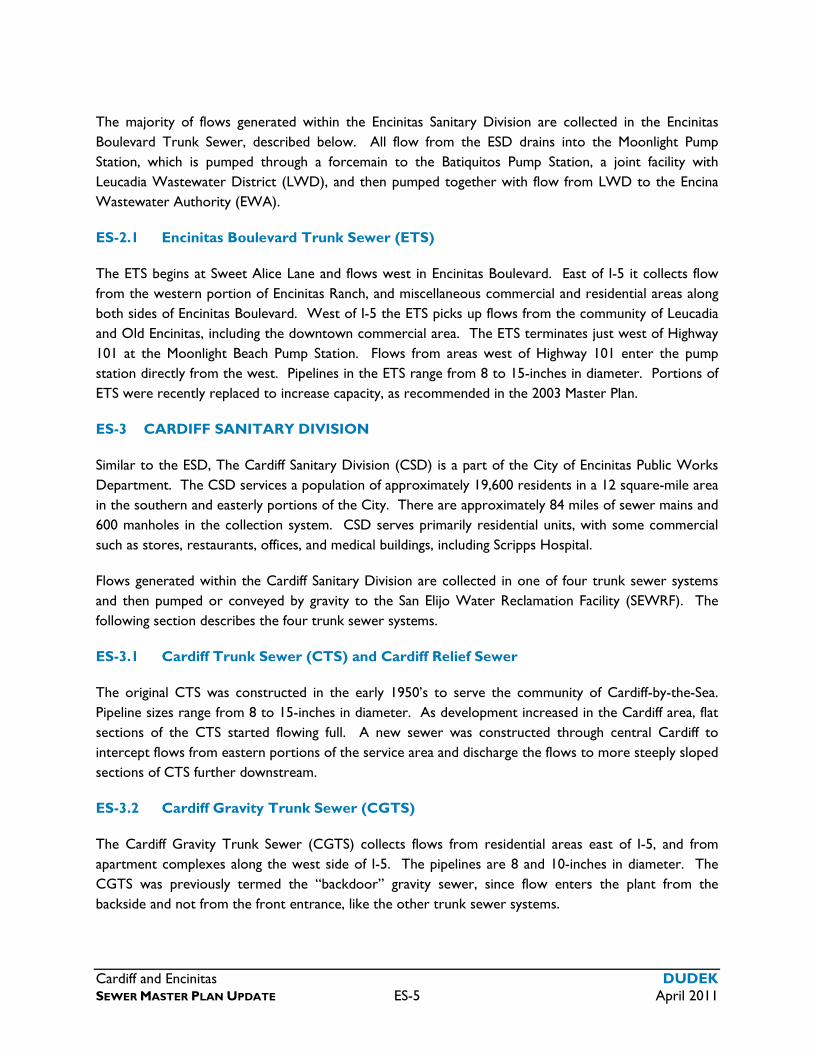
The following figure presents the dry weather 24-hour diurnal curve pattern for each of the four major trunk sewers.
Figure ES-2 Weekend Dry Weather Diurnal Peaking Curves
0.0
0.2
0.4
0.6
0.8
1.0
1.2
1.4
1.6
1.8
2.0
0:00 3:00 6:00 9:00 12:00 15:00 18:00 21:00 24:00
Time (Hours)
Flo
w F
acto
r (H
ou
rly
Flo
w/A
vera
ge
Flo
w)
CTS OTS Cardiff Gravity ETS
Cardiff and Encinitas DUDEK SEWER MASTER PLAN UPDATE ES-7 April 2011
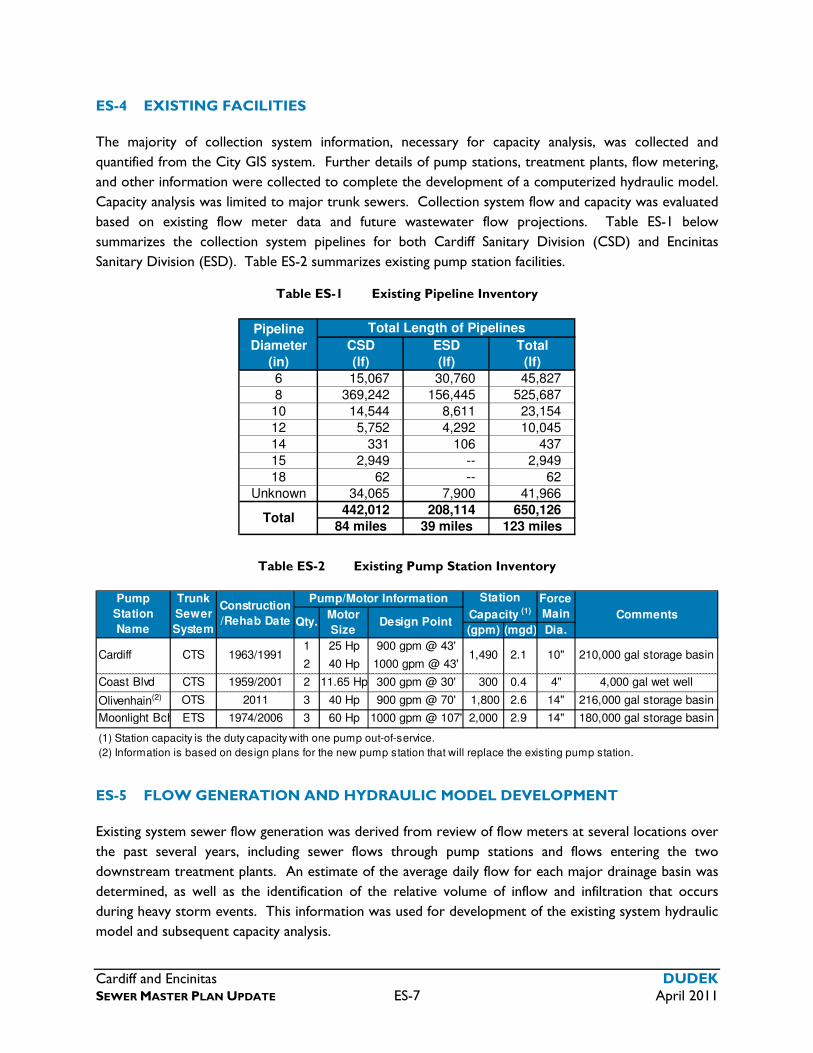
ES-4 EXISTING FACILITIES
The majority of collection system information, necessary for capacity analysis, was collected and
quantified from the City GIS system. Further details of pump stations, treatment plants, flow metering,
and other information were collected to complete the development of a computerized hydraulic model.
Capacity analysis was limited to major trunk sewers. Collection system flow and capacity was evaluated
based on existing flow meter data and future wastewater flow projections. Table ES-1 below
summarizes the collection system pipelines for both Cardiff Sanitary Division (CSD) and Encinitas
Sanitary Division (ESD). Table ES-2 summarizes existing pump station facilities.
Table ES-1 Existing Pipeline Inventory
Pipeline
Diameter CSD ESD Total
(in) (lf) (lf) (lf)
6 15,067 30,760 45,827
8 369,242 156,445 525,687
10 14,544 8,611 23,154
12 5,752 4,292 10,045
14 331 106 437
15 2,949 -- 2,949
18 62 -- 62
Unknown 34,065 7,900 41,966
442,012 208,114 650,126
84 miles 39 miles 123 milesTotal
Total Length of Pipelines
Table ES-2 Existing Pump Station Inventory
Comments
(gpm) (mgd) Dia.
1 25 Hp 900 gpm @ 43'
2 40 Hp 1000 gpm @ 43'
Coast Blvd CTS 1959/2001 2 11.65 Hp 300 gpm @ 30' 300 0.4 4" 4,000 gal wet well
Olivenhain(2) OTS 2011 3 40 Hp 900 gpm @ 70' 1,800 2.6 14" 216,000 gal storage basin
Moonlight Bch ETS 1974/2006 3 60 Hp 1000 gpm @ 107' 2,000 2.9 14" 180,000 gal storage basin
(1) Station capacity is the duty capacity with one pump out-of-service.
(2) Information is based on design plans for the new pump station that will replace the existing pump station.
Trunk
Sewer
System
Motor
Size
Force
MainDesign Point
Cardiff CTS 1963/1991
Qty.
Pump
Station
Name
Construction
/Rehab Date
Station
Capacity (1)
Pump/Motor Information
210,000 gal storage basin1,490 2.1 10"
ES-5 FLOW GENERATION AND HYDRAULIC MODEL DEVELOPMENT
Existing system sewer flow generation was derived from review of flow meters at several locations over
the past several years, including sewer flows through pump stations and flows entering the two
downstream treatment plants. An estimate of the average daily flow for each major drainage basin was
determined, as well as the identification of the relative volume of inflow and infiltration that occurs
during heavy storm events. This information was used for development of the existing system hydraulic
model and subsequent capacity analysis.
Cardiff and Encinitas DUDEK SEWER MASTER PLAN UPDATE ES-8 April 2011
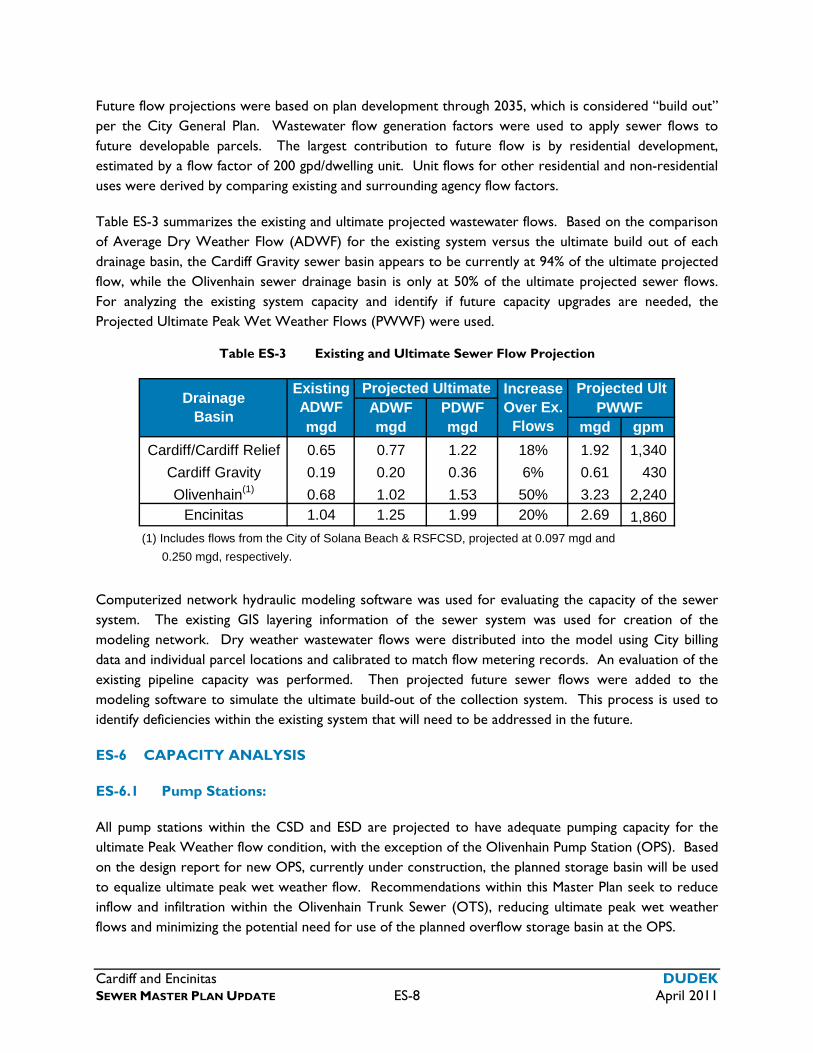
Future flow projections were based on plan development through 2035, which is considered “build out” per the City General Plan. Wastewater flow generation factors were used to apply sewer flows to future developable parcels. The largest contribution to future flow is by residential development, estimated by a flow factor of 200 gpd/dwelling unit. Unit flows for other residential and non-residential uses were derived by comparing existing and surrounding agency flow factors.
Table ES-3 summarizes the existing and ultimate projected wastewater flows. Based on the comparison of Average Dry Weather Flow (ADWF) for the existing system versus the ultimate build out of each drainage basin, the Cardiff Gravity sewer basin appears to be currently at 94% of the ultimate projected flow, while the Olivenhain sewer drainage basin is only at 50% of the ultimate projected sewer flows. For analyzing the existing system capacity and identify if future capacity upgrades are needed, the Projected Ultimate Peak Wet Weather Flows (PWWF) were used.
Table ES-3 Existing and Ultimate Sewer Flow Projection
ADWF PDWFmgd mgd mgd mgd gpm
Cardiff/Cardiff Relief 0.65 0.77 1.22 18% 1.92 1,340
Cardiff Gravity 0.19 0.20 0.36 6% 0.61 430
Olivenhain(1) 0.68 1.02 1.53 50% 3.23 2,240 Encinitas 1.04 1.25 1.99 20% 2.69 1,860
(1) Includes flows from the City of Solana Beach & RSFCSD, projected at 0.097 mgd and
0.250 mgd, respectively.
Existing ADWF
Increase Over Ex.
Flows
Projected Ultimate Projected UltPWWF
Drainage Basin
Computerized network hydraulic modeling software was used for evaluating the capacity of the sewer system. The existing GIS layering information of the sewer system was used for creation of the modeling network. Dry weather wastewater flows were distributed into the model using City billing data and individual parcel locations and calibrated to match flow metering records. An evaluation of the existing pipeline capacity was performed. Then projected future sewer flows were added to the modeling software to simulate the ultimate build-out of the collection system. This process is used to identify deficiencies within the existing system that will need to be addressed in the future.
ES-6 CAPACITY ANALYSIS
ES-6.1 Pump Stations:
All pump stations within the CSD and ESD are projected to have adequate pumping capacity for the ultimate Peak Weather flow condition, with the exception of the Olivenhain Pump Station (OPS). Based on the design report for new OPS, currently under construction, the planned storage basin will be used to equalize ultimate peak wet weather flow. Recommendations within this Master Plan seek to reduce inflow and infiltration within the Olivenhain Trunk Sewer (OTS), reducing ultimate peak wet weather flows and minimizing the potential need for use of the planned overflow storage basin at the OPS.
Cardiff and Encinitas DUDEK SEWER MASTER PLAN UPDATE ES-9 April 2011
ES-6.2 Encinitas Sanitary Division
During existing peak dry weather conditions, hydraulic simulations showed that no pipelines 12-inches and larger exceeded 75% of capacity. For ultimate system model analysis, the trigger point for consideration of upgrades is greater than 90% of capacity. Surcharging, if short in distance and duration is also considered acceptable. The ultimate system analysis of the Encinitas Trunk Sewer has shown that the pipeline can contain both ultimate peak dry and wet weather flows without exceeding 90% capacity.
ES-6.3 Cardiff Sanitary Division
During existing peak dry weather conditions, hydraulic simulations showed that no pipelines 12-inches and larger exceeded 75% of capacity with the Cardiff Trunk Sewer, Cardiff Relief Trunk Sewer or the Olivenhain Trunk Sewer (OTS). For ultimate system model analysis, the trigger point for consideration of upgrades is greater than 90% of capacity during peak wet weather conditions. Surcharging, if short in distance and duration is also considered acceptable.
During ultimate system analysis, the Cardiff Trunk Sewer was found to flow less than 90% full during peak wet weather conditions with exception of immediately upstream of the Cardiff Pump Station. This short and very deep sewer segment was not determined to need improvement.
A portion of the Cardiff Relief Trunk Sewer near Somerset Avenue was identified as an area of concern during ultimate system flows in the 2003 master plan. As flows have decreased from 2003 in this reach, concern of capacity issues within this section have decreased as ultimate peak wet weather flow did not exceed 90% capacity. Flow monitoring is recommended in this area to measure inflow and infiltration during storm events and to identify whether replacement or diversion is required.
Within the OTS, areas of existing concern are reiterated within the ultimate system during peak wet weather flow conditions. Based on the current contribution of wet weather inflow and infiltration (I&I), the majority of the OTS from 5th Street to the OPS shows the potential for surcharging, as projected flows exceed the full pipe flow capacity. In the 2003 master plan, the solution to the capacity issues was the recommendation of a new larger diameter pipeline for the OTS. As I&I is the underlying justification for the need to upsize, the recommendation for this master plan update is to investigate the nature of the I&I prior to consideration of replacement pipeline. According to City staff, the existing OTS pipeline is in good shape. As observed during condition assessments conducted in the dry summer months, discussed below, not only are the majority of manholes along the OTS in need of rehabilitation, several manholes had streaming inflow of groundwater through cracks in the concrete. Leaks such as these are amplified during wet winter months. Therefore the recommended approach to address I&I within the OTS is rehabilitation of the manholes, followed by a phased flow monitoring program to focus on the location of the remaining upstream I&I.
Cardiff and Encinitas DUDEK SEWER MASTER PLAN UPDATE ES-10 April 2011
ES-7 CONDITION ASSESSMENT
ES-7.1 Pipeline CCTV Inspection
Approximately 11,000 feet of gravity pipeline CCTV inspection video was reviewed as part of the project. Areas reviewed include 4,000 feet of pipe in downtown Encinitas and 7,000 feet of pipeline between Clark Avenue and Encinitas Blvd. Many significant problem areas were observed in both reaches of CCTV reports. For the downtown area along 2nd Street, a replacement project was ultimately recommended to relocate the existing pipeline from alleyways to the roadway. The new pipeline will allow abandonment of the existing pipeline that had numerous condition issues and sags, which result in added risk of blockage and backup of flows. The pipeline from Clark Street to Encinitas Blvd also revealed many problem areas. Recommended repairs include numerous point repairs, slip lining and in several locations, replacement of the existing pipeline.
ES-7.2 OTS Manhole Inspection
Also included in the condition assessment tasks of the project was inspection of manholes along the Olivenhain Trunk Sewer. Dudek conducted a pole camera video inspection of 27 of the existing 54 manholes along the OTS between El Camino Del Norte and Manchester Ave. Access was impeded in many areas as the easement along the existing OTS is not currently drivable. In general, the majority of manholes were heavily corroded due to long term hydrogen sulfide exposure, infiltration and age. The observed structural defects within the base, wall and cone portions of the manhole ranged from minor cracking to the exposure of rebar, with the most common being the exposure of aggregate. Significant inflow was observed at three locations through faulty joint or pipe wall connections. Inspection was conducted during the summer when lagoon and groundwater levels are at their lowest. Therefore inflow is expected to be greater during wetter periods of the year. Evidence of surcharging was evident at five manholes.
ES-7.3 Pump Station Field Reviews
A site visit and field review of the Moonlight, Cardiff, and Coast Pump Stations was conducted. As a major renovation of the Moonlight Pump Station was completed in 2006, noted improvements were generally repairs to the surrounding structure and specific projects to improve operation and functionality of the building and various internal and external equipment. The Coast Pump Station is showing significant signs of deterioration and is need of either a full evaluation for rehabilitation needs or consideration of a replacement pump station. Cardiff Pump Station is in need of several improvements to provide more efficient operation, less clogging of pumps, increase reliability of the electrical system and provision of capability to easily install a pumped bypass. The Olivenhain Pump Station was not reviewed as the CSD has completed final design of a new pump station with construction anticipated to be complete in 2012.
Cardiff and Encinitas DUDEK SEWER MASTER PLAN UPDATE ES-11 April 2011
ES-8 OTS ALTERNATIVE ANALYSIS
Several alternatives were evaluated for the OTS to quantify the improvements and costs necessary to divert some or all of the existing flow through a new collection system to the OPS. One alternative included the construction of a new pump station at Rancho Santa Fe Road to divert upstream flows to a parallel gravity sewer in Manchester Ave. Rehabilitation of 31 existing manholes would be necessary. A second alternative consisted of two new pump stations to divert both upstream OTS flow and additional flow from the CSD away from the downstream section of the OTS. Hydraulic model analysis was conducted to confirm sizing and configuration of both alternatives. Compared to the replacement of the pipeline as proposed in 2003, the two pump station alternatives were significantly higher in cost and both additionally added new infrastructure (pump stations) that would require additional operation and maintenance resources indefinitely. Therefore, the recommended approach is to address rehabilitation of the existing sewer manholes and conduct a phased flow monitoring and remote level sensing program to locate the source of upstream I&I.
ES-9 JOINT FACILITIES/ TREATMENT PLANTS
ES-9.1 Joint Facilities
The Moonlight Beach Forcemain discharges to the Batiquitos Influent Sewer at the corner of La Costa Avenue and Highway 101. This sewer conveys wastewater from Leucadia Wastewater District (LWD) and ESD to the Batiquitos Pump Station operated by LWD. The Batiquitos Pump Station discharges through duty and standby 24-inch diameter ductile iron pipe forcemains to the Lanakai Gravity Sewer in Carlsbad. The Lanakai Sewer discharges the combined ESD and LWD flows to the Occidental Trunk Sewer operated by the City of Carlsbad and jointly owned by ESD, LWD, and Carlsbad. The 39-inch to 48-inch diameter Occidental Trunk Sewer conveys wastewater to a junction with a City of Vista and City of Carlsbad sewer and the four-agency flows are conveyed in a 60-inch sewer to the headworks of the Encina Wastewater Authority (EWA) WPCF. The various existing Agreements governing all of these facilities are currently being reviewed by all of the included agencies for possible revision in the near future.
ES-9.2 Encina WPCF
ESD wastewater is processed and treated at the Encina WPCF. ESD has a contract treatment capacity right of 1.8 mgd based on average dry weather flows, with a peak wet weather treatment inflow limit of 2.76 mgd. Projected ultimate dry weather flow for ESD is 1.25 mgd. Ultimate peak wet weather flow is projected at 2.69 mgd.
ES-9.3 San Elijo Water Reclamation Facility
Treatment of CSD wastewater is processed at the San Elijo WRF. The average dry weather flow allocation to CSD at SEWRF is 2.5 mgd. The projected ultimate average dry weather flow of the CSD is 1.99 mgd. There is no contractual limitation on peak flows from CSD to the San Elijo WRF.
Cardiff and Encinitas DUDEK SEWER MASTER PLAN UPDATE ES-12 April 2011
ES-10 RECOMMENDED CAPITAL IMPROVEMENT PROJECTS
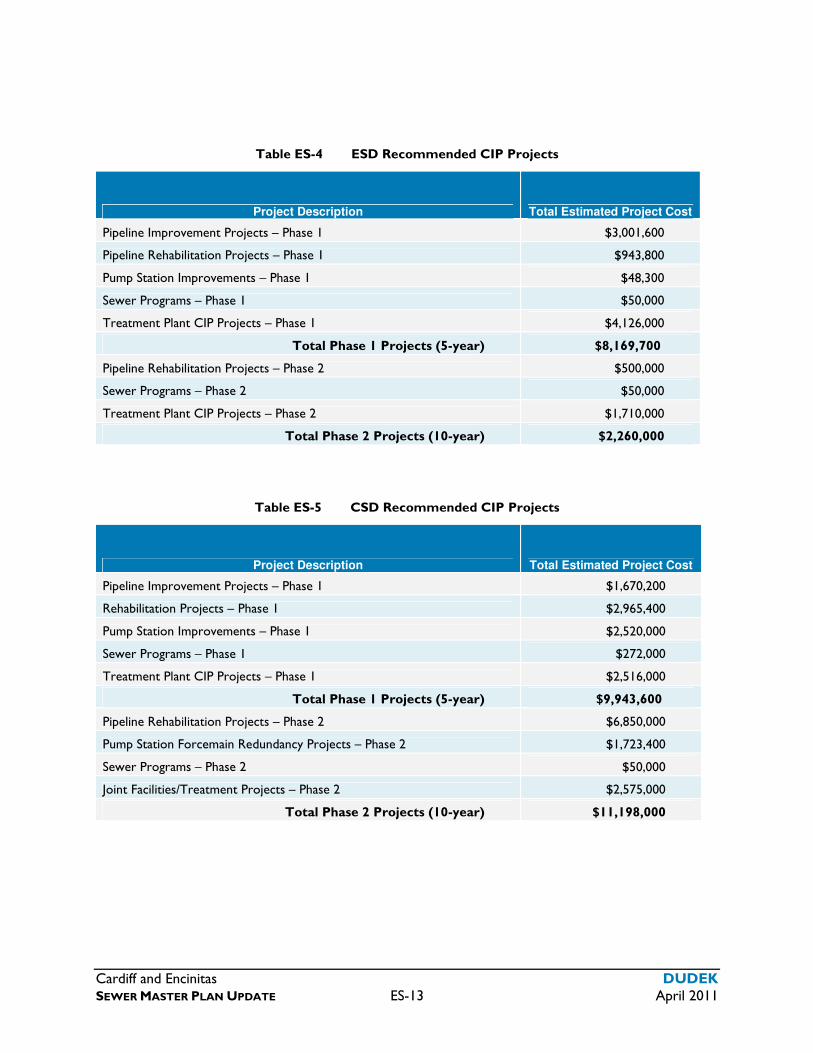
The Master Plan incorporates the findings of the capacity evaluation and condition assessments for the ESD and CSD into a comprehensive list of recommended capital improvement projects. Projects are recommended into a near term (5 year) and long term (10-year) planning horizons.
In addition to pipeline and pump station capacity and rehabilitation projects, the recommended CIP also includes projected Agency cost sharing for CIP projects planned at the treatment plants and several redundancy projects to provide both a backup in the event of an emergency and a means of maintaining the facility over time. The summary of grouped recommended CIP projects by Division and planning phase are provided in the following Tables ES-4 and ES-5.
Cardiff and Encinitas DUDEK SEWER MASTER PLAN UPDATE ES-13 April 2011
Table ES-4 ESD Recommended CIP Projects
Project Description Total Estimated Project Cost
Pipeline Improvement Projects – Phase 1 $3,001,600
Pipeline Rehabilitation Projects – Phase 1 $943,800
Pump Station Improvements – Phase 1 $48,300
Sewer Programs – Phase 1 $50,000
Treatment Plant CIP Projects – Phase 1 $4,126,000
Total Phase 1 Projects (5-year) $8,169,700
Pipeline Rehabilitation Projects – Phase 2 $500,000
Sewer Programs – Phase 2 $50,000
Treatment Plant CIP Projects – Phase 2 $1,710,000
Total Phase 2 Projects (10-year) $2,260,000
Table ES-5 CSD Recommended CIP Projects
Project Description Total Estimated Project Cost
Pipeline Improvement Projects – Phase 1 $1,670,200
Rehabilitation Projects – Phase 1 $2,965,400
Pump Station Improvements – Phase 1 $2,520,000
Sewer Programs – Phase 1 $272,000
Treatment Plant CIP Projects – Phase 1 $2,516,000
Total Phase 1 Projects (5-year) $9,943,600
Pipeline Rehabilitation Projects – Phase 2 $6,850,000
Pump Station Forcemain Redundancy Projects – Phase 2 $1,723,400
Sewer Programs – Phase 2 $50,000
Joint Facilities/Treatment Projects – Phase 2 $2,575,000
Total Phase 2 Projects (10-year) $11,198,000

Cardiff and Encinitas DUDEK SEWER MASTER PLAN UPDATE ES-14 April 2011
INTENTIONALLY LEFT BLANK
Cardiff and Encinitas DUDEK SEWER MASTER PLAN UPDATE 1-1 April 2011
CHAPTER 1 - INTRODUCTION
The Sewer Master Plan for the City of Encinitas (City) evaluates the condition and capacity of the major elements of the existing wastewater collection systems within both the Cardiff and Encinitas Sanitary Divisions, and makes recommendations for future system improvements. Collection system capacity is evaluated based on existing flow meter data and future wastewater flow projections that were incorporated into a new sewer collection system model of the major trunk sewers. Rehabilitation needs were identified based on video pipeline inspection of critical areas identified by the City’s Sanitary Divisions, topside manhole inspections, and onsite inspection of major pump stations. A proposed Capital Improvement Program (CIP) has been developed as part of this sewer system condition and capacity assessment to provide for continued reliable wastewater service through buildout conditions, which are projected to occur by approximately 2035. The CIP consists of a prioritized list of projects recommended to improve the reliability and/or capacity, and to extend the useful life of the collection system.
1.1 BACKGROUND
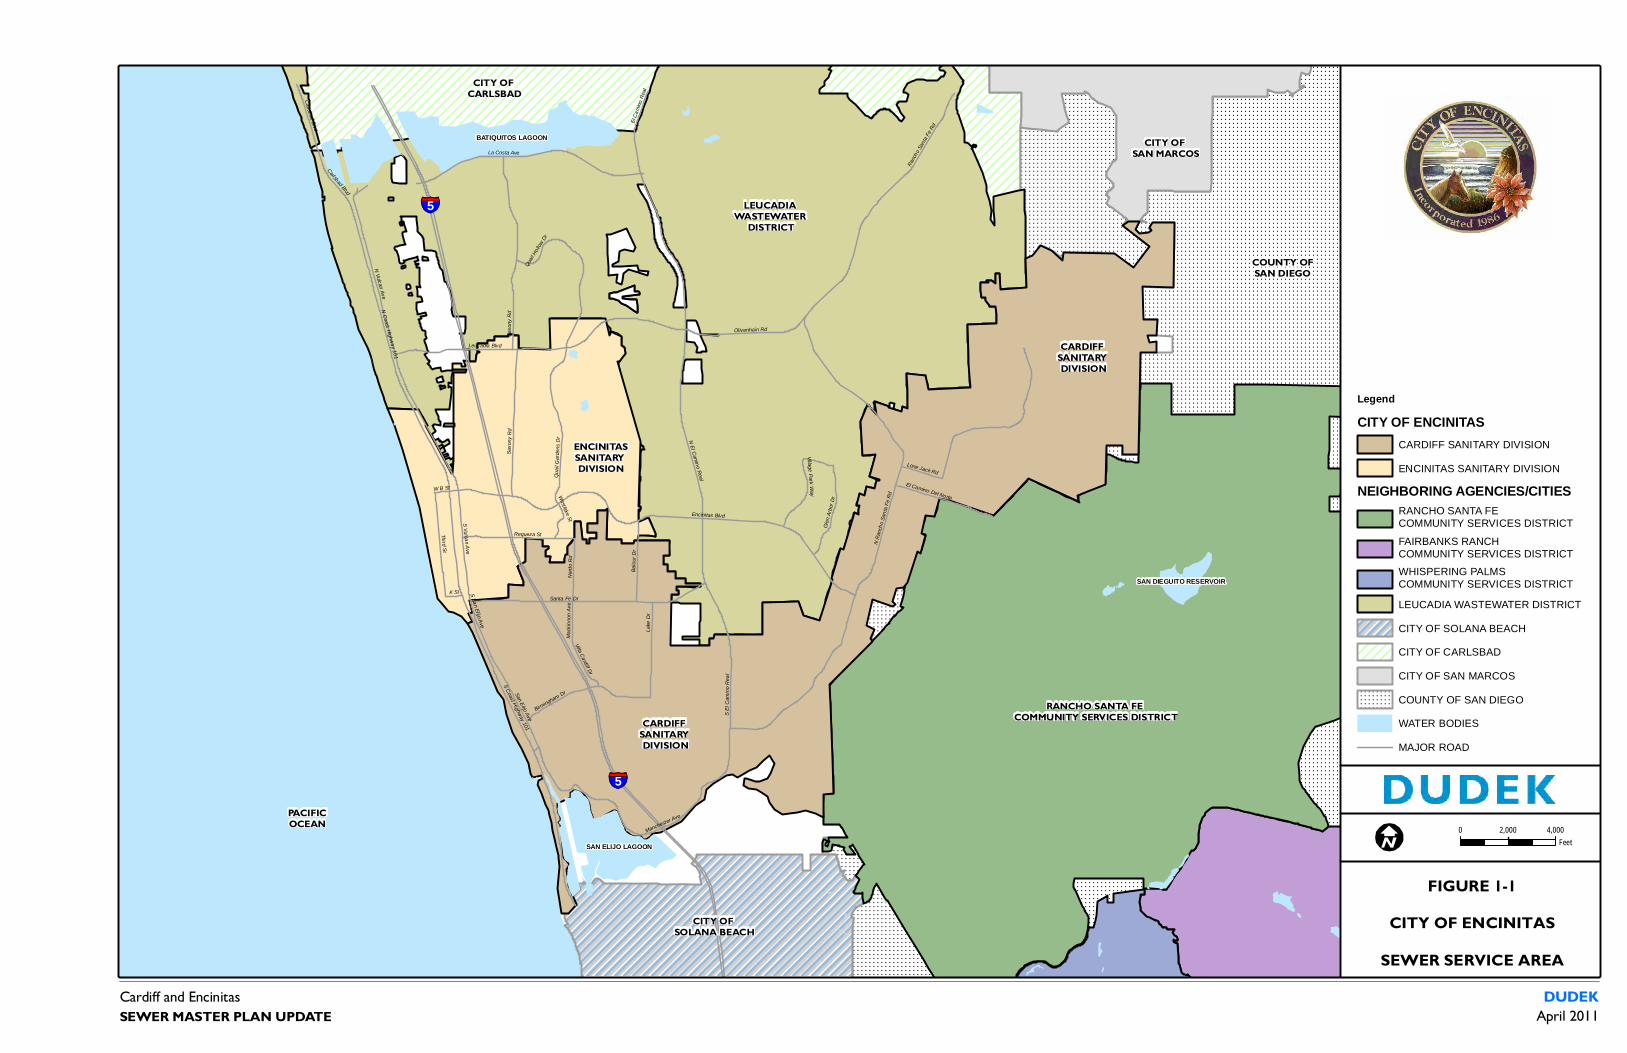
The Cardiff Sanitary Division (CSD) and Encinitas Sanitary Division (ESD) of the City of Encinitas provide wastewater collection service to the majority of the City limits through four main trunk sewers, approximately 123 miles of gravity pipelines, and four lift stations. The CSD provides sewer service to the communities of Cardiff and Olivenhain, and also collects flow from portions of the Rancho Santa Fe Community Services District (RSFCSD) and the City of Solana Beach. The ESD provides sewer service to the community of Old Encinitas and parts of Leucadia and New Encinitas. Sewage is delivered for treatment and disposal to either the Encina Water Pollution Control Facility (WPCF) in Carlsbad or to the San Elijo Water Reclamation Facility (SEWRF) in Cardiff. The Leucadia Wastewater District (LWD) provides sewer services to the remaining areas in the City, including a majority of residents in the communities of Leucadia and New Encinitas.
Figure 1-1illustrates the sewer service areas within the City of Encinitas and adjacent cities.
1.1.1 The City of Encinitas
The City of Encinitas was incorporated on October 1, 1986 as a General Law City and encompasses 21.5 square miles. The San Diego Association of Governments (SANDAG) estimates the 2010 population at approximately 65,171. The City includes the communities of Old Encinitas, New Encinitas, Leucadia, Cardiff, and Olivenhain. The City of Encinitas is served by two water districts: the San Dieguito Water Distinct and the Olivenhain Water District. Sewer service is provided by either the City of Encinitas or the LWD, although there are several small areas still served by on-site septic tank treatment and disposal systems.

Cardiff and Encinitas DUDEK SEWER MASTER PLAN UPDATE 1-2 April 2011
INTENTIONALLY LEFT BLANK
Encinitas Blvd
N Vulcan Ave
Manchester Ave
Leucadia Blvd
S Coast Highway 101
Santa Fe Dr
Saxo
ny R
d
La Costa Ave
San Elijo Ave
Quail
Gard
ens D
r
N Coast Highway 101
Ranch
o San
ta Fe R
dEl Ca
mino R
eal
Third St
Lone Jack Rd
Lake
Dr
S El C
amino
Rea
l
N El Camino Real
N Ra
ncho
Santa
Fe R
d
Balou
r Dr
Olivenhain Rd
Birmingham Dr
S Vulcan Ave
Requeza St
Nardo
Rd
Glen
Arbo
r Dr
El Camino Del Norte
Carlsbad Blvd
Village Park Way
K St
Villa Cardiff Dr
Westlake St
Mack
innon
Ave
Quail
Hollow
Dr
W B St
S San Elijo Ave
Saxo
ny R
d
Carlsbad Blvd
BATIQUITOS LAGOON
SAN ELIJO LAGOON
SAN DIEGUITO RESERVOIR
Cardiff and Encinitas
FIGURE 1-1CITY OF ENCINITAS
SEWER SERVICE AREA
SEWER MASTER PLAN UPDATEDUDEK
April 2011
PACIFICOCEAN
LegendCITY OF ENCINITAS
CARDIFF SANITARY DIVISION
ENCINITAS SANITARY DIVISION
NEIGHBORING AGENCIES/CITIESRANCHO SANTA FE COMMUNITY SERVICES DISTRICT
FAIRBANKS RANCH COMMUNITY SERVICES DISTRICT
WHISPERING PALMS COMMUNITY SERVICES DISTRICT
LEUCADIA WASTEWATER DISTRICT
CITY OF SOLANA BEACH
CITY OF CARLSBAD
CITY OF SAN MARCOS
COUNTY OF SAN DIEGO
WATER BODIES
MAJOR ROAD
CITY OF SAN MARCOS
CITY OF SOLANA BEACH
COUNTY OFSAN DIEGO
CITY OF CARLSBAD
5
5
0 4,0002,000Feet
RANCHO SANTA FE COMMUNITY SERVICES DISTRICTCARDIFF
SANITARY DIVISION
CARDIFF SANITARY DIVISION
ENCINITASSANITARY DIVISION
LEUCADIA WASTEWATER
DISTRICT

INTENTIONALLY LEFT BLANK
Cardiff and Encinitas DUDEK SEWER MASTER PLAN UPDATE 1-5 April 2011
Following incorporation of the City, authority over the former Cardiff and Encinitas Sanitation Districts was transferred from the County of San Diego to the City of Encinitas, and the districts became the Cardiff Sanitary Division (CSD) and the Encinitas Sanitary Division (ESD) within the City of Encinitas Public Works Department. Wastewater collection system services provided by the City of Encinitas include management, personnel, and equipment to perform administrative, engineering, maintenance, closed-circuit television (CCTV) inspections, and to respond to emergencies, as needed.
Operation and maintenance of the City’s four sewer pump stations is provided by contract with the San Elijo Joint Powers Authority (SEJPA). The Encinitas City Council makes all decisions regarding the ESD and CSD and appoints elected official representatives to sit as voting members on the Encina Wastewater Authority (EWA) Board for treatment and ocean disposal of EAD flows and the SEJPA Board for treatment and ocean disposal of CSD flows.
1.1.2 Cardiff Sanitary Division (CSD)
The original Cardiff Sanitation District was formed in 1953 to provide for the collection, transmission, and treatment of wastewater for the community of Cardiff-by-the-Sea, which was then an unincorporated area of San Diego County. Initial facilities included a small treatment plant near the mouth the San Elijo Lagoon and a system of gravity pipelines, including the Cardiff Trunk Sewer (CTS). The original treatment plant was replaced in the mid 1960’s with the SEWRF and a new ocean outfall, which was jointly constructed by the CSD and the City of Solana Beach (formerly the Solana Beach Sanitation District). The Cardiff Pump Station was then constructed to pump flow from the CTS to the new treatment plant and a separate gravity pipeline was constructed to convey a portion of Cardiff flows from the east. The City of Solana Beach also constructed a separate pump station and force main to the treatment plant. In 1972, the Olivenhain Pump Station (OPS) was constructed to serve areas further east that are tributary to the San Elijo Lagoon, which include areas of Olivenhain, the City of Solana Beach, and Rancho Santa Fe Community Service District (RSFCSD). The Olivenhain Trunk Sewer (OTS) was constructed at the same time along the north side of the lagoon. In 2001, the City of Encinitas assumed control of the CSD and began its operation as the Cardiff Sanitary Division of the Public Works Department.
CSD services a population of approximately 19,600 residents in a 12 square-mile area in the southern and easterly portions of the City. There are approximately 84 miles of sewer mains and 600 manholes in the collection system. CSD serves primarily residential units, with some commercial such as stores, restaurants, offices, and medical buildings, including Scripps Hospital. Sewer services are billed based on water use, and the average annual sewer service charge for single family residences is $663.76 (FY 20010/11). The sewer capacity fee is $3,417 per equivalent dwelling unit (EDU).
1.1.3 Encinitas Sanitary Division (ESD)
The original Encinitas Sanitation District was formed in 1946 to serve areas along the coast in Old Encinitas. A wastewater treatment plant was constructed at the northeast corner of Encinitas Boulevard and Vulcan Avenue (the present location of Cottonwood Creek Park) and a pump station and
Cardiff and Encinitas DUDEK SEWER MASTER PLAN UPDATE 1-6 April 2011
initial collection system were completed in 1953. When it became apparent that the capacity of the existing treatment plant would be insufficient to serve the needs of a rapidly developing community, wastewater treatment from the Encina WPCF, located in Carlsbad, was investigated.
In 1971, Encinitas Sanitation District and LWD (formerly the Leucadia County Water District) became members of the Encina Joint Powers Authority (JPA). The Moonlight Beach Pump Station was constructed in 1974 at the southwest corner of Third and “B” Streets in Encinitas to convey all effluent collected within the Encinitas Sanitation District service area to the north. Encinitas Sanitation District and LWD jointly funded construction of the Leucadia-Encinitas Phase 1 Pump and Transmission Facilities-Batiquitos Pump Station, which delivers effluent from the Moonlight Beach Pump station force main and LWD collection system facilities to the Encina WPCF.
After City incorporation in 1986, the City Council confirmed to sit as the Board of Directors for the Encinitas Sanitation District until 1995. In June 1995, the Encinitas Sanitation District was dissolved and became the Encinitas Sanitary Division (ESD) of the Public Works Department of the City of Encinitas.
ESD serves a population of approximately 16,500 residents in a 3 square-mile area in the westerly central portion of the City. There are approximately 39 miles of sewer mains and 475 manholes in the collection system. ESD serves primarily residential units with some commercial development in the downtown area. Sewer services are billed based on water use, and the average annual sewer service charge for single family residences is $565.93 (FY 2010/11). The sewer capacity fee is $2,680 per EDU.
1.1.4 Encina Wastewater Authority (EWA)
In 1988, the partners of the joint power authority, originally formed in 1961 entered into a Revised Basic Agreement and created the Encina Administrative Agency (EAA), which was renamed the Encina Wastewater Authority (EWA) in 1991. The EWA is a joint powers authority which was created to serve as the Operator/Administrator of the Encina Joint System. The EWA operates and maintains the Encina WPCF (Unit 1), ocean outfall (Unit J), a biosolids facility, and two lift stations jointly-owned by the cities of Vista and Carlsbad. The Encina WPCF, which is located in Carlsbad, provides full secondary treatment, sludge handling, and disposal through a deep ocean outfall. The EWA is comprised of six northern San Diego County wastewater member agencies: the Buena Sanitation District, City of Carlsbad, City of Encinitas, LWD, Vallecitos Water District, and the City of Vista. Each EWA member agency has capacity rights to the WPCF and ocean outfall system. The capacity rights for the City of Encinitas, based on the 2004 Encina Joint Powers Authority Revised Basic Agreement, are 1.80 million gallons per day (mgd) average daily flow for treatment plant capacity (5% of total capacity) and capacity in the outfall (4.74% of total). Peak wet weather flows must remain below a 2.76 peaking factor, or 4.97 mgd. Flows from the City of Encinitas to the Encina WPCF are metered at the discharge of the Moonlight Beach Pump Station force main.
1.1.5 San Elijo Joint Powers Authority (SEJPA)
The SEJPA was created as a separate public entity in 1987, following the incorporation of the cities of Encinitas and Solana Beach. Its member agencies are the City of Encinitas and the City of Solana Beach.
Cardiff and Encinitas DUDEK SEWER MASTER PLAN UPDATE 1-7 April 2011
The SEJPA owns and operates the 5.25 mgd SEWRF and a 2.48 mgd water reclamation facility co-located on one property in Cardiff. The SEJPA also operates and maintains nine wastewater lift stations, including the Moonlight Beach, Cardiff, Olivenhain and Coast pump stations. The SEWRF discharges secondary treated wastewater to the Pacific Ocean through the San Elijo Ocean Outfall, which extends 1.5 miles offshore.
The Cities of Encinitas and Solana Beach each have 50 percent interest in the SEWRF. Rancho Santa Fe Community Services District (RSFCSD) leases 0.25 mgd of capacity, and the remainder is split equally between Encinitas and Solana Beach. The allocation of ADWF for the City of Encinitas is therefore 2.5 mgd. Maintenance and operational costs for wastewater treatment and disposal are allocated between member agencies based on average daily flows for the calendar year.
The SEJPA shares ownership in the 30-inch and 48-inch diameter ocean outfall with the City of Escondido. The allocation of the outfall capacity to SEJPA is 21 percent, split 50-50 between Encinitas and Solana Beach, and 79 percent to Escondido. Based on the design outfall capacity of 25.5 mgd, The City of Encinitas has rights to 2.7 mgd.
1.1.6 Rancho Santa Fe Community Services District (RSFCSD)
The RSFCSD provides sewer collection, treatment and disposal services to the community of Rancho Santa Fe. A portion of the wastewater generated within the RSFCSD service area is tributary to the Olivenhain Trunk Sewer (OTS) and is treated at the SEWRF. Flow from approximately 479 residential units is collected and discharged to the OTS from four separate gravity lines that cross under the San Elijo Lagoon. The upstream collection system includes the La Granada and Rancho Serena Pump Stations.
CSD entered into an agreement with RSFCSD in 1991 to lease transmission capacity in the OTS, pump station, and force main. This 30-year lease permits RSFCSD to lease 0.25 mgd of average daily dry weather flow, and limits the maximum instantaneous discharge to 0.625 mgd. RSFCSD’s lease payment to CSD is comprised of a leased capacity component, which is based on 0.25 mgd of usage, and a separate component that covers administration, management, operations and maintenance of the transmission facilities.
1.1.7 City of Solana Beach
All wastewater from the City of Solana Beach is pumped to and treated at the SEWRF. Flows from over 85 percent of the city are pumped across the San Elijo Lagoon directly to the SEWRF from the Solana Beach Pump Station. Flows from the San Elijo Hills Drainage Basin, located between El Camino Real and Interstate 5 (I-5) in the northeastern portion of Solana Beach, are conveyed to the Olivenhain Pump Station in a 10-inch diameter siphon that crosses under the lagoon. The siphon was constructed in 2000 to replace an older gravity pipeline. Wastewater collection facilities in the San Elijo Hills Drainage basin consist of approximately 30,000 feet of gravity line and one permanent lift station, the San Elijo Hills Pump Station. The San Elijo Hills basin is fully built out, and development consists of approximately 480 single family homes.
Cardiff and Encinitas DUDEK SEWER MASTER PLAN UPDATE 1-8 April 2011
1.1.8 Leucadia Wastewater District (LWD)
The LWD was established in 1959 to serve the community of Leucadia. LWD originally operated the Gafner Water Reclamation Plant, which treated all collected wastewater flows. To meet the needs of the growing population, LWD joined the Encina JPA in 1971. LWD covers a total service area of 15 square miles and provides services to 60,000 residents in a boundary that includes the original service area in Leucadia as well as the La Costa area in Carlsbad and the northeastern area of Encinitas. As of December 2007, the collection system served 27,545 EDUs at 91.7% build-out. All wastewater generated within the District’s service area is conveyed to the Encina WPCF through the Batiquitos Pump Station, which is jointly-owned by the LWD and the ESD. LWD owns approximately 20% of the treatment capacity at the Encina WPCF and presently transports an average of 4.5 mgd of wastewater to the plant. The Gafner WRP is fully owned and operated by LWD and currently treats secondary treated effluent pumped from the Encina WPCF to the Gafner WRP and treated to tertiary standards for distribution as recycled water.
1.2 SERVICE AREA OVERVIEW
The City of Encinitas is a coastal resort town in northern San Diego County. The geography is characterized by two lagoons at the northern and southern boundaries, a central creek, and gently rolling to highly dissected mesa-like hills. Average annual precipitation is 10.7 inches, and most of the rainfall occurs between November and March.
The CSD service area within the City of Encinitas covers the southern and southeastern portions of the City. Elevations range from sea level along the coast to over 500 feet at the coastal foothills in the northeastern corner of the service area. Drainage is to the Escondido Creek and San Elijo Lagoon, which generally form the southern City boundary. Areas south of the City limits also drain to San Elijo Lagoon, and some of these areas discharge wastewater to portions of the CSD collection system. The boundaries of the CSD and its relationship to other sewer service districts were previously shown on Figure 1-1. The ESD service area lies entirely within the boundary of the City of Encinitas, primarily along the coast and the Cottonwood Creek drainage basin, as shown previously in Figure 1-1. The service area covers approximately 2.9 square miles and is bounded on the north and east by the LWD and on the south and east by the CSD service area. The ESD service area extends from the Pacific Ocean approximately 1 mile inland and represents about 10 percent of the total land areas within the City of Encinitas.
1.3 GENERAL LAND USE
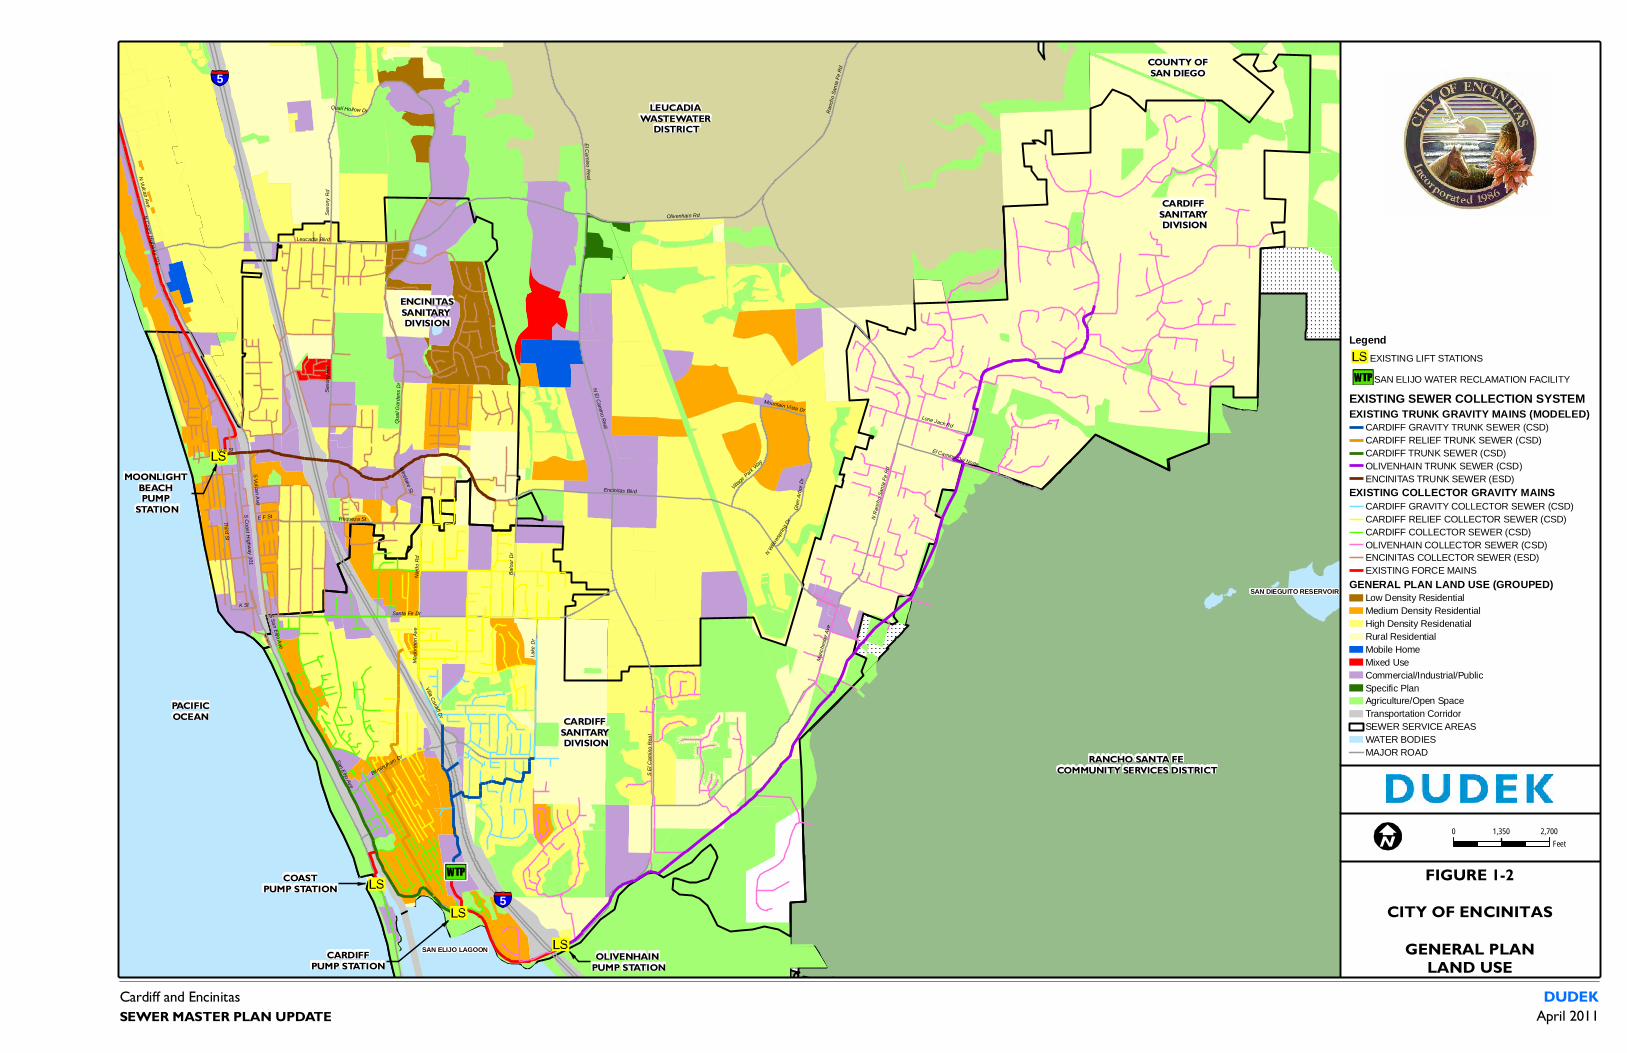
The Encinitas General Plan serves as the blueprint for the long-range, orderly, physical development of the City. The current General Plan was adopted in 1989. The general plan land use based on the City’s GIS general plan land use layer and open space layer is shown on Figure 1-2. Some of the similar land use types have been merged for clarity. The City embarked on a Comprehensive General Plan Update in 2009, and the update process is expected to take two years. It is noted that information from the update was not available for this master planning effort.
Cardiff and Encinitas DUDEK SEWER MASTER PLAN UPDATE 1-9 April 2011
1.3.1 CSD Land Use
The CSD consists primarily of two separate communities: Cardiff-by-the-Sea and Olivenhain. The community of Cardiff is primarily residential, with the highest densities concentrated in the area west of I-5. Commercial development consists of the central business district along San Elijo Avenue between Birmingham Drive and Glen Park, and a second commercial center adjacent to I-5 on Birmingham Drive. There is also some commercial development on Santa Fe Drive, both east and west of I-5, and a “restaurant row” along the southern stretch of Highway 101 in the City. Major public facilities include San Dieguito Academy, San Elijo State Beach Campground, and the SEWRF. Scripps Hospital is situated between the CSD and ESD service areas and is served by both.

Cardiff and Encinitas DUDEK SEWER MASTER PLAN UPDATE 1-10 April 2011
INTENTIONALLY LEFT BLANK
Encinitas Blvd
Manc
heste
r Ave
Leucadia Blvd
Santa Fe Dr
N Vulcan Ave
S Coast Highway 101
San Elijo Ave
Quail
Gard
ens D
r
Third St
Lone Jack Rd
Saxo
ny R
d
Lake
Dr
S El C
amino
Rea
l
N El Camino Real
N Coast Highway 101
N Ra
ncho
Santa
Fe R
d
Balou
r Dr
Olivenhain Rd
Birmingham Dr
S Vulcan Ave
Requeza St
Ranc
ho Sa
nta Fe
Rd
Nardo
Rd
El Camino Real
Glen
Arbo
r Dr
El Camino Del Norte
Village Park
Way
K St
Villa Cardiff Dr
Westlake St
Mack
innon
Ave
E F St
Quail Hollow Dr
W B St
Mountain Vista Dr
S San Elijo Ave
N Willo
wsprin
g Dr
Saxo
ny R
d
SAN ELIJO LAGOON
SAN DIEGUITO RESERVOIR
Cardiff and Encinitas
FIGURE 1-2CITY OF ENCINITAS
GENERAL PLANLAND USE
SEWER MASTER PLAN UPDATEDUDEK
April 2011
PACIFICOCEAN
LegendEXISTING LIFT STATIONS
SAN ELIJO WATER RECLAMATION FACILITY
EXISTING SEWER COLLECTION SYSTEMEXISTING TRUNK GRAVITY MAINS (MODELED)
CARDIFF GRAVITY TRUNK SEWER (CSD)CARDIFF RELIEF TRUNK SEWER (CSD)CARDIFF TRUNK SEWER (CSD)OLIVENHAIN TRUNK SEWER (CSD)ENCINITAS TRUNK SEWER (ESD)
EXISTING COLLECTOR GRAVITY MAINSCARDIFF GRAVITY COLLECTOR SEWER (CSD)CARDIFF RELIEF COLLECTOR SEWER (CSD)CARDIFF COLLECTOR SEWER (CSD)OLIVENHAIN COLLECTOR SEWER (CSD)ENCINITAS COLLECTOR SEWER (ESD)EXISTING FORCE MAINS
GENERAL PLAN LAND USE (GROUPED)Low Density ResidentialMedium Density ResidentialHigh Density ResidenatialRural ResidentialMobile HomeMixed UseCommercial/Industrial/PublicSpecific PlanAgriculture/Open SpaceTransportation CorridorSEWER SERVICE AREASWATER BODIESMAJOR ROAD
COUNTY OFSAN DIEGO
5
5
0 2,7001,350Feet
RANCHO SANTA FE COMMUNITY SERVICES DISTRICT
CARDIFF SANITARY DIVISION
CARDIFF SANITARY DIVISION
ENCINITASSANITARY DIVISION
LEUCADIA WASTEWATER
DISTRICT
COASTPUMP STATION
CARDIFFPUMP STATION
OLIVENHAIN PUMP STATION
MOONLIGHT BEACH PUMP
STATION

INTENTIONALLY LEFT BLANK
Cardiff and Encinitas DUDEK SEWER MASTER PLAN UPDATE 1-13 April 2011
The community of Olivenhain has lower residential densities than Cardiff. The highest residential densities in the community are towards the west end along Rancho Santa Fe Road, where residential zoning permits two units per acres. Virtually all of the remaining land areas in the community are designated Rural Residential or Rural, with minimum lot sizes ranging from one to eight acres. Commercial development exists in a single area of the community located at the intersection of Encinitas Boulevard and Rancho Santa Fe Road. The Olivenhain community includes areas that have steep topography and areas subject to periodic flooding. Many areas adjacent to Escondido Creek and its tributaries are designated as an ecological resource and will remain as open space. The largest open space area is the 123-acre Manchester Preserve, which was established in 1996. While not within the Olivenhain community, the commercial areas along El Camino Real south of Santa Fe Drive, the San Elijo campus of Mira Costa College, and several newer residential developments north of Manchester Avenue are tributary to the OTS. The CSD service area is estimated to be approximately 80 percent built-out.
1.3.2 ESD Land Use
The ESD includes the majority of Old Encinitas and portions of Leucadia. Over the years, land use within the ESD service area has progressed from mainly agricultural use to urbanized development and has subsequently produced an increased population within the service area. Old Encinitas includes varying commercial development along the Highway 101 corridor such as restaurants, stores, professional office, auto repair shops, hair salons, motels, etc. The area includes numerous planned residential developments, the largest being the Encinitas Ranch Specific Planning Area. Public facilities include Moonlight State Beach, Encinitas City Hall and the San Diego Botanic Gardens. Open space areas include a dedicated agricultural reserve within the Encinitas Ranch. The ESD area is experiencing some infill development, especially with further reduction of agricultural land. There have also been recent redevelopment projects, including multi-use developments (commercial/residential) in the downtown area. The ESD service area is approximately 90 percent built-out.
1.4 PURPOSE OF THE STUDY
The purpose of this Sewer Master Plan Update is to evaluate the City’s existing and future sewer facilities needs, make recommendations and prepare a preliminary opinion of probable cost for each of the proposed improvements. The previous Sewer Master Plan for the Cardiff and Encinitas Sanitary Divisions was completed in February, 2003. The Sewer Master Plan Update will include an assessment of the existing system (pipelines and pump stations), future needs determined by demographic projections and a comprehensive review of maintenance procedures. Information derived from this evaluation will be used to prepare a comprehensive list of improvement projects that will be necessary to accommodate “build-out” capacity as well as extending the useful life of the entire system. Each specific project will be described in detail and will include budget estimates. The Sewer Master Plan Update will be used as the foundation for a subsequent sewer rate study that will be conducted to ensure that revenues are sufficient to meet future operating, capital expansion and system rehabilitation needs.

Cardiff and Encinitas DUDEK SEWER MASTER PLAN UPDATE 1-14 April 2011
Authorization for the City of Encinitas Director of Public Works to negotiate a contract with Dudek for preparation of the 2010 Cardiff and Encinitas Sewer Master Plan Update was provided by the Encinitas City Council on May 19, 2010.
Cardiff and Encinitas DUDEK SEWER MASTER PLAN UPDATE 2-1 April 2011
CHAPTER 2 - EXISTING SYSTEM FACILITIES AND FLOWS
This chapter summarizes the major wastewater facilities in the Encinitas and Cardiff Sanitary Divisions of the City of Encinitas sewer system. These facilities include the main trunk sewers, pump stations, force mains, and collector sewers. Information regarding the existing wastewater collection system facilities was obtained from the City’s sewer system GIS, previous reports and studies, and City Engineering and Public Works staff input. Capacity calculations for the gravity trunk sewers are based on the sewer system GIS and were generated from the hydraulic model.
2.1 EXISTING FACILITIES
The existing City of Encinitas wastewater collection system is shown in Figure 2-1. Flows generated within the Cardiff Sanitary Division are collected in one of four trunk sewer systems and then pumped or conveyed by gravity to the SEWRF. All flows generated within the Encinitas Sanitary Division are collected in a single trunk sewer and pumped to the Encina WPCF. The following subsections provide detailed information about each of the major facilities.
2.1.1 Trunk Sewers
Cardiff Trunk Sewer (CTS) and Cardiff Relief Sewer
The original CTS was constructed in the early 1950’s to serve the community of Cardiff-by-the-Sea. The CTS begins about 1,800 feet south of Santa Fe Drive and flows south, paralleling the coastline in San Elijo Avenue. It then turns east and is aligned in Manchester Avenue, following the north shore of the San Elijo Lagoon to its terminus at the Cardiff Pump Station. Pipeline sizes range from 8 to 15-inches in diameter. As development increased in the Cardiff area, flat sections of the CTS started flowing full. A new sewer was constructed through central Cardiff to intercept flows from eastern portions of the service area and discharge the flows to more steeply sloped sections of CTS further downstream. The Cardiff Relief Sewer begins just east of I-5 and follows Somerset Avenue south to central Cardiff, where it flows west and south in a succession of turns in streets to connect with the CTS at Manchester and San Elijo Avenue. The Cardiff Relief Sewer collects flows from a sizable area east of I-5, including San Dieguito Academy and miscellaneous commercial development along Santa Fe Drive.
Cardiff Gravity Trunk Sewer (CGTS)
The Cardiff Gravity Trunk Sewer (CGTS) collects flows from residential areas east of I-5, and from apartment complexes along the west side of I-5. The pipelines are 8 and 10-inches in diameter. The CGTS begins at Lake Drive and Birmingham Drive, and flows south and west in several streets before crossing under I-5 near the south end of Playa Riviera Drive. Two separate upstream sections of the trunk sewer start just east of I-5 further north, and collect flows from areas north of Birmingham Drive, crossing under I-5 near Emma Drive and Nolbey Street. West of I-5 the CGTS flows south in Carol View Lane and then in an easement to the north end of the SEWRF. The CGTS was previously termed the “backdoor” gravity sewer, since flow enters the plant from the backside and not from the front entrance, like the other trunk sewer systems.

Cardiff and Encinitas DUDEK SEWER MASTER PLAN UPDATE 2-2 April 2011
INTENTIONALLY LEFT BLANK
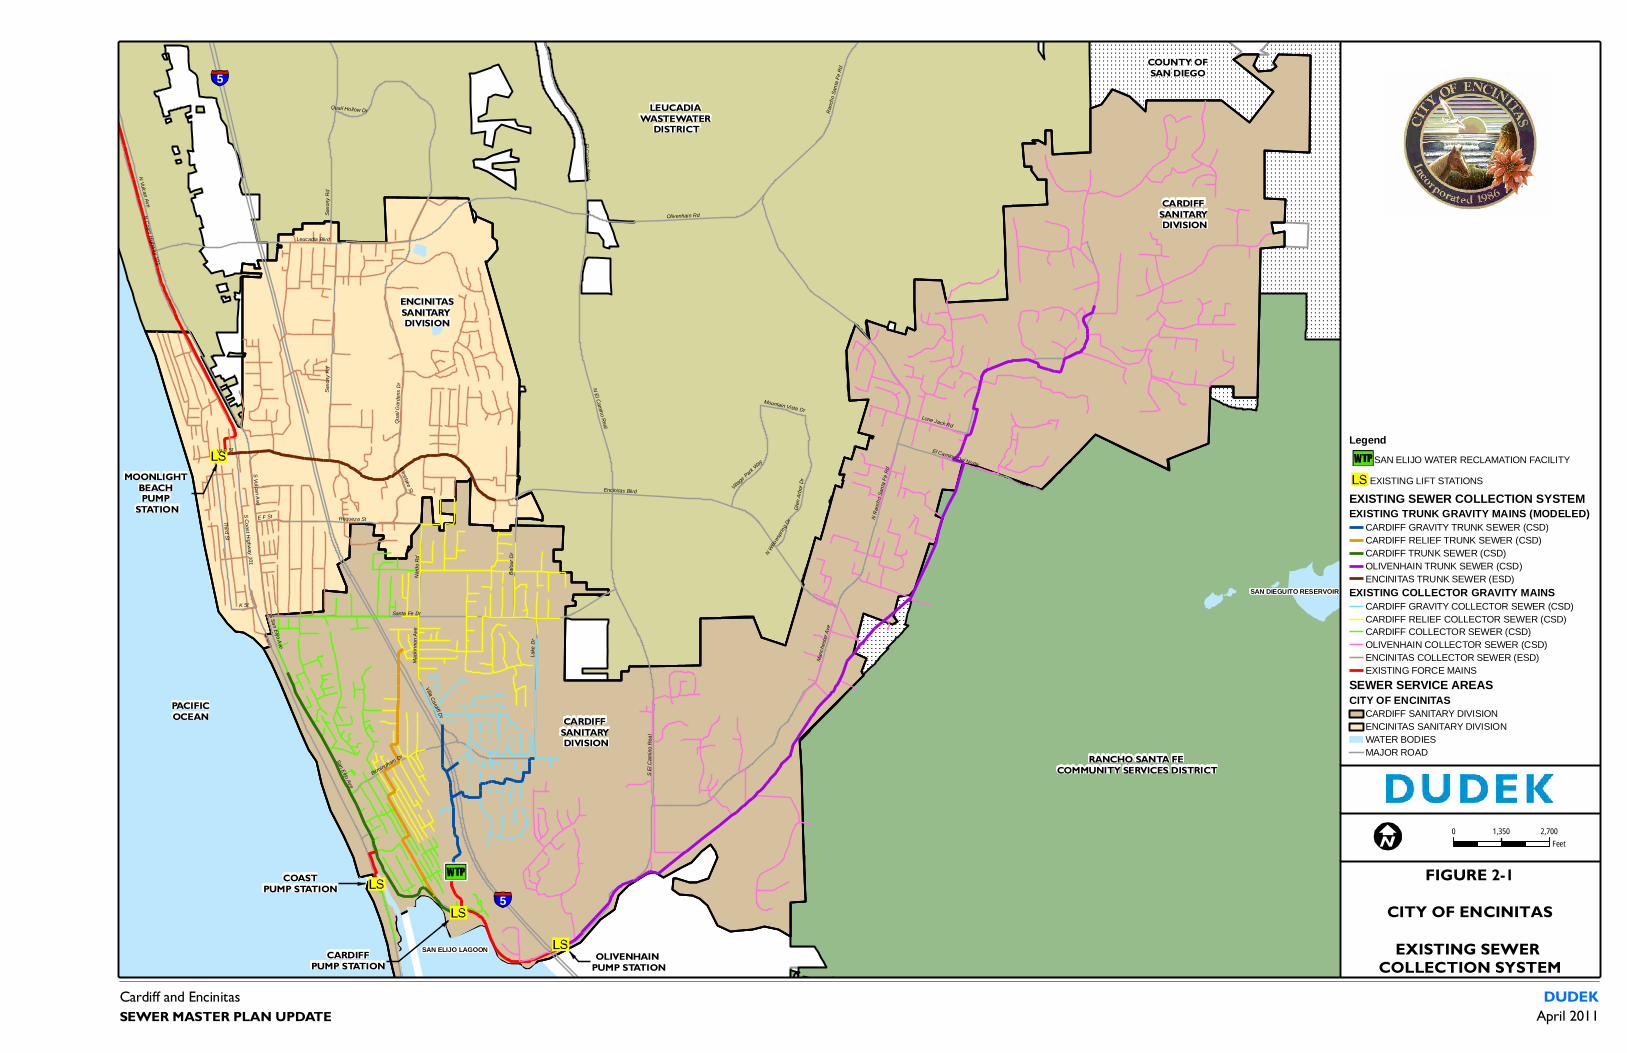
Encinitas Blvd
Manc
heste
r Ave
Leucadia Blvd
Santa Fe Dr
N Vulcan Ave
S Coast Highway 101
San Elijo Ave
Quail
Gard
ens D
r
Third St
Lone Jack Rd
Saxo
ny R
d
Lake
Dr
S El C
amino
Rea
l
N El Camino Real
N Coast Highway 101
N Ra
ncho
Santa
Fe R
d
Balou
r Dr
Olivenhain Rd
Birmingham Dr
S Vulcan Ave
Requeza St
Ranc
ho Sa
nta Fe
Rd
Nardo
Rd
El Camino Real
Glen
Arbo
r Dr
El Camino Del Norte
Village Park
Way
K St
Villa Cardiff Dr
Westlake St
Mack
innon
Ave
E F St
Quail Hollow Dr
W B St
Mountain Vista Dr
S San Elijo Ave
N Willo
wsprin
g Dr
Saxo
ny R
d
SAN ELIJO LAGOON
SAN DIEGUITO RESERVOIR
Cardiff and Encinitas
FIGURE 2-1CITY OF ENCINITAS
EXISTING SEWER COLLECTION SYSTEM
SEWER MASTER PLAN UPDATEDUDEK
April 2011
PACIFICOCEAN
LegendSAN ELIJO WATER RECLAMATION FACILITY
EXISTING LIFT STATIONS
EXISTING SEWER COLLECTION SYSTEMEXISTING TRUNK GRAVITY MAINS (MODELED)
CARDIFF GRAVITY TRUNK SEWER (CSD)CARDIFF RELIEF TRUNK SEWER (CSD)CARDIFF TRUNK SEWER (CSD)OLIVENHAIN TRUNK SEWER (CSD)ENCINITAS TRUNK SEWER (ESD)
EXISTING COLLECTOR GRAVITY MAINSCARDIFF GRAVITY COLLECTOR SEWER (CSD)CARDIFF RELIEF COLLECTOR SEWER (CSD)CARDIFF COLLECTOR SEWER (CSD)OLIVENHAIN COLLECTOR SEWER (CSD)ENCINITAS COLLECTOR SEWER (ESD)EXISTING FORCE MAINS
SEWER SERVICE AREASCITY OF ENCINITAS
CARDIFF SANITARY DIVISIONENCINITAS SANITARY DIVISIONWATER BODIESMAJOR ROAD
COUNTY OFSAN DIEGO
5
5
0 2,7001,350Feet
RANCHO SANTA FE COMMUNITY SERVICES DISTRICT
CARDIFF SANITARY DIVISION
CARDIFF SANITARY DIVISION
ENCINITASSANITARY DIVISION
LEUCADIA WASTEWATER
DISTRICT
COASTPUMP STATION
CARDIFFPUMP STATION
OLIVENHAIN PUMP STATION
MOONLIGHT BEACH PUMP
STATION

INTENTIONALLY LEFT BLANK
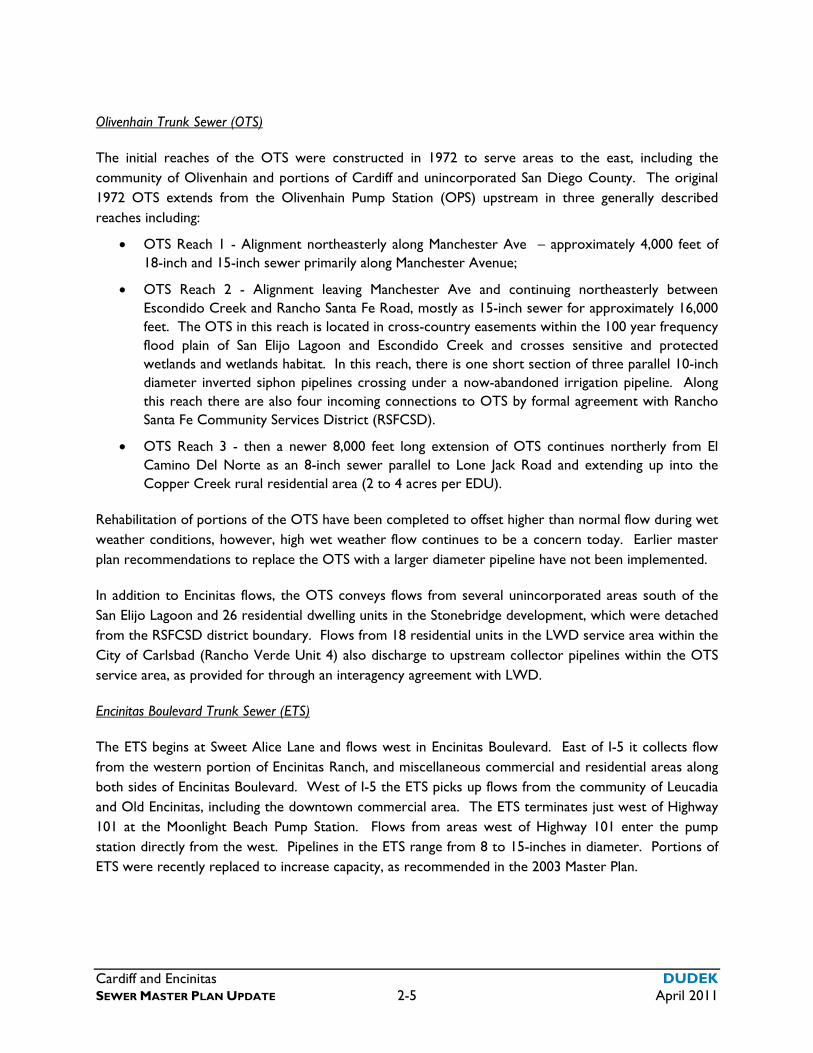
Cardiff and Encinitas DUDEK SEWER MASTER PLAN UPDATE 2-5 April 2011
Olivenhain Trunk Sewer (OTS)
The initial reaches of the OTS were constructed in 1972 to serve areas to the east, including the community of Olivenhain and portions of Cardiff and unincorporated San Diego County. The original 1972 OTS extends from the Olivenhain Pump Station (OPS) upstream in three generally described reaches including:
OTS Reach 1 - Alignment northeasterly along Manchester Ave – approximately 4,000 feet of 18-inch and 15-inch sewer primarily along Manchester Avenue;
OTS Reach 2 - Alignment leaving Manchester Ave and continuing northeasterly between Escondido Creek and Rancho Santa Fe Road, mostly as 15-inch sewer for approximately 16,000 feet. The OTS in this reach is located in cross-country easements within the 100 year frequency flood plain of San Elijo Lagoon and Escondido Creek and crosses sensitive and protected wetlands and wetlands habitat. In this reach, there is one short section of three parallel 10-inch diameter inverted siphon pipelines crossing under a now-abandoned irrigation pipeline. Along this reach there are also four incoming connections to OTS by formal agreement with Rancho Santa Fe Community Services District (RSFCSD).
OTS Reach 3 - then a newer 8,000 feet long extension of OTS continues northerly from El Camino Del Norte as an 8-inch sewer parallel to Lone Jack Road and extending up into the Copper Creek rural residential area (2 to 4 acres per EDU).
Rehabilitation of portions of the OTS have been completed to offset higher than normal flow during wet weather conditions, however, high wet weather flow continues to be a concern today. Earlier master plan recommendations to replace the OTS with a larger diameter pipeline have not been implemented.
In addition to Encinitas flows, the OTS conveys flows from several unincorporated areas south of the San Elijo Lagoon and 26 residential dwelling units in the Stonebridge development, which were detached from the RSFCSD district boundary. Flows from 18 residential units in the LWD service area within the City of Carlsbad (Rancho Verde Unit 4) also discharge to upstream collector pipelines within the OTS service area, as provided for through an interagency agreement with LWD.
Encinitas Boulevard Trunk Sewer (ETS)
The ETS begins at Sweet Alice Lane and flows west in Encinitas Boulevard. East of I-5 it collects flow from the western portion of Encinitas Ranch, and miscellaneous commercial and residential areas along both sides of Encinitas Boulevard. West of I-5 the ETS picks up flows from the community of Leucadia and Old Encinitas, including the downtown commercial area. The ETS terminates just west of Highway 101 at the Moonlight Beach Pump Station. Flows from areas west of Highway 101 enter the pump station directly from the west. Pipelines in the ETS range from 8 to 15-inches in diameter. Portions of ETS were recently replaced to increase capacity, as recommended in the 2003 Master Plan.
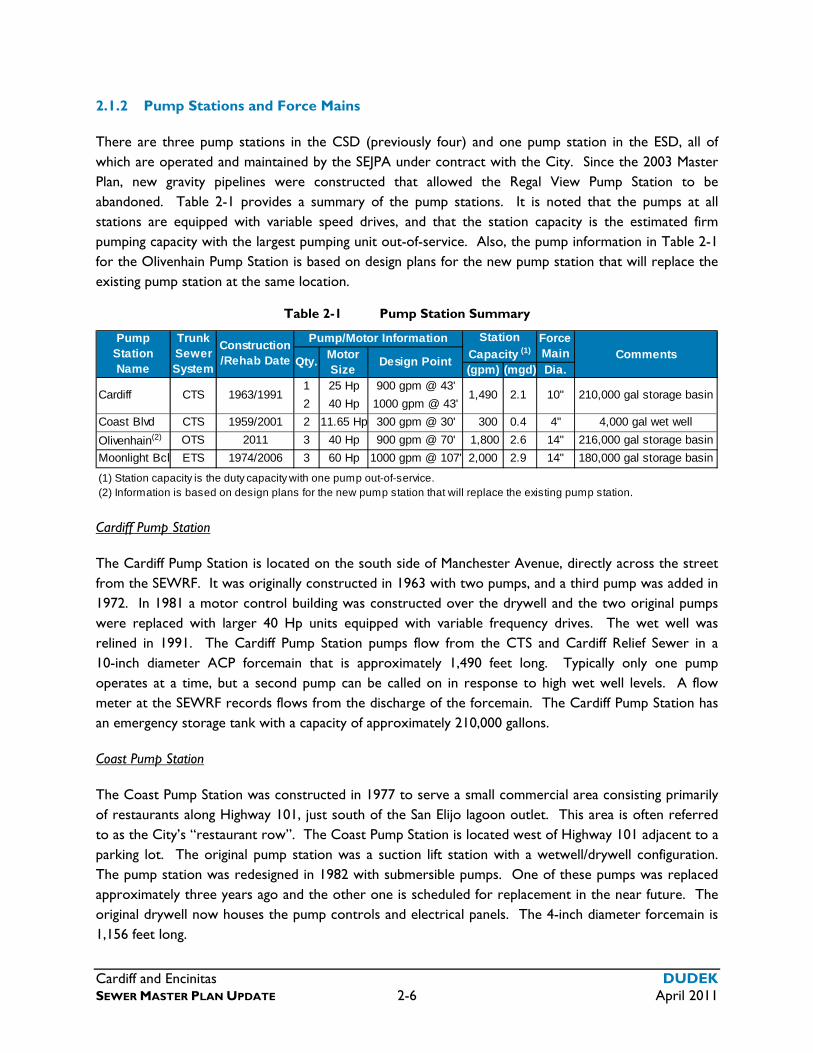
Cardiff and Encinitas DUDEK SEWER MASTER PLAN UPDATE 2-6 April 2011
2.1.2 Pump Stations and Force Mains
There are three pump stations in the CSD (previously four) and one pump station in the ESD, all of which are operated and maintained by the SEJPA under contract with the City. Since the 2003 Master Plan, new gravity pipelines were constructed that allowed the Regal View Pump Station to be abandoned. Table 2-1 provides a summary of the pump stations. It is noted that the pumps at all stations are equipped with variable speed drives, and that the station capacity is the estimated firm pumping capacity with the largest pumping unit out-of-service. Also, the pump information in Table 2-1 for the Olivenhain Pump Station is based on design plans for the new pump station that will replace the existing pump station at the same location.
Table 2-1 Pump Station Summary
Comments(gpm) (mgd) Dia.
1 25 Hp 900 gpm @ 43'
2 40 Hp 1000 gpm @ 43'
Coast Blvd CTS 1959/2001 2 11.65 Hp 300 gpm @ 30' 300 0.4 4" 4,000 gal wet well
Olivenhain(2) OTS 2011 3 40 Hp 900 gpm @ 70' 1,800 2.6 14" 216,000 gal storage basin
Moonlight Bch ETS 1974/2006 3 60 Hp 1000 gpm @ 107' 2,000 2.9 14" 180,000 gal storage basin
(1) Station capacity is the duty capacity with one pump out-of-service. (2) Information is based on design plans for the new pump station that will replace the existing pump station.
Trunk Sewer System
Motor Size
Force Main
Design Point
Cardiff CTS 1963/1991
Qty.
Pump Station Name
Construction /Rehab Date
Station
Capacity (1)Pump/Motor Information
210,000 gal storage basin1,490 2.1 10"
Cardiff Pump Station
The Cardiff Pump Station is located on the south side of Manchester Avenue, directly across the street from the SEWRF. It was originally constructed in 1963 with two pumps, and a third pump was added in 1972. In 1981 a motor control building was constructed over the drywell and the two original pumps were replaced with larger 40 Hp units equipped with variable frequency drives. The wet well was relined in 1991. The Cardiff Pump Station pumps flow from the CTS and Cardiff Relief Sewer in a 10-inch diameter ACP forcemain that is approximately 1,490 feet long. Typically only one pump operates at a time, but a second pump can be called on in response to high wet well levels. A flow meter at the SEWRF records flows from the discharge of the forcemain. The Cardiff Pump Station has an emergency storage tank with a capacity of approximately 210,000 gallons.
Coast Pump Station
The Coast Pump Station was constructed in 1977 to serve a small commercial area consisting primarily of restaurants along Highway 101, just south of the San Elijo lagoon outlet. This area is often referred to as the City’s “restaurant row”. The Coast Pump Station is located west of Highway 101 adjacent to a parking lot. The original pump station was a suction lift station with a wetwell/drywell configuration. The pump station was redesigned in 1982 with submersible pumps. One of these pumps was replaced approximately three years ago and the other one is scheduled for replacement in the near future. The original drywell now houses the pump controls and electrical panels. The 4-inch diameter forcemain is 1,156 feet long.
Cardiff and Encinitas DUDEK SEWER MASTER PLAN UPDATE 2-7 April 2011
Olivenhain Pump Station (OPS)
The OPS is an underground station that pumps flow from the OTS to the SEWRF. The original OPS was constructed in 1972 on a right-of-way parcel owned by the California Department of Transportation (Caltrans), adjacent to the I-5 northbound off-ramp at Manchester Avenue. Major renovations occurred in 1984, when two 75-Hp pumps were installed to replace the original 20 Hp units. Variable frequency drives and an upper floor motor control center were also added. In 1986, the original 10-inch diameter OPS force main in Manchester Avenue was replaced with a 5,100-foot long 14-inch diameter ductile iron pipe main aligned in Manchester Avenue. A flow meter at the SEWRF records flows from the discharge of the forcemain.
Due to the age of the pump station, capacity limitations, maintenance problems, and susceptibility to inflow and infiltration (I&I), the pump station is currently being replaced at the same location. Design plans have been prepared and construction is expected to begin in 2011, with project completion anticipated by the summer of 2013. The new Olivenhain Pump Station will be constructed in an above grade building that is above the 100-year floodplain of the adjacent San Elijo Lagoon. The pump station design includes emergency overflow storage, a pressurized surge tank, and an upstream grinder. The pump station will have three screw centrifugal submersible pumps equipped with variable frequency drives. Two pumps operating together will meet the pump station design flow capacity of 2.6 mgd (1,800 gpm). The 216,000 gallon emergency storage basin has been sized to store 2 hours of the design flow capacity in the event of a pump station failure. However, it is noted in the predesign report that the storage basin will also be used to manage ultimate peak wet weather flows, which were projected to be as high as 3.0 mgd (2.083 gpm) under ultimate conditions. The hydraulic analysis performed in this master plan assumes operation of the proposed pump station per the design plans.
Moonlight Beach Pump Station (MBPS)
The MBPS was constructed in 1974 at Third and “B” Streets in Encinitas to deliver effluent to the Encina WPCF through a force main and gravity pipelines. It is a multi-story underground structure with a dry pit/wet well configuration. The forcemain consists of approximately 13,780 feet of 14-inch diameter PVC pipe that follows the Old Highway 101 corridor and discharges to the Batiquitos Gravity Sewer at the intersection of Highway 101 and La Costa Avenue. A flow meter at the MPBS measures flows entering the force main. Flows are monitored and recorded by the EWA Flow Metering Program.
In the 1990’s the City replaced the MBPS force main and made several pump station upgrades. A major renovation project was completed in 2006 that included: construction of an emergency underground storage basin; relocation of all electrical equipment above ground in a new masonry building; installation of an activated carbon/biofilter odor control system; replacing/upgrading pumps with three 60 HP vertical centrifugal pumps; installation of in-line grinders; replacing/upgrading auxiliary generators; and modifications to the adjacent Moonlight Beach Urban Runoff Treatment Facility. The pump station design capacity for the renovation is listed as 2,000 gpm in the 2004 Preliminary Design Report. The capacity of the emergency storage basin is 180,000 gallons and was sized to provide storage for two hours based on peak ultimate flow conditions.
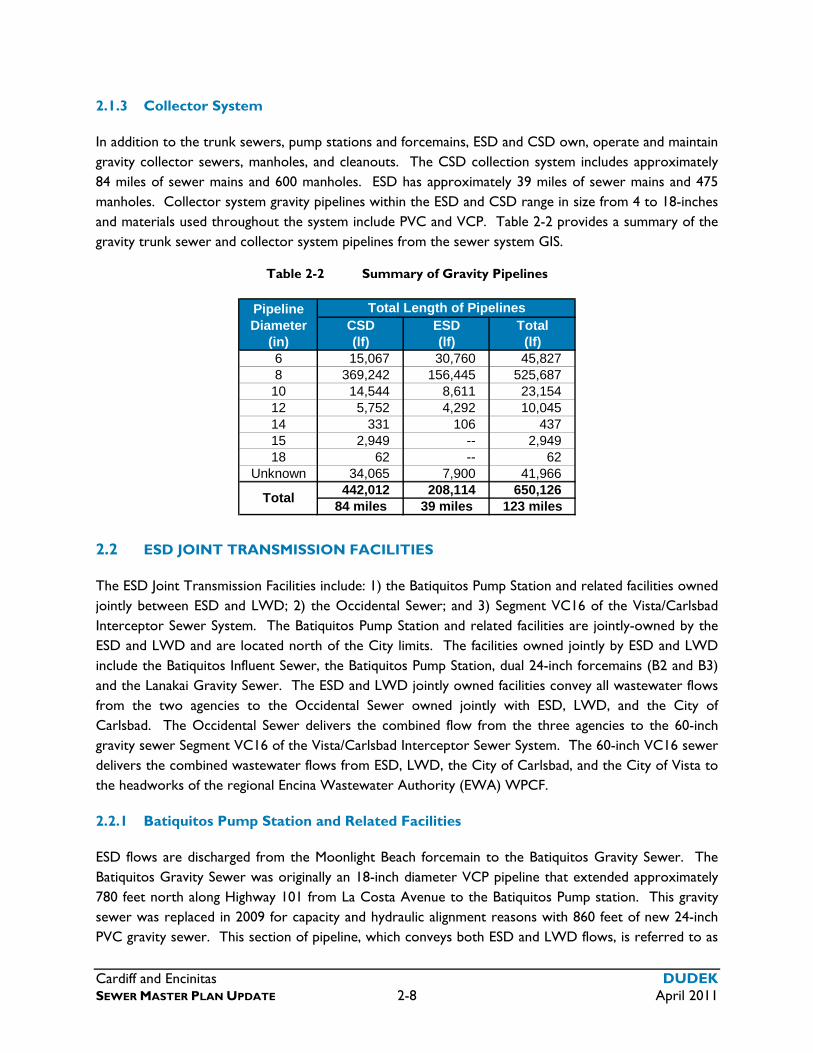
Cardiff and Encinitas DUDEK SEWER MASTER PLAN UPDATE 2-8 April 2011
2.1.3 Collector System
In addition to the trunk sewers, pump stations and forcemains, ESD and CSD own, operate and maintain gravity collector sewers, manholes, and cleanouts. The CSD collection system includes approximately 84 miles of sewer mains and 600 manholes. ESD has approximately 39 miles of sewer mains and 475 manholes. Collector system gravity pipelines within the ESD and CSD range in size from 4 to 18-inches and materials used throughout the system include PVC and VCP. Table 2-2 provides a summary of the gravity trunk sewer and collector system pipelines from the sewer system GIS.
Table 2-2 Summary of Gravity Pipelines
PipelineDiameter CSD ESD Total
(in) (lf) (lf) (lf)6 15,067 30,760 45,8278 369,242 156,445 525,68710 14,544 8,611 23,15412 5,752 4,292 10,04514 331 106 43715 2,949 -- 2,94918 62 -- 62
Unknown 34,065 7,900 41,966442,012 208,114 650,126
84 miles 39 miles 123 milesTotal
Total Length of Pipelines
2.2 ESD JOINT TRANSMISSION FACILITIES
The ESD Joint Transmission Facilities include: 1) the Batiquitos Pump Station and related facilities owned jointly between ESD and LWD; 2) the Occidental Sewer; and 3) Segment VC16 of the Vista/Carlsbad Interceptor Sewer System. The Batiquitos Pump Station and related facilities are jointly-owned by the ESD and LWD and are located north of the City limits. The facilities owned jointly by ESD and LWD include the Batiquitos Influent Sewer, the Batiquitos Pump Station, dual 24-inch forcemains (B2 and B3) and the Lanakai Gravity Sewer. The ESD and LWD jointly owned facilities convey all wastewater flows from the two agencies to the Occidental Sewer owned jointly with ESD, LWD, and the City of Carlsbad. The Occidental Sewer delivers the combined flow from the three agencies to the 60-inch gravity sewer Segment VC16 of the Vista/Carlsbad Interceptor Sewer System. The 60-inch VC16 sewer delivers the combined wastewater flows from ESD, LWD, the City of Carlsbad, and the City of Vista to the headworks of the regional Encina Wastewater Authority (EWA) WPCF.
2.2.1 Batiquitos Pump Station and Related Facilities
ESD flows are discharged from the Moonlight Beach forcemain to the Batiquitos Gravity Sewer. The Batiquitos Gravity Sewer was originally an 18-inch diameter VCP pipeline that extended approximately 780 feet north along Highway 101 from La Costa Avenue to the Batiquitos Pump station. This gravity sewer was replaced in 2009 for capacity and hydraulic alignment reasons with 860 feet of new 24-inch PVC gravity sewer. This section of pipeline, which conveys both ESD and LWD flows, is referred to as
Cardiff and Encinitas DUDEK SEWER MASTER PLAN UPDATE 2-9 April 2011
the Batiquitos Influent Sewer. The ESD Moonlight Beach forcemain and two Leucadia PS forcemains (L1 and L2) all enter the Batiquitos Gravity Sewer at the intersection of Highway 101 and La Costa Avenue.
The Batiquitos Pump Station (BPS) is located along the east side of Highway 101 and is a conventional wet pit/dry pit station with a 190,000 gallon emergency overflow wetwell. An additional 90,000 gallons of emergency storage is available in the BPS wet well. BPS was constructed in 1974 with 3 pumps and a 10,240-foot 14-inch diameter forcemain (B1). In 1980 the original force main was replaced with 10,263 feet of 24-inch diameter Ductile Iron Pipe (DIP) pipeline (B2), and a 10,167 feet long parallel 24-inch diameter DIP forcemain (B3) was added in 1988. A substantial electrical system upgrade was performed in 1998, and improvements made in 2006 included the addition of a fourth pump, valve replacements, and new odor control facilities.
The Batiquitos forcemain system discharges to the Lanikai Gravity Sewer, which consists of approximately 380 feet of 18-inch and 320 feet of 21-inch gravity sewer along the old “La Costa Boulevard” alignment. The Lanakai Gravity Sewer crosses from the west to the east side of the AT&SF Railroad Tracks (AT&SF or also known as North County Transit District (NCTD)) and joins with flow from a portion of the City of Carlsbad at the beginning of a three-agency sewer known as the Occidental Sewer.
In 1994 an agreement between ESD and LWD was established regarding ownership, operation and maintenance of the Batiquitos Pump Station and related facilities, replacing the original 1972 agreement. Revision of the 1994 agreement is currently being considered. Per the proposed revised agreement, LWD operates the Batiquitos Pump Station and ownership of the system is split 77.86% for LWD and 22.14% for ESD. Flow capacity rights based on the average dry weather flow (ADWF) are 7.11 mgd for LWD and 1.80 mgd for ESD. Operation, maintenance and repair expenses are shared in proportion to each agency’s respective flow through the station over the billing period covered, and not based on capacity rights. Flows are metered through the Encina Flow Metering Program.
The Lanakai Sewer was previously known as the La Costa Boulevard Sewer. The ownership of the La Costa Boulevard Sewer is governed by a 1972 agreement between the ESD, LWD and the Encina JPA. In this agreement, the La Costa Boulevard Sewer is described as the “Railroad Crossing” and ownership is: 57% LWD and 43% ESD.
2.3 INTERAGENCY AGREEMENTS
Wastewater collection systems operate primarily on a gravity flow basis. However, political boundaries are not always established to match natural drainage contours. As a result, some portions of a given service area may drain in an undesirable direction, away from the remainder of the gravity collection system. Inter-agency agreements can be developed to allow the wastewater flows to be conveyed into the collection system of an adjacent district or agency. San Diego Local Agency Formation Commission (LAFCO) is responsible for coordinating, directing, and overseeing governmental boundaries, including annexation and detachment of territory for special districts.
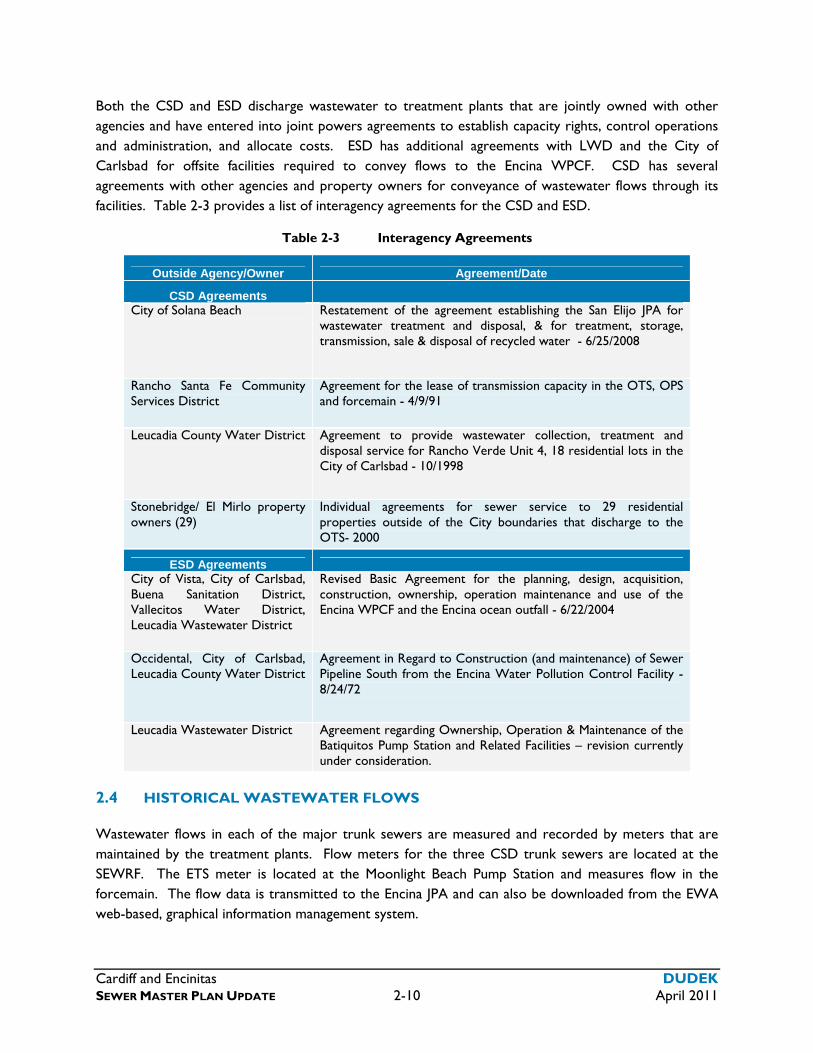
Cardiff and Encinitas DUDEK SEWER MASTER PLAN UPDATE 2-10 April 2011
Both the CSD and ESD discharge wastewater to treatment plants that are jointly owned with other agencies and have entered into joint powers agreements to establish capacity rights, control operations and administration, and allocate costs. ESD has additional agreements with LWD and the City of Carlsbad for offsite facilities required to convey flows to the Encina WPCF. CSD has several agreements with other agencies and property owners for conveyance of wastewater flows through its facilities. Table 2-3 provides a list of interagency agreements for the CSD and ESD.
Table 2-3 Interagency Agreements
Outside Agency/Owner Agreement/Date
CSD Agreements City of Solana Beach Restatement of the agreement establishing the San Elijo JPA for
wastewater treatment and disposal, & for treatment, storage, transmission, sale & disposal of recycled water - 6/25/2008
Rancho Santa Fe Community Services District
Agreement for the lease of transmission capacity in the OTS, OPS and forcemain - 4/9/91
Leucadia County Water District Agreement to provide wastewater collection, treatment and disposal service for Rancho Verde Unit 4, 18 residential lots in the City of Carlsbad - 10/1998
Stonebridge/ El Mirlo property owners (29)
Individual agreements for sewer service to 29 residential properties outside of the City boundaries that discharge to the OTS- 2000
ESD Agreements City of Vista, City of Carlsbad, Buena Sanitation District, Vallecitos Water District, Leucadia Wastewater District
Revised Basic Agreement for the planning, design, acquisition, construction, ownership, operation maintenance and use of the Encina WPCF and the Encina ocean outfall - 6/22/2004
Occidental, City of Carlsbad, Leucadia County Water District
Agreement in Regard to Construction (and maintenance) of Sewer Pipeline South from the Encina Water Pollution Control Facility - 8/24/72
Leucadia Wastewater District Agreement regarding Ownership, Operation & Maintenance of the Batiquitos Pump Station and Related Facilities – revision currently under consideration.
2.4 HISTORICAL WASTEWATER FLOWS
Wastewater flows in each of the major trunk sewers are measured and recorded by meters that are maintained by the treatment plants. Flow meters for the three CSD trunk sewers are located at the SEWRF. The ETS meter is located at the Moonlight Beach Pump Station and measures flow in the forcemain. The flow data is transmitted to the Encina JPA and can also be downloaded from the EWA web-based, graphical information management system.
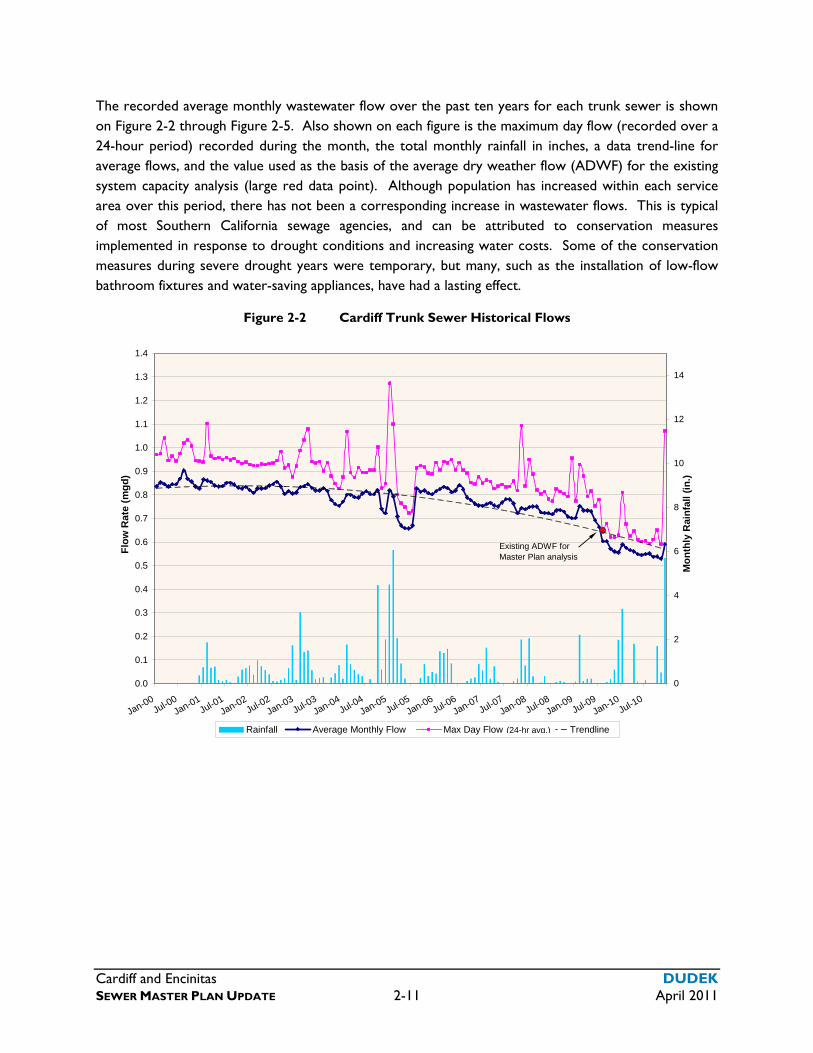
Cardiff and Encinitas DUDEK SEWER MASTER PLAN UPDATE 2-11 April 2011
The recorded average monthly wastewater flow over the past ten years for each trunk sewer is shown on Figure 2-2 through Figure 2-5. Also shown on each figure is the maximum day flow (recorded over a 24-hour period) recorded during the month, the total monthly rainfall in inches, a data trend-line for average flows, and the value used as the basis of the average dry weather flow (ADWF) for the existing system capacity analysis (large red data point). Although population has increased within each service area over this period, there has not been a corresponding increase in wastewater flows. This is typical of most Southern California sewage agencies, and can be attributed to conservation measures implemented in response to drought conditions and increasing water costs. Some of the conservation measures during severe drought years were temporary, but many, such as the installation of low-flow bathroom fixtures and water-saving appliances, have had a lasting effect.
Figure 2-2 Cardiff Trunk Sewer Historical Flows
0.0
0.1
0.2
0.3
0.4
0.5
0.6
0.7
0.8
0.9
1.0
1.1
1.2
1.3
1.4
Jan-00Jul-0
0Jan-01
Jul-01Jan-02
Jul-02Jan-03
Jul-03Jan-04
Jul-04Jan-05
Jul-05Jan-06
Jul-06Jan-07
Jul-07Jan-08
Jul-08Jan-09
Jul-09Jan-10
Jul-10
Flo
w R
ate
(m
gd
)
0
2
4
6
8
10
12
14
Mo
nth
ly R
ain
fall
(in
.)
Rainfall Average Monthly Flow Max Day Flow Trendline
Existing ADWF for Master Plan analysis
(24-hr avg.)
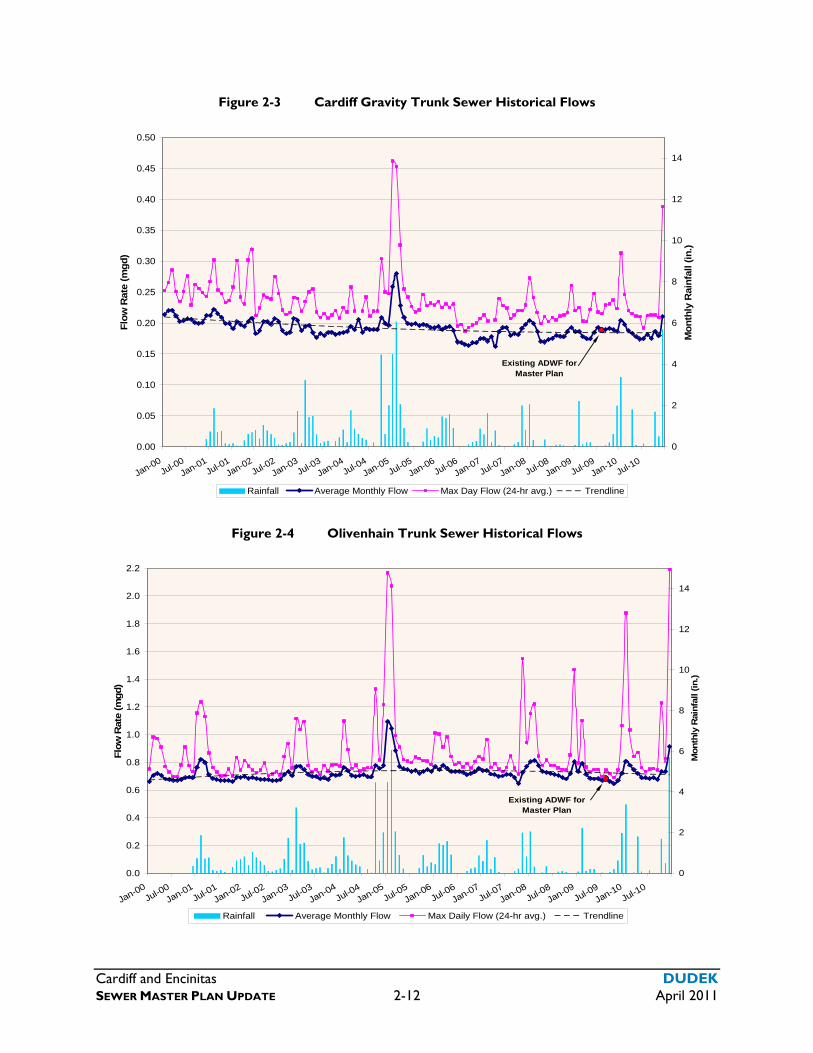
Cardiff and Encinitas DUDEK SEWER MASTER PLAN UPDATE 2-12 April 2011
Figure 2-3 Cardiff Gravity Trunk Sewer Historical Flows
0.00
0.05
0.10
0.15
0.20
0.25
0.30
0.35
0.40
0.45
0.50
Jan-00Jul-0
0Jan-01
Jul-01Jan-02
Jul-02Jan-03
Jul-03Jan-04
Jul-04Jan-05
Jul-05Jan-06
Jul-06Jan-07
Jul-07Jan-08
Jul-08Jan-09
Jul-09Jan-10
Jul-10
Flo
w R
ate
(m
gd
)
0
2
4
6
8
10
12
14
Mo
nth
ly R
ain
fall (
in.)
Rainfall Average Monthly Flow Max Day Flow (24-hr avg.) Trendline
Existing ADWF for Master Plan
Figure 2-4 Olivenhain Trunk Sewer Historical Flows
0.0
0.2
0.4
0.6
0.8
1.0
1.2
1.4
1.6
1.8
2.0
2.2
Jan-00Jul-0
0Jan-01
Jul-01Jan-02
Jul-02Jan-03
Jul-03Jan-04
Jul-04Jan-05
Jul-05Jan-06
Jul-06Jan-07
Jul-07Jan-08
Jul-08Jan-09
Jul-09Jan-10
Jul-10
Flo
w R
ate
(mgd)
0
2
4
6
8
10
12
14
Month
ly R
ainfa
ll (
in.)
Rainfall Average Monthly Flow Max Daily Flow (24-hr avg.) Trendline
Existing ADWF for Master Plan
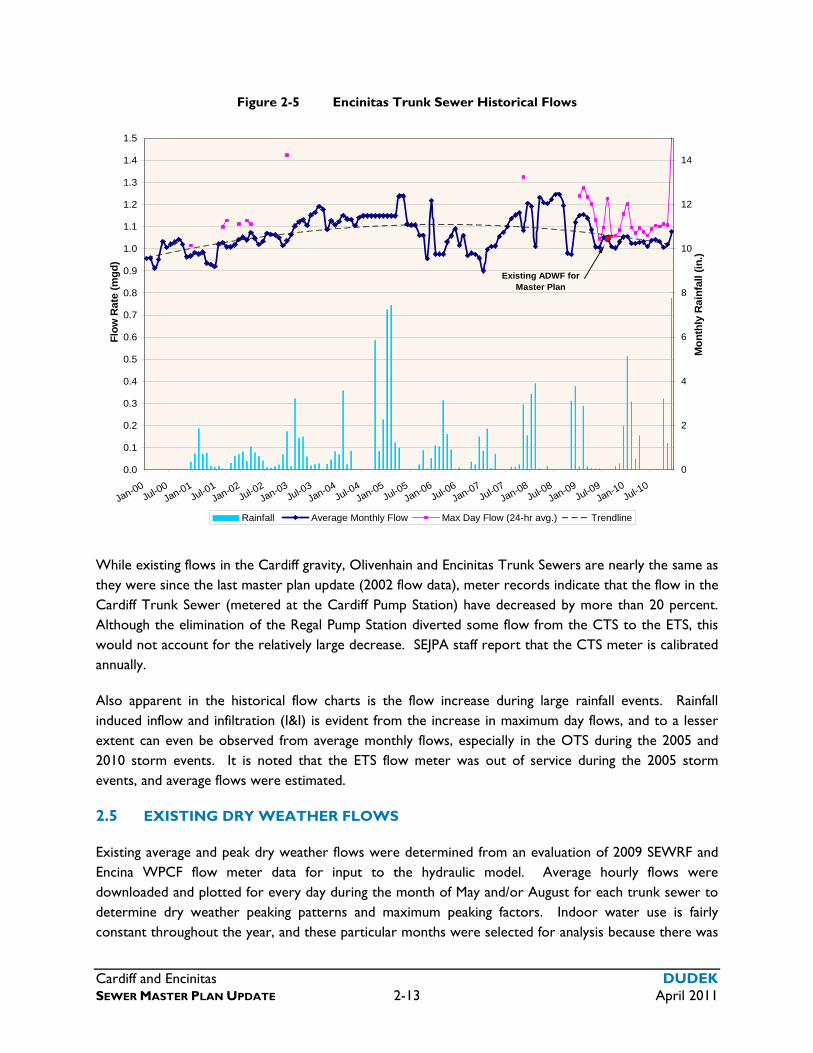
Cardiff and Encinitas DUDEK SEWER MASTER PLAN UPDATE 2-13 April 2011
Figure 2-5 Encinitas Trunk Sewer Historical Flows
0.0
0.1
0.2
0.3
0.4
0.5
0.6
0.7
0.8
0.9
1.0
1.1
1.2
1.3
1.4
1.5
Jan-00Jul-0
0Jan-01
Jul-01Jan-02
Jul-02Jan-03
Jul-03Jan-04
Jul-04Jan-05
Jul-05Jan-06
Jul-06Jan-07
Jul-07Jan-08
Jul-08Jan-09
Jul-09Jan-10
Jul-10
Flo
w R
ate
(m
gd
)
0
2
4
6
8
10
12
14
Mo
nth
ly R
ain
fall (
in.)
Rainfall Average Monthly Flow Max Day Flow (24-hr avg.) Trendline
Existing ADWF for Master Plan
While existing flows in the Cardiff gravity, Olivenhain and Encinitas Trunk Sewers are nearly the same as they were since the last master plan update (2002 flow data), meter records indicate that the flow in the Cardiff Trunk Sewer (metered at the Cardiff Pump Station) have decreased by more than 20 percent. Although the elimination of the Regal Pump Station diverted some flow from the CTS to the ETS, this would not account for the relatively large decrease. SEJPA staff report that the CTS meter is calibrated annually.
Also apparent in the historical flow charts is the flow increase during large rainfall events. Rainfall induced inflow and infiltration (I&I) is evident from the increase in maximum day flows, and to a lesser extent can even be observed from average monthly flows, especially in the OTS during the 2005 and 2010 storm events. It is noted that the ETS flow meter was out of service during the 2005 storm events, and average flows were estimated.
2.5 EXISTING DRY WEATHER FLOWS
Existing average and peak dry weather flows were determined from an evaluation of 2009 SEWRF and Encina WPCF flow meter data for input to the hydraulic model. Average hourly flows were downloaded and plotted for every day during the month of May and/or August for each trunk sewer to determine dry weather peaking patterns and maximum peaking factors. Indoor water use is fairly constant throughout the year, and these particular months were selected for analysis because there was
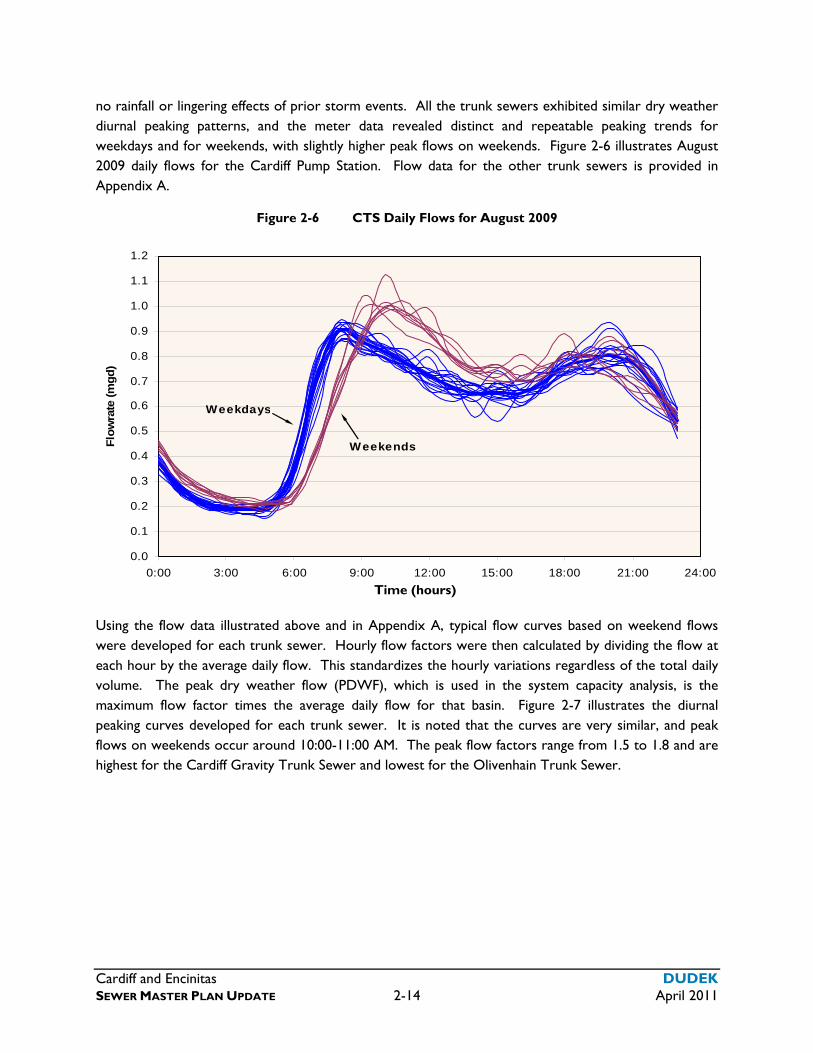
Cardiff and Encinitas DUDEK SEWER MASTER PLAN UPDATE 2-14 April 2011
no rainfall or lingering effects of prior storm events. All the trunk sewers exhibited similar dry weather diurnal peaking patterns, and the meter data revealed distinct and repeatable peaking trends for weekdays and for weekends, with slightly higher peak flows on weekends. Figure 2-6 illustrates August 2009 daily flows for the Cardiff Pump Station. Flow data for the other trunk sewers is provided in Appendix A.
Figure 2-6 CTS Daily Flows for August 2009
0.0
0.1
0.2
0.3
0.4
0.5
0.6
0.7
0.8
0.9
1.0
1.1
1.2
0:00 3:00 6:00 9:00 12:00 15:00 18:00 21:00 24:00
Flo
wra
te (
mg
d)
Weekdays
Weekends
Using the flow data illustrated above and in Appendix A, typical flow curves based on weekend flows were developed for each trunk sewer. Hourly flow factors were then calculated by dividing the flow at each hour by the average daily flow. This standardizes the hourly variations regardless of the total daily volume. The peak dry weather flow (PDWF), which is used in the system capacity analysis, is the maximum flow factor times the average daily flow for that basin. Figure 2-7 illustrates the diurnal peaking curves developed for each trunk sewer. It is noted that the curves are very similar, and peak flows on weekends occur around 10:00-11:00 AM. The peak flow factors range from 1.5 to 1.8 and are highest for the Cardiff Gravity Trunk Sewer and lowest for the Olivenhain Trunk Sewer.
Time (hours)
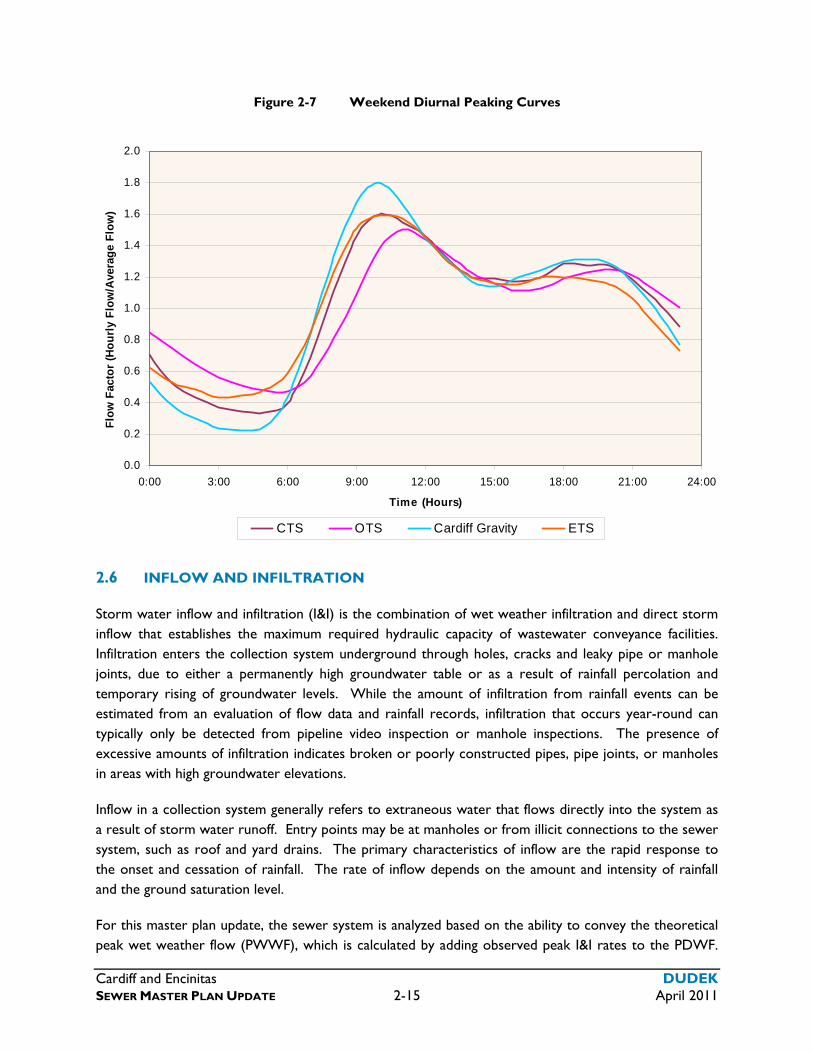
Cardiff and Encinitas DUDEK SEWER MASTER PLAN UPDATE 2-15 April 2011
Figure 2-7 Weekend Diurnal Peaking Curves
0.0
0.2
0.4
0.6
0.8
1.0
1.2
1.4
1.6
1.8
2.0
0:00 3:00 6:00 9:00 12:00 15:00 18:00 21:00 24:00
Time (Hours)
Flo
w F
acto
r (H
ou
rly
Flo
w/A
vera
ge
Flo
w)
CTS OTS Cardiff Gravity ETS
2.6 INFLOW AND INFILTRATION
Storm water inflow and infiltration (I&I) is the combination of wet weather infiltration and direct storm inflow that establishes the maximum required hydraulic capacity of wastewater conveyance facilities. Infiltration enters the collection system underground through holes, cracks and leaky pipe or manhole joints, due to either a permanently high groundwater table or as a result of rainfall percolation and temporary rising of groundwater levels. While the amount of infiltration from rainfall events can be estimated from an evaluation of flow data and rainfall records, infiltration that occurs year-round can typically only be detected from pipeline video inspection or manhole inspections. The presence of excessive amounts of infiltration indicates broken or poorly constructed pipes, pipe joints, or manholes in areas with high groundwater elevations.
Inflow in a collection system generally refers to extraneous water that flows directly into the system as a result of storm water runoff. Entry points may be at manholes or from illicit connections to the sewer system, such as roof and yard drains. The primary characteristics of inflow are the rapid response to the onset and cessation of rainfall. The rate of inflow depends on the amount and intensity of rainfall and the ground saturation level.
For this master plan update, the sewer system is analyzed based on the ability to convey the theoretical peak wet weather flow (PWWF), which is calculated by adding observed peak I&I rates to the PDWF.
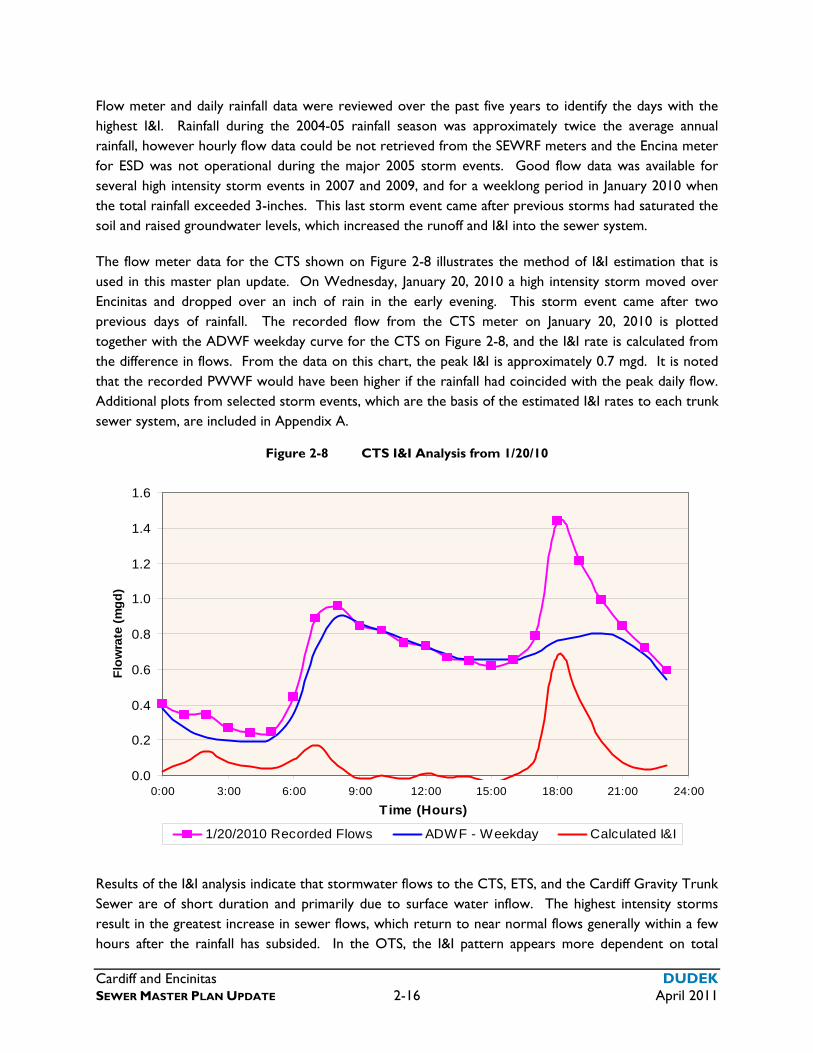
Cardiff and Encinitas DUDEK SEWER MASTER PLAN UPDATE 2-16 April 2011
Flow meter and daily rainfall data were reviewed over the past five years to identify the days with the highest I&I. Rainfall during the 2004-05 rainfall season was approximately twice the average annual rainfall, however hourly flow data could be not retrieved from the SEWRF meters and the Encina meter for ESD was not operational during the major 2005 storm events. Good flow data was available for several high intensity storm events in 2007 and 2009, and for a weeklong period in January 2010 when the total rainfall exceeded 3-inches. This last storm event came after previous storms had saturated the soil and raised groundwater levels, which increased the runoff and I&I into the sewer system.
The flow meter data for the CTS shown on Figure 2-8 illustrates the method of I&I estimation that is used in this master plan update. On Wednesday, January 20, 2010 a high intensity storm moved over Encinitas and dropped over an inch of rain in the early evening. This storm event came after two previous days of rainfall. The recorded flow from the CTS meter on January 20, 2010 is plotted together with the ADWF weekday curve for the CTS on Figure 2-8, and the I&I rate is calculated from the difference in flows. From the data on this chart, the peak I&I is approximately 0.7 mgd. It is noted that the recorded PWWF would have been higher if the rainfall had coincided with the peak daily flow. Additional plots from selected storm events, which are the basis of the estimated I&I rates to each trunk sewer system, are included in Appendix A.
Figure 2-8 CTS I&I Analysis from 1/20/10
0.0
0.2
0.4
0.6
0.8
1.0
1.2
1.4
1.6
0:00 3:00 6:00 9:00 12:00 15:00 18:00 21:00 24:00
Time (Hours)
Flo
wra
te (
mg
d)
1/20/2010 Recorded Flows ADWF - Weekday Calculated I&I
Results of the I&I analysis indicate that stormwater flows to the CTS, ETS, and the Cardiff Gravity Trunk Sewer are of short duration and primarily due to surface water inflow. The highest intensity storms result in the greatest increase in sewer flows, which return to near normal flows generally within a few hours after the rainfall has subsided. In the OTS, the I&I pattern appears more dependent on total
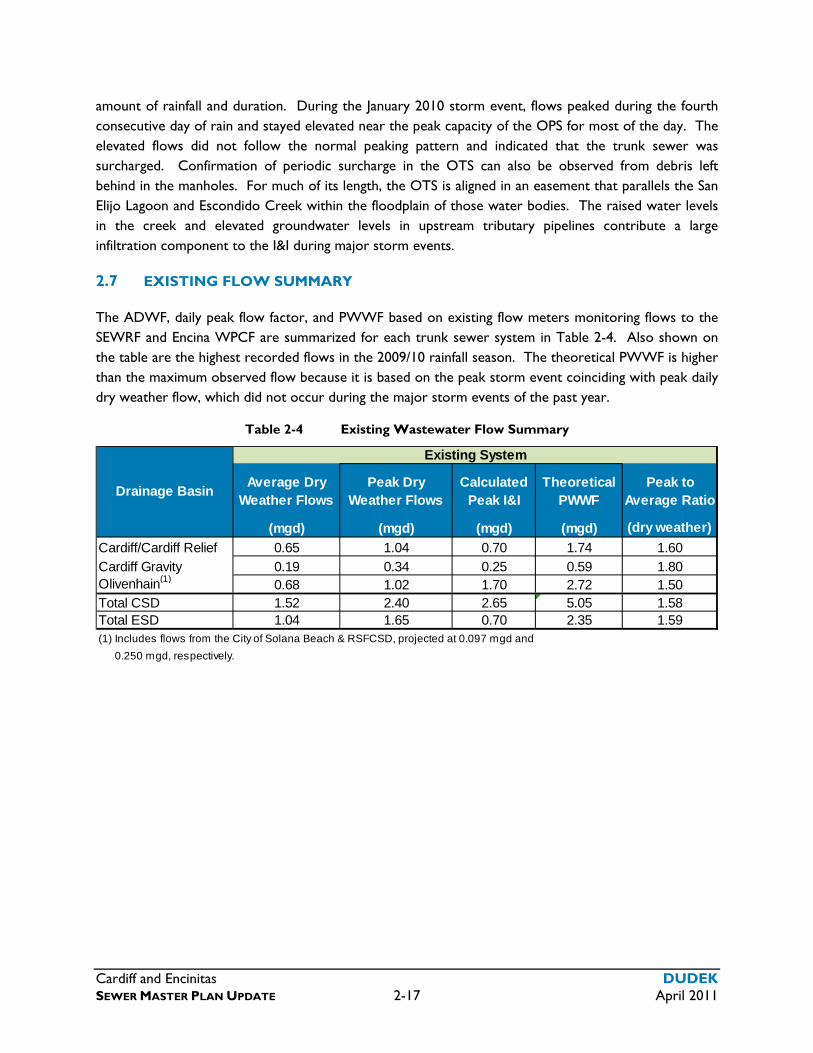
Cardiff and Encinitas DUDEK SEWER MASTER PLAN UPDATE 2-17 April 2011
amount of rainfall and duration. During the January 2010 storm event, flows peaked during the fourth consecutive day of rain and stayed elevated near the peak capacity of the OPS for most of the day. The elevated flows did not follow the normal peaking pattern and indicated that the trunk sewer was surcharged. Confirmation of periodic surcharge in the OTS can also be observed from debris left behind in the manholes. For much of its length, the OTS is aligned in an easement that parallels the San Elijo Lagoon and Escondido Creek within the floodplain of those water bodies. The raised water levels in the creek and elevated groundwater levels in upstream tributary pipelines contribute a large infiltration component to the I&I during major storm events.
2.7 EXISTING FLOW SUMMARY
The ADWF, daily peak flow factor, and PWWF based on existing flow meters monitoring flows to the SEWRF and Encina WPCF are summarized for each trunk sewer system in Table 2-4. Also shown on the table are the highest recorded flows in the 2009/10 rainfall season. The theoretical PWWF is higher than the maximum observed flow because it is based on the peak storm event coinciding with peak daily dry weather flow, which did not occur during the major storm events of the past year.
Table 2-4 Existing Wastewater Flow Summary
Drainage BasinAverage Dry
Weather FlowsPeak Dry
Weather FlowsCalculated
Peak I&I Theoretical
PWWF Peak to
Average Ratio
(mgd) (mgd) (mgd) (mgd) (dry weather)
Cardiff/Cardiff Relief 0.65 1.04 0.70 1.74 1.60
Cardiff Gravity 0.19 0.34 0.25 0.59 1.80Olivenhain(1)
0.68 1.02 1.70 2.72 1.50Total CSD 1.52 2.40 2.65 5.05 1.58Total ESD 1.04 1.65 0.70 2.35 1.59(1) Includes flows from the City of Solana Beach & RSFCSD, projected at 0.097 mgd and
0.250 mgd, respectively.
Existing System

Cardiff and Encinitas DUDEK SEWER MASTER PLAN UPDATE 2-18 April 2011
INTENTIONALLY LEFT BLANK
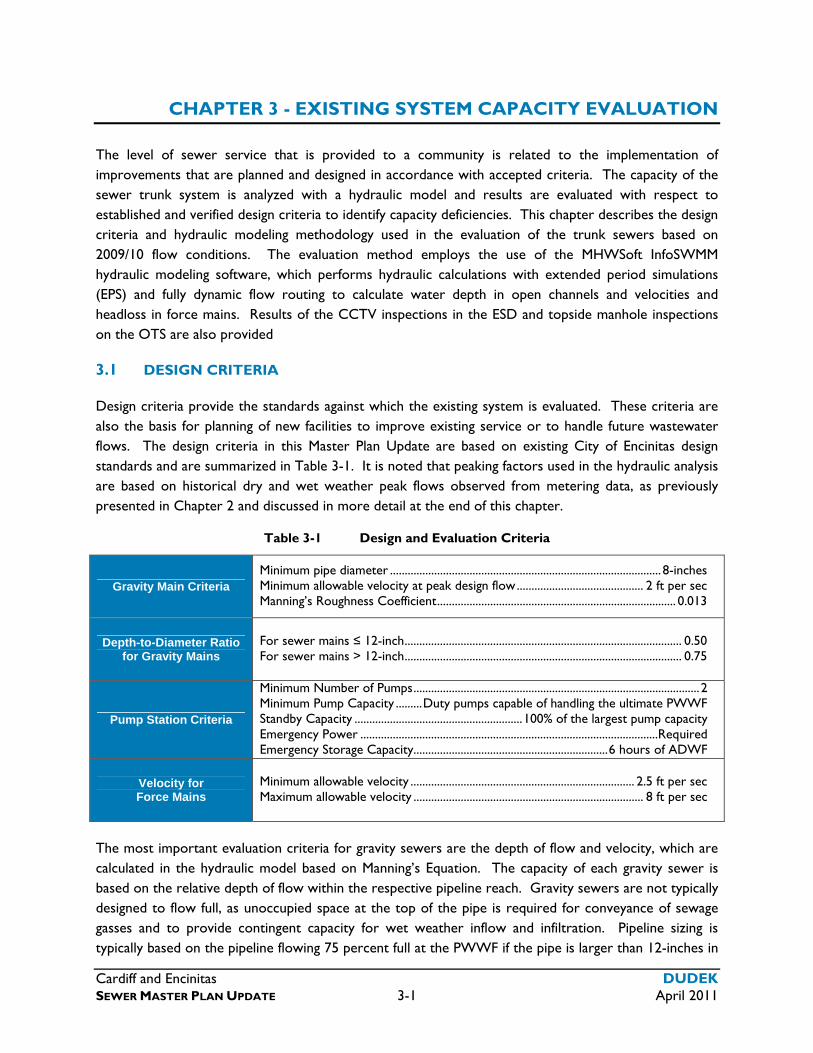
Cardiff and Encinitas DUDEK SEWER MASTER PLAN UPDATE 3-1 April 2011
CHAPTER 3 - EXISTING SYSTEM CAPACITY EVALUATION
The level of sewer service that is provided to a community is related to the implementation of improvements that are planned and designed in accordance with accepted criteria. The capacity of the sewer trunk system is analyzed with a hydraulic model and results are evaluated with respect to established and verified design criteria to identify capacity deficiencies. This chapter describes the design criteria and hydraulic modeling methodology used in the evaluation of the trunk sewers based on 2009/10 flow conditions. The evaluation method employs the use of the MHWSoft InfoSWMM hydraulic modeling software, which performs hydraulic calculations with extended period simulations (EPS) and fully dynamic flow routing to calculate water depth in open channels and velocities and headloss in force mains. Results of the CCTV inspections in the ESD and topside manhole inspections on the OTS are also provided
3.1 DESIGN CRITERIA
Design criteria provide the standards against which the existing system is evaluated. These criteria are also the basis for planning of new facilities to improve existing service or to handle future wastewater flows. The design criteria in this Master Plan Update are based on existing City of Encinitas design standards and are summarized in Table 3-1. It is noted that peaking factors used in the hydraulic analysis are based on historical dry and wet weather peak flows observed from metering data, as previously presented in Chapter 2 and discussed in more detail at the end of this chapter.
Table 3-1 Design and Evaluation Criteria
Gravity Main Criteria Minimum pipe diameter ............................................................................................ 8-inches Minimum allowable velocity at peak design flow ........................................... 2 ft per sec Manning’s Roughness Coefficient ................................................................................. 0.013
Depth-to-Diameter Ratio for Gravity Mains
For sewer mains ≤ 12-inch .............................................................................................. 0.50 For sewer mains > 12-inch .............................................................................................. 0.75
Pump Station Criteria
Minimum Number of Pumps ................................................................................................. 2 Minimum Pump Capacity ......... Duty pumps capable of handling the ultimate PWWF Standby Capacity ......................................................... 100% of the largest pump capacity Emergency Power .....................................................................................................Required Emergency Storage Capacity .................................................................. 6 hours of ADWF
Velocity for Force Mains
Minimum allowable velocity ............................................................................ 2.5 ft per sec Maximum allowable velocity .............................................................................. 8 ft per sec
The most important evaluation criteria for gravity sewers are the depth of flow and velocity, which are calculated in the hydraulic model based on Manning’s Equation. The capacity of each gravity sewer is based on the relative depth of flow within the respective pipeline reach. Gravity sewers are not typically designed to flow full, as unoccupied space at the top of the pipe is required for conveyance of sewage gasses and to provide contingent capacity for wet weather inflow and infiltration. Pipeline sizing is typically based on the pipeline flowing 75 percent full at the PWWF if the pipe is larger than 12-inches in
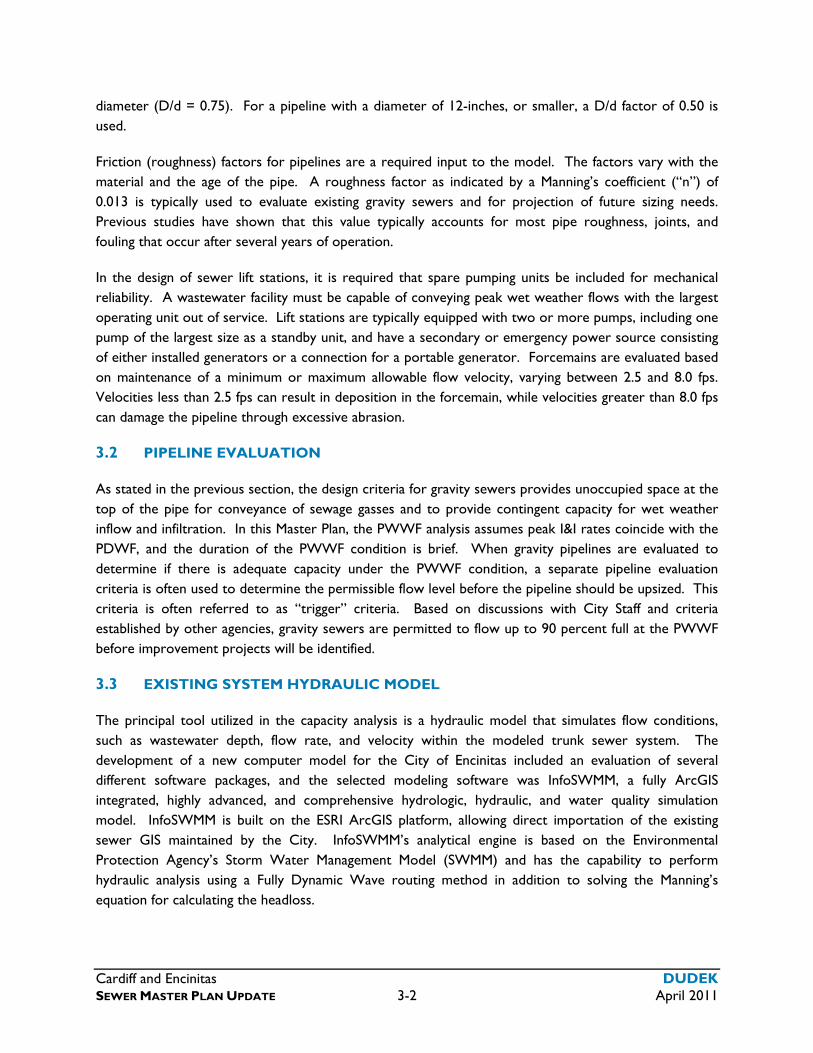
Cardiff and Encinitas DUDEK SEWER MASTER PLAN UPDATE 3-2 April 2011
diameter (D/d = 0.75). For a pipeline with a diameter of 12-inches, or smaller, a D/d factor of 0.50 is used.
Friction (roughness) factors for pipelines are a required input to the model. The factors vary with the material and the age of the pipe. A roughness factor as indicated by a Manning’s coefficient (“n”) of 0.013 is typically used to evaluate existing gravity sewers and for projection of future sizing needs. Previous studies have shown that this value typically accounts for most pipe roughness, joints, and fouling that occur after several years of operation.
In the design of sewer lift stations, it is required that spare pumping units be included for mechanical reliability. A wastewater facility must be capable of conveying peak wet weather flows with the largest operating unit out of service. Lift stations are typically equipped with two or more pumps, including one pump of the largest size as a standby unit, and have a secondary or emergency power source consisting of either installed generators or a connection for a portable generator. Forcemains are evaluated based on maintenance of a minimum or maximum allowable flow velocity, varying between 2.5 and 8.0 fps. Velocities less than 2.5 fps can result in deposition in the forcemain, while velocities greater than 8.0 fps can damage the pipeline through excessive abrasion.
3.2 PIPELINE EVALUATION
As stated in the previous section, the design criteria for gravity sewers provides unoccupied space at the top of the pipe for conveyance of sewage gasses and to provide contingent capacity for wet weather inflow and infiltration. In this Master Plan, the PWWF analysis assumes peak I&I rates coincide with the PDWF, and the duration of the PWWF condition is brief. When gravity pipelines are evaluated to determine if there is adequate capacity under the PWWF condition, a separate pipeline evaluation criteria is often used to determine the permissible flow level before the pipeline should be upsized. This criteria is often referred to as “trigger” criteria. Based on discussions with City Staff and criteria established by other agencies, gravity sewers are permitted to flow up to 90 percent full at the PWWF before improvement projects will be identified.
3.3 EXISTING SYSTEM HYDRAULIC MODEL
The principal tool utilized in the capacity analysis is a hydraulic model that simulates flow conditions, such as wastewater depth, flow rate, and velocity within the modeled trunk sewer system. The development of a new computer model for the City of Encinitas included an evaluation of several different software packages, and the selected modeling software was InfoSWMM, a fully ArcGIS integrated, highly advanced, and comprehensive hydrologic, hydraulic, and water quality simulation model. InfoSWMM is built on the ESRI ArcGIS platform, allowing direct importation of the existing sewer GIS maintained by the City. InfoSWMM’s analytical engine is based on the Environmental Protection Agency’s Storm Water Management Model (SWMM) and has the capability to perform hydraulic analysis using a Fully Dynamic Wave routing method in addition to solving the Manning’s equation for calculating the headloss.

Cardiff and Encinitas DUDEK SEWER MASTER PLAN UPDATE 3-3 April 2011
3.3.1 Physical Data Input
A new model of the CSD and ESD trunk sewer systems was developed from the City’s existing sewer system GIS data. A cursory review and quality control checks of the GIS were first made to identify missing data, erroneous input values, and values which appeared to be estimated. The review process required multiple data exchange iterations with City staff to fill in missing data for the trunk sewers. Missing inverts and pipeline diameters were input from plans provided by City staff, calculated from upstream/downstream inputs, or obtained from City GIS staff after research of as-built drawings. The existing system model includes gravity trunk sewers, manholes, and siphons (OTS only) that were operational during the flow metering period and is described in more detail in the following sections.
In the InfoSWMM model, the gravity mains and siphons are represented as links, whereas the wet wells, and manholes are represented as nodes. This type of model is referred to as a link-node model. Link alignments, node locations and basin modeling data associated with links and nodes (example - invert elevations, manhole depths, pipeline diameters, pipeline lengths, etc.) were imported directly from the City’s wastewater GIS. Manhole surface elevations were input from topographic data provided by City staff
3.3.2 Dry Weather Flow Loading
Average dry weather wastewater flows are distributed in the existing system based on the City’s sewer billing database and individual parcel locations for flows generated within CSD and ESD, and flow estimates made based on unit counts for areas outside the CSD that discharge to the OTS and OPS. Figure 3-1 illustrates the service area of each trunk sewer, which follows parcel lines and was developed based on the City’s collector system GIS and topographic data. Flow adjustment factors were applied to the sewer billing database so that the total flow input to each trunk sewer matched the metered ADWF, as provided previously in Table 2-3.
CSD and ESD Sewer Billing Database
The City bills for sewer service within the CSD and ESD based on winter water use and an assumed return rate to the sewer system. City staff provided the sewer billing database with 2009 billing data, including information on accounts that are billed manually and accounts with sub-meters. The accounts were digitally linked to the City of Encinitas parcel map using the County of San Diego Assessor Parcel Number (APN). To distribute flows to the trunk sewer models, billing data was converted to an average flow rate per parcel. Flows from each parcel were then joined digitally to the nearest collector sewer manhole, and flows along the collector pipelines were added and input to the model at the point of discharge to the trunk sewer. The connected parcels and their respective trunk sewer basin are illustrated on Figure 3-1. It is noted that the CSD sewer billing database includes customers in the Rancho Verde Unit 4 area of Carlsbad and the Stonebridge development in unincorporated San Diego County, which discharge to the OTS.

Cardiff and Encinitas DUDEK SEWER MASTER PLAN UPDATE 3-4 April 2011
INTENTIONALLY LEFT BLANK
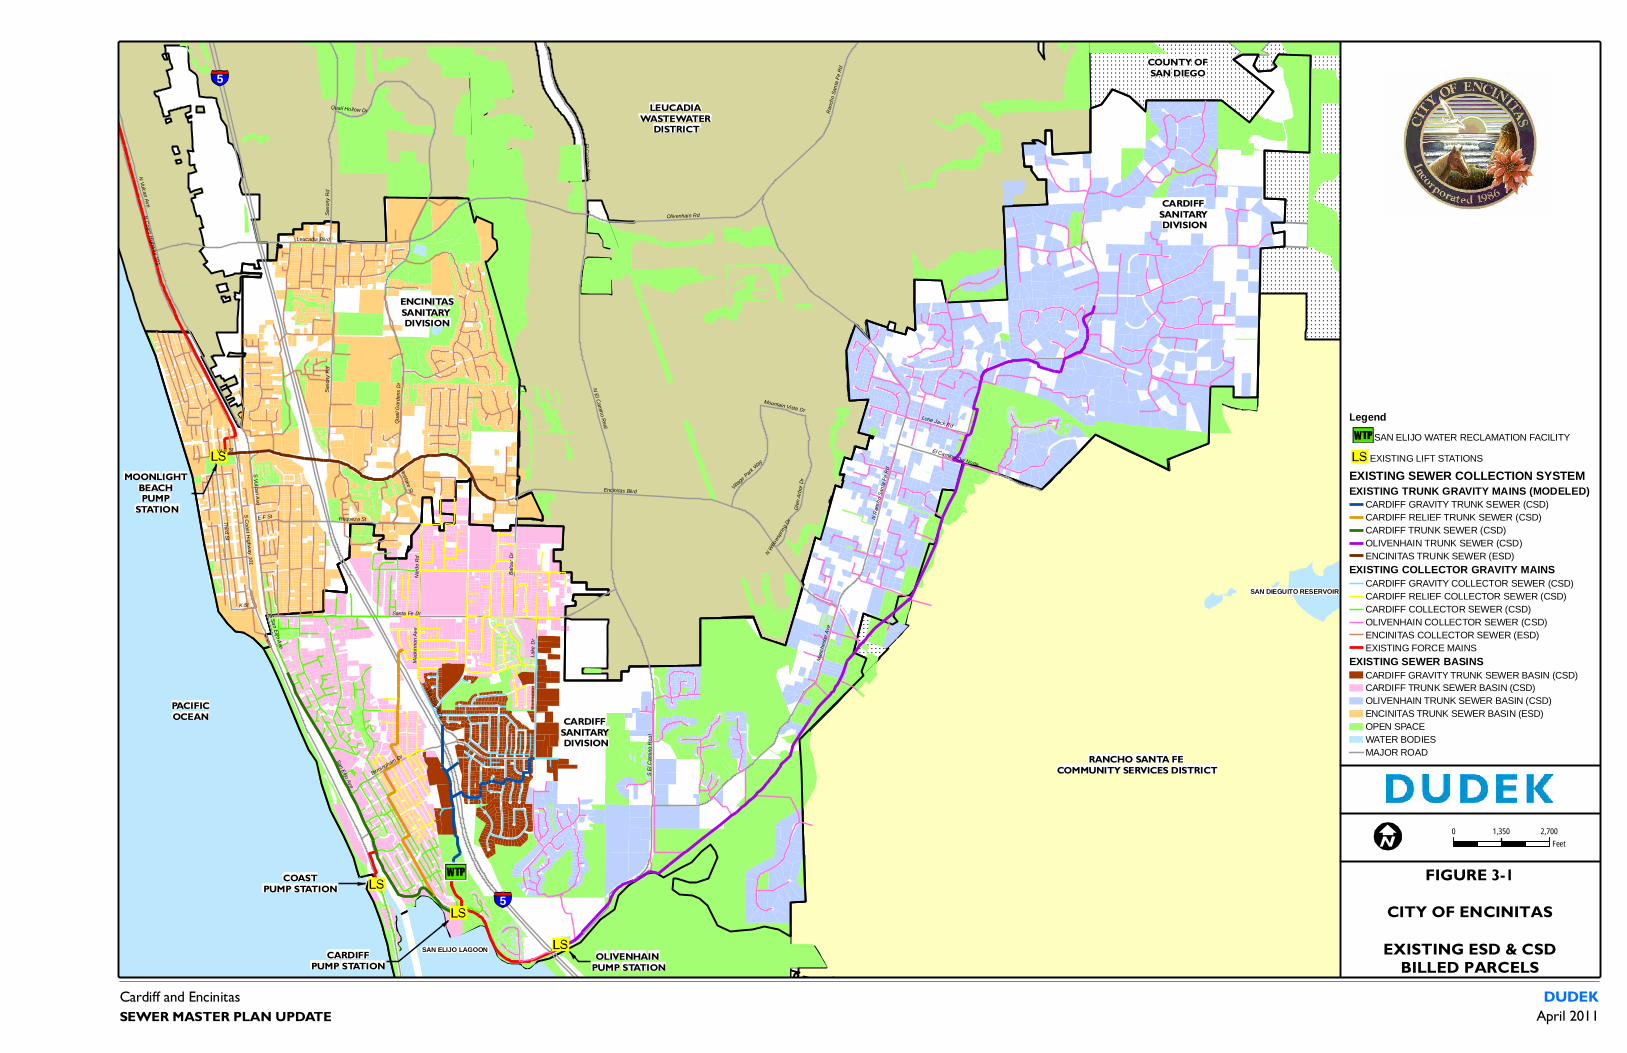
Encinitas Blvd
Manc
heste
r Ave
Leucadia Blvd
Santa Fe Dr
N Vulcan Ave
S Coast Highway 101
San Elijo Ave
Quail
Gard
ens D
r
Third St
Lone Jack Rd
Saxo
ny R
d
Lake
Dr
S El C
amino
Rea
l
N El Camino Real
N Coast Highway 101
N Ra
ncho
Santa
Fe R
d
Balou
r Dr
Olivenhain Rd
Birmingham Dr
S Vulcan Ave
Requeza St
Ranc
ho Sa
nta Fe
Rd
Nardo
Rd
El Camino Real
Glen
Arbo
r Dr
El Camino Del Norte
Village Park
Way
K St
Villa Cardiff Dr
Westlake St
Mack
innon
Ave
E F St
Quail Hollow Dr
W B St
Mountain Vista Dr
S San Elijo Ave
N Willo
wsprin
g Dr
Saxo
ny R
d
SAN ELIJO LAGOON
SAN DIEGUITO RESERVOIR
Cardiff and Encinitas
FIGURE 3-1CITY OF ENCINITAS
EXISTING ESD & CSDBILLED PARCELS
SEWER MASTER PLAN UPDATEDUDEK
April 2011
PACIFICOCEAN
LegendSAN ELIJO WATER RECLAMATION FACILITY
EXISTING LIFT STATIONS
EXISTING SEWER COLLECTION SYSTEMEXISTING TRUNK GRAVITY MAINS (MODELED)
CARDIFF GRAVITY TRUNK SEWER (CSD)CARDIFF RELIEF TRUNK SEWER (CSD)CARDIFF TRUNK SEWER (CSD)OLIVENHAIN TRUNK SEWER (CSD)ENCINITAS TRUNK SEWER (ESD)
EXISTING COLLECTOR GRAVITY MAINSCARDIFF GRAVITY COLLECTOR SEWER (CSD)CARDIFF RELIEF COLLECTOR SEWER (CSD)CARDIFF COLLECTOR SEWER (CSD)OLIVENHAIN COLLECTOR SEWER (CSD)ENCINITAS COLLECTOR SEWER (ESD)EXISTING FORCE MAINS
EXISTING SEWER BASINSCARDIFF GRAVITY TRUNK SEWER BASIN (CSD)CARDIFF TRUNK SEWER BASIN (CSD)OLIVENHAIN TRUNK SEWER BASIN (CSD)ENCINITAS TRUNK SEWER BASIN (ESD)OPEN SPACEWATER BODIESMAJOR ROAD
COUNTY OFSAN DIEGO
5
5
0 2,7001,350Feet
RANCHO SANTA FE COMMUNITY SERVICES DISTRICT
CARDIFF SANITARY DIVISION
CARDIFF SANITARY DIVISION
ENCINITASSANITARY DIVISION
LEUCADIA WASTEWATER
DISTRICT
COASTPUMP STATION
CARDIFFPUMP STATION
OLIVENHAIN PUMP STATION
MOONLIGHT BEACH PUMP
STATION

INTENTIONALLY LEFT BLANK
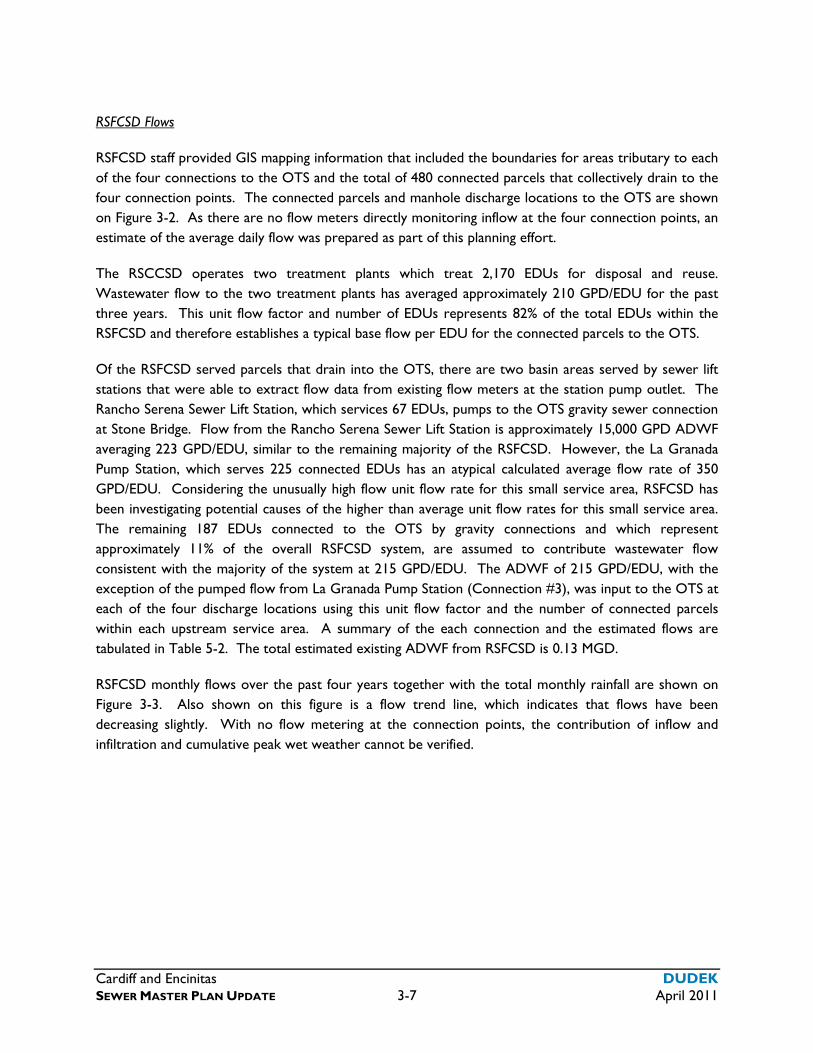
Cardiff and Encinitas DUDEK SEWER MASTER PLAN UPDATE 3-7 April 2011
RSFCSD Flows
RSFCSD staff provided GIS mapping information that included the boundaries for areas tributary to each of the four connections to the OTS and the total of 480 connected parcels that collectively drain to the four connection points. The connected parcels and manhole discharge locations to the OTS are shown on Figure 3-2. As there are no flow meters directly monitoring inflow at the four connection points, an estimate of the average daily flow was prepared as part of this planning effort.
The RSCCSD operates two treatment plants which treat 2,170 EDUs for disposal and reuse. Wastewater flow to the two treatment plants has averaged approximately 210 GPD/EDU for the past three years. This unit flow factor and number of EDUs represents 82% of the total EDUs within the RSFCSD and therefore establishes a typical base flow per EDU for the connected parcels to the OTS.
Of the RSFCSD served parcels that drain into the OTS, there are two basin areas served by sewer lift stations that were able to extract flow data from existing flow meters at the station pump outlet. The Rancho Serena Sewer Lift Station, which services 67 EDUs, pumps to the OTS gravity sewer connection at Stone Bridge. Flow from the Rancho Serena Sewer Lift Station is approximately 15,000 GPD ADWF averaging 223 GPD/EDU, similar to the remaining majority of the RSFCSD. However, the La Granada Pump Station, which serves 225 connected EDUs has an atypical calculated average flow rate of 350 GPD/EDU. Considering the unusually high flow unit flow rate for this small service area, RSFCSD has been investigating potential causes of the higher than average unit flow rates for this small service area. The remaining 187 EDUs connected to the OTS by gravity connections and which represent approximately 11% of the overall RSFCSD system, are assumed to contribute wastewater flow consistent with the majority of the system at 215 GPD/EDU. The ADWF of 215 GPD/EDU, with the exception of the pumped flow from La Granada Pump Station (Connection #3), was input to the OTS at each of the four discharge locations using this unit flow factor and the number of connected parcels within each upstream service area. A summary of the each connection and the estimated flows are tabulated in Table 5-2. The total estimated existing ADWF from RSFCSD is 0.13 MGD.
RSFCSD monthly flows over the past four years together with the total monthly rainfall are shown on Figure 3-3. Also shown on this figure is a flow trend line, which indicates that flows have been decreasing slightly. With no flow metering at the connection points, the contribution of inflow and infiltration and cumulative peak wet weather cannot be verified.

Cardiff and Encinitas DUDEK SEWER MASTER PLAN UPDATE 3-8 April 2011
INTENTIONALLY LEFT BLANK
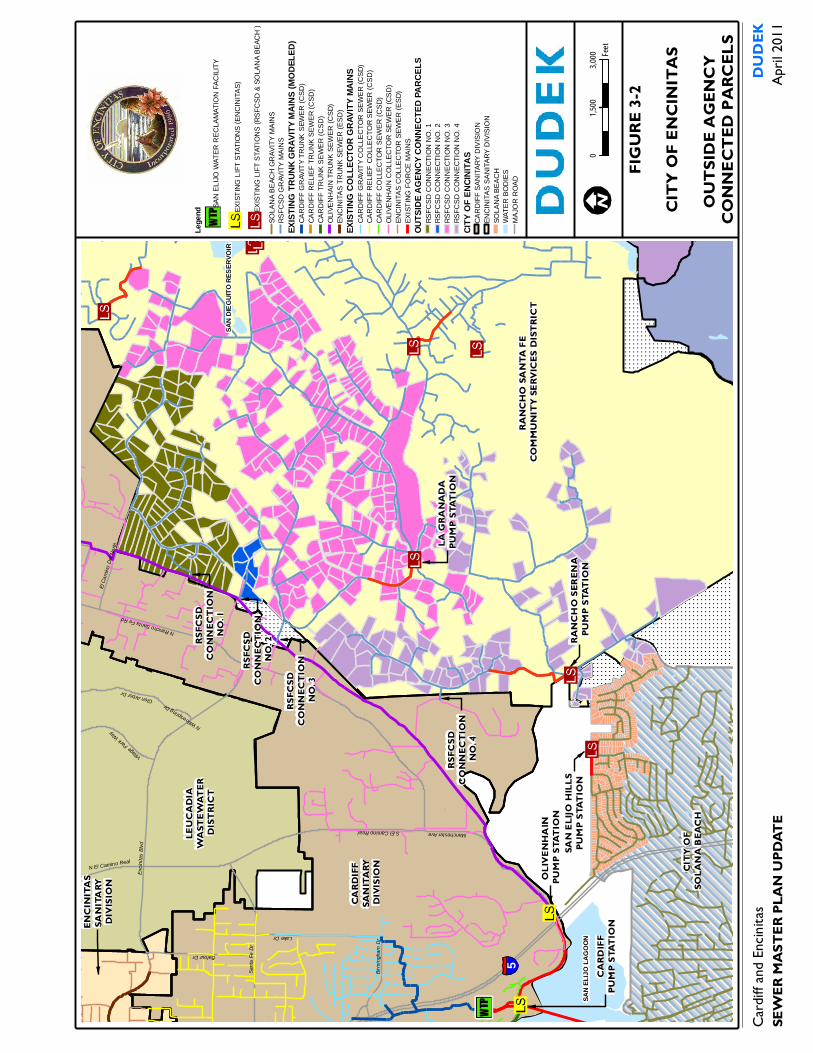
Manchester Ave
Encin
itas B
lvd
Lake Dr
S El Camino Real
Santa
Fe D
r
Balour Dr
N Rancho Santa Fe Rd
Glen Arbor Dr
El Ca
mino D
el Nort
e
Birmi
ngha
m Dr
Village Park
Way
N El Camino Real
N Willowspring Dr
SAN
ELIJO
LAGO
ON
SAN
DIEGU
ITO R
ESER
VOIR
FIGUR
E 3-2
CITY
OF E
NCIN
ITAS
OUTS
IDE A
GENC
Y CO
NNEC
TED
PARC
ELS
Lege
ndS
AN
EL
IJO
WA
TE
R R
EC
LAM
AT
ION
FA
CIL
ITY
EX
IST
ING
LIF
T S
TAT
ION
S (
EN
CIN
ITA
S)
EX
IST
ING
LIF
T S
TAT
ION
S (
RS
FC
SD
& S
OLA
NA
BE
AC
H )
SO
LAN
A B
EA
CH
GR
AV
ITY
MA
INS
RS
FC
SD
GR
AVIT
Y M
AIN
S
EXIST
ING
TRUN
K GRA
VITY M
AINS
(MOD
ELED
)C
AR
DIF
F G
RAV
ITY
TR
UN
K S
EW
ER
(C
SD
)C
AR
DIF
F R
ELI
EF
TR
UN
K S
EW
ER
(C
SD
)C
AR
DIF
F T
RU
NK
SE
WE
R (
CS
D)
OLI
VE
NH
AIN
TR
UN
K S
EW
ER
(C
SD
)E
NC
INIT
AS
TR
UN
K S
EW
ER
(E
SD
)
EXIST
ING
COLL
ECTO
R GR
AVITY
MAI
NSC
AR
DIF
F G
RAV
ITY
CO
LLE
CT
OR
SE
WE
R (
CS
D)
CA
RD
IFF
RE
LIE
F C
OLL
EC
TO
R S
EW
ER
(C
SD
)C
AR
DIF
F C
OLL
EC
TO
R S
EW
ER
(C
SD
)O
LIV
EN
HA
IN C
OL
LEC
TOR
SE
WE
R (
CS
D)
EN
CIN
ITA
S C
OL
LEC
TOR
SE
WE
R (
ES
D)
EX
IST
ING
FO
RC
E M
AIN
S
OUTS
IDE A
GENC
Y CON
NECT
ED PA
RCEL
SR
SF
CS
D C
ON
NE
CT
ION
NO
. 1
RS
FC
SD
CO
NN
EC
TIO
N N
O.
2R
SF
CS
D C
ON
NE
CT
ION
NO
. 3
RS
FC
SD
CO
NN
EC
TIO
N N
O.
4
CITY O
F ENC
INITA
SC
AR
DIF
F S
AN
ITA
RY
DIV
ISIO
NE
NC
INIT
AS
SA
NIT
AR
Y D
IVIS
ION
SO
LAN
A B
EA
CH
WA
TE
R B
OD
IES
MA
JOR
RO
AD
Cardi
ff and
Encin
itas
SEW
ER M
ASTE
R PLA
N UP
DATE
DUDE
KAp
ril 20
11
03,0
001,5
00Fee
tCA
RDIF
FPU
MP
STAT
ION
OLIV
ENHA
IN
PUM
P ST
ATIO
N
RSFC
SD
CONN
ECTI
ON
NO. 4
RSFC
SD
CONN
ECTI
ON
NO. 3
RSFC
SD
CONN
ECTI
ON
NO. 2RS
FCSD
CO
NNEC
TION
NO
. 1
RANC
HO SA
NTA
FE
COM
MUNI
TY SE
RVIC
ES D
ISTR
ICT
LEUC
ADIA
W
ASTE
WAT
ER
DIST
RICT
CARD
IFF
SANI
TARY
DI
VISI
ON
ENCI
NITA
SSA
NITA
RY
DIVI
SION
CITY
OF
SOLA
NA B
EACH
5
SAN
ELIJO
HIL
LSPU
MP
STAT
ION
RANC
HO SE
RENA
PU
MP
STAT
ION
LA G
RANA
DA
PUM
P ST
ATIO
N

THIS PAGE INTENTIONALLY LEFT BLANK
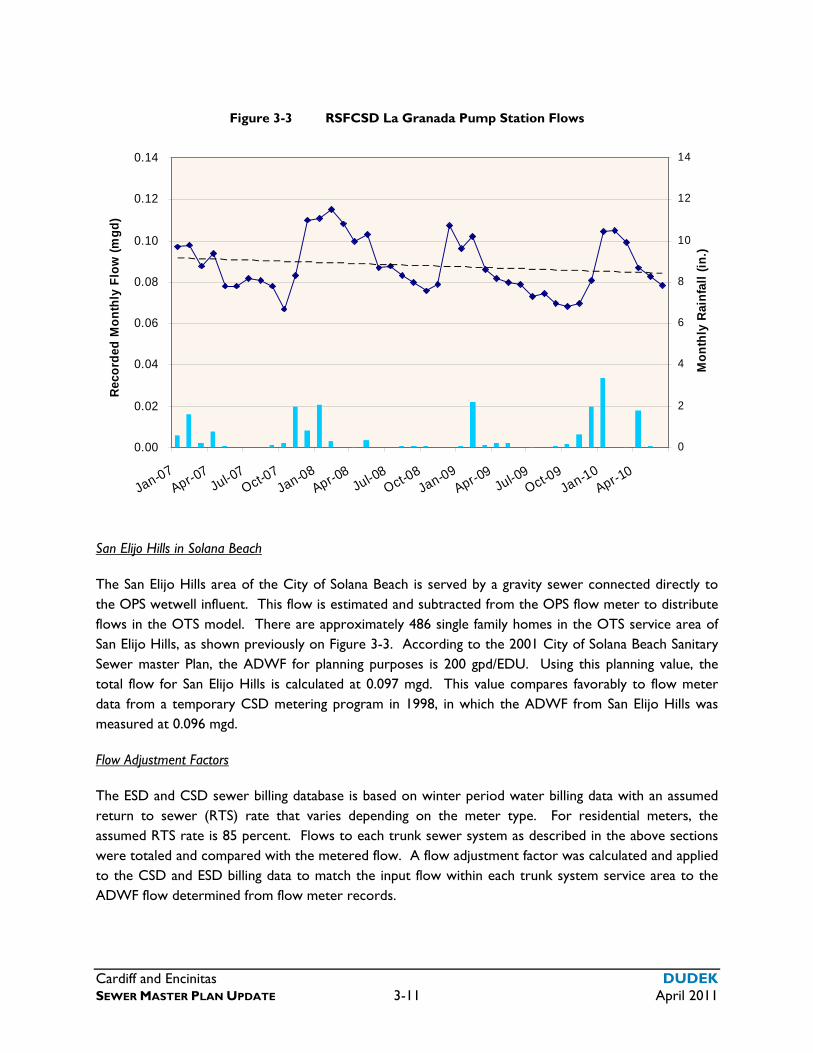
Cardiff and Encinitas DUDEK SEWER MASTER PLAN UPDATE 3-11 April 2011
Figure 3-3 RSFCSD La Granada Pump Station Flows
0.00
0.02
0.04
0.06
0.08
0.10
0.12
0.14
Jan-07Apr-0
7Jul-07
Oct-07
Jan-08Apr-0
8Jul-08
Oct-08Jan-09
Apr-09
Jul-09Oct-0
9Jan-10
Apr-10
Rec
ord
ed M
on
thly
Flo
w (
mg
d)
0
2
4
6
8
10
12
14
Mo
nth
ly R
ain
fall
(in
.)
San Elijo Hills in Solana Beach
The San Elijo Hills area of the City of Solana Beach is served by a gravity sewer connected directly to the OPS wetwell influent. This flow is estimated and subtracted from the OPS flow meter to distribute flows in the OTS model. There are approximately 486 single family homes in the OTS service area of San Elijo Hills, as shown previously on Figure 3-3. According to the 2001 City of Solana Beach Sanitary Sewer master Plan, the ADWF for planning purposes is 200 gpd/EDU. Using this planning value, the total flow for San Elijo Hills is calculated at 0.097 mgd. This value compares favorably to flow meter data from a temporary CSD metering program in 1998, in which the ADWF from San Elijo Hills was measured at 0.096 mgd.
Flow Adjustment Factors
The ESD and CSD sewer billing database is based on winter period water billing data with an assumed return to sewer (RTS) rate that varies depending on the meter type. For residential meters, the assumed RTS rate is 85 percent. Flows to each trunk sewer system as described in the above sections were totaled and compared with the metered flow. A flow adjustment factor was calculated and applied to the CSD and ESD billing data to match the input flow within each trunk system service area to the ADWF flow determined from flow meter records.
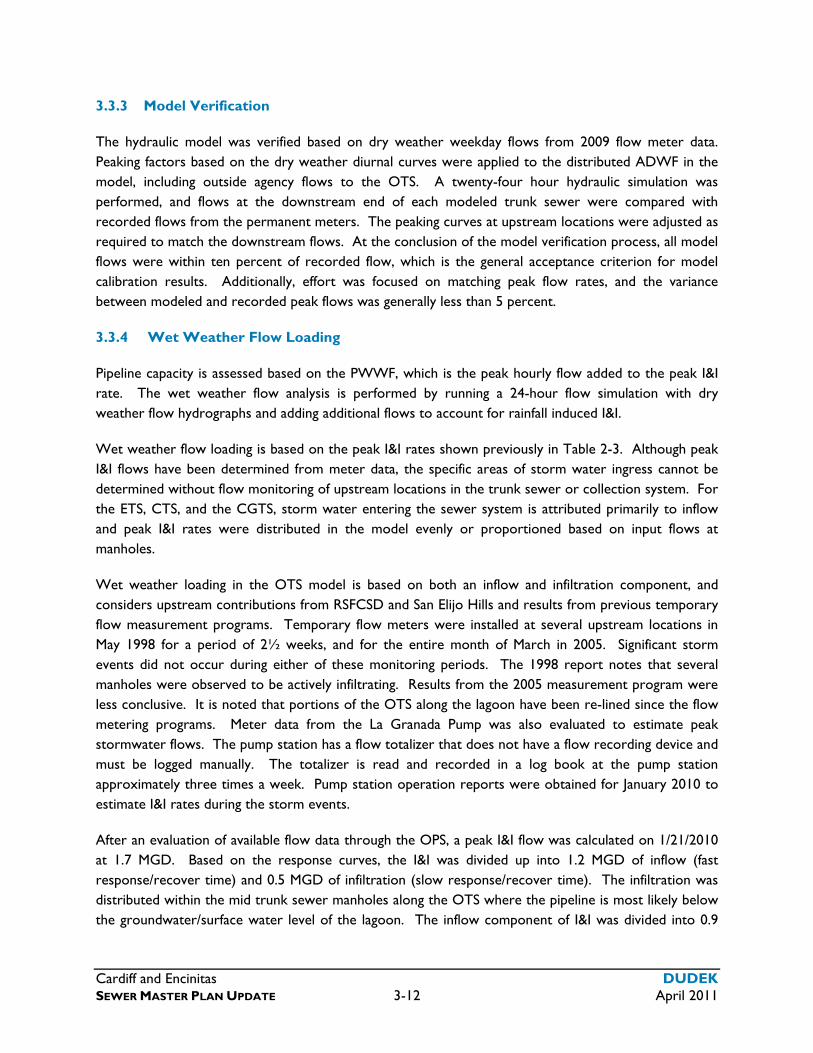
Cardiff and Encinitas DUDEK SEWER MASTER PLAN UPDATE 3-12 April 2011
3.3.3 Model Verification
The hydraulic model was verified based on dry weather weekday flows from 2009 flow meter data. Peaking factors based on the dry weather diurnal curves were applied to the distributed ADWF in the model, including outside agency flows to the OTS. A twenty-four hour hydraulic simulation was performed, and flows at the downstream end of each modeled trunk sewer were compared with recorded flows from the permanent meters. The peaking curves at upstream locations were adjusted as required to match the downstream flows. At the conclusion of the model verification process, all model flows were within ten percent of recorded flow, which is the general acceptance criterion for model calibration results. Additionally, effort was focused on matching peak flow rates, and the variance between modeled and recorded peak flows was generally less than 5 percent.
3.3.4 Wet Weather Flow Loading
Pipeline capacity is assessed based on the PWWF, which is the peak hourly flow added to the peak I&I rate. The wet weather flow analysis is performed by running a 24-hour flow simulation with dry weather flow hydrographs and adding additional flows to account for rainfall induced I&I.
Wet weather flow loading is based on the peak I&I rates shown previously in Table 2-3. Although peak I&I flows have been determined from meter data, the specific areas of storm water ingress cannot be determined without flow monitoring of upstream locations in the trunk sewer or collection system. For the ETS, CTS, and the CGTS, storm water entering the sewer system is attributed primarily to inflow and peak I&I rates were distributed in the model evenly or proportioned based on input flows at manholes.
Wet weather loading in the OTS model is based on both an inflow and infiltration component, and considers upstream contributions from RSFCSD and San Elijo Hills and results from previous temporary flow measurement programs. Temporary flow meters were installed at several upstream locations in May 1998 for a period of 2½ weeks, and for the entire month of March in 2005. Significant storm events did not occur during either of these monitoring periods. The 1998 report notes that several manholes were observed to be actively infiltrating. Results from the 2005 measurement program were less conclusive. It is noted that portions of the OTS along the lagoon have been re-lined since the flow metering programs. Meter data from the La Granada Pump was also evaluated to estimate peak stormwater flows. The pump station has a flow totalizer that does not have a flow recording device and must be logged manually. The totalizer is read and recorded in a log book at the pump station approximately three times a week. Pump station operation reports were obtained for January 2010 to estimate I&I rates during the storm events.
After an evaluation of available flow data through the OPS, a peak I&I flow was calculated on 1/21/2010 at 1.7 MGD. Based on the response curves, the I&I was divided up into 1.2 MGD of inflow (fast response/recover time) and 0.5 MGD of infiltration (slow response/recover time). The infiltration was distributed within the mid trunk sewer manholes along the OTS where the pipeline is most likely below the groundwater/surface water level of the lagoon. The inflow component of I&I was divided into 0.9
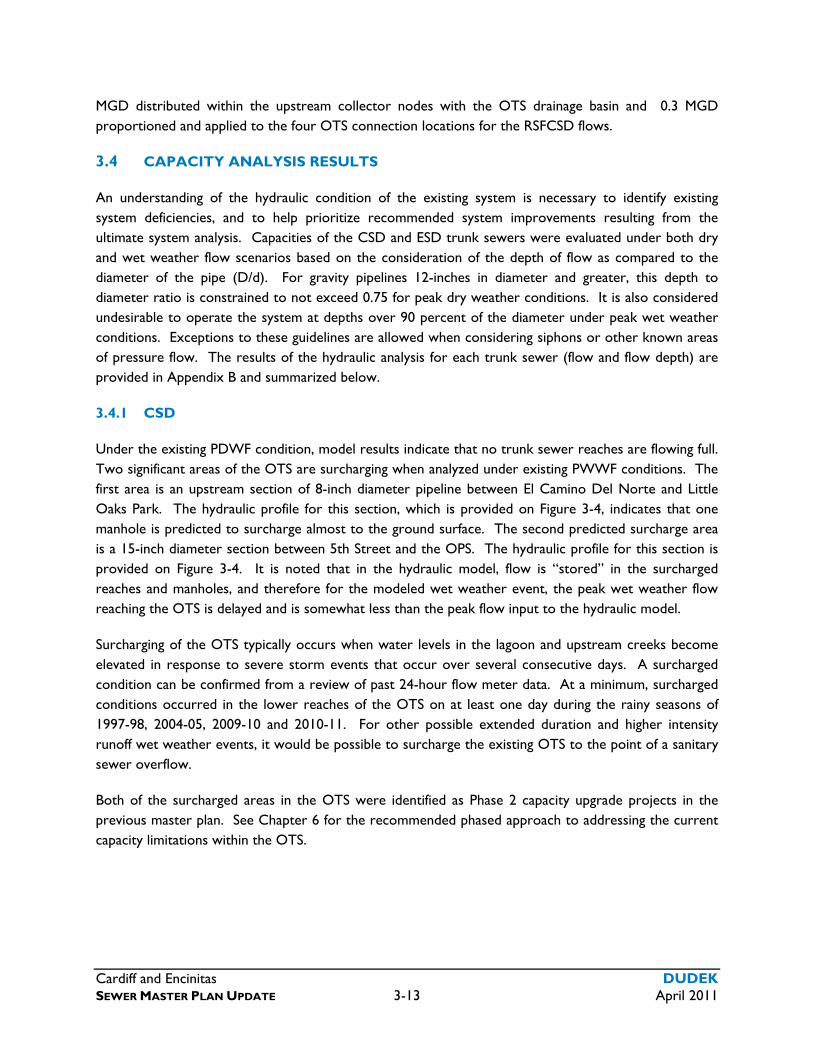
Cardiff and Encinitas DUDEK SEWER MASTER PLAN UPDATE 3-13 April 2011
MGD distributed within the upstream collector nodes with the OTS drainage basin and 0.3 MGD proportioned and applied to the four OTS connection locations for the RSFCSD flows.
3.4 CAPACITY ANALYSIS RESULTS
An understanding of the hydraulic condition of the existing system is necessary to identify existing system deficiencies, and to help prioritize recommended system improvements resulting from the ultimate system analysis. Capacities of the CSD and ESD trunk sewers were evaluated under both dry and wet weather flow scenarios based on the consideration of the depth of flow as compared to the diameter of the pipe (D/d). For gravity pipelines 12-inches in diameter and greater, this depth to diameter ratio is constrained to not exceed 0.75 for peak dry weather conditions. It is also considered undesirable to operate the system at depths over 90 percent of the diameter under peak wet weather conditions. Exceptions to these guidelines are allowed when considering siphons or other known areas of pressure flow. The results of the hydraulic analysis for each trunk sewer (flow and flow depth) are provided in Appendix B and summarized below.
3.4.1 CSD
Under the existing PDWF condition, model results indicate that no trunk sewer reaches are flowing full. Two significant areas of the OTS are surcharging when analyzed under existing PWWF conditions. The first area is an upstream section of 8-inch diameter pipeline between El Camino Del Norte and Little Oaks Park. The hydraulic profile for this section, which is provided on Figure 3-4, indicates that one manhole is predicted to surcharge almost to the ground surface. The second predicted surcharge area is a 15-inch diameter section between 5th Street and the OPS. The hydraulic profile for this section is provided on Figure 3-4. It is noted that in the hydraulic model, flow is “stored” in the surcharged reaches and manholes, and therefore for the modeled wet weather event, the peak wet weather flow reaching the OTS is delayed and is somewhat less than the peak flow input to the hydraulic model.
Surcharging of the OTS typically occurs when water levels in the lagoon and upstream creeks become elevated in response to severe storm events that occur over several consecutive days. A surcharged condition can be confirmed from a review of past 24-hour flow meter data. At a minimum, surcharged conditions occurred in the lower reaches of the OTS on at least one day during the rainy seasons of 1997-98, 2004-05, 2009-10 and 2010-11. For other possible extended duration and higher intensity runoff wet weather events, it would be possible to surcharge the existing OTS to the point of a sanitary sewer overflow.
Both of the surcharged areas in the OTS were identified as Phase 2 capacity upgrade projects in the previous master plan. See Chapter 6 for the recommended phased approach to addressing the current capacity limitations within the OTS.
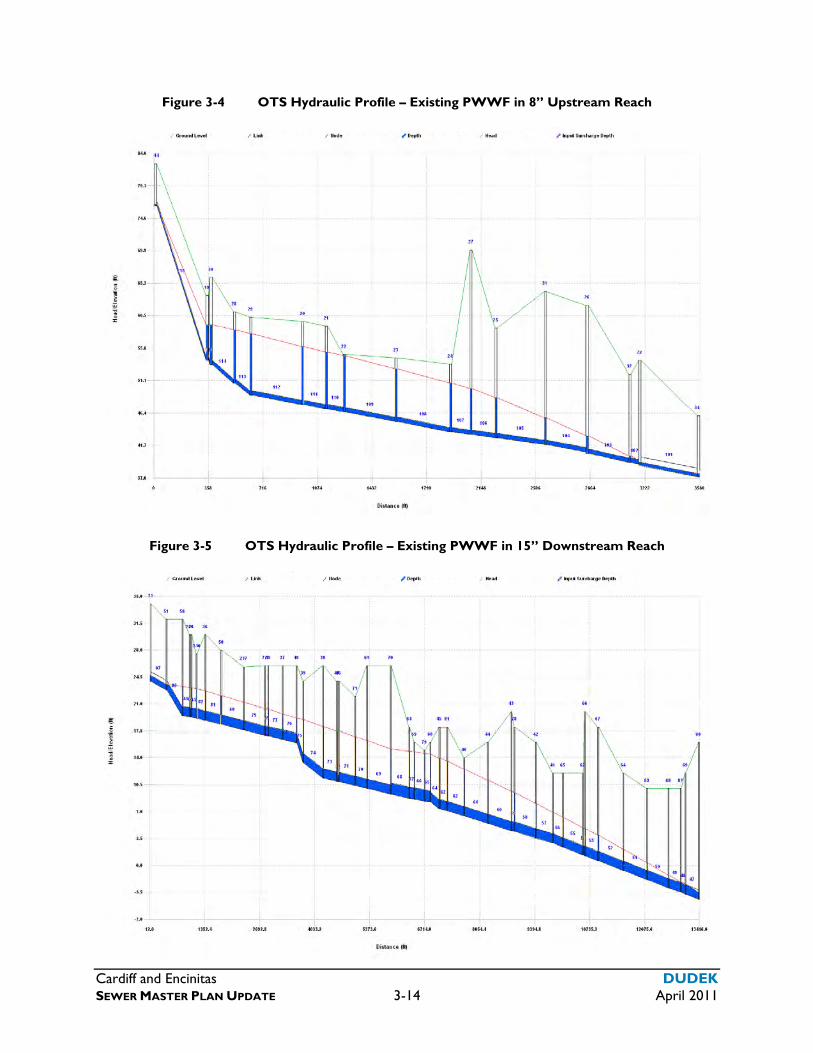
Cardiff and Encinitas DUDEK SEWER MASTER PLAN UPDATE 3-14 April 2011
Figure 3-4 OTS Hydraulic Profile – Existing PWWF in 8” Upstream Reach
Figure 3-5 OTS Hydraulic Profile – Existing PWWF in 15” Downstream Reach
Cardiff and Encinitas DUDEK SEWER MASTER PLAN UPDATE 3-15 April 2011
3.4.2 ESD
Model results indicate that the existing Encinitas Trunk Sewer can convey both peak dry and wet weather flows within the capacity of the pipeline. During peak dry weather flow, the highest depth to diameter ratio is 0.50 within GIS Pipe ID 14115SMAIN (15-inch). During peak wet weather flows, the highest depth to diameter ration is 0.63 in the same pipeline segment. Therefore no capacity improvements are necessary within the ETS based on existing sewer flows.

Cardiff and Encinitas DUDEK SEWER MASTER PLAN UPDATE 3-16 April 2011
INTENTIONALLY LEFT BLANK
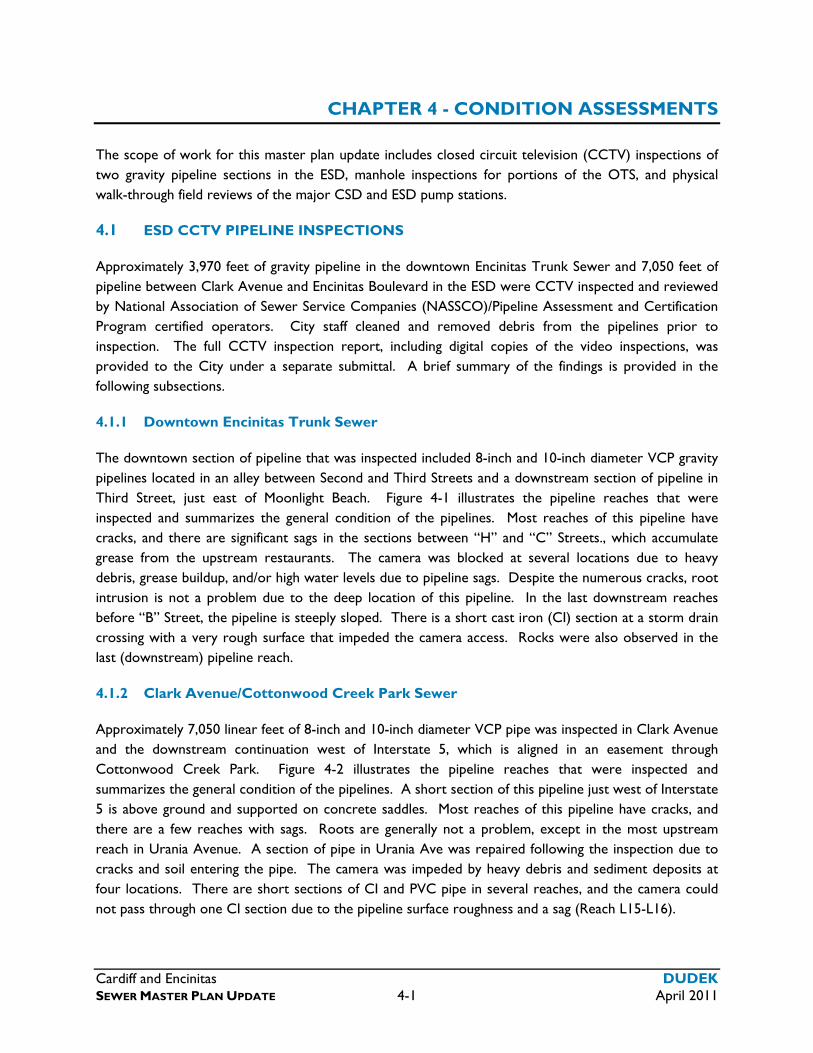
Cardiff and Encinitas DUDEK SEWER MASTER PLAN UPDATE 4-1 April 2011
CHAPTER 4 - CONDITION ASSESSMENTS
The scope of work for this master plan update includes closed circuit television (CCTV) inspections of two gravity pipeline sections in the ESD, manhole inspections for portions of the OTS, and physical walk-through field reviews of the major CSD and ESD pump stations.
4.1 ESD CCTV PIPELINE INSPECTIONS
Approximately 3,970 feet of gravity pipeline in the downtown Encinitas Trunk Sewer and 7,050 feet of pipeline between Clark Avenue and Encinitas Boulevard in the ESD were CCTV inspected and reviewed by National Association of Sewer Service Companies (NASSCO)/Pipeline Assessment and Certification Program certified operators. City staff cleaned and removed debris from the pipelines prior to inspection. The full CCTV inspection report, including digital copies of the video inspections, was provided to the City under a separate submittal. A brief summary of the findings is provided in the following subsections.
4.1.1 Downtown Encinitas Trunk Sewer
The downtown section of pipeline that was inspected included 8-inch and 10-inch diameter VCP gravity pipelines located in an alley between Second and Third Streets and a downstream section of pipeline in Third Street, just east of Moonlight Beach. Figure 4-1 illustrates the pipeline reaches that were inspected and summarizes the general condition of the pipelines. Most reaches of this pipeline have cracks, and there are significant sags in the sections between “H” and “C” Streets., which accumulate grease from the upstream restaurants. The camera was blocked at several locations due to heavy debris, grease buildup, and/or high water levels due to pipeline sags. Despite the numerous cracks, root intrusion is not a problem due to the deep location of this pipeline. In the last downstream reaches before “B” Street, the pipeline is steeply sloped. There is a short cast iron (CI) section at a storm drain crossing with a very rough surface that impeded the camera access. Rocks were also observed in the last (downstream) pipeline reach.
4.1.2 Clark Avenue/Cottonwood Creek Park Sewer
Approximately 7,050 linear feet of 8-inch and 10-inch diameter VCP pipe was inspected in Clark Avenue and the downstream continuation west of Interstate 5, which is aligned in an easement through Cottonwood Creek Park. Figure 4-2 illustrates the pipeline reaches that were inspected and summarizes the general condition of the pipelines. A short section of this pipeline just west of Interstate 5 is above ground and supported on concrete saddles. Most reaches of this pipeline have cracks, and there are a few reaches with sags. Roots are generally not a problem, except in the most upstream reach in Urania Avenue. A section of pipe in Urania Ave was repaired following the inspection due to cracks and soil entering the pipe. The camera was impeded by heavy debris and sediment deposits at four locations. There are short sections of CI and PVC pipe in several reaches, and the camera could not pass through one CI section due to the pipeline surface roughness and a sag (Reach L15-L16).

Cardiff and Encinitas DUDEK SEWER MASTER PLAN UPDATE 4-2 April 2011
INTENTIONALLY LEFT BLANK
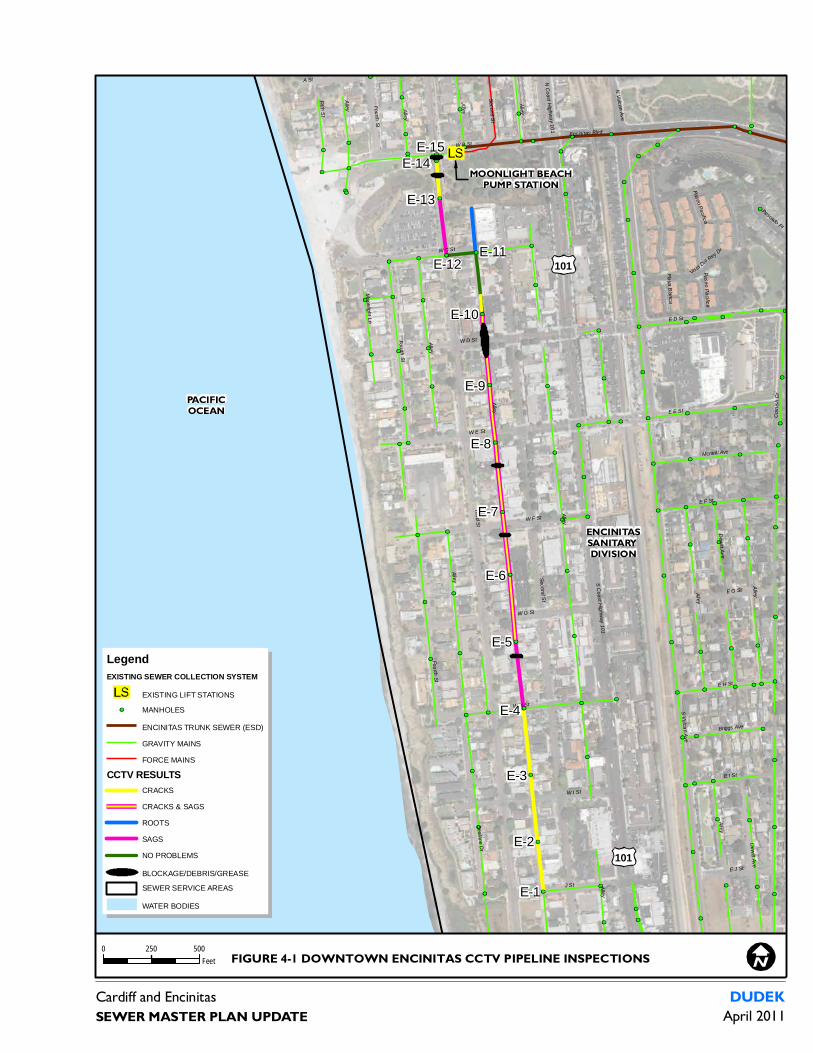
Third St
Second St
S Vulcan Ave
Corni
sh D
r
S Coast Highway 101
E D St
E E St
Fourth St
J St
W E St
W D St
W F St
W I St
W B St
W C St
W H St
W G St
A St
Alley
E F St
Encinitas Blvd
Sealane Dr
E G St
E I St
E H St
Dewitt Ave
E J St
Mcneill Ave
Fifth St
Playa Blanca
Briggs Ave
Vista Del Rey Dr
Moonlight Ln
Paseo Pacifica
N Vulcan Ave
Pescado Pl
N Coast Highway 101
Paseo Pacifica
Alley
Alley
Alley
Alley
Fourth St
Second St
Alley
Alley
AlleyAlley
Alley
Fourth St
Alley
Alley
Dewitt Ave
LegendEXISTING SEWER COLLECTION SYSTEM
EXISTING LIFT STATIONS
MANHOLES
ENCINITAS TRUNK SEWER (ESD)
GRAVITY MAINS
FORCE MAINS
CCTV RESULTSCRACKS
CRACKS & SAGS
ROOTS
SAGS
NO PROBLEMS
BLOCKAGE/DEBRIS/GREASE
SEWER SERVICE AREAS
WATER BODIES
Cardiff and EncinitasSEWER MASTER PLAN UPDATE
DUDEKApril 2011
101
101
0 500250Feet FIGURE 4-1 DOWNTOWN ENCINITAS CCTV PIPELINE INSPECTIONS
ENCINITASSANITARY DIVISION
PACIFICOCEAN
MOONLIGHT BEACHPUMP STATION
E-1
E-2
E-3
E-4
E-5
E-6
E-7
E-8
E-10
E-12
E-9
E-11
E-13
E-14E-15

Cardiff and Encinitas DUDEK SEWER MASTER PLAN UPDATE 4-4 April 2011
INTENTIONALLY LEFT BLANK
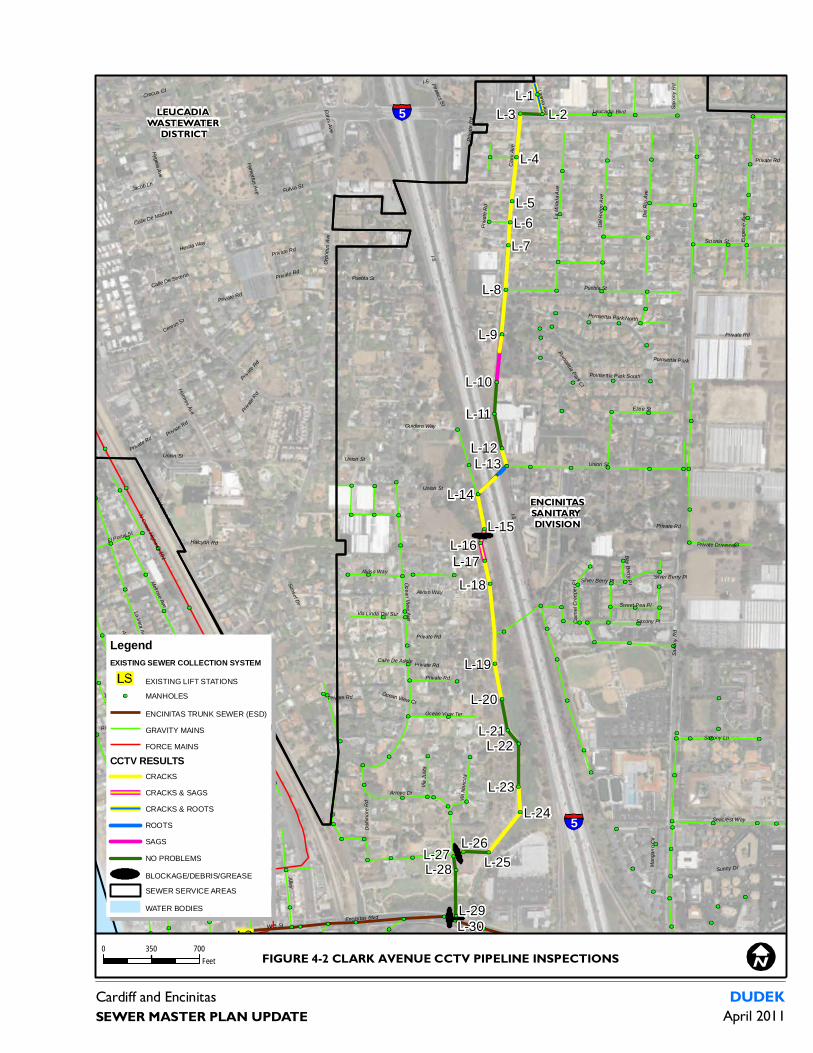
I-5
Saxo
ny R
d
Leucadia Blvd
N Vulcan Ave
Orph
eus A
ve
A St
Alley
Hygeia Ave
Union St
Ocean View Ave
La Veta Ave
Sunset Dr
Hymettus Ave
N Coast Highway 101Melrose Ave
Fulvia St
Clark
Ave
Fifth St
La Mesa Ave
Del R
io Av
e
Third St
Euge
nie Av
e
Del R
iego A
ve
Arroyo Dr
Encinitas Blvd
La M
irada
Ave
Fourth St
Ezee St
Sylvia St
Hermes Ave
W B St
Second St
Florita St
Eolus Ave
Private Rd
Sidonia St
Seacrest Way
Sunny Dr
Marcheta St
Saxony Ln
Puebla St
Neptune Ave Lolita St
Private Driveway
Saxony Pl
Silver Berry Pl
Poinsett ia Park North
Halcyon Rd
Alviso Way
Cereus St
El Portal St
Poinsett ia Park South
Ocean View Ter
Via N
ancit
a
Via Ju
lita
Piraeus St
Mang
ano C
ir
Crocus Ct
Calle De Sereno
Sweet Pea Pl
Jacob Ln
Urania Ave
Dollim
ore R
d
Roseta St
Carm
el Cr
eepe
r Pl
Guidero Way
Via Linda Del Sur
Hestia Way
Poinsett ia Park
Poinsett ia Park CtCalle De Madera
Bay Berry Pl
Calle De Adele
Ocean View Ct
Silver Berry Pl
Private Rd
Union StPrivate Rd
Alviso Way
Union St
Private Rd
I-5
Alley Alley
Union St
I-5
Saxo
ny R
d
Private Rd
Private R
d
Private Rd
Private Rd
Priva
te Rd
Alley
Private
RdPrivate Rd
AlleyAlley
Priva
te Rd
Private Rd
Private Rd
Private Rd
Alley
Private Rd
Puebla St
LegendEXISTING SEWER COLLECTION SYSTEM
EXISTING LIFT STATIONS
MANHOLES
ENCINITAS TRUNK SEWER (ESD)
GRAVITY MAINS
FORCE MAINS
CCTV RESULTSCRACKS
CRACKS & SAGS
CRACKS & ROOTS
ROOTS
SAGS
NO PROBLEMS
BLOCKAGE/DEBRIS/GREASE
SEWER SERVICE AREAS
WATER BODIES
Cardiff and EncinitasSEWER MASTER PLAN UPDATE
DUDEKApril 2011
5
5
0 700350Feet FIGURE 4-2 CLARK AVENUE CCTV PIPELINE INSPECTIONS
LEUCADIA WASTEWATER
DISTRICT
ENCINITASSANITARY DIVISION
L-1L-2L-3
L-4
L-5
L-6
L-7
L-8
L-9
L-10
L-11
L-12L-13
L-14
L-15L-16L-17
L-18
L-19
L-20
L-21L-22
L-23
L-24
L-25
L-26L-27L-28
L-29L-30

Cardiff and Encinitas DUDEK SEWER MASTER PLAN UPDATE 4-6 April 2011
INTENTIONALLY LEFT BLANK
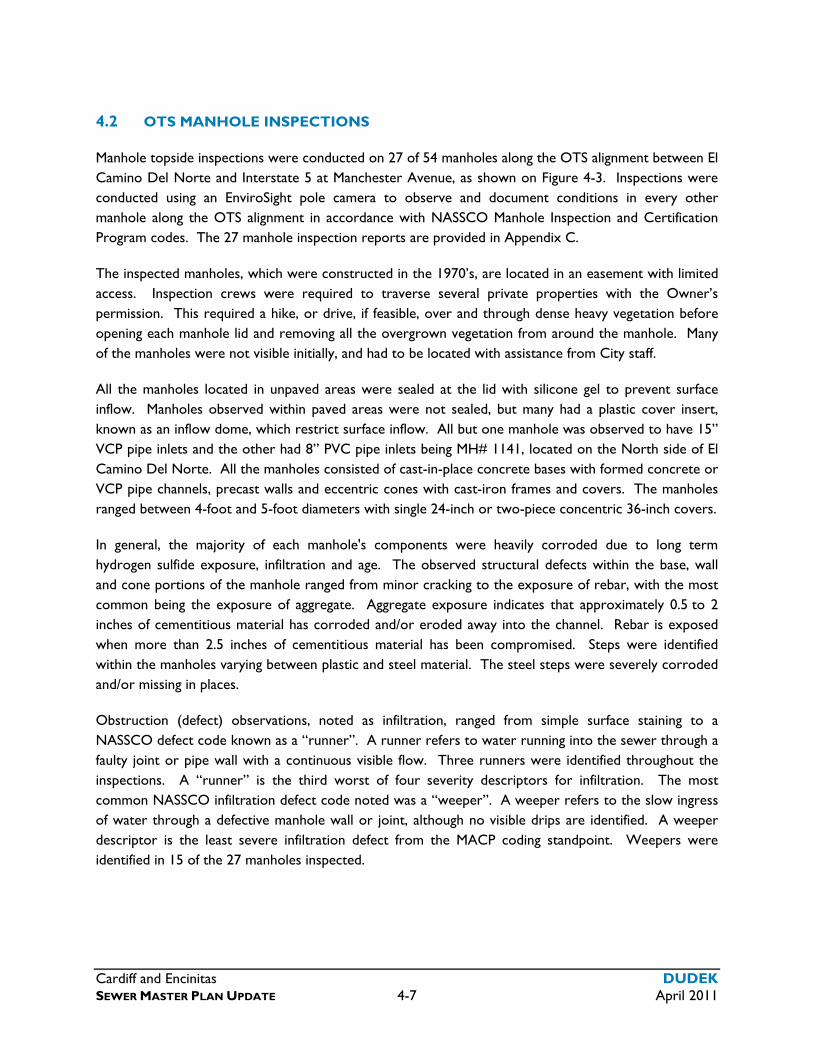
Cardiff and Encinitas DUDEK SEWER MASTER PLAN UPDATE 4-7 April 2011
4.2 OTS MANHOLE INSPECTIONS
Manhole topside inspections were conducted on 27 of 54 manholes along the OTS alignment between El Camino Del Norte and Interstate 5 at Manchester Avenue, as shown on Figure 4-3. Inspections were conducted using an EnviroSight pole camera to observe and document conditions in every other manhole along the OTS alignment in accordance with NASSCO Manhole Inspection and Certification Program codes. The 27 manhole inspection reports are provided in Appendix C.
The inspected manholes, which were constructed in the 1970’s, are located in an easement with limited access. Inspection crews were required to traverse several private properties with the Owner’s permission. This required a hike, or drive, if feasible, over and through dense heavy vegetation before opening each manhole lid and removing all the overgrown vegetation from around the manhole. Many of the manholes were not visible initially, and had to be located with assistance from City staff.
All the manholes located in unpaved areas were sealed at the lid with silicone gel to prevent surface inflow. Manholes observed within paved areas were not sealed, but many had a plastic cover insert, known as an inflow dome, which restrict surface inflow. All but one manhole was observed to have 15” VCP pipe inlets and the other had 8” PVC pipe inlets being MH# 1141, located on the North side of El Camino Del Norte. All the manholes consisted of cast-in-place concrete bases with formed concrete or VCP pipe channels, precast walls and eccentric cones with cast-iron frames and covers. The manholes ranged between 4-foot and 5-foot diameters with single 24-inch or two-piece concentric 36-inch covers.
In general, the majority of each manhole's components were heavily corroded due to long term hydrogen sulfide exposure, infiltration and age. The observed structural defects within the base, wall and cone portions of the manhole ranged from minor cracking to the exposure of rebar, with the most common being the exposure of aggregate. Aggregate exposure indicates that approximately 0.5 to 2 inches of cementitious material has corroded and/or eroded away into the channel. Rebar is exposed when more than 2.5 inches of cementitious material has been compromised. Steps were identified within the manholes varying between plastic and steel material. The steel steps were severely corroded and/or missing in places.
Obstruction (defect) observations, noted as infiltration, ranged from simple surface staining to a NASSCO defect code known as a “runner”. A runner refers to water running into the sewer through a faulty joint or pipe wall with a continuous visible flow. Three runners were identified throughout the inspections. A “runner” is the third worst of four severity descriptors for infiltration. The most common NASSCO infiltration defect code noted was a “weeper”. A weeper refers to the slow ingress of water through a defective manhole wall or joint, although no visible drips are identified. A weeper descriptor is the least severe infiltration defect from the MACP coding standpoint. Weepers were identified in 15 of the 27 manholes inspected.

Cardiff and Encinitas DUDEK SEWER MASTER PLAN UPDATE 4-8 April 2011
INTENTIONALLY LEFT BLANK
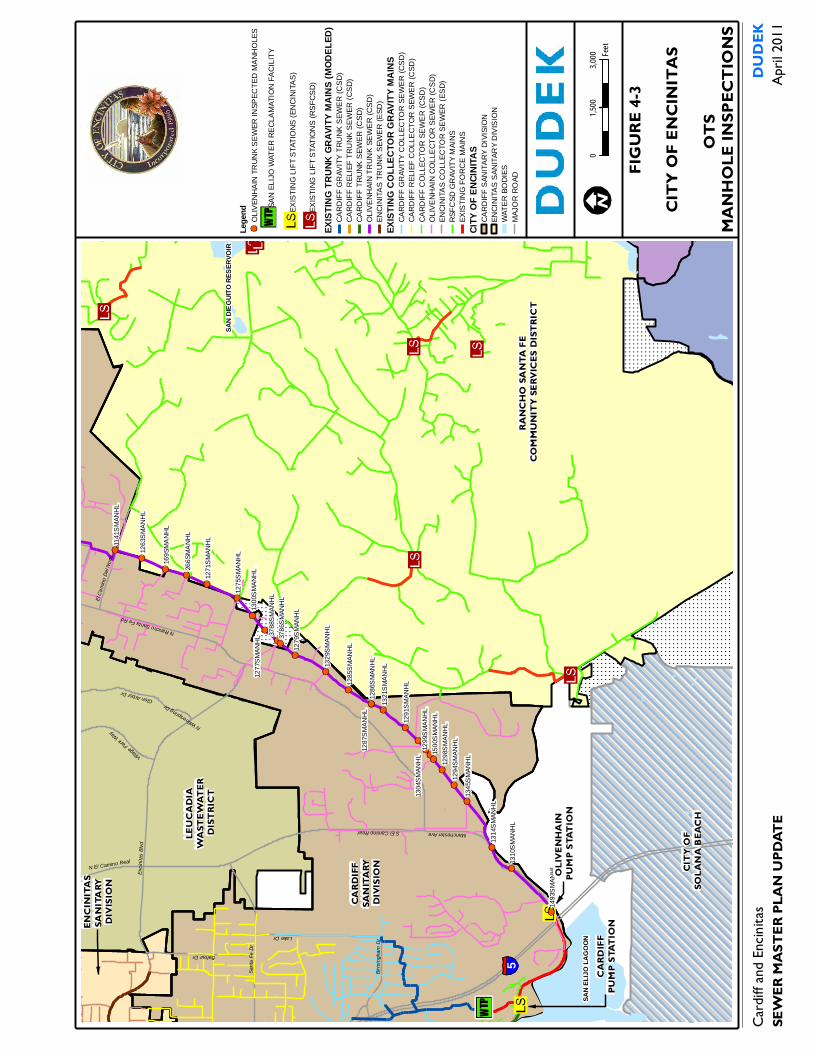
169
SM
AN
HL
266
SM
AN
HL
131
4SM
AN
HL
134
5SM
AN
HL
128
6SM
AN
HL
128
7SM
AN
HL
130
0SM
AN
HL
129
1SM
AN
HL
132
9SM
AN
HL
114
1SM
AN
HL
126
3SM
AN
HL
131
0SM
AN
HL
150
0SM
AN
HL
129
9SM
AN
HL
130
4SM
AN
HL
129
4SM
AN
HL
378
6SM
AN
HL
129
8SM
AN
HL
127
5SM
AN
HL
127
1SM
AN
HL
378
8SM
AN
HL
127
7SM
AN
HL
128
5SM
AN
HL
127
9SM
AN
HL
132
1SM
AN
HL
149
3SM
AN
HL
Manchester Ave
Encin
itas B
lvd
Lake Dr
S El Camino Real
Santa
Fe D
r
Balour Dr
N Rancho Santa Fe Rd
Glen Arbor Dr
El Ca
mino D
el Nort
e
Birmi
ngha
m Dr
Village Park
Way
N El Camino Real
N Willowspring Dr
SAN
ELIJO
LAGO
ON
SAN
DIEGU
ITO R
ESER
VOIR
FIGUR
E 4-3
CITY
OF E
NCIN
ITAS
OTS
MANH
OLE I
NSPE
CTIO
NS
Lege
ndO
LIV
EN
HA
IN T
RU
NK
SE
WE
R IN
SP
EC
TE
D M
AN
HO
LE
S
SA
N E
LIJ
O W
AT
ER
RE
CL
AM
AT
ION
FA
CIL
ITY
EX
IST
ING
LIF
T S
TA
TIO
NS
(E
NC
INIT
AS
)
EX
IST
ING
LIF
T S
TA
TIO
NS
(R
SF
CS
D)
EXIST
ING
TRUN
K GR
AVITY
MAI
NS (M
ODEL
ED)
CA
RD
IFF
GR
AV
ITY
TR
UN
K S
EW
ER
(C
SD
)C
AR
DIF
F R
EL
IEF
TR
UN
K S
EW
ER
(C
SD
)C
AR
DIF
F T
RU
NK
SE
WE
R (
CS
D)
OL
IVE
NH
AIN
TR
UN
K S
EW
ER
(C
SD
)E
NC
INIT
AS
TR
UN
K S
EW
ER
(E
SD
)
EXIST
ING
COLL
ECTO
R GR
AVITY
MAI
NSC
AR
DIF
F G
RA
VIT
Y C
OL
LE
CT
OR
SE
WE
R (
CS
D)
CA
RD
IFF
RE
LIE
F C
OL
LE
CT
OR
SE
WE
R (
CS
D)
CA
RD
IFF
CO
LL
EC
TO
R S
EW
ER
(C
SD
)O
LIV
EN
HA
IN C
OL
LE
CT
OR
SE
WE
R (
CS
D)
EN
CIN
ITA
S C
OL
LE
CT
OR
SE
WE
R (
ES
D)
RS
FC
SD
GR
AV
ITY
MA
INS
EX
IST
ING
FO
RC
E M
AIN
S
CITY
OF E
NCIN
ITAS
CA
RD
IFF
SA
NIT
AR
Y D
IVIS
ION
EN
CIN
ITA
S S
AN
ITA
RY
DIV
ISIO
NW
AT
ER
BO
DIE
SM
AJO
R R
OA
D
Cardi
ff and
Encin
itas
SEW
ER M
ASTE
R PLA
N UP
DATE
DUDE
KAp
ril 20
11
03,0
001,5
00Fee
tCA
RDIF
FPU
MP
STAT
ION
OLIV
ENHA
IN
PUM
P ST
ATIO
N
RANC
HO SA
NTA
FE
COM
MUNI
TY SE
RVIC
ES D
ISTR
ICT
LEUC
ADIA
W
ASTE
WAT
ER
DIST
RICT
CARD
IFF
SANI
TARY
DI
VISI
ON
ENCI
NITA
SSA
NITA
RY
DIVI
SION
CITY
OF
SOLA
NA B
EACH
5

THIS PAGE INTENTIONALLY LEFT BLANK
Cardiff and Encinitas DUDEK SEWER MASTER PLAN UPDATE 4-11 April 2011
It is noted that the manholes were inspected during the summer, when lagoon and groundwater levels are lowest. Much higher infiltration rates would be expected during the rainy season and periodic flooding of the adjacent lagoon and creek, when some manholes are submerged. Surcharge evidence was also noted at several manholes. Some examples of the surcharge evidence observed included debris located on steps or the bench, and/or water marks on the walls. Five (5) manholes were identified as showing evidence of surcharge.
4.3 PUMP STATION FIELD REVIEWS
Pump Station field reviews for the Cardiff, Coast, and Moonlight Beach Pump Stations were performed as part of this master plan. Physical site inspections were conducted with SEJPA operations staff the week of August 2nd, 2010 to document the physical condition and identify needed improvements, including operational/safety improvements as determined from SEJPA staff. The results of the field reviews are provided in Appendix D.

Cardiff and Encinitas DUDEK SEWER MASTER PLAN UPDATE 4-12 April 2011
INTENTIONALLY LEFT BLANK
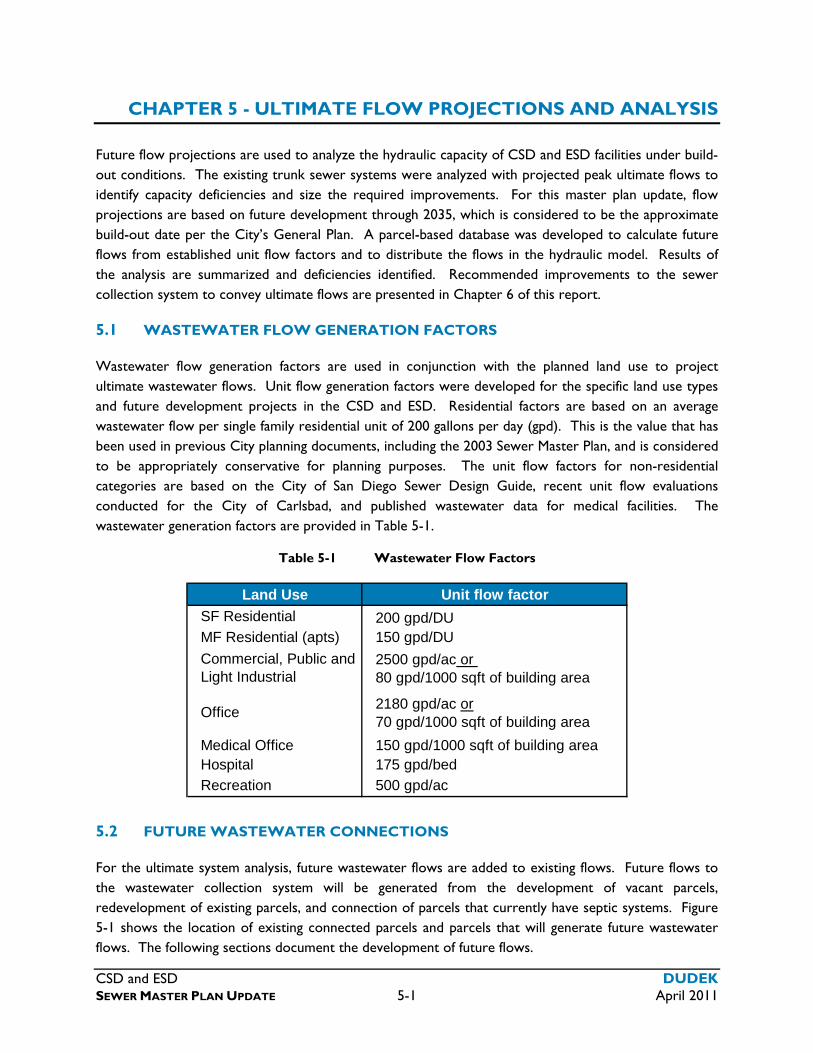
CSD and ESD DUDEK SEWER MASTER PLAN UPDATE 5-1 April 2011
CHAPTER 5 - ULTIMATE FLOW PROJECTIONS AND ANALYSIS
Future flow projections are used to analyze the hydraulic capacity of CSD and ESD facilities under build-out conditions. The existing trunk sewer systems were analyzed with projected peak ultimate flows to identify capacity deficiencies and size the required improvements. For this master plan update, flow projections are based on future development through 2035, which is considered to be the approximate build-out date per the City’s General Plan. A parcel-based database was developed to calculate future flows from established unit flow factors and to distribute the flows in the hydraulic model. Results of the analysis are summarized and deficiencies identified. Recommended improvements to the sewer collection system to convey ultimate flows are presented in Chapter 6 of this report.
5.1 WASTEWATER FLOW GENERATION FACTORS
Wastewater flow generation factors are used in conjunction with the planned land use to project ultimate wastewater flows. Unit flow generation factors were developed for the specific land use types and future development projects in the CSD and ESD. Residential factors are based on an average wastewater flow per single family residential unit of 200 gallons per day (gpd). This is the value that has been used in previous City planning documents, including the 2003 Sewer Master Plan, and is considered to be appropriately conservative for planning purposes. The unit flow factors for non-residential categories are based on the City of San Diego Sewer Design Guide, recent unit flow evaluations conducted for the City of Carlsbad, and published wastewater data for medical facilities. The wastewater generation factors are provided in Table 5-1.
Table 5-1 Wastewater Flow Factors
Land Use Unit flow factor
SF Residential 200 gpd/DUMF Residential (apts) 150 gpd/DU
2500 gpd/ac or 80 gpd/1000 sqft of building area
2180 gpd/ac or70 gpd/1000 sqft of building area
Medical Office 150 gpd/1000 sqft of building areaHospital 175 gpd/bed
Recreation 500 gpd/ac
Commercial, Public and Light Industrial
Office
5.2 FUTURE WASTEWATER CONNECTIONS
For the ultimate system analysis, future wastewater flows are added to existing flows. Future flows to the wastewater collection system will be generated from the development of vacant parcels, redevelopment of existing parcels, and connection of parcels that currently have septic systems. Figure 5-1 shows the location of existing connected parcels and parcels that will generate future wastewater flows. The following sections document the development of future flows.

CSD and ESD DUDEK SEWER MASTER PLAN UPDATE 5-2 April 2011
INTENTIONALLY LEFT BLANK
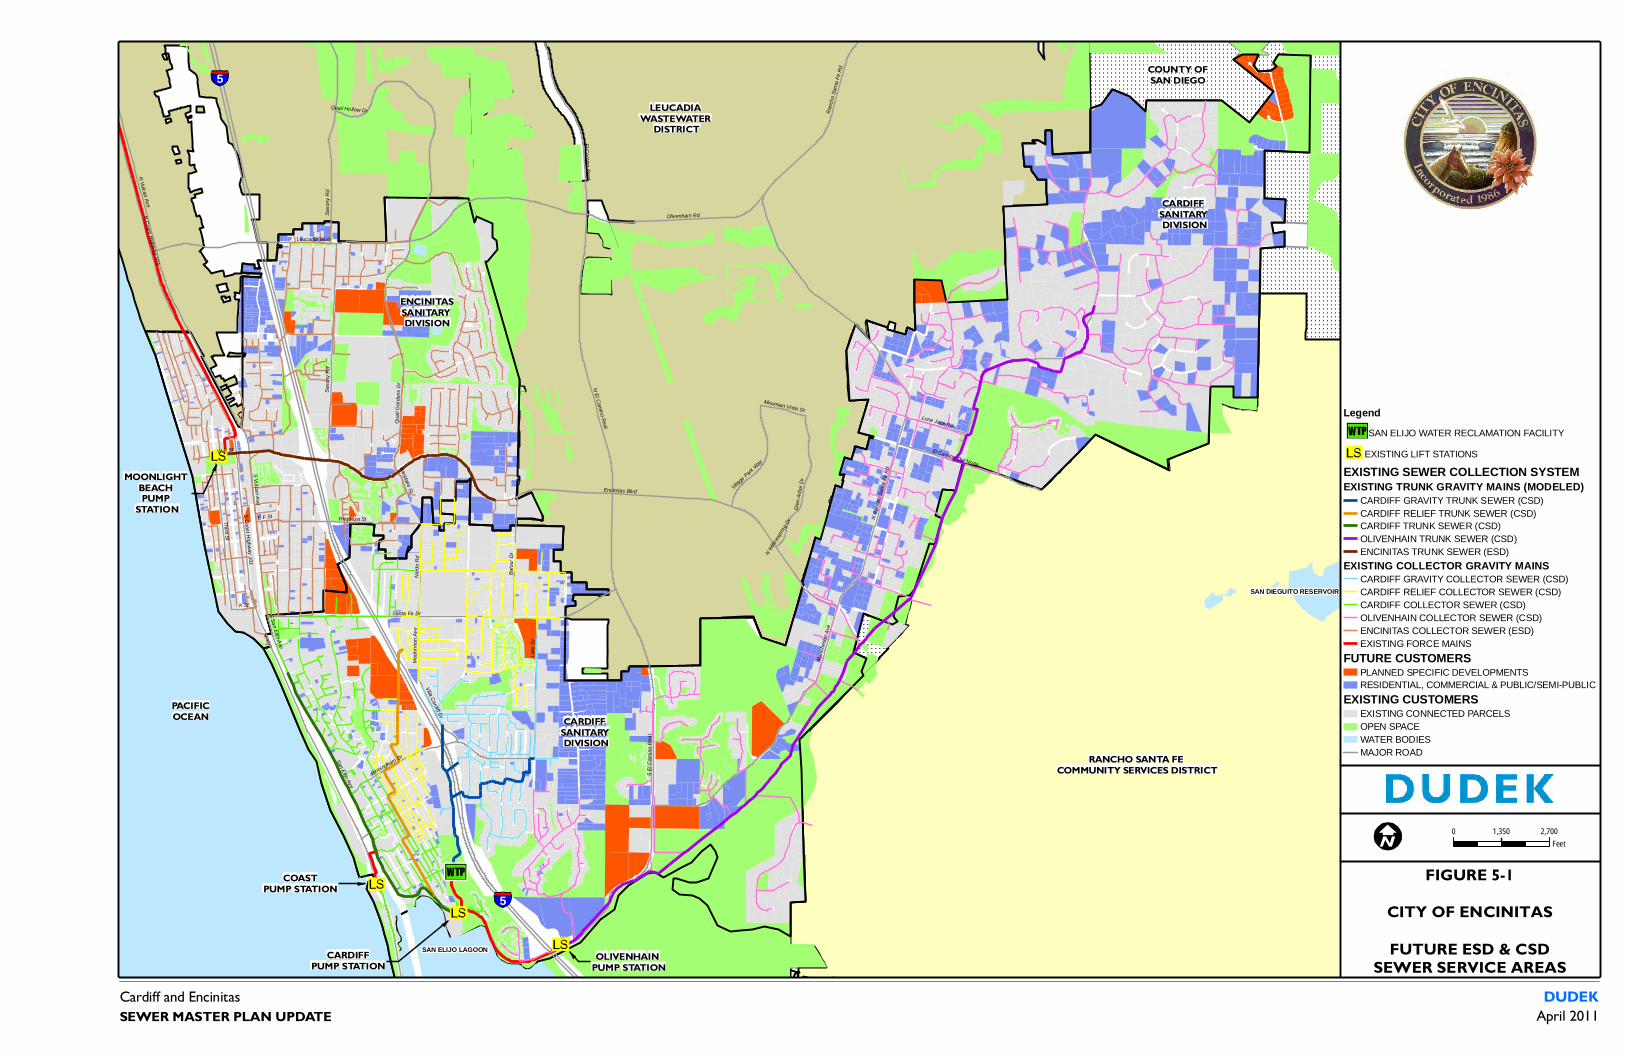
Encinitas Blvd
Manc
heste
r Ave
Leucadia Blvd
Santa Fe Dr
N Vulcan Ave
S Coast Highway 101
San Elijo Ave
Quail
Gard
ens D
r
Third St
Lone Jack Rd
Saxo
ny R
d
Lake
Dr
S El C
amino
Rea
l
N El Camino Real
N Coast Highway 101
N Ra
ncho
Santa
Fe R
d
Balou
r Dr
Olivenhain Rd
Birmingham Dr
S Vulcan Ave
Requeza St
Ranc
ho Sa
nta Fe
Rd
Nardo
Rd
El Camino Real
Glen
Arbo
r Dr
El Camino Del Norte
Village Park
Way
K St
Villa Cardiff Dr
Westlake St
Mack
innon
Ave
E F St
Quail Hollow Dr
W B St
Mountain Vista Dr
S San Elijo Ave
N Willo
wsprin
g Dr
Saxo
ny R
d
SAN ELIJO LAGOON
SAN DIEGUITO RESERVOIR
Cardiff and Encinitas
FIGURE 5-1CITY OF ENCINITAS
FUTURE ESD & CSDSEWER SERVICE AREAS
SEWER MASTER PLAN UPDATEDUDEK
April 2011
PACIFICOCEAN
LegendSAN ELIJO WATER RECLAMATION FACILITY
EXISTING LIFT STATIONS
EXISTING SEWER COLLECTION SYSTEMEXISTING TRUNK GRAVITY MAINS (MODELED)
CARDIFF GRAVITY TRUNK SEWER (CSD)CARDIFF RELIEF TRUNK SEWER (CSD)CARDIFF TRUNK SEWER (CSD)OLIVENHAIN TRUNK SEWER (CSD)ENCINITAS TRUNK SEWER (ESD)
EXISTING COLLECTOR GRAVITY MAINSCARDIFF GRAVITY COLLECTOR SEWER (CSD)CARDIFF RELIEF COLLECTOR SEWER (CSD)CARDIFF COLLECTOR SEWER (CSD)OLIVENHAIN COLLECTOR SEWER (CSD)ENCINITAS COLLECTOR SEWER (ESD)EXISTING FORCE MAINS
FUTURE CUSTOMERSPLANNED SPECIFIC DEVELOPMENTSRESIDENTIAL, COMMERCIAL & PUBLIC/SEMI-PUBLIC
EXISTING CUSTOMERSEXISTING CONNECTED PARCELSOPEN SPACEWATER BODIESMAJOR ROAD
COUNTY OFSAN DIEGO
5
5
0 2,7001,350Feet
RANCHO SANTA FE COMMUNITY SERVICES DISTRICT
CARDIFF SANITARY DIVISION
CARDIFF SANITARY DIVISION
ENCINITASSANITARY DIVISION
LEUCADIA WASTEWATER
DISTRICT
COASTPUMP STATION
CARDIFFPUMP STATION
OLIVENHAIN PUMP STATION
MOONLIGHT BEACH PUMP
STATION

INTENTIONALLY LEFT BLANK

CSD and ESD DUDEK SEWER MASTER PLAN UPDATE 5-5 April 2011
5.2.1 Specific Planned Developments
Several planned development projects are either in the planning stages, currently under construction, or have been recently constructed so that wastewater flows were not included in the sewer billing database. Future wastewater flows for these projects are projected based on the number of housing units and the building area for non-residential development. City Planning Department Staff provided specific development information, including layout plans for the proposed recreation center on the Hall Property and the Scripps Hospital Expansion, which included building areas and the number of future hospital beds. For the future expansion of Mira Costa College, the projected number of students was obtained from administration staff, and wastewater flows were increased from existing flows based on the ratio of future to existing students. The planned development projects within each sewer service area are listed below and shown on Figure 5-1. It is noted that most flows from the Scripps Hospital expansion will discharge south to the CSD, but a future medical office building on the north end of the site will discharge west through an onsite pump station to the ESD.
Planned Developments within the ESD
Bahlman Property – 72 single family homes
Quail Meadows – 33 single family homes
City property west of Quail Gardens Dr.
Greenhouses at Clark & Puebla – 6 single family homes
Seacrest Village II – 30 apartments
Pacific View school site – to be determined
Pacific Station – 47 MF + 50,000 sq. ft. commercial
Encinitas Corporate Center – 30,000 sq. ft. commercial
Scripps Hospital – 68,000 sq. ft.
Planned Developments within the CSD
Desert Rose – 16 single family homes
Pacific Canyon (Sage Canyon Dr. at El Camino Real) – 10 single family homes
Brown Property (off Lake) – 12 single family homes
North side of Requeza – 9 single family homes
Westlake/Requeza – 4 single family homes
Balour & Melba (existing greenhouses) – 18 single family homes
North Berryman Canyon – 4 single family homes
Techbilt Property (near Manchester preserve) – single family development
Stavep (northeast corner of OTS service area) – 32 single family homes
CSD and ESD DUDEK SEWER MASTER PLAN UPDATE 5-6 April 2011
Hall park – 15,000 sq. ft.
Scripps Hospital – 67,000 sq. ft. and 101 beds
Mira Costa College San Elijo campus – 43% increase in students
5.2.2 Build-Out of Vacant and Underdeveloped Parcels
Full build-out of vacant parcels is assumed per the General Plan Land Use at build-out. Vacant parcels within the existing CSD and ESD boundaries were first identified by intersecting the City’s GIS parcel map with parcels in the sewer billing database. Remaining parcels not in the sewer billing database were further reduced by subtracting out the specific planning projects identified above and open space, roads, and other non-developable areas per the GIS General Plan Land Use. Upon review of the remaining parcels and their land use with City Staff, numerous areas were identified that could never be developed, including areas in floodplains, common areas within existing developments, canyons, and designated open space areas that had incorrect land use designations. The undevelopable areas were subsequently removed from the developable parcel layer.
The future developable parcels have mostly rural residential and residential land use designations. The non-residential parcels have a commercial, light industrial, office, or public land use. The specific land use category for residential parcels identifies the range of dwelling units per acre. Future wastewater flows are calculated assuming the maximum number of units allowed on the parcel.
In addition to the build-out of vacant parcels, additional wastewater flows will be generated from existing parcels that are currently underdeveloped. Future development will include construction of small mixed-use projects to replace existing buildings in the downtown area, sub-divisions of residential parcels where permitted by zoning, and conversion of greenhouse properties to residential development. It is noted that only the Encinitas Ranch agricultural preserve areas have an agricultural land use in the General Plan. Most of the redevelopment from mixed-use development and residential lot splits is not expected to significantly increase wastewater flows, since new plumbing fixtures will generally be much more water efficient than existing fixtures. Furthermore, conservatism in the 200 gpd/EDU unit flow applied to future development should make up for the potential small flow increases in developed areas. Only future flows from development of existing agriculture and greenhouse properties are considered significant enough to evaluate separately in this master plan. Many parcels with existing commercial greenhouses have a house or other structure on the property, and therefore were included in the sewer billing database. Greenhouses were identified from aerial maps, and future wastewater flows were assigned to the parcel assuming development per the general plan land use.
5.2.3 Connection of Parcels with Septic Systems
All residential properties that currently have septic systems are assumed to be connected to the sewer system at build-out. In addition to the scattered older residences still on septic, there are several areas of contiguous parcels that will require the construction of small collector pipelines for sewer service. These areas are along Crest Drive in Cardiff, Ocean View Avenue in Leucadia, and at several locations in Olivenhain. Since residences on septic are not connected to the sewer billing database, they were
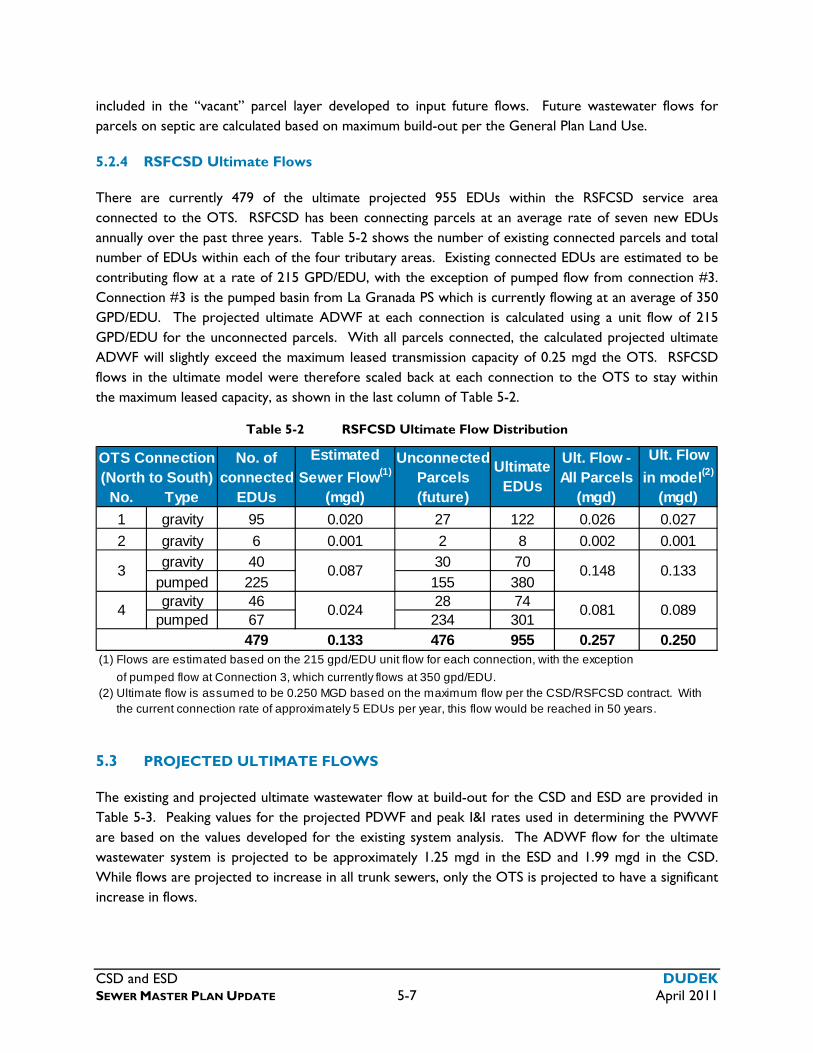
CSD and ESD DUDEK SEWER MASTER PLAN UPDATE 5-7 April 2011
included in the “vacant” parcel layer developed to input future flows. Future wastewater flows for parcels on septic are calculated based on maximum build-out per the General Plan Land Use.
5.2.4 RSFCSD Ultimate Flows
There are currently 479 of the ultimate projected 955 EDUs within the RSFCSD service area connected to the OTS. RSFCSD has been connecting parcels at an average rate of seven new EDUs annually over the past three years. Table 5-2 shows the number of existing connected parcels and total number of EDUs within each of the four tributary areas. Existing connected EDUs are estimated to be contributing flow at a rate of 215 GPD/EDU, with the exception of pumped flow from connection #3. Connection #3 is the pumped basin from La Granada PS which is currently flowing at an average of 350 GPD/EDU. The projected ultimate ADWF at each connection is calculated using a unit flow of 215 GPD/EDU for the unconnected parcels. With all parcels connected, the calculated projected ultimate ADWF will slightly exceed the maximum leased transmission capacity of 0.25 mgd the OTS. RSFCSD flows in the ultimate model were therefore scaled back at each connection to the OTS to stay within the maximum leased capacity, as shown in the last column of Table 5-2.
Table 5-2 RSFCSD Ultimate Flow Distribution
No. of Unconnectedconnected Parcels
No. Type EDUs (future)
1 gravity 95 0.020 27 122 0.026 0.027
2 gravity 6 0.001 2 8 0.002 0.001
gravity 40 30 70
pumped 225 155 380gravity 46 28 74
pumped 67 234 301479 0.133 476 955 0.257 0.250
(1) Flows are estimated based on the 215 gpd/EDU unit flow for each connection, with the exception
of pumped flow at Connection 3, which currently flows at 350 gpd/EDU.(2) Ultimate flow is assumed to be 0.250 MGD based on the maximum flow per the CSD/RSFCSD contract. With the current connection rate of approximately 5 EDUs per year, this flow would be reached in 50 years.
Ult. Flow - All Parcels
(mgd)
0.148
0.081
OTS Connection(North to South)
Ult. Flow
in model(2)
(mgd)
0.133
0.089
Ultimate EDUs
3
4
Estimated
Sewer Flow(1)
(mgd)
0.087
0.024
5.3 PROJECTED ULTIMATE FLOWS
The existing and projected ultimate wastewater flow at build-out for the CSD and ESD are provided in Table 5-3. Peaking values for the projected PDWF and peak I&I rates used in determining the PWWF are based on the values developed for the existing system analysis. The ADWF flow for the ultimate wastewater system is projected to be approximately 1.25 mgd in the ESD and 1.99 mgd in the CSD. While flows are projected to increase in all trunk sewers, only the OTS is projected to have a significant increase in flows.
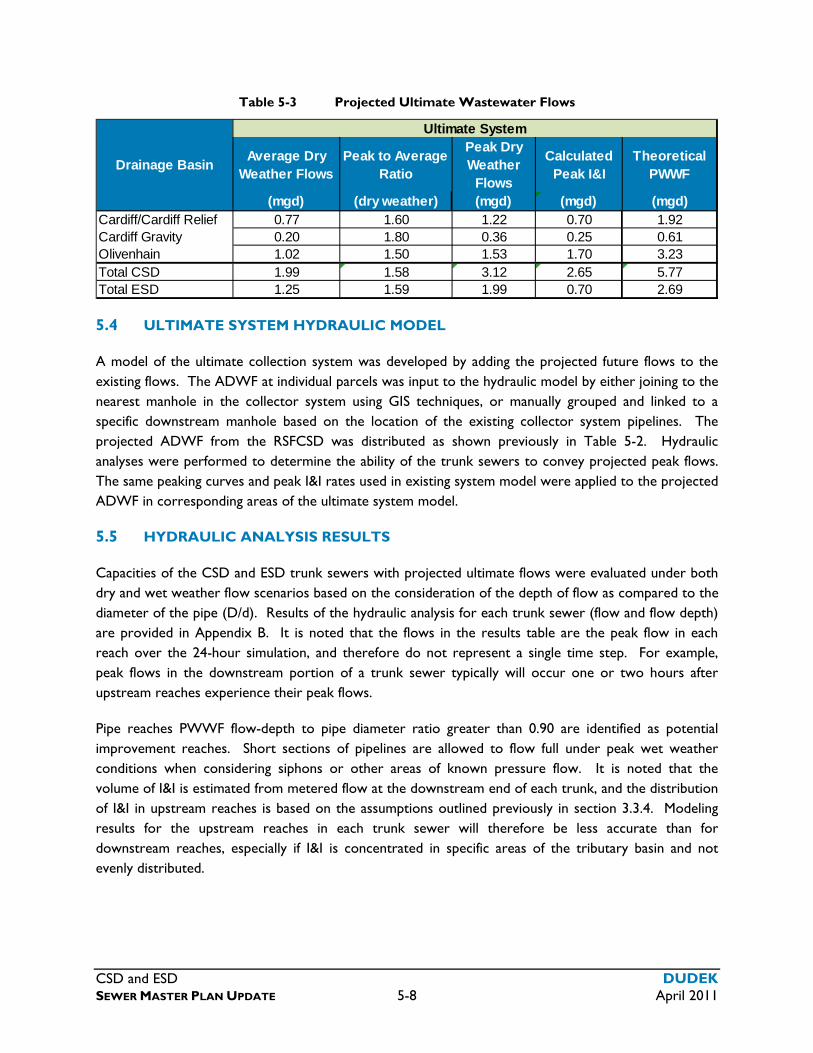
CSD and ESD DUDEK SEWER MASTER PLAN UPDATE 5-8 April 2011
Table 5-3 Projected Ultimate Wastewater Flows
Drainage BasinAverage Dry
Weather FlowsPeak to Average
Ratio
Peak Dry Weather
Flows
Calculated Peak I&I
Theoretical PWWF
(mgd) (dry weather) (mgd) (mgd) (mgd)Cardiff/Cardiff Relief 0.77 1.60 1.22 0.70 1.92Cardiff Gravity 0.20 1.80 0.36 0.25 0.61Olivenhain 1.02 1.50 1.53 1.70 3.23Total CSD 1.99 1.58 3.12 2.65 5.77Total ESD 1.25 1.59 1.99 0.70 2.69
Ultimate System
5.4 ULTIMATE SYSTEM HYDRAULIC MODEL
A model of the ultimate collection system was developed by adding the projected future flows to the existing flows. The ADWF at individual parcels was input to the hydraulic model by either joining to the nearest manhole in the collector system using GIS techniques, or manually grouped and linked to a specific downstream manhole based on the location of the existing collector system pipelines. The projected ADWF from the RSFCSD was distributed as shown previously in Table 5-2. Hydraulic analyses were performed to determine the ability of the trunk sewers to convey projected peak flows. The same peaking curves and peak I&I rates used in existing system model were applied to the projected ADWF in corresponding areas of the ultimate system model.
5.5 HYDRAULIC ANALYSIS RESULTS
Capacities of the CSD and ESD trunk sewers with projected ultimate flows were evaluated under both dry and wet weather flow scenarios based on the consideration of the depth of flow as compared to the diameter of the pipe (D/d). Results of the hydraulic analysis for each trunk sewer (flow and flow depth) are provided in Appendix B. It is noted that the flows in the results table are the peak flow in each reach over the 24-hour simulation, and therefore do not represent a single time step. For example, peak flows in the downstream portion of a trunk sewer typically will occur one or two hours after upstream reaches experience their peak flows.
Pipe reaches PWWF flow-depth to pipe diameter ratio greater than 0.90 are identified as potential improvement reaches. Short sections of pipelines are allowed to flow full under peak wet weather conditions when considering siphons or other areas of known pressure flow. It is noted that the volume of I&I is estimated from metered flow at the downstream end of each trunk, and the distribution of I&I in upstream reaches is based on the assumptions outlined previously in section 3.3.4. Modeling results for the upstream reaches in each trunk sewer will therefore be less accurate than for downstream reaches, especially if I&I is concentrated in specific areas of the tributary basin and not evenly distributed.
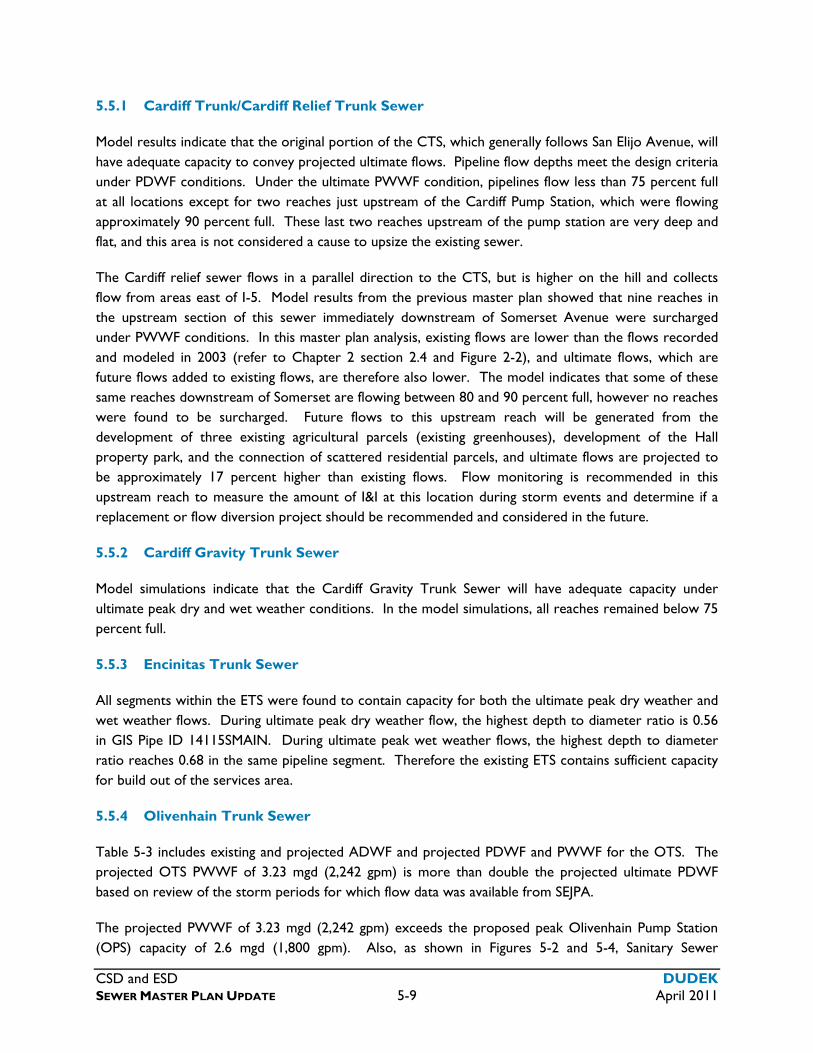
CSD and ESD DUDEK SEWER MASTER PLAN UPDATE 5-9 April 2011
5.5.1 Cardiff Trunk/Cardiff Relief Trunk Sewer
Model results indicate that the original portion of the CTS, which generally follows San Elijo Avenue, will have adequate capacity to convey projected ultimate flows. Pipeline flow depths meet the design criteria under PDWF conditions. Under the ultimate PWWF condition, pipelines flow less than 75 percent full at all locations except for two reaches just upstream of the Cardiff Pump Station, which were flowing approximately 90 percent full. These last two reaches upstream of the pump station are very deep and flat, and this area is not considered a cause to upsize the existing sewer.
The Cardiff relief sewer flows in a parallel direction to the CTS, but is higher on the hill and collects flow from areas east of I-5. Model results from the previous master plan showed that nine reaches in the upstream section of this sewer immediately downstream of Somerset Avenue were surcharged under PWWF conditions. In this master plan analysis, existing flows are lower than the flows recorded and modeled in 2003 (refer to Chapter 2 section 2.4 and Figure 2-2), and ultimate flows, which are future flows added to existing flows, are therefore also lower. The model indicates that some of these same reaches downstream of Somerset are flowing between 80 and 90 percent full, however no reaches were found to be surcharged. Future flows to this upstream reach will be generated from the development of three existing agricultural parcels (existing greenhouses), development of the Hall property park, and the connection of scattered residential parcels, and ultimate flows are projected to be approximately 17 percent higher than existing flows. Flow monitoring is recommended in this upstream reach to measure the amount of I&I at this location during storm events and determine if a replacement or flow diversion project should be recommended and considered in the future.
5.5.2 Cardiff Gravity Trunk Sewer
Model simulations indicate that the Cardiff Gravity Trunk Sewer will have adequate capacity under ultimate peak dry and wet weather conditions. In the model simulations, all reaches remained below 75 percent full.
5.5.3 Encinitas Trunk Sewer
All segments within the ETS were found to contain capacity for both the ultimate peak dry weather and wet weather flows. During ultimate peak dry weather flow, the highest depth to diameter ratio is 0.56 in GIS Pipe ID 14115SMAIN. During ultimate peak wet weather flows, the highest depth to diameter ratio reaches 0.68 in the same pipeline segment. Therefore the existing ETS contains sufficient capacity for build out of the services area.
5.5.4 Olivenhain Trunk Sewer
Table 5-3 includes existing and projected ADWF and projected PDWF and PWWF for the OTS. The projected OTS PWWF of 3.23 mgd (2,242 gpm) is more than double the projected ultimate PDWF based on review of the storm periods for which flow data was available from SEJPA.
The projected PWWF of 3.23 mgd (2,242 gpm) exceeds the proposed peak Olivenhain Pump Station (OPS) capacity of 2.6 mgd (1,800 gpm). Also, as shown in Figures 5-2 and 5-4, Sanitary Sewer
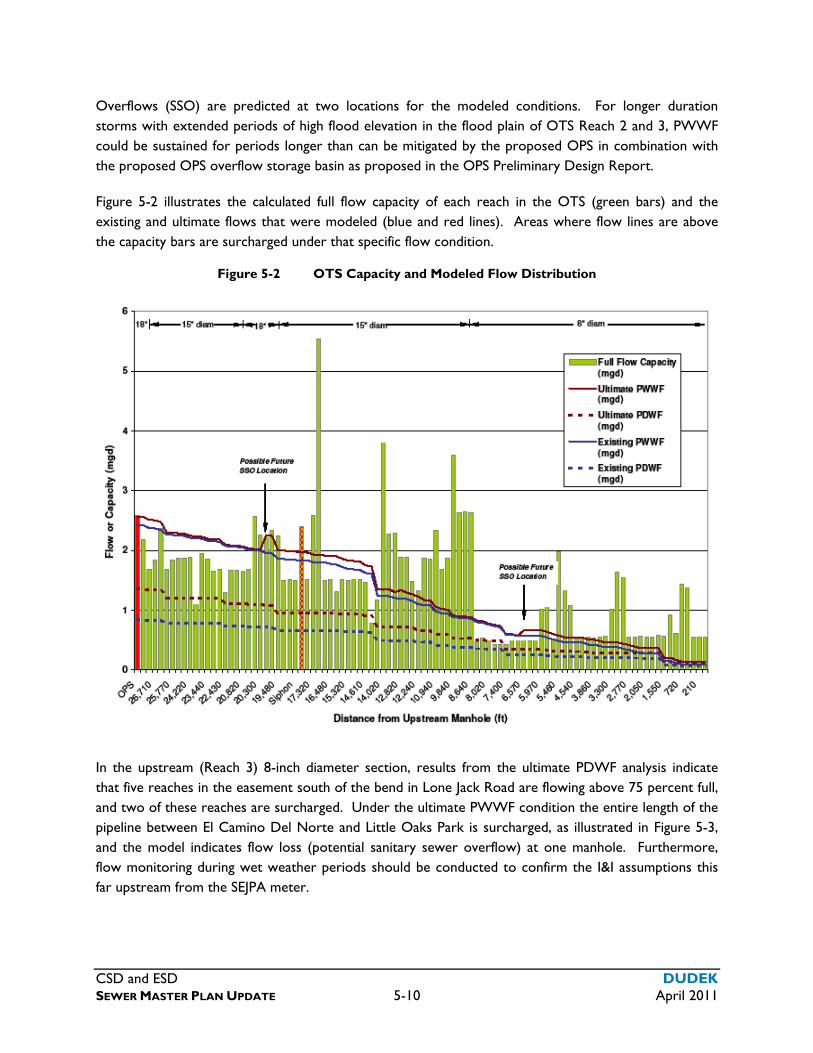
CSD and ESD DUDEK SEWER MASTER PLAN UPDATE 5-10 April 2011
Overflows (SSO) are predicted at two locations for the modeled conditions. For longer duration storms with extended periods of high flood elevation in the flood plain of OTS Reach 2 and 3, PWWF could be sustained for periods longer than can be mitigated by the proposed OPS in combination with the proposed OPS overflow storage basin as proposed in the OPS Preliminary Design Report.
Figure 5-2 illustrates the calculated full flow capacity of each reach in the OTS (green bars) and the existing and ultimate flows that were modeled (blue and red lines). Areas where flow lines are above the capacity bars are surcharged under that specific flow condition.
Figure 5-2 OTS Capacity and Modeled Flow Distribution
In the upstream (Reach 3) 8-inch diameter section, results from the ultimate PDWF analysis indicate that five reaches in the easement south of the bend in Lone Jack Road are flowing above 75 percent full, and two of these reaches are surcharged. Under the ultimate PWWF condition the entire length of the pipeline between El Camino Del Norte and Little Oaks Park is surcharged, as illustrated in Figure 5-3, and the model indicates flow loss (potential sanitary sewer overflow) at one manhole. Furthermore, flow monitoring during wet weather periods should be conducted to confirm the I&I assumptions this far upstream from the SEJPA meter.
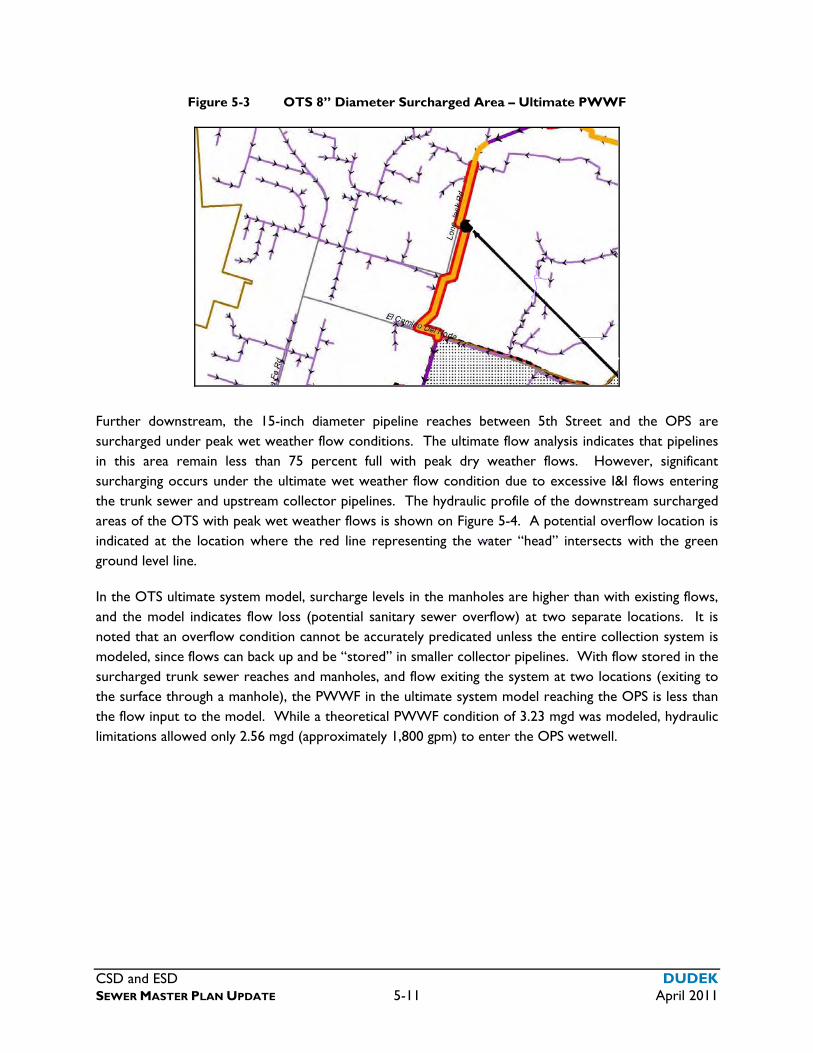
CSD and ESD DUDEK SEWER MASTER PLAN UPDATE 5-11 April 2011
Figure 5-3 OTS 8” Diameter Surcharged Area – Ultimate PWWF
Further downstream, the 15-inch diameter pipeline reaches between 5th Street and the OPS are surcharged under peak wet weather flow conditions. The ultimate flow analysis indicates that pipelines in this area remain less than 75 percent full with peak dry weather flows. However, significant surcharging occurs under the ultimate wet weather flow condition due to excessive I&I flows entering the trunk sewer and upstream collector pipelines. The hydraulic profile of the downstream surcharged areas of the OTS with peak wet weather flows is shown on Figure 5-4. A potential overflow location is indicated at the location where the red line representing the water “head” intersects with the green ground level line.
In the OTS ultimate system model, surcharge levels in the manholes are higher than with existing flows, and the model indicates flow loss (potential sanitary sewer overflow) at two separate locations. It is noted that an overflow condition cannot be accurately predicated unless the entire collection system is modeled, since flows can back up and be “stored” in smaller collector pipelines. With flow stored in the surcharged trunk sewer reaches and manholes, and flow exiting the system at two locations (exiting to the surface through a manhole), the PWWF in the ultimate system model reaching the OPS is less than the flow input to the model. While a theoretical PWWF condition of 3.23 mgd was modeled, hydraulic limitations allowed only 2.56 mgd (approximately 1,800 gpm) to enter the OPS wetwell.
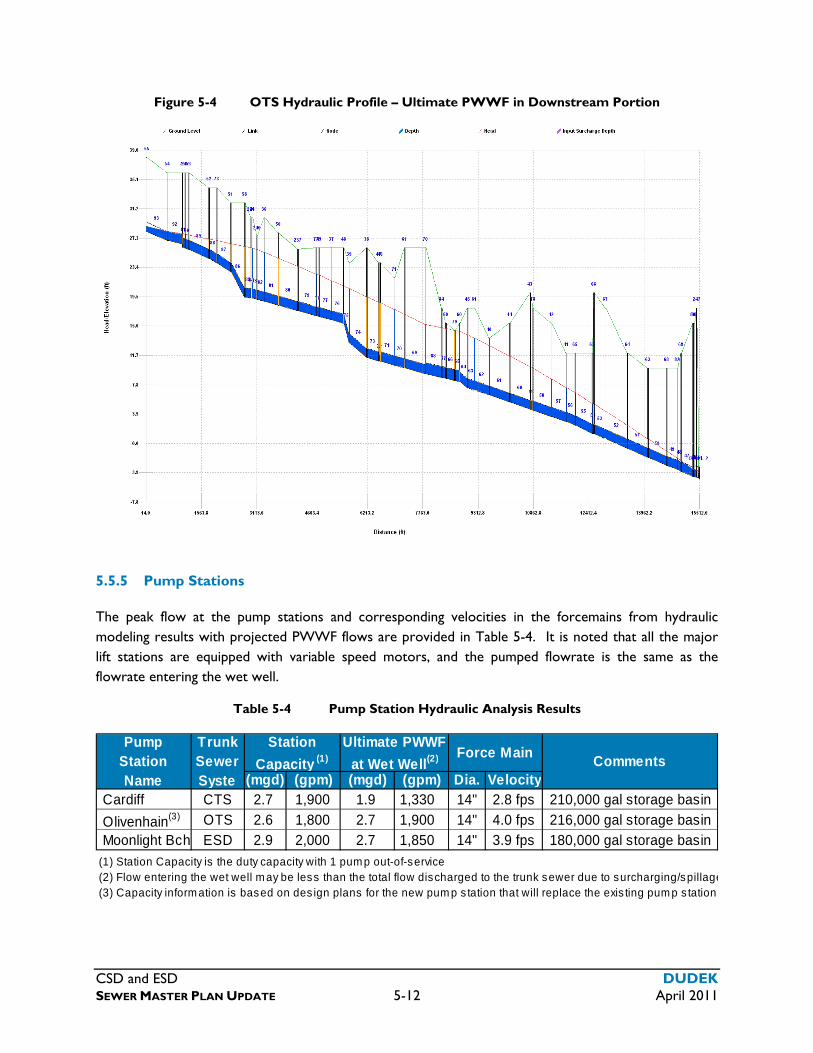
CSD and ESD DUDEK SEWER MASTER PLAN UPDATE 5-12 April 2011
Figure 5-4 OTS Hydraulic Profile – Ultimate PWWF in Downstream Portion
5.5.5 Pump Stations
The peak flow at the pump stations and corresponding velocities in the forcemains from hydraulic modeling results with projected PWWF flows are provided in Table 5-4. It is noted that all the major lift stations are equipped with variable speed motors, and the pumped flowrate is the same as the flowrate entering the wet well.
Table 5-4 Pump Station Hydraulic Analysis Results
(mgd) (gpm) (mgd) (gpm) Dia. Velocity Cardiff CTS 2.7 1,900 1.9 1,330 14" 2.8 fps 210,000 gal storage basin
Olivenhain(3) OTS 2.6 1,800 2.7 1,900 14" 4.0 fps 216,000 gal storage basin
Moonlight Bch ESD 2.9 2,000 2.7 1,850 14" 3.9 fps 180,000 gal storage basin
(1) Station Capacity is the duty capacity with 1 pum p out-of-service(2) Flow entering the wet well m ay be less than the total flow discharged to the trunk sewer due to surcharging/spillage(3) Capacity inform ation is based on des ign plans for the new pum p s tation that will replace the exis ting pum p s tation
CommentsTrunk Sewer Syste
Ultimate PWWF
at Wet Well(2)
Pump Station Name
Station
Capacity (1) Force Main
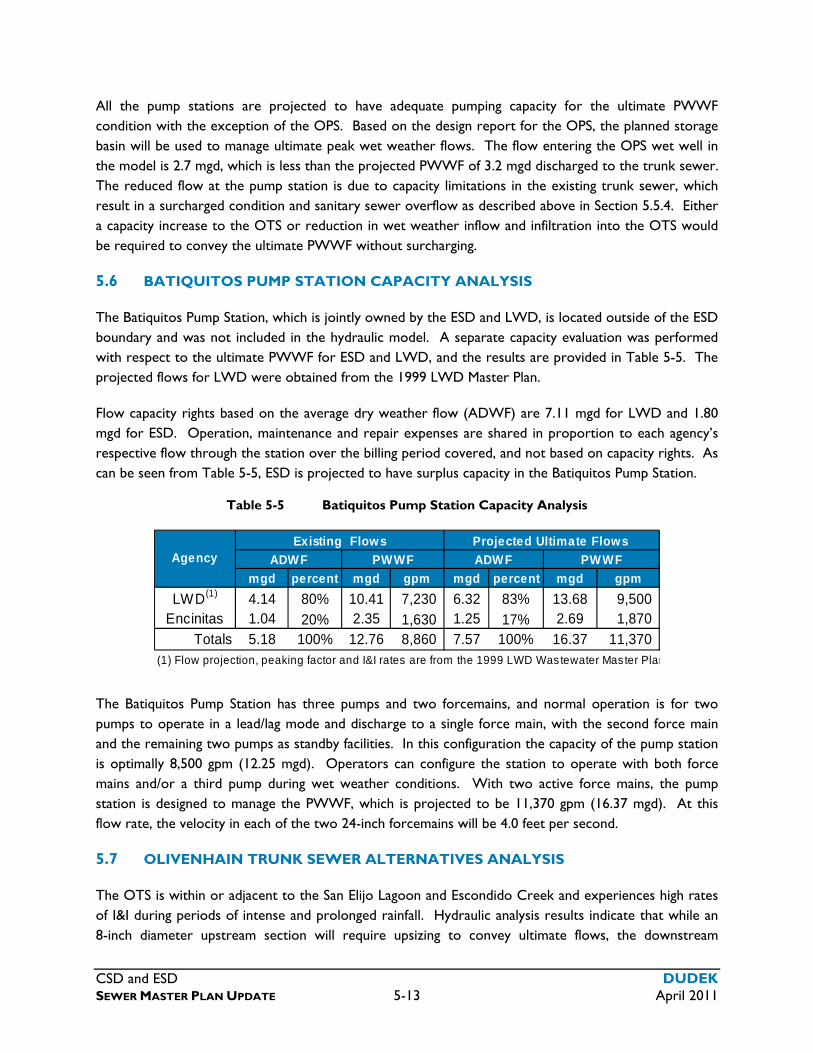
CSD and ESD DUDEK SEWER MASTER PLAN UPDATE 5-13 April 2011
All the pump stations are projected to have adequate pumping capacity for the ultimate PWWF condition with the exception of the OPS. Based on the design report for the OPS, the planned storage basin will be used to manage ultimate peak wet weather flows. The flow entering the OPS wet well in the model is 2.7 mgd, which is less than the projected PWWF of 3.2 mgd discharged to the trunk sewer. The reduced flow at the pump station is due to capacity limitations in the existing trunk sewer, which result in a surcharged condition and sanitary sewer overflow as described above in Section 5.5.4. Either a capacity increase to the OTS or reduction in wet weather inflow and infiltration into the OTS would be required to convey the ultimate PWWF without surcharging.
5.6 BATIQUITOS PUMP STATION CAPACITY ANALYSIS
The Batiquitos Pump Station, which is jointly owned by the ESD and LWD, is located outside of the ESD boundary and was not included in the hydraulic model. A separate capacity evaluation was performed with respect to the ultimate PWWF for ESD and LWD, and the results are provided in Table 5-5. The projected flows for LWD were obtained from the 1999 LWD Master Plan.
Flow capacity rights based on the average dry weather flow (ADWF) are 7.11 mgd for LWD and 1.80 mgd for ESD. Operation, maintenance and repair expenses are shared in proportion to each agency’s respective flow through the station over the billing period covered, and not based on capacity rights. As can be seen from Table 5-5, ESD is projected to have surplus capacity in the Batiquitos Pump Station.
Table 5-5 Batiquitos Pump Station Capacity Analysis
mgd percent mgd gpm mgd percent mgd gpm
LWD(1) 4.14 80% 10.41 7,230 6.32 83% 13.68 9,500 Encinitas 1.04 20% 2.35 1,630 1.25 17% 2.69 1,870
Totals 5.18 100% 12.76 8,860 7.57 100% 16.37 11,370 (1) Flow projection, peaking factor and I&I rates are from the 1999 LWD Wastewater Master Plan
Existing Flows Projected Ultimate Flows
ADWFAgency PWWF PWWFADWF
The Batiquitos Pump Station has three pumps and two forcemains, and normal operation is for two pumps to operate in a lead/lag mode and discharge to a single force main, with the second force main and the remaining two pumps as standby facilities. In this configuration the capacity of the pump station is optimally 8,500 gpm (12.25 mgd). Operators can configure the station to operate with both force mains and/or a third pump during wet weather conditions. With two active force mains, the pump station is designed to manage the PWWF, which is projected to be 11,370 gpm (16.37 mgd). At this flow rate, the velocity in each of the two 24-inch forcemains will be 4.0 feet per second.
5.7 OLIVENHAIN TRUNK SEWER ALTERNATIVES ANALYSIS
The OTS is within or adjacent to the San Elijo Lagoon and Escondido Creek and experiences high rates of I&I during periods of intense and prolonged rainfall. Hydraulic analysis results indicate that while an 8-inch diameter upstream section will require upsizing to convey ultimate flows, the downstream
CSD and ESD DUDEK SEWER MASTER PLAN UPDATE 5-14 April 2011
15-inch diameter reaches are adequately sized for projected ultimate dry weather flows. It is only under the PWWF condition that most of the 15-inch diameter reaches become surcharged. A surcharged condition can be detected from flow meter data, and a review of selected days from past rainfall events confirm that surcharged conditions occurred in the lower reaches of the OTS on at least one day during the rainy seasons of 1997-98, 2004-05, 2009-10 and 2010-11. Portions of the 15-inch diameter reaches have been relined, and City Staff report that the remaining pipeline sections are in good condition. The most probable sources of I&I are from manholes in the lagoon easement and collection systems in upstream areas prone to flooding.
Previous master planning efforts recommended replacing most of the OTS 15-inch diameter reaches with 18-inch or 21-inch diameter pipelines. There are major environmental constraints associated with working within the lagoon easement, and there is limited access to and along the longitudinal easement. As a part of this Master Plan, several alternatives to upsizing the OTS pipelines were proposed and discussed with City Staff, and three alternatives were identified for further evaluation. Exhibits for each of the OTS alternatives are provided in Appendix E and summarized briefly below.
Alternative 1 is a plan for rehabilitation of the OTS in conjunction with an aggressive I&I reduction program. The City must be prepared to rigorously pursue elimination of I&I and be prepared to make significant future system improvements to increase capacity to accommodate any I&I not eliminated and still threatening hydraulic surcharge and Sanitary Sewer Overflow. Alternative 1 includes the rehabilitation or replacement of 57 manholes. Additional future phases of work similar to the requirements of Alternative 4 would be required, if I&I reduction was insufficient to reduce actual PWWF to a level less than the safe peak capacity of the OTS and OPS. The Alternative 1 approach is recommended in this Master Plan
Alternative 2 proposes a new pump station at Rancho Santa Fe Road to divert upstream OTS flows to a new parallel gravity sewer in Manchester Avenue. The new gravity sewer would flow back to the OTS at El Camino Real, near the location where the trunk sewer leaves the lagoon easement and is aligned in Manchester Avenue. The OTS in Manchester Avenue would also be replaced with a larger capacity pipeline. With this alternative, a portion of the existing 15-inch diameter OTS sewer in the lagoon easement downstream of the new pump station can be abandoned. Reaches in the lagoon further south must remain to convey RSFCSD flows, and it is proposed to reline this section with a smaller diameter pipe. As part of Alternative 2, the 31 remaining manholes in the lagoon are proposed to be replaced.
Alternative 3 proposes two new pump stations to divert a portion of CSD flows away from the OTS. The upstream pump station is proposed at Lone Jack Road and El Camino Del Norte. The 8-inch diameter pipeline in Lone Jack Road would be upsized and supply the pump station, while the 8-inch diameter pipeline in an easement south of Lone Jack Road would be abandoned. The pump station is proposed to discharge to a new gravity main in Rancho Santa Fe Road and Manchester Avenue. A second pump station is required near Colony Terrace to lift flows over a high elevation in Manchester Avenue. Further downstream, the OTS 15-inch diameter pipeline in Manchester Avenue is proposed to be replaced with a larger capacity pipeline, and 54 manholes in the lagoon are proposed to be replaced.
CSD and ESD DUDEK SEWER MASTER PLAN UPDATE 5-15 April 2011
A hydraulic model was developed for each of the alternatives and a hydraulic analysis performed with peak wet weather flows. New pump stations, forcemains, and gravity pipelines were sized with the model to meet design criteria, and preliminary planning level cost estimates were prepared for each alternative. The three alternatives were presented and discussed with City Staff at a project review meeting, and a decision was made to pursue Alternative 1. The specific improvement projects and associated cost estimates for Alternative 1 are included in the list of proposed capital improvement projects in Chapter 6. A written approach to implement Alternative 1 is included in Appendix E.
5.8 TREATMENT CAPACITY ASSESSMENTS
5.8.1 Encina WPCF
Flows generated within the ESD are treated at the regional Encina WPCF and are monitored on a continual basis by the EWA. Flows are reported monthly to the six EWA member agencies as a continual check that each agency is within its contracted treatment capacity. Per the Revised Basic Agreement for Ownership, Operation and Maintenance of a Joint Sewer System (Basic Agreement), the Encina WPCF has a treatment capacity of 38 mgd and ESD has capacity rights of 1.80 mgd based on the ADWF. The Basic Agreement also states that the wet weather peaking factors on the ADWF are to remain below 2.76 mgd, and each member agency is to maintain a reserve capacity of up to 5 percent of their total capacity, which for the ESD is 0.09 mgd. The projected ESD ultimate ADWF is 1.25 mgd, which results in a reserve capacity of 0.55 mgd or 31 percent. The projected ultimate PWWF is 2.69 mgd, which equates to a peaking factor of 2.15 based on the projected ADWF, and 1.49 based on capacity rights. It is therefore projected that the ESD will have excess capacity at the Encina WPCF at build-out conditions.
5.8.2 SEWRF
Flows generated within the CSD are treated at the SEWRF and are monitored along with flows from the City of Solana Beach on a continual basis. The rated plant capacity of the SEWRF is currently 5.25 mgd based on the average daily flow, and the ADWF allocation for the City of Encinitas is 2.5 mgd. The ultimate ADWF from the CSD is projected to be 1.99 mgd, which is within the current capacity allocation.
Peak flows entering the SEWRF during storm events can exceed the rated plant capacity. The SEWRF has a flow equalization basin which, according to the treatment process hydraulic profile, allows a maximum day flow rate of 7.35 mgd through the plant. This is 1.4 times the rated ADWF capacity. Additionally, flow can be stored in unused aeration basins. Capacity allocations for flow to the SEWRF from the City of Encinitas and City of Solana Beach are based on average daily flows, and there are no contractual limitations on peak flows.
The SEJPA shares ownership in the 30-inch and 48-inch diameter ocean outfall with the City of Escondido. The allocation of the outfall capacity to SEJPA is 21 percent, split 50-50 between the Cities of Encinitas and Solana Beach, and 79 percent to Escondido. Based on the design outfall capacity of 25.5 mgd, SEJPA has capacity rights of 5.35 mgd, and Encinitas has rights to 2.68 mgd. It is noted that the
CSD and ESD DUDEK SEWER MASTER PLAN UPDATE 5-16 April 2011
maximum flow rate through the SEWRF exceeds the allocated capacity for treated effluent in the outfall. However, operators can divert a portion of the flow to empty aeration basins to control and limit flows to the outfall during storm events.
CSD and ESD DUDEK
SEWER MASTER PLAN UPDATE 6-1 April 2011
CHAPTER 6 - RECOMMENDATIONS
Wastewater flows generated within the ESD and CSD service areas are projected to increase by approximately 20 percent and 31 percent, respectively, over existing flows at build-out conditions. The projected increase includes future flow from new developments, connections to the sewer system by parcels currently served from septic systems, redevelopment areas, and flow from additional connections in RSFCSD within the limits of the existing agreement. This chapter summarizes recommended improvements to the existing sewer system required to adequately convey the projected ultimate wastewater volumes and rehabilitation projects determined from the CCTV, manhole, and pump station investigations summarized in the previous chapter. In addition, joint agency agreements and capacity agreements with the Encina WPCF and SEWRF are also summarized relative to build-out conditions. Several operations and maintenance projects originally identified within the 2003 Master Plan were also carried over into the CIP listing. A list of recommended Capital Improvement Projects is provided at the end of this chapter with an opinion of the probable project cost for each recommended project.
6.1 PIPELINE IMPROVEMENTS
The following projects include either improvement to increase system capacity or address rehabilitation needs. Capacity related projects were derived through hydraulic modeling and discussed in Chapter 5. Rehabilitation projects were identified based on inspection of the pipeline as discussed in Chapter 4.
2nd Street Sewer Relocation: The evaluation of the existing pipeline in the alley between Second and Third Street in the downtown area showed significant deficiencies, buildup of debris and grease, and portions of sags in the pipeline as discussed in section 4.1.1. Relocation of the existing pipeline to 2nd Street is recommended. Cast iron pipe near the Moonlight Pump Station should be replaced as soon as possible. Trenchless construction is potentially necessary for a significant portion between C Street and F Street.
Lone Jack Road: The existing 8-inch diameter pipeline along Lone Jack Road between El Camino Del Norte and Santa Fe Vista Court is recommended to be upsized to a 12-inch diameter pipeline due to localized surcharging.
Somerset/Cardiff Relief Sewer: Flow monitoring is ongoing by the City to evaluate the necessity for upsizing of this pipeline. Originally shown as exceeding capacity in the 2003 master plan, sewer flows have decreased and the pipeline no longer indicates the need for upsizing. In the event that sewer flows do increase, cost for replacement is included within the recommended CIP budget for installation of 2,400 LF of 12” diameter relief sewer to spread the excess flow.
6.2 PIPELINE REHABILITATION
ESD Clark Avenue sewer rehabilitation: The condition of the existing pipe warrants rehabilitation due to cracks, sags, and the buildup of heavy debris and sediment deposits. Rehabilitation needs include heavy cleaning, point repairs, lining, and replacement of cast-iron pipe.
CSD and ESD DUDEK
SEWER MASTER PLAN UPDATE 6-2 April 2011
Olivenhain Trunk Sewer: The recommended approach to address inefficient ultimate wet weather flow capacity within the OTS begins with an aggressive inflow and infiltration reduction effort and replacement of existing manholes within the low lying reaches along the Escondido Creek. The project includes preparation of access easement documentation and clearing along the alignment for facilitating both the improvements and long term maintenance of the OTS. Improvements include rehabilitation or replacement of 57 manholes and removal of the 10-inch diameter inverted siphon. A detailed description of the OTS Alternative 1 implementation plan in included in Appendix E.
In conjunction with the manhole rehabilitation, an aggressive flow monitoring program is recommended to further identify sources of existing inflow and infiltration with the OTS drainage basin. The cost implement of a phased approach focusing on I&I reduction is significantly less expensive that upsizing the entire OTS as proposed in previous master plans. As the effectiveness of the I&I reduction effort cannot be guaranteed to alleviate the ultimate capacity deficiency during wet weather flows, it is recommended to retain the long term Phase 2 project of ultimately upsizing the OTS. Therefore a Phase 2 project has been included in the recommended CIP table to address the potential for pipeline upsizing in the future.
Sewer Collection System Rehabilitation – The 2003 Master Plan recommended the development of a sewer collection system rehabilitation program based on a limited condition assessment of both the ESD and CSD systems. The recommended annual contribution into the programs for the ESD and CSD was $455,000 and $445,000 respectively. Since then, the City has conducted CCTV review of the entire collection system and made necessary emergency point repairs when discovered. Based on discussions with City staff, the need to continue contribution to the program at the same rate was determined not to be necessary. As some rehabilitation will be necessary indefinitely, the City has identified a value of $100,000 annually is appropriate for both the ESD and CSD to fund future point repairs and small rehabilitation projects.
6.2.1 Pump Station Improvements
Dudek conducted a field visit to the Moonlight, Coast and Cardiff pump stations to consolidate a summary of operational and potential safety improvements. The field notes for each visit are located in Appendix C. The following items list the general summary of facility improvements. Performance analysis of the pumps and planning analysis for future pump capacity or storage requirements were not addressed as part of the evaluation. The Olivenhain Pump Station replacement is currently initiating construction.
Moonlight Pump Station Improvements: Various minor improvements to the lift station structure were identified during a field visit with operations staff. The improvements generally address repairs, operation and functionality of the building and various internal and external equipment. The pump station underwent a major renovation in 2006, including installation of new pumps, grinders and upgrades to the auxiliary generators. An evaluation of the performance of the station is recommended to be conducted on a regular basis by the City.
Coast Pump Station Improvements: Based on the site visit to the station, there were several alternatives discussed to improve the reliability and longevity of the station. Although the wet well was not drained for inspection of the interior, it is estimated that much of the concrete
CSD and ESD DUDEK
SEWER MASTER PLAN UPDATE 6-3 April 2011
coating has failed and that corrosion of ferrous metals and deterioration of the concrete walls within the wet well has occurred. Complete replacement of the station is recommended.
Cardiff Pump Station Improvements: The Cardiff Pump Station has been in operation for approximately 40 years. Several operational improvements were identified during the site visit. The influent bar screen is currently cleaned manually. A channel grinder would help reduce pump clogging and allow removal of the bar screen, although hydraulic feasibility has not been determined and may adversely affect the influent sewer. A bypass suction pipe plumbed to allow more convenient locating of the suction trailer pump was identified as a means of improving efficiency during bypassing. A thorough evaluation of the Cardiff Pump Station, addressing electrical, structural, and mechanical aspects of the station is included as Appendix F to this report.
6.3 SEWER PROGRAMS
The following sewer programs are recommended addressing near term flow monitoring data collection and long term system master planning. Master Planning is included for both ESD and CSD, and is recommended to be updated concurrently in approximately 10 years.
Master Plan Update – Anticipated to be updated in 10 years at a combined cost of $200,000, shared between the two Divisions.
OTS Permanent Surcharge Monitoring – Implementation of a surcharge monitoring program along the OTS utilizing low cost equipment such as Smart Covers by Hadronex to detect surcharging occurring with the system. Monitors can be operated and relocated by operations staff. Sever (7) surcharge monitors are recommended.
OTS Flow Monitoring Program: Alternative 1 – Flow monitoring is recommended for the OTS to identify areas of inflow and/or infiltration. Several options are feasible for conducting the monitoring program. The recommended approach for capturing and identifying trouble areas is a single implementation of flow meters within a dispersion of approximately 10,000 linear feet between meters. Based on the OTS basin, a total of approximately 10-14 meters will be deployed for a period of up to two months during the winter season to capture a relatively strong rain event. By capturing the effects of a single event across an entire drainage basin, the short term and long term inflow and infiltration impacts can be evaluated, providing the CSD with the information necessary to focus effort in the areas contributing the highest volume to I&I. Focused effort following flow metering would include CCTV and smoke testing.
OTS Flow Monitoring Program: Alternative 2 – As an alternative to the single focused effort, a two phase approach can be implemented. The following information describes a two phase monitoring program:
Phase 1:
Phase 1 of the flow monitoring program includes installation of two flow monitoring devices for two months. The two flow meters will divide the upstream area of the OTS into two sewer basins. The flow meters will be installed at the following locations:
FM1 - In 8 inch OTS in Lone Jack Rd between Wildflower Valley Dr and Bella Collina
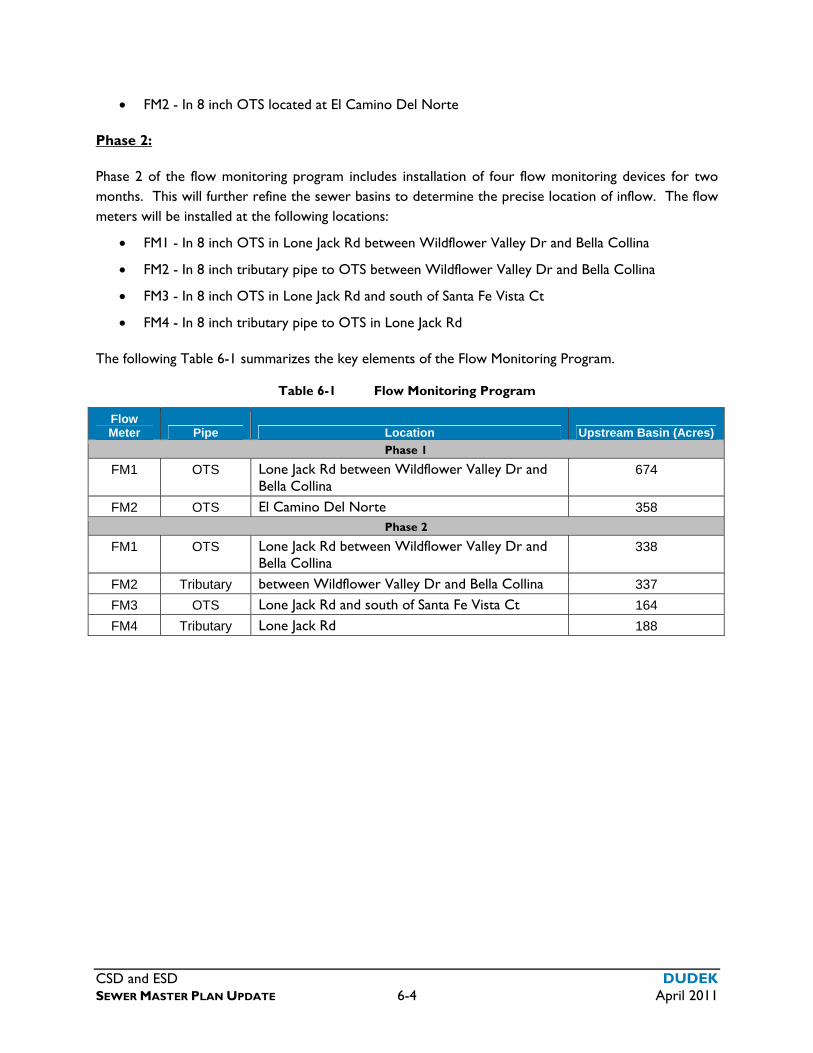
CSD and ESD DUDEK
SEWER MASTER PLAN UPDATE 6-4 April 2011
FM2 - In 8 inch OTS located at El Camino Del Norte
Phase 2:
Phase 2 of the flow monitoring program includes installation of four flow monitoring devices for two months. This will further refine the sewer basins to determine the precise location of inflow. The flow meters will be installed at the following locations:
FM1 - In 8 inch OTS in Lone Jack Rd between Wildflower Valley Dr and Bella Collina
FM2 - In 8 inch tributary pipe to OTS between Wildflower Valley Dr and Bella Collina
FM3 - In 8 inch OTS in Lone Jack Rd and south of Santa Fe Vista Ct
FM4 - In 8 inch tributary pipe to OTS in Lone Jack Rd
The following Table 6-1 summarizes the key elements of the Flow Monitoring Program.
Table 6-1 Flow Monitoring Program
Flow Meter Pipe Location Upstream Basin (Acres)
Phase 1
FM1 OTS Lone Jack Rd between Wildflower Valley Dr and Bella Collina
674
FM2 OTS El Camino Del Norte 358
Phase 2
FM1 OTS Lone Jack Rd between Wildflower Valley Dr and Bella Collina
338
FM2 Tributary between Wildflower Valley Dr and Bella Collina 337
FM3 OTS Lone Jack Rd and south of Santa Fe Vista Ct 164
FM4 Tributary Lone Jack Rd 188
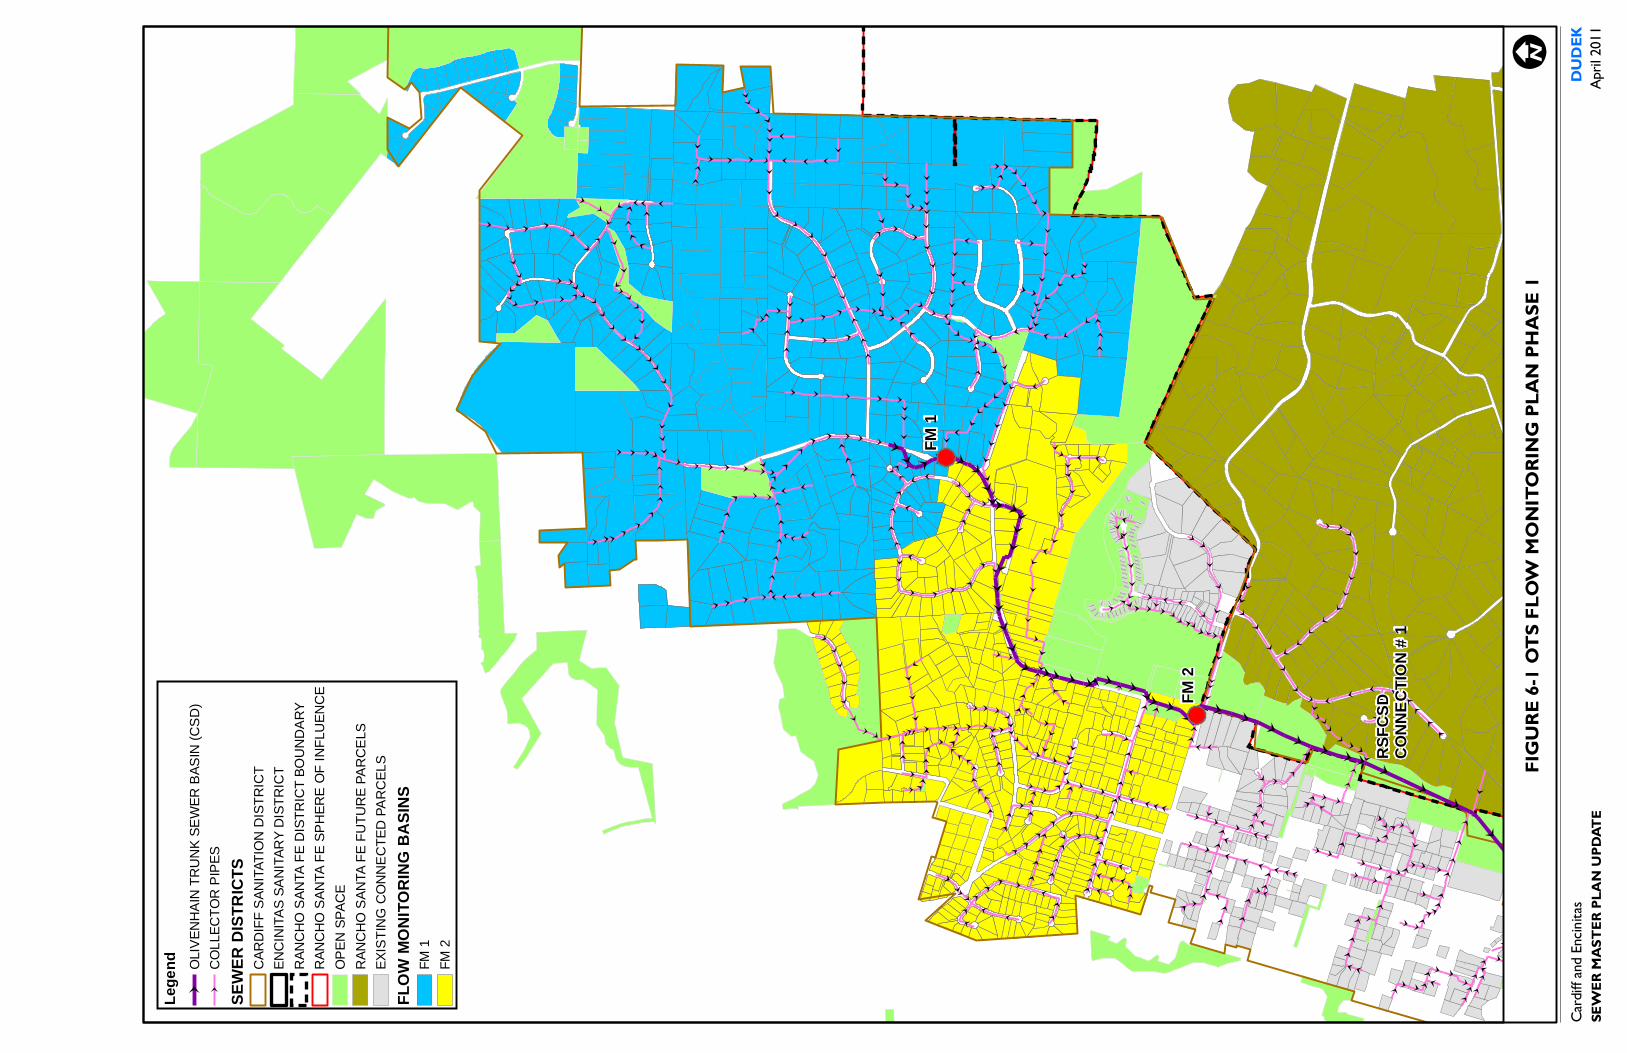
FIGUR
E 6-1
OTS F
LOW
MON
ITOR
ING
PLAN
PHAS
E 1
Lege
nd OLI
VE
NH
AIN
TR
UN
K S
EW
ER
BA
SIN
(C
SD
)
CO
LLE
CT
OR
PIP
ES
SEWE
R DI
STRI
CTS
CA
RD
IFF
SA
NIT
AT
ION
DIS
TR
ICT
EN
CIN
ITA
S S
AN
ITA
RY
DIS
TR
ICT
RA
NC
HO
SA
NTA
FE
DIS
TR
ICT
BO
UN
DA
RY
RA
NC
HO
SA
NTA
FE
SP
HE
RE
OF
IN
FLU
EN
CE
OP
EN
SP
AC
E
RA
NC
HO
SA
NTA
FE
FU
TU
RE
PA
RC
ELS
EX
IST
ING
CO
NN
EC
TE
D P
AR
CE
LS
FLOW
MON
ITORI
NG B
ASIN
SF
M 1
FM
2
FM 2
FM 1
RSFC
SD
CONN
ECTIO
N # 1
Cardi
ff and
Encin
itas
SEW
ER M
ASTE
R PLA
N UP
DATE
DUDE
KAp
ril 20
11

INTENTIONALLY LEFT BLANK
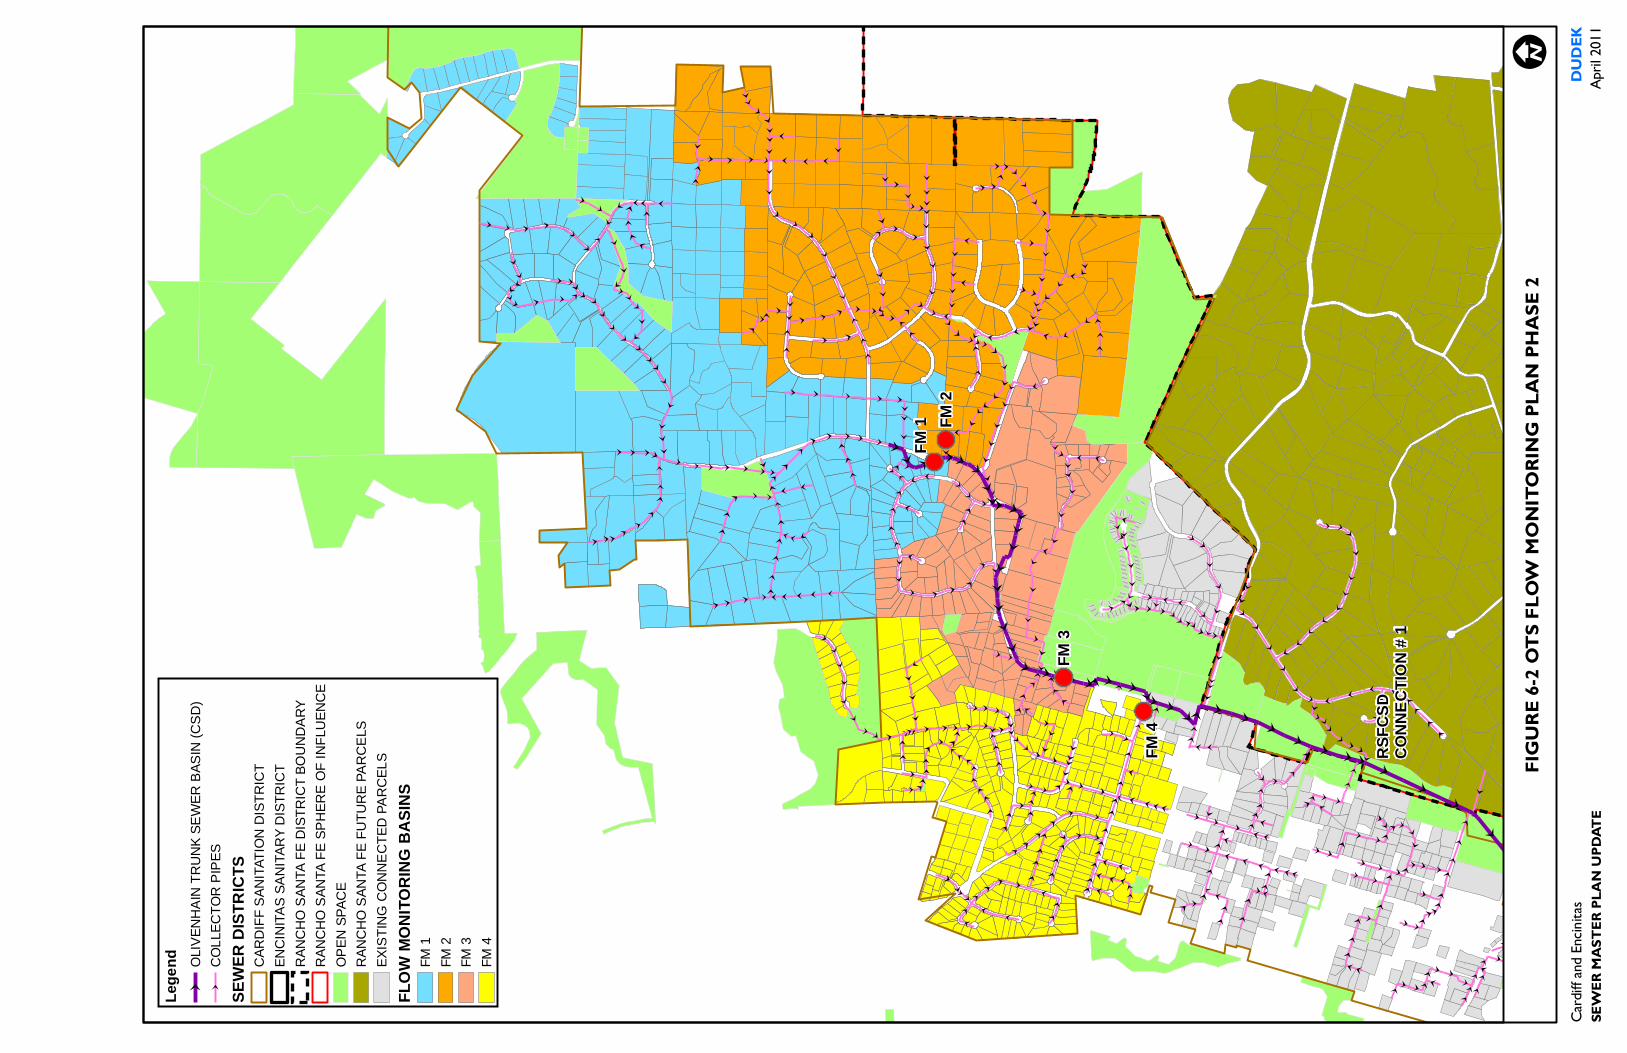
FIGUR
E 6-2
OTS F
LOW
MON
ITOR
ING
PLAN
PHAS
E 2
Lege
nd OLI
VE
NH
AIN
TR
UN
K S
EW
ER
BA
SIN
(C
SD
)
CO
LLE
CT
OR
PIP
ES
SEWE
R DI
STRI
CTS
CA
RD
IFF
SA
NIT
AT
ION
DIS
TR
ICT
EN
CIN
ITA
S S
AN
ITA
RY
DIS
TR
ICT
RA
NC
HO
SA
NTA
FE
DIS
TR
ICT
BO
UN
DA
RY
RA
NC
HO
SA
NTA
FE
SP
HE
RE
OF
IN
FLU
EN
CE
OP
EN
SP
AC
E
RA
NC
HO
SA
NTA
FE
FU
TU
RE
PA
RC
ELS
EX
IST
ING
CO
NN
EC
TE
D P
AR
CE
LS
FLOW
MON
ITORI
NG B
ASIN
SF
M 1
FM
2
FM
3
FM
4
FM 4
FM 1
RSFC
SD
CONN
ECTIO
N # 1
FM 2
FM 3
Cardi
ff and
Encin
itas
SEW
ER M
ASTE
R PLA
N UP
DATE
DUDE
KAp
ril 20
11

INTENTIONALLY LEFT BLANK
CSD and ESD DUDEK
SEWER MASTER PLAN UPDATE 6-9 April 2011
6.4 REDUNDANCY PROJECTS
Coast Pump Station Forcemain: Industry standards for new pump station and forcemain construction have begun to include dual forcemains as part of the improvement design to facilitate redundancy and the ability to inspect the forcemain without bypassing. The existing Coast PS forcemain is a single 1,160 LF 4” DIP pipeline. The City should consider the installation of a parallel forcemain for the Coast Pump Station.
Cardiff Pump Station Forcemain: The existing Cardiff PS forcemain is single 1,491 LF 10” DIP pipeline. Dual forcemains provide redundancy and a means of monitoring and maintaining the forcemain condition without the need for bypassing. The City should consider the installation of a parallel forcemain for the Cardiff Pump Station.
Olivenhain Pump Station Forcemain: The existing Olivenhain PS forcemain is single 3,000 LF 14” DIP pipeline. Dual forcemains provide redundancy and a means of monitoring and maintaining the forcemain condition without the need for bypassing. The City should consider the installation of a parallel forcemain for the Olivenhain Pump Station.
6.5 LWD/ESD JOINTLY OWNED FACILITIES IMPROVEMENTS
Historically, ESD has been accounting for an average of $50,000 per year for the shared miscellaneous capital improvements to the Batiquitos Pump Station. These improvements assist the pump station in meeting necessary up-keep and maintenance responsibilities and will reduce the risk of possible sewage spills into Batiquitos Lagoon. This annual expenditure is anticipated to continue indefinitely and has been incorporated into the 5-year and 10-year planning horizon of the recommended CIP. Several substantial capital projects and emergency projects have been designed, constructed or are planned to be constructed within the next 18 months that will be billed to ESD according to the shared facility contracts. These projects are described below. As the costs associated with these projects will be billed to the ESD within the first year of the 5-year planning horizon, the costs have not been included as part of the annual miscellaneous improvements planning budget.
Due to an unplanned corrosion failure of the B2 forcemain in June 2010 in the low lying area along Batiquitos Lagoon, an emergency forcemain replacement project was initiated with completion planned for March 2011. Approximately 1,350 feet of both 24-inch DIP forcemains B2 and B3 were removed and replaced with 24-inch diameter AWWA C905 PVC forcemains. Potholing, sampling, and CCTV inspection of both of the remaining DIP sections of B2 and B3 forcemains is also being conducted both immediately north of Batiquitos Lagoon and at a location 2,500 feet north in the frontage of the proposed Hilton Carlsbad Hotel project. The estimated ESD share for this work is approximately $381,000.
LWD has conducted Asset Management planning, a Corrosion Study for the forcemains, and has completed internal and external forcemain inspections in the vicinity of Batiquitos Lagoon. With the current partial B2 and B3 replacements along Batiquitos Lagoon, the remaining useful life of the
CSD and ESD DUDEK
SEWER MASTER PLAN UPDATE 6-10 April 2011
remainder of B2 and B3 is expected to be in the range of 5 to 20 years. Future monitoring, inspection, and sampling of the B2 and B3 forcemains will be conducted to confirm continued safe operation and timing of eventual forcemain replacements. The estimated ESD share for this work is approximately $99,000.
An additional project for BPS is currently in design with planned construction in late 2011 and 2012. Planned work includes replacement of three of the four pumps, rehabilitation of the wet well and overflow basin, addition of forcemain isolation and management valves, addition of permanent suction and discharge piping for portable engine driven bypass pumps, and other miscellaneous improvements. The estimated ESD share for this work is approximately $1,116,000.
In addition to the near term projects either in construction or planned at the Batiquitos Pump Station and Forcemain, the following additional projects are either recently constructed or in the design phase for construction within the next two years.
Lanakai Sewer Rehabilitation (LWD Design and Construction) - ESD share: $144,000
Occidental Sewer Replacement (Carlsbad Design and Construction) – ESD Share: $223,000
EWA Influent Sewer (2010 Emergency Replacement) - ESD Share: $30,000
6.6 TREATMENT CAPACITY ASSESSMENTS
6.6.1 Encina WPCF
The ESD contributes to the Encina Water Pollution Control Facilities (EWPDF) for treatment of wastewater conveyed from the Moonlight pump station. According to the member agency contract with the EWPDF, the ESD, through the City, has a 4.84% share of ownership. Capital costs include projects associated with plant rehabilitation, professional engineering services, capital acquisitions, labor and planned asset replacement. Based on the current EWPDF capital program, the next 5 years will average $376,000 annually. Based on year six projections, the following five years will average $292,000 annually.
6.6.2 SEWRF
San Elijo Water Reclamation Facility (SEWRF) provides operations and maintenance services to Cardiff Sanitary Division Pump Stations (Cardiff, Coast HWY and Olivenhain pump stations) and treatment of all downstream wastewater collected by the CSD and upstream drainage basins. Costs for capital improvements to the treatment plant are split between the CSD and City of Solana Beach. Improvements planned over the next five years include digester rehabilitation and upgrade, biosolids facility upgrades, electrical/emergency power upgrades, secondary clarifier rehabilitation, buildings, headworks and grit chamber rehabilitation and improved electrical independence. In year 2016-2017 the SEWRF plans on incorporating Class A Biosolids. Based on the current SEWRF capital program, the next 5 years will average $500,000 annually. Based on year six projections, the following five years will average $515,000 annually.
CSD and ESD DUDEK
SEWER MASTER PLAN UPDATE 6-11 April 2011
6.7 RECOMMENDED CAPITAL IMPROVEMENT PROJECTS
Improvement projects identified for the Capital Improvement Program (CIP) are summarized in Table 6-2 and Table 6-3, and illustrated on Figure 6-3. The projects are arranged into two groups based on priority.
Table 6-2 and 6-3 includes a planning level estimate of probable project costs. The cost estimates presented were developed from bid tabulations, cost curves, information obtained from previous studies, vendors and Dudek’s experience on other projects. Pipeline construction costs are generally based on a unit cost of $20 per diameter inch per length of pipe, unless the project is expected to be more complex than typical. For several projects, a detailed review of individual project components was evaluated to determine a order of magnitude construction cost. Construction costs were then increased by an estimated 40% to account for the combination of engineering and construction management, City legal and administrative costs, and a construction contingency.
The cost factors are prepared for general master planning purposes and for guidance in project evaluation and implementation. Final costs of a project will depend on actual labor and material costs, competitive market conditions, final project scope, implementation schedule, and other variable factors such as: preliminary alignments generation, investigation of alternatives routings, and detailed utility and topography surveys. Costs developed for this study should be considered “order of magnitude”, as defined by the American Association of Cost Engineers, with an expected accuracy range of +50 percent to -30 percent.
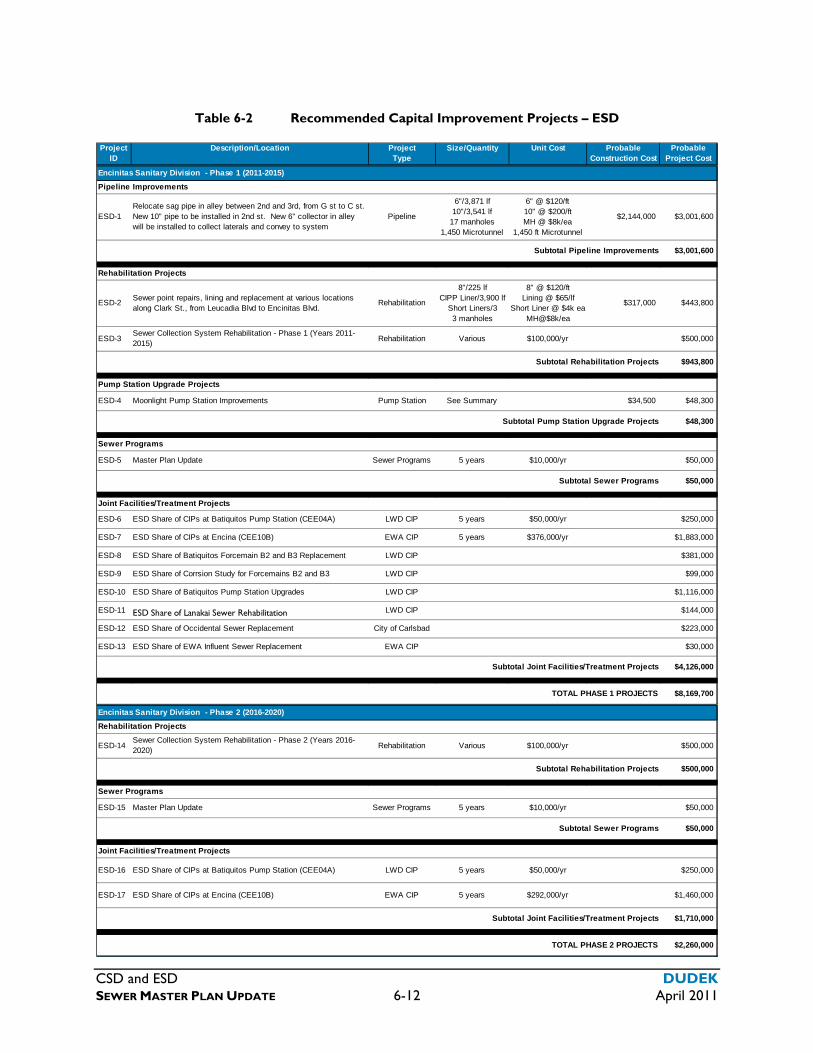
CSD and ESD DUDEK SEWER MASTER PLAN UPDATE 6-12 April 2011
Table 6-2 Recommended Capital Improvement Projects – ESD
Project Unit Cost Probable ProbableType Construction Cost Project Cost
Encinitas Sanitary Division - Phase 1 (2011-2015)
Pipeline Improvements
ESD-1Relocate sag pipe in alley between 2nd and 3rd, from G st to C st. New 10" pipe to be installed in 2nd st. New 6" collector in alley will be installed to collect laterals and convey to system
Pipeline
6"/3,871 lf 10"/3,541 lf
17 manholes 1,450 Microtunnel
6" @ $120/ft 10" @ $200/ft MH @ $8k/ea
1,450 ft Microtunnel
$2,144,000 $3,001,600
Subtotal Pipeline Improvements $3,001,600
Rehabilitation Projects
ESD-2Sewer point repairs, lining and replacement at various locations along Clark St., from Leucadia Blvd to Encinitas Blvd.
Rehabilitation
8"/225 lf CIPP Liner/3,900 lf
Short Liners/3 3 manholes
8" @ $120/ft Lining @ $65/lf
Short Liner @ $4k ea MH@$8k/ea
$317,000 $443,800
ESD-3Sewer Collection System Rehabilitation - Phase 1 (Years 2011-2015)
Rehabilitation Various $100,000/yr $500,000
Subtotal Rehabilitation Projects $943,800
Pump Station Upgrade Projects
ESD-4 Moonlight Pump Station Improvements Pump Station See Summary $34,500 $48,300
Subtotal Pump Station Upgrade Projects $48,300
Sewer Programs
ESD-5 Master Plan Update Sewer Programs 5 years $10,000/yr $50,000
Subtotal Sewer Programs $50,000
Joint Facilities/Treatment Projects
ESD-6 ESD Share of CIPs at Batiquitos Pump Station (CEE04A) LWD CIP 5 years $50,000/yr $250,000
ESD-7 ESD Share of CIPs at Encina (CEE10B) EWA CIP 5 years $376,000/yr $1,883,000
ESD-8 ESD Share of Batiquitos Forcemain B2 and B3 Replacement LWD CIP $381,000
ESD-9 ESD Share of Corrsion Study for Forcemains B2 and B3 LWD CIP $99,000
ESD-10 ESD Share of Batiquitos Pump Station Upgrades LWD CIP $1,116,000
ESD-11 ESD Share of Lanakai Sewer Rehabilitation LWD CIP $144,000
ESD-12 ESD Share of Occidental Sewer Replacement City of Carlsbad $223,000
ESD-13 ESD Share of EWA Influent Sewer Replacement EWA CIP $30,000
Subtotal Joint Facilities/Treatment Projects $4,126,000
TOTAL PHASE 1 PROJECTS $8,169,700
Encinitas Sanitary Division - Phase 2 (2016-2020)
Rehabilitation Projects
ESD-14Sewer Collection System Rehabilitation - Phase 2 (Years 2016-2020)
Rehabilitation Various $100,000/yr $500,000
Subtotal Rehabilitation Projects $500,000
Sewer Programs
ESD-15 Master Plan Update Sewer Programs 5 years $10,000/yr $50,000
Subtotal Sewer Programs $50,000
Joint Facilities/Treatment Projects
ESD-16 ESD Share of CIPs at Batiquitos Pump Station (CEE04A) LWD CIP 5 years $50,000/yr $250,000
ESD-17 ESD Share of CIPs at Encina (CEE10B) EWA CIP 5 years $292,000/yr $1,460,000
Subtotal Joint Facilities/Treatment Projects $1,710,000
TOTAL PHASE 2 PROJECTS $2,260,000
Project ID
Size/QuantityDescription/Location
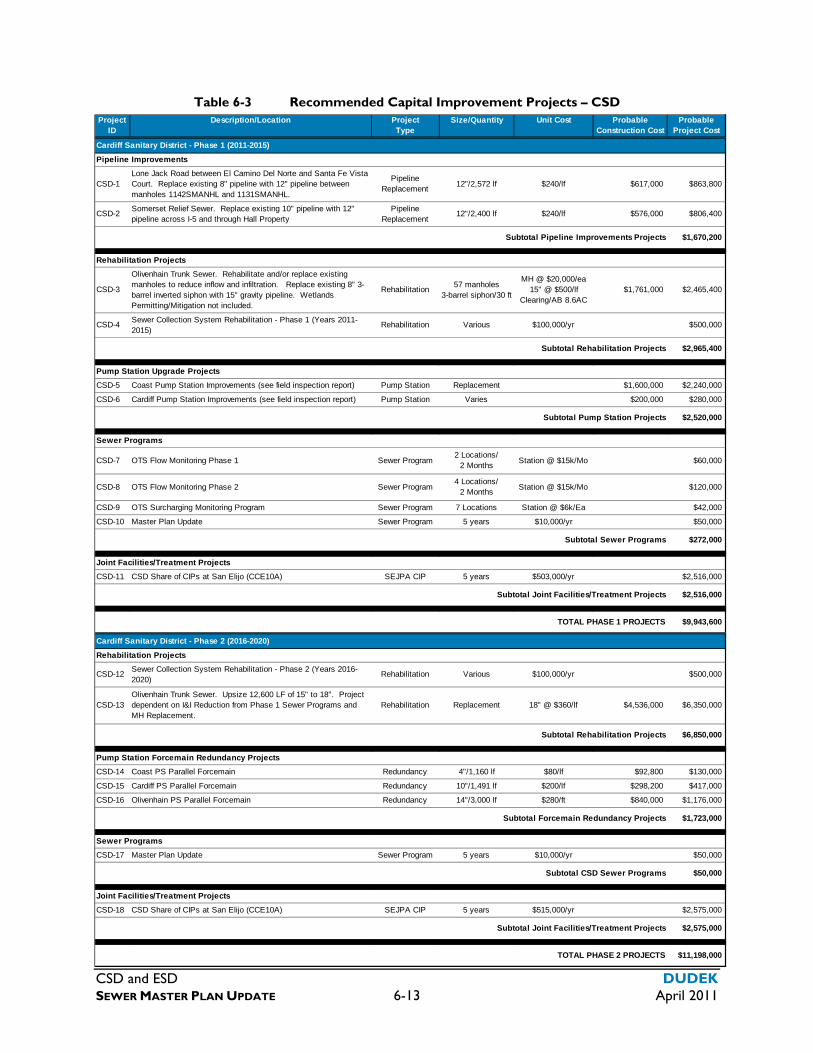
CSD and ESD DUDEK SEWER MASTER PLAN UPDATE 6-13 April 2011
Project Unit Cost Probable ProbableType Construction Cost Project Cost
Cardiff Sanitary District - Phase 1 (2011-2015)
Pipeline Improvements
CSD-1Lone Jack Road between El Camino Del Norte and Santa Fe Vista Court. Replace existing 8" pipeline with 12" pipeline between manholes 1142SMANHL and 1131SMANHL.
Pipeline Replacement
12"/2,572 lf $240/lf $617,000 $863,800
CSD-2Somerset Relief Sewer. Replace existing 10" pipeline with 12" pipeline across I-5 and through Hall Property
Pipeline Replacement
12"/2,400 lf $240/lf $576,000 $806,400
Subtotal Pipeline Improvements Projects $1,670,200
Rehabilitation Projects
CSD-3
Olivenhain Trunk Sewer. Rehabilitate and/or replace existing manholes to reduce inflow and infiltration. Replace existing 8" 3-barrel inverted siphon with 15" gravity pipeline. Wetlands Permitting/Mitigation not included.
Rehabilitation57 manholes
3-barrel siphon/30 ft
MH @ $20,000/ea 15" @ $500/lf
Clearing/AB 8.6AC$1,761,000 $2,465,400
CSD-4Sewer Collection System Rehabilitation - Phase 1 (Years 2011-2015)
Rehabilitation Various $100,000/yr $500,000
Subtotal Rehabilitation Projects $2,965,400
Pump Station Upgrade Projects
CSD-5 Coast Pump Station Improvements (see field inspection report) Pump Station Replacement $1,600,000 $2,240,000
CSD-6 Cardiff Pump Station Improvements (see field inspection report) Pump Station Varies $200,000 $280,000
Subtotal Pump Station Projects $2,520,000
Sewer Programs
CSD-7 OTS Flow Monitoring Phase 1 Sewer Program2 Locations/
2 MonthsStation @ $15k/Mo $60,000
CSD-8 OTS Flow Monitoring Phase 2 Sewer Program4 Locations/
2 MonthsStation @ $15k/Mo $120,000
CSD-9 OTS Surcharging Monitoring Program Sewer Program 7 Locations Station @ $6k/Ea $42,000
CSD-10 Master Plan Update Sewer Program 5 years $10,000/yr $50,000
Subtotal Sewer Programs $272,000
Joint Facilities/Treatment Projects
CSD-11 CSD Share of CIPs at San Elijo (CCE10A) SEJPA CIP 5 years $503,000/yr $2,516,000
Subtotal Joint Facilities/Treatment Projects $2,516,000
TOTAL PHASE 1 PROJECTS $9,943,600
Cardiff Sanitary District - Phase 2 (2016-2020)
Rehabilitation Projects
CSD-12Sewer Collection System Rehabilitation - Phase 2 (Years 2016-2020)
Rehabilitation Various $100,000/yr $500,000
CSD-13Olivenhain Trunk Sewer. Upsize 12,600 LF of 15" to 18". Project dependent on I&I Reduction from Phase 1 Sewer Programs and MH Replacement.
Rehabilitation Replacement 18" @ $360/lf $4,536,000 $6,350,000
Subtotal Rehabilitation Projects $6,850,000
Pump Station Forcemain Redundancy Projects
CSD-14 Coast PS Parallel Forcemain Redundancy 4"/1,160 lf $80/lf $92,800 $130,000
CSD-15 Cardiff PS Parallel Forcemain Redundancy 10"/1,491 lf $200/lf $298,200 $417,000
CSD-16 Olivenhain PS Parallel Forcemain Redundancy 14"/3,000 lf $280/ft $840,000 $1,176,000
Subtotal Forcemain Redundancy Projects $1,723,000
Sewer Programs
CSD-17 Master Plan Update Sewer Program 5 years $10,000/yr $50,000
Subtotal CSD Sewer Programs $50,000
Joint Facilities/Treatment Projects
CSD-18 CSD Share of CIPs at San Elijo (CCE10A) SEJPA CIP 5 years $515,000/yr $2,575,000
Subtotal Joint Facilities/Treatment Projects $2,575,000
TOTAL PHASE 2 PROJECTS $11,198,000
Project ID
Description/Location Size/Quantity
Table 6-3 Recommended Capital Improvement Projects – CSD

CSD and ESD DUDEK SEWER MASTER PLAN UPDATE 6-14 April 2011
INTENTIONALLY LEFT BLANK
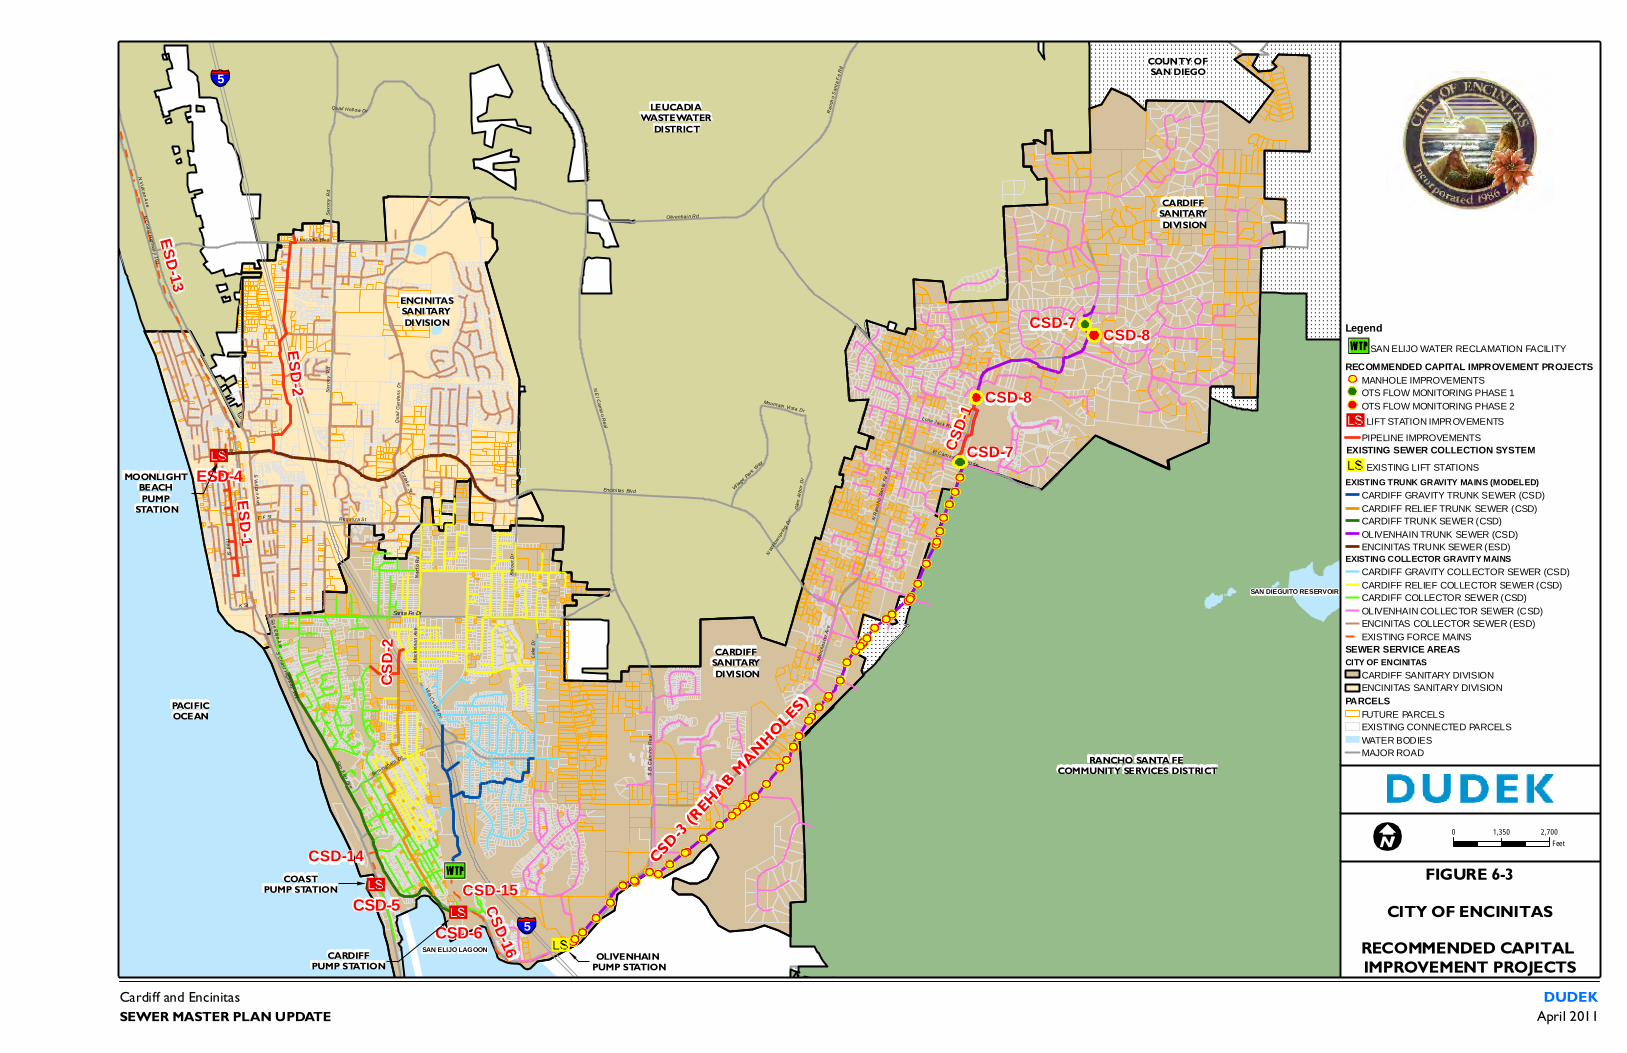
ESD-1
CSD-5
ESD-4
CSD-6
Encini tas Blvd
Manc
hest
er Av
e
Leucadia Blvd
Santa Fe Dr
N Vulcan Ave
S Coast Highway 101
San E lijo Ave
Quail
Gar
dens
Dr
Third St
Lone Jack Rd
Saxo
ny R
d
Lake
Dr
S El
Cam
ino R
eal
N E l Camin o Real
N Coast Highwa y 101
N Ra
ncho
San
ta Fe
Rd
Balo
ur D
r
Olivenhai n Rd
Birm ingham Dr
S Vul ca n Ave
Requeza S t
Ranc
h o S
anta
Fe R
d
Nard
o Rd
El Camino Real
Glen
Arb
or D
r
El Cam ino Del No rte
Vil lage Park W
ay
K St
Vil la Ca rdi ff Dr
West lake St
Mack
innon
Ave
E F St
Quail Holl ow Dr
W B St
Mountain Vi sta Dr
S Sa n E lij o Ave
N Wil lo
wsprin
g Dr
Saxo
ny R
d
CSD-
2
SAN ELIJO LAGOON
SAN DIEGUITO RESERVOIR
Cardiff and Encinitas
FIGURE 6-3CITY OF ENCINITAS
RECOMMENDED CAPITAL IMPROVEMENT PROJECTS
SEWER MASTER PLAN UPDATEDUDEK
April 2011
PACIFICOCEAN
LegendSAN ELIJO WATER RECLAMATION FACILITY
RECOMMENDED CAPITAL IMPROVEMENT PROJECTSMANHOLE IMPROVEMENTSOTS FLOW MONITORING PHASE 1
OTS FLOW MONITORING PHASE 2
LIFT STATION IMPROVEMENTS
PIPELINE IMPROVEMENTSEXISTING SEWER COLLECTION SYSTEM
EXISTING LIFT STATIONS
EXISTING TRUNK GRAVITY MAINS (MODELED)CARDIFF GRAVITY TRUNK SEWER (CSD)
CARDIFF RELIEF TRUNK SEWER (CSD)CARDIFF TRUNK SEWER (CSD)
OLIVENHAIN TRUNK SEWER (CSD)ENCINITAS TRUNK SEWER (ESD)
EXISTING COLLECTOR GRAVITY MAINSCARDIFF GRAVITY COLLECTOR SEWER (CSD)
CARDIFF RELIEF COLLECTOR SEWER (CSD)CARDIFF COLLECTOR SEWER (CSD)
OLIVENHAIN COLLECTOR SEWER (CSD)ENCINITAS COLLECTOR SEWER (ESD)
EXISTING FORCE MAINSSEWER SERVICE AREASCITY OF ENCINITAS
CARDIFF SANITARY DIVISIONENCINITAS SANITARY DIVISION
PARCELSFUTURE PARCELSEXISTING CONNECTED PARCELS
WATER BODIESMAJOR ROAD
COUNTY OFSAN DIEGO
5
5
0 2,7001,350Feet
RANCHO SANTA FE COMMUNITY SERVICES DISTRICT
CARDIFF SANITARY DIVISION
CARDIFF SANITARY DIVISION
ENCINITASSANITARY DIVISION
LEUCADIA WASTEWATER
DISTRICT
COASTPUMP STATION
CARDIFFPUMP STATION
OLIVENHAIN PUMP STATION
MOONLIGHT BEACH PUMP
STATION
ESD-13
ESD-2
CSD-14CSD-15CSD-16
CSD-3 (REHAB MANHOLES)
CSD-7
CSD-8
CSD-7 CSD-8
CSD-
1

INTENTIONALLY LEFT BLANK
CSD and ESD DUDEK
SEWER MASTER PLAN UPDATE April 2011
APPENDIX A Flow Meter Data
Cardiff Trunk Sewer
Cardiff Gravity Trunk Sewer
Olivenhain Trunk Sewer
Encinitas Trunk sewer

CSD and ESD DUDEK
SEWER MASTER PLAN UPDATE April 2011
INTENTIONALLY LEFT BLANK
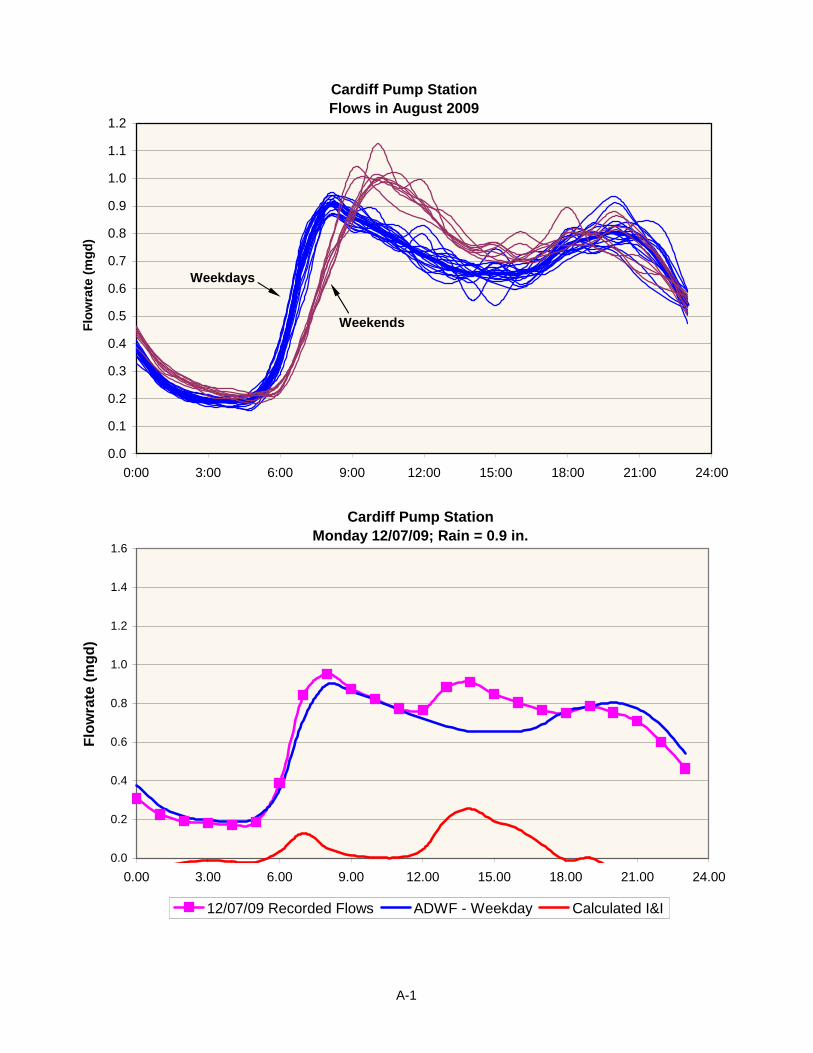
Cardiff Pump Station Flows in August 2009
0.0
0.1
0.2
0.3
0.4
0.5
0.6
0.7
0.8
0.9
1.0
1.1
1.2
0:00 3:00 6:00 9:00 12:00 15:00 18:00 21:00 24:00
Flow
rate
(mgd
)
Weekdays
Weekends
Cardiff Pump StationMonday 12/07/09; Rain = 0.9 in.
0.0
0.2
0.4
0.6
0.8
1.0
1.2
1.4
1.6
0.00 3.00 6.00 9.00 12.00 15.00 18.00 21.00 24.00
Flow
rate
(mgd
)
12/07/09 Recorded Flows ADWF - Weekday Calculated I&I
A-1
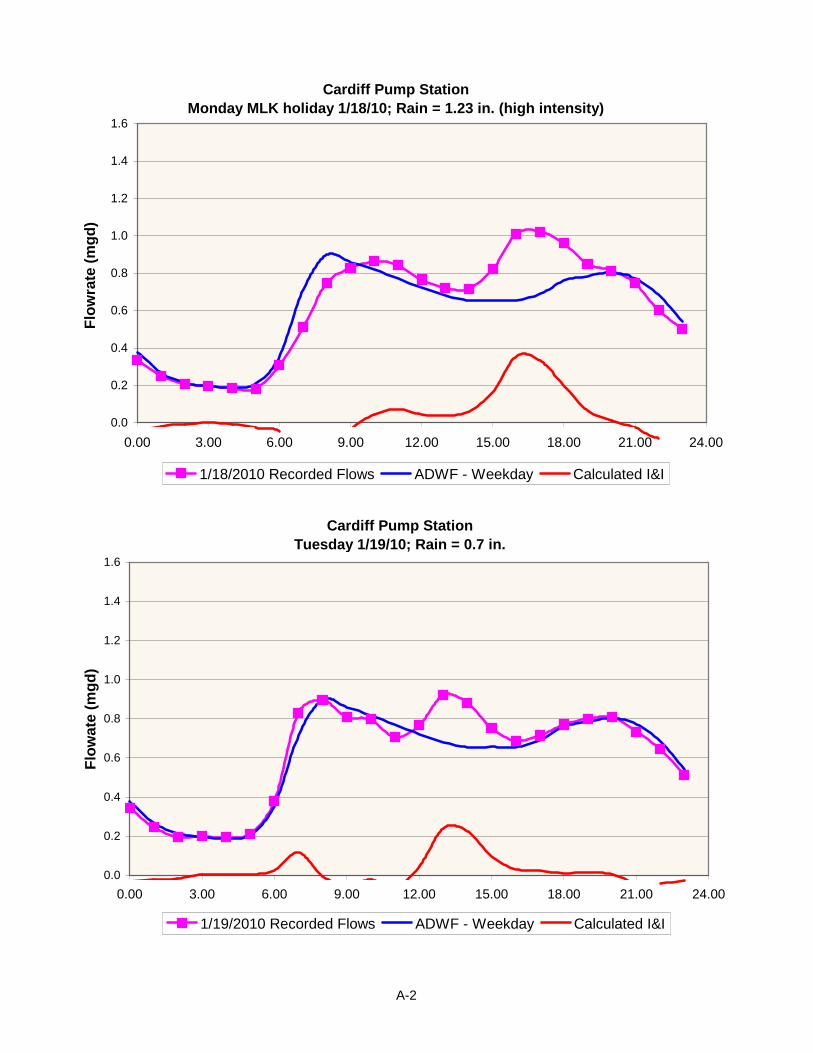
Cardiff Pump StationMonday MLK holiday 1/18/10; Rain = 1.23 in. (high intensity)
0.0
0.2
0.4
0.6
0.8
1.0
1.2
1.4
1.6
0.00 3.00 6.00 9.00 12.00 15.00 18.00 21.00 24.00
Flow
rate
(mgd
)
1/18/2010 Recorded Flows ADWF - Weekday Calculated I&I
Cardiff Pump StationTuesday 1/19/10; Rain = 0.7 in.
0.0
0.2
0.4
0.6
0.8
1.0
1.2
1.4
1.6
0.00 3.00 6.00 9.00 12.00 15.00 18.00 21.00 24.00
Flow
ate
(mgd
)
1/19/2010 Recorded Flows ADWF - Weekday Calculated I&I
A-2
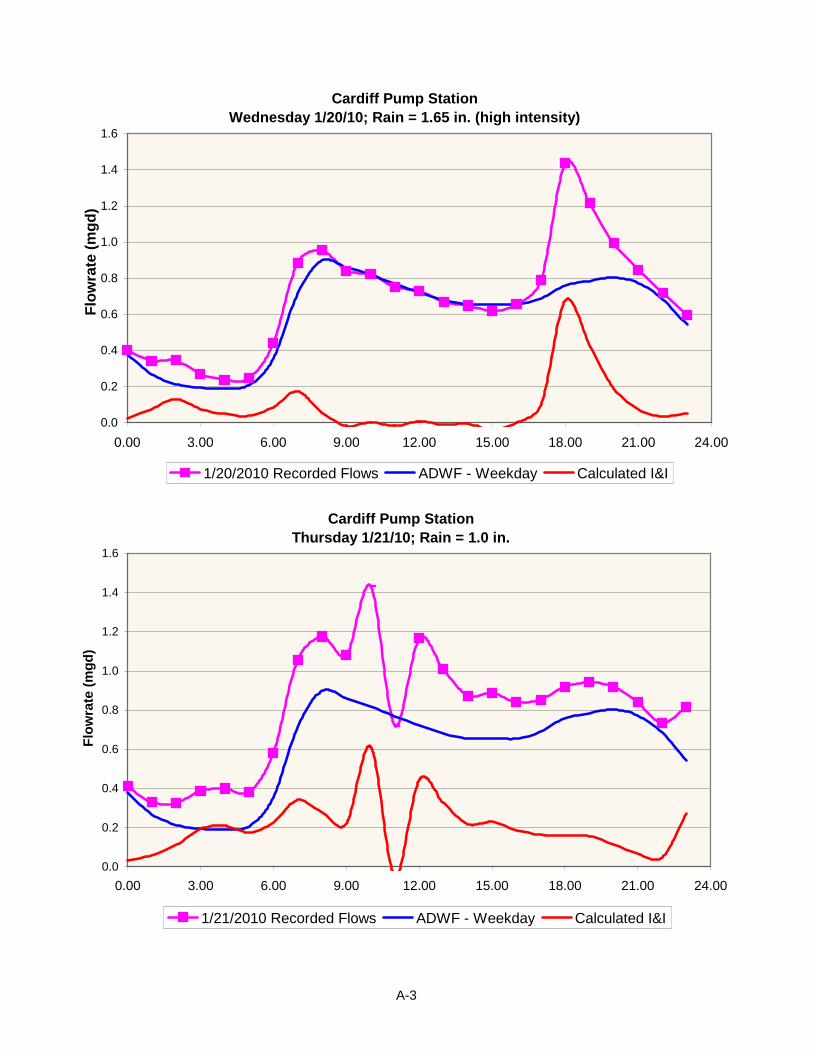
Cardiff Pump StationWednesday 1/20/10; Rain = 1.65 in. (high intensity)
0.0
0.2
0.4
0.6
0.8
1.0
1.2
1.4
1.6
0.00 3.00 6.00 9.00 12.00 15.00 18.00 21.00 24.00
Flow
rate
(mgd
)
1/20/2010 Recorded Flows ADWF - Weekday Calculated I&I
Cardiff Pump StationThursday 1/21/10; Rain = 1.0 in.
0.0
0.2
0.4
0.6
0.8
1.0
1.2
1.4
1.6
0.00 3.00 6.00 9.00 12.00 15.00 18.00 21.00 24.00
Flow
rate
(mgd
)
1/21/2010 Recorded Flows ADWF - Weekday Calculated I&I
A-3
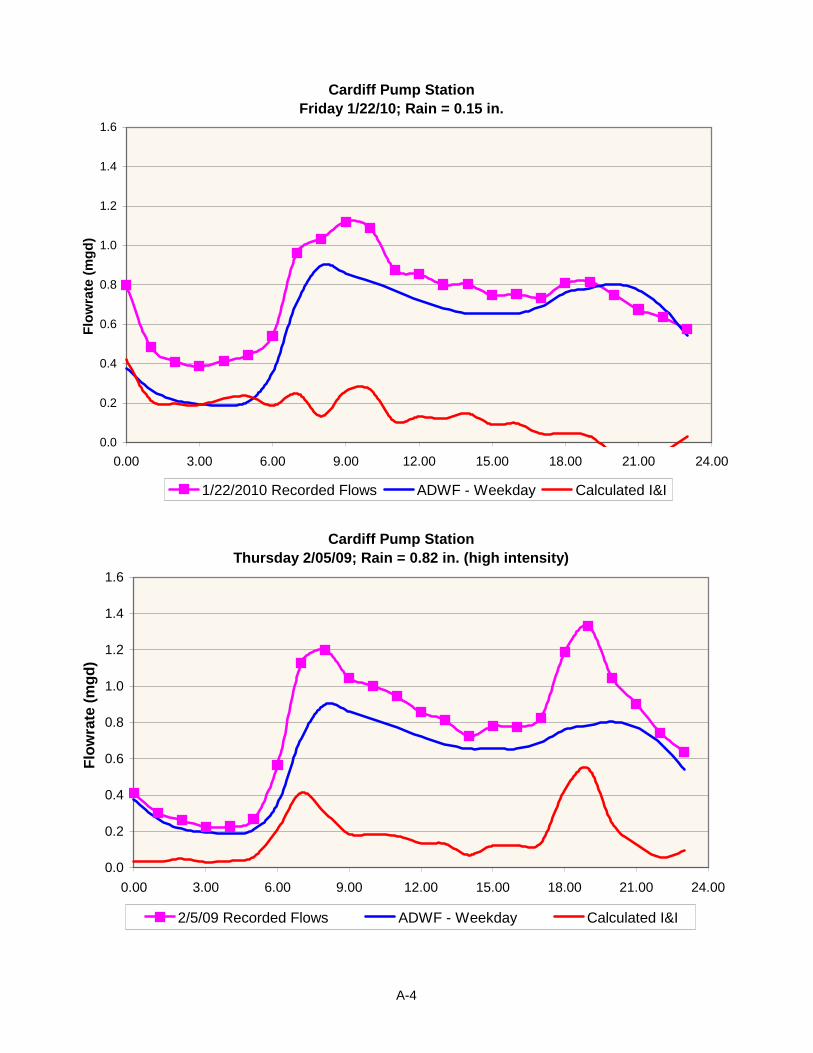
Cardiff Pump StationFriday 1/22/10; Rain = 0.15 in.
0.0
0.2
0.4
0.6
0.8
1.0
1.2
1.4
1.6
0.00 3.00 6.00 9.00 12.00 15.00 18.00 21.00 24.00
Flow
rate
(mgd
)
1/22/2010 Recorded Flows ADWF - Weekday Calculated I&I
Cardiff Pump StationThursday 2/05/09; Rain = 0.82 in. (high intensity)
0.0
0.2
0.4
0.6
0.8
1.0
1.2
1.4
1.6
0.00 3.00 6.00 9.00 12.00 15.00 18.00 21.00 24.00
Flow
rate
(mgd
)
2/5/09 Recorded Flows ADWF - Weekday Calculated I&I
A-4
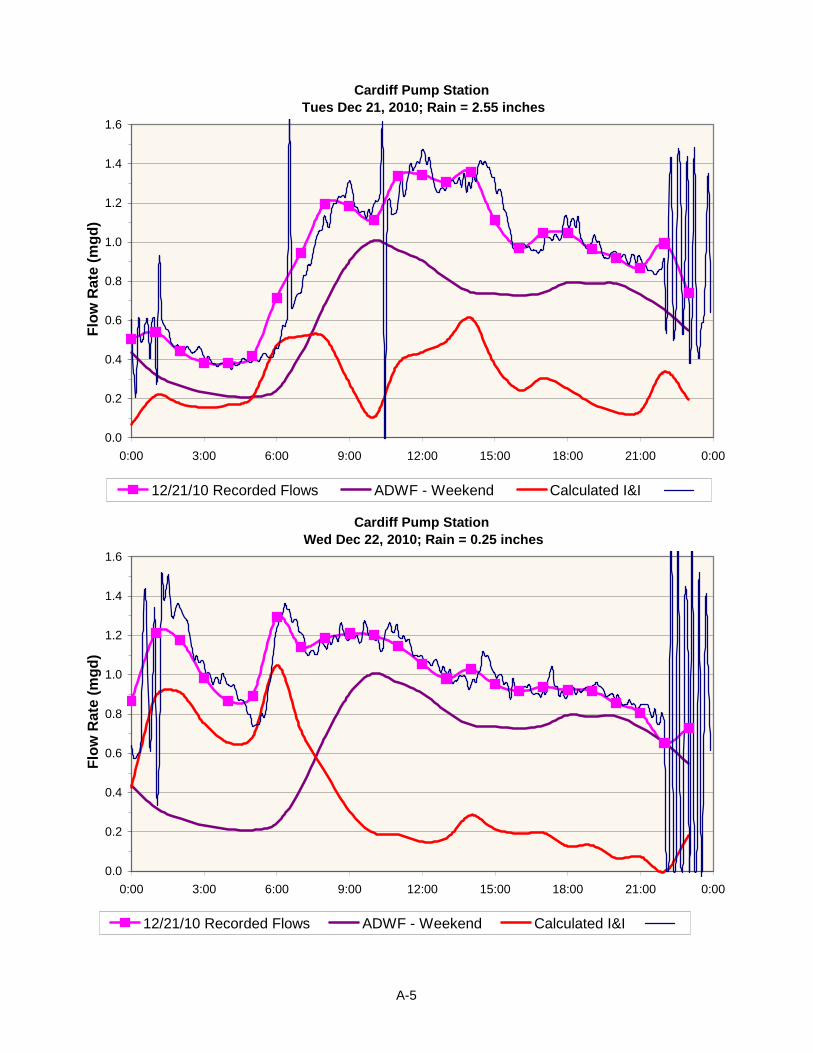
Cardiff Pump Station Tues Dec 21, 2010; Rain = 2.55 inches
0.0
0.2
0.4
0.6
0.8
1.0
1.2
1.4
1.6
0:00 3:00 6:00 9:00 12:00 15:00 18:00 21:00 0:00
Flow
Rat
e (m
gd)
12/21/10 Recorded Flows ADWF - Weekend Calculated I&I
Cardiff Pump Station Wed Dec 22, 2010; Rain = 0.25 inches
0.0
0.2
0.4
0.6
0.8
1.0
1.2
1.4
1.6
0:00 3:00 6:00 9:00 12:00 15:00 18:00 21:00 0:00
Flow
Rat
e (m
gd)
12/21/10 Recorded Flows ADWF - Weekend Calculated I&I
A-5
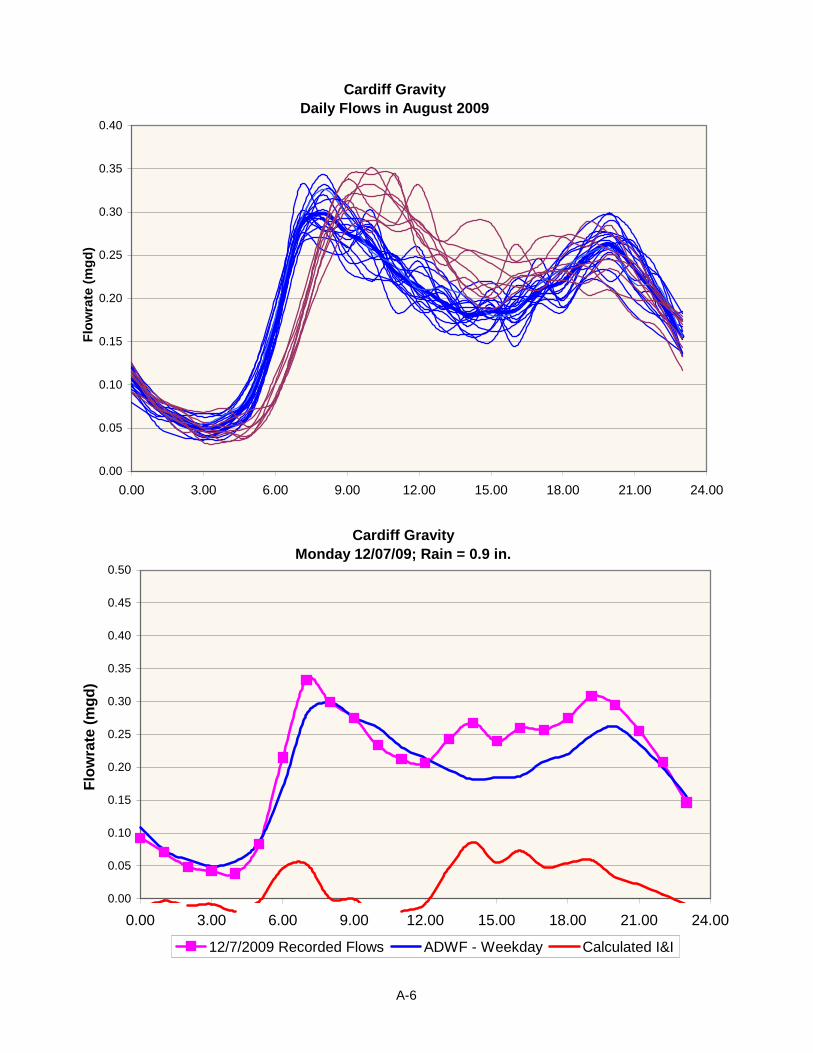
Cardiff Gravity Daily Flows in August 2009
0.00
0.05
0.10
0.15
0.20
0.25
0.30
0.35
0.40
0.00 3.00 6.00 9.00 12.00 15.00 18.00 21.00 24.00
Flow
rate
(mgd
)
Cardiff GravityMonday 12/07/09; Rain = 0.9 in.
0.00
0.05
0.10
0.15
0.20
0.25
0.30
0.35
0.40
0.45
0.50
0.00 3.00 6.00 9.00 12.00 15.00 18.00 21.00 24.00
Flow
rate
(mgd
)
12/7/2009 Recorded Flows ADWF - Weekday Calculated I&I
A-6
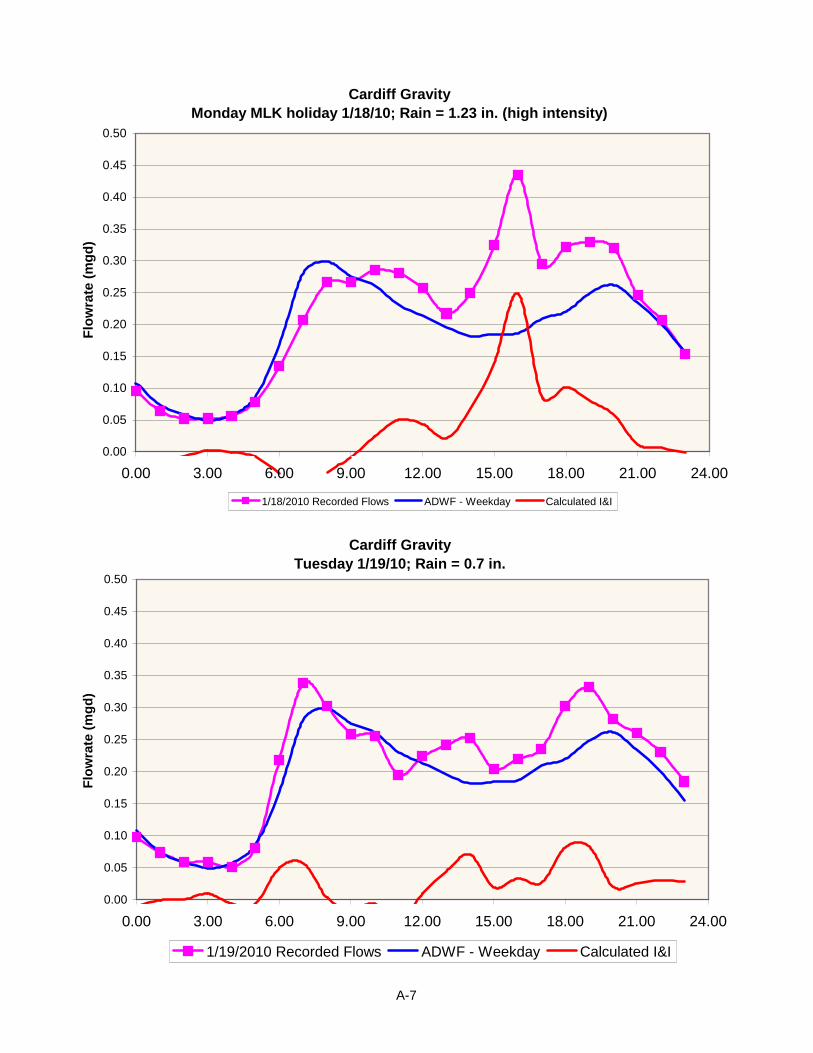
Cardiff GravityMonday MLK holiday 1/18/10; Rain = 1.23 in. (high intensity)
0.00
0.05
0.10
0.15
0.20
0.25
0.30
0.35
0.40
0.45
0.50
0.00 3.00 6.00 9.00 12.00 15.00 18.00 21.00 24.00
Flow
rate
(mgd
)
1/18/2010 Recorded Flows ADWF - Weekday Calculated I&I
Cardiff GravityTuesday 1/19/10; Rain = 0.7 in.
0.00
0.05
0.10
0.15
0.20
0.25
0.30
0.35
0.40
0.45
0.50
0.00 3.00 6.00 9.00 12.00 15.00 18.00 21.00 24.00
Flow
rate
(mgd
)
1/19/2010 Recorded Flows ADWF - Weekday Calculated I&I
A-7
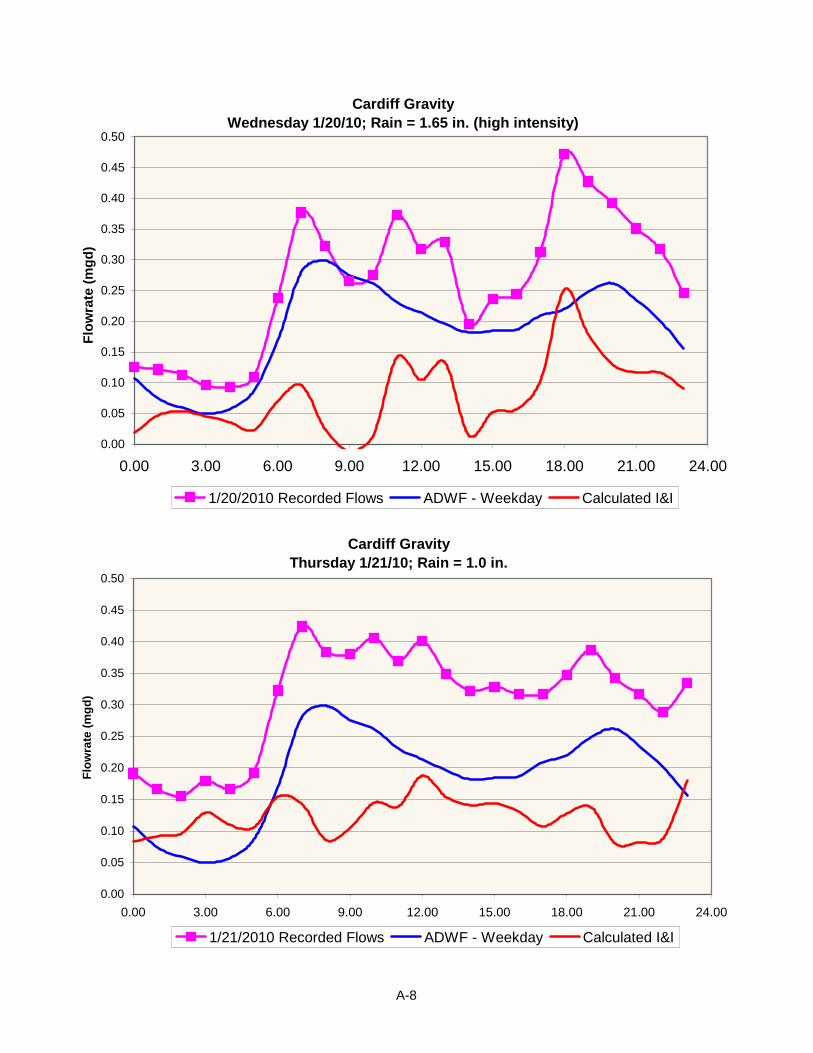
Cardiff GravityWednesday 1/20/10; Rain = 1.65 in. (high intensity)
0.00
0.05
0.10
0.15
0.20
0.25
0.30
0.35
0.40
0.45
0.50
0.00 3.00 6.00 9.00 12.00 15.00 18.00 21.00 24.00
Flow
rate
(mgd
)
1/20/2010 Recorded Flows ADWF - Weekday Calculated I&I
Cardiff GravityThursday 1/21/10; Rain = 1.0 in.
0.00
0.05
0.10
0.15
0.20
0.25
0.30
0.35
0.40
0.45
0.50
0.00 3.00 6.00 9.00 12.00 15.00 18.00 21.00 24.00
Flow
rate
(mgd
)
1/21/2010 Recorded Flows ADWF - Weekday Calculated I&I
A-8
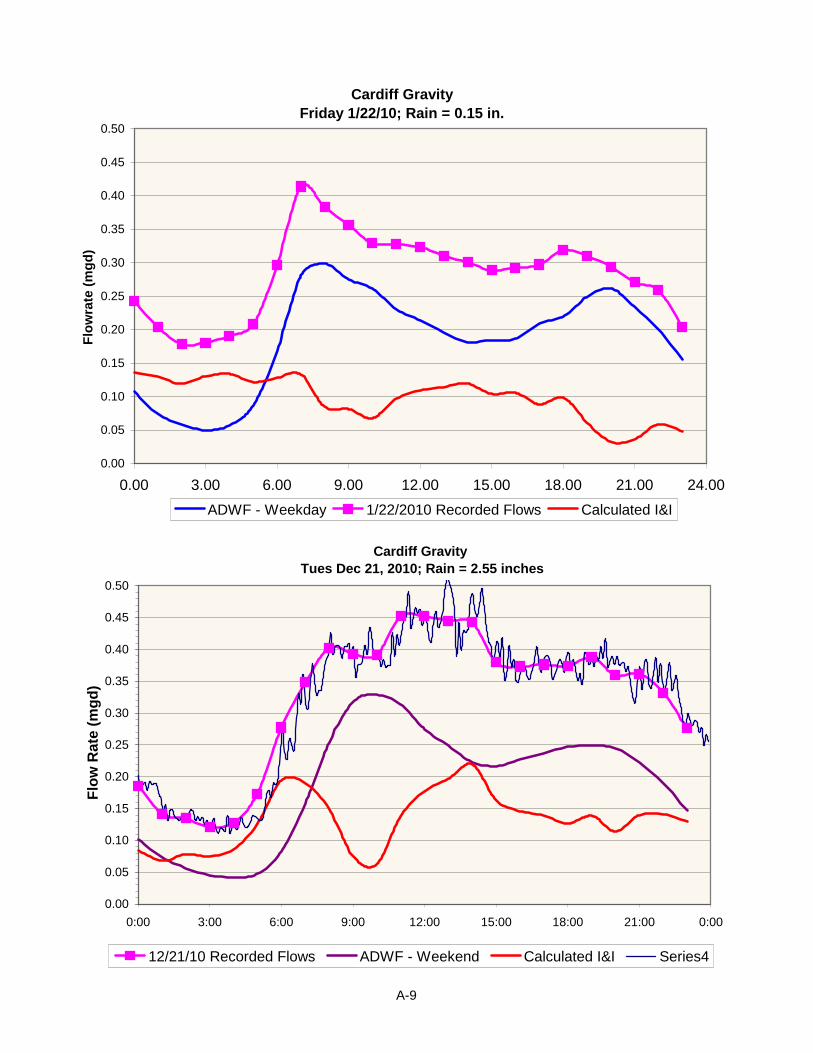
Cardiff GravityFriday 1/22/10; Rain = 0.15 in.
0.00
0.05
0.10
0.15
0.20
0.25
0.30
0.35
0.40
0.45
0.50
0.00 3.00 6.00 9.00 12.00 15.00 18.00 21.00 24.00
Flow
rate
(mgd
)
ADWF - Weekday 1/22/2010 Recorded Flows Calculated I&I
Cardiff Gravity Tues Dec 21, 2010; Rain = 2.55 inches
0.00
0.05
0.10
0.15
0.20
0.25
0.30
0.35
0.40
0.45
0.50
0:00 3:00 6:00 9:00 12:00 15:00 18:00 21:00 0:00
Flow
Rat
e (m
gd)
12/21/10 Recorded Flows ADWF - Weekend Calculated I&I Series4
A-9
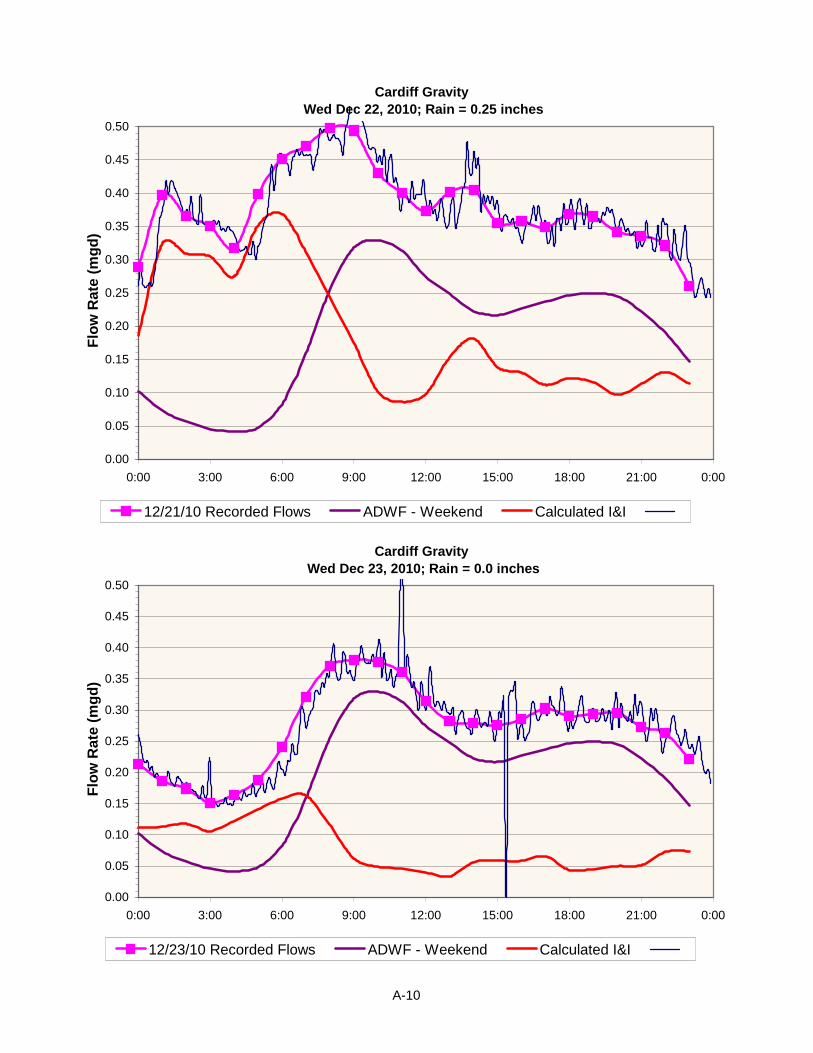
Cardiff Gravity Wed Dec 22, 2010; Rain = 0.25 inches
0.00
0.05
0.10
0.15
0.20
0.25
0.30
0.35
0.40
0.45
0.50
0:00 3:00 6:00 9:00 12:00 15:00 18:00 21:00 0:00
Flow
Rat
e (m
gd)
12/21/10 Recorded Flows ADWF - Weekend Calculated I&I
Cardiff Gravity Wed Dec 23, 2010; Rain = 0.0 inches
0.00
0.05
0.10
0.15
0.20
0.25
0.30
0.35
0.40
0.45
0.50
0:00 3:00 6:00 9:00 12:00 15:00 18:00 21:00 0:00
Flow
Rat
e (m
gd)
12/23/10 Recorded Flows ADWF - Weekend Calculated I&I
A-10
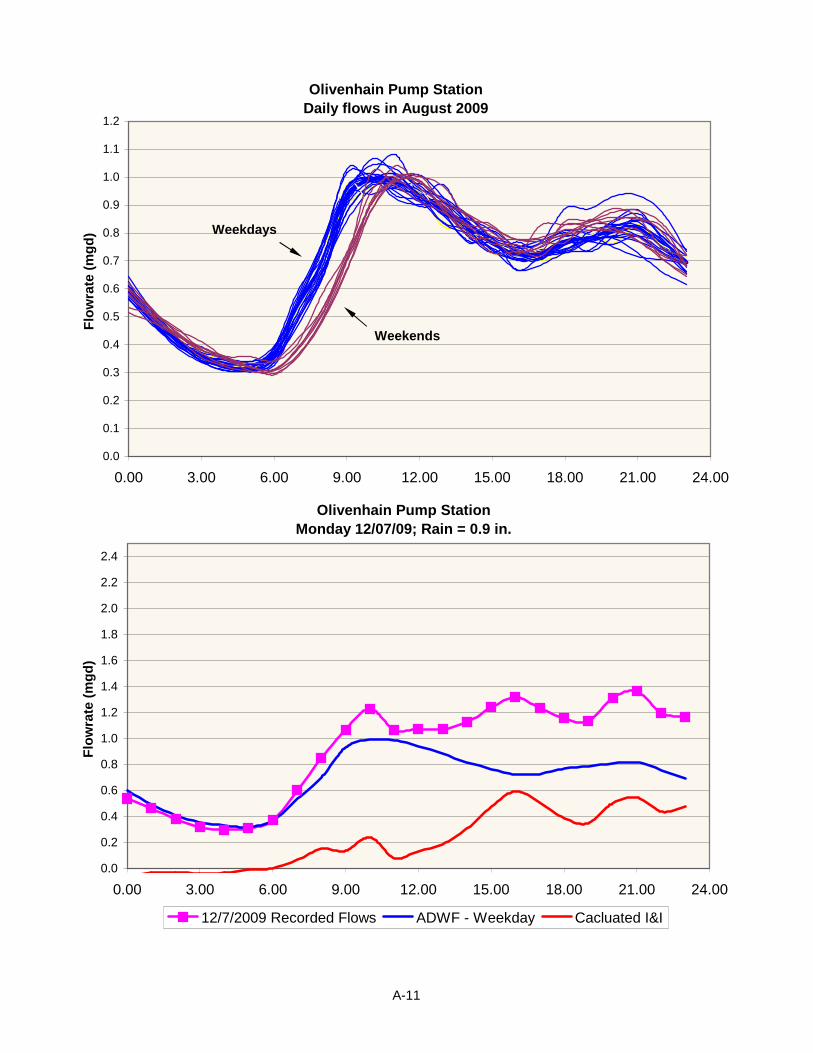
Olivenhain Pump StationDaily flows in August 2009
0.0
0.1
0.2
0.3
0.4
0.5
0.6
0.7
0.8
0.9
1.0
1.1
1.2
0.00 3.00 6.00 9.00 12.00 15.00 18.00 21.00 24.00
Flow
rate
(mgd
) Weekdays
Weekends
Olivenhain Pump StationMonday 12/07/09; Rain = 0.9 in.
0.0
0.2
0.4
0.6
0.8
1.0
1.2
1.4
1.6
1.8
2.0
2.2
2.4
0.00 3.00 6.00 9.00 12.00 15.00 18.00 21.00 24.00
Flow
rate
(mgd
)
12/7/2009 Recorded Flows ADWF - Weekday Cacluated I&I
A-11
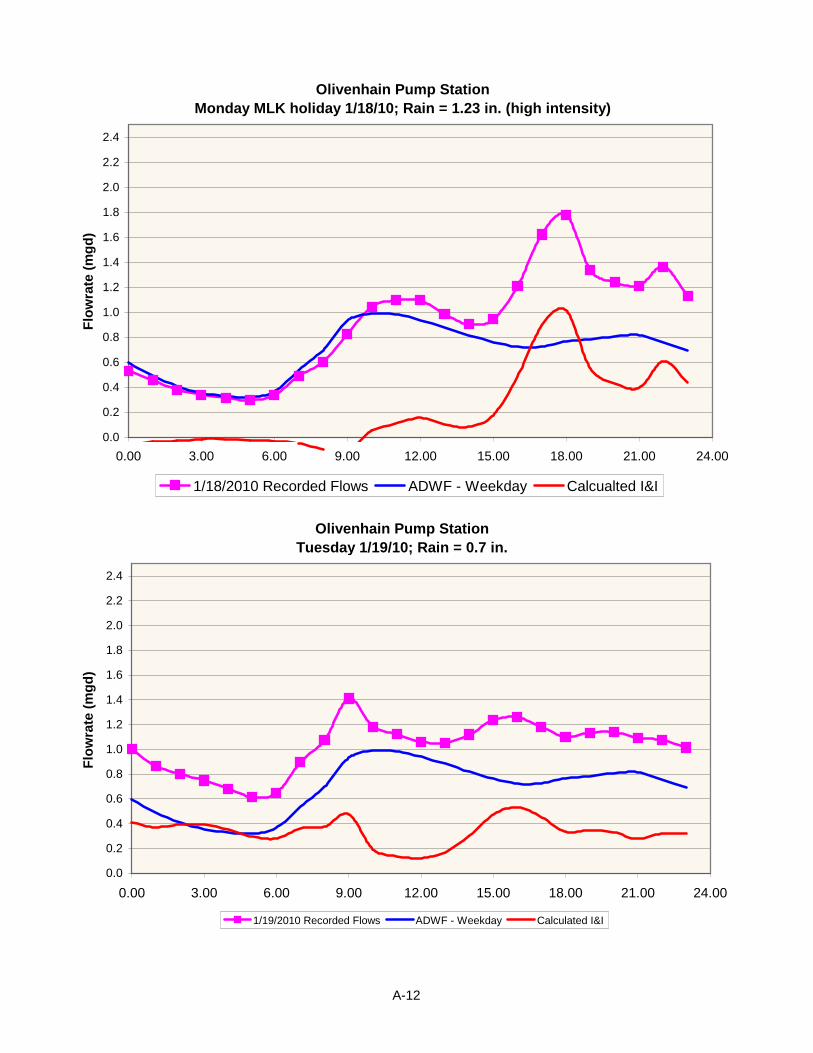
Olivenhain Pump StationMonday MLK holiday 1/18/10; Rain = 1.23 in. (high intensity)
0.0
0.2
0.4
0.6
0.8
1.0
1.2
1.4
1.6
1.8
2.0
2.2
2.4
0.00 3.00 6.00 9.00 12.00 15.00 18.00 21.00 24.00
Flow
rate
(mgd
)
1/18/2010 Recorded Flows ADWF - Weekday Calcualted I&I
Olivenhain Pump StationTuesday 1/19/10; Rain = 0.7 in.
0.0
0.2
0.4
0.6
0.8
1.0
1.2
1.4
1.6
1.8
2.0
2.2
2.4
0.00 3.00 6.00 9.00 12.00 15.00 18.00 21.00 24.00
Flow
rate
(mgd
)
1/19/2010 Recorded Flows ADWF - Weekday Calculated I&I
A-12
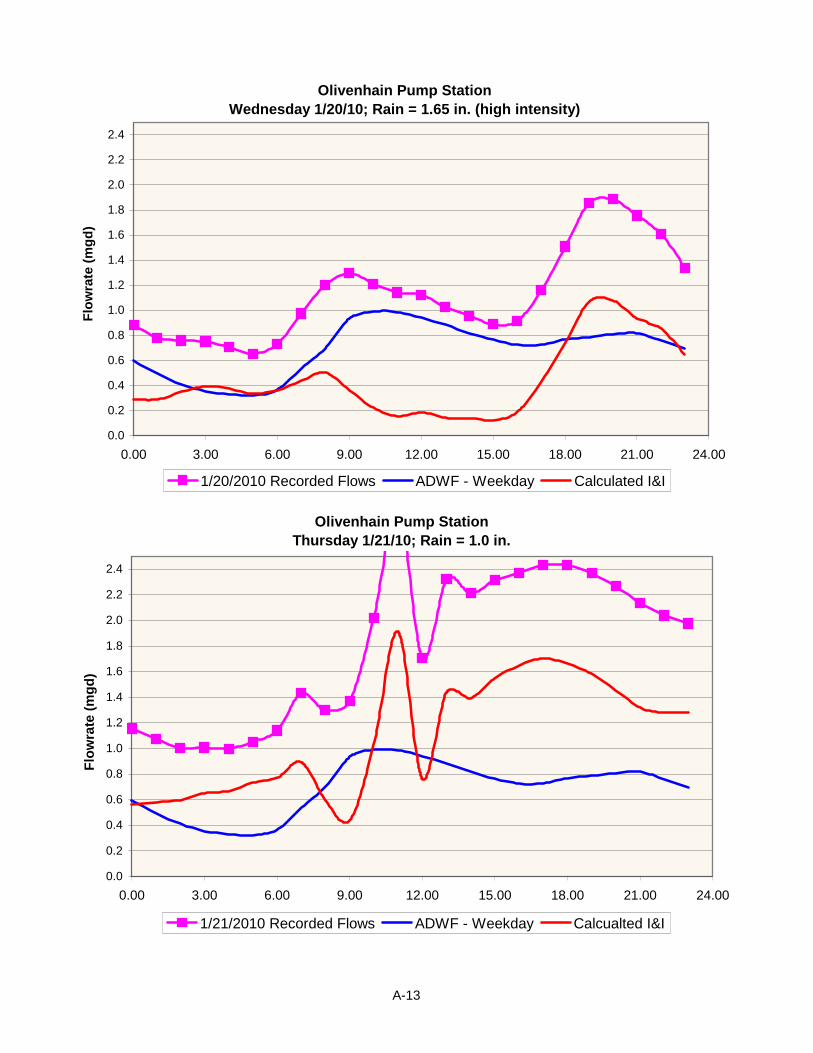
Olivenhain Pump StationWednesday 1/20/10; Rain = 1.65 in. (high intensity)
0.0
0.2
0.4
0.6
0.8
1.0
1.2
1.4
1.6
1.8
2.0
2.2
2.4
0.00 3.00 6.00 9.00 12.00 15.00 18.00 21.00 24.00
Flow
rate
(mgd
)
1/20/2010 Recorded Flows ADWF - Weekday Calculated I&I
Olivenhain Pump StationThursday 1/21/10; Rain = 1.0 in.
0.0
0.2
0.4
0.6
0.8
1.0
1.2
1.4
1.6
1.8
2.0
2.2
2.4
0.00 3.00 6.00 9.00 12.00 15.00 18.00 21.00 24.00
Flow
rate
(mgd
)
1/21/2010 Recorded Flows ADWF - Weekday Calcualted I&I
A-13
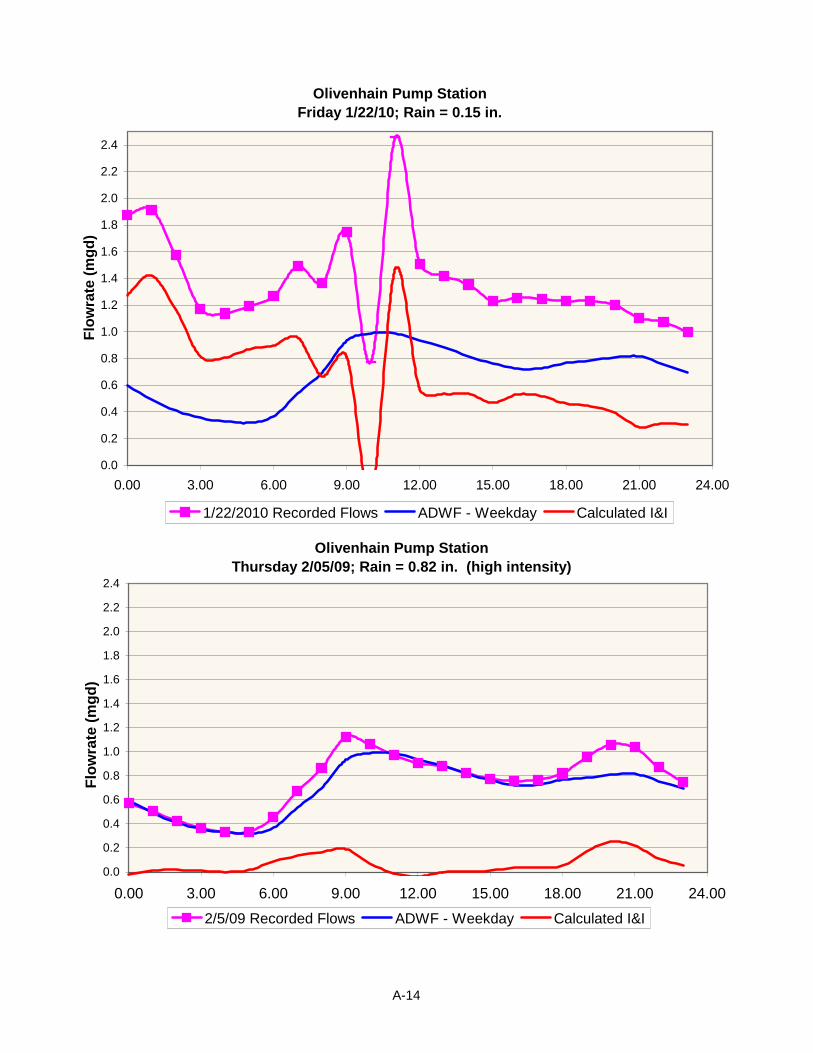
Olivenhain Pump StationFriday 1/22/10; Rain = 0.15 in.
0.0
0.2
0.4
0.6
0.8
1.0
1.2
1.4
1.6
1.8
2.0
2.2
2.4
0.00 3.00 6.00 9.00 12.00 15.00 18.00 21.00 24.00
Flow
rate
(mgd
)
1/22/2010 Recorded Flows ADWF - Weekday Calculated I&I
Olivenhain Pump StationThursday 2/05/09; Rain = 0.82 in. (high intensity)
0.0
0.2
0.4
0.6
0.8
1.0
1.2
1.4
1.6
1.8
2.0
2.2
2.4
0.00 3.00 6.00 9.00 12.00 15.00 18.00 21.00 24.00
Flow
rate
(mgd
)
2/5/09 Recorded Flows ADWF - Weekday Calculated I&I
A-14
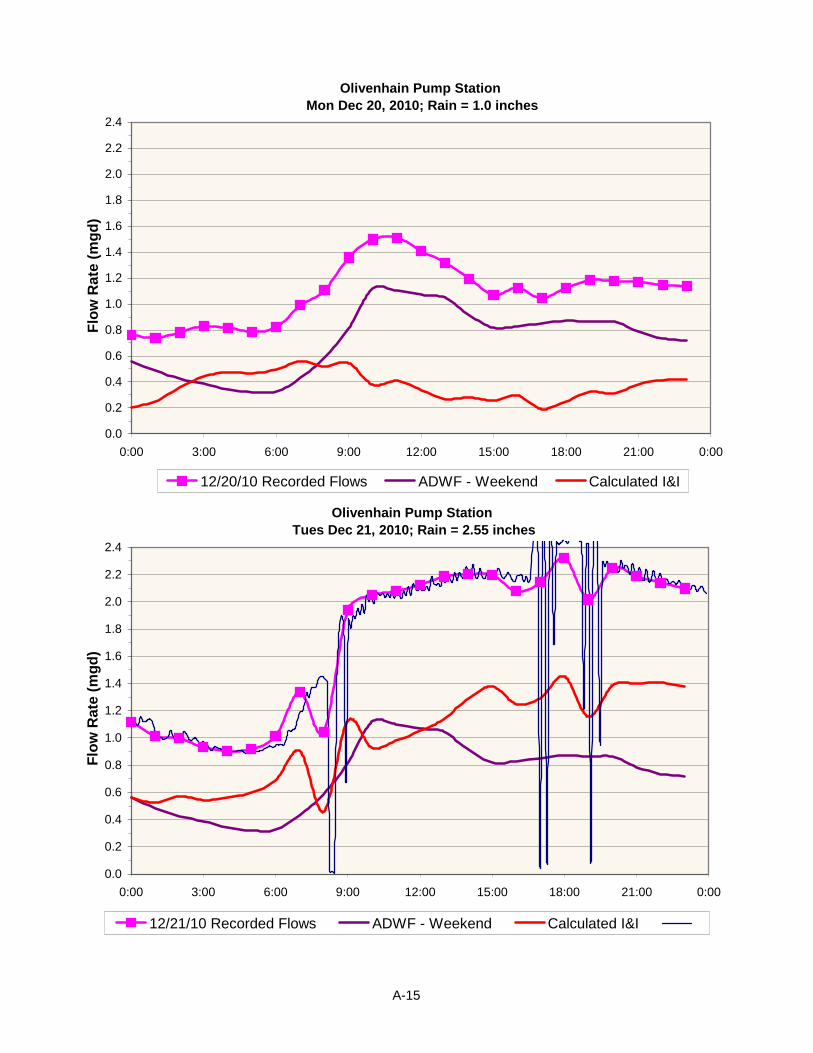
Olivenhain Pump Station Mon Dec 20, 2010; Rain = 1.0 inches
0.0
0.2
0.4
0.6
0.8
1.0
1.2
1.4
1.6
1.8
2.0
2.2
2.4
0:00 3:00 6:00 9:00 12:00 15:00 18:00 21:00 0:00
Flow
Rat
e (m
gd)
12/20/10 Recorded Flows ADWF - Weekend Calculated I&I
Olivenhain Pump Station Tues Dec 21, 2010; Rain = 2.55 inches
0.0
0.2
0.4
0.6
0.8
1.0
1.2
1.4
1.6
1.8
2.0
2.2
2.4
0:00 3:00 6:00 9:00 12:00 15:00 18:00 21:00 0:00
Flow
Rat
e (m
gd)
12/21/10 Recorded Flows ADWF - Weekend Calculated I&I
A-15
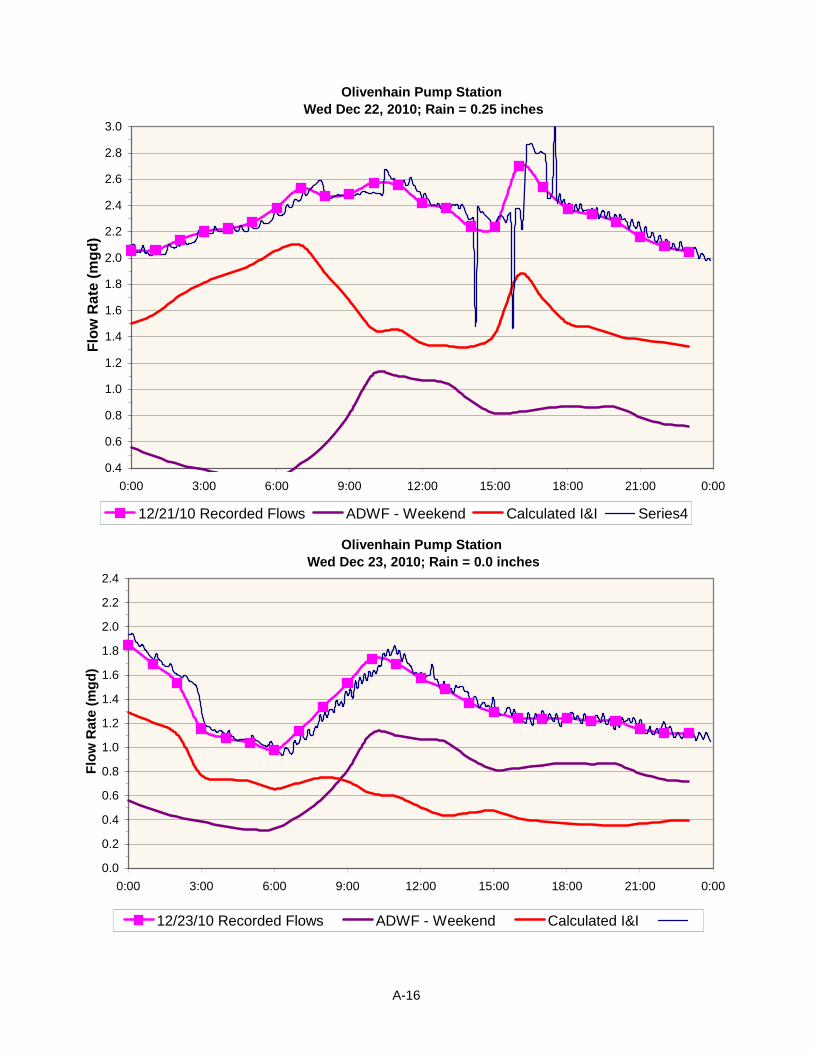
Olivenhain Pump Station Wed Dec 22, 2010; Rain = 0.25 inches
0.4
0.6
0.8
1.0
1.2
1.4
1.6
1.8
2.0
2.2
2.4
2.6
2.8
3.0
0:00 3:00 6:00 9:00 12:00 15:00 18:00 21:00 0:00
Flow
Rat
e (m
gd)
12/21/10 Recorded Flows ADWF - Weekend Calculated I&I Series4
Olivenhain Pump Station Wed Dec 23, 2010; Rain = 0.0 inches
0.0
0.2
0.4
0.6
0.8
1.0
1.2
1.4
1.6
1.8
2.0
2.2
2.4
0:00 3:00 6:00 9:00 12:00 15:00 18:00 21:00 0:00
Flow
Rat
e (m
gd)
12/23/10 Recorded Flows ADWF - Weekend Calculated I&I
A-16
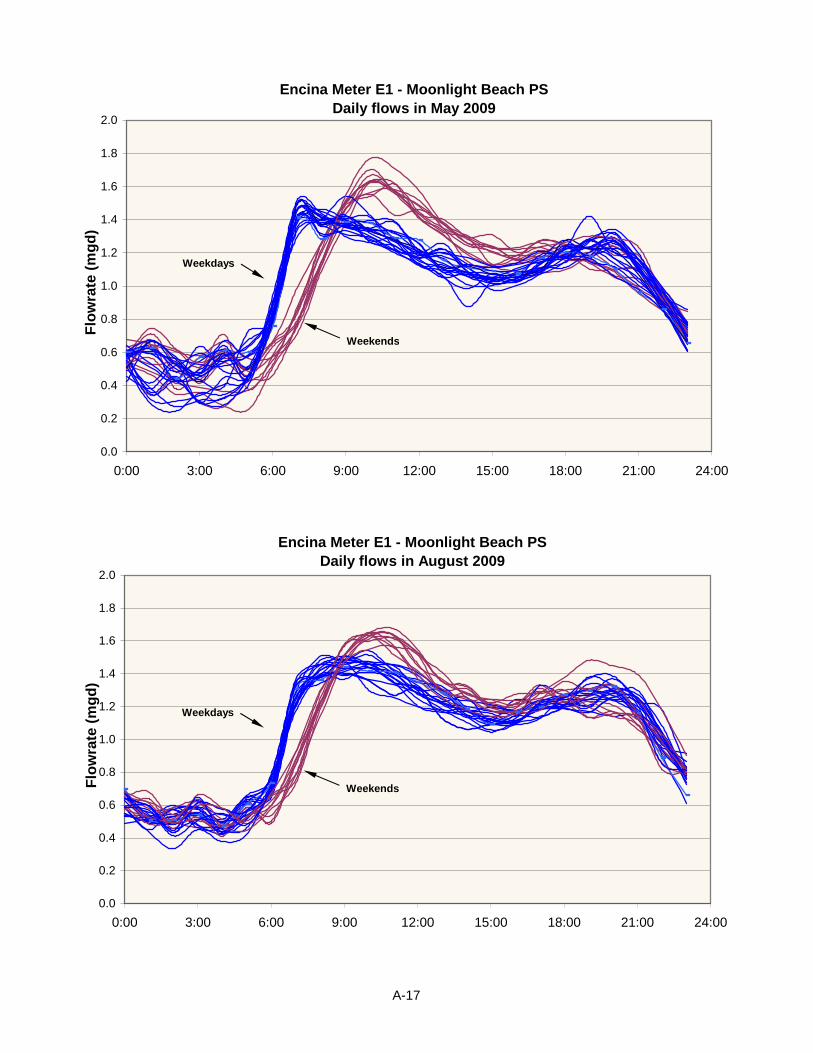
Encina Meter E1 - Moonlight Beach PSDaily flows in May 2009
0.0
0.2
0.4
0.6
0.8
1.0
1.2
1.4
1.6
1.8
2.0
0:00 3:00 6:00 9:00 12:00 15:00 18:00 21:00 24:00
Flow
rate
(mgd
)
Weekends
Weekdays
Encina Meter E1 - Moonlight Beach PSDaily flows in August 2009
0.0
0.2
0.4
0.6
0.8
1.0
1.2
1.4
1.6
1.8
2.0
0:00 3:00 6:00 9:00 12:00 15:00 18:00 21:00 24:00
Flow
rate
(mgd
)
Weekends
Weekdays
A-17
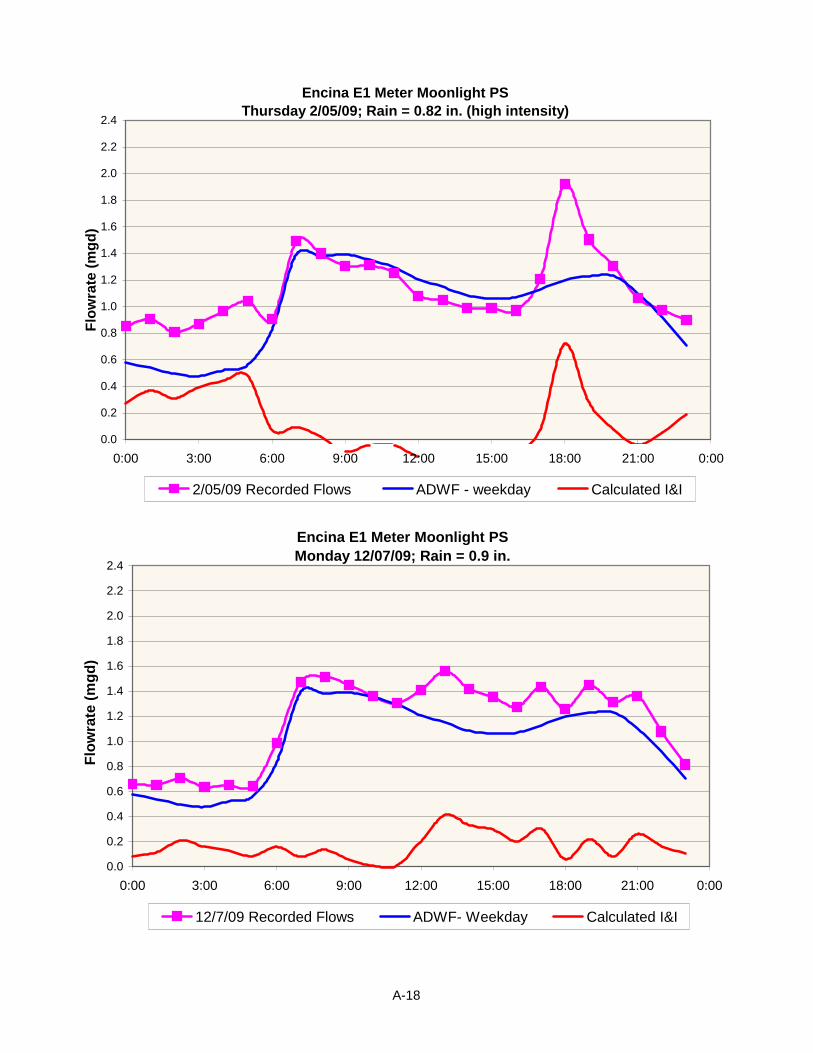
Encina E1 Meter Moonlight PS Thursday 2/05/09; Rain = 0.82 in. (high intensity)
0.0
0.2
0.4
0.6
0.8
1.0
1.2
1.4
1.6
1.8
2.0
2.2
2.4
0:00 3:00 6:00 9:00 12:00 15:00 18:00 21:00 0:00
Flow
rate
(mgd
)
2/05/09 Recorded Flows ADWF - weekday Calculated I&I
Encina E1 Meter Moonlight PS Monday 12/07/09; Rain = 0.9 in.
0.0
0.2
0.4
0.6
0.8
1.0
1.2
1.4
1.6
1.8
2.0
2.2
2.4
0:00 3:00 6:00 9:00 12:00 15:00 18:00 21:00 0:00
Flow
rate
(mgd
)
12/7/09 Recorded Flows ADWF- Weekday Calculated I&I
A-18
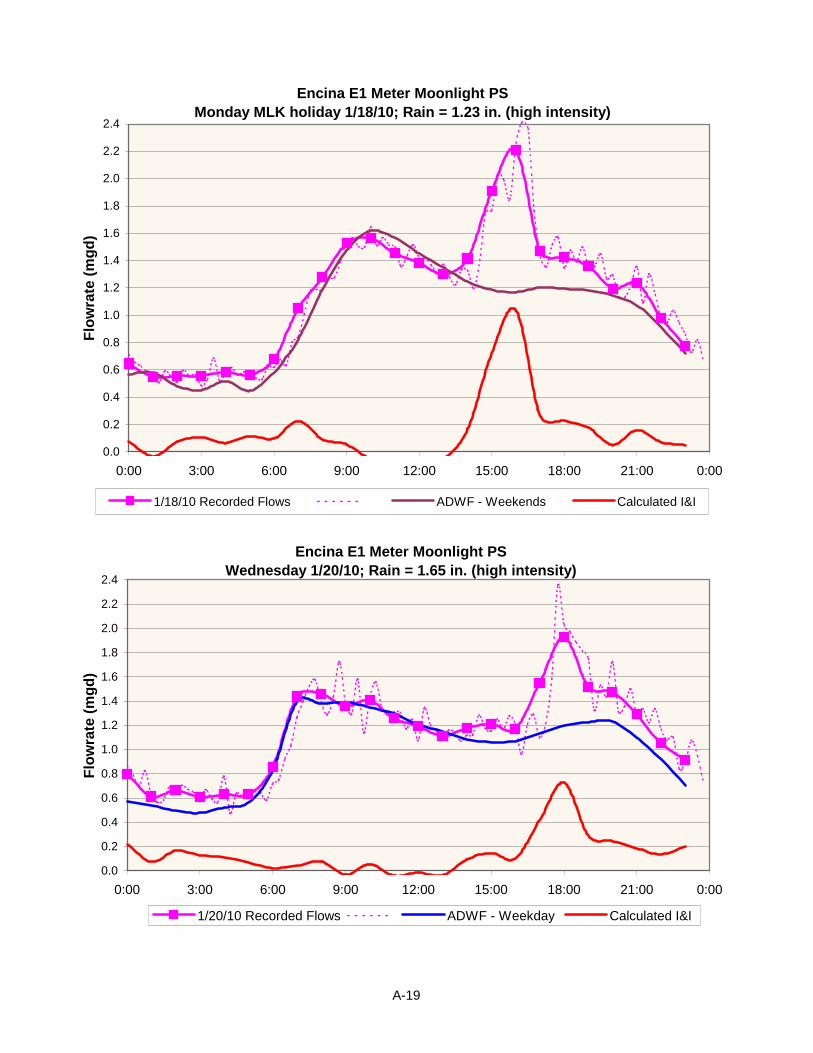
Encina E1 Meter Moonlight PS Monday MLK holiday 1/18/10; Rain = 1.23 in. (high intensity)
0.0
0.2
0.4
0.6
0.8
1.0
1.2
1.4
1.6
1.8
2.0
2.2
2.4
0:00 3:00 6:00 9:00 12:00 15:00 18:00 21:00 0:00
Flow
rate
(mgd
)
1/18/10 Recorded Flows ADWF - Weekends Calculated I&I
Encina E1 Meter Moonlight PS Wednesday 1/20/10; Rain = 1.65 in. (high intensity)
0.0
0.2
0.4
0.6
0.8
1.0
1.2
1.4
1.6
1.8
2.0
2.2
2.4
0:00 3:00 6:00 9:00 12:00 15:00 18:00 21:00 0:00
Flow
rate
(mgd
)
1/20/10 Recorded Flows ADWF - Weekday Calculated I&I
A-19
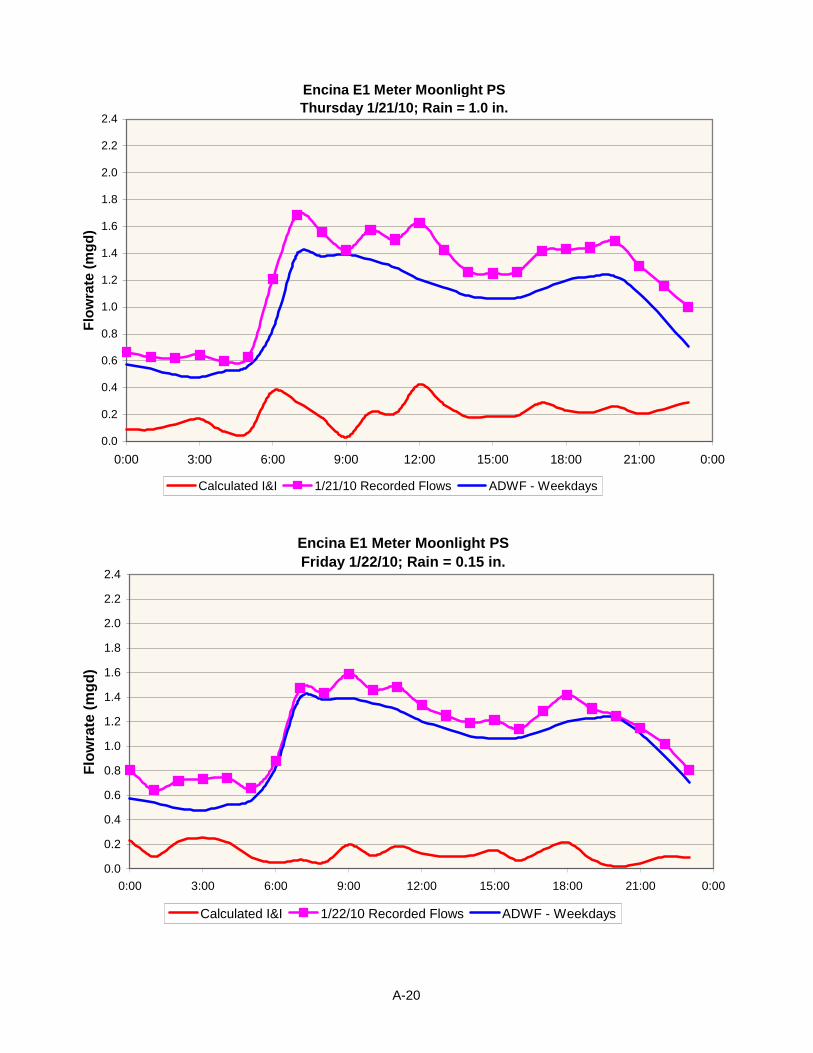
Encina E1 Meter Moonlight PS Thursday 1/21/10; Rain = 1.0 in.
0.0
0.2
0.4
0.6
0.8
1.0
1.2
1.4
1.6
1.8
2.0
2.2
2.4
0:00 3:00 6:00 9:00 12:00 15:00 18:00 21:00 0:00
Flow
rate
(mgd
)
Calculated I&I 1/21/10 Recorded Flows ADWF - Weekdays
Encina E1 Meter Moonlight PS Friday 1/22/10; Rain = 0.15 in.
0.0
0.2
0.4
0.6
0.8
1.0
1.2
1.4
1.6
1.8
2.0
2.2
2.4
0:00 3:00 6:00 9:00 12:00 15:00 18:00 21:00 0:00
Flow
rate
(mgd
)
Calculated I&I 1/22/10 Recorded Flows ADWF - Weekdays
A-20
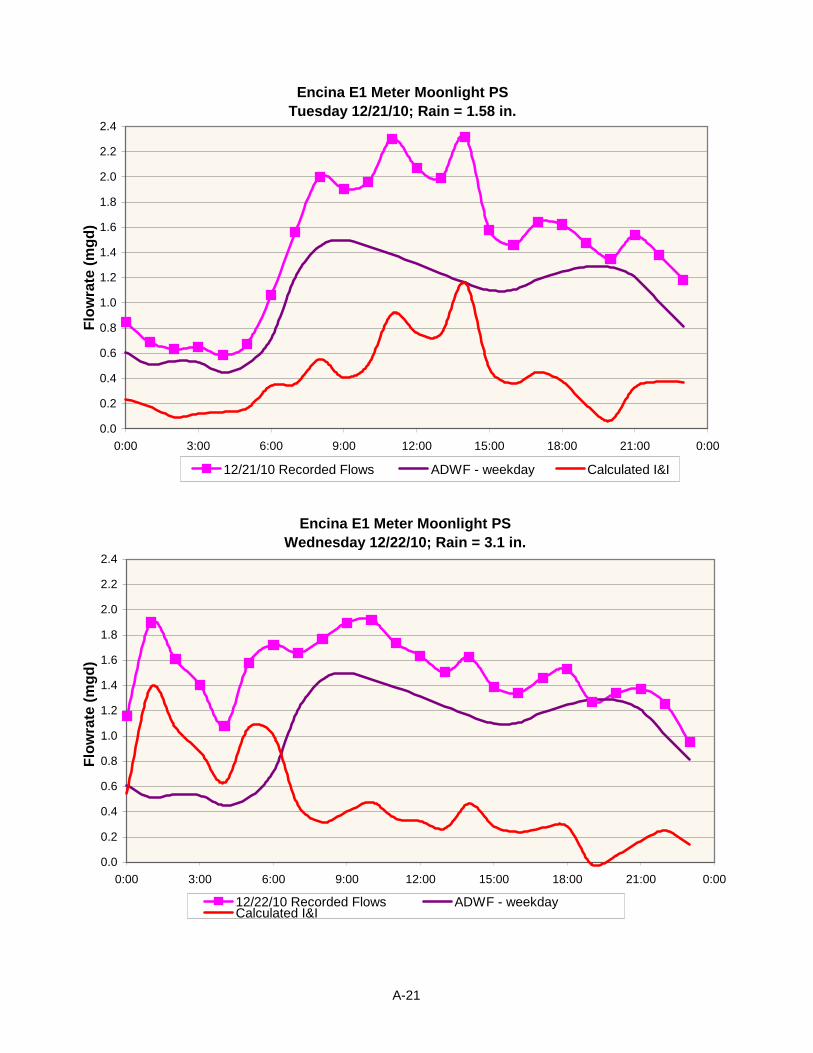
Encina E1 Meter Moonlight PS Tuesday 12/21/10; Rain = 1.58 in.
0.0
0.2
0.4
0.6
0.8
1.0
1.2
1.4
1.6
1.8
2.0
2.2
2.4
0:00 3:00 6:00 9:00 12:00 15:00 18:00 21:00 0:00
Flow
rate
(mgd
)
12/21/10 Recorded Flows ADWF - weekday Calculated I&I
Encina E1 Meter Moonlight PS Wednesday 12/22/10; Rain = 3.1 in.
0.0
0.2
0.4
0.6
0.8
1.0
1.2
1.4
1.6
1.8
2.0
2.2
2.4
0:00 3:00 6:00 9:00 12:00 15:00 18:00 21:00 0:00
Flow
rate
(mgd
)
12/22/10 Recorded Flows ADWF - weekdayCalculated I&I
A-21

CSD and ESD DUDEK
SEWER MASTER PLAN UPDATE April 2011
INTENTIONALLY LEFT BLANK
CSD and ESD DUDEK
SEWER MASTER PLAN UPDATE April 2011
APPENDIX B Hydraulic Model Output
Cardiff Trunk Sewer
Cardiff Trunk Sewer – Relief Portion
Cardiff Gravity Trunk Sewer
Olivenhain Trunk Sewer
Encinitas Trunk sewer

CSD and ESD DUDEK
SEWER MASTER PLAN UPDATE April 2011
INTENTIONALLY LEFT BLANK
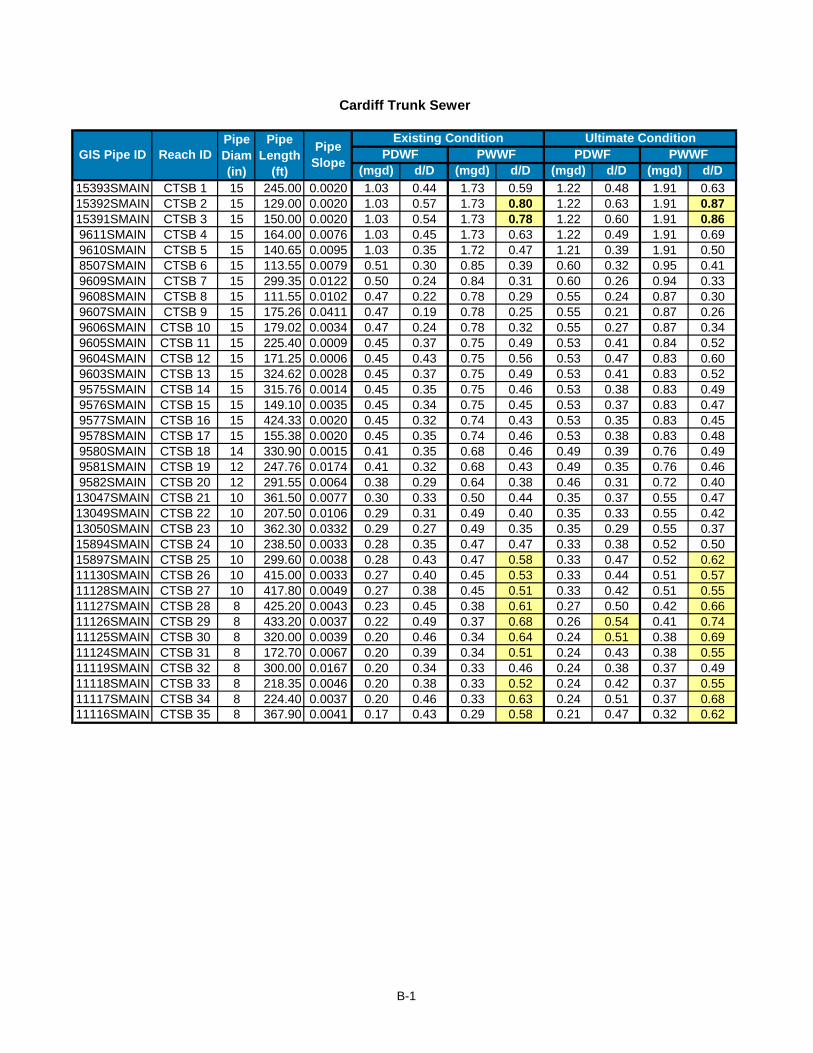
(mgd) d/D (mgd) d/D (mgd) d/D (mgd) d/D15393SMAIN CTSB 1 15 245.00 0.0020 1.03 0.44 1.73 0.59 1.22 0.48 1.91 0.6315392SMAIN CTSB 2 15 129.00 0.0020 1.03 0.57 1.73 0.80 1.22 0.63 1.91 0.8715391SMAIN CTSB 3 15 150.00 0.0020 1.03 0.54 1.73 0.78 1.22 0.60 1.91 0.869611SMAIN CTSB 4 15 164.00 0.0076 1.03 0.45 1.73 0.63 1.22 0.49 1.91 0.699610SMAIN CTSB 5 15 140.65 0.0095 1.03 0.35 1.72 0.47 1.21 0.39 1.91 0.508507SMAIN CTSB 6 15 113.55 0.0079 0.51 0.30 0.85 0.39 0.60 0.32 0.95 0.419609SMAIN CTSB 7 15 299.35 0.0122 0.50 0.24 0.84 0.31 0.60 0.26 0.94 0.339608SMAIN CTSB 8 15 111.55 0.0102 0.47 0.22 0.78 0.29 0.55 0.24 0.87 0.309607SMAIN CTSB 9 15 175.26 0.0411 0.47 0.19 0.78 0.25 0.55 0.21 0.87 0.269606SMAIN CTSB 10 15 179.02 0.0034 0.47 0.24 0.78 0.32 0.55 0.27 0.87 0.349605SMAIN CTSB 11 15 225.40 0.0009 0.45 0.37 0.75 0.49 0.53 0.41 0.84 0.529604SMAIN CTSB 12 15 171.25 0.0006 0.45 0.43 0.75 0.56 0.53 0.47 0.83 0.609603SMAIN CTSB 13 15 324.62 0.0028 0.45 0.37 0.75 0.49 0.53 0.41 0.83 0.529575SMAIN CTSB 14 15 315.76 0.0014 0.45 0.35 0.75 0.46 0.53 0.38 0.83 0.499576SMAIN CTSB 15 15 149.10 0.0035 0.45 0.34 0.75 0.45 0.53 0.37 0.83 0.479577SMAIN CTSB 16 15 424.33 0.0020 0.45 0.32 0.74 0.43 0.53 0.35 0.83 0.459578SMAIN CTSB 17 15 155.38 0.0020 0.45 0.35 0.74 0.46 0.53 0.38 0.83 0.489580SMAIN CTSB 18 14 330.90 0.0015 0.41 0.35 0.68 0.46 0.49 0.39 0.76 0.499581SMAIN CTSB 19 12 247.76 0.0174 0.41 0.32 0.68 0.43 0.49 0.35 0.76 0.469582SMAIN CTSB 20 12 291.55 0.0064 0.38 0.29 0.64 0.38 0.46 0.31 0.72 0.4013047SMAIN CTSB 21 10 361.50 0.0077 0.30 0.33 0.50 0.44 0.35 0.37 0.55 0.4713049SMAIN CTSB 22 10 207.50 0.0106 0.29 0.31 0.49 0.40 0.35 0.33 0.55 0.4213050SMAIN CTSB 23 10 362.30 0.0332 0.29 0.27 0.49 0.35 0.35 0.29 0.55 0.3715894SMAIN CTSB 24 10 238.50 0.0033 0.28 0.35 0.47 0.47 0.33 0.38 0.52 0.5015897SMAIN CTSB 25 10 299.60 0.0038 0.28 0.43 0.47 0.58 0.33 0.47 0.52 0.6211130SMAIN CTSB 26 10 415.00 0.0033 0.27 0.40 0.45 0.53 0.33 0.44 0.51 0.5711128SMAIN CTSB 27 10 417.80 0.0049 0.27 0.38 0.45 0.51 0.33 0.42 0.51 0.5511127SMAIN CTSB 28 8 425.20 0.0043 0.23 0.45 0.38 0.61 0.27 0.50 0.42 0.6611126SMAIN CTSB 29 8 433.20 0.0037 0.22 0.49 0.37 0.68 0.26 0.54 0.41 0.7411125SMAIN CTSB 30 8 320.00 0.0039 0.20 0.46 0.34 0.64 0.24 0.51 0.38 0.6911124SMAIN CTSB 31 8 172.70 0.0067 0.20 0.39 0.34 0.51 0.24 0.43 0.38 0.5511119SMAIN CTSB 32 8 300.00 0.0167 0.20 0.34 0.33 0.46 0.24 0.38 0.37 0.4911118SMAIN CTSB 33 8 218.35 0.0046 0.20 0.38 0.33 0.52 0.24 0.42 0.37 0.5511117SMAIN CTSB 34 8 224.40 0.0037 0.20 0.46 0.33 0.63 0.24 0.51 0.37 0.6811116SMAIN CTSB 35 8 367.90 0.0041 0.17 0.43 0.29 0.58 0.21 0.47 0.32 0.62
Cardiff Trunk Sewer
GIS Pipe ID Reach IDPipe Diam (in)
Pipe Length
(ft)
Pipe Slope
Existing Condition Ultimate ConditionPDWF PWWF PDWF PWWF
B-1
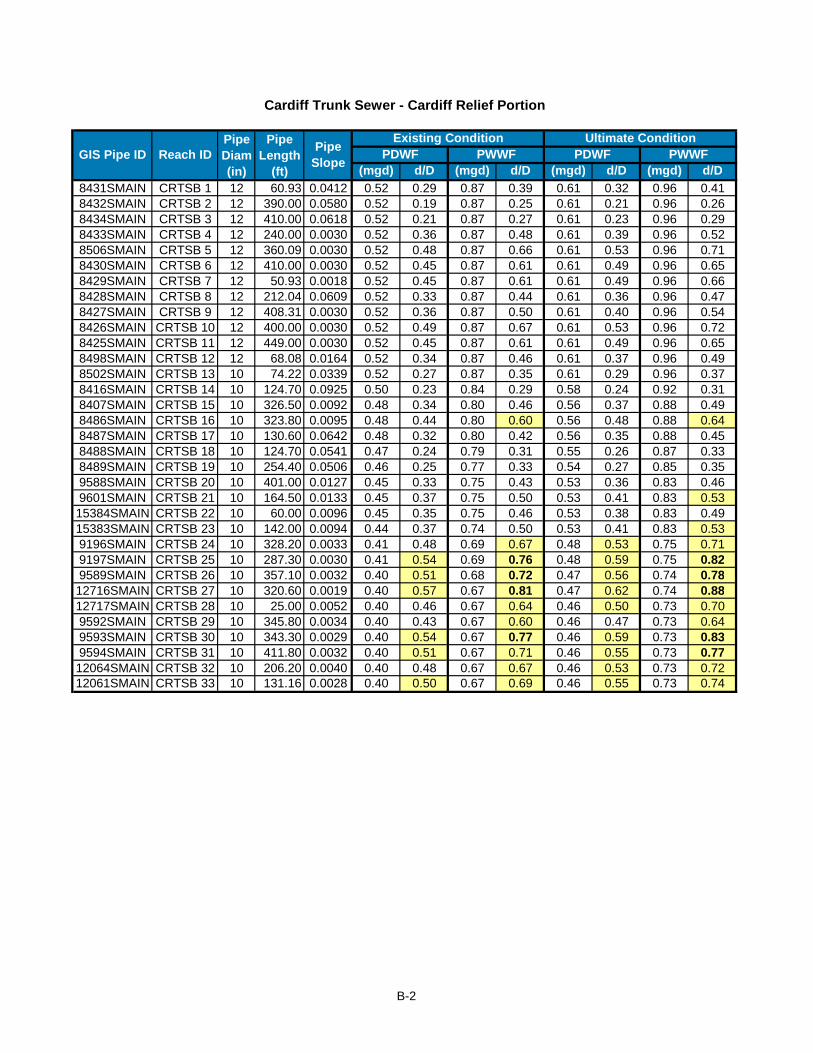
(mgd) d/D (mgd) d/D (mgd) d/D (mgd) d/D8431SMAIN CRTSB 1 12 60.93 0.0412 0.52 0.29 0.87 0.39 0.61 0.32 0.96 0.418432SMAIN CRTSB 2 12 390.00 0.0580 0.52 0.19 0.87 0.25 0.61 0.21 0.96 0.268434SMAIN CRTSB 3 12 410.00 0.0618 0.52 0.21 0.87 0.27 0.61 0.23 0.96 0.298433SMAIN CRTSB 4 12 240.00 0.0030 0.52 0.36 0.87 0.48 0.61 0.39 0.96 0.528506SMAIN CRTSB 5 12 360.09 0.0030 0.52 0.48 0.87 0.66 0.61 0.53 0.96 0.718430SMAIN CRTSB 6 12 410.00 0.0030 0.52 0.45 0.87 0.61 0.61 0.49 0.96 0.658429SMAIN CRTSB 7 12 50.93 0.0018 0.52 0.45 0.87 0.61 0.61 0.49 0.96 0.668428SMAIN CRTSB 8 12 212.04 0.0609 0.52 0.33 0.87 0.44 0.61 0.36 0.96 0.478427SMAIN CRTSB 9 12 408.31 0.0030 0.52 0.36 0.87 0.50 0.61 0.40 0.96 0.548426SMAIN CRTSB 10 12 400.00 0.0030 0.52 0.49 0.87 0.67 0.61 0.53 0.96 0.728425SMAIN CRTSB 11 12 449.00 0.0030 0.52 0.45 0.87 0.61 0.61 0.49 0.96 0.658498SMAIN CRTSB 12 12 68.08 0.0164 0.52 0.34 0.87 0.46 0.61 0.37 0.96 0.498502SMAIN CRTSB 13 10 74.22 0.0339 0.52 0.27 0.87 0.35 0.61 0.29 0.96 0.378416SMAIN CRTSB 14 10 124.70 0.0925 0.50 0.23 0.84 0.29 0.58 0.24 0.92 0.318407SMAIN CRTSB 15 10 326.50 0.0092 0.48 0.34 0.80 0.46 0.56 0.37 0.88 0.498486SMAIN CRTSB 16 10 323.80 0.0095 0.48 0.44 0.80 0.60 0.56 0.48 0.88 0.648487SMAIN CRTSB 17 10 130.60 0.0642 0.48 0.32 0.80 0.42 0.56 0.35 0.88 0.458488SMAIN CRTSB 18 10 124.70 0.0541 0.47 0.24 0.79 0.31 0.55 0.26 0.87 0.338489SMAIN CRTSB 19 10 254.40 0.0506 0.46 0.25 0.77 0.33 0.54 0.27 0.85 0.359588SMAIN CRTSB 20 10 401.00 0.0127 0.45 0.33 0.75 0.43 0.53 0.36 0.83 0.469601SMAIN CRTSB 21 10 164.50 0.0133 0.45 0.37 0.75 0.50 0.53 0.41 0.83 0.5315384SMAIN CRTSB 22 10 60.00 0.0096 0.45 0.35 0.75 0.46 0.53 0.38 0.83 0.4915383SMAIN CRTSB 23 10 142.00 0.0094 0.44 0.37 0.74 0.50 0.53 0.41 0.83 0.539196SMAIN CRTSB 24 10 328.20 0.0033 0.41 0.48 0.69 0.67 0.48 0.53 0.75 0.719197SMAIN CRTSB 25 10 287.30 0.0030 0.41 0.54 0.69 0.76 0.48 0.59 0.75 0.829589SMAIN CRTSB 26 10 357.10 0.0032 0.40 0.51 0.68 0.72 0.47 0.56 0.74 0.7812716SMAIN CRTSB 27 10 320.60 0.0019 0.40 0.57 0.67 0.81 0.47 0.62 0.74 0.8812717SMAIN CRTSB 28 10 25.00 0.0052 0.40 0.46 0.67 0.64 0.46 0.50 0.73 0.709592SMAIN CRTSB 29 10 345.80 0.0034 0.40 0.43 0.67 0.60 0.46 0.47 0.73 0.649593SMAIN CRTSB 30 10 343.30 0.0029 0.40 0.54 0.67 0.77 0.46 0.59 0.73 0.839594SMAIN CRTSB 31 10 411.80 0.0032 0.40 0.51 0.67 0.71 0.46 0.55 0.73 0.7712064SMAIN CRTSB 32 10 206.20 0.0040 0.40 0.48 0.67 0.67 0.46 0.53 0.73 0.7212061SMAIN CRTSB 33 10 131.16 0.0028 0.40 0.50 0.67 0.69 0.46 0.55 0.73 0.74
Cardiff Trunk Sewer - Cardiff Relief Portion
GIS Pipe ID Reach IDPipe Diam (in)
Pipe Length
(ft)
Pipe Slope
Existing Condition Ultimate ConditionPDWF PWWF PDWF PWWF
B-2
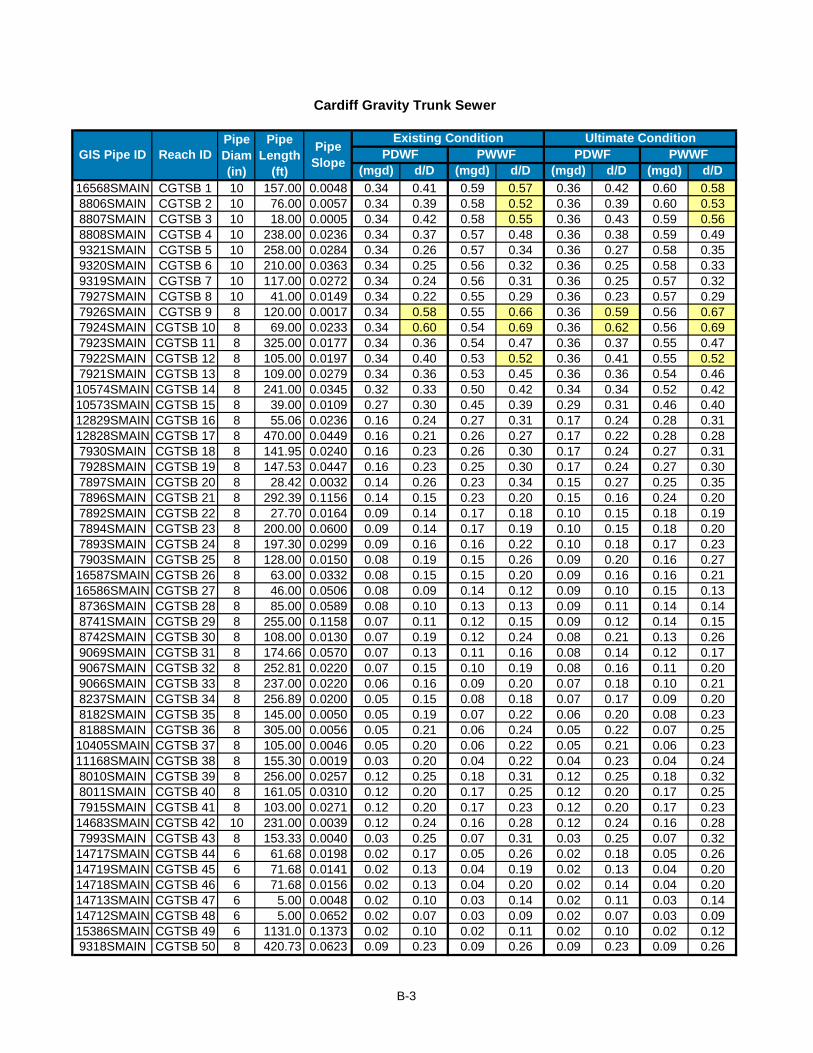
(mgd) d/D (mgd) d/D (mgd) d/D (mgd) d/D16568SMAIN CGTSB 1 10 157.00 0.0048 0.34 0.41 0.59 0.57 0.36 0.42 0.60 0.588806SMAIN CGTSB 2 10 76.00 0.0057 0.34 0.39 0.58 0.52 0.36 0.39 0.60 0.538807SMAIN CGTSB 3 10 18.00 0.0005 0.34 0.42 0.58 0.55 0.36 0.43 0.59 0.568808SMAIN CGTSB 4 10 238.00 0.0236 0.34 0.37 0.57 0.48 0.36 0.38 0.59 0.499321SMAIN CGTSB 5 10 258.00 0.0284 0.34 0.26 0.57 0.34 0.36 0.27 0.58 0.359320SMAIN CGTSB 6 10 210.00 0.0363 0.34 0.25 0.56 0.32 0.36 0.25 0.58 0.339319SMAIN CGTSB 7 10 117.00 0.0272 0.34 0.24 0.56 0.31 0.36 0.25 0.57 0.327927SMAIN CGTSB 8 10 41.00 0.0149 0.34 0.22 0.55 0.29 0.36 0.23 0.57 0.297926SMAIN CGTSB 9 8 120.00 0.0017 0.34 0.58 0.55 0.66 0.36 0.59 0.56 0.677924SMAIN CGTSB 10 8 69.00 0.0233 0.34 0.60 0.54 0.69 0.36 0.62 0.56 0.697923SMAIN CGTSB 11 8 325.00 0.0177 0.34 0.36 0.54 0.47 0.36 0.37 0.55 0.477922SMAIN CGTSB 12 8 105.00 0.0197 0.34 0.40 0.53 0.52 0.36 0.41 0.55 0.527921SMAIN CGTSB 13 8 109.00 0.0279 0.34 0.36 0.53 0.45 0.36 0.36 0.54 0.4610574SMAIN CGTSB 14 8 241.00 0.0345 0.32 0.33 0.50 0.42 0.34 0.34 0.52 0.4210573SMAIN CGTSB 15 8 39.00 0.0109 0.27 0.30 0.45 0.39 0.29 0.31 0.46 0.4012829SMAIN CGTSB 16 8 55.06 0.0236 0.16 0.24 0.27 0.31 0.17 0.24 0.28 0.3112828SMAIN CGTSB 17 8 470.00 0.0449 0.16 0.21 0.26 0.27 0.17 0.22 0.28 0.287930SMAIN CGTSB 18 8 141.95 0.0240 0.16 0.23 0.26 0.30 0.17 0.24 0.27 0.317928SMAIN CGTSB 19 8 147.53 0.0447 0.16 0.23 0.25 0.30 0.17 0.24 0.27 0.307897SMAIN CGTSB 20 8 28.42 0.0032 0.14 0.26 0.23 0.34 0.15 0.27 0.25 0.357896SMAIN CGTSB 21 8 292.39 0.1156 0.14 0.15 0.23 0.20 0.15 0.16 0.24 0.207892SMAIN CGTSB 22 8 27.70 0.0164 0.09 0.14 0.17 0.18 0.10 0.15 0.18 0.197894SMAIN CGTSB 23 8 200.00 0.0600 0.09 0.14 0.17 0.19 0.10 0.15 0.18 0.207893SMAIN CGTSB 24 8 197.30 0.0299 0.09 0.16 0.16 0.22 0.10 0.18 0.17 0.237903SMAIN CGTSB 25 8 128.00 0.0150 0.08 0.19 0.15 0.26 0.09 0.20 0.16 0.2716587SMAIN CGTSB 26 8 63.00 0.0332 0.08 0.15 0.15 0.20 0.09 0.16 0.16 0.2116586SMAIN CGTSB 27 8 46.00 0.0506 0.08 0.09 0.14 0.12 0.09 0.10 0.15 0.138736SMAIN CGTSB 28 8 85.00 0.0589 0.08 0.10 0.13 0.13 0.09 0.11 0.14 0.148741SMAIN CGTSB 29 8 255.00 0.1158 0.07 0.11 0.12 0.15 0.09 0.12 0.14 0.158742SMAIN CGTSB 30 8 108.00 0.0130 0.07 0.19 0.12 0.24 0.08 0.21 0.13 0.269069SMAIN CGTSB 31 8 174.66 0.0570 0.07 0.13 0.11 0.16 0.08 0.14 0.12 0.179067SMAIN CGTSB 32 8 252.81 0.0220 0.07 0.15 0.10 0.19 0.08 0.16 0.11 0.209066SMAIN CGTSB 33 8 237.00 0.0220 0.06 0.16 0.09 0.20 0.07 0.18 0.10 0.218237SMAIN CGTSB 34 8 256.89 0.0200 0.05 0.15 0.08 0.18 0.07 0.17 0.09 0.208182SMAIN CGTSB 35 8 145.00 0.0050 0.05 0.19 0.07 0.22 0.06 0.20 0.08 0.238188SMAIN CGTSB 36 8 305.00 0.0056 0.05 0.21 0.06 0.24 0.05 0.22 0.07 0.2510405SMAIN CGTSB 37 8 105.00 0.0046 0.05 0.20 0.06 0.22 0.05 0.21 0.06 0.2311168SMAIN CGTSB 38 8 155.30 0.0019 0.03 0.20 0.04 0.22 0.04 0.23 0.04 0.248010SMAIN CGTSB 39 8 256.00 0.0257 0.12 0.25 0.18 0.31 0.12 0.25 0.18 0.328011SMAIN CGTSB 40 8 161.05 0.0310 0.12 0.20 0.17 0.25 0.12 0.20 0.17 0.257915SMAIN CGTSB 41 8 103.00 0.0271 0.12 0.20 0.17 0.23 0.12 0.20 0.17 0.2314683SMAIN CGTSB 42 10 231.00 0.0039 0.12 0.24 0.16 0.28 0.12 0.24 0.16 0.287993SMAIN CGTSB 43 8 153.33 0.0040 0.03 0.25 0.07 0.31 0.03 0.25 0.07 0.3214717SMAIN CGTSB 44 6 61.68 0.0198 0.02 0.17 0.05 0.26 0.02 0.18 0.05 0.2614719SMAIN CGTSB 45 6 71.68 0.0141 0.02 0.13 0.04 0.19 0.02 0.13 0.04 0.2014718SMAIN CGTSB 46 6 71.68 0.0156 0.02 0.13 0.04 0.20 0.02 0.14 0.04 0.2014713SMAIN CGTSB 47 6 5.00 0.0048 0.02 0.10 0.03 0.14 0.02 0.11 0.03 0.1414712SMAIN CGTSB 48 6 5.00 0.0652 0.02 0.07 0.03 0.09 0.02 0.07 0.03 0.0915386SMAIN CGTSB 49 6 1131.0 0.1373 0.02 0.10 0.02 0.11 0.02 0.10 0.02 0.129318SMAIN CGTSB 50 8 420.73 0.0623 0.09 0.23 0.09 0.26 0.09 0.23 0.09 0.26
Cardiff Gravity Trunk Sewer
GIS Pipe ID Reach IDPipe Diam (in)
Pipe Length
(ft)
Pipe Slope
Existing Condition Ultimate ConditionPDWF PWWF PDWF PWWF
B-3
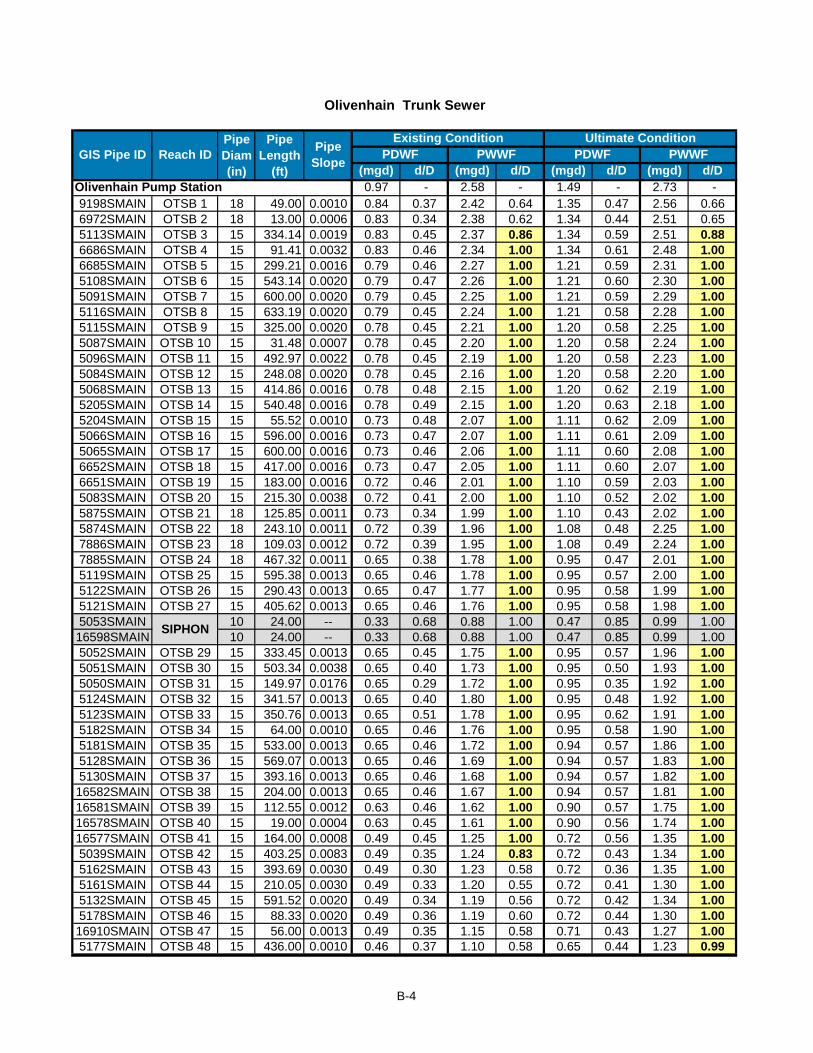
(mgd) d/D (mgd) d/D (mgd) d/D (mgd) d/D0.97 - 2.58 - 1.49 - 2.73 -
9198SMAIN OTSB 1 18 49.00 0.0010 0.84 0.37 2.42 0.64 1.35 0.47 2.56 0.666972SMAIN OTSB 2 18 13.00 0.0006 0.83 0.34 2.38 0.62 1.34 0.44 2.51 0.655113SMAIN OTSB 3 15 334.14 0.0019 0.83 0.45 2.37 0.86 1.34 0.59 2.51 0.886686SMAIN OTSB 4 15 91.41 0.0032 0.83 0.46 2.34 1.00 1.34 0.61 2.48 1.006685SMAIN OTSB 5 15 299.21 0.0016 0.79 0.46 2.27 1.00 1.21 0.59 2.31 1.005108SMAIN OTSB 6 15 543.14 0.0020 0.79 0.47 2.26 1.00 1.21 0.60 2.30 1.005091SMAIN OTSB 7 15 600.00 0.0020 0.79 0.45 2.25 1.00 1.21 0.59 2.29 1.005116SMAIN OTSB 8 15 633.19 0.0020 0.79 0.45 2.24 1.00 1.21 0.58 2.28 1.005115SMAIN OTSB 9 15 325.00 0.0020 0.78 0.45 2.21 1.00 1.20 0.58 2.25 1.005087SMAIN OTSB 10 15 31.48 0.0007 0.78 0.45 2.20 1.00 1.20 0.58 2.24 1.005096SMAIN OTSB 11 15 492.97 0.0022 0.78 0.45 2.19 1.00 1.20 0.58 2.23 1.005084SMAIN OTSB 12 15 248.08 0.0020 0.78 0.45 2.16 1.00 1.20 0.58 2.20 1.005068SMAIN OTSB 13 15 414.86 0.0016 0.78 0.48 2.15 1.00 1.20 0.62 2.19 1.005205SMAIN OTSB 14 15 540.48 0.0016 0.78 0.49 2.15 1.00 1.20 0.63 2.18 1.005204SMAIN OTSB 15 15 55.52 0.0010 0.73 0.48 2.07 1.00 1.11 0.62 2.09 1.005066SMAIN OTSB 16 15 596.00 0.0016 0.73 0.47 2.07 1.00 1.11 0.61 2.09 1.005065SMAIN OTSB 17 15 600.00 0.0016 0.73 0.46 2.06 1.00 1.11 0.60 2.08 1.006652SMAIN OTSB 18 15 417.00 0.0016 0.73 0.47 2.05 1.00 1.11 0.60 2.07 1.006651SMAIN OTSB 19 15 183.00 0.0016 0.72 0.46 2.01 1.00 1.10 0.59 2.03 1.005083SMAIN OTSB 20 15 215.30 0.0038 0.72 0.41 2.00 1.00 1.10 0.52 2.02 1.005875SMAIN OTSB 21 18 125.85 0.0011 0.73 0.34 1.99 1.00 1.10 0.43 2.02 1.005874SMAIN OTSB 22 18 243.10 0.0011 0.72 0.39 1.96 1.00 1.08 0.48 2.25 1.007886SMAIN OTSB 23 18 109.03 0.0012 0.72 0.39 1.95 1.00 1.08 0.49 2.24 1.007885SMAIN OTSB 24 18 467.32 0.0011 0.65 0.38 1.78 1.00 0.95 0.47 2.01 1.005119SMAIN OTSB 25 15 595.38 0.0013 0.65 0.46 1.78 1.00 0.95 0.57 2.00 1.005122SMAIN OTSB 26 15 290.43 0.0013 0.65 0.47 1.77 1.00 0.95 0.58 1.99 1.005121SMAIN OTSB 27 15 405.62 0.0013 0.65 0.46 1.76 1.00 0.95 0.58 1.98 1.005053SMAIN 10 24.00 -- 0.33 0.68 0.88 1.00 0.47 0.85 0.99 1.0016598SMAIN 10 24.00 -- 0.33 0.68 0.88 1.00 0.47 0.85 0.99 1.005052SMAIN OTSB 29 15 333.45 0.0013 0.65 0.45 1.75 1.00 0.95 0.57 1.96 1.005051SMAIN OTSB 30 15 503.34 0.0038 0.65 0.40 1.73 1.00 0.95 0.50 1.93 1.005050SMAIN OTSB 31 15 149.97 0.0176 0.65 0.29 1.72 1.00 0.95 0.35 1.92 1.005124SMAIN OTSB 32 15 341.57 0.0013 0.65 0.40 1.80 1.00 0.95 0.48 1.92 1.005123SMAIN OTSB 33 15 350.76 0.0013 0.65 0.51 1.78 1.00 0.95 0.62 1.91 1.005182SMAIN OTSB 34 15 64.00 0.0010 0.65 0.46 1.76 1.00 0.95 0.58 1.90 1.005181SMAIN OTSB 35 15 533.00 0.0013 0.65 0.46 1.72 1.00 0.94 0.57 1.86 1.005128SMAIN OTSB 36 15 569.07 0.0013 0.65 0.46 1.69 1.00 0.94 0.57 1.83 1.005130SMAIN OTSB 37 15 393.16 0.0013 0.65 0.46 1.68 1.00 0.94 0.57 1.82 1.0016582SMAIN OTSB 38 15 204.00 0.0013 0.65 0.46 1.67 1.00 0.94 0.57 1.81 1.0016581SMAIN OTSB 39 15 112.55 0.0012 0.63 0.46 1.62 1.00 0.90 0.57 1.75 1.0016578SMAIN OTSB 40 15 19.00 0.0004 0.63 0.45 1.61 1.00 0.90 0.56 1.74 1.0016577SMAIN OTSB 41 15 164.00 0.0008 0.49 0.45 1.25 1.00 0.72 0.56 1.35 1.005039SMAIN OTSB 42 15 403.25 0.0083 0.49 0.35 1.24 0.83 0.72 0.43 1.34 1.005162SMAIN OTSB 43 15 393.69 0.0030 0.49 0.30 1.23 0.58 0.72 0.36 1.35 1.005161SMAIN OTSB 44 15 210.05 0.0030 0.49 0.33 1.20 0.55 0.72 0.41 1.30 1.005132SMAIN OTSB 45 15 591.52 0.0020 0.49 0.34 1.19 0.56 0.72 0.42 1.34 1.005178SMAIN OTSB 46 15 88.33 0.0020 0.49 0.36 1.19 0.60 0.72 0.44 1.30 1.0016910SMAIN OTSB 47 15 56.00 0.0013 0.49 0.35 1.15 0.58 0.71 0.43 1.27 1.005177SMAIN OTSB 48 15 436.00 0.0010 0.46 0.37 1.10 0.58 0.65 0.44 1.23 0.99
Olivenhain Pump Station
SIPHON
GIS Pipe ID Reach IDPipe Diam (in)
Pipe Length
(ft)
Pipe Slope
Existing Condition Ultimate ConditionPDWF PWWF PDWF PWWF
Olivenhain Trunk Sewer
B-4
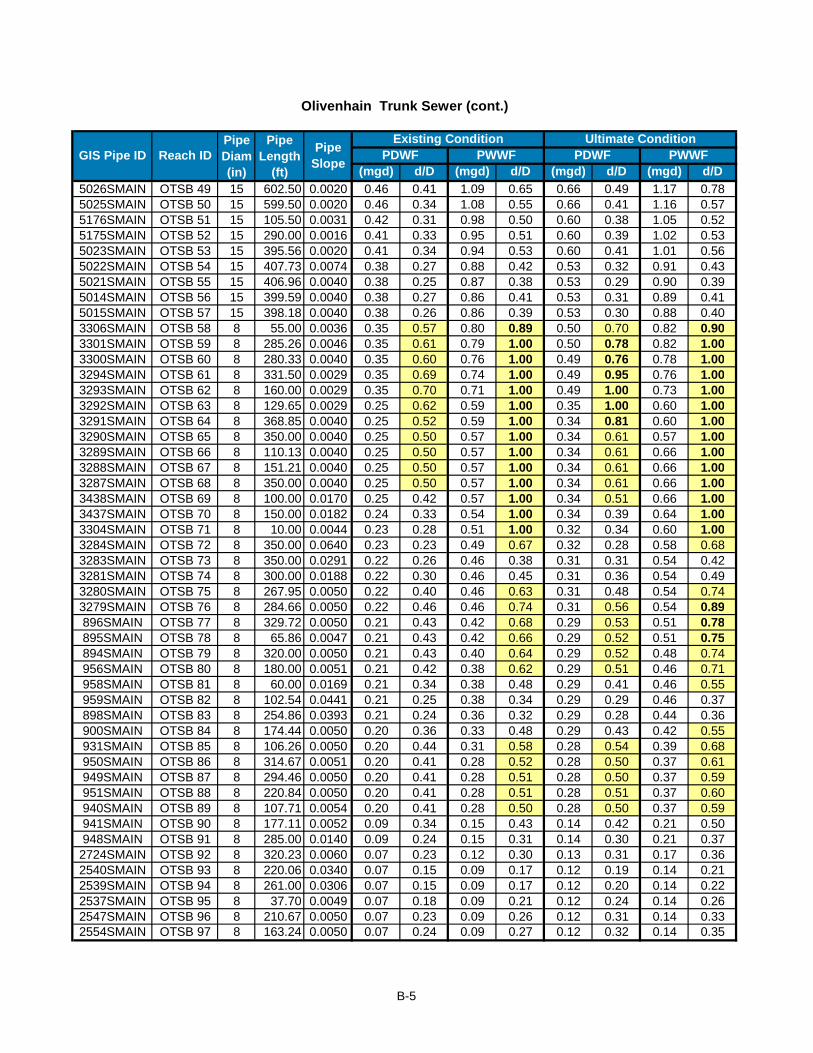
(mgd) d/D (mgd) d/D (mgd) d/D (mgd) d/D5026SMAIN OTSB 49 15 602.50 0.0020 0.46 0.41 1.09 0.65 0.66 0.49 1.17 0.785025SMAIN OTSB 50 15 599.50 0.0020 0.46 0.34 1.08 0.55 0.66 0.41 1.16 0.575176SMAIN OTSB 51 15 105.50 0.0031 0.42 0.31 0.98 0.50 0.60 0.38 1.05 0.525175SMAIN OTSB 52 15 290.00 0.0016 0.41 0.33 0.95 0.51 0.60 0.39 1.02 0.535023SMAIN OTSB 53 15 395.56 0.0020 0.41 0.34 0.94 0.53 0.60 0.41 1.01 0.565022SMAIN OTSB 54 15 407.73 0.0074 0.38 0.27 0.88 0.42 0.53 0.32 0.91 0.435021SMAIN OTSB 55 15 406.96 0.0040 0.38 0.25 0.87 0.38 0.53 0.29 0.90 0.395014SMAIN OTSB 56 15 399.59 0.0040 0.38 0.27 0.86 0.41 0.53 0.31 0.89 0.415015SMAIN OTSB 57 15 398.18 0.0040 0.38 0.26 0.86 0.39 0.53 0.30 0.88 0.403306SMAIN OTSB 58 8 55.00 0.0036 0.35 0.57 0.80 0.89 0.50 0.70 0.82 0.903301SMAIN OTSB 59 8 285.26 0.0046 0.35 0.61 0.79 1.00 0.50 0.78 0.82 1.003300SMAIN OTSB 60 8 280.33 0.0040 0.35 0.60 0.76 1.00 0.49 0.76 0.78 1.003294SMAIN OTSB 61 8 331.50 0.0029 0.35 0.69 0.74 1.00 0.49 0.95 0.76 1.003293SMAIN OTSB 62 8 160.00 0.0029 0.35 0.70 0.71 1.00 0.49 1.00 0.73 1.003292SMAIN OTSB 63 8 129.65 0.0029 0.25 0.62 0.59 1.00 0.35 1.00 0.60 1.003291SMAIN OTSB 64 8 368.85 0.0040 0.25 0.52 0.59 1.00 0.34 0.81 0.60 1.003290SMAIN OTSB 65 8 350.00 0.0040 0.25 0.50 0.57 1.00 0.34 0.61 0.57 1.003289SMAIN OTSB 66 8 110.13 0.0040 0.25 0.50 0.57 1.00 0.34 0.61 0.66 1.003288SMAIN OTSB 67 8 151.21 0.0040 0.25 0.50 0.57 1.00 0.34 0.61 0.66 1.003287SMAIN OTSB 68 8 350.00 0.0040 0.25 0.50 0.57 1.00 0.34 0.61 0.66 1.003438SMAIN OTSB 69 8 100.00 0.0170 0.25 0.42 0.57 1.00 0.34 0.51 0.66 1.003437SMAIN OTSB 70 8 150.00 0.0182 0.24 0.33 0.54 1.00 0.34 0.39 0.64 1.003304SMAIN OTSB 71 8 10.00 0.0044 0.23 0.28 0.51 1.00 0.32 0.34 0.60 1.003284SMAIN OTSB 72 8 350.00 0.0640 0.23 0.23 0.49 0.67 0.32 0.28 0.58 0.683283SMAIN OTSB 73 8 350.00 0.0291 0.22 0.26 0.46 0.38 0.31 0.31 0.54 0.423281SMAIN OTSB 74 8 300.00 0.0188 0.22 0.30 0.46 0.45 0.31 0.36 0.54 0.493280SMAIN OTSB 75 8 267.95 0.0050 0.22 0.40 0.46 0.63 0.31 0.48 0.54 0.743279SMAIN OTSB 76 8 284.66 0.0050 0.22 0.46 0.46 0.74 0.31 0.56 0.54 0.89896SMAIN OTSB 77 8 329.72 0.0050 0.21 0.43 0.42 0.68 0.29 0.53 0.51 0.78895SMAIN OTSB 78 8 65.86 0.0047 0.21 0.43 0.42 0.66 0.29 0.52 0.51 0.75894SMAIN OTSB 79 8 320.00 0.0050 0.21 0.43 0.40 0.64 0.29 0.52 0.48 0.74956SMAIN OTSB 80 8 180.00 0.0051 0.21 0.42 0.38 0.62 0.29 0.51 0.46 0.71958SMAIN OTSB 81 8 60.00 0.0169 0.21 0.34 0.38 0.48 0.29 0.41 0.46 0.55959SMAIN OTSB 82 8 102.54 0.0441 0.21 0.25 0.38 0.34 0.29 0.29 0.46 0.37898SMAIN OTSB 83 8 254.86 0.0393 0.21 0.24 0.36 0.32 0.29 0.28 0.44 0.36900SMAIN OTSB 84 8 174.44 0.0050 0.20 0.36 0.33 0.48 0.29 0.43 0.42 0.55931SMAIN OTSB 85 8 106.26 0.0050 0.20 0.44 0.31 0.58 0.28 0.54 0.39 0.68950SMAIN OTSB 86 8 314.67 0.0051 0.20 0.41 0.28 0.52 0.28 0.50 0.37 0.61949SMAIN OTSB 87 8 294.46 0.0050 0.20 0.41 0.28 0.51 0.28 0.50 0.37 0.59951SMAIN OTSB 88 8 220.84 0.0050 0.20 0.41 0.28 0.51 0.28 0.51 0.37 0.60940SMAIN OTSB 89 8 107.71 0.0054 0.20 0.41 0.28 0.50 0.28 0.50 0.37 0.59941SMAIN OTSB 90 8 177.11 0.0052 0.09 0.34 0.15 0.43 0.14 0.42 0.21 0.50948SMAIN OTSB 91 8 285.00 0.0140 0.09 0.24 0.15 0.31 0.14 0.30 0.21 0.37
2724SMAIN OTSB 92 8 320.23 0.0060 0.07 0.23 0.12 0.30 0.13 0.31 0.17 0.362540SMAIN OTSB 93 8 220.06 0.0340 0.07 0.15 0.09 0.17 0.12 0.19 0.14 0.212539SMAIN OTSB 94 8 261.00 0.0306 0.07 0.15 0.09 0.17 0.12 0.20 0.14 0.222537SMAIN OTSB 95 8 37.70 0.0049 0.07 0.18 0.09 0.21 0.12 0.24 0.14 0.262547SMAIN OTSB 96 8 210.67 0.0050 0.07 0.23 0.09 0.26 0.12 0.31 0.14 0.332554SMAIN OTSB 97 8 163.24 0.0050 0.07 0.24 0.09 0.27 0.12 0.32 0.14 0.35
Pipe Slope
Existing Condition Ultimate ConditionPDWF PWWF PDWF PWWF
Olivenhain Trunk Sewer (cont.)
GIS Pipe ID Reach IDPipe Diam (in)
Pipe Length
(ft)
B-5
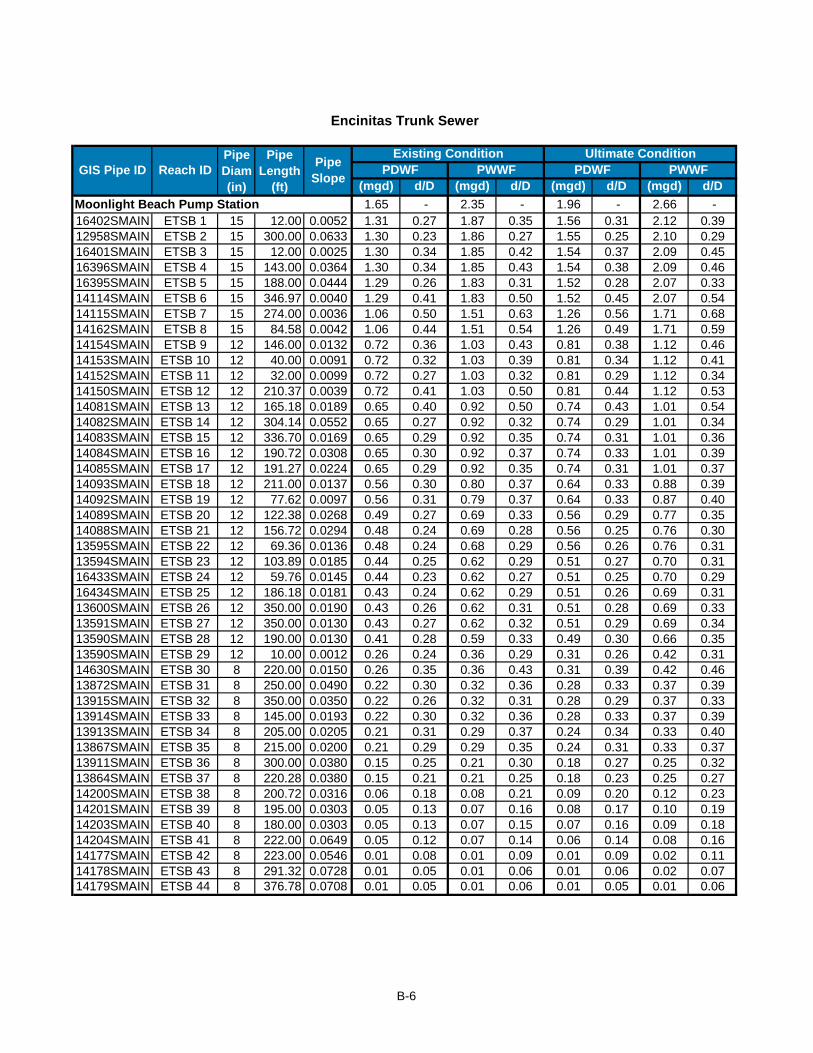
(mgd) d/D (mgd) d/D (mgd) d/D (mgd) d/D1.65 - 2.35 - 1.96 - 2.66 -
16402SMAIN ETSB 1 15 12.00 0.0052 1.31 0.27 1.87 0.35 1.56 0.31 2.12 0.3912958SMAIN ETSB 2 15 300.00 0.0633 1.30 0.23 1.86 0.27 1.55 0.25 2.10 0.2916401SMAIN ETSB 3 15 12.00 0.0025 1.30 0.34 1.85 0.42 1.54 0.37 2.09 0.4516396SMAIN ETSB 4 15 143.00 0.0364 1.30 0.34 1.85 0.43 1.54 0.38 2.09 0.4616395SMAIN ETSB 5 15 188.00 0.0444 1.29 0.26 1.83 0.31 1.52 0.28 2.07 0.3314114SMAIN ETSB 6 15 346.97 0.0040 1.29 0.41 1.83 0.50 1.52 0.45 2.07 0.5414115SMAIN ETSB 7 15 274.00 0.0036 1.06 0.50 1.51 0.63 1.26 0.56 1.71 0.6814162SMAIN ETSB 8 15 84.58 0.0042 1.06 0.44 1.51 0.54 1.26 0.49 1.71 0.5914154SMAIN ETSB 9 12 146.00 0.0132 0.72 0.36 1.03 0.43 0.81 0.38 1.12 0.4614153SMAIN ETSB 10 12 40.00 0.0091 0.72 0.32 1.03 0.39 0.81 0.34 1.12 0.4114152SMAIN ETSB 11 12 32.00 0.0099 0.72 0.27 1.03 0.32 0.81 0.29 1.12 0.3414150SMAIN ETSB 12 12 210.37 0.0039 0.72 0.41 1.03 0.50 0.81 0.44 1.12 0.5314081SMAIN ETSB 13 12 165.18 0.0189 0.65 0.40 0.92 0.50 0.74 0.43 1.01 0.5414082SMAIN ETSB 14 12 304.14 0.0552 0.65 0.27 0.92 0.32 0.74 0.29 1.01 0.3414083SMAIN ETSB 15 12 336.70 0.0169 0.65 0.29 0.92 0.35 0.74 0.31 1.01 0.3614084SMAIN ETSB 16 12 190.72 0.0308 0.65 0.30 0.92 0.37 0.74 0.33 1.01 0.3914085SMAIN ETSB 17 12 191.27 0.0224 0.65 0.29 0.92 0.35 0.74 0.31 1.01 0.3714093SMAIN ETSB 18 12 211.00 0.0137 0.56 0.30 0.80 0.37 0.64 0.33 0.88 0.3914092SMAIN ETSB 19 12 77.62 0.0097 0.56 0.31 0.79 0.37 0.64 0.33 0.87 0.4014089SMAIN ETSB 20 12 122.38 0.0268 0.49 0.27 0.69 0.33 0.56 0.29 0.77 0.3514088SMAIN ETSB 21 12 156.72 0.0294 0.48 0.24 0.69 0.28 0.56 0.25 0.76 0.3013595SMAIN ETSB 22 12 69.36 0.0136 0.48 0.24 0.68 0.29 0.56 0.26 0.76 0.3113594SMAIN ETSB 23 12 103.89 0.0185 0.44 0.25 0.62 0.29 0.51 0.27 0.70 0.3116433SMAIN ETSB 24 12 59.76 0.0145 0.44 0.23 0.62 0.27 0.51 0.25 0.70 0.2916434SMAIN ETSB 25 12 186.18 0.0181 0.43 0.24 0.62 0.29 0.51 0.26 0.69 0.3113600SMAIN ETSB 26 12 350.00 0.0190 0.43 0.26 0.62 0.31 0.51 0.28 0.69 0.3313591SMAIN ETSB 27 12 350.00 0.0130 0.43 0.27 0.62 0.32 0.51 0.29 0.69 0.3413590SMAIN ETSB 28 12 190.00 0.0130 0.41 0.28 0.59 0.33 0.49 0.30 0.66 0.3513590SMAIN ETSB 29 12 10.00 0.0012 0.26 0.24 0.36 0.29 0.31 0.26 0.42 0.3114630SMAIN ETSB 30 8 220.00 0.0150 0.26 0.35 0.36 0.43 0.31 0.39 0.42 0.4613872SMAIN ETSB 31 8 250.00 0.0490 0.22 0.30 0.32 0.36 0.28 0.33 0.37 0.3913915SMAIN ETSB 32 8 350.00 0.0350 0.22 0.26 0.32 0.31 0.28 0.29 0.37 0.3313914SMAIN ETSB 33 8 145.00 0.0193 0.22 0.30 0.32 0.36 0.28 0.33 0.37 0.3913913SMAIN ETSB 34 8 205.00 0.0205 0.21 0.31 0.29 0.37 0.24 0.34 0.33 0.4013867SMAIN ETSB 35 8 215.00 0.0200 0.21 0.29 0.29 0.35 0.24 0.31 0.33 0.3713911SMAIN ETSB 36 8 300.00 0.0380 0.15 0.25 0.21 0.30 0.18 0.27 0.25 0.3213864SMAIN ETSB 37 8 220.28 0.0380 0.15 0.21 0.21 0.25 0.18 0.23 0.25 0.2714200SMAIN ETSB 38 8 200.72 0.0316 0.06 0.18 0.08 0.21 0.09 0.20 0.12 0.2314201SMAIN ETSB 39 8 195.00 0.0303 0.05 0.13 0.07 0.16 0.08 0.17 0.10 0.1914203SMAIN ETSB 40 8 180.00 0.0303 0.05 0.13 0.07 0.15 0.07 0.16 0.09 0.1814204SMAIN ETSB 41 8 222.00 0.0649 0.05 0.12 0.07 0.14 0.06 0.14 0.08 0.1614177SMAIN ETSB 42 8 223.00 0.0546 0.01 0.08 0.01 0.09 0.01 0.09 0.02 0.1114178SMAIN ETSB 43 8 291.32 0.0728 0.01 0.05 0.01 0.06 0.01 0.06 0.02 0.0714179SMAIN ETSB 44 8 376.78 0.0708 0.01 0.05 0.01 0.06 0.01 0.05 0.01 0.06
Moonlight Beach Pump Station
Existing Condition Ultimate ConditionPDWF PWWF PDWF PWWFPipe
Slope
Pipe Length
(ft)
Pipe Diam (in)
Reach IDGIS Pipe ID
Encinitas Trunk Sewer
B-6

CSD and ESD DUDEK
SEWER MASTER PLAN UPDATE April 2011
APPENDIX C Manhole Inspection Reports

CSD and ESD DUDEK
SEWER MASTER PLAN UPDATE April 2011
INTENTIONALLY LEFT BLANK
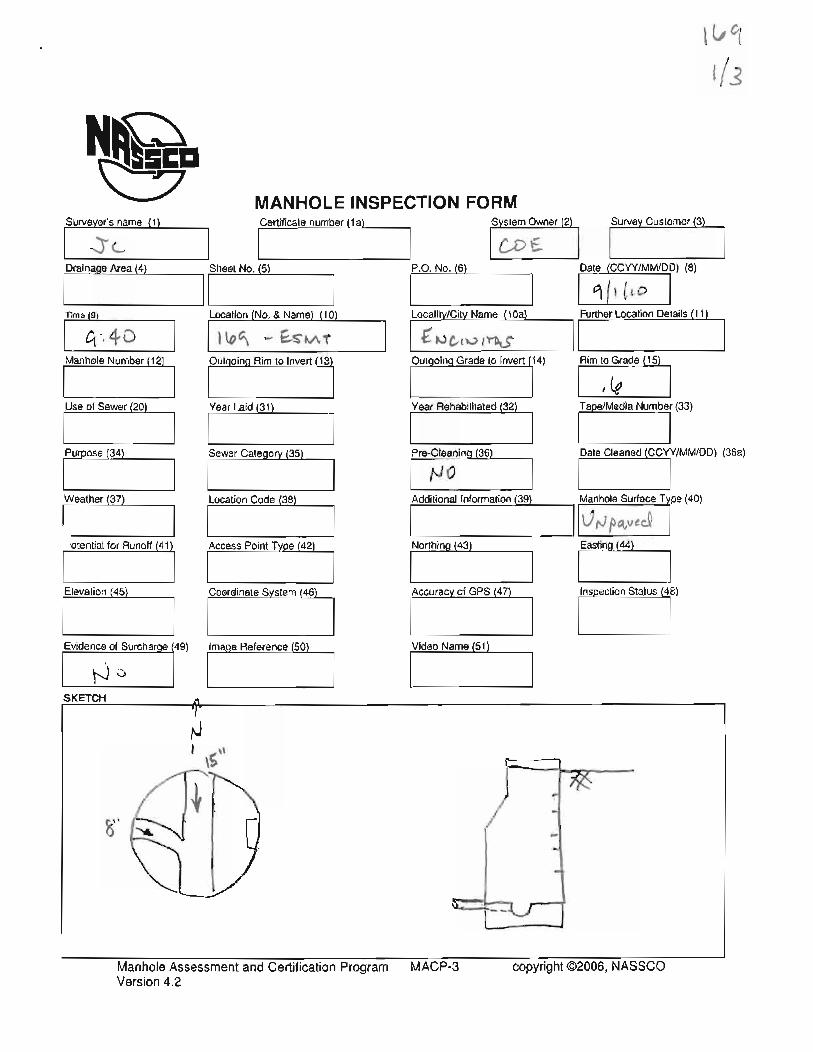

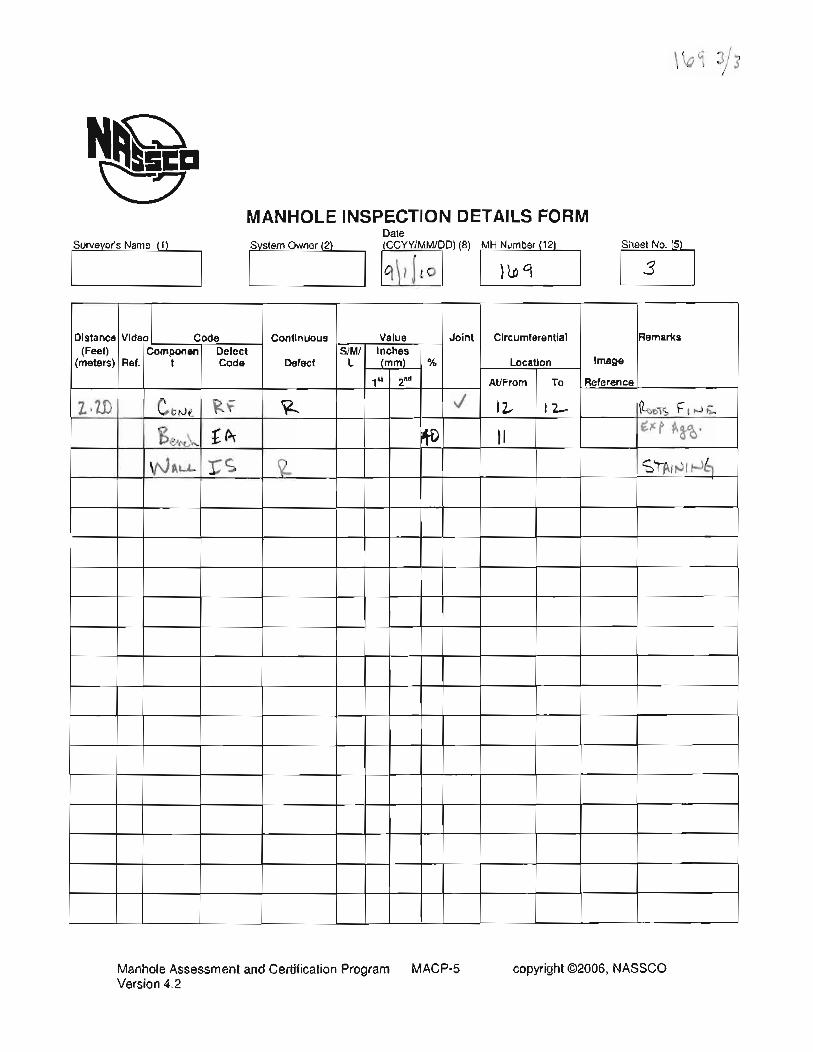
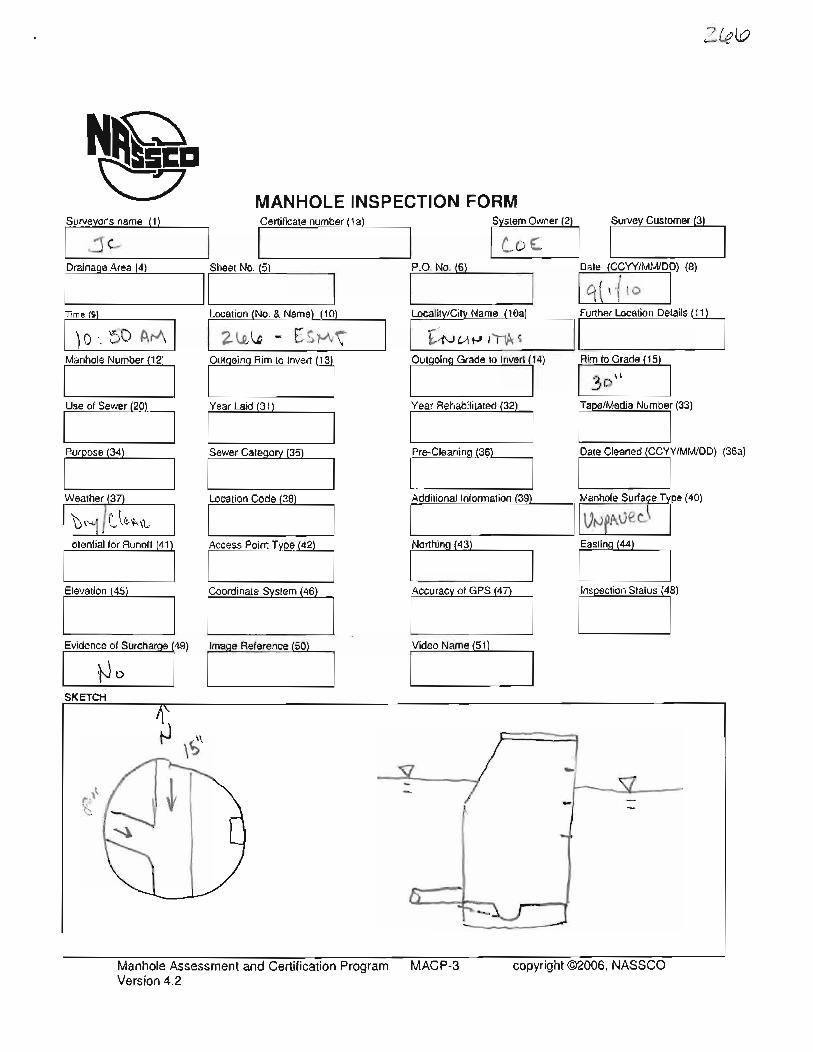
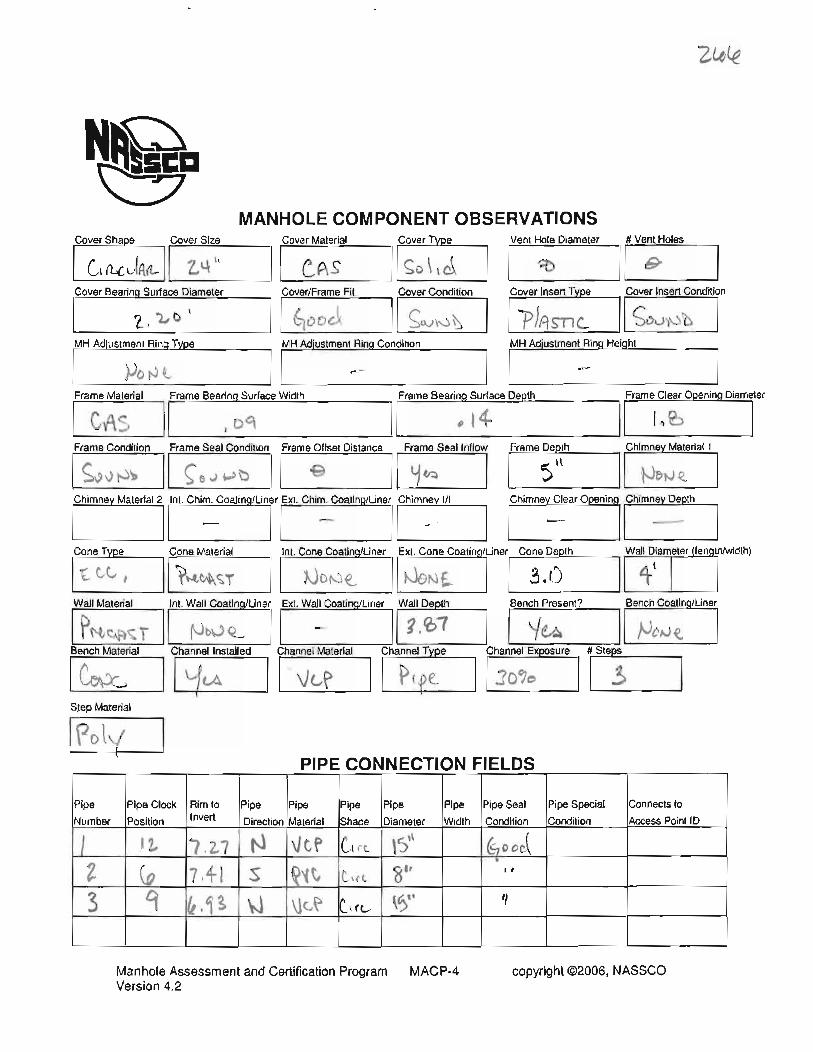
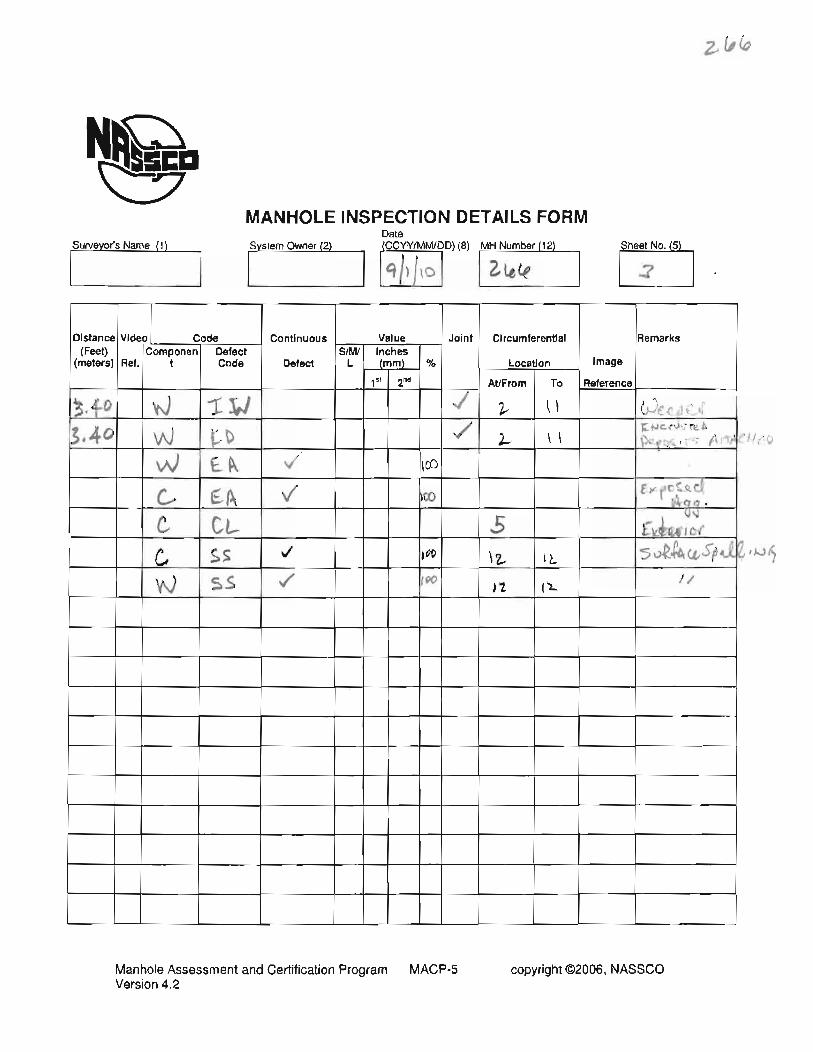
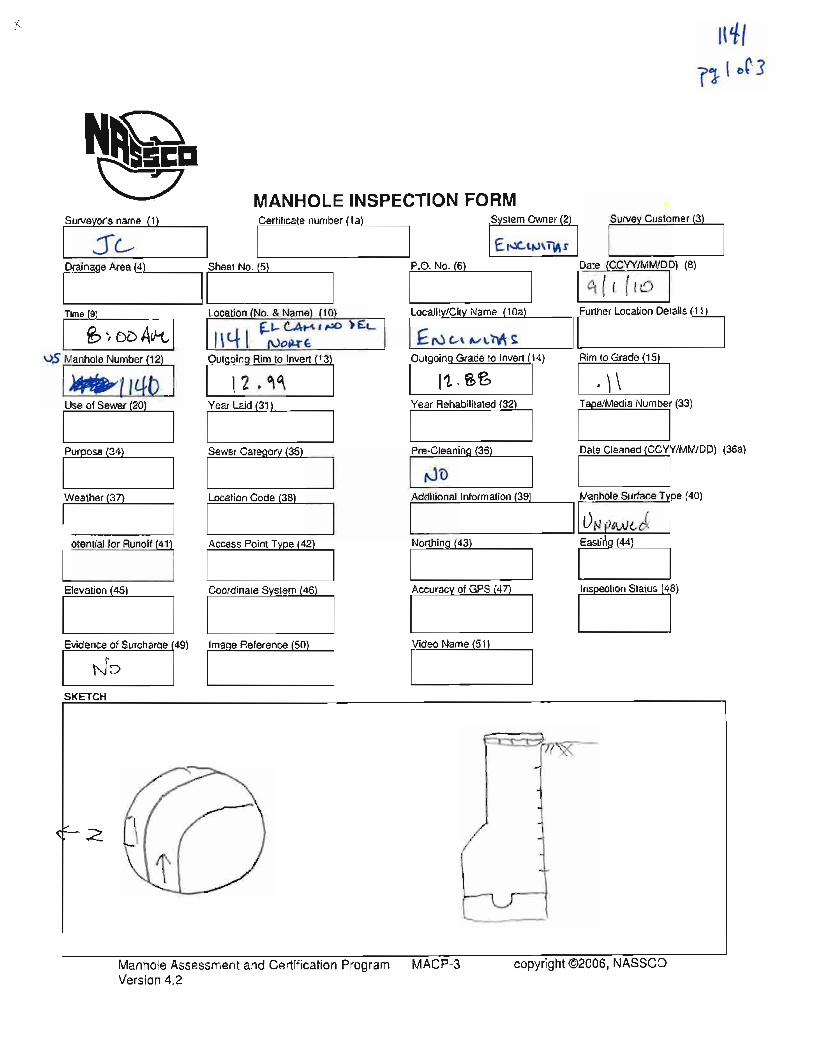
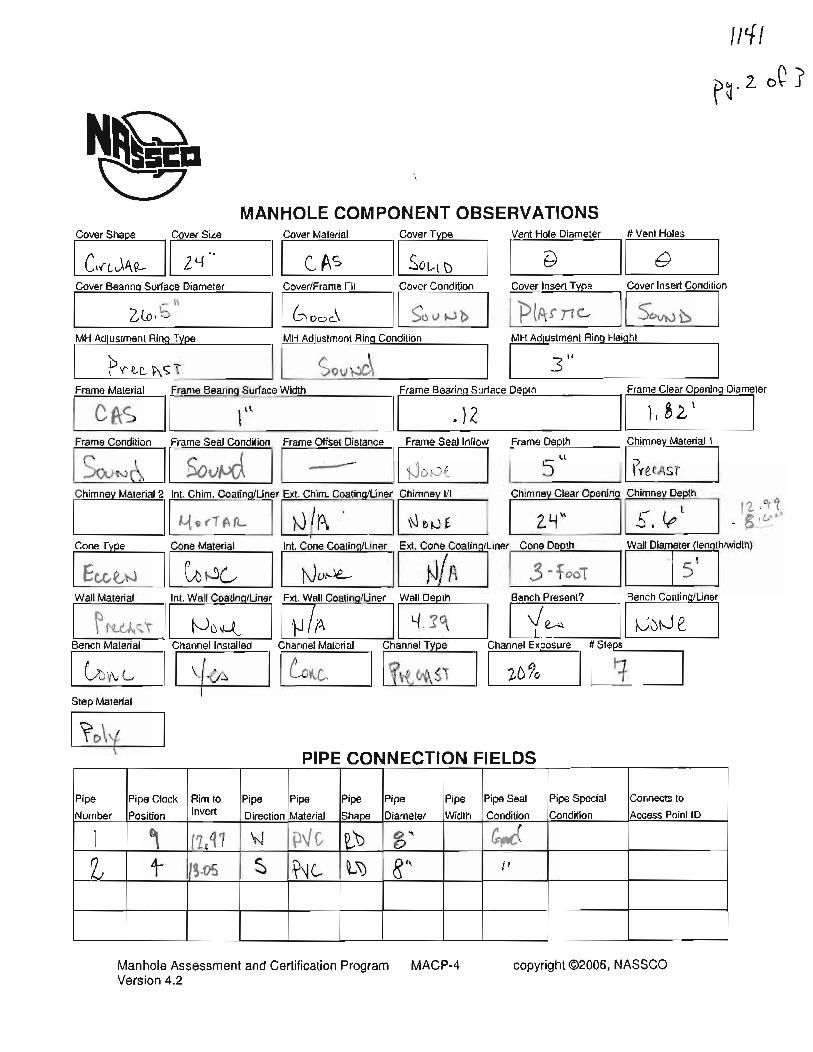
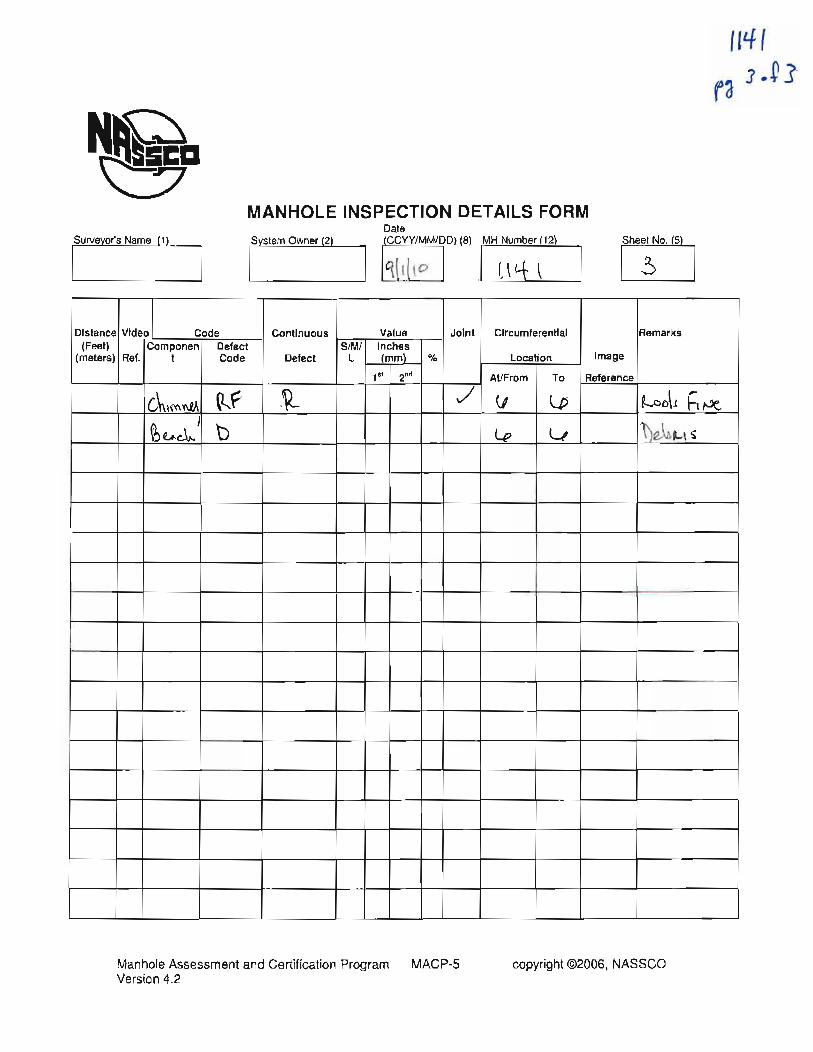
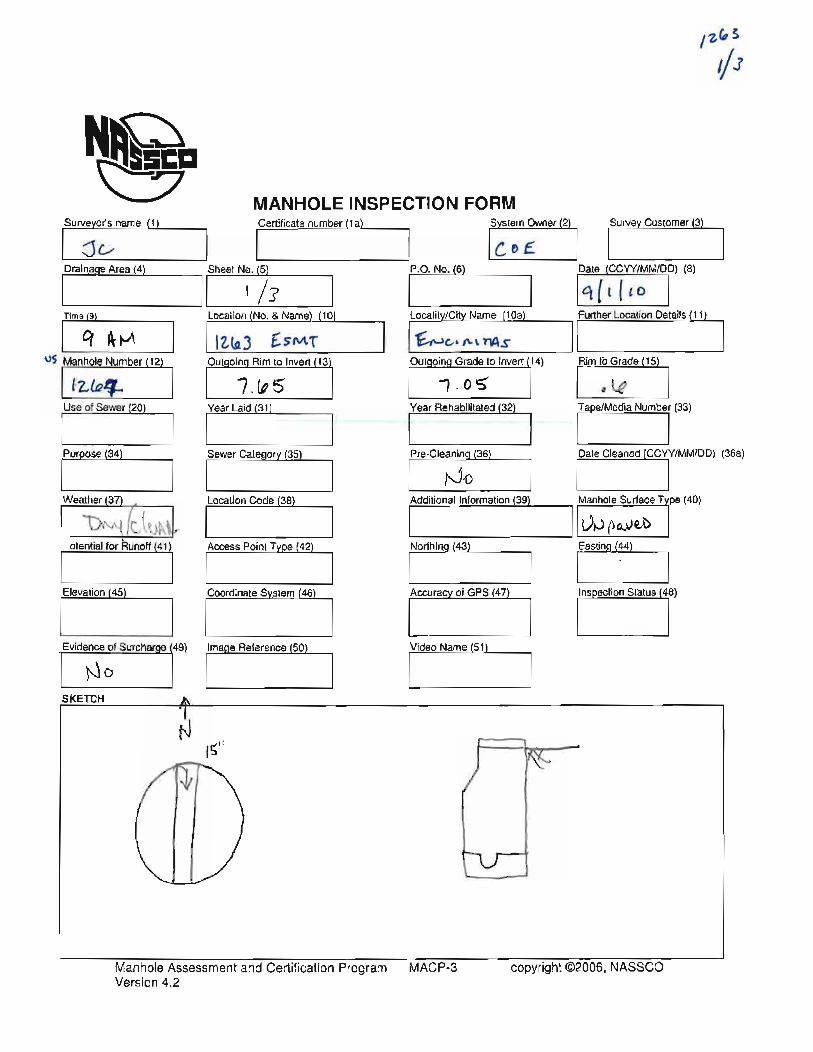
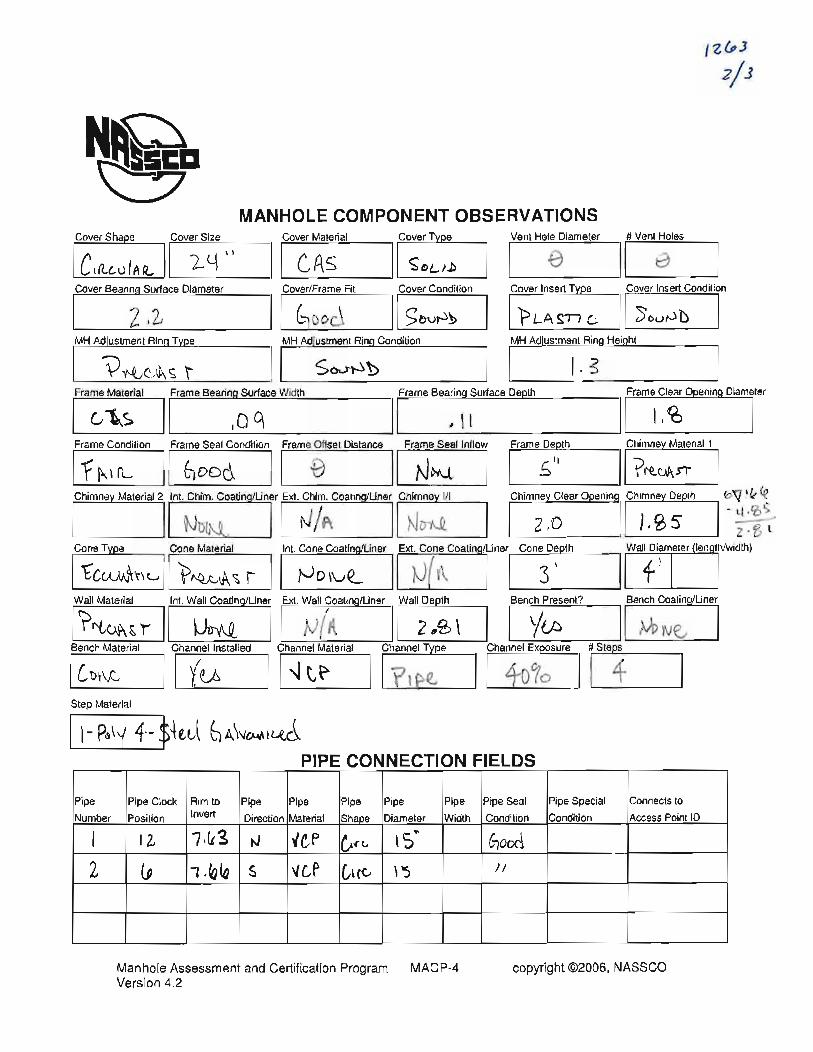
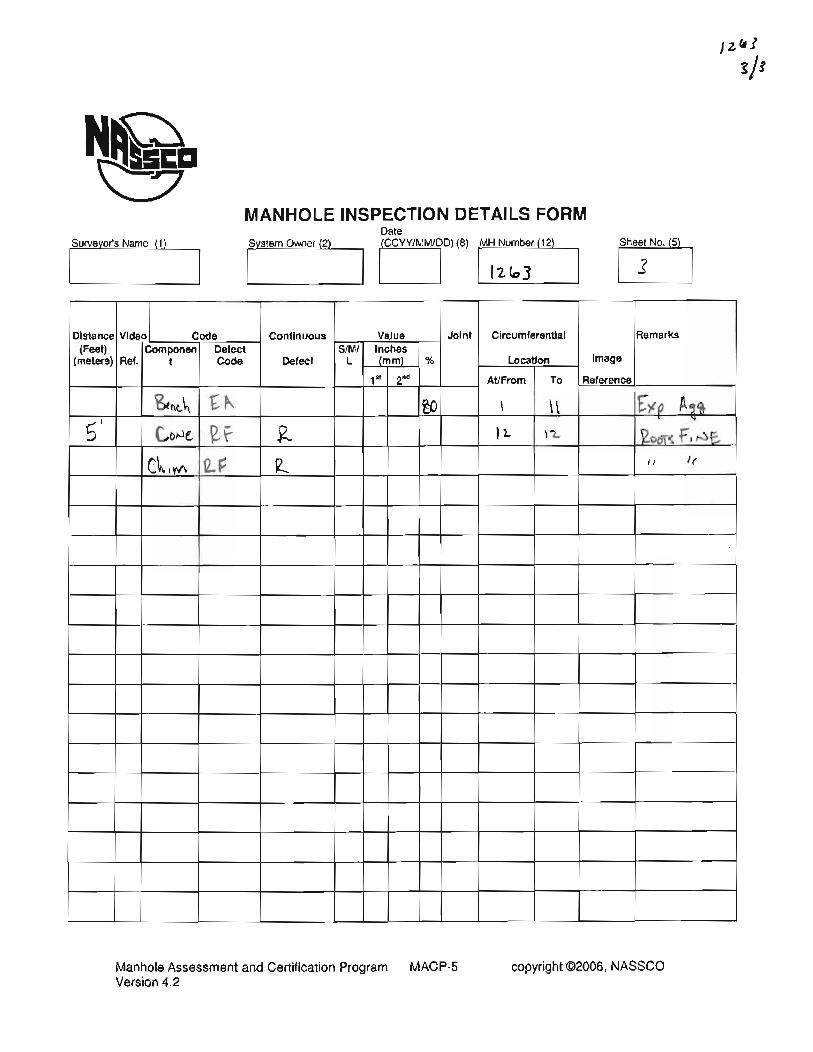
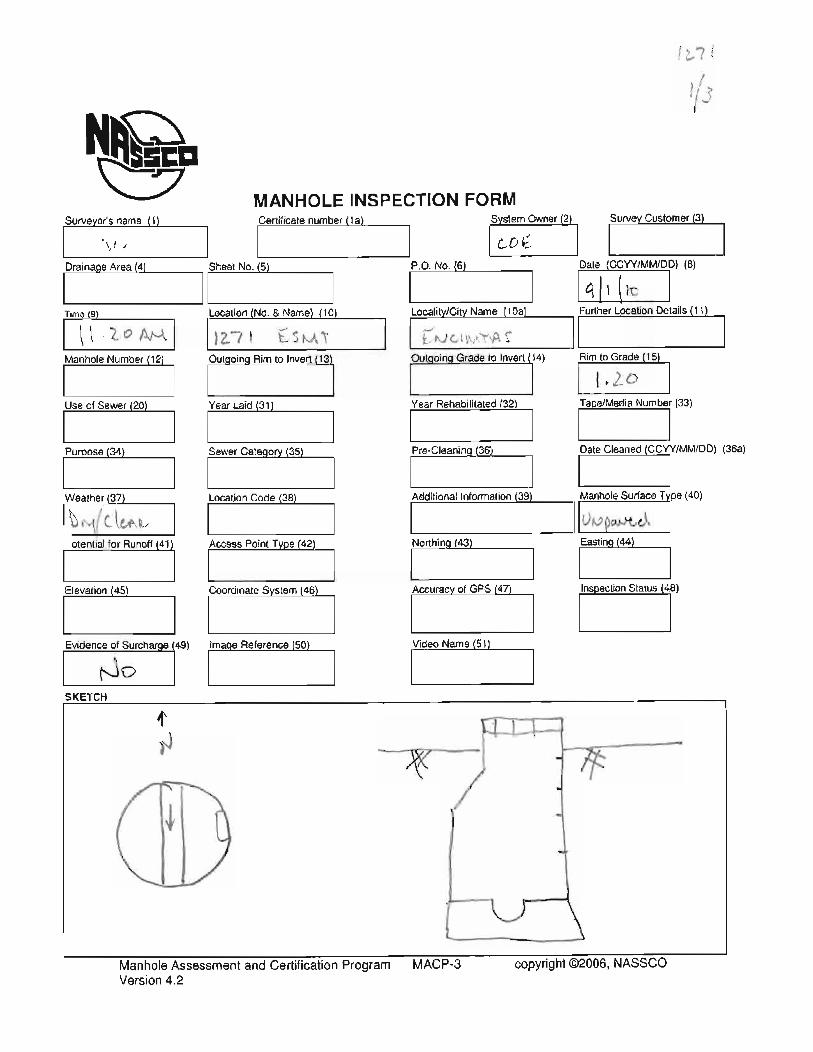
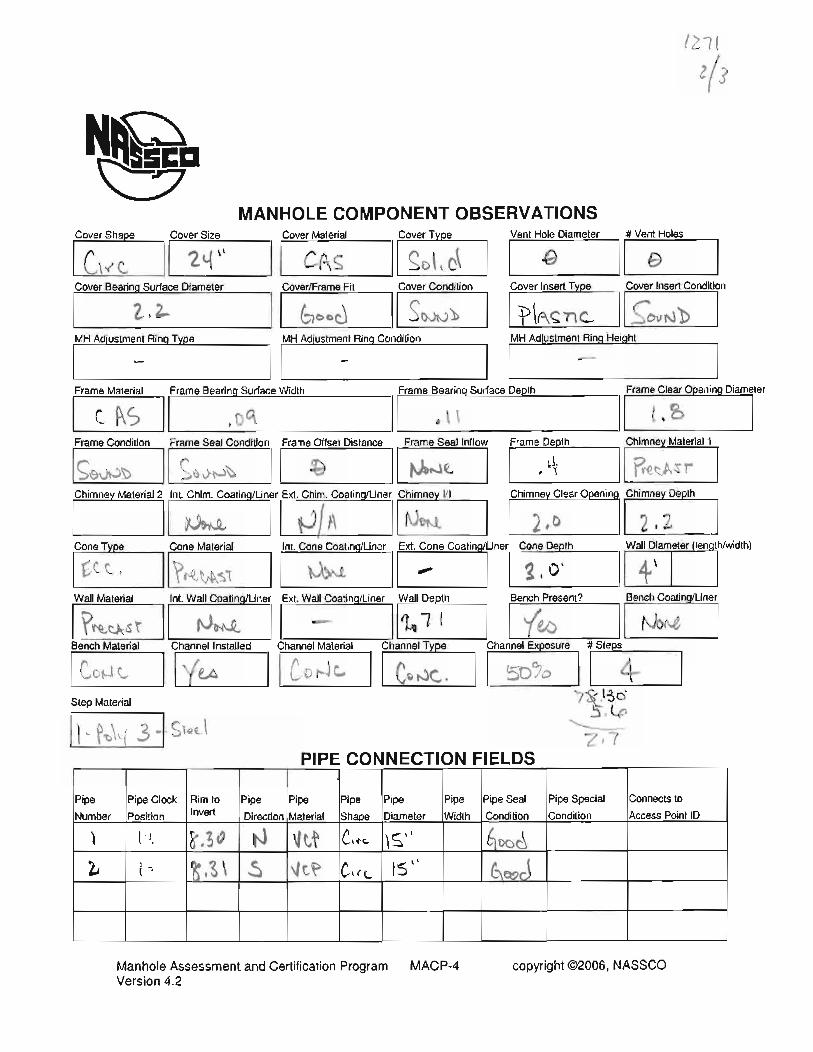
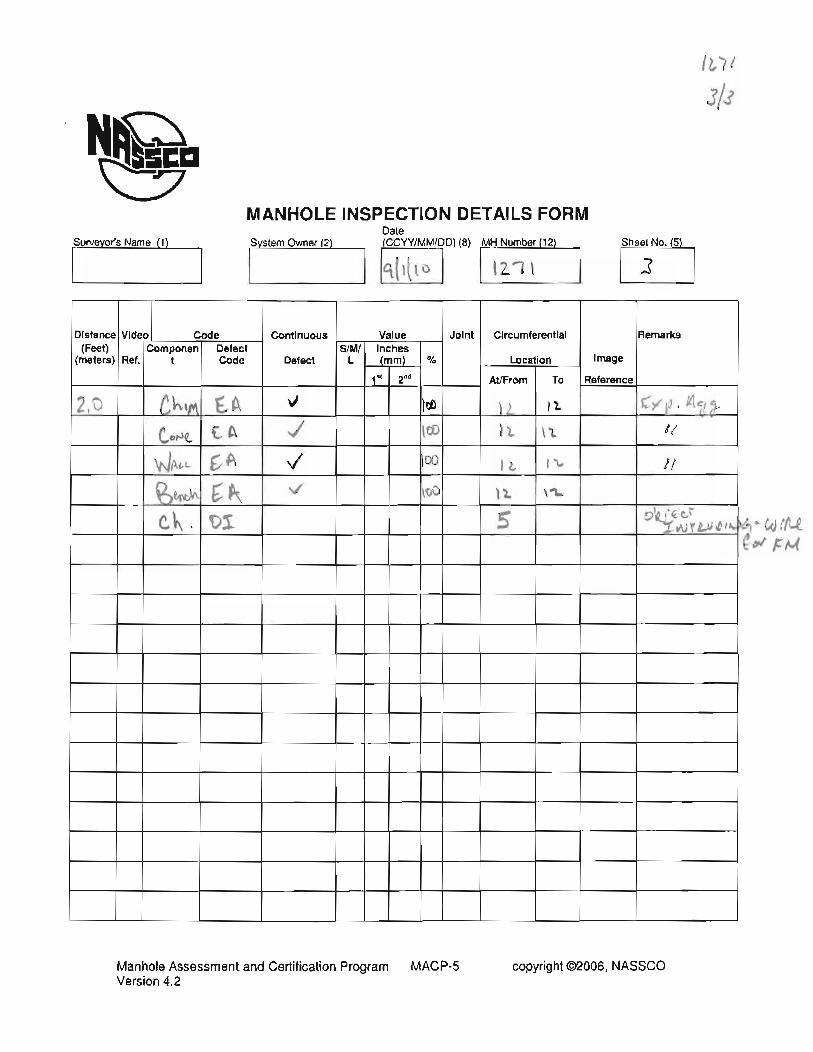


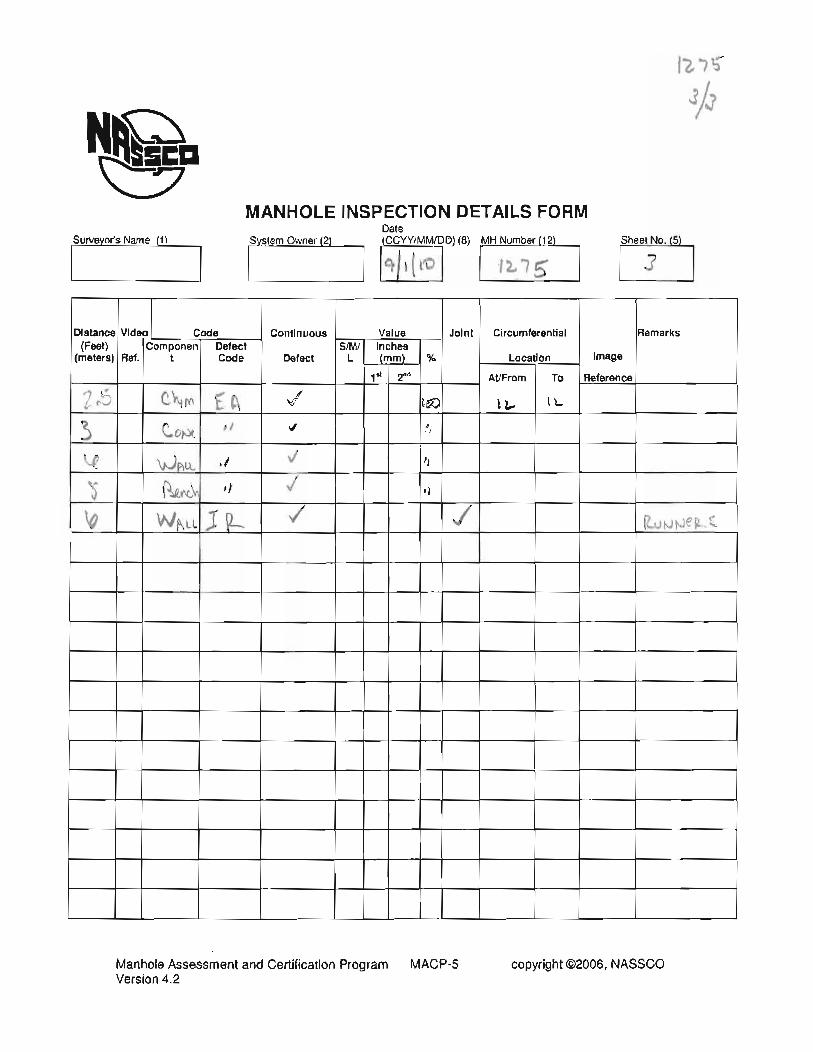
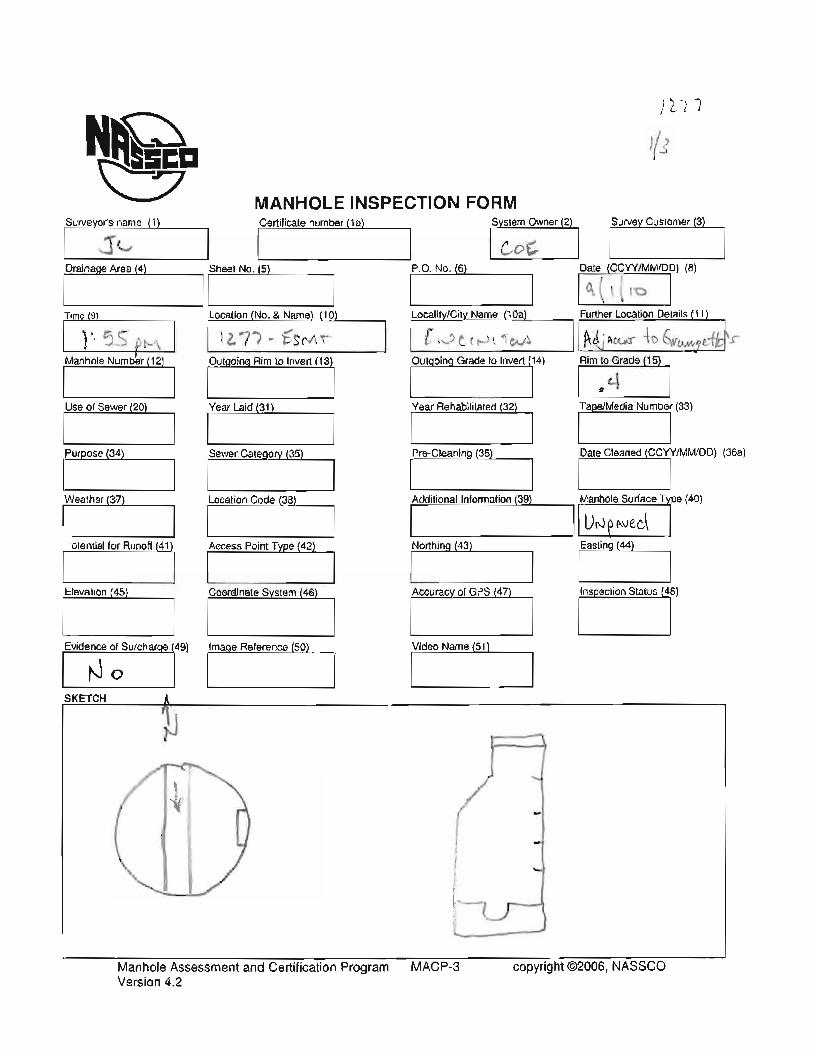

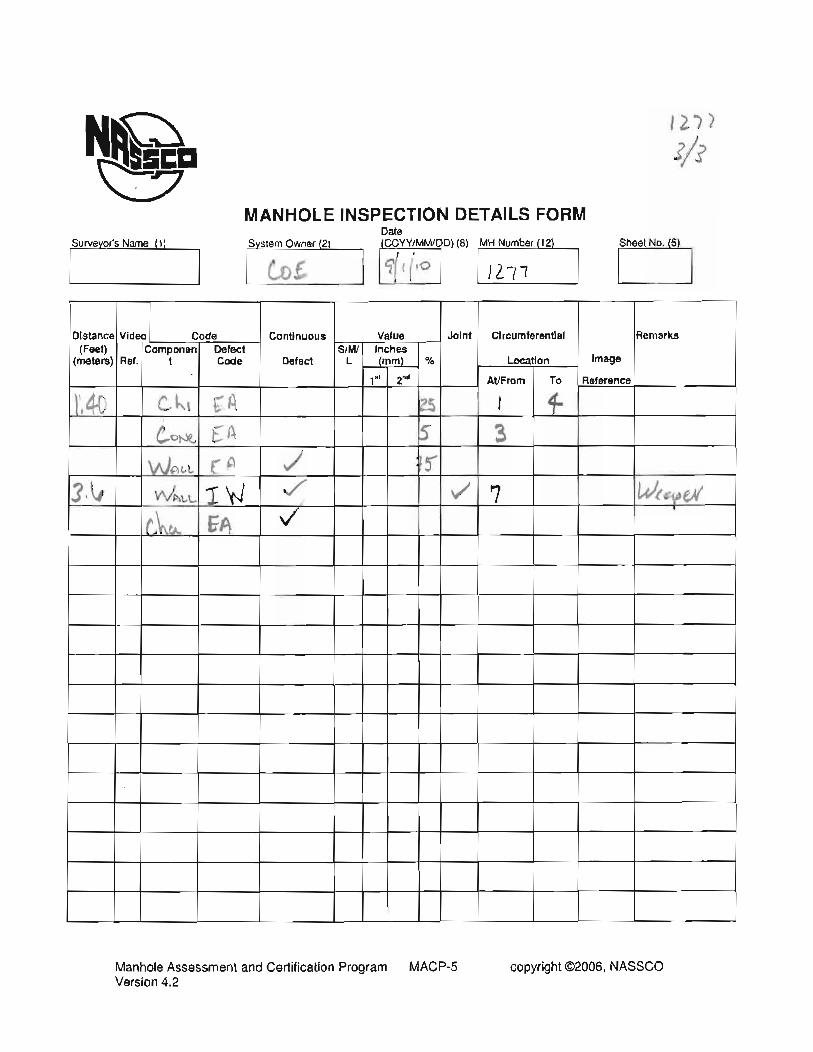
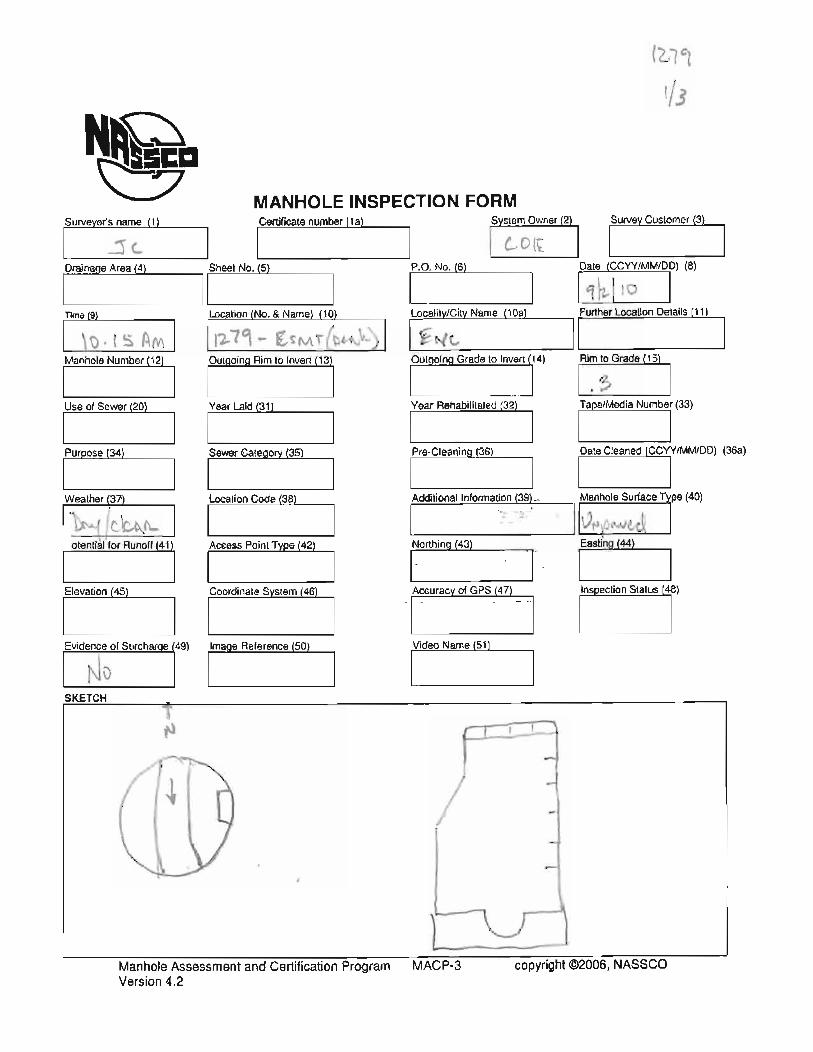
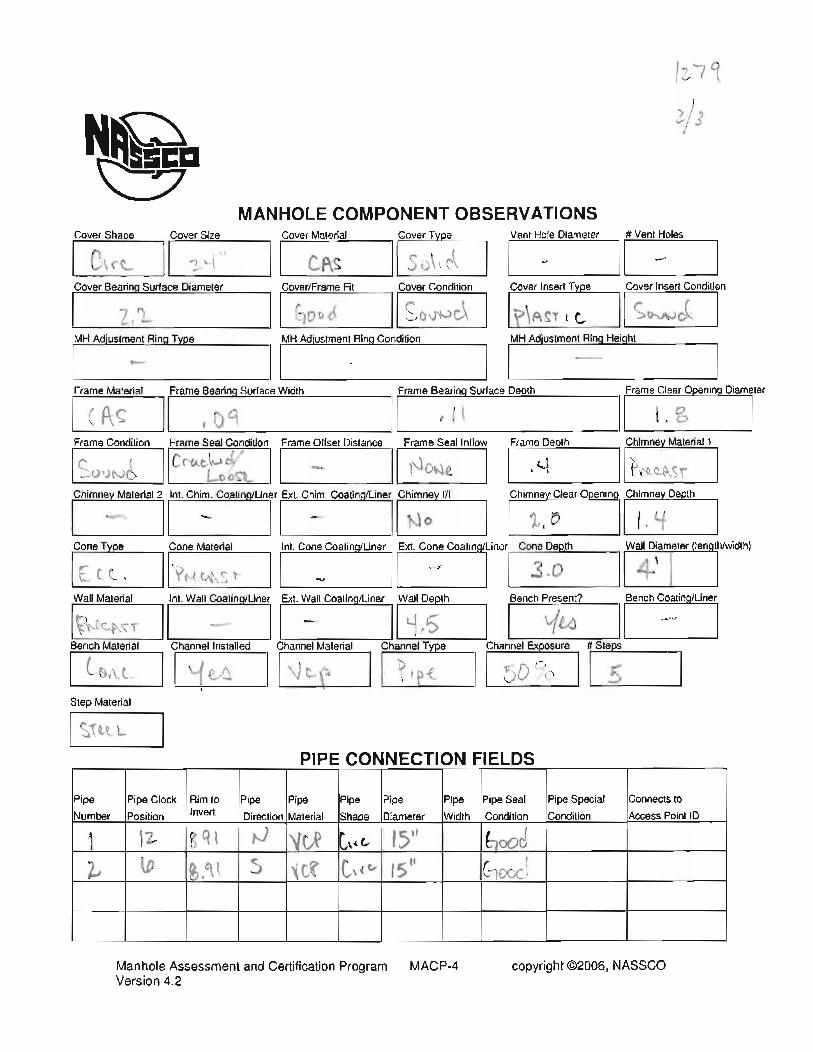
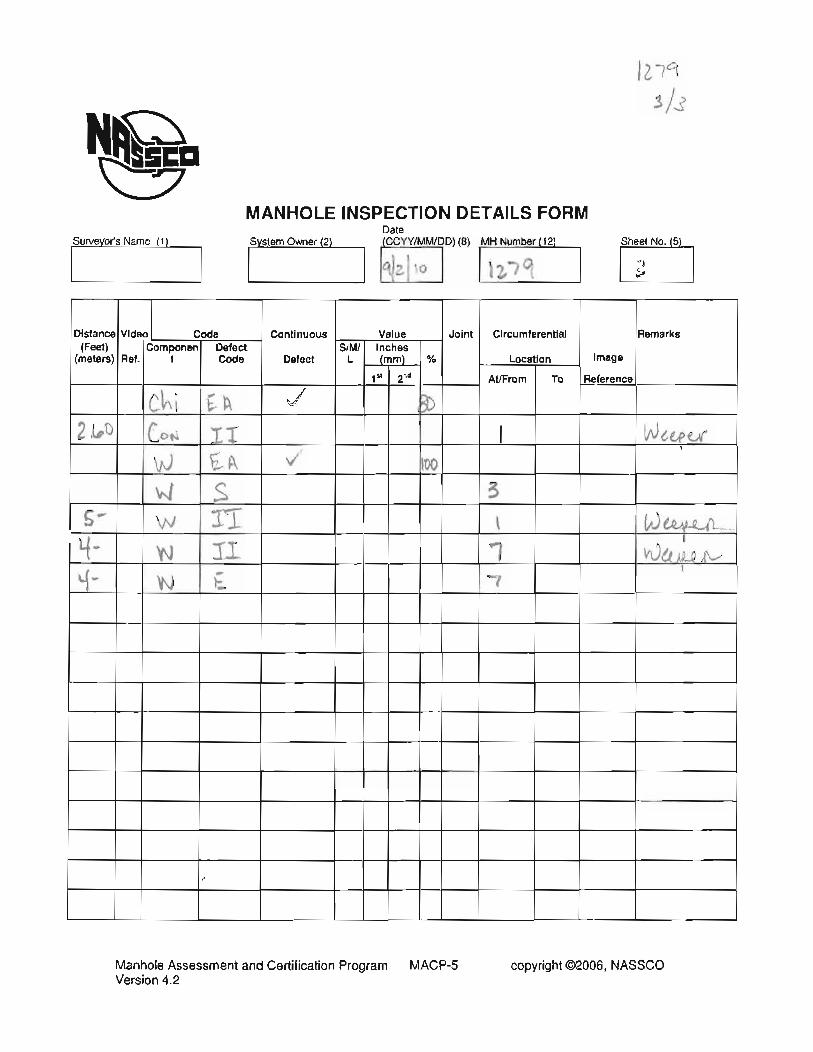
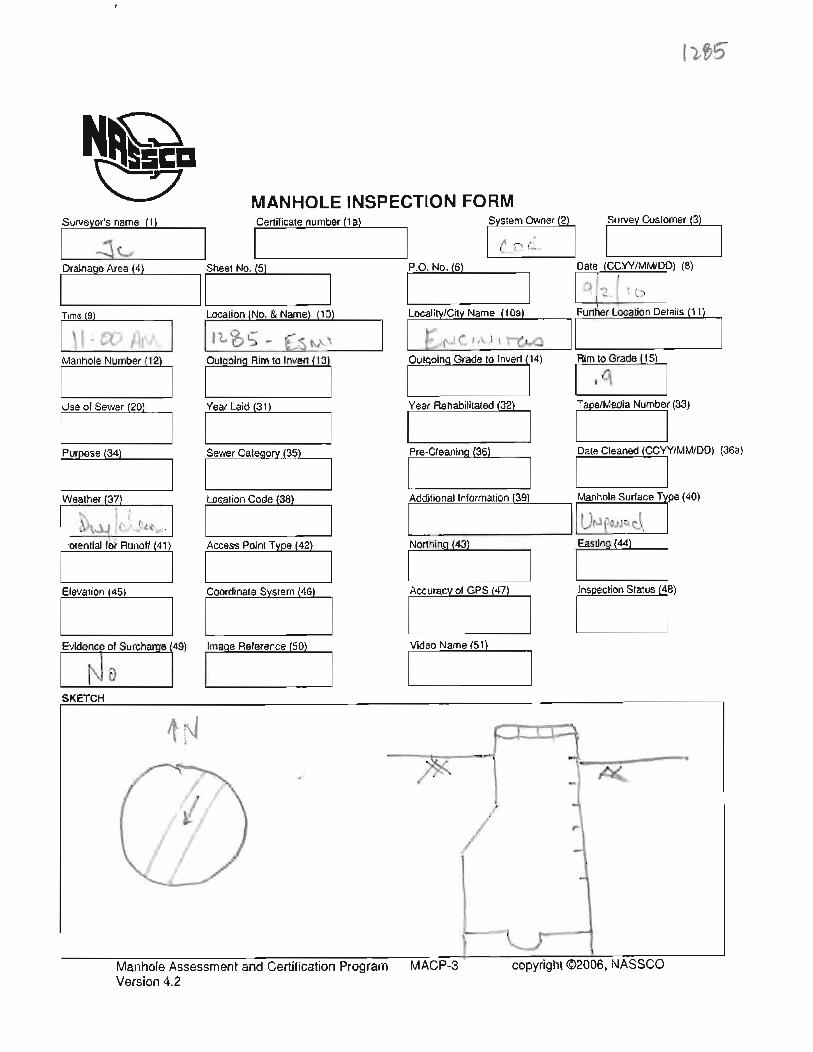

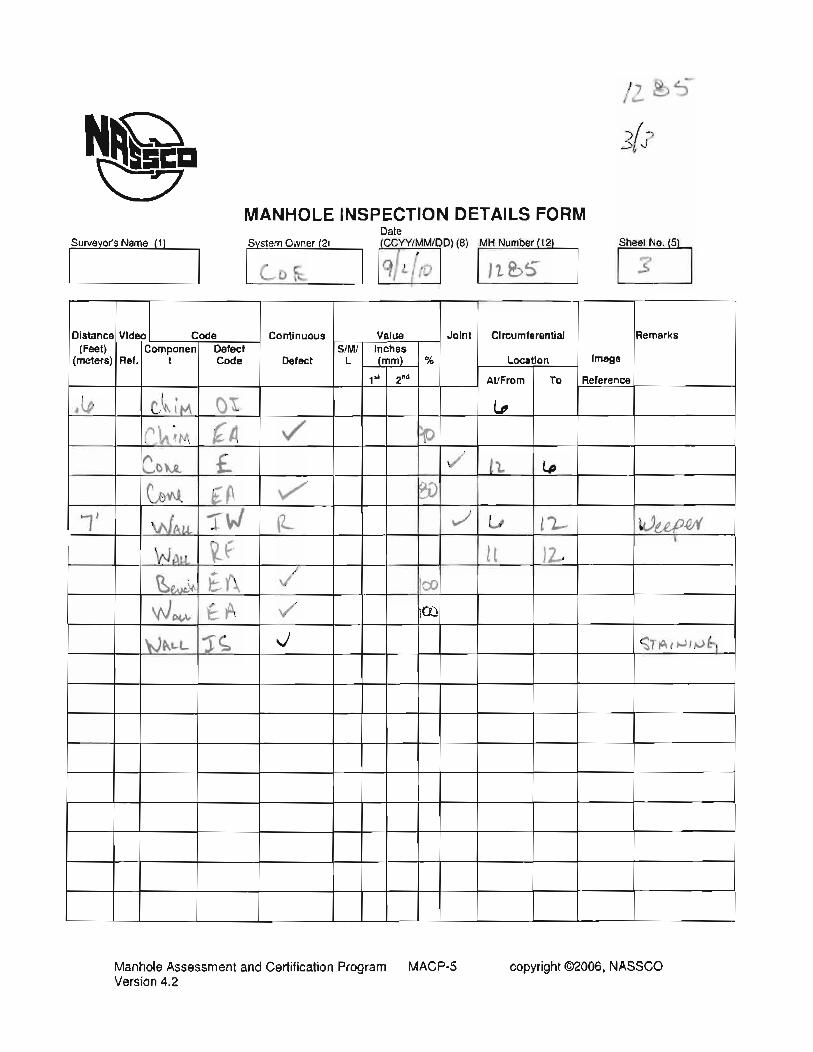
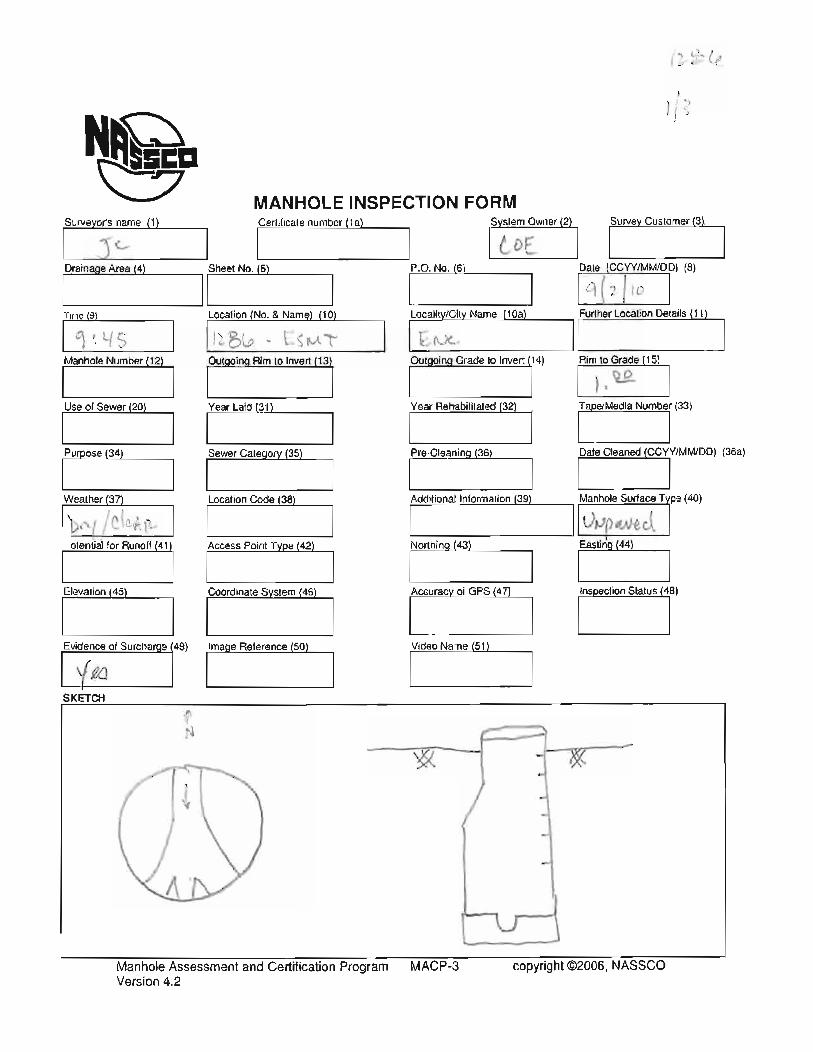

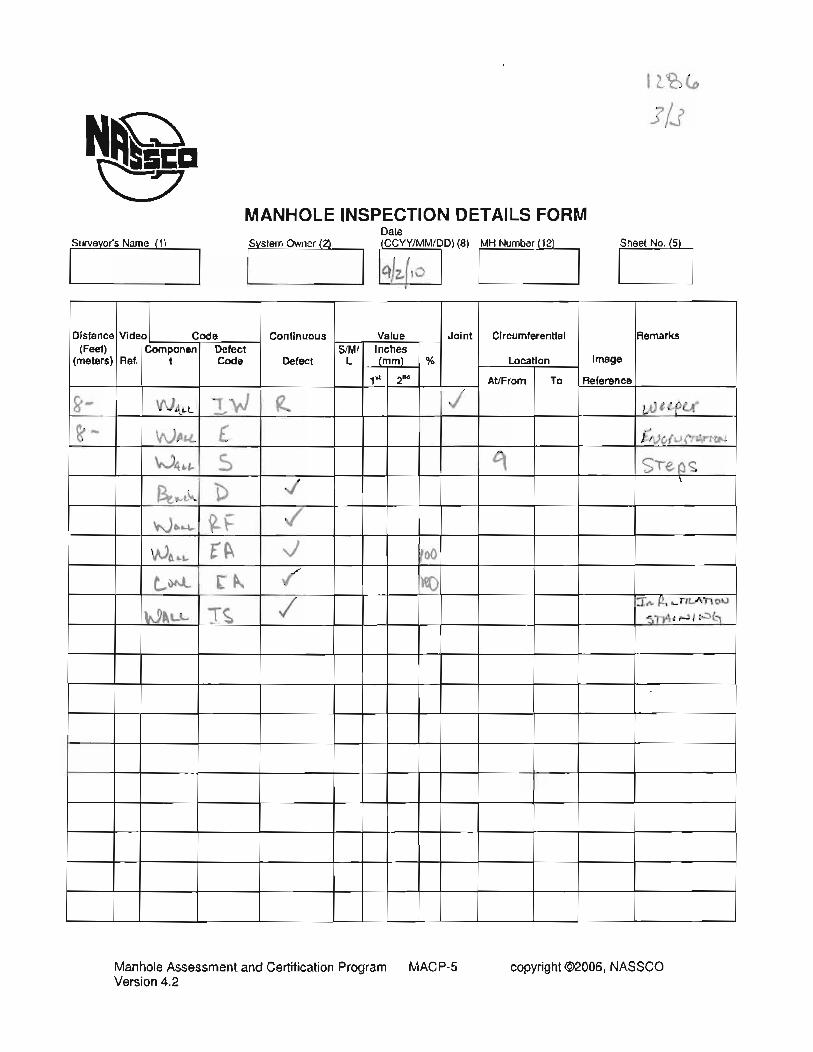
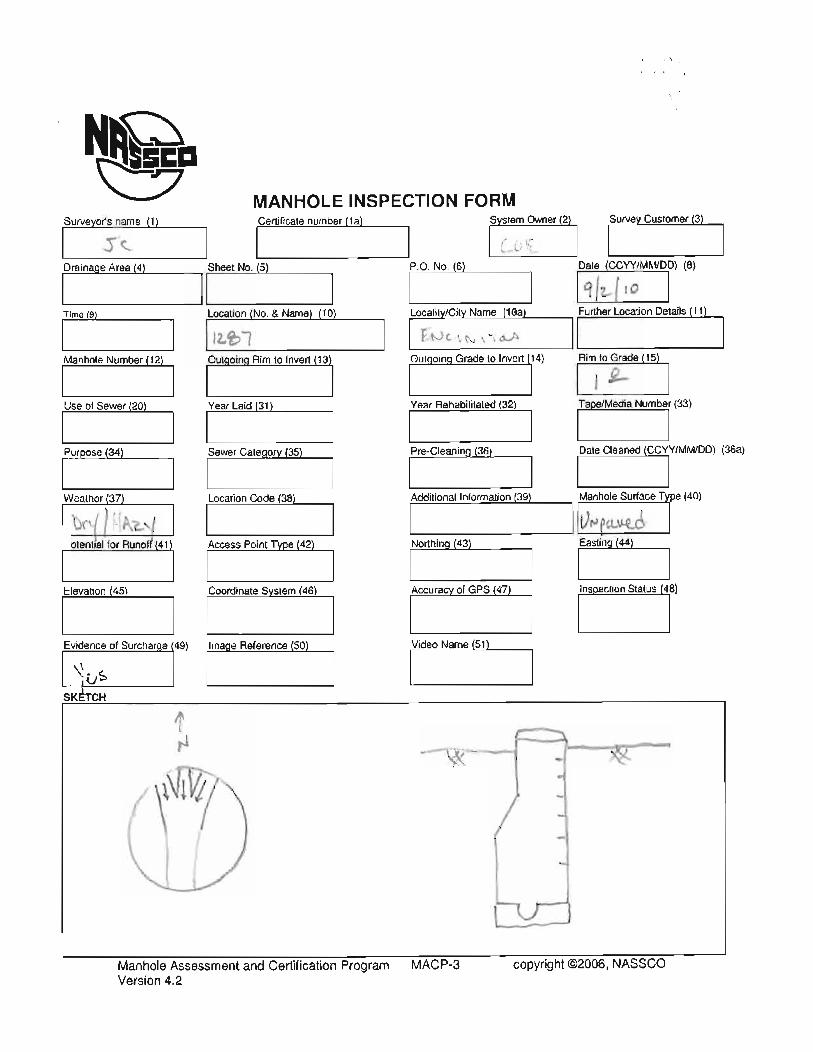

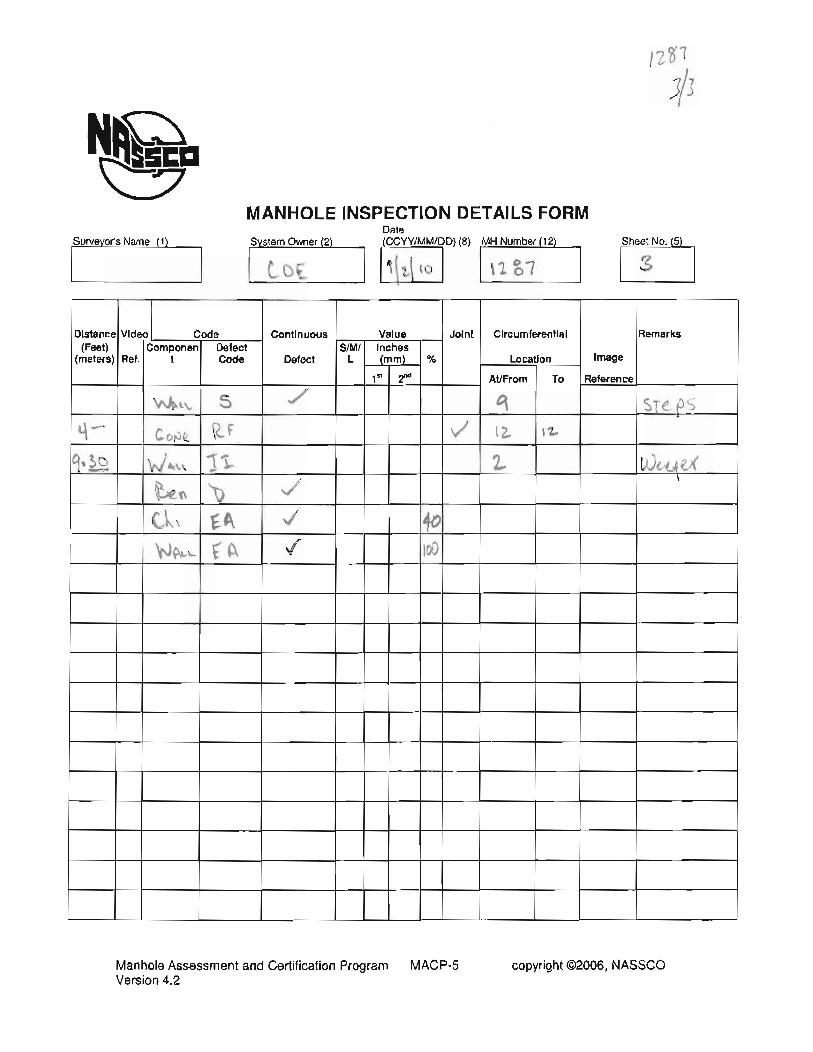
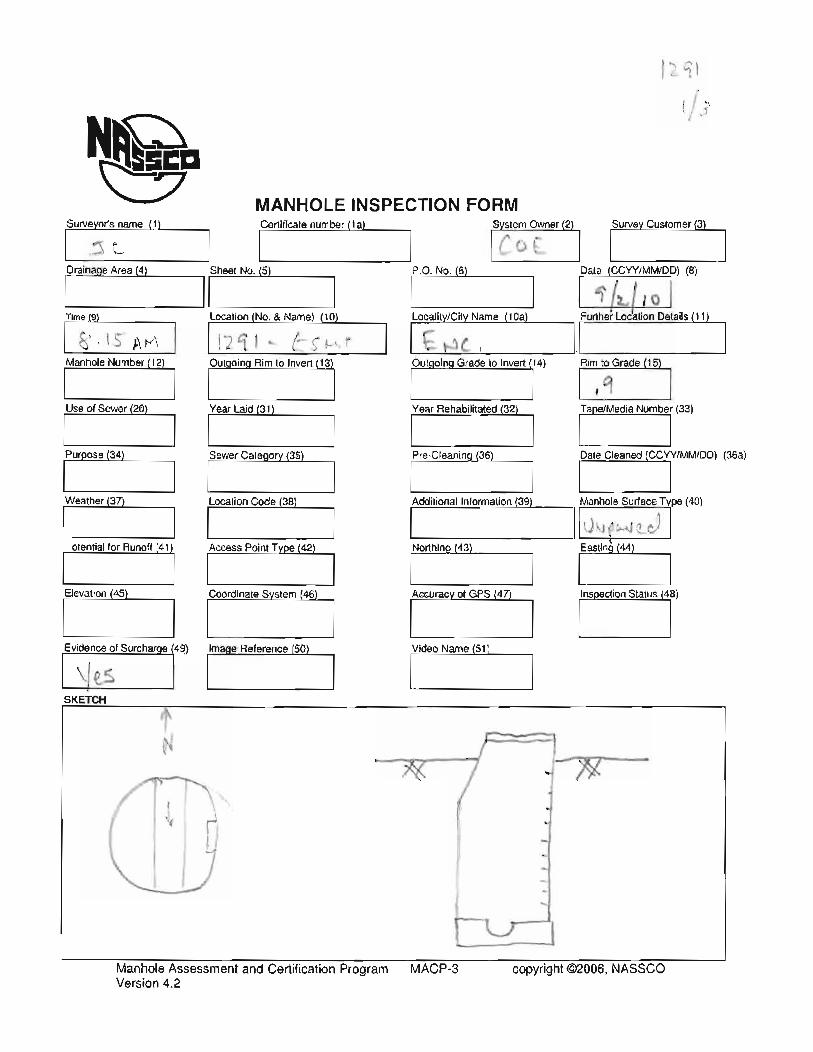
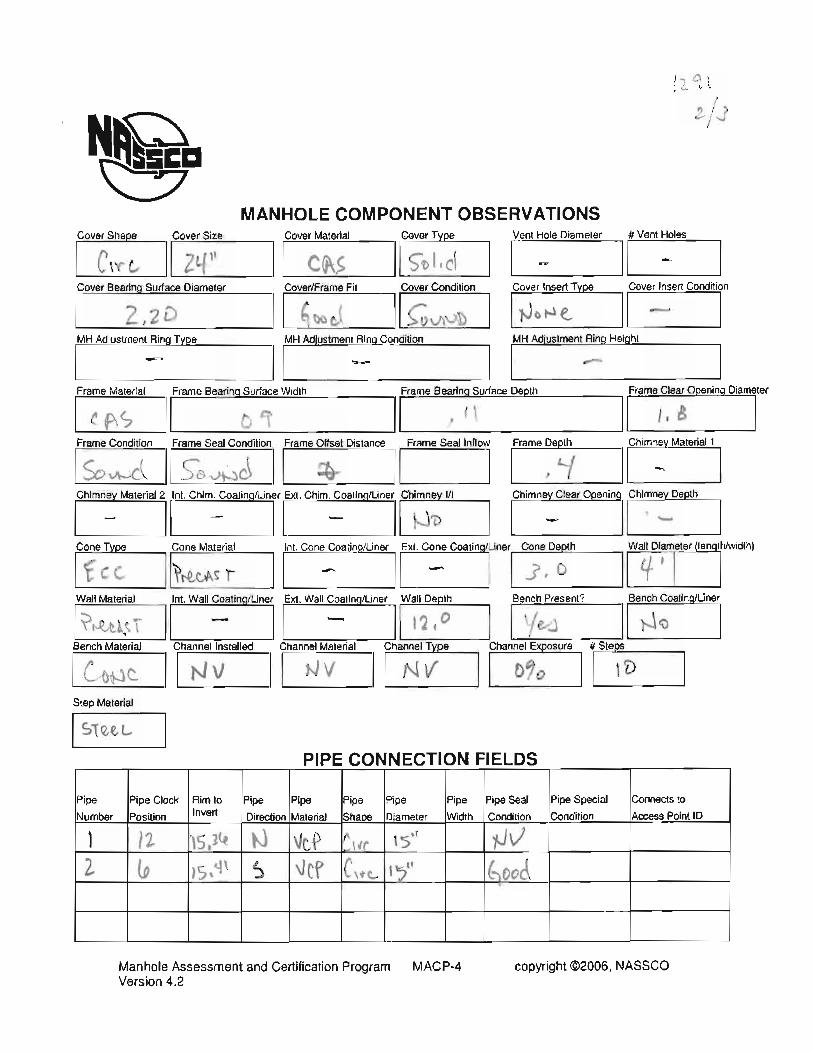
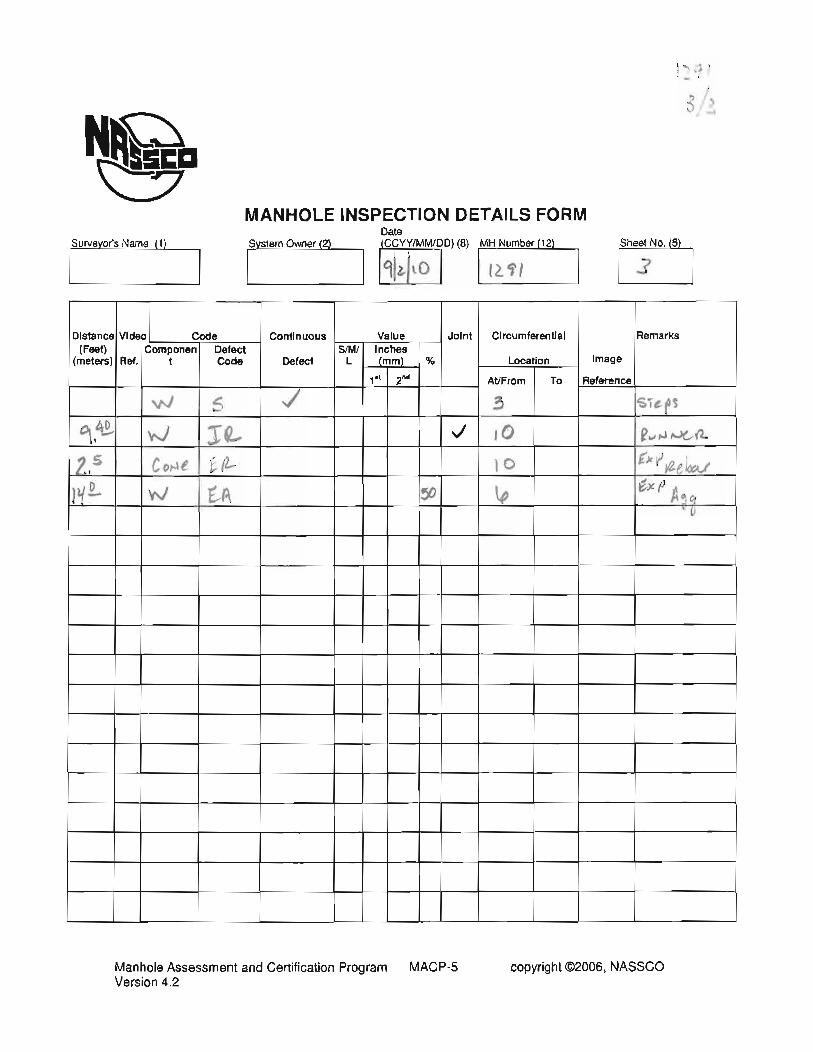
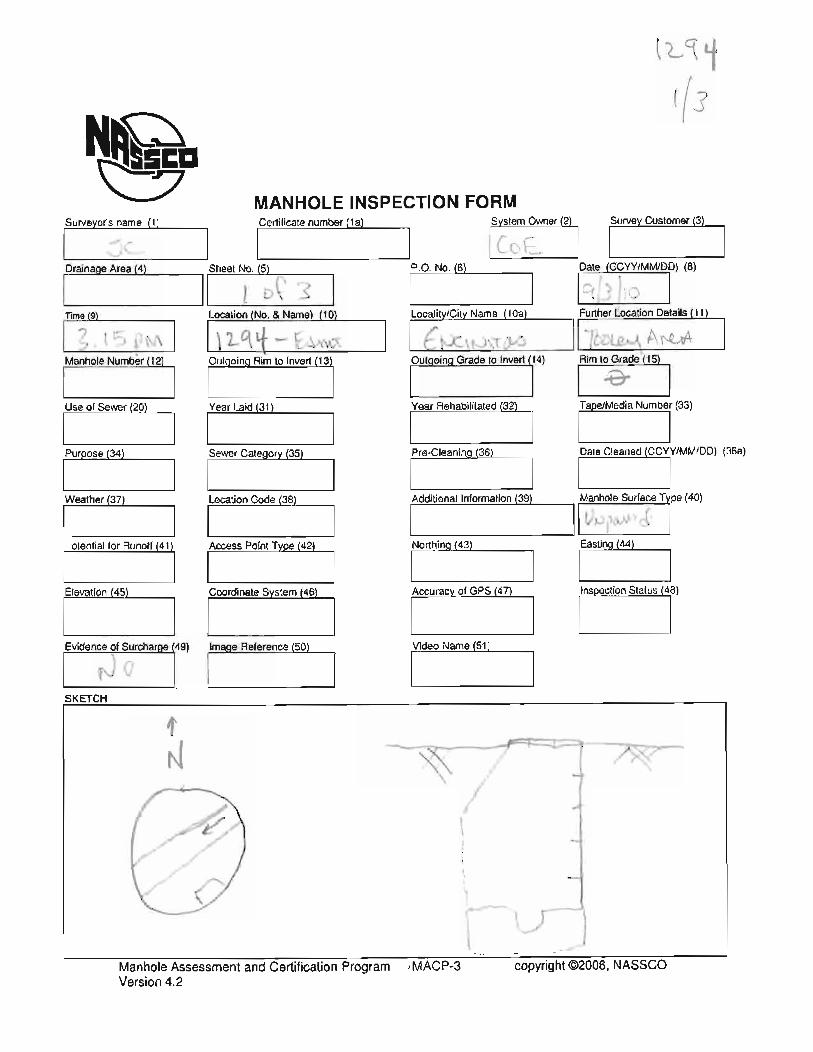
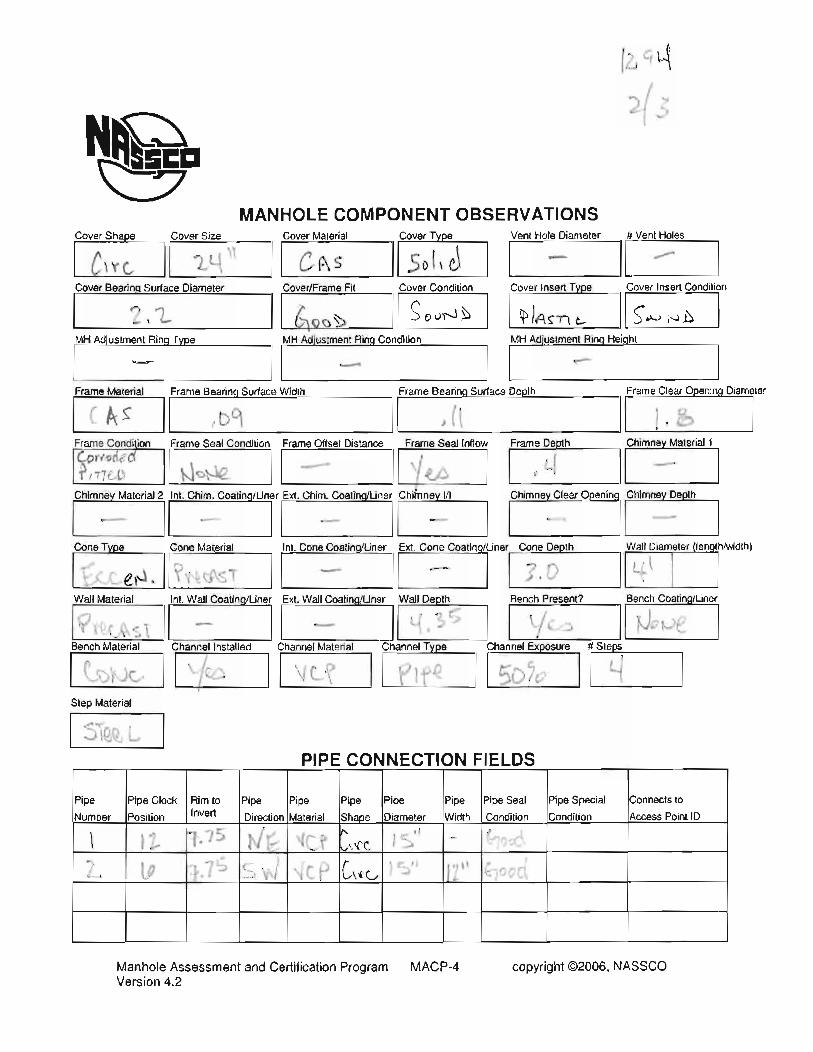
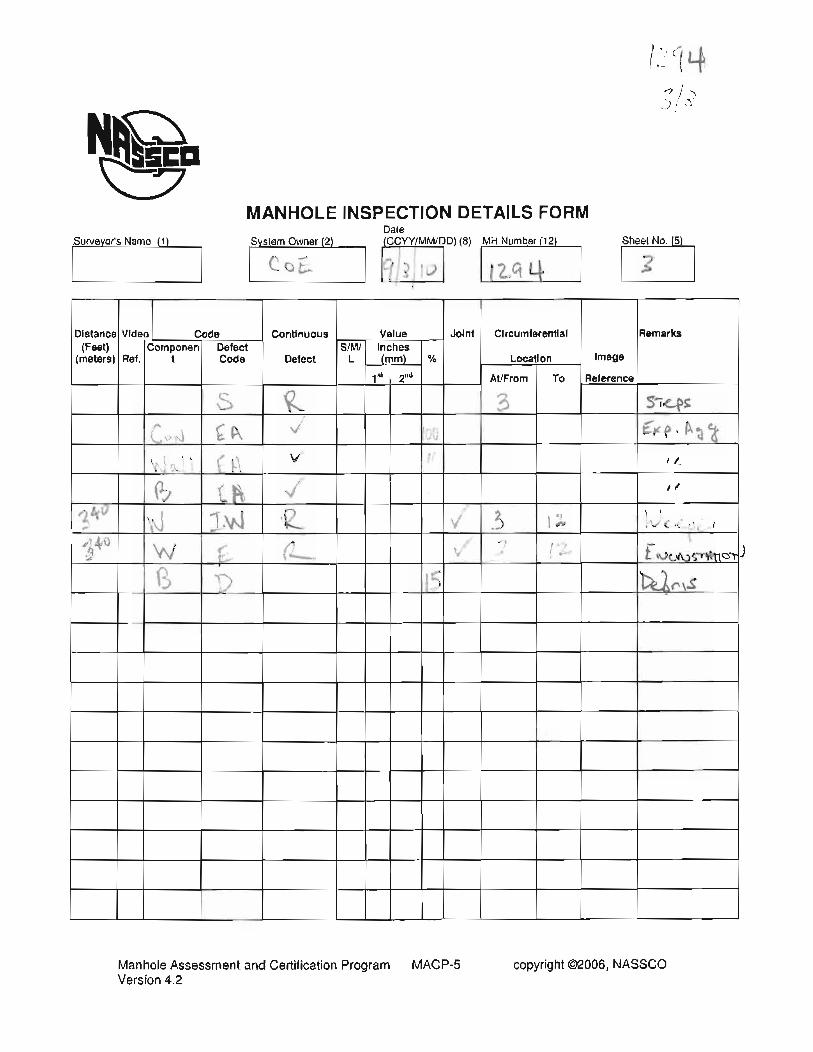
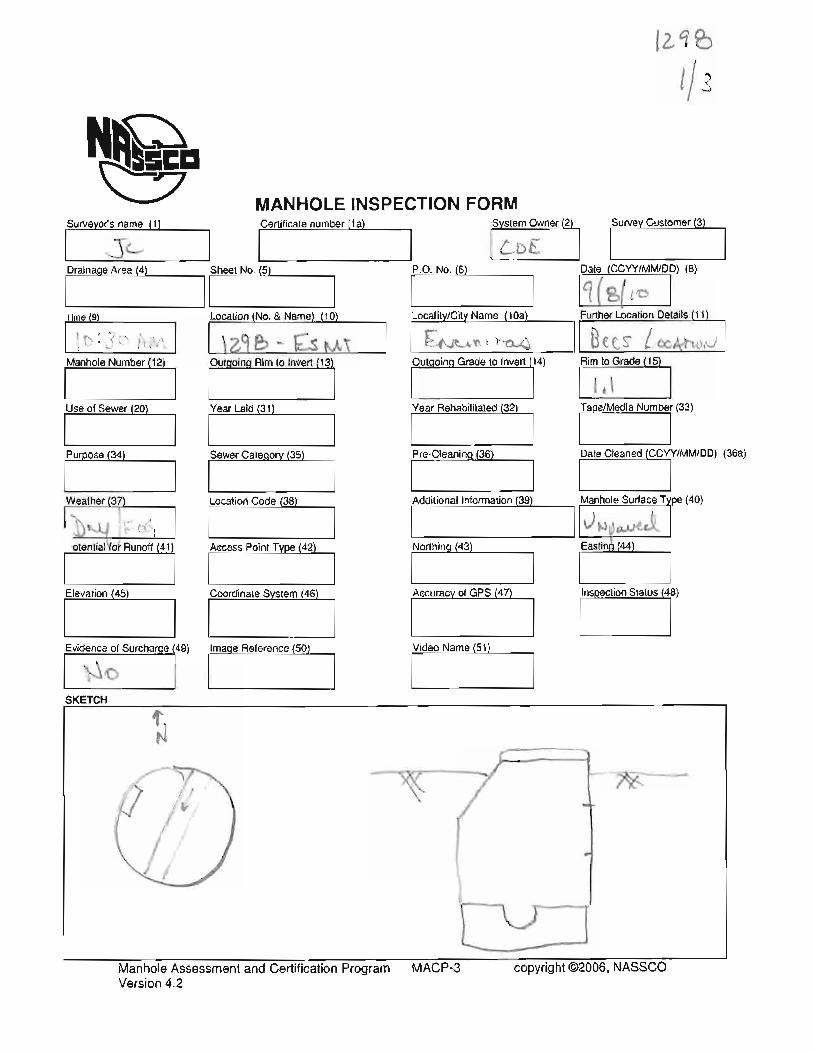
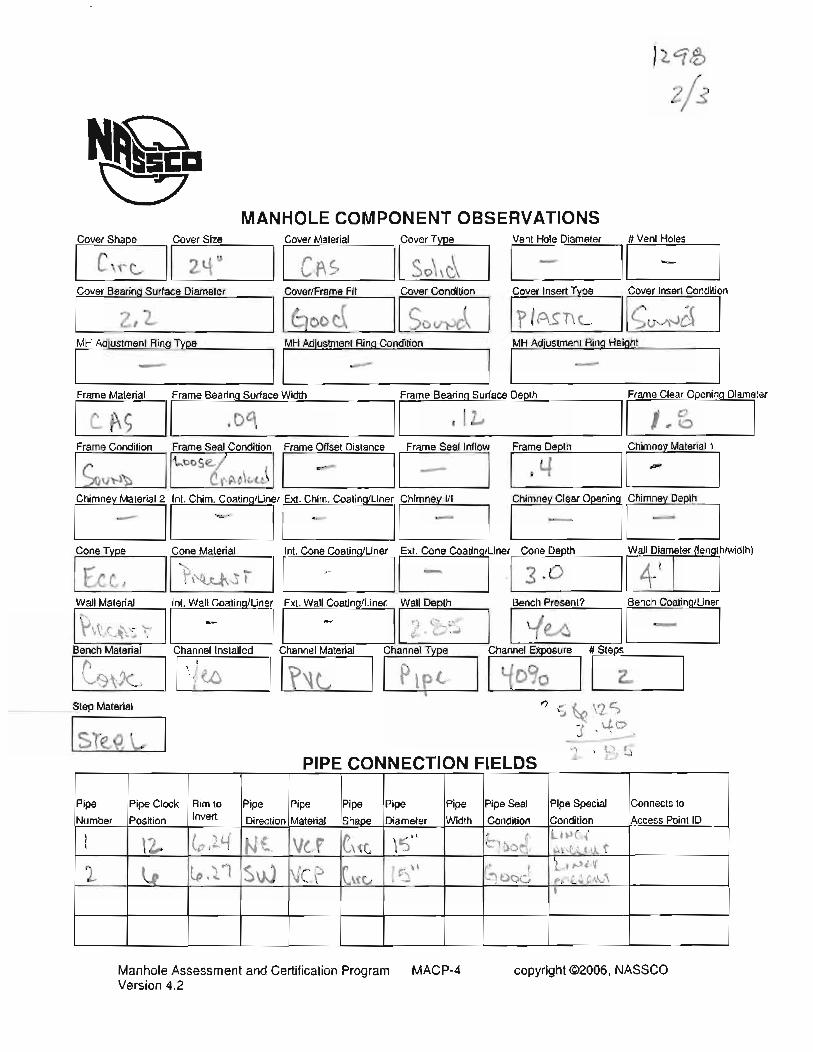
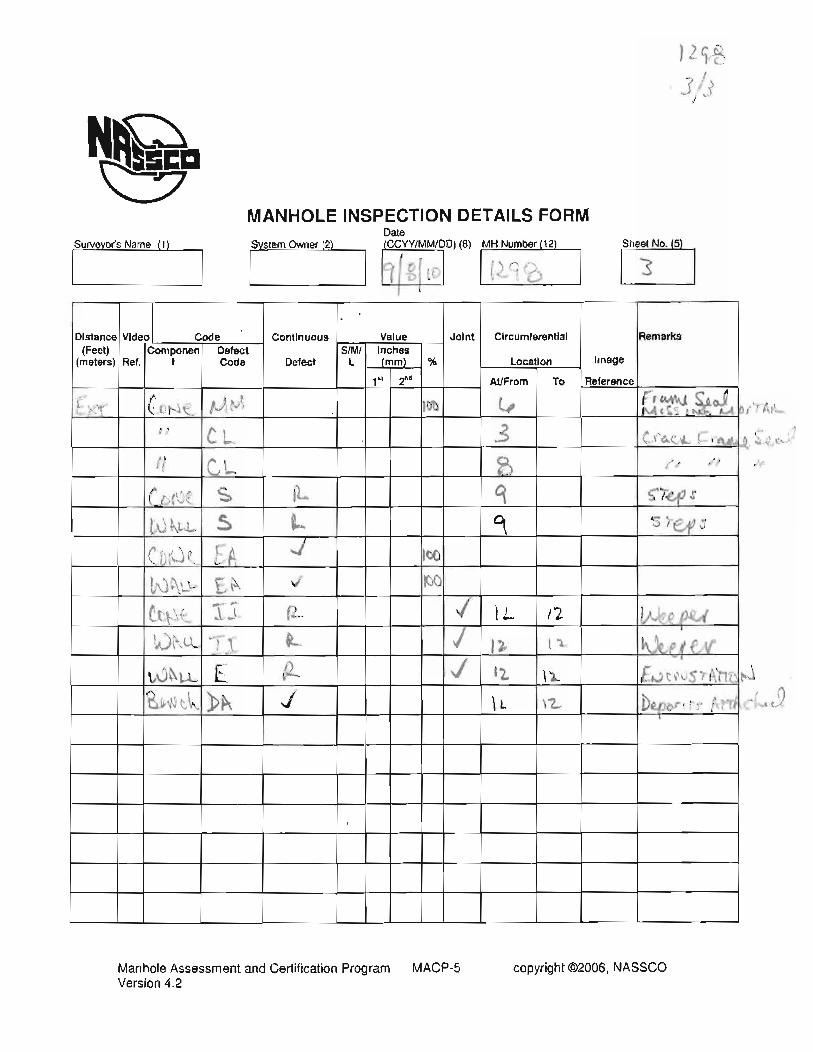
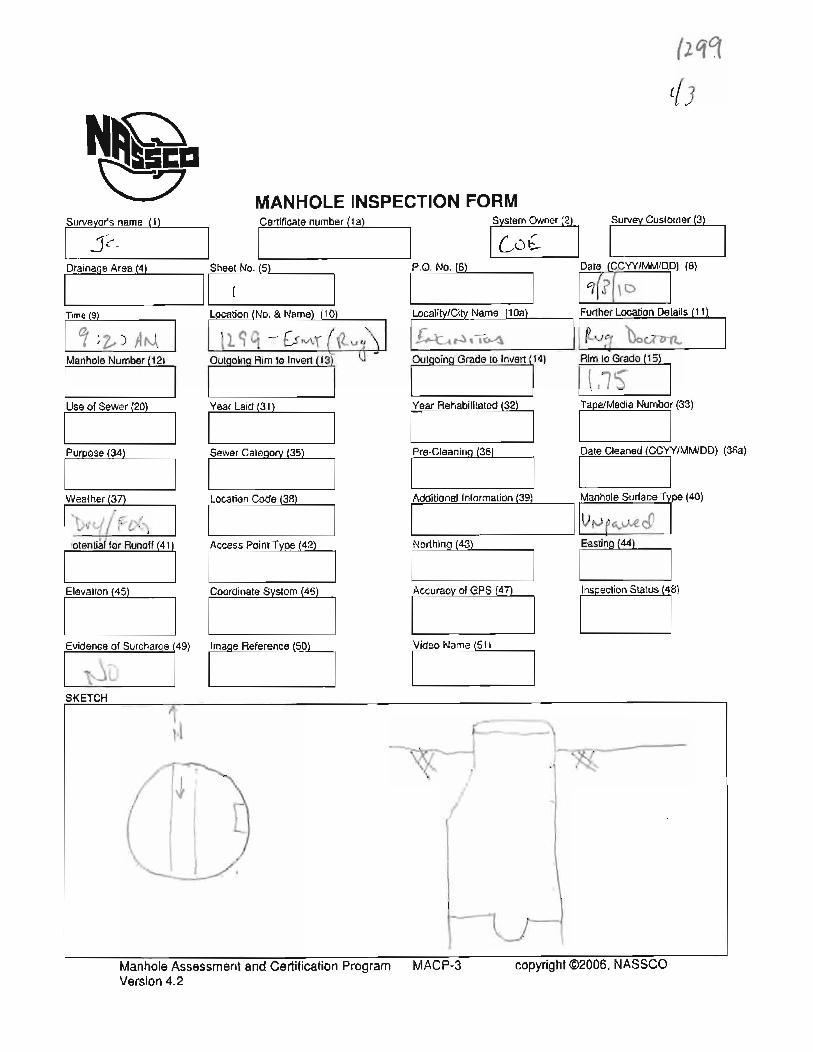
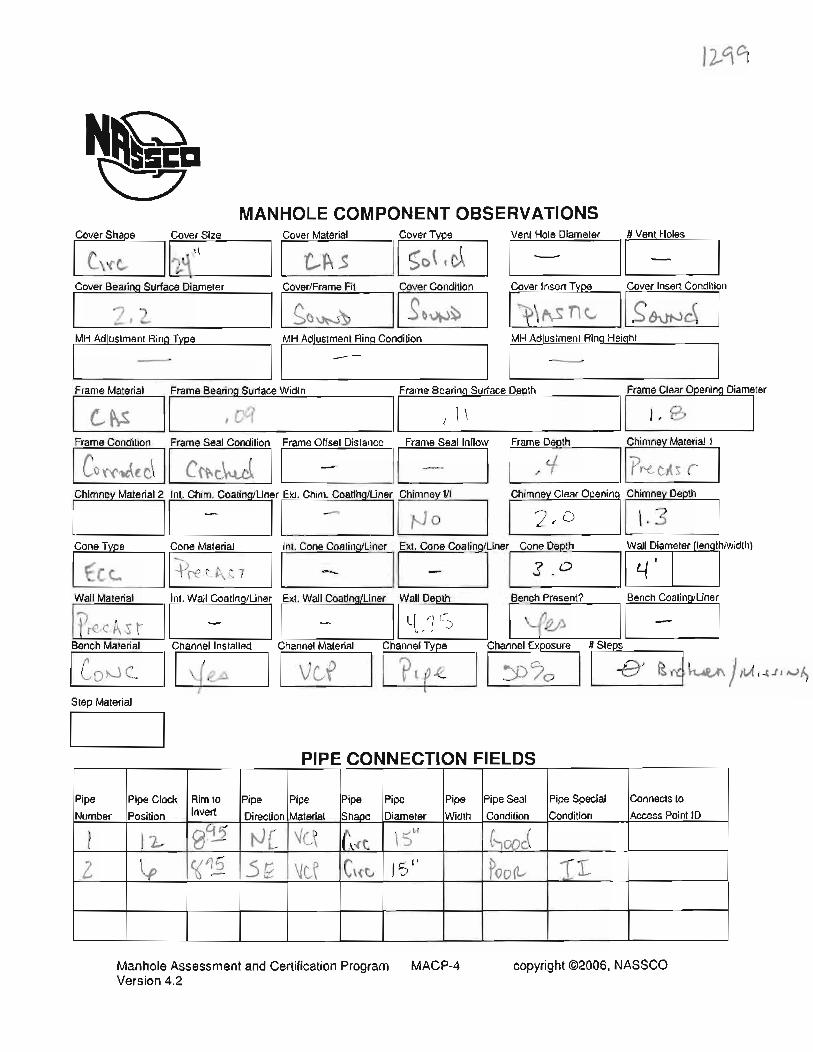
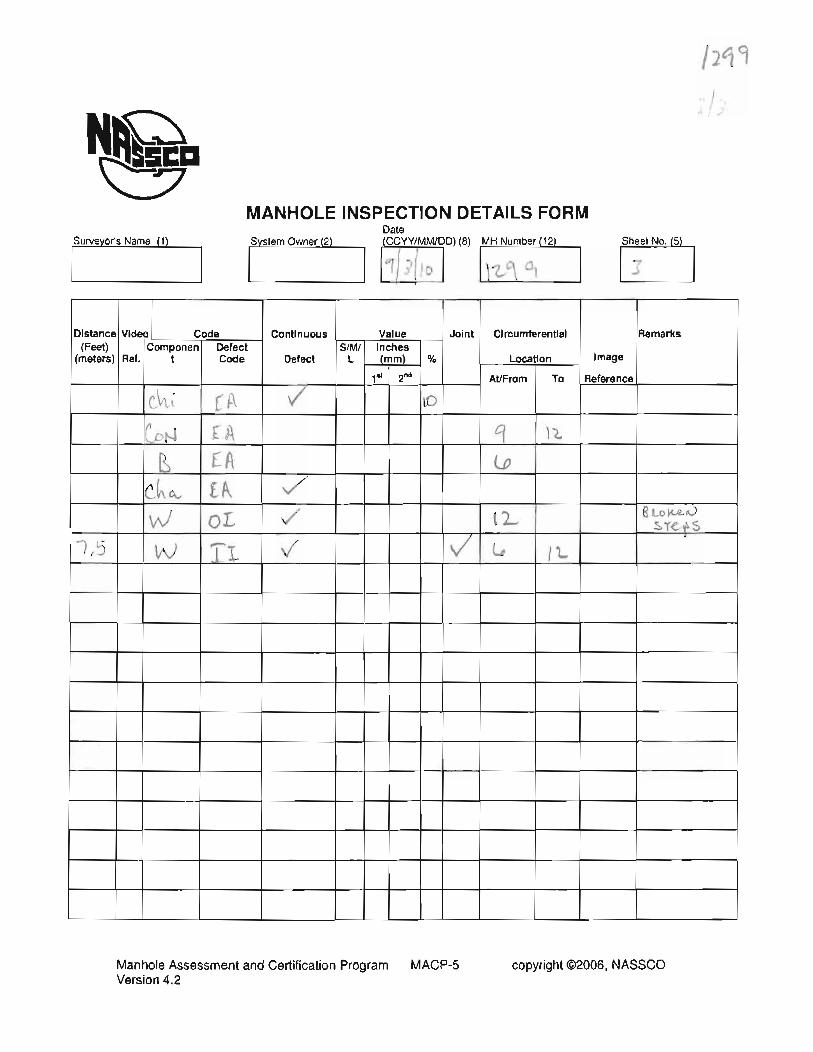
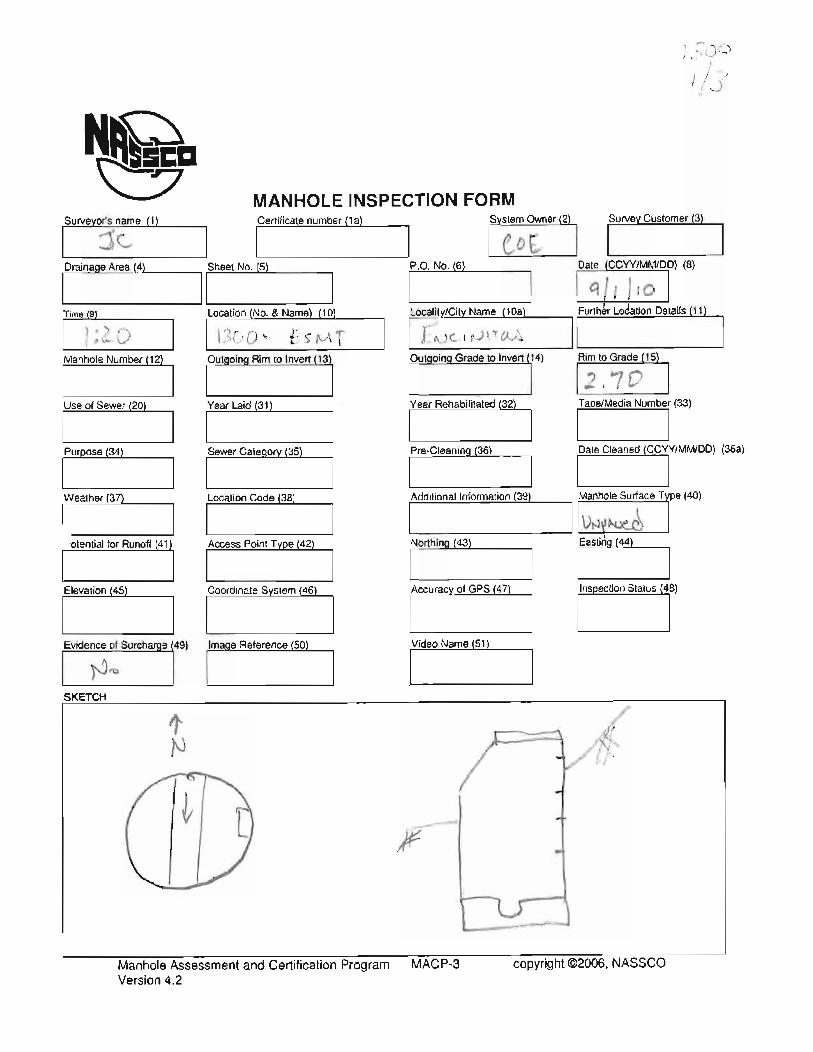
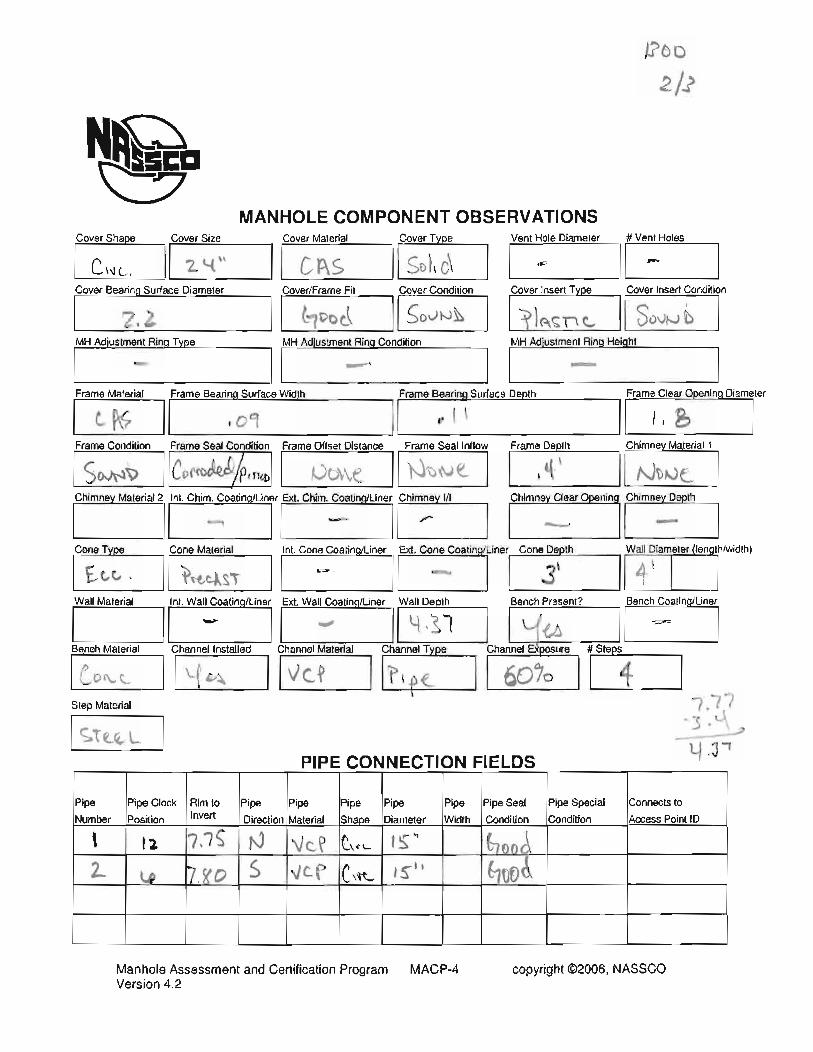
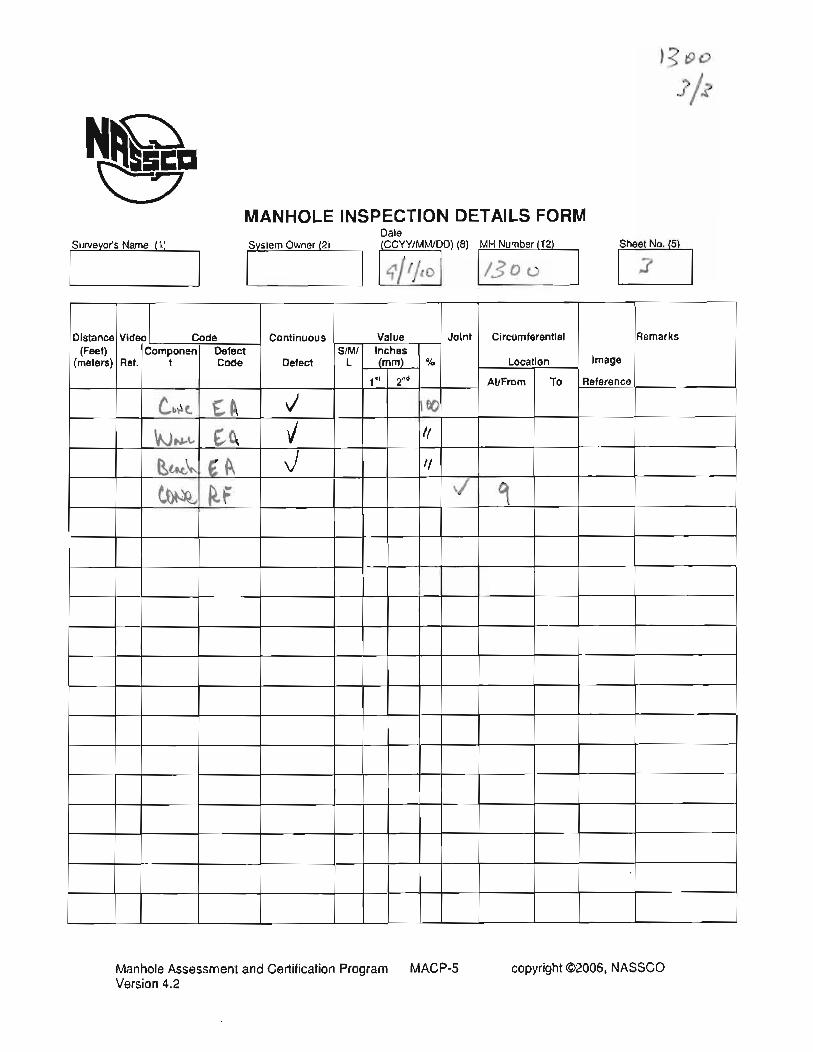
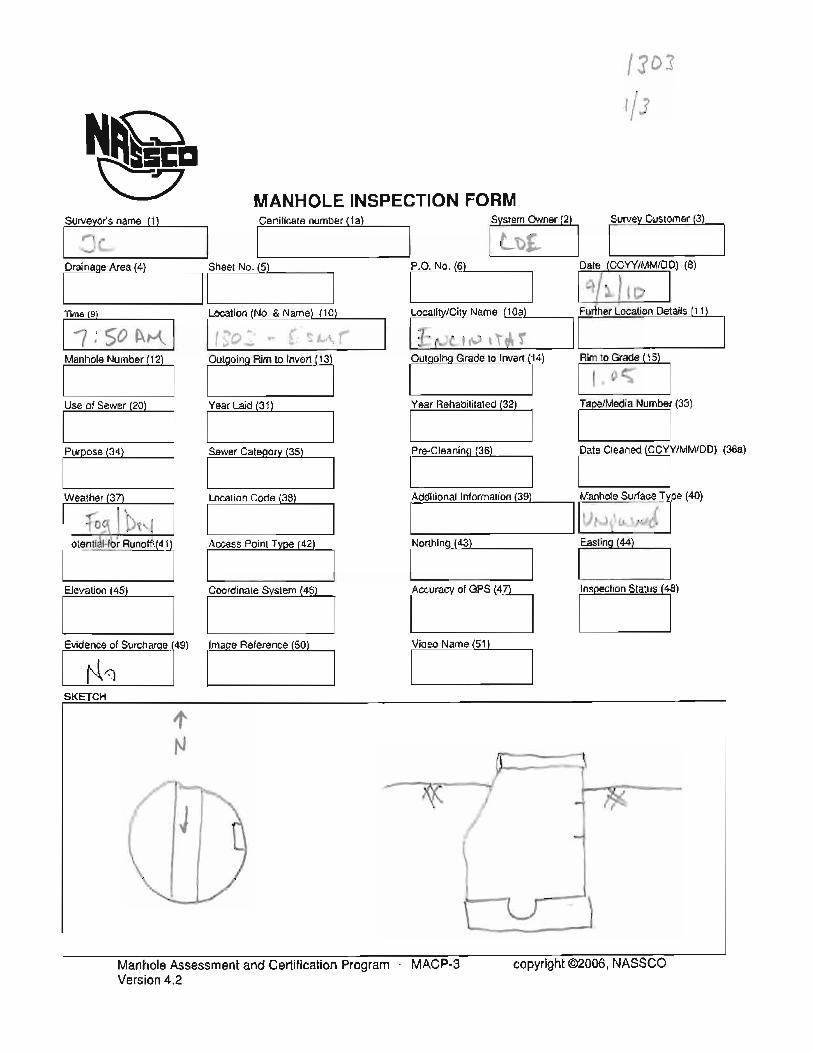
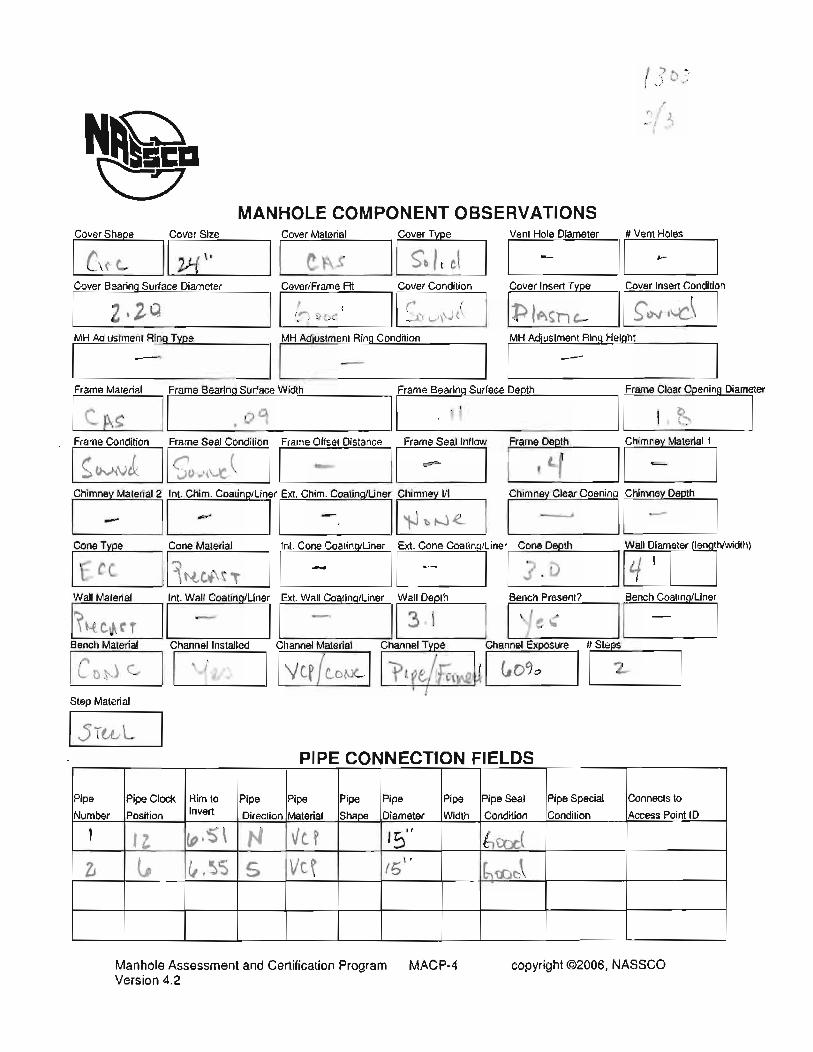
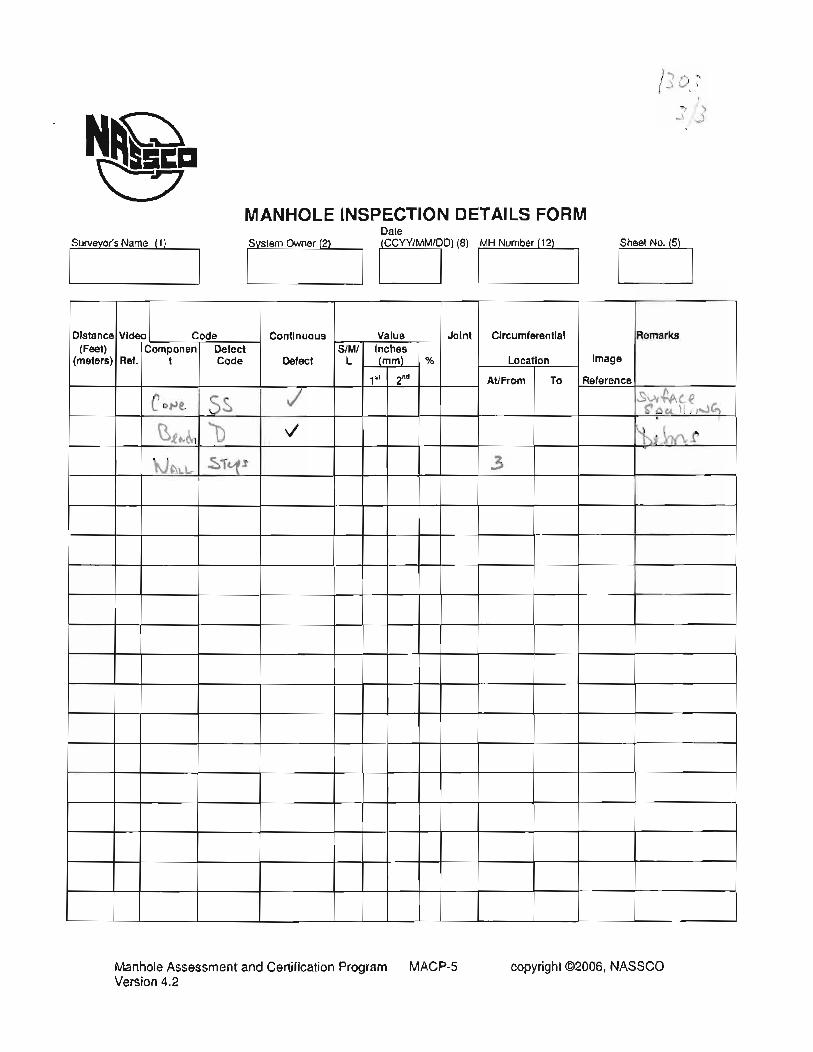
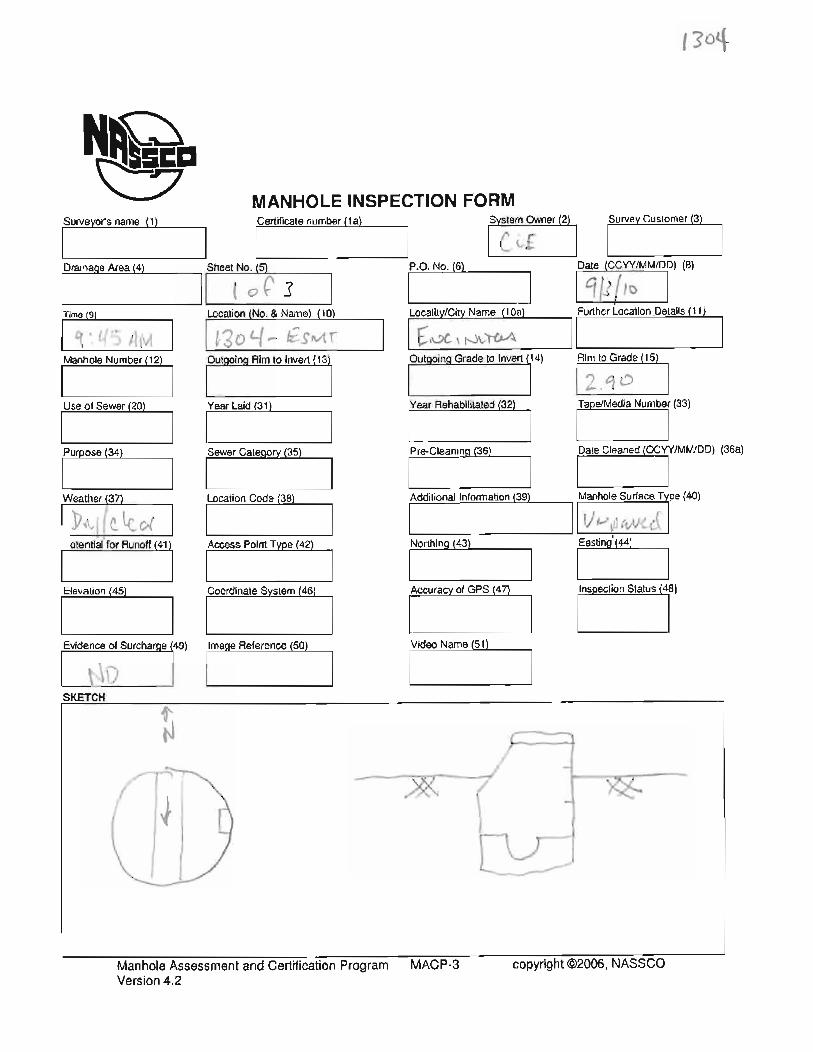

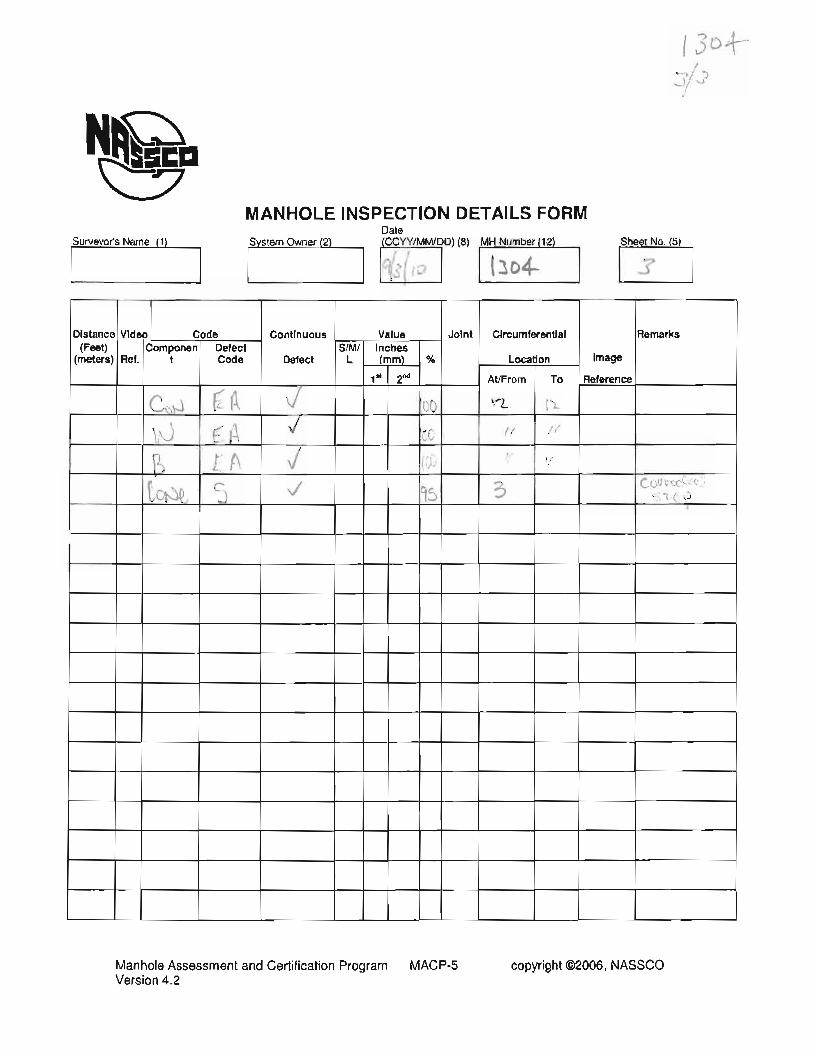


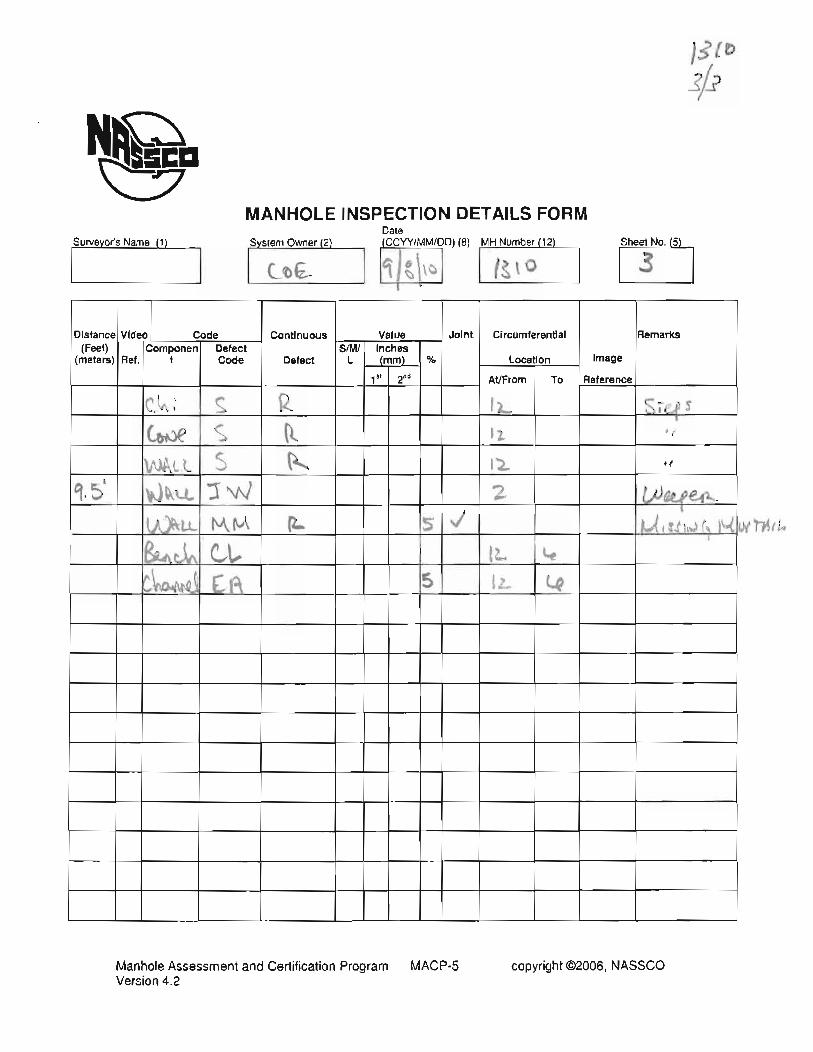
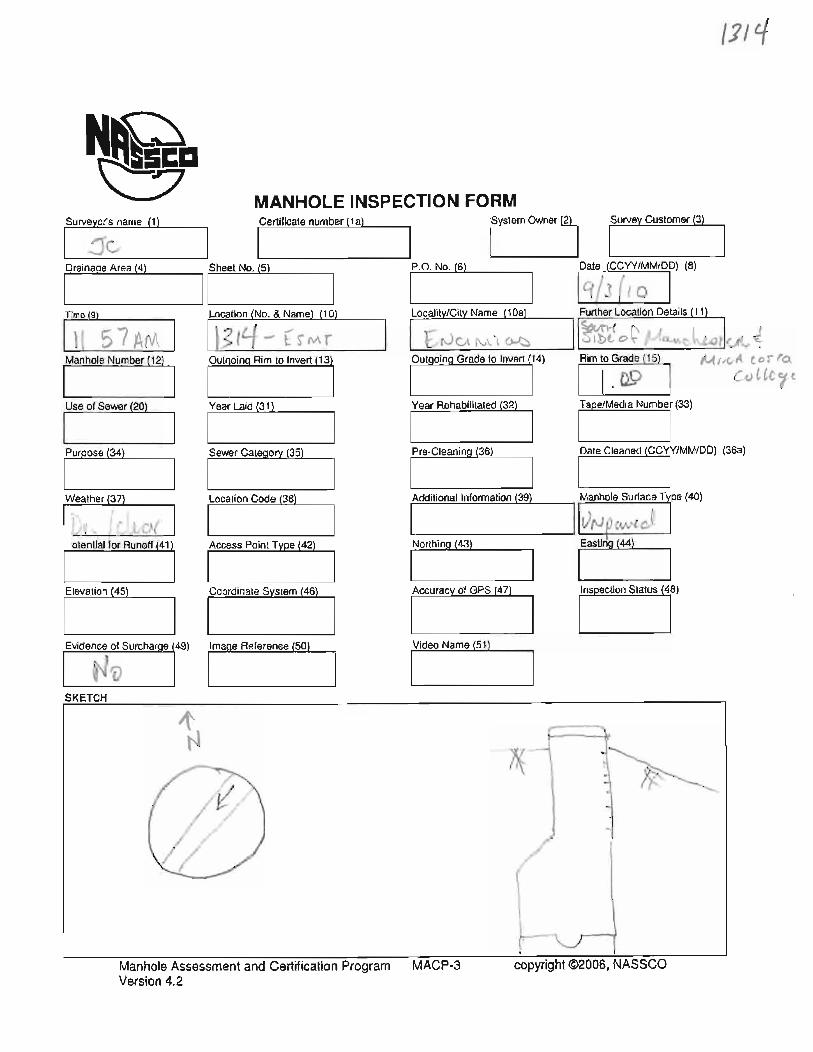
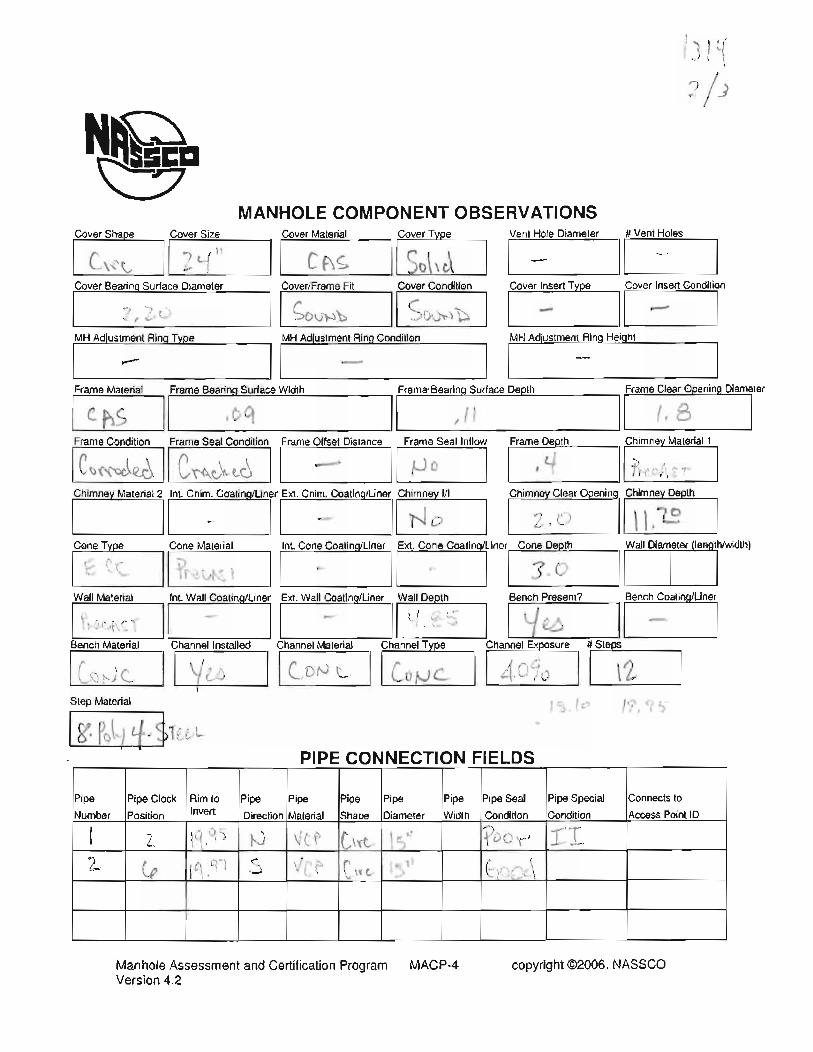
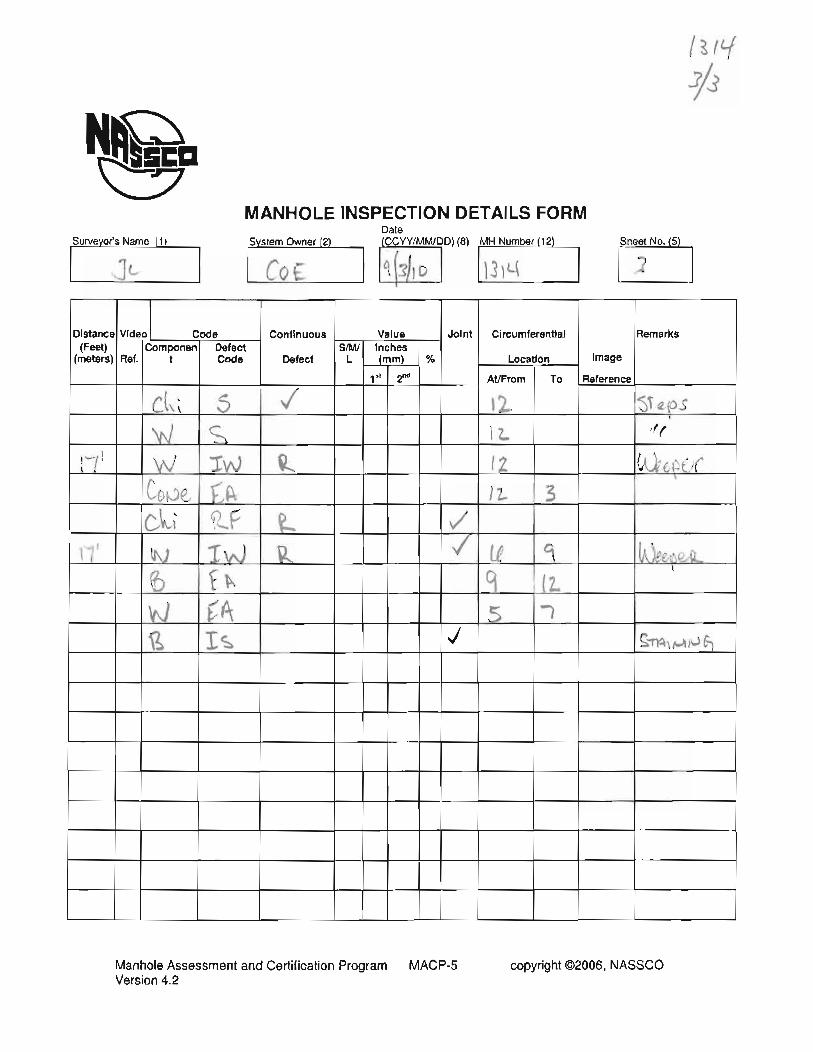
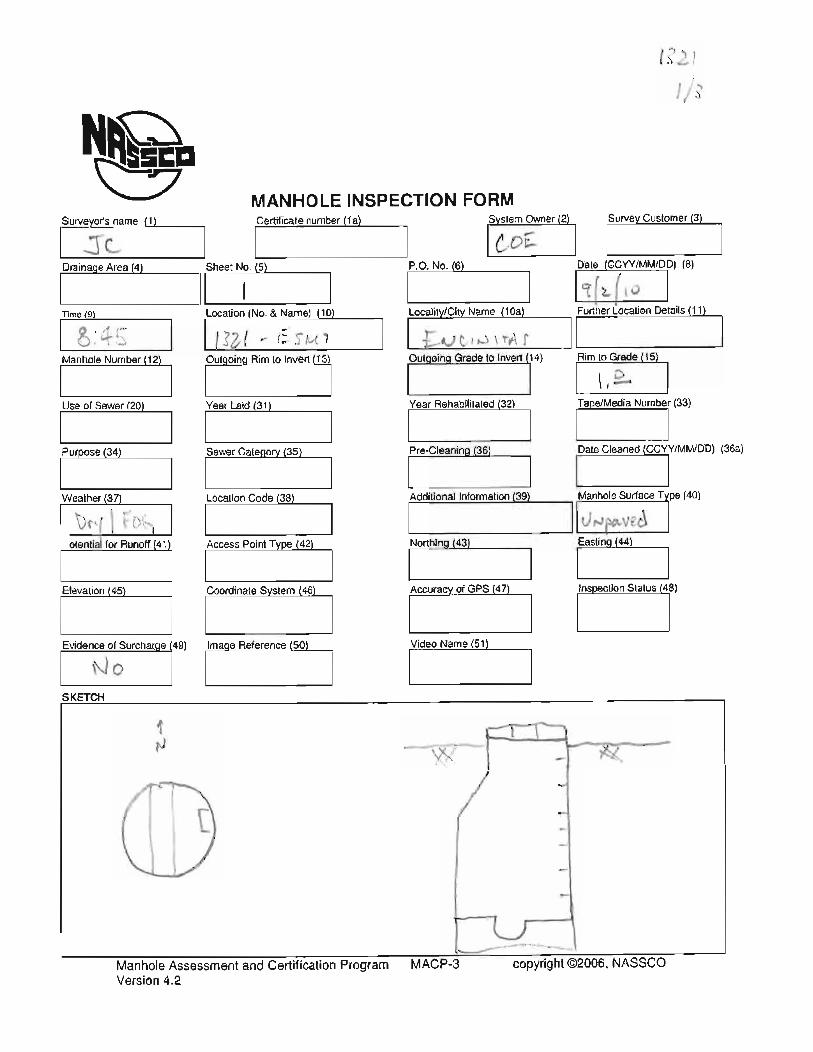

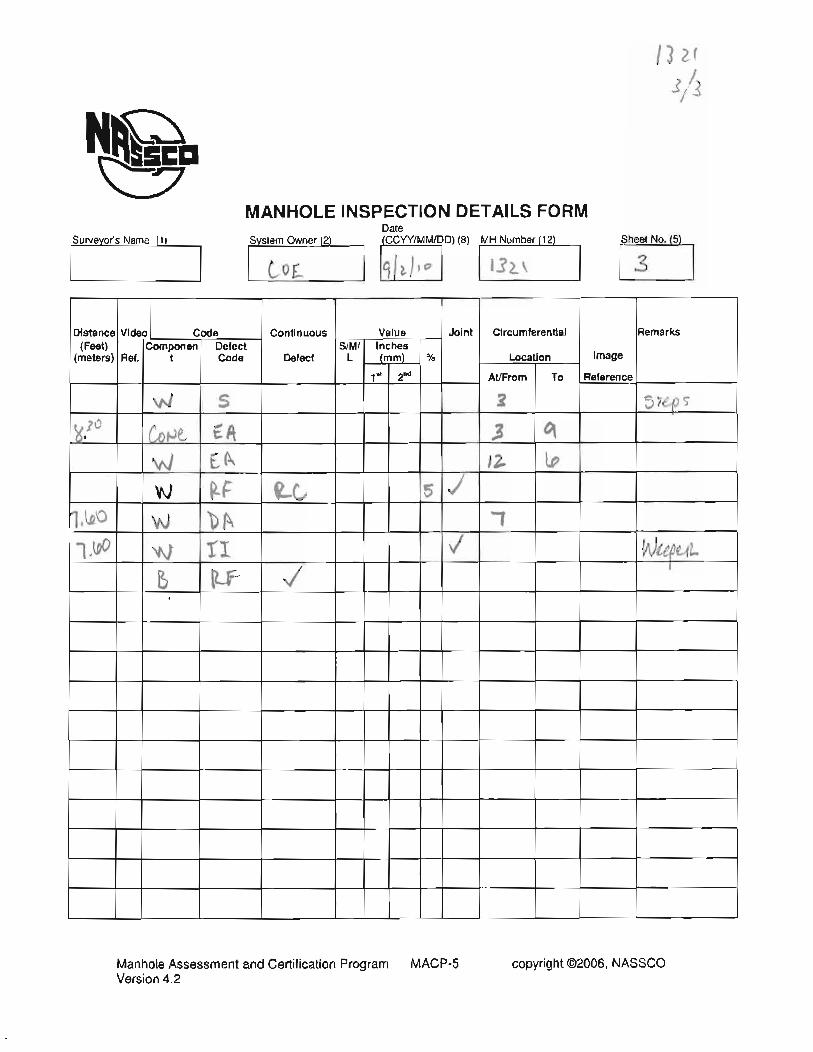
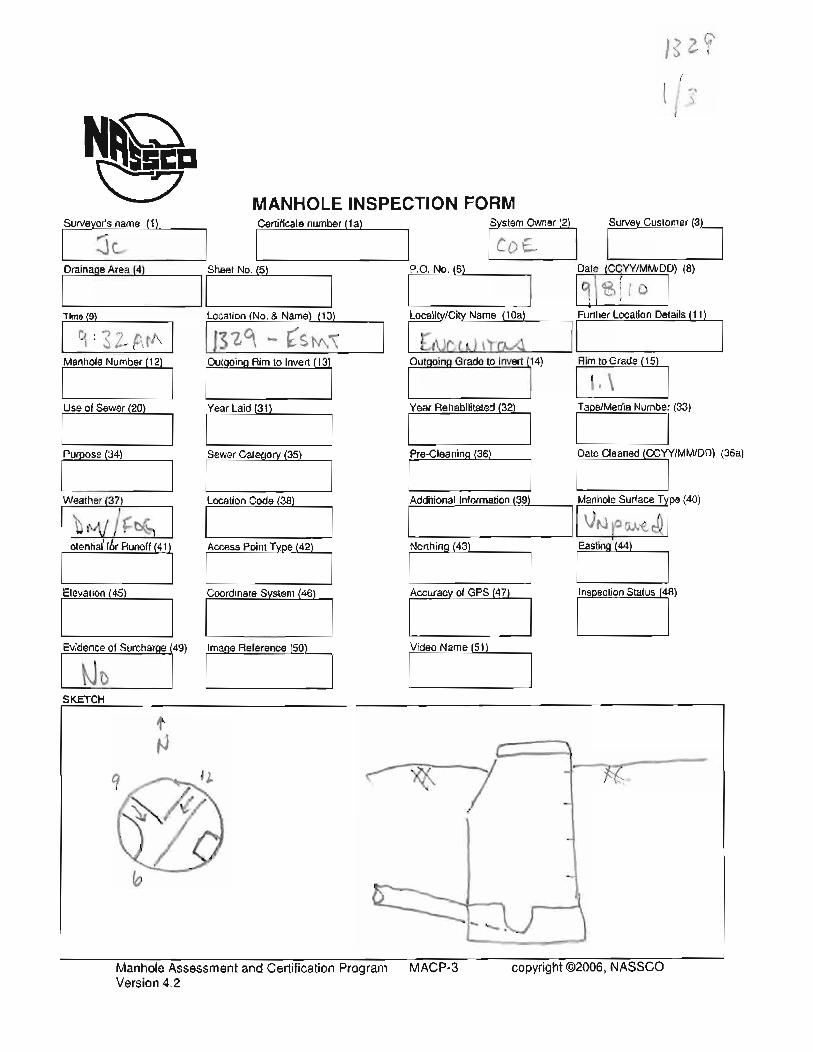
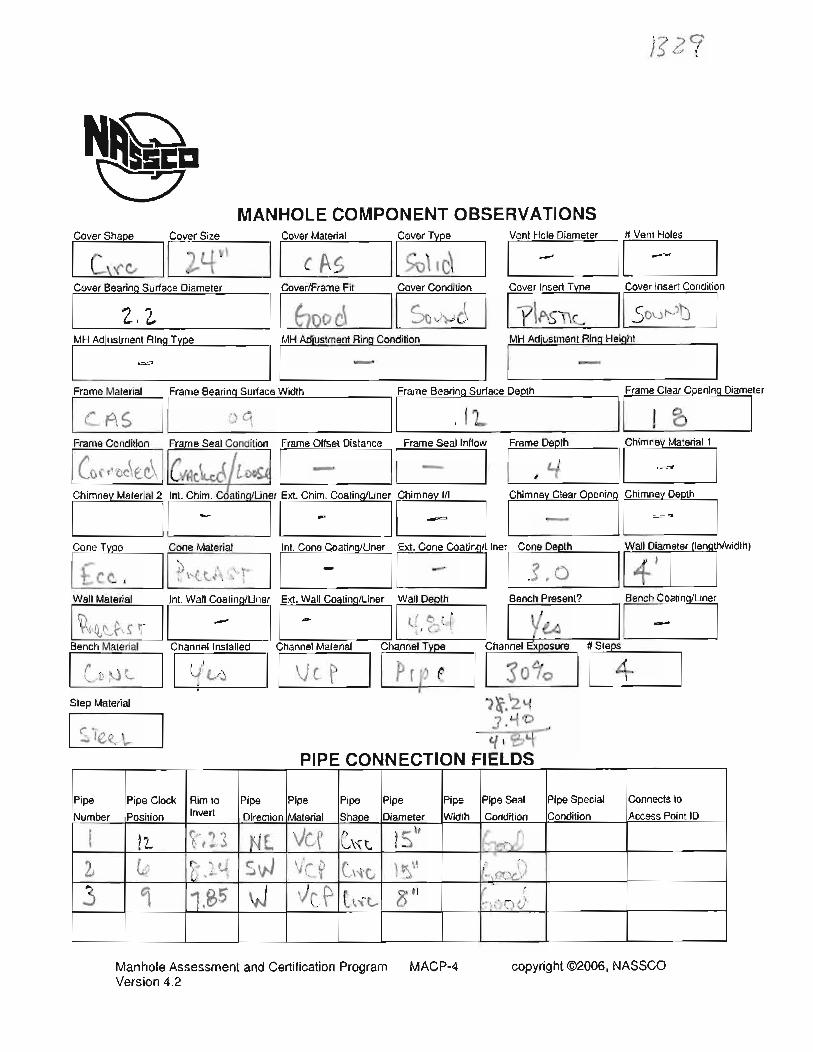
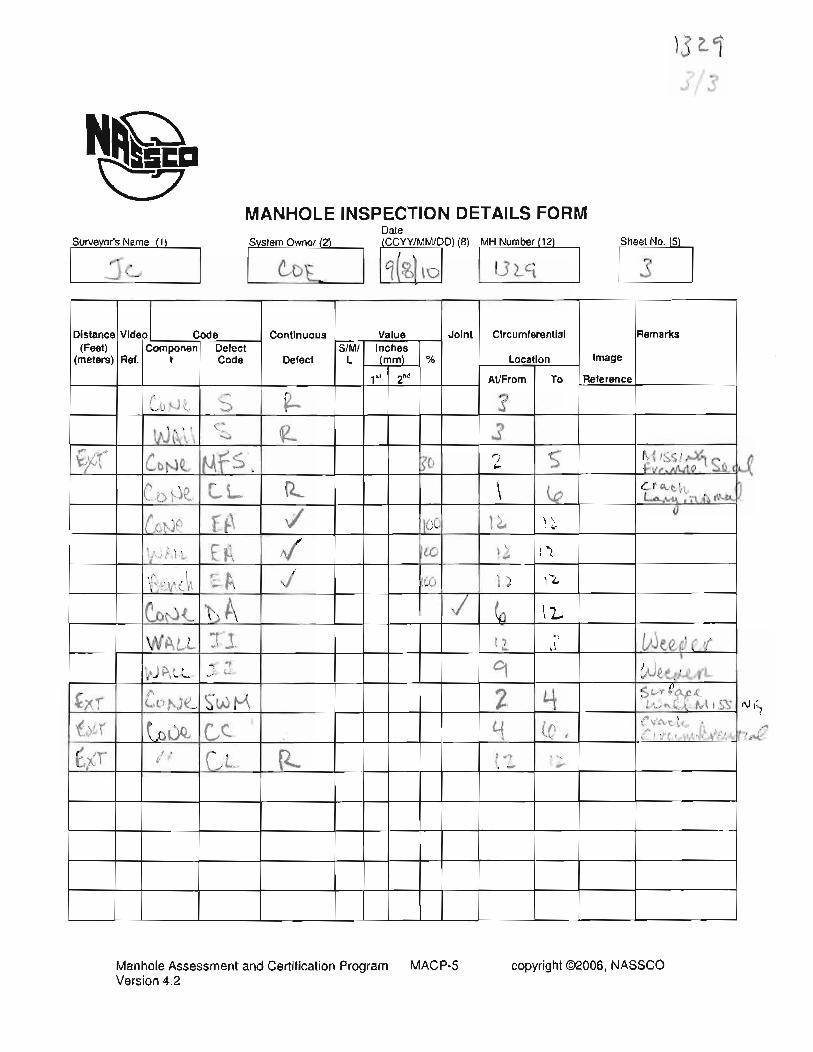
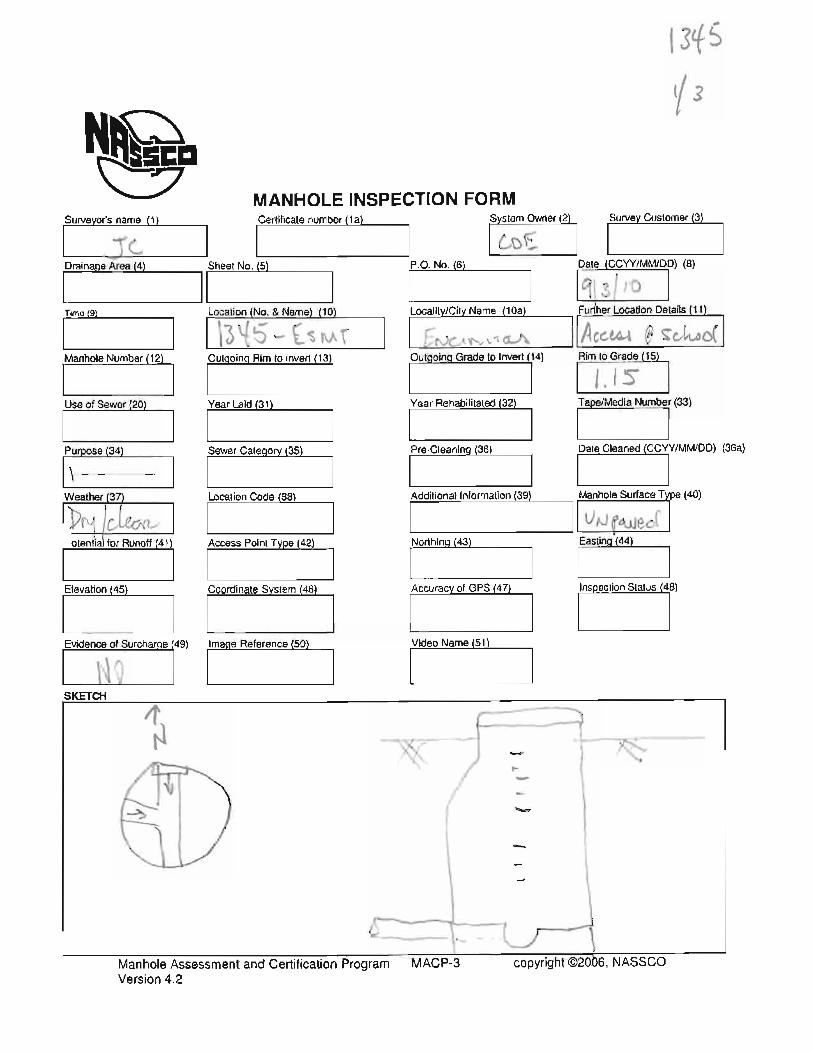
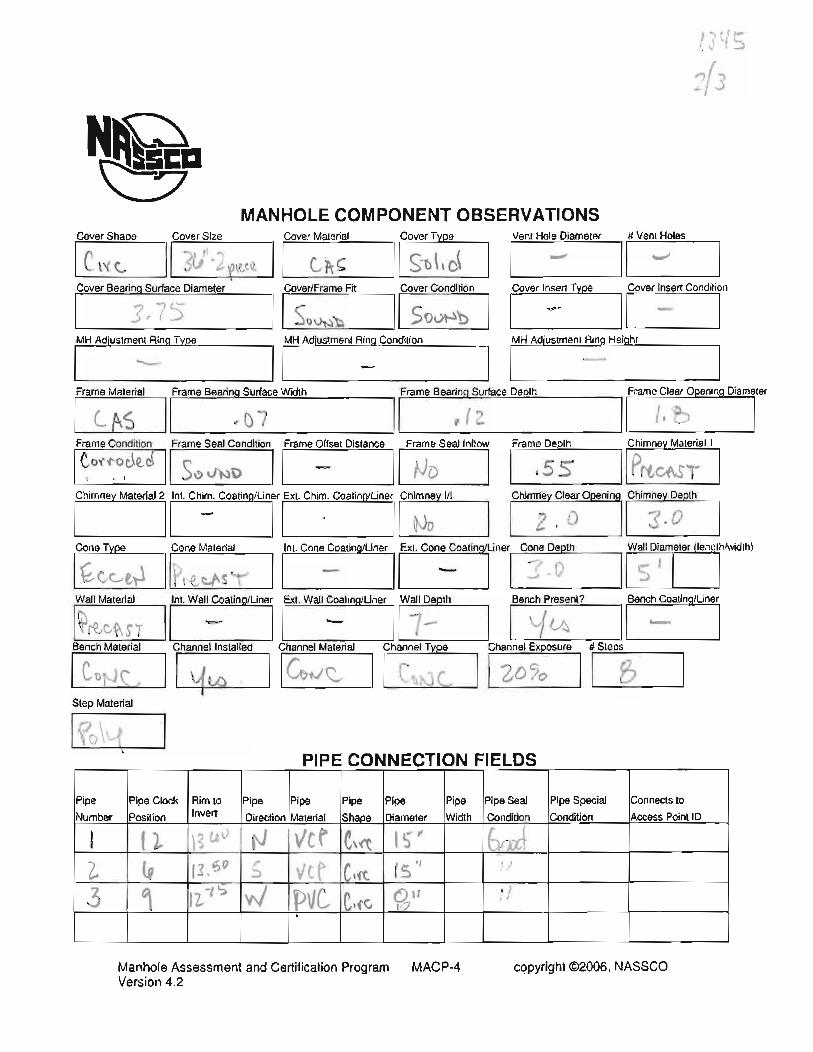
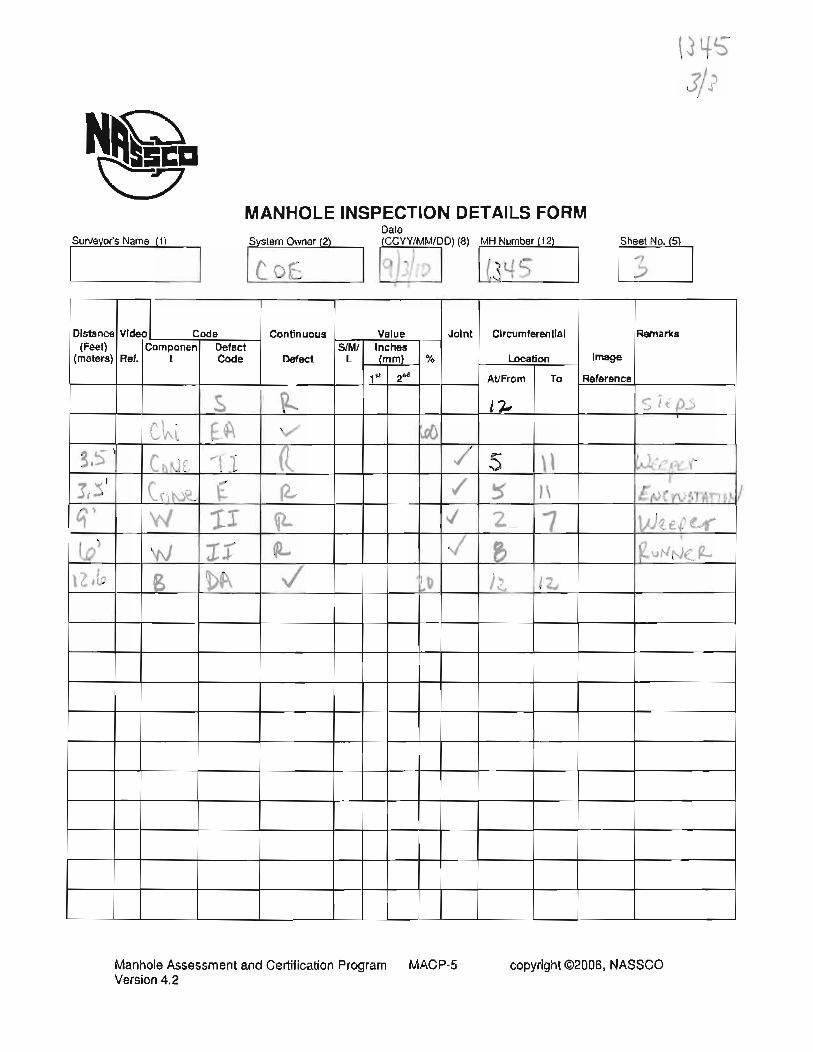

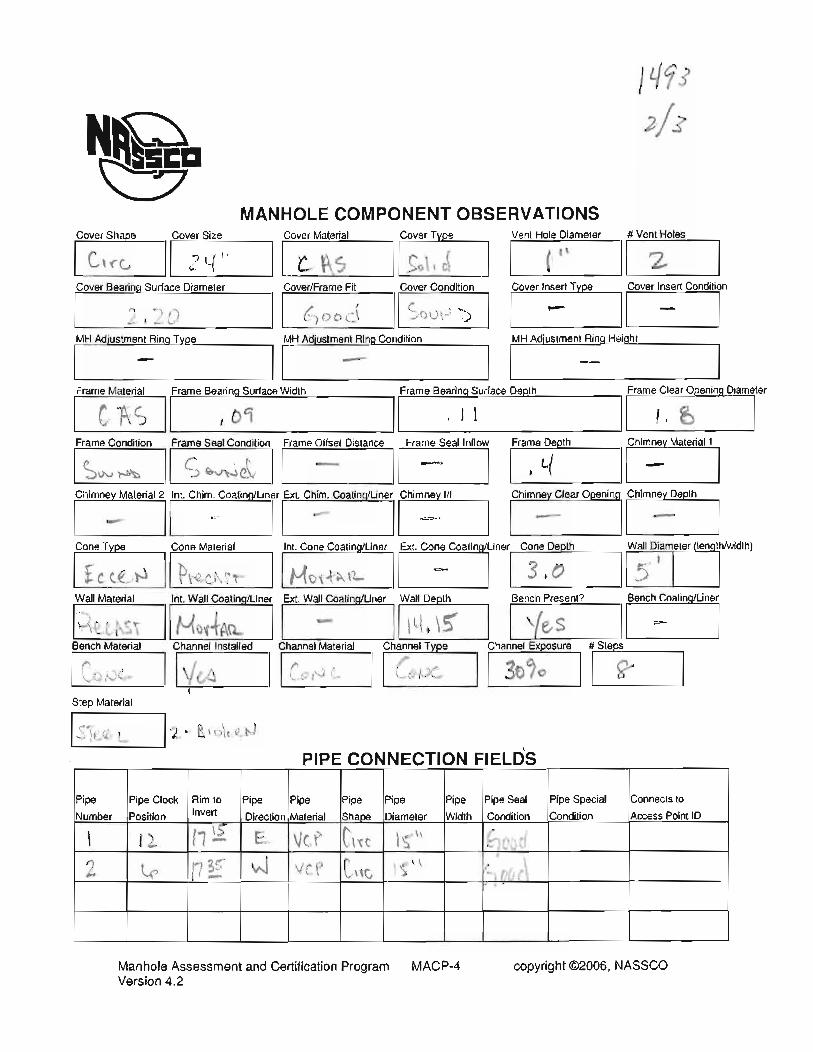
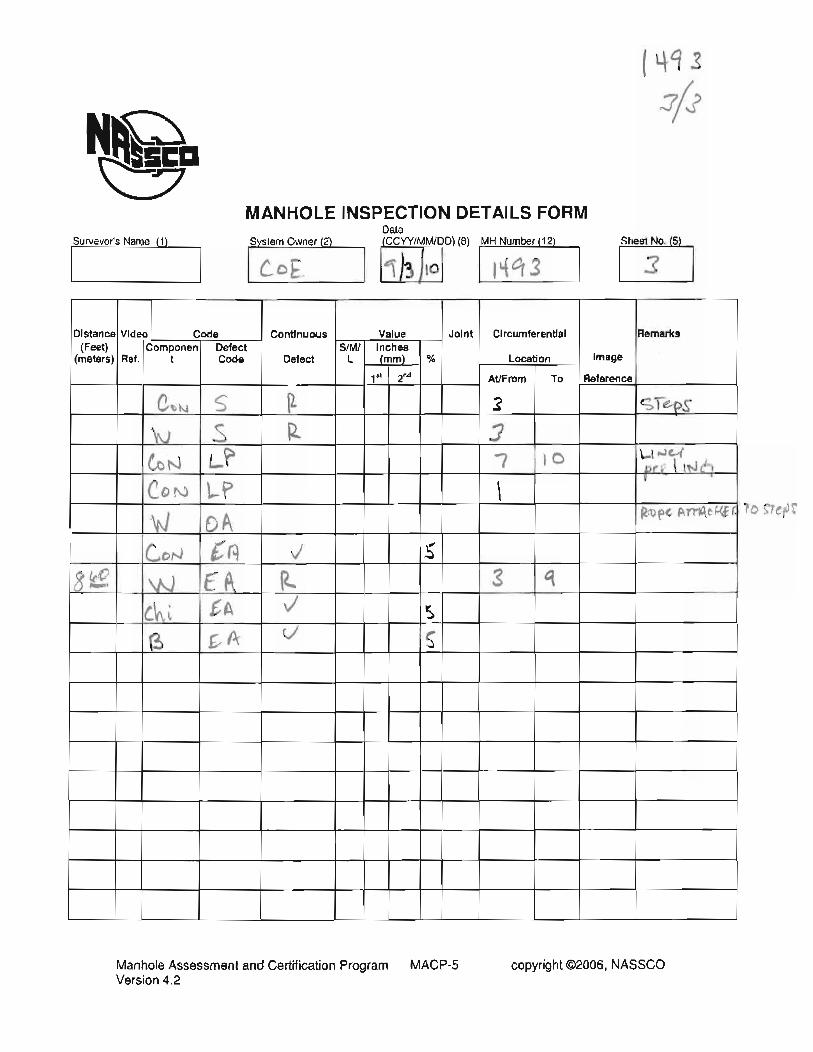
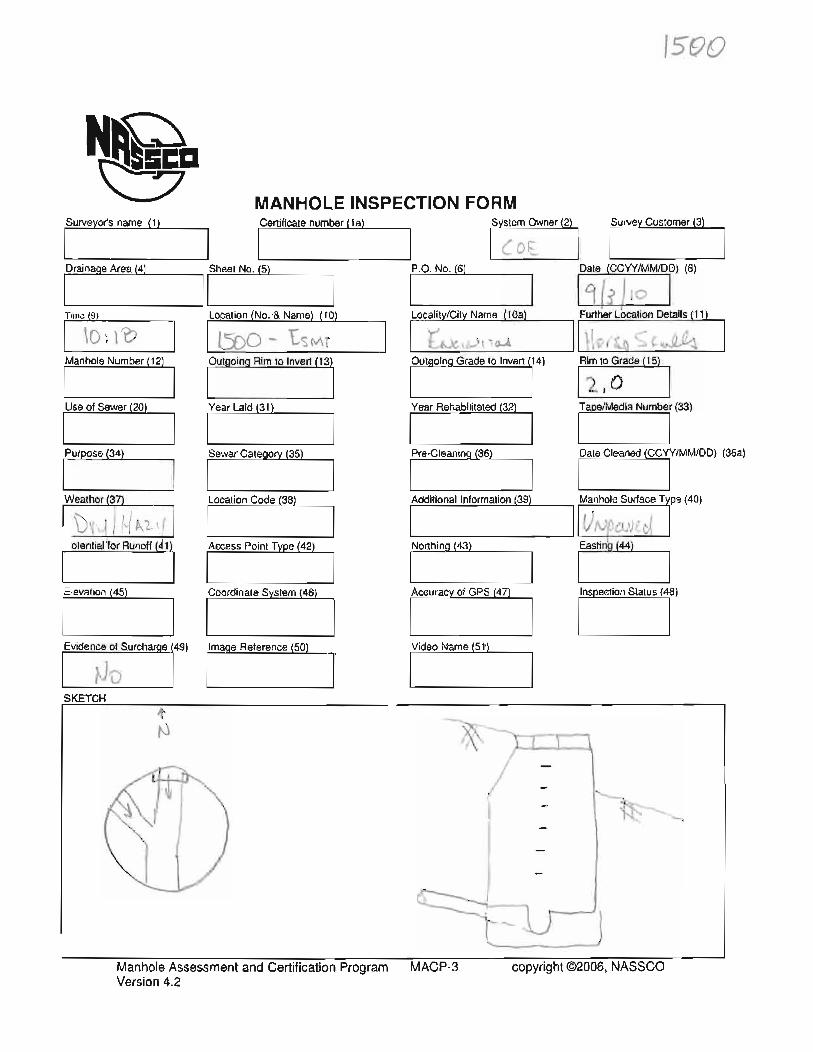
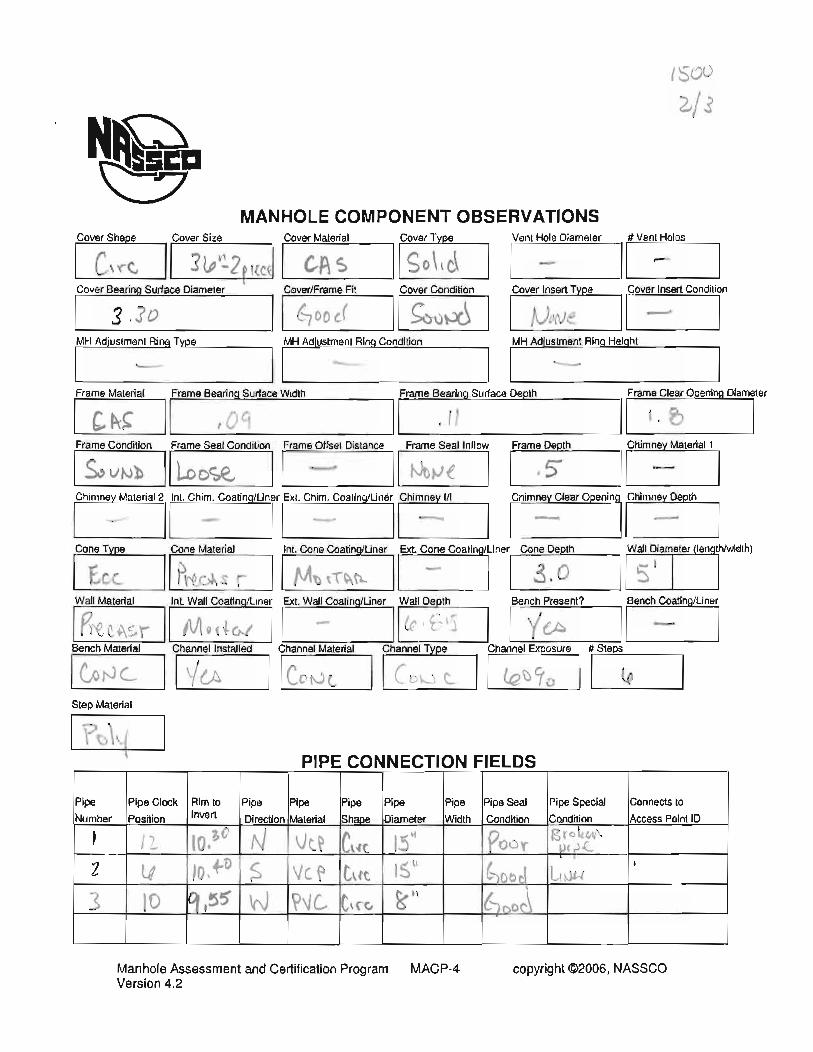
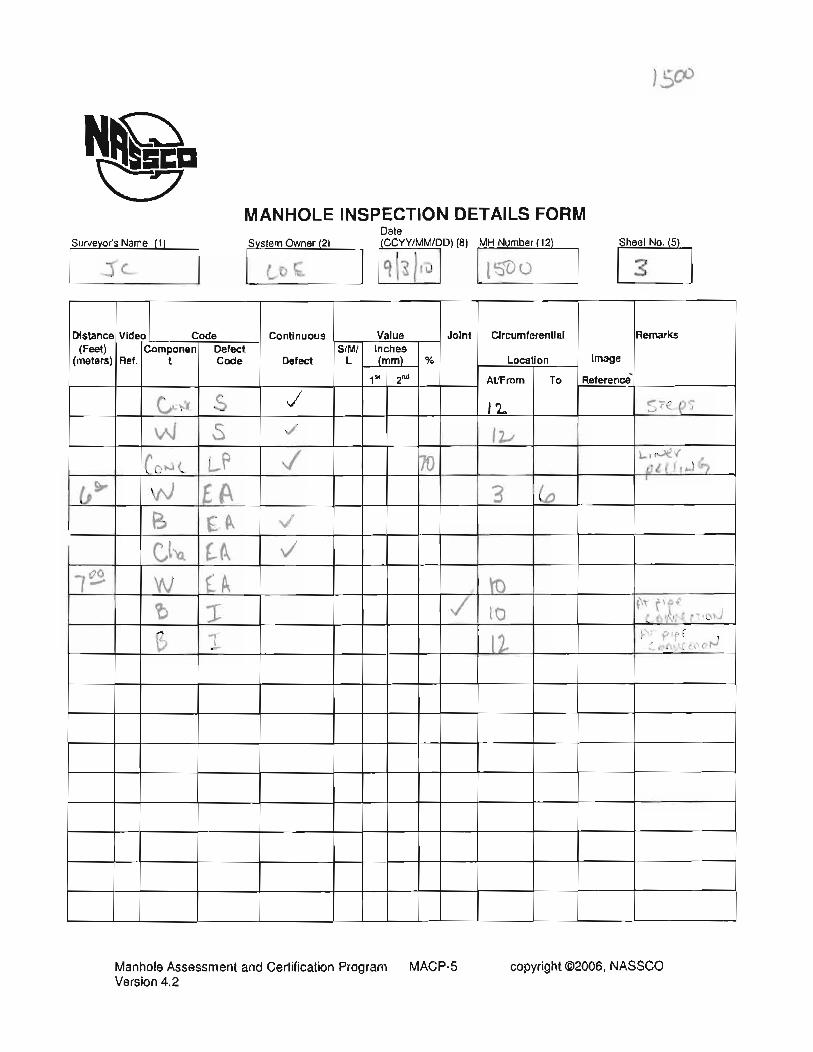
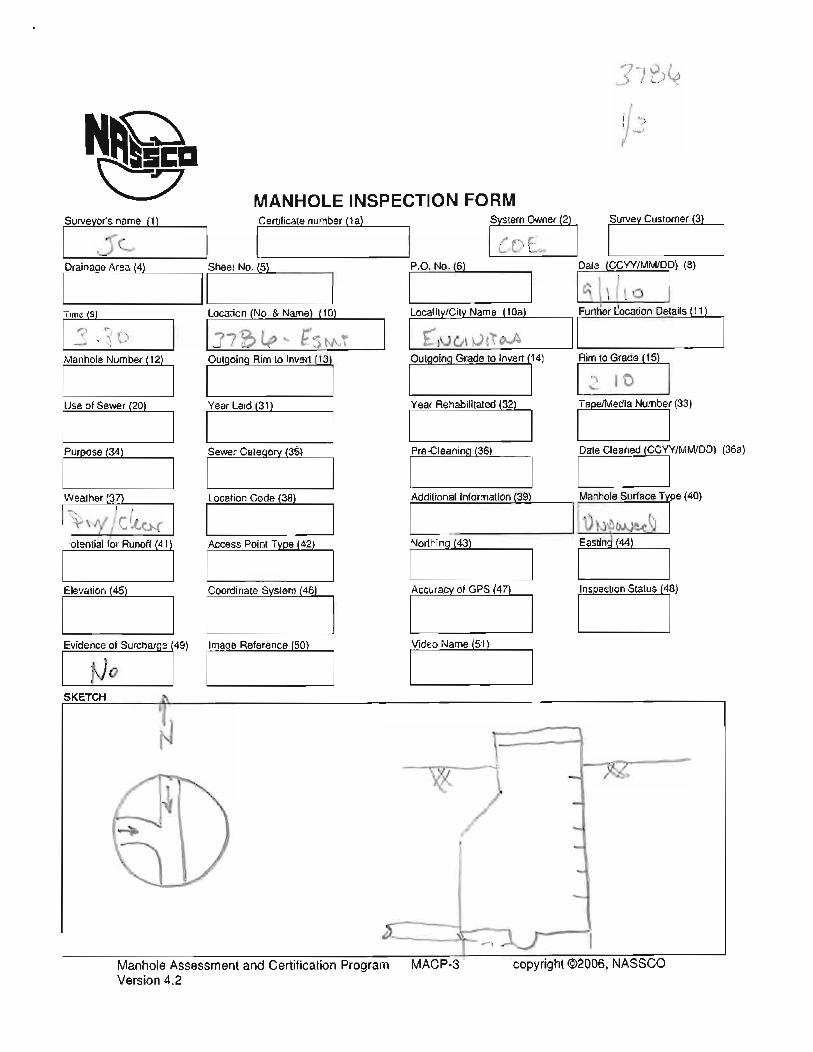
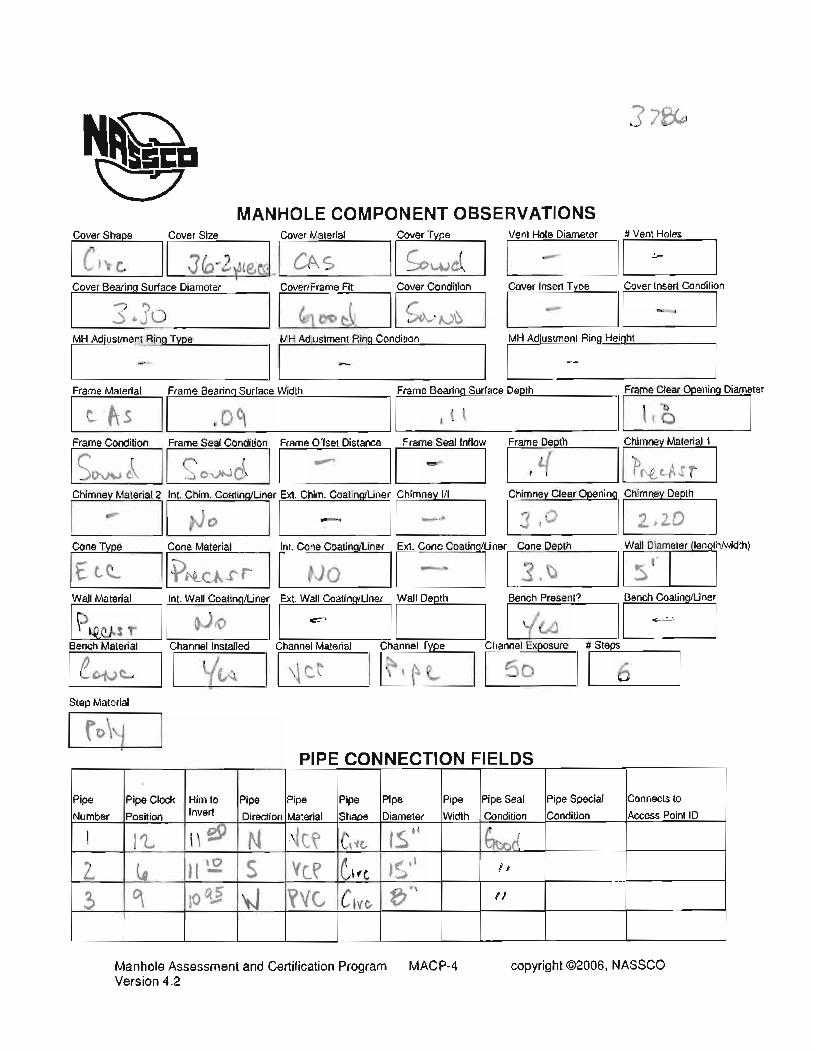
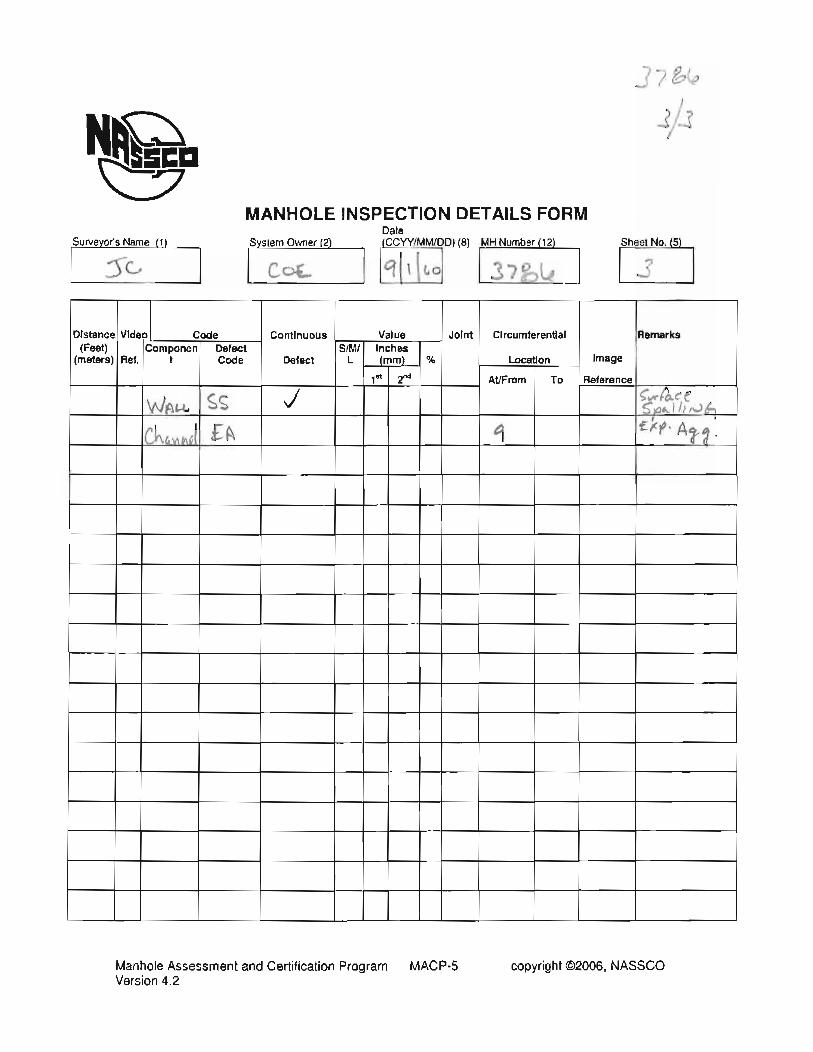
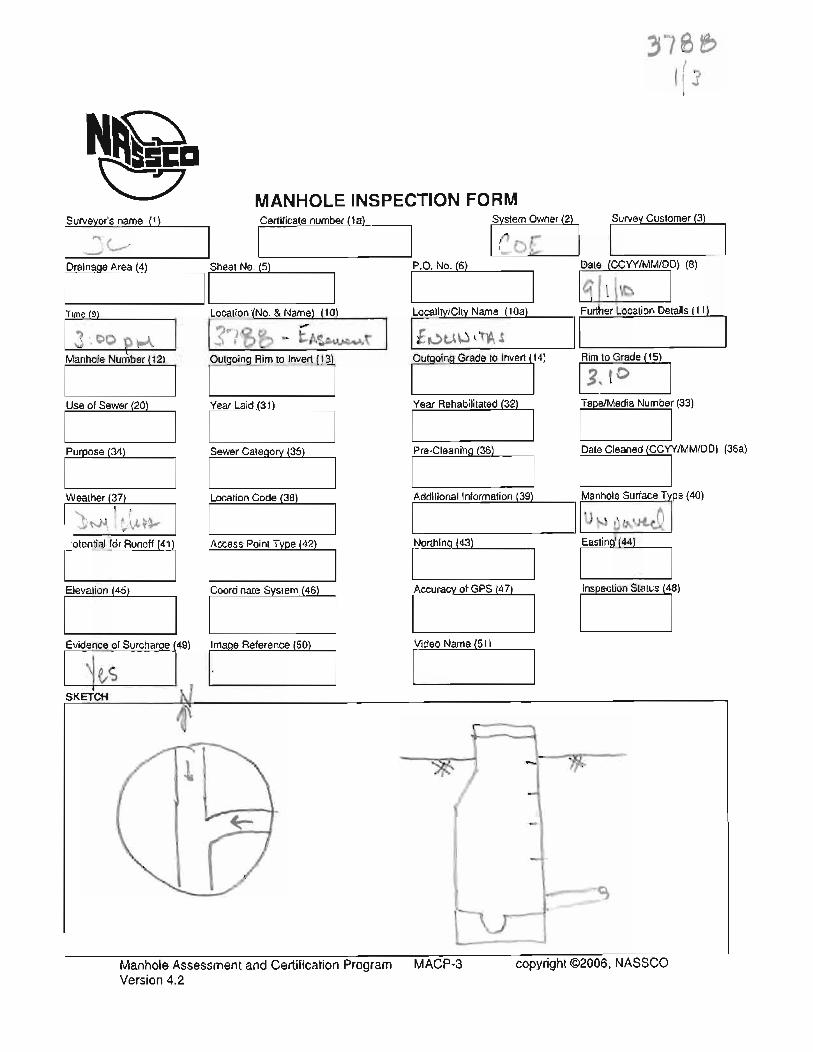

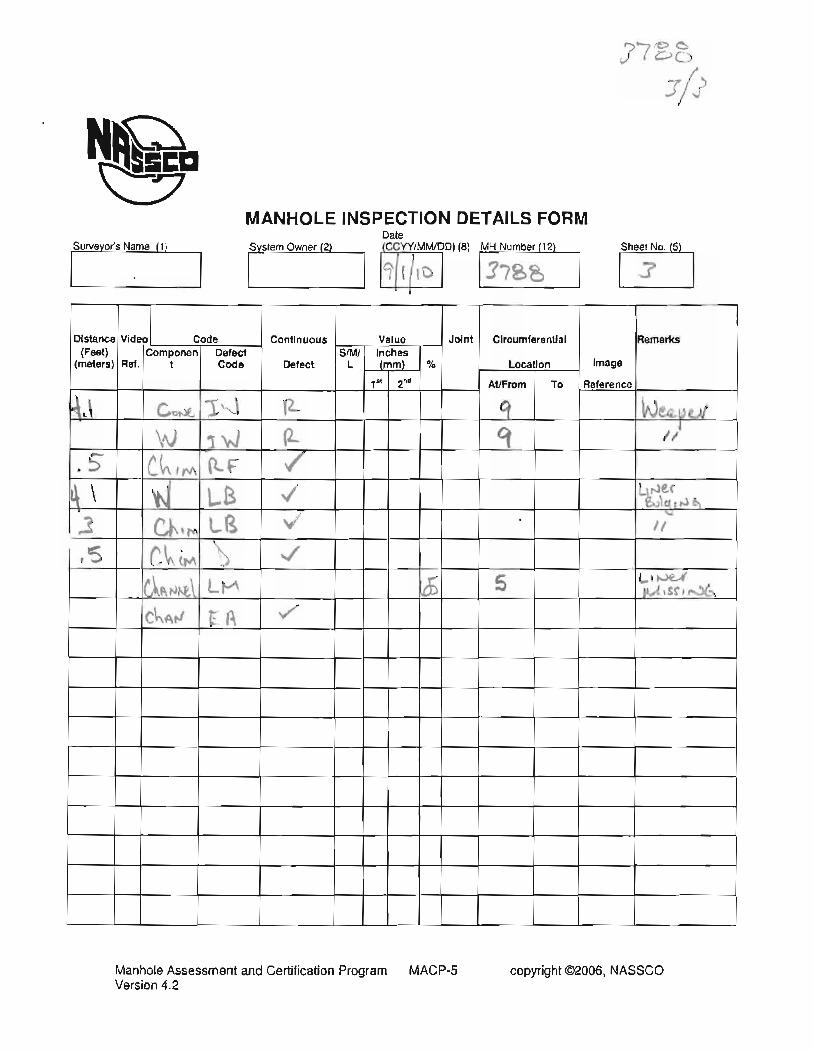

CSD and ESD DUDEK
SEWER MASTER PLAN UPDATE April 2011
APPENDIX D Pump Station Field Review Reports
Cardiff Pump Station
Coast Blvd. Pump Station
Moonlight Beach Pump Station

CSD and ESD DUDEK
SEWER MASTER PLAN UPDATE April 2011
INTENTIONALLY LEFT BLANK
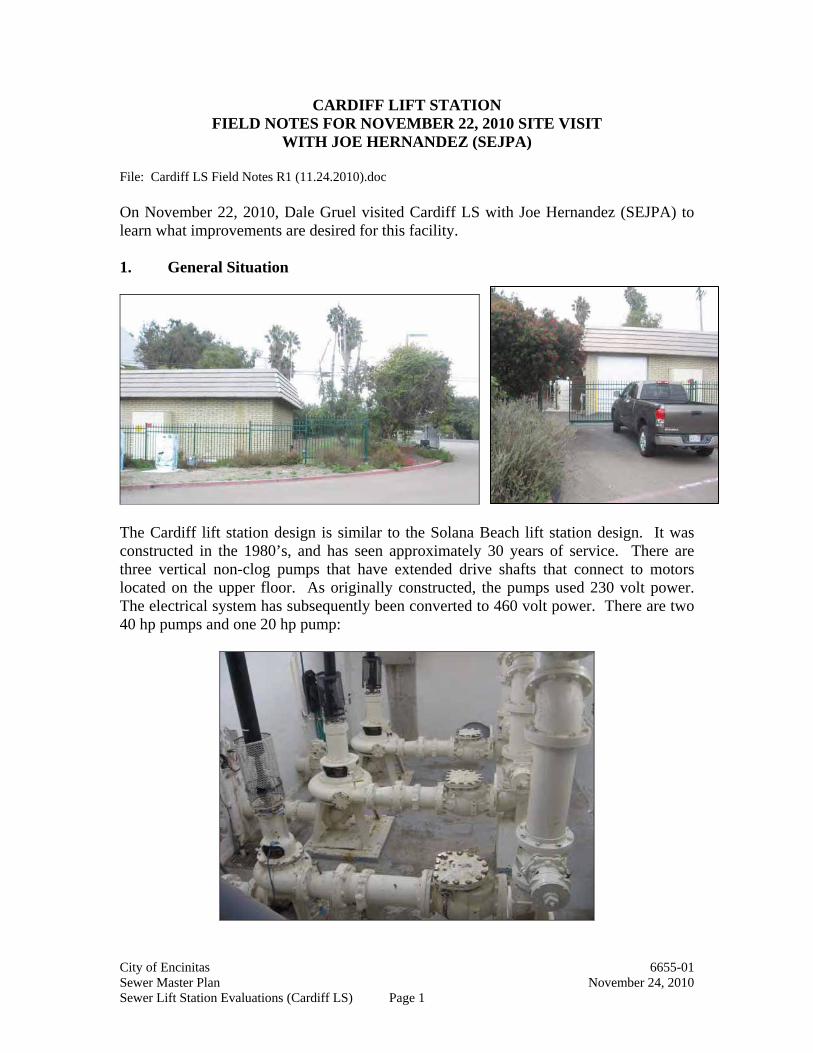
City of Encinitas 6655-01 Sewer Master Plan November 24, 2010 Sewer Lift Station Evaluations (Cardiff LS) Page 1
CARDIFF LIFT STATION FIELD NOTES FOR NOVEMBER 22, 2010 SITE VISIT
WITH JOE HERNANDEZ (SEJPA)
File: Cardiff LS Field Notes R1 (11.24.2010).doc On November 22, 2010, Dale Gruel visited Cardiff LS with Joe Hernandez (SEJPA) to learn what improvements are desired for this facility. 1. General Situation
The Cardiff lift station design is similar to the Solana Beach lift station design. It was constructed in the 1980’s, and has seen approximately 30 years of service. There are three vertical non-clog pumps that have extended drive shafts that connect to motors located on the upper floor. As originally constructed, the pumps used 230 volt power. The electrical system has subsequently been converted to 460 volt power. There are two 40 hp pumps and one 20 hp pump:
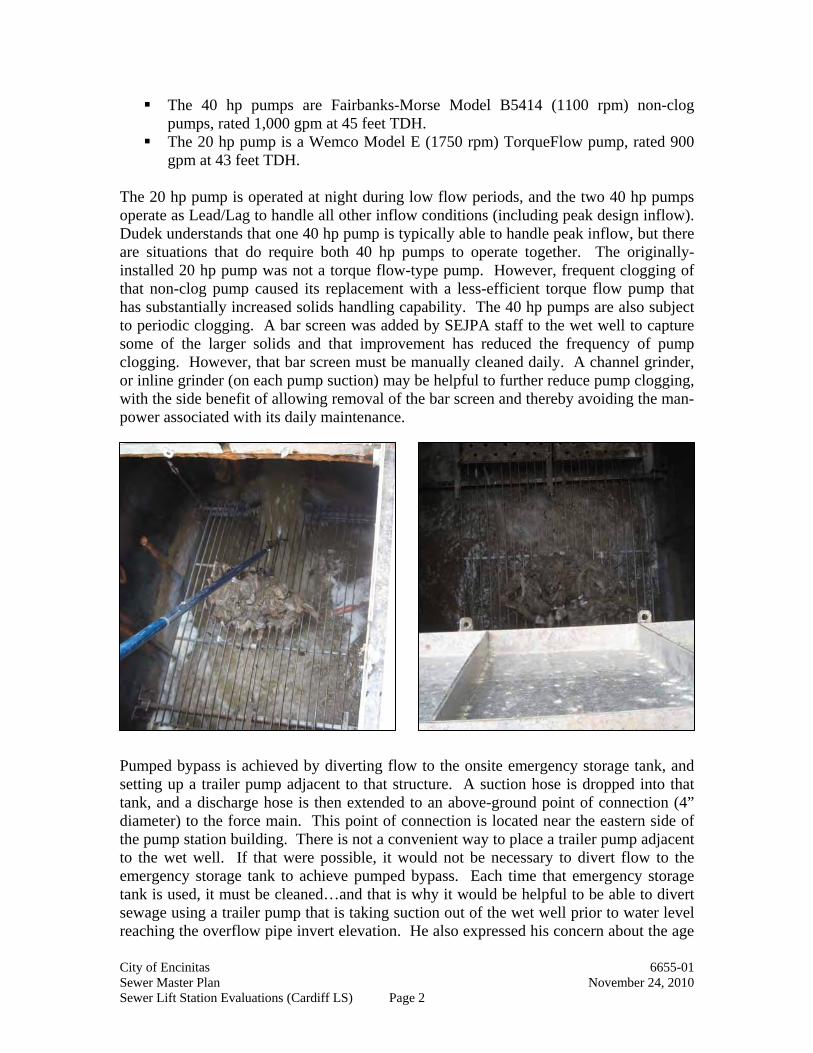
City of Encinitas 6655-01 Sewer Master Plan November 24, 2010 Sewer Lift Station Evaluations (Cardiff LS) Page 2
The 40 hp pumps are Fairbanks-Morse Model B5414 (1100 rpm) non-clog pumps, rated 1,000 gpm at 45 feet TDH.
The 20 hp pump is a Wemco Model E (1750 rpm) TorqueFlow pump, rated 900 gpm at 43 feet TDH.
The 20 hp pump is operated at night during low flow periods, and the two 40 hp pumps operate as Lead/Lag to handle all other inflow conditions (including peak design inflow). Dudek understands that one 40 hp pump is typically able to handle peak inflow, but there are situations that do require both 40 hp pumps to operate together. The originally-installed 20 hp pump was not a torque flow-type pump. However, frequent clogging of that non-clog pump caused its replacement with a less-efficient torque flow pump that has substantially increased solids handling capability. The 40 hp pumps are also subject to periodic clogging. A bar screen was added by SEJPA staff to the wet well to capture some of the larger solids and that improvement has reduced the frequency of pump clogging. However, that bar screen must be manually cleaned daily. A channel grinder, or inline grinder (on each pump suction) may be helpful to further reduce pump clogging, with the side benefit of allowing removal of the bar screen and thereby avoiding the man-power associated with its daily maintenance.
Pumped bypass is achieved by diverting flow to the onsite emergency storage tank, and setting up a trailer pump adjacent to that structure. A suction hose is dropped into that tank, and a discharge hose is then extended to an above-ground point of connection (4” diameter) to the force main. This point of connection is located near the eastern side of the pump station building. There is not a convenient way to place a trailer pump adjacent to the wet well. If that were possible, it would not be necessary to divert flow to the emergency storage tank to achieve pumped bypass. Each time that emergency storage tank is used, it must be cleaned…and that is why it would be helpful to be able to divert sewage using a trailer pump that is taking suction out of the wet well prior to water level reaching the overflow pipe invert elevation. He also expressed his concern about the age
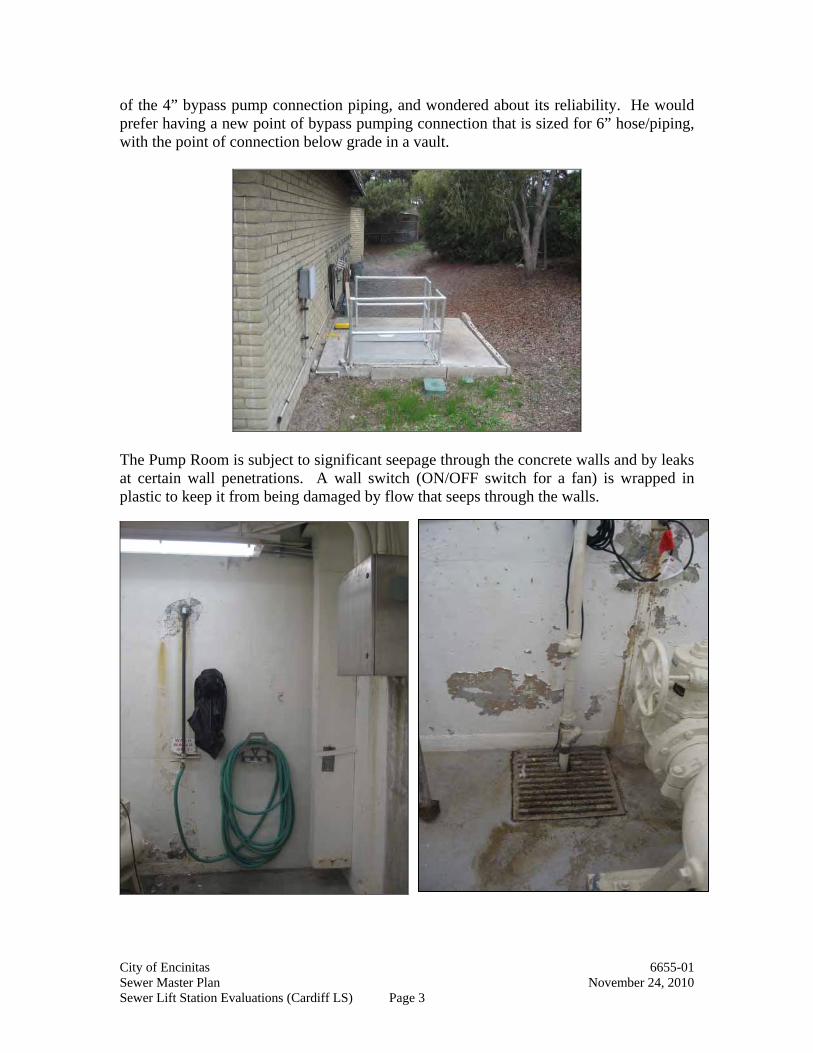
City of Encinitas 6655-01 Sewer Master Plan November 24, 2010 Sewer Lift Station Evaluations (Cardiff LS) Page 3
of the 4” bypass pump connection piping, and wondered about its reliability. He would prefer having a new point of bypass pumping connection that is sized for 6” hose/piping, with the point of connection below grade in a vault.
The Pump Room is subject to significant seepage through the concrete walls and by leaks at certain wall penetrations. A wall switch (ON/OFF switch for a fan) is wrapped in plastic to keep it from being damaged by flow that seeps through the walls.
`
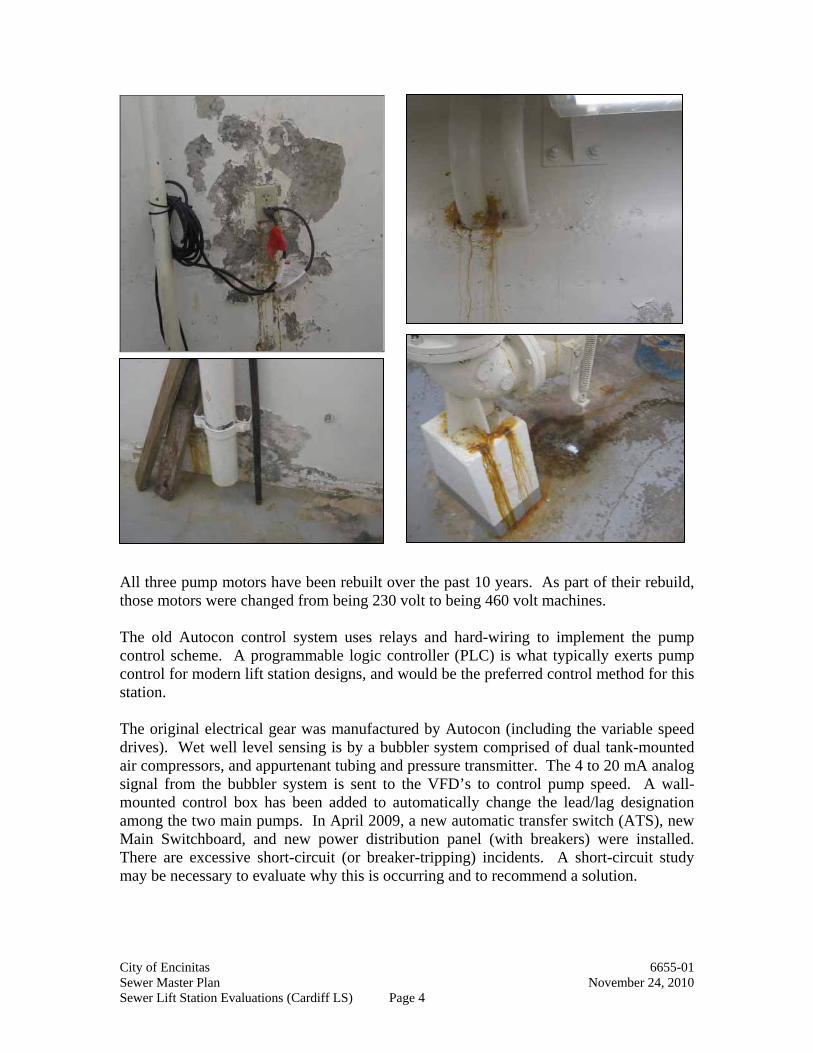
City of Encinitas 6655-01 Sewer Master Plan November 24, 2010 Sewer Lift Station Evaluations (Cardiff LS) Page 4
All three pump motors have been rebuilt over the past 10 years. As part of their rebuild, those motors were changed from being 230 volt to being 460 volt machines. The old Autocon control system uses relays and hard-wiring to implement the pump control scheme. A programmable logic controller (PLC) is what typically exerts pump control for modern lift station designs, and would be the preferred control method for this station. The original electrical gear was manufactured by Autocon (including the variable speed drives). Wet well level sensing is by a bubbler system comprised of dual tank-mounted air compressors, and appurtenant tubing and pressure transmitter. The 4 to 20 mA analog signal from the bubbler system is sent to the VFD’s to control pump speed. A wall-mounted control box has been added to automatically change the lead/lag designation among the two main pumps. In April 2009, a new automatic transfer switch (ATS), new Main Switchboard, and new power distribution panel (with breakers) were installed. There are excessive short-circuit (or breaker-tripping) incidents. A short-circuit study may be necessary to evaluate why this is occurring and to recommend a solution.
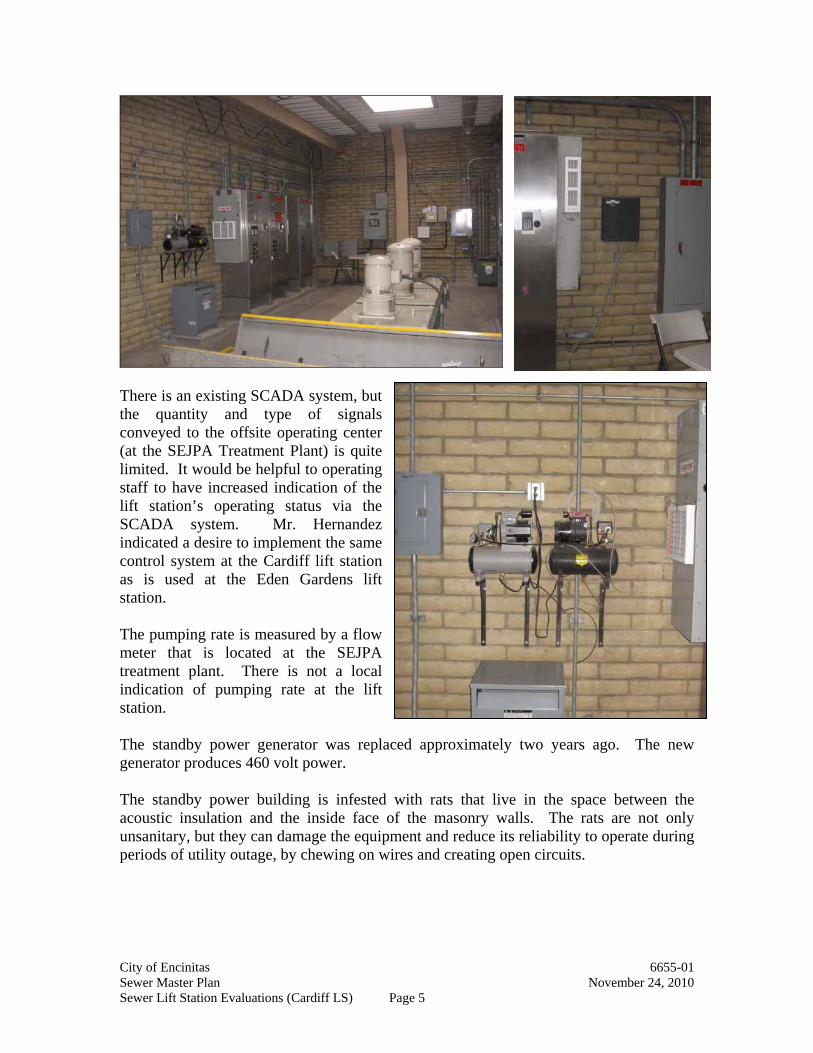
City of Encinitas 6655-01 Sewer Master Plan November 24, 2010 Sewer Lift Station Evaluations (Cardiff LS) Page 5
There is an existing SCADA system, but the quantity and type of signals conveyed to the offsite operating center (at the SEJPA Treatment Plant) is quite limited. It would be helpful to operating staff to have increased indication of the lift station’s operating status via the SCADA system. Mr. Hernandez indicated a desire to implement the same control system at the Cardiff lift station as is used at the Eden Gardens lift station. The pumping rate is measured by a flow meter that is located at the SEJPA treatment plant. There is not a local indication of pumping rate at the lift station. The standby power generator was replaced approximately two years ago. The new generator produces 460 volt power. The standby power building is infested with rats that live in the space between the acoustic insulation and the inside face of the masonry walls. The rats are not only unsanitary, but they can damage the equipment and reduce its reliability to operate during periods of utility outage, by chewing on wires and creating open circuits.
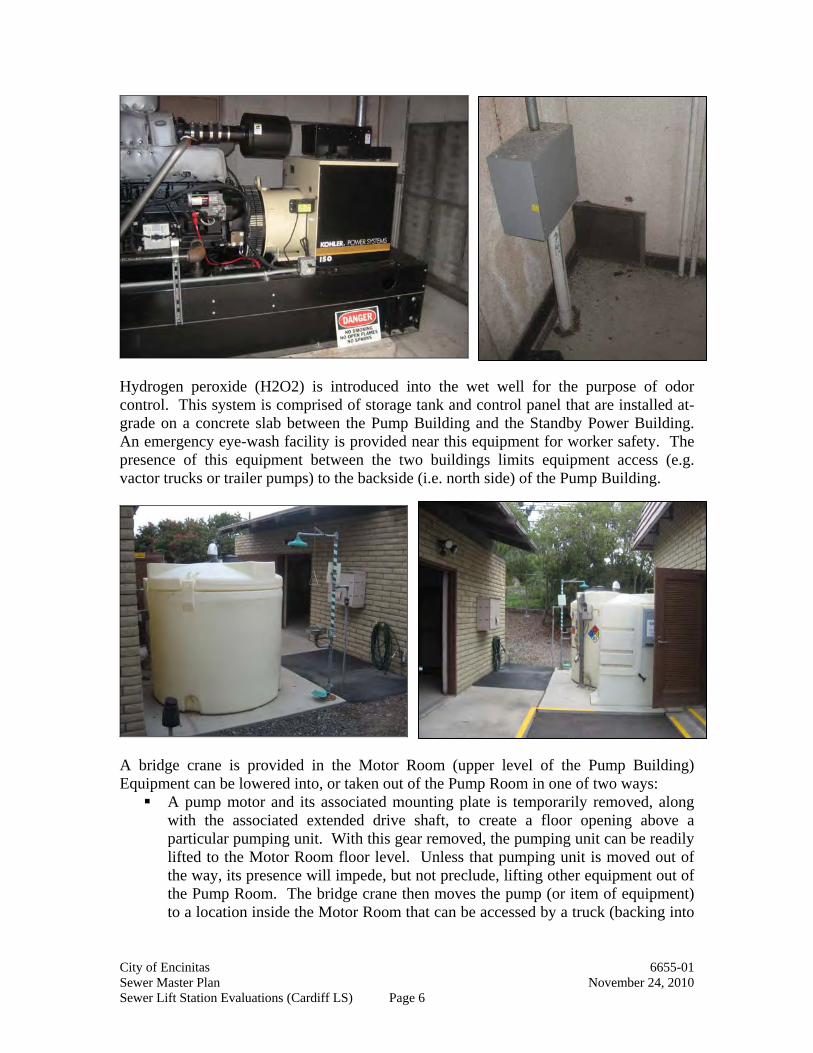
City of Encinitas 6655-01 Sewer Master Plan November 24, 2010 Sewer Lift Station Evaluations (Cardiff LS) Page 6
Hydrogen peroxide (H2O2) is introduced into the wet well for the purpose of odor control. This system is comprised of storage tank and control panel that are installed at-grade on a concrete slab between the Pump Building and the Standby Power Building. An emergency eye-wash facility is provided near this equipment for worker safety. The presence of this equipment between the two buildings limits equipment access (e.g. vactor trucks or trailer pumps) to the backside (i.e. north side) of the Pump Building.
A bridge crane is provided in the Motor Room (upper level of the Pump Building) Equipment can be lowered into, or taken out of the Pump Room in one of two ways: A pump motor and its associated mounting plate is temporarily removed, along
with the associated extended drive shaft, to create a floor opening above a particular pumping unit. With this gear removed, the pumping unit can be readily lifted to the Motor Room floor level. Unless that pumping unit is moved out of the way, its presence will impede, but not preclude, lifting other equipment out of the Pump Room. The bridge crane then moves the pump (or item of equipment) to a location inside the Motor Room that can be accessed by a truck (backing into
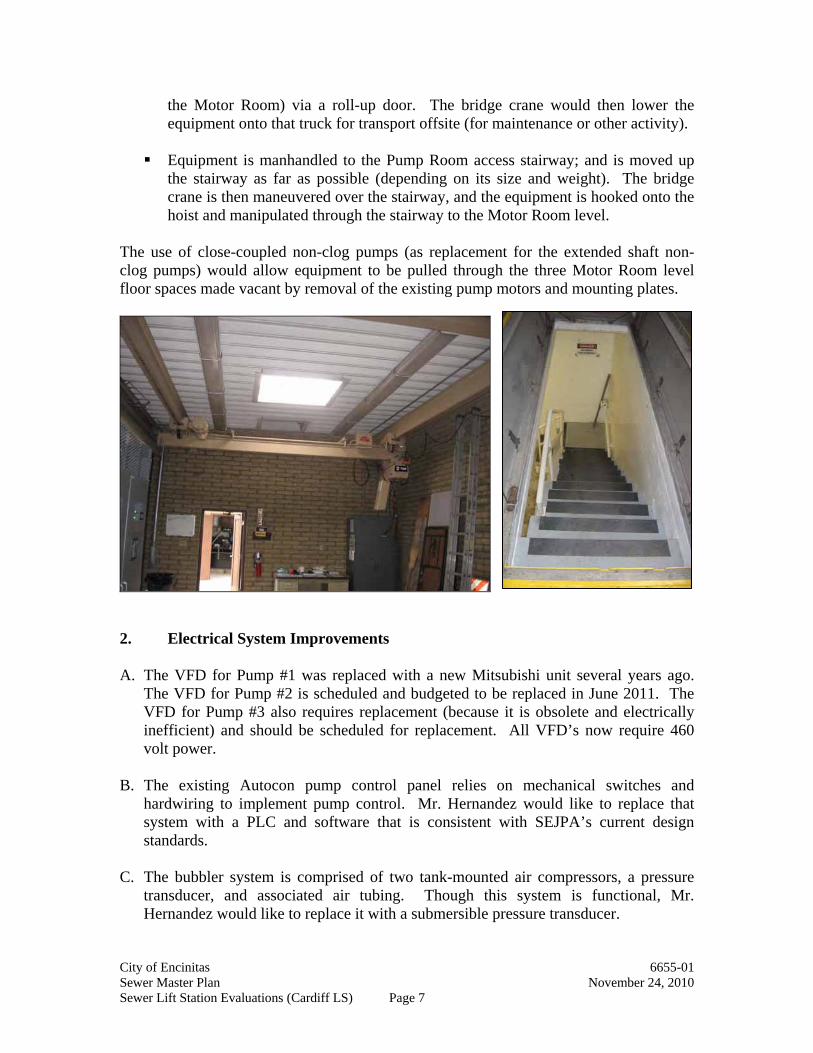
City of Encinitas 6655-01 Sewer Master Plan November 24, 2010 Sewer Lift Station Evaluations (Cardiff LS) Page 7
the Motor Room) via a roll-up door. The bridge crane would then lower the equipment onto that truck for transport offsite (for maintenance or other activity).
Equipment is manhandled to the Pump Room access stairway; and is moved up
the stairway as far as possible (depending on its size and weight). The bridge crane is then maneuvered over the stairway, and the equipment is hooked onto the hoist and manipulated through the stairway to the Motor Room level.
The use of close-coupled non-clog pumps (as replacement for the extended shaft non-clog pumps) would allow equipment to be pulled through the three Motor Room level floor spaces made vacant by removal of the existing pump motors and mounting plates.
2. Electrical System Improvements A. The VFD for Pump #1 was replaced with a new Mitsubishi unit several years ago.
The VFD for Pump #2 is scheduled and budgeted to be replaced in June 2011. The VFD for Pump #3 also requires replacement (because it is obsolete and electrically inefficient) and should be scheduled for replacement. All VFD’s now require 460 volt power.
B. The existing Autocon pump control panel relies on mechanical switches and
hardwiring to implement pump control. Mr. Hernandez would like to replace that system with a PLC and software that is consistent with SEJPA’s current design standards.
C. The bubbler system is comprised of two tank-mounted air compressors, a pressure
transducer, and associated air tubing. Though this system is functional, Mr. Hernandez would like to replace it with a submersible pressure transducer.
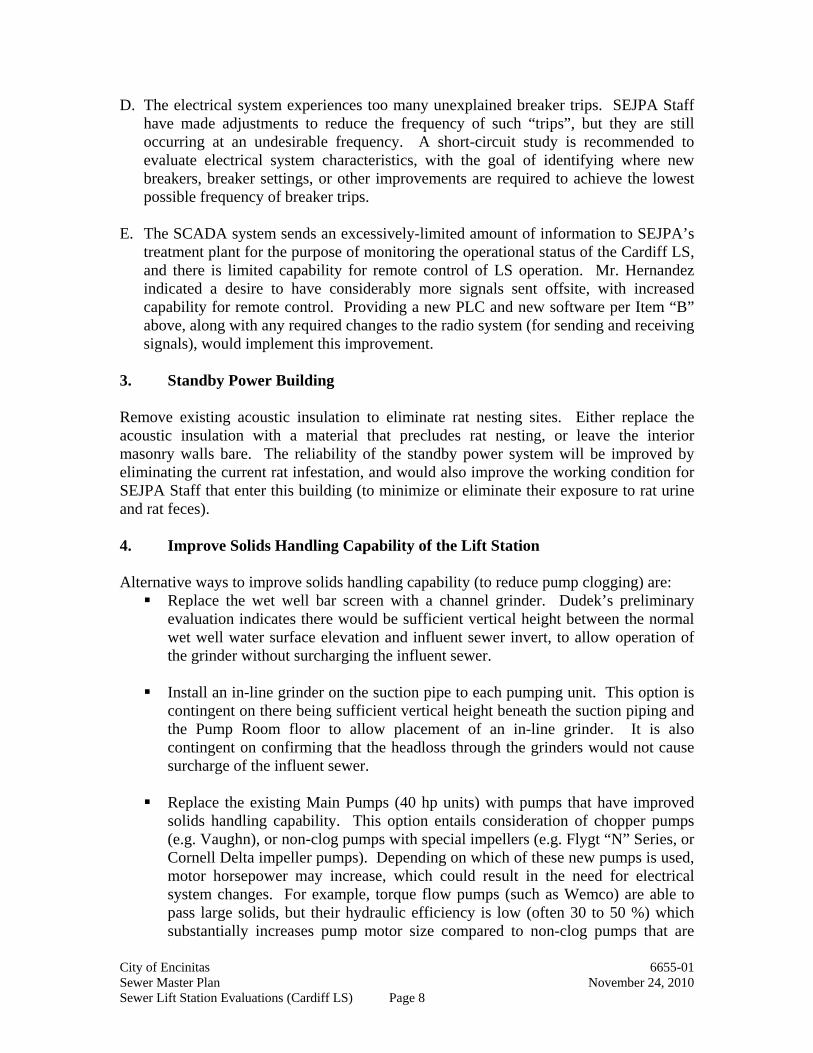
City of Encinitas 6655-01 Sewer Master Plan November 24, 2010 Sewer Lift Station Evaluations (Cardiff LS) Page 8
D. The electrical system experiences too many unexplained breaker trips. SEJPA Staff have made adjustments to reduce the frequency of such “trips”, but they are still occurring at an undesirable frequency. A short-circuit study is recommended to evaluate electrical system characteristics, with the goal of identifying where new breakers, breaker settings, or other improvements are required to achieve the lowest possible frequency of breaker trips.
E. The SCADA system sends an excessively-limited amount of information to SEJPA’s
treatment plant for the purpose of monitoring the operational status of the Cardiff LS, and there is limited capability for remote control of LS operation. Mr. Hernandez indicated a desire to have considerably more signals sent offsite, with increased capability for remote control. Providing a new PLC and new software per Item “B” above, along with any required changes to the radio system (for sending and receiving signals), would implement this improvement.
3. Standby Power Building Remove existing acoustic insulation to eliminate rat nesting sites. Either replace the acoustic insulation with a material that precludes rat nesting, or leave the interior masonry walls bare. The reliability of the standby power system will be improved by eliminating the current rat infestation, and would also improve the working condition for SEJPA Staff that enter this building (to minimize or eliminate their exposure to rat urine and rat feces). 4. Improve Solids Handling Capability of the Lift Station Alternative ways to improve solids handling capability (to reduce pump clogging) are: Replace the wet well bar screen with a channel grinder. Dudek’s preliminary
evaluation indicates there would be sufficient vertical height between the normal wet well water surface elevation and influent sewer invert, to allow operation of the grinder without surcharging the influent sewer.
Install an in-line grinder on the suction pipe to each pumping unit. This option is
contingent on there being sufficient vertical height beneath the suction piping and the Pump Room floor to allow placement of an in-line grinder. It is also contingent on confirming that the headloss through the grinders would not cause surcharge of the influent sewer.
Replace the existing Main Pumps (40 hp units) with pumps that have improved
solids handling capability. This option entails consideration of chopper pumps (e.g. Vaughn), or non-clog pumps with special impellers (e.g. Flygt “N” Series, or Cornell Delta impeller pumps). Depending on which of these new pumps is used, motor horsepower may increase, which could result in the need for electrical system changes. For example, torque flow pumps (such as Wemco) are able to pass large solids, but their hydraulic efficiency is low (often 30 to 50 %) which substantially increases pump motor size compared to non-clog pumps that are
City of Encinitas 6655-01 Sewer Master Plan November 24, 2010 Sewer Lift Station Evaluations (Cardiff LS) Page 9
typically 70% efficient. A consideration regarding use of chopper pumps is the need for periodic replacement of their cutter elements/features.
If the existing non-clog pumps are replaced, consideration should be given to using drypit submersible pumps. This would allow removal of the extended drive shafts that are now required, without loss of pumping capability should the Pump Room flood. This change would also include removal of motors (and their supporting plates) at the Motor Room level. Removal of this gear would permit lifting of materials/equipment through the Motor Room floor opening that is over each pumping unit. 5. Improve Bypass Pumping Capability Construct a driveway entrance (with gate) and all-weather access road from the paved entrance to the nature center, to the north side of the Pump Station. This would enable a trailer pump to be placed next to the wet well (on its east side). The suction line from the trailer pump would extend down through the open hatch of the wet well. The discharge line from the trailer pump would extend to the existing above-ground bypass pump connection. Mr. Hernandez expressed his concern about the age and reliability of the existing 4” bypass pump connection, and recommended it be replaced with new 6” piping and valving, with the point of connection installed in a vault. This point of bypass connection needs to be located and oriented so that it is able to serve a trailer pump that is placed near the emergency storage tank, as well as a trailer pump placed near the wet well. Mr. Hernandez would prefer to be able to avoid having to overflow to the emergency storage tank to implement bypass pumping. 6. Replacement of Pump Room Piping The pump room piping is old but serviceable. However, if pumps are replaced, that would be an ideal time to also replace the suction and discharge piping. 7. Waterproofing the Pump Room Walls There are several locations where water is seeping through the concrete walls (apparently the exterior surface of the below grade walls was not water-proofed during original construction). Xypex or Vandex (which are crystalline water-proofing products) can be applied to interior wall surfaces to seal them against such seepage. We anticipate the existing wall paint will need to be removed to prior to applying a crystalline water-proofing product. Cracks in the walls should be pressure grouted to seal them against leakage. Imperfectly sealed wall penetrations should also be pressure grouted to seal those openings against leakage.
City of Encinitas 6655-01 Sewer Master Plan November 24, 2010 Sewer Lift Station Evaluations (Cardiff LS) Page 10
8. Pump Room Door Replacement The existing Pump Room door is deteriorated from corrosion. Replace it with a new door that is suitable for the salt air environment. ******************************** END **********************************
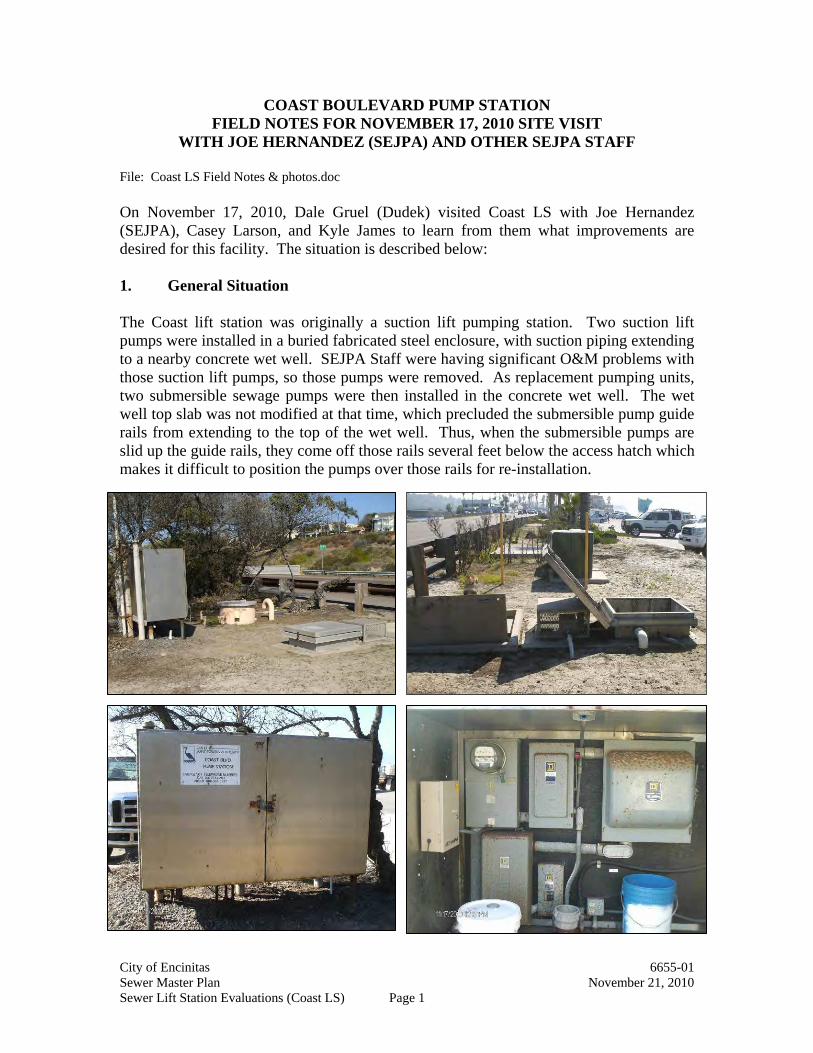
City of Encinitas 6655-01 Sewer Master Plan November 21, 2010 Sewer Lift Station Evaluations (Coast LS) Page 1
COAST BOULEVARD PUMP STATION FIELD NOTES FOR NOVEMBER 17, 2010 SITE VISIT
WITH JOE HERNANDEZ (SEJPA) AND OTHER SEJPA STAFF File: Coast LS Field Notes & photos.doc On November 17, 2010, Dale Gruel (Dudek) visited Coast LS with Joe Hernandez (SEJPA), Casey Larson, and Kyle James to learn from them what improvements are desired for this facility. The situation is described below: 1. General Situation The Coast lift station was originally a suction lift pumping station. Two suction lift pumps were installed in a buried fabricated steel enclosure, with suction piping extending to a nearby concrete wet well. SEJPA Staff were having significant O&M problems with those suction lift pumps, so those pumps were removed. As replacement pumping units, two submersible sewage pumps were then installed in the concrete wet well. The wet well top slab was not modified at that time, which precluded the submersible pump guide rails from extending to the top of the wet well. Thus, when the submersible pumps are slid up the guide rails, they come off those rails several feet below the access hatch which makes it difficult to position the pumps over those rails for re-installation.
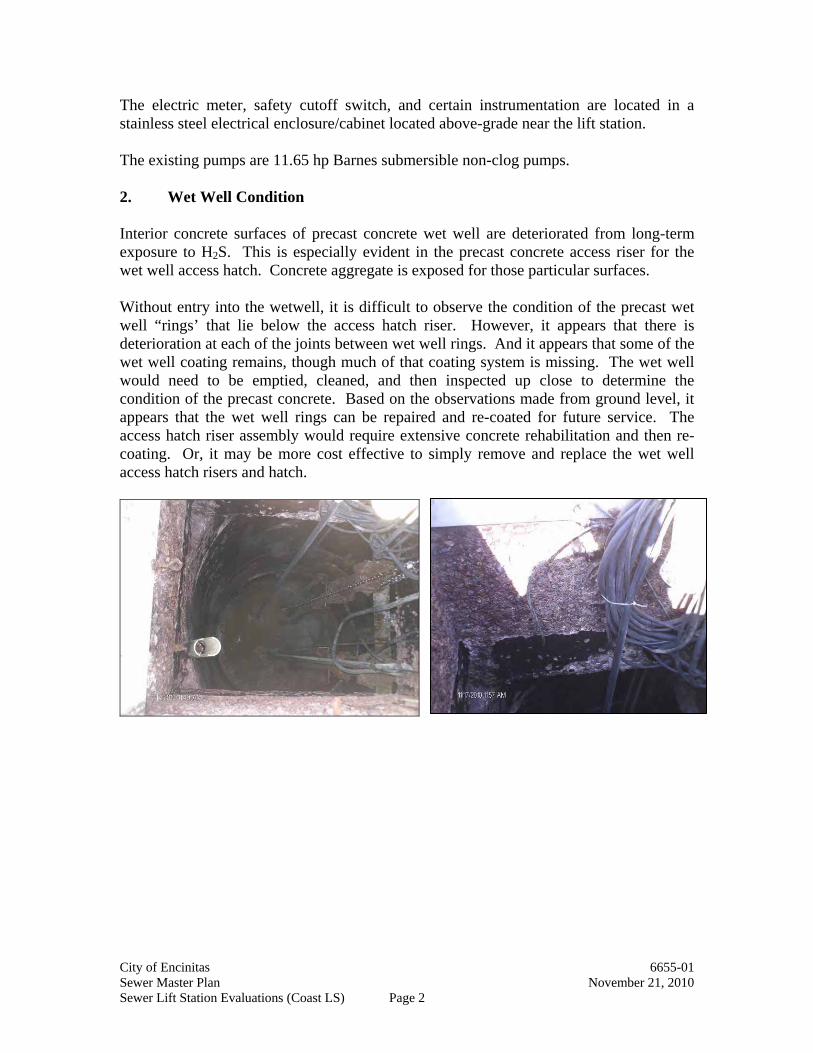
City of Encinitas 6655-01 Sewer Master Plan November 21, 2010 Sewer Lift Station Evaluations (Coast LS) Page 2
The electric meter, safety cutoff switch, and certain instrumentation are located in a stainless steel electrical enclosure/cabinet located above-grade near the lift station. The existing pumps are 11.65 hp Barnes submersible non-clog pumps. 2. Wet Well Condition Interior concrete surfaces of precast concrete wet well are deteriorated from long-term exposure to H2S. This is especially evident in the precast concrete access riser for the wet well access hatch. Concrete aggregate is exposed for those particular surfaces. Without entry into the wetwell, it is difficult to observe the condition of the precast wet well “rings’ that lie below the access hatch riser. However, it appears that there is deterioration at each of the joints between wet well rings. And it appears that some of the wet well coating remains, though much of that coating system is missing. The wet well would need to be emptied, cleaned, and then inspected up close to determine the condition of the precast concrete. Based on the observations made from ground level, it appears that the wet well rings can be repaired and re-coated for future service. The access hatch riser assembly would require extensive concrete rehabilitation and then re-coating. Or, it may be more cost effective to simply remove and replace the wet well access hatch risers and hatch.
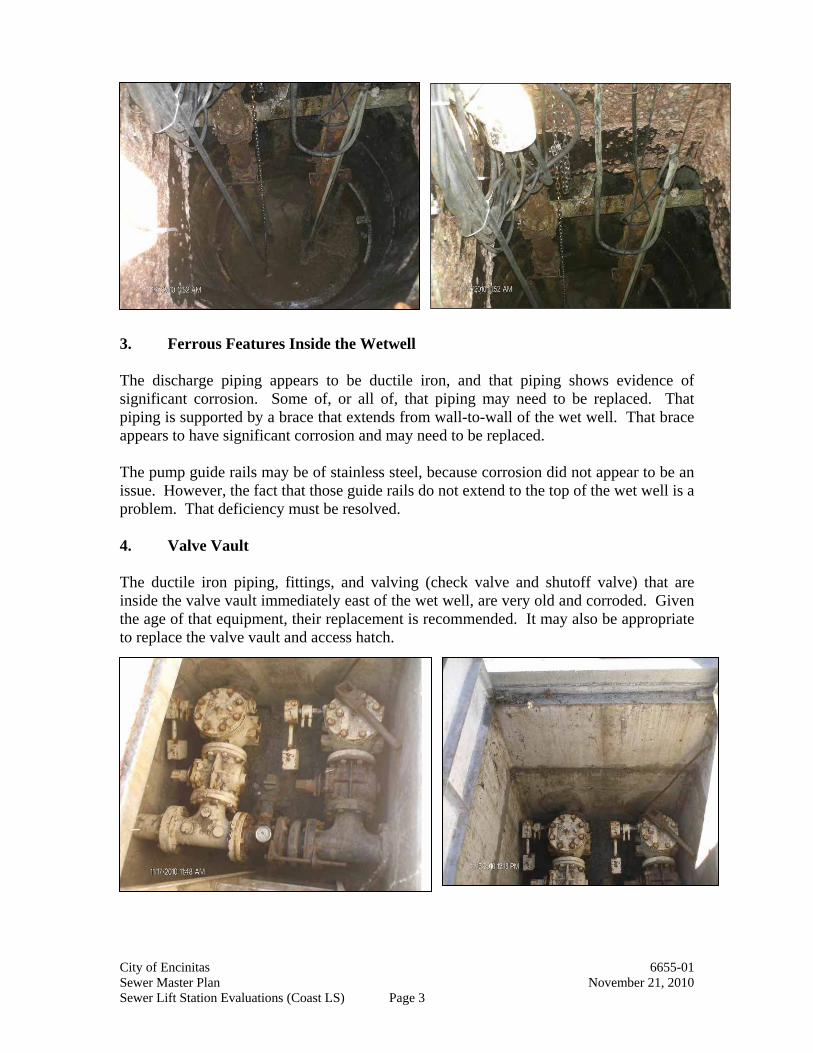
City of Encinitas 6655-01 Sewer Master Plan November 21, 2010 Sewer Lift Station Evaluations (Coast LS) Page 3
3. Ferrous Features Inside the Wetwell The discharge piping appears to be ductile iron, and that piping shows evidence of significant corrosion. Some of, or all of, that piping may need to be replaced. That piping is supported by a brace that extends from wall-to-wall of the wet well. That brace appears to have significant corrosion and may need to be replaced. The pump guide rails may be of stainless steel, because corrosion did not appear to be an issue. However, the fact that those guide rails do not extend to the top of the wet well is a problem. That deficiency must be resolved. 4. Valve Vault The ductile iron piping, fittings, and valving (check valve and shutoff valve) that are inside the valve vault immediately east of the wet well, are very old and corroded. Given the age of that equipment, their replacement is recommended. It may also be appropriate to replace the valve vault and access hatch.
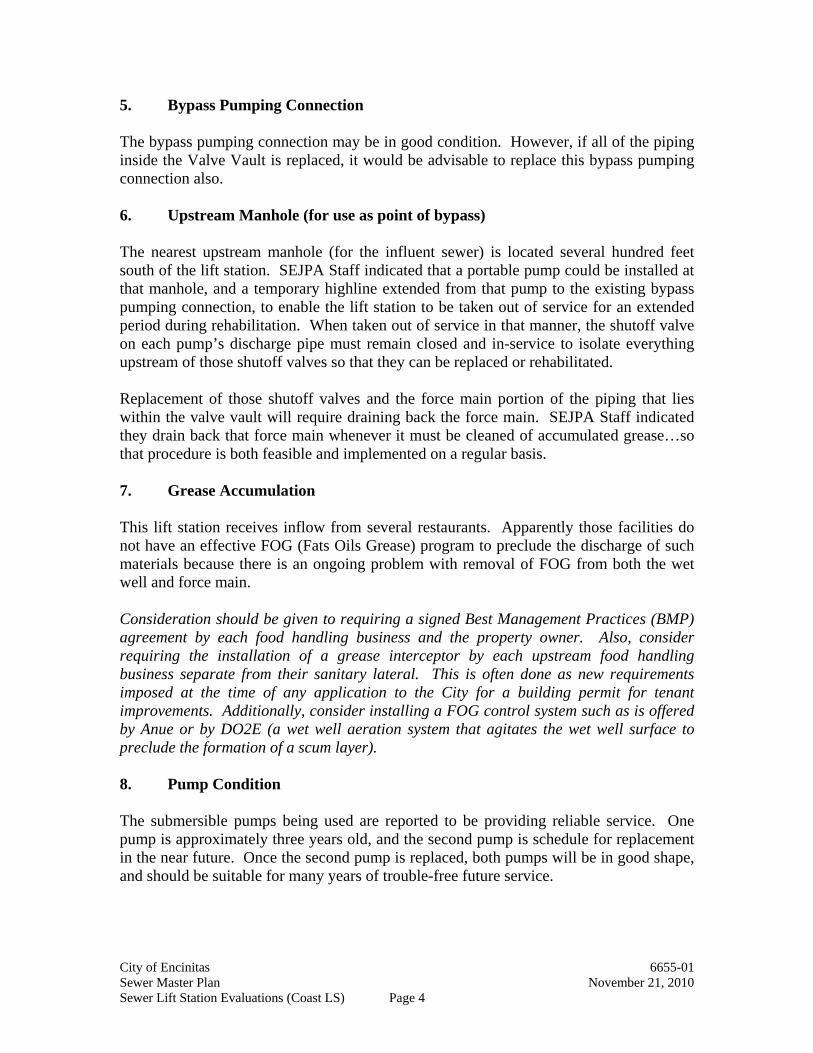
City of Encinitas 6655-01 Sewer Master Plan November 21, 2010 Sewer Lift Station Evaluations (Coast LS) Page 4
5. Bypass Pumping Connection The bypass pumping connection may be in good condition. However, if all of the piping inside the Valve Vault is replaced, it would be advisable to replace this bypass pumping connection also. 6. Upstream Manhole (for use as point of bypass) The nearest upstream manhole (for the influent sewer) is located several hundred feet south of the lift station. SEJPA Staff indicated that a portable pump could be installed at that manhole, and a temporary highline extended from that pump to the existing bypass pumping connection, to enable the lift station to be taken out of service for an extended period during rehabilitation. When taken out of service in that manner, the shutoff valve on each pump’s discharge pipe must remain closed and in-service to isolate everything upstream of those shutoff valves so that they can be replaced or rehabilitated. Replacement of those shutoff valves and the force main portion of the piping that lies within the valve vault will require draining back the force main. SEJPA Staff indicated they drain back that force main whenever it must be cleaned of accumulated grease…so that procedure is both feasible and implemented on a regular basis. 7. Grease Accumulation This lift station receives inflow from several restaurants. Apparently those facilities do not have an effective FOG (Fats Oils Grease) program to preclude the discharge of such materials because there is an ongoing problem with removal of FOG from both the wet well and force main. Consideration should be given to requiring a signed Best Management Practices (BMP) agreement by each food handling business and the property owner. Also, consider requiring the installation of a grease interceptor by each upstream food handling business separate from their sanitary lateral. This is often done as new requirements imposed at the time of any application to the City for a building permit for tenant improvements. Additionally, consider installing a FOG control system such as is offered by Anue or by DO2E (a wet well aeration system that agitates the wet well surface to preclude the formation of a scum layer). 8. Pump Condition The submersible pumps being used are reported to be providing reliable service. One pump is approximately three years old, and the second pump is schedule for replacement in the near future. Once the second pump is replaced, both pumps will be in good shape, and should be suitable for many years of trouble-free future service.
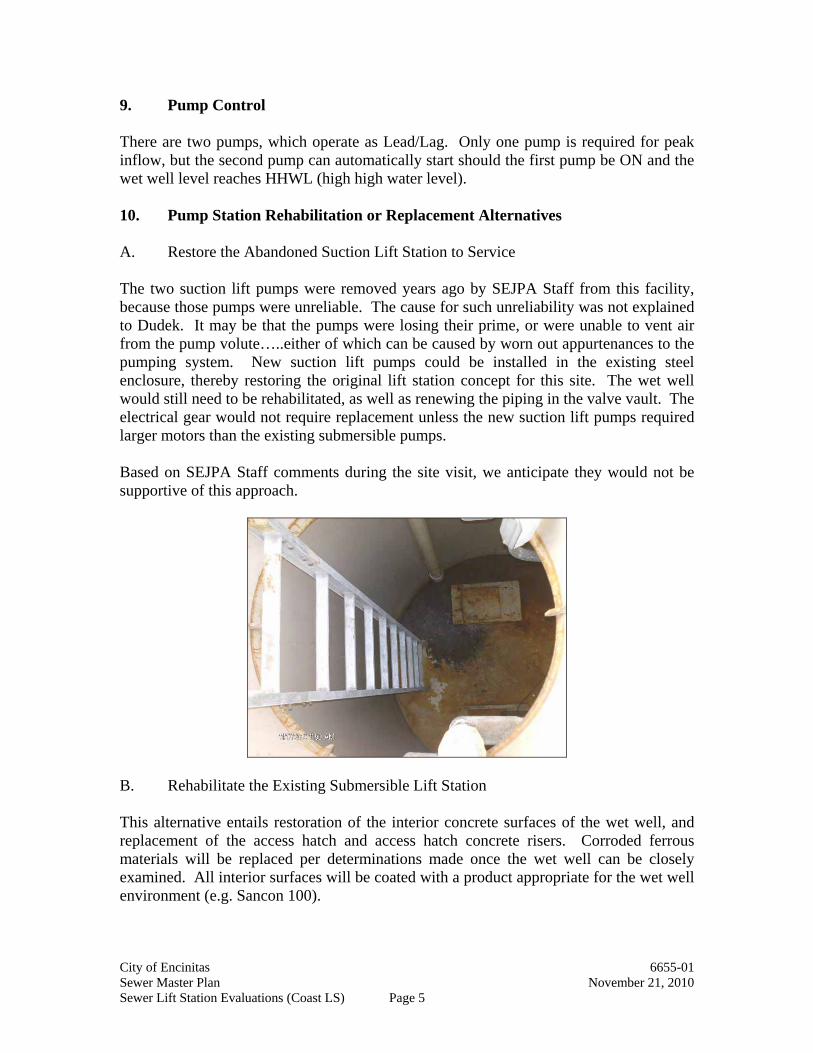
City of Encinitas 6655-01 Sewer Master Plan November 21, 2010 Sewer Lift Station Evaluations (Coast LS) Page 5
9. Pump Control There are two pumps, which operate as Lead/Lag. Only one pump is required for peak inflow, but the second pump can automatically start should the first pump be ON and the wet well level reaches HHWL (high high water level). 10. Pump Station Rehabilitation or Replacement Alternatives A. Restore the Abandoned Suction Lift Station to Service The two suction lift pumps were removed years ago by SEJPA Staff from this facility, because those pumps were unreliable. The cause for such unreliability was not explained to Dudek. It may be that the pumps were losing their prime, or were unable to vent air from the pump volute…..either of which can be caused by worn out appurtenances to the pumping system. New suction lift pumps could be installed in the existing steel enclosure, thereby restoring the original lift station concept for this site. The wet well would still need to be rehabilitated, as well as renewing the piping in the valve vault. The electrical gear would not require replacement unless the new suction lift pumps required larger motors than the existing submersible pumps. Based on SEJPA Staff comments during the site visit, we anticipate they would not be supportive of this approach.
B. Rehabilitate the Existing Submersible Lift Station This alternative entails restoration of the interior concrete surfaces of the wet well, and replacement of the access hatch and access hatch concrete risers. Corroded ferrous materials will be replaced per determinations made once the wet well can be closely examined. All interior surfaces will be coated with a product appropriate for the wet well environment (e.g. Sancon 100).
City of Encinitas 6655-01 Sewer Master Plan November 21, 2010 Sewer Lift Station Evaluations (Coast LS) Page 6
All discharge piping and valving will be replaced. The electrical gear is already scheduled to be upgraded per a current project (as mentioned in Item #1 above). The advantage of rehabilitating this structure versus replacing it (as addressed by Item “C” below) is there is no need for a shored and dewatered excavation to remove the wet well, and to install the new wet well. C. Construct a New Submersible Lift Station This alternative entails removing the existing wet well and valve vault, and installing new structures and new piping/valving. The existing pumps would be re-installed in the new wet well. The electrical gear would not require replacement. Even though this alternative requires a shored and dewatered excavation, it offers the following advantages: The new precast concrete wet well can be provided exterior waterproofing to
preclude seepage through joints and/or exposure of the concrete and its rebar to exposure to the saline ground water.
The new precast concrete wet well can be upsized if SEJPA determines there is a need to do so (perhaps to obtain increased onsite emergency storage that a larger wet well would offer).
The new precast concrete wet well could be furnished with a PVC lining (Ameron T-Lock) instead of a sprayed lining system, which may provide a longer-lasting protective coating.
Restoration of a badly corroded concrete structure (per Item “B” above) can be expensive. Depending on what is needed for that restoration, it may be more cost effective to remove the old wet well and replace it with a new wet well.
******************************** END **********************************
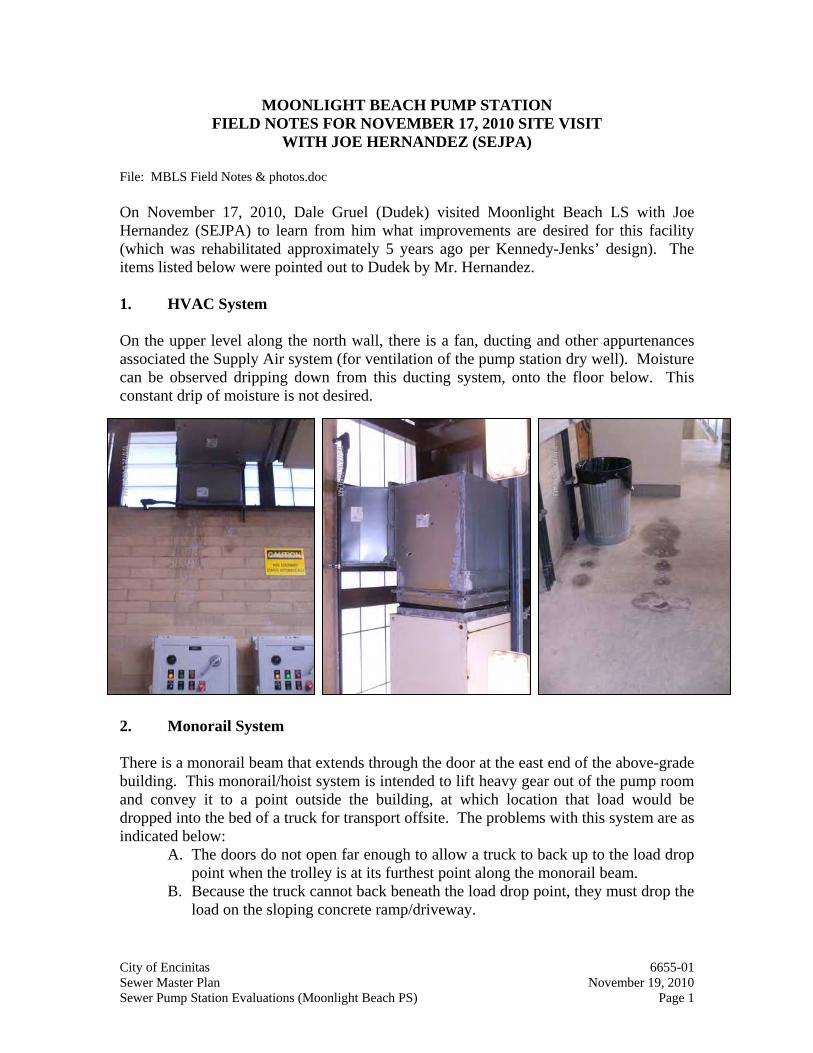
City of Encinitas 6655-01 Sewer Master Plan November 19, 2010 Sewer Pump Station Evaluations (Moonlight Beach PS) Page 1
MOONLIGHT BEACH PUMP STATION FIELD NOTES FOR NOVEMBER 17, 2010 SITE VISIT
WITH JOE HERNANDEZ (SEJPA) File: MBLS Field Notes & photos.doc On November 17, 2010, Dale Gruel (Dudek) visited Moonlight Beach LS with Joe Hernandez (SEJPA) to learn from him what improvements are desired for this facility (which was rehabilitated approximately 5 years ago per Kennedy-Jenks’ design). The items listed below were pointed out to Dudek by Mr. Hernandez. 1. HVAC System On the upper level along the north wall, there is a fan, ducting and other appurtenances associated the Supply Air system (for ventilation of the pump station dry well). Moisture can be observed dripping down from this ducting system, onto the floor below. This constant drip of moisture is not desired. 2. Monorail System There is a monorail beam that extends through the door at the east end of the above-grade building. This monorail/hoist system is intended to lift heavy gear out of the pump room and convey it to a point outside the building, at which location that load would be dropped into the bed of a truck for transport offsite. The problems with this system are as indicated below:
A. The doors do not open far enough to allow a truck to back up to the load drop point when the trolley is at its furthest point along the monorail beam.
B. Because the truck cannot back beneath the load drop point, they must drop the load on the sloping concrete ramp/driveway.
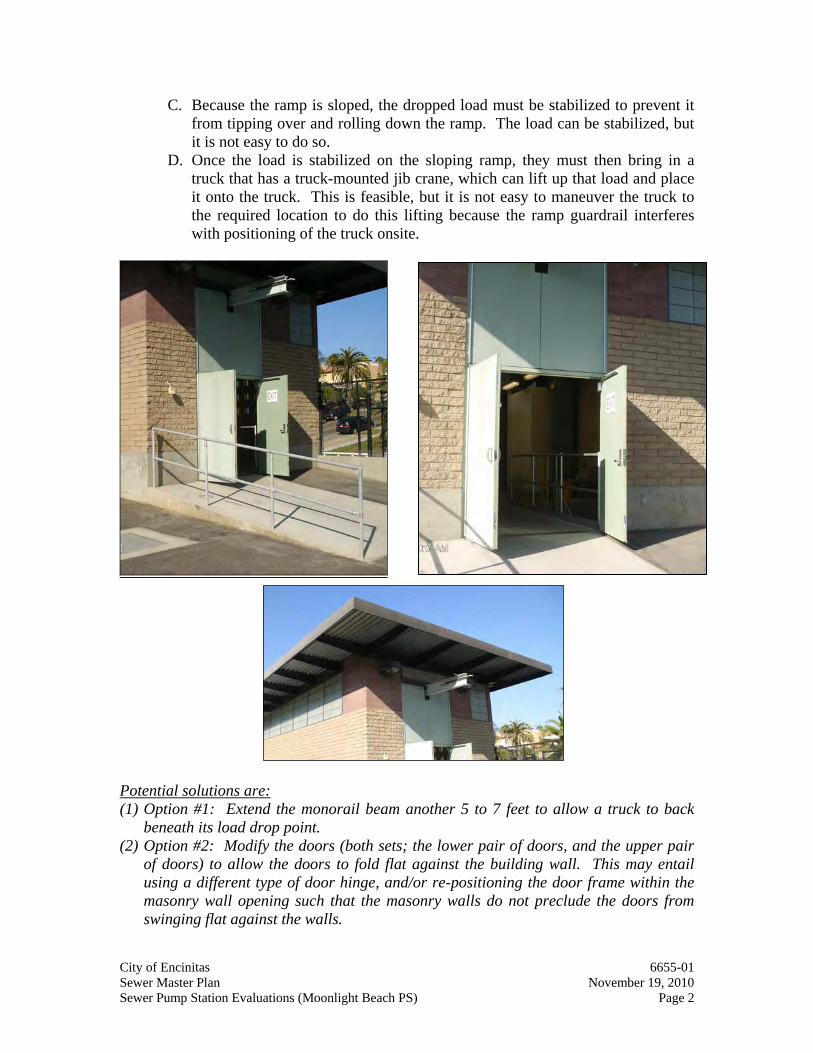
City of Encinitas 6655-01 Sewer Master Plan November 19, 2010 Sewer Pump Station Evaluations (Moonlight Beach PS) Page 2
C. Because the ramp is sloped, the dropped load must be stabilized to prevent it from tipping over and rolling down the ramp. The load can be stabilized, but it is not easy to do so.
D. Once the load is stabilized on the sloping ramp, they must then bring in a truck that has a truck-mounted jib crane, which can lift up that load and place it onto the truck. This is feasible, but it is not easy to maneuver the truck to the required location to do this lifting because the ramp guardrail interferes with positioning of the truck onsite.
Potential solutions are: (1) Option #1: Extend the monorail beam another 5 to 7 feet to allow a truck to back
beneath its load drop point. (2) Option #2: Modify the doors (both sets; the lower pair of doors, and the upper pair
of doors) to allow the doors to fold flat against the building wall. This may entail using a different type of door hinge, and/or re-positioning the door frame within the masonry wall opening such that the masonry walls do not preclude the doors from swinging flat against the walls.
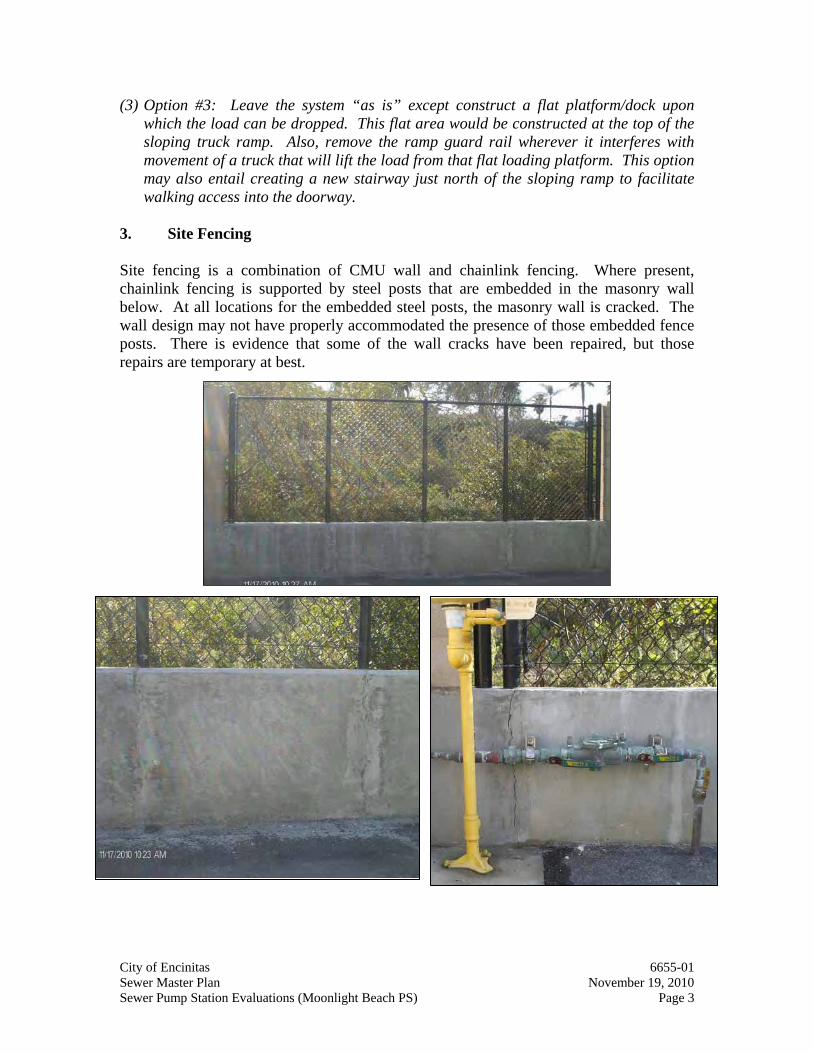
City of Encinitas 6655-01 Sewer Master Plan November 19, 2010 Sewer Pump Station Evaluations (Moonlight Beach PS) Page 3
(3) Option #3: Leave the system “as is” except construct a flat platform/dock upon which the load can be dropped. This flat area would be constructed at the top of the sloping truck ramp. Also, remove the ramp guard rail wherever it interferes with movement of a truck that will lift the load from that flat loading platform. This option may also entail creating a new stairway just north of the sloping ramp to facilitate walking access into the doorway.
3. Site Fencing Site fencing is a combination of CMU wall and chainlink fencing. Where present, chainlink fencing is supported by steel posts that are embedded in the masonry wall below. At all locations for the embedded steel posts, the masonry wall is cracked. The wall design may not have properly accommodated the presence of those embedded fence posts. There is evidence that some of the wall cracks have been repaired, but those repairs are temporary at best.
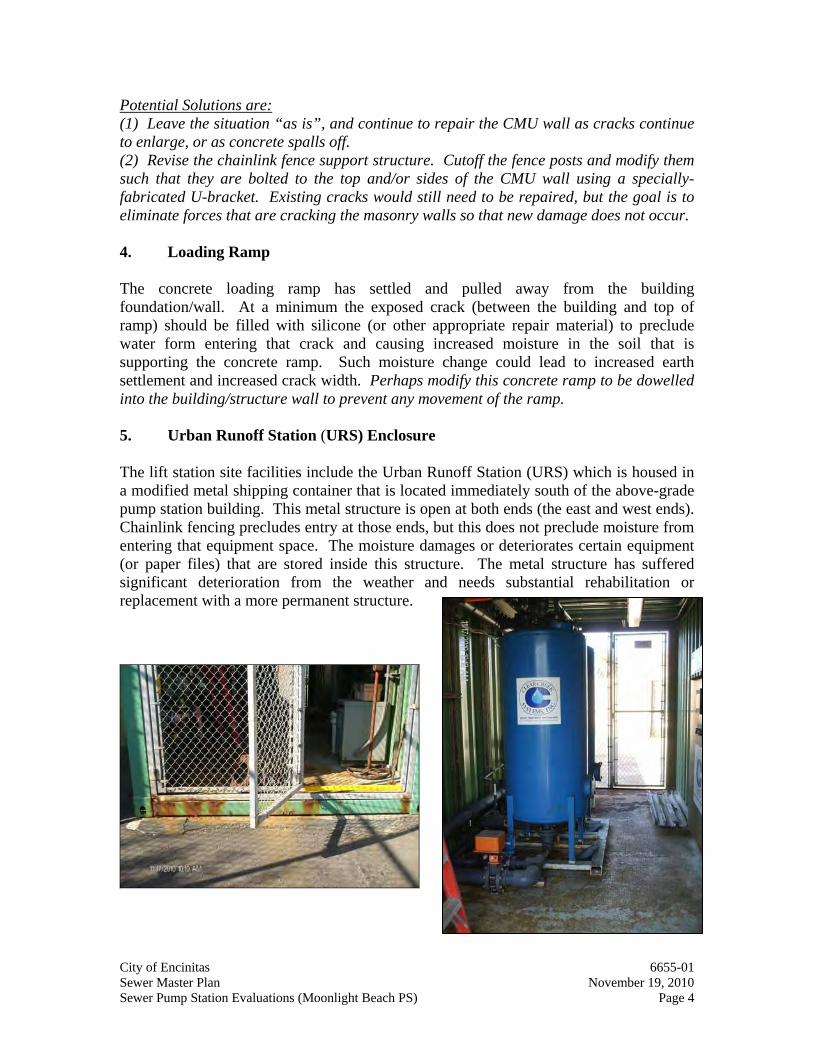
City of Encinitas 6655-01 Sewer Master Plan November 19, 2010 Sewer Pump Station Evaluations (Moonlight Beach PS) Page 4
Potential Solutions are: (1) Leave the situation “as is”, and continue to repair the CMU wall as cracks continue to enlarge, or as concrete spalls off. (2) Revise the chainlink fence support structure. Cutoff the fence posts and modify them such that they are bolted to the top and/or sides of the CMU wall using a specially-fabricated U-bracket. Existing cracks would still need to be repaired, but the goal is to eliminate forces that are cracking the masonry walls so that new damage does not occur. 4. Loading Ramp The concrete loading ramp has settled and pulled away from the building foundation/wall. At a minimum the exposed crack (between the building and top of ramp) should be filled with silicone (or other appropriate repair material) to preclude water form entering that crack and causing increased moisture in the soil that is supporting the concrete ramp. Such moisture change could lead to increased earth settlement and increased crack width. Perhaps modify this concrete ramp to be dowelled into the building/structure wall to prevent any movement of the ramp. 5. Urban Runoff Station (URS) Enclosure The lift station site facilities include the Urban Runoff Station (URS) which is housed in a modified metal shipping container that is located immediately south of the above-grade pump station building. This metal structure is open at both ends (the east and west ends). Chainlink fencing precludes entry at those ends, but this does not preclude moisture from entering that equipment space. The moisture damages or deteriorates certain equipment (or paper files) that are stored inside this structure. The metal structure has suffered significant deterioration from the weather and needs substantial rehabilitation or replacement with a more permanent structure.
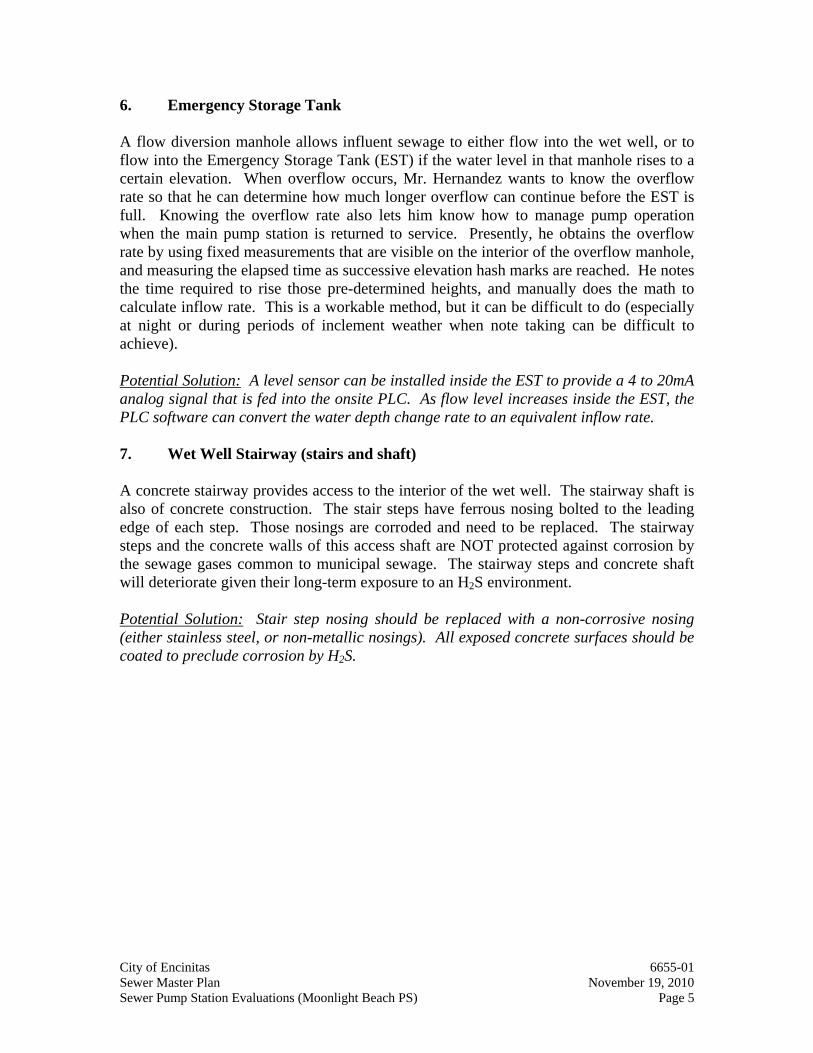
City of Encinitas 6655-01 Sewer Master Plan November 19, 2010 Sewer Pump Station Evaluations (Moonlight Beach PS) Page 5
6. Emergency Storage Tank A flow diversion manhole allows influent sewage to either flow into the wet well, or to flow into the Emergency Storage Tank (EST) if the water level in that manhole rises to a certain elevation. When overflow occurs, Mr. Hernandez wants to know the overflow rate so that he can determine how much longer overflow can continue before the EST is full. Knowing the overflow rate also lets him know how to manage pump operation when the main pump station is returned to service. Presently, he obtains the overflow rate by using fixed measurements that are visible on the interior of the overflow manhole, and measuring the elapsed time as successive elevation hash marks are reached. He notes the time required to rise those pre-determined heights, and manually does the math to calculate inflow rate. This is a workable method, but it can be difficult to do (especially at night or during periods of inclement weather when note taking can be difficult to achieve). Potential Solution: A level sensor can be installed inside the EST to provide a 4 to 20mA analog signal that is fed into the onsite PLC. As flow level increases inside the EST, the PLC software can convert the water depth change rate to an equivalent inflow rate. 7. Wet Well Stairway (stairs and shaft) A concrete stairway provides access to the interior of the wet well. The stairway shaft is also of concrete construction. The stair steps have ferrous nosing bolted to the leading edge of each step. Those nosings are corroded and need to be replaced. The stairway steps and the concrete walls of this access shaft are NOT protected against corrosion by the sewage gases common to municipal sewage. The stairway steps and concrete shaft will deteriorate given their long-term exposure to an H2S environment. Potential Solution: Stair step nosing should be replaced with a non-corrosive nosing (either stainless steel, or non-metallic nosings). All exposed concrete surfaces should be coated to preclude corrosion by H2S.
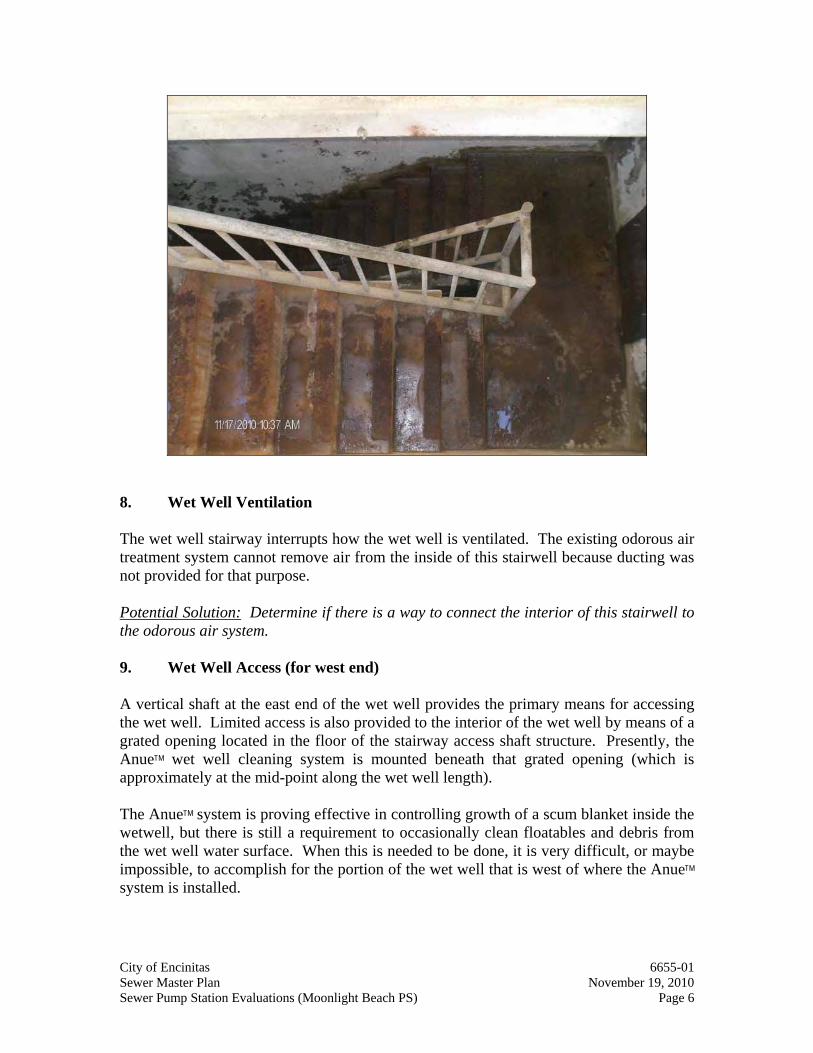
City of Encinitas 6655-01 Sewer Master Plan November 19, 2010 Sewer Pump Station Evaluations (Moonlight Beach PS) Page 6
8. Wet Well Ventilation The wet well stairway interrupts how the wet well is ventilated. The existing odorous air treatment system cannot remove air from the inside of this stairwell because ducting was not provided for that purpose. Potential Solution: Determine if there is a way to connect the interior of this stairwell to the odorous air system. 9. Wet Well Access (for west end) A vertical shaft at the east end of the wet well provides the primary means for accessing the wet well. Limited access is also provided to the interior of the wet well by means of a grated opening located in the floor of the stairway access shaft structure. Presently, the AnueTM wet well cleaning system is mounted beneath that grated opening (which is approximately at the mid-point along the wet well length). The AnueTM system is proving effective in controlling growth of a scum blanket inside the wetwell, but there is still a requirement to occasionally clean floatables and debris from the wet well water surface. When this is needed to be done, it is very difficult, or maybe impossible, to accomplish for the portion of the wet well that is west of where the AnueTM system is installed.
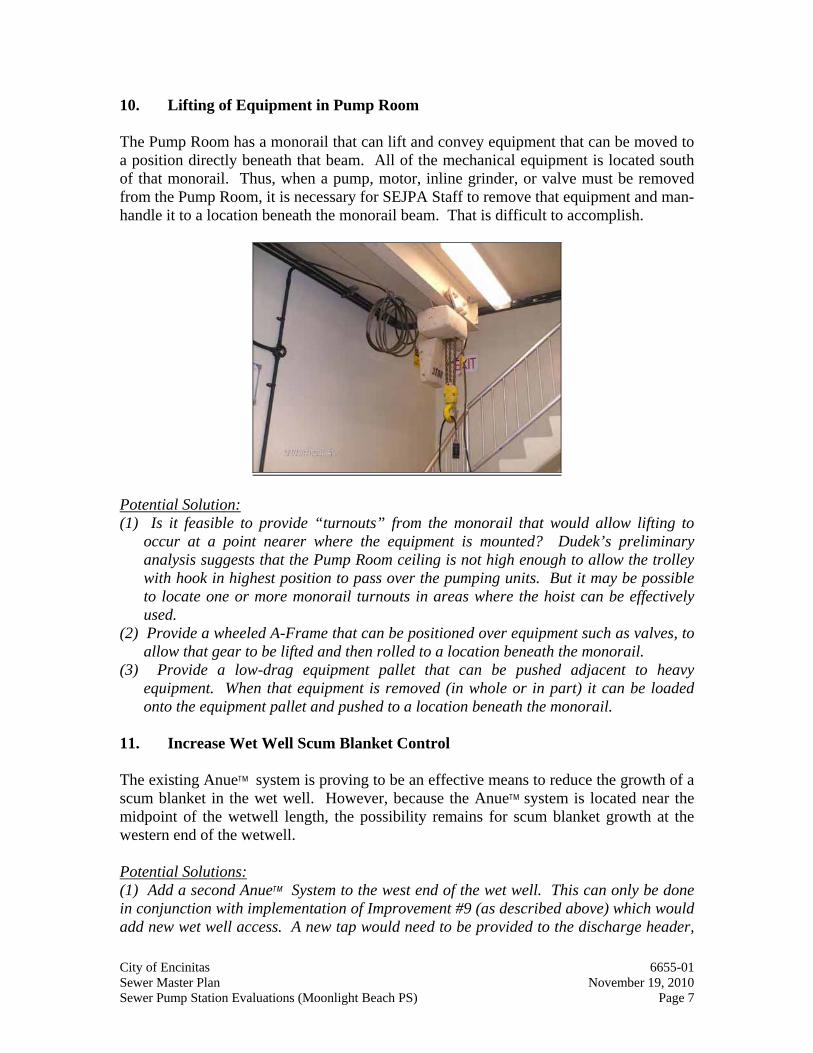
City of Encinitas 6655-01 Sewer Master Plan November 19, 2010 Sewer Pump Station Evaluations (Moonlight Beach PS) Page 7
10. Lifting of Equipment in Pump Room The Pump Room has a monorail that can lift and convey equipment that can be moved to a position directly beneath that beam. All of the mechanical equipment is located south of that monorail. Thus, when a pump, motor, inline grinder, or valve must be removed from the Pump Room, it is necessary for SEJPA Staff to remove that equipment and man-handle it to a location beneath the monorail beam. That is difficult to accomplish.
Potential Solution: (1) Is it feasible to provide “turnouts” from the monorail that would allow lifting to
occur at a point nearer where the equipment is mounted? Dudek’s preliminary analysis suggests that the Pump Room ceiling is not high enough to allow the trolley with hook in highest position to pass over the pumping units. But it may be possible to locate one or more monorail turnouts in areas where the hoist can be effectively used.
(2) Provide a wheeled A-Frame that can be positioned over equipment such as valves, to allow that gear to be lifted and then rolled to a location beneath the monorail.
(3) Provide a low-drag equipment pallet that can be pushed adjacent to heavy equipment. When that equipment is removed (in whole or in part) it can be loaded onto the equipment pallet and pushed to a location beneath the monorail.
11. Increase Wet Well Scum Blanket Control The existing AnueTM system is proving to be an effective means to reduce the growth of a scum blanket in the wet well. However, because the AnueTM system is located near the midpoint of the wetwell length, the possibility remains for scum blanket growth at the western end of the wetwell. Potential Solutions: (1) Add a second AnueTM System to the west end of the wet well. This can only be done in conjunction with implementation of Improvement #9 (as described above) which would add new wet well access. A new tap would need to be provided to the discharge header,

City of Encinitas 6655-01 Sewer Master Plan November 19, 2010 Sewer Pump Station Evaluations (Moonlight Beach PS) Page 8
to supply pressurized sewage flow to that new AnueTM system. This might also entail constructing a new wall penetration from the Pump Room to the west end of the wet well (for the piping from the discharge header to that new AnueTM system). (2) Consider adding a different type of scum blanket control system to the wet well. A possible system is the Little John Digester which violently aerates the wet well water surface to preclude formation of a scum blanket. There may be other system that could be implemented also.
CSD and ESD DUDEK
SEWER MASTER PLAN UPDATE April 2011
APPENDIX E Olivenhain Trunk Sewer Alternative Analysis
Alternative A
Alternative B
Alternative C

CSD and ESD DUDEK
SEWER MASTER PLAN UPDATE April 2011
INTENTIONALLY LEFT BLANK
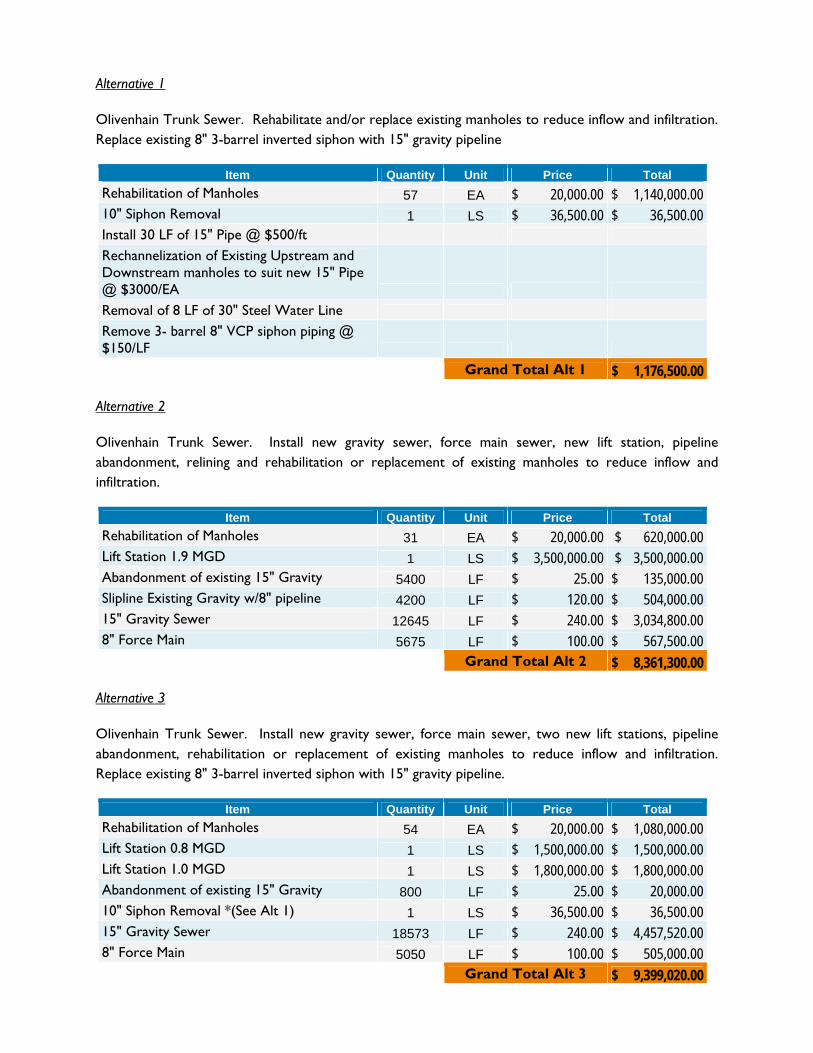
Alternative 1
Olivenhain Trunk Sewer. Rehabilitate and/or replace existing manholes to reduce inflow and infiltration. Replace existing 8" 3-barrel inverted siphon with 15" gravity pipeline
Item Quantity Unit Price Total
Rehabilitation of Manholes 57 EA $ 20,000.00 $ 1,140,000.00 10" Siphon Removal 1 LS $ 36,500.00 $ 36,500.00 Install 30 LF of 15" Pipe @ $500/ft Rechannelization of Existing Upstream and Downstream manholes to suit new 15" Pipe @ $3000/EA Removal of 8 LF of 30" Steel Water Line Remove 3- barrel 8" VCP siphon piping @ $150/LF
Grand Total Alt 1 $ 1,176,500.00
Alternative 2
Olivenhain Trunk Sewer. Install new gravity sewer, force main sewer, new lift station, pipeline abandonment, relining and rehabilitation or replacement of existing manholes to reduce inflow and infiltration.
Item Quantity Unit Price Total
Rehabilitation of Manholes 31 EA $ 20,000.00 $ 620,000.00 Lift Station 1.9 MGD 1 LS $ 3,500,000.00 $ 3,500,000.00 Abandonment of existing 15" Gravity 5400 LF $ 25.00 $ 135,000.00 Slipline Existing Gravity w/8" pipeline 4200 LF $ 120.00 $ 504,000.00 15" Gravity Sewer 12645 LF $ 240.00 $ 3,034,800.00 8" Force Main 5675 LF $ 100.00 $ 567,500.00
Grand Total Alt 2 $ 8,361,300.00
Alternative 3
Olivenhain Trunk Sewer. Install new gravity sewer, force main sewer, two new lift stations, pipeline abandonment, rehabilitation or replacement of existing manholes to reduce inflow and infiltration. Replace existing 8" 3-barrel inverted siphon with 15" gravity pipeline.
Item Quantity Unit Price Total
Rehabilitation of Manholes 54 EA $ 20,000.00 $ 1,080,000.00 Lift Station 0.8 MGD 1 LS $ 1,500,000.00 $ 1,500,000.00 Lift Station 1.0 MGD 1 LS $ 1,800,000.00 $ 1,800,000.00 Abandonment of existing 15" Gravity 800 LF $ 25.00 $ 20,000.00 10" Siphon Removal *(See Alt 1) 1 LS $ 36,500.00 $ 36,500.00 15" Gravity Sewer 18573 LF $ 240.00 $ 4,457,520.00 8" Force Main 5050 LF $ 100.00 $ 505,000.00
Grand Total Alt 3 $ 9,399,020.00
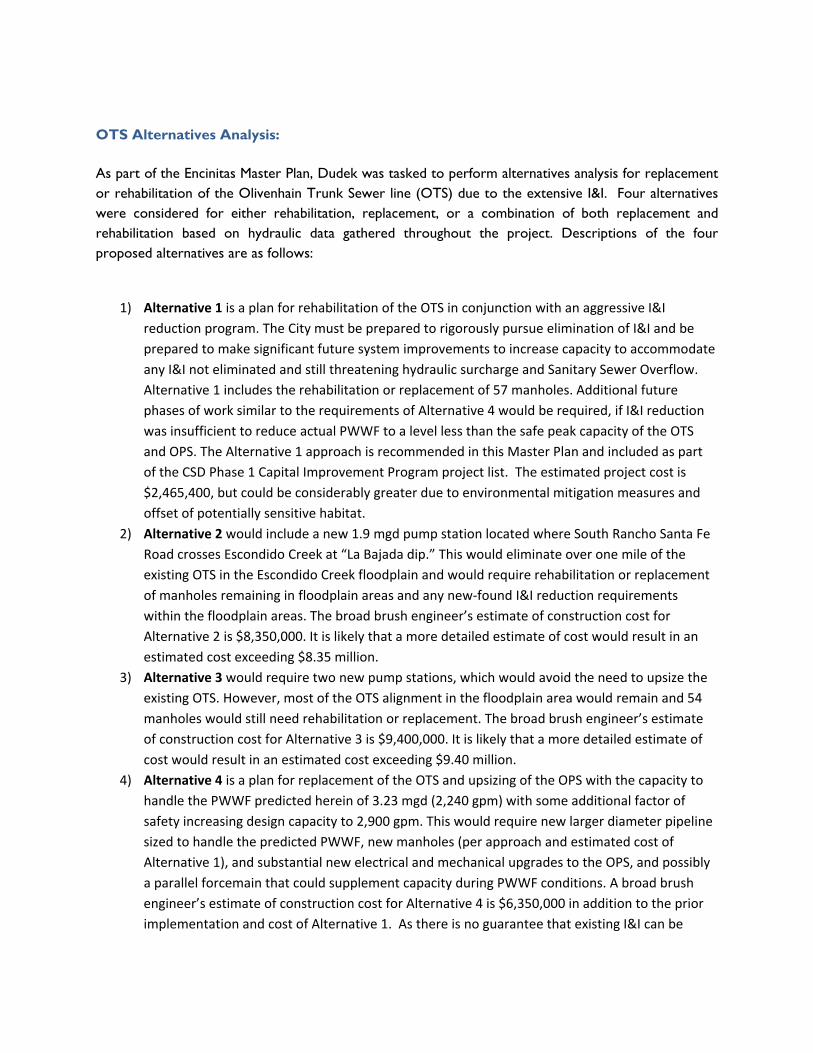
OTS Alternatives Analysis:
As part of the Encinitas Master Plan, Dudek was tasked to perform alternatives analysis for replacement or rehabilitation of the Olivenhain Trunk Sewer line (OTS) due to the extensive I&I. Four alternatives were considered for either rehabilitation, replacement, or a combination of both replacement and rehabilitation based on hydraulic data gathered throughout the project. Descriptions of the four proposed alternatives are as follows:
1) Alternative 1 is a plan for rehabilitation of the OTS in conjunction with an aggressive I&I
reduction program. The City must be prepared to rigorously pursue elimination of I&I and be
prepared to make significant future system improvements to increase capacity to accommodate
any I&I not eliminated and still threatening hydraulic surcharge and Sanitary Sewer Overflow.
Alternative 1 includes the rehabilitation or replacement of 57 manholes. Additional future
phases of work similar to the requirements of Alternative 4 would be required, if I&I reduction
was insufficient to reduce actual PWWF to a level less than the safe peak capacity of the OTS
and OPS. The Alternative 1 approach is recommended in this Master Plan and included as part
of the CSD Phase 1 Capital Improvement Program project list. The estimated project cost is
$2,465,400, but could be considerably greater due to environmental mitigation measures and
offset of potentially sensitive habitat.
2) Alternative 2 would include a new 1.9 mgd pump station located where South Rancho Santa Fe
Road crosses Escondido Creek at “La Bajada dip.” This would eliminate over one mile of the
existing OTS in the Escondido Creek floodplain and would require rehabilitation or replacement
of manholes remaining in floodplain areas and any new‐found I&I reduction requirements
within the floodplain areas. The broad brush engineer’s estimate of construction cost for
Alternative 2 is $8,350,000. It is likely that a more detailed estimate of cost would result in an
estimated cost exceeding $8.35 million.
3) Alternative 3 would require two new pump stations, which would avoid the need to upsize the
existing OTS. However, most of the OTS alignment in the floodplain area would remain and 54
manholes would still need rehabilitation or replacement. The broad brush engineer’s estimate
of construction cost for Alternative 3 is $9,400,000. It is likely that a more detailed estimate of
cost would result in an estimated cost exceeding $9.40 million.
4) Alternative 4 is a plan for replacement of the OTS and upsizing of the OPS with the capacity to
handle the PWWF predicted herein of 3.23 mgd (2,240 gpm) with some additional factor of
safety increasing design capacity to 2,900 gpm. This would require new larger diameter pipeline
sized to handle the predicted PWWF, new manholes (per approach and estimated cost of
Alternative 1), and substantial new electrical and mechanical upgrades to the OPS, and possibly
a parallel forcemain that could supplement capacity during PWWF conditions. A broad brush
engineer’s estimate of construction cost for Alternative 4 is $6,350,000 in addition to the prior
implementation and cost of Alternative 1. As there is no guarantee that existing I&I can be
substantially reduced as part of Alternative 1, Alternative 4 has been included within the
recommended CIP list as a long term Phase 2 capital project for the CSD.
The cost to implement the base Alternative 1 OTS Project for rehabilitation of 57 manholes is
considerably less expensive than Alternatives 2, 3, or 4. However, Alternative 1 has an unquantifiable
risk that supplemental I&I investigation and additional projects to eliminate that I&I may be required.
Nevertheless, the work of Alternative 1 will provide a significant foundation for improved access and
maintenance of the OTS and makes implementation of potentially required future projects significantly
easier and less expensive.
Alternative 1 Implementation Plan
Implementation of OTS Alternative 1 will require completion of a series of preliminary engineering,
environmental documentation, permitting, right‐of‐way acquisition, and construction activities.
Project Assumptions and Description
Significant past effort has been made to eliminate I&I from the existing OTS sewer. With the exception
of the needed rehabilitation or replacement of the existing 57 manholes subjected to high ground water
and flooding, the City is confident in the condition of the existing sewer to exclude I&I. It is the goal of
the OTS Alternative 1 project to eliminate all I&I through the rehabilitation or replacement of the
existing manholes. There may be also be additional sources of I&I that should be investigated, identified,
and eliminated and which are not now identified or quantified as part of the OTS Alternative 1 Project.
Additional sources of I&I can only be tracked down and identified during periods of wet weather and
with the aid of remote in‐line flow metering, hydraulic grade‐line monitoring, and visual inspection.
Preliminary Design Report and Final Design
Project elements required for implementation of OTS Alternative 1 include:
1. Basis of hydraulic design to verify the hydraulic capacity of all pipeline segments are adequate to
handle predicted PWWF.
2. Preparation of a new aerial survey with ground control and high resolution photography to
provide base maps for:
a. Location of existing sewer facilities to be maintained and upgraded.
b. Rim and sewer invert elevations for all manholes along the length of the OTS.
c. Property lines, ownerships, title reports, and existing and any needed new sewer
easements with construction access corridors from street right‐of‐way identified.
d. Detailed environmental characterization mapping for wetlands, flood plain, biology,
endangered species and endangered species habitat, etc.
3. Prepare geotechnical field borings, laboratory analysis, and geotechnical report to provide a
basis of determining means and methods for dewatering by the Contractors during the bid
phase with resulting estimates of dewatering necessary for construction. Determine the
feasibility of allowing discharge of groundwater to the sewer system or transport to the SEWRF
for storage and disposal to the ocean outfall, or alternatively determine the environmental and
permitting requirements to obtain a NPDES discharge permit from the RWQCB.
4. Provide temporary or permanent flow metering and/or hydraulic grade line monitoring at
numerous locations along the length of Reaches 1, 2, and 3 of the OTS. Identification of all
construction work necessary to remediate identified sources of I&I, most particularly
rehabilitation or replacement of 57 manholes along OTS Reaches 1 and 2. See Further Flow and
HGL Monitoring Discussion following this project outline.
5. Prepare a construction access plan, preliminary construction plans including maintenance of
wastewater flow with bypass for OTS Alternative 1, permanent easement access plan, and
easement maintenance plan.
6. Preparation of final design bid documents, plans, specifications, engineer’s estimate of
construction cost, and schedule.
CEQA Documentation and Permits
Prepare preliminary environmental studies and an Environmental Impact Report (EIR), which identifies
project impacts, proposed project impact mitigation, and permits to be acquired. Anticipated permits
include: Coastal Development Permit, various wetlands permits, SWPPP, etc. Avoidance of impacts to
nesting birds and to endangered species will likely require construction to be completed between mid‐
September and mid‐March. This period coincides with wet weather and special project requirements
and restrictions will result due to the location of the project within the flood plain of the San Elijo
Lagoon and Escondido Creek.
Construction
Complete bidding, construction, and start‐up in accordance with the EIR and bid document
requirements.
Post‐Construction Hydraulic Conditions
Continue to monitor wastewater flow before, during, and after the construction of OTS Alternative 1
project. Compare PWWF before and after the project during wet weather and flooding conditions along
all flow and/or hydraulic grade line monitoring locations.
Potential Future Supplemental Projects
Comparison of the PWWF conditions from before and after implementation of the OTS Alternative 1
project will determine whether sufficient I&I has been eliminated from PWWF or whether additional
investigation and projects will be necessary to either remove additional I&I or alternatively to increase
the PWWF capacity of OTS components.
In the extreme, the additional work described above for implementation of Alternative 4 would be
required. It is left to the discretion of the City whether to carry forward the estimated cost of
implementing Alternative 4 as a supplement to Alternative 1 for the financial planning of future capital
facilities, or not.
Smoke Testing and CCTV Inspection
Conduct smoke testing within the OTS. Smoke testing of up to 5 miles of sewer pipeline can be
completed for approximately $20,000 and could potentially provide immediately confirmation of
problem pipelines and/or manholes. In addition to smoke testing during the dry season, CCTV
inspection either during or immediately after a heavy rain event is also a recommended approach to
observing I&I issues within the OTS. Both smoke testing and CCTV inspection are relatively low in cost
compared to flow monitoring and have the potential for locating specific problems areas.
Flow and HGL Monitoring Discussion
The traditional method of tracking down I&I is to provide temporary flow monitoring during wet
weather at key locations and upstream branches in the sewer collection system. We understand that
the City has unsuccessfully attempted to capture meaningful wet weather data during at least two past
winter seasons due to a lack of significant rain events during the period of meter placement. As it is
expensive to set temporary meters and to continue to extend the period of their placement after being
set, it is often difficult to capture meaningful wet weather data.
Other newer hydraulic condition monitoring that could be considered to establish a baseline for design
of the OTS Alternative includes use of remote permanent flow meters (such as by ADS) and/or use of
hydraulic grade line monitoring (such as Smart Covers by Hydronex). Both of these systems provide
automatic data acquisition and web based data reporting.
As an example of estimate cost for use of these systems, ADS provided an informal quote of $90,000 for
a one‐time installation of seven meters plus an annual maintenance fee of $50,000 for calibration and
web‐based assistance and monitoring. Informally, we also understand that the Hydronex Smart Covers
can be installed and operated without battery replacement for a period of one year for a cost of $4,500
per manhole. The cost of Hydronex battery replacement would be nominal and provided for very cost‐
effective monitoring of hydraulic grade line in a sewer.
The original purpose of the Smart Covers was/is to provide early warning of hydraulic surcharge in a
manhole. However, Hydronex agrees that these same units could be calibrated with survey assistance to
provide tracking of a rising and falling hydraulic grade line in a sewer such as the OTS. Use of multiple
Smart Covers along the alignment of the OTS could provide concurrent HGL information at multiple
locations providing a relatively inexpensive way of tracking HGL conditions in the OTS over a period of
time long enough to capture multiple and varying magnitude wet weather events.
A separate PWWF Monitoring Plan should be prepared by an engineer. That PWWF Monitoring Plan
should recommend the locations and types of flow or hydraulic grade line monitoring that should be
provided to define PWWF conditions along the length of Reaches 1, 2, and 3 of the OTS including
consideration of input locations from RSFCSD. The City should continue to coordinate and require
additional flow monitoring to the extent determined feasible for flows from RSFCSD, including retrofit of
existing pump station discharge meters with instantaneous flow recorders and addition of gravity sewer
flow monitoring to the extent deemed reasonable and agreed between the City and RSFCSD.
Temporary flow metering is proposed in this Master Plan for the OTS Reach 3 area north of El Camino
Del Norte. That sequence of temporary flow monitoring and design of increased diameter sewers is
included in this Master Plan as a separate capital project. That portion of the OTS contributes flow to the
lower OTS, where the manholes are proposed to be rehabilitated or replaced as part of the proposed
OTS Alternative 1 project. The flow metering on the OTS north of El Camino Del Norte is key information
that is required to establish a firm basis of flow contribution to the lower OTS Reaches 1 and 2. This
project approach could be updated to match the flow monitoring and/or HGL monitoring approach used
for the lower OTS Reaches 1 and 2, as discussed above.

Encin
itas B
lvd
Manc
heste
r Ave
Santa
Fe D
r
San Elijo Ave
Saxony Rd
Lone
Jack
Rd
Lake Dr
S El Camino Real
N Rancho Santa Fe Rd
S Coast Highway 101
N El Camino Real
Balour Dr
Birmin
gham DrQuail Gardens Dr
Requ
eza S
t
Nardo Rd
Glen Arbor Dr
El Ca
mino D
el Nort
e
Village Park Way
Villa Cardiff Dr
Westlake St Mackinnon Ave
Moun
tain V
ista D
r
N Willowspring Dr
SAN
ELIJO
LAGO
ON
FIGUR
E E-1
CITY
OF E
NCIN
ITAS
OTS
ALTE
RNAT
IVE 1
Lege
ndOT
S ALT
ERNA
TIVE 1
RE
HA
B M
AN
HO
LE
S (
57
MA
NH
OL
ES
)C
SD
-1 (
2,6
00
LF
)R
EM
OV
E 1
0-I
NC
H S
IPH
ON
SA
N E
LIJ
O W
AT
ER
RE
CL
AM
AT
ION
FA
CIL
ITY
EX
IST
ING
LIF
T S
TA
TIO
NS
(E
NC
INIT
AS
)
EX
IST
ING
LIF
T S
TA
TIO
NS
(R
SF
CS
D)
EXIST
ING
TRUN
K GR
AVITY
MAI
NS (M
ODEL
ED)
CA
RD
IFF
GR
AV
ITY
TR
UN
K S
EW
ER
(C
SD
)C
AR
DIF
F R
EL
IEF
TR
UN
K S
EW
ER
(C
SD
)C
AR
DIF
F T
RU
NK
SE
WE
R (
CS
D)
OL
IVE
NH
AIN
TR
UN
K S
EW
ER
(C
SD
)E
NC
INIT
AS
TR
UN
K S
EW
ER
(E
SD
)
EXIST
ING
COLL
ECTO
R GR
AVITY
MAI
NSC
AR
DIF
F G
RA
VIT
Y C
OL
LE
CT
OR
SE
WE
R (
CS
D)
CA
RD
IFF
RE
LIE
F C
OL
LE
CT
OR
SE
WE
R (
CS
D)
CA
RD
IFF
CO
LL
EC
TO
R S
EW
ER
(C
SD
)O
LIV
EN
HA
IN C
OL
LE
CT
OR
SE
WE
R (
CS
D)
EN
CIN
ITA
S C
OL
LE
CT
OR
SE
WE
R (
ES
D)
RS
FC
SD
GR
AV
ITY
MA
INS
EX
IST
ING
FO
RC
E M
AIN
S
CITY
OF E
NCIN
ITAS
CA
RD
IFF
SA
NIT
AR
Y D
IVIS
ION
EN
CIN
ITA
S S
AN
ITA
RY
DIV
ISIO
NW
AT
ER
BO
DIE
SM
AJO
R R
OA
D
Cardi
ff and
Encin
itas
SEW
ER M
ASTE
R PLA
N UP
DATE
DUDE
KFeb
ruary
2011
03,0
001,5
00Fee
t
CARD
IFF
PUM
P ST
ATIO
NOL
IVEN
HAIN
PU
MP
STAT
ION
RANC
HO SA
NTA
FE
COM
MUNI
TY SE
RVIC
ES D
ISTR
ICT
LEUC
ADIA
W
ASTE
WAT
ER
DIST
RICT
CARD
IFF
SANI
TARY
DI
VISI
ON
ENCI
NITA
SSA
NITA
RY
DIVI
SION
PACI
FIC
OCEA
N
5CSD-1
COAS
T BL
VD.
PUM
P ST
ATIO
N
REMO
VE
10-IN
CH
SIPHO
N
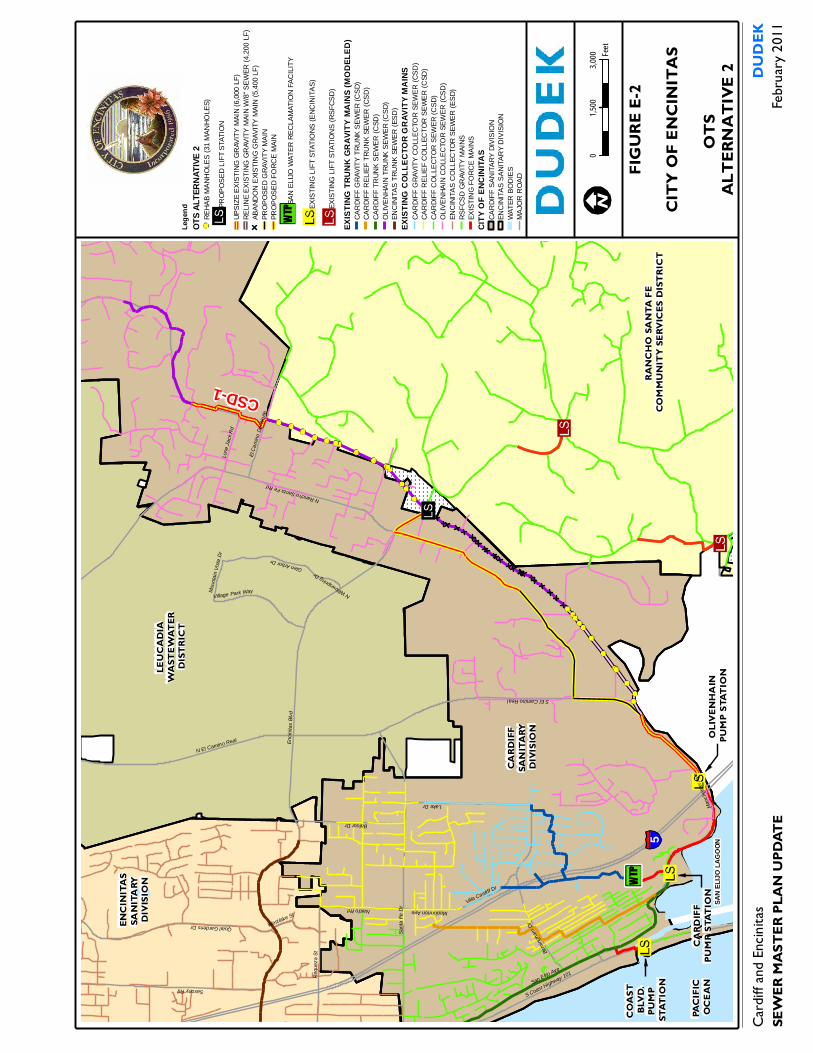
Encin
itas B
lvd
Manc
heste
r Ave
Santa
Fe D
r
San Elijo Ave
Saxony Rd
Lone
Jack
Rd
Lake Dr
S El Camino Real
N Rancho Santa Fe Rd
S Coast Highway 101
N El Camino Real
Balour Dr
Birmin
gham DrQuail Gardens Dr
Requ
eza S
t
Nardo Rd
Glen Arbor Dr
El Ca
mino D
el Nort
e
Village Park Way
Villa Cardiff Dr
Westlake St Mackinnon Ave
Moun
tain V
ista D
r
N Willowspring Dr
SAN
ELIJO
LAGO
ON
FIGUR
E E-2
CITY
OF E
NCIN
ITAS
OTS
ALTE
RNAT
IVE 2
Lege
ndOT
S ALT
ERNA
TIVE 2
RE
HA
B M
AN
HO
LES
(31
MA
NH
OLE
S)
PR
OP
OS
ED
LIF
T S
TATI
ON
UP
SIZ
E E
XIS
TIN
G G
RAV
ITY
MA
IN (
6,00
0 L
F)
RE
LIN
E E
XIS
TIN
G G
RAV
ITY
MA
IN W
/8"
SE
WE
R (
4,20
0 L
F)
AB
AN
DO
N E
XIS
TIN
G G
RA
VIT
Y M
AIN
(5,
400
LF)
PR
OP
OS
ED
GR
AV
ITY
MA
INP
RO
PO
SE
D F
OR
CE
MA
IN
SA
N E
LIJO
WA
TE
R R
EC
LAM
AT
ION
FA
CIL
ITY
EX
IST
ING
LIF
T S
TAT
ION
S (
EN
CIN
ITA
S)
EX
IST
ING
LIF
T S
TAT
ION
S (
RS
FC
SD
)
EXIS
TING
TRUN
K GR
AVITY
MAI
NS (M
ODEL
ED)
CA
RD
IFF
GR
AV
ITY
TR
UN
K S
EW
ER
(C
SD
)C
AR
DIF
F R
ELI
EF
TR
UN
K S
EW
ER
(C
SD
)C
AR
DIF
F T
RU
NK
SE
WE
R (
CS
D)
OLI
VE
NH
AIN
TR
UN
K S
EW
ER
(C
SD
)E
NC
INIT
AS
TR
UN
K S
EW
ER
(E
SD
)
EXIS
TING
COLL
ECTO
R GR
AVITY
MAI
NSC
AR
DIF
F G
RA
VIT
Y C
OLL
EC
TOR
SE
WE
R (
CS
D)
CA
RD
IFF
RE
LIE
F C
OLL
EC
TO
R S
EW
ER
(C
SD
)C
AR
DIF
F C
OL
LEC
TO
R S
EW
ER
(C
SD
)O
LIV
EN
HA
IN C
OLL
EC
TOR
SE
WE
R (
CS
D)
EN
CIN
ITA
S C
OLL
EC
TO
R S
EW
ER
(E
SD
)R
SF
CS
D G
RAV
ITY
MA
INS
EX
IST
ING
FO
RC
E M
AIN
S
CITY
OF E
NCIN
ITAS
CA
RD
IFF
SA
NIT
AR
Y D
IVIS
ION
EN
CIN
ITA
S S
AN
ITA
RY
DIV
ISIO
NW
AT
ER
BO
DIE
SM
AJO
R R
OA
D
Cardi
ff and
Encin
itas
SEW
ER M
ASTE
R PLA
N UP
DATE
DUDE
KFeb
ruary
2011
03,0
001,5
00Fee
t
CARD
IFF
PUM
P ST
ATIO
NOL
IVEN
HAIN
PU
MP
STAT
ION
RANC
HO SA
NTA
FE
COM
MUNI
TY SE
RVIC
ES D
ISTR
ICT
LEUC
ADIA
W
ASTE
WAT
ER
DIST
RICT
CARD
IFF
SANI
TARY
DI
VISI
ON
ENCI
NITA
SSA
NITA
RY
DIVI
SION
PACI
FIC
OCEA
N
5CSD-1
COAS
T BL
VD.
PUM
P ST
ATIO
N
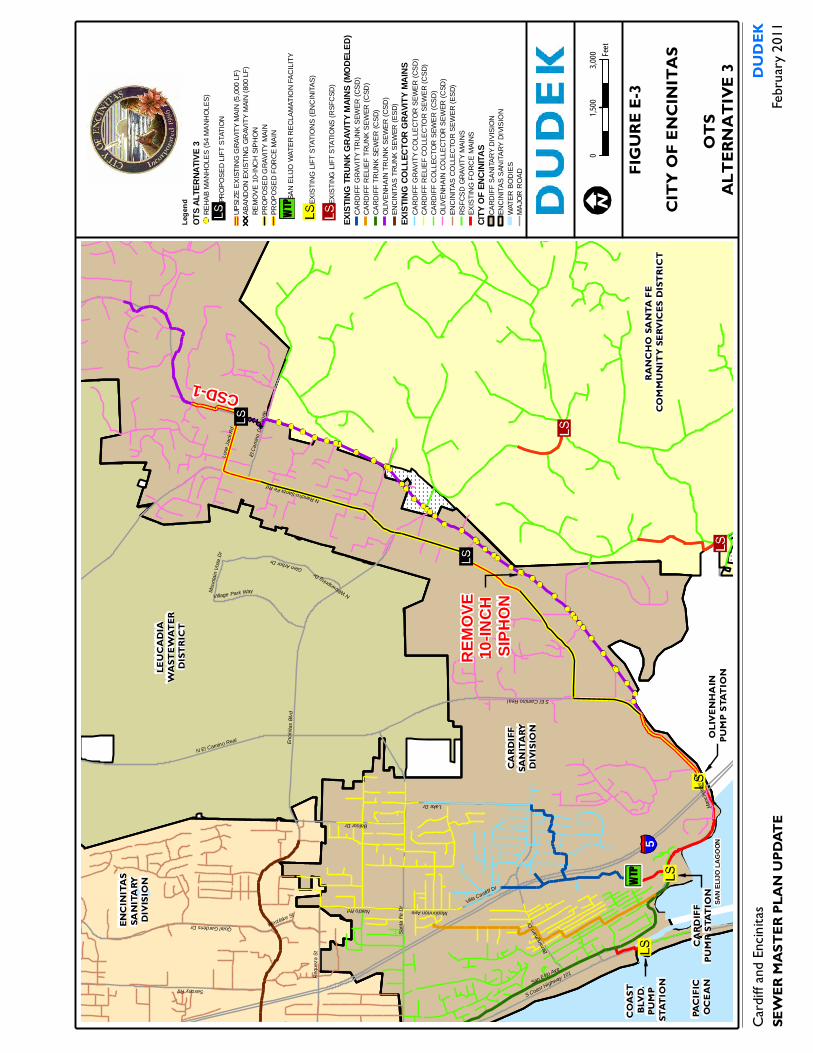
Encin
itas B
lvd
Manc
heste
r Ave
Santa
Fe D
r
San Elijo Ave
Saxony Rd
Lone
Jack
Rd
Lake Dr
S El Camino Real
N Rancho Santa Fe Rd
S Coast Highway 101
N El Camino Real
Balour Dr
Birmin
gham DrQuail Gardens Dr
Requ
eza S
t
Nardo Rd
Glen Arbor Dr
El Ca
mino D
el Nort
e
Village Park Way
Villa Cardiff Dr
Westlake St Mackinnon Ave
Moun
tain V
ista D
r
N Willowspring Dr
SAN
ELIJO
LAGO
ON
FIGUR
E E-3
CITY
OF E
NCIN
ITAS
OTS
ALTE
RNAT
IVE 3
Lege
ndOT
S ALT
ERNA
TIVE 3
RE
HA
B M
AN
HO
LES
(54
MA
NH
OLE
S)
PR
OP
OS
ED
LIF
T S
TAT
ION
UP
SIZ
E E
XIS
TIN
G G
RA
VIT
Y M
AIN
(5,0
00 L
F)
AB
AN
DO
N E
XIS
TIN
G G
RAV
ITY
MA
IN (
800
LF)
RE
MO
VE
10-
INC
H S
IPH
ON
PR
OP
OS
ED
GR
AV
ITY
MA
INP
RO
PO
SE
D F
OR
CE
MA
IN
SA
N E
LIJO
WA
TE
R R
EC
LAM
AT
ION
FA
CIL
ITY
EX
IST
ING
LIF
T S
TAT
ION
S (
EN
CIN
ITA
S)
EX
IST
ING
LIF
T S
TATI
ON
S (
RS
FC
SD
)
EXIST
ING
TRUN
K GRA
VITY M
AINS (
MODE
LED)
CA
RD
IFF
GR
AV
ITY
TR
UN
K S
EW
ER
(C
SD
)C
AR
DIF
F R
ELI
EF
TR
UN
K S
EW
ER
(C
SD
)C
AR
DIF
F T
RU
NK
SE
WE
R (
CS
D)
OLI
VE
NH
AIN
TR
UN
K S
EW
ER
(C
SD
)E
NC
INIT
AS
TR
UN
K S
EW
ER
(E
SD
)
EXIST
ING
COLL
ECTO
R GR
AVITY
MAI
NSC
AR
DIF
F G
RA
VIT
Y C
OL
LEC
TO
R S
EW
ER
(C
SD
)C
AR
DIF
F R
ELI
EF
CO
LLE
CTO
R S
EW
ER
(C
SD
)C
AR
DIF
F C
OLL
EC
TO
R S
EW
ER
(C
SD
)O
LIV
EN
HA
IN C
OLL
EC
TO
R S
EW
ER
(C
SD
)E
NC
INIT
AS
CO
LLE
CTO
R S
EW
ER
(E
SD
)R
SF
CS
D G
RA
VIT
Y M
AIN
SE
XIS
TIN
G F
OR
CE
MA
INS
CITY O
F ENC
INITA
SC
AR
DIF
F S
AN
ITA
RY
DIV
ISIO
NE
NC
INIT
AS
SA
NIT
AR
Y D
IVIS
ION
WAT
ER
BO
DIE
SM
AJO
R R
OA
D
Cardi
ff and
Encin
itas
SEW
ER M
ASTE
R PLA
N UP
DATE
DUDE
KFeb
ruary
2011
03,0
001,5
00Fee
t
CARD
IFF
PUM
P ST
ATIO
NOL
IVEN
HAIN
PU
MP
STAT
ION
RANC
HO SA
NTA
FE
COM
MUNI
TY SE
RVIC
ES D
ISTR
ICT
LEUC
ADIA
W
ASTE
WAT
ER
DIST
RICT
CARD
IFF
SANI
TARY
DI
VISI
ON
ENCI
NITA
SSA
NITA
RY
DIVI
SION
PACI
FIC
OCEA
N
5CSD-1
COAS
T BL
VD.
PUM
P ST
ATIO
N
REMO
VE
10-IN
CH
SIPHO
N

THIS PAGE INTENTIONALLY LEFT BLANK
CSD and ESD DUDEK
SEWER MASTER PLAN UPDATE April 2011
APPENDIX F Cardiff and Coast Pump Station Analysis

CSD and ESD DUDEK
SEWER MASTER PLAN UPDATE April 2011
INTENTIONALLY LEFT BLANK