Embed Size (px)
Citation preview
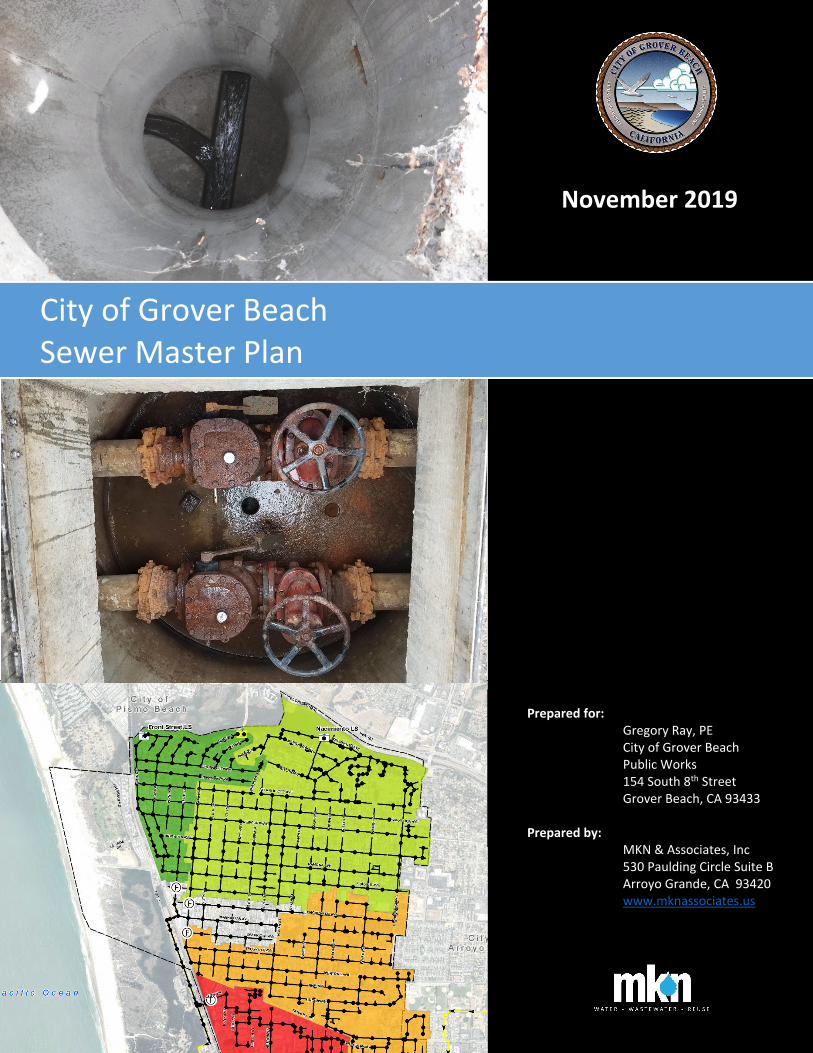
City of Grover Beach Sewer Master Plan
Prepared for: Gregory Ray, PE City of Grover Beach Public Works 154 South 8th Street Grover Beach, CA 93433 Prepared by:
MKN & Associates, Inc 530 Paulding Circle Suite B Arroyo Grande, CA 93420 www.mknassociates.us
November 2019

THIS PAGE LEFT INTENTIONALLY BLANK
City of Grover Beach
Sewer Master Plan
November 2019
City Council
Mayor Jeff Lee
Mayor Pro Tem Mariam Shah
Council Member Karen Bright
Council Member Desi Lance
Council Member Barbara Nicolls
City Staff
Gregory A. Ray, P.E., Public Works Director / City Engineer
Bruce Buckingham, Community Development Director
Cesar Zarate, Public Works Supervisor
Lynn Steele Pearson, Administrative Analyst
Michael K Nunley & Associates Staff
Michael K. Nunley, PE
Robert Lepore, GISP
JJ Reichmuth, PE
Prepared by:
Michael K. Nunley, PE C61801 Project Manager MKN & Associates, Inc.

THIS PAGE LEFT INTENTIONALLY BLANK
City of Grover Beach Sewer Master Plan November 2019
Page | i
Table of Contents
SECTION 1 INTRODUCTION ..................................................................................................................................... 1‐1
1.1 Purpose and Scope ......................................................................................................................................... 1‐1
SECTION 2 LAND USE AND POPULATION ................................................................................................................ 2‐1
2.1 General ........................................................................................................................................................... 2‐1
2.2 Land Use ......................................................................................................................................................... 2‐1
2.3 Population ...................................................................................................................................................... 2‐1
2.4 Future Development ...................................................................................................................................... 2‐3
SECTION 3 EXISTING AND PROJECTED SEWER FLOWS ............................................................................................ 3‐1
3.1 Wastewater Treatment Plant Flow ................................................................................................................ 3‐1
3.2 Flow Monitoring Study ................................................................................................................................... 3‐2
3.2.1 Flow Monitoring Results ............................................................................................................................. 3‐4
3.2.2 Sewer Use Factor Development ................................................................................................................. 3‐7
3.3 Existing Sewer Flow and Peaking Factors ...................................................................................................... 3‐9
3.3.1 Average Daily Flow ...................................................................................................................................... 3‐9
3.3.2 Peak Hour Flow ........................................................................................................................................... 3‐9
3.4 Future Sewer Flow ....................................................................................................................................... 3‐10
SECTION 4 EXISTING SYSTEM OVERVIEW ................................................................................................................ 4‐1
4.1 Overview ........................................................................................................................................................ 4‐1
4.2 Gravity Collection System .............................................................................................................................. 4‐1
4.3 Lift Stations .................................................................................................................................................... 4‐3
4.3.1 Nacimiento Avenue Lift Station .................................................................................................................. 4‐3
4.3.2 Front Street Lift Station .............................................................................................................................. 4‐3
4.3.3 South Oak Park Lift Station ......................................................................................................................... 4‐4
4.4 Operation and Maintenance Areas ................................................................................................................ 4‐7
4.5 SSLOCSD WWTP and Trunk Sewer System .................................................................................................... 4‐9
SECTION 5 DESIGN CRITERIA ................................................................................................................................... 5‐1
5.1 Gravity Collection System Criteria ................................................................................................................. 5‐1
5.2 Lift Station Criteria ......................................................................................................................................... 5‐2
City of Grover Beach Sewer Master Plan November 2019
Page | ii
5.2.1 Pump Capacity ............................................................................................................................................ 5‐2
5.2.2 Wet Well Capacity and Pump Cycle Times ................................................................................................. 5‐2
5.3 Force Main Criteria ........................................................................................................................................ 5‐2
SECTION 6 HYDRAULIC COMPUTER MODEL ............................................................................................................ 6‐1
6.1 Overview ........................................................................................................................................................ 6‐1
6.2 Model Development ...................................................................................................................................... 6‐1
6.2.1 Sewer Flow Allocation ................................................................................................................................ 6‐3
6.2.2 Model Scenarios ......................................................................................................................................... 6‐3
6.2.3 Model Settings ............................................................................................................................................ 6‐4
6.3 Hydraulic Model Flow Validation ................................................................................................................... 6‐4
SECTION 7 EXISTING FLOWS ‐ HYDRAULIC ANALYSIS AND CONDITION ASSESSMENT ........................................... 7‐1
7.1 Gravity Collection System .............................................................................................................................. 7‐1
7.1.1 Hydraulic Model Evaluation – Existing Flow Conditions ............................................................................. 7‐1
7.2 Lift Stations and Force Mains ......................................................................................................................... 7‐5
7.2.1 Hydraulic Analysis ....................................................................................................................................... 7‐5
7.3 Condition Assessment .................................................................................................................................. 7‐10
7.3.1 Nacimiento Lift Station ............................................................................................................................. 7‐10
7.3.2 Front Street Lift Station ............................................................................................................................ 7‐11
7.3.3 South Oak Park Lift Station ....................................................................................................................... 7‐11
7.4 SSLOCSD WWTP Permitted Capacity and City Contractual Allocation ........................................................ 7‐12
SECTION 8 FUTURE FLOWS ‐ HYDRAULIC ANALYSIS ................................................................................................ 8‐1
8.1 Gravity Collection System .............................................................................................................................. 8‐1
8.1.1 Hydraulic Model Evaluation – Future Flow Conditions .............................................................................. 8‐1
8.1.2 Hydraulic Model Evaluation – Future Alternative Flow Conditions ............................................................ 8‐4
8.2 Lift Stations .................................................................................................................................................... 8‐7
8.2.1 Hydraulic Analysis ....................................................................................................................................... 8‐7
SECTION 9 RECOMMENDED IMPROVEMENTS AND OPINION OF PROBABLE COSTS .............................................. 9‐1
9.1 Capital Improvement Criteria ........................................................................................................................ 9‐1
9.1.1 Typical Facility Lifecycle .............................................................................................................................. 9‐1
City of Grover Beach Sewer Master Plan November 2019
Page | iii
9.1.2 Opinion of Probable Cost ............................................................................................................................ 9‐1
9.2 Gravity Collection System .............................................................................................................................. 9‐2
9.3 Lift Stations .................................................................................................................................................... 9‐4
9.4 Maintenance and Operation .......................................................................................................................... 9‐4
9.4.1 Sewer System Management Plan ............................................................................................................... 9‐4
9.4.2 Asset Management Strategy ....................................................................................................................... 9‐4
9.4.3 Updating the City Geographic Information System (GIS) and Hydraulic Model ......................................... 9‐5
9.5 Capital Improvements Summary ................................................................................................................... 9‐5
City of Grover Beach Sewer Master Plan November 2019
Page | iv
List of Tables
Table 2‐1: Gross Acreage By General Plan Land Use Category ....................................................................................... 2‐1
Table 2‐2: SLOCOG 2050 Regional Growth Forecast for City of Grover Beach .............................................................. 2‐3
Table 2‐3: Vacant Residential Property Inventory .......................................................................................................... 2‐4
Table 2‐4: Vacant Commercial and Industrial Property Inventory ................................................................................ 2‐5
Table 2‐5: Underutilized Residential Properties Inventory ............................................................................................ 2‐6
Table 2‐6: Pending Development Projects Inventory ..................................................................................................... 2‐6
Table 2‐7: Pending Urban Reserve Development Inventory .......................................................................................... 2‐8
Table 2‐8: Potential Urban Reserve Residential Development ...................................................................................... 2‐9
Table 2‐9: Potential Urban Reserve Commercial Development ..................................................................................... 2‐9
Table 2‐10: Future City Population Year 2050 .............................................................................................................. 2‐11
Table 3‐1: Flow Meter Locations .................................................................................................................................... 3‐2
Table 3‐2: Flow Monitoring Results ................................................................................................................................ 3‐4
Table 3‐3: Sewer Use Factors ......................................................................................................................................... 3‐7
Table 3‐4: Flow Meters No. 1 and No. 2 Flow Validation Summary ............................................................................... 3‐7
Table 3‐5: Flow Meters No. 3 and No. 4 Flow Validation Summary ............................................................................... 3‐8
Table 3‐6: Existing Estimated Average Daily Flow .......................................................................................................... 3‐9
Table 3‐7: Existing Flows ............................................................................................................................................... 3‐10
Table 3‐8: Estimated Future Sewer Average Daily Flow ............................................................................................... 3‐11
Table 3‐9: Future Flows ................................................................................................................................................ 3‐12
Table 4‐1: Sewer Collection System Inventory by Pipe Size ........................................................................................... 4‐1
Table 4‐2: Sewer Collection System Inventory by Pipe Material .................................................................................... 4‐1
Table 4‐3: Sewer Collection System Inventory by Installation Period ............................................................................ 4‐1
Table 4‐4: Lift Station Summary ..................................................................................................................................... 4‐4
Table 4‐5: Collection System Root Treatment ................................................................................................................ 4‐7
Table 4‐6: Collection System Gravity Line Jetting ........................................................................................................... 4‐8
Table 5‐1: City Design Standards for Gravity Sewer Pipe ............................................................................................... 5‐1
Table 5‐2: Pipe d/D Evaluation Criteria .......................................................................................................................... 5‐1
Table 6‐1: Future Hotel Lift Stations ............................................................................................................................... 6‐3
City of Grover Beach Sewer Master Plan November 2019
Page | v
Table 7‐1: Collection System Deficiencies during Existing PHF Conditions .................................................................... 7‐3
Table 7‐2: Recommended Improvements to Address Existing Flows............................................................................. 7‐5
Table 7‐3: Lift Station Pump Capacity for Existing Flows ................................................................................................ 7‐8
Table 7‐4: Lift Station Pump Cycle Time for Existing Flows ............................................................................................ 7‐8
Table 7‐5: Minimum Active Volume for Existing Flow Conditions ................................................................................. 7‐9
Table 7‐6: Force Main Evaluation for Existing Flows ...................................................................................................... 7‐9
Table 7‐7: Nacimiento Avenue Lift Station Condition Assessment Summary .............................................................. 7‐10
Table 7‐8: Front Street Lift Station Condition Assessment Summary .......................................................................... 7‐11
Table 7‐9: South Oak Park Lift Station Condition Assessment Summary ..................................................................... 7‐11
Table 7‐10: SSLOCSD WWTP Flows ............................................................................................................................... 7‐12
Table 7‐11: City Capacity of SSLOCSD WWTP ............................................................................................................... 7‐12
Table 8‐1: Collection System Deficiencies during Future PHF Conditions ...................................................................... 8‐2
Table 8‐2: Recommended Improvements to Address Future Flows .............................................................................. 8‐4
Table 8‐3: Collection System Deficiencies during Future Alternative PHF Conditions ................................................... 8‐4
Table 8‐4: Recommended Improvements to Address Future Alternative Flows ........................................................... 8‐5
Table 8‐5: Lift Station Pump Capacity for Future Flows ................................................................................................. 8‐7
Table 8‐6: Lift Station Pump Cycle Time for Future Flows .............................................................................................. 8‐7
Table 9‐1: Replacement Facility Expected Life ............................................................................................................... 9‐1
Table 9‐2: Pipeline Unit Construction Cost by Size ......................................................................................................... 9‐2
Table 9‐3: SMP Cost Summary ........................................................................................................................................ 9‐5
Table 9‐4: Capital Improvements Recommended to Address Existing Flow Deficiencies .............................................. 9‐6
Table 9‐5: Operation and Maintenance Improvements ................................................................................................. 9‐8
Table 9‐6: Capital Improvements Recommended to Address Future Flow Deficiencies ............................................... 9‐9
Table 9‐7: Capital Improvements Recommended to Address Future Alternative Flow Deficiencies ........................... 9‐11
City of Grover Beach Sewer Master Plan November 2019
Page | vi
List of Figures
Figure 2‐1: Existing Land Use Map .................................................................................................................................. 2‐2
Figure 2‐2: Future Development Map .......................................................................................................................... 2‐10
Figure 3‐1: SSLOCSD WWTP Historical Average Monthly Influent Flow Rate ................................................................ 3‐1
Figure 3‐2: Typical Flow Meter Installation .................................................................................................................... 3‐2
Figure 3‐3: Flow Meter Locations ................................................................................................................................... 3‐3
Figure 3‐4: Flow Meter No. 1 ‐ Hourly Flow Conditions ................................................................................................. 3‐5
Figure 3‐5: Flow Meter No. 2 ‐ Hourly Flow Conditions ................................................................................................. 3‐5
Figure 3‐6: Flow Meter No. 3 ‐ Hourly Flow Conditions ................................................................................................. 3‐6
Figure 3‐7: Flow Meter No. 4 ‐ Hourly Flow Conditions ................................................................................................. 3‐6
Figure 4‐1: Existing Collection System ............................................................................................................................ 4‐2
Figure 4‐2: Nacimiento Avenue Lift Station ................................................................................................................... 4‐3
Figure 4‐3: Front Street Lift Station ................................................................................................................................ 4‐3
Figure 4‐4: South Oak Park Lift Station .......................................................................................................................... 4‐4
Figure 4‐5: Lift Station Sewer Basins .............................................................................................................................. 4‐6
Figure 6‐1: Sewer Collection System Hydraulic Model ................................................................................................... 6‐2
Figure 6‐2: Sewer Flow Allocation .................................................................................................................................. 6‐3
Figure 7‐1: Gravity Pipeline Velocities during Existing PHF Conditions .......................................................................... 7‐2
Figure 7‐2: Existing PHF Collection System Capacity ...................................................................................................... 7‐4
Figure 7‐3: Nacimentio Avenue Lift Station Pump Curve Vs System Curves .................................................................. 7‐6
Figure 7‐4: Front Street Lift Station Pump Curve Vs System Curves .............................................................................. 7‐6
Figure 7‐5: South Oak Park Lift Station Pump Curve Vs System Curves ......................................................................... 7‐7
Figure 8‐1: Future PHF Collection System with Capacity Improvements to Address Existing Flows ............................. 8‐3
Figure 8‐2: Future Alternative PHF Collection System with Capacity Improvements to Address Future Flows ............ 8‐6
Figure 9‐1: CIPs for Existing Collection System Deficiencies .......................................................................................... 9‐7
Figure 9‐2: CIPs for Future Collection System Deficiencies .......................................................................................... 9‐10
Figure 9‐3: CIPs for Future Alternative Collection System Deficiencies ....................................................................... 9‐12
City of Grover Beach Sewer Master Plan November 2019
Page | vii
Appendices
Appendix A: Flow Monitoring Study Results
Appendix B: Lift Station Asbuilts
Appendix C: Lift Station Manufacturer Pump Curves
Appendix D: Photos from Lift Station Condition Assessment
Appendix E: SewerCAD Capacity Profiles
City of Grover Beach Sewer Master Plan November 2019
Page | viii
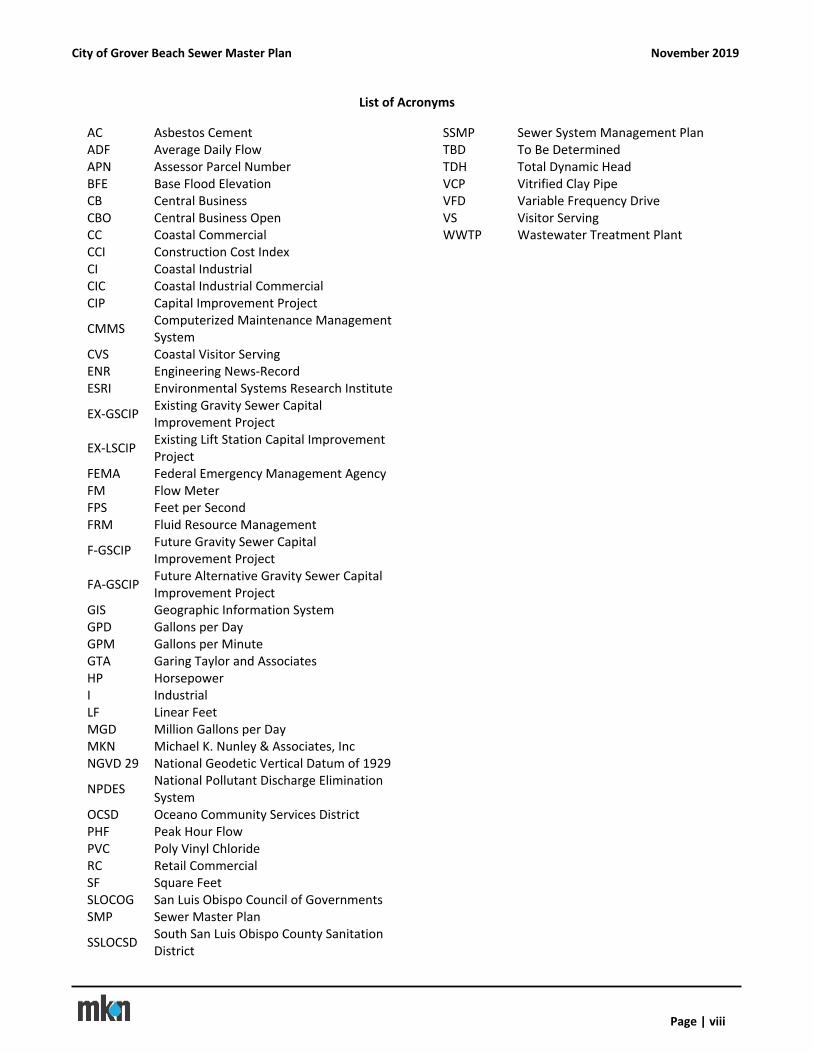
List of Acronyms
AC Asbestos Cement SSMP Sewer System Management Plan ADF Average Daily Flow TBD To Be Determined APN Assessor Parcel Number TDH Total Dynamic Head BFE Base Flood Elevation VCP Vitrified Clay Pipe CB Central Business VFD Variable Frequency Drive CBO Central Business Open VS Visitor Serving CC Coastal Commercial WWTP Wastewater Treatment Plant CCI Construction Cost Index CI Coastal Industrial CIC Coastal Industrial Commercial CIP Capital Improvement Project
CMMS Computerized Maintenance Management System
CVS Coastal Visitor Serving ENR Engineering News‐Record ESRI Environmental Systems Research Institute
EX‐GSCIP Existing Gravity Sewer Capital Improvement Project
EX‐LSCIP Existing Lift Station Capital Improvement Project
FEMA Federal Emergency Management Agency FM Flow Meter FPS Feet per Second FRM Fluid Resource Management
F‐GSCIP Future Gravity Sewer Capital Improvement Project
FA‐GSCIP Future Alternative Gravity Sewer Capital Improvement Project
GIS Geographic Information System GPD Gallons per Day GPM Gallons per Minute GTA Garing Taylor and Associates HP Horsepower I Industrial LF Linear Feet MGD Million Gallons per Day MKN Michael K. Nunley & Associates, Inc NGVD 29 National Geodetic Vertical Datum of 1929
NPDES National Pollutant Discharge Elimination System
OCSD Oceano Community Services District PHF Peak Hour Flow PVC Poly Vinyl Chloride RC Retail Commercial SF Square Feet SLOCOG San Luis Obispo Council of Governments SMP Sewer Master Plan
SSLOCSD South San Luis Obispo County Sanitation District
City of Grover Beach Sewer Master Plan November 2019
Page | ix
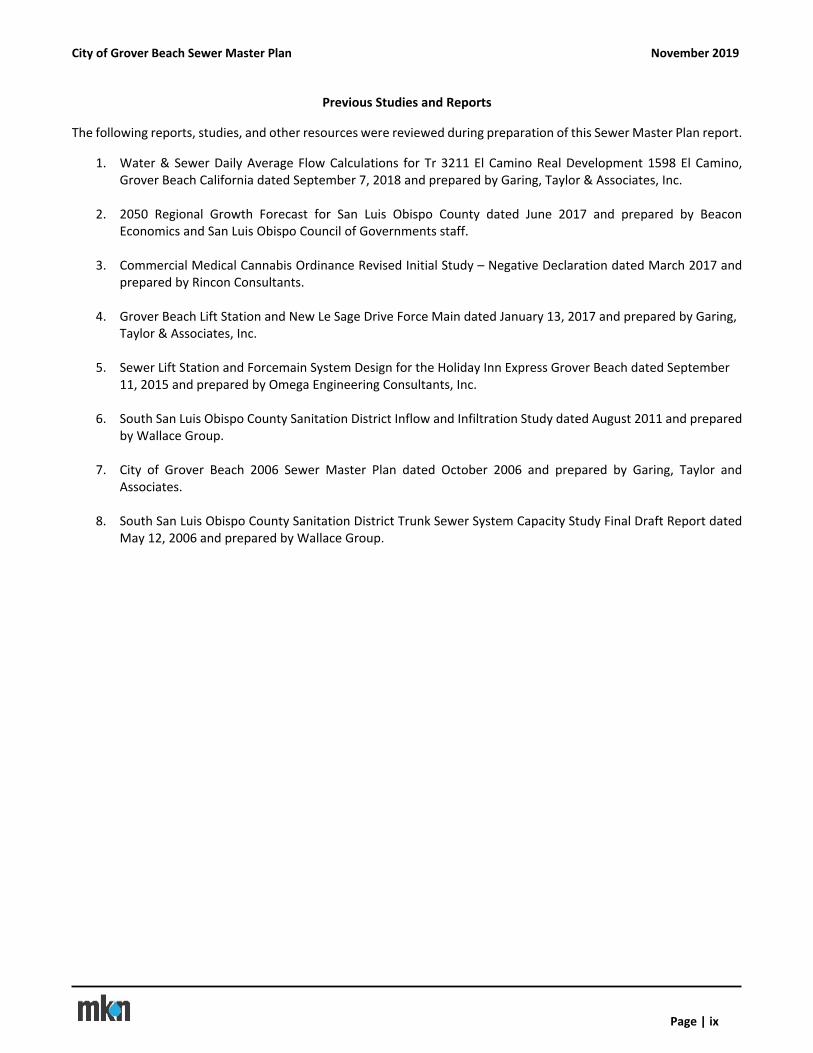
Previous Studies and Reports
The following reports, studies, and other resources were reviewed during preparation of this Sewer Master Plan report.
1. Water & Sewer Daily Average Flow Calculations for Tr 3211 El Camino Real Development 1598 El Camino, Grover Beach California dated September 7, 2018 and prepared by Garing, Taylor & Associates, Inc.
2. 2050 Regional Growth Forecast for San Luis Obispo County dated June 2017 and prepared by Beacon Economics and San Luis Obispo Council of Governments staff.
3. Commercial Medical Cannabis Ordinance Revised Initial Study – Negative Declaration dated March 2017 and prepared by Rincon Consultants.
4. Grover Beach Lift Station and New Le Sage Drive Force Main dated January 13, 2017 and prepared by Garing, Taylor & Associates, Inc.
5. Sewer Lift Station and Forcemain System Design for the Holiday Inn Express Grover Beach dated September 11, 2015 and prepared by Omega Engineering Consultants, Inc.
6. South San Luis Obispo County Sanitation District Inflow and Infiltration Study dated August 2011 and prepared by Wallace Group.
7. City of Grover Beach 2006 Sewer Master Plan dated October 2006 and prepared by Garing, Taylor and Associates.
8. South San Luis Obispo County Sanitation District Trunk Sewer System Capacity Study Final Draft Report dated May 12, 2006 and prepared by Wallace Group.

THIS PAGE LEFT INTENTIONALLY BLANK
City of Grover Beach Sewer Master Plan November 2019
Page | 1‐1
SECTION 1 INTRODUCTION
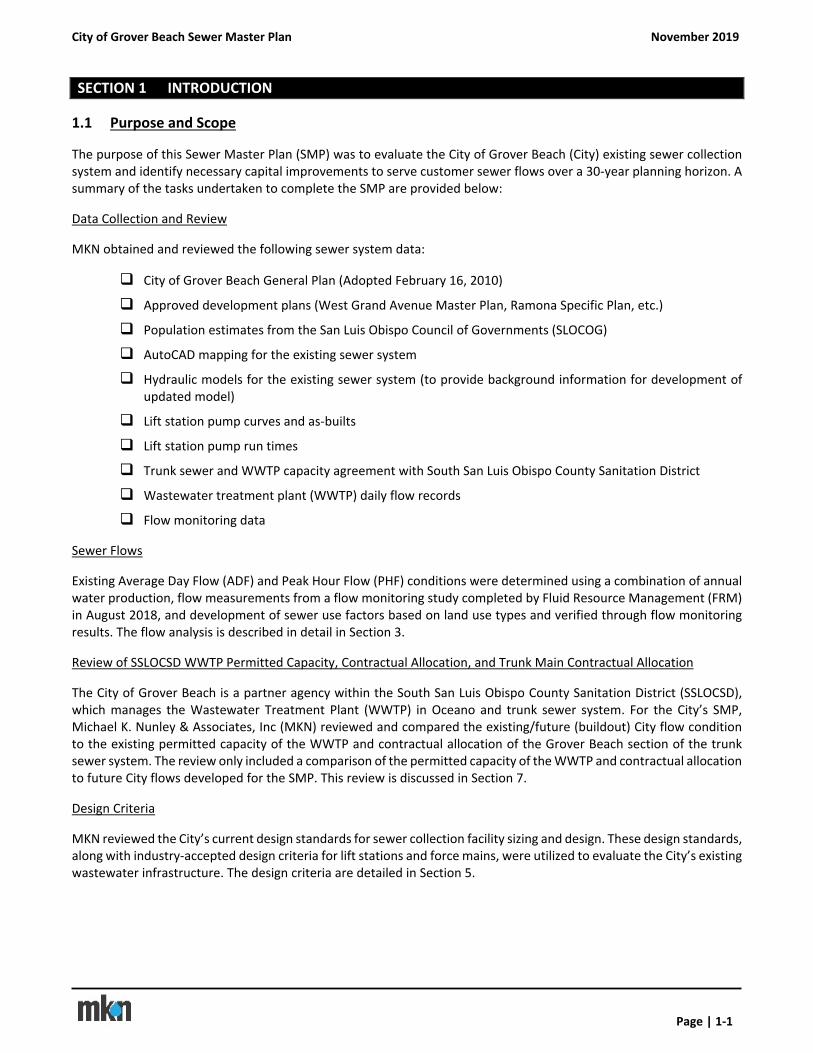
1.1 Purpose and Scope
The purpose of this Sewer Master Plan (SMP) was to evaluate the City of Grover Beach (City) existing sewer collection system and identify necessary capital improvements to serve customer sewer flows over a 30‐year planning horizon. A summary of the tasks undertaken to complete the SMP are provided below:
Data Collection and Review
MKN obtained and reviewed the following sewer system data:
City of Grover Beach General Plan (Adopted February 16, 2010)
Approved development plans (West Grand Avenue Master Plan, Ramona Specific Plan, etc.)
Population estimates from the San Luis Obispo Council of Governments (SLOCOG)
AutoCAD mapping for the existing sewer system
Hydraulic models for the existing sewer system (to provide background information for development of updated model)
Lift station pump curves and as‐builts
Lift station pump run times
Trunk sewer and WWTP capacity agreement with South San Luis Obispo County Sanitation District
Wastewater treatment plant (WWTP) daily flow records
Flow monitoring data
Sewer Flows
Existing Average Day Flow (ADF) and Peak Hour Flow (PHF) conditions were determined using a combination of annual water production, flow measurements from a flow monitoring study completed by Fluid Resource Management (FRM) in August 2018, and development of sewer use factors based on land use types and verified through flow monitoring results. The flow analysis is described in detail in Section 3.
Review of SSLOCSD WWTP Permitted Capacity, Contractual Allocation, and Trunk Main Contractual Allocation
The City of Grover Beach is a partner agency within the South San Luis Obispo County Sanitation District (SSLOCSD), which manages the Wastewater Treatment Plant (WWTP) in Oceano and trunk sewer system. For the City’s SMP, Michael K. Nunley & Associates, Inc (MKN) reviewed and compared the existing/future (buildout) City flow condition to the existing permitted capacity of the WWTP and contractual allocation of the Grover Beach section of the trunk sewer system. The review only included a comparison of the permitted capacity of the WWTP and contractual allocation to future City flows developed for the SMP. This review is discussed in Section 7.
Design Criteria
MKN reviewed the City’s current design standards for sewer collection facility sizing and design. These design standards, along with industry‐accepted design criteria for lift stations and force mains, were utilized to evaluate the City’s existing wastewater infrastructure. The design criteria are detailed in Section 5.
City of Grover Beach Sewer Master Plan November 2019
Page | 1‐2
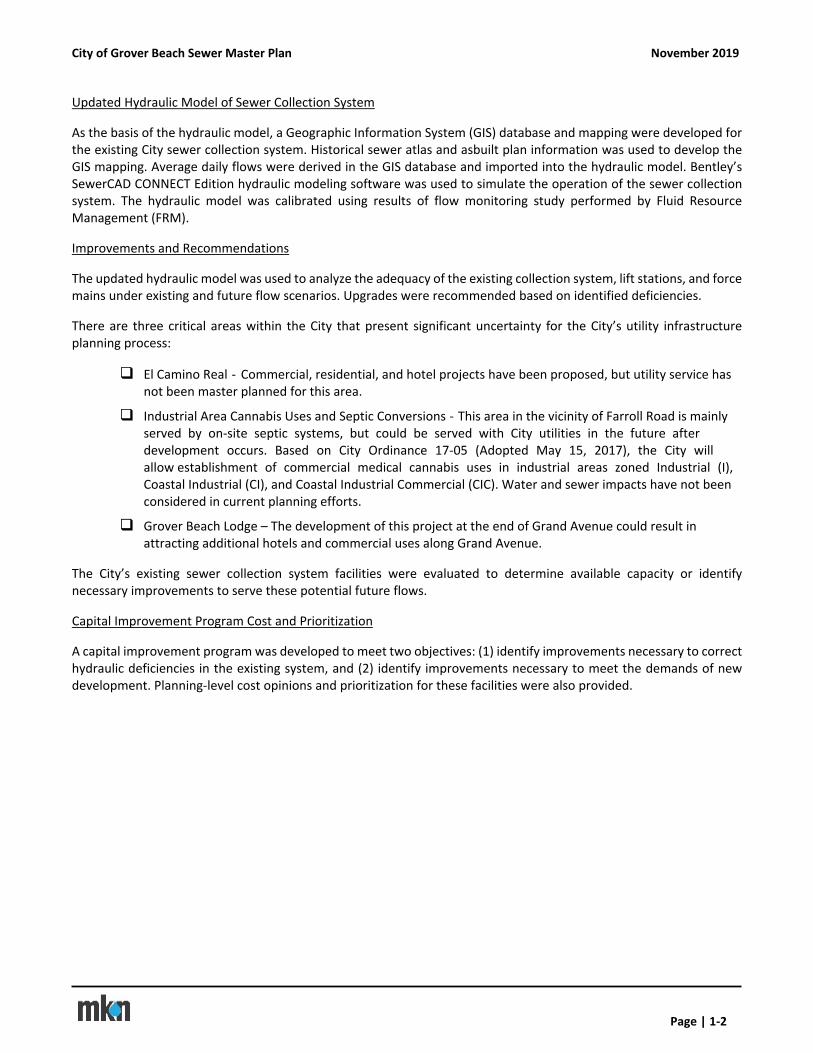
Updated Hydraulic Model of Sewer Collection System
As the basis of the hydraulic model, a Geographic Information System (GIS) database and mapping were developed for the existing City sewer collection system. Historical sewer atlas and asbuilt plan information was used to develop the GIS mapping. Average daily flows were derived in the GIS database and imported into the hydraulic model. Bentley’s SewerCAD CONNECT Edition hydraulic modeling software was used to simulate the operation of the sewer collection system. The hydraulic model was calibrated using results of flow monitoring study performed by Fluid Resource Management (FRM).
Improvements and Recommendations
The updated hydraulic model was used to analyze the adequacy of the existing collection system, lift stations, and force mains under existing and future flow scenarios. Upgrades were recommended based on identified deficiencies.
There are three critical areas within the City that present significant uncertainty for the City’s utility infrastructure planning process:
El Camino Real ‐ Commercial, residential, and hotel projects have been proposed, but utility service has not been master planned for this area.
Industrial Area Cannabis Uses and Septic Conversions ‐ This area in the vicinity of Farroll Road is mainly served by on‐site septic systems, but could be served with City utilities in the future after development occurs. Based on City Ordinance 17‐05 (Adopted May 15, 2017), the City will allow establishment of commercial medical cannabis uses in industrial areas zoned Industrial (I), Coastal Industrial (CI), and Coastal Industrial Commercial (CIC). Water and sewer impacts have not been considered in current planning efforts.
Grover Beach Lodge – The development of this project at the end of Grand Avenue could result in attracting additional hotels and commercial uses along Grand Avenue.
The City’s existing sewer collection system facilities were evaluated to determine available capacity or identify necessary improvements to serve these potential future flows.
Capital Improvement Program Cost and Prioritization
A capital improvement program was developed to meet two objectives: (1) identify improvements necessary to correct hydraulic deficiencies in the existing system, and (2) identify improvements necessary to meet the demands of new development. Planning‐level cost opinions and prioritization for these facilities were also provided.
City of Grover Beach Sewer Master Plan November 2019
Page | 2‐1
SECTION 2 LAND USE AND POPULATION
This section provides an overview of the existing land uses, existing population and growth, and potential development within the City.
2.1 General
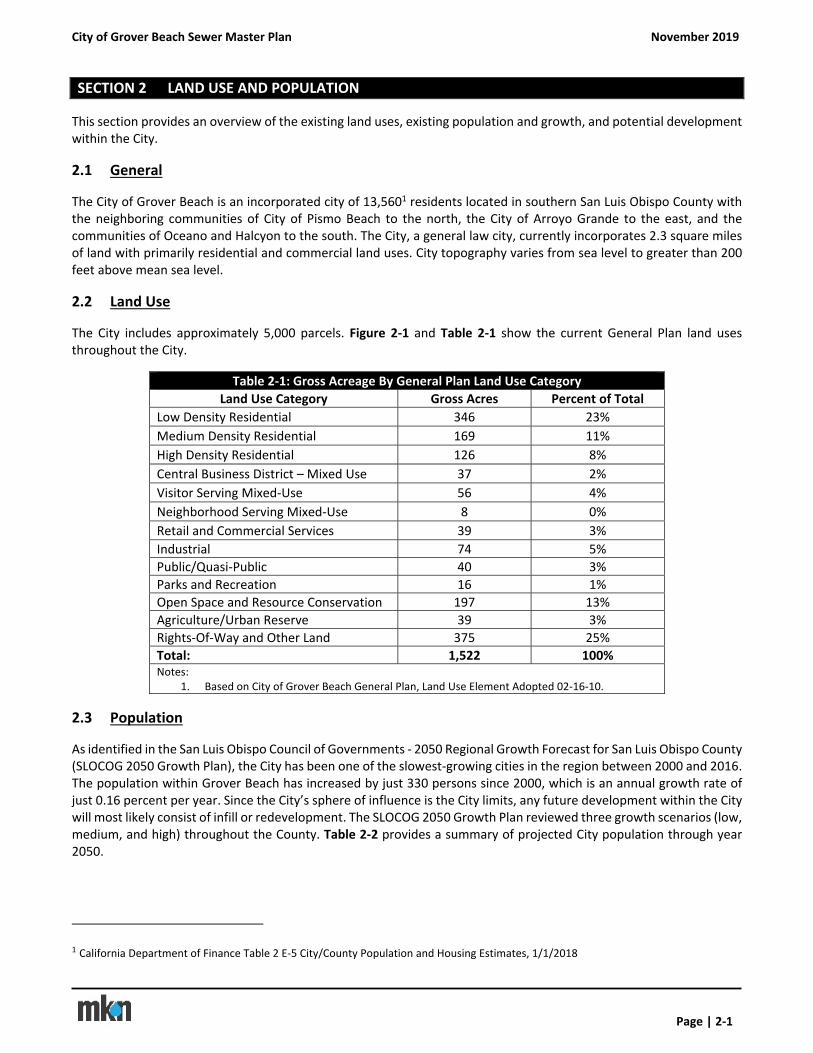
The City of Grover Beach is an incorporated city of 13,5601 residents located in southern San Luis Obispo County with the neighboring communities of City of Pismo Beach to the north, the City of Arroyo Grande to the east, and the communities of Oceano and Halcyon to the south. The City, a general law city, currently incorporates 2.3 square miles of land with primarily residential and commercial land uses. City topography varies from sea level to greater than 200 feet above mean sea level.
2.2 Land Use
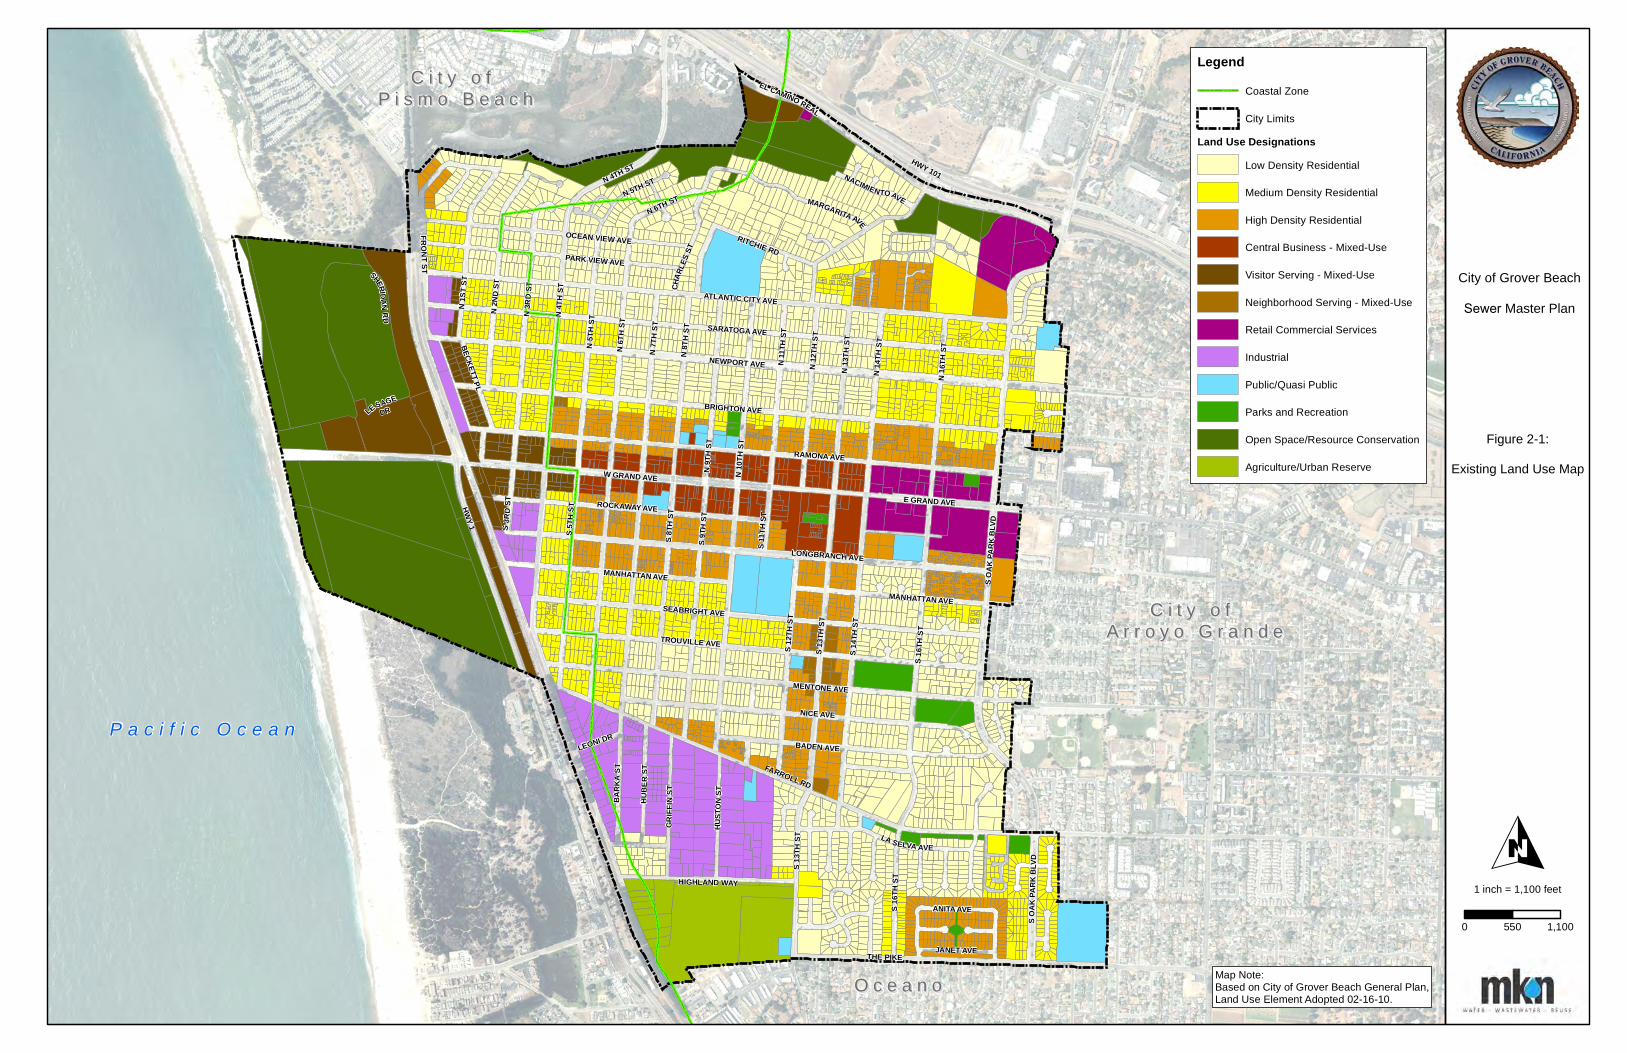
The City includes approximately 5,000 parcels. Figure 2‐1 and Table 2‐1 show the current General Plan land uses throughout the City.
Table 2‐1: Gross Acreage By General Plan Land Use Category
Land Use Category Gross Acres Percent of Total
Low Density Residential 346 23%
Medium Density Residential 169 11%
High Density Residential 126 8%
Central Business District – Mixed Use 37 2%
Visitor Serving Mixed‐Use 56 4%
Neighborhood Serving Mixed‐Use 8 0%
Retail and Commercial Services 39 3%
Industrial 74 5%
Public/Quasi‐Public 40 3%
Parks and Recreation 16 1%
Open Space and Resource Conservation 197 13%
Agriculture/Urban Reserve 39 3%
Rights‐Of‐Way and Other Land 375 25%
Total: 1,522 100% Notes:
1. Based on City of Grover Beach General Plan, Land Use Element Adopted 02‐16‐10.
2.3 Population
As identified in the San Luis Obispo Council of Governments ‐ 2050 Regional Growth Forecast for San Luis Obispo County (SLOCOG 2050 Growth Plan), the City has been one of the slowest‐growing cities in the region between 2000 and 2016. The population within Grover Beach has increased by just 330 persons since 2000, which is an annual growth rate of just 0.16 percent per year. Since the City’s sphere of influence is the City limits, any future development within the City will most likely consist of infill or redevelopment. The SLOCOG 2050 Growth Plan reviewed three growth scenarios (low, medium, and high) throughout the County. Table 2‐2 provides a summary of projected City population through year 2050.
1 California Department of Finance Table 2 E‐5 City/County Population and Housing Estimates, 1/1/2018

THIS PAGE LEFT INTENTIONALLY BLANK
P a c i f i c O c e a n
C i t y o f C i t y o f A r r o y o G r a n d eA r r o y o G r a n d e
C i t y o f C i t y o f P i s m o B e a c hP i s m o B e a c h
O c e a n oO c e a n o
S OAK
PARK
BLV
D
HWY 101
MENTONE AVE
NACIMIENTOAVEN 5TH ST
FARROLL RD
TROUVILLE AVE
BARK
A ST
N 4TH ST
N 5T
H ST
N 6TH ST
N 2N
D ST
N 3R
D ST
N 1S
T ST
HIGHLAND WAY
CHAR
LES S
T
LA SELVA AVE
ATLANTIC CITY AVE
E GRAND AVE
FRONTST
S 13T
H ST
RITCHIE RD
N16
THST
S OAK
PARK
BLV
D
N 13
TH S
T
N 11
TH ST
S 14T
H ST
N 8T
H ST
W GRAND AVE N 10
TH S
T
S 12T
H ST
ROCKAWAY AVE
S 9TH
ST
PARK VIEW AVE
N 6T
H ST
N 4T
H ST
S 8TH
ST
MANHATTAN AVE
MANHATTAN AVE
SARATOGA AVE
SEABRIGHT AVE
N 7T
H ST
BADEN AVE
LONGBRANCH AVE
OCEAN VIEW AVE
N 9T
H ST
N 12
TH S
T
S 3RD
ST
GRIFF
IN ST
S 11T
H ST
S 5TH
ST
THE PIKE
S 16T
H ST
LESAGEDR
N 14
TH S
T
LEONI DR
BECKETT PL
NICE AVE
BRIGHTON AVE
RAMONA AVE
NEWPORT AVE
ANITA AVE
JANET AVE
HUBE
R ST
S 16T
H ST
HUST
ON ST
HWY 1
SHERIDANRD
MARGARITA AVE
EL CAMINO REAL
S 13T
H ST O
LegendCoastal Zone
City Limits
Land Use DesignationsLow Density Residential
Medium Density Residential
High Density Residential
Central Business - Mixed-Use
Visitor Serving - Mixed-Use
Neighborhood Serving - Mixed-Use
Retail Commercial Services
Industrial
Public/Quasi Public
Parks and Recreation
Open Space/Resource Conservation
Agriculture/Urban Reserve
Figure 2-1:
Existing Land Use Map
City of Grover Beach
Sewer Master Plan
Map Note: Based on City of Grover Beach General Plan,Land Use Element Adopted 02-16-10.
1 inch = 1,100 feet
0 1,100550

THIS PAGE LEFT INTENTIONALLY BLANK
City of Grover Beach Sewer Master Plan November 2019
Page | 2‐3
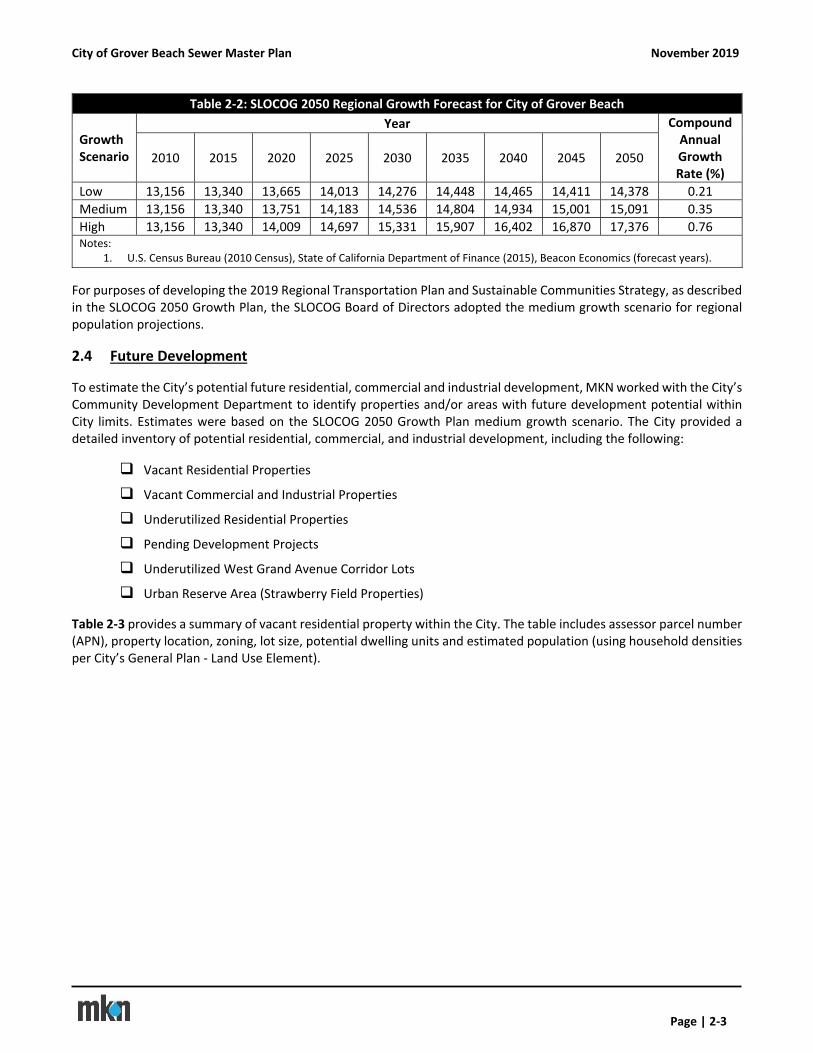
Table 2‐2: SLOCOG 2050 Regional Growth Forecast for City of Grover Beach
Growth Scenario
Year Compound Annual Growth Rate (%)
2010 2015 2020 2025 2030 2035 2040 2045 2050
Low 13,156 13,340 13,665 14,013 14,276 14,448 14,465 14,411 14,378 0.21
Medium 13,156 13,340 13,751 14,183 14,536 14,804 14,934 15,001 15,091 0.35
High 13,156 13,340 14,009 14,697 15,331 15,907 16,402 16,870 17,376 0.76 Notes:
1. U.S. Census Bureau (2010 Census), State of California Department of Finance (2015), Beacon Economics (forecast years).
For purposes of developing the 2019 Regional Transportation Plan and Sustainable Communities Strategy, as described in the SLOCOG 2050 Growth Plan, the SLOCOG Board of Directors adopted the medium growth scenario for regional population projections.
2.4 Future Development
To estimate the City’s potential future residential, commercial and industrial development, MKN worked with the City’s Community Development Department to identify properties and/or areas with future development potential within City limits. Estimates were based on the SLOCOG 2050 Growth Plan medium growth scenario. The City provided a detailed inventory of potential residential, commercial, and industrial development, including the following:
Vacant Residential Properties
Vacant Commercial and Industrial Properties
Underutilized Residential Properties
Pending Development Projects
Underutilized West Grand Avenue Corridor Lots
Urban Reserve Area (Strawberry Field Properties)
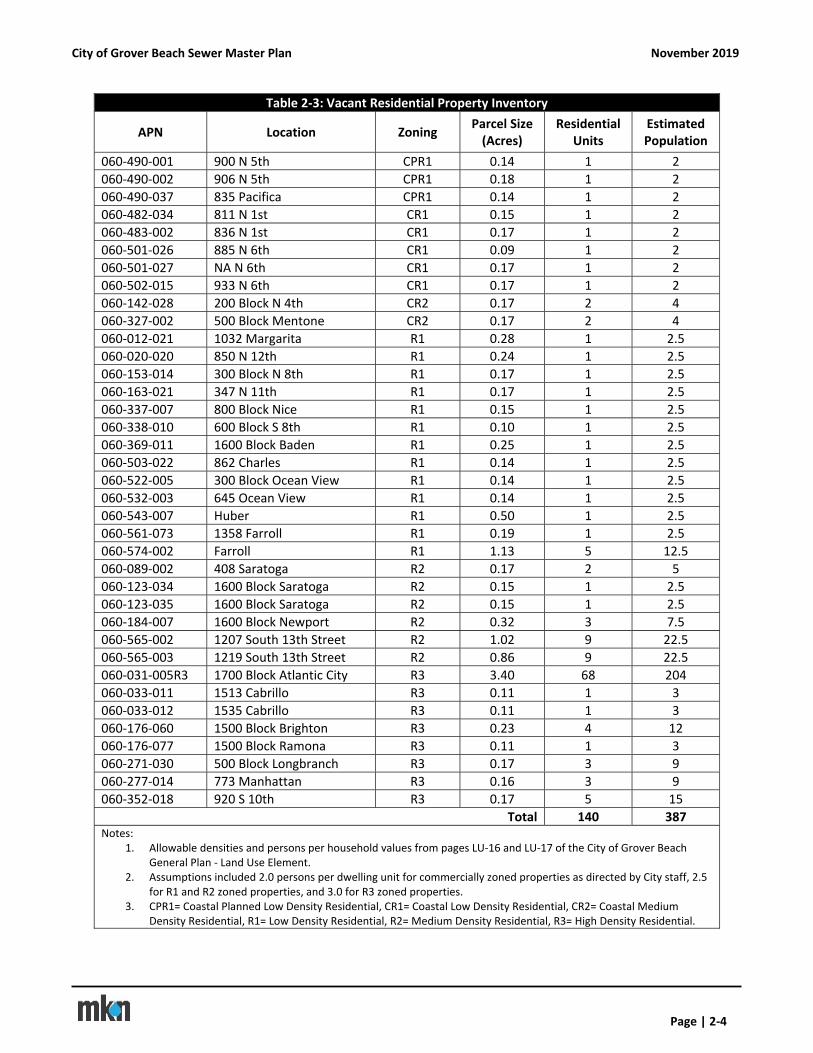
Table 2‐3 provides a summary of vacant residential property within the City. The table includes assessor parcel number (APN), property location, zoning, lot size, potential dwelling units and estimated population (using household densities per City’s General Plan ‐ Land Use Element).
City of Grover Beach Sewer Master Plan November 2019
Page | 2‐4
Table 2‐3: Vacant Residential Property Inventory
APN Location Zoning Parcel Size (Acres)
Residential Units
Estimated Population
060‐490‐001 900 N 5th CPR1 0.14 1 2
060‐490‐002 906 N 5th CPR1 0.18 1 2
060‐490‐037 835 Pacifica CPR1 0.14 1 2
060‐482‐034 811 N 1st CR1 0.15 1 2
060‐483‐002 836 N 1st CR1 0.17 1 2
060‐501‐026 885 N 6th CR1 0.09 1 2
060‐501‐027 NA N 6th CR1 0.17 1 2
060‐502‐015 933 N 6th CR1 0.17 1 2
060‐142‐028 200 Block N 4th CR2 0.17 2 4
060‐327‐002 500 Block Mentone CR2 0.17 2 4
060‐012‐021 1032 Margarita R1 0.28 1 2.5
060‐020‐020 850 N 12th R1 0.24 1 2.5
060‐153‐014 300 Block N 8th R1 0.17 1 2.5
060‐163‐021 347 N 11th R1 0.17 1 2.5
060‐337‐007 800 Block Nice R1 0.15 1 2.5
060‐338‐010 600 Block S 8th R1 0.10 1 2.5
060‐369‐011 1600 Block Baden R1 0.25 1 2.5
060‐503‐022 862 Charles R1 0.14 1 2.5
060‐522‐005 300 Block Ocean View R1 0.14 1 2.5
060‐532‐003 645 Ocean View R1 0.14 1 2.5
060‐543‐007 Huber R1 0.50 1 2.5
060‐561‐073 1358 Farroll R1 0.19 1 2.5
060‐574‐002 Farroll R1 1.13 5 12.5
060‐089‐002 408 Saratoga R2 0.17 2 5
060‐123‐034 1600 Block Saratoga R2 0.15 1 2.5
060‐123‐035 1600 Block Saratoga R2 0.15 1 2.5
060‐184‐007 1600 Block Newport R2 0.32 3 7.5
060‐565‐002 1207 South 13th Street R2 1.02 9 22.5
060‐565‐003 1219 South 13th Street R2 0.86 9 22.5
060‐031‐005R3 1700 Block Atlantic City R3 3.40 68 204
060‐033‐011 1513 Cabrillo R3 0.11 1 3
060‐033‐012 1535 Cabrillo R3 0.11 1 3
060‐176‐060 1500 Block Brighton R3 0.23 4 12
060‐176‐077 1500 Block Ramona R3 0.11 1 3
060‐271‐030 500 Block Longbranch R3 0.17 3 9
060‐277‐014 773 Manhattan R3 0.16 3 9
060‐352‐018 920 S 10th R3 0.17 5 15
Total 140 387 Notes:
1. Allowable densities and persons per household values from pages LU‐16 and LU‐17 of the City of Grover Beach General Plan ‐ Land Use Element.
2. Assumptions included 2.0 persons per dwelling unit for commercially zoned properties as directed by City staff, 2.5 for R1 and R2 zoned properties, and 3.0 for R3 zoned properties.
3. CPR1= Coastal Planned Low Density Residential, CR1= Coastal Low Density Residential, CR2= Coastal Medium Density Residential, R1= Low Density Residential, R2= Medium Density Residential, R3= High Density Residential.
City of Grover Beach Sewer Master Plan November 2019
Page | 2‐5
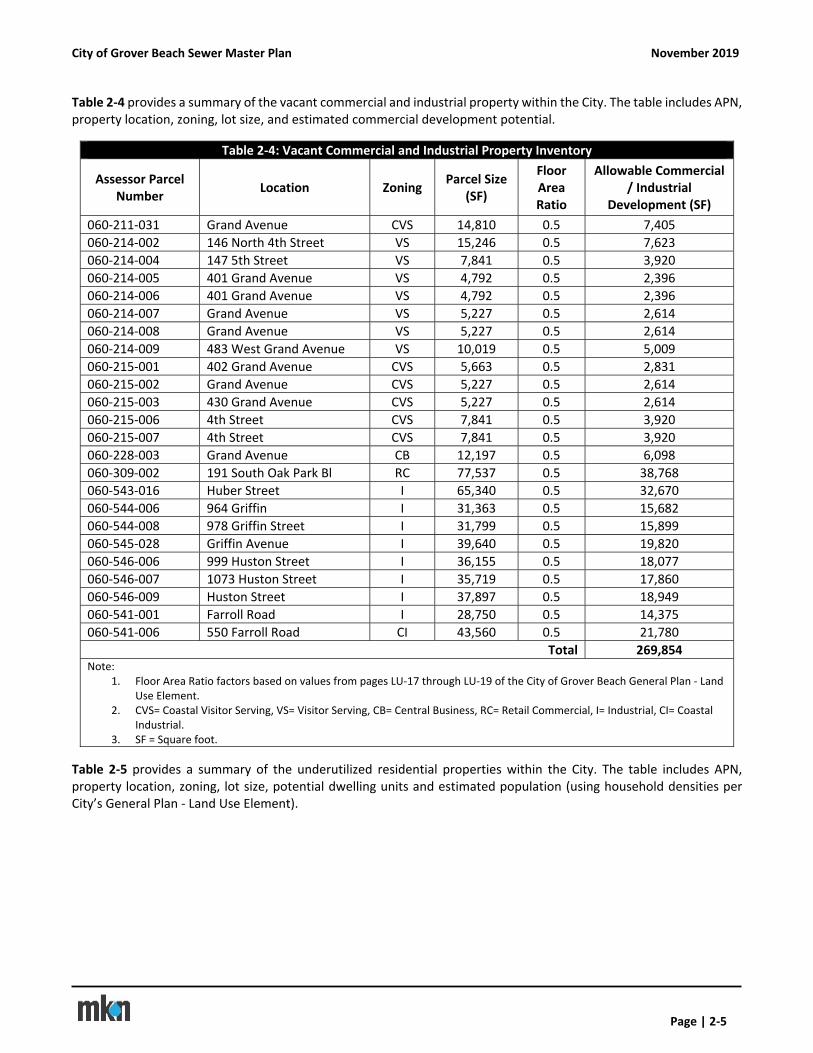
Table 2‐4 provides a summary of the vacant commercial and industrial property within the City. The table includes APN, property location, zoning, lot size, and estimated commercial development potential.
Table 2‐4: Vacant Commercial and Industrial Property Inventory
Assessor Parcel Number
Location Zoning Parcel Size
(SF)
Floor Area Ratio
Allowable Commercial / Industrial
Development (SF)
060‐211‐031 Grand Avenue CVS 14,810 0.5 7,405
060‐214‐002 146 North 4th Street VS 15,246 0.5 7,623
060‐214‐004 147 5th Street VS 7,841 0.5 3,920
060‐214‐005 401 Grand Avenue VS 4,792 0.5 2,396
060‐214‐006 401 Grand Avenue VS 4,792 0.5 2,396
060‐214‐007 Grand Avenue VS 5,227 0.5 2,614
060‐214‐008 Grand Avenue VS 5,227 0.5 2,614
060‐214‐009 483 West Grand Avenue VS 10,019 0.5 5,009
060‐215‐001 402 Grand Avenue CVS 5,663 0.5 2,831
060‐215‐002 Grand Avenue CVS 5,227 0.5 2,614
060‐215‐003 430 Grand Avenue CVS 5,227 0.5 2,614
060‐215‐006 4th Street CVS 7,841 0.5 3,920
060‐215‐007 4th Street CVS 7,841 0.5 3,920
060‐228‐003 Grand Avenue CB 12,197 0.5 6,098
060‐309‐002 191 South Oak Park Bl RC 77,537 0.5 38,768
060‐543‐016 Huber Street I 65,340 0.5 32,670
060‐544‐006 964 Griffin I 31,363 0.5 15,682
060‐544‐008 978 Griffin Street I 31,799 0.5 15,899
060‐545‐028 Griffin Avenue I 39,640 0.5 19,820
060‐546‐006 999 Huston Street I 36,155 0.5 18,077
060‐546‐007 1073 Huston Street I 35,719 0.5 17,860
060‐546‐009 Huston Street I 37,897 0.5 18,949
060‐541‐001 Farroll Road I 28,750 0.5 14,375
060‐541‐006 550 Farroll Road CI 43,560 0.5 21,780
Total 269,854 Note:
1. Floor Area Ratio factors based on values from pages LU‐17 through LU‐19 of the City of Grover Beach General Plan ‐ Land Use Element.
2. CVS= Coastal Visitor Serving, VS= Visitor Serving, CB= Central Business, RC= Retail Commercial, I= Industrial, CI= Coastal Industrial.
3. SF = Square foot.
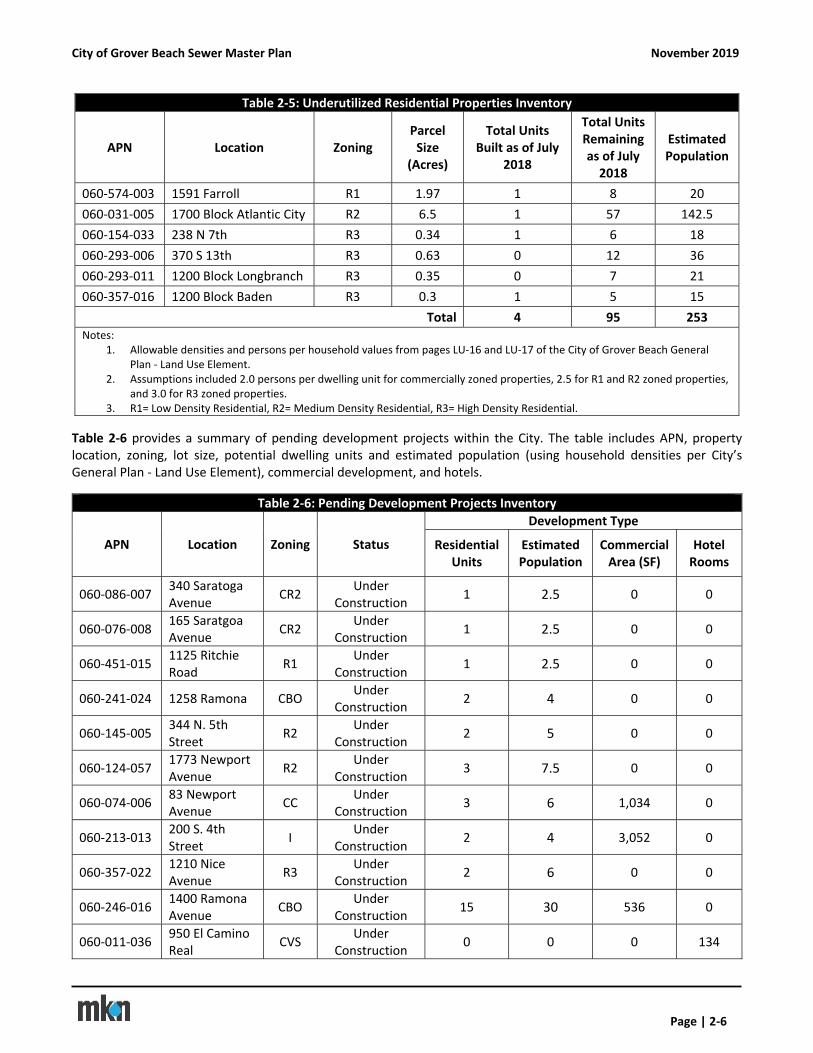
Table 2‐5 provides a summary of the underutilized residential properties within the City. The table includes APN, property location, zoning, lot size, potential dwelling units and estimated population (using household densities per City’s General Plan ‐ Land Use Element).
City of Grover Beach Sewer Master Plan November 2019
Page | 2‐6
Table 2‐5: Underutilized Residential Properties Inventory
APN Location Zoning Parcel Size
(Acres)
Total Units Built as of July
2018
Total Units Remaining as of July 2018
Estimated Population
060‐574‐003 1591 Farroll R1 1.97 1 8 20
060‐031‐005 1700 Block Atlantic City R2 6.5 1 57 142.5
060‐154‐033 238 N 7th R3 0.34 1 6 18
060‐293‐006 370 S 13th R3 0.63 0 12 36
060‐293‐011 1200 Block Longbranch R3 0.35 0 7 21
060‐357‐016 1200 Block Baden R3 0.3 1 5 15
Total 4 95 253 Notes:
1. Allowable densities and persons per household values from pages LU‐16 and LU‐17 of the City of Grover Beach General Plan ‐ Land Use Element.
2. Assumptions included 2.0 persons per dwelling unit for commercially zoned properties, 2.5 for R1 and R2 zoned properties, and 3.0 for R3 zoned properties.
3. R1= Low Density Residential, R2= Medium Density Residential, R3= High Density Residential.
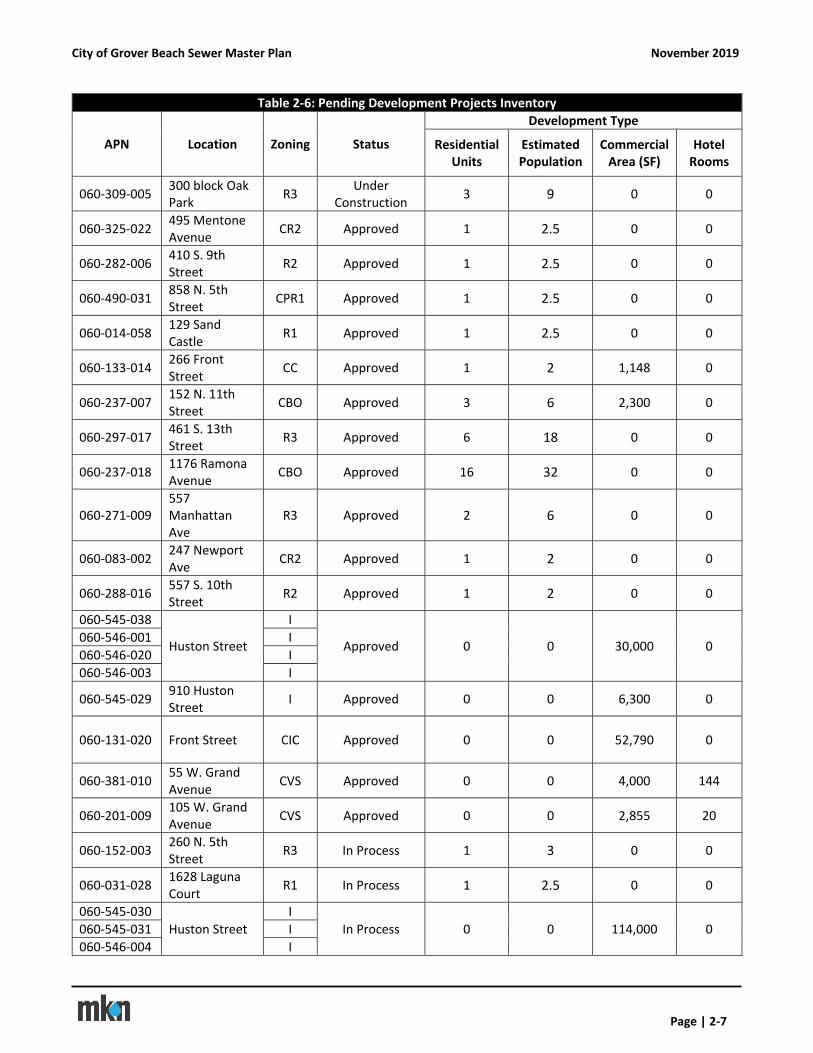
Table 2‐6 provides a summary of pending development projects within the City. The table includes APN, property location, zoning, lot size, potential dwelling units and estimated population (using household densities per City’s General Plan ‐ Land Use Element), commercial development, and hotels.
Table 2‐6: Pending Development Projects Inventory
APN Location Zoning Status
Development Type
Residential Units
Estimated Population
Commercial Area (SF)
Hotel Rooms
060‐086‐007 340 Saratoga Avenue
CR2 Under
Construction 1 2.5 0 0
060‐076‐008 165 Saratgoa Avenue
CR2 Under
Construction 1 2.5 0 0
060‐451‐015 1125 Ritchie Road
R1 Under
Construction 1 2.5 0 0
060‐241‐024 1258 Ramona CBO Under
Construction 2 4 0 0
060‐145‐005 344 N. 5th Street
R2 Under
Construction 2 5 0 0
060‐124‐057 1773 Newport Avenue
R2 Under
Construction 3 7.5 0 0
060‐074‐006 83 Newport Avenue
CC Under
Construction 3 6 1,034 0
060‐213‐013 200 S. 4th Street
I Under
Construction 2 4 3,052 0
060‐357‐022 1210 Nice Avenue
R3 Under
Construction 2 6 0 0
060‐246‐016 1400 Ramona Avenue
CBO Under
Construction 15 30 536 0
060‐011‐036 950 El Camino Real
CVS Under
Construction 0 0 0 134
City of Grover Beach Sewer Master Plan November 2019
Page | 2‐7
Table 2‐6: Pending Development Projects Inventory
APN Location Zoning Status
Development Type
Residential Units
Estimated Population
Commercial Area (SF)
Hotel Rooms
060‐309‐005 300 block Oak Park
R3 Under
Construction 3 9 0 0
060‐325‐022 495 Mentone Avenue
CR2 Approved 1 2.5 0 0
060‐282‐006 410 S. 9th Street
R2 Approved 1 2.5 0 0
060‐490‐031 858 N. 5th Street
CPR1 Approved 1 2.5 0 0
060‐014‐058 129 Sand Castle
R1 Approved 1 2.5 0 0
060‐133‐014 266 Front Street
CC Approved 1 2 1,148 0
060‐237‐007 152 N. 11th Street
CBO Approved 3 6 2,300 0
060‐297‐017 461 S. 13th Street
R3 Approved 6 18 0 0
060‐237‐018 1176 Ramona Avenue
CBO Approved 16 32 0 0
060‐271‐009 557 Manhattan Ave
R3 Approved 2 6 0 0
060‐083‐002 247 Newport Ave
CR2 Approved 1 2 0 0
060‐288‐016 557 S. 10th Street
R2 Approved 1 2 0 0
060‐545‐038
Huston Street
I
Approved 0 0 30,000 0 060‐546‐001 I
060‐546‐020 I
060‐546‐003 I
060‐545‐029 910 Huston Street
I Approved 0 0 6,300 0
060‐131‐020 Front Street CIC Approved 0 0 52,790 0
060‐381‐010 55 W. Grand Avenue
CVS Approved 0 0 4,000 144
060‐201‐009 105 W. Grand Avenue
CVS Approved 0 0 2,855 20
060‐152‐003 260 N. 5th Street
R3 In Process 1 3 0 0
060‐031‐028 1628 Laguna Court
R1 In Process 1 2.5 0 0
060‐545‐030
Huston Street
I
In Process 0 0 114,000 0 060‐545‐031 I
060‐546‐004 I
City of Grover Beach Sewer Master Plan November 2019
Page | 2‐8
Table 2‐6: Pending Development Projects Inventory
APN Location Zoning Status
Development Type
Residential Units
Estimated Population
Commercial Area (SF)
Hotel Rooms
060‐546‐005 I
060‐546‐019 I
060‐174‐042 267 N. 14th Street
R3 In Process 2 6 0 0
060‐031‐022 1598 El Camino Real
RC In Process 7 14 4000 151 060‐031‐021
Total 80 183 222,015 449 Notes:
1. Allowable densities and persons per household values from pages LU‐16 and LU‐17 of the City of Grover Beach General Plan ‐ Land Use Element.
2. Assumptions included 2.0 persons per dwelling unit for commercially zoned properties, 2.5 for R1 and R2 zoned properties, and 3.0 for R3 zoned properties.
3. CVS= Coastal Visitor Serving, VS= Visitor Serving, CB= Central Business, CBO= Central Business Open, RC= Retail Commercial, I= Industrial, CI= Coastal Industrial. R1= Low Density Residential, R2= Medium Density Residential, R3= High Density Residential, CC= Coastal Commercial, CIC= Coastal Industrial Commercial.
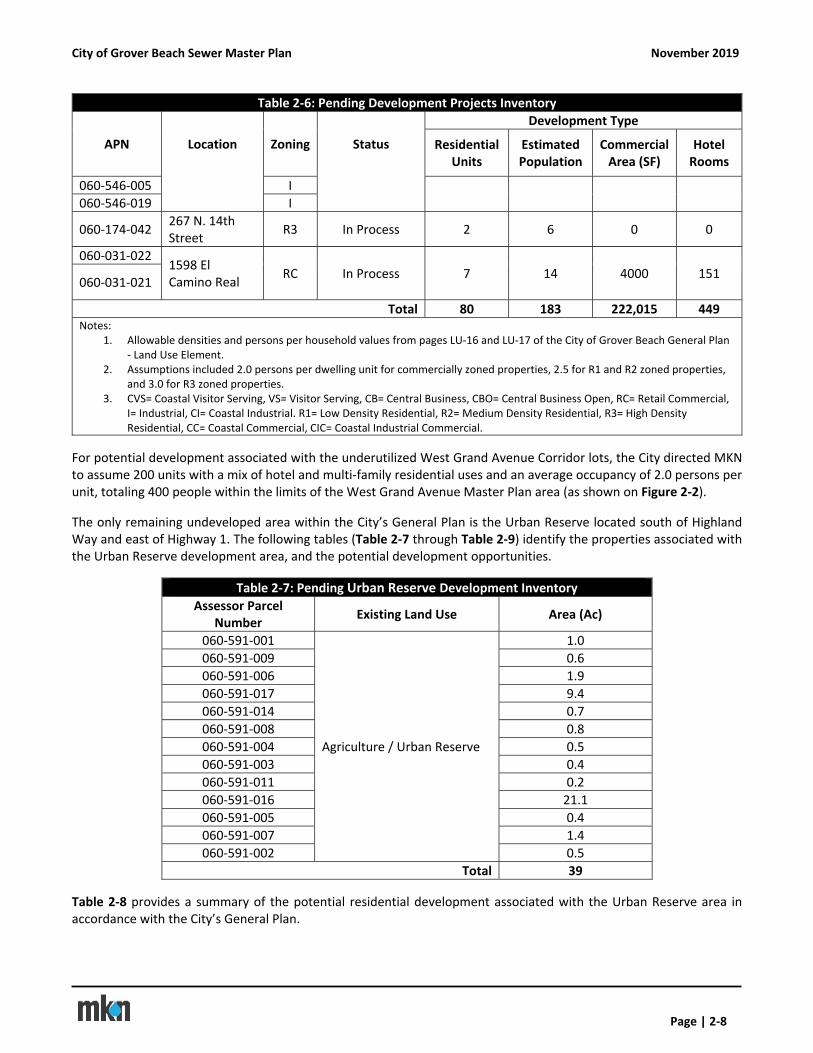
For potential development associated with the underutilized West Grand Avenue Corridor lots, the City directed MKN to assume 200 units with a mix of hotel and multi‐family residential uses and an average occupancy of 2.0 persons per unit, totaling 400 people within the limits of the West Grand Avenue Master Plan area (as shown on Figure 2‐2).
The only remaining undeveloped area within the City’s General Plan is the Urban Reserve located south of Highland Way and east of Highway 1. The following tables (Table 2‐7 through Table 2‐9) identify the properties associated with the Urban Reserve development area, and the potential development opportunities.
Table 2‐7: Pending Urban Reserve Development Inventory Assessor Parcel
Number Existing Land Use Area (Ac)
060‐591‐001
Agriculture / Urban Reserve
1.0
060‐591‐009 0.6
060‐591‐006 1.9
060‐591‐017 9.4
060‐591‐014 0.7
060‐591‐008 0.8
060‐591‐004 0.5
060‐591‐003 0.4
060‐591‐011 0.2
060‐591‐016 21.1
060‐591‐005 0.4
060‐591‐007 1.4
060‐591‐002 0.5
Total 39
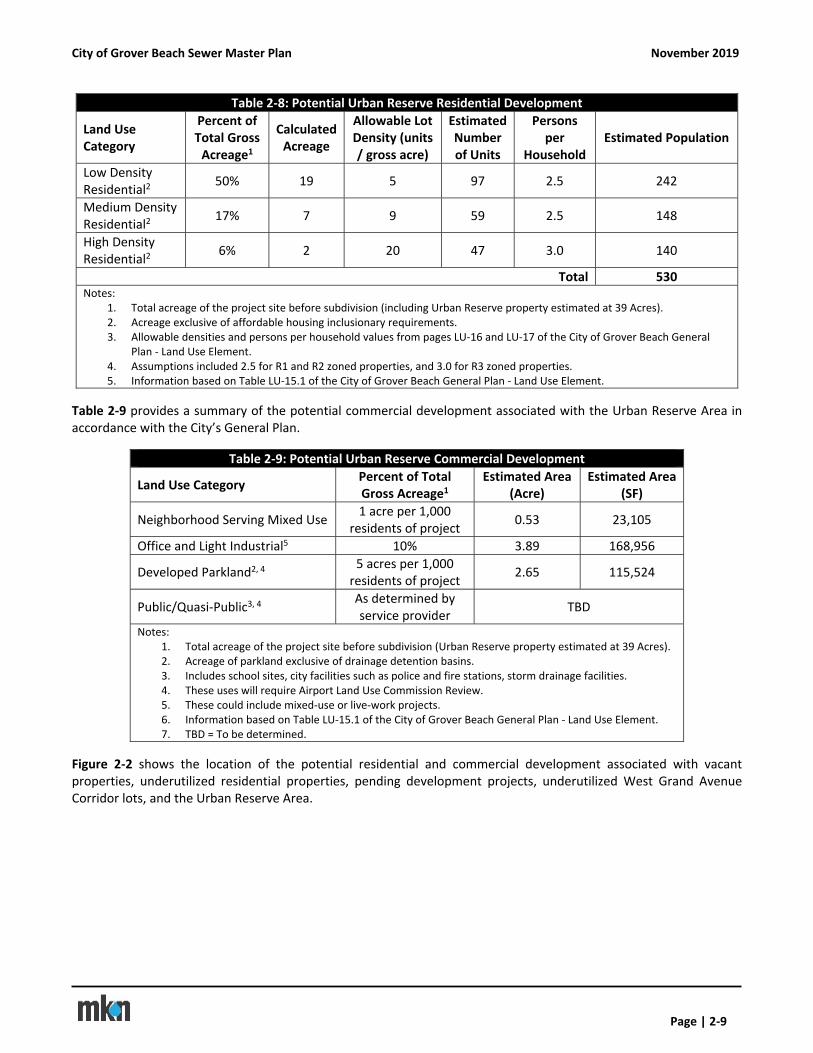
Table 2‐8 provides a summary of the potential residential development associated with the Urban Reserve area in accordance with the City’s General Plan.
City of Grover Beach Sewer Master Plan November 2019
Page | 2‐9
Table 2‐8: Potential Urban Reserve Residential Development
Land Use Category
Percent of Total Gross Acreage1
Calculated Acreage
Allowable Lot Density (units / gross acre)
Estimated Number of Units
Persons per
Household Estimated Population
Low Density Residential2
50% 19 5 97 2.5 242
Medium Density Residential2
17% 7 9 59 2.5 148
High Density Residential2
6% 2 20 47 3.0 140
Total 530 Notes:
1. Total acreage of the project site before subdivision (including Urban Reserve property estimated at 39 Acres). 2. Acreage exclusive of affordable housing inclusionary requirements. 3. Allowable densities and persons per household values from pages LU‐16 and LU‐17 of the City of Grover Beach General
Plan ‐ Land Use Element. 4. Assumptions included 2.5 for R1 and R2 zoned properties, and 3.0 for R3 zoned properties. 5. Information based on Table LU‐15.1 of the City of Grover Beach General Plan ‐ Land Use Element.
Table 2‐9 provides a summary of the potential commercial development associated with the Urban Reserve Area in accordance with the City’s General Plan.
Table 2‐9: Potential Urban Reserve Commercial Development
Land Use Category Percent of Total Gross Acreage1
Estimated Area (Acre)
Estimated Area (SF)
Neighborhood Serving Mixed Use 1 acre per 1,000
residents of project 0.53 23,105
Office and Light Industrial5 10% 3.89 168,956
Developed Parkland2, 4 5 acres per 1,000 residents of project
2.65 115,524
Public/Quasi‐Public3, 4 As determined by service provider
TBD
Notes: 1. Total acreage of the project site before subdivision (Urban Reserve property estimated at 39 Acres). 2. Acreage of parkland exclusive of drainage detention basins. 3. Includes school sites, city facilities such as police and fire stations, storm drainage facilities. 4. These uses will require Airport Land Use Commission Review. 5. These could include mixed‐use or live‐work projects. 6. Information based on Table LU‐15.1 of the City of Grover Beach General Plan ‐ Land Use Element. 7. TBD = To be determined.
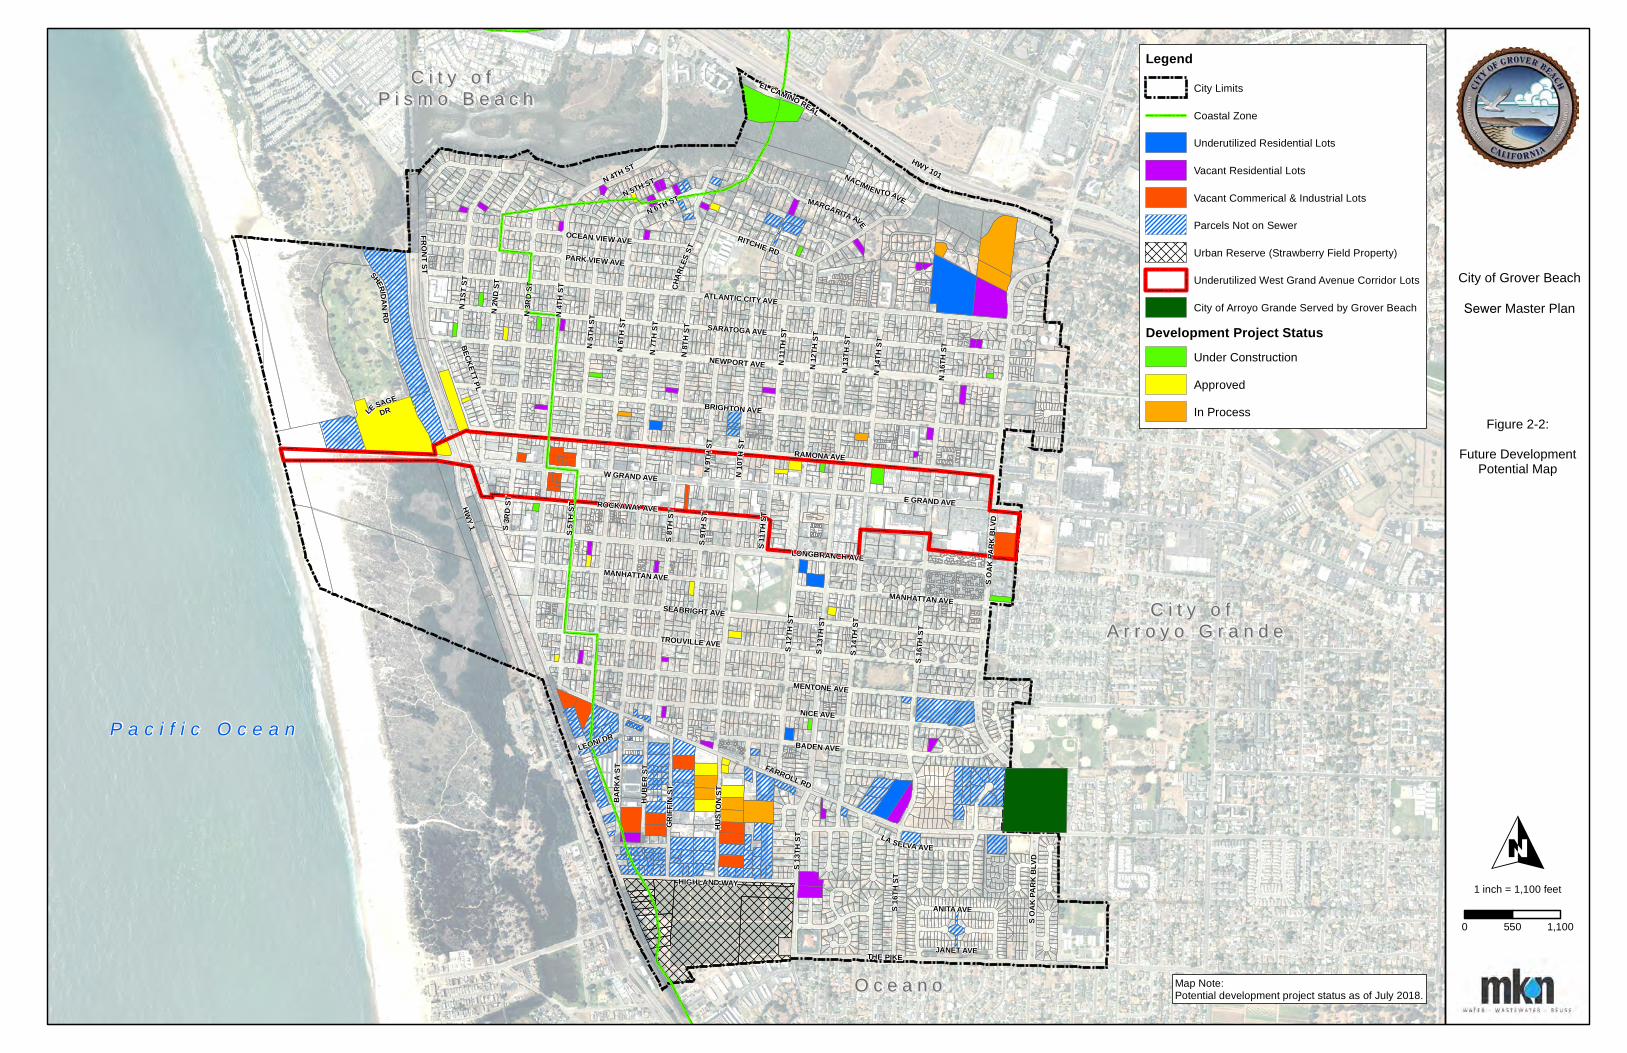
Figure 2‐2 shows the location of the potential residential and commercial development associated with vacant properties, underutilized residential properties, pending development projects, underutilized West Grand Avenue Corridor lots, and the Urban Reserve Area.

THIS PAGE LEFT INTENTIONALLY BLANK
P a c i f i c O c e a n
C i t y o f C i t y o f A r r o y o G r a n d eA r r o y o G r a n d e
C i t y o f C i t y o f P i s m o B e a c hP i s m o B e a c h
O c e a n oO c e a n o
S OAK
PARK
BLV
D
HWY 101
MENTONE AVE
NACIMIENTOAVEN 5TH ST
FARROLL RD
TROUVILLE AVE
BARK
A ST
N 4TH ST
N 5T
H ST
N 6TH ST
N 2N
D ST
N 3R
D ST
N 1S
T ST
HIGHLAND WAY
CHAR
LES S
T
LA SELVA AVE
ATLANTIC CITY AVE
E GRAND AVE
FRONTST
S 13T
H ST
RITCHIE RD
N16
THST
S OAK
PARK
BLV
D
N 13
TH S
T
N 11
TH ST
S 14T
H ST
N 8T
H ST
W GRAND AVE N 10
TH S
T
S 12T
H ST
ROCKAWAY AVE
S 9TH
ST
PARK VIEW AVE
N 6T
H ST
N 4T
H ST
S 8TH
ST
MANHATTAN AVE
MANHATTAN AVE
SARATOGA AVE
SEABRIGHT AVE
N 7T
H ST
BADEN AVE
LONGBRANCH AVE
OCEAN VIEW AVE
N 9T
H ST
N 12
TH S
T
S3R
DST
GRIFF
IN ST
S 11T
H ST
S 5TH
ST
THE PIKE
S 16T
H ST
LE SAGEDR
N 14
TH S
T
LEONI DR
BECKETT PL
NICE AVE
BRIGHTON AVE
RAMONA AVE
NEWPORT AVE
ANITA AVE
JANET AVE
HUBE
R ST
S 16T
H ST
HUST
ON ST
HWY 1
SHERIDANRD
MARGARITA AVE
EL CAMINO REAL
S 13T
H ST O
LegendCity Limits
Coastal Zone
Underutilized Residential Lots
Vacant Residential Lots
Vacant Commerical & Industrial Lots
Parcels Not on Sewer
Urban Reserve (Strawberry Field Property)
Underutilized West Grand Avenue Corridor Lots
City of Arroyo Grande Served by Grover Beach
Development Project StatusUnder Construction
Approved
In ProcessFigure 2-2:
Future DevelopmentPotential Map
City of Grover Beach
Sewer Master Plan
Map Note: Potential development project status as of July 2018.
1 inch = 1,100 feet
0 1,100550

THIS PAGE LEFT INTENTIONALLY BLANK
City of Grover Beach Sewer Master Plan November 2019
Page | 2‐11
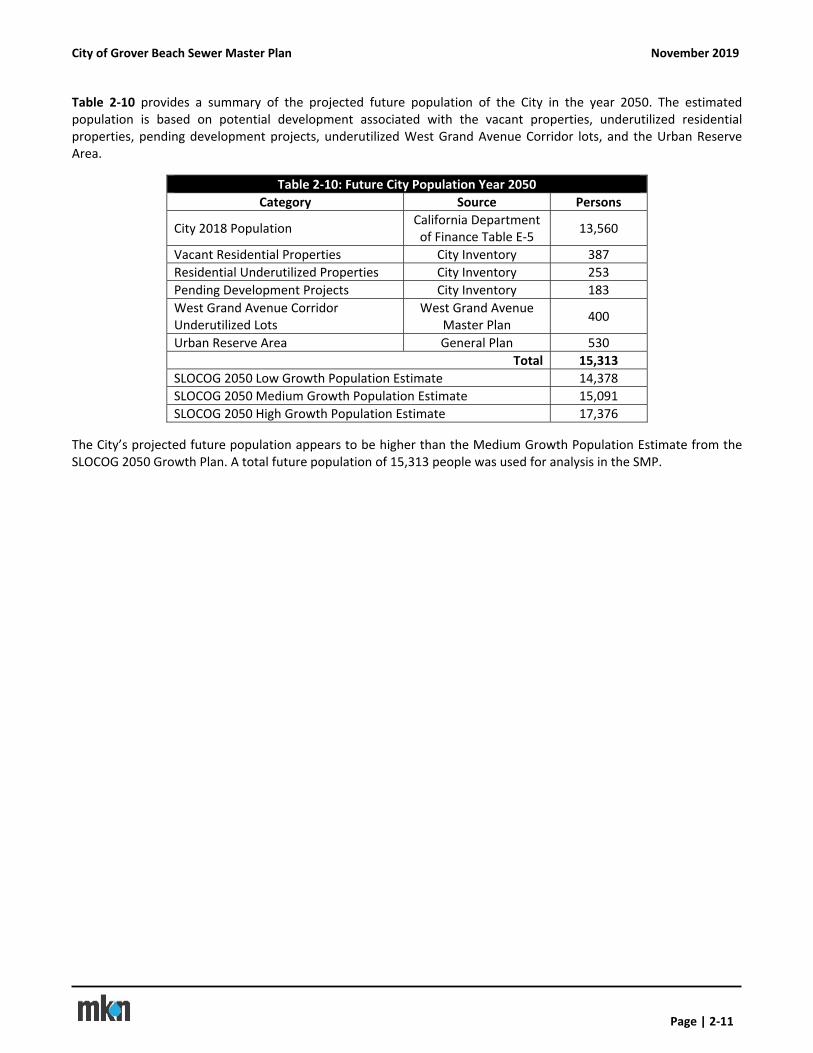
Table 2‐10 provides a summary of the projected future population of the City in the year 2050. The estimated population is based on potential development associated with the vacant properties, underutilized residential properties, pending development projects, underutilized West Grand Avenue Corridor lots, and the Urban Reserve Area.
Table 2‐10: Future City Population Year 2050
Category Source Persons
City 2018 Population California Department of Finance Table E‐5
13,560
Vacant Residential Properties City Inventory 387
Residential Underutilized Properties City Inventory 253
Pending Development Projects City Inventory 183
West Grand Avenue Corridor Underutilized Lots
West Grand Avenue Master Plan
400
Urban Reserve Area General Plan 530
Total 15,313
SLOCOG 2050 Low Growth Population Estimate 14,378
SLOCOG 2050 Medium Growth Population Estimate 15,091
SLOCOG 2050 High Growth Population Estimate 17,376
The City’s projected future population appears to be higher than the Medium Growth Population Estimate from the SLOCOG 2050 Growth Plan. A total future population of 15,313 people was used for analysis in the SMP.

THIS PAGE LEFT INTENTIONALLY BLANK
City of Grover Beach Sewer Master Plan November 2019
Page | 3‐1
SECTION 3 EXISTING AND PROJECTED SEWER FLOWS
This section provides an overview of the flow monitoring study completed for the SMP, summarizes the existing flow conditions and the estimated future sewer flows for the City.
3.1 Wastewater Treatment Plant Flow
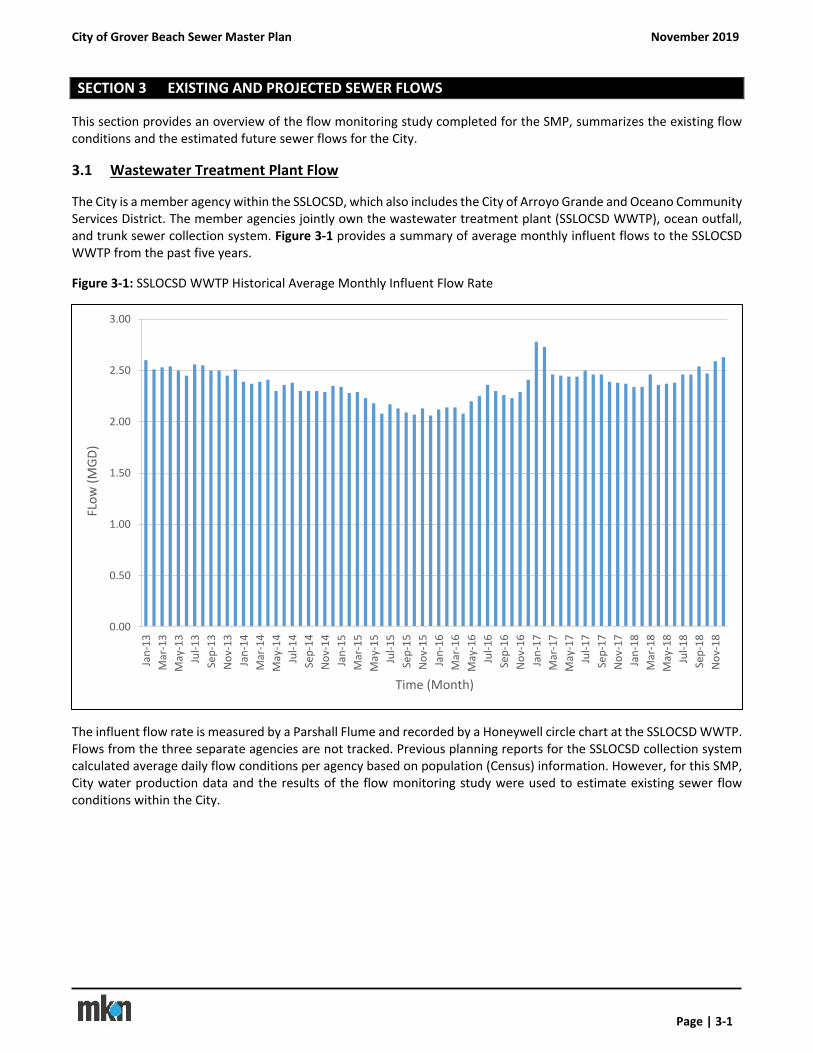
The City is a member agency within the SSLOCSD, which also includes the City of Arroyo Grande and Oceano Community Services District. The member agencies jointly own the wastewater treatment plant (SSLOCSD WWTP), ocean outfall, and trunk sewer collection system. Figure 3‐1 provides a summary of average monthly influent flows to the SSLOCSD WWTP from the past five years.
Figure 3‐1: SSLOCSD WWTP Historical Average Monthly Influent Flow Rate
The influent flow rate is measured by a Parshall Flume and recorded by a Honeywell circle chart at the SSLOCSD WWTP. Flows from the three separate agencies are not tracked. Previous planning reports for the SSLOCSD collection system calculated average daily flow conditions per agency based on population (Census) information. However, for this SMP, City water production data and the results of the flow monitoring study were used to estimate existing sewer flow conditions within the City.
0.00
0.50
1.00
1.50
2.00
2.50
3.00
Jan‐13
Mar‐13
May‐13
Jul‐13
Sep‐13
Nov‐13
Jan‐14
Mar‐14
May‐14
Jul‐14
Sep‐14
Nov‐14
Jan‐15
Mar‐15
May‐15
Jul‐15
Sep‐15
Nov‐15
Jan‐16
Mar‐16
May‐16
Jul‐16
Sep‐16
Nov‐16
Jan‐17
Mar‐17
May‐17
Jul‐17
Sep‐17
Nov‐17
Jan‐18
Mar‐18
May‐18
Jul‐18
Sep‐18
Nov‐18
FLow (MGD)
Time (Month)
City of Grover Beach Sewer Master Plan November 2019
Page | 3‐2
3.2 Flow Monitoring Study
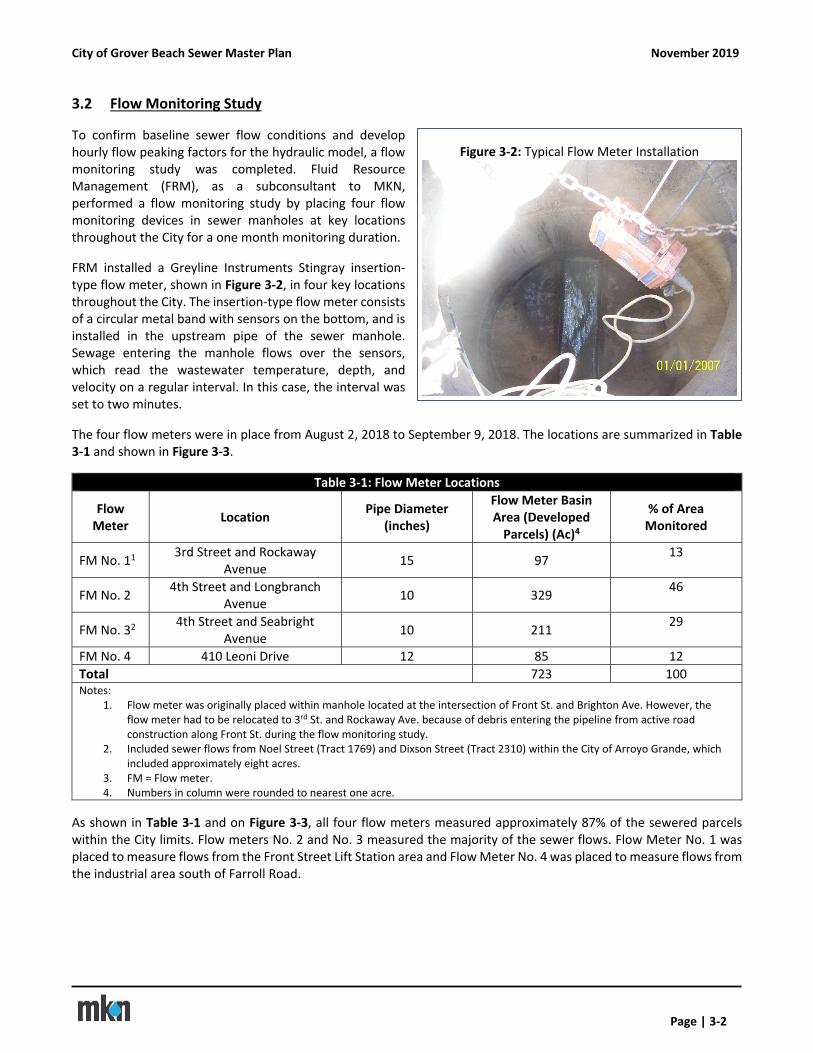
To confirm baseline sewer flow conditions and develop hourly flow peaking factors for the hydraulic model, a flow monitoring study was completed. Fluid Resource Management (FRM), as a subconsultant to MKN, performed a flow monitoring study by placing four flow monitoring devices in sewer manholes at key locations throughout the City for a one month monitoring duration.
FRM installed a Greyline Instruments Stingray insertion‐type flow meter, shown in Figure 3‐2, in four key locations throughout the City. The insertion‐type flow meter consists of a circular metal band with sensors on the bottom, and is installed in the upstream pipe of the sewer manhole. Sewage entering the manhole flows over the sensors, which read the wastewater temperature, depth, and velocity on a regular interval. In this case, the interval was set to two minutes.
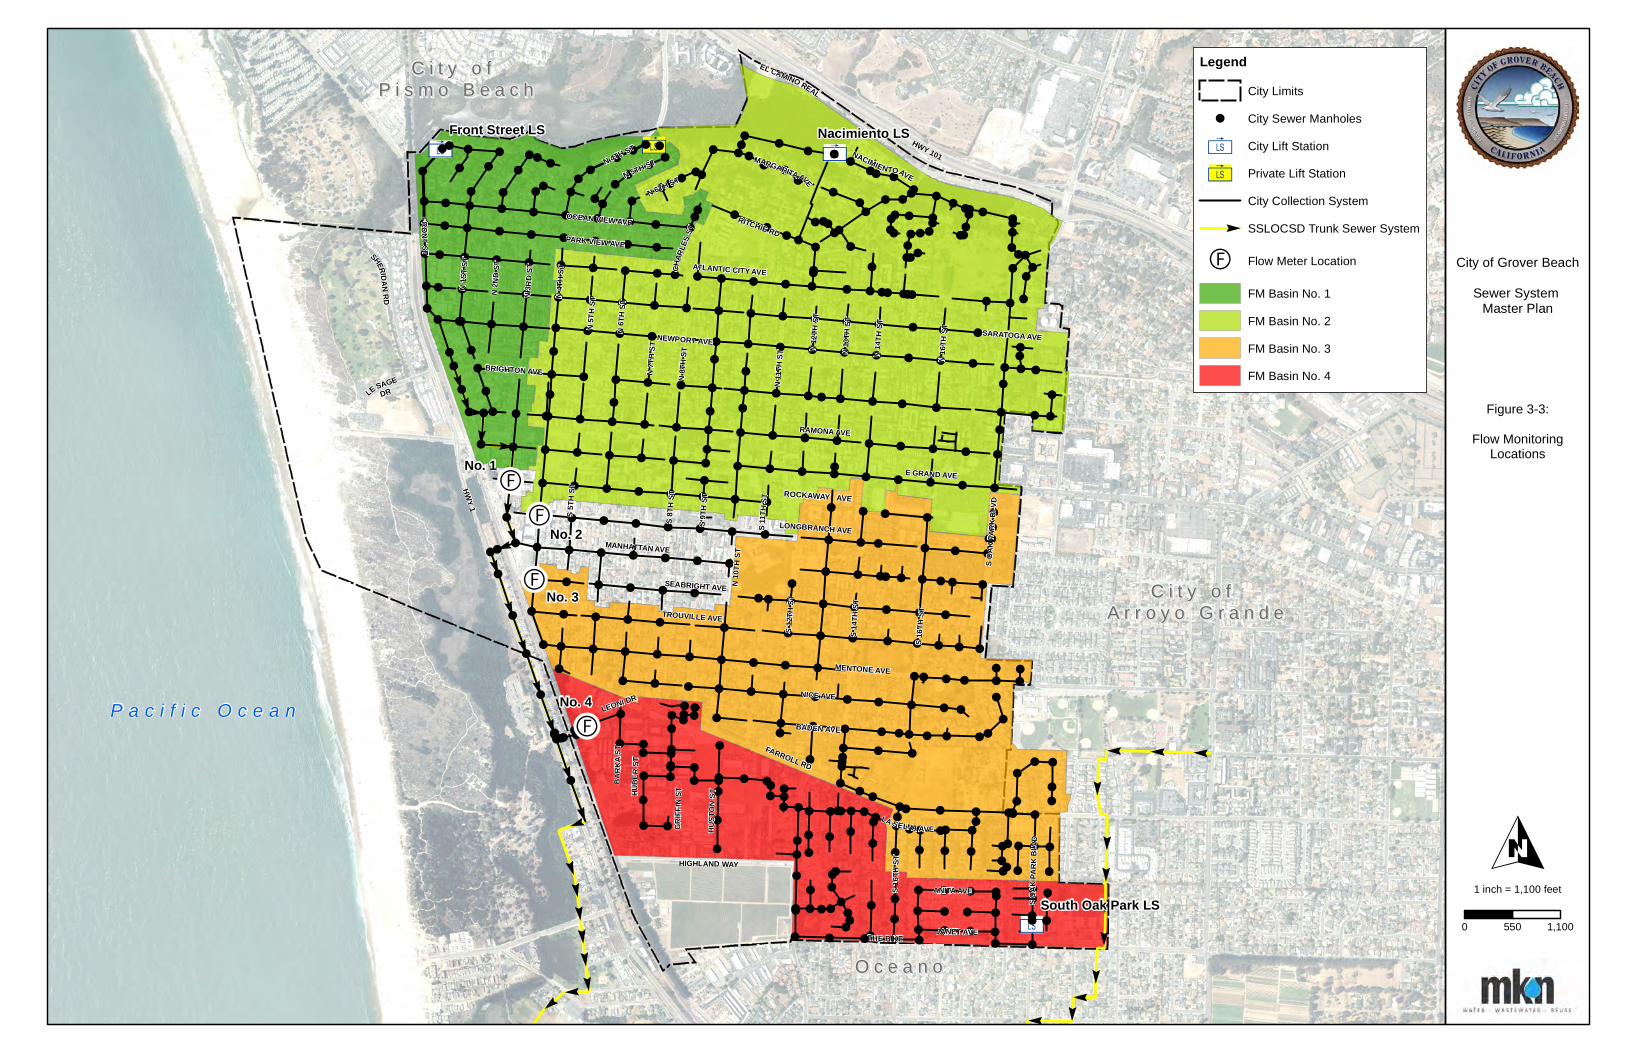
The four flow meters were in place from August 2, 2018 to September 9, 2018. The locations are summarized in Table 3‐1 and shown in Figure 3‐3.
Table 3‐1: Flow Meter Locations
Flow Meter
Location Pipe Diameter
(inches)
Flow Meter Basin Area (Developed Parcels) (Ac)4
% of Area Monitored
FM No. 11 3rd Street and Rockaway
Avenue 15 97
13
FM No. 2 4th Street and Longbranch
Avenue 10 329
46
FM No. 32 4th Street and Seabright
Avenue 10 211
29
FM No. 4 410 Leoni Drive 12 85 12
Total 723 100 Notes:
1. Flow meter was originally placed within manhole located at the intersection of Front St. and Brighton Ave. However, the flow meter had to be relocated to 3rd St. and Rockaway Ave. because of debris entering the pipeline from active road construction along Front St. during the flow monitoring study.
2. Included sewer flows from Noel Street (Tract 1769) and Dixson Street (Tract 2310) within the City of Arroyo Grande, which included approximately eight acres.
3. FM = Flow meter. 4. Numbers in column were rounded to nearest one acre.
As shown in Table 3‐1 and on Figure 3‐3, all four flow meters measured approximately 87% of the sewered parcels within the City limits. Flow meters No. 2 and No. 3 measured the majority of the sewer flows. Flow Meter No. 1 was placed to measure flows from the Front Street Lift Station area and Flow Meter No. 4 was placed to measure flows from the industrial area south of Farroll Road.
Figure 3‐2: Typical Flow Meter Installation
%%
%
%
%
%
%
%
%
%%
%%
%
%%
%%
%
%%
%%%%
%%
%%
%%%
%
%%%
%
%
%
%%%
%%
%%
%
%
%
%
%
%%%
%
%
%
%
%%
%
%
%
%
%
%
%
%%
%
%
%
%
%
%%%
%%
%%
%%
%%
%%
%%
%
%
%
%
%
%
%
%
%%
%
%
%
%
%
%%%
%
%
%%
%
%
%
%
%
3ä 3ä
3ä
3ä
!
!
!
!
!
! !
!
!
!
!
!
!
!!
!
!
!
!
!
!
!
!
!
!
!
!
!!!
!
!
!
!
!
! !!
!!
!
!
!!
!
!
!!!
!
!!
!
!!
!
!!
!
!
!
!
!!!!!!
!
!
! !
!
!
!!
! !!!!
!
!!
! !
!
!
!!
!
!
!!
!
!
!
!
!
!!
!
!
!
!
!
!
!
!
! !
!
!!
!
!!
!!!
!
!
!
!
!
!
!
!
!
!
!
!
!
!
!
!
!
!!
!!
!! !
!
!
! !
!
! ! !
! !
!
!!
!
!
!! !!!
!!!
!!!!!
!!!!!!
!
!!
!!! !
! ! ! !
!
!
! !
! !
!
!
!!
!!!
!!
!
!!!
! !
! ! ! !
!
!!
! !!!
!!!
!!!!!!!
! ! ! ! !! ! ! ! !
!
! ! !
!
!!!!
! ! ! ! ! ! ! ! ! !
!!!!!!
!
! ! ! !
! !
!
!
!
!
!!!
! !! !
!!!!
!
!
!
!
!
!
!
!
!
! !
! !
!!
!
!
!
!
!
!
!
!!
!
!!
!
!
!
!
!
!
!
!!
!
!!
!!!
! !!! !
!
!
!
!
!
!
!!
!
!
!
!
!
!
!
!
!
!
!
!!
!!
!
!
!
!
!!
!
!
! !
!!
!
!!
!!
!
!
!
!
! !
!
!
!
!
!
!
!
!!
!! !
!
!
!
!!
!
!!!
!
!
!
!! !
!
!
!
!
!
!
!!
!!!!!!!!
!
!
!
!
!!
!! ! ! ! ! !
!!!!!!!
!!!
!!
!
!!
!
!! ! ! ! ! ! ! ! !
!! !
!!!!
!!!
!!!
!!
!
! ! !
!!!
! ! ! ! ! !!
!
! ! ! !
! ! !
!
!
!
!
!
! !
!
!!!!
!!!
!
! ! ! !
!
!!
!!!!!
!
!!
!
!
!
!
!
!
!
!
!
!! !
!E!E
!E
!EP a c i f i c O c e a n
C i t y o f C i t y o f A r r o y o G r a n d eA r r o y o G r a n d e
C i t y o f C i t y o f P i s m o B e a c hP i s m o B e a c h
O c e a n oO c e a n o
ROCKAWAY AVE
No. 1
No. 4
No. 3
No. 2
S OAK
PARK
BLV
D
HWY 101
MENTONE AVE
NACIMIENTOAVEN 5TH ST
FARROLL RD
TROUVILLE AVEBA
RKA
ST
N 4TH ST
N 5T
H ST
N 6TH ST
N 2N
D ST
N 3R
D ST
N 1S
T ST
HIGHLAND WAY
CHAR
LES S
T
LA SELVA AVE
ATLANTIC CITY AVE
E GRAND AVE
FRONTST
RITCHIE RD
N16
THST
S OAK
PARK
BLV
D
N 13
TH S
T
N 11
TH ST
S 14T
H ST
N 8T
H ST
N 10
TH S
T
S 12T
H ST
S 9TH
ST
PARK VIEW AVE
N 6T
H ST
N 4T
H ST
S 8TH
ST
MANHATTAN AVE
SARATOGA AVE
SEABRIGHT AVE
N 7T
H ST
BADEN AVE
LONGBRANCH AVE
OCEAN VIEW AVE
N 12
TH S
T
GRIFF
IN ST
S 11T
H ST
S 5TH
ST
THE PIKE
S 16T
H ST
LE SAGEDR
N 14
TH S
T
LEONI DR NICE AVE
BRIGHTON AVE
RAMONA AVE
NEWPORT AVE
ANITA AVE
JANET AVE
HUBE
R ST
S 16T
H ST
HUST
ON ST
HWY 1
SHERIDANRD
MARGARITA AVE
EL CAMINO REAL
Nacimiento LSFront Street LS
South Oak Park LS
O
LegendCity Limits
! City Sewer Manholes
3ä City Lift Station
3ä Private Lift Station
City Collection System
% SSLOCSD Trunk Sewer System
!E Flow Meter Location
FM Basin No. 1
FM Basin No. 2
FM Basin No. 3
FM Basin No. 4
Figure 3-3:
Flow MonitoringLocations
City of Grover Beach
Sewer System Master Plan
1 inch = 1,100 feet
0 1,100550

THIS PAGE LEFT INTENTIONALLY BLANK
City of Grover Beach Sewer Master Plan November 2019
Page | 3‐4
3.2.1 Flow Monitoring Results
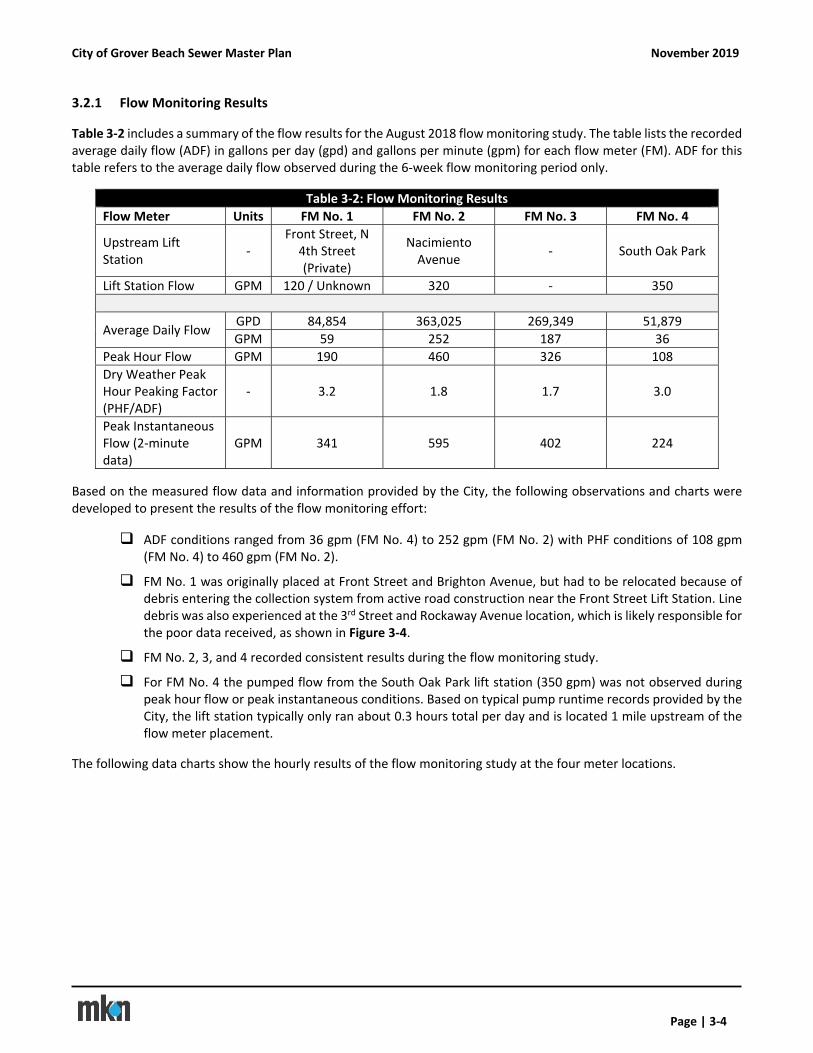
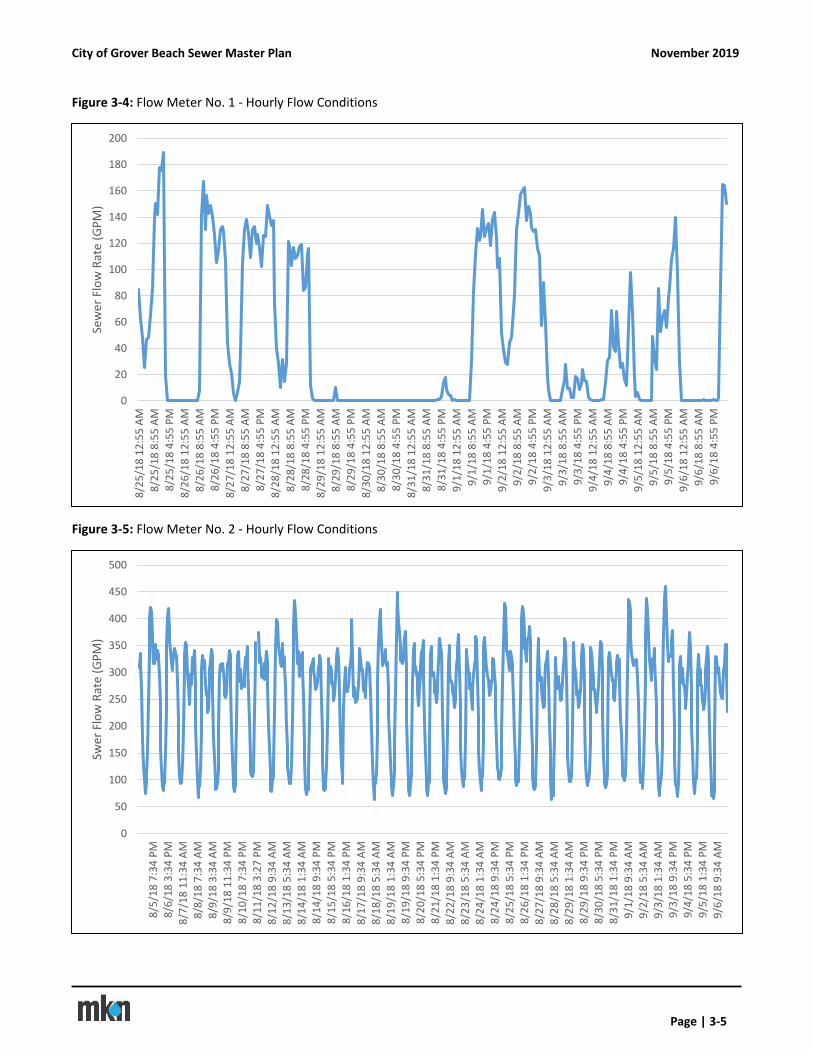
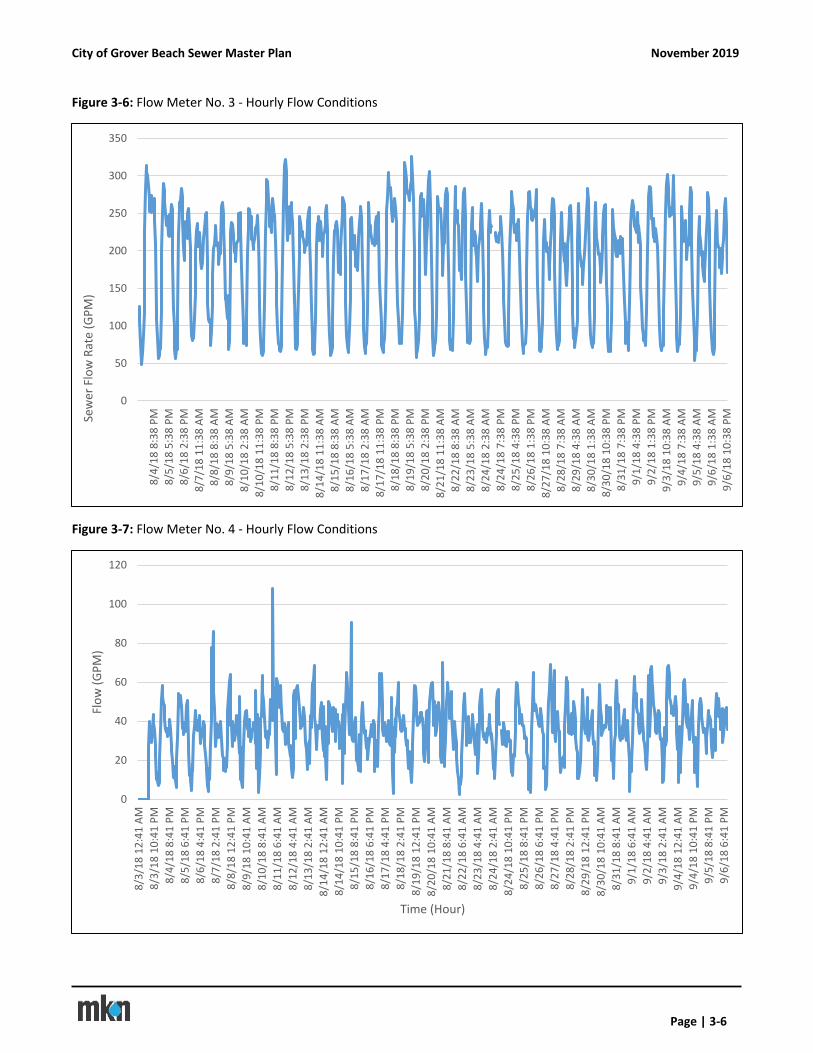
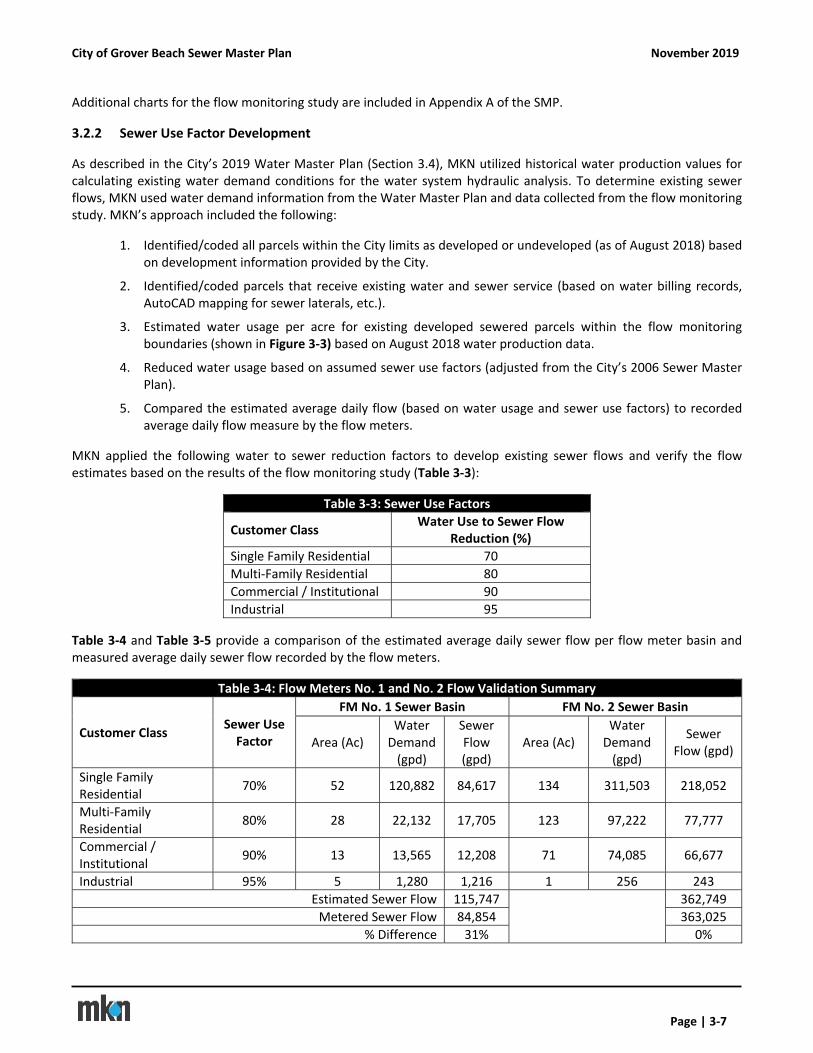
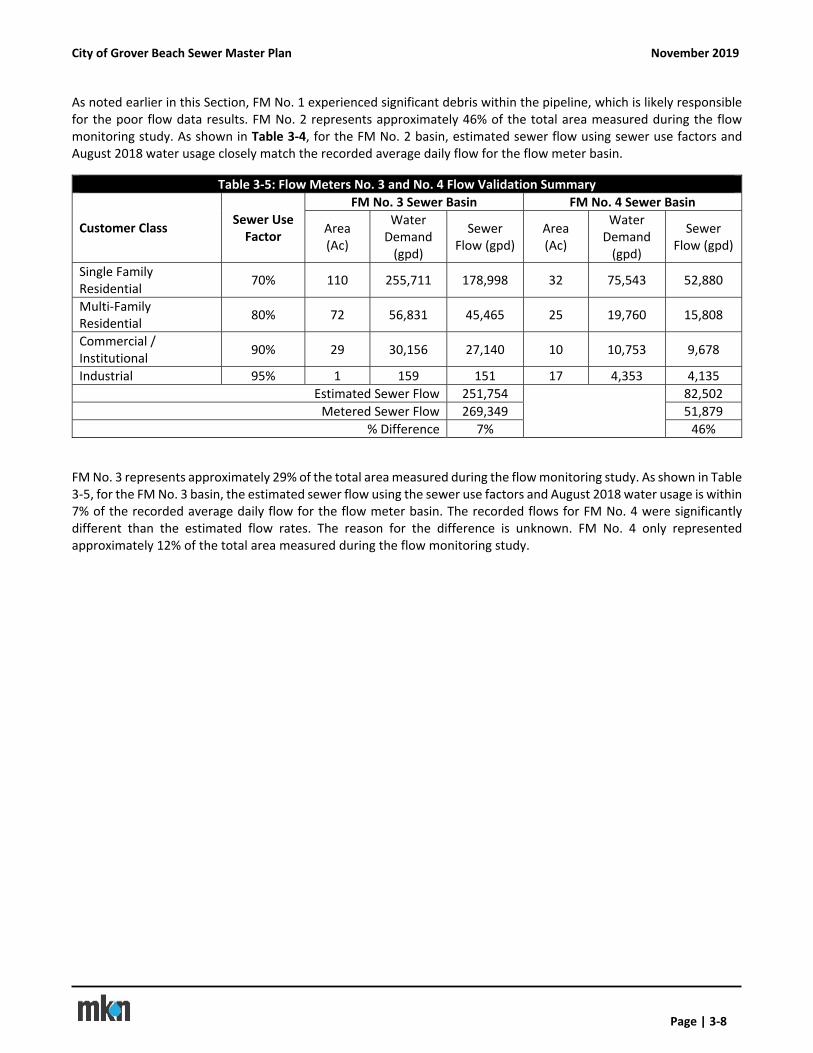
Table 3‐2 includes a summary of the flow results for the August 2018 flow monitoring study. The table lists the recorded average daily flow (ADF) in gallons per day (gpd) and gallons per minute (gpm) for each flow meter (FM). ADF for this table refers to the average daily flow observed during the 6‐week flow monitoring period only.
Table 3‐2: Flow Monitoring Results
Flow Meter Units FM No. 1 FM No. 2 FM No. 3 FM No. 4
Upstream Lift Station
‐ Front Street, N 4th Street (Private)
Nacimiento Avenue
‐ South Oak Park
Lift Station Flow GPM 120 / Unknown 320 ‐ 350
Average Daily Flow GPD 84,854 363,025 269,349 51,879
GPM 59 252 187 36
Peak Hour Flow GPM 190 460 326 108
Dry Weather Peak Hour Peaking Factor (PHF/ADF)
‐ 3.2 1.8 1.7 3.0
Peak Instantaneous Flow (2‐minute data)
GPM 341 595 402 224
Based on the measured flow data and information provided by the City, the following observations and charts were developed to present the results of the flow monitoring effort:
ADF conditions ranged from 36 gpm (FM No. 4) to 252 gpm (FM No. 2) with PHF conditions of 108 gpm (FM No. 4) to 460 gpm (FM No. 2).
FM No. 1 was originally placed at Front Street and Brighton Avenue, but had to be relocated because of debris entering the collection system from active road construction near the Front Street Lift Station. Line debris was also experienced at the 3rd Street and Rockaway Avenue location, which is likely responsible for the poor data received, as shown in Figure 3‐4.
FM No. 2, 3, and 4 recorded consistent results during the flow monitoring study.
For FM No. 4 the pumped flow from the South Oak Park lift station (350 gpm) was not observed during peak hour flow or peak instantaneous conditions. Based on typical pump runtime records provided by the City, the lift station typically only ran about 0.3 hours total per day and is located 1 mile upstream of the flow meter placement.
The following data charts show the hourly results of the flow monitoring study at the four meter locations.
City of Grover Beach Sewer Master Plan November 2019
Page | 3‐5
Figure 3‐4: Flow Meter No. 1 ‐ Hourly Flow Conditions
Figure 3‐5: Flow Meter No. 2 ‐ Hourly Flow Conditions
0
20
40
60
80
100
120
140
160
180
2008/25/18 12:55 AM
8/25/18 8:55 AM
8/25/18 4:55 PM
8/26/18 12:55 AM
8/26/18 8:55 AM
8/26/18 4:55 PM
8/27/18 12:55 AM
8/27/18 8:55 AM
8/27/18 4:55 PM
8/28/18 12:55 AM
8/28/18 8:55 AM
8/28/18 4:55 PM
8/29/18 12:55 AM
8/29/18 8:55 AM
8/29/18 4:55 PM
8/30/18 12:55 AM
8/30/18 8:55 AM
8/30/18 4:55 PM
8/31/18 12:55 AM
8/31/18 8:55 AM
8/31/18 4:55 PM
9/1/18 12:55 AM
9/1/18 8:55 AM
9/1/18 4:55 PM
9/2/18 12:55 AM
9/2/18 8:55 AM
9/2/18 4:55 PM
9/3/18 12:55 AM
9/3/18 8:55 AM
9/3/18 4:55 PM
9/4/18 12:55 AM
9/4/18 8:55 AM
9/4/18 4:55 PM
9/5/18 12:55 AM
9/5/18 8:55 AM
9/5/18 4:55 PM
9/6/18 12:55 AM
9/6/18 8:55 AM
9/6/18 4:55 PM
Sewer Flow Rate (GPM)
0
50
100
150
200
250
300
350
400
450
500
8/5/18 7:34 PM
8/6/18 3:34 PM
8/7/18 11:34 AM
8/8/18 7:34 AM
8/9/18 3:34 AM
8/9/18 11:34 PM
8/10/18 7:34 PM
8/11/18 3:27 PM
8/12/18 9:34 AM
8/13/18 5:34 AM
8/14/18 1:34 AM
8/14/18 9:34 PM
8/15/18 5:34 PM
8/16/18 1:34 PM
8/17/18 9:34 AM
8/18/18 5:34 AM
8/19/18 1:34 AM
8/19/18 9:34 PM
8/20/18 5:34 PM
8/21/18 1:34 PM
8/22/18 9:34 AM
8/23/18 5:34 AM
8/24/18 1:34 AM
8/24/18 9:34 PM
8/25/18 5:34 PM
8/26/18 1:34 PM
8/27/18 9:34 AM
8/28/18 5:34 AM
8/29/18 1:34 AM
8/29/18 9:34 PM
8/30/18 5:34 PM
8/31/18 1:34 PM
9/1/18 9:34 AM
9/2/18 5:34 AM
9/3/18 1:34 AM
9/3/18 9:34 PM
9/4/18 5:34 PM
9/5/18 1:34 PM
9/6/18 9:34 AM
Swer Flow Rate (GPM)
City of Grover Beach Sewer Master Plan November 2019
Page | 3‐6
Figure 3‐6: Flow Meter No. 3 ‐ Hourly Flow Conditions
Figure 3‐7: Flow Meter No. 4 ‐ Hourly Flow Conditions
0
50
100
150
200
250
300
350
8/4/18 8:38 PM
8/5/18 5:38 PM
8/6/18 2:38 PM
8/7/18 11:38 AM
8/8/18 8:38 AM
8/9/18 5:38 AM
8/10/18 2:38 AM
8/10/18 11:38 PM
8/11/18 8:38 PM
8/12/18 5:38 PM
8/13/18 2:38 PM
8/14/18 11:38 AM
8/15/18 8:38 AM
8/16/18 5:38 AM
8/17/18 2:38 AM
8/17/18 11:38 PM
8/18/18 8:38 PM
8/19/18 5:38 PM
8/20/18 2:38 PM
8/21/18 11:38 AM
8/22/18 8:38 AM
8/23/18 5:38 AM
8/24/18 2:38 AM
8/24/18 7:38 PM
8/25/18 4:38 PM
8/26/18 1:38 PM
8/27/18 10:38 AM
8/28/18 7:38 AM
8/29/18 4:38 AM
8/30/18 1:38 AM
8/30/18 10:38 PM
8/31/18 7:38 PM
9/1/18 4:38 PM
9/2/18 1:38 PM
9/3/18 10:38 AM
9/4/18 7:38 AM
9/5/18 4:38 AM
9/6/18 1:38 AM
9/6/18 10:38 PMSewer Flow Rate (GPM)
0
20
40
60
80
100
120
8/3/18 12:41 AM
8/3/18 10:41 PM
8/4/18 8:41 PM
8/5/18 6:41 PM
8/6/18 4:41 PM
8/7/18 2:41 PM
8/8/18 12:41 PM
8/9/18 10:41 AM
8/10/18 8:41 AM
8/11/18 6:41 AM
8/12/18 4:41 AM
8/13/18 2:41 AM
8/14/18 12:41 AM
8/14/18 10:41 PM
8/15/18 8:41 PM
8/16/18 6:41 PM
8/17/18 4:41 PM
8/18/18 2:41 PM
8/19/18 12:41 PM
8/20/18 10:41 AM
8/21/18 8:41 AM
8/22/18 6:41 AM
8/23/18 4:41 AM
8/24/18 2:41 AM
8/24/18 10:41 PM
8/25/18 8:41 PM
8/26/18 6:41 PM
8/27/18 4:41 PM
8/28/18 2:41 PM
8/29/18 12:41 PM
8/30/18 10:41 AM
8/31/18 8:41 AM
9/1/18 6:41 AM
9/2/18 4:41 AM
9/3/18 2:41 AM
9/4/18 12:41 AM
9/4/18 10:41 PM
9/5/18 8:41 PM
9/6/18 6:41 PM
Flow (GPM)
Time (Hour)
City of Grover Beach Sewer Master Plan November 2019
Page | 3‐7
Additional charts for the flow monitoring study are included in Appendix A of the SMP.
3.2.2 Sewer Use Factor Development
As described in the City’s 2019 Water Master Plan (Section 3.4), MKN utilized historical water production values for calculating existing water demand conditions for the water system hydraulic analysis. To determine existing sewer flows, MKN used water demand information from the Water Master Plan and data collected from the flow monitoring study. MKN’s approach included the following:
1. Identified/coded all parcels within the City limits as developed or undeveloped (as of August 2018) based on development information provided by the City.
2. Identified/coded parcels that receive existing water and sewer service (based on water billing records, AutoCAD mapping for sewer laterals, etc.).
3. Estimated water usage per acre for existing developed sewered parcels within the flow monitoring boundaries (shown in Figure 3‐3) based on August 2018 water production data.
4. Reduced water usage based on assumed sewer use factors (adjusted from the City’s 2006 Sewer Master Plan).
5. Compared the estimated average daily flow (based on water usage and sewer use factors) to recorded average daily flow measure by the flow meters.
MKN applied the following water to sewer reduction factors to develop existing sewer flows and verify the flow estimates based on the results of the flow monitoring study (Table 3‐3):
Table 3‐3: Sewer Use Factors
Customer Class Water Use to Sewer Flow
Reduction (%)
Single Family Residential 70
Multi‐Family Residential 80
Commercial / Institutional 90
Industrial 95
Table 3‐4 and Table 3‐5 provide a comparison of the estimated average daily sewer flow per flow meter basin and measured average daily sewer flow recorded by the flow meters.
Table 3‐4: Flow Meters No. 1 and No. 2 Flow Validation Summary
Customer Class Sewer Use Factor
FM No. 1 Sewer Basin FM No. 2 Sewer Basin
Area (Ac) Water Demand (gpd)
Sewer Flow (gpd)
Area (Ac) Water Demand (gpd)
Sewer Flow (gpd)
Single Family Residential
70% 52 120,882 84,617 134 311,503 218,052
Multi‐Family Residential
80% 28 22,132 17,705 123 97,222 77,777
Commercial / Institutional
90% 13 13,565 12,208 71 74,085 66,677
Industrial 95% 5 1,280 1,216 1 256 243
Estimated Sewer Flow 115,747
362,749
Metered Sewer Flow 84,854 363,025
% Difference 31% 0%
City of Grover Beach Sewer Master Plan November 2019
Page | 3‐8
As noted earlier in this Section, FM No. 1 experienced significant debris within the pipeline, which is likely responsible for the poor flow data results. FM No. 2 represents approximately 46% of the total area measured during the flow monitoring study. As shown in Table 3‐4, for the FM No. 2 basin, estimated sewer flow using sewer use factors and August 2018 water usage closely match the recorded average daily flow for the flow meter basin.
Table 3‐5: Flow Meters No. 3 and No. 4 Flow Validation Summary
Customer Class Sewer Use Factor
FM No. 3 Sewer Basin FM No. 4 Sewer Basin
Area (Ac)
Water Demand (gpd)
Sewer Flow (gpd)
Area (Ac)
Water Demand (gpd)
Sewer Flow (gpd)
Single Family Residential
70% 110 255,711 178,998 32 75,543 52,880
Multi‐Family Residential
80% 72 56,831 45,465 25 19,760 15,808
Commercial / Institutional
90% 29 30,156 27,140 10 10,753 9,678
Industrial 95% 1 159 151 17 4,353 4,135
Estimated Sewer Flow 251,754
82,502
Metered Sewer Flow 269,349 51,879
% Difference 7% 46%
FM No. 3 represents approximately 29% of the total area measured during the flow monitoring study. As shown in Table 3‐5, for the FM No. 3 basin, the estimated sewer flow using the sewer use factors and August 2018 water usage is within 7% of the recorded average daily flow for the flow meter basin. The recorded flows for FM No. 4 were significantly different than the estimated flow rates. The reason for the difference is unknown. FM No. 4 only represented approximately 12% of the total area measured during the flow monitoring study.
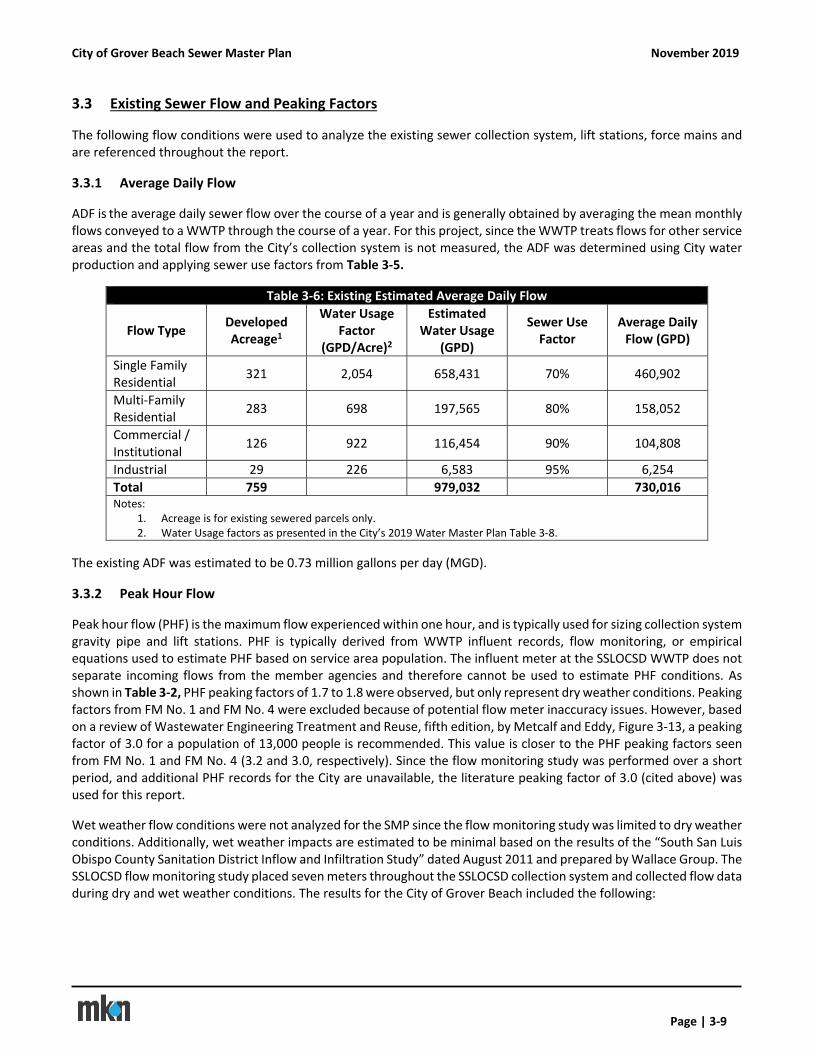
City of Grover Beach Sewer Master Plan November 2019
Page | 3‐9
3.3 Existing Sewer Flow and Peaking Factors
The following flow conditions were used to analyze the existing sewer collection system, lift stations, force mains and are referenced throughout the report.
3.3.1 Average Daily Flow
ADF is the average daily sewer flow over the course of a year and is generally obtained by averaging the mean monthly flows conveyed to a WWTP through the course of a year. For this project, since the WWTP treats flows for other service areas and the total flow from the City’s collection system is not measured, the ADF was determined using City water production and applying sewer use factors from Table 3‐5.
Table 3‐6: Existing Estimated Average Daily Flow
Flow Type Developed Acreage1
Water Usage Factor
(GPD/Acre)2
Estimated Water Usage
(GPD)
Sewer Use Factor
Average Daily Flow (GPD)
Single Family Residential
321 2,054 658,431 70% 460,902
Multi‐Family Residential
283 698 197,565 80% 158,052
Commercial / Institutional
126 922 116,454 90% 104,808
Industrial 29 226 6,583 95% 6,254
Total 759 979,032 730,016 Notes:
1. Acreage is for existing sewered parcels only. 2. Water Usage factors as presented in the City’s 2019 Water Master Plan Table 3‐8.
The existing ADF was estimated to be 0.73 million gallons per day (MGD).
3.3.2 Peak Hour Flow
Peak hour flow (PHF) is the maximum flow experienced within one hour, and is typically used for sizing collection system gravity pipe and lift stations. PHF is typically derived from WWTP influent records, flow monitoring, or empirical equations used to estimate PHF based on service area population. The influent meter at the SSLOCSD WWTP does not separate incoming flows from the member agencies and therefore cannot be used to estimate PHF conditions. As shown in Table 3‐2, PHF peaking factors of 1.7 to 1.8 were observed, but only represent dry weather conditions. Peaking factors from FM No. 1 and FM No. 4 were excluded because of potential flow meter inaccuracy issues. However, based on a review of Wastewater Engineering Treatment and Reuse, fifth edition, by Metcalf and Eddy, Figure 3‐13, a peaking factor of 3.0 for a population of 13,000 people is recommended. This value is closer to the PHF peaking factors seen from FM No. 1 and FM No. 4 (3.2 and 3.0, respectively). Since the flow monitoring study was performed over a short period, and additional PHF records for the City are unavailable, the literature peaking factor of 3.0 (cited above) was used for this report.
Wet weather flow conditions were not analyzed for the SMP since the flow monitoring study was limited to dry weather conditions. Additionally, wet weather impacts are estimated to be minimal based on the results of the “South San Luis Obispo County Sanitation District Inflow and Infiltration Study” dated August 2011 and prepared by Wallace Group. The SSLOCSD flow monitoring study placed seven meters throughout the SSLOCSD collection system and collected flow data during dry and wet weather conditions. The results for the City of Grover Beach included the following:
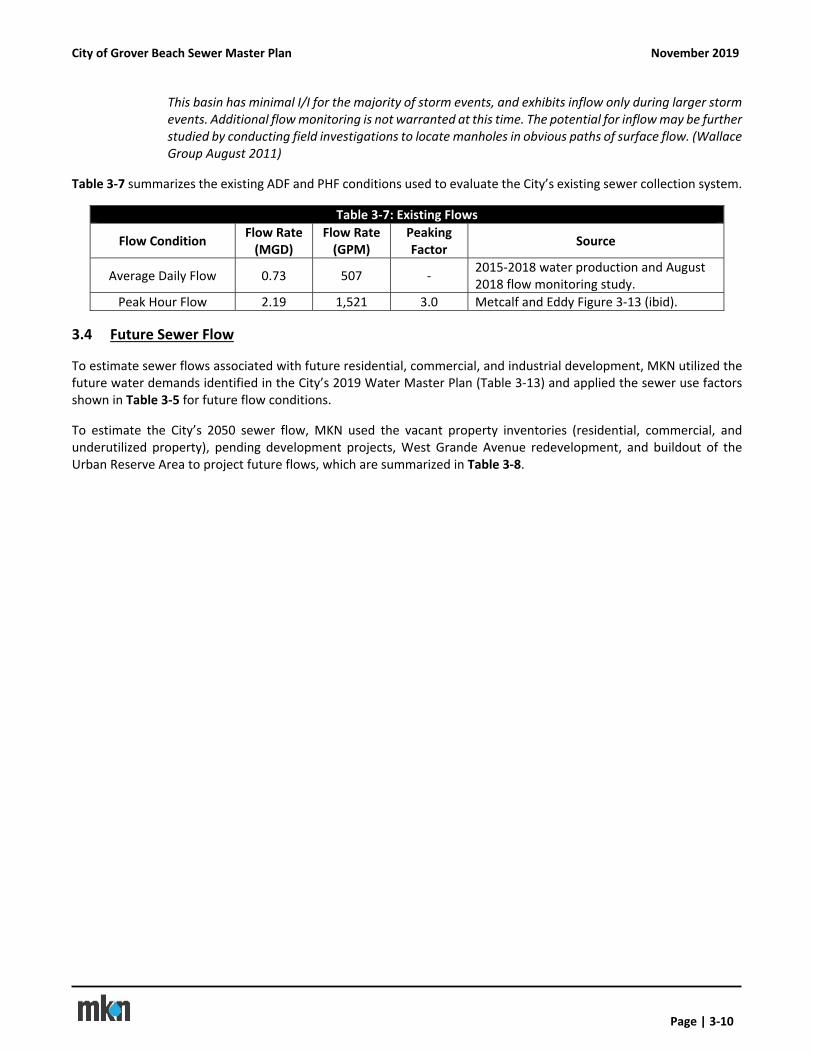
City of Grover Beach Sewer Master Plan November 2019
Page | 3‐10
This basin has minimal I/I for the majority of storm events, and exhibits inflow only during larger storm events. Additional flow monitoring is not warranted at this time. The potential for inflow may be further studied by conducting field investigations to locate manholes in obvious paths of surface flow. (Wallace Group August 2011)
Table 3‐7 summarizes the existing ADF and PHF conditions used to evaluate the City’s existing sewer collection system.
Table 3‐7: Existing Flows
Flow Condition Flow Rate (MGD)
Flow Rate (GPM)
Peaking Factor
Source
Average Daily Flow 0.73 507 ‐ 2015‐2018 water production and August 2018 flow monitoring study.
Peak Hour Flow 2.19 1,521 3.0 Metcalf and Eddy Figure 3‐13 (ibid).
3.4 Future Sewer Flow
To estimate sewer flows associated with future residential, commercial, and industrial development, MKN utilized the future water demands identified in the City’s 2019 Water Master Plan (Table 3‐13) and applied the sewer use factors shown in Table 3‐5 for future flow conditions.
To estimate the City’s 2050 sewer flow, MKN used the vacant property inventories (residential, commercial, and underutilized property), pending development projects, West Grande Avenue redevelopment, and buildout of the Urban Reserve Area to project future flows, which are summarized in Table 3‐8.
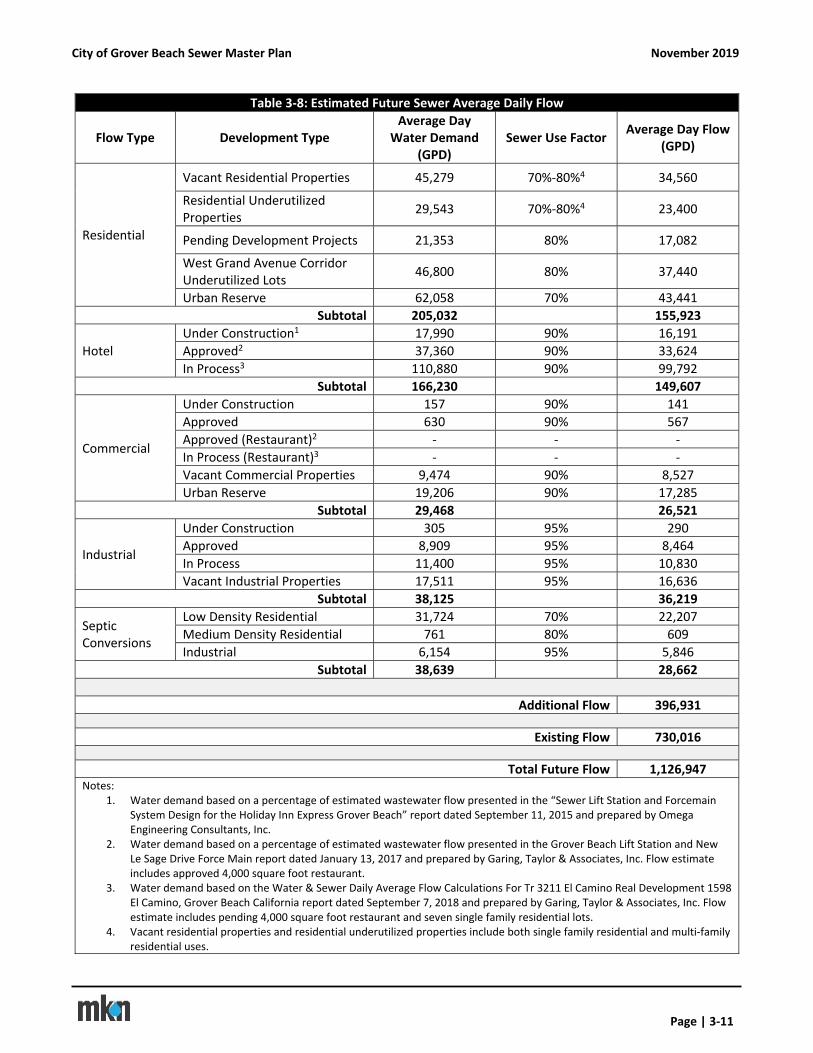
City of Grover Beach Sewer Master Plan November 2019
Page | 3‐11
Table 3‐8: Estimated Future Sewer Average Daily Flow
Flow Type Development Type Average Day
Water Demand (GPD)
Sewer Use Factor Average Day Flow
(GPD)
Residential
Vacant Residential Properties 45,279 70%‐80%4 34,560
Residential Underutilized Properties
29,543 70%‐80%4 23,400
Pending Development Projects 21,353 80% 17,082
West Grand Avenue Corridor Underutilized Lots
46,800 80% 37,440
Urban Reserve 62,058 70% 43,441
Subtotal 205,032 155,923
Hotel
Under Construction1 17,990 90% 16,191
Approved2 37,360 90% 33,624
In Process3 110,880 90% 99,792
Subtotal 166,230 149,607
Commercial
Under Construction 157 90% 141
Approved 630 90% 567
Approved (Restaurant)2 ‐ ‐ ‐
In Process (Restaurant)3 ‐ ‐ ‐
Vacant Commercial Properties 9,474 90% 8,527
Urban Reserve 19,206 90% 17,285
Subtotal 29,468 26,521
Industrial
Under Construction 305 95% 290
Approved 8,909 95% 8,464
In Process 11,400 95% 10,830
Vacant Industrial Properties 17,511 95% 16,636
Subtotal 38,125 36,219
Septic Conversions
Low Density Residential 31,724 70% 22,207
Medium Density Residential 761 80% 609
Industrial 6,154 95% 5,846
Subtotal 38,639 28,662
Additional Flow 396,931
Existing Flow 730,016
Total Future Flow 1,126,947 Notes:
1. Water demand based on a percentage of estimated wastewater flow presented in the “Sewer Lift Station and Forcemain System Design for the Holiday Inn Express Grover Beach” report dated September 11, 2015 and prepared by Omega Engineering Consultants, Inc.
2. Water demand based on a percentage of estimated wastewater flow presented in the Grover Beach Lift Station and New Le Sage Drive Force Main report dated January 13, 2017 and prepared by Garing, Taylor & Associates, Inc. Flow estimate includes approved 4,000 square foot restaurant.
3. Water demand based on the Water & Sewer Daily Average Flow Calculations For Tr 3211 El Camino Real Development 1598 El Camino, Grover Beach California report dated September 7, 2018 and prepared by Garing, Taylor & Associates, Inc. Flow estimate includes pending 4,000 square foot restaurant and seven single family residential lots.
4. Vacant residential properties and residential underutilized properties include both single family residential and multi‐family residential uses.
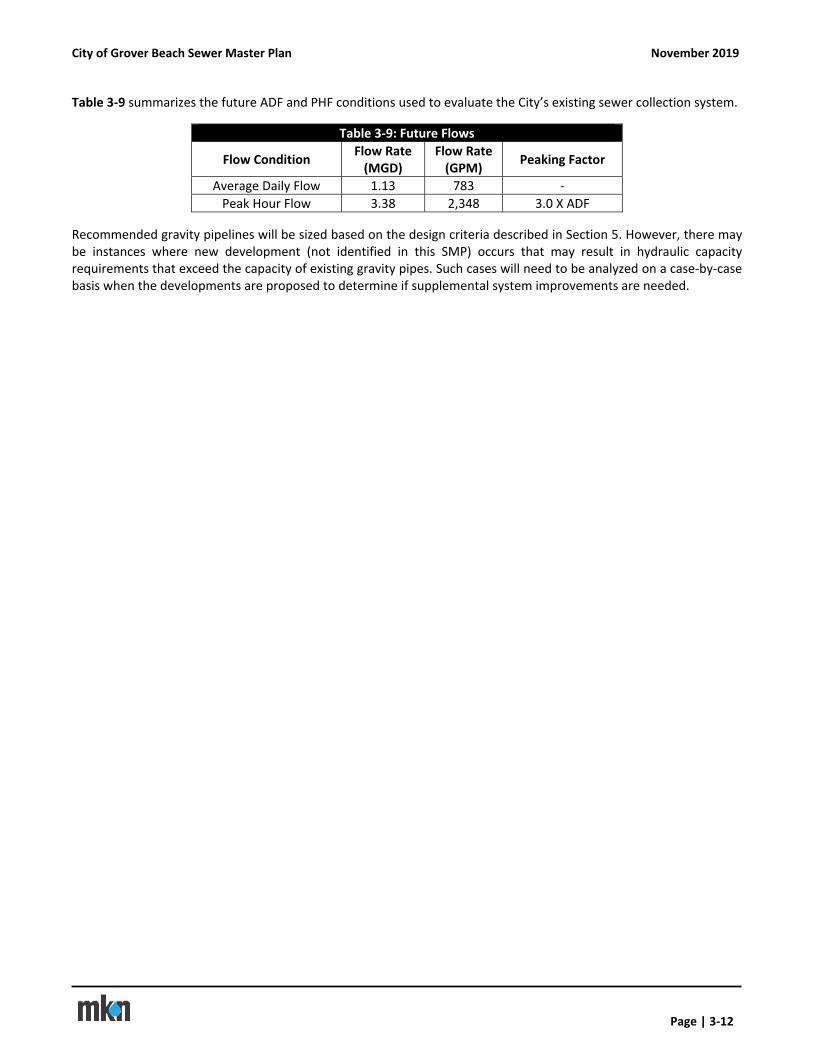
City of Grover Beach Sewer Master Plan November 2019
Page | 3‐12
Table 3‐9 summarizes the future ADF and PHF conditions used to evaluate the City’s existing sewer collection system.
Table 3‐9: Future Flows
Flow Condition Flow Rate (MGD)
Flow Rate (GPM)
Peaking Factor
Average Daily Flow 1.13 783 ‐
Peak Hour Flow 3.38 2,348 3.0 X ADF
Recommended gravity pipelines will be sized based on the design criteria described in Section 5. However, there may be instances where new development (not identified in this SMP) occurs that may result in hydraulic capacity requirements that exceed the capacity of existing gravity pipes. Such cases will need to be analyzed on a case‐by‐case basis when the developments are proposed to determine if supplemental system improvements are needed.

THIS PAGE LEFT INTENTIONALLY BLANK
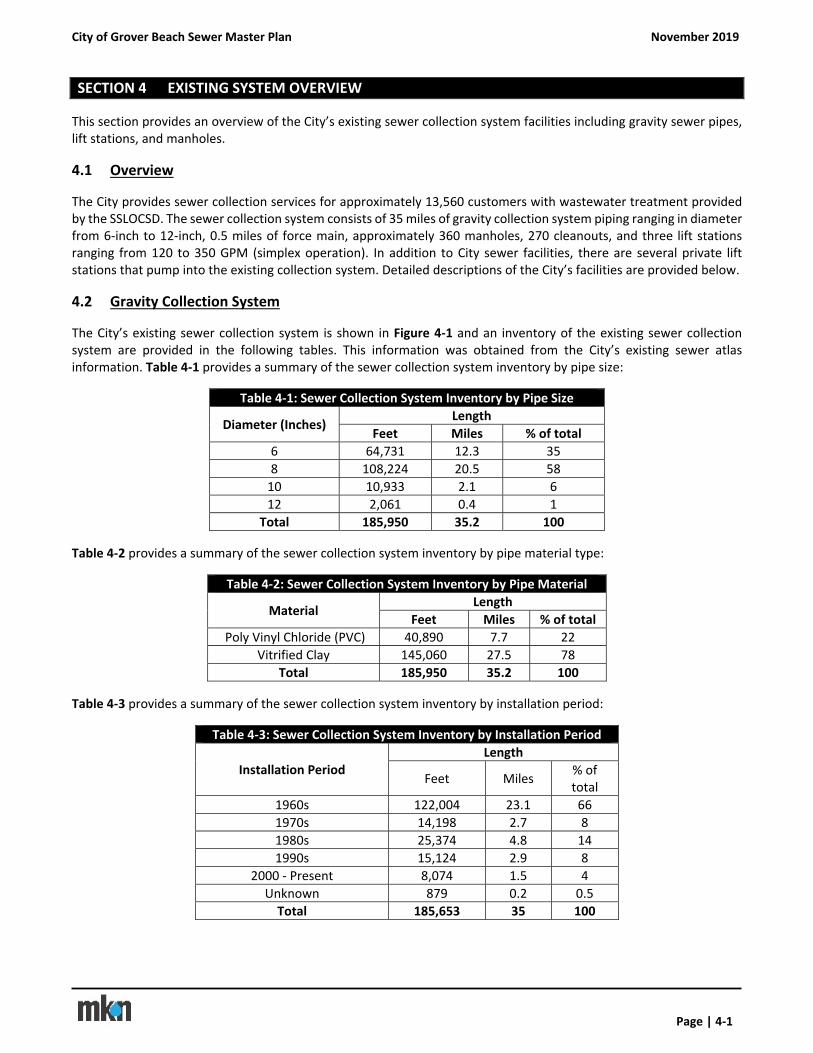
City of Grover Beach Sewer Master Plan November 2019
Page | 4‐1
SECTION 4 EXISTING SYSTEM OVERVIEW
This section provides an overview of the City’s existing sewer collection system facilities including gravity sewer pipes, lift stations, and manholes.
4.1 Overview
The City provides sewer collection services for approximately 13,560 customers with wastewater treatment provided by the SSLOCSD. The sewer collection system consists of 35 miles of gravity collection system piping ranging in diameter from 6‐inch to 12‐inch, 0.5 miles of force main, approximately 360 manholes, 270 cleanouts, and three lift stations ranging from 120 to 350 GPM (simplex operation). In addition to City sewer facilities, there are several private lift stations that pump into the existing collection system. Detailed descriptions of the City’s facilities are provided below.
4.2 Gravity Collection System
The City’s existing sewer collection system is shown in Figure 4‐1 and an inventory of the existing sewer collection system are provided in the following tables. This information was obtained from the City’s existing sewer atlas information. Table 4‐1 provides a summary of the sewer collection system inventory by pipe size:
Table 4‐1: Sewer Collection System Inventory by Pipe Size
Diameter (Inches) Length
Feet Miles % of total
6 64,731 12.3 35
8 108,224 20.5 58
10 10,933 2.1 6
12 2,061 0.4 1
Total 185,950 35.2 100
Table 4‐2 provides a summary of the sewer collection system inventory by pipe material type:
Table 4‐2: Sewer Collection System Inventory by Pipe Material
Material Length
Feet Miles % of total
Poly Vinyl Chloride (PVC) 40,890 7.7 22
Vitrified Clay 145,060 27.5 78
Total 185,950 35.2 100
Table 4‐3 provides a summary of the sewer collection system inventory by installation period:
Table 4‐3: Sewer Collection System Inventory by Installation Period
Installation Period Length
Feet Miles % of total
1960s 122,004 23.1 66
1970s 14,198 2.7 8
1980s 25,374 4.8 14
1990s 15,124 2.9 8
2000 ‐ Present 8,074 1.5 4
Unknown 879 0.2 0.5
Total 185,653 35 100

THIS PAGE LEFT INTENTIONALLY BLANK
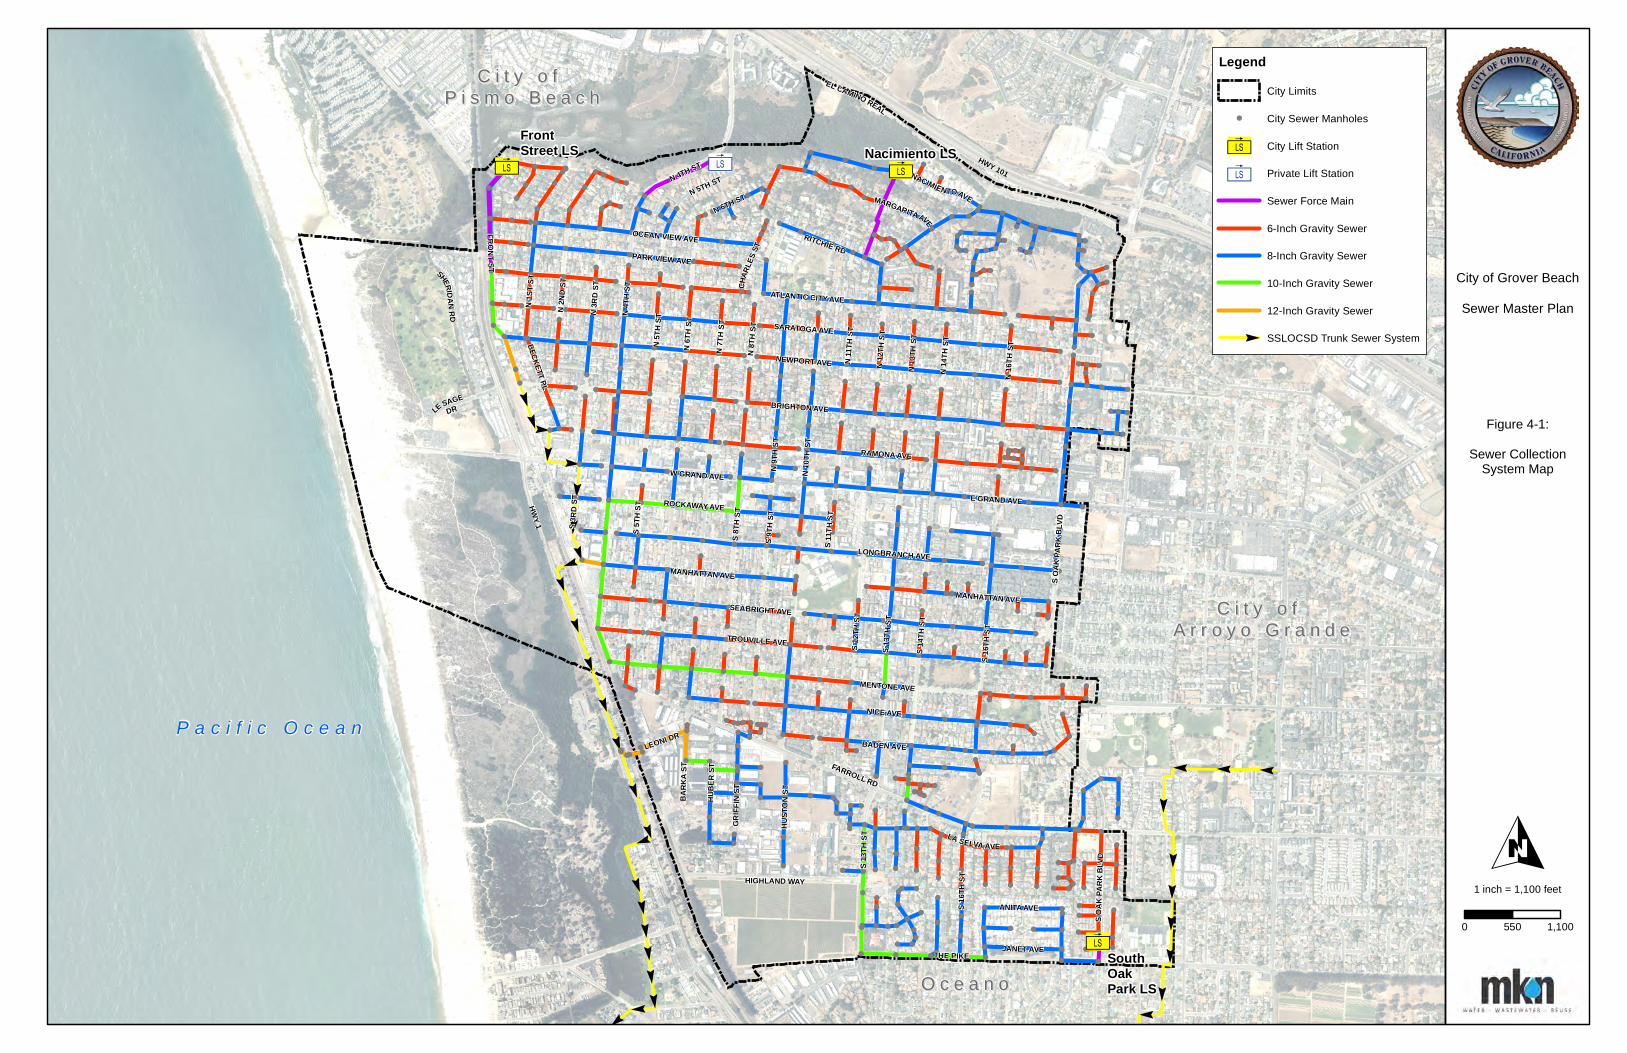
%%
%
%
%
%
%
%
%
%%
%%
%
%%
%%
%
%%
%%%
%
%%
%%
%%%
%
%%%
%
%
%
%%%
%%
%%
%
%
%
%
%
%%%
%
%
%
%
%%
%
%
%
%
%
%
%
%%
%
%
%
%
%
%%%
%%
%%
%%
%%
%%
%%
%
%
%
%
%
%
%
%
%%
%
%
%
%
%
%%%
%
%
%%
%
%
%
%
%
!
!
!
!
!
!
!!
!
!
!
!
!
!
!
!
!!
!
!
!
!!
!
!
!
!!
!
! ! ! !
!
!
!
!
!
! ! !
!
! !
!
!
! !
!
!!
!
!
!
!
!
!
!
!
!!
!
!
!
!
!
!
!
!
!
!
!
!
!
!!
!
!
!
!
!
!
!
!
!
!
!
!
!
!
!
!
!
!
!
!
!
!
!!
!!
!
!
!
!
!
!
!
!
!
!
!! !
!!
!
!
!
!
!
!
! !
!
!
!
!
!
!
!
!
!
!
!
!!
!
!
!
!
!!
!
!
!
!
!
!
!
!!
!
!
!
!
!!
!
!
!
!
!
!
!
!!
!
!
!
!
!
!
!
! !
!
!
!
!
!
!
!
!
!
!
!
!
!
!
!
!
!
!
!
!
!
!
!
!!!!
!!
!!!
!!
!
!
!!!
!
!
!
!
!
!
!
!
!
!
!
!
!
!
!
! !
!
!
!
!
!
!
!
!
!
!
!!
!
!!
!
!
!
!
!
!
!
!
!
!
!
!
!
!
!
!
!
!!
!
!
!
!
!
!
!
!
!
!
!
!
! !
!
!
!
!
!
!
!
!
!
!
!
!
!
!
!
!
!
!
!
!
!
!!
!
!
!
!
!!
!
!
!
!
!
!!
!
!
!!
!
!
!
!
!
!!
!
!!
!
!
!
!
!!
!
!
!!
!
!
! !
!
!
!!
! !!!
!
!
!!
! !
!
!
!
!
!
!
!!
!
!
!
!
!
!
!
!
!
!
!
!
!
!
!
! !
!
!
!
! !
!
!
!
!
!
!
!
!
!
!
!
!
!
!
!
!
!
!
!!
!!
!! !
!
!
! !
!
! ! !
! !
!
!!
!
!
!! !
!!
!
!
!
!
!!!!
!!!
!!!
!
!!
!!
! !
! ! ! !
!
!
!!
! !
!
!
!!
!!
!
!!
!
!!
!
! !
! ! ! !
!
!
!
! ! !
!!!!
!!!!!!!
!! ! ! !
! ! ! ! !
!
! ! !
!
!!!
!
! ! ! ! ! ! ! ! ! !
!!!!!
!
!
! ! ! !
! !
!
!
!
!
!
!!
! !
!!
!!!!
!
!
!
!
!
!
!
!
!
! !
!!
!!
!
!
!
!
!
!
!
!
!
!
!!
!
!
!
!
!
!
!
!
!
!
!!
!!
!
! !!! !
!
!
!
!
!
!
!!
!
!
!
!
!
!
!
!
!
!
!
!!
!
!
!
!!
!
!
! !
!!
!
!!
!!
!
!
!
!
! !
!
!
!
!
!
!
!
!!
!
! !
!
!
!
!
!
!
!
!!
!
!
!
!
! !
!
!
!
!
!
!
!
!
!!!!!!!!
!
!
!
!
!!
!! ! ! ! ! !
!!!
!!!!
!!
!
!!
!
!!
!
!
! ! ! ! ! ! ! ! !
!! !
!!!!
!!
!
!
!!!!
!
! ! !
!!!
! ! ! ! ! !
!
!
! ! ! !
! ! !
! !
!
!
!!!
!!!
!
!! ! !
!
!
!
!!
!!!
!
!
!
!
!
!! !
[ä [ä
[ä
[ä
P a c i f i c O c e a n
C i t y o f C i t y o f A r r o y o G r a n d eA r r o y o G r a n d e
C i t y o f C i t y o f P i s m o B e a c hP i s m o B e a c h
O c e a n oO c e a n o
S OAK
PARK
BLV
D
HWY 101
MENTONE AVE
NACIMIENTOAVEN 5TH ST
FARROLL RD
TROUVILLE AVE
BARK
A ST
N 4TH ST
N 5T
H ST
N 6TH ST
N 2N
D ST
N 3R
D ST
N 1S
T ST
HIGHLAND WAY
CHAR
LES S
T
LA SELVA AVE
ATLANTIC CITY AVE
E GRAND AVE
FRONTST
S 13T
H ST
RITCHIE RD
N16
THST
S OAK
PARK
BLV
D
N 13
TH S
T
N 11
TH ST
S 14T
H ST
N 8T
H ST
W GRAND AVE N 10
TH S
T
S 12T
H ST
ROCKAWAY AVE
S 9TH
ST
PARK VIEW AVE
N 6T
H ST
N 4T
H ST
S 8TH
ST
MANHATTAN AVE
MANHATTAN AVE
SARATOGA AVE
SEABRIGHT AVE
N 7T
H ST
BADEN AVE
LONGBRANCH AVE
OCEAN VIEW AVE
N 9T
H ST
N 12
TH S
T
S 3RD
S T
GRIFF
IN ST
S 11T
H ST
S 5TH
ST
THE PIKE
S 16T
H ST
LE SAGEDR
N 14
TH S
T
LEONI DR
BECKETT PL
NICE AVE
BRIGHTON AVE
RAMONA AVE
NEWPORT AVE
ANITA AVE
JANET AVE
HUBE
R ST
S 16T
H ST
HUST
ON ST
HWY 1
SHERIDANRD
MARGARITA AVE
EL CAMINO REAL
S 13T
H ST
FrontStreet LS
SouthOakPark LS
Nacimiento LS
O
LegendCity Limits
! City Sewer Manholes
[ä City Lift Station
[ä Private Lift Station
Sewer Force Main
6-Inch Gravity Sewer
8-Inch Gravity Sewer
10-Inch Gravity Sewer
12-Inch Gravity Sewer
% SSLOCSD Trunk Sewer System
Figure 4-1:
Sewer CollectionSystem Map
City of Grover Beach
Sewer Master Plan
1 inch = 1,100 feet
0 1,100550

THIS PAGE LEFT INTENTIONALLY BLANK
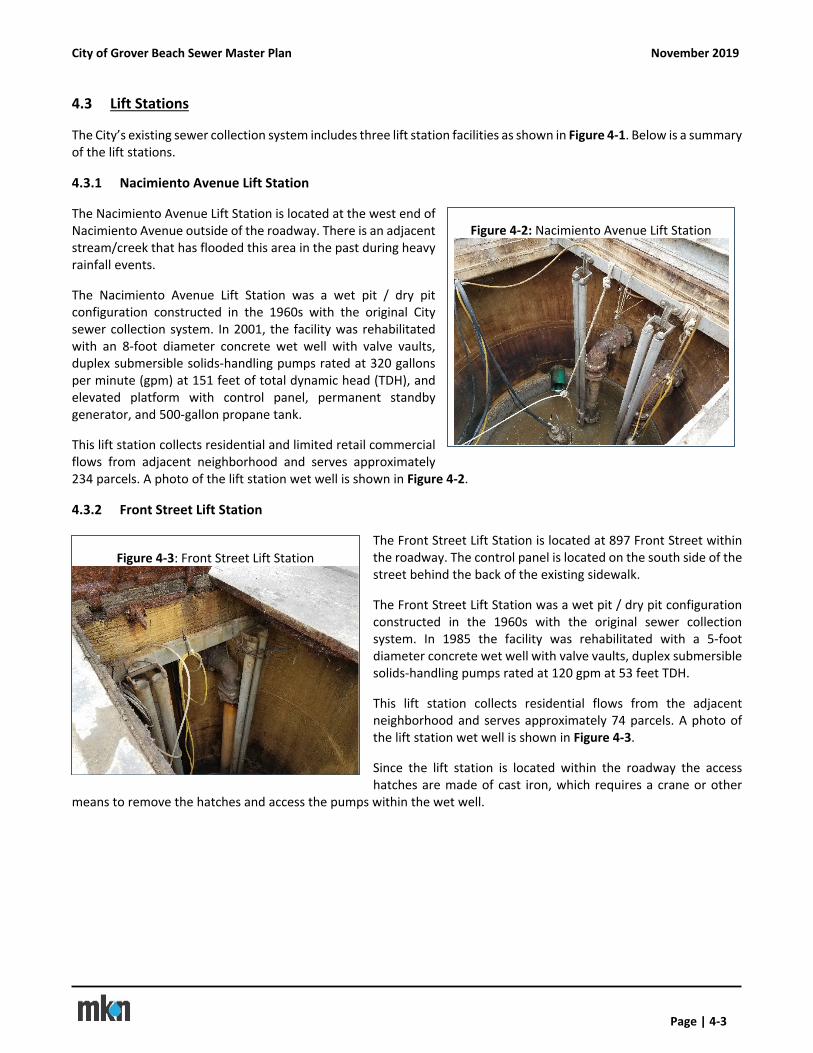
City of Grover Beach Sewer Master Plan November 2019
Page | 4‐3
4.3 Lift Stations
The City’s existing sewer collection system includes three lift station facilities as shown in Figure 4‐1. Below is a summary of the lift stations.
4.3.1 Nacimiento Avenue Lift Station
The Nacimiento Avenue Lift Station is located at the west end of Nacimiento Avenue outside of the roadway. There is an adjacent stream/creek that has flooded this area in the past during heavy rainfall events.
The Nacimiento Avenue Lift Station was a wet pit / dry pit configuration constructed in the 1960s with the original City sewer collection system. In 2001, the facility was rehabilitated with an 8‐foot diameter concrete wet well with valve vaults, duplex submersible solids‐handling pumps rated at 320 gallons per minute (gpm) at 151 feet of total dynamic head (TDH), and elevated platform with control panel, permanent standby generator, and 500‐gallon propane tank.
This lift station collects residential and limited retail commercial flows from adjacent neighborhood and serves approximately 234 parcels. A photo of the lift station wet well is shown in Figure 4‐2.
4.3.2 Front Street Lift Station
The Front Street Lift Station is located at 897 Front Street within the roadway. The control panel is located on the south side of the street behind the back of the existing sidewalk.
The Front Street Lift Station was a wet pit / dry pit configuration constructed in the 1960s with the original sewer collection system. In 1985 the facility was rehabilitated with a 5‐foot diameter concrete wet well with valve vaults, duplex submersible solids‐handling pumps rated at 120 gpm at 53 feet TDH.
This lift station collects residential flows from the adjacent neighborhood and serves approximately 74 parcels. A photo of the lift station wet well is shown in Figure 4‐3.
Since the lift station is located within the roadway the access hatches are made of cast iron, which requires a crane or other
means to remove the hatches and access the pumps within the wet well.
Figure 4‐2: Nacimiento Avenue Lift Station
Figure 4‐3: Front Street Lift Station
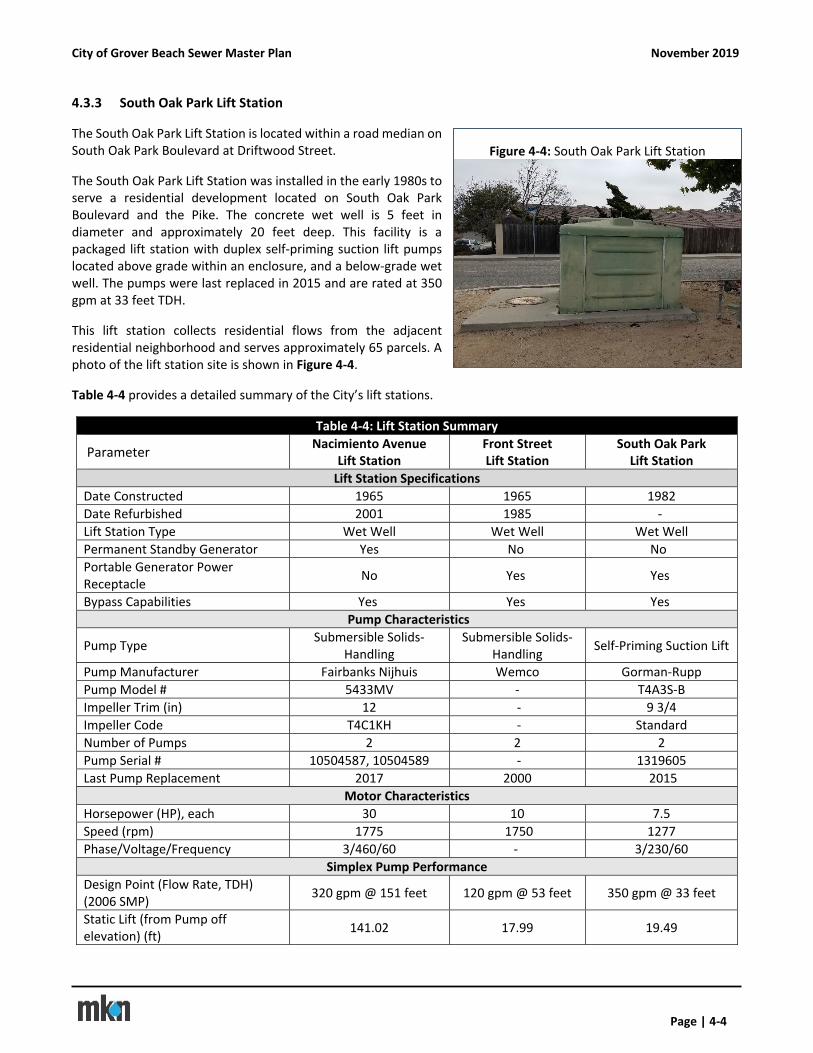
City of Grover Beach Sewer Master Plan November 2019
Page | 4‐4
4.3.3 South Oak Park Lift Station
The South Oak Park Lift Station is located within a road median on South Oak Park Boulevard at Driftwood Street.
The South Oak Park Lift Station was installed in the early 1980s to serve a residential development located on South Oak Park Boulevard and the Pike. The concrete wet well is 5 feet in diameter and approximately 20 feet deep. This facility is a packaged lift station with duplex self‐priming suction lift pumps located above grade within an enclosure, and a below‐grade wet well. The pumps were last replaced in 2015 and are rated at 350 gpm at 33 feet TDH.
This lift station collects residential flows from the adjacent residential neighborhood and serves approximately 65 parcels. A photo of the lift station site is shown in Figure 4‐4.
Table 4‐4 provides a detailed summary of the City’s lift stations.
Table 4‐4: Lift Station Summary
Parameter Nacimiento Avenue
Lift Station Front Street Lift Station
South Oak Park Lift Station
Lift Station Specifications
Date Constructed 1965 1965 1982
Date Refurbished 2001 1985 ‐
Lift Station Type Wet Well Wet Well Wet Well
Permanent Standby Generator Yes No No
Portable Generator Power Receptacle
No Yes Yes
Bypass Capabilities Yes Yes Yes
Pump Characteristics
Pump Type Submersible Solids‐
Handling Submersible Solids‐
Handling Self‐Priming Suction Lift
Pump Manufacturer Fairbanks Nijhuis Wemco Gorman‐Rupp
Pump Model # 5433MV ‐ T4A3S‐B
Impeller Trim (in) 12 ‐ 9 3/4
Impeller Code T4C1KH ‐ Standard
Number of Pumps 2 2 2
Pump Serial # 10504587, 10504589 ‐ 1319605
Last Pump Replacement 2017 2000 2015
Motor Characteristics
Horsepower (HP), each 30 10 7.5
Speed (rpm) 1775 1750 1277
Phase/Voltage/Frequency 3/460/60 ‐ 3/230/60
Simplex Pump Performance
Design Point (Flow Rate, TDH) (2006 SMP)
320 gpm @ 151 feet 120 gpm @ 53 feet 350 gpm @ 33 feet
Static Lift (from Pump off elevation) (ft)
141.02 17.99 19.49
Figure 4‐4: South Oak Park Lift Station
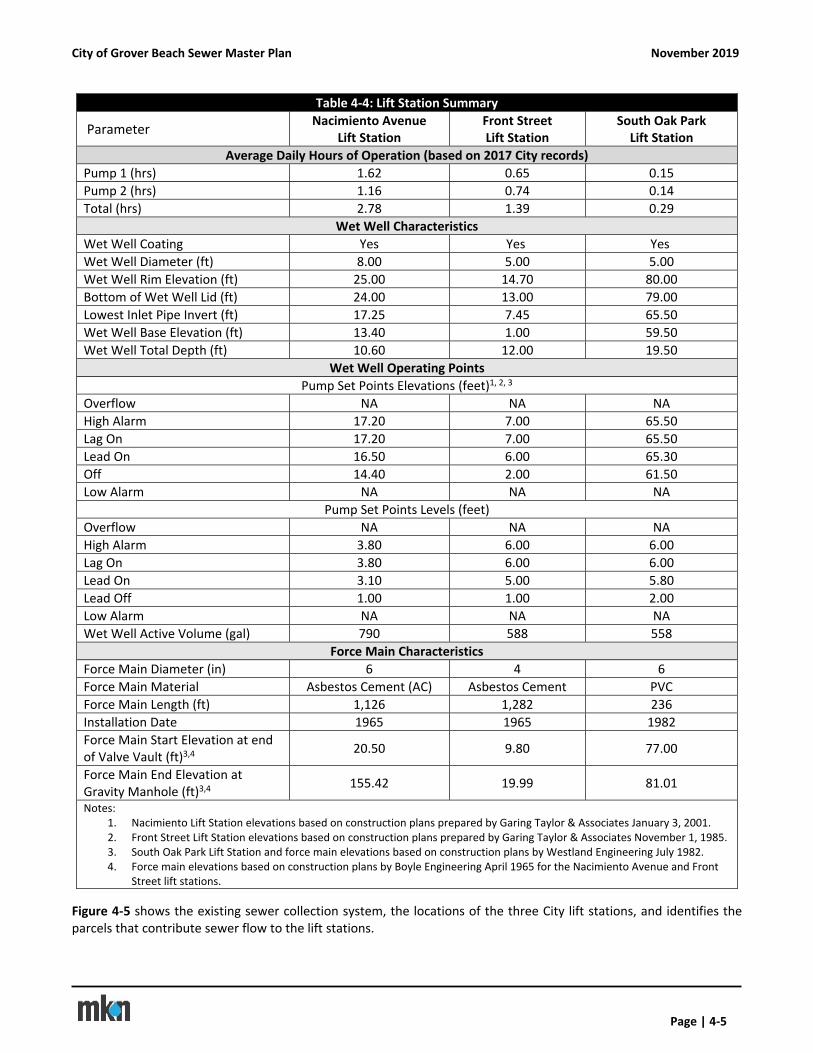
City of Grover Beach Sewer Master Plan November 2019
Page | 4‐5
Table 4‐4: Lift Station Summary
Parameter Nacimiento Avenue
Lift Station Front Street Lift Station
South Oak Park Lift Station
Average Daily Hours of Operation (based on 2017 City records)
Pump 1 (hrs) 1.62 0.65 0.15
Pump 2 (hrs) 1.16 0.74 0.14
Total (hrs) 2.78 1.39 0.29
Wet Well Characteristics
Wet Well Coating Yes Yes Yes
Wet Well Diameter (ft) 8.00 5.00 5.00
Wet Well Rim Elevation (ft) 25.00 14.70 80.00
Bottom of Wet Well Lid (ft) 24.00 13.00 79.00
Lowest Inlet Pipe Invert (ft) 17.25 7.45 65.50
Wet Well Base Elevation (ft) 13.40 1.00 59.50
Wet Well Total Depth (ft) 10.60 12.00 19.50
Wet Well Operating Points
Pump Set Points Elevations (feet)1, 2, 3
Overflow NA NA NA
High Alarm 17.20 7.00 65.50
Lag On 17.20 7.00 65.50
Lead On 16.50 6.00 65.30
Off 14.40 2.00 61.50
Low Alarm NA NA NA
Pump Set Points Levels (feet)
Overflow NA NA NA
High Alarm 3.80 6.00 6.00
Lag On 3.80 6.00 6.00
Lead On 3.10 5.00 5.80
Lead Off 1.00 1.00 2.00
Low Alarm NA NA NA
Wet Well Active Volume (gal) 790 588 558
Force Main Characteristics
Force Main Diameter (in) 6 4 6
Force Main Material Asbestos Cement (AC) Asbestos Cement PVC
Force Main Length (ft) 1,126 1,282 236
Installation Date 1965 1965 1982
Force Main Start Elevation at end of Valve Vault (ft)3,4
20.50 9.80 77.00
Force Main End Elevation at Gravity Manhole (ft)3,4
155.42 19.99 81.01
Notes: 1. Nacimiento Lift Station elevations based on construction plans prepared by Garing Taylor & Associates January 3, 2001. 2. Front Street Lift Station elevations based on construction plans prepared by Garing Taylor & Associates November 1, 1985. 3. South Oak Park Lift Station and force main elevations based on construction plans by Westland Engineering July 1982. 4. Force main elevations based on construction plans by Boyle Engineering April 1965 for the Nacimiento Avenue and Front
Street lift stations.
Figure 4‐5 shows the existing sewer collection system, the locations of the three City lift stations, and identifies the parcels that contribute sewer flow to the lift stations.

THIS PAGE LEFT INTENTIONALLY BLANK
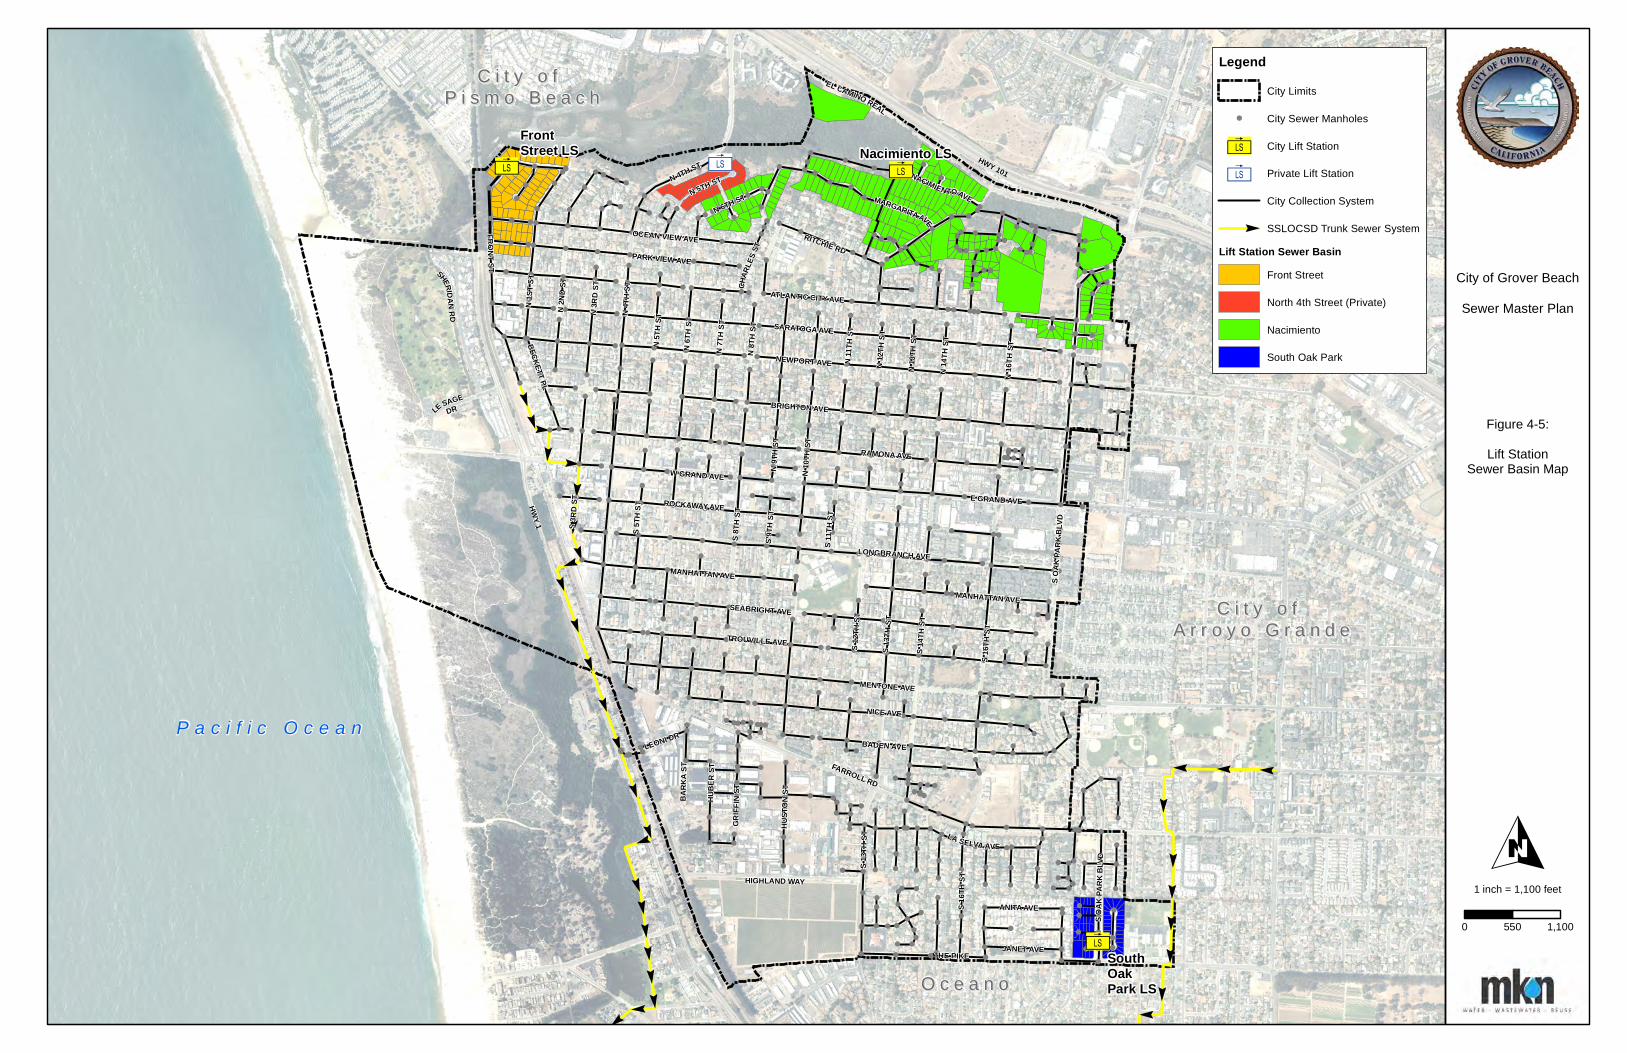
%%
%
%
%
%
%
%
%
%%
%%
%
%%
%%
%
%%
%%%
%
%%
%%
%%%
%
%%%
%
%
%
%%%
%%
%%
%
%
%
%
%
%%%
%
%
%
%
%%
%
%
%
%
%
%
%
%%
%
%
%
%
%
%%%
%%
%%
%%
%%
%%
%%
%
%
%
%
%
%
%
%
%%
%
%
%
%
%
%%%
%
%
%%
%
%
%
%
%
!
!
!
!
!
!
!!
!
!
!
!
!
!
!
!
!!
!
!
!
!!
!
!
!
!!
!
! ! ! !
!
!
!
!
!
! ! !
!
! !
!
!
! !
!
!!
!
!
!
!
!
!
!
!
!!
!
!
!
!
!
!
!
!
!
!
!
!
!
!!
!
!
!
!
!
!
!
!
!
!
!
!
!
!
!
!
!
!
!
!
!
!
!!
!!
!
!
!
!
!
!
!
!
!
!
!! !
!!
!
!
!
!
!
!
! !
!
!
!
!
!
!
!
!
!
!
!
!!
!
!
!
!
!!
!
!
!
!
!
!
!
!!
!
!
!
!
!!
!
!
!
!
!
!
!
!!
!
!
!
!
!
!
!
! !
!
!
!
!
!
!
!
!
!
!
!
!
!
!
!
!
!
!
!
!
!
!
!
!!!!
!!
!!!
!!
!
!
!!!
!
!
!
!
!
!
!
!
!
!
!
!
!
!
!
! !
!
!
!
!
!
!
!
!
!
!
!!
!
!!
!
!
!
!
!
!
!
!
!
!
!
!
!
!
!
!
!
!!
!
!
!
!
!
!
!
!
!
!
!
!
! !
!
!
!
!
!
!
!
!
!
!
!
!
!
!
!
!
!
!
!
!
!
!!
!
!
!
!
!!
!
!
!
!
!
!!
!
!
!!
!
!
!
!
!
!!
!
!!
!
!
!
!
!!
!
!
!!
!
!
! !
!
!
!!
! !!!
!
!
!!
! !
!
!
!
!
!
!
!!
!
!
!
!
!
!
!
!
!
!
!
!
!
!
!
! !
!
!
!
! !
!
!
!
!
!
!
!
!
!
!
!
!
!
!
!
!
!
!
!!
!!
!! !
!
!
! !
!
! ! !
! !
!
!!
!
!
!! !
!!
!
!
!
!
!!!!
!!!
!!!
!
!!
!!
! !
! ! ! !
!
!
!!
! !
!
!
!!
!!
!
!!
!
!!
!
! !
! ! ! !
!
!
!
! ! !
!!!!
!!!!!!!
!! ! ! !
! ! ! ! !
!
! ! !
!
!!!
!
! ! ! ! ! ! ! ! ! !
!!!!!
!
!
! ! ! !
! !
!
!
!
!
!
!!
! !
!!
!!!!
!
!
!
!
!
!
!
!
!
! !
!!
!!
!
!
!
!
!
!
!
!
!
!
!!
!
!
!
!
!
!
!
!
!
!
!!
!!
!
! !!! !
!
!
!
!
!
!
!!
!
!
!
!
!
!
!
!
!
!
!
!!
!
!
!
!!
!
!
! !
!!
!
!!
!!
!
!
!
!
! !
!
!
!
!
!
!
!
!!
!
! !
!
!
!
!
!
!
!
!!
!
!
!
!
! !
!
!
!
!
!
!
!
!
!!!!!!!!
!
!
!
!
!!
!! ! ! ! ! !
!!!
!!!!
!!
!
!!
!
!!
!
!
! ! ! ! ! ! ! ! !
!! !
!!!!
!!
!
!
!!!!
!
! ! !
!!!
! ! ! ! ! !
!
!
! ! ! !
! ! !
! !
!
!
!!!
!!!
!
!! ! !
!
!
!
!!
!!!
!
!
!
!
!
!! !
[ä [ä
[ä
[ä
P a c i f i c O c e a n
C i t y o f C i t y o f A r r o y o G r a n d eA r r o y o G r a n d e
C i t y o f C i t y o f P i s m o B e a c hP i s m o B e a c h
O c e a n oO c e a n o
S OAK
PARK
BLV
D
HWY 101
MENTONE AVE
NACIMIENTOAVEN 5TH ST
FARROLL RD
TROUVILLE AVE
BARK
A ST
N 4TH ST
N 5T
H ST
N 6TH ST
N 2N
D ST
N 3R
D ST
N 1S
T ST
HIGHLAND WAY
CHAR
LES S
T
LA SELVA AVE
ATLANTIC CITY AVE
E GRAND AVE
FRONTST
S 13T
H ST
RITCHIE RD
N16
THST
S OAK
PARK
BLV
D
N 13
TH S
T
N 11
TH ST
S 14T
H ST
N 8T
H ST
W GRAND AVE N 10
TH S
T
S 12T
H ST
ROCKAWAY AVE
S 9TH
ST
PARK VIEW AVE
N 6T
H ST
N 4T
H ST
S 8TH
ST
MANHATTAN AVE
MANHATTAN AVE
SARATOGA AVE
SEABRIGHT AVE
N 7T
H ST
BADEN AVE
LONGBRANCH AVE
OCEAN VIEW AVE
N 9T
H ST
N 12
TH S
T
S 3RD
S T
GRIFF
IN ST
S 11T
H ST
S 5TH
ST
THE PIKE
S 16T
H ST
LE SAGEDR
N 14
TH S
T
LEONI DR
BECKETT PL
NICE AVE
BRIGHTON AVE
RAMONA AVE
NEWPORT AVE
ANITA AVE
JANET AVE
HUBE
R ST
S 16T
H ST
HUST
ON ST
HWY 1
SHERIDANRD
MARGARITA AVE
EL CAMINO REAL
S 13T
H ST
FrontStreet LS
SouthOakPark LS
Nacimiento LS
O
LegendCity Limits
! City Sewer Manholes
[ä City Lift Station
[ä Private Lift Station
City Collection System
% SSLOCSD Trunk Sewer System
Lift Station Sewer BasinFront Street
North 4th Street (Private)
Nacimiento
South Oak Park
Figure 4-5:
Lift StationSewer Basin Map
City of Grover Beach
Sewer Master Plan
1 inch = 1,100 feet
0 1,100550

THIS PAGE LEFT INTENTIONALLY BLANK
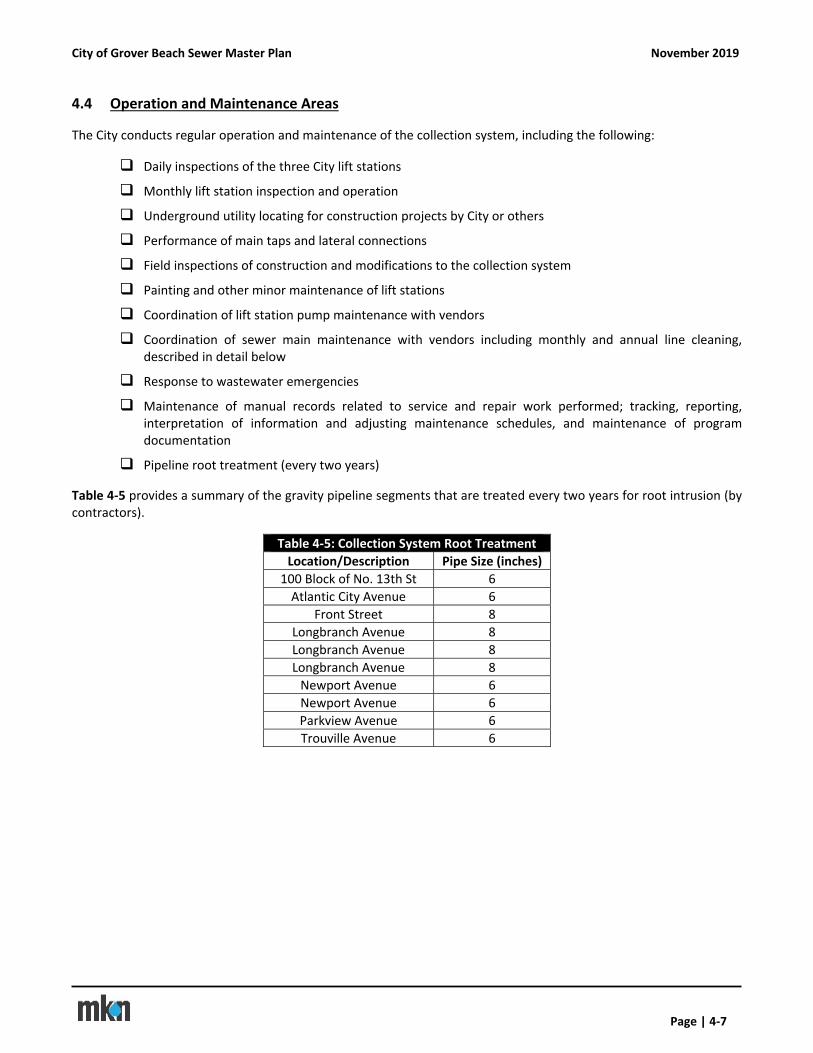
City of Grover Beach Sewer Master Plan November 2019
Page | 4‐7
4.4 Operation and Maintenance Areas
The City conducts regular operation and maintenance of the collection system, including the following:
Daily inspections of the three City lift stations
Monthly lift station inspection and operation
Underground utility locating for construction projects by City or others
Performance of main taps and lateral connections
Field inspections of construction and modifications to the collection system
Painting and other minor maintenance of lift stations
Coordination of lift station pump maintenance with vendors
Coordination of sewer main maintenance with vendors including monthly and annual line cleaning, described in detail below
Response to wastewater emergencies
Maintenance of manual records related to service and repair work performed; tracking, reporting, interpretation of information and adjusting maintenance schedules, and maintenance of program documentation
Pipeline root treatment (every two years)
Table 4‐5 provides a summary of the gravity pipeline segments that are treated every two years for root intrusion (by contractors).
Table 4‐5: Collection System Root Treatment
Location/Description Pipe Size (inches)
100 Block of No. 13th St 6
Atlantic City Avenue 6
Front Street 8
Longbranch Avenue 8
Longbranch Avenue 8
Longbranch Avenue 8
Newport Avenue 6
Newport Avenue 6
Parkview Avenue 6
Trouville Avenue 6
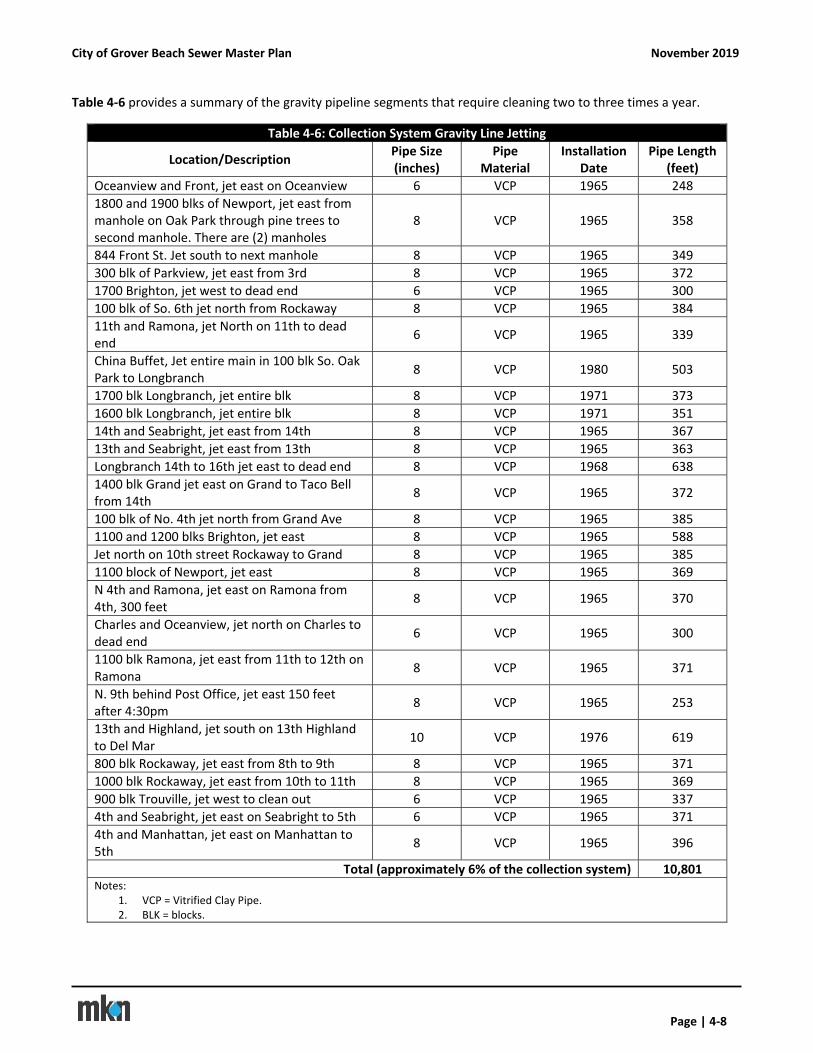
City of Grover Beach Sewer Master Plan November 2019
Page | 4‐8
Table 4‐6 provides a summary of the gravity pipeline segments that require cleaning two to three times a year.
Table 4‐6: Collection System Gravity Line Jetting
Location/Description Pipe Size (inches)
Pipe Material
Installation Date
Pipe Length (feet)
Oceanview and Front, jet east on Oceanview 6 VCP 1965 248
1800 and 1900 blks of Newport, jet east from manhole on Oak Park through pine trees to second manhole. There are (2) manholes
8 VCP 1965 358
844 Front St. Jet south to next manhole 8 VCP 1965 349
300 blk of Parkview, jet east from 3rd 8 VCP 1965 372
1700 Brighton, jet west to dead end 6 VCP 1965 300
100 blk of So. 6th jet north from Rockaway 8 VCP 1965 384
11th and Ramona, jet North on 11th to dead end
6 VCP 1965 339
China Buffet, Jet entire main in 100 blk So. Oak Park to Longbranch
8 VCP 1980 503
1700 blk Longbranch, jet entire blk 8 VCP 1971 373
1600 blk Longbranch, jet entire blk 8 VCP 1971 351
14th and Seabright, jet east from 14th 8 VCP 1965 367
13th and Seabright, jet east from 13th 8 VCP 1965 363
Longbranch 14th to 16th jet east to dead end 8 VCP 1968 638
1400 blk Grand jet east on Grand to Taco Bell from 14th
8 VCP 1965 372
100 blk of No. 4th jet north from Grand Ave 8 VCP 1965 385
1100 and 1200 blks Brighton, jet east 8 VCP 1965 588
Jet north on 10th street Rockaway to Grand 8 VCP 1965 385
1100 block of Newport, jet east 8 VCP 1965 369
N 4th and Ramona, jet east on Ramona from 4th, 300 feet
8 VCP 1965 370
Charles and Oceanview, jet north on Charles to dead end
6 VCP 1965 300
1100 blk Ramona, jet east from 11th to 12th on Ramona
8 VCP 1965 371
N. 9th behind Post Office, jet east 150 feet after 4:30pm
8 VCP 1965 253
13th and Highland, jet south on 13th Highland to Del Mar
10 VCP 1976 619
800 blk Rockaway, jet east from 8th to 9th 8 VCP 1965 371
1000 blk Rockaway, jet east from 10th to 11th 8 VCP 1965 369
900 blk Trouville, jet west to clean out 6 VCP 1965 337
4th and Seabright, jet east on Seabright to 5th 6 VCP 1965 371
4th and Manhattan, jet east on Manhattan to 5th
8 VCP 1965 396
Total (approximately 6% of the collection system) 10,801 Notes:
1. VCP = Vitrified Clay Pipe. 2. BLK = blocks.
City of Grover Beach Sewer Master Plan November 2019
Page | 4‐9
4.5 SSLOCSD WWTP and Trunk Sewer System
The City is a member agency of the SSLOCSD, which also includes the City of Arroyo Grande and Oceano Community Services District. The member agencies jointly own the SSLOCSD WWTP, ocean outfall, and trunk sewer collection system.
The SSLOCSD trunk sewer collection system consists of approximately 9 miles of gravity sewer ranging in diameter from 12‐inch to 33‐inch with 540 manholes. The City’s portion of the trunk sewer system consists of 2 miles of gravity sewer (approximately 20% of the total), with diameters ranging from 15‐inch to 24‐inch.

THIS PAGE LEFT INTENTIONALLY BLANK
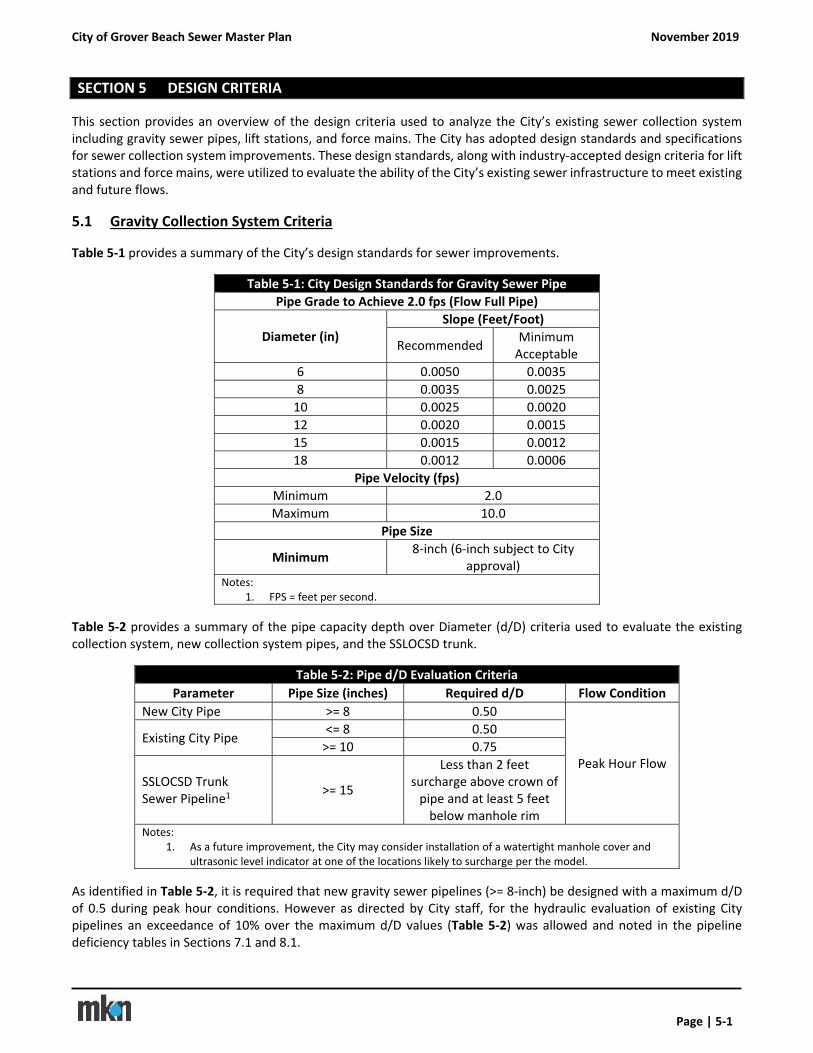
City of Grover Beach Sewer Master Plan November 2019
Page | 5‐1
SECTION 5 DESIGN CRITERIA
This section provides an overview of the design criteria used to analyze the City’s existing sewer collection system including gravity sewer pipes, lift stations, and force mains. The City has adopted design standards and specifications for sewer collection system improvements. These design standards, along with industry‐accepted design criteria for lift stations and force mains, were utilized to evaluate the ability of the City’s existing sewer infrastructure to meet existing and future flows.
5.1 Gravity Collection System Criteria
Table 5‐1 provides a summary of the City’s design standards for sewer improvements.
Table 5‐1: City Design Standards for Gravity Sewer Pipe
Pipe Grade to Achieve 2.0 fps (Flow Full Pipe)
Diameter (in) Slope (Feet/Foot)
Recommended Minimum Acceptable
6 0.0050 0.0035
8 0.0035 0.0025
10 0.0025 0.0020
12 0.0020 0.0015
15 0.0015 0.0012
18 0.0012 0.0006
Pipe Velocity (fps)
Minimum 2.0
Maximum 10.0
Pipe Size
Minimum 8‐inch (6‐inch subject to City
approval) Notes:
1. FPS = feet per second.
Table 5‐2 provides a summary of the pipe capacity depth over Diameter (d/D) criteria used to evaluate the existing collection system, new collection system pipes, and the SSLOCSD trunk.
Table 5‐2: Pipe d/D Evaluation Criteria
Parameter Pipe Size (inches) Required d/D Flow Condition
New City Pipe >= 8 0.50
Peak Hour Flow
Existing City Pipe <= 8 0.50
>= 10 0.75
SSLOCSD Trunk Sewer Pipeline1
>= 15
Less than 2 feet surcharge above crown of pipe and at least 5 feet below manhole rim
Notes: 1. As a future improvement, the City may consider installation of a watertight manhole cover and
ultrasonic level indicator at one of the locations likely to surcharge per the model.
As identified in Table 5‐2, it is required that new gravity sewer pipelines (>= 8‐inch) be designed with a maximum d/D of 0.5 during peak hour conditions. However as directed by City staff, for the hydraulic evaluation of existing City pipelines an exceedance of 10% over the maximum d/D values (Table 5‐2) was allowed and noted in the pipeline deficiency tables in Sections 7.1 and 8.1.
City of Grover Beach Sewer Master Plan November 2019
Page | 5‐2
5.2 Lift Station Criteria
The following design criteria were used to evaluate capacity of the City’s three existing lift stations under existing and future flow conditions.
5.2.1 Pump Capacity
It is recommended that lift stations are designed with a minimum of two pumps, such that the pumping system can serve the full design flow with the largest pump offline, to provide full redundancy if one pump fails or requires service, to alternate pump cycles to minimize wear on the pump components, and to provide supplemental pumping capacity to convey instantaneous peak flows. Each pump should be sized to convey the peak hour flow entering the wet well.
5.2.2 Wet Well Capacity and Pump Cycle Times
Another factor in lift station design and evaluation is Pump Cycle Time, which is defined as the sum of the fill time and drain time for the wet well. Wet wells should be large enough to prevent rapid pump cycling and small enough to reduce residence time to minimize odors and settling/accumulation of solids. The following equation was used to determine the time between starts for a constant speed pump in a wet well:
T = Fill Time + Drain Time
Fill Time = VACTIVE/QIN
Drain Time = VACTIVE/(QPUMP ‐ QIN)
Where T is the cycle time between starts, QPUMP is the rated capacity of a single pump in gpm, QIN is the inflow (average and peak hour upstream flow to the wet well) and VACTIVE is the available active volume of the wet well. The maximum recommended cycle time is 30 minutes to reduce odor issues associated with extended detention times. Lift station pumps should typically cycle not more than 5 or 6 times per hour to limit pump starts. This recommendation, however, should be based on the actual pump manufacturer’s information, as smaller horsepower motors may be capable of starting more often.
To evaluate the capacity of the lift station wet wells under existing and future ADF and PHF inflow conditions, the available active volume is calculated and compared to the recommended based on pump cycle time. The active wet well volume is the volume between the “lead pump off” and “lead pump on” set points. The minimum recommended active volume for the City lift stations were determined using the following equation:
VMIN = QPUMPT/4
Where VMIN is the minimum active volume in gallons, QPUMP is the rated capacity of a single pump in gallons per minute (gpm), and T is cycle time in minutes (the minimum recommended cycle time is 10 minutes, or six starts per hour).
5.3 Force Main Criteria
Force mains were analyzed to determine if they are properly sized to convey the lift station pumped flow, while maintaining minimum pipeline velocities to re‐suspend solids and provide pipeline cleaning. It is recommended that lift station force mains convey minimum velocities of 3.5 to 6 feet per second (fps) with maximum velocities less than 10 fps to minimize head loss and potential for surge events.
City of Grover Beach Sewer Master Plan November 2019
Page | 6‐1
SECTION 6 HYDRAULIC COMPUTER MODEL
6.1 Overview
This section provides an overview of the collection system hydraulic model developed for this project to analyze the ability of the existing system to serve existing and future flows.
6.2 Model Development
MKN developed an updated hydraulic model using Bentley SewerCAD CONNECT Edition Version 10 (SewerCAD) hydraulic modeling software to simulate the operation of the gravity collection system. SewerCAD incorporates the Manning’s equation for open channel flow and Hazen‐Williams formula for pressure pipes (lift station force mains). The hydraulic model was run under steady state conditions using a backwater analysis. This type of analysis starts at the collection system outlet location (SSLOCSD WWTP headworks for the SMP) with an assigned outlet condition (either free discharge, submerged, or tailwater control). From the outlet location SewerCAD proceeds in an upstream direction performing the hydraulic analysis.
A representative model of the existing pipes and pumping facilities was developed using the following information:
The City’s 2013 collection system atlas AutoCAD file (prepared by GTA). The AutoCAD file provided the following information:
o Gravity pipe alignment and manhole locations
o Gravity pipe diameter, material, and installation dates
o Lift station locations and force main alignments
1965 Asbuilt Plans for the original collection system (prepared by Boyle Engineering). The Asbuilt Plans provided:
o Manhole rim elevations
o Gravity invert elevations
o Pipe slopes based on the National Geodetic Vertical Datum of 1929 (NGVD 29)
For gravity pipe segments installed after 1965, pipe slope and manhole depth values were taken from available asbuilt plans provided by the City. Rim and invert elevations for these areas were estimated based on available elevations from manholes in the 1965 system.
Field visits with City staff to each lift station.
Pump curves from pump vendors for the lift stations.
The portion of the SSLOCSD trunk sewer system was included in the updated hydraulic model from the City to the SSLOCSD WWTP based on the City’s 1964 asbuilts for the collection system.
The existing sewer collection system was mapped using an Environmental Systems Research Institute (ESRI) GIS geodatabase and integrated with the City’s GIS parcel basemap (provided by the City). Pipe characteristics and average day flows (from each sewered parcel) were recorded in the sewer GIS database and imported into the hydraulic model. A skeletonized hydraulic model was constructed to evaluate the collection system. Only pipe segments with invert information were included, amounting to approximately 45% of the total collection system and covering the majority of the major trunk mains (Figure 6‐1). Existing and future flows from areas not imported in the hydraulic model were assigned to the closest downstream manhole.

THIS PAGE LEFT INTENTIONALLY BLANK
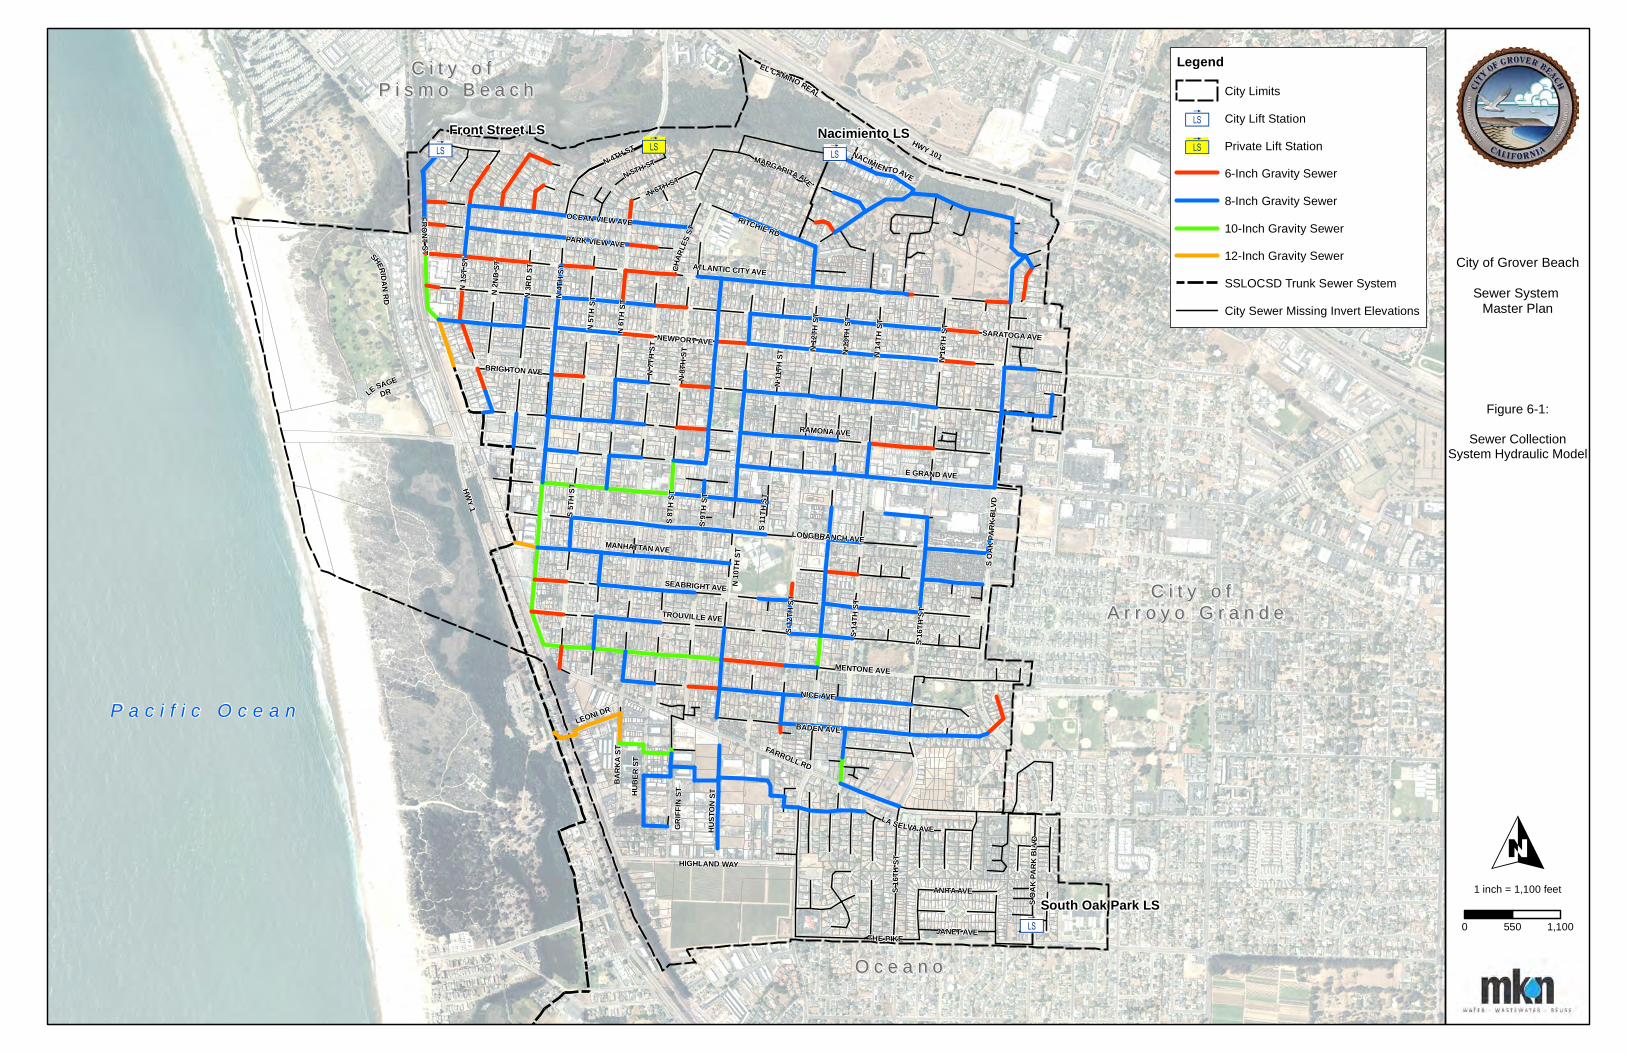
3ä 3ä
3ä
3ä
P a c i f i c O c e a n
C i t y o f C i t y o f A r r o y o G r a n d eA r r o y o G r a n d e
C i t y o f C i t y o f P i s m o B e a c hP i s m o B e a c h
O c e a n oO c e a n o
S OAK
PARK
BLV
D
HWY 101
MENTONE AVE
NACIMIENTOAVEN 5TH ST
FARROLL RD
TROUVILLE AVEBA
RKA
ST
N 4TH ST
N 5T
H ST
N 6TH ST
N 2N
D ST
N 3R
D ST
N 1S
T ST
HIGHLAND WAY
CHAR
LES S
T
LA SELVA AVE
ATLANTIC CITY AVE
E GRAND AVE
FRONTST
RITCHIE RD
N16
THST
S OAK
PARK
BLV
D
N 13
TH S
T
N 11
TH ST
S 14T
H ST
N 8T
H ST
N 10
TH S
T
S 12T
H ST
S 9TH
ST
PARK VIEW AVE
N 6T
H ST
N 4T
H ST
S 8TH
ST
MANHATTAN AVE
SARATOGA AVE
SEABRIGHT AVE
N 7T
H ST
BADEN AVE
LONGBRANCH AVE
OCEAN VIEW AVE
N 12
TH S
T
GRIFF
IN ST
S 11T
H ST
S 5TH
ST
THE PIKE
S 16T
H ST
LE SAGEDR
N 14
TH S
T
LEONI DRNICE AVE
BRIGHTON AVE
RAMONA AVE
NEWPORT AVE
ANITA AVE
JANET AVE
HUBE
R ST
S 16T
H ST
HUST
ON ST
HWY 1
SHERIDANRD
MARGARITA AVE
EL CAMINO REAL
Nacimiento LSFront Street LS
South Oak Park LS
O
LegendCity Limits
3ä City Lift Station
3ä Private Lift Station
6-Inch Gravity Sewer
8-Inch Gravity Sewer
10-Inch Gravity Sewer
12-Inch Gravity Sewer
SSLOCSD Trunk Sewer System
City Sewer Missing Invert Elevations
Figure 6-1:
Sewer CollectionSystem Hydraulic Model
City of Grover Beach
Sewer System Master Plan
1 inch = 1,100 feet
0 1,100550

THIS PAGE LEFT INTENTIONALLY BLANK
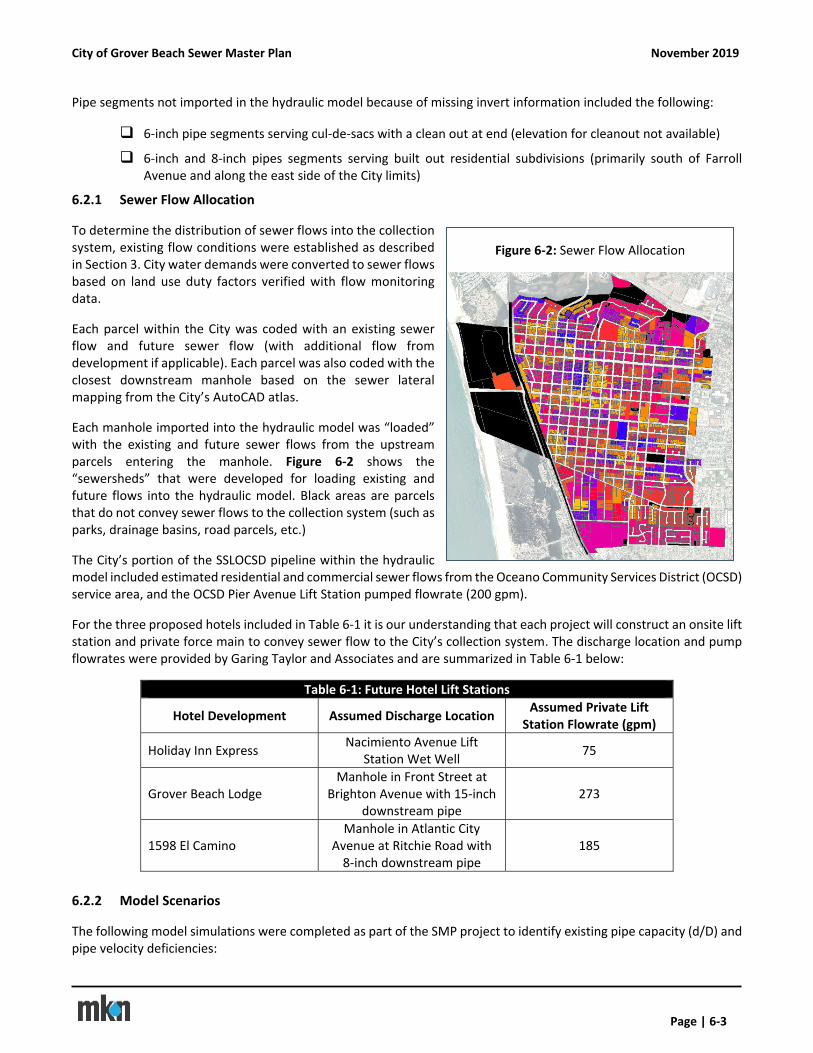
City of Grover Beach Sewer Master Plan November 2019
Page | 6‐3
Pipe segments not imported in the hydraulic model because of missing invert information included the following:
6‐inch pipe segments serving cul‐de‐sacs with a clean out at end (elevation for cleanout not available)
6‐inch and 8‐inch pipes segments serving built out residential subdivisions (primarily south of Farroll Avenue and along the east side of the City limits)
6.2.1 Sewer Flow Allocation
To determine the distribution of sewer flows into the collection system, existing flow conditions were established as described in Section 3. City water demands were converted to sewer flows based on land use duty factors verified with flow monitoring data.
Each parcel within the City was coded with an existing sewer flow and future sewer flow (with additional flow from development if applicable). Each parcel was also coded with the closest downstream manhole based on the sewer lateral mapping from the City’s AutoCAD atlas.
Each manhole imported into the hydraulic model was “loaded” with the existing and future sewer flows from the upstream parcels entering the manhole. Figure 6‐2 shows the “sewersheds” that were developed for loading existing and future flows into the hydraulic model. Black areas are parcels that do not convey sewer flows to the collection system (such as parks, drainage basins, road parcels, etc.)
The City’s portion of the SSLOCSD pipeline within the hydraulic model included estimated residential and commercial sewer flows from the Oceano Community Services District (OCSD) service area, and the OCSD Pier Avenue Lift Station pumped flowrate (200 gpm).
For the three proposed hotels included in Table 6‐1 it is our understanding that each project will construct an onsite lift station and private force main to convey sewer flow to the City’s collection system. The discharge location and pump flowrates were provided by Garing Taylor and Associates and are summarized in Table 6‐1 below:
Table 6‐1: Future Hotel Lift Stations
Hotel Development Assumed Discharge Location Assumed Private Lift
Station Flowrate (gpm)
Holiday Inn Express Nacimiento Avenue Lift
Station Wet Well 75
Grover Beach Lodge Manhole in Front Street at
Brighton Avenue with 15‐inch downstream pipe
273
1598 El Camino Manhole in Atlantic City
Avenue at Ritchie Road with 8‐inch downstream pipe
185
6.2.2 Model Scenarios
The following model simulations were completed as part of the SMP project to identify existing pipe capacity (d/D) and pipe velocity deficiencies:
Figure 6‐2: Sewer Flow Allocation
City of Grover Beach Sewer Master Plan November 2019
Page | 6‐4
Existing conditions with 1) existing system; and 2) existing system including capital improvements
o Average Daily Flow
o Peak Hour Flow
Future conditions with 1) existing system; and 2) existing system including capital improvements (based on future development in Table 3‐8 excluding West Grand Avenue Development and Septic Conversions)
o Average Daily Flow
o Peak Hour Flow
Alternative Future conditions with 1) existing system; and 2) existing system including capital improvements (based on future development in Table 3‐8 with West Grand Avenue Development and Septic Conversions)
o Average Daily Flow
o Peak Hour Flow
6.2.3 Model Settings
With the corrected sewer system network, existing and future flows imported into SewerCAD the following modeling parameters were configured:
Adjustment of vendor‐supplied lift station pump curves to account for minor manifold losses and friction losses to simulate the performance of the pumps
Lift station wet well levels were set to the low wet well level (pump off position) to simulate “worst‐case” static lift conditions
Lift stations were set to “on” during existing and future ADF and PHF flow conditions
All hydraulic simulations were completed under “Steady State” time analysis
The following Hazen‐Williams friction coefficients were used for force mains
o Asbestos Cement Pipe: 120
o Polyvinyl Chloride: 140
The following Mannings N friction coefficients were used for gravity pipelines:
o Polyvinyl Chloride: 0.013
o Vitrified Clay: 0.015
6.3 Hydraulic Model Flow Validation
As described in Section 3.2.2, MKN used the August 2018 flow monitoring and water production data to develop sewer use factors (water usage reduction) to estimate existing and future flow conditions within the hydraulic model.
City of Grover Beach Sewer Master Plan November 2019
Page | 7‐1
SECTION 7 EXISTING FLOWS ‐ HYDRAULIC ANALYSIS AND CONDITION ASSESSMENT
This section summarizes the hydraulic evaluation of the City’s existing sewer collection system to serve existing flows and visual condition assessment of the three lift stations.
7.1 Gravity Collection System
7.1.1 Hydraulic Model Evaluation – Existing Flow Conditions
The City’s existing sewer collection system contains over 35 miles of gravity sewer pipe ranging from 6‐inch to 12‐inch in size (excluding the SSLOCSD trunk sewer collection system) and consists of PVC or vitrified clay pipe. As described in Section 6.2, a skeletonized hydraulic model was constructed to evaluate the collection system. Only pipe segments with invert information were included, amounting to approximately 45% of the total collection (Figure 6‐1). The City’s portion of the SSLOCSD trunk sewer system was also imported into the hydraulic model with estimated residential and commercial sewer flows from the OCSD service area, and the OCSD Pier Avenue Lift Station pumped flowrate (200 gpm). Existing and future flows for areas not imported into the hydraulic model were assigned to the closest downstream manhole. Gravity collection system deficiencies were primarily determined based on a hydraulic evaluation of pipeline sizes, slope, and downstream restrictions using the following designations:
“A” designation was used to track and identify deficiencies for gravity sewer pipes less than or equal to 8‐inch in diameter and evaluated for a d/D less than or equal to 0.5.
“B” designation was used to track and identify deficiencies for gravity sewer pipes greater than or equal to 10‐inch in diameter and evaluated for a d/D less than or equal to 0.75.
Figure 7‐1 provides an overview of typical gravity pipeline velocities during existing PHF conditions. Approximately 33% of the modeled City sewer collection system will achieve self‐cleaning velocities equal to or greater than 2 FPS during peak hour conditions. Table 7‐1 and Figure 7‐2 provides an overview of the collection system deficiencies identified through the hydraulic model simulations during existing PHF conditions.

THIS PAGE LEFT INTENTIONALLY BLANK
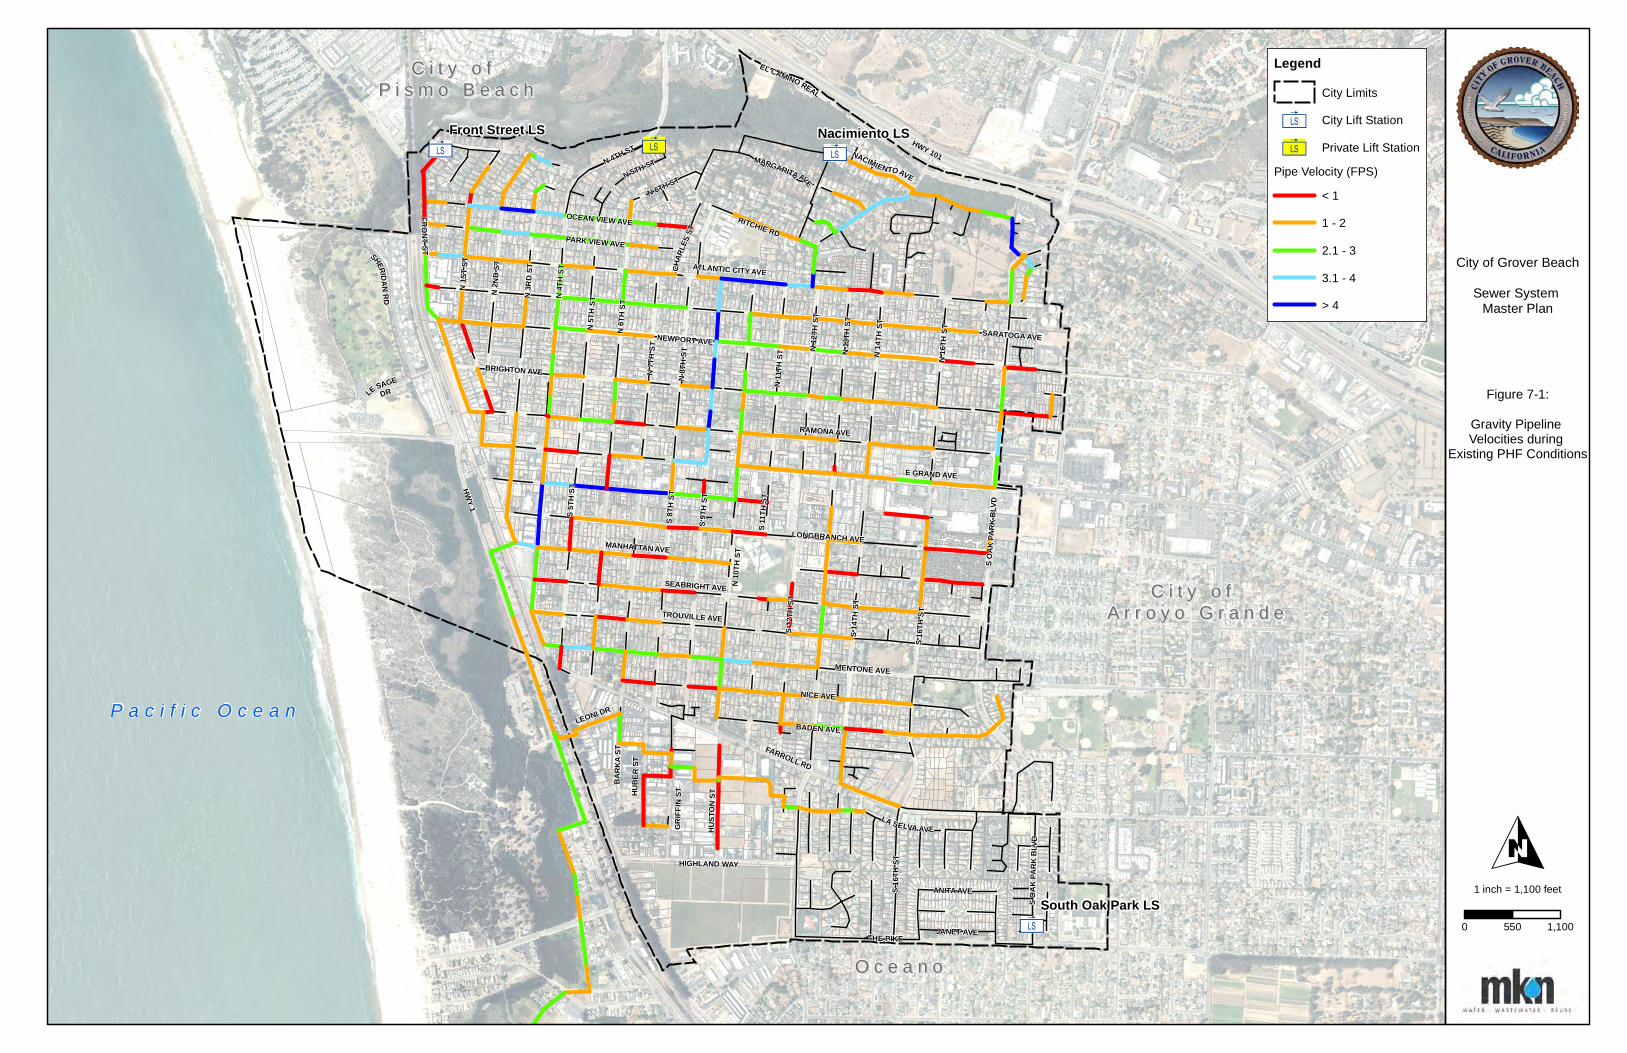
3ä 3ä
3ä
3ä
P a c i f i c O c e a n
C i t y o f C i t y o f A r r o y o G r a n d eA r r o y o G r a n d e
C i t y o f C i t y o f P i s m o B e a c hP i s m o B e a c h
O c e a n oO c e a n o
S OAK
PARK
BLV
D
HWY 101
MENTONE AVE
NACIMIENTOAVEN 5TH ST
FARROLL RD
TROUVILLE AVEBA
RKA
ST
N 4TH ST
N 5T
H ST
N 6TH ST
N 2N
D ST
N 3R
D ST
N 1S
T ST
HIGHLAND WAY
CHAR
LES S
T
LA SELVA AVE
ATLANTIC CITY AVE
E GRAND AVE
FRONTST
RITCHIE RD
N16
THST
S OAK
PARK
BLV
D
N 13
TH S
T
N 11
TH ST
S 14T
H ST
N 8T
H ST
N 10
TH S
T
S 12T
H ST
S 9TH
ST
PARK VIEW AVE
N 6T
H ST
N 4T
H ST
S 8TH
ST
MANHATTAN AVE
SARATOGA AVE
SEABRIGHT AVE
N 7T
H ST
BADEN AVE
LONGBRANCH AVE
OCEAN VIEW AVE
N 12
TH S
T
GRIFF
IN ST
S 11T
H ST
S 5TH
ST
THE PIKE
S 16T
H ST
LE SAGEDR
N 14
TH S
T
LEONI DRNICE AVE
BRIGHTON AVE
RAMONA AVE
NEWPORT AVE
ANITA AVE
JANET AVE
HUBE
R ST
S 16T
H ST
HUST
ON ST
HWY 1
SHERIDANRD
MARGARITA AVE
EL CAMINO REAL
Nacimiento LSFront Street LS
South Oak Park LS
O
LegendCity Limits
3ä City Lift Station
3ä Private Lift Station
Pipe Velocity (FPS)
< 1
1 - 2
2.1 - 3
3.1 - 4
> 4
Figure 7-1:
Gravity Pipeline Velocities during
Existing PHF Conditions
City of Grover Beach
Sewer System Master Plan
1 inch = 1,100 feet
0 1,100550

THIS PAGE LEFT INTENTIONALLY BLANK
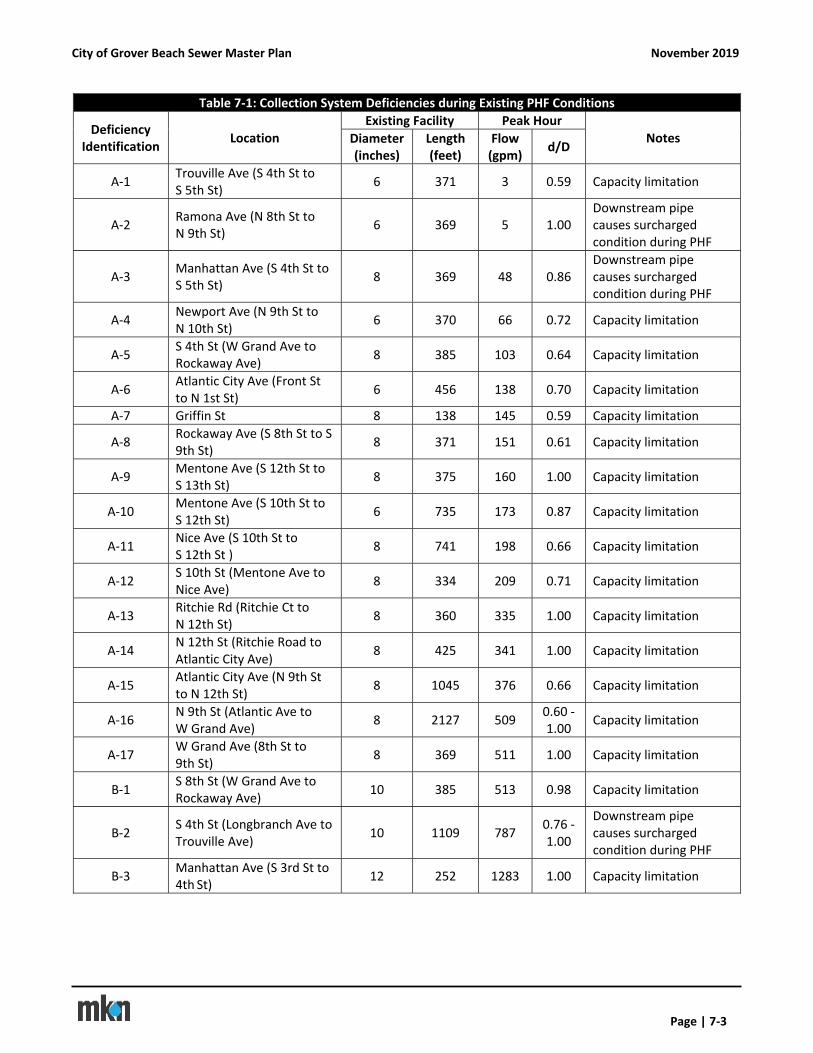
City of Grover Beach Sewer Master Plan November 2019
Page | 7‐3
Table 7‐1: Collection System Deficiencies during Existing PHF Conditions
Deficiency Identification
Location Existing Facility Peak Hour
Notes Diameter (inches)
Length (feet)
Flow (gpm)
d/D
A‐1 Trouville Ave (S 4th St to S 5th St)
6 371 3 0.59 Capacity limitation
A‐2 Ramona Ave (N 8th St to N 9th St)
6 369 5 1.00 Downstream pipe causes surcharged condition during PHF
A‐3 Manhattan Ave (S 4th St to S 5th St)
8 369 48 0.86 Downstream pipe causes surcharged condition during PHF
A‐4 Newport Ave (N 9th St to N 10th St)
6 370 66 0.72 Capacity limitation
A‐5 S 4th St (W Grand Ave to Rockaway Ave)
8 385 103 0.64 Capacity limitation
A‐6 Atlantic City Ave (Front St to N 1st St)
6 456 138 0.70 Capacity limitation
A‐7 Griffin St 8 138 145 0.59 Capacity limitation
A‐8 Rockaway Ave (S 8th St to S 9th St)
8 371 151 0.61 Capacity limitation
A‐9 Mentone Ave (S 12th St to S 13th St)
8 375 160 1.00 Capacity limitation
A‐10 Mentone Ave (S 10th St to S 12th St)
6 735 173 0.87 Capacity limitation
A‐11 Nice Ave (S 10th St to S 12th St )
8 741 198 0.66 Capacity limitation
A‐12 S 10th St (Mentone Ave to Nice Ave)
8 334 209 0.71 Capacity limitation
A‐13 Ritchie Rd (Ritchie Ct to N 12th St)
8 360 335 1.00 Capacity limitation
A‐14 N 12th St (Ritchie Road to Atlantic City Ave)
8 425 341 1.00 Capacity limitation
A‐15 Atlantic City Ave (N 9th St to N 12th St)
8 1045 376 0.66 Capacity limitation
A‐16 N 9th St (Atlantic Ave to W Grand Ave)
8 2127 509 0.60 ‐ 1.00
Capacity limitation
A‐17 W Grand Ave (8th St to 9th St)
8 369 511 1.00 Capacity limitation
B‐1 S 8th St (W Grand Ave to Rockaway Ave)
10 385 513 0.98 Capacity limitation
B‐2 S 4th St (Longbranch Ave to Trouville Ave)
10 1109 787 0.76 ‐ 1.00
Downstream pipe causes surcharged condition during PHF
B‐3 Manhattan Ave (S 3rd St to 4th St)
12 252 1283 1.00 Capacity limitation

THIS PAGE LEFT INTENTIONALLY BLANK
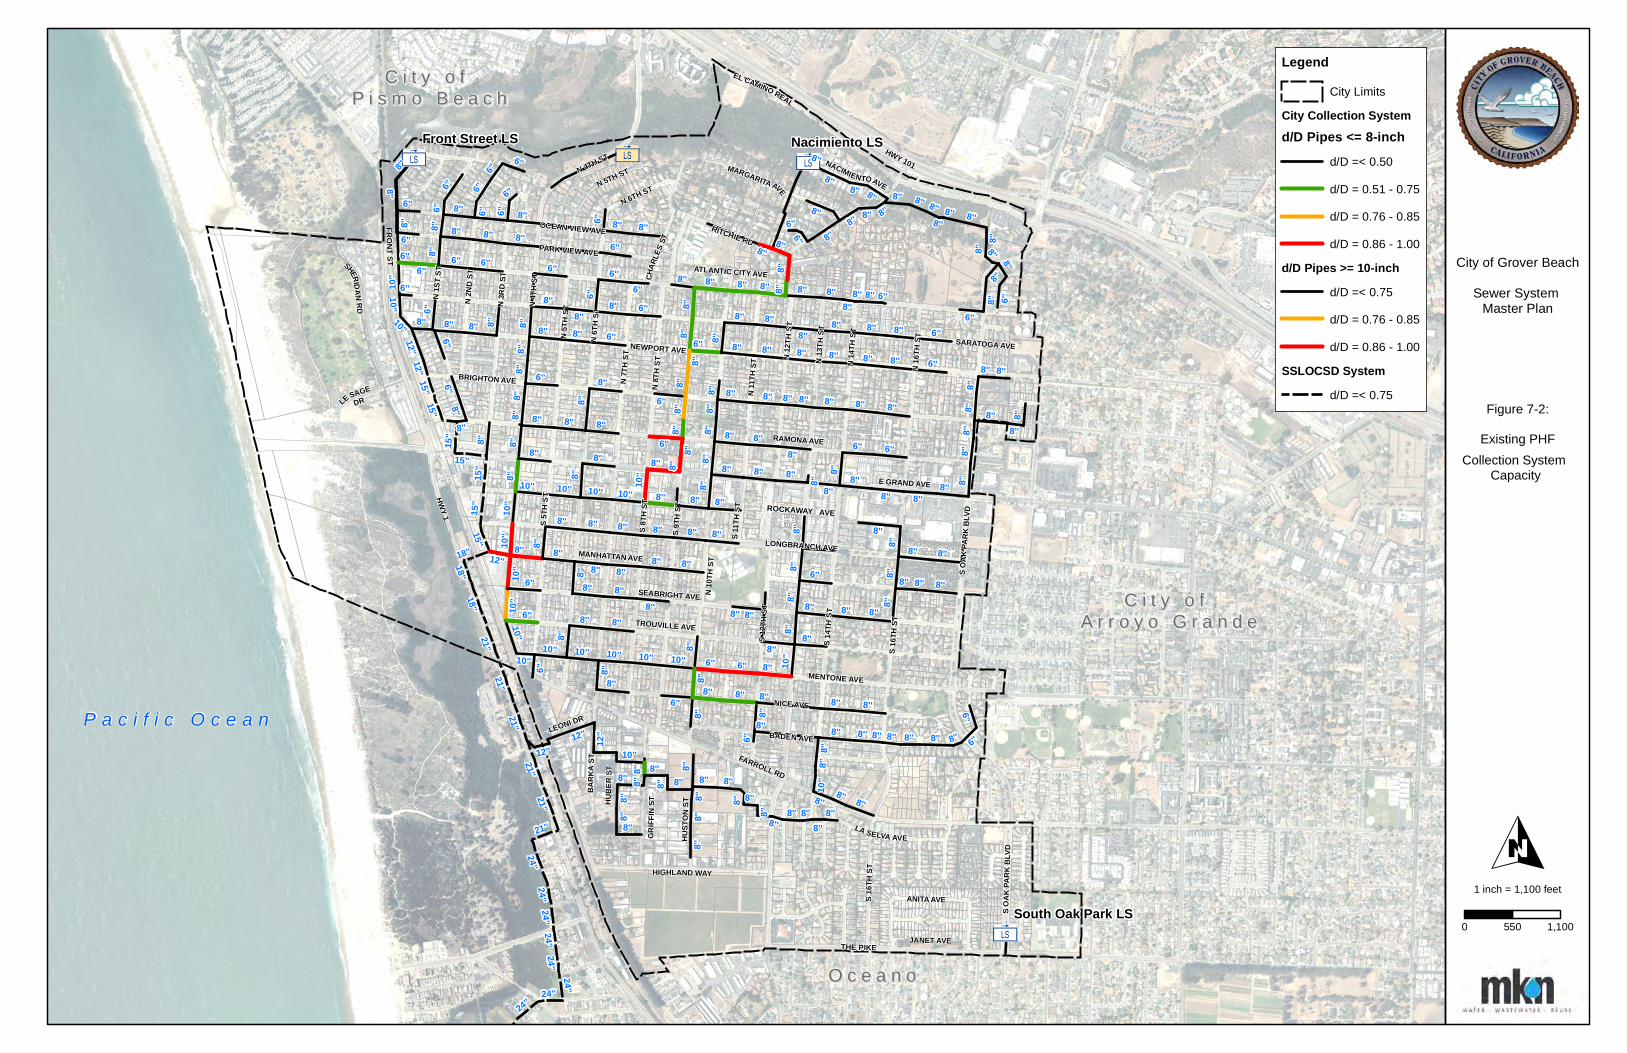
3ä 3ä
3ä
3ä
P a c i f i c O c e a n
C i t y o f C i t y o f A r r o y o G r a n d eA r r o y o G r a n d e
C i t y o f C i t y o f P i s m o B e a c hP i s m o B e a c h
O c e a n oO c e a n o
ROCKAWAY AVE
S OAK
PARK
BLV
D
HWY 101
MENTONE AVE
NACIMIENTOAVEN 5TH ST
FARROLL RD
TROUVILLE AVE
BARK
A ST
N 4TH ST
N 5T
H ST
N 6TH ST
N 2N
D ST
N 3R
D ST
N 1S
T ST
HIGHLAND WAY
CHAR
LES S
T
LA SELVA AVE
ATLANTIC CITY AVE
E GRAND AVE
FRONTST
RITCHIE RD
N16
THS T
S OAK
PARK
BLV
D
N 13
TH S
T
N 11
TH ST
S 14T
H ST
N 8T
H ST
N 10
TH S
T
S 12T
H ST
S 9TH
ST
PARK VIEW AVE
N 6T
H ST
N 4T
H ST
S 8TH
ST
MANHATTAN AVE
SARATOGA AVE
SEABRIGHT AVE
N 7T
H ST
BADEN AVE
LONGBRANCH AVE
OCEAN VIEW AVE
N 12
TH S
T
GRIFF
IN ST
S 11T
H ST
S 5TH
ST
THE PIKE
S 16T
H ST
LE SAGEDR
N 14
TH S
T
LEONI DRNICE AVE
BRIGHTON AVE
RAMONA AVE
NEWPORT AVE
ANITA AVE
JANET AVE
HUBE
R ST
S 16T
H ST
HUST
ON ST
HWY 1
SHERIDANRD
MARGARITA AVE
EL CAMINO REAL
12''
10''
10''
10''
10'' 10''
12''
10''10''
10''
10''
10''
12''
10''
10''
10''
12''
12''
10''
10''
12''
10''
10'' 10''10''
10''
10''
10''
8''
6''8''8''
8''
8''
8''
8''
6''
8''
8''
8''
8''
8''
8''
8''
8''
8''
8''
8''
8''
6''
8''
8''
8''
6''
6''
8''
6''
8''
8''
8''
8''
8''
8''
6''
8''
8''
8''
8''
6''
8''
8''
8''
8''
8''
6''
8''
6''
8''
8''
8''
6''
8''
8''
8''
8''
6''
8''8''
8''
8''
6''
8''
8''
8''
8''
8''8''
8''
6''
8''
6''
6''
8''
8''
8''
8''
6''
8''
8''
8''
8''
8''
8''
8''
8''
8''
6''
8'' 8''
8''
8''
8''
8''
8''
6''
6''
8''
6''
8''
8''
8''
8''
8''
8''8''
6''
8'' 8''
6''
8''
8''
8''
6''
8''
8''
8''
6''
6''
8''
8''
8''
8''
8''
8''
8''8''
8''
8''
8''
8''
8''
8''
8''
8''
8''
8''
8''
8''
6''
8''
8''
8''
8''
6''
8''
8''
8''
8''
8''
8''
8''
8''
8''
8''
8''
8''
6''
8''
8''
6''
8''
8''
8''
8''
8''
8''
6''
8''
8''
8''
8''
8''
8''
8''
8''
8''
8''
8''8''
8''8''
8''
8''
8''
8''
6''
8''
8''
8''
8''
8''
8''
8''
8''
8''
8''
8''
8''
8''
6''
6''
6''
6''
8''
8'' 6''
8''
6''
8''
6''
8''
8''
8''
8''
8''
8''
8''
8''
8''
8''
8''
8''
8''8''
8''
8''
8''
8''
6''
8''
8''
8''
8''6''
8''
8''
6''8''
6''
8''
8''
6''
8''
8''
8''8''
8''
8''
8''
8''
6''
8''
8''
8''
8''
8''
8''
8''
6''
6''
8''
8''
6''
8''
8''
6''
8''
8''
24''
18''
21''
15''
24''
24''
15''
15''
18''
15''
24''
18''21''
21''
24''
15''
21''
21''
24''
15''15''
24''
21''
24''
Nacimiento LSFront Street LS
South Oak Park LS
O
LegendCity Limits
City Collection Systemd/D Pipes <= 8-inch
d/D =< 0.50
d/D = 0.51 - 0.75
d/D = 0.76 - 0.85
d/D = 0.86 - 1.00
d/D Pipes >= 10-inchd/D =< 0.75
d/D = 0.76 - 0.85
d/D = 0.86 - 1.00
SSLOCSD Systemd/D =< 0.75
City of Grover Beach
Sewer System Master Plan
Figure 7-2:
Existing PHF
Collection System Capacity
1 inch = 1,100 feet
0 1,100550

THIS PAGE LEFT INTENTIONALLY BLANK
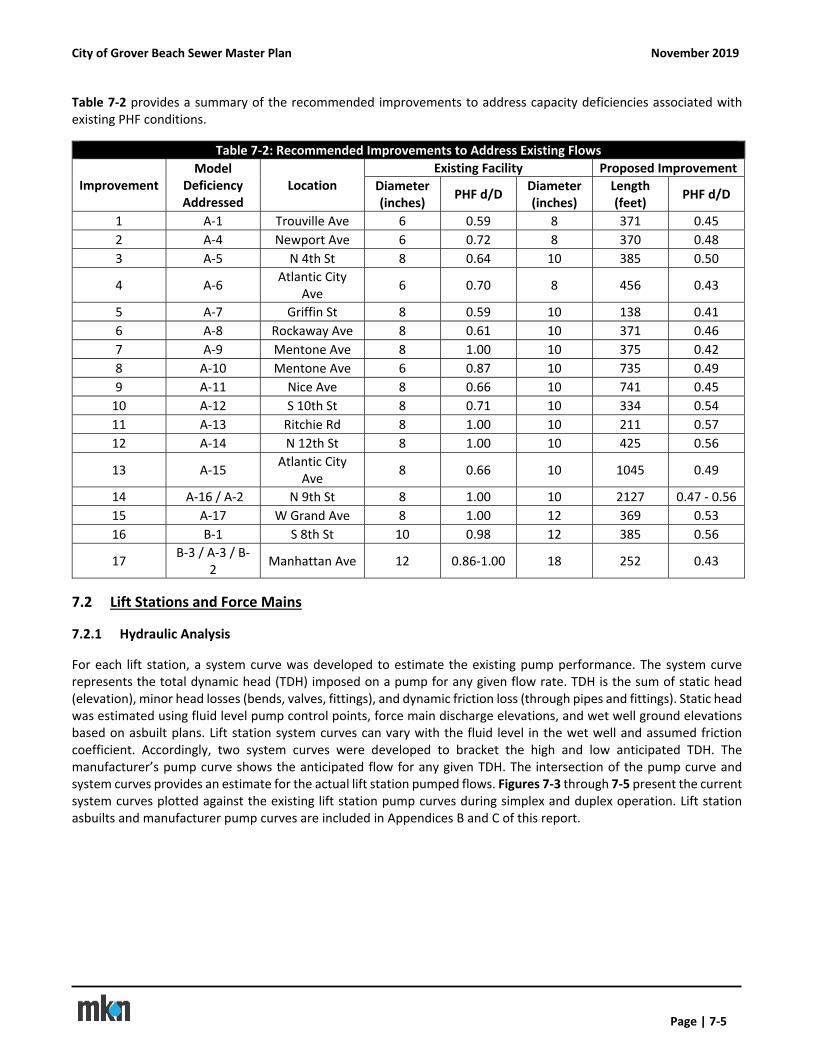
City of Grover Beach Sewer Master Plan November 2019
Page | 7‐5
Table 7‐2 provides a summary of the recommended improvements to address capacity deficiencies associated with existing PHF conditions.
Table 7‐2: Recommended Improvements to Address Existing Flows
Improvement Model
Deficiency Addressed
Location Existing Facility Proposed Improvement
Diameter (inches)
PHF d/D Diameter (inches)
Length (feet)
PHF d/D
1 A‐1 Trouville Ave 6 0.59 8 371 0.45
2 A‐4 Newport Ave 6 0.72 8 370 0.48
3 A‐5 N 4th St 8 0.64 10 385 0.50
4 A‐6 Atlantic City
Ave 6 0.70 8 456 0.43
5 A‐7 Griffin St 8 0.59 10 138 0.41
6 A‐8 Rockaway Ave 8 0.61 10 371 0.46
7 A‐9 Mentone Ave 8 1.00 10 375 0.42
8 A‐10 Mentone Ave 6 0.87 10 735 0.49
9 A‐11 Nice Ave 8 0.66 10 741 0.45
10 A‐12 S 10th St 8 0.71 10 334 0.54
11 A‐13 Ritchie Rd 8 1.00 10 211 0.57
12 A‐14 N 12th St 8 1.00 10 425 0.56
13 A‐15 Atlantic City
Ave 8 0.66 10 1045 0.49
14 A‐16 / A‐2 N 9th St 8 1.00 10 2127 0.47 ‐ 0.56
15 A‐17 W Grand Ave 8 1.00 12 369 0.53
16 B‐1 S 8th St 10 0.98 12 385 0.56
17 B‐3 / A‐3 / B‐
2 Manhattan Ave 12 0.86‐1.00 18 252 0.43
7.2 Lift Stations and Force Mains
7.2.1 Hydraulic Analysis
For each lift station, a system curve was developed to estimate the existing pump performance. The system curve represents the total dynamic head (TDH) imposed on a pump for any given flow rate. TDH is the sum of static head (elevation), minor head losses (bends, valves, fittings), and dynamic friction loss (through pipes and fittings). Static head was estimated using fluid level pump control points, force main discharge elevations, and wet well ground elevations based on asbuilt plans. Lift station system curves can vary with the fluid level in the wet well and assumed friction coefficient. Accordingly, two system curves were developed to bracket the high and low anticipated TDH. The manufacturer’s pump curve shows the anticipated flow for any given TDH. The intersection of the pump curve and system curves provides an estimate for the actual lift station pumped flows. Figures 7‐3 through 7‐5 present the current system curves plotted against the existing lift station pump curves during simplex and duplex operation. Lift station asbuilts and manufacturer pump curves are included in Appendices B and C of this report.
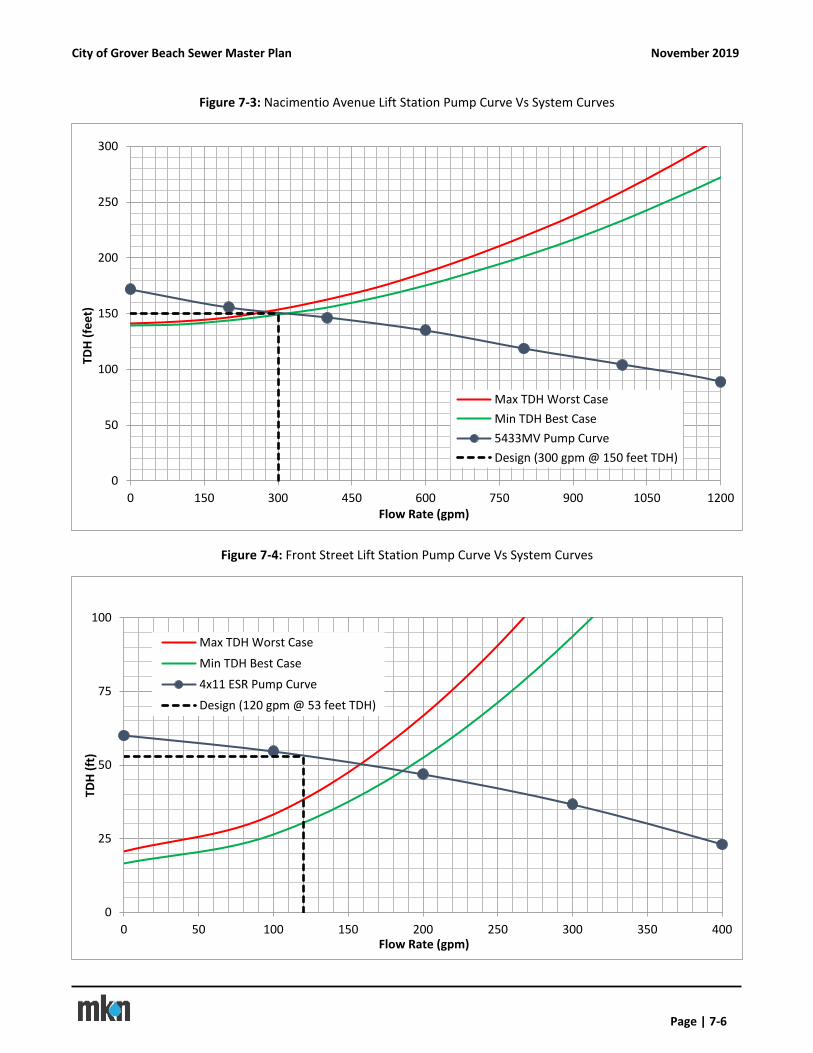
City of Grover Beach Sewer Master Plan November 2019
Page | 7‐6
Figure 7‐3: Nacimentio Avenue Lift Station Pump Curve Vs System Curves
Figure 7‐4: Front Street Lift Station Pump Curve Vs System Curves
0
50
100
150
200
250
300
0 150 300 450 600 750 900 1050 1200
TDH (feet)
Flow Rate (gpm)
Max TDH Worst Case
Min TDH Best Case
5433MV Pump Curve
Design (300 gpm @ 150 feet TDH)
0
25
50
75
100
0 50 100 150 200 250 300 350 400
TDH (ft)
Flow Rate (gpm)
Max TDH Worst Case
Min TDH Best Case
4x11 ESR Pump Curve
Design (120 gpm @ 53 feet TDH)
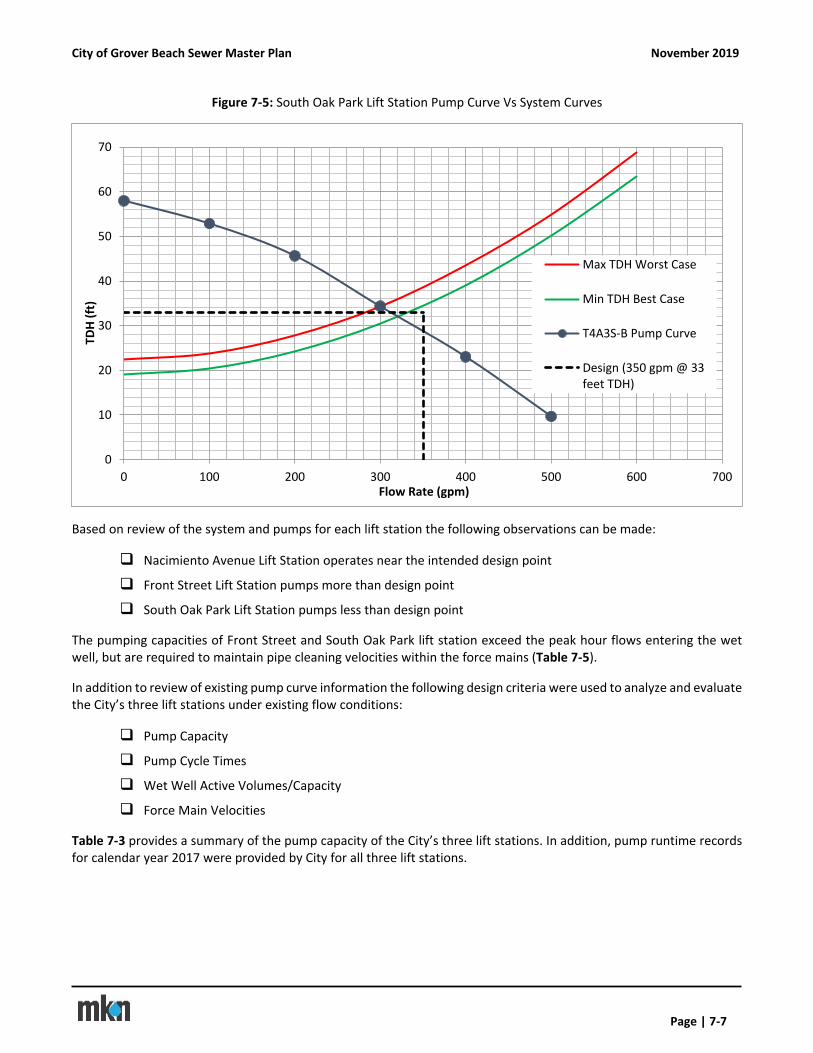
City of Grover Beach Sewer Master Plan November 2019
Page | 7‐7
Figure 7‐5: South Oak Park Lift Station Pump Curve Vs System Curves
Based on review of the system and pumps for each lift station the following observations can be made:
Nacimiento Avenue Lift Station operates near the intended design point
Front Street Lift Station pumps more than design point
South Oak Park Lift Station pumps less than design point
The pumping capacities of Front Street and South Oak Park lift station exceed the peak hour flows entering the wet well, but are required to maintain pipe cleaning velocities within the force mains (Table 7‐5).
In addition to review of existing pump curve information the following design criteria were used to analyze and evaluate the City’s three lift stations under existing flow conditions:
Pump Capacity
Pump Cycle Times
Wet Well Active Volumes/Capacity
Force Main Velocities
Table 7‐3 provides a summary of the pump capacity of the City’s three lift stations. In addition, pump runtime records for calendar year 2017 were provided by City for all three lift stations.
0
10
20
30
40
50
60
70
0 100 200 300 400 500 600 700
TDH (ft)
Flow Rate (gpm)
Max TDH Worst Case
Min TDH Best Case
T4A3S‐B Pump Curve
Design (350 gpm @ 33feet TDH)
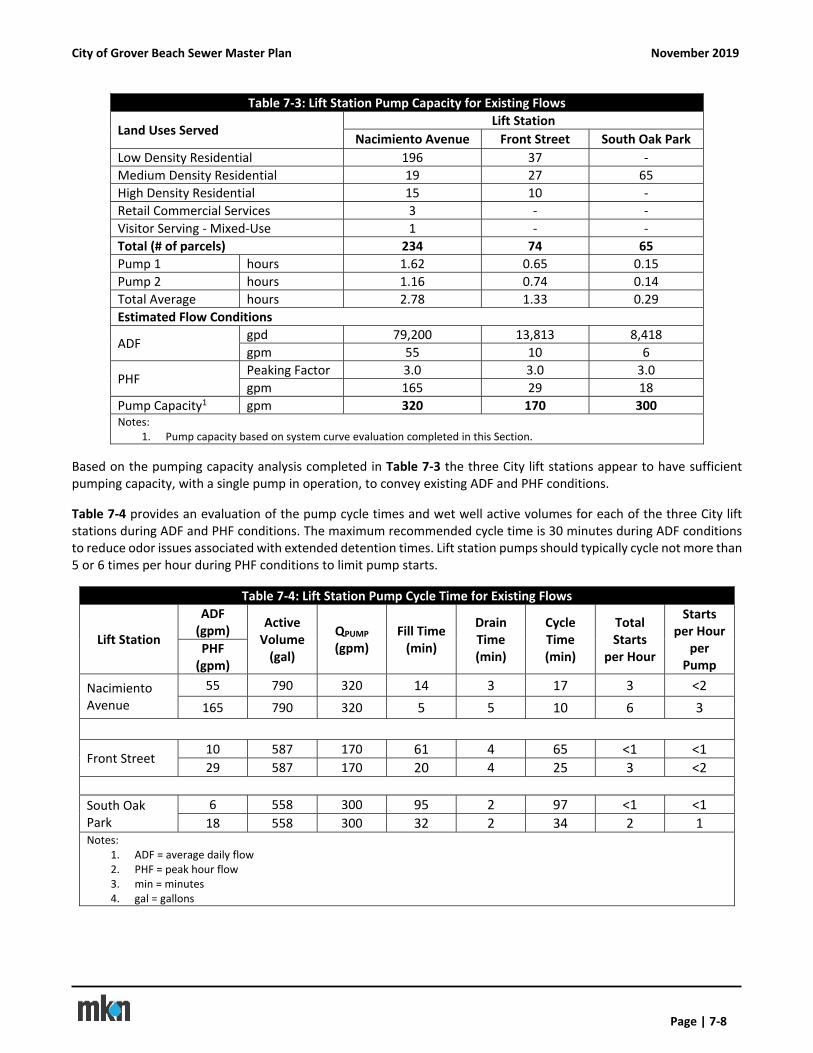
City of Grover Beach Sewer Master Plan November 2019
Page | 7‐8
Table 7‐3: Lift Station Pump Capacity for Existing Flows
Land Uses Served Lift Station
Nacimiento Avenue Front Street South Oak Park
Low Density Residential 196 37 ‐
Medium Density Residential 19 27 65
High Density Residential 15 10 ‐
Retail Commercial Services 3 ‐ ‐
Visitor Serving ‐ Mixed‐Use 1 ‐ ‐
Total (# of parcels) 234 74 65
Pump 1 hours 1.62 0.65 0.15
Pump 2 hours 1.16 0.74 0.14
Total Average hours 2.78 1.33 0.29
Estimated Flow Conditions
ADF gpd 79,200 13,813 8,418
gpm 55 10 6
PHF Peaking Factor 3.0 3.0 3.0
gpm 165 29 18
Pump Capacity1 gpm 320 170 300 Notes:
1. Pump capacity based on system curve evaluation completed in this Section.
Based on the pumping capacity analysis completed in Table 7‐3 the three City lift stations appear to have sufficient pumping capacity, with a single pump in operation, to convey existing ADF and PHF conditions.
Table 7‐4 provides an evaluation of the pump cycle times and wet well active volumes for each of the three City lift stations during ADF and PHF conditions. The maximum recommended cycle time is 30 minutes during ADF conditions to reduce odor issues associated with extended detention times. Lift station pumps should typically cycle not more than 5 or 6 times per hour during PHF conditions to limit pump starts.
Table 7‐4: Lift Station Pump Cycle Time for Existing Flows
Lift Station
ADF (gpm)
Active Volume (gal)
QPUMP
(gpm) Fill Time (min)
Drain Time (min)
Cycle Time (min)
Total Starts
per Hour
Starts per Hour
per Pump
PHF (gpm)
Nacimiento Avenue
55 790 320 14 3 17 3 <2
165 790 320 5 5 10 6 3
Front Street 10 587 170 61 4 65 <1 <1
29 587 170 20 4 25 3 <2
South Oak Park
6 558 300 95 2 97 <1 <1
18 558 300 32 2 34 2 1 Notes:
1. ADF = average daily flow 2. PHF = peak hour flow 3. min = minutes 4. gal = gallons
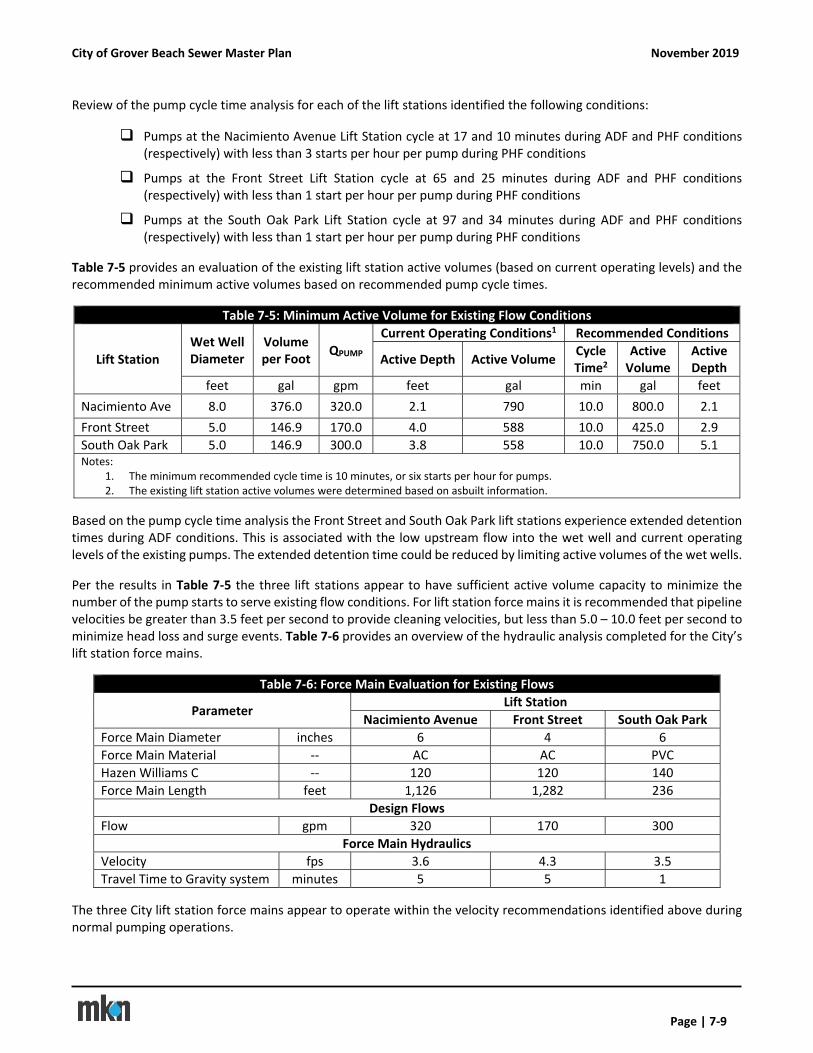
City of Grover Beach Sewer Master Plan November 2019
Page | 7‐9
Review of the pump cycle time analysis for each of the lift stations identified the following conditions:
Pumps at the Nacimiento Avenue Lift Station cycle at 17 and 10 minutes during ADF and PHF conditions (respectively) with less than 3 starts per hour per pump during PHF conditions
Pumps at the Front Street Lift Station cycle at 65 and 25 minutes during ADF and PHF conditions (respectively) with less than 1 start per hour per pump during PHF conditions
Pumps at the South Oak Park Lift Station cycle at 97 and 34 minutes during ADF and PHF conditions (respectively) with less than 1 start per hour per pump during PHF conditions
Table 7‐5 provides an evaluation of the existing lift station active volumes (based on current operating levels) and the recommended minimum active volumes based on recommended pump cycle times.
Table 7‐5: Minimum Active Volume for Existing Flow Conditions
Lift Station Wet Well Diameter
Volume per Foot
QPUMP Current Operating Conditions1 Recommended Conditions
Active Depth Active Volume Cycle Time2
Active Volume
Active Depth
feet gal gpm feet gal min gal feet
Nacimiento Ave 8.0 376.0 320.0 2.1 790 10.0 800.0 2.1
Front Street 5.0 146.9 170.0 4.0 588 10.0 425.0 2.9
South Oak Park 5.0 146.9 300.0 3.8 558 10.0 750.0 5.1 Notes:
1. The minimum recommended cycle time is 10 minutes, or six starts per hour for pumps. 2. The existing lift station active volumes were determined based on asbuilt information.
Based on the pump cycle time analysis the Front Street and South Oak Park lift stations experience extended detention times during ADF conditions. This is associated with the low upstream flow into the wet well and current operating levels of the existing pumps. The extended detention time could be reduced by limiting active volumes of the wet wells.
Per the results in Table 7‐5 the three lift stations appear to have sufficient active volume capacity to minimize the number of the pump starts to serve existing flow conditions. For lift station force mains it is recommended that pipeline velocities be greater than 3.5 feet per second to provide cleaning velocities, but less than 5.0 – 10.0 feet per second to minimize head loss and surge events. Table 7‐6 provides an overview of the hydraulic analysis completed for the City’s lift station force mains.
Table 7‐6: Force Main Evaluation for Existing Flows
Parameter Lift Station
Nacimiento Avenue Front Street South Oak Park
Force Main Diameter inches 6 4 6
Force Main Material ‐‐ AC AC PVC
Hazen Williams C ‐‐ 120 120 140
Force Main Length feet 1,126 1,282 236
Design Flows
Flow gpm 320 170 300
Force Main Hydraulics
Velocity fps 3.6 4.3 3.5
Travel Time to Gravity system minutes 5 5 1
The three City lift station force mains appear to operate within the velocity recommendations identified above during normal pumping operations.
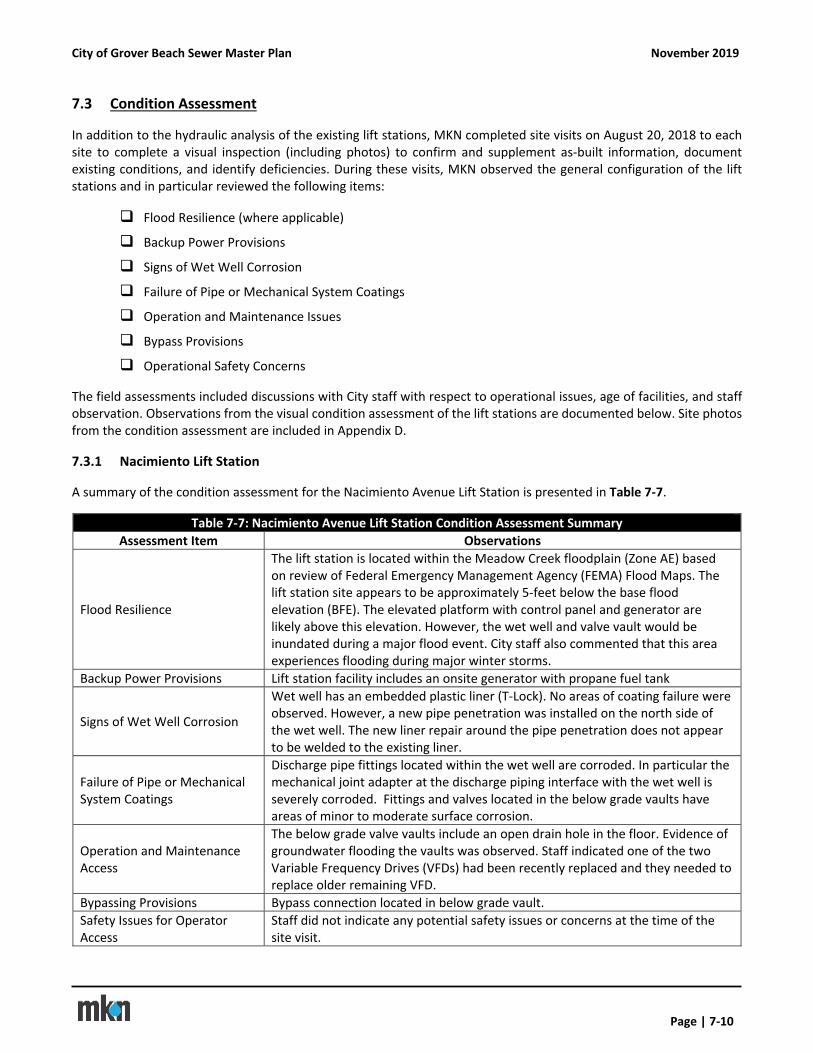
City of Grover Beach Sewer Master Plan November 2019
Page | 7‐10
7.3 Condition Assessment
In addition to the hydraulic analysis of the existing lift stations, MKN completed site visits on August 20, 2018 to each site to complete a visual inspection (including photos) to confirm and supplement as‐built information, document existing conditions, and identify deficiencies. During these visits, MKN observed the general configuration of the lift stations and in particular reviewed the following items:
Flood Resilience (where applicable)
Backup Power Provisions
Signs of Wet Well Corrosion
Failure of Pipe or Mechanical System Coatings
Operation and Maintenance Issues
Bypass Provisions
Operational Safety Concerns
The field assessments included discussions with City staff with respect to operational issues, age of facilities, and staff observation. Observations from the visual condition assessment of the lift stations are documented below. Site photos from the condition assessment are included in Appendix D.
7.3.1 Nacimiento Lift Station
A summary of the condition assessment for the Nacimiento Avenue Lift Station is presented in Table 7‐7.
Table 7‐7: Nacimiento Avenue Lift Station Condition Assessment Summary
Assessment Item Observations
Flood Resilience
The lift station is located within the Meadow Creek floodplain (Zone AE) based on review of Federal Emergency Management Agency (FEMA) Flood Maps. The lift station site appears to be approximately 5‐feet below the base flood elevation (BFE). The elevated platform with control panel and generator are likely above this elevation. However, the wet well and valve vault would be inundated during a major flood event. City staff also commented that this area experiences flooding during major winter storms.
Backup Power Provisions Lift station facility includes an onsite generator with propane fuel tank
Signs of Wet Well Corrosion
Wet well has an embedded plastic liner (T‐Lock). No areas of coating failure were observed. However, a new pipe penetration was installed on the north side of the wet well. The new liner repair around the pipe penetration does not appear to be welded to the existing liner.
Failure of Pipe or Mechanical System Coatings
Discharge pipe fittings located within the wet well are corroded. In particular the mechanical joint adapter at the discharge piping interface with the wet well is severely corroded. Fittings and valves located in the below grade vaults have areas of minor to moderate surface corrosion.
Operation and Maintenance Access
The below grade valve vaults include an open drain hole in the floor. Evidence of groundwater flooding the vaults was observed. Staff indicated one of the two Variable Frequency Drives (VFDs) had been recently replaced and they needed to replace older remaining VFD.
Bypassing Provisions Bypass connection located in below grade vault.
Safety Issues for Operator Access
Staff did not indicate any potential safety issues or concerns at the time of the site visit.
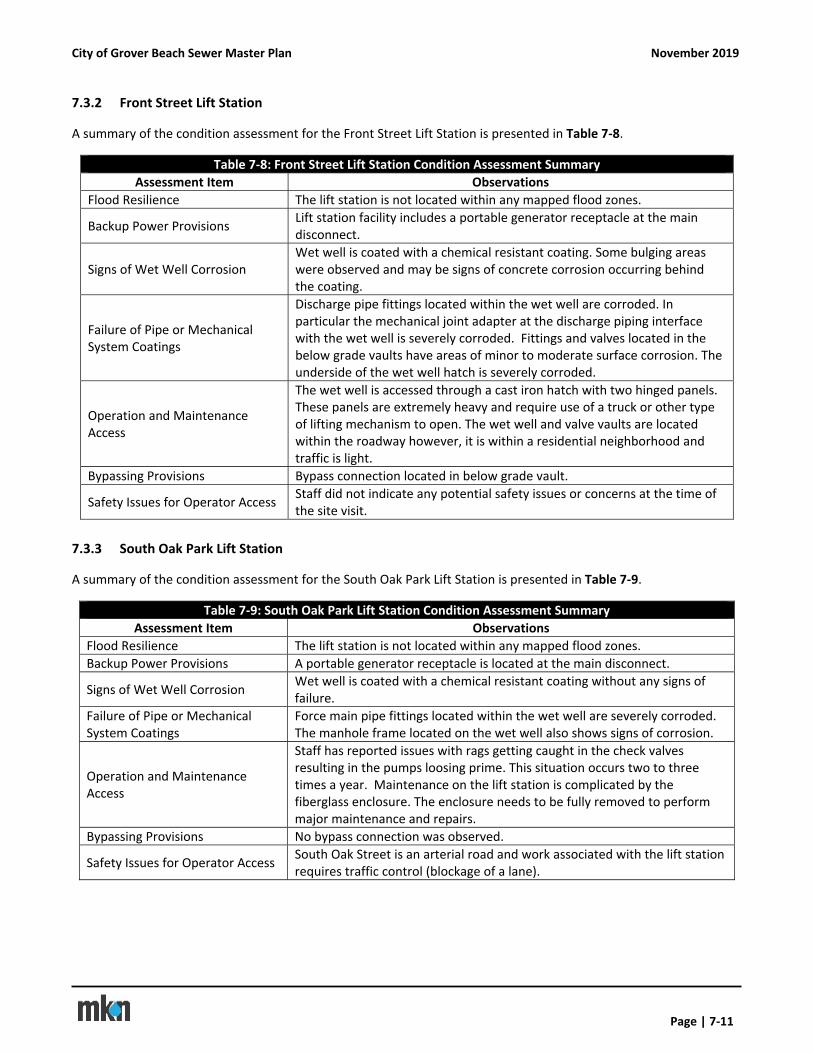
City of Grover Beach Sewer Master Plan November 2019
Page | 7‐11
7.3.2 Front Street Lift Station
A summary of the condition assessment for the Front Street Lift Station is presented in Table 7‐8.
Table 7‐8: Front Street Lift Station Condition Assessment Summary
Assessment Item Observations
Flood Resilience The lift station is not located within any mapped flood zones.
Backup Power Provisions Lift station facility includes a portable generator receptacle at the main disconnect.
Signs of Wet Well Corrosion Wet well is coated with a chemical resistant coating. Some bulging areas were observed and may be signs of concrete corrosion occurring behind the coating.
Failure of Pipe or Mechanical System Coatings
Discharge pipe fittings located within the wet well are corroded. In particular the mechanical joint adapter at the discharge piping interface with the wet well is severely corroded. Fittings and valves located in the below grade vaults have areas of minor to moderate surface corrosion. The underside of the wet well hatch is severely corroded.
Operation and Maintenance Access
The wet well is accessed through a cast iron hatch with two hinged panels. These panels are extremely heavy and require use of a truck or other type of lifting mechanism to open. The wet well and valve vaults are located within the roadway however, it is within a residential neighborhood and traffic is light.
Bypassing Provisions Bypass connection located in below grade vault.
Safety Issues for Operator Access Staff did not indicate any potential safety issues or concerns at the time of the site visit.
7.3.3 South Oak Park Lift Station
A summary of the condition assessment for the South Oak Park Lift Station is presented in Table 7‐9.
Table 7‐9: South Oak Park Lift Station Condition Assessment Summary
Assessment Item Observations
Flood Resilience The lift station is not located within any mapped flood zones.
Backup Power Provisions A portable generator receptacle is located at the main disconnect.
Signs of Wet Well Corrosion Wet well is coated with a chemical resistant coating without any signs of failure.
Failure of Pipe or Mechanical System Coatings
Force main pipe fittings located within the wet well are severely corroded. The manhole frame located on the wet well also shows signs of corrosion.
Operation and Maintenance Access
Staff has reported issues with rags getting caught in the check valves resulting in the pumps loosing prime. This situation occurs two to three times a year. Maintenance on the lift station is complicated by the fiberglass enclosure. The enclosure needs to be fully removed to perform major maintenance and repairs.
Bypassing Provisions No bypass connection was observed.
Safety Issues for Operator Access South Oak Street is an arterial road and work associated with the lift station requires traffic control (blockage of a lane).
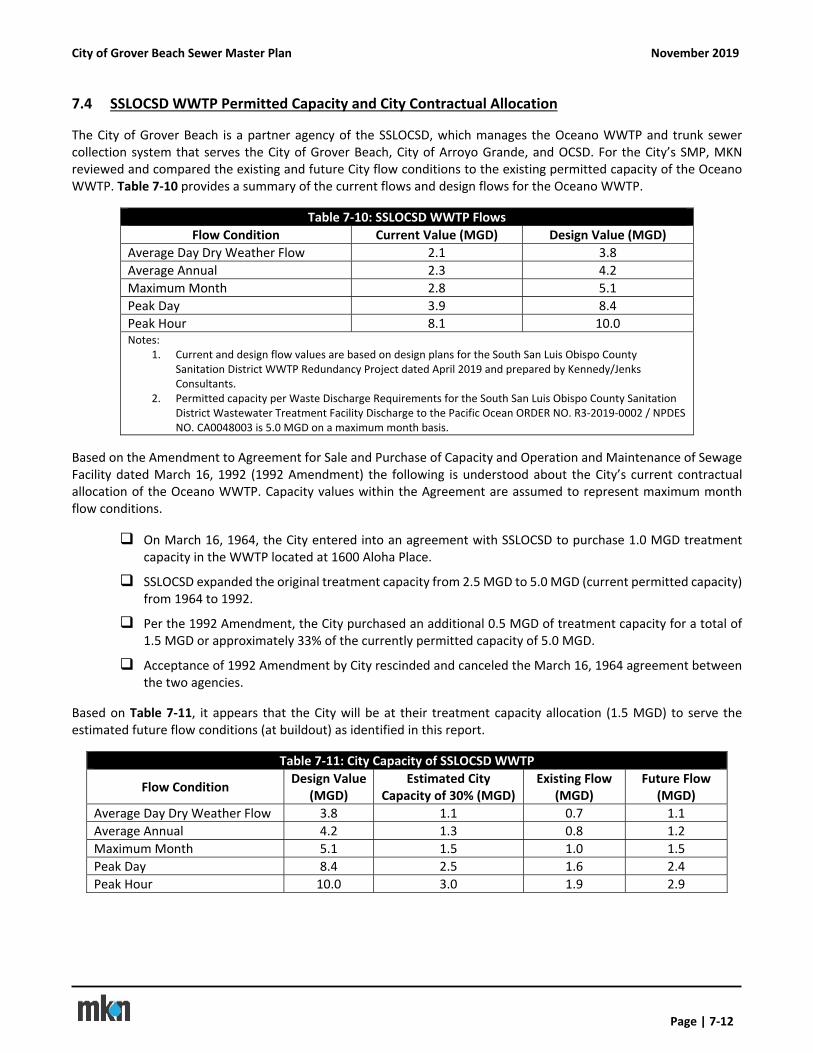
City of Grover Beach Sewer Master Plan November 2019
Page | 7‐12
7.4 SSLOCSD WWTP Permitted Capacity and City Contractual Allocation
The City of Grover Beach is a partner agency of the SSLOCSD, which manages the Oceano WWTP and trunk sewer collection system that serves the City of Grover Beach, City of Arroyo Grande, and OCSD. For the City’s SMP, MKN reviewed and compared the existing and future City flow conditions to the existing permitted capacity of the Oceano WWTP. Table 7‐10 provides a summary of the current flows and design flows for the Oceano WWTP.
Table 7‐10: SSLOCSD WWTP Flows
Flow Condition Current Value (MGD) Design Value (MGD)
Average Day Dry Weather Flow 2.1 3.8
Average Annual 2.3 4.2
Maximum Month 2.8 5.1
Peak Day 3.9 8.4
Peak Hour 8.1 10.0 Notes:
1. Current and design flow values are based on design plans for the South San Luis Obispo County Sanitation District WWTP Redundancy Project dated April 2019 and prepared by Kennedy/Jenks Consultants.
2. Permitted capacity per Waste Discharge Requirements for the South San Luis Obispo County Sanitation District Wastewater Treatment Facility Discharge to the Pacific Ocean ORDER NO. R3‐2019‐0002 / NPDES NO. CA0048003 is 5.0 MGD on a maximum month basis.
Based on the Amendment to Agreement for Sale and Purchase of Capacity and Operation and Maintenance of Sewage Facility dated March 16, 1992 (1992 Amendment) the following is understood about the City’s current contractual allocation of the Oceano WWTP. Capacity values within the Agreement are assumed to represent maximum month flow conditions.
On March 16, 1964, the City entered into an agreement with SSLOCSD to purchase 1.0 MGD treatment capacity in the WWTP located at 1600 Aloha Place.
SSLOCSD expanded the original treatment capacity from 2.5 MGD to 5.0 MGD (current permitted capacity) from 1964 to 1992.
Per the 1992 Amendment, the City purchased an additional 0.5 MGD of treatment capacity for a total of 1.5 MGD or approximately 33% of the currently permitted capacity of 5.0 MGD.
Acceptance of 1992 Amendment by City rescinded and canceled the March 16, 1964 agreement between the two agencies.
Based on Table 7‐11, it appears that the City will be at their treatment capacity allocation (1.5 MGD) to serve the estimated future flow conditions (at buildout) as identified in this report.
Table 7‐11: City Capacity of SSLOCSD WWTP
Flow Condition Design Value
(MGD) Estimated City
Capacity of 30% (MGD) Existing Flow
(MGD) Future Flow
(MGD)
Average Day Dry Weather Flow 3.8 1.1 0.7 1.1
Average Annual 4.2 1.3 0.8 1.2
Maximum Month 5.1 1.5 1.0 1.5
Peak Day 8.4 2.5 1.6 2.4
Peak Hour 10.0 3.0 1.9 2.9
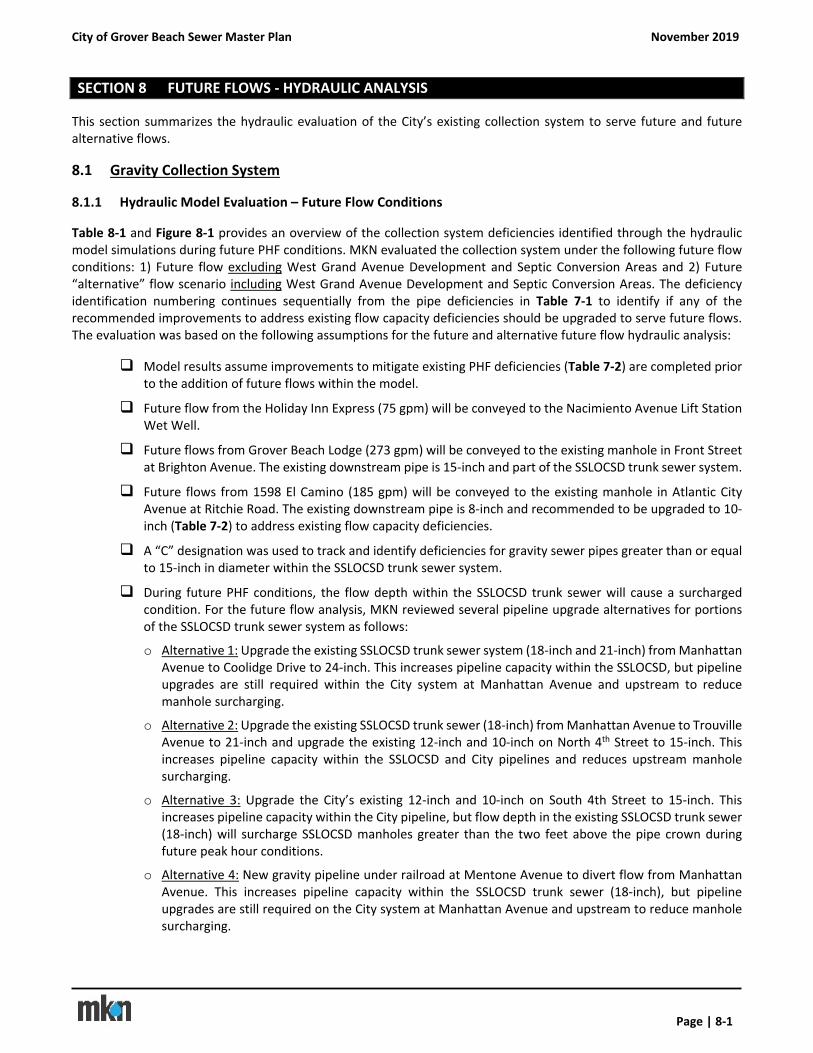
City of Grover Beach Sewer Master Plan November 2019
Page | 8‐1
SECTION 8 FUTURE FLOWS ‐ HYDRAULIC ANALYSIS
This section summarizes the hydraulic evaluation of the City’s existing collection system to serve future and future alternative flows.
8.1 Gravity Collection System
8.1.1 Hydraulic Model Evaluation – Future Flow Conditions
Table 8‐1 and Figure 8‐1 provides an overview of the collection system deficiencies identified through the hydraulic model simulations during future PHF conditions. MKN evaluated the collection system under the following future flow conditions: 1) Future flow excluding West Grand Avenue Development and Septic Conversion Areas and 2) Future “alternative” flow scenario including West Grand Avenue Development and Septic Conversion Areas. The deficiency identification numbering continues sequentially from the pipe deficiencies in Table 7‐1 to identify if any of the recommended improvements to address existing flow capacity deficiencies should be upgraded to serve future flows. The evaluation was based on the following assumptions for the future and alternative future flow hydraulic analysis:
Model results assume improvements to mitigate existing PHF deficiencies (Table 7‐2) are completed prior to the addition of future flows within the model.
Future flow from the Holiday Inn Express (75 gpm) will be conveyed to the Nacimiento Avenue Lift Station Wet Well.
Future flows from Grover Beach Lodge (273 gpm) will be conveyed to the existing manhole in Front Street at Brighton Avenue. The existing downstream pipe is 15‐inch and part of the SSLOCSD trunk sewer system.
Future flows from 1598 El Camino (185 gpm) will be conveyed to the existing manhole in Atlantic City Avenue at Ritchie Road. The existing downstream pipe is 8‐inch and recommended to be upgraded to 10‐inch (Table 7‐2) to address existing flow capacity deficiencies.
A “C” designation was used to track and identify deficiencies for gravity sewer pipes greater than or equal to 15‐inch in diameter within the SSLOCSD trunk sewer system.
During future PHF conditions, the flow depth within the SSLOCSD trunk sewer will cause a surcharged condition. For the future flow analysis, MKN reviewed several pipeline upgrade alternatives for portions of the SSLOCSD trunk sewer system as follows:
o Alternative 1: Upgrade the existing SSLOCSD trunk sewer system (18‐inch and 21‐inch) from Manhattan Avenue to Coolidge Drive to 24‐inch. This increases pipeline capacity within the SSLOCSD, but pipeline upgrades are still required within the City system at Manhattan Avenue and upstream to reduce manhole surcharging.
o Alternative 2: Upgrade the existing SSLOCSD trunk sewer (18‐inch) from Manhattan Avenue to Trouville Avenue to 21‐inch and upgrade the existing 12‐inch and 10‐inch on North 4th Street to 15‐inch. This increases pipeline capacity within the SSLOCSD and City pipelines and reduces upstream manhole surcharging.
o Alternative 3: Upgrade the City’s existing 12‐inch and 10‐inch on South 4th Street to 15‐inch. This increases pipeline capacity within the City pipeline, but flow depth in the existing SSLOCSD trunk sewer (18‐inch) will surcharge SSLOCSD manholes greater than the two feet above the pipe crown during future peak hour conditions.
o Alternative 4: New gravity pipeline under railroad at Mentone Avenue to divert flow from Manhattan Avenue. This increases pipeline capacity within the SSLOCSD trunk sewer (18‐inch), but pipeline upgrades are still required on the City system at Manhattan Avenue and upstream to reduce manhole surcharging.
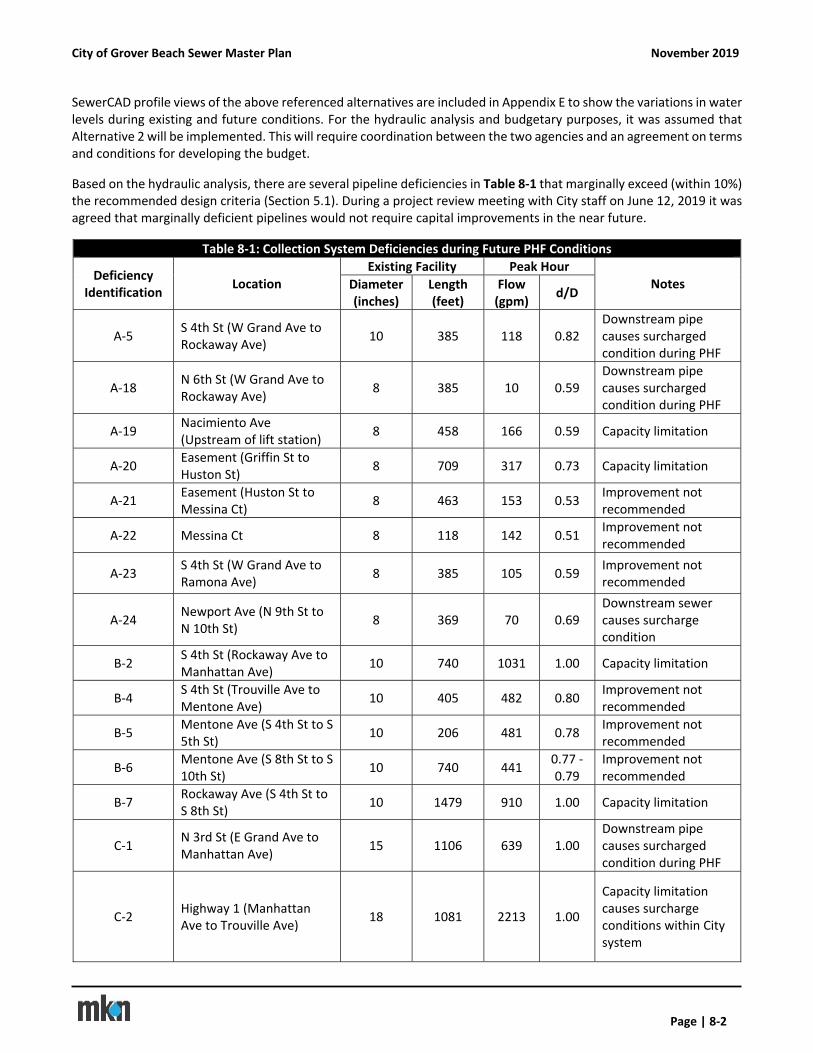
City of Grover Beach Sewer Master Plan November 2019
Page | 8‐2
SewerCAD profile views of the above referenced alternatives are included in Appendix E to show the variations in water levels during existing and future conditions. For the hydraulic analysis and budgetary purposes, it was assumed that Alternative 2 will be implemented. This will require coordination between the two agencies and an agreement on terms and conditions for developing the budget.
Based on the hydraulic analysis, there are several pipeline deficiencies in Table 8‐1 that marginally exceed (within 10%) the recommended design criteria (Section 5.1). During a project review meeting with City staff on June 12, 2019 it was agreed that marginally deficient pipelines would not require capital improvements in the near future.
Table 8‐1: Collection System Deficiencies during Future PHF Conditions
Deficiency Identification
Location Existing Facility Peak Hour
Notes Diameter (inches)
Length (feet)
Flow (gpm)
d/D
A‐5 S 4th St (W Grand Ave to Rockaway Ave)
10 385 118 0.82 Downstream pipe causes surcharged condition during PHF
A‐18 N 6th St (W Grand Ave to Rockaway Ave)
8 385 10 0.59 Downstream pipe causes surcharged condition during PHF
A‐19 Nacimiento Ave (Upstream of lift station)
8 458 166 0.59 Capacity limitation
A‐20 Easement (Griffin St to Huston St)
8 709 317 0.73 Capacity limitation
A‐21 Easement (Huston St to Messina Ct)
8 463 153 0.53 Improvement not recommended
A‐22 Messina Ct 8 118 142 0.51 Improvement not recommended
A‐23 S 4th St (W Grand Ave to Ramona Ave)
8 385 105 0.59 Improvement not recommended
A‐24 Newport Ave (N 9th St to N 10th St)
8 369 70 0.69 Downstream sewer causes surcharge condition
B‐2 S 4th St (Rockaway Ave to Manhattan Ave)
10 740 1031 1.00 Capacity limitation
B‐4 S 4th St (Trouville Ave to Mentone Ave)
10 405 482 0.80 Improvement not recommended
B‐5 Mentone Ave (S 4th St to S 5th St)
10 206 481 0.78 Improvement not recommended
B‐6 Mentone Ave (S 8th St to S 10th St)
10 740 441 0.77 ‐ 0.79
Improvement not recommended
B‐7 Rockaway Ave (S 4th St to S 8th St)
10 1479 910 1.00 Capacity limitation
C‐1 N 3rd St (E Grand Ave to Manhattan Ave)
15 1106 639 1.00 Downstream pipe causes surcharged condition during PHF
C‐2 Highway 1 (Manhattan Ave to Trouville Ave)
18 1081 2213 1.00
Capacity limitation causes surcharge conditions within City system
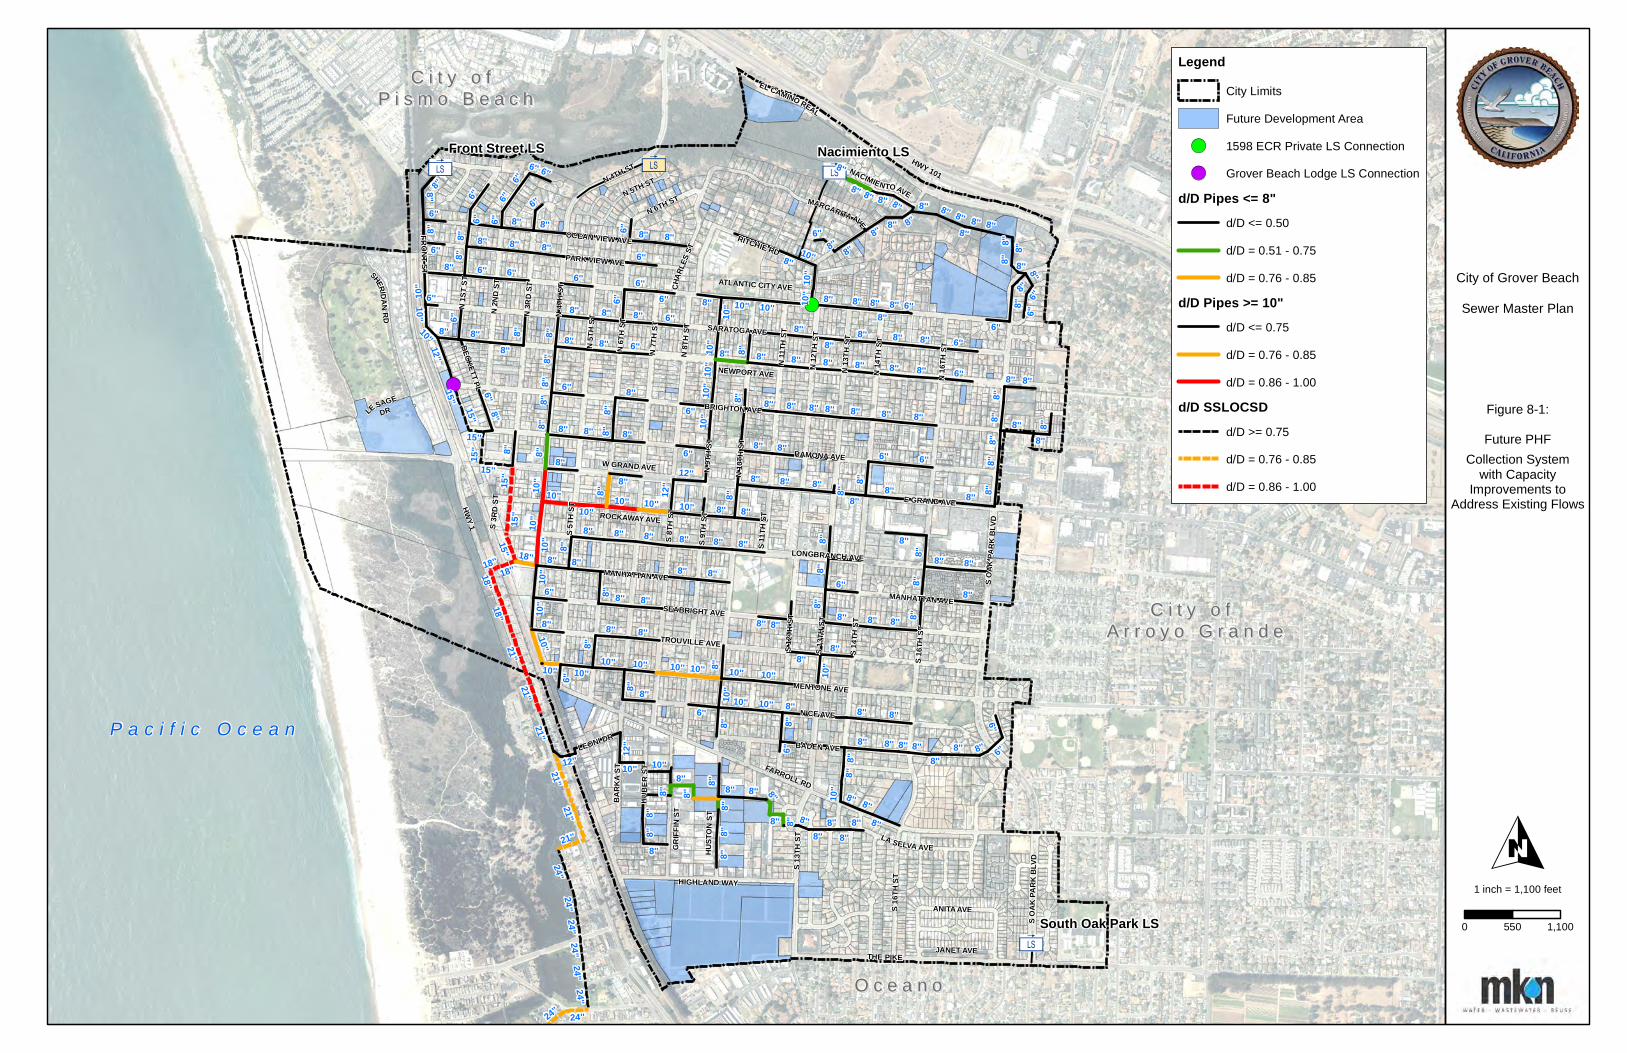
3ä 3ä
3ä
3ä
!(
!(
P a c i f i c O c e a n
C i t y o f C i t y o f A r r o y o G r a n d eA r r o y o G r a n d e
C i t y o f C i t y o f P i s m o B e a c hP i s m o B e a c h
O c e a n oO c e a n o
S OAK
PARK
BLV
D
HWY 101
MENTONE AVE
NACIMIENTOAVEN 5TH ST
FARROLL RD
TROUVILLE AVE
BARK
A ST
N 4TH ST
N 5T
H ST
N 6TH ST
N 2N
D ST
N 3R
D ST
N 1S
T ST
HIGHLAND WAY
CHAR
LES S
T
LA SELVA AVE
ATLANTIC CITY AVE
E GRAND AVE
FRONTST
S 13T
H ST
RITCHIE RD
N16
THST
S OAK
PARK
BLV
D
N 13
TH S
T
N 11
TH ST
S 14T
H ST
N 8T
H ST
W GRAND AVE
N 10
TH S
T
S 12T
H ST
ROCKAWAY AVE
S 9TH
ST
PARK VIEW AVE
N 6T
H ST
N 4T
H ST
S 8TH
ST
MANHATTAN AVE
MANHATTAN AVE
SARATOGA AVE
SEABRIGHT AVE
N 7T
H ST
BADEN AVE
LONGBRANCH AVE
OCEAN VIEW AVE
N 9T
H ST
N 12
TH S
T
S3R
DST
GRIFF
IN ST
S 11T
H ST
S 5TH
ST
THE PIKE
S 16T
H ST
LE SAGEDR
N 14
TH S
T
LEONI DR
BECKETT PL
NICE AVE
BRIGHTON AVE
RAMONA AVE
NEWPORT AVE
ANITA AVE
JANET AVE
HUBE
R ST
S 16T
H ST
HUST
ON ST
HWY 1
SHERIDANRD
MARGARITA AVE
EL CAMINO REAL
S 13T
H ST
24''
18''
21''
15''
15''
18''
24''24''
18''
18''
15''
15''
21''
21''
24''
15''
24''
15''
24''
21''
21''
21''
24''
24''
15''
15''
8''
6''8''
6''
8''
6''
8''
8''
8''
8''
8''
6''
6''
8''8''
8''
8''8''
8''
6''
6''
8''
8''
8''8''
8''
8''
6''
8''
8''
8''
8''
6''
8''
8''
8''
8''
6''
8''
8''
8''
8''
6''
8''
8''
8''
8''
8''
8''
8''
8''
8''
6''
8''
8''
8''
8''
8''
8''8''
6''
6''
8''8''
8''
8''
6''
8''
8''
6''
8''
8''
8''
8''
8''
8''
8''
8''
8''
8''
8''6''8''
8''8''
8''
8''
8''
8''
8''
8''
8''
8''
8''
8''
8''
8''
8''
8''
8''
8''
8''
8''8''
6''
8''
8''
8''
6''8''
6''
8''
8''
6''
8''
8''8''
8''
8''
6''
8''
8''
8''
8''
8''
6''
8''
6''
6''
8''
8''
8''
8''
8''
8''
8''
8''
8''
8''
8''
8''
6''
8''
8''
8''
6''
6''8''
8''8''
8''
8''
8''
8''
8''
8''
8''
8''
8''
8''
6'' 8''
8''
6''
8''
8''8''
6''8''
8''
8''
8''
8''
8''
8''
8''
8''
8''
8''
8''
8''
8''
8''
8''
8''
8''
6''
8''
8''
8''8''
8''
6''
8''
8''
8''
8''
8''
8''
6''
8''
8''
6''
8''
8''
8''
8''
8''
6''
8''
8''
8''
8''
6''
6''
8''
8''6''
8''
6''
8''
8''
8''
8'' 8''
6''
6''
8''
8''
8''
12''
10''
18''
10'' 10''
10''
10''
10''
10''
10''
10''
10''
10''
10''
10''
10''
10''
10''
10''
10''
10''
10''
10''
10''
10''10''
10''
10''
10''
10''
12''
10''
12''
10''
10''
12''
10''
10''
10''
10''
10''
10''
12''
10''
10''
Nacimiento LSFront Street LS
South Oak Park LS
O
Figure 8-1:
Future PHF
Collection Systemwith Capacity
Improvements toAddress Existing Flows
City of Grover Beach
Sewer Master Plan
LegendCity Limits
Future Development Area
!( 1598 ECR Private LS Connection
!( Grover Beach Lodge LS Connection
d/D Pipes <= 8"d/D <= 0.50
d/D = 0.51 - 0.75
d/D = 0.76 - 0.85
d/D Pipes >= 10"d/D <= 0.75
d/D = 0.76 - 0.85
d/D = 0.86 - 1.00
d/D SSLOCSDd/D >= 0.75
d/D = 0.76 - 0.85
d/D = 0.86 - 1.00
1 inch = 1,100 feet
0 1,100550

THIS PAGE LEFT INTENTIONALLY BLANK

City of Grover Beach Sewer Master Plan November 2019
Page | 8‐4
Table 8‐2 provides a summary of the recommended improvements to address capacity deficiencies associated with
future PHF conditions (as described in Table 8‐1).
Table 8‐2: Recommended Improvements to Address Future Flows
Improvement Model
Deficiency Addressed
Location Existing Facility Proposed Improvement
Diameter (inches)
PHF d/D Diameter (inches)
Length (feet)
PHF d/D
1 A‐20 Easement (Griffin St to Huston St)
8 0.73 10 709 0.57
2 A‐19 Nacimiento
Ave 8 0.59 10 458 0.44
3 B‐2 / A‐5 S 4th St 10 1.00 12 740 0.64
4 B‐7 / A‐18 /
A‐24 Rockaway Ave 10 1.00 12 1479 0.65
SSLOCSD System
C‐2 / C‐1 Highway 1 18 1.00 21 1081 0.74
Notes: 1. Deficiencies A‐21, A‐22, A‐23, B‐4, B‐5, and B‐6 were not recommended for mitigation and are not influenced by the
above improvements.
8.1.2 Hydraulic Model Evaluation – Future Alternative Flow Conditions
Table 8‐3 and Figure 8‐2 provides an overview of the collection system deficiencies identified through the hydraulic model simulations under future alternative PHF conditions. The future alternative PHF condition was modeled under the assumption that all existing and future recommended improvements were constructed prior to the addition of future flows.
Table 8‐3: Collection System Deficiencies during Future Alternative PHF Conditions
Deficiency Identification
Location Existing Facility Peak Hour
Notes Diameter (inches)
Length (feet)
Flow (gpm)
d/D
A‐21 Sewer Easement (Huston St to
Messina Ct) 8 463 155 0.53
Improvement not recommended
A‐22 Messina Ct 8 118 142 0.51 Improvement not recommended
A‐25 S 12th St (Nice Ave to
Baden Ave) 8 335 184 0.52
Improvement not recommended
A‐26 S 10th St (Trouville Ave to
Mentone Ave) 8 371 10 0.53
Improvement not recommended
A‐28 Baden Ave (S 13th St to
S 14th St) 8 371 168 0.51
Improvement not recommended
B‐2 S 4th St (Manhattan Ave to
Trouville Ave) 10 740 526 0.80
Capacity limitation
B‐4 S 4th St (Trouville Ave to
Mentone Ave) 10 405 520 0.96
Capacity limitation
B‐5 Mentone Ave (S 4th St to S
5th St) 10 206 519 0.96
Capacity limitation
B‐6 Mentone Ave S (8th St to S
10th St) 10 740 478 0.93
Capacity limitation
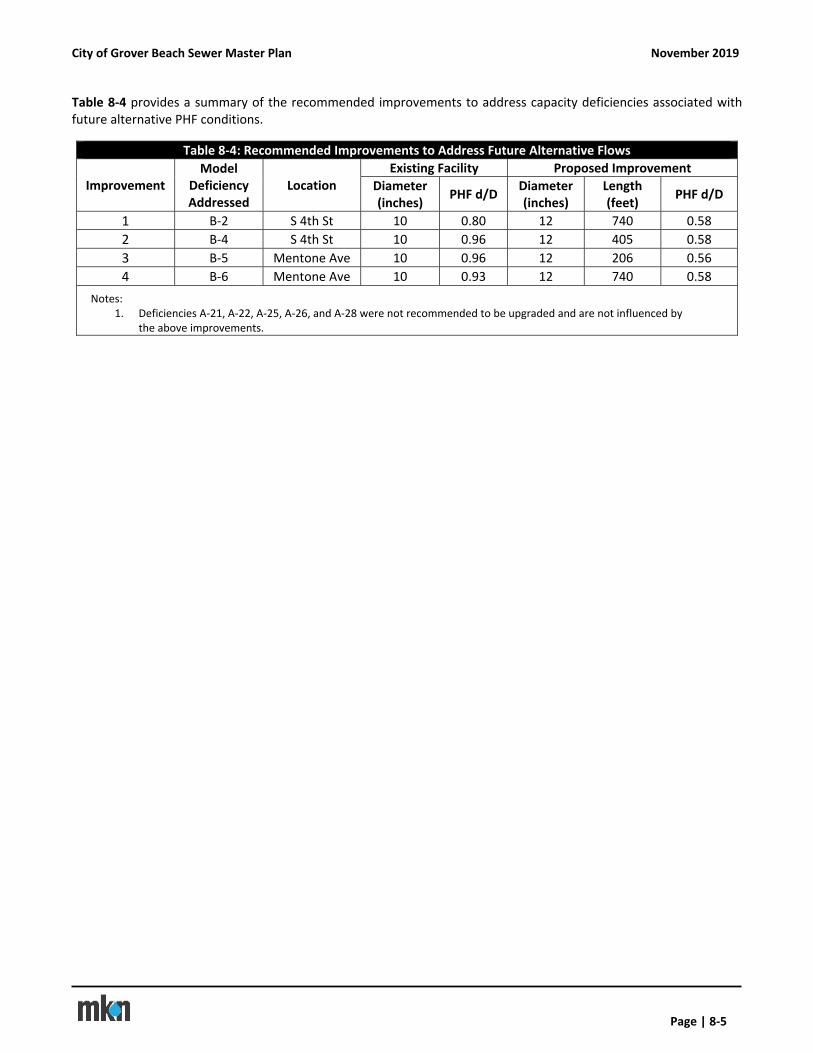
City of Grover Beach Sewer Master Plan November 2019
Page | 8‐5
Table 8‐4 provides a summary of the recommended improvements to address capacity deficiencies associated with future alternative PHF conditions.
Table 8‐4: Recommended Improvements to Address Future Alternative Flows
Improvement Model
Deficiency Addressed
Location Existing Facility Proposed Improvement
Diameter (inches)
PHF d/D Diameter (inches)
Length (feet)
PHF d/D
1 B‐2 S 4th St 10 0.80 12 740 0.58
2 B‐4 S 4th St 10 0.96 12 405 0.58
3 B‐5 Mentone Ave 10 0.96 12 206 0.56
4 B‐6 Mentone Ave 10 0.93 12 740 0.58
Notes: 1. Deficiencies A‐21, A‐22, A‐25, A‐26, and A‐28 were not recommended to be upgraded and are not influenced by
the above improvements.
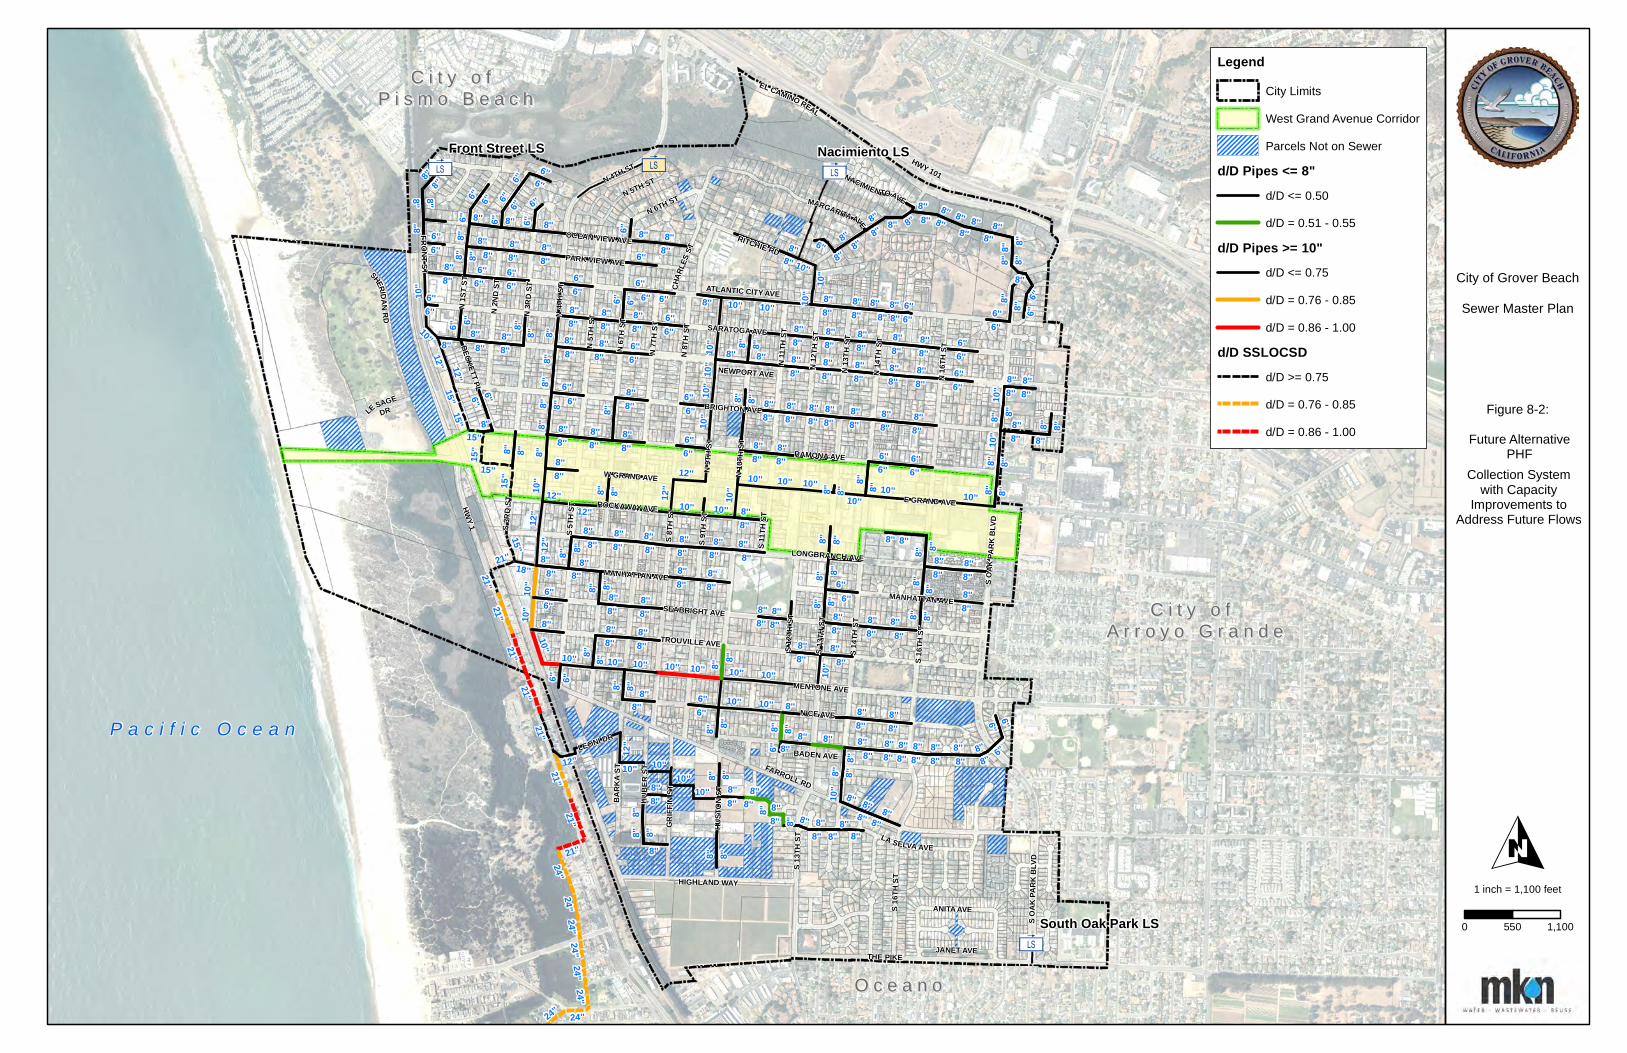
3ä 3ä
3ä
3ä
P a c i f i c O c e a n
C i t y o f C i t y o f A r r o y o G r a n d eA r r o y o G r a n d e
C i t y o f C i t y o f P i s m o B e a c hP i s m o B e a c h
O c e a n oO c e a n o
S OAK
PARK
BLV
D
HWY 101
MENTONE AVE
NACIMIENTOAVEN 5TH ST
FARROLL RD
TROUVILLE AVE
BARK
A ST
N 4TH ST
N 5T
H ST
N 6TH ST
N 2N
D ST
N 3R
D ST
N 1S
T ST
HIGHLAND WAY
CHAR
LES S
T
LA SELVA AVE
ATLANTIC CITY AVE
E GRAND AVE
FRONTST
S 13T
H ST
RITCHIE RD
N16
THST
S OAK
PARK
BLV
D
N 13
TH S
T
N 11
TH ST
S 14T
H ST
N 8T
H ST
W GRAND AVE N 10
TH S
T
S 12T
H ST
ROCKAWAY AVE
S 9TH
ST
PARK VIEW AVE
N 6T
H ST
N 4T
H ST
S 8TH
ST
MANHATTAN AVE
MANHATTAN AVE
SARATOGA AVE
SEABRIGHT AVE
N 7T
H ST
BADEN AVE
LONGBRANCH AVE
OCEAN VIEW AVE
N 9T
H ST
N 12
TH S
T
S3R
DST
GRIFF
IN ST
S 11T
H ST
S 5TH
ST
THE PIKE
S 16T
H ST
LE SAGEDR
N 14
TH S
T
LEONI DR
BECKETT PL
NICE AVE
BRIGHTON AVE
RAMONA AVE
NEWPORT AVE
ANITA AVE
JANET AVE
HUBE
R ST
S 16T
H ST
HUST
ON ST
HWY 1
SHERIDANRD
MARGARITA AVE
EL CAMINO REAL
S 13T
H ST
24''
21''
15''
15''
21''24''
24''
21''
21''
15''
15''
21''
21''
24''
24''
15''
24''
21''
21''
21''
24''
24''
15''
15''
8''
6''
6''8''
8''
8''
8''8''
6''
6''
8''
8''
8''
8''
8''
8''
8''
8''
8''
8''
8''
8''8''
8''
8''
8''
8''
6''
8''
8''
6''
6''
8''
8''
8''
8''
8''
8''
8''
8''
6''
8''
8''
8''
6''
8''
8''
6''
8''
8''
6''
8''
8''
6''
8''
8''8''
8''
8''
8''
6''
8''
8''
6''
8''
8''
8''
8''
8''
8''
8''
8''
8''
8''
8''
8''6''
8''
8'' 8''
8''
6''
8''
8''
8''
8''
8''
8''
6''
6''
8''
6''
8''
8''
8''
8''
8''
6''
8''
8''
8''8''
8'' 8''
8''
8''
8''
8''
8''
6''
8''8''
8''
8''
8''
8''
8''
8''
8''
8''
8''
8''
8''
8''
8''
6''
8''
8''
8''8''
8''
8''
8''
6''
8''
6''
6''
6''
8''
8''
6''
8''
8''
6''
8''
8''
8''8''
8''
8''
8''
8''
8''
8''
8''
8''8''
8''
8''
8''
8''
8''
8''
8''
6''
8''8''
6'' 8''
8''
6''
8''
8''
8''
6''
8''
8''
6''
8''
8''8''
8''
8''
6''
8''
8''
8''
8''
8''
8''
6''
6''
8''
8''
8''
8''
6''
8''
8''
8''
8''
6''
6''
8''
6''
6''
8''8''
8''
8''
6''12''
10''
18''
8''
8''
8''
8''8''
6''
8''
6''
10''
8''
6''
12''
12'' 10''
10''
8''
8''
8''
8''
8''
8''
8''
6''
8''
8''
6''
8''
8''
8''8''
8''
8''
8''
8''
8''
8''
10''
10''
8''
10''
12''
10''
6''
8''
8''
8''
8''
8''
8''
10''
8''
10''
8''
6''
6''
8''
8''
8''
8''
8''
8''
8''
10''6''
6''8''
6''
12''
8''
6''
12''
8''
8''
8''
10''
8''
8''
10''
10''
10''
6''
10''
8''
6''
10''
8''
6''
8''
8''
8''
8''
8''
12''
8''
8''
8''8''
6''
10''
8''
10''
6''
8''
8''
8''
10''
8''
8''
8''
8''
8''
8''
6''
10''
6''
8''
8''
10''
8''
8''
8''
8''
10''8''
8''
8''
8''10''
8''
6''
8''
8''
8''
10''
10''
8''
8''
6''
8''
8''
12''
8''
10''
10''
6''
10''
8''
6''
10''
8''
12''
8''
8''
10''
8''
8''
8''
8''
10''
8''8''
8''
8''
8''
8''
8''
8''
6''
8''
10''
10''
8''
10''
10''
8''8''
8''
8''
8''
8''
6''
8''
6''
10''8''
8''
8''
10''
8''
8''
12''
8''
8''
10''
10''10''
6''
8''
8''
8''
8''
Nacimiento LSFront Street LS
South Oak Park LS
O
Figure 8-2:
Future Alternative PHF
Collection Systemwith Capacity
Improvements toAddress Future Flows
City of Grover Beach
Sewer Master Plan
LegendCity Limits
West Grand Avenue Corridor
Parcels Not on Sewer
d/D Pipes <= 8"d/D <= 0.50
d/D = 0.51 - 0.55
d/D Pipes >= 10"d/D <= 0.75
d/D = 0.76 - 0.85
d/D = 0.86 - 1.00
d/D SSLOCSDd/D >= 0.75
d/D = 0.76 - 0.85
d/D = 0.86 - 1.00
1 inch = 1,100 feet
0 1,100550

THIS PAGE LEFT INTENTIONALLY BLANK
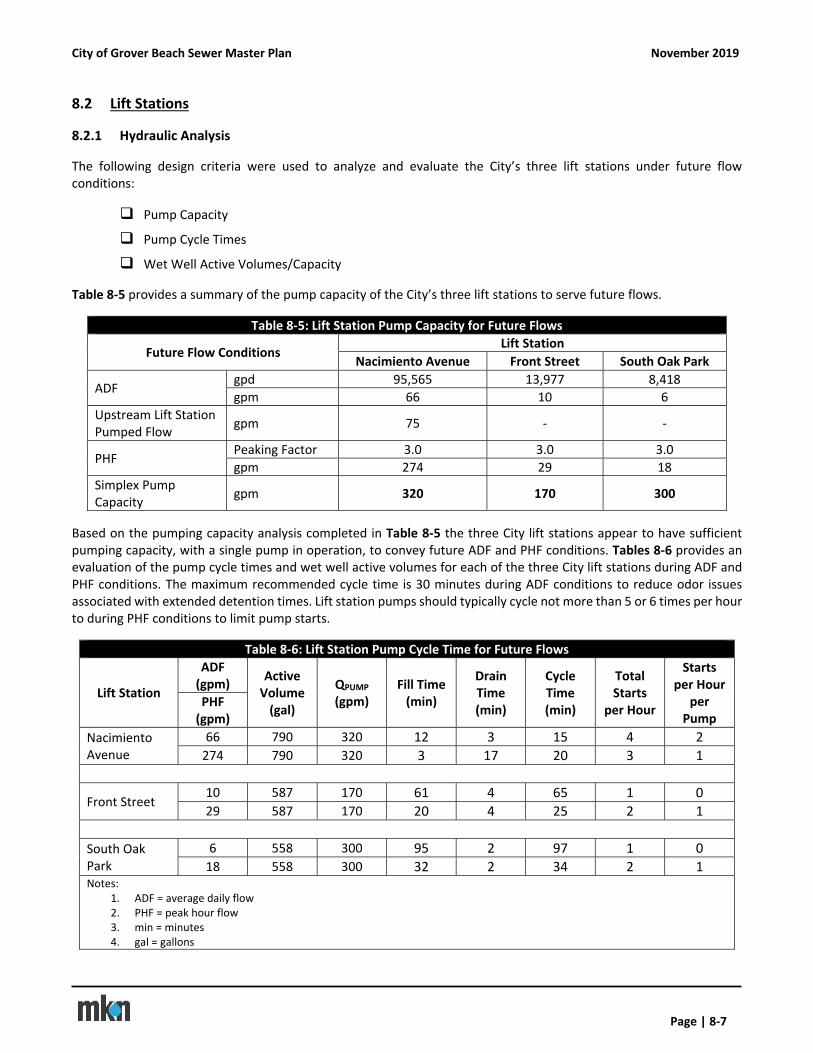
City of Grover Beach Sewer Master Plan November 2019
Page | 8‐7
8.2 Lift Stations
8.2.1 Hydraulic Analysis
The following design criteria were used to analyze and evaluate the City’s three lift stations under future flow conditions:
Pump Capacity
Pump Cycle Times
Wet Well Active Volumes/Capacity
Table 8‐5 provides a summary of the pump capacity of the City’s three lift stations to serve future flows.
Table 8‐5: Lift Station Pump Capacity for Future Flows
Future Flow Conditions Lift Station
Nacimiento Avenue Front Street South Oak Park
ADF gpd 95,565 13,977 8,418
gpm 66 10 6
Upstream Lift Station Pumped Flow
gpm 75 ‐ ‐
PHF Peaking Factor 3.0 3.0 3.0
gpm 274 29 18
Simplex Pump Capacity
gpm 320 170 300
Based on the pumping capacity analysis completed in Table 8‐5 the three City lift stations appear to have sufficient pumping capacity, with a single pump in operation, to convey future ADF and PHF conditions. Tables 8‐6 provides an evaluation of the pump cycle times and wet well active volumes for each of the three City lift stations during ADF and PHF conditions. The maximum recommended cycle time is 30 minutes during ADF conditions to reduce odor issues associated with extended detention times. Lift station pumps should typically cycle not more than 5 or 6 times per hour to during PHF conditions to limit pump starts.
Table 8‐6: Lift Station Pump Cycle Time for Future Flows
Lift Station
ADF (gpm)
Active Volume (gal)
QPUMP
(gpm) Fill Time (min)
Drain Time (min)
Cycle Time (min)
Total Starts
per Hour
Starts per Hour
per Pump
PHF (gpm)
Nacimiento Avenue
66 790 320 12 3 15 4 2
274 790 320 3 17 20 3 1
Front Street 10 587 170 61 4 65 1 0
29 587 170 20 4 25 2 1
South Oak Park
6 558 300 95 2 97 1 0
18 558 300 32 2 34 2 1 Notes:
1. ADF = average daily flow 2. PHF = peak hour flow 3. min = minutes 4. gal = gallons
City of Grover Beach Sewer Master Plan November 2019
Page | 8‐8
Review of the pump cycle time analysis for each of the lift stations identified the following conditions:
Pumps at the Nacimiento Avenue Lift Station cycle at 15 and 20 minutes during ADF and PHF conditions (respectively) with less than 2 starts per hour per pump
Pumps at the Front Street Lift Station cycle at 65 and 25 minutes during ADF and PHF conditions (respectively) with less than 1 start per hour per pump during PHF conditions
Pumps at the South Oak Park Lift Station cycle at 97 and 34 minutes during ADF and PHF conditions (respectively) with less than 1 starts per hour per pump during PHF conditions
Based on the pump cycle time analysis the Front Street and South Oak Park lift stations experience extended detention times during ADF conditions. This is associated with the low upstream flow into the wet well and current operating levels of the existing pumps. The extended detention time could be reduced by limiting active volumes of the wet wells.
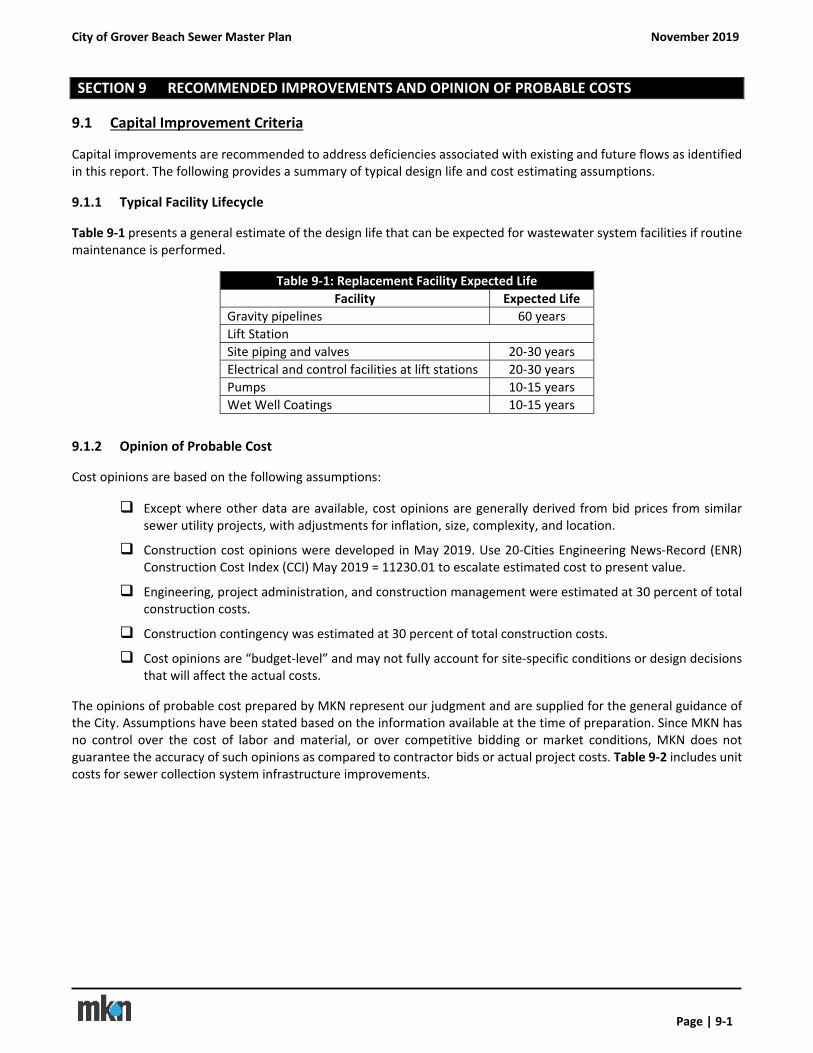
City of Grover Beach Sewer Master Plan November 2019
Page | 9‐1
SECTION 9 RECOMMENDED IMPROVEMENTS AND OPINION OF PROBABLE COSTS
9.1 Capital Improvement Criteria
Capital improvements are recommended to address deficiencies associated with existing and future flows as identified in this report. The following provides a summary of typical design life and cost estimating assumptions.
9.1.1 Typical Facility Lifecycle
Table 9‐1 presents a general estimate of the design life that can be expected for wastewater system facilities if routine maintenance is performed.
Table 9‐1: Replacement Facility Expected Life
Facility Expected Life
Gravity pipelines 60 years
Lift Station
Site piping and valves 20‐30 years
Electrical and control facilities at lift stations 20‐30 years
Pumps 10‐15 years
Wet Well Coatings 10‐15 years
9.1.2 Opinion of Probable Cost
Cost opinions are based on the following assumptions:
Except where other data are available, cost opinions are generally derived from bid prices from similar sewer utility projects, with adjustments for inflation, size, complexity, and location.
Construction cost opinions were developed in May 2019. Use 20‐Cities Engineering News‐Record (ENR) Construction Cost Index (CCI) May 2019 = 11230.01 to escalate estimated cost to present value.
Engineering, project administration, and construction management were estimated at 30 percent of total construction costs.
Construction contingency was estimated at 30 percent of total construction costs.
Cost opinions are “budget‐level” and may not fully account for site‐specific conditions or design decisions that will affect the actual costs.
The opinions of probable cost prepared by MKN represent our judgment and are supplied for the general guidance of the City. Assumptions have been stated based on the information available at the time of preparation. Since MKN has no control over the cost of labor and material, or over competitive bidding or market conditions, MKN does not guarantee the accuracy of such opinions as compared to contractor bids or actual project costs. Table 9‐2 includes unit costs for sewer collection system infrastructure improvements.
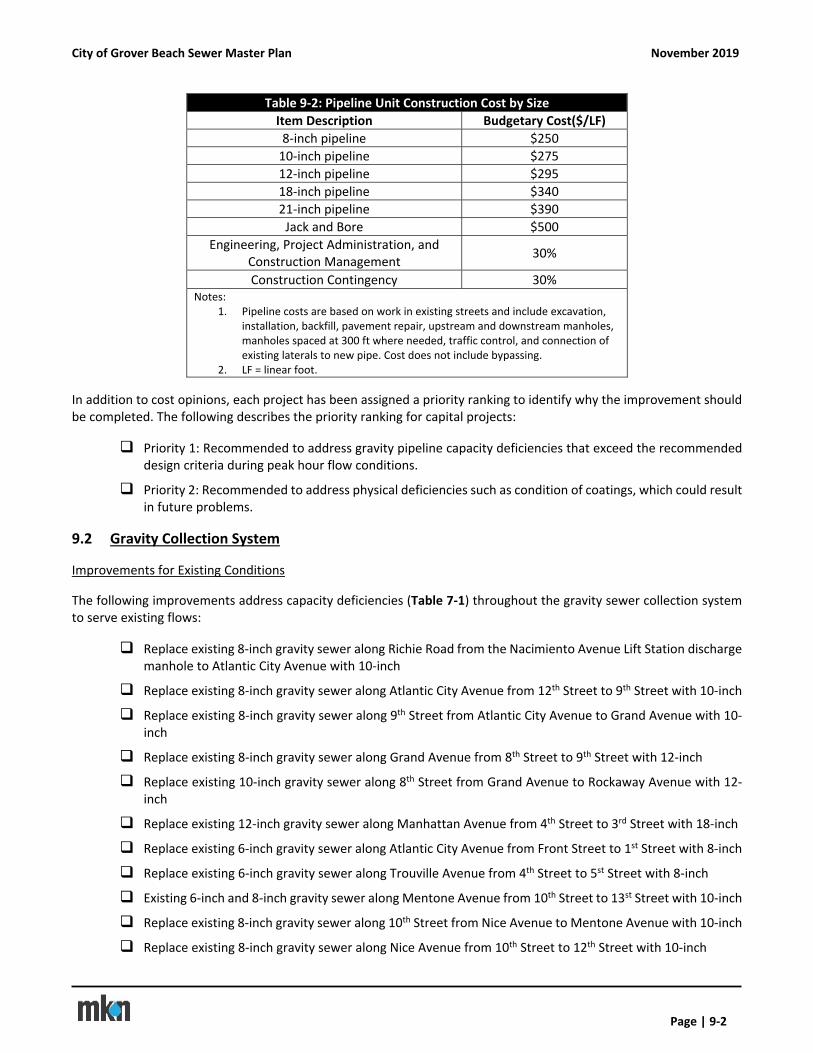
City of Grover Beach Sewer Master Plan November 2019
Page | 9‐2
Table 9‐2: Pipeline Unit Construction Cost by Size
Item Description Budgetary Cost($/LF)
8‐inch pipeline $250
10‐inch pipeline $275
12‐inch pipeline $295
18‐inch pipeline $340
21‐inch pipeline $390
Jack and Bore $500
Engineering, Project Administration, and Construction Management
30%
Construction Contingency 30% Notes:
1. Pipeline costs are based on work in existing streets and include excavation, installation, backfill, pavement repair, upstream and downstream manholes, manholes spaced at 300 ft where needed, traffic control, and connection of existing laterals to new pipe. Cost does not include bypassing.
2. LF = linear foot.
In addition to cost opinions, each project has been assigned a priority ranking to identify why the improvement should be completed. The following describes the priority ranking for capital projects:
Priority 1: Recommended to address gravity pipeline capacity deficiencies that exceed the recommended design criteria during peak hour flow conditions.
Priority 2: Recommended to address physical deficiencies such as condition of coatings, which could result in future problems.
9.2 Gravity Collection System
Improvements for Existing Conditions
The following improvements address capacity deficiencies (Table 7‐1) throughout the gravity sewer collection system to serve existing flows:
Replace existing 8‐inch gravity sewer along Richie Road from the Nacimiento Avenue Lift Station discharge manhole to Atlantic City Avenue with 10‐inch
Replace existing 8‐inch gravity sewer along Atlantic City Avenue from 12th Street to 9th Street with 10‐inch
Replace existing 8‐inch gravity sewer along 9th Street from Atlantic City Avenue to Grand Avenue with 10‐inch
Replace existing 8‐inch gravity sewer along Grand Avenue from 8th Street to 9th Street with 12‐inch
Replace existing 10‐inch gravity sewer along 8th Street from Grand Avenue to Rockaway Avenue with 12‐inch
Replace existing 12‐inch gravity sewer along Manhattan Avenue from 4th Street to 3rd Street with 18‐inch
Replace existing 6‐inch gravity sewer along Atlantic City Avenue from Front Street to 1st Street with 8‐inch
Replace existing 6‐inch gravity sewer along Trouville Avenue from 4th Street to 5st Street with 8‐inch
Existing 6‐inch and 8‐inch gravity sewer along Mentone Avenue from 10th Street to 13st Street with 10‐inch
Replace existing 8‐inch gravity sewer along 10th Street from Nice Avenue to Mentone Avenue with 10‐inch
Replace existing 8‐inch gravity sewer along Nice Avenue from 10th Street to 12th Street with 10‐inch
City of Grover Beach Sewer Master Plan November 2019
Page | 9‐3
Replace existing 8‐inch gravity sewer along Griffin Street with 10‐inch
Install up to 18 HDPE manhole inserts within collection system manholes along Meadow Creek to reduce I/I into Nacimiento Lift Station
The recommended gravity collection system improvements to address existing flow deficiencies as described above are shown in Table 9‐4.
Improvements for Future Conditions
To serve future flows, it was assumed the City already constructed the recommended improvements to address existing flow deficiencies. In addition, segments of the existing SSLOCSD trunk sewer system will be required to be upgraded to reduce surcharge conditions within the City’s collection system. The required improvements within the SSLOCSD trunk sewer system will consist of the following:
Replace the existing 18‐inch trunk sewer under the railroad (350 linear feet) and 18‐inch trunk sewer along Highway 1 (730 linear feet) with 21‐inch trunk sewer. It was assumed that the portion under the railroad will be installed via jack and bore.
The following improvements address capacity deficiencies (Table 8‐1) throughout the gravity sewer collection system to serve future flows:
Replace 8‐inch gravity sewer along sewer easement from Griffin Street to Huston Street with 10‐inch
Replace 8‐inch gravity sewer along Nacimiento Avenue from Nacimiento Avenue to Mono Street with 10‐inch
Replace 10‐inch gravity sewer along 4th Street from Manhattan Avenue to Rockaway Avenue with 12‐inch
Replace 10‐inch gravity sewer along Rockaway Avenue from 4th Street to 8th Street with 12‐inch
The recommended gravity collection system improvements to address future flow deficiencies as described above are shown in Table 9‐6.
Future Alternative Conditions
To serve future alternative flow conditions (additional flow from West Grand Avenue Corridor and septic conversions), it was assumed the City already constructed the recommended improvements to address existing and future flow deficiencies. This also included the required improvements within the SSLOCSD trunk sewer system. The following improvements address capacity deficiencies (Table 8‐3) throughout the gravity sewer collection system to serve future alternative flows:
Replace 10‐inch gravity sewer along 4th Street from Manhattan Avenue to Mentone Avenue with 12‐inch
Replace 10‐inch gravity sewer along Mentone Avenue from 4th Street to 10th Street with 12‐inch
The above described pipe segments were identified to have marginal d/D deficiencies (up to d/D of 0.80 or less than 10%) during future flow simulations, but not significant requiring replacement. However, additional flow from West Grand Avenue Corridor and septic conversions would increase flow depth within the SSLOCSD trunk sewer system creating a surcharged condition that impacts the sewer segments on 4th Street and Mentone Avenue.
The recommended gravity collection system improvements to address future alternative flow deficiencies as described above are shown in Table 9‐7.
City of Grover Beach Sewer Master Plan November 2019
Page | 9‐4
9.3 Lift Stations
Existing Conditions
Based on the hydraulic analysis completed in Section 7.2.1, the existing City lift stations have sufficient pumping capacity and wet well volume to convey existing City flows. However, based on the condition assessment MKN identified a number of recommended improvements to address existing physical deficiencies and improve facility operations. The following provides a brief description of the improvements for the three City lift stations:
Nacimiento Avenue Lift Station Rehabilitation: Replace/re‐coat existing valves and pipe fittings within wet well and valve vault.
Front Street Lift Station Rehabilitation: Complete detailed investigation of wet well coating, replace/re‐coat existing valves and pipe fittings within wet well and valve vault, and install new hatch system.
South Oak Park Lift Station Rehabilitation: Replace/re‐coat existing pipe fittings within wet well, retrofit fiberglass enclosure to allow for user access, and install bypass connection.
Based on the pump cycle time analysis, the Front Street and South Oak Park lift stations experience extended detention times during ADF conditions. This is associated with low flow entering the wet well and current set points of the existing pumps. It is recommended that the existing wet well working volumes be minimized to reduce extended detention times.
Future Conditions
No lift station improvements are recommended to address future flow deficiencies.
Future Alternative Conditions
No lift station improvements are recommended to address future alternative flow deficiencies.
9.4 Maintenance and Operation
The following section identifies potential projects that the City could implement to more efficiently operate and manage the existing sewer collection system facilities. Opinions of cost for these options are included in Table 9‐5.
9.4.1 Sewer System Management Plan
It is recommended that the City continue to clean, video, and monitor the collection system pipelines on an annual basis, bi‐annual basis, and/or as required by the Regional Water Quality Control Board. For the City’s Sewer System Management Plan (SSMP) compliance MKN has included an allowance for the City to complete the biannual audits and report updates as required by the SSMP.
9.4.2 Asset Management Strategy
In conjunction with the recommended wastewater system staffing and to more efficiently plan, budget, manage and complete system‐wide maintenance and repair tasks, it is recommended that the City implement an asset management strategy. This system would consist of integrating a Computerized Maintenance Management System (CMMS), asset inventory and condition/capacity assessment and Geographic Information Systems (GIS). The City has completed a preliminary asset inventory, capacity assessment, and GIS development as part of this Sewer Master Plan update. Some common asset management software programs that the City may consider evaluating include Cityworks, Cartegraph, Lucity, Accela and Infro/Hanson.
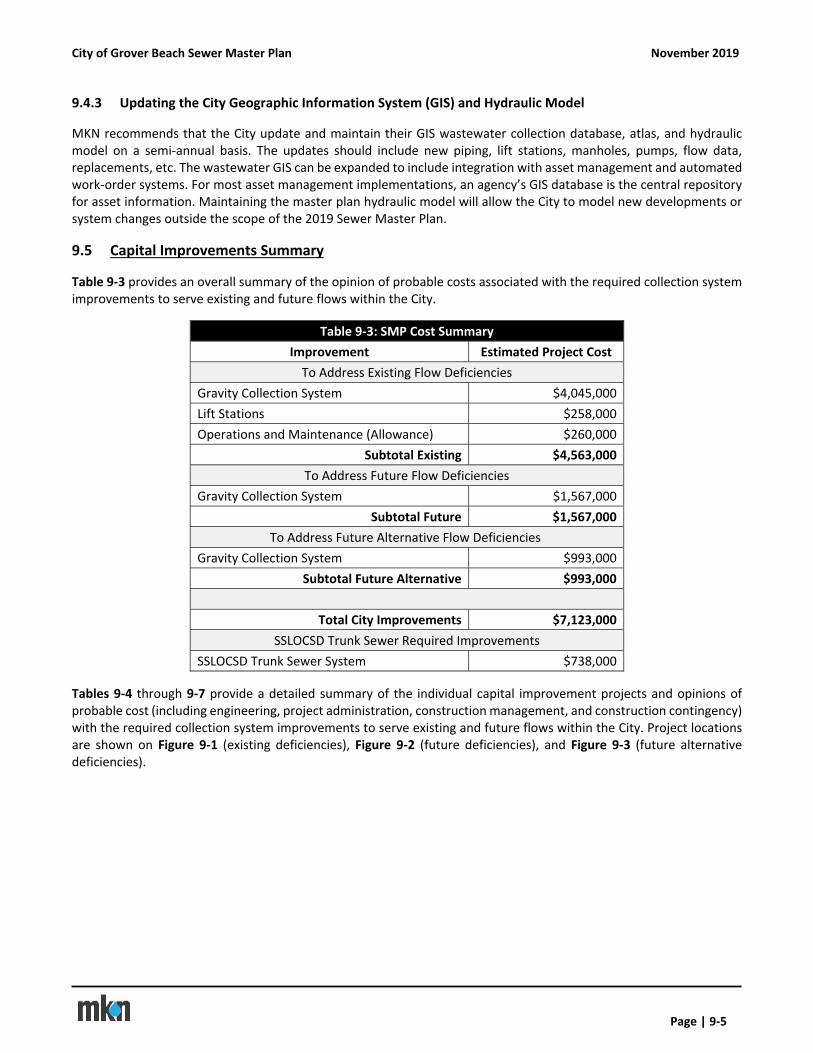
City of Grover Beach Sewer Master Plan November 2019
Page | 9‐5
9.4.3 Updating the City Geographic Information System (GIS) and Hydraulic Model
MKN recommends that the City update and maintain their GIS wastewater collection database, atlas, and hydraulic model on a semi‐annual basis. The updates should include new piping, lift stations, manholes, pumps, flow data, replacements, etc. The wastewater GIS can be expanded to include integration with asset management and automated work‐order systems. For most asset management implementations, an agency’s GIS database is the central repository for asset information. Maintaining the master plan hydraulic model will allow the City to model new developments or system changes outside the scope of the 2019 Sewer Master Plan.
9.5 Capital Improvements Summary
Table 9‐3 provides an overall summary of the opinion of probable costs associated with the required collection system improvements to serve existing and future flows within the City.
Table 9‐3: SMP Cost Summary
Improvement Estimated Project Cost
To Address Existing Flow Deficiencies
Gravity Collection System $4,045,000
Lift Stations $258,000
Operations and Maintenance (Allowance) $260,000
Subtotal Existing $4,563,000
To Address Future Flow Deficiencies
Gravity Collection System $1,567,000
Subtotal Future $1,567,000
To Address Future Alternative Flow Deficiencies
Gravity Collection System $993,000
Subtotal Future Alternative $993,000
Total City Improvements $7,123,000
SSLOCSD Trunk Sewer Required Improvements
SSLOCSD Trunk Sewer System $738,000
Tables 9‐4 through 9‐7 provide a detailed summary of the individual capital improvement projects and opinions of probable cost (including engineering, project administration, construction management, and construction contingency) with the required collection system improvements to serve existing and future flows within the City. Project locations are shown on Figure 9‐1 (existing deficiencies), Figure 9‐2 (future deficiencies), and Figure 9‐3 (future alternative deficiencies).

THIS PAGE LEFT INTENTIONALLY BLANK
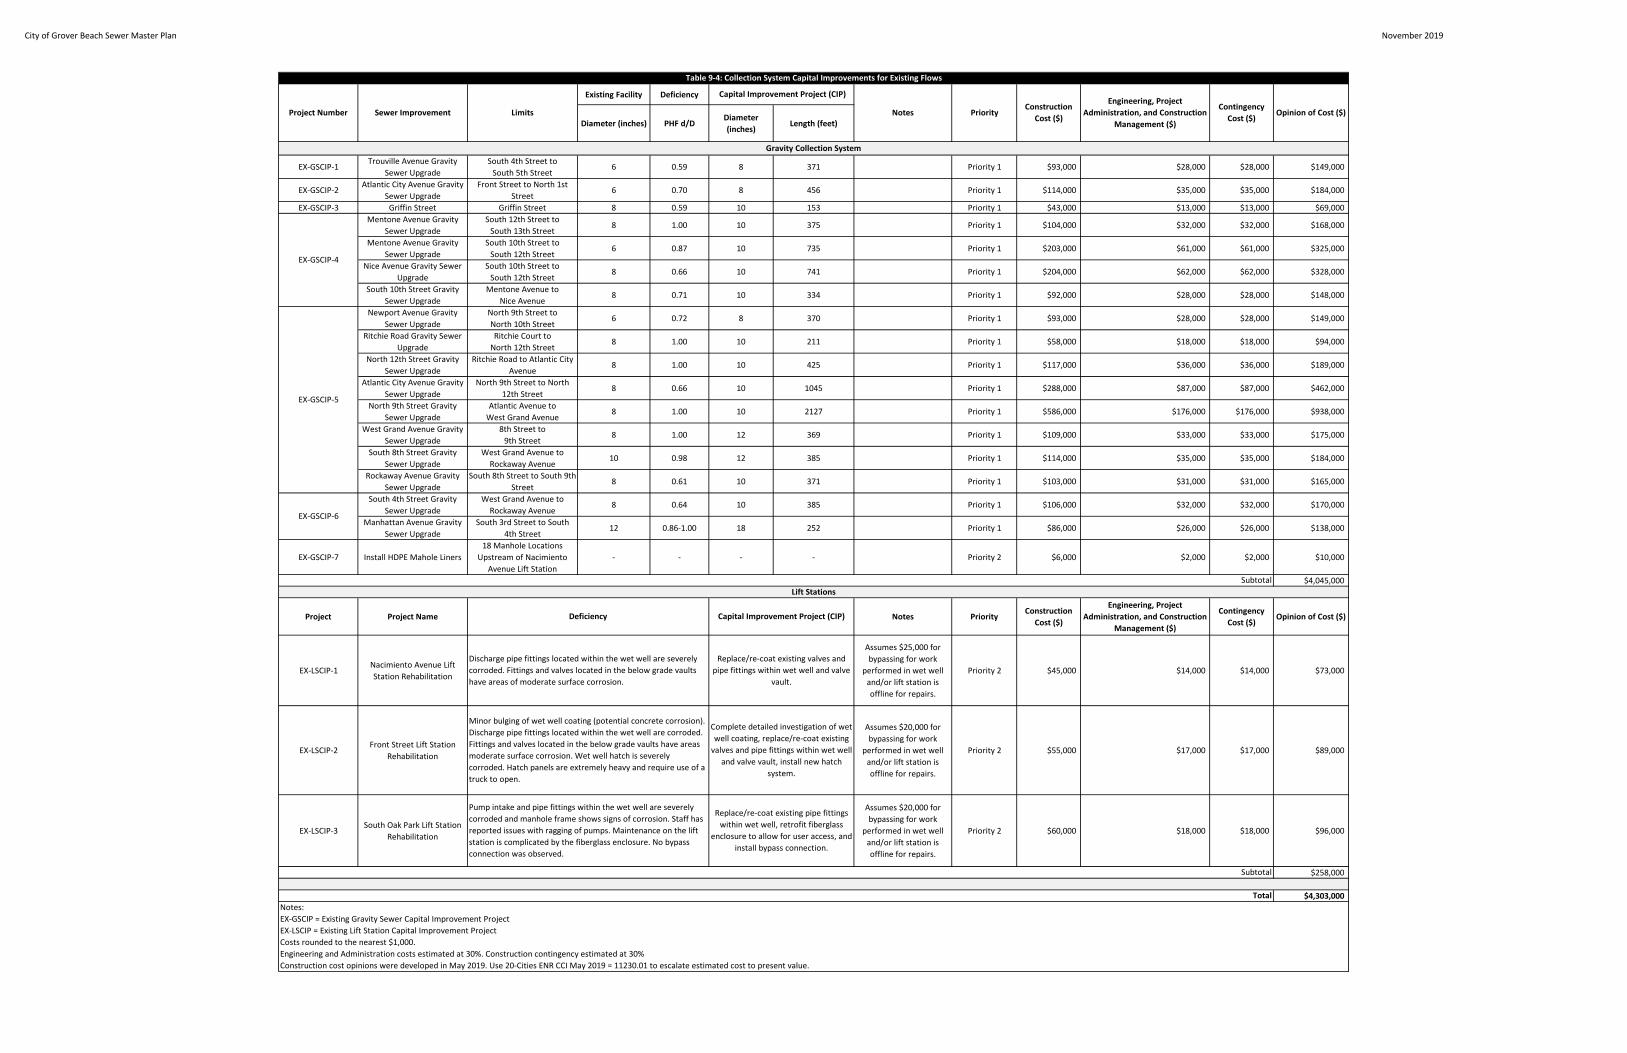
City of Grover Beach Sewer Master Plan November 2019
Existing Facility Deficiency
Diameter (inches) PHF d/DDiameter
(inches)Length (feet)
EX‐GSCIP‐1Trouville Avenue Gravity
Sewer Upgrade
South 4th Street to
South 5th Street6 0.59 8 371 Priority 1 $93,000 $28,000 $28,000 $149,000
EX‐GSCIP‐2Atlantic City Avenue Gravity
Sewer Upgrade
Front Street to North 1st
Street6 0.70 8 456 Priority 1 $114,000 $35,000 $35,000 $184,000
EX‐GSCIP‐3 Griffin Street Griffin Street 8 0.59 10 153 Priority 1 $43,000 $13,000 $13,000 $69,000
Mentone Avenue Gravity
Sewer Upgrade
South 12th Street to
South 13th Street8 1.00 10 375 Priority 1 $104,000 $32,000 $32,000 $168,000
Mentone Avenue Gravity
Sewer Upgrade
South 10th Street to
South 12th Street6 0.87 10 735 Priority 1 $203,000 $61,000 $61,000 $325,000
Nice Avenue Gravity Sewer
Upgrade
South 10th Street to
South 12th Street8 0.66 10 741 Priority 1 $204,000 $62,000 $62,000 $328,000
South 10th Street Gravity
Sewer Upgrade
Mentone Avenue to
Nice Avenue8 0.71 10 334 Priority 1 $92,000 $28,000 $28,000 $148,000
Newport Avenue Gravity
Sewer Upgrade
North 9th Street to
North 10th Street6 0.72 8 370 Priority 1 $93,000 $28,000 $28,000 $149,000
Ritchie Road Gravity Sewer
Upgrade
Ritchie Court to
North 12th Street8 1.00 10 211 Priority 1 $58,000 $18,000 $18,000 $94,000
North 12th Street Gravity
Sewer Upgrade
Ritchie Road to Atlantic City
Avenue8 1.00 10 425 Priority 1 $117,000 $36,000 $36,000 $189,000
Atlantic City Avenue Gravity
Sewer Upgrade
North 9th Street to North
12th Street8 0.66 10 1045 Priority 1 $288,000 $87,000 $87,000 $462,000
North 9th Street Gravity
Sewer Upgrade
Atlantic Avenue to
West Grand Avenue8 1.00 10 2127 Priority 1 $586,000 $176,000 $176,000 $938,000
West Grand Avenue Gravity
Sewer Upgrade
8th Street to
9th Street8 1.00 12 369 Priority 1 $109,000 $33,000 $33,000 $175,000
South 8th Street Gravity
Sewer Upgrade
West Grand Avenue to
Rockaway Avenue10 0.98 12 385 Priority 1 $114,000 $35,000 $35,000 $184,000
Rockaway Avenue Gravity
Sewer Upgrade
South 8th Street to South 9th
Street8 0.61 10 371 Priority 1 $103,000 $31,000 $31,000 $165,000
South 4th Street Gravity
Sewer Upgrade
West Grand Avenue to
Rockaway Avenue8 0.64 10 385 Priority 1 $106,000 $32,000 $32,000 $170,000
Manhattan Avenue Gravity
Sewer Upgrade
South 3rd Street to South
4th Street12 0.86‐1.00 18 252 Priority 1 $86,000 $26,000 $26,000 $138,000
EX‐GSCIP‐7 Install HDPE Mahole Liners
18 Manhole Locations
Upstream of Nacimiento
Avenue Lift Station
‐ ‐ ‐ ‐ Priority 2 $6,000 $2,000 $2,000 $10,000
$4,045,000
Project Project Name Notes PriorityConstruction
Cost ($)
Engineering, Project
Administration, and Construction
Management ($)
Contingency
Cost ($)Opinion of Cost ($)
EX‐LSCIP‐1Nacimiento Avenue Lift
Station Rehabilitation
Assumes $25,000 for
bypassing for work
performed in wet well
and/or lift station is
offline for repairs.
Priority 2 $45,000 $14,000 $14,000 $73,000
EX‐LSCIP‐2Front Street Lift Station
Rehabilitation
Assumes $20,000 for
bypassing for work
performed in wet well
and/or lift station is
offline for repairs.
Priority 2 $55,000 $17,000 $17,000 $89,000
EX‐LSCIP‐3South Oak Park Lift Station
Rehabilitation
Assumes $20,000 for
bypassing for work
performed in wet well
and/or lift station is
offline for repairs.
Priority 2 $60,000 $18,000 $18,000 $96,000
$258,000
$4,303,000
EX‐GSCIP = Existing Gravity Sewer Capital Improvement Project
EX‐LSCIP = Existing Lift Station Capital Improvement Project
Subtotal
EX‐GSCIP‐4
EX‐GSCIP‐5
EX‐GSCIP‐6
Table 9‐4: Collection System Capital Improvements for Existing Flows
Gravity Collection System
Priority
Engineering, Project
Administration, and Construction
Management ($)
Contingency
Cost ($)Opinion of Cost ($)
Capital Improvement Project (CIP)
Construction
Cost ($)Project Number Sewer Improvement Limits Notes
Notes:
Costs rounded to the nearest $1,000.
Engineering and Administration costs estimated at 30%. Construction contingency estimated at 30%
Construction cost opinions were developed in May 2019. Use 20‐Cities ENR CCI May 2019 = 11230.01 to escalate estimated cost to present value.
Lift Stations
Pump intake and pipe fittings within the wet well are severely
corroded and manhole frame shows signs of corrosion. Staff has
reported issues with ragging of pumps. Maintenance on the lift
station is complicated by the fiberglass enclosure. No bypass
connection was observed.
Replace/re‐coat existing valves and
pipe fittings within wet well and valve
vault.
Complete detailed investigation of wet
well coating, replace/re‐coat existing
valves and pipe fittings within wet well
and valve vault, install new hatch
system.
Replace/re‐coat existing pipe fittings
within wet well, retrofit fiberglass
enclosure to allow for user access, and
install bypass connection.
Subtotal
Total
Minor bulging of wet well coating (potential concrete corrosion).
Discharge pipe fittings located within the wet well are corroded.
Fittings and valves located in the below grade vaults have areas
moderate surface corrosion. Wet well hatch is severely
corroded. Hatch panels are extremely heavy and require use of a
truck to open.
Discharge pipe fittings located within the wet well are severely
corroded. Fittings and valves located in the below grade vaults
have areas of moderate surface corrosion.
Capital Improvement Project (CIP)Deficiency

THIS PAGE LEFT INTENTIONALLY BLANK
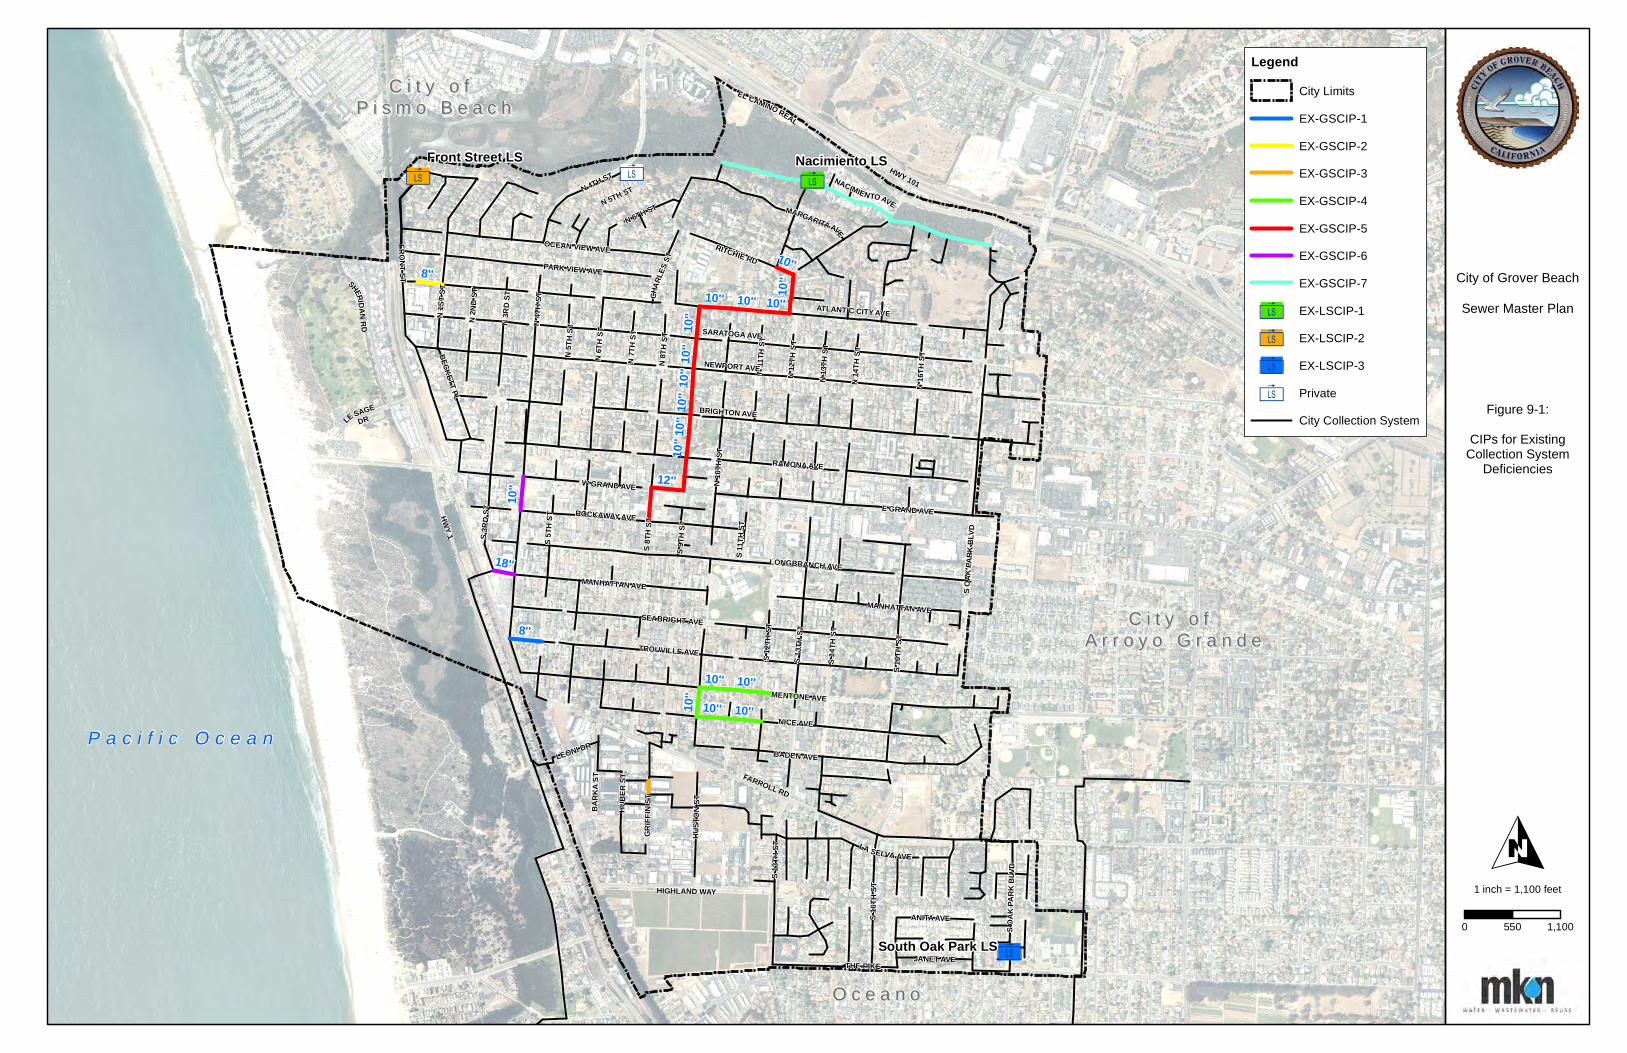
3ä 3ä
3ä
3ä
P a c i f i c O c e a n
C i t y o f C i t y o f A r r o y o G r a n d eA r r o y o G r a n d e
C i t y o f C i t y o f P i s m o B e a c hP i s m o B e a c h
O c e a n oO c e a n oS O
AK PA
RK B
LVD
HWY 101
MENTONE AVE
NACIMIENTOAVEN 5TH ST
FARROLL RD
TROUVILLE AVE
BARK
A ST
N 4TH ST
N 5T
H ST
N 6TH ST
N 2N
D ST
N 3R
D ST
N 1S
T ST
HIGHLAND WAY
CHAR
LES S
T
LA SELVA AVE
ATLANTIC CITY AVE
E GRAND AVE
FRONTST
S 13T
H ST
RITCHIE RD
N16
THST
S OAK
PARK
BLV
D
N 13
TH S
T
N 11
TH ST
S 14T
H ST
N 8T
H ST
W GRAND AVE N 10
TH S
T
S 12T
H ST
ROCKAWAY AVE
S 9TH
ST
PARK VIEW AVE
N 6T
H ST
N 4T
H ST
S 8TH
ST
MANHATTAN AVE
MANHATTAN AVE
SARATOGA AVE
SEABRIGHT AVEN
7TH
ST
BADEN AVE
LONGBRANCH AVE
OCEAN VIEW AVE
N 12
TH S
T
S 3RD
ST
GRIFF
IN ST
S 11T
H ST
S 5TH
ST
THE PIKE
S 16T
H ST
LE SAGEDR
N 14
TH S
T
LEONI DR
BECKETT PL
NICE AVE
BRIGHTON AVE
RAMONA AVE
NEWPORT AVE
ANITA AVE
JANET AVE
HUBE
R ST
S 16T
H ST
HUST
ON ST
HWY 1
SHERIDANRD
MARGARITA AVE
EL CAMINO REAL
S 13T
H ST
8''
12''
10''
18''
10''
8''
10'' 1
0''
10''
10''
10''10
''10
''
10''
10''
10''
10''10
''10
''10''
10''
Nacimiento LSFront Street LS
South Oak Park LS
O
LegendCity Limits
EX-GSCIP-1
EX-GSCIP-2
EX-GSCIP-3
EX-GSCIP-4
EX-GSCIP-5
EX-GSCIP-6
EX-GSCIP-7
3ä EX-LSCIP-1
3ä EX-LSCIP-2
3ä EX-LSCIP-3
3ä Private
City Collection SystemFigure 9-1:
CIPs for ExistingCollection System
Deficiencies
City of Grover Beach
Sewer Master Plan
1 inch = 1,100 feet
0 1,100550

THIS PAGE LEFT INTENTIONALLY BLANK
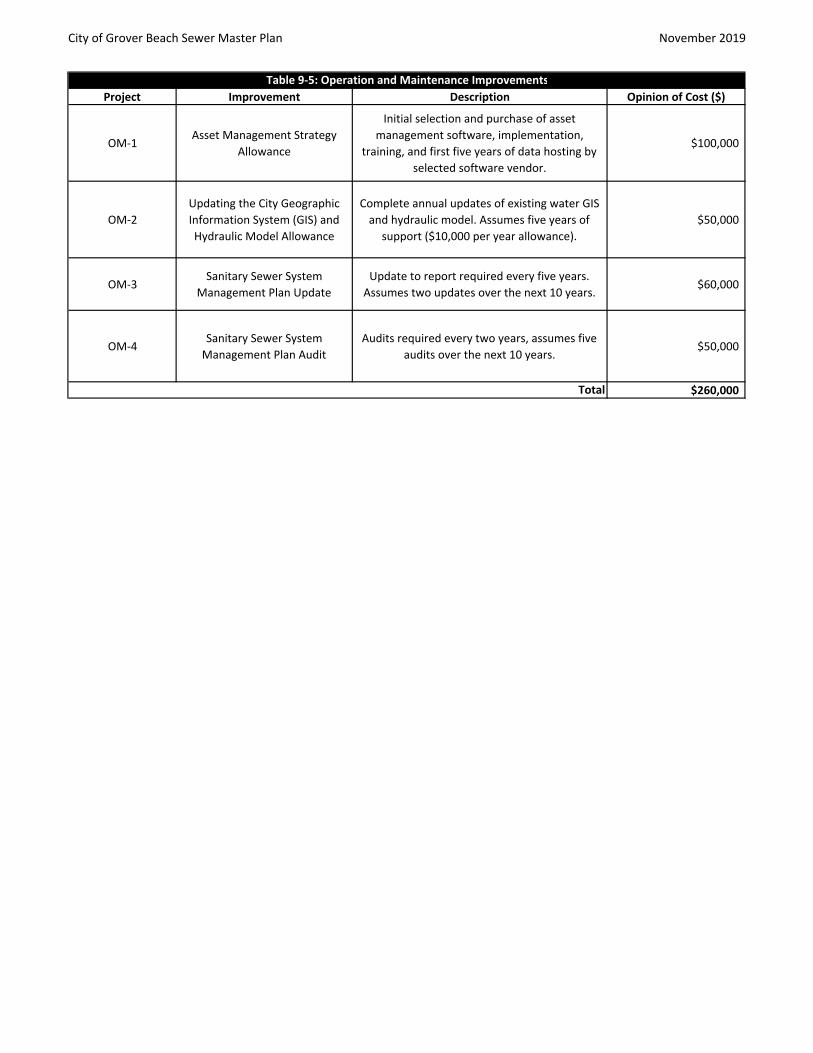
City of Grover Beach Sewer Master Plan November 2019
Project Improvement Description Opinion of Cost ($)
OM‐1Asset Management Strategy
Allowance
Initial selection and purchase of asset
management software, implementation,
training, and first five years of data hosting by
selected software vendor.
$100,000
OM‐2
Updating the City Geographic
Information System (GIS) and
Hydraulic Model Allowance
Complete annual updates of existing water GIS
and hydraulic model. Assumes five years of
support ($10,000 per year allowance).
$50,000
OM‐3Sanitary Sewer System
Management Plan Update
Update to report required every five years.
Assumes two updates over the next 10 years.$60,000
OM‐4Sanitary Sewer System
Management Plan Audit
Audits required every two years, assumes five
audits over the next 10 years.$50,000
$260,000
Table 9‐5: Operation and Maintenance Improvements
Total

THIS PAGE LEFT INTENTIONALLY BLANK
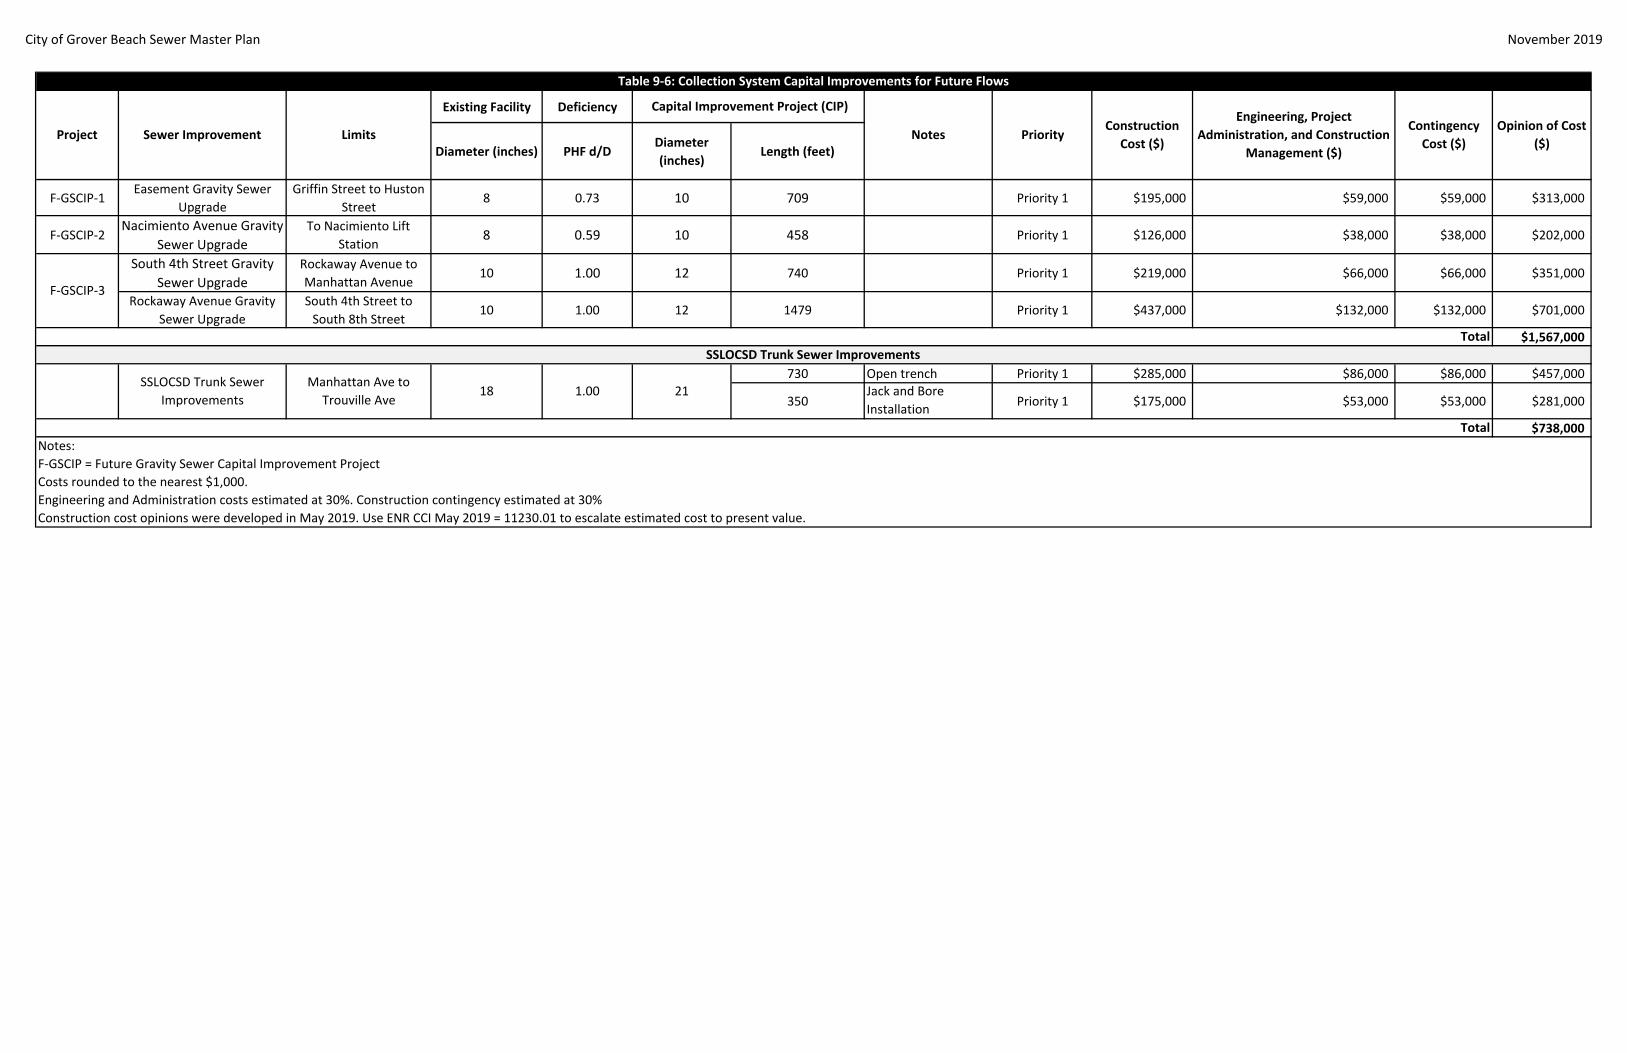
City of Grover Beach Sewer Master Plan November 2019
Existing Facility Deficiency
Diameter (inches) PHF d/DDiameter
(inches)Length (feet)
F‐GSCIP‐1Easement Gravity Sewer
Upgrade
Griffin Street to Huston
Street8 0.73 10 709 Priority 1 $195,000 $59,000 $59,000 $313,000
F‐GSCIP‐2Nacimiento Avenue Gravity
Sewer Upgrade
To Nacimiento Lift
Station8 0.59 10 458 Priority 1 $126,000 $38,000 $38,000 $202,000
South 4th Street Gravity
Sewer Upgrade
Rockaway Avenue to
Manhattan Avenue10 1.00 12 740 Priority 1 $219,000 $66,000 $66,000 $351,000
Rockaway Avenue Gravity
Sewer Upgrade
South 4th Street to
South 8th Street10 1.00 12 1479 Priority 1 $437,000 $132,000 $132,000 $701,000
$1,567,000
730 Open trench Priority 1 $285,000 $86,000 $86,000 $457,000
350Jack and Bore
InstallationPriority 1 $175,000 $53,000 $53,000 $281,000
$738,000
F‐GSCIP = Future Gravity Sewer Capital Improvement Project
Engineering and Administration costs estimated at 30%. Construction contingency estimated at 30%
F‐GSCIP‐3
Table 9‐6: Collection System Capital Improvements for Future Flows
Project
1.00 21
Total
SSLOCSD Trunk Sewer Improvements
Construction cost opinions were developed in May 2019. Use ENR CCI May 2019 = 11230.01 to escalate estimated cost to present value.
Priority
Engineering, Project
Administration, and Construction
Management ($)
Contingency
Cost ($)
Opinion of Cost
($)Sewer Improvement Limits
Capital Improvement Project (CIP)
NotesConstruction
Cost ($)
Notes:
Costs rounded to the nearest $1,000.
SSLOCSD Trunk Sewer
Improvements
Manhattan Ave to
Trouville Ave18
Total

THIS PAGE LEFT INTENTIONALLY BLANK
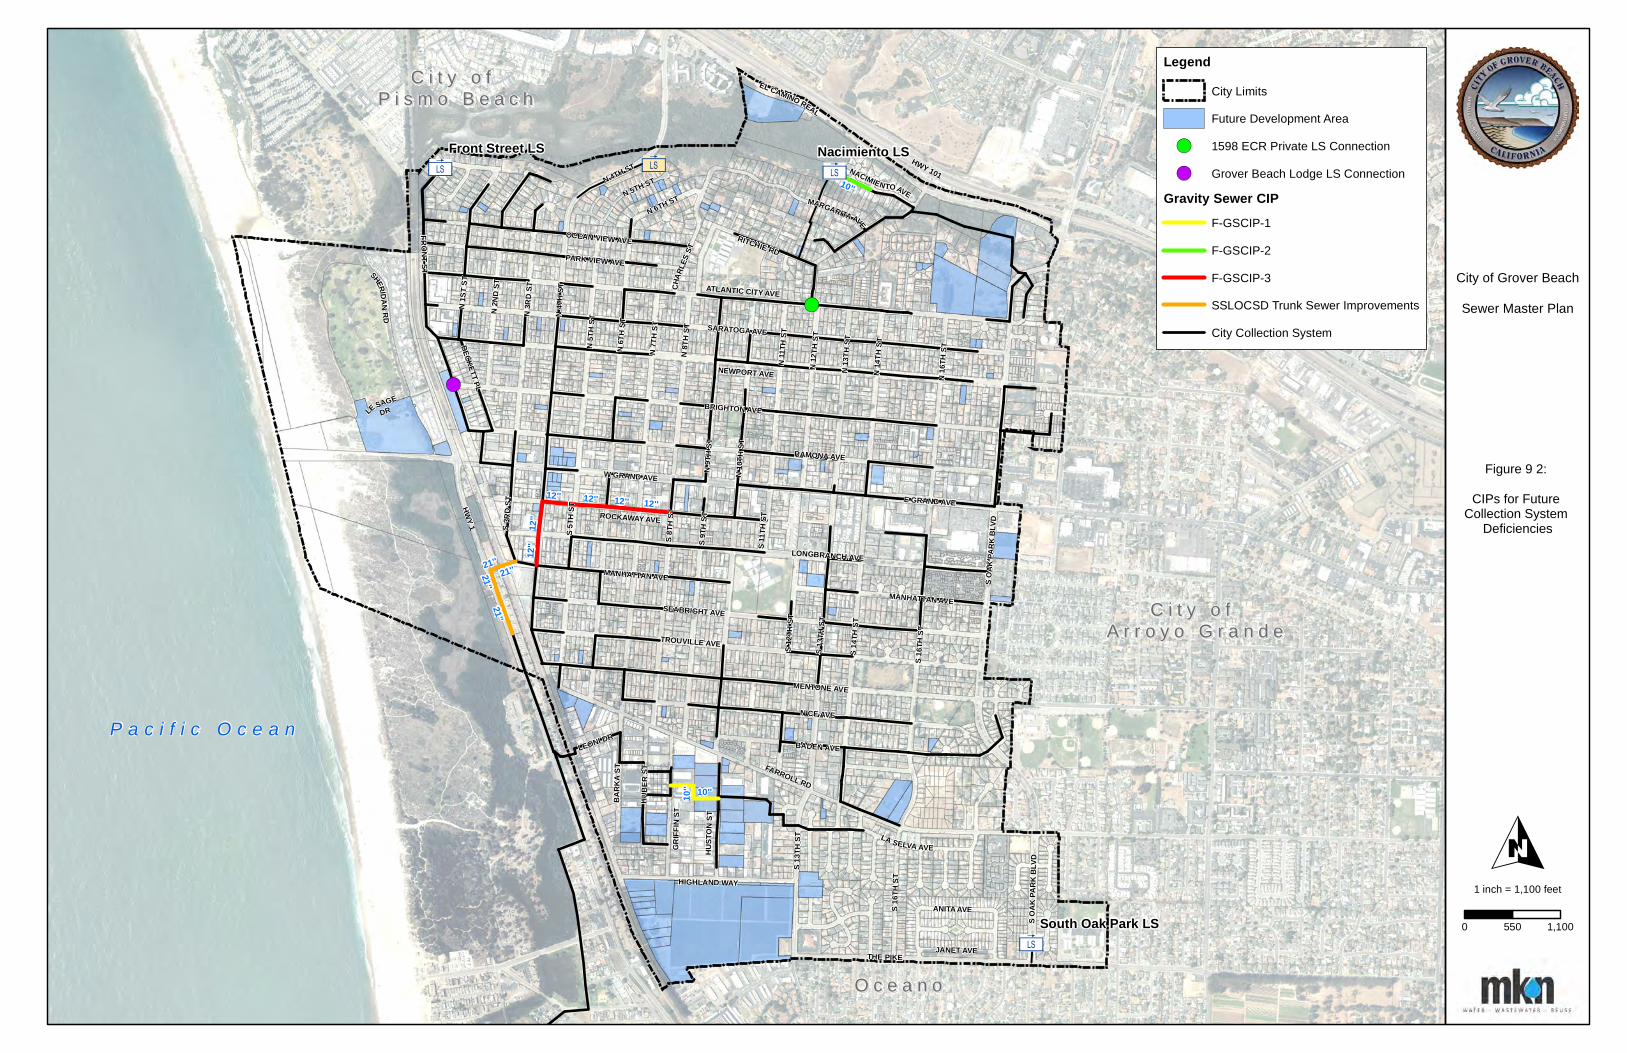
3ä 3ä
3ä
3ä
!(
!(
P a c i f i c O c e a n
C i t y o f C i t y o f A r r o y o G r a n d eA r r o y o G r a n d e
C i t y o f C i t y o f P i s m o B e a c hP i s m o B e a c h
O c e a n oO c e a n o
S OAK
PARK
BLV
D
HWY 101
MENTONE AVE
NACIMIENTOAVEN 5TH ST
FARROLL RD
TROUVILLE AVE
BARK
A ST
N 4TH ST
N 5T
H ST
N 6TH ST
N 2N
D ST
N 3R
D ST
N 1S
T ST
HIGHLAND WAY
CHAR
LES S
T
LA SELVA AVE
ATLANTIC CITY AVE
E GRAND AVE
FRONTST
S 13T
H ST
RITCHIE RD
N16
THST
S OAK
PARK
BLV
D
N 13
TH S
T
N 11
TH ST
S 14T
H ST
N 8T
H ST
W GRAND AVE N 10
TH S
T
S 12T
H ST
ROCKAWAY AVE
S 9TH
ST
PARK VIEW AVE
N 6T
H ST
N 4T
H ST
S 8TH
ST
MANHATTAN AVE
MANHATTAN AVE
SARATOGA AVE
SEABRIGHT AVE
N 7T
H ST
BADEN AVE
LONGBRANCH AVE
OCEAN VIEW AVE
N 9T
H ST
N 12
TH S
T
S3R
DST
GRIFF
IN ST
S 11T
H ST
S 5TH
ST
THE PIKE
S 16T
H ST
LE SAGEDR
N 14
TH S
T
LEONI DR
BECKETT PL
NICE AVE
BRIGHTON AVE
RAMONA AVE
NEWPORT AVE
ANITA AVE
JANET AVE
HUBE
R ST
S 16T
H ST
HUST
ON ST
HWY 1
SHERIDANRD
MARGARITA AVE
EL CAMINO REAL
S 13T
H ST
21''
10''
12''
21''
12''
10''
21'' 12''
12''
21''
10''
12''
12''
Nacimiento LSFront Street LS
South Oak Park LS
O
Figure 9 2:
CIPs for Future Collection System
Deficiencies
City of Grover Beach
Sewer Master Plan
LegendCity Limits
Future Development Area
!( 1598 ECR Private LS Connection
!( Grover Beach Lodge LS Connection
Gravity Sewer CIPF-GSCIP-1
F-GSCIP-2
F-GSCIP-3
SSLOCSD Trunk Sewer Improvements
City Collection System
1 inch = 1,100 feet
0 1,100550

THIS PAGE LEFT INTENTIONALLY BLANK
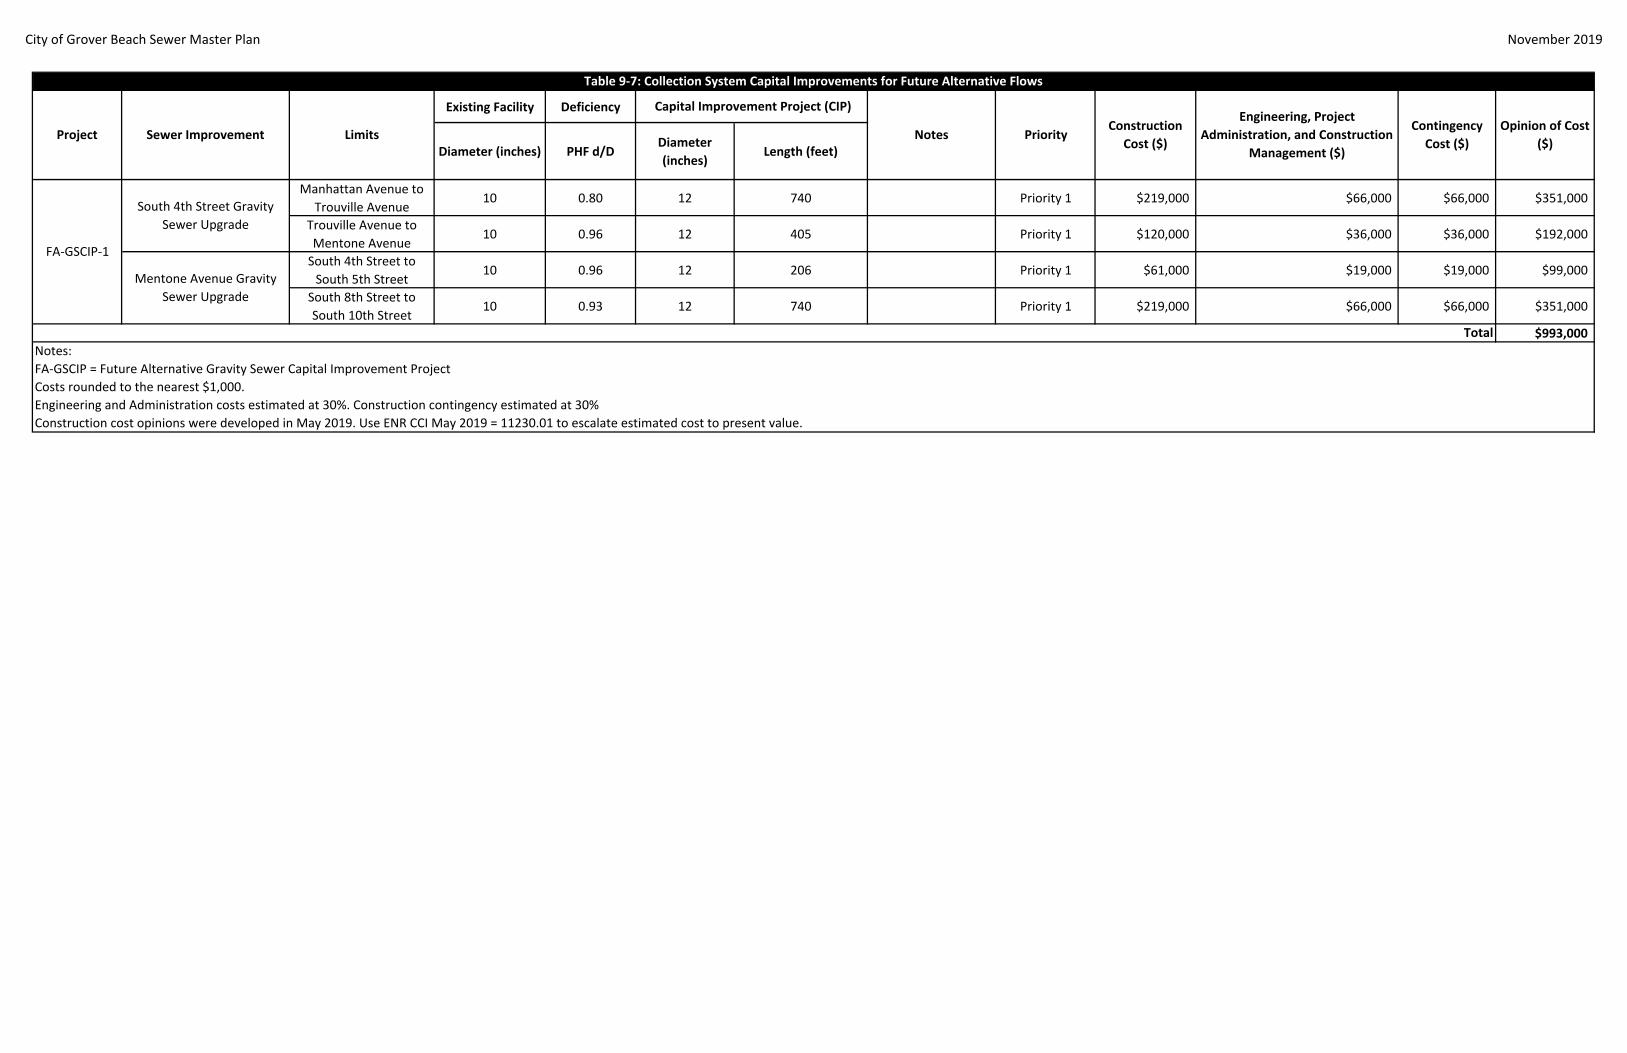
City of Grover Beach Sewer Master Plan November 2019
Existing Facility Deficiency
Diameter (inches) PHF d/DDiameter
(inches)Length (feet)
Manhattan Avenue to
Trouville Avenue10 0.80 12 740 Priority 1 $219,000 $66,000 $66,000 $351,000
Trouville Avenue to
Mentone Avenue10 0.96 12 405 Priority 1 $120,000 $36,000 $36,000 $192,000
South 4th Street to
South 5th Street10 0.96 12 206 Priority 1 $61,000 $19,000 $19,000 $99,000
South 8th Street to
South 10th Street10 0.93 12 740 Priority 1 $219,000 $66,000 $66,000 $351,000
$993,000
FA‐GSCIP = Future Alternative Gravity Sewer Capital Improvement Project
Opinion of Cost
($)
Table 9‐7: Collection System Capital Improvements for Future Alternative Flows
Project Sewer Improvement Limits
Capital Improvement Project (CIP)
Notes PriorityConstruction
Cost ($)
Engineering, Project
Administration, and Construction
Management ($)
Contingency
Cost ($)
Costs rounded to the nearest $1,000.
Engineering and Administration costs estimated at 30%. Construction contingency estimated at 30%
Construction cost opinions were developed in May 2019. Use ENR CCI May 2019 = 11230.01 to escalate estimated cost to present value.
FA‐GSCIP‐1
South 4th Street Gravity
Sewer Upgrade
Mentone Avenue Gravity
Sewer Upgrade
Total
Notes:

THIS PAGE LEFT INTENTIONALLY BLANK
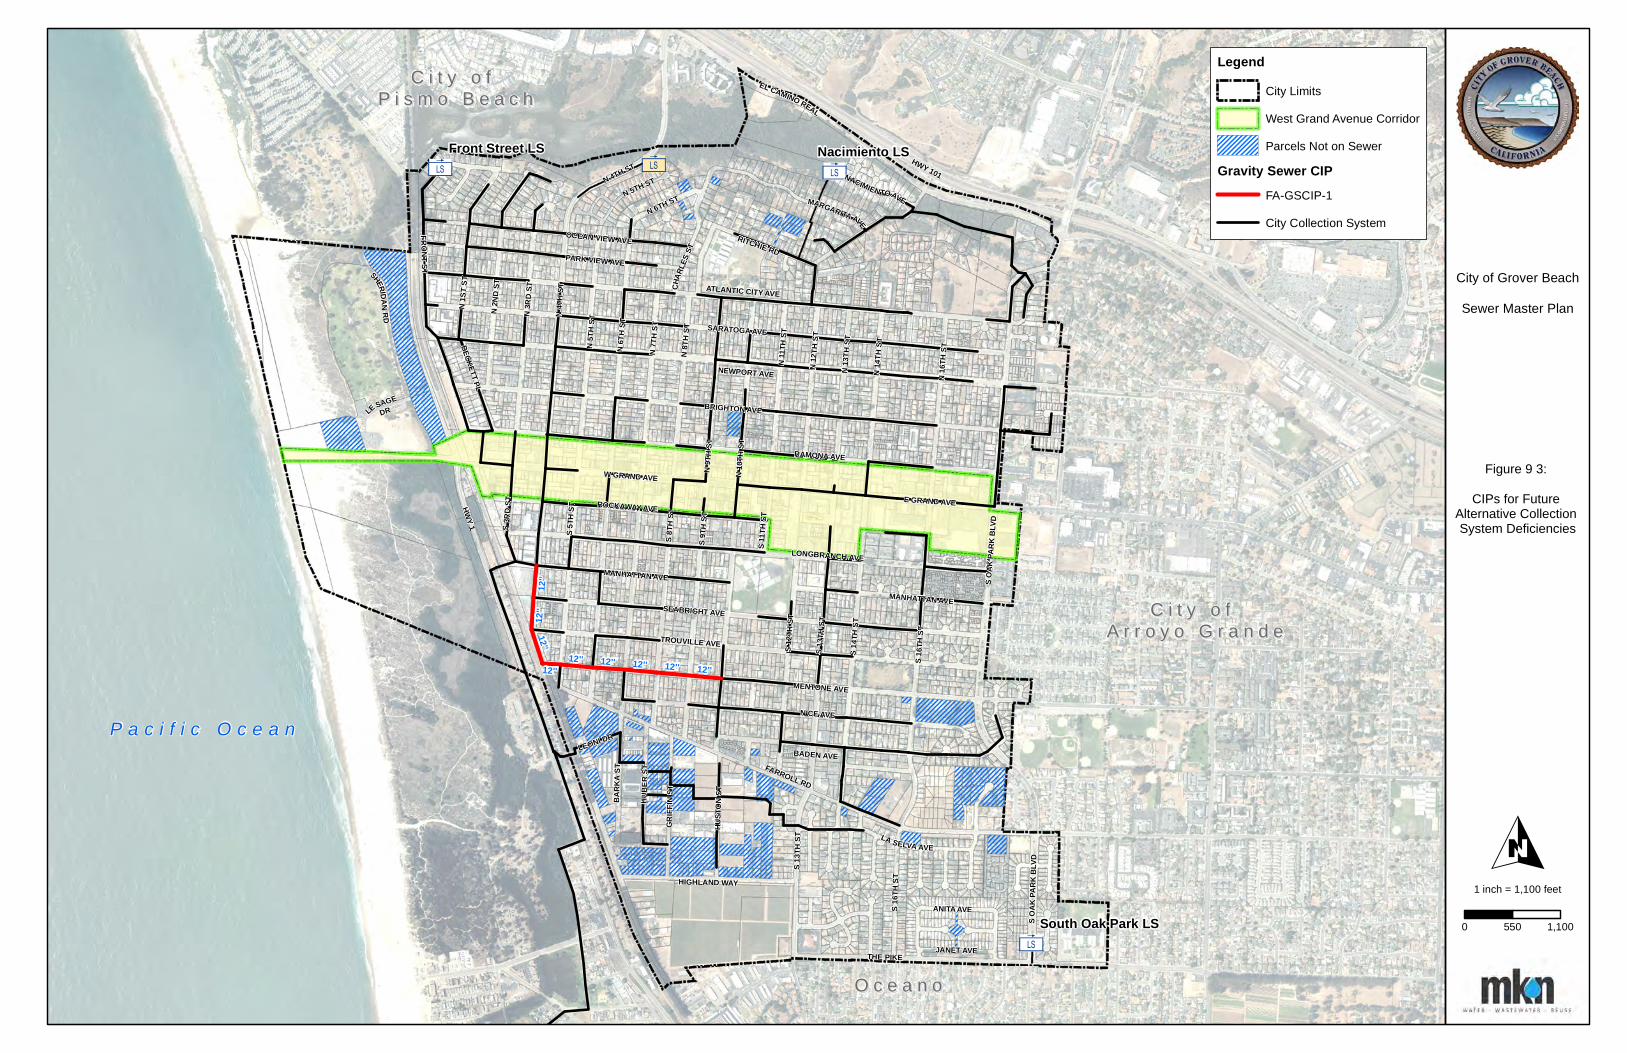
3ä 3ä
3ä
3ä
P a c i f i c O c e a n
C i t y o f C i t y o f A r r o y o G r a n d eA r r o y o G r a n d e
C i t y o f C i t y o f P i s m o B e a c hP i s m o B e a c h
O c e a n oO c e a n o
S OAK
PARK
BLV
D
HWY 101
MENTONE AVE
NACIMIENTOAVEN 5TH ST
FARROLL RD
TROUVILLE AVE
BARK
A ST
N 4TH ST
N 5T
H ST
N 6TH ST
N 2N
D ST
N 3R
D ST
N 1S
T ST
HIGHLAND WAY
CHAR
LES S
T
LA SELVA AVE
ATLANTIC CITY AVE
E GRAND AVE
FRONTST
S 13T
H ST
RITCHIE RD
N16
THST
S OAK
PARK
BLV
D
N 13
TH S
T
N 11
TH ST
S 14T
H ST
N 8T
H ST
W GRAND AVE N 10
TH S
T
S 12T
H ST
ROCKAWAY AVE
S 9TH
ST
PARK VIEW AVE
N 6T
H ST
N 4T
H ST
S 8TH
ST
MANHATTAN AVE
MANHATTAN AVE
SARATOGA AVE
SEABRIGHT AVE
N 7T
H ST
BADEN AVE
LONGBRANCH AVE
OCEAN VIEW AVE
N 9T
H ST
N 12
TH S
T
S3R
DST
GRIFF
IN ST
S 11T
H ST
S 5TH
ST
THE PIKE
S 16T
H ST
LE SAGEDR
N 14
TH S
T
LEONI DR
BECKETT PL
NICE AVE
BRIGHTON AVE
RAMONA AVE
NEWPORT AVE
ANITA AVE
JANET AVE
HUBE
R ST
S 16T
H ST
HUST
ON ST
HWY 1
SHERIDANRD
MARGARITA AVE
EL CAMINO REAL
S 13T
H ST
12''
12'' 12'' 12''
12''
12''
12''12''12''
Nacimiento LSFront Street LS
South Oak Park LS
O
Figure 9 3:
CIPs for Future Alternative Collection System Deficiencies
City of Grover Beach
Sewer Master Plan
LegendCity Limits
West Grand Avenue Corridor
Parcels Not on Sewer
Gravity Sewer CIPFA-GSCIP-1
City Collection System
1 inch = 1,100 feet
0 1,100550