Embed Size (px)
Citation preview
This is an Open Access document downloaded from ORCA, Cardiff University's institutional
repository: http://orca.cf.ac.uk/109649/
This is the author’s version of a work that was submitted to / accepted for publication.
Citation for final published version:
Giommoni, Luca and Gundur, Rajeev 2018. An analysis of the United Kingdom’s cannabis market
using crowdsourced data. Global Crime 19 (2) , pp. 85-106. 10.1080/17440572.2018.1460071 file
Publishers page: https://doi.org/10.1080/17440572.2018.1460071
<https://doi.org/10.1080/17440572.2018.1460071>
Please note:
Changes made as a result of publishing processes such as copy-editing, formatting and page
numbers may not be reflected in this version. For the definitive version of this publication, please
refer to the published source. You are advised to consult the publisher’s version if you wish to cite
this paper.
This version is being made available in accordance with publisher policies. See
http://orca.cf.ac.uk/policies.html for usage policies. Copyright and moral rights for publications
made available in ORCA are retained by the copyright holders.
Manuscript accepted for publication in Global Crime in March 2018
1
An Analysis of the United Kingdom’s Cannabis Market Using Crowdsourced Data
Luca Giommoni1, R.V. Gundur 2
1 Cardiff University, School of Social Sciences 2 University of Liverpool, Department of Sociology, Social Policy and Criminology
Corresponding author:
Luca Giommoni
School of Social Sciences, Cardiff University, UK
Glamorgan Building King Edward VII Avenue,
Cardiff CF10 3WT, Wales, UK
Tel: 02920874436
Email: [email protected]
This article contributes to the growing literature on the use computer mediated
communications to research illicit markets. In it, we conduct an analysis of the
British cannabis market using data crowdsourced from a publicly available
platform, PriceofWeed.com. Crowd-sourced transaction data presents some new
insights into the British cannabis market. First, this study has tracked the
trafficking flow of cannabis within the UK. Second, it shows the extent to which
a quantity discount is granted to consumers. Third, it discusses purchasing
habits of cannabis users. Conclusions suggest new areas of application of
crowdsourcing to research hard to reach and deviant populations.
Key words: crowdsourcing, illicit drug markets, cannabis, UK, digital criminology
Introduction
In recent years, social media data emerged as an important, additional source of information
for social science research. Gantz and Reinsel1 estimated that by 2020 the global volume of
digital data will be 35 zettabytes (3.5 x 1022 bytes), a figure that is 44 times the volume of the
total digital data that was available in 2010. The ease of uploading information means that
more digital data is now created every two to seven days than what was generated and
recorded in the entirety of humankind until 2003 (Griffiths, 2012). These huge streams of
data represent an unprecedented source of information to examine problems that have
historically been difficult to study.
This article contributes to a growing literature on the use of social media and
computer mediated communications to research crime-related problems and deviant
populations 2. We conducted an analysis of the British cannabis market using data
1 Gantz and Reinsel, ‘The Digital Universe Decade – Are You Ready?’ 2 Williams, Burnap, and Sloan, ‘Crime Sensing with Big Data’; Gerber, ‘Predicting Crime Using
Twitter and Kernel Density Estimation’; Holt and Blevins, ‘Examining Sex Work from the
Client’s Perspective’; Holt, ‘Identifying Gaps in the Research Literature on Illicit Markets On-
Line’.
crowdsourced from a publicly available platform, PriceofWeed.com. The results provide
insights to cannabis trafficking flows, dealers’ behaviors, and consumers’ purchasing habits
in the United Kingdom that would not be possible or very expensive to develop using
traditional data sources.
This article proceeds as follows: First, we discuss what research strategies of illicit
drug markets. Second, we show crowdsourcing drug prices can serve as a valid additional
data source. Third, we illustrate how crowdsourced data mined from priceofweed.com can be
a viable in terms of predicting prices, by triangulating the data with other, publicly available
sources. Fourth, we demonstrate how the Price of Weed data can be used to understand
trafficking flows, the degree to which discounts are given for quantity sold, and the
purchasing habits of buyers. Finally, we discuss the benefits, limitations, and future
applications of our approach.
Researching Illicit Drug Markets
Researchers have studied illicit drug markets in various ways, including analyzing collated
data sets, examining court documents, conducting ethnographies and qualitative interviews 3,
analyzing seizures 4, and surveying drug users 5. Each approach has it benefits and
limitations. Ethnography, court documents, and qualitative interviews allow researchers to
conduct a nuanced examination of local drug markets, behaviors of the different participants,
and social and cultural norms regulating the local drug market. Some scholars even resorted
3 Decker and Chapman, Drug Smugglers on Drug Smuggling; Potter, Weed, Need and Greed;
Murphy, ‘Drug Court as Both a Legal and Medical Authority’. 4 Farrell, ‘The Global Rate of Interception of Illicit Opiates and Cocaine 1980-1994.’; Burgdorf,
Kilmer, and Pacula, ‘Heterogeneity in the Composition of Marijuana Seized in California’;
Stevens, Drugs, Crime and Public Health. 5 Hughes and Stevens, ‘What Can We Learn From The Portuguese Decriminalization of Illicit
Drugs?’; MacDonald, ‘Illicit Drug Use in the UK’.
to video footage of narcotics transactions extracted from the closed-circuit television to have
a less intrusive observation of drug dealers’ behaviors6. Nonetheless, the main limitations
shared by these approaches is that they are, generally, time consuming, expensive, and lack
generalizability across marketplaces. Given that markets’ components and characteristics,
including actors, roles, social and cultural norms within7, are variable, the analysis of any
given market may not lead to comparative conclusions that are applicable to multiple markets
or markets of a given region.
In response, to develop generalizable findings on drug shipment volumes, one
strategy researchers have employed is to measure drug seizures, which are a function of the
quantity of drug shipped into a country8. As such, seizure data can be used to estimate the
national and international supply of illicit drugs. However, the quantity of drugs seized is not
a straightforward indicator of supply; seizures are the outcome of several factors including
the relative skill of the interdictors, the care taken by smugglers, and whether the jurisdiction
is a known transshipment point9.
Many developed and developing countries estimate drug use prevalence through
periodic surveys of students and their general population10. Prevalence measures, regarded as
the best available indicator to understand how well a country is doing in controlling illicit
drugs11, dominate the literature. However, population surveys have well-known limitations
6 Moeller, ‘Video-Recorded Retail Cannabis Trades in a Low-Risk Marketplace’; Piza and Sytsma,
‘Exploring the Defensive Actions of Drug Sellers in Open-Air Markets’. 7 Ritter, ‘Studying Illicit Drug Markets’. 8 Farrell, ‘The Global Rate of Interception of Illicit Opiates and Cocaine 1980-1994.’; Giommoni,
Aziani, and Berlusconi, ‘How Do Illicit Drugs Move Across Countries?’ 9 MacCoun and Reuter, Drug War Heresis: Learning from Other, Vices, Times, & Places. 10 Mounteney et al., ‘The Drug Situation in Europe’. 11 Kilmer, Reuter, and Giommoni, ‘What Can Be Learned from Cross-National Comparisons of Data
on Illegal Drugs?’
such as nonresponse by those who frequently use drugs, misreporting by those who do report
use, and unwillingness by many users who do respond to disclose their use12.
A new line of research has been opened by the recent diffusion of anonymous online
drug marketplaces (also known as drug cryptomarkets). Several scholars have resorted to
quantitative methods measuring the economic performances of these markets13 or observing
forum threads where buyers, vendors, and administrators discuss cryptomarket issues14.
Nonetheless, despite cryptomarkets’ potential to change the way illicit drugs are bought and
sold, they only represent a tiny fraction of the illicit drug market15.
Given some of the limits of alternative data sources, several researchers use drug
prices as a metric to extrapolate information about drug market dynamics. The three main
sources of data on drug prices are (1) synthesis reports by national and international agencies
such as the United Nations Office on Drugs and Crime (UNODC); (2) transaction-level data
from law enforcement agencies such as the US Drug Enforcement Administration; and, (3)
self-report data collected from drug users, where respondents report characteristics of their
transaction such as how much they spent, what they bought, and the quantity purchased16.
Accordingly, exploiting information on the cost of illicit drug transactions is
particularly appealing as price data are relatively abundant. Moreover, transaction data can be
12 Bowman-Bowen and Menard, ‘Survey Design Elements as Influences on Estimates of Self-
Reported Illicit Substance Use and Other Illegal Activities’; Giommoni, Reuter, and Kilmer,
‘Exploring the Perils of Cross-National Comparisons of Drug Prevalence’. 13 Aldridge and Décary-Hétu, ‘Not an “Ebay for Drugs”’. 14 Moeller, Munksgaard, and Demant, ‘Flow My FE the Vendor Said’. 15 Kruithof et al., ‘Internet-Facilitated Drugs Trade. An Analysis of the Size, Scope and the Role of
the Netherlands’. 16 Caulkins, ‘Price and Purity Analysis for Illicit Drug: Data and Conceptual Issues’.
disaggregated geographically and temporally to investigate specific patterns17. Given its
versatility, pricing information has been used in a large array of applications including
estimating the elasticity of demand18, predicting the number of overdoses19, understanding
how traffickers respond to law enforcement interventions20, and estimating a country’s
expenditure on illicit drugs21.
Recently, a data source that tabulates user’s self-reported expenditures, the publicly
accessibly, clear-web website PriceofWeed.com, has attracted attention among North-
American scholars. This website crowdsources data on cannabis transactions, including how
much users spent, what kind of cannabis product they bought, and the quantity and perceived
quality purchased. This data has been used to examine the consequences of cannabis
legalisation in California22, the effect of law enforcement on cannabis price23, the elasticity of
cannabis demand24 and even to inform on the financial implications of the legalisation of
cannabis in Canada25. Data on cannabis prices crowdsourced from the PriceofWeed.com,
17 Moeller, ‘Video-Recorded Retail Cannabis Trades in a Low-Risk Marketplace’; Sifaneck et al.,
‘Retail Marijuana Purchases in Designer and Commercial Markets in New York City’; Wilkins,
Reilly, and Casswell, ‘Cannabis “tinny” Houses in New Zealand’. 18 Olmstead et al., ‘The Price Elasticity of Demand for Heroin’; Bretteville-Jensen, ‘Drug Demand –
Initiation, Continuation and Quitting’. 19 Scott et al., ‘High-Frequency Drug Purity and Price Series as Tools for Explaining Drug Trends and
Harms in Victoria, Australia’; Unick et al., ‘The Relationship between US Heroin Market
Dynamics and Heroin-Related Overdose, 1992–2008’. 20 Kuziemko and Levitt, ‘An Empirical Analysis of Imprisoning Drug Offenders’; Caulkins and
Reuter, ‘How Drug Enforcement Affects Drug Prices’; Reuter and Kleiman, ‘Risks and Prices’. 21 RAND Corporation, ‘What America’s Users Spend on Illegal Drugs’. 22 Caulkins and Bond, ‘Marijuana Price Gradients Implications for Exports and Export-Generated Tax
Revenue for California after Legalization’. 23 Thies, ‘The Relationship Between Enforcement and the Price of Marijuana’; Lawson and Nesbit,
‘Alchian and Allen Revisited’. 24 Davis, Geisler, and Nichols, ‘The Price Elasticity of Marijuana Demand’. 25 Office of the Parliamentary Budget Officer, ‘Legalized Cannabis: Fiscal Considerations’.
however, has never been examined outside of the USA and Canada. This article shows the
potential of crowdsourced data on cannabis prices in a country that, contrary to the US, has
less nuanced sources of drug prices, with only a few composite estimates which are publicly
available. Our analysis contributes to the current research on the UK’s cannabis market by
providing several insights into cannabis flows, dealers’ behaviours and consumers’
purchasing habits using data crowdsourced from the PriceofWeed.com.
Crowdsourcing the Price of Cannabis
Crowdsourcing is a process that solicits help from a large pool of actors to support a project,
either by contributing funds, skills, or information to help realize a goal, usually in exchange
for promised recompense.26 As with any other social media platform, crowdsourcing allows
users to create and share information with each other. However, unlike other forms of social
media, such as Twitter or Facebook, crowdsourcing defines precise tasks – such as “solve this
problem,” “fund this product,” or “contribute knowledge for this project” – that require
support to complete.
The Price of Weed’s raison d'être is to crowdsource answers to the question: “What is
marijuana really worth [in a particular location]?” The site encourages users to provide the
prices paid for the benefit of the community, as to understand what the true value of the
cannabis purchased is at any given location. By submitting information about their latest
transactions, users contribute to the understanding of what the optimal price should be in their
area. Users then provide information about their latest transaction for the same reason people
contribute to Wikipedia. Users do not get any compensation for writing and editing
Wikipedia articles except improved self-esteem through their contribution to the knowledge-
26 Estellés-Arolas and González-Ladrón-de-Guevara, ‘Towards an Integrated Crowdsourcing
Definition’; Gupta and Brooks, Using Social Media for Global Security.
base of the Wikipedia community. In the same way, people submitting information about
cannabis purchases are happy to contribute and improve the knowledge-base of the cannabis
user community.
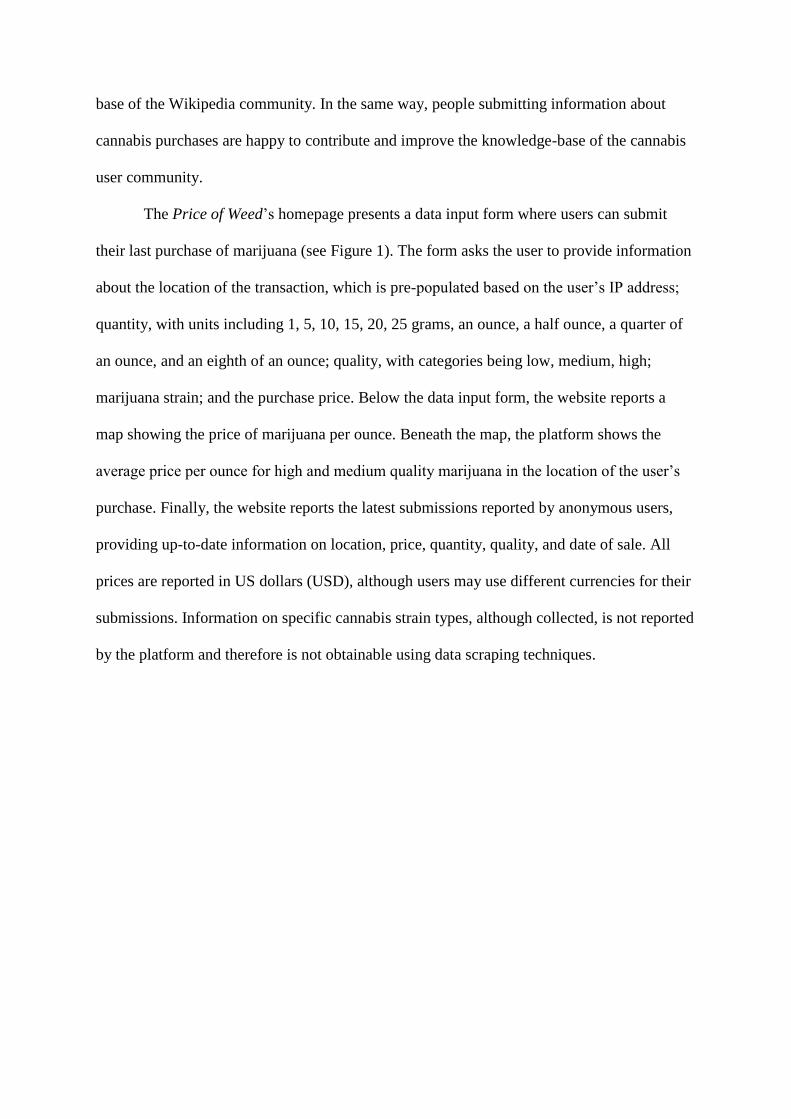
The Price of Weed’s homepage presents a data input form where users can submit
their last purchase of marijuana (see Figure 1). The form asks the user to provide information
about the location of the transaction, which is pre-populated based on the user’s IP address;
quantity, with units including 1, 5, 10, 15, 20, 25 grams, an ounce, a half ounce, a quarter of
an ounce, and an eighth of an ounce; quality, with categories being low, medium, high;
marijuana strain; and the purchase price. Below the data input form, the website reports a
map showing the price of marijuana per ounce. Beneath the map, the platform shows the
average price per ounce for high and medium quality marijuana in the location of the user’s
purchase. Finally, the website reports the latest submissions reported by anonymous users,
providing up-to-date information on location, price, quantity, quality, and date of sale. All
prices are reported in US dollars (USD), although users may use different currencies for their
submissions. Information on specific cannabis strain types, although collected, is not reported
by the platform and therefore is not obtainable using data scraping techniques.
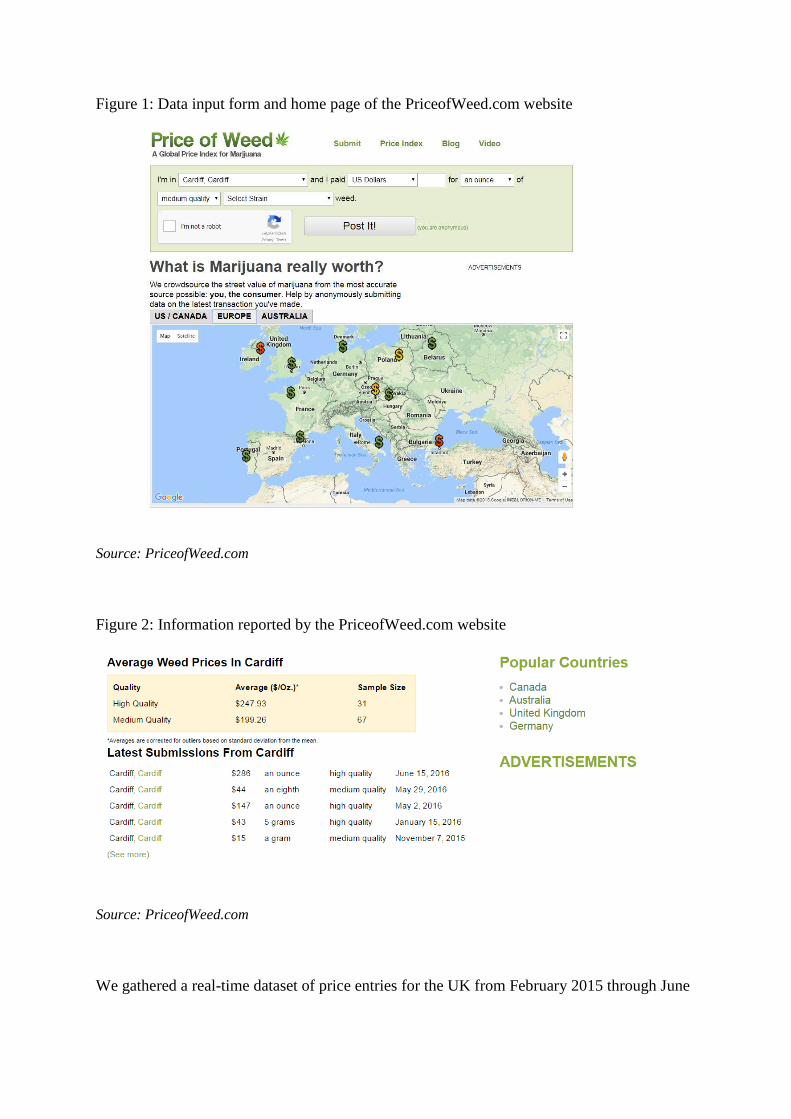
Figure 1: Data input form and home page of the PriceofWeed.com website
Source: PriceofWeed.com
Figure 2: Information reported by the PriceofWeed.com website
Source: PriceofWeed.com
We gathered a real-time dataset of price entries for the UK from February 2015 through June
2016 by scraping the data from the Price of Weed on a daily basis.27 The Price of Weed
website, in fact, does not provide the entire dataset but only the latest 15 transactions per
country, meaning that daily collection is necessary in order to ensure that all records are
collected. The data collection produced an initial sample of 2,146 entries. To create a
standard point of comparison, we converted the prices, reported in United States Dollars
(USD/ $) to what they would be at the gram amount. Observations with prices lower than
$0.30 per gram and higher than $35 were dropped given their abnormal deviance from the
mean. All transactions were then converted from USD to Great British Pounds (GBP/ £)
using the daily exchange rate provided by the Bank of England. The final dataset contains
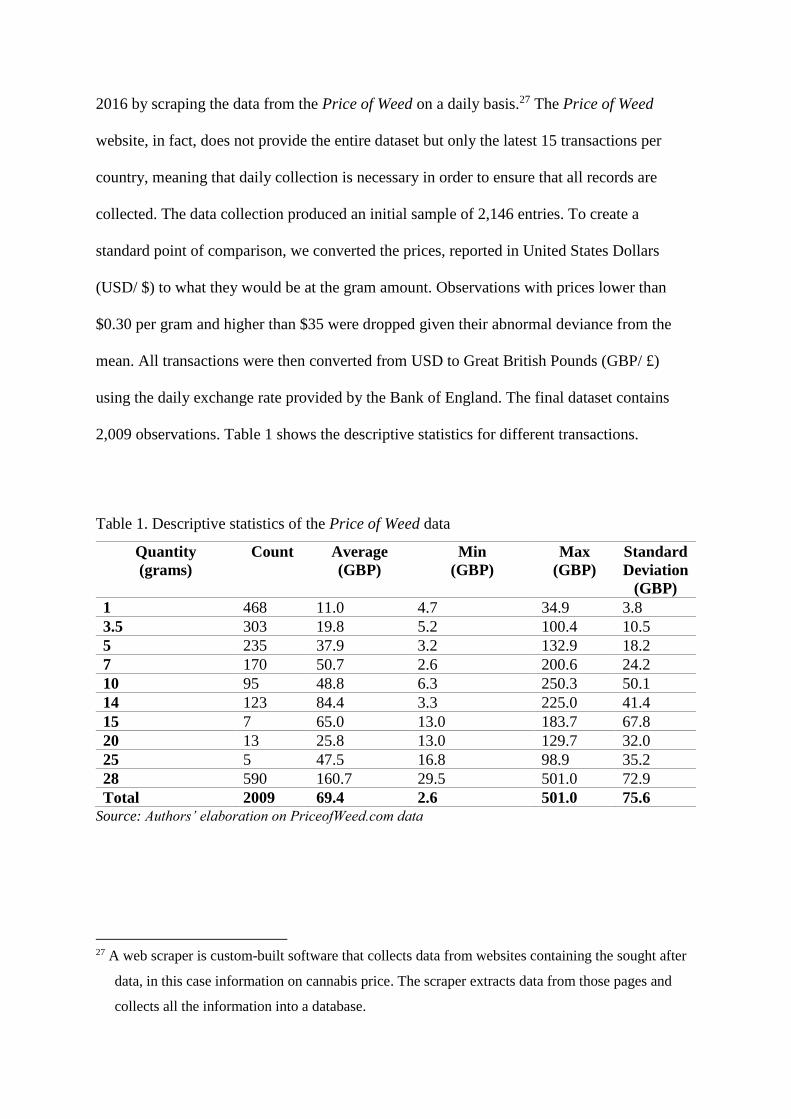
2,009 observations. Table 1 shows the descriptive statistics for different transactions.
Table 1. Descriptive statistics of the Price of Weed data
Quantity (grams)
Count Average (GBP)
Min (GBP)
Max (GBP)
Standard Deviation
(GBP) 1 468 11.0 4.7 34.9 3.8 3.5 303 19.8 5.2 100.4 10.5 5 235 37.9 3.2 132.9 18.2 7 170 50.7 2.6 200.6 24.2 10 95 48.8 6.3 250.3 50.1 14 123 84.4 3.3 225.0 41.4 15 7 65.0 13.0 183.7 67.8 20 13 25.8 13.0 129.7 32.0 25 5 47.5 16.8 98.9 35.2 28 590 160.7 29.5 501.0 72.9 Total 2009 69.4 2.6 501.0 75.6
Source: Authors’ elaboration on PriceofWeed.com data
27 A web scraper is custom-built software that collects data from websites containing the sought after
data, in this case information on cannabis price. The scraper extracts data from those pages and
collects all the information into a database.
This data shows the large variation in the sample which is not unexpected. Illicit drug prices
per unit of measure may vary from transaction to transaction, between places, and over time.
Variability does not reduce the data’s analytical purchase, and is common in licit
marketplaces as well. For instance, the retail price of oil can show different values within the
same city and is far more expensive in some parts of the world than in others; nevertheless, it
is common to speak about “the price of oil.” Whether speaking about the “the price of oil” or
“the price of drugs,” it is not important that drugs/oil are sold everywhere at the same price,
rather it is important that prices are sufficiently linked thereby making it possible to identify a
benchmark value28.
Comparing the Price of Weed data to other sources
We checked the validity of the price data collected by comparing it to alternative available
sources of data on drug price. In their review, Bryan et al identify three main sources of data
for drug prices in the UK 29:
1) Data generated by the National Crime Agency (NCA) and forensic services;
2) a survey of drug and alcohol services, police forces and service user groups conducted
by the charity DrugWise (previously known as DrugScope);
3) and, a survey of drug users by the Independent Drug Monitoring Unit (IDMU).
The data provided by the NCA are collected and collated from police forces throughout the
UK, who obtain information using a variety of means, including test purchases, prisoner
interviews, and informants’ reports. The NCA does not publish the data itself but does
28 Moore et al., ‘Monograph No. 09: Heroin Markets in Australia: Current Understandings and Future
Possibilities’. 29 Bryan, Del Bono, and Pudney, ‘Licensing and Regulation of the Cannabis Market in England and
Wales: Towards a Cost-Benefit Analysis’.
provide them in standardized format to international bodies such as the United Nations Office
on Drugs and Crime (UNODC) and the European Monitoring Centre for Drugs and Drug
Addiction (EMCDDA).
DrugWise is a charity that offers advice and support to organizations in the drug
sectors. DrugWise has surveyed local social workers, Drug Action Team staff, and police
officers working in drug squads. The interviews were conducted mainly by telephone but also
email and face-to-face. Average prices from the surveys are published on the DrugWise
webpage.30
The Independent Drug Monitoring Unit is a company that monitors the state of the
drugs market in the UK and provides expert witnesses in court cases. They conduct an annual
survey which collects information on drug consumption and prices paid by drug users who
volunteer to take the survey (mainly online). For 2015, the year used in our comparison of the
main drug price data sources in the UK to the data collected from the Price of Weed, the
sample is composed by 333 observations collected in twelve different regions in the UK31.
Several issues complicate our ability to directly compare these three official data
sources and the Price of Weed data. First, these sources do not publish in detail methods of
data collection or authentication. However, from the information provided, it is clear that the
methods used differ widely for each dataset. Each data provider uses varying sampling
strategies whereby they conduct interviews differently, and survey distinct geographical
areas.
Second, cannabis is not a standardised product, so research on “cannabis” may
include a wide array of products, which are not studied similarly across the datasets. For
30 http://www.drugwise.org.uk/how-much-do-drugs-cost/ 31 The regions surveyed are: London, South East, South West, Midlands, Wales, Yorkshire and the
Humber, North West, North East, Scotland, Ireland, and others.
instance, the IDMU collects information for seven different types of cannabis whereas
EMCDDA, UNODC, and DrugWise report a much more limited selection.
Third, the complete datasets are not publicly available and the only provide point
estimates at gram- (EMCDDA and UNODC), eighth- (IDMU), quarter- (DrugWise) and
ounce-level (IDMU). Given the lack of harmonisation among the datasets differences among
the four sources are expected. However, this exercise can indicate if crowd-sourced values
are roughly in line with those reported by other sources.
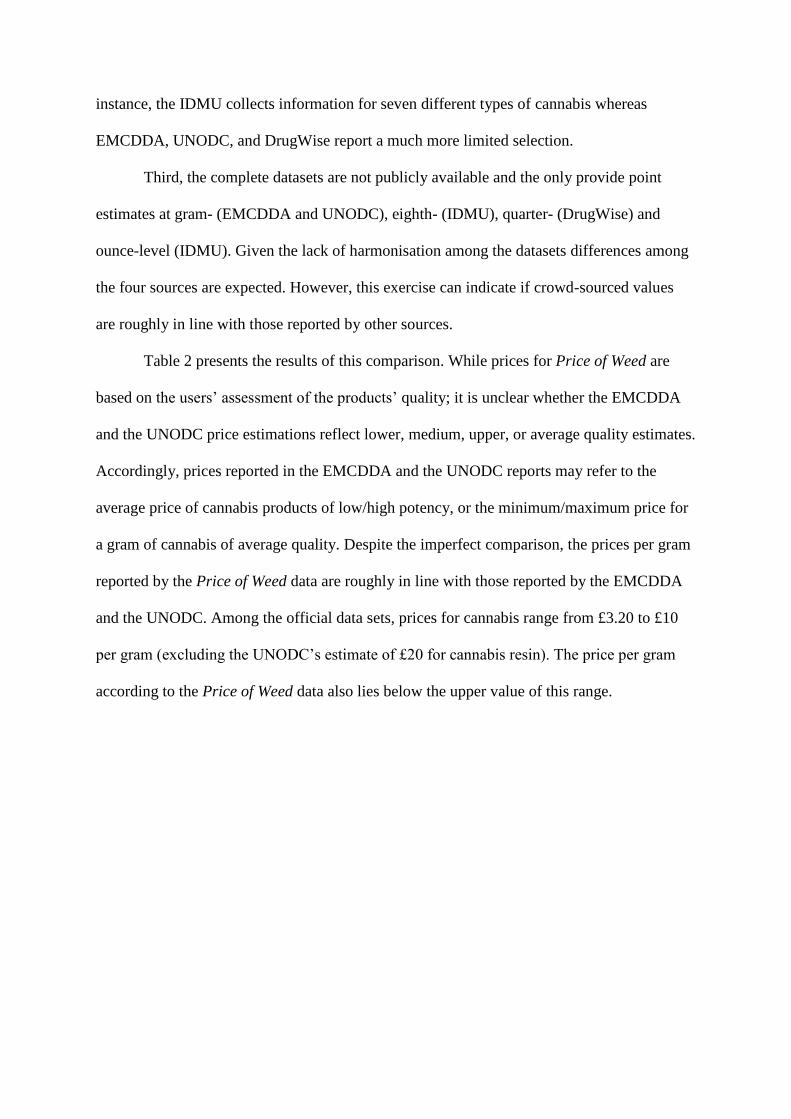
Table 2 presents the results of this comparison. While prices for Price of Weed are
based on the users’ assessment of the products’ quality; it is unclear whether the EMCDDA
and the UNODC price estimations reflect lower, medium, upper, or average quality estimates.
Accordingly, prices reported in the EMCDDA and the UNODC reports may refer to the
average price of cannabis products of low/high potency, or the minimum/maximum price for
a gram of cannabis of average quality. Despite the imperfect comparison, the prices per gram
reported by the Price of Weed data are roughly in line with those reported by the EMCDDA
and the UNODC. Among the official data sets, prices for cannabis range from £3.20 to £10
per gram (excluding the UNODC’s estimate of £20 for cannabis resin). The price per gram
according to the Price of Weed data also lies below the upper value of this range.
Table 2. Price of cannabis (GBP) in the UK according to the Price of Weed, the EMCDDA, the UNODC, the IDMU and DrugWise
Source Average per gram An eighth A fourth An ounce Low Medium High Medium High Medium High Medium High
PoWa 7.2 7.2 19.9 19.6 47.6 56.2 152 170.9 (±0.2) (±0.3) (±1.4) (±2.4) (±3.9) (±7.4) (±7.9) (±8.6)
EMCDDA Cannabis herb 3.3 5.7 Cannabis resin 3.2 4.3
UNODCb Cannabis resin 10 10 20 Cannabis herb 5 5 10 Skunk 5
IDMU
Black 23.8 107.5 Soap-Bar 21.3 75.4 Other Moroccan 21.4 92.3 Other Hash 31.5 125 Skunk 28.3 216 Homegrown/Leaf 12.9 67.1 Imported Bush 24.1 132.9
DrugWise
Herbal Cannabis (Standard)
37
Herbal Cannabis (High standard)
55
*Price of Weed: 2015/2016; EMCDDA: 2014 (cannabis resin) and 2013 (cannabis herb); UNODC: 2012; DrugWise: 2016; IDMU: 2015. a We do report value for low quality given the few observations (n.= 84) compared to medium (n. =1,368) and high quality (n. = 557) b UNODC considers mean as typical
The IDMU reports data for an eighth of an ounce (~3.5 grams) and an ounce (~28 grams).
Data refers approximately to the same year (Price of Weed: 2015/16; IDMU: 2015) but
differs in terms of cannabis product. The IDMU reports prices per ounce for several strains
that range from £67.10 to a maximum of £216. According to the Price of Weed, the average
price for an ounce of cannabis is £152 (±£7.90) for medium-quality and £171 (±£8.60) for
high-quality. The range provided by the IDMU is wide and lacks nuance; nonetheless, the
prices reported by the Price of Weed fall within the IDMU range allowing us to see that the
prices observed are reasonable when compared to public measurements. The paucity of low-
grade cannabis transactions reported in the Price of Weed data (there were four) coupled with
the fact that that medium- and high-grade products are close in price, could suggest that the
quality of product available on market is relatively high overall, supporting the observed
trend of relatively small-scale domestic producers competing with each other for market
share, and thus providing relatively good quality product32.
The last comparison is with DrugWise for a quarter ounce of cannabis. DrugWise and
Price of Weed report prices for different cannabis products but approximately the same year.
Despite this, the two datasets seem to report similar results. The minimum price reported by
DrugWise is between £27 and £55 per quarter ounce. Price of Weed reports an average cost
of £47.60 (±£3.90) for medium-quality and £56 (±£7.40) for high-quality cannabis.
Crowdsourced values are closer to the upper value and roughly in line with the source of
comparison.
As expected, there are differences in the reported prices between the Price of Weed
data and the other sources surveyed, which could be due to the different year of analysis,
product varieties, potency, or variance in the methods of data collection. Prices can change
32 Potter et al., ‘Global Patterns of Domestic Cannabis Cultivation’.
quite noticeably across years 33 and, as comparative studies in criminology show,
idiosyncratic systems of data collection produce different results34. One of the main factors
limiting the comparison of the Price of Weed data with existing data sets is the absence of
information about specific types of cannabis products from the Price of Weed. In fact, it just
reports if the cannabis purchased was of a low, medium, or high quality based on the user’s
assessment, rather than specifying whether the product is herbal, hash, or some other
cannabis product, such as wax. Nonetheless, this does not mean that the Price of Weed
dataset cannot be used but that it cannot, in its current form, wholly replace some of the
nuances the existing sources provide on specific product types.
Results
The next section presents our findings from the Price of Weed data in the United Kingdom.
They are organized around three themes relevant to understanding the dynamics of drug
markets: trafficking flows, quantity discount, and purchasing habits.
Trafficking Flows
Illicit drug prices increase as one moves away from drug import sources35. Several studies
have used systematic observations on drug prices to infer drug trafficking flows – that is, the
route a drug is trafficked along – and to calculate price gradients, that is, changes in price
over the trafficking flow. In a series of papers, Chandra and colleagues used drug price
33 Bryan, Del Bono, and Pudney, ‘Licensing and Regulation of the Cannabis Market in England and
Wales: Towards a Cost-Benefit Analysis’; Caulkins and Reuter, ‘What Price Data Tell Us About
Drug Markets’. 34 Tonry, ‘Is Cross-National and Comparative Research on the Criminal Justice System Useful?’;
Aebi and Linde, ‘The Epistemological Obstacles in Comparative Criminology’. 35 Caulkins and Bond, ‘Marijuana Price Gradients Implications for Exports and Export-Generated Tax
Revenue for California after Legalization’.
information to identify heroin and cocaine trafficking flows across European countries36 and
within the United States 37. Lahaie et al.38 found that the price of heroin in France tends to
increase moving away from the border with the Netherlands, which is acknowledged to be
the main entry route for heroin into Western Europe. Similarly, Caulkins and Bond39
estimated that the price of marijuana in the United States tends to increase between $325 and
$475 per pound per 1,000 miles travelled as the product moves north from the Mexican
border.
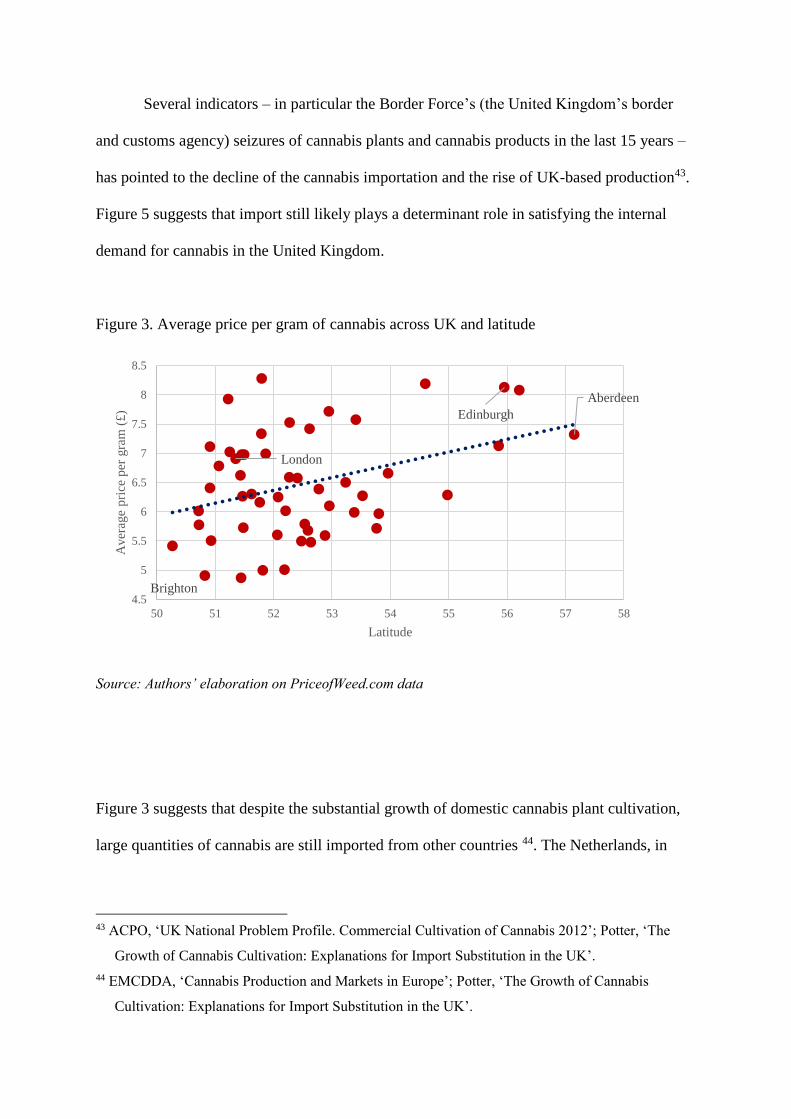
Prices in the UK cannabis market behave in a similar way: the further away from a
southern shipping port, the more a cannabis sells for. Figure 3 plots the average price per
gram for 52 cities in the UK against their latitude40. This linear model is an approximation,
but it fits the data reasonably well (R = .37; p < .001). The price per unit increases constantly
moving from south to north reflecting shipping patterns in the UK. The figure indicates that it
is likely that most cannabis shipments enter the UK from the south. Moving from the source
of the supply to the north increases traffickers’ risk in terms of arrest or seizure given the
needs to transport the product, stage the product, and finding a buyer.41 Accordingly, as we
would expect, and as the data reflects, cannabis is more expensive in the northern part of the
UK compared to the southern part of the country42.
36 Chandra and Barkell, ‘What the Price Data Tell Us about Heroin Flows across Europe’; Chandra,
Barkell, and Steffen, ‘Inferring Cocaine Flows across Europe’; Chandra and Joba, ‘Transnational
Cocaine and Heroin Flow Networks in Western Europe’. 37 Chandra, Peters, and Zimmer, ‘How Powdered Cocaine Flows Across the United States Evidence
From Open-Source Price Data’. 38 ‘Determinants of Heroin Retail Prices in Metropolitan France’. 39 ‘Marijuana Price Gradients Implications for Exports and Export-Generated Tax Revenue for
California after Legalization’. 40 The analysis considered just those cities for which at least 20 observations has been collected. 41 Reuter and Kleiman, ‘Risks and Prices’. 42 Caulkins, ‘Domestic Geographic Variation in Illicit Drug Prices’.
Several indicators – in particular the Border Force’s (the United Kingdom’s border
and customs agency) seizures of cannabis plants and cannabis products in the last 15 years –
has pointed to the decline of the cannabis importation and the rise of UK-based production43.
Figure 5 suggests that import still likely plays a determinant role in satisfying the internal
demand for cannabis in the United Kingdom.
Figure 3. Average price per gram of cannabis across UK and latitude
Source: Authors’ elaboration on PriceofWeed.com data
Figure 3 suggests that despite the substantial growth of domestic cannabis plant cultivation,
large quantities of cannabis are still imported from other countries 44. The Netherlands, in
43 ACPO, ‘UK National Problem Profile. Commercial Cultivation of Cannabis 2012’; Potter, ‘The
Growth of Cannabis Cultivation: Explanations for Import Substitution in the UK’. 44 EMCDDA, ‘Cannabis Production and Markets in Europe’; Potter, ‘The Growth of Cannabis
Cultivation: Explanations for Import Substitution in the UK’.
Aberdeen
Brighton
Edinburgh
London
4.5
5
5.5
6
6.5
7
7.5
8
8.5
50 51 52 53 54 55 56 57 58
Ave
rage
pri
ce p
er g
ram
(£)
Latitude
particular, has been identified as having a determinant role on the importation of cannabis to
the UK45. The Netherlands not only exports large quantities of high-quality, domestically
produced cannabis to the UK but also works as a staging and distribution hub for the cannabis
produced in other countries including Albania, Morocco and Afghanistan46. Traffickers can
take advantage of the numerous ports of entry in southern Britain, including Southampton,
Portsmouth, Dover, Tilbury and Harwich, as well as the Channel Tunnel to transport cannabis
loads into the UK47.
Given the number of variables in play, identifying the determinants of the price of
cannabis is beyond the scope of this article. Future quantitative work should aim at assessing
the influence of different factors (e.g. product quality, level of enforcement, etc.) in
determining cannabis price. Moreover, since no model can perfectly fit the complexity and
heterogeneity of cannabis market, ethnographic and qualitative studies are necessary to add a
deeper understanding of local cannabis markets48.
Quantity Discount
In both licit and illicit marketplaces, customers buying in bulk receive a quantity discount.
Merchants use discount prices to attract customers to buy more items and lessen stock, thus
passing on the risk of possessing, and potentially losing stock before they are compensated,
due to theft, disaster, or any other occurrence which would destroy the value of the stock.
45 EMCDDA and EUROPOL, ‘EU Drug Markets Report. In-Depth Analysis’. 46 Burton et al., ‘United Kingdom Drug Situation: Annual Report to the European Monitoring Centre
for Drugs and Drug Addiction (EMCDDA) 2014’; EMCDDA, ‘Cannabis Production and Markets
in Europe’; EMCDDA, ‘European Drug Report 2015. Trends and Development’. 47 In this analysis we used latitude and not distance from port given the numerous ports present in the
UK. There are, in fact, sixteen ports in the South of the UK and each of which can serve as point of
entry for the cannabis smuggled onto the island. Latitude is then a better fit in the model. 48 Adler, Wheeling and Dealing.
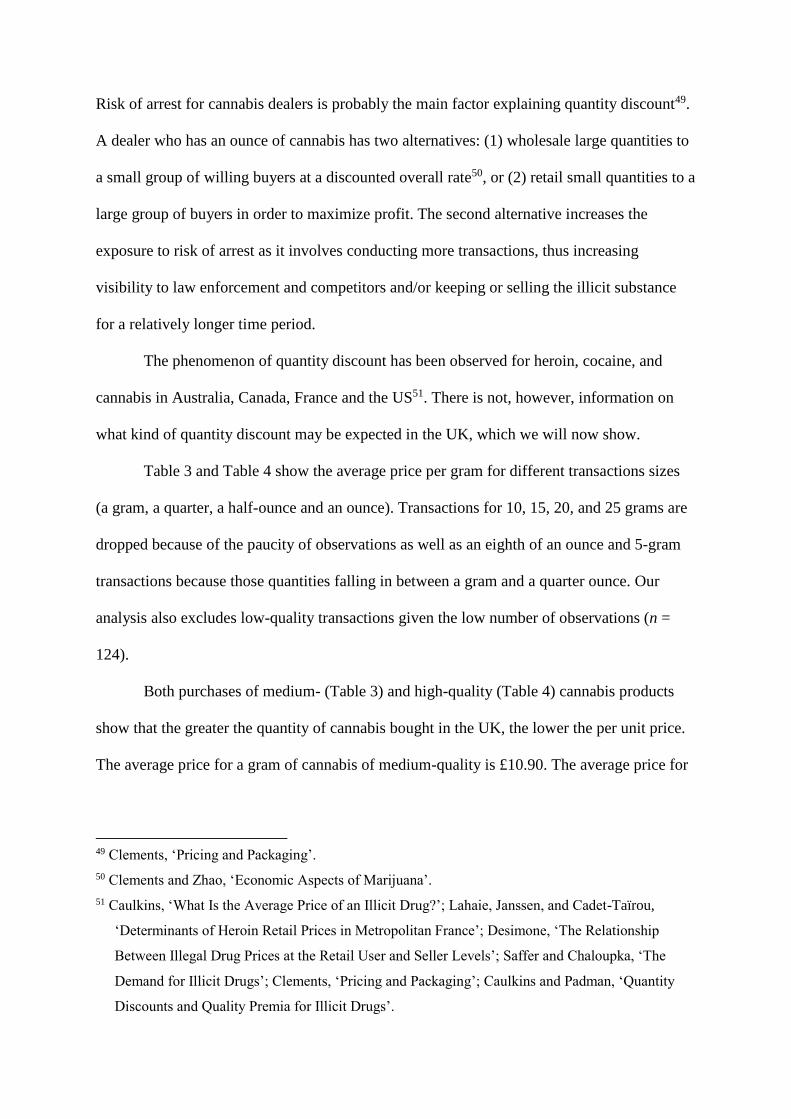
Risk of arrest for cannabis dealers is probably the main factor explaining quantity discount49.
A dealer who has an ounce of cannabis has two alternatives: (1) wholesale large quantities to
a small group of willing buyers at a discounted overall rate50, or (2) retail small quantities to a
large group of buyers in order to maximize profit. The second alternative increases the
exposure to risk of arrest as it involves conducting more transactions, thus increasing
visibility to law enforcement and competitors and/or keeping or selling the illicit substance
for a relatively longer time period.
The phenomenon of quantity discount has been observed for heroin, cocaine, and
cannabis in Australia, Canada, France and the US51. There is not, however, information on
what kind of quantity discount may be expected in the UK, which we will now show.
Table 3 and Table 4 show the average price per gram for different transactions sizes
(a gram, a quarter, a half-ounce and an ounce). Transactions for 10, 15, 20, and 25 grams are
dropped because of the paucity of observations as well as an eighth of an ounce and 5-gram
transactions because those quantities falling in between a gram and a quarter ounce. Our
analysis also excludes low-quality transactions given the low number of observations (n =
124).
Both purchases of medium- (Table 3) and high-quality (Table 4) cannabis products
show that the greater the quantity of cannabis bought in the UK, the lower the per unit price.
The average price for a gram of cannabis of medium-quality is £10.90. The average price for
49 Clements, ‘Pricing and Packaging’. 50 Clements and Zhao, ‘Economic Aspects of Marijuana’. 51 Caulkins, ‘What Is the Average Price of an Illicit Drug?’; Lahaie, Janssen, and Cadet-Taïrou,
‘Determinants of Heroin Retail Prices in Metropolitan France’; Desimone, ‘The Relationship
Between Illegal Drug Prices at the Retail User and Seller Levels’; Saffer and Chaloupka, ‘The
Demand for Illicit Drugs’; Clements, ‘Pricing and Packaging’; Caulkins and Padman, ‘Quantity
Discounts and Quality Premia for Illicit Drugs’.
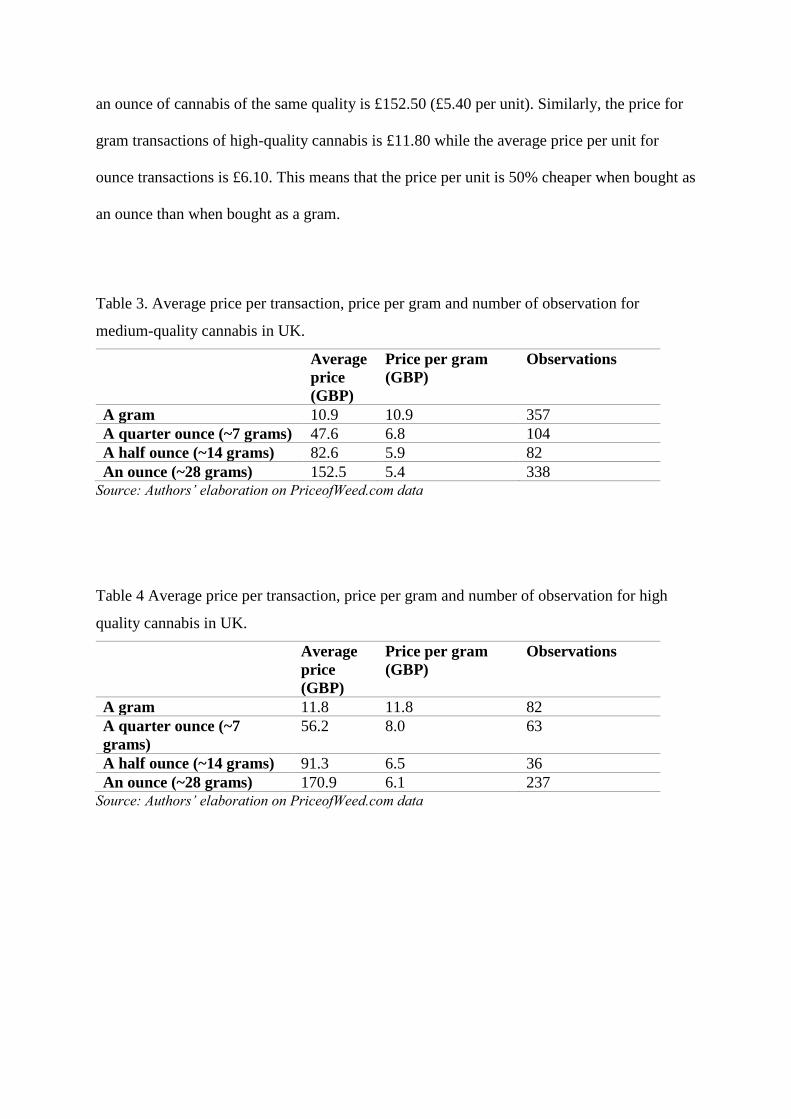
an ounce of cannabis of the same quality is £152.50 (£5.40 per unit). Similarly, the price for
gram transactions of high-quality cannabis is £11.80 while the average price per unit for
ounce transactions is £6.10. This means that the price per unit is 50% cheaper when bought as
an ounce than when bought as a gram.
Table 3. Average price per transaction, price per gram and number of observation for
medium-quality cannabis in UK.
Average price (GBP)
Price per gram (GBP)
Observations
A gram 10.9 10.9 357 A quarter ounce (~7 grams) 47.6 6.8 104 A half ounce (~14 grams) 82.6 5.9 82 An ounce (~28 grams) 152.5 5.4 338
Source: Authors’ elaboration on PriceofWeed.com data
Table 4 Average price per transaction, price per gram and number of observation for high
quality cannabis in UK.
Average price (GBP)
Price per gram (GBP)
Observations
A gram 11.8 11.8 82 A quarter ounce (~7 grams)
56.2 8.0 63
A half ounce (~14 grams) 91.3 6.5 36 An ounce (~28 grams) 170.9 6.1 237
Source: Authors’ elaboration on PriceofWeed.com data
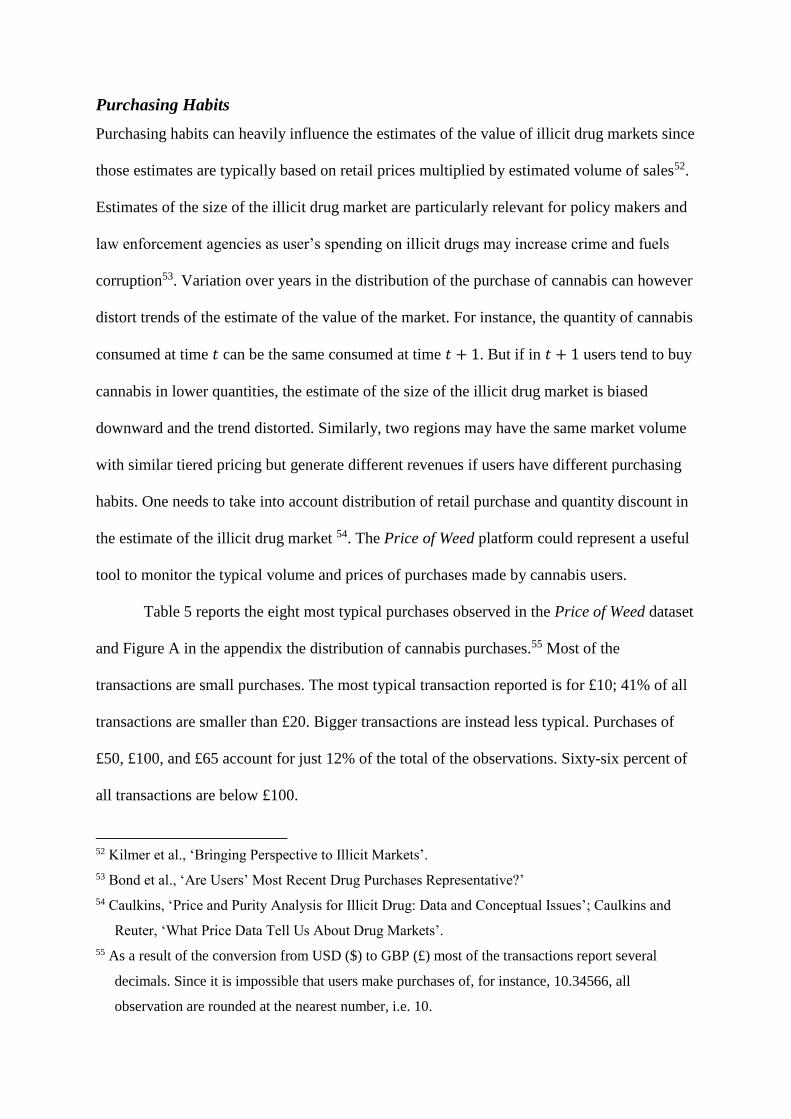
Purchasing Habits
Purchasing habits can heavily influence the estimates of the value of illicit drug markets since
those estimates are typically based on retail prices multiplied by estimated volume of sales52.
Estimates of the size of the illicit drug market are particularly relevant for policy makers and
law enforcement agencies as user’s spending on illicit drugs may increase crime and fuels
corruption53. Variation over years in the distribution of the purchase of cannabis can however
distort trends of the estimate of the value of the market. For instance, the quantity of cannabis
consumed at time � can be the same consumed at time � + 1. But if in � + 1 users tend to buy
cannabis in lower quantities, the estimate of the size of the illicit drug market is biased
downward and the trend distorted. Similarly, two regions may have the same market volume
with similar tiered pricing but generate different revenues if users have different purchasing
habits. One needs to take into account distribution of retail purchase and quantity discount in
the estimate of the illicit drug market 54. The Price of Weed platform could represent a useful
tool to monitor the typical volume and prices of purchases made by cannabis users.
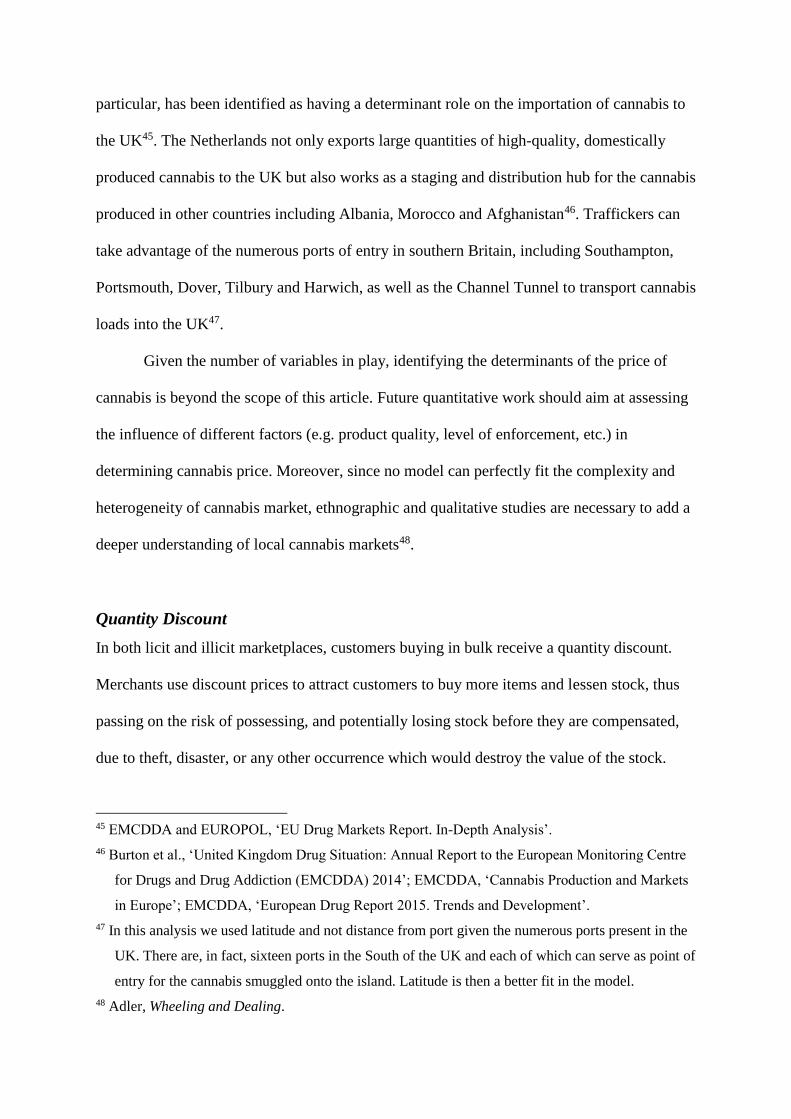
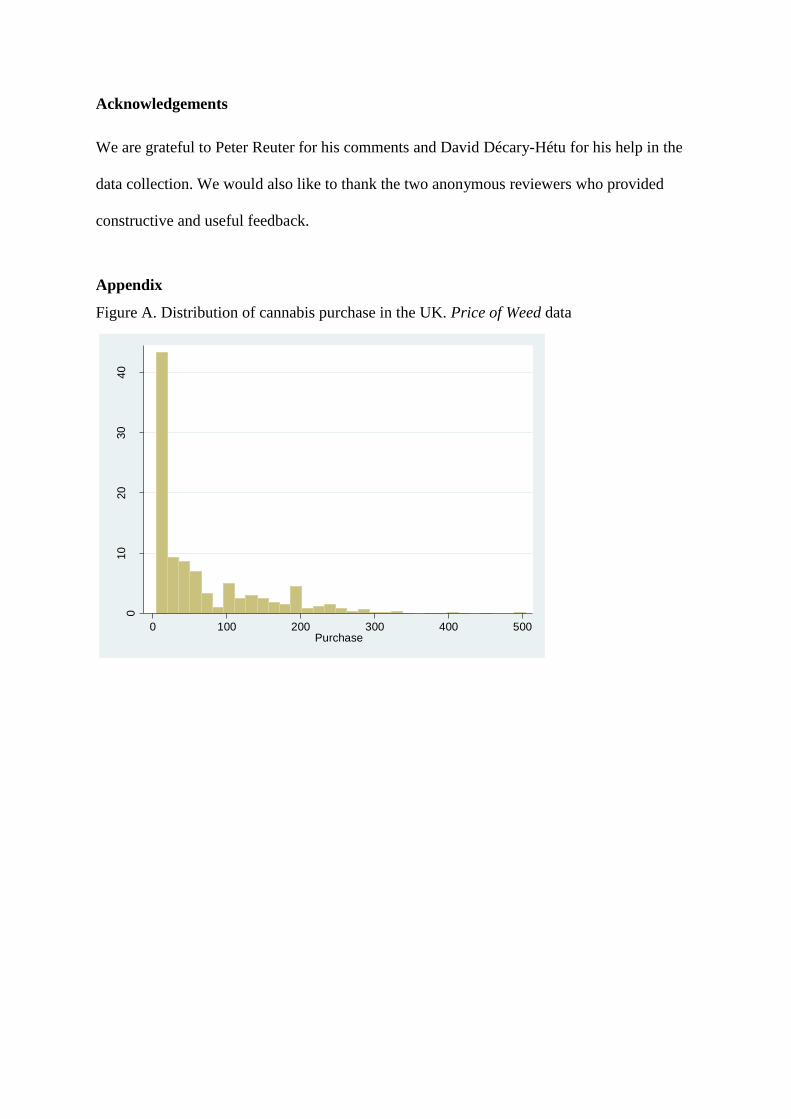
Table 5 reports the eight most typical purchases observed in the Price of Weed dataset
and Figure A in the appendix the distribution of cannabis purchases.55 Most of the
transactions are small purchases. The most typical transaction reported is for £10; 41% of all
transactions are smaller than £20. Bigger transactions are instead less typical. Purchases of
£50, £100, and £65 account for just 12% of the total of the observations. Sixty-six percent of
all transactions are below £100.
52 Kilmer et al., ‘Bringing Perspective to Illicit Markets’. 53 Bond et al., ‘Are Users’ Most Recent Drug Purchases Representative?’ 54 Caulkins, ‘Price and Purity Analysis for Illicit Drug: Data and Conceptual Issues’; Caulkins and
Reuter, ‘What Price Data Tell Us About Drug Markets’. 55 As a result of the conversion from USD ($) to GBP (£) most of the transactions report several
decimals. Since it is impossible that users make purchases of, for instance, 10.34566, all
observation are rounded at the nearest number, i.e. 10.
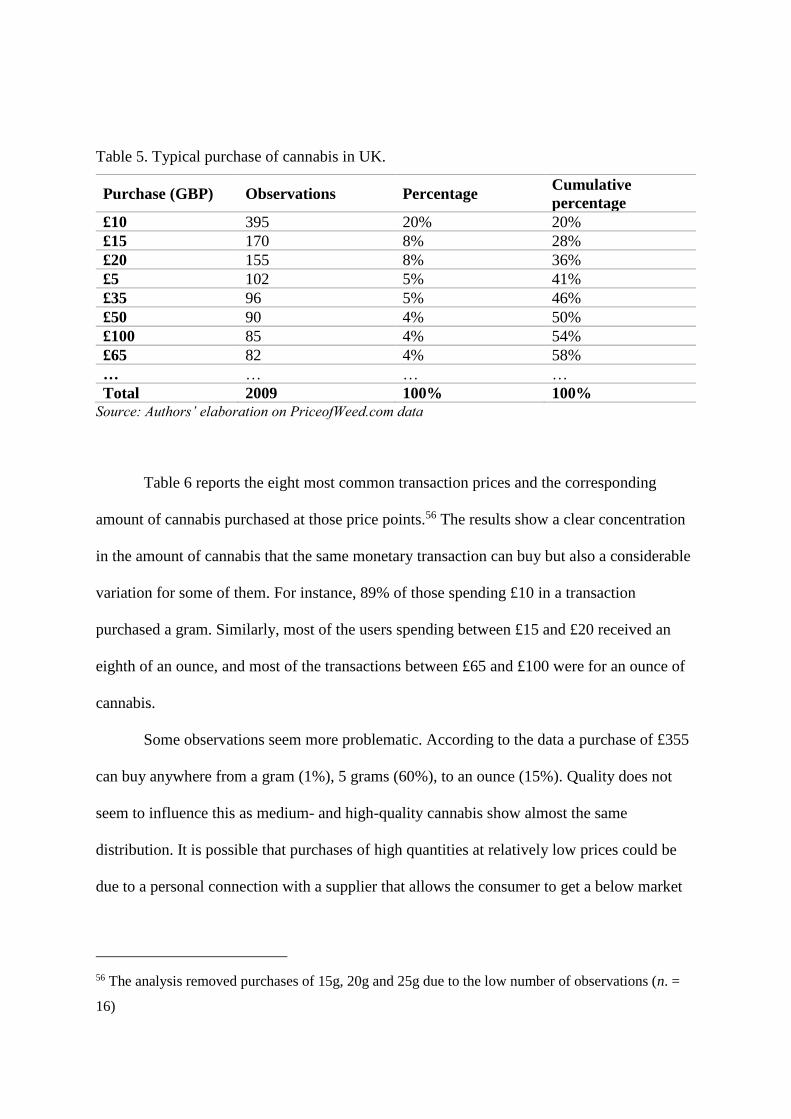
Table 5. Typical purchase of cannabis in UK.
Purchase (GBP) Observations Percentage Cumulative percentage
£10 395 20% 20% £15 170 8% 28% £20 155 8% 36% £5 102 5% 41% £35 96 5% 46% £50 90 4% 50% £100 85 4% 54% £65 82 4% 58% … … … … Total 2009 100% 100%
Source: Authors’ elaboration on PriceofWeed.com data
Table 6 reports the eight most common transaction prices and the corresponding
amount of cannabis purchased at those price points.56 The results show a clear concentration
in the amount of cannabis that the same monetary transaction can buy but also a considerable
variation for some of them. For instance, 89% of those spending £10 in a transaction
purchased a gram. Similarly, most of the users spending between £15 and £20 received an
eighth of an ounce, and most of the transactions between £65 and £100 were for an ounce of
cannabis.
Some observations seem more problematic. According to the data a purchase of £355
can buy anywhere from a gram (1%), 5 grams (60%), to an ounce (15%). Quality does not
seem to influence this as medium- and high-quality cannabis show almost the same
distribution. It is possible that purchases of high quantities at relatively low prices could be
due to a personal connection with a supplier that allows the consumer to get a below market
56 The analysis removed purchases of 15g, 20g and 25g due to the low number of observations (n. =
16)
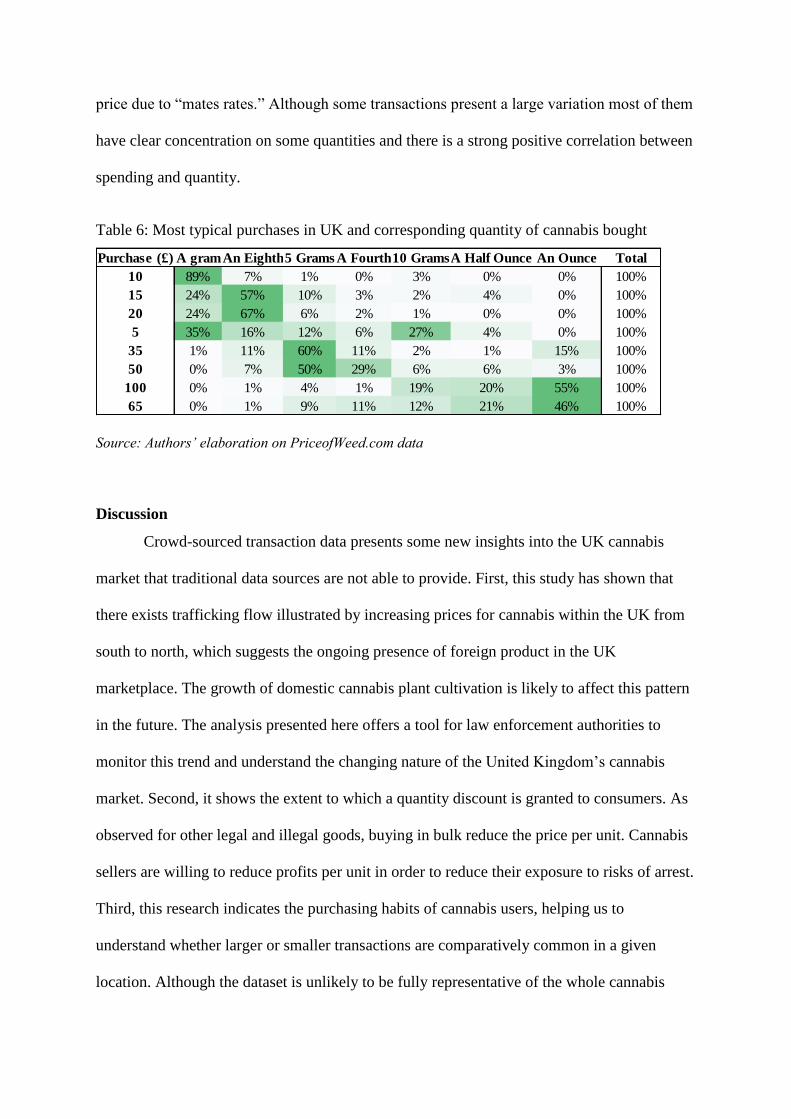
price due to “mates rates.” Although some transactions present a large variation most of them
have clear concentration on some quantities and there is a strong positive correlation between
spending and quantity.
Table 6: Most typical purchases in UK and corresponding quantity of cannabis bought
Source: Authors’ elaboration on PriceofWeed.com data
Discussion
Crowd-sourced transaction data presents some new insights into the UK cannabis
market that traditional data sources are not able to provide. First, this study has shown that
there exists trafficking flow illustrated by increasing prices for cannabis within the UK from
south to north, which suggests the ongoing presence of foreign product in the UK
marketplace. The growth of domestic cannabis plant cultivation is likely to affect this pattern
in the future. The analysis presented here offers a tool for law enforcement authorities to
monitor this trend and understand the changing nature of the United Kingdom’s cannabis
market. Second, it shows the extent to which a quantity discount is granted to consumers. As
observed for other legal and illegal goods, buying in bulk reduce the price per unit. Cannabis
sellers are willing to reduce profits per unit in order to reduce their exposure to risks of arrest.
Third, this research indicates the purchasing habits of cannabis users, helping us to
understand whether larger or smaller transactions are comparatively common in a given
location. Although the dataset is unlikely to be fully representative of the whole cannabis
Purchase (£) A gramAn Eighth5 Grams A Fourth10 GramsA Half Ounce An Ounce Total10 89% 7% 1% 0% 3% 0% 0% 100%15 24% 57% 10% 3% 2% 4% 0% 100%20 24% 67% 6% 2% 1% 0% 0% 100%5 35% 16% 12% 6% 27% 4% 0% 100%
35 1% 11% 60% 11% 2% 1% 15% 100%50 0% 7% 50% 29% 6% 6% 3% 100%
100 0% 1% 4% 1% 19% 20% 55% 100%65 0% 1% 9% 11% 12% 21% 46% 100%
market, the results suggest that most cannabis transactions are small in terms of price and
volume, with £10 buying a gram being the most typical transaction reported.
Crowdsourcing could be used not only to provide a static snapshot of an illicit market,
as it the case for the results presented here, but also used as a tool to monitor the market in
near real time. Data from crowdsourcing platforms such as the PriceofWeed.com could show
how buyers, sellers, and traffickers respond to law enforcement interventions or drug policy
changes by evaluating shifts in supply, demand, and price. For instance, traffickers can adapt
to interdiction programs by shifting to alternative routes. This form of displacement is often
referred to as the “balloon effect,” and suggests that stronger law enforcement actions in one
location will result in the displacement of drug trafficking activities to another location57.
Similarly, law enforcement actions or changes in drug policy (e.g. reclassification of some
substances, changes threshold limits to discern sales from personal use, etc.) can affect users’
and dealers’ behaviors and push them to sell or buy in bigger or smaller quantities. Given the
inability to understand these shifts with existing research products, crowdsourcing is a tool
that could supplement the limited data available to law enforcement agencies, public health
institutions, policy makers and NGOs on the effect of such interventions, though practitioners
should be cautious in using the Price of Weed data given its array of limitations.
There are, in fact, significant limitations in the use of the Price of Weed data. First,
this is not a random or representative sample. The transaction data are self-reported by
relatively unknown participants and not a random sample of the cannabis purchasing
population 58. To date, we know little about those who provide information and the data
collected might not be representative of the entire cannabis population. We have no
57 Friesendorf, ‘Squeezing the Balloon?’; Hawdon and Kleiman, Encyclopedia of Drug Policy;
Reuter, ‘The Mobility of Drug Trafficking’. 58 Ouellet et al., ‘The Price of Cannabis in Canada’.
demographic information or an indication of a user’s typical consumption. The anonymity
granted by the platform encourages users to submit genuine information but, simultaneously,
deprives researchers from any sociodemographic or economic information about those using
the platform. While it may be technically possible to ask for such information, an increase in
requesting potentially identifying information could deter users from participating.
Attempting to estimate likely users by analyzing users from other crowdsourcing platforms
would not be viable, since the use of these platforms depends on the platforms’ purpose and
the way in which they collect data (online, telephone, etc.)59.
However, we know from previous studies that social media platform usage rates vary
by sociodemographic and economic conditions. Male, younger people, and certain
occupational groups (e.g. managerial, administrative, and professional occupations) have
higher participation60. This can suggest that participants of the Price of Weed website are
likely to have relatively high income and being able to buy better products. Conversely,
incarcerated and homeless populations, who may have a higher rate of drug use, are likely to
be underrepresented in this sample61. Clearly, future research should try to better understand
the population of individuals participating on these sorts of platforms.
Second, there is no ability to protect against false or inaccurate submissions,
potentially input by anyone purposefully or erroneously (i.e. typos). Moreover, there is an
issue regarding the independence of the submissions. The same users can report multiple
submissions of transactions taking place at different times, however there is no way of
determining if this is the behavior observed. The inability for researchers to fully understand
the participating population makes it difficult to test for errors and weight for over or under
59 Behrend et al., ‘The Viability of Crowdsourcing for Survey Research’. 60 Sloan et al., ‘Who Tweets?’; Sloan et al., ‘Knowing the Tweeters’. 61 Ouellet et al., ‘The Price of Cannabis in Canada’; Giommoni, Reuter, and Kilmer, ‘Exploring the
Perils of Cross-National Comparisons of Drug Prevalence’.
representation. We triangulated the crowdsourced data with other traditional sources in order
to check its reliability. This comparison was hampered by lack of harmonization among the
different datasets. Nonetheless, we have demonstrated that the Price of Weed data do not
deviate from the ranges reported by these other sources
Third, cannabis is an experience good62 which means that buyers may have a limited
knowledge of the quality of the product before they consume it. Users may have a better
knowledge of the product after developing a history of consumption. Moreover, users may
view quality relevant to the best they have consumed, with personal baselines for comparison
varying widely. Accordingly, the self-reporting nature of the information on quality can be
inaccurate and subjective. For instance, what it is considered high-quality cannabis in
Edinburgh may be considered as low-quality cannabis in Brighton. Evrard, Legleye, and
Cadet-Taïrou63 asked drug users the perceived quality of cocaine that they were consuming
and then analyzed them in a laboratory. They discovered that “users were not good at
assessing the actual purity of the cocaine they had used”64. Similarly, Decorte65 concludes
that users have an incomplete knowledge of the quality of the substance they use even after
its consumption. This can help to explain the little difference in the price per unit for
medium- and high-quality cannabis according to the data gathered from the Price of Weed
website. Additional and more objective information on the concentration of
tetrahydrocannabinol (THC), the primary psychoactive cannabinoid in cannabis, and
cannabidiol (CBD), the other significant, although non-psychoactive cannabinoid present in
62 Caulkins, ‘Price and Purity Analysis for Illicit Drug: Data and Conceptual Issues’. 63 ‘Composition, Purity and Perceived Quality of Street Cocaine in France’. 64 Evrard, Legleye, and Cadet-Taïrou, 402. 65 ‘Quality Control by Cocaine Users’.
cannabis, is needed to make sure that we are comparing similar products66. Perhaps more
importantly, the last years have seen a proliferation of cannabis products, including marijuana
edibles, oils, and vaping products. Future data collection efforts should consider the
heterogeneity of cannabis-based products.
Conclusions
The analyses provide encouraging results in the use of crowdsourcing for researching
transactions and behaviors within illicit drug markets. Our work has shown that mining the
publicly available, crowdsourced data from Price of Weed can help researchers understand
patterns that are otherwise indiscernible from public reports. In countries like the UK, where
such research outputs are lacking, such strategies may present one of the few ways in which
researchers can proceed with such inquires. Moreover, this work illustrates that it may be
possible to develop crowdsourcing instruments that effectively gather information from some
traditionally hard-to-reach and/or deviant populations. Importantly, the information gathered
via the internet can be used to extrapolate data regarding the transactions involving higher-
level groups, such as wholesalers, that traditional methods often struggle to evaluate67.
The crowdsourcing platform used in this article is not ideal for researchers, rendering
several limitations on the data collected and the inferences made. Accordingly, practitioners
and social scientists can respond to their research needs by starting to develop their own
crowdsourcing platforms. An optimized platform could provide data also for other substances
including new psychoactive substances, synthetic drugs, cocaine, and similar products.
66 Martin-Santos et al., ‘Acute Effects of a Single, Oral Dose of D9-Tetrahydrocannabinol (THC) and
Cannabidiol (CBD) Administration in Healthy Volunteers’. 67 Gundur, ‘Using the Internet to Recruit Respondents for Offline Interviews in Criminological
Studies’.
Further considerations could include the need to educate users on the quality and type of the
product they are consuming, by providing cues such as photos to help identify products and
estimate amounts, descriptions of a product’s appearance and aroma, descriptions of the
effect after a drug’s consumption, or techniques on how to do simple chemical analysis for
substance purity. Such efforts are likely to provide a better matching between the reported
and actual quality of the product but cannot have the precision of forensic analysis.
Keeping the ongoing limitations of crowdsourcing in mind, it is a methodology that
should be used to complement and augment, rather than replace, conventional sources, such
as law enforcement and forensic data, in countries with a tradition of data collection and
analysis on illicit markets. Nonetheless, crowdsourcing could provide a starting point for
analysis in countries that do not have robust recording practices within criminal justice
agencies, acting as a substitute of traditional data sources. In such circumstances,
crowdsourcing may provide the drug-related data researchers require to study drug markets in
a way that otherwise would not be possible.
References
ACPO. ‘UK National Problem Profile. Commercial Cultivation of Cannabis 2012’. London: Association of Chief Police Officers (ACPO), 2012.
Adler, Patricia A. Wheeling and Dealing: An Ethnography of an Upper-Level Drug Dealing and Smuggling Community. 2nd Revised edition edition. New York: Columbia University Press, 1993.
Aebi, Marcelo F., and Antonia Linde. ‘The Epistemological Obstacles in Comparative Criminology: A Special Issue Introduction’. European Journal of Criminology 12, no. 4 (1 July 2015): 381–85. https://doi.org/10.1177/1477370815595311.
Aldridge, Judith, and David Décary-Hétu. ‘Not an “Ebay for Drugs”: The Cryptomarket “Silk Road” as a Paradigm Shifting Criminal Innovation’. SSRN Scholarly Paper. Rochester, NY: Social Science Research Network, 13 May 2014. http://papers.ssrn.com/abstract=2436643.
Behrend, Tara S., David J. Sharek, Adam W. Meade, and Eric N. Wiebe. ‘The Viability of Crowdsourcing for Survey Research’. Behavior Research Methods 43, no. 3 (1 September 2011): 800. https://doi.org/10.3758/s13428-011-0081-0.
Bond, Brittany, Jonathan P. Caulkins, Nick Scott, Beau Kilmer, and Paul Dietze. ‘Are Users’ Most Recent Drug Purchases Representative?’ Drug & Alcohol Dependence 142 (1 September 2014): 133–38. https://doi.org/10.1016/j.drugalcdep.2014.06.016.
Bowman-Bowen, Lisa C., and Scott Menard. ‘Survey Design Elements as Influences on Estimates of Self-Reported Illicit Substance Use and Other Illegal Activities’. Journal of Drug Issues 46, no. 3 (1 July 2016): 178–97. https://doi.org/10.1177/0022042616629513.
Bretteville-Jensen, Anne. ‘Drug Demand – Initiation, Continuation and Quitting’. De Economist 154, no. 4 (2006): 491–516.
Bryan, Mark, Emilia Del Bono, and Stephen Pudney. ‘Licensing and Regulation of the Cannabis Market in England and Wales: Towards a Cost-Benefit Analysis’. Institute for Social and Economic Research, University of Essex & The Beckley Foundation., 2013. https://www.iser.essex.ac.uk/research/publications/521860.
Burgdorf, James Richard, Beau Kilmer, and Rosalie Liccardo Pacula. ‘Heterogeneity in the Composition of Marijuana Seized in California’. Drug & Alcohol Dependence 117, no. 1 (1 August 2011): 59–61. https://doi.org/10.1016/j.drugalcdep.2010.11.031.
Burton, Robyn, Fay Thomson, Cristina Visintin, and Craig Wright. ‘United Kingdom Drug Situation: Annual Report to the European Monitoring Centre for Drugs and Drug Addiction (EMCDDA) 2014’. London: United Kingdom Focal Point at Public Health England, 2015.
Caulkins, Jonathan P. ‘Domestic Geographic Variation in Illicit Drug Prices’. Journal of Urban Economics 37, no. 1 (January 1995): 38–56.
———. ‘Price and Purity Analysis for Illicit Drug: Data and Conceptual Issues’. Drug and Alcohol Dependence 90, no. Supplement 1 (2007): S61–68.
———. ‘What Is the Average Price of an Illicit Drug?’ Addiction 89, no. 7 (1 July 1994): 815–19. https://doi.org/10.1111/j.1360-0443.1994.tb00984.x.
Caulkins, Jonathan P., and Brittany M. Bond. ‘Marijuana Price Gradients Implications for Exports and Export-Generated Tax Revenue for California after Legalization’. Journal of Drug Issues 42, no. 1 (2012): 28–45.
Caulkins, Jonathan P., and Rema Padman. ‘Quantity Discounts and Quality Premia for Illicit Drugs’. Journal of the American Statistical Association 88, no. 423 (1993): 748–57.
Caulkins, Jonathan P., and Peter H. Reuter. ‘How Drug Enforcement Affects Drug Prices’. Crime and Justice 39, no. 1 (2010): 213–271.
———. ‘What Price Data Tell Us About Drug Markets’. Journal of Drug Issues 28, no. 3 (1998): 593–613.
Chandra, Siddharth, and Matthew Barkell. ‘What the Price Data Tell Us about Heroin Flows across Europe’. International Journal of Comparative and Applied Criminal Justice 37, no. 1 (2013): 1–13. https://doi.org/10.1080/01924036.2012.708120.
Chandra, Siddharth, Matthew Barkell, and Kelly Steffen. ‘Inferring Cocaine Flows across Europe: Evidence from Price Data : Journal of Drug Policy Analysis’. Journal of Drug Policy Analysis 4, no. 1 (2011): 1–18.
Chandra, Siddharth, and Johnathan Joba. ‘Transnational Cocaine and Heroin Flow Networks in Western Europe: A Comparison’. International Journal of Drug Policy, 2015. https://doi.org/10.1016/j.drugpo.2015.04.016.
Chandra, Siddharth, Samuel Peters, and Nathaniel Zimmer. ‘How Powdered Cocaine Flows Across the United States Evidence From Open-Source Price Data’. Journal of Drug Issues, 2014, 0022042614522621. https://doi.org/10.1177/0022042614522621.
Clements, Kenneth W. ‘Pricing and Packaging: The Case of Marijuana’. Economics Discussion / Working Paper. The University of Western Australia, Department of Economics, 2004. http://econpapers.repec.org/paper/uwawpaper/04-03.htm.
Clements, Kenneth W, and Xueyan Zhao. ‘Economic Aspects of Marijuana’. Melbourne, 2005. http://www.is.uwa.edu.au/__data/assets/pdf_file/0009/99963/05_28_Clements.pdf.
Davis, Adam J., Karl R. Geisler, and Mark W. Nichols. ‘The Price Elasticity of Marijuana Demand: Evidence from Crowd-Sourced Transaction Data’. Empirical Economics 50, no. 4 (30 July 2015): 1171–92. https://doi.org/10.1007/s00181-015-0992-1.
Decker, Scott H., and Margaret Townsend Chapman. Drug Smugglers on Drug Smuggling: Lessons from the Inside. Temple University Press, 2008.
Decorte, Tom. ‘Quality Control by Cocaine Users: Underdeveloped Harm Reduction Strategies’. European Addiction Research 7, no. 4 (2001): 161–75. https://doi.org/10.1159/000050737.
Desimone, Jeff. ‘The Relationship Between Illegal Drug Prices at the Retail User and Seller Levels’. Contemporary Economic Policy 24, no. 1 (2006): 64–73.
EMCDDA. ‘Cannabis Production and Markets in Europe’. Lisbon, Portugal: European Monitoring Centre for Drugs and Drug Addiction, 2012. http://www.emcdda.europa.eu/publications/insights/cannabis-market.
———. ‘European Drug Report 2015. Trends and Development’. Lisbon: European Monitoring Centre for Drugs and Drug Addiction, 2015. http://www.emcdda.europa.eu/publications/edr/trends-developments/2015.
EMCDDA, and EUROPOL. ‘EU Drug Markets Report. In-Depth Analysis’. Luxembourg: European Monitoring Centre for Drugs and Drug Addiction and Europol, 2016. http://www.emcdda.europa.eu/system/files/publications/2373/TD0216072ENN.PDF.
Estellés-Arolas, Enrique, and Fernando González-Ladrón-de-Guevara. ‘Towards an Integrated Crowdsourcing Definition’. Journal of Information Science 38, no. 2 (1 April 2012): 189–200. https://doi.org/10.1177/0165551512437638.
Evrard, I., S. Legleye, and A. Cadet-Taïrou. ‘Composition, Purity and Perceived Quality of Street Cocaine in France’. International Journal of Drug Policy 21, no. 5 (2010): 399–406.
Farrell, Graham. ‘The Global Rate of Interception of Illicit Opiates and Cocaine 1980-1994.’, 1995. https://dspace.lboro.ac.uk/dspace-jspui/handle/2134/823.
Friesendorf, Cornelius. ‘Squeezing the Balloon?: United States Air Interdiction and the Restructuring of the South American Drug Industry in the 1990s’. Crime, Law and Social Change 44, no. 1 (2005): 35–78. https://doi.org/10.1007/s10611-006-9005-9.
Gantz, John, and David Reinsel. ‘The Digital Universe Decade – Are You Ready?’ IDC, sponsored by EMC Corporation, 2010. https://www.emc.com/collateral/analyst-reports/idc-digital-universe-are-you-ready.pdf.
Gerber, Matthew S. ‘Predicting Crime Using Twitter and Kernel Density Estimation’. Decision Support Systems 61 (May 2014): 115–25. https://doi.org/10.1016/j.dss.2014.02.003.
Giommoni, Luca, Alberto Aziani, and Giulia Berlusconi. ‘How Do Illicit Drugs Move Across Countries? A Network Analysis of the Heroin Supply to Europe’. Journal of Drug Issues 47, no. 2 (1 April 2017): 217–40. https://doi.org/10.1177/0022042616682426.
Giommoni, Luca, Peter Reuter, and Beau Kilmer. ‘Exploring the Perils of Cross-National Comparisons of Drug Prevalence: The Effect of Survey Modality’. Drug and Alcohol Dependence 181 (1 December 2017): 194–99. https://doi.org/10.1016/j.drugalcdep.2017.09.027.
Gundur, R. V. ‘Using the Internet to Recruit Respondents for Offline Interviews in Criminological Studies’. Urban Affairs Review, 7 December 2017, 1078087417740430. https://doi.org/10.1177/1078087417740430.
Gupta, Ravi, and Hugh Brooks. Using Social Media for Global Security. 1 edition. Indianapolis, IN: John Wiley & Sons, 2013.
Hawdon, James E., and Mark A. R. Kleiman. Encyclopedia of Drug Policy. Vol. 2. SAGE Publications, Inc., 2011.
Holt, Thomas J. ‘Identifying Gaps in the Research Literature on Illicit Markets On-Line’. Global Crime 18, no. 1 (2 January 2017): 1–10. https://doi.org/10.1080/17440572.2016.1235821.
Holt, Thomas J., and Kristie R. Blevins. ‘Examining Sex Work from the Client’s Perspective: Assessing Johns Using on-Line Data’. Deviant Behavior 28, no. 4 (11 May 2007): 333–54. https://doi.org/10.1080/01639620701233282.
Hughes, Caitlin Elizabeth, and Alex Stevens. ‘What Can We Learn From The Portuguese Decriminalization of Illicit Drugs?’ British Journal of Criminology 50, no. 6 (1 November 2010): 999–1022.
Kilmer, Beau, Jonathan P Caulkins, Rosalie Liccardo Pacula, and Peter H. Reuter. ‘Bringing Perspective to Illicit Markets: Estimating the Size of the U.S. Marijuana Market’. Drug and Alcohol Dependence 119, no. 1–2 (2011): 153–60.
Kilmer, Beau, Peter H. Reuter, and Luca Giommoni. ‘What Can Be Learned from Cross-National Comparisons of Data on Illegal Drugs?’ Crime and Justice 44, no. 1 (2015): 227–96.
Kruithof, Kristy, Judith Aldridge, David Décary Hétu, Megan Sim, Elma Dujso, and Stijn Hoorens. ‘Internet-Facilitated Drugs Trade. An Analysis of the Size, Scope and the Role of the Netherlands’. WODC, Ministerie van Veiligheid en Justitie, 2016. https://www.rand.org/pubs/research_reports/RR1607.html.
Kuziemko, Ilyana, and Steven D Levitt. ‘An Empirical Analysis of Imprisoning Drug Offenders’. Journal of Public Economics 88, no. 9–10 (2004): 2043–66.
Lahaie, Emmanuel, Eric Janssen, and Agnès Cadet-Taïrou. ‘Determinants of Heroin Retail Prices in Metropolitan France: Discounts, Purity and Local Markets’. Drug and Alcohol Review, 1 January 2015, n/a-n/a. https://doi.org/10.1111/dar.12355.
Lawson, Robert A., and Todd M. Nesbit. ‘Alchian and Allen Revisited: Law Enforcement and the Price of Weed’. Atlantic Economic Journal 41, no. 4 (1 December 2013): 363–70. https://doi.org/10.1007/s11293-013-9392-0.
MacCoun, Robert, and Peter H. Reuter. Drug War Heresis: Learning from Other, Vices, Times, & Places. New York: Cambridge University Press, 2001.
MacDonald, Z. ‘Illicit Drug Use in the UK: Evidence from the British Crime Survey’. British Journal of Criminology 39, no. 4 (1 September 1999): 585–608. https://doi.org/10.1093/bjc/39.4.585.
Martin-Santos, R., J. A. Crippa, A. Batalla, S. Bhattacharyya, Z. Atakan, S. Borgwardt, P. Allen, et al. ‘Acute Effects of a Single, Oral Dose of D9-Tetrahydrocannabinol (THC) and Cannabidiol (CBD) Administration in Healthy Volunteers’. Current Pharmaceutical Design 18, no. 32 (1 November 2012): 4966–79. https://doi.org/10.2174/138161212802884780.
Moeller, Kim. ‘Video-Recorded Retail Cannabis Trades in a Low-Risk Marketplace: Trade Value and Temporal Patterns’. Journal of Research in Crime and Delinquency 55, no. 1 (1 February 2018): 103–24. https://doi.org/10.1177/0022427817701256.
Moeller, Kim, Rasmus Munksgaard, and Jakob Demant. ‘Flow My FE the Vendor Said: Exploring Violent and Fraudulent Resource Exchanges on Cryptomarkets for Illicit Drugs’. American Behavioral Scientist 61, no. 11 (1 October 2017): 1427–50. https://doi.org/10.1177/0002764217734269.
Moore, Timothy J., Jonathan P. Caulkins, Alison Ritter, Paul Dietze, Shannon Monagle, and Jonathon Pruden. ‘Monograph No. 09: Heroin Markets in Australia: Current Understandings and Future Possibilities’. DPMP Monograph Series. Fitzory: Turning Point Alcohol and Drug Centre, 2005.
Mounteney, Jane, Paul Griffiths, Roumen Sedefov, Andre Noor, Julián Vicente, and Roland Simon. ‘The Drug Situation in Europe: An Overview of Data Available on Illicit Drugs and New Psychoactive Substances from European Monitoring in 2015’. Addiction 111, no. 1 (1 January 2016): 34–48. https://doi.org/10.1111/add.13056.
Murphy, Jennifer. ‘Drug Court as Both a Legal and Medical Authority’. Deviant Behavior 32, no. 3 (2 March 2011): 257–91. https://doi.org/10.1080/01639621003771979.
Office of the Parliamentary Budget Officer. ‘Legalized Cannabis: Fiscal Considerations’. Ottawa, Canada: Office of the Parliamentary Budget Officer, 2016. http://www.pbo-dpb.gc.ca/web/default/files/Documents/Reports/2016/Legalized%20Cannabis/Legalized%20Canabis%20Fiscal%20Considerations_EN.pdf.
Olmstead, Todd A., Sheila M. Alessi, Brendan Kline, Rosalie Liccardo Pacula, and Nancy M. Petry. ‘The Price Elasticity of Demand for Heroin: Matched Longitudinal and Experimental Evidence’. Journal of Health Economics 41 (May 2015): 59–71. https://doi.org/10.1016/j.jhealeco.2015.01.008.
Ouellet, Marie, Mitch Macdonald, Martin Bouchard, Carlo Morselli, and Richard Frank. ‘The Price of Cannabis in Canada’. Public Safety Canada, 2017. https://www.publicsafety.gc.ca/cnt/rsrcs/pblctns/2017-r005/2017-r005-en.pdf.
Piza, Eric L., and Victoria A. Sytsma. ‘Exploring the Defensive Actions of Drug Sellers in Open-Air Markets: A Systematic Social Observation’. Journal of Research in Crime and Delinquency 53, no. 1 (1 February 2016): 36–65. https://doi.org/10.1177/0022427815592451.
Potter, Garfield. ‘The Growth of Cannabis Cultivation: Explanations for Import Substitution in the UK’. In Cannabis in Europe: Dynamics in Perception, Policy and Markets, by Dirk J. Korf. Lengerich: Pabst, Wolfgang Science, 2008.
Potter, Gary R. Weed, Need and Greed: A Study of Domestic Cannabis Cultivation. London: Free Association Books, 2010.
Potter, Gary R., Monica J. Barratt, Aili Malm, Martin Bouchard, Thomas Blok, Anne-Sofie Christensen, Tom Decorte, et al. ‘Global Patterns of Domestic Cannabis Cultivation: Sample Characteristics and Patterns of Growing across Eleven Countries’. International Journal of Drug Policy, Domestic Cannabis Cultivation, 26, no. 3 (1 March 2015): 226–37. https://doi.org/10.1016/j.drugpo.2014.12.007.
RAND Corporation. ‘What America’s Users Spend on Illegal Drugs’. Santa Monica, CA: Office of National Drug Control Policy Office of Research and Data Analysis, 2014. https://www.whitehouse.gov/ondcp/research-and-data/estimation-drug-expenditures-consumption-supply.
Reuter, Peter H. ‘The Mobility of Drug Trafficking’. In Ending the Drug Wars. Report of the LSE Expert Group on the Economics of Drug Policy, edited by LSE. London: The London School of Economics and Political Science, 2014.
Reuter, Peter H., and Mark A. R. Kleiman. ‘Risks and Prices: An Economic Analysis of Drug Enforcement’. Crime and Justice 7 (Gennaio 1986): 289–340.
Ritter, Alison. ‘Studying Illicit Drug Markets: Disciplinary Contributions’. International Journal of Drug Policy 17, no. 6 (2006): 453–463.
Saffer, Henry, and Frank J. Chaloupka. ‘The Demand for Illicit Drugs’. New York: National Bureau of Economic Research, 1995. http://papers.ssrn.com/sol3/papers.cfm?abstract_id=225302.
Scott, Nick, Jonathan P Caulkins, Alison Ritter, Catherine Quinn, and Paul Dietze. ‘High-Frequency Drug Purity and Price Series as Tools for Explaining Drug Trends and Harms in Victoria, Australia’. Addiction 110, no. 1 (1 January 2015): 120–28. https://doi.org/10.1111/add.12740.
Sifaneck, Stephen J., Geoffrey L. Ream, Bruce D. Johnson, and Eloise Dunlap. ‘Retail Marijuana Purchases in Designer and Commercial Markets in New York City: Sales Units, Weights, and Prices per Gram’. Drug and Alcohol Dependence 90, no. Suppl 1 (September 2007): S40–51. https://doi.org/10.1016/j.drugalcdep.2006.09.013.
Sloan, Luke, Jeffrey Morgan, Pete Burnap, and Matthew Williams. ‘Who Tweets? Deriving the Demographic Characteristics of Age, Occupation and Social Class from Twitter User Meta-Data’. PLOS ONE 10, no. 3 (2 March 2015): e0115545. https://doi.org/10.1371/journal.pone.0115545.
Sloan, Luke, Jeffrey Morgan, William Housley, Matthew Williams, Adam Edwards, Pete Burnap, and Omer Rana. ‘Knowing the Tweeters: Deriving Sociologically Relevant Demographics from Twitter’. Sociological Research Online 18, no. 3 (2013): 7.
Stevens, Alex. Drugs, Crime and Public Health: The Political Economy of Drug Policy. Routledge-Cavendish, 2011.
Thies, Clifford F. ‘The Relationship Between Enforcement and the Price of Marijuana’. Journal of Private Enterprise 28, no. 1 (2012): 79–90.
Tonry, M. ‘Is Cross-National and Comparative Research on the Criminal Justice System Useful?’ European Journal of Criminology 12, no. 4 (1 July 2015): 505–16. https://doi.org/10.1177/1477370815581699.
Unick, George, Daniel Rosenblum, Sarah Mars, and Daniel Ciccarone. ‘The Relationship between US Heroin Market Dynamics and Heroin-Related Overdose, 1992–2008’. Addiction 109, no. 11 (1 November 2014): 1889–98. https://doi.org/10.1111/add.12664.
Wilkins, Chris, James L Reilly, and Sally Casswell. ‘Cannabis “tinny” Houses in New Zealand: Implications for the Use and Sale of Cannabis and Other Illicit Drugs in New Zealand’. Addiction 100, no. 7 (2005): 971–80.
Williams, Matthew L., Pete Burnap, and Luke Sloan. ‘Crime Sensing with Big Data: The Affordances and Limitations of Using Open Source Communications to Estimate Crime Patterns’. British Journal of Criminology, 31 March 2016, azw031. https://doi.org/10.1093/bjc/azw031.
Acknowledgements
We are grateful to Peter Reuter for his comments and David Décary-Hétu for his help in the
data collection. We would also like to thank the two anonymous reviewers who provided
constructive and useful feedback.
Appendix
Figure A. Distribution of cannabis purchase in the UK. Price of Weed data
010
2030
40
0 100 200 300 400 500Purchase