Embed Size (px)
Citation preview

This manuscript is a preprint. This manuscript has been submitted to Journal of the Geological
Society, having previously been peer-reviewed. Subsequent versions of this manuscript may have
different content. If accepted, the final version of this manuscript will be available via the ‘Peer-
reviewed Publication DOI’ link via this webpage. Please feel free to contact any of the authors
directly or to comment on the manuscript. We welcome feedback!

1
Are magnetic stripes on the Cuvier Abyssal Plain (offshore NW Australia) 1
diagnostic of oceanic crust? 2
3
Running title: Origin of the Cuvier Abyssal Plain 4
5
Matthew T. Reeve1, Craig Magee1,2*, Ian D. Bastow1, Carl McDermott1, Christopher A.-L. 6
Jackson1, Rebecca E. Bell1, Julie Prytulak3 7
8
1Basins Research Group (BRG), Department of Earth Science and Engineering, Royal School 9
of Mines, Prince Consort Road, Imperial College London, SW7 2BP, England, UK. 10
2School of Earth and Environment, University of Leeds, Leeds, LS2 9JT, UK. 11
3Department of Earth Sciences, University of Durham, DH1 3LE, UK 12
13
*Correspondence ([email protected]) 14
15
Abstract 16
Magnetic stripes have long been used to define the presence and age of oceanic crust. 17
However, continental crust heavily intruded by magma can record magnetic reversals akin to 18
those observed in oceanic crust. We re-evaluate the nature of the Cuvier Abyssal Plain 19
(CAP), offshore NW Australia, which hosts magnetic stripes and has previously been defined 20
as oceanic crust. We use magnetic, 2D seismic reflection, and geochemical data to test 21
whether the CAP structure and composition is consistent with unambiguous oceanic crust. 22
We show chemical data from a basalt within the CAP, previously described as displaying an 23
enriched MORB-like signature, actually contains evidence of contamination by continental 24
material. We also recognise seaward-dipping reflector (SDR) sequences across the CAP. 25
2
Borehole data from overlying sedimentary rocks suggests these SDRs were emplaced in a 26
shallow-water (<200 m depths) or sub-aerial environment. Our results indicate the CAP may 27
not be unambiguous oceanic crust. Instead, we suggest the CAP could comprise a spectrum 28
of heavily intruded continental crust (akin to present-day Ethiopia) through to fully oceanic 29
crust, recording the evolution from continental rifting to progressively magma-dominated, 30
sub-aerial to shallow-water extension. Our work supports suggestions that magnetic reversals 31
may not be truly diagnostic of oceanic crust. 32
33
Supplementary material: Enlarged and uninterpreted versions of the magnetic data and 34
seismic reflection lines are available at. 35
36
Development of magnetic reversal anomalies (stripes) during oceanic crust formation is 37
fundamental to modern plate tectonic theory (e.g., Vine & Matthews 1963). Where magnetic 38
stripes occur adjacent to passive continental margins, they are commonly interpreted to mark 39
a basin’s oldest, unambiguous oceanic crust. Such stripes have also historically been used to 40
define the continent-ocean boundary (e.g., Talwani & Eldholm 1973; Rabinowitz & 41
LaBrecque 1979; Veevers 1986; Eagles et al. 2015): here we define unambiguous oceanic 42
crust as comprising layers of pillow basalts, sheeted dikes, and gabbro formed during deep-43
marine (≳2 km water depths) seafloor spreading (e.g., McDermott et al. 2018). However, 44
continental break-up can produce broad, complex zones that have structural and geochemical 45
traits lying somewhere between unambiguous continental crust and unambiguous oceanic 46
crust (e.g., Skogseid et al. 1992; Symonds et al. 1998; Planke et al. 2000; Skogseid et al. 47
2000; Direen et al. 2007; Bastow & Keir 2011). The crustal affinity of such break-up zones is 48
accordingly difficult to distinguish (e.g., Eagles et al. 2015). Where these so-called continent-49
ocean transition zones (COTZs) occur, as opposed to an abrupt continent-ocean boundary, 50
3
magnetic stripes within the adjacent unambiguous oceanic crust are expected to mark the 51
outer limit of the COTZ (e.g., Pickup et al. 1996; Direen et al. 2007; Eagles et al. 2015; Paton 52
et al. 2017; Peron-Pinvidic et al. 2019). Using magnetic stripes to recognise and accurately 53
map the extent and age of oceanic crust has proved critical to palinspastic and plate kinematic 54
reconstructions (e.g., Heine & Müller 2005; Eagles et al. 2015; Causer et al. 2020). Yet linear 55
magnetic stripes akin to those hosted by unambiguous oceanic crust have recently been 56
identified along: (i) the onshore Afar Rift, Ethiopia in heavily intruded continental crust 57
(Bridges et al. 2012), an area expected to eventually become a COTZ assuming full seafloor 58
spreading develops; (ii) magma-poor passive margin COTZs offshore Iberia and 59
Newfoundland, where magnetic anomalies are recorded by magmatic intrusion into exhumed 60
and serpentinised mantle prior to break-up (Bronner et al. 2011); (iii) part of the magma-rich 61
passive margin COTZ offshore NW Australia (i.e. the Gascoyne margin; Direen et al. 2008); 62
and (iv) offshore South America where the margin comprises ‘magmatic crust’ wholly 63
comprised of new igneous material, which differs from normal oceanic crust in that it formed 64
via sub-aerial and/or shallow-water extension, not deep-marine spreading (Collier et al. 2017; 65
McDermott et al. 2018). These observations suggest magnetic stripes could develop within 66
non-oceanic crust, which questions whether they can be confidently used to diagnose seafloor 67
spreading, detect continent-ocean boundaries, and be used as hard constraints on palinspastic 68
and plate kinematic reconstructions (Rooney et al. 2014). 69
Given recent studies have shown magnetic stripes may not be diagnostic of 70
unambiguous oceanic crust formed during deep-marine seafloor spreading (e.g., Direen et al. 71
2008; Bridges et al. 2012; Collier et al. 2017; McDermott et al. 2018), it is worth re-72
evaluating the nature of previously defined oceanic crust adjacent to passive margins. Here, 73
we test the origin of the Cuvier Abyssal Plain (CAP), offshore NW Australia through an 74
integrated analysis of 2D seismic reflection data from the CAP, coupled with a re-75
4
examination of published chemical data (Fig. 1). The CAP hosts well-developed magnetic 76
anomalies distributed about an inferred spreading centre along the Sonne Ridge (Fig. 1B) 77
(e.g., Robb et al. 2005). These anomalies, coupled with observations from seismic refraction 78
data, have previously been used to suggest that the CAP comprises unambiguous oceanic 79
crust (Fig. 1) (e.g., Falvey & Veevers 1974; Larson et al. 1979; Robb et al. 2005; MacLeod et 80
al. 2017). Basalts dredged from the Sonne Ridge have been interpreted to reflect an enriched 81
MORB-like chemistry, supporting the inference that the CAP crust is oceanic (Crawford & 82
von Rad 1994; Dadd et al. 2015). The CAP has thus previously been defined as oceanic crust 83
in all regional and global palinspastic and palaeogeographic reconstructions involving NW 84
Australia (e.g., Heine & Müller, 2005; Gibbons et al., 2012). 85
Within our seismic reflection data we recognise multiple packages of up to ~3 km 86
thick seaward-dipping reflector (SDR) sequences, which cumulatively extend at least ~300 87
km oceanwards from the continental shelf. These SDR packages are likely dominated by 88
lavas and occasionally span several well-defined, broadly linear magnetic anomalies. 89
Lithological and biostratigraphic data from the Deep Sea Drilling Project (DSDP) Site 263 90
borehole indicate sedimentary strata above these SDRs were deposited in neritic 91
environments (<200 m water depths), implying lava emplacement was sub-aerial or shallow-92
water. Our reinterpretation of chemical data also indicates basalts from the Sonne Ridge 93
contain a continental signature (e.g., Robb et al. 2005; MacLeod et al. 2017). We suggest that 94
the CAP may not be unambiguous oceanic crust and could instead comprise a spectrum of 95
crustal types, ranging from heavily intruded continental crust to fully magmatic crust 96
generated during sub-aerial or shallow-water extension. We consider the CAP may define a 97
COTZ with an outer-limit >500 km oceanwards from the previously defined passive margin 98
boundary. Our interpretation has important implications for palinspastic and plate kinematic 99
reconstructions involving the NW Australian margin, as well as for heat flow and basin 100

5
modelling studies. More generally, or study supports the arising hypothesis that magnetic 101
stripes may not be a unique feature of oceanic crust. 102
103
Continent-Ocean Transition Zones 104
Where we can study active, magma-rich continental break-up onshore in Ethiopia, the 105
processes driving development of a possible future COTZ during the latter stage of rifting 106
(i.e. prior to rupture) involve the localisation of extension into narrow (~20 km wide) zones 107
that progressively become dominated by dyke intrusion (e.g., Ebinger & Casey 2001; 108
Keranen et al. 2004; Mackenzie et al. 2005; Maguire et al. 2006; Daniels et al. 2014). In these 109
sub-aerial and so-called ‘magmatic segments’, ≳50% of the crust may comprise new, 110
intruded mafic material (Daniels et al., 2014). Along volcanic or magma-rich passive 111
margins, COTZs commonly contain seismically isotropic, fast (>7 km s-1) crust, overlain by 112
SDR sequences of mafic volcanic products (e.g. lava flows) interbedded with sedimentary 113
rocks emplaced within sub-aerial or shallow-water environments (e.g., Eldholm et al. 1989; 114
Larsen & Saunders 1998; Symonds et al. 1998; Menzies et al. 2002). The COTZ crust 115
underlying these SDR-bearing domains comprises a spectrum of stretched and heavily 116
intruded continental crust (e.g., Eldholm et al. 1989) to ‘magmatic crust’ (also termed 117
‘igneous’ crust), which record processes similar to those active within Ethiopian magmatic 118
segments (e.g., Collier et al. 2017; Paton et al. 2017; McDermott et al. 2018). Magmatic crust 119
is structurally similar to oceanic crust but instead formed during sub-aerial or shallow-water 120
extension along a magmatic segment, rather than deep-marine spreading at a mid-ocean ridge 121
(e.g., Collier et al. 2017; Paton et al. 2017; McDermott et al. 2018); i.e. although the 122
formation of magmatic crust requires the prior break-up of continental crust, we note that this 123
event may not coincide with full continental lithospheric rupture, which necessarily involves 124
the mantle lithosphere. 125
6
Observations from rifted margins and active rifts suggest that COTZs at magma-rich 126
passive margins are marked by a compositional and structural spectrum, bounded by 127
unambiguous continental and oceanic crust end-members (Fig. 2). From the landward limit of 128
COTZs, we expect the proportion of magma intruded into continental crust to increase 129
oceanwards (Fig. 2). As dyking localises, eventually no continental crust will remain (i.e. 130
break-up of continental crust), and the COTZ will solely comprise igneous intrusions and 131
extrusions emplaced along magmatic segments during sub-aerial or shallow-water extension 132
(i.e. magmatic crust; Fig. 2) (e.g., Paton et al. 2017; McDermott et al. 2018). Because of 133
uncertainties in data resolution and interpretation mean, it is often difficult to constrain the 134
progression from intrusion of continental crust to the onset of magmatic crust emplacement. 135
We therefore combine these domains and refer to them both simply as a COTZ (Fig. 2). 136
Diminishment of the buoyant support maintaining these dense, sub-aerial or shallow-water 137
magmatic segments will promote their subsidence (e.g., Corti et al. 2015; McDermott et al. 138
2018). As these magmatic segments subside to water depths of ≳2 km, plate-spreading drives 139
the generation of unambiguous oceanic crust, comprising layers of pillow basalts, sheeted 140
dykes, gabbro, and oceanic mantle lithosphere (e.g., McDermott et al. 2018); i.e. full 141
continental lithospheric rupture has occurred by this point. Across COTZs and into 142
unambiguous oceanic crust, we may therefore expect an oceanwards reduction in the 143
continental signature of magma chemistry as they become more MORB-like (Fig. 2). 144
145
Geological Setting 146
Crustal Structure and Age 147
The North Carnarvon Basin and South Carnarvon Basin form part of the NW Australian 148
magma-rich passive margin, bound by the Argo Abyssal Plain to the north, and the Gascoyne 149
Abyssal Plain and Cuvier Abyssal Plain (CAP) to the west (Fig. 1A) (Longley et al. 2002; 150
7
Stagg et al. 2004). Basin formation occurred during multiple phases of Permian-to-Late 151
Jurassic rifting, culminating in Early Cretaceous break-up of the Gascoyne and Cuvier 152
margin rift segments (Fig. 3A) (Longley et al. 2002). We sub-divide the study area into the 153
~400 km wide Gascoyne and 180 km-wide Cuvier margin sectors, separated by the NW-154
trending Cape Range Fracture Zone (Fig. 1A). The CAP is bound to the SW by the Wallaby 155
Plateau and Wallaby Saddle (Fig. 1A). 156
157
Previously interpreted continent-ocean transition zones (COTZs) 158
A 200–250 km wide COTZ lies northwest of the continental Exmouth Plateau (i.e. the Gallah 159
Province; Fig. 1A). This COTZ comprises 2–5.5 km thick SDRs and high-velocity lower 160
crust (Direen et al. 2008). The Gallah Province COTZ preserves magnetic stripes formed 161
during chrons M10N–M5n (~136–131 Ma; Valanginian-to-Hauterivian), with interpreted 162
oceanic crust (Gascoyne Abyssal Plain) emplaced onwards from chron M3r (~130 Ma, 163
Hauterivian; Figs 1B and 3A) (Direen et al. 2008). Along the Cuvier Margin, beneath the 164
modern continental slope, seismically imaged SDR sequences are interpreted to mark a 50–165
70 km wide COTZ (e.g., Figs 1A and C) (Hopper et al. 1992; Symonds et al. 1998). 166
167
Cuvier Abyssal Plain 168
Adjacent to the Cuvier Margin, the CAP lies ~5 km below sea level and comprises a ~1–3.3 169
km thick sedimentary sequence overlying ~6–10.5 km thick crystalline crust (e.g., Fig. 1C) 170
(Hopper et al., 1992). Based on recognition of magnetic chrons M10N–M5 within the CAP, it 171
has been interpreted as oceanic crust emplaced initially at ~136 Ma (i.e. Valanginian; Figs 1B 172
and 3A) (Falvey & Veevers 1974; Larson et al. 1979). The presence of chrons M10N–M5 173
within the Gallah Province COTZ (Direen et al. 2008) and the inference that seafloor 174
spreading began in the CAP at ~136 Ma, suggest that continental rupture and seafloor 175
8
spreading adjacent to the Cuvier Margin occurred ~5–6 Myr before the Gascoyne Margin 176
(Fig. 3A) (Falvey & Veevers 1974; Larson et al. 1979). Critically, the occurrence of magnetic 177
stripes in the non-oceanic (i.e. COTZ) crust of the Gallah Province questions whether the 178
presence magnetic stripes in the CAP should be used to classify it as oceanic crust (e.g., 179
Direen et al. 2008; Bridges et al. 2012; Collier et al. 2017; McDermott et al. 2018). 180
181
Origin of the Sonne and Sonja ridges 182
Under the assumption that the CAP comprises oceanic crust, the ~175 km long Sonne Ridge 183
and ~100 km long Sonja Ridge, which extend into the Wallaby Plateau (Fig. 1A), have been 184
interpreted as probable extinct oceanic spreading ridges (e.g., Mihut & Müller 1998; Robb et 185
al. 2005; MacLeod et al. 2017); in this model, spreading is interpreted to have jumped from 186
the Sonne Ridge to the Sonja Ridge at ~131.7 Ma (Hauterivian). Geochemical analyses of a 187
basalt dredged from the Sonne Ridge along its extension into the Wallaby Plateau, suggest it 188
has a slightly enriched MORB-like signature, supporting the inference that the Sonne Ridge 189
is an oceanic spreading centre (Dadd et al. 2015). An alternative interpretation forwarded for 190
the Sonne Ridge is that it represents a ‘pseudofault’ (i.e. an apparent offset in magnetic 191
stripes formed by ridge jumps; Hey 1977); this interpretation is based on changes in gravity 192
intensity across the structure and the possible termination of the Cape Range Fracture Zone 193
directly north of the ridge (Gibbons et al. 2012). In their model, Gibbons et al. (2012) define 194
a different oceanic spreading centre ~100 km to the SE and parallel to the Sonne Ridge (red 195
dashed line in Figs 1A and B). However, we note that Gibbons et al. (2012) use the COB of 196
Heine & Müller (2005) to define the termination of the Cape Range Fracture Zone. This COB 197
interpretation does not consider the Gallah Province is a COTZ and, hence, does not include 198
the required north-westward extension of the fracture zone beyond the seaward limit of the 199
Exmouth Plateau (Heine & Müller 2005; Robb et al. 2005; Direen et al. 2008). Overall, given 200
9
the repetition of magnetic stripe sequences either side of the Sonne Ridge, and to a lesser 201
extent the Sonja Ridge, we favour their interpretation as spreading ridges and thus use the 202
interpreted magnetic chron configuration of Robb et al. (2005). This magnetic chron 203
configuration is centred on the Sonne Ridge and predicts half-spreading rates adjacent to both 204
Gascoyne and Cuvier margins were similar during chrons M10–M5 (~4.5 cm/yr), decreasing 205
to ~3 cm/yr by chron M3 (Robb et al. 2005). 206
207
The Wallaby Plateau and Wallaby Saddle 208
The Wallaby Plateau is a large bathymetric high (Fig. 1A), containing up to ~7.5 km thick 209
sequences of volcanic and sedimentary rocks, which are typically expressed in seismic 210
reflection data as packages of diverging and dipping reflections that appear similar to SDRs 211
(e.g., Colwell et al. 1994; Daniell et al. 2009; Stilwell et al. 2012; Olierook et al. 2015). 212
Interpretation of seismic reflection and magnetic data, coupled with chemical, 213
geochronological, and biostratigraphic analyses of dredge samples, suggests the Wallaby 214
Plateau probably comprises ~124 Myr old, continental flood basalts and interbedded 215
sedimentary strata emplaced on a fragment of extended continental crust (see Olierook et al. 216
2015 and references therein). Between the Wallaby Plateau and the Australian continent is 217
the Wallaby Saddle, a bathymetric low containing SDRs but no magnetic stripes, interpreted 218
by Symonds et al. (1998) to comprise ‘transitional’ crust (Figs 1A and B). The Wallaby 219
Plateau and Wallaby Saddle seemingly preserve a range of crustal types typical of a COTZ, 220
but not unambiguous continental crust or unambiguous oceanic crust. Similarities between 221
their structure and that of the CAP may therefore imply the latter is not truly oceanic crust. 222
223
Sedimentary Cover on the Cuvier Abyssal Plain 224
10
The top of the crystalline basement within the CAP corresponds to a high-amplitude 225
reflection in seismic data, which is overlain by a ~1–3.3 km thick, sedimentary succession 226
broadly comprising sub-horizontal reflections (e.g., Fig. 1C) (e.g., Veevers & Johnstone 227
1974; Hopper et al. 1992). Biostratigraphic and lithological data for the sedimentary cover 228
are available from the DSDP Site 263 borehole, which was drilled in 1972 and terminates 229
~100–200 m above the basement (Figs 1A and 3B) (e.g., Bolli 1974; Scheibnerová 1974; 230
Wiseman & Williams 1974; Holbourn & Kaminski 1995). From a depth of 200 m below 231
seabed to the base of the borehole (746 m), the sedimentary strata intersected at DSDP Site 232
263 comprise black claystones; between depths of ~475–746 m these claystones are silty and 233
contain abundant kaolinite (Fig. 3B) (Robinson et al. 1974; Compton et al. 1992). Within the 234
lowermost ~20 m of the drilled sequence, and in thin units at around ~500 m depth, the 235
siltstones occur that are poorly sorted, and contain angular quartz grains (Fig. 3B) (Robinson 236
et al. 1974). Analyses of benthic foraminifera from DSDP Site 263 suggest the black, 237
kaolinitic claystones spanning ~475–746 m are likely Hauterivian-to-Middle Barremian, 238
passing upwards into Albian-to-Aptian black claystones (Fig. 3B) (Holbourn & Kaminski 239
1995); these age ranges are supported by dinoflagellate distributions and carbon isotope 240
stratigraphy (Wiseman & Williams 1974; Oosting et al. 2006). A gradual upwards transition 241
from coarsely to finely agglutinated foraminifera species, coupled with an upwards increase 242
in the scarcity of shallow-water taxa (e.g., Hyperamina spp.) and a corresponding decrease in 243
grain size, suggests that the Hauterivian-to-Middle Barremian strata record deepening neritic 244
(i.e. <200 m water depth) conditions (e.g., Fig. 3B) (Robinson et al. 1974; Veevers & 245
Johnstone 1974; Holbourn & Kaminski 1995; Oosting et al. 2006). Sedimentary rocks 246
recovered from the Pendock-1 borehole, which is located on the current continental shelf, are 247
sedimentologically similar and of comparable age to those penetrated in DSDP 263 (Veevers 248
& Johnstone 1974; Holbourn & Kaminski 1995). These similarities to Pendock-1 suggest that 249
11
the Hauterivian-to-Middle Barremian strata sampled by DSDP Site 263 can broadly be 250
correlated to the Winning Group of the North and South Carnarvon basins (Figs 1A and 3) 251
(Veevers & Johnstone 1974; Holbourn & Kaminski 1995). 252
253
Dataset and methodology 254
Seismic reflection data 255
To assess the crustal structure of the CAP and surrounding areas, we interpret seven 2D 256
seismic lines from four, pre-stack time-migrated reflection surveys (Fig. 1A) (see 257
Supplementary Table 1 for acquisition and processing details for each survey). Seismic lines 258
EW0113-5, EW0113-6, and repro-n303 are each >400 km long and extend from the 259
continental shelf up to ~300 km into the CAP from the currently defined COTZ (i.e. they are 260
orthogonal to the structural trend of the margin); EW0113-5 and EW0113-6 span the mapped 261
area of SDRs in the Cuvier COTZ and the location of the extinct spreading centre predicted 262
by Gibbons et al., (2012), whereas repro-n303 images the Sonne Ridge (Fig. 1A). Due to 263
extreme amplitude contrasts between the shallow and deep sections of the original migrated, 264
EW0113 data, we applied a time-dependent gain filter and root filter to improve amplitude 265
balance and enhance deep reflectivity (see supplementary information for details). Lines 266
s135-05, s135-08, and s310-59 image the inferred ‘transitional’ crust of the Wallaby Saddle 267
and the intruded continental crust of the Wallaby Plateau (e.g., Symonds et al., 1998; 268
Goncharov and Nelson, 2012; Olierook et al., 2015). The NE-trending seismic line s135-11 269
was also interpreted as ties together the margin-orthogonal seismic lines and provides a 270
margin-parallel image of the southernmost Exmouth Plateau continental crust, the CAP, and 271
the Wallaby Plateau (Fig. 1A). 272
Although time-migrated seismic reflection data allows us to qualitatively and 273
quantitatively characterise crustal structure, seismic velocity information is required to 274
12
convert depth information from seconds two-way time (TWT) to metres. To provide context 275
for the thicknesses and depths of some discussed structures, we depth-converted the 276
EW0113-5 and EW0113-6 seismic data using interval velocities derived from ocean-bottom 277
seismometer (OBS) data (Table 1) (Tischer 2006). The OBS array was co-located with 278
seismic line EW0113-6, which is located ~70 km along-strike from line EW0113-5 (Fig. 1A); 279
the geological structure imaged in line EW0113-6 is very similar to that of EW0113-5, 280
supporting the use of velocities from EW0113-6 to depth convert both lines. As velocity data 281
from across the Wallaby Plateau and Wallaby Saddle is limited (Goncharov & Nelson 2012), 282
and because along-strike variation in geology will likely promote changes in the velocity 283
structure, lines s135-05, s135-08, and s310-59 are presented in time. For easier comparison 284
between seismic data from the CAP and the Wallaby Plateau and Wallaby Saddle, we do not 285
depth-convert repro-n303 or s135-11. Interpretation of reflection configurations (e.g., dip 286
values) in time-migrated data are only qualitative, and may change if depth-converted. 287
288
Magnetic data 289
To examine the regional magnetic anomalies, we utilise the EMAG2v2 and EMAG2v3 Earth 290
Magnetic Anomaly Grids (Maus et al. 2009; Meyer et al. 2017). EMAG2v2 is a 2 arc min 291
resolution grid derived from marine, airborne, and satellite magnetic data, but uses a priori 292
information to interpolate magnetic anomalies in areas where data gaps are present (Fig. 4A) 293
(Maus et al. 2009; Meyer et al. 2017). In contrast, EMAG2v3 uses more data points to derive 294
magnetic anomaly maps but assumes no a priori information (Fig. 4B) (Meyer et al. 2017). 295
In ocean basins with a relatively poor coverage of magnetic data available, such as the CAP, 296
clear linear magnetic anomalies in EMAG2v2 thus typically appear poorly developed or are 297
absent in EMAG2v3 (cf. Figs 4A and B) (Meyer et al. 2017). This difference in the presence 298
and appearance of linear magnetic anomalies between grids is because (assumed) knowledge 299
13
of seafloor spreading processes was incorporated into, and therefore influenced, interpolation 300
during construction of the EMAG2v2 grid (Maus et al. 2009; Meyer et al. 2017). Importantly, 301
the apparent reduction in magnetic stripes observed in EMAG2v3, compared to EMAG2v2 302
(Figs 4A and B), does not necessarily mean these features are absent, but rather that the 303
available data is insufficient to unambiguously confirm their presence in non-directionally 304
gridded data such as EMAG2v3 (Meyer et al. 2017). Comparing the EMAG2v2 and 305
EMAG2v3 grids, coupled with shiptrack magnetic data (Robb et al. 2005), allows us to 306
interrogate the magnetic architecture of the CAP (cf. Meyer et al. 2017). In particular, we use 307
EMAG2v2 to interpret possible magnetic chrons, picked on positive peaks (Fig. 1B), and 308
attempt to correlate them to the EMAG2v3 grid and shiptrack magnetic data. From these 309
comparisons, we tied interpreted magnetic stripes to seismic line EW0113-5, EW0113-6, and 310
repro-n303 using the synthetic profiles of Robb et al. (2005). To update the absolute ages of 311
the interpreted magnetic anomalies (Robb et al. 2005), we use the time-calibrated, magnetic 312
polarity reversal sequence of Gradstein & Ogg (2012). 313
314
Geochemical data 315
To evaluate whether the Sonne Ridge is an extinct seafloor spreading centre (e.g., Mihut & 316
Müller 1998; Robb et al. 2005) consisting of oceanic crust with a MORB or MORB-like 317
affinity along its length, we examine chemical data from a dredged basalt lava sample 318
collected along its extension into the Wallaby Plateau (i.e. Site 57 - sample 057DR051A; 319
diamond 57 in Fig. 1A) (Daniell et al. 2009; Dadd et al. 2015; Olierook et al. 2015). We 320
compare the Sonne Ridge sample to two samples collected from near the south-western 321
margin of the Wallaby Plateau (diamonds 55 and 52 in Fig. 1A) (i.e. Site 55 - samples 322
055BS004A and 055BS004B) (Dadd et al. 2015). Two Wallaby Plateau basalts dated from 323
Site 52 (Fig 1A) yield plagioclase 40Ar/39Ar plateau ages of 125.12±0.9 Ma and 123.80±1.0 324

14
Ma, whereas two analyses of the Sonne Ridge sample yielded less precise ages of 120±14 Ma 325
and 123±11 Ma (Olierook et al. 2015). 326
327
Results 328
Reflection seismology 329
Cuvier Abyssal Plain 330
We interpret a prominent, continuous, high-amplitude seismic reflection across the CAP; this 331
represents the interface between crystalline rock and overlying sedimentary strata (e.g., Figs 332
1C and 5). The Moho was picked at the base of a sub-horizontal zone of moderate-to-high-333
amplitude, discontinuous seismic reflections, and is broadly flat-lying at ~16–17 km or ~10 s 334
TWT (Fig. 5). On EW0113-5, the Moho appears to become shallower oceanwards (to ≤14 335
km), although our interpretation of repro-n303 suggests it may deepen again beneath the 336
Sonne Ridge (Figs 5A and D). Overall, the crystalline crust is ~8–10 km (~3–5 s TWT) thick 337
(Figs 1C and 5). On EW0113-5 and EW0113-6, there is no clear evidence for the spreading 338
ridge interpreted by Gibbons et al., (2012), which is expected to occur within magnetic chron 339
M9n (Figs 1A and 5). 340
Across the CAP, the ~1–3 km-thick, uppermost crystalline crustal layer comprises a 341
layered, moderate- to high-amplitude seismic facies (SF1; Fig. 5). On NW-trending seismic 342
lines orthogonal to the margin (i.e. EW0113-5, EW0113-6, and repro-n303), SF1 locally 343
contains ≤40 km wide, ≤4.5 km thick wedges of coherent, high-amplitude, dipping 344
reflections that predominantly diverge seaward (Figs 5 and 6); adjacent to the Sonne Ridge 345
on its NW side, a package of dipping reflections diverge landwards (e.g., Fig. 5D). There is 346
no correlation between the location and width of these wedges relative to the magnetic 347
chrons; e.g., some packages of seaward-diverging reflections span several chrons (Fig. 5). 348
Where well-developed wedges are absent, SF1 contains discontinuous, horizontal to gently 349

15
seaward-dipping reflections (Fig. 5). On line s135-11, which is oriented parallel to the 350
margin, most reflections within SF1 are either sub-horizontal or dip gently north-eastwards 351
(Fig. 7). Seismic velocities for SF1 are estimated to be ~4–5 km/s (Fig. 5; Tischer 2006). 352
In places, the uppermost crystalline layer (SF1) is underlain by a low-amplitude, near 353
transparent seismic facies (i.e. SF2), which is particularly clear on lines EW0113-5 and 354
EW0113-6 (Figs 5 and 6). SF2 is up to ~2.8 km thick, being thinnest and occasionally absent 355
beneath wedges of dipping reflections within SF1 (Figs 5 and 6). The few reflections that 356
occur within SF2 typically have low-to-moderate to amplitudes and variable dips (Figs 5 and 357
6). On repro-n303, at the seaward termination of an overlying wedge in SF1, a ~15 km wide 358
swarm of landward-dipping reflections are present in SF2 (Fig. 5D). There is no clear SF2 359
observed on line s135-11, even in areas where it is encountered on the intersecting margin-360
orthogonal lines (Fig. 7). 361
Beneath SF2 we recognise a ~3.5–6 km (<2 s TWT) thick, low-amplitude layer that 362
locally contains prominent, high-amplitude, dipping reflections and discontinuous, moderate 363
amplitude, sub-horizontal reflections (SF3; Figs 5–7). On line EW0113-5, the inclined 364
reflections within SF3 terminate at the Moho and primarily dip oceanwards at 20–30° (Fig. 365
5A). On lines EW0113-6 and repro-n303, however, reflections within SF3 dip both 366
oceanwards and landwards (Figs 5B, C, and 6). Mapped reflections within SF3 on s135-11 367
primarily dip towards the SE, extending from the top of the layer down into the mantle, 368
cross-cutting but not offseting NE-dipping, gently inclined reflections (Fig. 7). Similar mid- 369
and lower-crustal reflection configurations to SF2 and SF3, respectively, occur in the seismic 370
data presented by Hopper et al. (1992) (Fig. 1C). Seismic velocities of SF2 and SF3 are 6.8–371
7.2 km/s (Fig. 4; Tischer 2006). 372
373
Wallaby Plateau and Wallaby Saddle 374

16
Building on previous investigations of seismic data across the continental-to-COTZ crust of 375
the Wallaby Plateau and Wallaby Saddle, here we (re)interpret several 2D seismic lines and 376
compare their structure to that of the CAP. Similar to the CAP, a prominent, continuous, 377
high-amplitude seismic reflection marks the interface between crystalline rock and overlying 378
sedimentary strata across the Wallaby Plateau and Wallaby Saddle (Figs 7 and 8). Within the 379
Wallaby Saddle, the crust appears to be ~5–6 s TWT thick, although the Moho can only 380
tentatively be interpreted, and can also be sub-divided into: (i) SF1, itself containing up to ~4 381
s TWT thick, 12 km wide wedges of diverging reflections that typically dip seawards; (ii) 382
restricted zones that seismically appear similar to SF2 described from the CAP; and (iii) a 383
1.5–3 s TWT thick SF3 unit that contains reflections with variable dips, including prominent 384
swarms of landward-dipping reflections that cross-cut but do not offset other reflections and 385
that typically occur at the oceanward termination of SF1 wedges (Fig. 8). Derivation of 386
interval velocities from seismic reflection stacking velocities suggests rocks comprising SF1 387
have velocities of ~2.5–5.3 km s-1 (see insets in Fig. 8C) (Goncharov & Nelson 2012). It is 388
difficult to determine whether SF1-SF3 continue across the full extent of the Wallaby Saddle 389
in s310-59 because there appears to be a distinct change in reflection configuration (Fig. 8C). 390
In particular, we observe that although reflectivity in west of this change is decreased, 391
reflections towards the top of the crust are broadly sub-parallel to the basement reflection and 392
those within the mid- to lower-crustal areas are either gently inclined landwards, or 393
moderately inclined oceanwards (Fig. 8C). 394
Seismic reflection imaging of the Wallaby Plateau reveals the crust is up to ~7 s TWT 395
thick (e.g., at the Sonne Ridge), thicker than that of the Wallaby Saddle (~5–6 s TWT thick) 396
but that there is no apparent significant change in Moho depth between the two crustal 397
domains (Figs 7 and 8); we note these observations are based on time-migrated data and may 398
thus be invalidated if there any differences in velocity structure between the two areas not 399

17
previously recognised. The crust of the Wallaby Plateau is also thicker than that of the CAP, 400
and its underlying Moho is located at deeper levels (~12 s TWT; Fig. 7). Towards the SW 401
margin of the Wallaby Plateau, a ~40 km wide, apparently NE-trending rift system occurs, 402
comprising normal faults with throws of up to ~1 s TWT that bound and dissect a graben 403
(Figs 8B–D). Reflections within the upper section of the Wallaby Plateau crust are typically 404
moderate-to-high amplitude and form layered packages, which are either conformable to the 405
top basement horizon or that diverge (Fig. 8). The diverging packages of dipping reflections 406
appear similar to SF1 observed in the CAP and Wallaby Saddle (Figs 5 and 8). Derivation of 407
interval velocities from seismic reflection stacking velocities suggests rocks comprising these 408
diverging reflector sequences have velocities of ~2.5–5.3 km s-1 (Fig. 8C) (Goncharov & 409
Nelson 2012). Due to uncertainties regarding the reliability of seismic processing within the 410
middle and lower crustal sections of the Wallaby Plateau, e.g., where imaging is hindered by 411
seabed multiples, it is difficult to confidently interpret reflections as real geological features 412
and not artefacts. However, we note that in these middle and lower crustal sections, 413
reflections are low-to-moderate amplitude and broadly dip gently in various directions; in 414
places, steeply inclined reflections are observed that appear to cross-cut but not offset gently 415
dipping reflections (Fig. 8). These steeply inclined mid- to lower-crustal reflections typically 416
appear to be located beneath diverging reflection packages, or beyond their down-dip 417
termination (Fig. 8). 418
419
Comparison of magnetic anomalies to seismic reflection data 420
EMAG2v2 and ship-track magnetic data reveal that 10 km wide, 220 km long magnetic 421
stripes cover much of the CAP (Figs 1B, 4, and 5). No magnetic stripes can confidently be 422
identified and dated within the Wallaby Plateau and none are observed within the Wallaby 423
Saddle (Figs 1B and 4). Although magnetic anomalies in the EMAG2v3 grid are suppressed 424
18
relative to EMAG2v2, subtle, linear anomalies can still be distinguished across the CAP and 425
in the Gallah Province (cf. Figs 4A and B). Due to the lower resolution of magnetic 426
anomalies in the EMAG2v3 grid, magnetic chrons cannot be confidently attributed and we 427
thus rely on EMAG2v2 and shiptrack data to define possible chrons (Fig. 4). Proximal to the 428
Australian continent, long-wavelength magnetic anomalies can only be broadly assigned to 429
chron M10N (~135.9–134.2 Ma; Figs 1B, 4, and 5) (Robb et al. 2005); across parts of 430
seismic lines EW0113-5, EW0113-6, and repro-n303, chrons M10n–M5r (~135.3–131.4 Ma) 431
are clearly defined and have amplitudes of ≤±100 nT (Figs 1B, 4, and 5). On all three seismic 432
lines, chrons M8r–M7n (~133–132 Ma) coincide with a package of seaward-dipping 433
reflectors observed in SF1, which on EW0113-5 is ≤3 km thick and ~25 km long (Fig. 5). 434
Robb et al. (2005) interpret the magnetic anomalies M10N–M6 southeast of the 435
Sonne Ridge as conjugate to a more poorly developed set of anomalies northwest of the ridge 436
(Fig. 1B). These chrons NW of the Sonne Ridge (i.e. M10N–M6; ~135.9–131.7 Ma) 437
terminate abruptly north-eastwards against the Cape Range Fracture Zone, abutting magnetic 438
chrons on the Gallah Province, and to the SW are cross-cut by chrons (M5n?; 131.7–130.6 439
Ma) mirrored either side of the Sonja Ridge (Fig. 1B). Beyond the outermost chron (M10N) 440
interpreted in the CAP, chron M5n is the first to occur continuously along-strike across both 441
the Cuvier and Gascoyne margin segments, extending into the Wallaby Plateau (Fig. 1B). 442
443
Geochemistry of basalts dredged from the Sonne Ridge 444
The only basalt collected from the Sonne Ridge displays a relatively flat Rare Earth Element 445
(REE) pattern (Fig. 9A). Based on this observation, Dadd et al. (2015) interpret the basalt to 446
have a slightly enriched MORB-like source, supporting the inference that the CAP comprises 447
oceanic crust (e.g., Larson et al. 1979; Hopper et al. 1992; Mihut & Müller 1998). Although a 448
flat REE pattern can be indicative of a shallow melting regime related to MORB generation, 449
19
it does not preclude other settings. By replotting the trace element and radiogenic isotopic 450
compositions of the Sonne Ridge sample, we show the sample has characteristics that could 451
suggest a more continental source (Fig. 9A). It should be noted that the Sonne Ridge sample 452
is heavily altered (Dadd et al. 2015) which could explain the elemental enrichment in Pb, Ba, 453
and Rb, as well as elevated 87Sr/86Sr. However, the sample exhibits unradiogenic εNd and a 454
negative Nb anomaly that is in part defined by a relative enrichment in the neighbouring 455
element Th, which likely cannot be attributed to contamination; the combination of these 456
features likely cannot be ascribed to alteration (Fig. 9). Instead, the negative Nb anomaly and 457
unradiogenic εNd may indicate a chemically evolved, continental or sedimentary contribution 458
to the magmas. The chemical similarity of the Sonne Ridge basalt to two ~124 Ma samples 459
from the Wallaby Plateau (Fig. 9), which is interpreted to comprise intruded continental crust 460
(Daniell et al. 2009; Stilwell et al. 2012; Olierook et al. 2015), is also consistent with a 461
continental or sedimentary contribution to the Sonne Ridge magmas. 462
463
Interpretation and Discussion 464
Since the recognition that it contains magnetic stripes, the CAP has been considered to 465
comprise unambiguous oceanic crust that formed at ~136 Ma (Valanginian) in response to 466
seafloor spreading at the Sonne Ridge (e.g., Falvey & Veevers 1974; Larson et al. 1979; 467
Hopper et al. 1992; Robb et al. 2005). An oceanic origin for the CAP has been supported by 468
seismic reflection-based observations that it has a thin crust relative to adjacent continental 469
blocks (e.g., Fig. 1C) (e.g., Hopper et al. 1992), and chemical data, which suggest it has a 470
MORB-like signature (Dadd et al. 2015). The apparent certainty that the CAP is oceanic 471
means it has been unquestionably treated as such in all geological models of the evolution of 472
NW Australia, including regional and global palinspastic and plate kinematic reconstructions 473
(Heine & Müller 2005; Gibbons et al. 2012). However, the identification of linear magnetic 474
20
anomalies within non-oceanic crust, in areas such as Ethiopia and the Atlantic margins, 475
requires us to re-evaluate the origin of crustal domains previously classified as oceanic crust 476
based on the presence of magnetic stripes (e.g., Bronner et al. 2011; Bridges et al. 2012; 477
Collier et al. 2017; McDermott et al. 2018). 478
479
Seismic facies interpretation 480
Beneath the sedimentary cover across the CAP, we recognise three distinct layers (SF1–SF3; 481
Figs 5–8). We particularly identify a newly recognised upper-crustal layer (SF1) in the CAP 482
that comprises well-developed wedges of divergent, seaward-dipping reflectors (SDRs) (Figs 483
5 and 6). These SDRs are 4.5 km thick, likely have seismic velocities of ~4–5 km s-1 484
(Tischer 2006), and that collectively extend >300 km seaward from the previously interpreted 485
COTZ (Figs 5 and 6). Diverging SDRs are also observed within the: (i) the previously 486
defined, 50–70 km wide COTZ along the Cuvier Margin beneath the continental slope, where 487
they are up to ~5 km thick (e.g., Fig. 1C) (e.g., Hopper et al. 1992; Symonds et al. 1998); and 488
(ii) across the Wallaby Saddle and Wallaby Plateau, where they are ~5–10 km thick and have 489
similar seismic velocities (2.5–5.3 km s-1) to those in the CAP (Figs 5, 6, and 8) (e.g., 490
Symonds et al. 1998; Sayers et al. 2002; Goncharov & Nelson 2012). The lack of boreholes 491
penetrating these SDR sequences offshore NW Australia means we cannot determine their 492
composition or the nature of underlying crust. However, SDR sequences that are 493
geometrically and geophysically (e.g., seismic velocities typically range from ~3–5 km s-1) 494
similar to those from offshore NW Australia (e.g., SF1) have been recognised along other 495
passive margins, developed on both heavily intruded continental crust and thickened oceanic 496
crust (e.g., Hinz 1981; Larsen & Saunders 1998; Harkin et al. 2020). Where these SDRs have 497
been drilled, or are exposed onshore (e.g., Iceland and Greenland), they comprise interbedded 498
basaltic lavas, tuffs, and sedimentary rocks formed during sub-aerial, or perhaps shallow-499
21
water, continental breakup and crustal spreading (e.g., Bodvarsson & Walker 1964; Mutter et 500
al. 1982; Roberts et al. 1984; Eldholm et al. 1987; Larsen et al. 1994a; Geoffroy et al. 2001; 501
Harkin et al. 2020). Based on similarities in structure and seismic velocities to SDRs studied 502
elsewhere, we suggest that SF1 comprises spreading-related volcanic rocks interbedded with 503
sedimentary layers (Figs 1C, 5, 6, and 8) (e.g., Mutter et al. 1982; Hopper et al. 1992; 504
Symonds et al. 1998; Planke et al. 2000; McDermott et al. 2019; Harkin et al. 2020). 505
SDR sequences (SF1) can develop on heavily intruded continental crust or thickened 506
oceanic crust (e.g., Larsen & Saunders 1998). The observed structure and seismic velocities 507
(6.8–7.2 km s-1) of SF2 and SF3 in the CAP, defined by transparent seismic facies and 508
discordant high-amplitude reflections, respectively (Figs 5–8), are consistent with the typical 509
seismic character of sheeted dykes and lower crustal gabbro intrusions in oceanic crust (e.g., 510
Eittreim et al. 1994; Paton et al. 2017). However, we note that these seismic facies are not 511
uniquely diagnostic of oceanic crust but can also occur in COTZs, where moderate- to high-512
amplitude reflections may represent igneous intrusions (e.g., dykes), primary layering within 513
gabbros, or texturally distinct lower crustal shear zones within otherwise homogenous 514
crystalline rocks (e.g., Phipps-Morgan & Chen 1993; Abdelmalak et al. 2015; Paton et al. 515
2017). For example, the swarm of landward dipping reflections within SF2 and SF3 at the 516
down-dip termination of an SDR sequence may correspond to dykes; i.e. they cross-cut but 517
do not offset background reflections and are thus not faults or shear zones (e.g., Figs 5 and 8) 518
(e.g., Abdelmalak et al., 2015; Phillips et al., 2018). 519
520
Implications of SDR recognition for the CAP 521
Origin of SDR lavas 522
Lavas within SDR wedges are inferred to emanate from and be thickest at axial magmatic 523
segments, where they were likely fed by sub-vertical dykes. With continued plate divergence, 524
22
these lavas subside and rotate to dip inwards towards their eruption site (e.g., Planke & 525
Eldholm 1994; Paton et al. 2017; Norcliffe et al. 2018; Tian & Buck 2019); this subsidence 526
also rotates underlying feeder dykes, which will dip away from the magmatic segment (e.g., 527
Lenoir et al. 2003; Abdelmalak et al. 2015). SDRs across the CAP appear to dip and diverge 528
north-westwards, except one SDR-like package of concave-upwards reflections that borders 529
and diverges south-eastwards towards the Sonne Ridge; i.e. we define a conjugate set of 530
SDRs that occur either side of and dip towards the Sonne Ridge (Fig. 5). Although only one 531
SDR package to the NW of the Sonne Ridge dips south-eastwards towards the ridge, we 532
suggest that the other SDR packages, which dip north-westwards, relate to and were formed 533
at the Sonja Ridge (Fig. 5). From these SDR geometries and distribution, coupled with the 534
previously inferred conjugate sets of magnetic chrons (Fig. 1B), our results are consistent 535
with suggestions that (Falvey & Veevers 1974; Larson et al. 1979; Robb et al. 2005; 536
MacLeod et al. 2017): (i) extension within the CAP was predominantly centred on the Sonne 537
Ridge during chrons M10N–M5r (~136–131 Ma); before (ii) briefly jumping to the Sonja 538
Ridge at ~131 Ma (chron M5n), which interrupted subsidence and rotation of the SDR wedge 539
immediately to the NW of the Sonne Ridge and instead produced north-westwards diverging 540
SDRs. There are no changes in SDR divergence direction either side of chron M9n in 541
EW0113-5 or EW0113-6, suggesting no spreading centre existed here (Figs 5A and B) (cf. 542
Gibbons et al. 2012). 543
The chemistry of a basalt sample from the Sonne Ridge, particularly its Nd isotopic 544
composition and refractory trace element abundances (Fig. 9), indicates it could originate 545
from either: (i) melting of sub-continental lithospheric mantle (SCLM); or (ii) contamination 546
of a MORB-like magma by assimilation as it ascended through continental crust (cf. Dadd et 547
al. 2015). Because these chemical data provide evidence that the Sonne Ridge basalt 548
interacted with continental material, these same data cannot thus be used as definitive 549

23
evidence that the CAP comprises oceanic crust (cf. Dadd et al. 2015). The basalt sample 550
dredged from its present-day bathymetric expression can be considered a product of one of 551
the youngest magmas within the CAP system (e.g., Robb et al. 2005). We thus think it 552
plausible that older magmas emanating from the Sonne Ridge, including the SDRs imaged in 553
the seismic reflection data, could have a more pronounced continental signature. 554
555
Environment of SF1 lava emplacement 556
Borehole and field data reveal SDR lavas typically erupt sub-aerially, but can develop sub-557
aqueously (e.g., Bodvarsson & Walker 1964; Mutter et al. 1982; Roberts et al. 1984; Eldholm 558
et al. 1987; Larsen et al. 1994b; Symonds et al. 1998; Planke et al. 2000; Geoffroy et al. 559
2001; Harkin et al. 2020). Determining the environment and age of SDR deposition can help 560
establish whether they likely formed via: (i) seafloor spreading at a mid-ocean ridge, 561
consistent with previous interpretations that the CAP comprises unambiguous oceanic crust 562
(e.g., Falvey & Veevers 1974; Larson et al. 1979; Hopper et al. 1992; Robb et al. 2005); or 563
(ii) magmatic addition along a sub-aerial or shallow-water axis during the transition from 564
continental rifting to full plate separation (i.e. the CAP does not comprise oceanic crust) (e.g., 565
McDermott et al. 2018). However, from their seismic character alone it can be difficult to 566
determine whether SDRs formed in sub-aerial, shallow-water, or deep-marine environments 567
(e.g., compare inner and outer SDR character and inferred emplacement conditions; Symonds 568
et al. 1998; Planke et al. 2000). 569
Observations from the DSDP Site 263 borehole, which terminates ~100–200 m above 570
the crystalline crust, indicate the sedimentary cover deposited above the SDRs: (i) comprises 571
poorly sorted silty claystones that include angular quartz grains and abundant kaolinite, 572
consistent with a neritic (i.e. <200 m water depth) depositional environment (Fig. 3B) (e.g., 573
Robinson et al. 1974; Veevers & Johnstone 1974; Compton et al. 1992; Holbourn & 574
24
Kaminski 1995; Oosting et al. 2006); (ii) contain coarsely agglutinated foraminifera species 575
and taxa such as Hyperamina spp. within the lowermost intersected strata, which are typical 576
of shallow-marine conditions (Holbourn & Kaminski 1995); and (iii) based on 577
biostratigraphic data were deposited at least in the middle Barremian (e.g., ~127 Ma), but are 578
perhaps as old as Hauterivian (~132.6–129.4 Ma) (Oosting et al. 2006). Deposition of the 579
lowermost sedimentary cover intersected by DSDP Site 263 thus occurred up to ~9 Myr (i.e. 580
~135.9–127 Ma) after formation of the CAP crust they rest upon, which records chron M10N 581
(135.9–134.2 Ma), during development of crust hosting chrons M7–M1n (132.5–126.3 Ma; 582
Fig. 1B). Critically, SDR-bearing crust cools and subsides as it is transported away from its 583
emplacement site (e.g., Planke & Eldholm 1994; Paton et al. 2017; Norcliffe et al. 2018; Tian 584
& Buck 2019). The presence of strata deposited in the neritic zone (<200 m water depth) 585
above SF1 in DSDP 263, after ~9 Myr of crustal cooling and subsidence, thus implies lava 586
eruption during the early stages of CAP formation occurred: (i) in a sub-aerial or shallow-587
water environment (i.e. comparable to the inner SDRs of Symonds et al. 1998; Planke et al. 588
2000), if we assume the underlying crust only subsided in the ~9 Myr between SDR 589
emplacement and sediment deposition; or (ii) at a moderately deep-marine spreading centre 590
(i.e. comparable to the outer SDRs of Symonds et al. 1998; Planke et al. 2000), but localised 591
uplift elevated the DSDP 263 area to bathymetric depths equivalent to the neritic zone prior 592
to deposition of overlying strata. We lack the data from strata directly overlying or 593
interbedded with the SDRs to test these two interpretations regarding lava emplacement 594
depth, but note that the relatively flat-lying crystalline crust across the interpreted CAP 595
seismic lines (except for the Sonne Ridge) provides no evidence of post-spreading uplift, 596
perhaps suggesting a sub-aerial or shallow-water environment of emplacement is most 597
plausible (Fig. 5). 598
599
25
Nature of CAP crust 600
Seismic and magnetic data alone are insufficient to determine the origin of the CAP crust 601
because the SDRs, seismic facies (SF1–SF3), and magnetic stripes these data illuminate can 602
be recognised in both oceanic crust and COTZs (e.g., Larsen & Saunders 1998; Symonds et 603
al. 1998; Planke et al. 2000; Bridges et al. 2012; Collier et al. 2017; McDermott et al. 2018). 604
We also show that the chemical data available for a basalt at the Sonne Ridge possesses a 605
continental signature and are thus inconclusive regarding whether or not the crust is oceanic 606
(Fig. 9) (cf. Dadd et al. 2015). However, based on lithological and biostratigraphic data from 607
the sedimentary cover intersected by DSDP Site 263, we suggest: (i) the inferred lavas within 608
SF1, at least during the early stages of CAP formation (i.e. chron M10N), likely erupted in a 609
sub-aerial, or perhaps shallow-water (<200 m water depth), environment; and (ii), assuming 610
the underlying crystalline crust had since subsided relative its position during formation, that 611
the syn-depositional, ~9 Myr old Sonne Ridge was elevated above at least the base of the 612
neritic zone. These constraints on SDR emplacement depth are inconsistent with the CAP 613
being oceanic crust since mid-ocean ridges in such a setting are expected to occur at water 614
depths of ~3 km after 5–10 Myr of spreading (e.g., Menard 1969; Parsons & Sclater 1977; 615
Stein & Stein 1992). 616
We envisage that crustal structure of the CAP could involve a gradual north-617
westwards change from the continental crust of the Cuvier Margin into a COTZ, which is 618
likely characterised at its landward edge by heavily intruded continental crust and 619
progressively becomes increasingly magma-dominated towards the Sonne Ridge (Figs 2 and 620
10). Our data are insufficient to determine where, or if, there is a transition from heavily 621
intruded continental crust to magmatic crust, which would mark break-up of the continental 622
crust within the CAP. Repetition of the M10N-M6 chrons centred on the Sonne Ridge 623
suggests the possible COTZ of the CAP may extend at least out to chron M5n, which is: (i) 624

26
>500 km oceanwards of the outer- limit of the previously defined Cuvier COTZ (e.g., Hopper 625
et al. 1992; Symonds et al. 1998); and (ii) broadly coincident with the north-western limit of 626
the Gallah Province on the Gascoyne margin (Direen et al. 2008) (Figs 1B and 10B). From 627
the distribution of the magnetic chrons (Fig. 1B), our recognition of a continental chemical 628
signature within the Sonne Ridge basalt (Fig. 9), and the probable sub-aerial or shallow-water 629
elevation of the ridge during extension, make it plausible that full continental lithospheric 630
rupture may not have occurred in the CAP (Fig. 10). Instead, we suggest rupture of the 631
continental lithosphere and onset of seafloor spreading occurred simultaneously offshore the 632
Cuvier and Gascoyne margins at ~131 Ma (Hauterivian), following an oceanwards ridge 633
jump from the Sonja Ridge, producing unambiguous oceanic crust recording chron M5 (Figs 634
1 and 10) (e.g., Robb et al. 2005; Direen et al. 2008). Continuation of the COTZ across the 635
CAP has implications for the timing and kinematics of plate reconstructions of the NW 636
Australian margin, with the onset of deep-marine seafloor spreading potentially ~3 Myr later 637
than suggested by previous studies (e.g., Robb et al. 2005). 638
Interpreting the CAP as a COTZ developed through sub-aerial, or at least shallow-639
water, extension implies its crust was: (i) thicker during SDR emplacement, but concurrently 640
and/or subsequently thinned during continued magmatic extension and late-stage stretching 641
(e.g., Bastow & Keir 2011; Bastow et al. 2018); (ii) less dense and thus more buoyant than 642
100% oceanic crust, because it likely retained a significant proportion of continental material; 643
and (iii) thermally buoyant due to the presence of abundant hot intrusions and underlying, 644
decompressing mantle. That these processes can maintain rift axes at above or near sea-level 645
elevations is demonstrated by the onshore occurrence of active rift zones, characterised by 646
heavily-intruded continental crust, in the Main Ethiopia Rift and Afar (e.g., Hayward & 647
Ebinger 1996; Ebinger & Casey 2001; Mackenzie et al. 2005; Bridges et al. 2012). 648
27
Because the degree of thermal subsidence is at least partly controlled by crustal 649
density, we would expect oceanic crust to thermally subside more than less dense, heavily-650
intruded continental crust. Given the Hauterivian-to-Middle Barremian sedimentary strata 651
overlying the SDRs were deposited in neritic conditions (Veevers & Johnstone 1974; 652
Holbourn & Kaminski 1995; Oosting et al. 2006), it is apparent the CAP subsided from near 653
sea-level to a current, unloaded basement depth of ~6.5 km; this total subsidence is greater 654
than predicted for dense, thermally subsiding oceanic crust (Stein & Stein 1992). To interpret 655
the CAP as COTZ crust, our results would require other mechanisms, in addition to thermal 656
subsidence, to influence its subsidence history. For example, post-breakup decay of 657
asthenospheric thermal anomalies may account for some elevation discrepancies via removal 658
of dynamic support of the margin (e.g., Czarnota et al. 2013). Finally, the CAP COTZ may 659
have involved some late-stage stretching prior to terminal breakup and the onset of seafloor 660
spreading, akin to processes observed today in the sub-aerial Red Sea rift in Ethiopia (e.g., 661
Bastow & Keir 2011; Daniels et al. 2014). 662
663
Development of magnetic stripes during break-up 664
Recent forward modelling of conjugate, ship-track magnetic profiles by Collier et al. (2017) 665
suggest magnetic signals over SDRs arise from a combination of stacked and rotated lavas, 666
producing a long-wavelength positive anomaly that can sometimes mask reversals, and linear 667
magnetic anomalies caused by dyke intrusion in the underlying crust. Stacked SDR wedges 668
on the CAP are part of a possible COTZ and span several chrons (e.g. M8n-M7r), but are 669
≤4.5 km thick (Figs 5 and 6). These observations indicate the CAP magnetic stripes likely 670
record magnetic reversal signatures originating from sub-SDR rocks; i.e. the SDRs and flat-671
lying lavas are too thin to dominate the magnetic signature (cf. Collier et al. 2017). In 672
contrast¸ the less-clearly developed yet higher amplitude magnetic reversals in the Gallah 673
28
Province COTZ may relate to interference from the greater SDR thicknesses (≤5.5 km) 674
relative to the CAP (Direen et al. 2008). Our inference that the magnetic signature is derived 675
from sub-SDR rocks is consistent with studies of onshore incipient spreading centres (e.g. 676
Ethiopia), where magnetic stripes likely originate from axial intrusion by dykes in heavily 677
intruded, upper continental crust, rather than overlying lavas (Bridges et al. 2012). 678
We suggest that SDR thickness and, thereby, preservation of magnetic anomalies 679
within a COTZ can partly be attributed to extension rate. For example, the extension rate 680
during SDR eruption offshore NW Australia (~4.5 cm/yr half rate; Robb et al. 2005) is 681
substantially faster than the inferred extension rates for the South Atlantic during magmatic 682
crust formation (~1.1 cm/yr half-rate; Paton et al. 2017). Slower extension rates (e.g. South 683
Atlantic) likely promote stacking of lava flows to produce thicker SDRs (Eagles et al. 2015), 684
leading to interference between the magnetic signal of the SDRs and sub-SDR crust and thus 685
the development of the long-wavelength positive magnetic anomalies (e.g., Moulin et al. 686
2010). Extension rate may also influence magnetic anomaly development by affecting the 687
width of magnetic stripes; reversal anomalies will be narrowest at slow spreading ridges 688
(Vine 1966). The narrower anomalies, combined with the greater potential for vertical 689
stacking of lavas, will tend to suppress magnetic anomaly preservation. 690
691
Conclusions 692
The recognition of magnetic stripes within the Cuvier Abyssal Plain (CAP), offshore NW 693
Australia, has led to the assumption that it comprises oceanic crust generated by conventional 694
seafloor spreading at the Sonne Ridge, probably at water depths of ≳2 km. We challenge this 695
assumption, in line with the growing consensus that magnetic stripes are not necessarily 696
diagnostic of oceanic crust and can instead form in continent-ocean transition zones 697
(COTZs). Using regional 2D seismic reflection lines we demonstrate that the uppermost layer 698
29
in the CAP crystalline line crust contains seaward-dipping reflector (SDR) sequences, akin to 699
those observed in the previously defined COTZ of the Cuvier Margin and Wallaby Saddle, as 700
well as on the heavily intruded continental crust of the Wallaby Plateau. Through comparison 701
to SDRs recognised elsewhere, we suggest those observed across the CAP comprise lavas, 702
interbedded with sedimentary strata, erupted from an axial magmatic segment. Lithological 703
and biostratigraphic data from a borehole penetrating the CAP sedimentary cover, which 704
were deposited in neritic (<200 m water depth) conditions, require the underlying crystalline 705
crust to have been at shallow-water depths ~9 Myr after its formation and thus imply SDR 706
emplacement occurred in a shallow water or sub-aerial environment. We also re-interpret 707
chemical data from a basalt dredged along the Sonne Ridge and, contrary to previous work, 708
show that it exhibits a continental chemical signature. Overall, these data and interpretations 709
suggest the CAP may not comprise unambiguous oceanic crust, but could instead represent a 710
>500 km wide COTZ where extension likely became more magma-dominated, producing 711
heavily-intruded continental crust (akin to present-day Ethiopia) through to magmatic crust. 712
In our model, break-up of the continental crust occurred during the formation of the CAP, but 713
full continental lithospheric rupture occurred outboard of the COTZ following a ridge jump at 714
~130 Ma. Our re-evaluation of the CAP crustal type supports suggestions that COTZs along 715
volcanic passive margins may record the development of magnetic stripes, which thus should 716
not be used alone as a reliable proxy for the onset of seafloor spreading and the extent of 717
oceanic crust. 718
719
Acknowledgements 720
Schlumberger are thanked for provision of Petrel software licenses. M.T.R. was supported by 721
NERC grant NE/L501621/L. The EW0113 seismic survey and EMAG2 magnetic anomaly 722
grids were, and can be acquired from, the UTIG Marine Geoscience Data System and the 723

30
NOAA National Geophysical Data Centre, respectively. Gwenn Peron-Pinvidic, Gareth 724
Roberts, and Saskia Goes are thanked for helpful discussions during the preparation of this 725
manuscript. We thank five reviewers, including Jon Bull, for their constructive comments on 726
previous versions of this manuscript. 727
728
Figure captions 729
Figure 1: (A) Location map of the study area highlighting the seismic lines used in this study 730
and key tectonic elements, including areas of recognised seaward-dipping reflectors (SDRs) 731
(Symonds et al. 1998; Holford et al. 2013) and previously interpreted approximate limits of 732
the continent-ocean boundary (COB; Eagles et al. 2015) and continent-ocean transition zones 733
(COTZs; Symonds et al. 1998; Direen et al. 2008). Inset: study area location offshore NW 734
Australia. AAP – Argo Abyssal Plain, CAP – Cuvier Abyssal Plain, CRFZ – Cape Range 735
Fracture Zone, GAP – Gascoyne Abyssal Plain, GP – Gallah Province, NCB – North 736
Carnarvon Basin, EP – Exmouth Plateau, PB – Perth Basin, SCB – South Carnarvon Basin, 737
Cu – Cuvier margin COTZ, SR – Sonne Ridge, SjR – Sonja Ridge, WP – Wallaby Plateau, 738
WS – Wallaby Saddle, WZFZ – Wallaby-Zenith Fracture Zone. Dredge sites 52, 55 (samples 739
055BS004A and 055BS004B), and 57 (sample 057DR051A) are also shown (Dadd et al. 740
2015). (B) Total magnetic intensity grid (EMAG2v2), interpreted magnetic chrons (based on 741
Robb et al. 2005). See Supplementary Figure S1 for an uninterpreted version. (C) 742
Uninterpreted and interpreted seismic line (i.e. seismic profile 670) across the Cuvier Margin, 743
imaging the crustal structure beneath the continental shelf and the deep abyssal plain 744
(modified from Hopper et al., 1992). Velocity profiles from refraction experiments shown; 745
see Hopper et al., (1992) for details. See Figure 1A for approximate line location and 746
Supplementary Figure S2 for an enlarged version of the uninterpreted seismic line. 747
748

31
Figure 2: Schematic model (not to scale) of a continent-ocean transition zone along a magma-749
rich passive margin, which depicts the evolution from unambiguous continental crust to 750
unambiguous oceanic crust; for simplicity the lithospheric mantle is not shown. As magma 751
intrudes continental crust, likely as dykes at mid- to upper-crustal levels and larger gabbroic 752
bodies in the lower crust, it becomes ‘heavily intruded continental crust’ (e.g., Eldholm et al. 753
1989). Continued intrusion and dyking leads to localisation of magmatism within narrow 754
zones where there is little, if any, continental crust remaining (i.e. 'magmatic crust'; e.g., 755
Collier et al. 2017; Paton et al. 2017). We categorize heavily intruded continental crust and 756
magmatic crust as ‘COTZ crust’. Sub-aerial, magma-assisted rifting may feed extensive lava 757
flows that later, through subsidence, become seaward-dipping reflectors (SDRs). SDR 758
subsidence leads to rotation of underlying dykes (Abdelmalak et al. 2015); a similar rotation 759
of lavas and dykes is observed in oceanic crust (Karson 2019). 760
761
Figure 3: Tectono-stratigraphic chart for the Exmouth Plateau and Cuvier Margin (after 762
Hocking et al., 1987; Arditto, 1993; Partington et al. 2003; Willis, 2005; Reeve et al. 2016). 763
(B) Comparison between stratigraphic data from DSDP 263 and Pendock-1 boreholes 764
(modified from Veevers & Johnstone, 1974; Holbourn & Kaminski, 1995). See Figure 1A for 765
borehole locations. 766
767
Figure 4: Total magnetic intensity grids EMAG2v2 and EMAG2v3 (Maus et al. 2009; Meyer 768
et al. 2017), compared with shiptrack magnetic data (Robb et al. 2005). Key tectonic 769
elements also shown (see Fig. 1 for legend). In (A), CAP – Cuvier Abyssal Plain, GAP – 770
Gascoyne Abyssal Plain, GP – Gallah Province, NCB – North Carnarvon Basin, PB – Perth 771
Basin, SCB – South Carnarvon Basin, Cu – Cuvier margin COTZ, WP – Wallaby Plateau, 772
WS – Wallaby Saddle. 773
32
774
Figure 5: Interpreted and uninterpreted, depth-converted seismic lines (A) EW0113-5 and (B) 775
EW0113-6, and the time-migrated line (D) repro n303 showing crustal structure of the Cuvier 776
Margin; see Figures 1A and 5C for line locations. The tie-co-located magnetic anomaly 777
profile showing interpreted magnetic chrons is presented for (A–D) (after Robb et al. 2005). 778
See Supplementary Figure S2 for an enlarged version of the uninterpreted seismic lines. 779
780
Figure 6: Zoomed in view of EW0113-5 highlighting the seismic character of interpreted 781
SDR packages (see Fig. 5A for location). 782
783
Figure 7: Interpreted and uninterpreted, time-migrated seismic line s135-11; see Figure 1A 784
for location. See Supplementary Figure S2 for an enlarged version of the uninterpreted 785
seismic line. 786
787
Figure 8: Interpreted and uninterpreted, time-migrated seismic lines (A) s135-s135_05, (B) 788
s135-08, and (D) s310-59 showing crustal structure of the Wallaby Plateau and Wallaby 789
Saddle; see Figures 1A and 8D for line locations. See Supplementary Figure S2 for an 790
enlarged version of the uninterpreted seismic lines. 791
792
Figure 9: (A) Primitive mantle normalized incompatible element diagram comparing the 793
dredged Sonne Ridge and Wallaby Plateau basalt lava samples with average (ave.) 794
compositions of MORB variants (Hofmann 2014), Globally Subducting Sediment (GLOSS) 795
(Plank & Langmuir 1998), and continental crust (Rudnick & Fountain 1995). (B) Plot of 796
ε(Nd) versus 87Sr/86Sr, illustrating that the Sonne Ridge and Wallaby Plateau samples are 797
distinct from MORB (based on data collated in Hofmann 2014). 798
33
799
Figure 10: (A) Map showing the potential limits of the COTZ based on interpreting the CAP 800
and Gallah Province as transitional and/or magmatic crust. (B-D) Schematic maps showing 801
the development of COTZ crust and the onset of oceanic crust accretion adjacent to the 802
Gascoyne and Cuvier margins, during formation of chrons (B) M10, (C) M6 and (D) M3r. 803
See Figure 1 for chron ages. Location of present day coastline shown for reference. 804
805
References 806
Abdelmalak, M.M., Andersen, T.B., Planke, S., Faleide, J.I., Corfu, F., Tegner, C., Shephard, 807 G.E., Zastrozhnov, D., et al. 2015. The ocean-continent transition in the mid-Norwegian 808 margin: Insight from seismic data and an onshore Caledonian field analogue. Geology, 43, 809 1011-1014. 810
811 Bastow, I.D. & Keir, D. 2011. The protracted development of the continent-ocean transition 812 in Afar. Nature Geosci, 4, 248-250. 813
814 Bastow, I.D., Booth, A.D., Corti, G., Keir, D., Magee, C., Jackson, C.A.L., Warren, J., 815 Wilkinson, J., et al. 2018. The Development of Late‐Stage Continental Breakup: Seismic 816 Reflection and Borehole Evidence from the Danakil Depression, Ethiopia. 37, 2848-2862. 817
818 Bodvarsson, G. & Walker, G. 1964. Crustal drift in Iceland. Geophysical Journal 819 International, 8, 285-300. 820
821 Bolli, H.M. 1974. Jurassic and Cretaceous Calcisphaerulidae from DSDP Leg 27, eastern 822 Indian Ocean. 823
824 Bridges, D.L., Mickus, K., Gao, S.S., Abdelsalam, M.G. & Alemu, A. 2012. Magnetic stripes 825 of a transitional continental rift in Afar. Geology, 40, 203-206. 826
827 Bronner, A., Sauter, D., Manatschal, G., Péron-Pinvidic, G. & Munschy, M. 2011. Magmatic 828 breakup as an explanation for magnetic anomalies at magma-poor rifted margins. Nature 829 Geoscience, 4, 549. 830
831 Causer, A., Pérez-Díaz, L., Adam, J. & Eagles, G. 2020. Uncertainties in break-up markers 832 along the Iberia–Newfoundland margins illustrated by new seismic data. Solid Earth, 11, 833 397-417. 834
835
34
Collier, J.S., McDermott, C., Warner, G., Gyori, N., Schnabel, M., McDermott, K. & Horn, 836 B.W. 2017. New constraints on the age and style of continental breakup in the South Atlantic 837 from magnetic anomaly data. Earth and Planetary Science Letters, 477, 27-40. 838
839 Colwell, J., Symonds, P. & Crawford, A. 1994. The nature of the Wallaby (Cuvier) Plateau 840 and other igneous provines of the west Australian margin. Journal of Australian Geology and 841 Geophysics, 15, 137-156. 842
843 Compton, J., Mallinson, D., Netranatawong, T. & Locker, D. 1992. Regional correlation of 844 mineralogy and diagenesis of sediment from the Exmouth Plateau and Argo Basin, 845 Northwestern Australian Continental Margin. 846
847 Corti, G., Agostini, A., Keir, D., Van Wijk, J., Bastow, I.D. & Ranalli, G. 2015. Magma-848 induced axial subsidence during final-stage rifting: Implications for the development of 849 seaward-dipping reflectors. Geosphere, 11, 563-571. 850
851 Crawford, A.J. & von Rad, U. 1994. The petrology, geochemistry and implications of basalts 852 dredged from the Rowley Terrace-Scott Plateau and Exmouth Plateau margins, northwestern 853 Australia. Journal of Australian Geology and Geophysics, 15, 43-54. 854
855 Czarnota, K., Hoggard, M., White, N. & Winterbourne, J. 2013. Spatial and temporal patterns 856 of Cenozoic dynamic topography around Australia. Geochemistry, Geophysics, Geosystems, 857 14, 634-658. 858
859 Dadd, K.A., Kellerson, L., Borissova, I. & Nelson, G. 2015. Multiple sources for volcanic 860 rocks dredged from the Western Australian rifted margin. Marine Geology, 368, 42-57. 861
862 Daniell, J., Jorgensen, D., Anderson, T., Borissova, I., Burq, S., Heap, A., Hughes, D., 863 Mantle, D., et al. 2009. Frontier basins of the West Australian continental margin. 864 Geoscience Australia Record, 38, 243. 865
866 Daniels, K.A., Bastow, I.D., Keir, D., Sparks, R.S.J. & Menand, T. 2014. Thermal models of 867 dyke intrusion during development of continent–ocean transition. Earth and Planetary 868 Science Letters, 385, 145-153. 869
870 Direen, N.G., Stagg, H.M.J., Symonds, P.A. & Colwell, J.B. 2008. Architecture of volcanic 871 rifted margins: new insights from the Exmouth – Gascoyne margin, Western Australia. 872 Australian Journal of Earth Sciences, 55, 341-363. 873
874 Direen, N.G., Borissova, I., Stagg, H., Colwell, J.B. & Symonds, P.A. 2007. Nature of the 875 continent–ocean transition zone along the southern Australian continental margin: a 876 comparison of the Naturaliste Plateau, SW Australia, and the central Great Australian Bight 877 sectors. Geological Society, London, Special Publications, 282, 239-263. 878
879
35
Eagles, G., Pérez-Díaz, L. & Scarselli, N. 2015. Getting over continent ocean boundaries. 880 Earth-Science Reviews, 151, 244-265. 881
882 Ebinger, C.J. & Casey, M. 2001. Continental breakup in magmatic provinces: An Ethiopian 883 example. Geology, 29, 527. 884
885 Eittreim, S.L., Gnibidenko, H., Helsley, C.E., Sliter, R., Mann, D. & Ragozin, N. 1994. 886 Oceanic crustal thickness and seismic character along a central Pacific transect. Journal of 887 Geophysical Research: Solid Earth, 99, 3139-3145. 888
889 Eldholm, O., Thiede, J. & Taylor, E. 1989. The Norwegian continental margin: tectonic, 890 volcanic, and paleoenvironmental framework. Proceedings of the ocean drilling program, 891 Scientific results. Citeseer, 5-26. 892
893 Eldholm, O., Thiede, J., Taylor, E. & Party, S.S. 1987. Summary and preliminary 894 conclusions, ODP Leg 104. Proceedings of the Ocean Drilling Program, Scientific Results. 895 Ocean Drilling Program College Station, Texas, 751-771. 896
897 Falvey, D. & Veevers, J. 1974. Physiography of the Exmouth and Scott plateaus, western 898 Australia, and adjacent northeast Wharton Basin. Marine Geology, 17, 21-59. 899
900 Geoffroy, L., Callot, J.P., Scaillet, S., Skuce, A., Gélard, J., Ravilly, M., Angelier, J., Bonin, 901 B., et al. 2001. Southeast Baffin volcanic margin and the North American‐Greenland plate 902 separation. Tectonics, 20, 566-584. 903
904 Gibbons, A.D., Barckhausen, U., den Bogaard, P., Hoernle, K., Werner, R., Whittaker, J.M. 905 & Müller, R.D. 2012. Constraining the Jurassic extent of Greater India: Tectonic evolution of 906 the West Australian margin. Geochemistry, Geophysics, Geosystems, 13. 907
908 Goncharov, A. & Nelson, G. 2012. From two way time to depth and pressure for 909 interpretation of seismic velocities offshore: Methodology and examples from the Wallaby 910 Plateau on the West Australian margin. Tectonophysics, 572, 26-37. 911
912 Gradstein, F. & Ogg, J. 2012. The chronostratigraphic scale The geologic time scale. 913 Elsevier, 31-42. 914
915 Harkin, C., Kusznir, N., Roberts, A., Manatschal, G. & Horn, B. 2020. Origin, composition 916 and relative timing of seaward dipping reflectors on the Pelotas rifted margin. Marine and 917 petroleum geology, 114, 104235. 918
919 Hayward, N. & Ebinger, C. 1996. Variations in the along‐axis segmentation of the Afar Rift 920 system. Tectonics, 15, 244-257. 921
922

36
Heine, C. & Müller, R. 2005. Late Jurassic rifting along the Australian North West Shelf: 923 margin geometry and spreading ridge configuration. Australian Journal of Earth Sciences, 924 52, 27-39. 925
926 Hey, R. 1977. A new class of “pseudofaults” and their bearing on plate tectonics: A 927 propagating rift model. Earth and Planetary Science Letters, 37, 321-325. 928
929 Hinz, K. 1981. A hypothesis on terrestrial catastrophies Wedges of very thick oceanward 930 dipping layers beneath passive continental margins. Their origin and paleoenvironmental 931 significance. Geologisches Jahrbuch. Reihe E, Geophysik, 3-28. 932
933 Hofmann, A. 2014. Sampling mantle heterogeneity through oceanic basalts: Isotopes and 934 trace elements. In: RW, C. (ed) The Mantle and Core, Treatise on Geochemistry. Elsevier-935 Pergamon, Oxford, 67-101. 936
937 Holbourn, A.E. & Kaminski, M.A. 1995. Lower Cretaceous benthic foraminifera from DSDP 938 Site 263: micropalaeontological constraints for the early evolution of the Indian Ocean. 939 Marine Micropaleontology, 26, 425-460. 940
941 Holford, S.P., Schofield, N., Jackson, C.A.L., Magee, C., Green, P.F. & Duddy, I.R. 2013. 942 Impacts of igneous intrusions on source and reservoir potential in prospective sedimentary 943 basins along the western Australian continental margin. In: Keep, M. & Moss, S.J. (eds) The 944 Sedimentary Basins of Western Australia IV. Proceedings of the Petroleum Exploration 945 Society of Australia Symposium, Perth, WA. 946
947 Hopper, J.R., Mutter, J.C., Larson, R.L. & Mutter, C.Z. 1992. Magmatism and rift margin 948 evolution: Evidence from northwest Australia. Geology, 20, 853-857. 949
950 Karson, J.A. 2019. From Ophiolites to Oceanic Crust: Sheeted Dike Complexes and Seafloor 951 Spreading. In: Srivastava, R., Ernst, R. & Peng, P. (eds) Dyke Swarms of the World: A 952 Modern Perspective. Springer, 459-492. 953
954 Keranen, K., Klemperer, S., Gloaguen, R. & Group, E.W. 2004. Three-dimensional seismic 955 imaging of a protoridge axis in the Main Ethiopian rift. Geology, 32, 949-952. 956
957 Larsen, H. & Saunders, A. 1998. 41. Tectonism and volcanism at the Southeast Greenland 958 rifted margin: a record of plume impact and later continental rupture. Proceedings of the 959 Ocean Drilling Program, Scientific Results, 503-533. 960
961 Larsen, H., Saunders, A. & Clift, P. 1994a. Proceedings of the Ocean Drilling Program, 962 Initial Reports. Ocean Drilling Program, College Station, Texas, 1-152. 963
964

37
Larsen, H., Saunders, A., Larsen, L. & Lykke-Andersen, H. 1994b. ODP activities on the 965 South-East Greenland margin: Leg 152 drilling and continued site surveying. Rapport 966 Grønlands Geologiske Undersøgelse, 160, 75-81. 967
968 Larson, R.L., Mutter, J.C., Diebold, J.B., Carpenter, G.B. & Symonds, P. 1979. Cuvier Basin: 969 a product of ocean crust formation by Early Cretaceous rifting off Western Australia. Earth 970 and Planetary Science Letters, 45, 105-114. 971
972 Lenoir, X., Féraud, G. & Geoffroy, L. 2003. High-rate flexure of the East Greenland volcanic 973 margin: constraints from 40Ar/39Ar dating of basaltic dykes. Earth and Planetary Science 974 Letters, 214, 515-528. 975
976 Longley, I., Buessenschuett, C., Clydsdale, L., Cubitt, C., Davis, R., Johnson, M., Marshall, 977 N., Murray, A., et al. 2002. The North West Shelf of Australia–a Woodside perspective. The 978 sedimentary basins of Western Australia, 3, 27-88. 979
980 Mackenzie, G., Thybo, H. & Maguire, P. 2005. Crustal velocity structure across the Main 981 Ethiopian Rift: results from two-dimensional wide-angle seismic modelling. Geophysical 982 Journal International, 162, 994-1006. 983
984 MacLeod, S.J., Williams, S.E., Matthews, K.J., Müller, R.D. & Qin, X. 2017. A global 985 review and digital database of large-scale extinct spreading centers. Geosphere, 13, 911-949. 986
987 Maguire, P., Keller, G., Klemperer, S., Mackenzie, G., Keranen, K., Harder, S., O Reilly, B., 988 Thybo, H., et al. 2006. Crustal structure of the northern Main Ethiopian Rift from the 989 EAGLE controlled-source survey; a snapshot of incipient lithospheric break-up. Geological 990 Society, London, Special Publications, 259, 269. 991
992 Maus, S., Barckhausen, U., Berkenbosch, H., Bournas, N., Brozena, J., Childers, V., 993 Dostaler, F., Fairhead, J., et al. 2009. EMAG2: A 2–arc min resolution Earth Magnetic 994 Anomaly Grid compiled from satellite, airborne, and marine magnetic measurements. 995 Geochemistry, Geophysics, Geosystems, 10. 996
997 McDermott, C., Lonergan, L., Collier, J.S., McDermott, K.G. & Bellingham, P. 2018. 998 Characterization of Seaward‐Dipping Reflectors Along the South American Atlantic Margin 999 and Implications for Continental Breakup. Tectonics, 37, 3303-3327. 1000
1001 McDermott, C., Collier, J.S., Lonergan, L., Fruehn, J. & Bellingham, P. 2019. Seismic 1002 velocity structure of seaward-dipping reflectors on the South American continental margin. 1003 Earth and Planetary Science Letters, 521, 14-24. 1004
1005 Menard, H. 1969. Elevation and subsidence of oceanic crust. Earth and Planetary Science 1006 Letters, 6, 275-284. 1007
1008
38
Menzies, M., Klemperer, S., Ebinger, C. & Baker, J. 2002. Characteristics of volcanic rifted 1009 margins. In: Menzies, M., Klemperer, S., Ebinger, C. & Baker, J. (eds) Volcanic Rifted 1010 Margins, Special Publications. Geological Society of America, 362, 1-14. 1011
1012 Meyer, B., Chulliat, A. & Saltus, R. 2017. Derivation and error analysis of the Earth 1013 Magnetic Anomaly Grid at 2 arc min Resolution Version 3 (EMAG2v3). Geochemistry, 1014 Geophysics, Geosystems, 18, 4522-4537. 1015
1016 Mihut, D. & Müller, R.D. 1998. Volcanic margin formation and Mesozoic rift propagators in 1017 the Cuvier Abyssal Plain off Western Australia. Journal of Geophysical Research, 103, 1018 27149. 1019
1020 Moulin, M., Aslanian, D. & Unternehr, P. 2010. A new starting point for the South and 1021 Equatorial Atlantic Ocean. Earth-Science Reviews, 98, 1-37. 1022
1023 Mutter, J.C., Talwani, M. & Stoffa, P.L. 1982. Origin of seaward-dipping reflectors in 1024 oceanic crust off the Norwegian margin by “subaerial sea-floor spreading”. Geology, 10, 353-1025 357. 1026
1027 Norcliffe, J.R., Paton, D.A., Mortimer, E.J., McCaig, A.M., Nicholls, H., Rodriguez, K., 1028 Hodgson, N. & Van Der Spuy, D. 2018. Laterally Confined Volcanic Successions (LCVS); 1029 recording rift-jumps during the formation of magma-rich margins. Earth and Planetary 1030 Science Letters, 504, 53-63. 1031
1032 Olierook, H.K., Merle, R.E., Jourdan, F., Sircombe, K., Fraser, G., Timms, N.E., Nelson, G., 1033 Dadd, K.A., et al. 2015. Age and geochemistry of magmatism on the oceanic Wallaby 1034 Plateau and implications for the opening of the Indian Ocean. Geology, 43, 971-974. 1035
1036 Oosting, A., Leereveld, H., Dickens, G., Henderson, R. & Brinkhuis, H. 2006. Correlation of 1037 Barremian-Aptian (mid-Cretaceous) dinoflagellate cyst assemblages between the Tethyan 1038 and Austral realms. Cretaceous Research, 27, 792-813. 1039
1040 Parsons, B. & Sclater, J.G. 1977. An analysis of the variation of ocean floor bathymetry and 1041 heat flow with age. Journal of Geophysical Research, 82, 803-827. 1042
1043 Paton, D., Pindell, J., McDermott, K., Bellingham, P. & Horn, B. 2017. Evolution of 1044 seaward-dipping reflectors at the onset of oceanic crust formation at volcanic passive 1045 margins: Insights from the South Atlantic. Geology, 45, 439-442. 1046
1047 Peron-Pinvidic, G., Manatschal, G. & Participants, a.t.I.R.W. 2019. Rifted margins: state of 1048 the art and future challenges. Frontiers in Earth Science, 7, 8. 1049
1050
39
Phipps-Morgan, J. & Chen, Y.J. 1993. The genesis of oceanic crust: Magma injection, 1051 hydrothermal circulation, and crustal flow. Journal of Geophysical Research: Solid Earth, 1052 98, 6283-6297. 1053
1054 Pickup, S., Whitmarsh, R., Fowler, C. & Reston, T. 1996. Insight into the nature of the 1055 ocean-continent transition off West Iberia from a deep multichannel seismic reflection 1056 profile. Geology, 24, 1079-1082. 1057
1058 Plank, T. & Langmuir, C.H. 1998. The chemical composition of subducting sediment and its 1059 consequences for the crust and mantle. Chemical Geology, 145, 325-394. 1060
1061 Planke, S. & Eldholm, O. 1994. Seismic response and construction of seaward dipping 1062 wedges of flood basalts: Vøring volcanic margin. Journal of Geophysical Research: Solid 1063 Earth, 99, 9263-9278. 1064
1065 Planke, S., Symonds, P.A., Alvestad, E. & Skogseid, J. 2000. Seismic volcanostratigraphy of 1066 large‐volume basaltic extrusive complexes on rifted margins. Journal of Geophysical 1067 Research: Solid Earth, 105, 19335-19351. 1068
1069 Rabinowitz, P.D. & LaBrecque, J. 1979. The Mesozoic South Atlantic Ocean and evolution 1070 of its continental margins. Journal of Geophysical Research: Solid Earth, 84, 5973-6002. 1071
1072 Robb, M.S., Taylor, B. & Goodliffe, A.M. 2005. Re-examination of the magnetic lineations 1073 of the Gascoyne and Cuvier Abyssal Plains, off NW Australia. Geophysical Journal 1074 International, 163, 42-55. 1075
1076 Roberts, D., Backman, J., Morton, A., Murray, J. & Keene, J. 1984. Evolution of volcanic 1077 rifted margins – synthesis of leg-81 results on the West margin of Rockall Plateau. 1078
1079 Robinson, P.T., Thayer, P., Cook, P., McKnight, B. & et al. 1974. Lithology of Mesozoic and 1080 Cenozoic sediments of the eastern Indian Ocean, Leg 27, Deep Sea Drilling Project. 1081
1082 Rooney, T.O., Bastow, I.D., Keir, D., Mazzarini, F., Movsesian, E., Grosfils, E.B., 1083 Zimbelman, J.R., Ramsey, M.S., et al. 2014. The protracted development of focused 1084 magmatic intrusion during continental rifting. Tectonics, 33, 875-897. 1085
1086 Rudnick, R.L. & Fountain, D.M. 1995. Nature and composition of the continental crust: a 1087 lower crustal perspective. Reviews of Geophysics, 33, 267-309. 1088
1089 Sayers, J., Borissova, I., Ramsay, D. & Symonds, P. 2002. Geological framework of the 1090 Wallaby Plateau and adjacent areas. 1091
1092
40
Scheibnerová, V. 1974. Aptian–Albian benthonic foraminifera from DSDP Leg 27, Sites 259, 1093 260 and 263, Eastern Indian Ocean. 1094
1095 Skogseid, J., Pedersen, T., Eldholm, O. & Larsen, B.T. 1992. Tectonism and magmatism 1096 during NE Atlantic continental break-up: the Voring Margin. Geological Society, London, 1097 Special Publications, 68, 305-320. 1098
1099 Skogseid, J., Planke, S., Faleide, J.I., Pedersen, T., Eldholm, O. & Neverdal, F. 2000. NE 1100 Atlantic continental rifting and volcanic margin formation. In: Nottvedt, A. (ed) Dynamics of 1101 the Norwegian Margin. Geological Society, London, Special Publications, London, 167, 295-1102 326. 1103
1104 Stagg, H., Alcock, M., Bernardel, G., Moore, A., Symonds, P. & Exon, N. 2004. Geological 1105 framework of the outer Exmouth Plateau and adjacent ocean basins. Geoscience Australia. 1106
1107 Stein, C.A. & Stein, S. 1992. A model for the global variation in oceanic depth and heat flow 1108 with lithospheric age. Nature, 359, 123. 1109
1110 Stilwell, J., Quilty, P. & Mantle, D. 2012. Paleontology of Early Cretaceous deep-water 1111 samples dredged from the Wallaby Plateau: new perspectives of Gondwana break-up along 1112 the Western Australian margin. Australian Journal of Earth Sciences, 59, 29-49. 1113
1114 Symonds, P.A., Planke, S., Frey, O. & Skogseid, J. 1998. Volcanic evolution of the Western 1115 Australian Continental Margin and its implications for basin development. The Sedimentary 1116 Basins of Western Australia 2: Proc. of Petroleum Society Australia Symposium, Perth, WA. 1117
1118 Talwani, M. & Eldholm, O. 1973. Boundary between continental and oceanic crust at the 1119 margin of rifted continents. Nature, 241, 325. 1120
1121 Tian, X. & Buck, W.R. 2019. Lithospheric thickness of volcanic rifting margins: Constraints 1122 from seaward dipping reflectors. Journal of Geophysical Research: Solid Earth, 124, 3254-1123 3270. 1124
1125 Tischer, M. 2006. The structure and development of the continent-ocean transition zone of 1126 the Exmouth Plateau and Cuvier margin, Northwest Australia: implications for extensional 1127 strain partitioning. PhD, Columbia University. 1128
1129 Veevers, J. 1986. Breakup of Australia and Antarctica estimated as mid-Cretaceous (95±5 1130 Ma) from magnetic and seismic data at the continental margin. Earth and Planetary Science 1131 Letters, 77, 91-99. 1132
1133 Veevers, J. & Johnstone, M. 1974. Comparative stratigraphy and structure of the western 1134 Australian margin and the adjacent deep ocean floor. Initial Reports of the Deep Sea Drilling 1135 Project, 27, 571-585. 1136
41
1137 Vine, F.J. 1966. Spreading of the ocean floor: new evidence. Science, 154, 1405-1415. 1138
1139 Vine, F.J. & Matthews, D.H. 1963. Magnetic anomalies over oceanic ridges. Nature, 199, 1140 947-949. 1141
1142 Wiseman, J.F. & Williams, A. 1974. Palynological investigation of samples from sites 259, 1143 261, and 263, Leg 27, Deep Sea Drilling Project. 1144
1145
1146
1147
1148
1149
1150
1151
1152
1153
1154
1155
1156
1157
1158
1159
1160
1161
1162
1163
1164
1165
1166
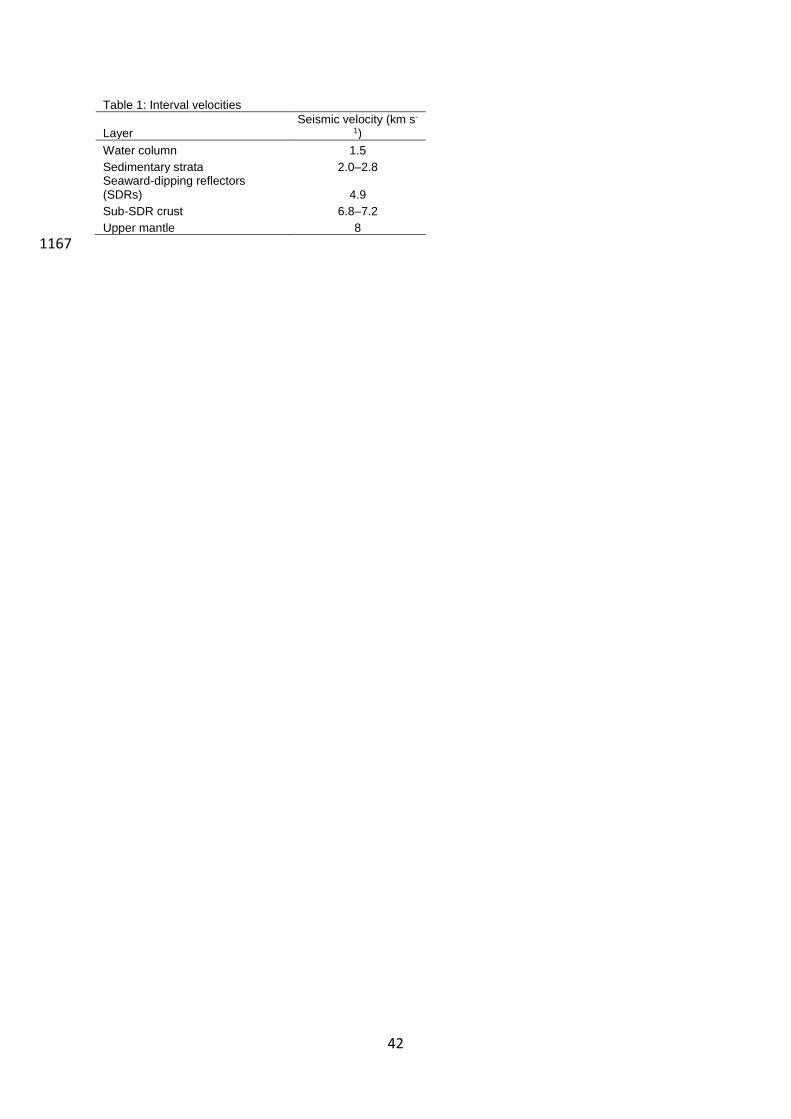
42
Table 1: Interval velocities
Layer Seismic velocity (km s-
1)
Water column 1.5
Sedimentary strata 2.0–2.8 Seaward-dipping reflectors (SDRs) 4.9
Sub-SDR crust 6.8–7.2
Upper mantle 8
1167
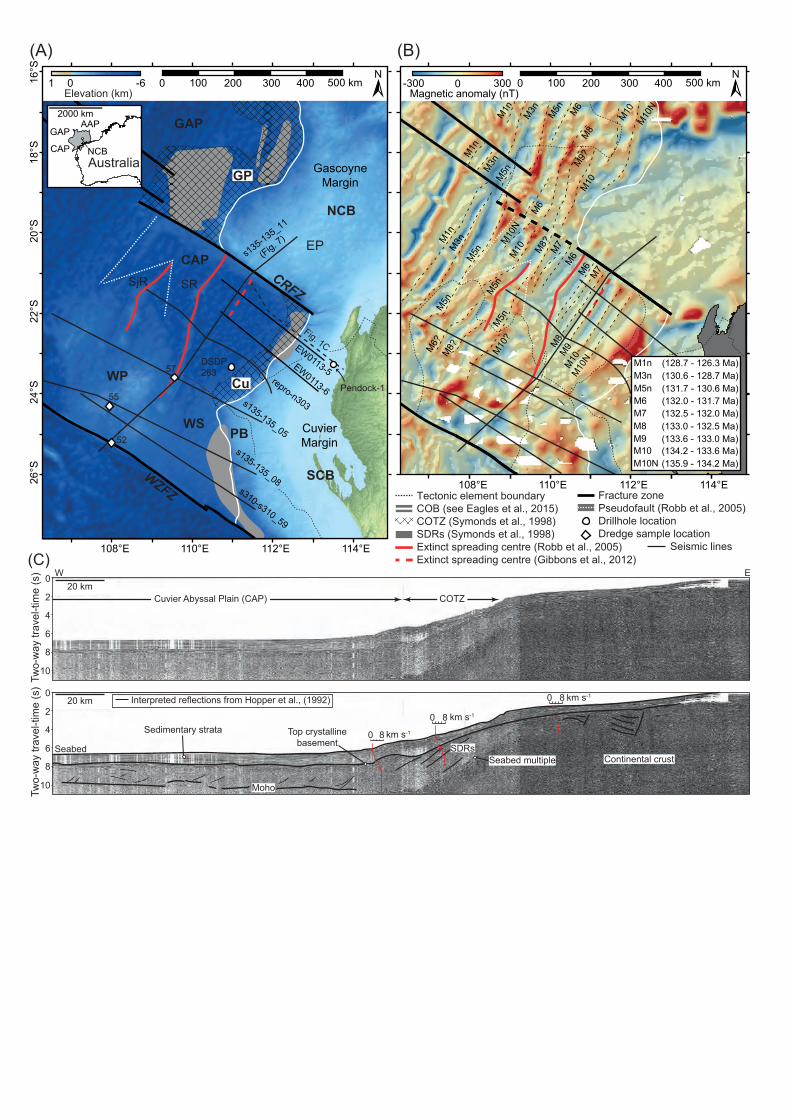
(C)0
2
4
6
8
10
Two-
way
trav
el-ti
me
(s) W E
20 km
0
2
4
6
8
10
Two-
way
trav
el-ti
me
(s)
20 km
Seabed
Top crystallinebasement
0 8 km s-1
0 8 km s-1
0 8 km s-1
Seabed multiple
Moho
SDRs
Interpreted reflections from Hopper et al., (1992)
Sedimentary strata
Continental crust
108°E 110°E 112°E 114°E
0 100 200 300 400 500 km-300 0 300Magnetic anomaly (nT)
N
M10N
M10M9
M7
M8
M6M6M7M8?
M10
M10N
M5nM5n
M10N
M8
M6
M10M9?
M10M6
M5n
M5n
M1n
M3nM1n
M1nM3n
M5n
(B)
M8?M6?
M10?
M10N M10 M9 M8 M7 M6 M5n M3n M1n
(135.9 - 134.2 Ma) (134.2 - 133.6 Ma) (133.6 - 133.0 Ma) (133.0 - 132.5 Ma) (132.5 - 132.0 Ma) (132.0 - 131.7 Ma) (131.7 - 130.6 Ma) (130.6 - 128.7 Ma) (128.7 - 126.3 Ma)
M5nM3n
108°E 110°E 112°E 114°E
26°S
24°S
22°S
20°S
18°S
16°S
001 -6 100 200 300 400 500 kmN
EW0113-6
EW0113-5DSDP26357
Elevation (km)
(A)
Fig. 1C
CRFZ
AAPGAP
CAP
2000 km
NCBAustralia
NCB
SCB
PB
WP
WZFZ
SRSjR
WS
CAP
GAP
GP
Cu repro-n303s135-135_05
s135-135_08s310-s310_59
s135-135_11
(Fig. 7)
55
GascoyneMargin
CuvierMargin
Pendock-1
52
Tectonic element boundaryCOB (see Eagles et al., 2015)COTZ (Symonds et al., 1998)SDRs (Symonds et al., 1998)Extinct spreading centre (Robb et al., 2005)Extinct spreading centre (Gibbons et al., 2012)
Fracture zonePseudofault (Robb et al., 2005)Drillhole locationDredge sample location Seismic lines
EP
Cuvier Abyssal Plain (CAP) COTZ
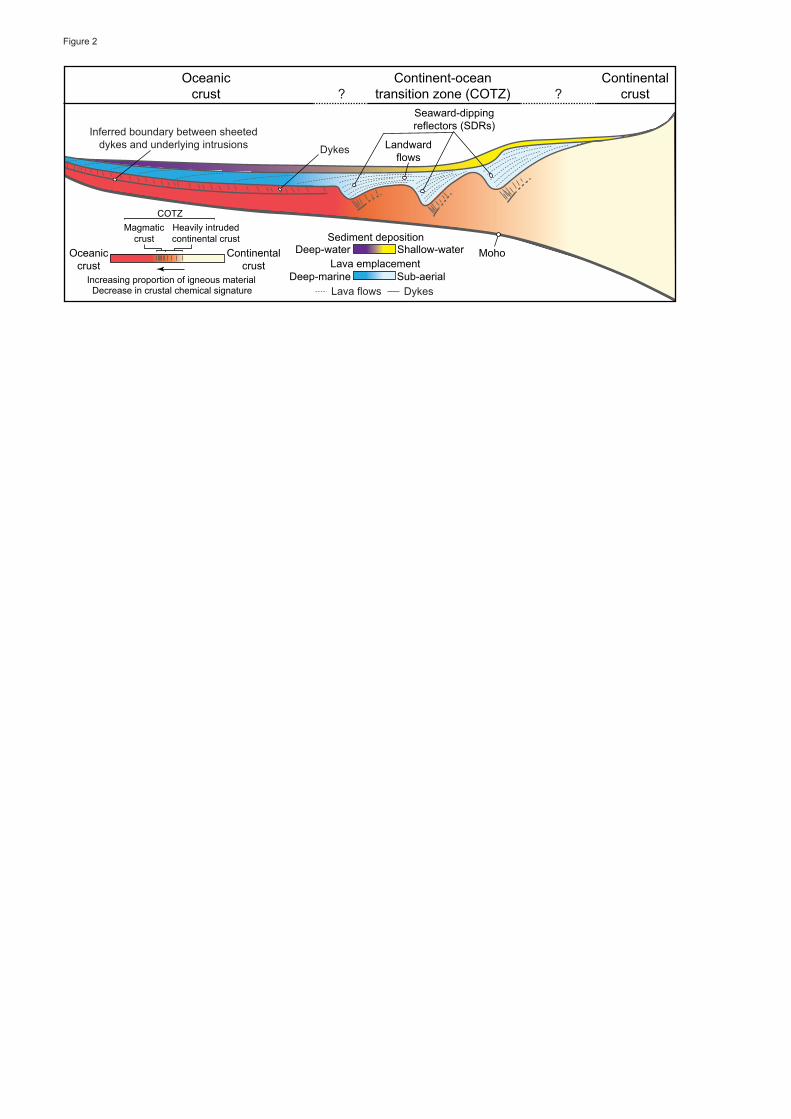
Oceaniccrust
Continent-oceantransition zone (COTZ)
Continentalcrust
Seaward-dippingreflectors (SDRs)
Landwardflows
Moho
Figure 2
? ?
Sediment depositionDeep-water Shallow-water
Deep-marine Sub-aerialLava emplacement
Lava flows Dykes
Oceaniccrust
Continentalcrust
Increasing proportion of igneous materialDecrease in crustal chemical signature
Magmaticcrust
Heavily intrudedcontinental crust
COTZ
DykesInferred boundary between sheeted
dykes and underlying intrusions

Rhaetian
Sinemurian
Pliensbachian
Toarcian
AalenianBajocian
BathonianCallovianOxfordian
Tithonian
Kimmeridgian
Berriasian
Valanginian
Hauterivian
Barremian
Aptian
Albian
Cenomanian
Hettangian
Upp
erLo
wer
Mid
dle
Upp
erLo
wer
Upp
er
Tria
ssic
Jura
ssic
Cre
tace
ous
Exmouth Plateau Cuvier Margin Stratigraphy Tectonic Events
Ma
GearleSiltstone
WindaliaRadiolarite
MuderongShale
BirdrongSandstone
DingoClaystone
AtholFormation
MuratSiltstone
North Rankin Formation
BrigadierFormation
Learmonth Form
ation
Sandstone
Siltstone
Sandstone/Siltstone
Sandstone/Claystone
Radiolarite Terrestrial
Claystone
FluviodeltaicShallow Marine (Clastic)
Offshore Marine (Clastic)
Eroded/condensed
Lithology Depositional environment
Offshore Marine (Low sediment input)
200
180
160
140
120
100
Chronostratigraphicage
BarrowGroup
Winning G
roup
Rifting
Rifting
Gascoyne Cuvier
CO
TZ
CO
TZ
Break-up
Break-up
(A) (B)
200
300
400
500
600
700
T.D. 746
Dep
th (m
)
Claystone
Birdrong Sandstone
Siltstone/Claystone
Siltstone
Shallowest recordedHyperamina spp.
DSDP 263 Pendock-1
800
850
Figure 3
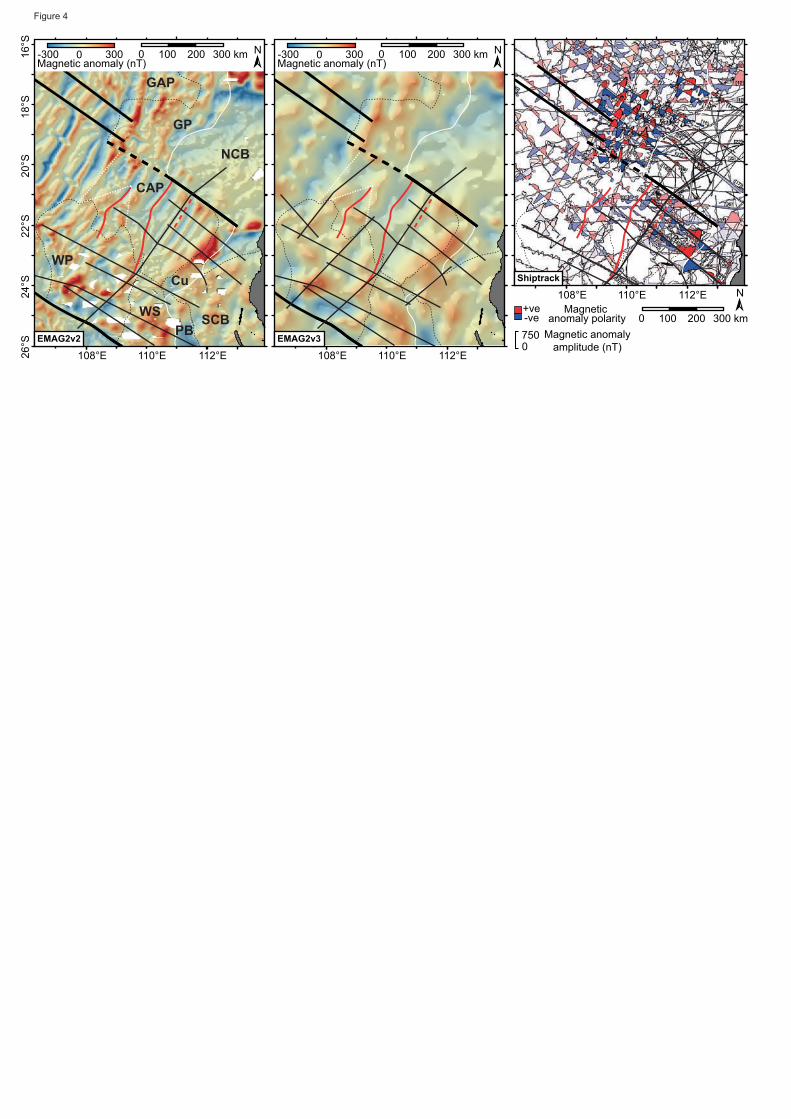
Figure 426
°S24
°S22
°S20
°S18
°S16
°S
108°E 110°E 112°E
0 100 200 300 km-300 0 300Magnetic anomaly (nT)
N
EMAG2v2
108°E 110°E 112°E
0 100 200 300 km-300 0 300Magnetic anomaly (nT)
N
EMAG2v3
108°E 110°E 112°EShiptrack
+ve-ve
Magnetic anomaly polarity
0750 Magnetic anomaly
amplitude (nT)
0 100 200 300 km
N
NCB
SCBPB
WP
WS
CAP
GAP
GP
Cu
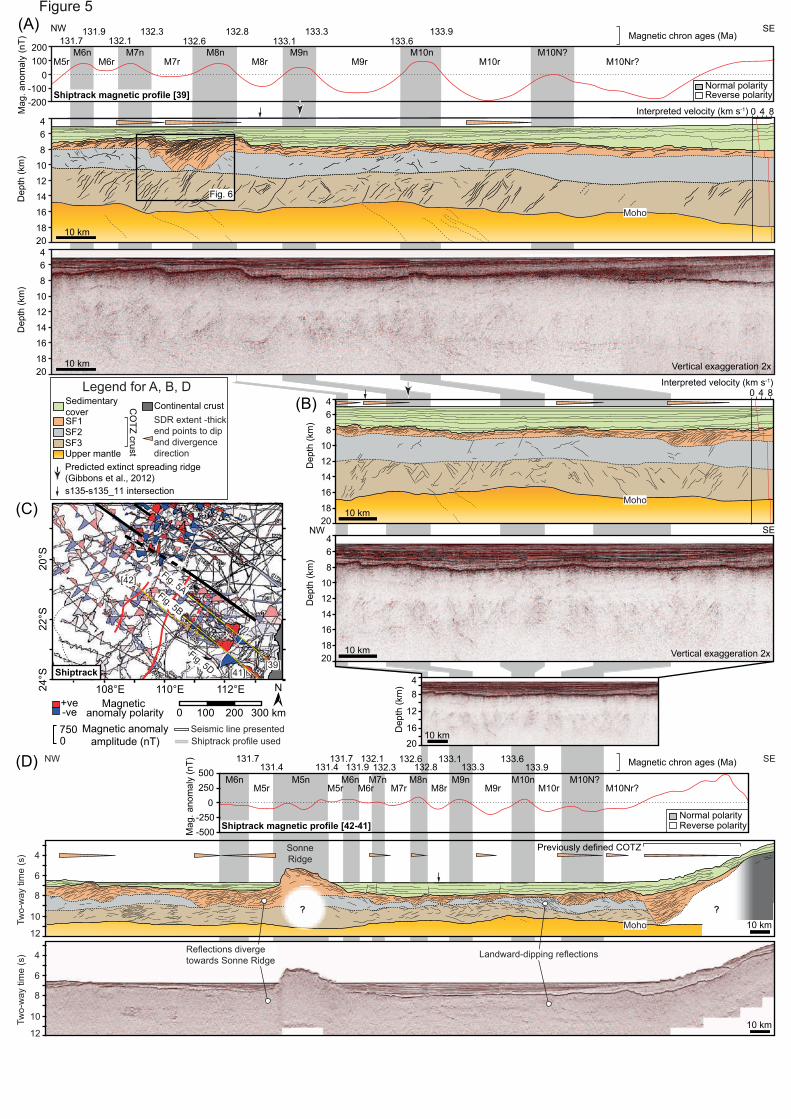
Previously defined COTZ
12
10
8
6
4
10 kmTwo-
way
tim
e (s
)
12
10
8
6
4
10 kmTwo-
way
tim
e (s
)
NW SE
?
SonneRidge
(D)
(C)
M5rM6n M10n
M9rM9n
M8rM8n
M6rM7n
M7rM6n
M5rM5n
M10r M10Nr?M10N?
131.7131.7131.9131.4131.4
132.1132.3
132.6132.8
133.1133.3
133.6133.9
Normal polarityReverse polarity
500250
0-250-500M
ag. a
nom
aly
(nT)
Shiptrack magnetic profile [42-41]
10 km
48
12
1620
Dep
th (k
m)
(B)
10 km
10 km
NW SE
468
101214161820
Dep
th (k
m)
468
101214161820
Dep
th (k
m)
0 4 8Interpreted velocity (km s-1)
M5rM6n
M6rM7n
M7rM8n
M8rM9n
M9rM10n
M10r M10Nr?M10N?
131.7131.9
132.1132.3
132.6132.8
133.1133.3
133.6133.9 Magnetic chron ages (Ma)
Normal polarityReverse polarity
200100
0-100-200
Mag
. ano
mal
y (n
T)
10 km
10 km
NW SE
468
101214161820
Dep
th (k
m)
468
101214161820
Dep
th (k
m)
0 4 8Interpreted velocity (km s-1)
(A)
Vertical exaggeration 2x
Fig. 6
Shiptrack magnetic profile [39]
Magnetic chron ages (Ma)
Vertical exaggeration 2x
SedimentarycoverSF1SF2
CO
TZ crust
SF3Upper mantlePredicted extinct spreading ridge (Gibbons et al., 2012)
Continental crustSDR extent -thick end points to dipand divergencedirection
Legend for A, B, D
s135-s135_11 intersection
108°E 110°E 112°EShiptrack
+ve-ve
Magnetic anomaly polarity
0750 Magnetic anomaly
amplitude (nT)
0 100 200 300 km
N
[42]
[39][41]
24°S
22°S
20°S
Fig. 5AFig. 5B
Fig. 5D
Seismic line presentedShiptrack profile used
?
Figure 5
Landward-dipping reflections
Moho
Moho
Moho
Reflections diverge towards Sonne Ridge
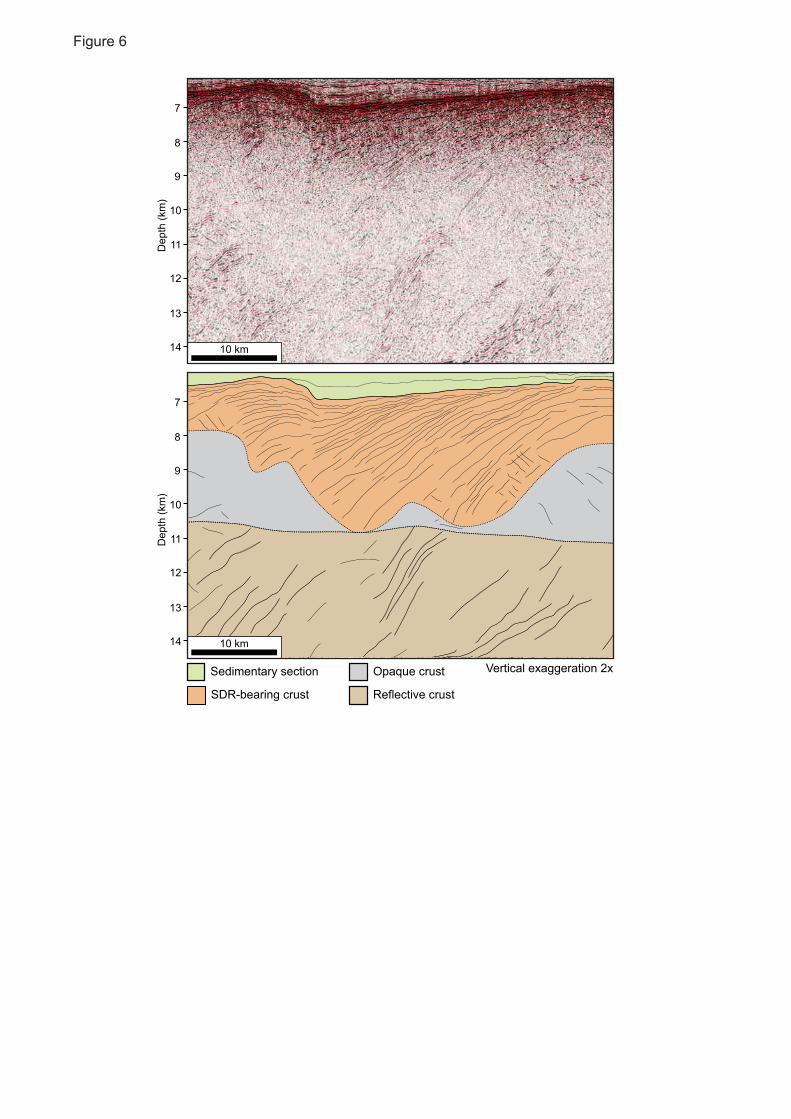
10 km
7
8
9
10
11
12
13
14
Dep
th (k
m)
10 km
7
8
9
10
11
12
13
14
Dep
th (k
m)
Sedimentary section
SDR-bearing crust
Opaque crust
Reflective crust
Vertical exaggeration 2x
Figure 6
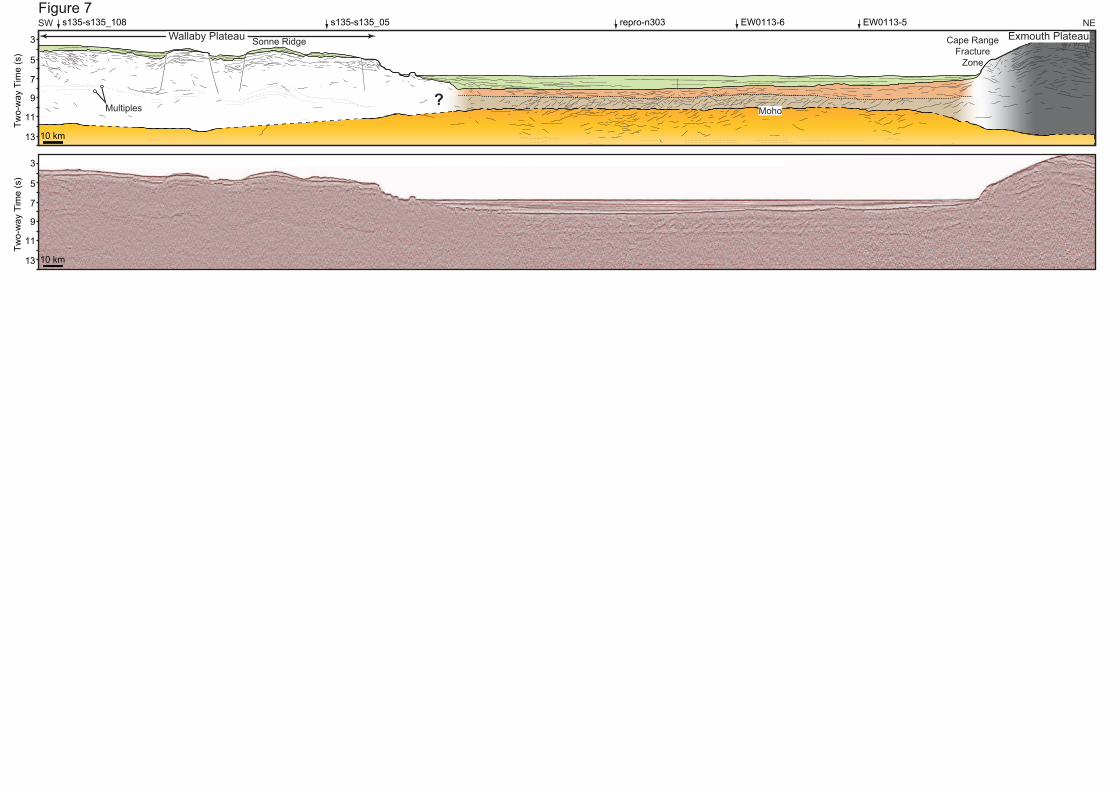
10 km
3
5
7
9
11
13
Two-
way
Tim
e (s
)
10 km
3
5
7
9
11
13
Two-
way
Tim
e (s
)SW NEs135-s135_05s135-s135_108 repro-n303 EW0113-6 EW0113-5
Wallaby Plateau Sonne Ridge Cape RangeFracture
Zone
Multiples ?
Exmouth Plateau
Figure 7
Moho
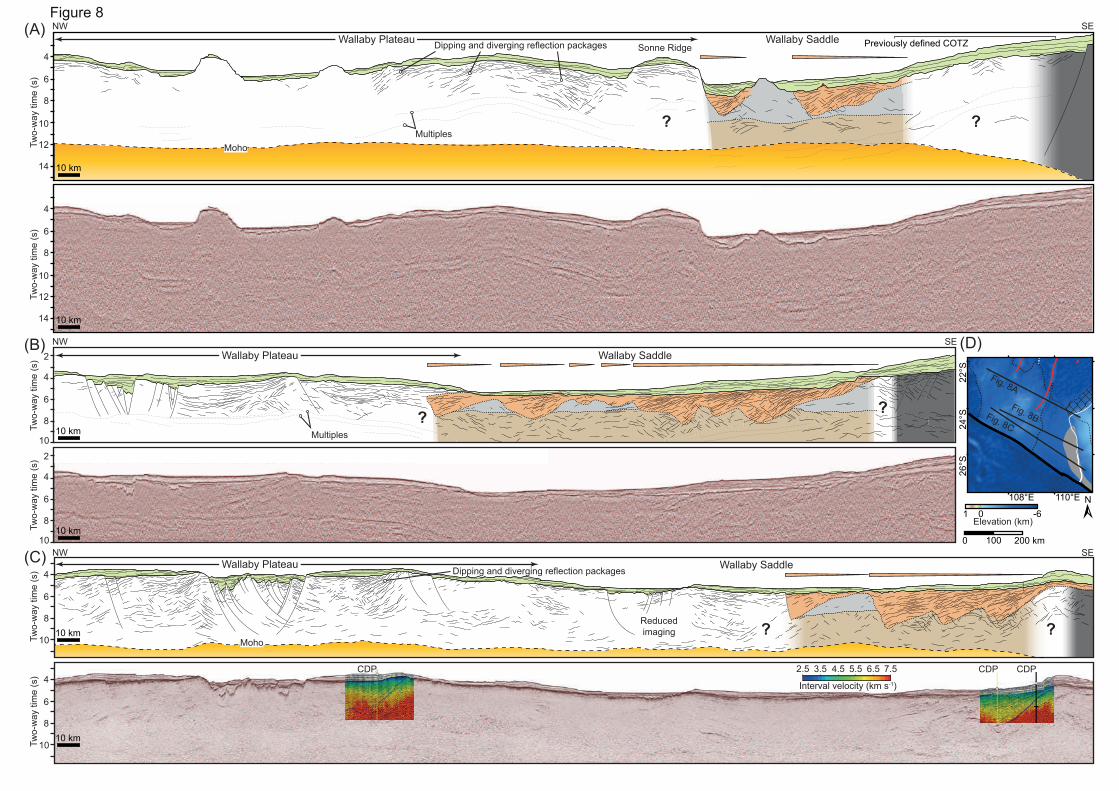
10 km10
8
6
4
Two-
way
tim
e (s
)
12
14
10
8
6
4
Two-
way
tim
e (s
)NW SE
12
14
10
8
6
4
Two-
way
tim
e (s
)
10 km
10 km
(A)
? ?
Sonne RidgeWallaby Saddle Previously defined COTZ
NW SE(B)
10 km10
8
6
4
2
Two-
way
tim
e (s
)
10 km10
8
6
4
2
Two-
way
tim
e (s
)
??
Wallaby Saddle
NW SE(C)
10 km10
8
6
4
Two-
way
tim
e (s
)
CDP CDP CDP
Interval velocity (km s-1)
2.5 3.5 4.5 5.5 6.5 7.5
??
0
01 -6
100 200 km
N
Elevation (km)
(D)
108°E 110°E
26°S
24°S
22°S
Fig. 8A
Wallaby Saddle
Wallaby Plateau
Wallaby Plateau
Wallaby Plateau
Multiples
Multiples
Figure 8
Fig. 8C
Fig. 8B
Dipping and diverging reflection packages
Dipping and diverging reflection packages
Moho
Moho
Reducedimaging
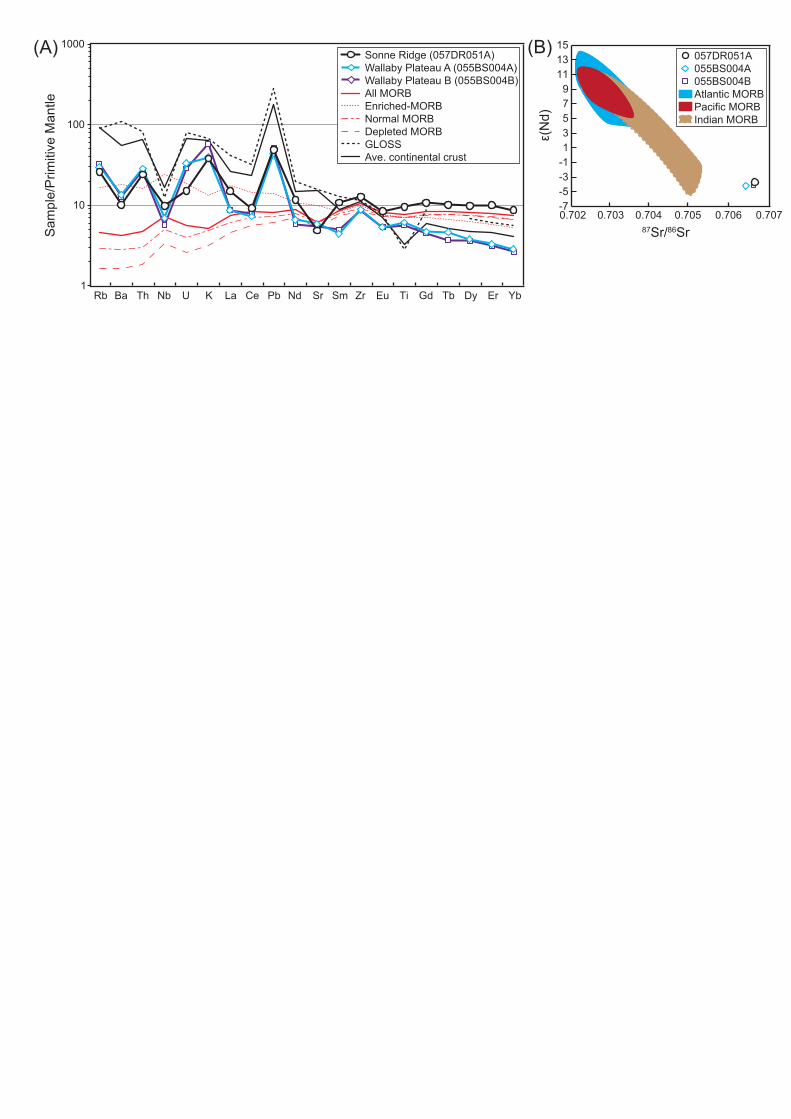
-7-5-3-113579
111315
0.702 0.703 0.704 0.705 0.706 0.707
1
10
100
1000Sa
mpl
e/Pr
imiti
ve M
antle
Rb Ba Th Nb U K La Ce Pb Nd Sr Sm Zr Eu Ti Gd Tb Dy Er Yb
Sonne Ridge (057DR051A)Wallaby Plateau A (055BS004A)Wallaby Plateau B (055BS004B)All MORBEnriched-MORBNormal MORBDepleted MORBGLOSSAve. continental crust
87Sr/86Sr
ε(N
d)
057DR051A055BS004A055BS004BAtlantic MORBPacific MORBIndian MORB
(A) (B)

?
N200 km
CRFZ
?
N200 km
CRFZ
N200 km
CRFZ
(B)
(C) (D)
Continental crust COTZ crust Oceanic crust
M10NM10M9M8
M7M6M5nSpreading ridge (active)
Spreading ridge (abandoned)Ridge jump boundaries (pseudofaults)
~134 Ma
~132 Ma ~130 Ma
108°E 110°E 112°E
22°S
20°S
18°S
16°S
200 km-300 0 300
Magnetic anomaly (nT)
Proposed COTZ
(A)
GM
GMGM
CM
CM
CM
SR
SjR
SR SR
Key for B-D
SR
SjR
PreviousCOB
Oldest CAPoceanic crust


