Embed Size (px)
Citation preview
1
Enhanced visualization of optimal cerebral perfusion pressure over time to 1 support clinical decision making 2 3 4 5
Marcel JH Aries, MD, PhD1 3 Robin Wesselink, MBChB 1 5 Jan Willem J Elting, MD, 6
PHD2 Joseph Donnelly, MBChB 3 Marek Czosnyka, PhD3 Ari Ercole, MB BChir, 7
PhD4 Natasha M Maurits, PhD2 6* & Peter Smielewski, PhD3* 8
9 10 1 Department of Intensive Care, University of Groningen, University Medical Center 11 Groningen, Groningen, The Netherlands 12 2 Department of Neurology, University of Groningen, University Medical Center 13 Groningen, Groningen, The Netherlands 14 3 Brain Physics Group, Department of Clinical Neurosciences, Addenbrooke’s Hospital, 15 University of Cambridge, Cambridge, UK 16 4 Division of Anaesthesia, University of Cambridge, Addenbrooke’s Hospital, Cambridge, 17 UK 18 5 Department of Technical Medicine, University of Twente, Enschede, The Netherlands 19 6 Research School of Behavioural and Cognitive Neurosciences, University of Groningen, 20 Groningen, the Netherlands 21 22
Correspondence: MJH Aries, Department of Critical Care, University of 23
Groningen, University Medical Centre, Hanzeplein 1, 9700 RB Groningen, The 24
Netherlands; Email: [email protected] 25
26
Key words: cerebral autoregulation, cerebral perfusion pressure management; 27
traumatic brain injury 28
29
Tables:…...0......; Figures:……2……….; Word count:…1902…….; Abstract 30
count:……298…. Number of references:……8………… 31
*Both authors contributed equally to the manuscript. 32
33
Final revised Manuscript
1 2 3 4 5 6 7 8 9 10 11 12 13 14 15 16 17 18 19 20 21 22 23 24 25 26 27 28 29 30 31 32 33 34 35 36 37 38 39 40 41 42 43 44 45 46 47 48 49 50 51 52 53 54 55 56 57 58 59 60 61 62 63 64 65
2
Conflicts of interest and sources of funding 1
2 3 Marcel Aries received an unrestricted grant from the Dutch Society of Intensive 4
Care. 5
Joseph Donnelly is supported by a Woolf Fisher Trust Scholarship. 6
The software for brain monitoring ICM+® (www.neurosurg.cam.ac.uk/imcplus) 7
is licensed by the University of Cambridge (Cambridge Enterprise). Peter 8
Smielewski and Marek Czosnyka have a financial interest in a part of the 9
licensing fee. 10
11 For the remaining authors none were declared. 12 13 14 Copyright form disclosures: Dr. Aries disclosed other support (The software 15 for brain monitoring ICM+® [www.neurosurg.cam.ac.uk/icmplus] is licensed by 16 the University of Cambridge [Cambridge Enterprise]. Peter Smielewski and 17 Marek Czosnyka have a financial interest in a part of the licensing fee). Dr. 18 Donnelly received funding from Woolf Fisher Trust, New Zealand (study 19 scholarship). Dr. Czosnyka disclosed other support (Integra Life sciences 20 Speakers Bureau - payment 1500Euro) and received funding from Cambridge 21 Enterprise Ltd, UK. Dr. Maurits received funding from Radboud University 22 Nijmegen. Her institution received funding from EU and from the Princess 23 Beatrix Foundation, the Netherlands. Dr. Smielewski disclosed other support (I 24 have a financial interest in the part of the licensing fees of the software, ICM+, 25 used in data collection and partial analysis for this project). The remaining 26 authors have disclosed that they do not have any potential conflicts of interest. 27
1 2 3 4 5 6 7 8 9 10 11 12 13 14 15 16 17 18 19 20 21 22 23 24 25 26 27 28 29 30 31 32 33 34 35 36 37 38 39 40 41 42 43 44 45 46 47 48 49 50 51 52 53 54 55 56 57 58 59 60 61 62 63 64 65
3
Abstract 1 2
Objective: Cerebrovascular reactivity can provide a continuously updated 3
individualised target for management of CPP, termed CPPopt. 4
Data Sources: Here we present a concept method of visualisation of 5
autoregulation based CPPopt using data of 4 severe TBI patients with ICP 6
monitoring. 7
Conclusions: The visualization method addresses some of the main drawbacks 8
of the original methodology and might bring the potential for its clinical 9
application closer. 10
11
1 2 3 4 5 6 7 8 9 10 11 12 13 14 15 16 17 18 19 20 21 22 23 24 25 26 27 28 29 30 31 32 33 34 35 36 37 38 39 40 41 42 43 44 45 46 47 48 49 50 51 52 53 54 55 56 57 58 59 60 61 62 63 64 65

4
Introduction 1
Current guidelines for management of severe traumatic brain injury (TBI) 2
patients recommend keeping ICP below 20 mmHg and CPP within the range of 3
50-70 mmHg.1 Although some success has been achieved, it ignores substantial 4
injury-specific and patient-specific variability.2 A recent trial showed lack of any 5
important outcome benefits of applying one particular fixed ICP treatment cut-6
off value.3 One promising approach supports the idea of individualizing 7
perfusion treatment strategies guided by the state of cerebral autoregulation.4-6 8
Cerebrovascular pressure reactivity represents a key element of autoregulation. 9
The pressure reactivity index (PRx) can be determined as the moving correlation 10
coefficient between ABP and ICP.7 With this approach active cerebrovascular 11
reactions can be assessed by observing the response of cerebral blood volume 12
and subsequently ICP to slow spontaneous changes in ABP.8 However, minute-13
by-minute values of PRx vary over time and require averaging to provide 14
meaningful values. Additionally whilst PRx provides a method for assessing 15
autoregulation, it does not, by itself, suggest any particular course of action in 16
patient management. 17
One useful way of ‘averaging’ PRx and at the same time providing it with an 18
immediate clinical meaning, is to divide its values into different bins according to 19
corresponding predefined CPP ranges. Plotting mean PRx against associated CPP 20
bins frequently produces a U-shaped curve with both hypoperfusion (low CPP) 21
and hyperperfusion (high CPP) associated with worsened cerebrovascular 22
reactivity.4, 5 Employing curve fitting the lowest point of the individual 23
autoregulation curve can be marked as the ‘optimal’ CPP (CPPopt) value, 24
1 2 3 4 5 6 7 8 9 10 11 12 13 14 15 16 17 18 19 20 21 22 23 24 25 26 27 28 29 30 31 32 33 34 35 36 37 38 39 40 41 42 43 44 45 46 47 48 49 50 51 52 53 54 55 56 57 58 59 60 61 62 63 64 65
5
corresponding to the CPP where individual autoregulation is the most effective. 1
These calculations can be repeated every minute from a chosen time range of 2
past data samples (moving window) thus producing a time-trend of CPPopt that 3
can be plotted alongside of CPP and ICP (Figure 1a). Recently, we have 4
demonstrated that larger deviation of CPP from the automatically calculated 5
CPPopt was associated with worse clinical outcome.4 However, the CPPopt trend 6
does not fully reflect the character of the PRx-CPP relationship, nor does it 7
capture its dynamic nature. In addition, the CPPopt trends can be fairly ‘erratic’ 8
(noisy), and may often contain many gaps where the PRx-CPP curves cannot 9
robustly be fitted. These effects are likely to be detrimental to the process of 10
clinical introduction of the autoregulation guided CPP therapy. 11
In this study we therefore aim to improve the CPPopt methodology by 12
introducing a new visualization method that may provide insight into the 13
complete characteristics of the CPP-PRx relationship, and its temporal evolution. 14
Materials and Methods 15
Patients 16
We present the concepts of the new visualization method using data from four 17
randomly selected severe TBI patients who were admitted to the neurocritical 18
care unit in 2013 and underwent monitoring of ICP as part of the TBI 19
management protocol at the University Medical Center Groningen. The local 20
medical ethics committee waived the need for informed consent. The local TBI 21
protocol aimed at keeping the CPP at approximately 60-70 mmHg and the ICP 22
below 20 mmHg. 23
1 2 3 4 5 6 7 8 9 10 11 12 13 14 15 16 17 18 19 20 21 22 23 24 25 26 27 28 29 30 31 32 33 34 35 36 37 38 39 40 41 42 43 44 45 46 47 48 49 50 51 52 53 54 55 56 57 58 59 60 61 62 63 64 65

6
Data acquisition 1
ABP was monitored invasively with an intravascular line connected to a pressure 2
transducer (Baxter Healthcare Corp. CardioVascular Group, Irvine, CA) and 3
zeroed at right atrium level. An intraventricular ICP probe (Raumedic Neurovent, 4
Raumedic AG, Helmbrechts, Germany) was used. All monitoring data were stored 5
using ICM+® software (Cambridge Enterprise, Cambridge, UK, 6
http://www.neurosurg.cam.ac.uk/icmplus). Time-averaged means for ABP, ICP 7
CPP (ABP minus ICP), and PRx 7 were calculated and stored every minute. 8
Data processing and visualisation 9
MATLAB (The MathWorks, Inc., Natick, Massachusetts, USA) was used to 10
implement a curve-fitting procedure based on an algorithm described 11
elsewhere4 in order to retrieve the PRx-CPP curves and the corresponding 12
CPPopt values every minute, with a calculation data buffer of 4 hours . 13
Importantly, all the fitted PRx-CPP curves were extended to cover the whole 14
examined range of CPP, from 40 to 120 mmHg. 15
The sequential PRx-CPP curves were then used to create a colour-coded map of 16
PRx-CPP relationship evolution over time (Figure 1b). The time (horizontal) axis 17
represents the position of the moving window for CPPopt calculation. The fitted 18
values of PRx are color-coded for every CPP-time point in the plot. The cool (blue 19
to yellow) colors represent intact cerebral pressure reactivity while impaired 20
pressure reactivity is represented by hot (orange to red) colors. Black areas 21
represent time points for which no CPPopt could be determined. In the second 22
step a non-causal, exponentially weighted moving average (EWMA) filter (n=240 23
data points (i.e. 240 minutes), α=0.005) was applied to the image along the time 24
1 2 3 4 5 6 7 8 9 10 11 12 13 14 15 16 17 18 19 20 21 22 23 24 25 26 27 28 29 30 31 32 33 34 35 36 37 38 39 40 41 42 43 44 45 46 47 48 49 50 51 52 53 54 55 56 57 58 59 60 61 62 63 64 65
7
axis only. This filter has a low-pass (smoothing) effect in time, and moreover it 1
allows to fill in some of the gaps (of duration not exceeding the filter length) with 2
appropriately weighted average of the preceding and following data values 3
(Figure 1c). In a third step the measured CPP (blue line) values were smoothed 4
with the same EWMA filter and added to the image. Finally, the boundaries of the 5
actual CPP ranges used for individual curve fitting (reflecting the number of 6
included CPP intervals and thereby providing a proxy of the curve reliability) are 7
indicated with black lines. Transparent overlays on both sides of these black 8
lines make clear within which CPP range the patient was kept and where 9
interpolation of the PRx-CPP curves has taken place. A ‘quality’ indicator bar was 10
added on top of the figure, marking sections of the image where the original gaps 11
were present but which were subsequently interpolated by the EWMA filter 12
(figure 2a). 13
14
Results 15
We illustrate the new CPPopt visualization method for the first three monitoring 16
days of four TBI patients (Figure 2) and provide some retrospective observations 17
that could not have been made with the traditional approach. 18
In patient 1 (Figure 2a), the PRx-CPP landscape indicates that lower CPP values 19
could have probably been well tolerated on day two. By day three however PRx 20
becomes positive over the whole CPP range (complete loss of autoregulation). In 21
such situations, autoregulation cannot be optimised and non CPP orientated, 22
management protocols are probably temporarily more appropriate. In patient 2 23
(Figure 2b) PRx became consistently negative (improving autoregulation) for 24
CPP values around 70 mmHg on day 2 but in the later part of day 3 the patients’ 25
1 2 3 4 5 6 7 8 9 10 11 12 13 14 15 16 17 18 19 20 21 22 23 24 25 26 27 28 29 30 31 32 33 34 35 36 37 38 39 40 41 42 43 44 45 46 47 48 49 50 51 52 53 54 55 56 57 58 59 60 61 62 63 64 65
8
autoregulation deteriorated considerably suggesting that a more aggressive and 1
targeted management of CPP at higher values (80-90) could have perhaps been 2
attempted. The PRx-CPP image for patient 3, (Figure 2c), tells the opposite story. 3
The patient started off with global loss of autoregulation, then on day 2 the 4
autoregulation seemed to have recovered but only for a relatively narrow and 5
high (75-90) range of CPPs. Subsequently, from day 3 onwards autoregulation 6
recovered over a broad range (55-75) of CPP. Also patient 4 (Figure 2d) started 7
with global loss of autoregulation with the patient kept at very high CPPs (above 8
90) at end of day 1. Subsequently, from day 3 improved autoregulation in the 9
range 60-75 mmHg might have enabled keeping CPP more ‘stable’ in this range 10
over time. 11
Discussion and conclusions 12
In our previous work4 we used PRx as a marker of cerebrovascular reactivity to 13
provide a continuously updated individualised target for management of CPP, 14
termed CPPopt. Here, we present a visualisation tool which may help clinicians 15
understand the prevailing physiology in the context of time variation so as to 16
help them in their decision making in individual patients. 17
First, by reducing the complexity of the CPP-PRx relationship to a single value 18
(CPPopt) is an oversimplification that may omit clinically important aspects of 19
autoregulatory behaviour. For example, in addition to a CPPopt target it is also 20
useful to understand what the overall autoregulatory capacity is and how 21
dependent autoregulation is on CPP. Second, the CPPopt time series may 22
sometimes behave quite erratically with large jumps in CPPopt despite relatively 23
stable overall clinical condition of the patient. Finally the current CPPopt 24
1 2 3 4 5 6 7 8 9 10 11 12 13 14 15 16 17 18 19 20 21 22 23 24 25 26 27 28 29 30 31 32 33 34 35 36 37 38 39 40 41 42 43 44 45 46 47 48 49 50 51 52 53 54 55 56 57 58 59 60 61 62 63 64 65
9
calculation does not always return a valid result at every instant leading to 1
periods with no data (gaps). 2
Such observations naturally reduce the physiological relevance of any single 3
value of CPPopt and are probably in part a consequence of the assumptions of 4
the CPPopt calculation including the assessment of autoregulation itself using the 5
PRx index. Since PRx (and therefore CPPopt) is calculated from spontaneous 6
variations in ICP and ABP rather than diagnostic interventions, it is 7
fundamentally a statistical parameter, with all uncertainties this brings. 8
The proposed visualisation method attempts to address and ameliorate these 9
limitations by providing a continuous representation of the relationship between 10
autoregulation and CPP over time. This allows for not only an indicator of the 11
instantaneous CPPopt but also for the full appreciation of the CPP-dependence of 12
autoregulation past and present. The erratic behaviour and ‘missing values’ of 13
CPPopt is addressed by smoothly interpolating the CPP-PRx behaviour. This 14
smoothing is physiologically plausible when we consider the timescales of the 15
underlying pathobiology likely to be responsible for changes in autoregulation 16
are also likely to be in the order of hours-days rather than minutes. 17
What we describe here is a natural extension of the concept of autoregulatory 18
assessment, providing the full retrospective ‘landscape’ of PRx-CPP relationship 19
extending over the past several hours. Although further methodological 20
improvements and a test of functionality are needed, the proposed visualisation, 21
while addressing some of the problems discussed above, may improve individual 22
CPP management methods based on the status of cerebral autoregulation, 23
current and past. The visualisation tool could be helpful in the development and 24
1 2 3 4 5 6 7 8 9 10 11 12 13 14 15 16 17 18 19 20 21 22 23 24 25 26 27 28 29 30 31 32 33 34 35 36 37 38 39 40 41 42 43 44 45 46 47 48 49 50 51 52 53 54 55 56 57 58 59 60 61 62 63 64 65

10
fine tuning of an autoregulation-guided CPP treatment protocol that needs 1
prospective testing. 2
3
4
1 2 3 4 5 6 7 8 9 10 11 12 13 14 15 16 17 18 19 20 21 22 23 24 25 26 27 28 29 30 31 32 33 34 35 36 37 38 39 40 41 42 43 44 45 46 47 48 49 50 51 52 53 54 55 56 57 58 59 60 61 62 63 64 65

11
Acknowledgments 1 2 The software for brain monitoring ICM+® (www.neurosurg.cam.ac.uk/icmplus) 3
is licensed by the University of Cambridge (Cambridge Enterprise). Peter 4
Smielewski and Marek Czosnyka have a financial interest in a part of the 5
licensing fee. 6
1 2 3 4 5 6 7 8 9 10 11 12 13 14 15 16 17 18 19 20 21 22 23 24 25 26 27 28 29 30 31 32 33 34 35 36 37 38 39 40 41 42 43 44 45 46 47 48 49 50 51 52 53 54 55 56 57 58 59 60 61 62 63 64 65
12
References 1
1. Bratton SL, Chestnut RM, Ghajar J, et al: Guidelines for the management of 2 severe traumatic brain injury. IX. Cerebral perfusion thresholds. J 3 Neurotrauma 2007;24: S59-S64 4
2. Maas AI, Menon DK. Traumatic brain injury: rethinking ideas and 5 approaches: Lancet Neurol 2012; 11:12-13 6
3. Chesnut RM, Temkin N, Carney N, et al. A Trial of Intracranial-Pressure 7 Monitoring in Traumatic Brain Injury: N Engl J Med 2012; 367:2471-2481 8
4. Aries MJ, Czosnyka M, Budohoski KP, et al: Continuous determination of 9 optimal cerebral perfusion pressure in traumatic brain injury. Crit Care Med 10 2012; 40:2456-2463 11
5. Steiner LA, Czosnyka M, Piechnik SK, et al: Continuous monitoring of 12 cerebrovascular pressure reactivity allows determination of optimal 13 cerebral perfusion pressure in patients with traumatic brain injury. Crit 14 Care Med 2002; 30:733-738 15
6. Le Roux P, Menon DK, Citerio G, et al: Consensus summary statement of the 16 International Multidisciplinary Consensus Conference on Multimodality 17 Monitoring in Neurocritical Care : A statement for healthcare professionals 18 from the Neurocritical Care Society and the European Society of Intensive 19 Care Medicine. Intensive Care Med 2014; 40:1189-1209 20
7. Czosnyka M, Smielewski P, Kirkpatrick P, Laing RJ, Menon D, Pickard JD: 21 Continuous assessment of the cerebral vasomotor reactivity in head injury. 22 Neurosurgery 1997; 41:11-17 23
8. Czosnyka M, Piechnik S, Richards HK, Kirkpatrick P, Smielewski P, Pickard 24 JD: Contribution of mathematical modelling to the interpretation of bedside 25 tests of cerebrovascular autoregulation. J Neurol Neurosurg Psychiatry 26 1997; 63:721-731 27
28 29
30
1 2 3 4 5 6 7 8 9 10 11 12 13 14 15 16 17 18 19 20 21 22 23 24 25 26 27 28 29 30 31 32 33 34 35 36 37 38 39 40 41 42 43 44 45 46 47 48 49 50 51 52 53 54 55 56 57 58 59 60 61 62 63 64 65
13
Figure legends 1
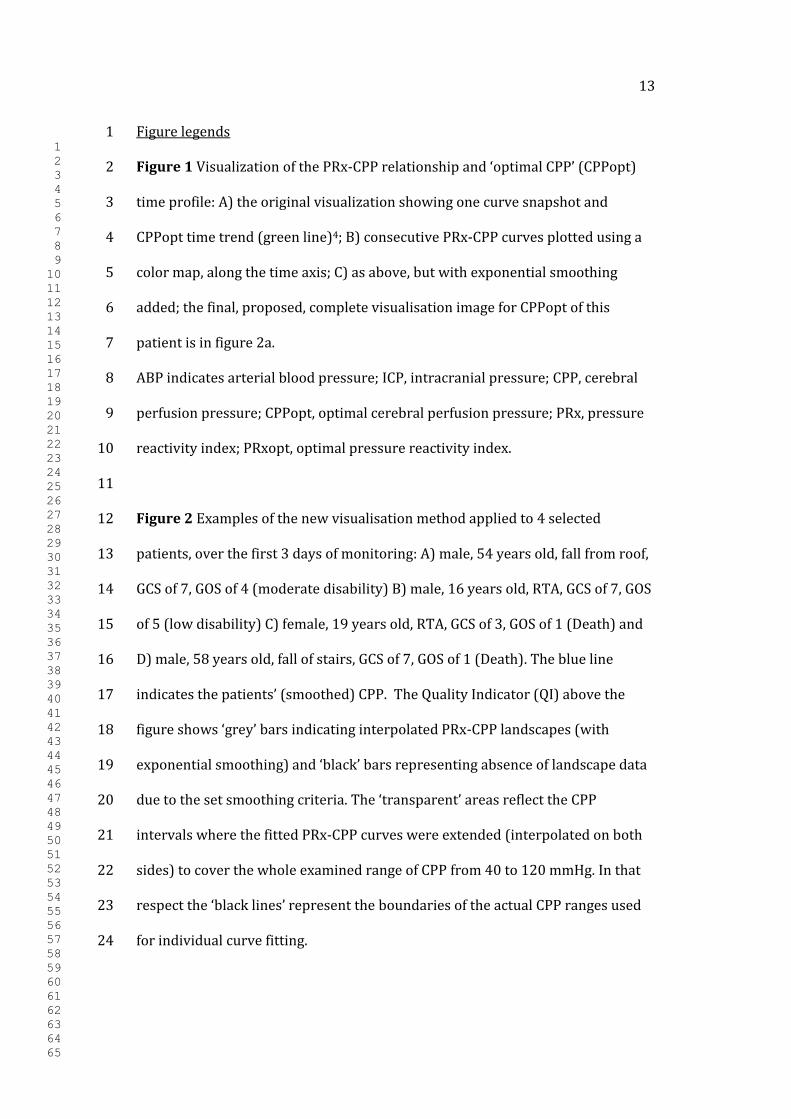
Figure 1 Visualization of the PRx-CPP relationship and ‘optimal CPP’ (CPPopt) 2
time profile: A) the original visualization showing one curve snapshot and 3
CPPopt time trend (green line)4; B) consecutive PRx-CPP curves plotted using a 4
color map, along the time axis; C) as above, but with exponential smoothing 5
added; the final, proposed, complete visualisation image for CPPopt of this 6
patient is in figure 2a. 7
ABP indicates arterial blood pressure; ICP, intracranial pressure; CPP, cerebral 8
perfusion pressure; CPPopt, optimal cerebral perfusion pressure; PRx, pressure 9
reactivity index; PRxopt, optimal pressure reactivity index. 10
11
Figure 2 Examples of the new visualisation method applied to 4 selected 12
patients, over the first 3 days of monitoring: A) male, 54 years old, fall from roof, 13
GCS of 7, GOS of 4 (moderate disability) B) male, 16 years old, RTA, GCS of 7, GOS 14
of 5 (low disability) C) female, 19 years old, RTA, GCS of 3, GOS of 1 (Death) and 15
D) male, 58 years old, fall of stairs, GCS of 7, GOS of 1 (Death). The blue line 16
indicates the patients’ (smoothed) CPP. The Quality Indicator (QI) above the 17
figure shows ‘grey’ bars indicating interpolated PRx-CPP landscapes (with 18
exponential smoothing) and ‘black’ bars representing absence of landscape data 19
due to the set smoothing criteria. The ‘transparent’ areas reflect the CPP 20
intervals where the fitted PRx-CPP curves were extended (interpolated on both 21
sides) to cover the whole examined range of CPP from 40 to 120 mmHg. In that 22
respect the ‘black lines’ represent the boundaries of the actual CPP ranges used 23
for individual curve fitting. 24
1 2 3 4 5 6 7 8 9 10 11 12 13 14 15 16 17 18 19 20 21 22 23 24 25 26 27 28 29 30 31 32 33 34 35 36 37 38 39 40 41 42 43 44 45 46 47 48 49 50 51 52 53 54 55 56 57 58 59 60 61 62 63 64 65

14
GCS indicates Glasgow Coma score (after resuscitation); RTA, Road Traffic 1
Accident; GOS, Glasgow Outcome Scale (at 6 months). 2
3
1 2 3 4 5 6 7 8 9 10 11 12 13 14 15 16 17 18 19 20 21 22 23 24 25 26 27 28 29 30 31 32 33 34 35 36 37 38 39 40 41 42 43 44 45 46 47 48 49 50 51 52 53 54 55 56 57 58 59 60 61 62 63 64 65
Figure 1 Click here to download Figure Figure 1 600dpi.tif

Figu
re 2
Clic
k he
re to
dow
nloa
d Fi
gure
Fig
2 fi
nal.t
if


![A Note on Contraction-Free Logic for Validity [preprint]](https://img.dokumen.tips/doc/110x75/632ad29bbe5c6e98e7023089/a-note-on-contraction-free-logic-for-validity-preprint.jpg)
