Embed Size (px)
Citation preview

Ca r d i f fUNIVERSITY
PRIFYSGOLCaeRDY[§>
Investigation of high temperature enhanced hydrogen formation in mineral amended sediment slurries, as a potential
novel deep biosphere energy source
Cathal David Linnane
Submitted in partial fulfilment o f the requirements for the degree o f Doctoro f Philosophy (PhD)

UMI Number: U585199
All rights reserved
INFORMATION TO ALL USERS The quality of this reproduction is dependent upon the quality of the copy submitted.
In the unlikely event that the author did not send a complete manuscript and there are missing pages, these will be noted. Also, if material had to be removed,
a note will indicate the deletion.
Dissertation Publishing
UMI U585199Published by ProQuest LLC 2013. Copyright in the Dissertation held by the Author.
Microform Edition © ProQuest LLC.All rights reserved. This work is protected against
unauthorized copying under Title 17, United States Code.
ProQuest LLC 789 East Eisenhower Parkway
P.O. Box 1346 Ann Arbor, Ml 48106-1346

DECLARATION
This work has not previously been accepted in substance for any degree and is not concurrently submitted in candidature for any degree.
Signed ...................... (candidate) Date 7.
STATEMENT 1
This thesis is being submitted in partial fulfillment of the requirements for the degree of Ph.O (insert MCh, MD, MPhil, PhD etc, as appropriate)
Signed ... .TT (candidate) Date ... ! .7 . \o
STATEMENT 2/
This thesis is the result of my own independent work/investigation, except where otherwise stated.Other sources are acknowledged by explicit references.
Signed (candidate) Date .............
STATEMENT3
I hereby give consent for my thesis, if accepted, to be available for photocopying and for inter-library loan, and for the title and summary to be made available to outside organisations. ^
Signed T.) . ....................(candidate) Date . . . . ( '5 . 7 . ^ . .............
STATEMENT 4: PREVIOUSLY APPROVED BAR ON ACCESS
I hereby give consent for my thesis, if accepted, to be available for photocopying and for inter-library loans after expiry of a bar on access previously approved by the Graduate Development Committee.
Signed .y^ .l^ :.^ .“....Z .tv r r .-^ ....... .'................... (candidate) D ate....(r.^ ..^ .^v ...............

Acknowledgements
Acknowledgements
I would like to thank my supervisor John Parkes for giving me the opportunity to do a
PhD in his Lab. I would especially like to thank him for his patience, time and help
throughout the course of this project. I would like to thank Andrew Weightman for the
use of his lab in which all the molecular work was carried out. Gordon Webster deserves
a special mention for the many discussions and help afforded to me over the course of
this project. Ed Homibrook in the University of Bristol provided help and discussion on
isotope analysis and thanks to Henrick Sass for all his help in the Lab. Thanks to Barry
for providing wine and food on many occasions and his own “special” form of
encouragement.
My lab mates, Joachim, Falko, Chloe, Emily, Derek, Julia, Andrew, Gerard,
Andrea, Xiahong, Thanks to Tony for the XRD help and Ian McDonald for help with
ICP-OES.
Thanks to my housemates Mostyn, Dan and Lizzie, the craic was mighty for 3 years and I
did more stuff than I thought possible. Thanks to Nick who never stopped trying to get
me to go places.
A big thanks to my parents, for helping me through and giving me support, and
my sisters Sharon and Michelle. Special thanks to Andrea, for all the happy times, and
the support throughout the final year.
Thanks for all the fun times to the rest of the PhDs.

Abstract
Abstract
The deep biosphere has been estimated to be the largest prokaryotic habitat on Earth. However, what energy sources sustain these prokaryotes at depth and over geological timescales, remote from photosynthetic energy supply, is unclear. Hydrogen generation from basalt weathering has been controversially suggested as a potential deep terrestrial energy source, although other minerals were thought to be unimportant, as they did not generate H2 under abiotic conditions.
In this study these experiments were repeated but in the presence of sedimentary prokaryotes using a range of minerals, with differing iron concentrations at a range of temperatures (4-105°C) and under anoxic conditions. Results showed that at certain temperatures high levels of H2 were produced from several minerals (600-1650 pmol I"1). This was associated with high levels of acetate formation (-5000-1000 pmol I'1). Substantial CH4 (100-600 pmol I'1) was also produced. Sulphate reduction proceeded between - 50-85°C, which no removal at higher temperatures, similar to hot oil reservoirs. The amounts of these compounds produced varied depending on mineral composition. The presence of iron in minerals was found not to be necessary to facilitate the production of H2 as previously thought. Under sterile conditions little H2 or other products were formed. This shows that H2 generation from minerals was a microbially mediated process and was consistent with the presence of considerable prokaryotic cell numbers (range 4.3 x 10⁷ to 5.1 x 10⁸ cells ml'1) in these experiments. Prokaryotic cell numbers decrease with increases in temperature, similar to the predicted decrease in numbers with depth in the sub seafloor biosphere (e.g. 99°C 6.67 x 10⁵ cells ml'1). Sequential ramping experiments to 155°C, demonstrated that prokaryotic activity in the biotic zone <120°C, increased the formation of products such as H2 (x34) and low weight molecular acids (acetate x2.3) in the abiotic zone >120°C. This has implications for hydrous pyrolysis experiments, which are used to simulate high temperature diagenesis. This increases the sources of potential energy, which may migrate upward to feed the base o f the deep biosphere. The prokaryotic community present was assessed using 16S rRNA gene analysis (PCR-DGGE). Communities varied with mineral type and included thermophilic methanogens and acetate oxidisers, iron-reducers and Deltaproteobacteria, Thermoplasmatales, as well as uncultured bacterial and archaeal sequences. Clone libraries indicate that the archaeal community is similar to proposed HyperSliMe communities, dominated by Thermococcales related species at high temperature -80- 95°C. Fresh grinding of minerals enhanced activity, which has implications for the rate of energy supply in the subsurface. A mechanochemical process based on the interaction of Si radicals, which is enhanced by the presence of prokaryotes, perhaps through microbial weathering, is hypothesised to be involved in H2 generation. But the interaction of other mineral constituents such as Fe, A1 and Ti may also play a role.
We found minerals stimulated prokaryotic activity up to at least 100 days. Interestingly, the carbon isotope values for the CH4 produced covered a wide range of values (-42 to -78%o), including depleted values that could be misinterpreted as being indicative of an abiotic origin. These results extend the range of minerals that could be potential “dark energy” sources in the subsurface and provide details of the prokaryotes and processes that such energy sources could stimulate.

Table of contents
Chapter 1 Introduction
1.1 Introduction 11.2 The subsurface biosphere 11.3 Major subsurface metabolisms 7
1.3.1 Denitrification and ammonification 71.3.2 Anaerobic ammonium oxidation (anammox) 81.3.3 Dissimilatory metal reduction 91.3.4 Sulphate reduction 131.3.5 Methanogenesis 161.3.6 Anaerobic oxidation of methane (AOM) 191.3.7 Isotope systematics of methane formation and oxidation 211.3.8 Acetogenesis 22
1.4 Molecular characterisation of subsurface communities 251.5 Hydrogen driven Subsurface Lithoautrophic microbial ecosystems (SLiMEs) 281.6 Abiotic sources of Hydrogen generation in the subsurface 31
1.6.1 Serpentinization 311.6.2 Pyrite formation 331.6.3 Thermal decomposition 331.6.4 Radiolytic dissociation of water 34
Chapter 2
2.1 Sample Sites 362.2 Sediment Sites 372.3 Sampling 392.4 Minerals 392.5 X-Ray Diffraction and ICP-OES 402.6 Mineral preparation for slurry addition 402.7 Slurry preparation 412.8 Reaction Vessels 432.9 Incubations 482.10 Pore water analysis 492.11 Gas Analysis 502.12 Iron analysis 502.13 8 13C Isotope analysis 512.14 Acridine orange direct counts 512.15 Molecular analysis 54
2.15.2 PCR reactions 542.15.3 DGGE analysis 562.15.4 Cloning 572.15.5 Phylogenetic analysis 58
Chapter 3
3.1 Introduction 59

Table of contents
3.2 Mineral composition 593.3 Experimental Setup 603.4 Results Section 623.5 Results: Hornblende, Ilmenite, Olivine and Olivine bombs 66
3.5.1 Hornblende 663.5.2 Ilmenite 663.5.3 Olivine 673.5.4 Olivine bombs 68
3.6 Results: Labradorite, hematite, pyrite, pyrrhotite and basalt 743.6.1 Labradorite 743.6.2 Hematite 743.6.3 Pyrite 753.6.4 Pyrrhotite 763.6.5 Basalt 77
3.7 AODC Counts 773.8 Sterile controls 783.9 8 13C-CH4 isotope data 813.10 Molecular analysis 823.11 Activation of mineral surfaces versus non-activation 873.12 Inhibition experiments 903.13 Sulphate inhibition of basalt mineral incubation at 60°C 923.14 Methane inhibition of basalt mineral incubation at 60°C 943.15 Discussion 95
Chapter 4
4.1 Introduction 994.2 Results, sediment only incubation 1044.3 Results basalt sediment incubation 1104.4 Results sterile control incubation 1164.5 Mineral and anoxic mineral salts solution only incubation 1184.6 Results mineral and anoxic mineral salt solution 1184.7 Bacterial molecular analysis of basalt thermal gradient experiment 1204.8 Molecular analysis basalt thermal gradient archaeal analysis 122
4.8.1 Molecular results 1244.9 Ramping experiment 1264.10 Results ramping experiment 1324.12 Discussion 13 5
Chapter 5
5.1 Introduction5.2 Pyrite results5.3 Ilmenite results
137142150

Table of contents
5.4 Hematite results 15 75.5 Magnetite results 1625.6 AODC counts 1645.7 DGGE results for ilmenite Bacterial incubation after 83 days 1655.8 DGGE results for ilmenite Archaeal after 83 days 1665.11 Clone libraries 1685.12 Molecular results for ilmenite and pyrite thermal gradient incubations 1695.13 Discussion 172
Chapter 6
6 .1 Introduction 1776.2 Olivine Results 1806.3 Hornblende results 1846.4 Labradorite results 1896.5 Silica Results 1966 .6 AODC counts on silica incubation 1996.7 Discussion 201
Chapter 7
7.1 Introduction 2047.2 Concentrations of hydrogen generated, temperature effects and
abiogenic/biogenic reactions 2057.3 Mineral composition and relationship to H2 generation 2097.4 Comparison to H2 concentrations found in other experiments and
Environments 2147.5 H2 generation and effect on acetogenesis 2167.6 H2 generation effect on methanogenesis 2207.7 Hydrogen influences on sulphate reduction and carbon dioxide generation 2237.8 Characterisation of microbial community responsible 2297.9 Possible mechanism o f hydrogen generation 2347.10 Conclusions 2367.11 Future work 237
References 239

Table of Figures
Chapter 1
Fig 1.1 Distribution of prokaryotic cells in sub-seafloor sediments Fig 1.2 The electron towerFig 1.3 Porewater profiles in an idealised marine sediment.Fig 1.4 Interaction between nitrifers and denitrifiersFig 1.5 Electron transfer between microorganisms and solid Fe(III)Fig 1.6 Phylogenetic tree describing sulphate-reducing bacterial species Fig 1.7 CD-diagram for classification of prokaryotic and thermogenic methane Fig 1.8 The acetyl-CoA Wood-Ljungdahl pathway Fig 1.9 Homoacetogenic conversion of glucose to acetate Fig 1.10 Community composition of major taxonomic groups of Bacteria
from 16S rRNA gene libraries at various sites and depths in the deep sub seafloor biosphere
Fig 1.11 Community composition o f Archaea 16S rRNA genes from various sites and depths in the deep sub seafloor biosphere
Fig 1.12 The deep hydrogen driven biosphere hypothesis
Chapter 2
Fig 2.1 Maps of sampling sites Fig 2.2 Tamar estuary sampling Fig 2.3 Master slurry set upFig 2.4 Type 1 reaction vessel (modified conical flask)Fig 2.5 Type 2-reaction vessel (inverted modified conical flask)Fig 2.6 Type 3 reaction vessel (PTFE stopped Duran bottle)Fig 2.7 Type 4 reaction vessel Wheaton® serum vialsFig 2.8 Type 5 reaction vessel (Parr Scientific pressure vessel)Fig 2.9 Type 5 reaction vessel close up Fig 2.10 Thermal Gradient system
TV
Fig 2.11 DCode Universal Mutation Detection SystemFig 2.12 pGEM®-T Easy Vector circle map and sequence reference points
Chapter 3
Fig 3.1 Hornblende incubation Fig 3.2 Ilmenite incubation Fig 3.3 Olivine Incubation Fig 3.4 Olivine bombs incubation Fig 3.5 Labradorite incubation Fig 3.6 Hematite incubation Fig 3.7 Pyrite incubation Fig 3.8 Pyrrhotite incubation Fig 3.9 Basalt incubation
23481214212324
26
2729
363941454546464747485758
626364656970717273

Table of Figures
Fig 3.10 Hornblende sterile control 79Fig 3.11 Bacterial DGGE profile 82Fig 3.12 Archaeal DGGE profile 82Fig 3.13 (a)Homblende incubation fresh grinding versus no grinding 87Fig 3.13 (b) Hornblende incubation fresh grinding, versus no grinding 88Fig 3.14 Sulphate reduction inhibition 92Fig 3.15 Methane inhibition 94
Chapter 4
Fig 4.1 No mineral addition 3 days incubation 101Fig 4.2 No mineral addition, 93 days incubation 102Fig 4.3 No mineral addition, 93 days Al, K 103Fig 4.4 No mineral addition, 93 days Fe, Mn and Ti 103Fig 4.5 No mineral addition, 93 days, Ca, Mg 103Fig 4.6 No mineral addition, 93 days, P, Si 103Fig 4.7 Comparison of carbon dioxide values with Ca, Mg and K 106Fig 4.8 Basalt 3-day incubation 107Fig 4.9 Basalt 83 day incubation 108Fig 4.10 Basalt addition, 83 days Al, K 109Fig 4.11 Basalt mineral addition, 83 days, Fe, Mn, Ti 109Fig 4.12 Basalt mineral addition, 83 days Ca, Mg 109Fig 4.13 Basalt mineral addition, 83 days P, Si 109Fig 4.14 Basalt sterile control 3 days 113Fig 4.15 Basalt sterile control. 130 days 114Fig 4.16 Basalt sterile addition, 133 days. Al, K 115Fig 4.17 Basalt sterile addition, 133 days. Fe, Mn, 115Fig 4.18 Basalt sterile addition, 133 days Ca, Mg 115Fig 4.19 Basalt sterile addition, 133 days P, Si 115Fig 4.20 Sulphate removed against carbon dioxide generated 117Fig 4.21 Ground Basalt and mineral salt solution 118Fig 4.22 Bacterial DGGE gel, of basalt thermal gradient incubation
after 83 days incubation 120Fig 4.23 (a) 30-60% Archaeal Basalt incubation 122Fig 4.23 (b) 30%-80% Archaeal Basalt incubation 122Fig 4.24 Bar graph showing archaeal changes with temperature 124Fig 4.25 Basalt ramping experiment 127Fig 4.26 Basalt ramping sterile control 128Fig 4.27 Basalt ramping comparison of biotic and sterile control 129Fig 4.28 Basalt ramping incubation. Al, K 130Fig 4.29 Basalt sterile control ramping incubation. Al, K. 130Fig 4.30 Basalt ramping incubation. Mn, Ti 130Fig 4.31 Basalt sterile control ramping incubation. Mn, Ti 130Fig 4.32 Basalt ramping incubation. Ca. Mg 131Fig 4.33 Basalt sterile control ramping incubation. Ca. Mg 131Fig 4.34 Basalt ramping incubation. P, Si 131

Table of Figures
Fig 4.35 Basalt sterile control ramping incubation. P.Si 131
Chapter 5
Fig 5.1 Pyrite results after 3 days incubation 139Fig 5.2 Pyrite results after, 110 days incubation. 140Fig 5.3 Pyrite addition 110 days incubation. Al, K. 141Fig 5.4 Pyrite addition 110 days incubation. Fe, Mn,Ti. 141Fig 5.5 Pyrite addition 110 days incubation. Ca. Mg. 141Fig 5.6 Pyrite addition 110 days incubation .P, Si. 141Fig 5.7 Pyrite methane isotope data, temperature effects 144Fig 5.8 Pyrite incubation showing Fe and Hydrogen 145Fig 5.9 Ilmenite addition, 3 days incubation 147Fig 5.10 Ilmenite addition, 83 days incubation 148Fig 5.11 Ilmneite addition 83 days incubation. Al, K. 149Fig 5.12 Ilmneite addition 83 days incubation. Fe, Mn,Ti. 149Fig 5.13 Ilmneite addition 83 days incubation. Ca. Mg. 149Fig 5.14 Ilmneite addition 83 days incubation .P, Si. 149Fig 5.15 ilmenite incubation H2 and Ca concentrations 153Fig 5.16 Hematite addition, 3 days incubation 154Fig 5.17 Hematite addition, 100 days incubation 15 5Fig 5.18 Hematite addition 100 days incubation. Al, K. 156Fig 5.19 Hematite addition 100 days incubation. Fe, Mn,Ti. 156Fig 5.20 Hematite addition 100 days incubation. Ca. Mg. 156Fig 5.21 Hematite addition 100 days incubation .P, Si. 156Fig 5.22 Magnetite addition, 3 days incubation 160Fig 5.23 Magnetite incubation after 92 days 161Fig 5.24 Hematite incubation cell count in log 164Fig 5.25 Bacterial DGGE Gel ilmenite 165Fig 5.26a Archaeal DGGE profile 60% denaturant gel 166Fig 5.26b Archaeal DGGE profile 30-80% ilmenite 166Fig 5.27 Ilmenite Phylogenetic tree 63°C 168-AFig 5.28 Ilmenite Phylogenetic tree 89°C 168-BFig 5.29 Pyrite Phylogenetic tree 65°C 168-CFig 5.30 Pyrite Phlyogenetic tree 90°C 168-DFig 5.31 Combined graphs of methane and acetate 174Fig 5.32 Combined graph showing hydrogen generation 175
Chapter 6
Fig 6 .1 Olivine incubation after 3 days incubation 178Fig 6.2 Olivine incubation after 61 days incubation 179Fig 6.3 Hornblende incubation, after 3 days 182Fig 6.4 Hornblende incubation, 61 days 183Fig 6.5 Labradorite incubation after 3 days 186Fig 6 .6 Labradorite incubation after 108 days 187

Table of Figures
Fig 6.7 Labradorite addition, 108 days incubation. Al, K 188Fig 6.8 Labradorite addition, 108 days incubation. Fe, Mn and Ti 188Fig 6.9 Labradorite addition, 108 days incubation. Ca, Mg 188Fig 6.10 Labradorite addition, 108 days incubation. P, Si 188Fig 6 .11 a Labradorite, Acetate and Fe concentrations 192Fig 6.1 lb Acetate and Silica (Labradorite) 192Fig 6.12 Labradorite Methane and Fe concentrations 192Fig 6.13 Silica addition, 3 days incubation 193Fig 6.14 Silica addition, 97 days incubation 194Fig 6.15 Silica addition, 97 days incubation Al, K 195Fig 6.16 Silica addition, 97 days incubation Fe, Mn and Ti 195Fig 6.17 Silica addition, 97 days incubation Ca, Mg 195Fig 6.18 Silica addition, 97 days incubation P, Si 195Fig 6.19 Silica incubation. Fe, V, H2 197Fig 6.20 Silica and iron concentrations 198Fig 6.21 Hydrogen V silica 199Fig 6.22 AODC counts on silica thermal gradient incubation 200Fig 6.23. 6 13C-CH4 data for all data in chapter 6 plotted against temperature 202
Chapter 7
Fig 7.1 Production of H2 over time by Snake River Plain basalt 211Fig 7.2 Maximum hydrogen concentrations after 3 days incubation,
against final Si concentrations 212Fig 7.3 Final hydrogen concentration plotted against final acetate 217Fig 7.4 5 13C-CH4 values for all thermal gradient experiments
plotted against temperature 221Fig 7.5 Initial CO2 and H2 after 3 days 228

Table of tables
Chapter 1
Table 1.1 pe°’ as a function for selected half reactions in microbial metabolisms 5 Table 1.2 Sulphate reducing reactions 15Table 1.3 Reactions and standard changes in free energies for methanogenesis 17
Chapter 2
Table 2.1 Recipe for anoxic artificial seawater solution 42Table 2.2 Primers used in this study 55-A
Chapter 3
Table 3.1 Minerals chosen for experimentation 59Table 3.2 Mineral compositions according to ICP-OES 60Table 3.3 AODC bacterial numbers of varying mineral
incubations, after 65 days of incubation 78Table 3.4 Isotope data for selected samples 81Table 3.5 Bacterial sequences (Fig 3.11) 83Table 3.6 Archaeal sequences (Fig 3.12) 84Table 3.7 Grinding experiment ilmenite and olivine results 89Table 3.8 513C values for methane from grinding experiment 90
Chapter 4
Table 4 .1 Methane isotope for basalt incubation 111Table 4.2 Basalt bacterial DGGE gel 121Table 4.3 30-60% DGGE (Fig 4.23) Archaeal 123Table 4.4 30-80% DGGE (Fig 4.23b) Archaeal 123Table 4.5 Maximum concentrations for hydrogen methane and acetate 135
Chapter 5
Table 5.1 5 I3C values for pyrite incubation 143Table 5.2 5 ,3C values for ilmenite incubation 151Table 5.3 5I3C values for hematite incubation 157Table 5.4 DGGE bacterial results for ilmenite 165Table 5.5 DGGE Archaea Ilmenite 60% results (18-63°C) 167Table 5.6 DGGE Archaea Ilmenite 80% results (76-95°C) 167Table 5.7 Maximum concentrations recorded after 3 days 172Table 5.8 Mineral composition and maximum hydrogen generation 173

Table of tables
Chapter 6
Table 6.1 §13C values for olivine incubation Table 6.2 5 ,3C values for hornblende incubation Table 6.3 5 13C values for labradorite incubation
Table 6.4 Maximum H2, CH4 and acetate concentrations after 3 days incubation
Table 6.5 Maximum of H2, CH4 and acetate concentrations at final sampling point
Chapter 7
Table 7.1 Maximum hydrogen concentrations, during 60°C incubations from Chapter 3
Table 7.2 Maximum concentration of hydrogen generated after 3days using the thermal gradient incubation system (0-105°C)
Table 7.3 Maximum hydrogen concentrations and relationshipwith Fe and Si, after 3 days incubation in the thermal gradient system
Table 7.4 maximum acetate and hydrogen concentrations with temperature detected at the final sampling point of thermal gradient
Table 7.5 Maximum methane concentrations with temperature detected at during final incubation point in thermal gradient experiments
Table 7.6 Mineral incubations comparison of sulphate removal rates andmaximum temperature of activity in the thermal gradient experiments
Table 7.7 Comparison of CO2 concentrations with temperatureand initial and final maximum concentration, plus correlation with SO42' reduction in the thermal gradient experiment.
181185190
201
201
206
207
208
217
220
223
226

Chapter 1 Introduction
Chapter 1
Introduction
1.1 Introduction
This chapter provides a review of the deep subsurface biosphere, major metabolic
processes, an overall view of hydrogen generation in the subsurface with an introduction
to subsurface lithoautotrophic microbial ecosystems (SLiMES).
1.2 The subsurface biosphere
Prokaryotes in sub-seafloor sediments are thought to make up about 70% of the global
prokaryotic biomass (Whitman et al., 1998). This is not surprising, when one considers
that oceans cover ~70% of the earth’s surface and the high amounts of particulate organic
matter in the sub-seafloor. It is estimated that between 5 and 10 billion tons of particulate
organic matter is constantly sinking in the world’s ocean which accumulates as sediment
(Jorgensen, 1983). The vast amount of this organic matter is degraded by near surface
microbial activity. However, over geological time the accumulation of the remainderQ
results in the largest global reservoir of organic carbon; 15000 x 10 g C (Hedges and
Keil, 1995). Despite these considerations it is only relatively recently that the existence of
a deep biosphere in the marine subsurface has comprehensively been proven (Parkes et
al., 1994; Wellsbury et al., 2002). The deep sub sea floor biosphere extends to at least
1626 mbsf, into sediments that are 111 My old with a temperature range of 60-100°C
(Roussel et al., 2008). Prokaryotic cell numbers decrease with depth from concentrations
of ~ 109 cm'3, in near surface sediments, to ~3 xlO6 cm'3 at 500 mbsf (Fig 1.1).
1

Chapter 1 Introduction
0.01
0.1
1
Depth (mbsf)
10
100
1000
Fig 1.1 Distribution of prokaryotic cells in sub-seafloor sediments located worldwide. The solid line is the regression line and the dotted lines either side are the 95% prediction limits. ODP Ocean Drilling Program, OM organic matter (After Parkes et al., 1994)
Organic matter becomes increasingly recalcitrant during burial making it increasingly
difficult to utilise as a substrate for microorganisms. Hence metabolic activity decreases
with depth and metabolic rates can be 1 0 3- 1 0 5 times lower in the subsurface than in the
organic rich near surface sediment (Lovley and Chapelle, 1995). Energy supply is a
problem for microbes at depth, as the most favourable electron acceptors are used
sequentially in a predictable cascade, confining less energy generating reactions to the
subsurface , such as those based on CO 2 . In broad terms, the progression o f terminal
electron accepters begins with O 2 near the surface, followed with increasing depth by
NO3 ', NO 2’, Mn (IV), Fe (III), SO42' and finally CO 2 . This thermodynamically predicted
progression, is determined from values o f the standard Gibbs free energies o f reaction
(AGr°). and is typically paralleled by a microbial metabolic succession (Stumm and
2
3 4 5 6 7 8 9 10 11Bacteria (log cells/cm3)
Prokaryotic cell distributions in deep sediments from 17 ODP/IODP Legs worldwide.
•D eep bacteria ubiquitous.
• Water depth to 5867 m.
* Sediment depth 1626 mbsf.
# Low to high OM (-0.4 -6.8%).
*Low to high Temperature (2- -150°C- hydrothermal).
•A ncient deposits (-111 mya)
*M any environments bacteria continuously decrease with depth.
•B iom ass to 500m. globally equals -10% o f surface biosphere carbon, with both higher (-30% ) and lower estimates (minimum based on detectable living cells.

Chapter 1 Introduction
Morgan, 1996). This redox couple cascade is shown diagrammatically in Fig 1.2 (Telling
et al., 2004)
Electron Electrondonors acceptors
E (V) E (V)
-0 .4 -
-0 .2 -
- h2 ----.----AcetateCH4 \
'H 2S \
1 1
ooO CO
1i
ii
io
o
ho ^
0.0 -Fe2+ \ FeOOH
- 0.0
+ 0.2 - - +0.2
+ 0.4 . nh4+- no2-
Mn2+\ no3- _
\ Mn02- + 0.4
+ 0.6 - - + 0.6
+ 0.8 -\ 2N03"
o2 - +0.8
Fig 12. The electron tower. The strongest reductants are at the top, and strongest oxidants at the bottom of the diagram. Coupled reactions between electron donors having more negative Eo’ with electron acceptors possessing more positive Eo’ are exergonic and may provide sufficient energy to support bacterial metabolism. In the example cited in the text, oxidation of acetate with oxygen has a steep negative gradient, and hence a high free-energy yield. The oxidation of hydrogen with carbon dioxide (methanogenesis or acetogenesis) has a shallower gradient and consequently, a lower free-energy yield.
The Gibbs free energy (AG°) is the amount of energy obtained from a given
metabolic reaction. It is worth noting that the predicted succession of reactions is based
on the thermodynamic properties under standard state and not conditions that exist in the
3

Chapter 1 Introduction
natural environment (25°C and 1 bar). The energy yield from a reaction depend on
temperature, pressure and chemical concentrations & composition, and are therefore
sample and site specific, and may deviate from the proposed succession. However, an
idealised pore water profile is shown in Fig 1.3, which serves as a general model for
metabolic activity in subsurface sediments.
Porewater concentrations (not to scale)
►
Aerobic respiration Coupled nitrification-
| denitrtrification- ammonification
| Mn(IV)-reductionc■8ooC
s ° 4 2' Sulfate reduction
12
(Anaerobic methane oxidation)
£D.1Q Methanogenesis
Fig 1.3 Porewater profiles in an idealised marine sediment. In the sequence, oxygen is consumed first, followed by nitrate, Mn(IV)-oxides, Fe(III)-oxides, sulfate and finally CO2, creating a zonation of reactants and products. The sequence is determined by the free energy yield of the various redox reactions. Aerobic ammonia oxidation (nitrification) and anaerobic methane oxidation (shaded zone) are also show n. Depth is not to scale from (Telling et al., 2004).
In order to show the changes that can occur theoretically w ith temperature using standard
half reactions (Amend and Teske, 2005) provide theoretical values for microbial
metabolisms at various temperatures by, using pe° which donates pe° at neutral pH.
Values for this table were computed from the standard redox potentials (Eh°) first by
using (AG°r) which is the free energy change o f the reaction under standard conditions.
4

Chapter 1 Introduction
E h° = -A G r° n¥
n represents the number of moles of electrons in reaction r and F denotes the Faraday
constant (96,485 coulomb mol I'1). Eh° was then converted to the negative logarithm of
electron activity (pe°)
P8° = FEh°2.303RT
where R and T denote the gas constant and temperature in K. Furthermore valves were
modified to neutral pH (biological standard state) by
p8°’ =ps°+ nh logKw2
nH stands for the number of moles of protons per mole of electrons in the half reaction
and Kw represents the equilibrium constant at the temperature and pressure of interest
for the dissociation reaction of water as H20 —> H++ OH'. It should be noted that neutral
pH changes with temperature e.g. at 25°C and 1 bar pH is 7, while at 100°C neutral pH is
6.13.
Table 1.1 pe°’ as a function for selected half reactions in microbial metabolisms
Reaction 25°C 50°C 100°C 150°C
I 0 :(aq)+4ir+4e—>2H20 14.50 13.23 11.12 9.42II NO, + 6 H + 5 e-> l/2 N 2(aq)+3H20 12.32 11.26 9.53 8.18in N 0 2 + 8 H + 6 e-> N Ii,+ 2 H 20 5.90 5.29 4.28 3.45IV NO, +2H~+2e -> N 0 2 +H20 6.88 6.27 5.24 4.39V Fe20 3(s)+6H +2e->2F e2~+3H20 -7.94 -8.03 -8.37 -8.85VI S 0 4:> 10 H + 8 e —>H2S(aq)+4H20 -3.67 -3.39 -2.99 -2.70VII C 0 2(aq)+8H*+8e'->CH4(aq)+2H20 -4.31 -4.09 -3.81 -3.65VIII S°(s)+2H*+2e'->H2S(aq) -4.55 -4.17 -3.60 -3.19IX 2C 02(aq)+8H +8e->CH 3C00H(aq)+2H20 -4.83 -4.58 -4.31 -4.16X 6C 02(aq)+24H +24e—>C 6H, 20 6(aq)+6H20 -6.83 -6.46 -6.02 -5.75XI H'+e'->l/2H2(aq) -8.55 -7.94 -6.98 -6.26
5

Chapter 1 Introduction
It can be seen from Table 1.1 that several of the reactions are sensitive to temperature.
Several reactions including sulphate reduction, autotrophic methanogenesis and
homoacetogenesis decrease only slightly with temperature. Although the general redox
couples remain the same several couples can change in order with temperature. For
example the CO2/CH4 couple drops below that of the STF^S couple between 50 and
100°C. Theoretical considerations like these should be kept in mind when dealing with
subsurface reactions that involve increases in temperature with depth. However, they are
just that, theoretical and may not always apply, due to different conditions in situ e.g.
reactant concentrations, chemical / mineralogical composition.
Anaerobic metabolisms often proceed in syntrophic association where the
degradation of a substrate by one species is made thermodynamically possible through
the removal of end products by another species (Schink, 1997). It has previously been
belived that that biological systems conserve energy in discrete amounts with a minimum
biochemically convertible energy of -20 kj mol*1 (Schink, 1997). Meaning that decay of
matter in the subsurface would stop before this minimum free energy is reached.
However this seems not to be the case in syntrophic association involving the degradation
of substrate by one species and removal by another it was found through experimentation
with co-culture that syntrophic relationships can metabolise near thermodynamic
equilibrium (AG' ~ 0 kj mol*1) (Jackson and Mclnemey, 2002). Previous studies have
reached the conclusion that most subsurface cells must be adapted to extremely low
energy or are dead or dormant (D'Hondt et al., 2002a), this however only was considered
in the presence of sulphate reducers and methanogens.
6

Chapter 1 Introduction
1.3 Major subsurface metabolisms
The following sections introduce the major subsurface metabolisms in order of idealised
occurrence in the subsurface.
1.3.1 Denitrification and ammonification (Fig 1.4)
Denitrification, is a dissimilatory process in which nitrate rather than oxygen is used as
electron acceptor by microorganisms. Respiratory reduction of nitrate (denitrification) is
recognized as the most important process converting biologically available (fixed)
nitrogen to N2 (also anammox section 1.3.2). In current N cycle models, a major
proportion of global marine denitrification (50-70%) (Gruber and Sarmiento, 1997;
Codispoti et al., 2001) is assumed to take place on the sea floor, particularly in organic
rich continental margin sediments. During denitrification, dissolved NO3- is reduced to
N2 gas through a series of intermediates (NO2-, NO, and N2O ) which can be catalysed
by various genera of bacteria e.g. Pseudomonas spp, the following reactions outline the
process (Knowles, 1982)
Each step in the above reaction is catalysed, by a specific enzyme. If the succession of
reactions stops at any step, this liberates the product of that reaction into the environment.
These reactions are carried out by a diverse range of facultatively anaerobic bacteria
under anaerobic or low O2 conditions (Jeter and Ingraham, 1996). Nitrate ammonification
and denitrification share the same initial step Eq 1.1, which uses the iron-molybdenum
containing nitrate reductase enzyme, whose synthesis is suppressed by O2. Species such
NO3' + 2H++ 2e ->N 02 +H20
N 0 2 + 2H+ +e- —> NO + H20
2NO + 2H+ + 2e‘ N20 + H20
N20 + 2H+ + 2e -> N2 + H2Q
Eq 1.1
Eq 1.2
Eq 1.3
Eq 1.4
7

Chapter 1 Introduction
as Escherichia coli or Staphylococcus camosus at this stage either excrete the NO 2’ or
reduce it further to NH4' (Neubauer and Gotz, 1996)
(Photosynthesis)I
t
NH/ * n o 2 NO,AerobicNH4*oxidizers
Aerobicn o 2oxidizers
Interface
NH/ <--------— N 0 2 « j NOj-
» \Anammoxx^*% *
; / %* Organotrophic N 02; ^ N an< reduction! 2 with formate, acetate
Anaerobic mineralization and proprionate byof dead organic matter anammox bacteria
Fig 1.4 Interaction competition among aerobic and anaerobic nitrifers and Denitrifiers from (Kuenen, 2008)
1.3.2 Anaerobic ammonium oxidation (anammox)
Co-occurring with denitrifraction anaerobic ammonium oxidation (anammox) is now also
considered a key part in the marine nitrogen cycle. Anammox can be coupled to NO 2 '
reduction to produce N2 , Eq 1.5. Anammox involves hydrazine as an intermediate and
forms N2 by a one to one combination o f nitrogen from two sources (Strous et al.. 1999a;
Jetten et al., 2005).
8

Chapter 1 Introduction
NO2' + NRt+ -> N2 + 2H20 Eq 1.5
The discovery of anammox and its linkage to nitrate is relatively recent (Mulder et al.,
1995) although the occurrence of this processes in nature has been hypothesised for quite
some time (Broda, 1977) it was deemed one of the “missing” reactions. The organism
directly responsible for anammox was found to be a specialised group of prokaryotes
belonging to the Plantomycetes and metabolism is limited to this group (Strous et al.,
1999b; Schmid et al., 2005). The first identification of anaerobic ammonium oxidation in
marine sediments was provided by (Thamdrup and Dalsgaard, 2002; Kuypers et al.,
2003). Anammox type reactions are now thought to contribute significantly to the
production of N2 along with denitrification in the marine environment. In marine
sediments NO3' is more abundant than NO2’ and it has previously been thought that
anammox must rely on other external processes to reduce N0 3 '(Dalsgaard and Thamdrup,
2002). However, this does not necessarily have to be the case, it is now clear that the
metabolism of anammox species is more diverse than previously thought, they can use
organic acids such as acetate/formate as electron donors to reduce nitrate and nitrite thus
allowing them to outcompete heterotrophic denitrifiers. The reduction of nitrate (NO3 )
can be achieved by anammox bacteria such as Kuenenia stuttgartiensis, however this
does not proceed through conventional denitrification via N2O. Rather reduction of NO3'
to NH#* occurs via dissimilatory nitrate and nitrite reduction which can subsequently
convert nitrite and NH4' to N2 by the standard anammox reaction Eq 1.5 (Kartal et al.,
2007). This allows anammox bacteria to join in the competition for nitrate in marine
sediments, where NO3' is substantially higher than NO2’ (Jaffe, 2000).
1,3.3 Dissimilatory metal reduction
Metals have long been known as key components in proteins used for transferring
electrons to key acceptors in microbial metabolisms e.g. O2 and SC^2*. It is only relatively
recently that metals have been proven to be used as external terminal electron acceptors
themselves, capable of supporting microbial metabolisms this is called dissimilatory
metal reduction. Here we concentrate on the use of iron (Fe3+) as it is the most studied in
9

Chapter 1 Introduction
the natural environment, iron is also the 4th most abundant element in the earths crust and
is therefore readily available for microbial interaction. Mn(IV) reduction will also be
mentioned. It is also worth mentioning that other metals such as U, Se, Cr have also been
studied in relation to microbial activity. (See (Lovley, 1993) for a review).
Iron is often the most abundant electron acceptor in many sedimentary
environments and microbial reactions involving the reduction of Fe(III) minerals have
been shown to be the primary reductive process in non-sulphidogenic sediments (Lovley,
2000). Microbial activity of this kind involving both Fe(III) and Mn(IV) may account for
the majority of the oxidation of organic matter in sediments, and has previously been
shown to be responsible for 50-80% of oxidation in near coastal sediments in Denmark
and Norway (Canfield et al., 1993a; Canfield et al., 1993b) and close to 80% in Atlantic
coastal sediments (Aller, 1990). Microbes from both the Archaea and Bacteria can
exploit this energetically favourable redox potential. One of the first bacteria studied in
pure culture involved in Fe(III) reduction was Geobacter metallireducens which can gain
energy from the coupling of Fe(III) reduction to the oxidation of H2 (Lovley et al.,
1993b). Since then several hypherthermophilic Archaea, and sulphate reducers have aft
shown the ability to reduce Fe(III) (Lovley, 2004).
Dissimilatory Fe(III) reduction is more energetically favourable with the use of
poorly crystalline Fe(III) oxide minerals such as ferric hydroxide e.g. goethite (FeOOH)
functioning as electron acceptors and these are the preferred solid phase ferric iron for Fe
reducing prokaryotes (Lovley and Philips, 1987). However, iron oxides in marine
sediments predominately exist as the harder less thermodynamically favourable
crystalline oxides such as hematite (Fe2C>3) and magnetite (Fe304). Some studies using
laboratory experiment have shown that some Fe reducing microbes e.g. Shewanella
putrefaciens, strain CN32 are capable of obtaining the same energy yield from the
crystalline and the poorly crystalline minerals, resulting in the formation of biogenic
Fe(II) minerals such as siderite/vivanite (Kostka et al., 1996; Roden and Zachara, 1996;
Fredrickson et al., 1998). These studies environmental relevance have been criticised, due
to being conducted under too high nutrient concentrations which bear little resemblance
to actual environmental conditions in situ (Glasauer et al., 2003; Lovley, 2004). Other
10

Chapter 1 Introduction
studies have shown that microbes can generate enough energy for survival by reducing
the Fe(III) component in smectite clays (Kostka et al., 2002). G. metallireducans was
also found to reduce goethite beyond the amorphous Fe(III) oxide content, which is an
indication of microbial reduction of crystalline Fe(III) oxide in the environment (Weber
et al., 2006b). Iron (III) minerals are insoluble at pH values greater than 4. Therefore it
has been proposed that direct contact between the bacteria and the iron oxide is necessary
for the use of that mineral as the terminal electron acceptor. Some theories have been put
forward as mechanisms of how this can be achieved. Most of this work has been done
using either Geobacter spp. or Shewanella spp. Geobacter spp were found to form
flagella or pili thus being able to attach directly to the oxide (Childers et al., 2002). These
pili function as conducts transferring electrons to insoluble Fe(III) oxides and maybe
other terminal electron acceptors (Reguera et al., 2005). These nanowires are not
exclusive to Geobacter species and certain species of Shew anella may also produce them
under harsh electron limited conditions (Gorby et al., 2006).
Extracellular electron shuttles such as humic acids and certain antibiotics, have
also been proposed as a means of solving the problem of direct attachment, these shuttles
can be exploited as mediators to complete the transfer of electrons to the solid oxide
(Lovley et al., 1996; Newman and Kolter, 2000; Turick et al., 2002). Using a
combination of abiotic and biotic processes, the bacteria oxidize an electron donor
coupled to the reduction of the soluble electron shuttle. The shuttle donates electrons
abiotically to the oxide (Turick et al., 2002). Fig 1.5 shows a diagram of use of electron
transfer by microbes using both shuttles and nanowires, taken from (Weber et al., 2006a)
11

Chapter 1 Introduction
Electron . shuttle reduced
Electron'shuttleau d ited
Fig 1.5 Three primary strategies have been proposed to facilitate the electron transfer between microorganisms and solid Fe(lII) oxide surfaces, a | In Geobacter spp. direct contact with the oxide surface is required. The production of ’nanowires', conductive extracellular appendages, facilitates electron transfer by functioning as an electrical conduit to the Fe(III) oxide surface, b | An endogenously or exogenously produced electron shuttle mediates electron transfer to solid-phase Fe(III) oxides, c | The production of complexing ligands as in the case of Geothrix sp. aids in the dissolution of the solid-phase Fe(III) oxide prosiding a soluble Fe(IU) form more readily available to the microorganism. Although these strategies have only been demonstrated for Fe(III)-reducing microorganisms, similar strategies might be used by Fe(II)-oxidizing microorganisms that are utilizing solid-phase Fe(II) electron donors. From (Weber et al.. 2006a)
Oxidation o f Fe(II) anaeorbically is less well studied, and has been coupled to
nitrate reduction in marine sediments where it has been found to occur in certain
hydrothermal systems and deep sea sediments (Straub et al., 1996; Edwards et al., 2003).
In pure culture it has only been demonstrated in Ferroglobus placidus and a Beta
proteobacteria (Hafenbradl et al., 1996; Weber et al., 2006c)
Although substantial amounts are known about the role o f Fe reduction it is still
only in it infancy. The physiology o f Fe(III) reduction and Fe(II) oxidation is unknown a
terminal Fe(III) reductase has yet to be identified, but it is clear that these type of
reactions play a major role in biogeochemical cycles.
12

Chapter 1 Introduction
1.3.4 Sulphate reduction
Sulphate reduction is an important process in marine sediments; this is due to the high
concentration of the SC>42' in seawater (~29 mM). Sulphate reduction is controlled by
sulphate reducing bacteria (SRB). This is a generic term used as both Bacteria and
Archaea have been found to perform dissimilatory sulphate reduction. SRBs are
anaerobic microorganisms, which utilise sulphate as the terminal electron acceptor in the
degradation of organic compounds, resulting in the production of sulphide. Rates of
sulphate reduction can vary in marine sediments from picomole per cubic centimetres per
day in deep sediments, to many thousand nanomoler per cubic centimetre per day in near
surface sediments (Canfield and Teske, 1996). It has been estimated that sulphate
reduction can account for more than 50% of the organic carbon mineralization in marine
sediments (Jorgensen, 1982). Physiologically metabolisms employed by SRB are diverse
a large diversity of sulphate reducers have been found.
Using molecular microbiological techniques sulphate reducers can be grouped
into seven phylogenetic lineages which span both the Bacteria (5) and the Archaea (2).
Archaeal sulphate reducers fall into the Euryarchaeota {A rchaeoglobus, e.g
Archaeoglobus profundus (Burggraf et al., 1990)) and the Crenarchaeota
(Thermocladium (Itoh et al., 1998) and Caldirvirga (Itoh et al., 1999)). The majority of
sulphate reducers fall within the bacteria with 23 genera within the Delta proteobacteria
(e.g. Desulfovibrio spp and Desulfobacteraceae). The remaining groups are within the
Clostridia (e.g. Desulfosporosinus, Desulfotomaculum) and 3 lineages which contain
only thermophiles Nitrospirae, Thermodesulfobiaceae, and Thermodesulfobacteria . See
Fig 1.6 for a phylogenetic tree for all described sulphate reducing species.
Two major metabolic groups have been identified in the sulphate reducers, which
depends on their ability to oxidise acetate, group one incompletely oxidises compounds
such as lactate, propionate and formate to acetate, while group two completely oxidises
acetate all the way to CO2 (Widdel, 1988). Many SRBs are also able to grow
chemolithoautotrophically by using H2 as an electron donor. Table 1.2 show common
sulphate reducing reactions found in subsurface sediments.
13

Chapter 1 Introduction
OX)
Desutfobulbaceae
Desulfobacteraceae
Desutfobactermm aniltni (AI237601) DesUtforcuhjs baarsii (AF418T74)
Syntrophobacteraceae
C Desutfomonie limknaris (AF282177) Desulfomonile tiedjei (AM086646)
Deltaproteobacteria
Desutfovibrio spp.
r Desutfonatronum bcustre (AF418T71) Desutfonatronum thiodismutans (AF373920)
- Desutfonatronum cooperativum (AY725424)— Desutfonatronwibno hydrogenovorans (X99234)
Desutfomicrobium spp.
Desutfocaldus terraneus (AY464939)
Desutfohalobtum spp
_ Tbermodesutfcwbrio istandkus (X96726)
fft"I Do
Thermodesutfowbrioyetkxvstonii (AB2318S8) Desutfosporomusa potytropa (AJ006605)
Nitrospirae
Clostridia
Desdfosporosinus orientis (AJ493052)Desutfosporosinus youngu (DQT17470)
Desutfosporosmus rrtendtei (AF076247)
Desutfotomocutum spp.
Thermodesutfobium narugense (AB077817) Thermodesulfobiaceae
:- Thermodesutfobocterium hveragerdense (X96725)- Thermodesutfobocterium thermophihjm (AF334601) Thermodesutfobocterium commune (AF418169) Thermodesutfobocterium hydrogenphHum (AB325W)
Thermodesulfobacteria
Thermodesufotator indcus (AF393376)I Archoeogbbus profundus (AF297529)[i— Archoeogtobus venefbus (AF418181)*— Archoeogtobus hthotrophbus (AJ299218)
Thermododtum modestbs (AB005296)Catdrvrga moquiingensa (AB013926)
Euryarchaeota >32-<%
Crenarchaeota *
Fig 1.6 Phylogenetic tree based on nearly complete 16S ribosomal RNA gene sequence of described sulphate-reducing bacterial species (Muyzer and Stains, 2008)
14

Chapter 1 Introduction
Table 1.2 Sulphate reducing reactions, from (Muyzer and Stams, 2008)
Sulphate reducing reactions
AG°’*
(KJ/reaction)
4H2 + SO42' + H+->HS* + 4H20 -151.9
Acetate‘+SC>42'—>2 HCC>3‘ + HS' -47.6
Propionate* + 0.75 SO42' —> Acetate* + HCO3' + 0.75HS* + 0.25H+ -37.7
Butyrate* + 0 .5 SO42* —> 2Acetate* + 0.5 HS* + 0.5H+ -27.8
Lactate* + O.5 SO42—> Acetate* + HCO3* + 0.5HS* -80.2
*Calculated from (Thauer et al., 1977)
As mentioned above a huge range of sulphate reducers have been described although
acetate and hydrogen is the most common in the marine environment. The diversity of
substrate utilisation is large, sulphate reducers have been found to use the following
substrates, amino acids (Baena et al., 1998), methanol (Nanninga and Gottschal, 1987;
Nazina et al., 1987), carbon monoxide (Henstra et al., 2007), methanethiol (Tanimoto and
Bak, 1994), sugars (Sass et al., 2002), long chain alkanes (Aeckersberg et al., 1998) and
alkenes (Grossi et al., 2007).
The energetics of sulphate reduction is as follows, the sulphate ion is very stable,
therefore before reduction can take place, sulphate must be activated by the enzyme ATP-
sulphurylase. This reaction involves the attachment of sulphate to a phosphate group of
ATP (formation of adensine phosphosulfate APS). Pyrophosphate is also released as a
result of this reaction and is hydrolysed by the enzyme pyrophosphatase to 2 -phosphate.
ATP is then reduced to sulphite by APS reductase, which releases adenosine
monophosphate. Once sulphite is formed it is further reduced to H2S by a series of
intermediate reactions these intermediates, which may include thiosulphate and other
sulphur compounds, can be excreted from the cell, into the surrounding environment
becoming available for use by chemolithotrophs.
Some members of the sulphate reducing bacteria are able to gain energy through
disproportionation reactions. This involves using sulphur compounds of intermediate
oxidation state. Disproportiontion refers to the splitting of a compound in two, one which
is more oxidised and one which is more reduced than the original compound. Substrates
include, sulphite Eq 1.6, thiosulphate Eq.1.7 and sulphur Eq.1.8 being converted into
15

Chapter 1 Introduction
both sulphide and sulphate (Bak and Cypionka, 1987; Bak and Pfennig, 1987; Thamdrup
et al., 1993; Lovley and Phillips, 1994; Bottcher et al., 2005).
4S032' + 2H+ -> 3SO„2' +H2S Eq 1.6
S20 32' + H20 -► S042’ + H2S Eq 1.7
4S° + 4H20 -> S042' + 3H2S + 2H+ Eq 1.8
Disproportion of reaction 1.8 is often linked to formation of sulphide minerals, it is only
when the H2S is oxidised and incorporated into these minerals that the reaction becomes
suitably energy yielding for microbial metabolism (Thamdrup et al., 1993).
Sulphate reducers do not necessarily have to use sulphate as a terminal electron
acceptor, other compounds that can be used for growth include reduction of nitrate to
nitrite and the use of inorganic compounds such as Fe(III), arsenate (As(VI) or chromate
(Cr(VI) (Lovley et al., 1993a; Lovley and Philips, 1994; Macy et al., 2000). In the marine
environment dimethlysulphoxide has been found to be used (Jonkers et al., 1996).
Sulphate reducers have been found in all marine environments including
sediments (Parkes et al., 1993; Webster et al., 2006) and hydrothermal systems
(Jorgensen et al., 1992; Teske et al., 2002). Sulphate reducers are also found in
freshwater sediments (Sass et al., 1998), where sulphate concentrations are low and are
thought to play a major role in fermentation. The gene dsrAJB is a genetic marker for
sulphate reducers and specific primers targeting this can be used as a means of estimating
the numbers of sulphate reducers in subsurface samples.
1.3.5 Methanogenesis
Methane production in marine sediments is very significant and is estimated at between
75-320 Tg year'1 (Valentine, 2002). Methane is an end product of the degradation of
organic matter under anoxic conditions when inorganic oxidants such as nitrate, ferric
iron or sulphate are depleted. Methanogens are a group of Archaea that derive energy
from the production of methane. They are relatively physiologically diverse, and can be
divided into 3 groups according to their substrate usage these are CO2, acetate, and
16

Chapter 1 Introduction
methyl-group utilising (H2, CO2 , acetate, formate, methanol, methylamines and CO)
(Boone et al., 1993; Thauer, 1998; Thaur, 1998; Garcia et al., 2000; Ferry and Kastead,
2007).
Most methanogens are hydrogenotrophs and can reduce CO2 to CH4 by using H2 as the
primary electron donor. Many can also use formate similarly as an electron donor. Some
species have also been found to utilise some secondary alcohols such as 2 -propanol and
2-butanol (Widdel, 1986; Frimmer and Widdel, 1989).Only two genera can use acetate
for methanogenesis those are Methanosarcina and Methanosaeta, and only one order so
far has been found to utilise methyl group containing compounds and these are limited to
the order Methanosarcinales with the exception of Methanosphaera which belongs to the
order Methanobacteriales. Five orders of methanogens have been identified by molecular
analysis these are Methanobacteriales, Methanococcales, Methanomicrobiales,
Methanosarcinales and Methaopyrales. Table 1.3 contains a list of various microbial
metabolisms (excluding CO metabolism which is mentioned in the next section).
Table 1.3.Reactions and standard changes* in free energies for methanogenesis
Reaction AG°’ ( KJ/mol CH4)4 H2+CO2—>CH4+2 H20 -135.64 Formate—»CH4+3C0 2 +2 H20 -130.12 Ethanol+C0 2 ->CH4+2 Acetate -116.3Methanol+H2->CH4+H20 -112.54 Methanol—>3CH4+C 02+2H20 -104.94 Methylamine+2 H2 0 —»3CH4+C0 2 +4NH4 -75.04 Trimethylamine+6 H2 0 —>9CH4+3C0 2 +4NH4 -74.32 Dimethylsulfide+2 H2 0 —>3CH4+C0 2 +H2S -73.82 Dimethylamine+2 H2 0 —>3CH4+C0 2 +2NH4 -73.24 2 -Propanol+C0 2 —»CH4+4 Acetone+2 H2 0 -36.5Acetate—»C H4+C O2 -31.0
a: calculated from the free energy o f formation o f the most abundant ionic species at neutral pH. Thus, C 02 is HCO' +H~ and formate is HCOO'+H". Taken from (Garcia et al., 2000)
Anaerobic growth of methanogens on carbon monoxide is rare and is therefore not
included in Table 1.3. Certain methanogens e.g Methanosarcina acetivorans have the
ability to utilise CO for energy production. Eq 1.9
17

Chapter 1 Introduction
4CO + 5H20 -> CH4 + 3HCO3' + 3H+ AG°’ = -195.6 kj/mol CH4 Eq 1.9
Even more interesting is the fact that M. acetivorans is able to employ the acetyl-CoA
pathway as an alternative to methanogenesis, producing acetate and formate, but not
hydrogen when methanogenesis cannot proceed at its maximal rate (Rother and Metcalf,
2004). Methane production in the subsurface is limited in the presence of sulphate due to
the competitive nature of the substrate. Sulphate reducers are able to utilise compounds
like H2 & acetate at lower concentrations than methanogens and thus out compete them in
the presence of S 042'(Kristjansson et al., 1982; Oremland and Polcin, 1982; Lovley and
Goodwin, 1988).
Hence the majority of methane production in the subsurface occurs after sulphate
and compounds such as ferric iron have been removed. This is generally but may not
always be the case as several studies have shown methanogenesis occurring in zones of
high sulphate concentrations (D'Hondt et al., 2002b; D'Hondt et al., 2004). This may be
due to the fact that the sulphate reducers and methanogens are not competing for similar
(i.e non competitive) limited substrates e.g. H2 and methanol. Carbon isotope values of
CH4 indicate that the majority of methane from near surface sediments is as the result of
H2/CO2 methanogenesis (Whiticar et al., 1986; Whiticar, 1999). However, the role of
acetoclastic methanogenesis may be greater than previously appreciated at depth, recent
studies have indicated that the amounts of acetate available in the subsurface may be
greater than realised (Wellsbury et al., 1997; Parkes et al., 2007).
The majority o f methane produced in marine sediments, does not reach the water
colum. Methane migrates upwards and is removed when it reaches the sulphate zone,
through the processes of anaerobic methane oxidation AOM. The amount of methane
removed varies according to sample site from 80% (Orphan et al., 2001a) to 100%
(Niewohner et al., 1998). This process is coupled to sulphate reduction and is discussed
in the next section.
18

Chapter 1 Introduction
1,3.6 Anaerobic oxidation of methane (AOM)
It has been hypothesised for many years that methane oxidation in marine sediments has
been the primary sink for methane in the sulphate reduction zone (Reeburgh, 1976,
1980). The exact metabolic process of AOM is unknown this is due to the fact that the
micro organisms involved have yet to be isolated (Niewohner et al., 1998; Hinrichs and
Boetius, 2002). The suggested model is the use of sulphate as the terminal electron
acceptor in the process according to equation 1.10 (Bames and Goldberg, 1976). This
was due to the observation that AOM peaks co-occurred with increases in sulphate
reduction rates.
CH, + SO42' -> HCO3' + HS' + H2O Eq 1.10
The thermodynamics of this reaction are unfavourable with only a low energy yield per
reaction. It was therefore suggested that a consortium of microorganisms were involved
in AOM. It was found by Hoehler et al., (1994) that AOM was possible as long as H2
concentration is kept low they suggested that two syntrophic partners are involved,
relying on interspecies hydrogen transfer, a methanogen mediating the oxidation of
methane and a sulphate reducer scavenging the intermediate hydrogen.
CH4 + 2H20 -> C 02 + 4H2 Eq.1.11
SO42' + 4R,+H+-» HS' + 4H20 Eq 1.12
The question of whether AOM can support microbial growth has long been debated. This
appears to have been answered when extremely high amounts of microbial biomass
which contained aggregated methanogens through the presence of anaerobic
methanotrophic archaea (ANME sequences) and sulphate reducing bacteria thought to be
involved in AOM were found in sediments above marine gas hydrates (Boetius et al.,
2000). The biomass of the AOM consortia was far higher than the surrounding sediment.
The use of acetate in AOM has also been hypothesised due to the 16S rRNA gene
and biomass/lipids biomarker work, anaerobic methanotrophs are extremely d13C-
depleted demonstrating carbon from 13C depleted CH4, identifying species of sulphate
19

Chapter 1 Introduction
reducers closely related to known Deltaproteobacteria that oxidize acetate (Hinrichs et
al., 1999; Boetius et al., 2000; Hinrichs et al., 2000; Pancost et al., 2000; Orphan et al.,
2001b). Although thermodynamically the use of acetate is unattractive as concentrations
would have to be lower than 2 nM (Boetius et al., 2000) and in situ concentrations are
often in the low mM range. The use of formate is also thought possible (Sorensen et al.,
2001) (use of acetate is as follows Eq 1.13 and Eq 1.14)
CH4 + HC03 -> CH3COO' +H20 Eq 1.13
SO42' + CH3COO —> HS' + 2 HCO3' Eq 1.14
Anaerobic methane oxidation has also been coupled to denitrification (Raghoebarsing et
al., 2006) in fresh water sediments. Eq 1.15 and 1.16 with a preference for nitrite over
nitrate, this is thought to be a reflection of the AG°’ of each, nitrate -795 kJ mol'1 and
nitrite -928 kJ mol'1 per mole of CH4
5CH4 + 8N 03' + 8H+ -> 5C02 + 4N2 +14H20 Eq 1.15
3CH4 + 8N 02' + 8H+ -> 3C02 + 4N2 + 10H2O Eq 1.16
Through the use of biomarkers and 16S rRNA gene analysis, the dominating Archaea
found in areas of active AOM in the marine environment have been closely related to the
Methanosarcinales (ANME-2) and/or sequences that form a unique cluster (ANME-1).
Although ANME-1 is distinct it is related to the Methanomicrobiales and
Methanosarcinales. SRB species detected are closely related to the Desulfosarcina /
Desulfococcus (Boetius et al., 2000; Hinrichs et al., 2000; Pancost et al., 2000; Orphan et
al., 2 0 0 1b) while those found in freshwater involved in denitrification bacterially are
unique and distant from all other subdivisions, the Archaea were also quite unique, but
were distantly related to ANME-2.
20

Chapter 1 Introduction
1.3.7 Isotope systematics o f methane formation and oxidation
Through the use o f ( ,3 C /12C) and (D/H = 2 H /1H) isotopes it is possible to track the uptake
by methanogens o f either CO 2 or other reduced carbon substrates e.g. acetate. The
bacterial reduction o f CO2 to CH4 is associated with a kinetic isotope effect, which
discriminates against 13C yielding specific values for the separation between CO2 and
CH4 (ec). This value varies according to the substrate used and can be plotted to show the
source o f CH4 (H2/CO2, acetate or thermogenic origin) which is related to specific
methanogenic environments e.g. marine and freshwater. The generally accepted model
for usage is the Whiticar model Fig 1.7 (Whiticar et al., 1986; Whiticar, 1999)
C-, H-isotope signatures of CH4 sources-120
m ' 1 0 0aQ_
*1 -8 0
/ Bacterial Carbonate ReductionBacterial
<33c03
S Z
mix v.A~.Bacterial
Mefrryl-Type-60<DE
6 -4 0 CO
-20
-450 -650 -250 -150 -505D-methane (%©, SMOW)
Fig 1.7 CD-diagram for classification of prokaryotic and thermogenic methane sources by combination of S 13C c h 4 and 6 D ch4 data (Whiticar, 1999)
21

Chapter 1 Introduction
Differentiation between thermogenic and biotic CH4 is achieved through analysis of the
5 13C-CH4 values. Thermogenic methane is enriched with I3C compared to prokaryotic
methane and according to the model (Fig 1.7) has a range extending from -50%o to -20%o.
It is also possible to classify thermogenic methane according to source rock type and
maturity level (Schoell, 1988; Whiticar, 1994). Prokaryotic methane production has a
broader range of values than thermogenic. Ranging from ~ -1 10%o to -50%o (Fig 1.7).
Use can also be made of the model to infer the prokaryotic pathway with the labelling if
methyl-type substrates which is more common in fresh water (acetate usage) with the
remainder being inferred as H2/CO2 (prokaryotic carbonate reduction) cut off at
approximately -60%o between both types lower than -60%o H2/CO2, higher acetoclastic
1.3.8 Acetogenesis
Acetogenesis is an important process in subsurface sediments. Acetogens use the acetyl-
CoA pathway for the reduction of CO2 to the acetyl moiety of acetyl-coenzyme A, to
conserve energy and assimilate CO2 into cellular carbon (Drake, 1994). Acetogens are
strictly anaerobic and similar to methanogens, H2 is the major substrate. Acetogens are
quite diverse and over 100 acetogenic species, representing 22 genera have been isolated
from a large variety of environments (Drake et al., 2008). Homoacetogens produce
acetate by using H2 as an electron donor and coupling it to CO2 reduction.
4H2 + H++ 2HC03' -► CH3COO" + 4H20 AG°’ -104.6 kj/reaction Eq 1.17
In addition to H2 many other compounds can be used as an electron donor in acetogenesis
such as amino acids, sugars and alcohols, but this entails intermediate H2
production/consumption. Reduction of NO3' and S2O3 ' is also possible via the usage of
CO2. All acetogens use the same pathway of CO2 reduction namely the acety-CoA
Wood-Lungdahl Pathway. This is the distinguishing feature of all acetogens. The acetyl-
CoA pathway (Fig 1.8) is a reductive, linear one carbon process and thus is very different
than other CO2 cyclic fixing processes (e.g Calvin cycle) which depends upon recycled
22

Chapter 1 Introduction
intermediates (Wood, 1991; Wood and Ljungdahl, 1991). The acetyl-CoA pathway is a
divided into two branch’s. One branch reduces CO 2 to the methyl group o f acetate and
the other reduces CO2 to the carbonyl group o f acetate. Both compounds then merge to
synthesise acetyl-CoA, which is subsequently converted to either acetate or assimilated
into biomass. Acetyl-CoA synthase not only catalyzes the reduction o f CO 2 to CO and
the synthesis o f acetyl-CoA but can also oxidises CO to CO 2 . Different subunits o f
acetyl-CoA synthase are capable o f catalyzing different reactions (Wood and Ljungdahl,
1991; Ljungdahl. 1994; Ragsdale, 1997). The conservation o f energy occurs through
substrate level phosphorylation and chemiosmotic processes. Four ATP are produced for
each glucose that is converted to 3 acetates Fig 1.8. However substrate level
phosphorylation produces no net gain in ATP. Thus growth o f acetogens under these
conditions is depended on chemiosmotic energy conserving processes and translocation
of protons and sodium ions.
Fig 1.8 The acetyl-CoA Wood-Ljungdahl pathway, showing both branches of C 0 2
reduction front (Drake et al., 2008)
Methyl Branch Carbonyl Branch CO,
KCOOH
Acm^KaA
ICH01-H4P
2 rICH}-H«F
O M y*opaiM »
I —2 r
ADP CHjCOO-POj*
CHjCOOH
*Assimilation Into Cailular Carbon
23

Chapter 1 Introduction
C,H,AGlucose
2 ATP.
2 Pyruvate
-*• 2COa♦ 4 !• ] -
2 Acetytphosphate
2 CHjCOOH
2 ATP.
3 CHjCOOH ♦ 4 A T P ^
8[e]
CHjCOOH
2 CO,
Fig 1.9 Homoacetogenic conversion of glucose to acetate.
Homoacetogenic bacteria (e.g. Acetobacterium u oodii) are often found in association
with methanogens. Homoacetogenises is the energy metabolism involving the production
o f acetate from either H2 plus CO 2 or other organic compounds. Certain Homoaceogens
ferment sugars such as glucose (Fig 1.9) Eq 1.18 to acetate and H2 via a pyruvate
intermediate.
2 CH3H 3 0 3 '(pyruvate) + 2H20 -> 2CH3COO + 2 C 0 2 +2H2 AG° =104 kj/reaction Eq 1.18
A syntrophic relationship develops between homoacetogens and methanogens both
substrates o f this reaction can be consumed during methanogenesis H2 (interspecies
hydrogen transfer) and acetate. This is a benefit to the acetogens, removing waste
products and keeping H2 concentration low. If the H2 concentration is two high the above
(Thiele and Zeikus, 1989) reaction (1.18) becomes thermodynamically unfavourable.
Microbial acetogenesis rather than abiotic generation has been found to be the principal
source o f acetate generation in the marine subsurface (Chapelle and Bradley, 1996) and
24

Chapter 1 Introduction
normally acetogens and methanogens are in direct competition for H2 with the exception
of acetoclastic methanogens. Most methane from the subsurface is thought to come from
H2/CO2 (Whiticar, 1999). However similar other studies have found that acetate may play
a significant role in fuelling other microbial processes (Wellsbury et al., 1997; Wellsbury
et al., 2002; Parkes et al., 2007) and perhaps the role of acetate is not fully appreciated in
subsurface environments.
1.4 Molecular characterisation of subsurface communities
Due to the low cultivability of prokaryotes in the subsurface, molecular methods based on
16S rRNA gene analysis are the best way, currently available for the quantification of
communities in the subsurface, here we give a quick overview of the main community
composition of prokaryotes in the subsurface, found so far in 16S rRNA gene libraries.
This is to give the reader an understanding of the amounts and phylotypes present in the
subsurface, for comparison with the metabolisms mentioned previously and for reference
when examining clone libraries in the upcoming results chapters. Recent reviews (Teske,
2006; Fry et al., 2008; Teske and Sorensen, 2008) have examined published clone
libraries for subsurface sediments. Overall the most abundant subsurface bacterial groups
are the Gammaproteobacteria, Chloroflexi and members of the candidate division JS1
(Webster et al., 2004) which make up 62.3% of clone libraries and are present in 62-70%
of all libraries analysed. The remainder of the libraries are made up of Alpha-,Beta-Delta
and Epsilon proteobacteria (7.8%, 4.9%, 3.7% 2,1%) of the remainder of the clones
Planctomycetes are most abundant (2-26%) with the remainder novel species (Fry et al.,
2008) Fig 1.10 show the diversity of clones found so far in bacterial sub-seafloor clone
libraries
25

Chapter 1 Introduction
OOP Leg 128. Japan Sm. t in 788. 1 8-503 n o d [A: 25] OOP Log 140. Cascacis Margr. mat 886800 0 mbs? [6:100]OP Log 140. Caecad* Margn *•» 686 890 166 mod (B: 100]OP Log 140. Ceacada Margm. Me 688890 222 mbaf (6; 100]OP Lag 140. Caacada Margn. a«e 686 890 234 mod (B: 100]
Nankai Foraarc Basin. 105.5 mbaf [C: 37] Nankai Foraarc Basin. 240.4 mbef [C: 50) Nankai Foraarc Been. 287.0 mbef [C: 34]
Saa of Okhotsk, pslagic cay layars. 7.5 mod [D; 64] Saa of Okhotsk, pelagic day layars. 22.2 mbef [0 :02] Saa of Okhotsk, pa age day layers. 45 3 mbaf [0; 48] Saa of Okhotsk, peiag* day layars. 57.8 mbaf [0.75] Saa of Okhotsk, vdcanc ash layera. 18.3 irtjef [0 52] Saa of Okhotsk, volcanic ash layars. 24.8 mbaf [D: 01 j Saa of Okhotsk, volcanic ash layers. 30.8 mbaf ]0: 56]
Saa d Okhotsk, volcanic ash layars. 45.7 mbaf [D; 150] OOP Lag 180. Nankai Trou^v saa 1170. 1-86 mbaf [E: 31] OOP Lag 180. Nankai Trough, mm 1170. 184 mbaf [E: 23] OOP Lag 180. Hm*ai Trough, site 1173. 4.15 mbaf fF 38]
OOP Lag 201. Peru Margm, aid 1228. 0 7 mbef [G; 56] OOP Lag 201. Peru Margin, eto 1229. 302 mbaf [G: 86]
OOP Lag 201. Peru Margn. aits 1228. 42 03 rrtosf [G; 01] OOP Leg 201, Peru Margn K r 1228. 86 87 mbaf |G; 82]
OOP Lag 201. Pam Margin, saa 1227. -30 mbaf [H. 05] OOP Leg 201 Peru Margin, site 1227. -40 mbaf IH; 114] OOP Lag 201. Pern Margin, site 1230. -30 mbaf [H 47]
OOP Log 201. Pam Margin, ate 1230. -120 mbaf [H; 21] OOP Lag 201. Peru Margn. ails 1230. -200 mbef (H; 24]
OOP Leg 204. Cascade Margn arts 12445. -30 mbaf |H; 18] 30P Lag 204. Cascade Margin, aba 1244.5. -120 mbef |H: 20] 3DP Lag 204. Caacada Margin, mm 12446. -200 mbaf (H: 22]
OOP Leg 204. Cascade Margn mm 1251. -50 mbef pH. 23] OOP Lag 204. Caecada Margin, sue 1251. -120 mbaf [Ft 25] OOP Lag 204. Cascada Margn. site 1251. -200 mbaf [H; 23]
CD Alphaproteobactena
■ Betaproteobacteria
B Gammaproteobacteria
B Dettaproteobactena
B EpsMonproteobacteria B CNorolfexi (GNS)
BJ S l candidate division
B Planctomycetes
B Gram Positive Bacteria
B Cyanobacteria ■ OP8 candidate division
BNT-B2
B NT-B6
mothers
OOP Lag OOP Leg OOP Leg
Average
0.0 0.1 0 2 0.3 0.4 0.5 0.6 0.7 0B 0 8 1.0Proportion of donee «r*vn taxonomic groups
Fig 1. 10 Community composition of major taxonomic groups of Bacteria from 16S rRNA gene libraries at various sites and depths in the deep subseafloor biosphere (Fry et al., 2008)
Community composition o f archaea clone libraries are dominated by the Crenarchaeota
with 73.4% of clones belonging to the Crenarchaeota and 24.5 % belonging to the
Euryarchaeota (Fry et al., 2008) The most dominate group amongst the Crenarchaeota
fall within the Miscellaneous Crenarchaeotic Group (MCG) and the marine benthic
group B (Teske and Sorensen, 2008) which comprised 33% and 26% of clone libraries,
the next most abundant were the marine group 1 and the south African gold mine groups
8.4% and 7.6%. Thermophilic Euryarchaeota only account for < 8 % of clones libraries,
the majority o f clones are related to uncultured lineages. Fig 1.11 shows the community
composition o f archaea from various sites in the deep subseafloor biopshere
26

Chapter 1 Introduction
Martin Poraarc Beam.
Saa of OkftSaa ot Ofchotte uoteanieaeti
OOP Leg 190. Nank* Trough.OOP Lac 190 ktetai Troutfv
oi~
c eaMoyers a!si® 117c, 66'1
___________ Jv aaa 1173.4_____Lag 201 Peru Saw, aaa 1231.1 8 real Lag 201 Paru Baem. ate 1231. 6 0 mbef Leg2C1. Penj Beam. ate 1231. 43 moat
OOP Lag201 Pam Margin, ate 122B, 6.7& W & tt£rJSN S&OOP Lag 201. Peru Matgrrv ate 1229.88.87 mbaf OOP Lag 201. Pe«u Margm. ate 1229 29 4 meet OOP Lag 201, Paru Margm. area 1229. 86 8 mbat
OOP Lag 201. Equator® Patee. ate 1225.1 5 mbat OOP Lag 201. Equator® Paeftc. a * 1223. 78 mbat
OOP laeiOI. Peru Margm.ate 1225.~5 OOP Lag 201. Pam Margm a® 1225, -15OOP Leg __ _____ __ __________OOP Lag 201. Paru Margin, ate 1227 -30 treat OOP Lag 201. Paru Margm aaa 1227. -49 treat
OOP Leo 201. Peru Margn. ate 1227. 735 mbat I OOP LhZM Km MaagK ite i37T 21 38 MM
OOP Lagan, Peru Margn. ate 1227, 37 75 mbat OOP Lag 201. Peru Margm. ate 12Z7. 40-45 OOP Lag 201. Paru Margn. ate 1227 37 8 i OOP Lagan. Peru Margm. ate 1230. 11 1 mbaf OOP Lag 201. Peru Margn. ate 1230. -20 mbat OOP Lag 201, Paru Margn ate 1230. -120 — OOP Lag 201. Paru Margn ate 1230.-200
OOP Lag204. Caacarta Maron ate 1244.5 -30 OOP Lag 204 Caacacu Margm. ate 1244.3. -120 OOP Lag 204. Caacada Margn. ate 12443. -200c lI5&£2aawja«%i8OOP Lag 204. Caeceba Margn. ate 1251. -200
OOP Lag 210. Newtautend Margm. ate 1278.1.443 mbatOOP LagOOP Leg 210. Neteoudhnct Marge, ate 1278,1.828 mbaf
■ Marine Benthtc Group B ro mManne Group Im Marine Benthic Group A Ca MsceBaneous Cnnarcffeobc Gmr>W Unctdtured Crenarchaeota Group lib g
Marine Hydrothermal Vert Group W■ iiiiririe flBiftfc'Spqp D****a South Afhcan Gold M-ne Euryarchaeotal Gps 1 & 2
Terrestrial Miscetaneous Eiryarchaeotal Groi$> S a Methanogens §■ AW E p r Thermococcales I hyperthermophdes■ Unknown Euryarchaeota Group UE-Vt {■ Deepsea Hydrothermal Vent Euryarchaeotai Gp 6 mothers
K
09 0.1 02 03 04 05 08 07 03 09 19Proporton of don## wrtvn ta unnonwc group#
Fig 1.11 Community composition of Archaea 16S rRNA genes from various sites and depths in the deep subseafloor biosphere. (Fry et al., 2008)
27

Chapter 1 Introduction
1.5 Hydrogen driven Subsurface Lithoautrophic Microbial Ecosystems (SLiMEs)
The possible existence of a “Deep hot biosphere” independent of photosynthetic energy
supply and primary production was first hypothesised by Thomas Gold in 1992 (Gold,
1992). This involved the use of abiotically derived chemical compounds as a source of
energy for subsurface microbes such compounds included H2, CH4 and other
hydrocarbons. H2 is a good electron donor and can be utilised by many prokaryotes. This
hypothesis was ahead of its time in many ways and at the time the true extent of
subsurface microbial communities was unknown and unverified. So far only 3 proposed
examples of hydrogen driven communities occurring in the subsurface have been
proposed.
Stevens and McKinley (Stevens and McKinley, 1995) proposed a hydrogen
driven subsurface community in the Columbia river basalts. It was Stevens and McKinley
who first coined the acronym SLiME (Subsurface lithoautotrophic microbial ecosystem).
High concentrations of H2 are found in ground waters in the Columbia River Basalts
(~0.2-80pM). Which was proposed as the result of weathering of Fe(II)-bearing silicates
at high water rock ratios, where the oxidation of ferrous silicates and the precipitation of
magnetite (Fe3C>4) and other secondary phases driving H2 formation. This hydrogen was
proposed to be in high enough concentrations to support the indigenous prokaryotic
community independent of photosynthetically derived organic matter, as autotrophic
populations dominated the prokaryotic community. This type of community was summed
up by (Pedersen, 1997) see Fig 1.12
28

Chapter 1 Introduction
CH.
"geogae"
Fig 1.12 The deep hydrogen driven biosphere hypothesis, illustrated by its carbon cycle. At relevant temperature and water availability conditions, subterranean microorganisms are theoretically capable of performing a life cycle that is independent of sun driven ecosystems. Hydrogen and carbon dioxide from the deep crust of the earth or from sedimentary deposits of organic carbon can be used as energy and carbon sources. (Pedersen, 1997)
The assertion that the Columbia river Basalt aquifer (CRB) represented a
community living off geochemically produced H2 came under criticism (Anderson et al.,
1998) for a number of reasons. The molecular analysis of the CRB which had previously
been performed (Fry et al., 1997) showed that the microbial community composition
more closely resembled that of a heterotrophic community living off organic matter than
H2. Less than 3% of the microbial community was comprised of methanogenic
microorganisms. In the system that was proposed by Stevens and McKinley (1995) in
which the main electron donor was H2 (abiotically produced) and H2/CO2 methanogens
are the primary consumers of this, its follows that these should form the majority of the
community, which they did not. Also the amount of organic matter (DOM) found in the
CRB (Fry et al., 1997) is 2-5 mg/1 and it was noted (Anderson et al., 1998) that these
29

Chapter 1 Introduction
amounts of DOM have previously been enough to sustain deep pristine aquifers in which
the community was found to be heterotrophic. The final line of argument against the
presence of a H2 sustained community concerns the mechanism and amount of H2
production in laboratory experiments carried out with crushed basalt and artificial buffers
(Stevens and McKinley, 1995, 2000). While a range of pH values were tested continuous
H2 was generated at an artificially low pH with the highest concentrations of H2 produced
at pH 6 . Only low and unsustainable amounts were produced at pH 8 . This is a major
factor as basalt aquifers including the CRB are buffered at an alkaline pH (Hearn et al.,
1986). The breakdown of basalt minerals at low temperature in ground water consumes1 2 -
H and releases Ca and HCO3' with the precipitation of CaCOs, this combined process
buffers the system at pH ~8 . This vital factor makes the amounts of H2 produced at pH 6
in laboratory experiments not relevant to processes occurring in the CRB.
The Lidy hot springs are another proposed hydrogen based subsurface community
and unlike the CRB contains negligible concentrations of dissolved organic carbon <0.27
mg f 1 subsurface waters from the spring were 58.5°C (Chapelle et al., 2002). H2
concentrations were 13 ± 2 nM. The community structure matches a community
proposed to be driven by H2 99% of the community were archaeal with 62 out of 65
(95%) clones, sequenced being related to methanogens. However, no methane production
could be demonstrated which is unusual considering methanogens are dominant.
A HyperSLiME community which is a hyperthermophilic SLiME community is
proposed in the central Indian ridge at the Kairei hydrothermal field (Takai et al., 2004).
Mid oceanic ridge spreading centres are promising sites for SLiME communities due to
the low levels of dissolved organic carbon (DOC) and these areas are generally sediment
poor. Active geological processes may provide a readily available source of H2. At the
Kairei field the hydrothermal fluids emitted from the vents studied had high amounts of
H2 (2.5 mM) and low Mg concentrations indicated little mixing with the surrounding
seawater. Serpentinization type reactions are thought to be responsible for H2 formation
Relative high concentrations of CO2 were found (7.8-8 mM) as well as some small
concentrations of CH4 (84-199 nM). Molecular analysis showed an abundance of
Archaea similar to the Lidy hot springs. Unlike the Lidy hot spring however, 2 groups
dominated those being the Theimococcales and Methanococcales. Movement away from
30

Chapter 1 Introduction
vents produced a more diverse community structure with bacterial populations beginning
to dominate.
1.6 Abiotic sources o f Hydrogen generation in the subsurface
All SLiME communities proposed so far rely on sources of abiotically generated H2. The
following section will attempt to clarify these sources and processes. The production of2 +
hydrogen through the oxidation of Fe bearing minerals as proposed by Stevens and
McKinley (Stevens and McKinley, 1995) has already been discussed .
1.6.1 Serpentinization
The most speculated process providing H2 as a possible microbial energy source is
serpentinization of ultramafic rocks mainly composed of olivine [(Mg, Fe)2Si0 4 ] and
pyroxenes both orthopyroxenes [(Mg,Fe)-Si0 3 ] and clinopyroxenes [Ca(Mg,Fe)Si2 0 6]
with atomic Mg/Fe ratios of ~ 9:1. Owning to differences in mineralogy and bulk
chemistry the serpentinization of ultramafics which occurs in association with
hydrothermal processes results in a substantially different composition of vent fluid than
can be found with hydrothermal processes associated with basalt (Janecky and Seyfried,
1986; Wetzel and Shock, 2000; Allen and Seyfried, 2003)
The most common exposure of ultramafics is along axis of slow and very slow spreading
ridges where the mantle is too cool to form significant basalts (Sleep et al., 2004)
approximately 10% of oceanic crust is thought to form at these ridges (Dick et al., 2003).
At temperatures below 300°C and with low Si(aq) concentrations these rocks react withI
H2O to form hydrous Mg and Fe silicates and hydroxides Eq 1.19
Fe2Si04 + 5Mg2Si0 4 + 9H20 -> 3 Mg3Si20 5(0 H)4 + Mg(OH)2 +2Fe(OH)2 Eq 1.19
This fluid then oxidizes some of the Fe2+ to magnetite and liberates H2 gas which may
fuel associated biological reactions Eq 1.20
31

Chapter 1 Introduction
3Fe(OH)2 -> Fe30 4 + 2H20 + H2 Eq 1.20
The major difference between ultramafic rocks and basalt, which enables higher
concentrations of H2 to be formed in ultramafics, is the Si concentration, low Si results in
the formation of alteration minerals (e.g. serpentine), these minerals during formation
tend to exclude Fe(II) which leads to the formation of magnetite and H2 which at elevated
temperatures can also lead to CH4 formation, (which can therefore theoretically fuel H2
and AOM utilizers). In basalt which generally has a higher concentration of Si more
Fe(II) is incorporated into alteration minerals such as chlorite meaning less is converted
to Fe(III), resulting in lower amounts of H2 generation. This is somewhat unique to
ultramafics, H2 generation thus depends on the relative partitioning of Fe(II) into product
minerals (Bach et al., 2004). Huge amounts of H2 have been found associated with
serpentinization at deep sea hydrothermal vent fluids (12-16 mmol/kg (Charlou et al.,
2002; Kelley et al., 2005). Concentrations exceeding 100 mmol/kg have been found in
some circumstances and are thought to result from the presence of certain metal alloys
which catalyse hydrogen generation (Alt and Shanks, 1998). These have been reproduced
in the laboratory (McCollom and Seewald, 2001).
Basalt interaction with hydrothermal fluids result in H2 ~ 0.05-1.7 pmol/kg (Von
Damm, 1995). Another common product result from serpentinization is CH4 the
percentage amount of methane produced by various processes at vent fluids has yet to be
determined correctly (McCollom and Seewald, 2007) but is considered to be the result of
abiotic processes although it may also proceed through biotic functions. Basalt fluids are
often highly enriched in H2S leaving the oxidation of sulphur as the predominant source
of metabolic energy (McCollom and Shock, 1997; Kelley et al., 2002). Ultramafics on
the other hand are typically low in sulphur.
32

Chapter 1 Introduction
1.6.2 Pyrite formation
Other sources of water rock interactions which produce H2 is the formation of FeS2 from
FeS (Drobner et al., 1990).This involves the formation of pyrite at 100°C with H+ as the
oxidant under anaerobic conditions. The first time this was observed it contradicted the
previous hypothesis that the presence of elemental sulphur or sulphur equivalent
(polysulphide or thiosulphate) was required for pyrite formation. H2 formations was
linked to pyrite formation from both amorphous FeS or with synthetic pyrrhotite by the
following reactions
FeS + H2S-> Fe(SH)2 Eq 1.21
Fe(SH)2—> FeS2 + H2 Eq 1.22
Amounts of H2 formed varied from 0.2 to 40 pmol I'1 the most H2 was evolved from
reactions with amorphous FeS. Mineral products were pyrite and mackinawite (FeS].x)
1.6.3 Thermal decomposition
Thermal decomposition of alkanes and carboxylic acids has been proposed as a
mechanism for the production of H2 (Seewald, 2001). Experiments were conducted at
elevated temperatures of between 300-350°C in order to mimic hydrothermal conditions;
reaction systems were buffered with minerals such as pyrite magnetite and hematite. The
addition of these minerals seemed to stimulate previously unknown pathways. Results
indicated that decomposition of w-alkanes proceeds through a series of oxidation and
hydration reactions sequentially producing alkenes, alcohols, ketones and organic acids
(as intermediates). These organic acids subsequently underwent decarboxylation and or
oxidation reactions forming CO2 and some short chain saturated hydrocarbons with H2 as
a product. The highest H2 concentration achieved was 0.9 mM in the pyrite-pyrrhotote
and magnetite buffered assemblage. Lower temperature aromatisation of organic matter
in the presence of prokaryotes is also thought to result in the production of H2 (Parkes et
al., 2007) 20-90°C.
33

Chapter 1 Introduction
1.6,4 Radiolytic dissociation of water
It has been noted previously that molecular hydrogen and oxidants produced by the
radiolysis of water may provide energy sources in the deep subsurface (Pedersen, 1997;
Lin et al., 2005). In rocks and sediments alpha, beta, and gamma radiation which is
released by the decay of various radioactive elements, mainly uranium ( U), thorium
(232Th) and potassium (40K) which are the most abundant in marine sediments (Lin et al.,
2002) leads to the dissociation water molecules, producing molecular H2. Energy from
the alpha beta and gamma radiation is transferred to the water molecules leading to
excitation and ionisasation. Reactive species are formed as a result such as, (e'aq). protons
(H+), hydrogen radicals (H*) and hydroxyl radicals (OH*) (Draganic and Draganic, 1971)
These reactions are short lived and the subsequent reactions form molecular H2 and have
hydrogen peroxide H2O2, OH*,H+ and H* as products (Harris and Pimblott, 2002).
Additional H2 can be formed from the reaction of two H* or one H* and one e'aq and one
H2O molecule, and possibly also through the combination of two e‘aq ions with two H2O
molecules (Spinks and Woods, 1990).
In marine sediments the U, TH and K concentrations are similar to those in igneous
continental crust (Taylor and McLennan, 1985), but with the small grain size and higher
relative porosity and abundance of water throughout the sediment, the amount of
radiolysis is thought to be much higher. Studies on actual subsurface samples indicted
that H2 production by radiolysis fuelled as much as 10% of the metabolic respiration at
leg 201 (site 1231) during IODP cruises drilling on the deep biosphere (Blair et al.,
2007). It is also hypothesised that in ecosystems with extremely low rates of respiration
such as central ocean gyre, water radiolysis may be the principal source of electron
donors.
Very little is known about microbial communities in the deep sub seafloor. Even
less is known about SLiMEs, which may be occurring within hydrothermal sites. The
study of communities that are independent of photosynthesis could have great benefit not
just in terms of expanding our understanding of “dark energy’' sources (Bach and
Edwards, 2003) and the origin of life on this planet and the elements necessary for life to
34

Chapter 1 Introduction
survive, but also could be used as analogies for proposed microbial communities
occurring on other planets
35

Chapter 2 Materials and Methods
Chapter 2
Materials and Methods
This chapter contains and covers the main experimental techniques used during this
research project. Where adaptations and changes were made to the general procedure
these have been dealt with separately in the various individual sections.
2.1 Sample Sites
Sediment from two sample sites were used in this project. The majority o f the sediment
used was obtained from the St John's Lake section o f the Tamar estuary in Cornwall,
United Kingdom.
Quayma* • Batin
Sampling-Site PACIFIC OCEAN
Fig 2.1 Maps of sampling sites, Tamar estuary and Guaymas Basin.
A small amount o f sediment in each experiment was (as inoculum) obtained from the
hydrothermally active Guaymas Basin, G ulf o f California, courtesy o f Andreas Teske
36

Chapter 2 Materials and Methods
(University of North Carolina, Chapel Hill). These sediments came from Alvin dives
3204 which was at 27-00.764N, 111-24.558W and at a depth of 2100 m sampling into
soft sediments and 3205 at 27-00.888N, 111-24.734W, at 2000 m sampling into high
temperature vents and adjacent soft sediment (Woods Hole Oceanographic Institute).
2.2 Sediment Sites
The Tamar estuary is one of the most studied tidal systems in the United Kingdom
(Watson et al., 1985 a, 1985 b; Stephens et al., 1992). It has also been used as a basis for
various biogeochemical studies, some of which similar to this project have looked at
reactions in the deep subsurface, in terms of effect that temperature increase during burial
has on microbial relevant processes (Wellsbury and Parkes, 1995; Wellsbury et al., 1997;
Parkes et al., 2007). The river Tamar flows from north Cornwall for approx 100 km to
Plymouth sound through a catchment area of 1700 km (Miller, 1999). Samples were
taken at St Johns Lake approx 3 km northwest of Plymouth sound. Pollution input is
concentrated further down the river, close to the large centres of population and the
sampling site is easily assessable at low tide. Lack of pollution is important as it is as
close as possible to a natural system with minimal anthropogenic input and is
representative of other estuarine systems.
The Guaymas Basin is part of a short series of seafloor-spreading segments in the
Gulf of California. The basin is separated from adjacent deeps by long, north western-
southeast striking transform faults, and divided into sub parallel northern and southern
troughs. Rapid Sedimentation (1 to 5 m ka'1 (Fisher and Becker, 1991)) combined with
the fact that hydrothermal fluid is forced through a sediment layer of 300-400 m thick
before reaching the seafloor makes it a different system biologically than most other vent
areas. The temperature profile of the sediment can range from 2.7°C just above the
sediment, to 45°C over the first 0-10 cm and 126°C at 70 cm depth (Jorgensen et al.,
1990). A large variety of thermophiles and hyperthermophiles have been found in the rich
sediments of the Guaymas Basin such as the sulphate reducer Archaeoglobus (Burggraf
et al., 1990) and hyperthermophilic methanogens such as Methanopyrus (Huber et al.,
1989) and Methanococcus (Jones et al., 1983) and also members of the anaerobic
37

Chapter 2 Materials and Methods
methane oxidising Euryarchaeota (ANME) (Teske et al., 2002) have been found to
inhabit this environment.
The inclusion of Guaymas Basin inoculum was to ensure that there was a definite
presence of thermophilic and hyperthermophilic organisms available for reactions during
high temperature incubations ( > 60°C).
38

Chapter 2 Materials and Methods
2.3 Sampling
Sampling was conducted in the Tamar estuary using hand corers, all sampled cores were
kept cool and transported with frozen ice packs. The cores were taken straight to the
laboratory within 4 hours and stored at 4 °C until required. All Guaymas samples were
sampled using the Woods hole oceanographic submersible ALVIN and were stored and
shipped under anaerobic conditions in sealed Balch-type tubes, crimped with a rubber
stopper. These were also stored at 4°C until required
Fig 2.2 Taniar estuary sampling
2.4 Minerals
Minerals used in this project were the following. Basalt, Hornblende, Labradorite,
Hematite, Pyrite, Olivine, Olivine bombs, Pyrrohotite and Magnetite (Richard Taylor
minerals. Surry, England). Also a sample o f sand (silica/ quartz) was used as a control for
some o f the thermal gradient experiments.
39

Chapter 2 Materials and Methods
All samples were from natural outcrop sources. The exact composition of each
mineral used was determined by ICP-OES (Inductively coupled plasma, optical emission
spectrometry) and by XRD (X-Ray Diffraction). Mineral composition is given in results
chapter 3.
2.5 X-Ray Diffraction and ICP-OES
X-Ray diffraction was performed on samples using a Philips PW1710,XRD. Samples
were crushed into a fine powder and packed inside aluminium holders, which was
mounted inside the chamber of the diffractometer. Samples were run for 25 mins. The
following is a brief outline of XRD. Braggs law (nX=2d sin0) was used to distinguish the
various mineral phases, where n is the order of reflection, X is known wavelength of the
X-rays, 0 is the angle of incidence and d is the interplaner distance. By varying the angle
of incidence, Braggs law is satisfied by different d spacings within the crystalline
structure. The different angular positions and intensities can be plotted to provide a
unique characteristic X-ray powder pattern, which can be used to identify the unknown
crystal mineral phase. Phases were identified using the operating software in this case
Philips PW1877APD
Inductively coupled plasma optical emission spectrometry (ICP-OES) was carried
out in the School of Earth and Ocean Sciences, Cardiff University. Samples were fused
using a Classie FLUXY fusion system, with a lithium metaborate flux before being
analysed using a Jobin Yvon Ultima 2 ICP-OES.
2.6 Mineral preparation for slurry addition
Minerals were received in whole rock form from Taylor minerals and those, which were
not small enough for powdering, were crushed to a course consistency using a Fritsch
Jaw Crusher. Minerals were generally left in this course form until they were needed for
experimental use, at which stage they were powdered using a Retsh pm 400, Agate,
centrifugal ball mill. The mill pots were washed with 70% ethanol solution prior to
mineral addition. Samples were powdered for 5 Min at 200 rpm. The majority of the
40

Chapter 2 Materials and Methods
particles were less than 125 mm. However the mineral was not divided up into varying
particle size (except for initial size comparison experiment) this was to more accurately
mimic the processes occurring in the natural environment also separating particles adds
more possible sources o f contamination and delays the addition o f mineral to master
slurry. This use o f freshly ground reactive surfaces was found to have a major effect on
biogeochemical processes and thus any delay from grinding to addition was avoided
where possible
2.7. Slurry preparation
Nitrogen flow into master slurry
Stirrer with magnetic Stirrer Bar Needle with continuous
flow o f nitrogen
This was based on procedures described by (Parkes et al., 2007) for similar experiments.
Anoxic artificial seawater solution formed the basis o f all media in slurry experiments,
was identical regardless o f experiment, and was initially set up in a master slurry. All
chemicals used were AnalaR grade and were purchased from Sigma Aldrich or Fisher.Master slurry vessel
3 way valve
Serum vial for incubation
3.2pm Filter on nitrogen flow
Fig 2.3 Master slurry set up
41

Chapter 2 Materials and Methods
Table 2.1Recipe for anoxic artificial seawater solution.
Compound g/L
NaCl 26.5
MgCl2.6H20 1.28
CaCl2.2H20 0.15
KC1 0.50
NH4C1 0.25
K H 2PO 4 0.20
Na2S0 4 1.42
lM N aH C03 30.00ml
Medium was autoclaved at 121 °C for 30 min and cooled under sterile (0.2pm filtered)
oxygen-free nitrogen (OFN) and the pH was adjusted to 7.6 with sterile autoclaved
sodium hydroxide (1M). Sterile autoclaved 12% (w/v) sulphide solution (Na2S.9H20)
was added (6ml/l) and the pH was adjusted to 7.6 where necessary.
All slurries were made according to the following procedure and contained the following
components per litre. To this the following constituents were added with the following
procedures to produce sediment slurry.
1) 250 g Tamar Sediment
2) 10 ml Guaymas basin sediment inoculum
3) 750 ml anoxic artificial seawater solution
4) 100 g of mineral (10 g /L in initial experiments).
All master slurries (Fig 2.3) were set up in the same way with only variation in
amount and type of mineral used depending on experiment. All additions were conducted
whilst gassing with OFN
42

Chapter 2 Materials and Methods
1) Cooled, sterile, anoxic artificial seawater solution as above was prepared, with the
1 litre mark and 750 ml mark on the vessel measured and marked prior to
autoclaving, 250 ml was removed.
2) 10 ml of Guaymas basin sediment was added, using a sterile syringe with the end
removed.
3) A sterilised bag was filled with Tamar sediment pushed directly from the core,
with the top 5 cm removed to leave anoxic sediment into bag.
4) 250 ml of mixed sediment was added to the anoxic artificial seawater solution.
5) This was manually mixed and stirred with a magnetic stirrer bar.
6) 10 g or 100 g of freshly ground mineral was added depending on experimental
setup.
7) Slurry was mixed using a magnetic stirrer bar for 10-15 minutes
8) The master slurry was flushed with OFN before the liquid slurry was dispensed
into varying reaction vessels under continuous OFN flow.
9) Amount of slurry added was controlled by a syringe attached to master slurry (Fig
2.3)
10) Headspace was flushed with nitrogen then reaction vessel was sealed and in case
of serum vials crimped, then incubated at appropriate experimental temperature.
2,8 Reaction Vessels
Varying types of reaction vessels were used throughout this project depending on the
experiment being conducted and due to the fact that we developed easier and better ways
of incubating the vessels over the course of the project.
Type 1, initial experiments were carried out using a modified conical flask, sealed
with a rubber bung (Fig 2.4). Through which a needle was placed with a 3-way valve,
this was used for sampling gases and liquid sampling was done through modified
sampling port at the bottom which was sealed with a Hoffman clamp. This was found to
be unsatisfactory for long-term incubation as the bung was prone to failure.
Type 2, was a modified inverted 2 litre conical flask used for initial
experimentation (Fig 2.5) as reported by (Parkes et al., 2007). The inverted shape enabled
some compensation for changes in surface area/head space contact during repeat
43

Chapter 2 Materials and Methods
sampling. Unlike type 1 it has a PTFE stopper with 2 O-rings with a 3-way valve fitted to
the top. Gas sampling was through the 3 way valve and liquid sampling through a
modified sampling port at the bottom. The PTFE stopper was found to be a great
improvement on previous stoppers with no failures, however size and shape of vessel
made it awkward to handle and sample, plus the number of replicates were limited.
Type 3, is a 100 ml Duran plugged with a PTFE stopper (Fig 2.6) liquid and gas
sampling was via the 3 way valve at the top. This set up worked well and was used for
the 60 ° C. Incubations with varying minerals; this provided the ease of working with a
smaller vessel and the safety of a PTFE stopper.
Type 4, an 8.5 ml Wheaton® serum vials (Fig 2.7), the vial was used in
conjunction with a neoprene stopper and was crimped, this was used in all the thermal
gradient experiments and was destructively sampled, with 6 replicates for each
temperature being sampled over the given time period. This was to ensure no chance of
contamination/ re-inoculation or leakage over the temperature profile. These worked very
well up to temperatures of 100-105°C above that they tended to leak.
Type 5, (Fig 2.8/2.9) was a commercial pressure vessel constructed by Pan-
Scientific © (Moline, Illinois, USA). This was constructed to withstand temperatures up
to 200°C and pressures up to 15 bar. This was used in the ramping experiment for
temperatures over 100°C.
44

Chapter 2 Materials and Methods
Fig 2.4. Type 1 reaction vessel (modified conical flask)
Fig 2.5. Type 2 reaction vessel (inverted modified conical flask)
45

Chapter 2 Materials and Methods
•0 ml Duran
Fig 2.6. Type 3 reaction vessel (PTFE stopperd duram bottle)
PTFE Top with 3 way valve attached
Fig 2.7.Tvpe 4 reaction vessel Wheaton® serum vials
46

Chapter 2 Materials and Methods
ReactionVessel
■ ■ I W K M
Fig 2.8. Type 5 reaction vessel (Parr Scientific pressure vessel)
basalt RAMP EXPI
Fig 2.9. Type 5 reaction vessel close up
LiquidSampling port
Pressure G
fety Valve urst disks)
47

Chapter 2 Materials and Methods
2.9 Incubations
Incubations were all carried out in Gallenkamp ovens with the exception of the
temperature profiling experiment, which was carried out in a thermal gradient system.
0°C 150°C
Thermal gradient set up 0 to 150°C Fig 2.10. Thermal Gradient system
The thermal gradient system is an apparatus to replicate incubations at discrete
temperatures over a defined temperature range. At one end the temperature is 0°C and at
the other end it is 150°C. with sample positions every 2°C. Each temperature position is
able to hold 6 samples at that temperature, which is ideal for running replicates and
destructive sampling over a time course. The systems were custom made at the Bristol
University, Earth Science Dept, workshops after (Isaksen et al., 1994).
48

Chapter 2 Materials and Methods
2.10 Pore water analysis
Liquid for pore water analysis was removed through the liquid sampling port in each
vessel; the amount removed was replaced with the same amount of nitrogen as to avoid
creation of a vacuum except for destructive sampling. The sample was centrifuged using
a Rotanta 460R (Hettich Zentrifugen GmbH, Tuttlingen Germany) at 1780 g for 12 min
to remove particles and supernatant was used for analysis. Pore water sulphate and
volatile fatty acid (acetate lactate and formate) as well as chloride and several other
compounds were measured by ion exchange chromatography using an ICS-2000 ion
chromatography system (Dionex®, UK) fitted with two AS15-HC 4 mm columns in
series, and a Dionex® Anion Self-Regenerating Suppressor (ASRS®-ULTRA II 4-mm)
unit in combination with a Dionex® DS6 heated conductivity cell. Components were
separated using a potassium hydroxide gradient program as follows: a normal program
run of 18 mM (14 min isocratic), 40 mM (10 min isocratic), 90 mM (6 min isocratic) 18
mM (7 min isocratic) for a total run time of 38 mins and a longer program of 6.0 mM
KOH (38 min isocratic), 16.0 mM KOH min-1 to 70 mM (17 min isocratic) for more
accurate determination of lactate and butyrate was also occasionally used depending on
sample
Calibration used 5 standards with varying concentrations depending on
concentrations of samples to be analysed i.e. high acetate or low acetate. Any calibration
under 99% calibration coefficients was rejected. Cations were analysed using a Dionex®
DX-120 ion chromatograph, using CS16 column 5x250 mm and a cation self-
regenerating suppressor (CSRS® ultra II 4 mm). Components were separated using 38
mM Methanosulphonic acid, over a sample run time of 35 mins (isocratic) detection was
via suppressed conductivity detector. This was connected to AS50 auto sampler for ease
of sampling. Again 5 standards were used of varying concentration and any calibration
under 99% was rejected. Calibration was linear for all samples with the exception of
acetate which was quadratic at high concentrations.
49

Chapter 2 Materials and Methods
2.11 Gas Analysis
Each gas sample was collected using the same method with the syringe being flushed 3
times with sample headspace before the sample was taken. The headspace was analysed
by gas chromatography using a modified Perkin Elmer/Amel Clarus 500 Natural Gas
Analyser. With a configuration of flame ionisation Detector (FID) and Thermal
Conductivity detector (TCD) which consists of two TCDs combined. Argon was used as
the carrier gas for the TCD and helium as carrier gas for the FID. TCD was used for CO2
and hydrogen determination and FID for methane, ethane, propane, butane and isobutene.
Oven Temperature was 110°C with TCD at 150°C and FID at 250°C air and hydrogen
were used as gases to enable combustion at the FID. Calibration was by means of 3
standard gases mixtures (Scott Scientific). Detection limits for methane, ethane, propane,
butane and isobutane were 0.5 ppm and hydrogen was 70 ppm, and CO2 was 50 ppm with
a sampling loop size of 1 OOpl.
Lower levels of hydrogen were detected using a Mercury Vapour system (Peak
Laboratories, Menlo park California) giving a lower detection limit of 5 ppb for
Hydrogen. Carrier gas used was nitrogen and column temp was 220 °C loop size lOpl.
Calibration was by means of one-shot calibration using a blended standard of 20 ppm
concentration (Scott scientific).
2.12 Iron analysis
Samples for iron (II) analysis were spun in the small 8.5 ml vials used for the thermal
gradient system, so as to keep the sample in anaerobic condition as long as possible, 200
pi of sample supernatant was removed through the septum by sterile syringe and
immediately stored in 800 pi of 0.5M HC1. Samples were analysed after the method of
(Stookey, 1970). A standard Fe (II) Solution was made using 0.05 g ferrous sulphate
dissolved in 50ml of 1.2M HC1, and 0.05 ml, 0.15 ml, 0.30 ml, 0.50 ml and 0.8 ml
aliquots were added to 5 ml of 0.5 M HC1 and made up to 6 ml with 18MQ Milliq water.
50

Chapter 2 Materials and Methods
Aliquots (0.5 ml) of each sample and of each standard were transferred to a 5 ml
ferrozine solution (0.5 g ferrozine dissolved in 500 ml of 50 mM HEPES buffer at pH 7)
Colour intensity was allowed to develop for 30 mins. Colour intensity was measured
using a Varian Cary 50 Probe UV Visible Spectrophotometer at 562 nm. A plot of
standard absorption (minus the blank) against Fe (II) concentration had a liner response
allowing the determination of the Fe (II) concentration in each sample. Calibrations that
have an R2 value of less than 0.98 were rejected.
2.13 tf3C Isotope analysis
The gas was stored as a headspace in inverted crimp top Wheaton® vials by displacement
of a preservative solution that consisted of 10% (w/v) KC1 in deionised water adjusted to
pH 1 using HC1. Stable carbon isotope analysis of CFL* was conducted by GC combustion
isotope ratio mass spectrometry using a Varian 3400® GC coupled to a Thermoelectron
XP® mass spectrometer via a Gas Bench® interface. Methane was separated on a PLOT
Q capillary column (0.32 mm x 30 m) and combusted to CO2 at 1000°C in a ceramic
reactor containing Cu and Pt wires. A high purity blend of 1% O2 in helium was fed into
the reactor at ~~0.1 ml m in 1 to ensure quantitative conversion of CH4 to CO2. The H2O
produced was removed using a Nafion® membrane. Accuracy and precision of 8 13C-CH4
analyses by this method were both better than ± 0.2%o based upon replicate analysis of a
BOC alpha gravimetric CH4 standard. Stable isotope ratios are reported in the standard
delta (™13) notation in units of per mil (%o) relative to Vienna Pee Dee Belemnite
standard. Samples with concentrations of less than 800 ppm are below the detection limit
and could not be analysed. Storage of samples in KC1 lead to the loss of the ability to
measure 5 13C-CC>2 due to the buffering effect of KC1.
2.14 Acridine orange direct counts
Prokaryotic cell numbers in experiments were quantified using acridine orange counts
after (Fry, 1988) with minor modifications. Acridine orange is a fluorescent dye that
binds to the groove on DNA double helix, which produces a change in UV fluorescence
51

Chapter 2 Materials and Methods
(orange to green). A 1ml Aliquot of shaken mixed slurry was added to 5 mis of a filtered
(0.1 pm) (Whatman anotop) solution containing 2% formaldehyde and 3.5% NaCl (w/v).
This was stored until sample could be counted by fluorescent microscopy. Fixed samples
were vortex mixed and a quantity added to 10 ml of 2 % filter sterilised (0.1 pm)
formaldehyde in 3.5% in NaCl. The quantity added varied depending on cell numbers
present. Acridine orange (50 pi) was added to give a final concentration of 5 mg/1. This
was left for 3 mins in solution and then was filtered through a 25 mm Nucleopore black
polycarbonate membrane (Osmonics inc., Minnetonka, MN, U.S.A) of 0.2 pm pore size.
The filter was rinsed with a further 10 ml of solution as above. This was mounted on a
slide with paraffin oil.
The mounted membrane filters were viewed under incident illumination with a Zeiss
Axioskop microscope (Carl Zeiss, Oberkochen, Germany) fitted with a 50-W mercury
vapour lamp, a wide-band interference filter set for blue excitation, a 100 X (numerical
aperture = 1.3) Plan Neofluar objective lens, and 10 X eyepieces. The volume of sample
stained and filtered were adjusted to optimize filter coverage by particles to around 70%.
Sediment particles were orange/red whilst bacterial cells were bright green/blue
fluorescence. Three replicate filters were prepared from each sample to minimize count
variance (Kirchman et al., 1982). A minimum of 200 fields of view, or 200 prokaryotic
cells were counted. The total number of bacteria and the numbers of dividing and divided
cells were separately counted. The number of cells counted on opaque particles were
doubled to account for cells hidden from view (Goulder, 1977). Blank membranes were
regularly counted to asses any contamination and prokaryotic population size is
calculated after subtraction of the any reagent blank.
52

Chapter 2 Materials and Methods
Total bacterial numbers were calculated from;
r r
2C o n + C o f f + C d g + 2C d dC o n x ( C dg +
2C d d )2CrvM + Cr»cc L J
"\ -N
x A - B[
V VIEWJ J J
D
Numbers of dividing and divided cells were calculated from the same equation
with the omission of the terms “ 2C 0 n + C o f f ” at the start of the equation, and the
substitution of Bd for Bj.
The percentage of dividing and divided cells were calculated from the numbers of
dividing and divided cells expressed as a percentage of the total bacterial cell numbers.
Where total bacterial numbers approach the calculated detection limit, or numbers of
cells counted approach the number of cells observed in the blanks, then this calculation
becomes unreliable.Key
C o n and C o f f - Number of cells counted ON and OFF particles, for the purposes of this
calculation transparent particles.
C dg and C dd- Numbers of cells observed dividing (a cell with an invagination) and
divided (two adjacent cells of identical morphology with a distinct space
between them). Cells counted in these two categories are not also tallied
under ON and OFF particle categories.
VIEW: The total number of fields of view observed during a cell count on a filter.
A: Filter area ratio. Total countable area of the filter divided by the area of
filter observed for one field of view.
53

Chapter 2 Materials and Methods
Bt and Bp: Blank correction terms for the total cell number (B t) and the dividing and
divided cell numbers (Bd). Calculated from counts of blank membranes
and using the same equation with the omission of the correction term. In
this instance V c t will equal 10050 (10 mL of formaldehyde +50 pL of
Acridine orange) and D will equal 1.
Vct: Volume of formaldehyde-preserved sample that is stained (pL)
D: Dilution factor of original sample expressed as a proportion, e.g., 1 cm3 of
sediment in 9 mL of formaldehyde will give D = 0.1
2.15 Molecular analysis
2.15.1 DNA extraction
All sediment samples collected for molecular analysis were stored at -80°C until
required.
The FastDNA Spin Kit for Soil (MP Biomedicals, Ohio, USA) with modifications
(Webster et al., 2003) was used for DNA extraction in all cases. DNA extractions were
carried out on 1 g of sediment slurry with the kit to give a final DNA solution of 50 pi.
Visualization of DNA for yield and size was by agarose (1.0% w/v) gel electrophoresis
with 0.5 pg ml'1 ethidium bromide or Syber safe (Invitrogen©, Carlsbad, Ca, USA) and
compared to HyperLadder I DNA quantification marker (Bioline, London, UK).
Extracted DNA solutions were stored at -80°C until required.
2.15.2 PCR reactions
PCR set-up was carried out under aseptic conditions using autoclaved and/or UV-treated
plastic ware and pipettes and sterile nuclease-free molecular-grade water (Severn Biotech
Ltd., Kidderminster, UK) to restrict contamination to a minimum. Positive [pure culture
DNA] and negative controls (molecular-grade water) were used in all PCR
amplifications, and undertaken in a DNA Engine Dyad Thermal Cycler gradient block
(MJ Research, Boston, MA) with the PCR primers listed in Table 2. The 16S rRNA gene
54

Chapter 2 Materials and Methods
PCR mixtures contained (total 50 pL, molecular-grade water) 0.4 pmol pL'1 of primers, 1
pL of sediment DNA template (1/10 dilution or 1/50 depending on sample), 1 x reaction
buffer (Promega Corporation, Madison, WI), 1.5 mM MgCh, 1.5 U Biotaq DNA
polymerase (Promega), 0.25 mM each dNTP, 10 pg bovine serum albumin (BSA;
Promega).
Bacterial 16S rRNA genes were amplified from sediment DNA samples using
primer combinations 27F-1492R or 27F-907R (Table 2.1) with the following PCR
conditions. Reaction mixtures were held at 95°C for 2 min followed by 30 cycles of 94°C
for 30 s, 52°C for 30 s and 72°C for 90 s plus 1 s per cycle, with a final extension step of
5 min at 72°C. Archaeal and Euryarchaeal 16S rRNA genes were amplified from
sediment DNA with primer combinations 109F-958R with the following PCR reaction of
30 cycles of 98°C for 30 s 92°C for 45 s, 45°C for 45 s, 72°C for 42 s followed by an
extension step of 72°C for 5 min, as described by (Newberry et al., 2004). The primer
combination 109F-958R was chosen after analysis of the RDP (Ribosomal Database
Project) database version 8.1 with the computer software OligoCheck
(http://www.cardiff.ac.uk/biosi/research/biosoft/), because in silico results suggested that
these primers could target >85% of the RDP archaeal sequences, including 16S rRNA
genes from methanogenic Archaea shown to be important in subsurface marine sediments
(Bidle et al., 1999; Marchesi et al., 2001; Newberry et al., 2004).
The 16S rRNA gene PCR products analysed by DGGE were re-amplified in a
nested PCR reaction using the reaction mixture described above without BSA. Bacterial
16S rRNA genes were reamplified with primers 357F-518R at 95°C for 5 min followed
by 10 cycles of 94°C for 30 s, 55°C for 30 s, 72°C for 60 s, and 25 cycles of 92°C for 30
s, 52°C for 30 s, 72°C for 60 s, with a final step of 10 min at 72°C. Archaeal and
euryarchaeal 16S rRNA gene products were re-amplified with primers SAf and
PARCH519r at 95°C for 5 min followed by 4 cycles of 94°C for 30 s ,53.5°C for 30 s
72°C for 1 min followed by 92°C for 30 s with 29 cycles of 53.5°C for 30 s and 72°C for
1 min and a final extension step of 72°C for 10 min as described (Nichols, 2003).
55

Table 2.2 Primers used in this study.
Target gene PrimerName
Sequence 5’-3’ Procedure Reference
16S rRNA Bacteria 27F AGAGTTTGATCMTGGCTCAG PCR Lane (1991)907R CCGTC A ATT CMTTT G AGTTT PCR Muyzer et al.,(1998)1492R GGTT ACCTT GTT ACG ACTT PCR Lane(1991)
Grosskopf et al (1998)16S rRNA Archaea 109F ACKGCTCAGTAACACGT PCR
958R YCCGGCGTTGAMTCCAATT PCR De Long (1992) Muyzer et al (1993)
16S rRNA Bacteria 357F-GC GCCGCCCGCCGCGCGCGGCGGGCGGGGCGGGGGCACGGGGGGCCTACGGGAGGCAGCAG
PCR-DGGE
518R
Saf-GC B
ATT ACCGCGGCTGCT GG PCR-DGGE Muyzer et al (1993
16S rDNA Archaea S A lf CGCCCGCCGCGCGCGGCGGGCGGGGCGGGGGCACGGGGGGCCTAYGGGGCGCAGCAGG
PCR-DGGE Nicol et a l (2003)
SA2f
PARCH519r
CGCCCGCCGCGCGCGGCGGGCGGGGCGGG GGC ACGGGGGGCCT ACGGGGCGC AG AGGG TTACCGCGGCKGCTG
PCR-DGGE
PCR-DGGE
Nicols et al (2003
O’Sullivan et al.,(2008)16S rRNA Bacterial 357F-GC- CAGGAAACAGCTATGACGGGCGGGGCGG DGGE band
DGGE bands M13R GGGC ACGGGGGGCCT ACGGG AGGC AGC AG reamplification518R-AT-
M13FGT AAAACGACGGCCAGTAAATAAAATAA AAATGTAAAAAAATTACCGCGGCTGCTGG
DGGE band reamplification
O’Sullivan et al.,(2008)
16S rRNA Archaea SAaf-GC C AGG A A AC AGCTATG ACGGGCGGGGCGGG0 DGGE band O’Sullivan et al.,(2008)DGGE M13RC GGCACGGGGGGCCTACGGGGCGCAGCAGG reamplification
SAbf-GC-M13R
CAGGAAACAGCTATGACGGGCGGGGCGGG GGC ACGGGGGGCCTATGGGGCGC AGC AGG
DGGE band reamplification
O’Sullivan et al.,(2008)
SAcf-GC-M13R
CAGGAAACAGCTATGACGGGCGGGGCGGGGGCACGGGGGGCCTACGGGGCGCAGAGGG
DGGE band reamplification
O’Sullivan et al.,(2008)
PARCH519r- AT-M13F
GTAAAACGACGGCCAGTAAATAAAATAAAAATGTAAAAAATTACCGCGGCKGCTG
DGGE band reamplification
O’Sullivan et al.,(2008)
16S rRNA M13F GTAAAACGACGGCCAG SequencingA. D=G or A or T, H=A or T or C, K=G or T, M=A or C, R=A or G, W=A or T, Y= C or T.B. Primer SAf is a mixture of SAl f and SA2f in a 2:1 molar ratio (Nicol et al., 2003)C. Primer SAf-GC-M13R is a mixture of SAaf-GC-M13R, SAbf-GC-M13R and SAcf-GCM13R in a 1:1:1 molar ratioD. Underlined type indicates the GC - or AT- linker

Chapter 2 Materials and Methods
2.15.3 DGGE analysis
DGGE was carried out as described with some modifications (Webster et al., 2002;
Webster et al., 2005). PCR products (c. 100 ng of each PCR product) were separated
using a DCode™ Universal Mutation Detection System (Bio-Rad Laboratories, Hercules,
CA, USA) and 1-mm-thick (16 x 16 cm glass plates) 8% (w/v) polyacrylamide gels
(Acrylogel 2.6 solution, acrylamide: N,N'-methylenebisacrylamide; 37 : 1; BDH
Laboratory Supplies, Poole, UK) with a gradient of alcrylamide denaturant between 30
and 60% and in some cases a 30 and 80% gradient (indicated in text). Gels were poured
with a 50-mL volume Gradient Mixer (Fisher Scientific, Loughborough, UK) and
prepared with 1 x TAE buffer (pH 8 ; 40 mM Tris base, 20 mM acetic acid, 1 mM
EDTA). Electrophoresis was at 200 V for 5 h (with an initial 10 min at 80 V) at 60°C in 1
x TAE buffer. Polyacrylamide gels were stained with SYBRGold® (invitrogen, Carlsbad
Ca, USA) nucleic acid gel stain for 30 min and viewed under UV. Gel images were
captured with a Gene Genius Bio Imaging System (Syngene, Ca , USA).
Individual DGGE bands were excised by use of a sterile scalpel and washed in
sterile nuclease-free molecular-grade water (Severn Biotech Ltd, Kidderminster, UK) for
10 min. Bands were air-dried and crushed in 10-20 pi molecular-grade water and
incubated overnight at 4°C. The supernatant (lpl) was used as template DNA in a PCR
using primers, 357F-518R (M l3) or SAf-PARCH519r (M l3), as described above, and
PCR products were re-analysed by DGGE to confirm recovery of excised bands. PCR
products of excised bands had the DNA yield quantified by 1.2% (w/v) agarose gel
electrophoresis and DNA quantification marker Hyperladder I (Bioline). Sequencing
reactions were performed with primer 518R-M13 or PARCH519r -M l3 and an ABI
PRISM 3100-Genetic Analyzer (Applied Biosystems, Foster City, CA).Partial 16S rRNA
gene sequences were subjected to a blast® search in the National Centre for
Biotechnology Information (NCBI) database (http://www.ncbi.nlm.nih.gov/blast/) to
identify sequences with highest similarity. By Cardiff university sequencing core.
56

Chapter 2 Materials and Methods
Fig 2.11 DCode Universal Mutation Detection System (Bio-Rad Laboratories) used
to carry out DGGE analysis.
2.15.4 Cloning
All 16S rRNA gene fragments were screened by DGGE prior to cloning as recommended
for deep biosphere samples (Webster et al., 2003). Only products from reactions showing
the highest diversity assessed by DGGE and without PCR product in the negative
controls were cloned. Each gene library was constructed from five independent PCR
products that were pooled and cleaned with Microcon PCR Preps DNA Purification
System (Promega Corporation) according to the manufacturer's instructions. Cloning was
with pGEM-T Easy (Promega Corporation), using optimized insert: vector ratios and
overnight ligation at 4°C. Libraries were screened by PCR with M13F or 16S rRNA gene
primers and clones with verified inserts were randomly selected for sequencing with 27F
(bacterial 16S rRNA genes), 109F (Archaeal 16S rRNA genes), and were sequenced
using the ABI PRISM 3100.
57

Chapter 2 Materials and Methods
Xmnl 2009
Seal 1890 Nael 2707
pGEM*-T Easy iacZ Vector
(3015bp)
T7 -IApalAatllSphiBstZINcolBstZINollSacllEooRI
1 start 14 20 26 31 37 43 43 49 52
Spel 64EcoRl 70Notl 77BstZI 77Pstl 88Sail 90Ndel 97Sacl 109BstXI 118 3Nsil 127 jf
t SP6 141 1
Fig 2.12 pGEM®-T Easy Vector circle map and sequence reference points.
pGEM-T Easy vector sequence reference points are for pUC/M13 Reverse Sequencing
Primer binding site, 176-197 and pUC/M13 Forward Sequencing Primer binding site is
2949-2972.
2.15.5 Phylogenetic analysis
Sequence chromatographs were analysed using the chromas software package version
1.45 (http://www.technelysium.com.au/chromas.html). Closest relatives were identified
by use of the NCBI database (http://www.ncbi.nlm.nih.gov/). All nucleotide sequences
were aligned using ClustalX (Thompson et al., 1997) with sequences retrieved from the
database. Alignments were edited manually using BioEdit Sequence Alignment Editor
version 5.0.9 (Hall, 1999) and regions of ambiguous alignment removed. Guide trees
were constructed using neighbour joining with the Jukes and Cantor correction algorithm
in mega version 3.1 (Kumar et al., 2001) and the data bootstrapped 1000 times to assess
support for nodes.
58

Chapter 3 Initial mineral experiments
Chapter 3
Initial mineral experiments
3.1 Introduction
The initial experiments (results shown in appendix A) to determine the viability of
microbially mediated hydrogen generation; by the addition of minerals to sediment
slurries provided mixed results. The main aim of the initial magnetite experiments were
to determine what effect temperature and particle size had on microbially driven
hydrogen formation and utilisation. These initial experiments proved that processes such
as acetogenesis, methanogenesis and sulphate reduction were effected by temperature
and particle size, however, the effect that the mineral itself had on these processes could
not be accurately determined. Therefore it was decided to broaden the range of minerals
being used so as to compare our biotic experiments with previously published abiotic
experiments with a range of iron minerals (Stevens and McKinley, 2000).The objective
of these experiments was to demonstrate direct microbial involvement in hydrogen
generation and to observe the effect of different mineral types on other relevant
microbial processes such as acetogenesis methanogenesis and sulphate reduction.
3. 2 Mineral composition
Table 3.1 Minerals chosen for experimentation were the following
Mineral Formula
Magnetite Fe?04
Hematite Fe20 2
Pyrite FeS2
Pyrrhotite FeS
Hornblende NaCa2(M g,Fe,Al)5(Si,Al)80 22(0 H 2)
Ilmenite FeTiO?
Olivine (Mg,Fe)2(S i0 4)
Labradorite (Ca o.5 Nao.5)(Alo.5Sio.5)AlSi08
Olivine bombs (Hematisied Olivine) (Mg,Fe)2(S i0 4)
Basalt Basalt from isle o f Skye UK
59

Chapter 3 Initial mineral experiments
Rationale for choosing the minerals selected were two fold, 1) to enable comparison with
minerals studied previously under abiotic conditions (Stevens and McKinley, 2000) ,2)
To investigate the effect of mineral composition by using a range of mafic and felsic
mineral types. All minerals were analysed using XRD (appendix B) and ICP-OES (Table
3.2). With the exception of pyrite and pyrrhotite, where analysis was confined to XRD as
analysis of high sulphur containing minerals by ICP-OES requires addition of extra flux
and thus the loss of ability to detect minor compounds in the sample. Comparison of
samples analysed by XRD and ICP-OES showed that the XRD analysis was consistent
with major elements detected by ICP-OES.
Table 3.2. Mineral composition according to ICP-OES. In order of decreasing Si02
ICP-OES Si02 Ti02 ai2o 3 Fe20 3 MnO MgO CaO Na20 k2o p 2o 5 Total
Mineral wt% wt% wt% wt% wt% wt% wt% wt% wt% wt% wt%
Labradorite 52.57 0.14 28.24 0.62 0.02 0.63 12.94 3.53 0.24 0.02 98.94
Hornblende 49.95 0.30 8.25 7.87 0.09 15.91 12.55 2.33 0.83 0.00 98.07
Basalt 47.50 1.61 15.52 12.62 0.17 7.45 9.91 1.96 0.23 0.13 97.11
Olivine 41.82 0.01 0.55 7.94 0.09 49.35 0.10 0.08 0.03 0.00 99.98
Olivine B 41.72 0.17 0.37 7.56 0.12 48.34 0.26 0.16 0.00 0.01 98.71
Hematite 20.53 0.79 17.76 54.12 0.04 1.81 4.94 0.29 0.90 0.23 101.41
Magnetite 2.57 0.05 1.05 99.49 0.18 0.36 0.25 0.23 0.30 0.00 104.48
llmenite 1.06 47.31 1.28 50.75 0.22 3.41 0.19 0.04 0.00 0.01 104.27
Silica 100.2 0.02 0.06 0.04 0 0 0.01 0.01 0.02 0 100.36
3.3 Experimental Setup
All incubations were set up according to master slurry description in Chapter 2. Initial
experiments shown in appendix B were conducted in type 1 reaction vessels with 10 g/1
of mineral addition. Experiments in this chapter were conducted using type 3 reaction
vessels with a concentration of 100 g/1. of mineral. Minerals were reground and left for a
period of 48 hrs before addition to slurry mix. At periodical intervals samples for gas,
VFA, AODC and molecular analyses were taken. At each sampling event the amount of
liquid or gas sampled was replaced by an equal amount of nitrogen to avoid the creation
60

Chapter 3 Initial mineral experiments
of a vacuum. Incubation was at 60°C for 88 days except for hornblende, which had an
extra sampling point after 135 days.
61

Chapter 3 Initial mineral experiments
3.4 Results Section
10000 80000
70000
800060000
50000 q6000
40000 0)Cl T=
400030000 O
200002000
10000
00 20 40 60 80 100 120 140
Days Incubation12000
10000
8000oE
CMQ * 6000CO
aCO 4000CDO<
2000
o —10 20 40 60 80 100 120 140
Days incubation
Fig 3.1. Hornblende incubationKey: CH4 (•), CO2 (c), H2 (♦), Acetate (*) and S 0 42' (c)
62

Chapter 3 Initial mineral experiments
oEa
xo
1200 80000■=o
700001000
60000 O
5 800 Q.CD■o
50000 z;< M
_C 600 40000 g a .Vi■o
30000 Q)400
20000
20010000
00 20 80 10040 60 120
Days incubation
o E
o(OQ)SQ)O<
12000
10000
8000
6000
4000
2000
00 20 40 60 80 100 120
Days incubation
Fig3.2 Ilmenite incubation.
Key: CFL* (•), CO2 (^), H2 (♦ ), Acetate (*), and SO4 2* (o)
63

Chapter 3 Initial mineral experiments
10000 70000
600008000
0OCOg- 6000TJCO0
-C
40000.
-O&i— 4000
<n 13 (/)
20000
200010000
0 20 40 60 80 100 120 140Days incubation
12000
10000
■q 8000
6000
4000
2000
o —10 20 40 60 80 100 120 140
Days incubation
Fig 3.3 Olivine Incubation.Key: C H 4 ( • ) , C 02 C -), H 2 (♦), Acetate (*), and S O 4 2' (o )
64

Chapter 3 Initial mineral experiments
<D7 O — (Do g- E ~o=L (0
O £■L .
CM D
X w
OEzL0CO0o<
7000010000
600008000
50000
600040000
4000
20000
200010000
0
Ooo
3o
20 40 60 80 100 120 140Days incubation
12000 10000
100008000
8000
6000
6000
4000
4000
20002000
0
COo
T=3o
20 40 60 80 100Days incubation
Fig 3.4 Olivine bombs incubation.Key: CR* (•), C O 2 (^), H 2 (♦ ), Acetate (*) and S O 4 2' ( c )
120 140
65

Chapter 3 Initial mineral experiments
3.5 Results: Hornblende, Ilmenite, Olivine and Olivine bombs
3.5.1 Hornblende (Fig 3.1)
Incubation with hornblende showed significant concentrations of hydrogen generated
over the first 3 days (max of 8451 pmol I*1). After which, hydrogen levels rapidly
decrease reaching levels below detection limit by day 5. This initial hydrogen spike co
occurs with a rapid increase in carbon dioxide to 40.8 mmol I"1. Once hydrogen
concentrations drop below the detection limit, carbon dioxide slowly increases until day
85 reaching a maximum of 73.19 mmol I'1. Before decreasing by 36.9 mmol f 1 to 36.29
mmol f 1 at day 101 and remaining stable thereafter until the termination of the
experiment (132 days). This CO2 decrease coincides with a rapid increase in methane
from 7.918 mmol I'1 at day 85 to 56.6 mmol f 1 at day 101 (a 7-fold increase). Methane
then remains stable from 101 to 132 days. Initially methane concentrations remained low,
reaching a concentration of 1101 pmol I'1 after 20 days. Once sulphate depletion occurs
methane starts to increase reaching a maximum concentration of 56.6 mmol I'1 by day 85.
Sulphate concentrations have a start value of 8.94 mmol I 1 and show a stepwise decrease
over the course of the experiment until depletion occurs at day 60. The start of sulphate
removal mirrors the decrease in hydrogen at the beginning of the experiment. Acetate
values show an initial rapid increase over the first 6 days from a start value of 4.3 mmol f
1 to 11.5 mmol I'1 this is then followed by a gradual decrease to 2.01 mmol f 1 after 132
days. A slight increase is noted around the 60-day mark, 4.5 to 7.06 mmol I"1 this
transitory peak in acetate occurs when sulphate reduction stops and is a possible
indication of previous acetate utilisation during sulphate removal.
3.5.2 Ilmenite (Fig 3.2)
During ilmenite slurry incubations, high amounts of hydrogen were formed over the first
3 days, with a maximum of 1097 pmol I'1 at day 2 (which is 7.7 times lower than
hornblende), which decreased below the detection limit by day 5. Carbon dioxide shows
a rapid initial increase to 37.5 mmol I'1 (day 7) decreasing to 18.1 mmol I'1 by day 15
66

Chapter 3 Initial mineral experiments
before a gradual increase, to plateau at 73.9 mmol I'1 after 85 days. The initial drop in
carbon dioxide values co-occurs with increases in methane concentrations from 35 pmol
I*1 to 407 pmol I"1 between day 6 to day 14 ( an 11 fold increase). Methane then remains
stable until day 60 before beginning a gradual increase to 1010 pmol I"1 after 101 days,
which is 56 times less than hornblende. Unusually methane production occurs in the
presence of high sulphate concentrations and active sulphate reduction. This is unusual as
sulphate reducers can out compete methanogens for competitive substrates. Occurrence
of both processes may indicate that they are using differing substrates or that competitive
substrates are being supplied in excess. Sulphate has a start value of 10.08 mmol l1 and
gradually decreases over the course of the incubation however, sulphate is never fully
removed reaching a minimum value of 270 pmol f 1 after 87 days incubation (removal of
9.8 mmol I'1). Acetate values show a initial rapid increase from 3411 pmol I'1 (day 2) to
10 mmol f 1 (day 7) this is the maximum value obtained and concentrations slowly
decrease to a minimum value of 2288 pmol I'1 after 87 days.
3.5.3 Olivine (Fig 3.3)
Olivine incubation experiment shows a rapid initial increase in hydrogen values reaching
9137 pmol I'1 (day 2) before dropping below the detection limit by day 4. However unlike
the previous experiments, hydrogen levels slowly start to increase again around day 72
from 110 pmol I'1 to 2775 pmol l^after 135 days. This increase in hydrogen begins 12
days after sulphate depletion. Sulphate has a start value of 10 mmol I 1, removal starts
immediately until depletion at day 85. Again similar to ilmenite methane is formed
during active sulphate reduction. Methane slowly increases to a maximum value of
1988 pmol f 1 (day 85) which is 28 times less than hornblende, decreasing then to 695
pmol I'1 (day 132). This decreases in methane co-occurs with an increase in hydrogen and
decrease in carbon dioxide. Carbon dioxide shows an initial rapid increase coinciding
with the observed initial H2, reaching 31.34 mmol I'1 after 4 days. Before gradually
increasing further to 68.37 mmol I'1 at day 85 then decreasing to 33.2 mmol I'1 at 132
days.
67

Chapter 3 Initial mineral experiments
Acetate concentrations unlike ilmenite, hornblende start at a relatively low level 1184
pmol I 1 and continue to rise throughout the experiment, which is in contrast to the
decreasing concentrations found in the hornblende and ilmenite. Final acetate
concentrations were 11.02 pmol I'1 after 132 days.
3.5.4 Olivine bombs (Fig 3.4)
Olivine bomb addition results are not surprisingly quite similar to Olivine. As they are
both chemically similar according to ICP-OES analysis (Table 3.2). Similar to all four
mineral additions covered in this section an initial rapid increase in hydrogen occurs over
the first 3 days reaching a maximum of 8898 pmol I'1 (day 2), decreasing below detection
limit by day 6. Like Olivine but unlike ilmenite and hornblende detectable hydrogen
reappears at day 85 increasing to 1089 pmol f 1 by day 132. Carbon dioxide levels
increase rapidly reaching a maximum of 24.80 mmol I"1 by day four followed by a dip to
7864 pmol I'1 by day 14. CO2 gradually increases until day 85 (62.87 mmol I’1), after 85
days carbon dioxide decreases similar to olivine coinciding with a noticeable increase in
hydrogen values and a decrease in methane. Methane production also co-occurs with
sulphate reduction; methane gradually increases to 2409 pmol f 1 at day 85 decreasing
after to 695 pmol f 1 at 132 days. Sulphate levels starts at 8.6 mmol I'1 and decrease
gradually to 110 pmol I'1 at day 60 before full depletion at day 87. Acetate formation is
slightly different than the olivine incubation. Initial rapid increase occurs over the first 7
days with an increase of 9.56 mmol f 1 to 11.21 mmol I'1, this decreases to 4625 pmol I'1
at day 46 gradually increasing again to a final value of 9801 pmol I'1 after 132 days.
68

Chapter 3 Initial mineral experiments
oEA
Io
0o(0Q .C0"O(00
'cnj 3I (0
3000 80000
700002500
60000 CO
200050000
1500 40000T3
30000 CD1000
20000
50010000
020 40 800 60 100
Oro
3o
Days incubation
oEA
NO"CO
&rooo<
10000
8000
6000
4000
2000
020 40 60
Days incubation80 100
Fig 3.5. Labradorite incubation.
Key: CR, (•), C 0 2 ( ), H2 (♦), Acetate (») and S O 4 2' ( )
69

Chapter 3 Initial mineral experiments
120002000
10000
1500
8000
oE=LCD
1000 6000
(00O< 4000
500
2000
0 20 40 60 80 100
OEaXo
CM 3x a>
0o(DQ_(/)"OCD0_c
Days incubation
3o
2000 80000
70000
1500 60000
50000
1000 40000 Q) q Q- o
30000 0
500 20000
10000
00 20 40 60 80 100
Days incubation
Fig 3.6. Hematite incubation.
Key: CH. (•), COz (□), H2 (♦), Acetate ( . ) and SO.2' (o)
70

Chapter 3 Initial mineral experiments
300000
250000
200000 ^ Q 3 O^ N5o 40(0Q .
a) 30 150000 a .
100000
50000
0 20 40 60 80 100 120 140
oEzL(DCDa5o<
Days incubation12 100000
1080000
8
6
40000
4
200002
20 40 60 80 100 120 140
D ays incubation
Fig 3.7 Pyrite incubation
Key: CH4 (•), CO2 C-), H2 (♦ ), acetate (*) and SO4 2' (c)
71

Chapter 3 Initial mineral experiments
IO
1000 200000
800150000
a>oroQ .COTJ(0<D.C
600
100000 q . W "D
4003W
50000200
□-----
OE3.<D(Ua>o<
O
3
20 40 60 80 100
Days incubation
120 140
6 70000
600005
500004
40000
3
30000
2
20000
110000
00 20 40 60 80 100 120 140
C/)o
3o
Days incubation
Fig 3.8. Pyrrhotite incubation.
Key: CH4 (•), CO2 F-), H2 (♦), Acetate ( * ) and S 0 42* (o)
72

Chapter 3 Initial mineral experiments
0 Ea1 O
CDOCDQ.(0"OCD<D
X = (0
OEa0TO0O<
2500 100000
2000 80000
1500
CL
1000 40000 0)
500 20000
00 20 40 8060 100
Days incubation600
500
400
300 -
200
100
12000
10000
0 20 40 60
Days incubation100
Fig 3.9 Basalt incubation.
Key: CH4 (•), CO2 (-), H2 (♦), acetate (*) and S 0 42'(c).
73

Chapter 3 Initial mineral experiments
3.4 Results: Labradorite, hematite, pyrite, pyrrhotite and basalt
3.6.1 Labradorite (Fig 3.5)
Labradorite incubation shows, initial rapid hydrogen formation (max of 2560 pmol I'1)
which decreases below the detection limit by day 4 and remains at this level over the
course of the experiment. Carbon dioxide also shows a rapid initial peak reaching
28.2 mmol I'1 by day 2 then decreasing to 3.4 mmol I'1 at day 6. CO2 then gradually
increases throughout the remainder of the experiment to a maximum of 73.55 mmol I'1
after 85 days. Methanogenesis commences at day 6 when carbon dioxide is at its lowest
concentration (3419 pmol I*1) and methane concentrations steadily increases to a
maximum of 1822 pmol I'1 after 85 days of incubation (31x less than hornblende).
Methane production co-occurs with sulphate reduction and high sulphate concentrations.
Sulphate concentrations are initially at 6350 pmol I 1, unusually the second sampling
point is higher (9.1 mmol f 1), this second sampling point is close to the start
concentrations for other incubations and perhaps the initial sulphate point is the result of
some sort of sampling error. Sulphate reduction begins after this point and is depleted by
day 45, much more rapidly than many of the other minerals such as ilmenite and
hornblende where depletion only occurred after 60 days. However at the 87 day sampling
point there is an increase in sulphate, this can happen if some O2 was introduced into the
system at the precious sampling point, however, the fact that methane and carbon dioxide
levels do not change seems to rule this out. They do however stop increasing temporarily.
Acetate values increase from a start value of 2655 pmol I'1 to 5721 pmol I'1 after 7 days.
Then steadily decreasing until day 60 after which, time similar to sulphate, an increase
occurs from 1420 pmol f 1 to 6214 pmol I'1.
3.6.2 Hematite (Fig 3.6)
Hematite incubation was different to previous incubations. No hydrogen was detected
throughout the course of the experiment and complete SO42' removal does not occur.
Also carbon dioxide levels do not initially increase as rapidly reaching a peak of
74
Chapter 3 Initial mineral experiments
24.28 m m ol1 then decreasing to 6667 pmol I'1 by day 14. Subsequently CO2 levels
increase again to an overall maximum of 79.42 mmol l_,at 72 days before decreasing to
66.13 mmol I'1 after 85 days (Despite high SO42'). Methane values start to increase at day
4 from 4 pmol I'1 to a maximum of 1684 pmol I"1 after 72 days, decreasing slightly
towards the end of the experiment to a final concentration of 1368 pmol I'1 after 85 days.
Sulphate start concentration was 11.9 mmol I 1, sulphate reduction began immediately
and continued until 60 days before stabilising at 7.91 mmol I"1. This possibly occurs
shortly after the time that acetate becomes depleted. Sulphate final concentration was
7.83 mmol I"1 , a removal of 3.44 mmol f 1 . Acetate levels increase slightly at the
beginning from a start value of 1526 pmol I 1 to 1615 pmol I'1, after 6 days of incubation.
Then acetate becomes depleted by day 45.
3.6,3 Pyrite (Fig 3,7)
Pyrite mineral incubation also produced no detectable hydrogen, neither was there an
initial rapid increase in carbon dioxide, as seen in other incubations e.g. ilmenite (10
mmol I"1 to 30 mmol I 1 in 6 days). However, initial concentrations were high in
comparison (273 mmol I'1). Carbon dioxide decreases to 125 mmol I'1 by day 9, (-16.4
mmol I'1 day). Then increases to 212.5 mmol I'1 by day 85, before decreasing to 75.4
mmol f 1 (day 132). The carbon dioxide concentration changes, seems overall to be
related to the sulphate reduction profile. Methanogenesis occurs during active sulphate
reduction and methane concentrations gradually increase to 53 pmol I'1 by day 85,
plateauing for the remainder of the experiment (Day 132). The amount of methane
formed is considerably less than other experiments e.g. 1684 pmol I"1 maximum in
hematite.
Initial concentrations of sulphate in this incubation, and the pyrrhotite incubation,
are very high in comparison to all other incubations (pyrite 89.4 mmol I*1 and pyrrhotite
65 mmol I'1, compared to 11.2 mmol I 1 for hematite), such high levels seem to be a direct
result of the crushing process. Exposure of freshly crushed pyrite surfaces to the9 9atmosphere (O2) may release previously oxidised compounds S ' -» SO4 \ This can be
75

Chapter 3 Initial mineral experiments
limited by speeding up the transfer process between crushing and slurry addition, and this
problem was not as pronounced during later pyrite thermal gradient experiments.
Sulphate reduction begins immediately lowering the sulphate concentration from
89.4 mmol I'1 to 65.1 mmol f 1 by day. The sulphate concentration then stabilises and
remains more or less constant until day 87 (58.9 mmol I"1) Rapid sulphate removal occurs
between day 87 and day 132 (down to 5.1 mmol I 1) . This rapid onset of sulphate
reduction is contiguous with a decrease in carbon dioxide, and this was unexpected since
CO2 is a product of sulphate reduction. Total sulphate removed over the incubation period
is large, 84.3 mmol I"1 over 132 days.
Acetate values initially peak to 4 pmol I'1 then dips to 0 pmol I'1 before increasing
gradually to finish at 10 pmol I'1 by day 132. Acetate and methane amounts produced are
low, with start concentrations for acetate much lower than previous incubations.
3.6.4 Pyrrhotite (Fig 3.8)
Similarly pyrrhotite incubation shows no measurable hydrogen production. Carbon
dioxide increases rapidly initially from 76.88 mmol I"1 day 1 to 166.38 mmol I'1 after 6
days. Carbon dioxide levels then more gradually increase to 174.44 mmol I 1 by day 58.
After this point a rapid dip occurs down to 80.16 mmol I'1 before increasing again to
190.87 mmol I'1. This dip in CO2 coincides with a sharp peak in methane values,
potentially indicating H2/CO2 methanogenesis. Carbon dioxide again decreases to
18.56 mmol I'1 by 100 days and then remains constant. Initially methane concentrations
remain low, increasing slowly from 4.5 to 63 pmol I'1 over the first 58 days. Then there is
a peak in methane formation at day 72 to 865 pmol I 1. After this methane decreases and
levels of to 65 pmol I"1 after 132 days.
Sulphate levels are initially high starting at 65.02 mmol I'1, this is again possibly
due to the crushing and powdering process before addition, possibly due to S2’ oxidation
as mentioned in the pyrite results. Sulphate reduction occurs immediately with rapid
sulphate removal occurring over the first 45 days (13 mmol I'1) sulphate removal then
slows with only 1.6 mmol I'1 removed over the remaining 87 days finishing at 50.34
76

Chapter 3 Initial mineral experiments
mmol I'1 (day 135). Complete sulphate removal does not occur, hence the peak in CH4
occurs in the presence of high methane concentrations. Acetate concentrations are very
low with a maximum of 5 pmol I'1 during the course of the experiment (day 132). An
initial ~2 pmol I'1 occurs at the start, this decreases to 0 pmol I"1 by day 6 and remains at
zero until after day 60 by day 87 acetate concentrations had reached 2 pmol I"1 and
further increases to 5 pmol I"1. Again the dominant process is sulphate reduction total
removal of 14.67 mmol I'1 (0.111 mmol l'Vday)
3.6.5 Basalt (Fig 3.9)
With basalt mineral addition, no hydrogen was observed during the experiment. Carbon
dioxide promptly increases from 9820 pmol I"1 to 31.629 mmol I 1 by day 4. Then
gradually increases during the course of the incubation reaching a maximum of
93519 pmol f 1 (day 85). A small dip in CO2 concentrations occurs at day 6 (6998 pmol 1"
’) coinciding with the onset of methane formation. Methane formation begins at day 6
and increases gradually to 2023 pmol I"1 (day 83). Methanogenesis occurs during active
sulphate reduction. Sulphate reduction is not as rapid as in the previous two mineral
incubations (pyrite and pyrrhotite). The start value for sulphate is much lower at
10.40 mmol f 1. Sulphate reduction begins immediately reaching 7010 pmol f 1 (day 60).
Sulphate is not however, completely removed as it levels and increases slightly to
7270 pmol I'1 (day 85). This increase at the end of a long incubation may be the result of
O2 entering into the reaction vessel (through a leak) or during sampling. However, both
methane and carbon dioxide concentrations do not change making a strong argument
against this. Acetate concentrations have a start value of 549 pmol I'1 reaching zero by
day 45. Depletion of acetate precedes the cessation of sulphate reduction, by aprox a 15-
day lag, but due to lack of sampling this may have been much longer.
3.7 AODC Counts
All Experiments were counted after 65 days of incubation using acridine orange direct
count technique. Interestingly, the number of prokaryotes present was similar in all cases
77

Chapter 3 Initial mineral experiments
except for the basalt experiment, which was slightly lower. This is irrespective of the
differing rates of methanogenesis, sulphate reduction and acetogenesis and H2 generation.
Table 3.3 AODC bacterial numbers of varying mineral incubations, after 65 days of incubation.
Sam ple__________ 95%CL______Totals/ mlHornblende 0.104 2.23 X 10*Pyrohotite 0.069 2.31 X 10*Ilmenite 0.473 1.90 X 10(Hematite 0.099 1.92 X 10*Olibomb 0.0230 3.72 X 10*Basalt 0.051 4.24 X 10*Olivine 0.063 5.10 X 10*Pyrite 0.273 4.07 X 10*Labrodorite 0.048 2.45 X 10*
3.8 Sterile controls
Sterile controls were run for all individual mineral experiments in order to demonstrate
whether prokaryotes could influence H2 from mineral: water reactions, that have
previously been considered to be purely abiological processes. Sterilisation was carried
out as described in chapter 2. Minerals were powdered and treated in the same way as the
biotic experiments. Triple autoclaving was chosen due to previous experience, that in
certain circumstances single autoclaving of bulk sediment was not enough to fully
sterilise. This was shown by sulphate reduction occurring in initial sterile controls (data
not presented in this study) after 20-30 days of incubation.
Only the graphs for the hornblende sterile incubation are being shown here with the
remainder of the data presented in the appendix. This is because all the data was similar
with no noticeable difference and hornblende is a good example of the overall trend.
78

Chapter 3 Initial mineral experiments
<0oCOCLCO"O<0<D
JZ
oE
IO
12000
10000
8000
6000
4000
0.5
2000
0 10050 150 200
oo
3o
□rCD0)CL<flT30)OCD
Days incubation
16000
O-
12000
8000
4000
00 50 100 150 200
Days incubation
Fig 3.10 Hornblende sterile control.
Key CH4 (•), C 0 2 (^), H2 (♦ ), acetate (*) and S 0 42'(c)
79

Chapter 3 Initial mineral experiments
Hornblende sterile control results shown (Fig 3.10) were run over a longer incubation
period than the any of the abiotic experiments (182 days). This was to ensure that even if
abiotic reactions were slower than biotic reactions, sufficient time was provided to detect
chemical changes. No hydrogen was detectable. Trace amounts of methane (1.7 pmol I'1)
were formed over the first 3 days before decreasing to zero after 182 days. No significant
acetate formation occurred, with a concentration of 7-15 pmol I'1 throughout the course
of the experiment. This was still higher than detected in the pyrite and Pyrrohotite
experiment. No sulphate reduction takes place. There is some variability in sulphate
values, however, this is within analytical error. All other sterile controls also showed no
significant methane acetate or hydrogen formation and absence of sulphate reduction
over 182 days incubation at 60°C.
80

Chapter 3 Initial mineral experiments
3.9 rf3C-CH4 isotope data.
Isotope 8 13C-CH4 analysis was performed on specific mineral incubations, in order to
better understand methanogenic processes occurring during mineral incubation. Gas
samples were taken from all mineral incubations. However, instrument constraints meant
only samples with CH4 concentrations in excess of 800 ppmv could be used.
Table 3.4 isotope data for selected samples
Sample S13C-CH4 SD(%o) (%o)
Hornblende -78.7 0.2Olivine -46.7 2.1
Olivine bombs -55.3 0.1Basalt -51.8 0.4
Hematite -47.4 0.4Pyrite -57.8 1.4
Ilmenite -60.6 5.3
3 H2/ c o 2
Acetate or mixed
SD= Standard Deviation.
There is a surprising range of 8 13C-CH4 values for the different minerals incubated under
identical conditions, all were characteristic of biogenic methane formation. This
difference in values is a reflection of the differing biogeochemical process occurring to
produce the methane A detailed diagram of methane sources and isotopic composition is
shown in Fig 1.7. Values seem to group together as follows 2 values between 40%o,
which are close to, the thermogenic zone and 50%o, 3 values between 50%o and 60%o, 2
values 60 %o plus. This shows that depending on the mineral under incubation a different
metabolic pathway may be followed i.e. Acetoclastic methanogenesis and H2/CO2 being
the main pathways however other substrates can be used e.g. methyl substrates such as
methanol,(eg Methanosphaera stadtmaniae) and other CO2 type substrates such as
formate and carbon monoxide. Overall it would seem mineral composition effects
substrate formation, which in turn effects substrate used for methanogenesis.
81

Chapter 3 Initial mineral experiments
3.10 Molecular analysis
Samples were taken for molecular analysis after 80 days incubation. DNA
extraction was as described in Chapter 2. DNA extraction was diluted 1 in 10 for archaeal
amplification and 1 in 50 for bacterial amplification this was found to give the best results
in terms o f ease o f product amplification.
Primers used were Bacterial 27F-907R nested with 357F-518R.Archaeal 109F-
958R nested with Parch -Saf. Samples were run on a 30-60% denaturing gradient gel for
profiling o f different sequences by DGGE.
To compare community profile in each o f the samples. Bands were excised and amplified
using M13F GC, followed by sequencing in the Cardiff University-sequencing core.
1 2 3 4 5 6 7 9 10 1 1 2 3 4 5 6 7 8 9 10
Fig 3.11 Bacterial DGGE profile
Key on following page.
13—0
“ > 1 4 —0
Fig 3.12 Archaeal DGGE profile
82

Chapter 3 Initial mineral experiments
Key for Figs 3.11 and 3.121) Marker2) Basalt3) Olivine4) Olivine Bombs5) Hornblende
6) Pyrite7) Pyrrhotite8) Labradorite9) Hematite10). Ilmenite
Numbers with arrows shows bands excised and sequenced.
The following tables shows the molecular match’s of the excised bands. In both archaeal
and bacterial DGGE gels. Substantially more bands were excised and sequenced than are
shown here however not all were of the desired quality especially many of the bacterial
sequences; all bands that are included in this study were over 100 bps. Expected Size of
DGGE product was 200 bp.
Table 3.5 Bacterial sequences Fig 3.11
N u m b e r N e a r e s t m a t c h b y B l a s t n s e a r c h
( A c c e s s i o n n u m b e r )
S e q u e n c e S i m i l a r i t y
C /.) '
P h y l o g e n e t i ca f f i l i a t i o n
I s o l a t i o n e n v i r o n m e n t n e a r e s t m a t c h
1 Thermosyntropha lipolytica
(X99980)
83% Syntrophomonadaceae, Thermosyntropha
Bioreactor co-culture With methanogen
2 Uncultured vent bacterium ML-8 (AF209003)
98% Candidate division OP9 Hydrothermal Vent
3 Thermotogales bacterium Ag55
(AB260049)
83% Thermotogales Hydrothermal vent
4 Thermotogales bacterium Ag55
(AB260049)
92% Thermotogales Hydrothermal vent
5 Thermotoga therm arum (AB039769)
91% Thermotogales. Thermotoga. High temperature oil reservoir
6 Beta proteobacteri um PCSC1 (AF411828)
97% Proteobacteria: Betaproteobacteria Unknown
7 Bacillus sp. OS-ac-18 (U46747)
100% Firmicutes Hot Spring
8 uncultured Methylococ caceae
bacterium clone Elev_16S_1037 (EF019533)
97% Gammaproteobacteria;Methylococcales:
Soil sample
9 Uncultured actinobacterium clone R61 -03-00r09
(DQ316867)
98% Actinobacteria Microbial communities contaminated
Subsurface sediments10 Uncultured delta
proteobacteriu m clone PA74 (AY771988)
100%Deltaproteobacteria
Tidal flats (Wadden Sea)
11 Moorella sp. enrichment clone R65 (DQ533547)
100% Clostridia;Thermoanaerobacteriales
Petroleum reservoir
83

Chapter 3 Initial mineral experiments
Table 3.6 Archaeal sequences Fig 3.12
N u m b e rN e a r e s t m a t c h b y B l a s t n s e a r c h
( A c c e s s i o n n u m b e r )S e q u e n c e
S i m i l a r i t y ( % )P h y l o g e n e t i c
a f f i l i a t i o nI s o l a t i o n
e n v i r o n m e n t o f n e a r e s t m a t c h
12 Aciduliprofundum boonei strain T469 (DQ451875)
97% Euryarchaeota: Aciduliprofundum Hydrothermal vent system
13 Uncultured Thermoplasmatales archaeon clone GoM HDA-13
(AY542186)
97% Euryarchaeoia: Thermoplasmatales Gulf of Mexico Gas hydrate
14 Uncultured archaeon clone: IAN 1-62 (AB175594)
96% Eury archaeota: Methanococcales hydrothermal vent field
15 Uncultured archaeon clone NAKl-al (DQ867048)
100% Methanobacteriales High temperature natural gas field
16 Uncultured archaeon clone SBAK- shallow-40
(DQ640171)
96% Thermoplasmatales Subsurface sediment estuarine sediment
17 Uncultured archaeon clone SBAK- shallow-40
(DQ640171)
97% Thermoplasmatales Subsurface sediment estuarine sediment
18 Uncultured archaeon clone NAKl-al
(DQ867048)
96% Methanobacteriales High temperature natural gas field
It can be seen by visual analysis of both gels that the community structure is
significantly different depending on mineral type. This is a reflection of the different rates
of biogeochemical processes occurring during the incubation, such as sulphate reduction,
methanogenesis, acetogenesis despite being common to all. Also it maybe that these
biogeochemical reactions are catalysed by different prokaryotes depending on mineral
type, or a reflection of different prokaryotes involved in additional mineral specific
reactions.
The community structure within the bacterial community appears to be more
complex than the archaeal, at 60°C however the effect of primer bias must be taken into
account on all DGGE profiles especially towards archaea (Teske and Sorensen, 2008).
Thus it appears the dominant community may be bacterial. Species diversity reflected
that commonly found in the deep biosphere sediments mostly from high temperature
hydrothermal environments. This gave added confidence that our approach could be
taken as a true refection of prokaryotic composition of our high temperature incubations,
which had been inoculated with Guaymas hydrothermal sediment. It must also be stated
that 97% similarity equates to species level, 95% equals genera and less than 95% is
indicative of novel genera. Sequence data from bands extracted and analysed (and
84

Chapter 3 Initial mineral experiments
deemed to be of acceptable quality) showed Thermotogales related species was one of the
dominant bacterial species to occur. Thermotogales is a branch of the Eubacteria
consisting of only three genera: Thermotoga, Thermosipho, and Fervidobacterium. All
of these organisms are extremophiles. Members of the Thermotogales are strictly
anaerobic growing optimally at neutral pH. The hyperthermophilic species T.maritima
and T. neapolitana grow at a maximum temperature of 90°C and an optimum around
80°C (Huber and Stetter, 1992 (a)), these are the highest growth temperatures in this
order. Thermotogales are organotrophs, fermenting simple and complex carbohydrates
with end products of acetate, ethanol, carbon dioxide and hydrogen formed when grown
on glucose (Huber and Stetter, 1992 (B)). Members of the Thermotogales are often found
in high temperature hydrothermal vents sediments and deep-sea sediments.
Other species that feature prominently are the Firmicutes. Firmicutes are Gram
positive of which the Clostridia are a sub division. In several hydrogen producing
bioreactor systems Clostridia were found to be the dominant species. Gram positive
proteobacteria belonging to the Beta, Gamma and Delta divisions were also present.
Betaproteobacteria are often associated with degradation of organic matter and are
known to be facultatively anaerobic. Gammaproteobacterial species Methylococcales
was also found, these are methanotrophs, which gain energy and carbon through the
oxidation of methane. However, all species so far have been found to be aerobic. This
sequence was only 97% related to Methylococcales over a 200 bp product, so it is
possibly a related anaerobic species. Deltaproteobacteria contain the sulphate reducing
bacteria and iron reducing species e.g. (Geobacter). Other recognised sequences were
related to the Thermosytropha, which is a thermophilic fatty acid oxidising bacteria
however the % similarity is very low 83%, so no physiological relationship can be
inferred. Related sequences to the Thermoanaerobacteriales (100%) were also found
which is a member of the Clostridia. Unfortunately description of the most closely
related match is unpublished, however the most closely related isolated member to our
sequence is Moorella glycerini. Which is a moderate thermophilic homoacetogen with
optimum growth at 58°C and pH 6.8 (Slobodkin et al., 1997). Subsurface
Thermoanaerobacter species have been isolated from the marine subsurface that are also
capable of metal reduction. Using H2 acetate and other compounds at optimal
85

Chapter 3 Initial mineral experiments
temperature of approx 60°C (Roh et al., 2002) Sequences similar to candidate division
OP9 were also found however very little is know about this division apart from its
association with deep sea hydrothermal vent systems (possible relationship with
candidate division JS1). Some of the matches had a low percentage similarity this is
perhaps a reflection of the presence of novel species not so far incorporated into the
BLAST database.
The Archaeal community structure appears to be not as complex as the bacterial
community. A change in composition is notable with varying mineral type with
methanogen species such as Methanococcales (found in hornblende and pyrite, unusual
as methane levels are low in pyrite) Methanococcales contain such species as
Methanococcus jannaschii which is a thermophile and produces methane through H2/CO2
methanogenesis(Jones et al., 1983) and Methanobacteriales (most pronounced in
labradorite and pyrrhotite incubations) the most common exponent of this species is
Methanobacterium thermoautotrophicum which is an Archaeon that grows optimally at
~-65°C it is an “absolute” autotroph, requiring only CO2, H2 and salts for growth (Zeikus,
1972). Other archaeal species were related to the Thermoplasmatales and
Aciduliprofimdum boonei (found in basalt, olivine and olivine bombs/
Thermoplasmatales (present in all, differing species but all Thermoplasmatales related)
often associated with sulphur respiration at elevated temperatures. Aciduliprofundum
boonei is the only isolated representative of phylogenetic DHVE2 cluster, it has been
shown to be an obligate thermoacidophilic sulphur and iron reducing heterotroph, capable
of growing from pH 3.3 to 5.8 and between 60 and 75°C (Reysenbach et al., 2006)
perhaps this strain is capable of growing at neutral pH.
The molecular data is consistent with a thermophilic archaeal community being
active in the mineral slurry experiments.
86

Chapter 3 Initial mineral experiments
3.11 Activation of mineral surfaces versus non-activation
In previous publications (Kita et al., 1982; Stevens and McKinley, 2000) it has been
indicated that the fresh grinding of minerals plays a major role in hydrogen generation.
In the initial magnetite experiments (appendix A), minerals were left for approx 96 hours
after grinding before addition to the master slurry. No hydrogen was generated and
processes such as sulphate reduction and acetogenesis were slow by comparison to other
experiments. In the previously described 60°C experiments minerals were left for
approximately 16 hours before addition. An initial experiment was conducted comparing
freshly re-ground minerals less than 10 minutes between grinding and addition, with
minerals that had been ground and stored for 3 months (aerobically) in order to directly
quantify the effect of fresh grinding on the initial stages of biotic mineral reactions.
Slurries were set up and incubated at 60°C with the two varying mineral treatments. The
following graphs show the results. ( Fig 3.13a/3.13b)
15000 250000
200000
CL10000
150000
100000
5000
50000
10 20 30Days incubation
40 50
o015 ’1 31 3
CD 0) Q . <ft T3 0) O CD
Fig 3.13 (a)Hornblende incubation fresh grinding versus no grinding, gas results Key: CH4 ( • ) C 0 2 (□) dashed line no re-grinding, Solid line fresh grinding.
87

Chapter 3 Initial mineral experiments
16
14
C/512 O
N5
3
10 18
6
4-10 0 10 20 30 40 50
Days incubation
Fig 3.13b hornblende incubation fresh grinding, versus no grinding (B) Acetate (A), S(>42’(0).Fresh grinding solid line, No re-grinding dashed line.
The two graphed results (Figs 3.13(a)/(b)) using hornblende at 60°C shows a clear
grinding effect. Fresh grinding of minerals in the presence of prokaryotes substantially
speeds up reactions, such as methanogenesis and sulphate reduction, as well as increasing
the production of carbon dioxide. No hydrogen was detected. Gas results shows methane
concentrations increase to 14017 ppmv over the first 25 days in the freshly ground slurry
(FG) with the non-reground minerals (NG) reaching only 1333 ppmv. A 10.5 fold
increase in methane production rates. Methane levels plateau after this with a final value
of 12798 ppmv for FG minerals and 1602 ppmv for NG minerals after 45 days. Carbon
dioxide levels similarly differ with a difference of 147987 ppmv after 25 days (FG
194000 ppmv, NG 46013 ppmv) final carbon dioxide levels reach 229000 ppmv and
29055 ppmv for FG and NG minerals respectively, a 7.8 fold difference in production.
Gas production is between 7 and 11 times faster in slurries with freshly ground minerals
than without.

Chapter 3 Initial mineral experiments
Rates of sulphate removal also differed; sulphate start values were identical for
both. Sulphate started at 15 mmol I'1 after 45 days incubation FG minerals sulphate levels
were at 4.46 mmol 1" (10.54 mmol 1' removed) and NG slurries were at 7.57 mmol f (7.43
mmol I'1 removed). Gives you a rate of removal of 0.234 mmol 1' 1 per day for FG slurry
and 0.168 mmol I'1 per day for NG slurry. Acetate levels start at the same concentration
however acetate values increase in FG slurry from 2 pmol I'1 to 2.4 pmol I'1 and
decreases to 1.75 pmol I'1 in NG slurry. The amount of acetate produced is very low and
one should not read to much into such low levels of acetate formation and removal.
The following table shows the data for the other mineral incubations used for grinding
analysis ilmenite and olivine.
Table 3. 7 Grinding experiment ilmenite and olivine results
Mineral Days Methane(ppm)
Carbon Dioxide(ppm)
Acetatepmol I'1
Sulphatemmol I'1
llemnite (FG) 0 0 0 1 15.01llemnite (FG) 25 10272 1.96E+05 na nallemnite (FG) 45 9483 2.19E+05 5.6 4.76Ilmenite (NG) 0 0 0 1 15.01Ilmenite (NG) 25 1434 51691 na naIlmenite (NG) 45 511 41192 1.7 6.72Olivine (FG) 0 0 0 1 14.2Olivine (FG) 25 9807 1.56E+05 na naOlivine (FG) 45 10453 2.19E+05 12 2 3.62Olivine (NG) 0 0 0 1 14.2Olivine (NG) 25 977 53678 na NaOlivine (NG) 45 317 36837 15 6.4
FG= Fresh grinding, NG=No grinding
Table 3.7 clearly shows the difference in rates of methanogenesis sulphate removal and
acetogenesis for olivine and ilmenite. The following is an approximate difference in
changes between FG and NG slurries for both mineral types:
a) Ilmenite, CH4 FG greater by 18 fold, Carbon dioxide by 5, sulphate removal by 1.5 and
acetate formation by 5.
b) Olivine, FG greater than NG for methane by 32 fold increase. Carbon dioxide by 5,
Acetate formation 8 . Sulphate removal 2 fold.1 3Grinding also affected the 6 C values of the methane produced.
89

Chapter 3 Initial mineral experiments
Table 3.8 S13C values for methane from grinding experiment.
Sample 813C-CH4 SD(%o) (%o)
Olivine (FG) -50.7 0.6Hornblende (FG) -57.4 0.5Hornblende (NG) -77.4 1.5
FG=Fresh grinding and NG= no grinding
Methane production was too low in the other samples for isotopic analysis. No results
were obtained for ilmenite incubation as a failure of the reaction vessel prior to sampling
caused less methane to be present than was required for analysis. The results show a
marked difference in 5 13C-CH4 values for hornblende depending on grinding or non
grinding of fresh mineral surfaces. However all values are indicative of biogenic methane
formation. But the lighter values for the hornblende NG incubation would be consistent
with greater CH4 from H2/CO2. The heavier values for hornblende FG are more
consistent with acetoclastic methanogenesis. Unfortunately due to limited data it is not
known whether this is true for other minerals.
3.12 Inhibition experiments
Inhibition experiments were conducted to determine immediate substrates for the key
anaerobic reactions of sulphate reduction and methanogenesis. This is a well-used
approach in anaerobic microbial ecology and works on the following principle.
Molybdate, chromate, tungstate and selenate are analogs of the sulfate ion which inhibit1 •} 'y
sulfate reduction with the approximate order of effectiveness. C1O4 > M0O4 "= W04 >
SeCV (Taylor and Oremland, 1979) but molybdate is the most commonly used inhibitor.
Molybdate enters cells via a sulphate transport system and interferes with the formation
of adenosine phosphosulfate (APS), leading to deprivation of reduced sulphur
compounds for growth. It forms adenosine phospho-molybdate in the cell. Without the
presence of a stable intermediate like APS, the next sequential enzymatic step cannot
occur.(Eq 3.1) and substrates that would have been used by sulphate reducing bacteria
accumulate.
90

Chapter 3 Initial mineral experiments
APS + 2e'—» AMP + S(>32'(E q 3.1) (Oremland and Capone, 1988)
Addition of molybdate to the slurry, is at the concentration of SC>42‘ present.
Methane inhibition occurs by means of addition of 2-bromoethanesulfonic acid (BES)
which is a structural analogue of meraptoethanesulfonic acid (which is the co-factor
known as “HS-coenzyme M” (CoM)) . CoM is associated with the terminal methylation
reactions involved in methanogenesis, including methyl-CoM reductase enzyme complex
from which methane is evolved. Uptake of BES inhibits methanogenesis and substrates
that would have been used by methanogens accumulate.
It has been found that 70pm BES blocked all methane on Methanosarcina sp grown on
acetate. (Smith, 1978) and is Usually effective when added in excess of 0.1 mM
(Oremland and Capone, 1988)
A point to remember is that too long specific inhibition may cause feed back inhibition,
as substrates accumulate, of the producing prokaryotes.
91

Chapter 3 Initial mineral experiments
3.13 Sulphate inhibition of basalt mineral incubation at 60 °C
9 •Sulphate inhibition was achieved through the addition of molybdate (M0O4 ') Addition
concentration was the in situ concentration of sulphate at, in this case 3 mmol I'1 at the
start of inhibition. Inhibition was started when sulphate reduction was well established.
Due to time taken to analyse SO4 removal was slightly more advanced than was ideal.
1.6 10"1200
1.4 10"
1000
1.2 10J
800 1 104
600 8000
6000400
4000
200Inhibition 2000
40 60 80 100Days incubation
2 .5 1 0 5250
Inhibition2105200
>2
150D "Q.
Q.
Xo 100
5104
20 600 40 80 100Days incubation
Fig 3.14 sulphate reduction inhibition in basalt mineral sediment slurries
at 60°C. Key CH4 (•) CO2 (-), Acetate (A ), SO42' (c). arrows indicatennint n f inhihitfnn
92

Chapter 3 Initial mineral experiments
Inhibition with molybdate was achieved, as sulphate removal and hence, sulphate
reduction was inhibited. This caused a rapid increase in acetate concentrations from 24
pmol I'1 at 24 days to 574 pmol I"1 by day 54 achieving a final concentration of
1078 pmol f 1 at day 9. Inhibition occurred at day 24 when sulphate values were at
3.1 mmol f 1 after 90 days sulphate values were at 2.9 mmol I'1 this is within analytical
error. 1 However prior to inhibition sulphate removal rates had began to slow and taking
this into account the approx percentage of sulphate reduction to acetate oxidation is
25.4% as acetate, sulphate is in a ratio of 1:1. This would seem to indicate either sulphate
reduction is not completely achieved using acetate or some other process is using acetate
when sulphate reduction is inhibited
Acetate' + S0 4 2"+3H+—» 2CO2+ H2S + 2 H2O AG° = -57.2 kj/reaction( Eq 3.2)
Methane and carbon dioxide concentrations that were increasing rapidly decreased
equally as rapidly methane decreasing from 210 ppmv after 24 days (inhibition point)
down to 91 ppmv after 90 days. CO2 decreasing from 216000 ppmv (24 Days) to
157000ppm (90days) no hydrogen accumulation was detected.
93

Chapter 3 Initial mineral experiments
3.14 Methane inhibition of basalt mineral incubation at 60 °C
Methane inhibition by addition of 0.1M 2-Bromoethanosulphonic acid was started after
consistent methanogenesis was established.
Basalt slurry, incubation at 60°C.
Inhibition 1.2 10 5
7000
6000
5000
4000
30004 104
20002 1041000 Inhibition
20 40 60 10080
Days incubation6 1 0 58000
70005 105
6000
4 1055000
4000
30002 105
20001 1051000
0 Inhibition100Days incubation
Fig 3.15 Methane inhibition, basalt incubation at 60°C:
Key: Carbon dioxide, (□) Sulphate (c) Acetate (■*) and Methane (•)
94

Chapter 3 Initial mineral experiments
Methane inhibition was successfully achieved on addition of BES after 38 days of
incubation. Methane levels at day 38 were 107090 ppmv and start to drop after addition
to 47091 after 70 days. Before inhibition acetate was decreasing, but after inhibition,
acetate concentrations increased from 406 pmol I'1 at inhibition to 7339 pmol I 1. Carbon
dioxide and sulphate remain the same carbon dioxide increasing and sulphate low (0.56
mmol I 1). No hydrogen was detected either before or after inhibition. The lack of
hydrogen liberated and increase in acetate concentrations suggests that methane
production was via acetoclastic methanogenesis (Eq.3.3).
CH3COO' + H20 ->CH4 + HCO3' AG° = -113kj/reaction (Eq.3.3)
3.15 Discussion
The aim of these initial mineral experiments were numerous and were as follows. What is
the effect of mineral addition and differing composition, on major biogeochemical
process such as methanogenesis, acetogenesis, sulphate reduction and hydrogen
generation? Is mineral H2 generation, influenced by microbially driven processes? Is
there an effect on microbial community structure with differing minerals? Is the
microbial community present similar to typical environmental samples so that these
incubations have a realistic bases for extrapolation to a natural environmental setting.
Does physical alteration of the mineral in terms of grinding and activation of “fresh
surfaces” have an effect on microbial processes? Through the use of specific inhibition
experiments identify the substrate used in the major processes of sulphate reduction and
methanogenesis in the presence of minerals. Can this work be extended by the use of
more detailed chemical analysis, molecular genetics and an extension of the range and
type of treatment of samples/minerals
Mineral addition has a clear effect on processes such as methanogenesis,
acetogenesis and sulphate reduction. This effect varies according to the composition of
the mineral used. Detectable hydrogen was only found in 5 of the incubations
(hornblende, ilmenite, olivine, olivine bombs, and labradorite) and is used rapidly over
the first 4/5 days. H2 is not detectable for the remainder of these experiments, with the

Chapter 3 Initial mineral experiments
exception of olivine and olivine bombs where some hydrogen is formed after sulphate
depletion and a decrease in methane concentrations occurs, (possible indication of
hydrogen use in each). No detectable hydrogen was found in basalt, hematite, pyrite and
pyrrhotite (magnetite was also analysed [appendix B] and found not to produce
hydrogen). Initial theories suggesting that hydrogen liberation was dependent on iron
concentrations, seem not to be the case, as hematite and magnetite both produced no
detectable hydrogen where as labradorite did. (Hematite Fe2C>3 54.12%, Magnetite
99.49%, Labradorite 0.62%, Table 3.2). However, lack of detectable hydrogen does not
necessarily mean hydrogen is not produced as hydrogen is rapidly and readily
cataboilized by a range of anaerobic prokaryotes for many purposes such as
methanogenesis acetogenesis and sulphate reduction.
Methane formation is affected by mineral type, both in terms of amount and
timing of formation. Methanogenesis occurs during sulphate reduction for all minerals
bar hornblende (Fig 3.1), where only after sulphate is depleted is there substantial
methane formation. Methane concentrations varied with mineral, hornblende being the
highest and pyrite being the lowest, this could be due to a number of factors primarily
being that methane can be produced via use of hydrogen (Eq.3.4) and there was no
detectable hydrogen formed with pyrite.
C 02 + 4H2 -» C tt, + 2H20 AG0;= -131 kj/reaction (Eq.3.4)
Sulphate levels start at a high level in the pyrite and pyrrhotite incubation. Sulphate
reducing bacteria (SRBs) utilise hydrogen at a lower partial pressure than methanogens
(Kristjansson et al., 1982) are capable of, thus limiting possible hydrogen availability for
methane formation during pyrite incubation. In Hornblende sulphate is depleted, freeing
up hydrogen for use in methanogenesis, as there is a drop in carbon dioxide
concentrations (Fig 3.1) and an isotope CFL* value of -78%o (Table 3.4) both indicating
H2/CO2 methane formation (Eq.3.4). The remaining incubations produced methane while1 sulphate was also being removed and also provide a mix of 5 C-CH4 values (Table 3.4),
indicating a possible mixture of methane production mechanisms, including acetoclastic
methanogenesis (Eq.3.3). But acetate is also preferentially removed by sulphate reducers
96

Chapter 3 Initial mineral experiments
in competition with methanogens (Schonheit et al., 1982). So it is surprising that both
processes are occurring together unless acetate concentrations are in excess in these
mineral experiments, or non-competitive substrates are being produced. Sulphate removal
rates also vary with mineral; sulphate is fully depleted in four incubations, (Hornblende,
olivine, olivine bombs and labradorite) and not fully depleted in the rest, hematite basalt
ilmenite pyrite and pyrrhotite. The latter, pyrite and pyrrhotite, start at a much higher
level than the other minerals, the overall amount of SC>42‘ removed far exceeds the other
minerals where sulphate was fully depleted. Acetate concentrations are linked to sulphate
removal rates, two processes of sulphate reduction seem to be taking place, firstly using
acetate as in Eq.3.2, inhibition experiments however only document acetate utilization,
sulphate reduction may also be conducted using hydrogen (Eq 3.5)
4 H2 + SO42' + H+ —» HS + 4 H2O AG° = -151.6 kj/reaction (Eq.3.5)
Olivine (Fig 3.3) shows acetate increasing during the course of the incubation, and once
sulphate is depleted after a 10-15 day lag phase hydrogen levels increase, pointing to a
possible usage of hydrogen during the initial sulphate reduction phase. However many of
the incubations show an initial high acetate concentration from H2/CO2 acetogenesis,
which is gradually used until sulphate, is depleted (hornblende Fig 3.1). In the case of
basalt (Fig 3.9) once acetate is depleted sulphate removal ceases and full depletion never
occurs. Acetate formation is also linked to hydrogen generation (Eq.3.6)
4H2 + H+ + 2HC03 -» CH3COO' + 4H20 AG° = -104.6 kj/reaction (Eq.3.6)
Highest concentrations of acetate were formed in slurries where initial hydrogen was
detected (e.g. hornblende, ilmenite Figs 3.1, 3.2). Conclusions from this are that rates of
processes such as methanogenesis, acetogenesis, sulphate reduction plus hydrogen
generation and co-occurrence of competitive substrates are affected by mineral
composition.
Hydrogen generation was influenced by microbial processes with little or no H2
formation controls at 60°C (max of 3-4 pmol I'1) even when running longer than the
97

Chapter 3 Initial mineral experiments
mineral incubations themselves (Fig 3.10a ), Standard AODC counts show no difference
in cell numbers per ml between varying slurry incubations (Table 3.3). However,
molecular genetic analysis using the 16S rRNA gene. Shows that both bacterial and
archaeal community structure differs according to mineral, related mineral compositions
show similar profiles (Figs 3.11, 3.12). Sequenced bands revealed majority of 16S rRNA
gene sequences were related to thermophilic species found in deep marine environments
such as hydrothermal vents, gas hydrates and oil reservoirs. This gave confidence that our
simulations could be used to simulate deep subsurface processes.
Physical alteration of the mineral through regrinding speeds up processes. This
may be due to the creation of fresh reactive surface. It is not due to particle size/ surface
area effects, as the mineral that was not ground was previously powdered using the same
procedure and time as the freshly ground sample. Perhaps hydrogen is generated by
stimulated prokaryotic activity at reactive surfaces and under elevated temperatures.
The specific inhibition of sulphate reduction, using molybdate and
methanogenesis through BES, showed that both processes in those specific basalt
incubations were significantly acetate driven 25.4% in case of sulphate reduction. No
hydrogen was formed during inhibition of either process. This confirmed our
interpretation of the basalt mineral incubation (Fig 3.9) where it was assumed that acetate
depletion was the limiting factor that caused sulphate removal to cease after 60 days
incubation.
This series of experiments showed that hydrogen could be consistently generated
from a range of minerals. It is a microbially driven process; it can potentially have a
major affect on subsurface microbial processes. Both the type of mineral and physical
treatment of the mineral (grinding) influences processes and community structure. Our
community structure resembled deep subsurface communities and could be a good
analogue, for this habitat. It was decided based on these findings to increase the
temperature range of experiments and do a full temperature profile, more detailed
molecular work and chemical analysis to better understand these processes and the
impact/significance of these findings.
98

Chapter 4 Temperature characteristics of basalt reactions in sediment slurries
Chapter 4
Temperature characteristics of basalt reactions in sediment
slurries
4.1 Introduction
Hydrogen generation from basalts has been subject to much debate in recent years. The
focus being on whether basalt/water, interactions can liberate hydrogen, which may be
capable of supporting prokaryotic life independent of photosynthetic energy capture
(Stevens and McKinley, 1995; Anderson et al., 1998; Stevens and McKinley, 2000) this
combined with the fact that hydrogen based subsurface communities have been found in
association with basalts (Chapelle et al., 2002), has fuelled speculation on the exact
nature of hydrogen generation from basalts. Considering these issues, research in this
project while concentrating on differing mineral types (varying Fe and Si composition),
conducted extensive experiments using basalt (Table 3.2).
Basalt also has a composition that is generally reflective of the group of minerals
we analysed, consisting of a mixture of Si and Fe, with concentrations close to the
median in comparison to the other minerals used.
The experiments presented in this chapter are as follows 1) Temperature
characterisation of slurries without basalt addition, conducted over a large temperature
range on the thermal gradient incubation system, in order to establish a “baseline”, to
quantify the direct effect of basalt addition on sedimentary prokaryotic reactions. 2)
Temperature characterisation of slurries with basalt addition, to examine the effect of
basalt addition on prokaryotic sedimentary processes at a range of temperatures 3)
Temperature characterisation of sterile slurries with basalt addition, to gauge the effect
that prokaryotes have on these sedimentary reactions. Are prokaryotes driving H2
generation reactions? 4) Temperature characterisation of sterile anoxic mineral salt
solution alone and basalt, to quantify the effect of ground minerals and anoxic mineral
salt solution, especially H2 generating potential. Serpentinization type reactions,
99

Chapter 4 Temperature characteristics of basalt reactions in sediment slurries
involving the interaction of basalts and seawater can produce high levels of hydrogen, at
hydrothermal field sites i.e. the lost city hydrothermal field (Kelley et al., 2005).
Reactions of this type were also the bases of previous hypothesis on sources of hydrogen
generation from basalts (Stevens and McKinley, 2000) . This experiment was in effect a
control to see if freshly ground minerals and anoxic mineral salt solution produced any
detectable hydrogen at biologically relevant temperatures and if it did, how do these
concentrations compare to quantities found to be generated in the presence of
sedimentary prokaryotes. 5) Molecular profiling of prokaryotic community structure to
analyse the community present and see the effect of temperature on community structure
6) A basalt ramping experiment was conducted using pressurised incubation vessels
(Chapter 2). This was conducted so as to simulate processes occurring over a defined
temperature range, through sequential temperature increases mimicking rapid burial
rather than a range of single temperatures as conducted in previous experiments. Using
these pressure vessels we were able to extend the temperature range beyond the limits of
the thermal gradient system (100/105°C) into a definite abiotic temperature zone
(>120°C). This experiment was subject to rapid ramping 10°C every 10 days. This was
due to time constraints on the experiment, and this was essentially a trial experiment to
test the feasibility of running this pressure system up to 155°C and handling high
temperature pressurised sub-sampling. Due to this rapid ramping, it was recognised that it
would be a challenge for the prokaryotic community to respond. A sterile control was
also run, this was to determine abiotic reactions at temperatures > 100°C and their
potential to supply H2 to the base of the biosphere and the effects if any, that microbial
interaction with minerals at biotic temperature have on interactions occurring at higher
abiotic temperatures.
100

Chapter 4 Temperature characteristics of basalt reactions in sediment slurries
a>T O H TOo CLC WS -o(N <D
X -C V ^
5 -i
4 4000
3.5 3500
I—y Q — 30003
2500 C2.5
2
"O1500 o1.5
10001
5000.5
020 40 60 80 1000
OE=L0)ro-4—» 0 O <
Termperature [ C ]140001200
120001000
10000800
8000
600
6000
4004000
2002000
08060 10040200
O)O
T=3o
Temperature [ C]
Fig 4.1 No mineral addition 3 days incubation.
Key CH. (•) , C 0 2 ( ), H2 (♦ ), acetate ( “ ) and SO.2' (c).
101

Chapter 4 Temperature characteristics of basalt reactions in sediment slurries
oE
1400600
1200500
10000O 400COQ .(0■oCO
300
800
600 “5
200- 400
100200
10040 8020 600
T3o
Temperature [ C ]160004000
140003500
120003000
100002500OE=L 800020000(0
■*—>0o< 60001500
40001000
2000500
1008040 60200
inO
to
T3o
Temperature [ C ]
Fig 4.2 No mineral addition, 93 days incubation.
Key: CR* (•), C 0 2 (□), H2 (♦), acetate (^) and S042' (c).
102

Ca
[mg/
L]
Al [m
g/L]
Chapter 4 Temperature characteristics of basalt reactions in sediment slurries
Cation concentrations in sediment only (no mineral addition) incubation after 93 days.3
0.352.5
2
1.5
1
0.5
010020 800 6040
Temperature [ °C ]
2.5
2
1 5
1
0.5
040
Temperature [ °C ]6020 80 1000
Fig 43 No mineral addition. Al and K cation concentrations after 93 days incubation, across selected key temperature points.
Al: inverted closed triangle. K: open Diamond
Fig 4.4 No mineral addition. Fe, Mn and Ti cation concentrations after 93 days incubation, across selected key temperature points.
Fe: closed circle. Mn: x. Ti: open box
400120
350100
300
250
200
150
100
50
10060 8020 40Tem perature [ UC ]
o
3(Q
14
12 -o.10
8
6
4
2
020 80 1000 40 60
Temperature [ C ]
Fig 45 No mineral addition. Ca and Mg cation concentrations after 93 days incubation, across selected key temperature points.
Ca: closed Diamond. Mg: open triangle
Fig 4.6 No mineral addition. P and Si cation concentrations after 93 days incubation, across selected key temperature points.
P: open circle. Si: closed triangle
103
Mn, Ti
[mg/L]
01 l'r,y/LJ

Chapter 4 Temperature characteristics of basalt reactions in sediment slurries
4.2 Results, sediment only incubation (Figs 4.1-4,6)
This experiment was conducted to quantify the effect of heating of the sediment matrix
used in the mineral addition experiments. In order to clearly define the effect that mineral
addition was having on heating experiments (baseline establishment).
The affects of heating on the sediment matrix are clearly shown in this experiment
(Fig 4.2). Experimental data shows VFA and gas data after 3 and 93 days plus cation data
at 93 days only.
After 3 days incubation no significant amounts of methane were detected ( max
value of 2.3 pmol I'1) . Hydrogen values were low with a maximum concentration of 3.5
pmol F1 detected at 71°C but proceeds from 40°C. Acetate concentrations start to
increase from 0 pmol F1 at 33°C to 1190 pmol F1 at 71 °C. This increase is not uniform
and a decrease is noted at 65°C where concentrations decrease by 374 pmol F1 to
791 pmol F1 before increasing again. Highest concentrations of acetate occurred at 71°C
after 3 days. Acetate concentrations decrease after 71°C, reaching 212 pmol F1 at 79°C.
Some sulphate removal occurs over the first 3 days. Sulphate values decrease from
approx 13.4 mmol F1 at 33°C to a minimum of 11.8 mmol F1 at 71°C (1.6 mmol F1
reduction). No removal takes place at 95°C. The zone of sulphate removal was from 39 to
95°C. Carbon dioxide values gradually increase with temperature reaching 3776 pmol F1
by 77°C before dropping and reaching 3000 pmol F1 by 95°C.
After 93 days incubation distinct biogeochemical patterns have occurred
associated with temperature. Methane values show two distinct temperature peaks. Firstly
one peaking at 20°C reaching 120 pmol F1 and the other at 40°C with a maximum of
535 pmol F1. Methane decreases after 40°C becoming undetectable past 71 °C. Carbon
dioxide levels seem to broadly mirror sulphate removal; maximum carbon dioxide
concentrations of 1400 pmol F1 occur near the zone of maximum sulphate removal at
71°C carbon dioxide decreases after this, which is mirrored by a decrease in sulphate
reduction. Sulphate removal stops at 77°C with concentrations similar to start
concentrations (13.1 mmol F1). However sulphate concentrations are seen to increase to
104

Chapter 4 Temperature characteristics of basalt reactions in sediment slurries
15 mmol I"1 at the final sampling point which is unusual. Perhaps this is due to anaerobic
S ' oxidation.
Hydrogen concentrations are undetectable for majority of temperatures. Low
concentrations however, are detected between 55-70°C overlapping the zone of sulphate
depletion. Acetate and methane levels seem to be linked as the second methane peak
decreases acetate increases. Starting concentrations for acetate at 6°C was 1045 pmol I'1
increasing to 1756 pmol I'1 at 26°C before decreasing to zero at 33°C and 11 pmol 1" at
39°C. This decrease co-occurs with the start of the second peak in methane
concentrations possibly indicating the occurrence of acetoclastic methanogenesis. Acetate
values increases considerably as methane concentrations begin to decrease, with the most
rapid increase noted when methane concentration drops to near zero at 60°C. Acetate
increases from 1.4 mmol f 1 to 3 mmol I'1 by 65 °C and continues to a maximum
concentration of 3.75 mmol I’1 at 71°C. Acetate decreases rapidly after this to 1.07 mmol
I'1 at 83°C. a slight increase occurs toward the end similar to carbon dioxide
concentrations increasing to 1.55 mmol I'1 at 89°C and decreasing to 1 mmol’1 at 95°C
Cation results indicate that various elements react differently during 93 days
incubation at varying temperatures. K concentrations follow the inverse of sulphate
reduction similar to carbon dioxide values. Calcium and magnesium concentrations also
have a profile similar to CO2 (Fig 4.5) (offset observed in this could be lack of sampling
resolution) Silica values increased with temperature reaching a maximum of 9.4mg/l. Mn
values showed a slight decrease at higher temperature from 0.38 to 0.36 mg/1.
Total iron values increased initially concurrent with the second methane peak at
40°C then decreases to minimum values when Ca Mg and K increased. Total Fe then
consistently increased with temperature from 60°C to a maximum value of 2.45 mg/1 at
95°C. Ti concentrations were at there highest when methane concentration were at there
maximum.
105

Chapter 4 Temperature characteristics of basalt reactions in sediment slurries
1400 500
1200400
1000
300800
Oo 600 200
400
100200
60 80 1000 20 40Temperature [ UC 1
Fig 4.7 . Comparison of carbon dioxide concentrations over the incubation temperature generated after 93 days, with the Ca, Mg and K cations concentrations found in the incubation slurry after 93 days.
Key :CC>2 open box: Ca closed diamond: Mg open triangle: K open Diamond.
106

Chapter 4 Temperature characteristics of basalt reactions in sediment slurries
8000800
7000700
6000600
== g 500O Q.C (0§. ■eCNX
o ' 2 300
5000 ^ O
4000 O "D —
3000
2000200
1000100
0 20 40 60 80 100 120
Tem perature [ °C ]150002500
2000
£ 1500 H.<DCDCD£ 1000
5000
500
12060 80 10020 400Tem peratu re [ °C ]
Fig 4.8. Basalt slurry 3 day incubation.
Key CH4 ( • ) C 0 20 H2 (♦ ) acetate (*■) and SO*2' (o)
107

Chapter 4 Temperature characteristics of basalt reactions in sediment slurries
0— o— CDO Q_E w^ CDo* (1)
° %
350 2500
300
2000
250
1500200
73150
1000 &or
100
500n50
020 40 60 80 100
oE=LCD0O<
20 80 10040 60
Temperature [ °C ]Fig 4.9 Basalt slurry 83 day incubation.
Key CH4 (•), C 0 2 (□), H2 (♦), Acetate (a) and SO42' (o)
oo
N5
T3o
120
Temperature [ C ]150008000
7000
6000
100005000
4000
30005000
2000
1000
0
05o
*p3o
120
108

Chapter 4 Temperature characteristics of basalt reactions in sediment slurries
Cation concentrations found in Basalt sediment slurry after 83 days incubation.
t.6
1.4
1
0.8
0.6
04
060 10020 12040 800
* ^ 3 £
Temperature [ C ]
2
1.5
1
0 5
020 ) 60 80
Temperature [ °C ]1200 10040
Fig 4.10 Basalt mineral addition. Al and K cation concentrations after 83 days, over selected key temperatures
Fig 4.11 Basalt mineral addition, Fe, Mn and Ti cation concentrations after 83 days, over selected key temperatures
Al: inverted triangle. K: open Diamond Fe: closed circle. Mn: x. Ti: open box
500300
450
250
400
200350
<Q300 r*
150
250
100200
15060 80
Tem perature [ °C ]100 120200 40
10
8
6
4
2 -O
020 100 12040 60
Temperature [UC ]800
Fig 4.12 Basalt mineral addition, Ca and Mg cation concentrations after 83 days, over selected key temperatures.
Ca: Diamond. Mg: open triangle
Fig 4.13 Basalt mineral addition, P and Si cation concentrations after 83 days, over selected key temperatures
P: open circle. Si: triangle
109
Chapter 4 Temperature characteristics of basalt reactions in sediment slurries
4.3. Results basalt sediment incubation (Figs 4.8-4.13)
No significant methane was detected after 3 days incubation, with a maximum
concentration observed of 5 pmol I"1 at 40°C. However, methane concentrations were still
higher than the sediment only incubation, by a factor of 2. Carbon dioxide concentrations
increased with temperature, reaching a maximum of 7709 pmol I"1 at 98°C. This is also
approximately a factor of two times greater than the sediment only incubation, max
concentration (3776 pmol I'1).
Hydrogen concentrations were substantially greater (x218) than the sediment only
incubation. High levels of hydrogen were detected between 80-105°C. With maximum
concentrations of 766 pmol I"1 detected at 92°C. However, no hydrogen was formed
above 100°C. Initial concentrations of sulphate were approx 14.5 mmol I'1. Sulphate
removal occurred between 20-98°C, with a maximum removal of 3.3 mmol I'1 occurring
at 79°C. Significant amounts of acetate were present by day 3. Acetate values increase
from 0 pmol I"1 (34°C) to 2030 pmol I 1 (60°C), before decreasing to 143 pmol I"1
(79°C), acetate increases again similar hydrogen to 1664 pmol T1 at 92°C before
decreasing towards and after 100°C. The decrease in the amount of acetate at 79°C
coincides with the point of maximum sulphate removal indicating perhaps acetoclastic
sulphate reduction taking place. (~ 3000 pmol I'1 and ~ 2000 pmol I"1 reduction in
acetate)
After 83 days of incubation, carbon dioxide concentrations increase to a
maximum of 2160 pmol I'1 at 60°C. Carbon dioxide increases were contiguous with
sulphate removal with maximum concentrations of carbon dioxide, occurring in the zone
of sulphate depletion. Rapid decrease in CO2 occurs at 73°C (1932 pmol I'1) to 465 pmol
I'1 at 79°C. This decrease coincides with rapid increases in acetate. Acetate formation
can consume carbon dioxide and hydrogen.
2C02 + 4H2 -> CH3COOH + 2H20 AG°’= -104.6 kj/reaction. (Eq 4.1)
110

Chapter 4 Temperature characteristics of basalt reactions in sediment slurries
However H2 is increasing this leads to the assumption that H2 is being produced in
excess.
Some methane formation occurs during sulphate removal, with two distinct peaks
being distinguishable which were close to or in the SO4 ' depletion zone. Maximum
concentrations of 65 pmol I'1 at 47°C and 159 pmol I'1 at 6 6 °C. Methane formation
occurs at a higher temperature than no mineral slurry incubation, but surprisingly not to
higher concentrations.
5 ,3C-CH4 values were obtained for these samples and they show values consistent
with biogenic methane formation from acetate (Whiticar, 1999) (Table 4.1)
\
Table 4.1 Methane isotope for basalt incubation
Temperature 8 i3C-CH4 SD 8,3 C -C 0 2 SD
6 6 °C -54.7%o 0.9 -2 1 %o 0.4
47°C -60.8%o 0 . 8 -2 0 %o 0 . 2
SD= standard deviation.
Hydrogen occurs at high concentrations 300 pmol I'1 at 92°C. Lower levels are
present in the zone of sulphate depletion 32 pmol f 1 at 73°C, which is also close to where
the highest methane concentrations occurred . Acetate concentrations increase in the zone
of sulphate depletion to 700 pmol I"1 at 6 6°C (indicating that acetate formation in this
zone is greater than sulphate reduction), before rising rapidly when sulphate removal
slows to reach a maximum concentrations of 7.1 mmol f 1 at 98°C similar to hydrogen a
rapid decrease above 100°C occurs, to 2.2 mmol I"1 at 105°C. Sulphate concentrations
start at approx 14.4 mmol I'1 removal begins at 15°C (decrease to 13.4 mmol I"1 at 21°C)
sulphate values reach zero (depletion) between 53-66°C and removal decreases above
this temperatures. Increases in acetate during decrease in sulphate removal rates indicate
possible use of acetate in sulphate reduction.
I l l

Chapter 4 Temperature characteristics of basalt reactions in sediment slurries
Acetate'+ SO4 2 + 3H+ —> 2CO2 + H2 S + 2 H2 O AG° = -57 kj/reaction. (Eq 4.2)
Cation analysis showed several cation profiles were different than the no mineral control,
such as K, Ca, and Mg other elements are similar such as Al, Si, Mn and P. A1
concentration commences at 1.38 mg/1 decreasing to a lowest level of 0.49 mg/1 at 85°C
followed by an increase. This decrease occurs close to the time of rapid acetate
generation and slow down of sulphate reduction. K concentrations show a decrease at
40°C and 98°C from 390 to 280 mg/1 and 362 to 299 mg/1 respectively. Fe and Mn
concentrations broadly increase with temperature most rapid increase in Fe occurs from 8
to 40°C (0.4 to 1.72 mg/1) this co-occur with first large methane peak this is rather
different than the no mineral incubation (Fig 4.4) where we see this rapid increase
followed by an equally rapid drop in Fe close to the zone of sulphate depletion. Ti is
broadly similar to no mineral addition increase over the first 40°C decreasing over the
remainder of the temperatures. Ca and Mg are both very different to the no mineral
incubation. Mg concentrations at 8°C of 486 mg/1 decrease to 178 mg/1 by 98°C before
increasing at 98°C from 178 mg/1 to 263 mg/1. Ca levels start at a higher concentration
than the no basalt incubation (157 mg/1 as opposed to 16 mg/1) decreasing at 40°C to 96
mg/1 before increasing to 253mg/l at 105°C (a slight decrease occurs between 92 and
98°C). Ca and Mg concentrations are significantly higher in the basalt incubation than the
no mineral control.
Si concentrations are broadly similar in both basalt and no basalt
incubations increase with temperature (a small decrease is however, noted at ~ 80°C in
the no mineral incubation). Si stepwise increases with temperature, 0.8 mg/1 at 8°C to
10.4 mg/1 105°C. Phosphorus concentrations are quite different; basalt incubation starts at
a lower level by a factor approx 6 at 1.48 mg/1 increasing with temperature but with a
decrease at 85°C coinciding with the start of hydrogen generation. Final concentration at
105°C, is 9.5 mg/1.
112

Chapter 4 Temperature characteristics o f basalt reactions in sediment slurries
<DO_ COO Q-c wE -o=*- coX ^
XO (0
70001
6000
0.8
5000
0.64000 -j-
3000 "O
2000Q a
1000
012020 40 60 80
Temperature [ °Co 100
O
15000700
600
50010000 CO
OE 400a.oco"5 300O <
5000200
100
12020 40 60 OTemperature[ C]80 1000
Fig 4.14 Basalt slurry sterile control 3 days.
Key CH4 (•), CO2 ( ) , H2 (♦ ), acetate (*) and S 0 42' ( ).
113

Chapter 4 Temperature characteristics of basalt reactions in sediment slurries
CD7_ o— CD O Cl
E=L(/)■DCD
x " !O y)
700
600
500
400
0.8
300 TJ
0.6
2000.4
1000.2
20 100 1200 60 8040
Temperature [ C ]
OO1=3o
150002500
2000
100001500
=L
10005000
500
100 120806020 40
Temperature [ C ]
Fig 4.15 Basalt slurry sterile control. 130 days.
Key CH4 (•), C 0 2 ( ), H2 (♦ ), acetate (*) and S 0 42' (=).
114

Al [
mg/
L]
Chapter 4 Temperature characteristics of basalt reactions in sediment slurries
Basalt sterile control, cation concentrations, after 133 days of incubation.
4
35
3
2.5
CDE 2Li.
1.5
1□----------a-
05
060 80
Temperature [ °C ]40 100 1200 20
2.5 o -
60 ITemperature [ °C
100 12020 40 800
Fig 4.16 Basalt sterile control. Al and K cation concentrations Fig 4.17 Basalt sterile control. Fe, Mn, and Ti cationafter 133 days, over selected key temperatures concentrations after 133 days, over selected key temperati
Al: inverted triangle. K: open Diamond Fe: Solid circlet. Mn: x. Ti: open box
400350
350300
300250
250
200200
150
150
100 100
12010060 80400 20
CO —j ,__, CD3 E
(O '—'. n o .
10
8
6
4
2
0
Tem perature [ C ]40 60 80
Tem perature [ C ]
Fig 4.18 Basalt sterile control. Ca and Mg cation concentrations after 133 days, over selected key temperatures
Ca: Diamond. Mg: open triangle
Fig 4.19 Basalt sterile control. P and Si cation concentrations after 133 days, over selected key temperatures
P: open circle. Si: triangle
115
Mn , Ti
[mg/L]

Chapter 4 Temperature characteristics of basalt reactions in sediment slurries
4.4. Results sterile control incubation (Figs 4.14-4.19)
No hydrogen was detected over any temperature range in the absence of prokaryotes,
after 3 days of incubation. Extremely low levels of methane were detected with the
highest value of 0.89 pmol I"1 at 100°C. Carbon dioxide increased with temperature with
a maximum concentration of 6303 pmol I’1 also at 100°C. Initial sulphate concentrations
were 13.1 mmol f 1 no sulphate removal occurred, but there was a slight increase to 13.6
mmol I'1 at 100°C. The initial concentration of acetate was 185 pmol I'1 this remained
constant until 62°C (199 mmol I'1) before consistently increasing with temperature to a
maximum value of 614 pmol I 1 at 100°C.
After 130 days incubation (this was longer to see if any slower abiotic reactions
could be occurring over the course of the incubation which, may have an effect on
biogeochemical processes) methane concentrations are still very low with a maximum
value of 1.56 pmol I'1 present at 87°C. No hydrogen was detected at any temperature.
Carbon dioxide levels are substantially lower than the 3 day incubation with a maximum
of 667 pmol I’1 (5690 pmol I"1 lower). Carbon dioxide decreases from 4°C (535 pmol I’1)
to 190pmol I"1 at 62°C (a small increase of ~100 pmol I 1 is noticed at 9°C) before
increasing with temperature to a maximum of 667 pmol I'1 at 100°C. This is the inverse
of both prokaryotic experiments. No sulphate removal takes place over the course of the
experiment in fact a slight increase was noted over the temperature gradient.
Concentrations were 12.8 mmol I’1 at 4°C whilst at 100°C concentrations of 14.7 mmol 1‘
1 where noted. This increase could perhaps be due to FeS/FeS2 oxidation.
Surprisingly high levels of acetate were produced and this increased with
temperature above ~40°C, however, no acetate consumption was obvious. Acetate levels
increase with temperature with a more exponential increase noted at higher temperatures,
maximum concentration of acetate was, 2401 jumol I'1.
Cation profiles after 130 days, show differences to incubations conducted in the
presence of prokaryotes in both experiments with or without basalt. Potassium (K)
concentration shows no variation across temperature ranges unlike biotic experiments. Al
116

Chapter 4 Temperature characteristics of basalt reactions in sediment slurries
is similar to other experiments increasing to a max at 42°C (2.88 mg/1) before decreasing
to 1.6 mg/1 at 87°C and increasing to a final value of 2.85 at 100°C. Fe and Mn
concentrations differ than those in the presence of prokaryotes. Increase is not as rapid
initially with Fe, but a clear increase with temperature is noted and the maximum value is
higher in biotic basalt incubations 3.92 mg/1 as opposed to 1.7 mg/1 found in abiotic
incubations. Mn also increases with temperature from 0.4 mg/1 at 17°C to 0.6 mg/1 at
100°C. Ti slightly increases, but values are very low from 0.11 mg/1 at 17°C to 0.18 mg/1
at 100°C. Mg profile is similar in the sterile control to biotic experiments however the
concentration changes are not with the basalt incubation decreasing by 250 mg/1 as
opposed to 100 mg/1 in the sterile control. Mg decrease with temperature from values of
399 mg/1 at 17°C to 267 mg/1 at 94°C before a slight rise to 280 mg/1 at 100°C. Ca
concentrations decrease slightly to 239 mg/1 at 42°C before increasing to a maximum
value of 323 mg/1 at 100°C. Ca concentrations seem to increase more rapidly when
acetate increases again this is similar to biotic experiments, but concentration changes are
more extreme when prokaryotes are present. P concentrations increase rapidly to a
maximum concentration of 9.37 mg/1 at 42°C, plateauing until 87°C (9.13 mg/1)
decreasing for remainder 100°C (6.7 mg/1). Si is similar to biotic experiments increase
with temperature with a more rapid increase to 40°C. Concentrations are lower than
biotic experiments with the highest concentration occurring at 94°C (6.2 mg/1) decreasing
to 5.05 mg/1 100°C.
oE
Oo
Sterile control average- -6~ o —
10000 150005000Am ount of Su lphate rem oved [pmol 11]
o
Fig 4.20. Sulphate removed against carbon dioxide generated Key: Basalt incubation diamond. Sediment only, open circle.Sterile control dotted line. Average was taken as no sulphate was 1 1 7
removed

Chapter 4 Temperature characteristics of basalt reactions in sediment slurries
4.5. Mineral and Anoxic mineral salts solution only incubation (Fig 4,21)
To analyse the effect of freshly ground mineral and anoxic mineral salts on hydrogen
generation a limited temperature, thermal gradient experiment was set up. Only gas
production was measured and incubation temperatures where chosen where hydrogen
was generated in the thermal gradient experiment containing basalt and prokaryotes. The
results were as follows.
CDOCOQ .UiTJCOa>
X ^
20
d" "o - ----
15
10
5
070 75 80 85 90 95
2000
1500
§ o<zrCD
1000 jDOT■Oo>oCD
500
1=3o
100Temperature [ C]
Fig 4.21 Ground Basalt and mineral salt solution.
Key : H2 3 days(O) 28 days (♦): C 0 2, 3 days (□) 28 days (■)
4.6 Results mineral and anoxic mineral salt solution (Fig 4.21)
Some low levels of hydrogen were generated in the presence of ground basalt and sterile
anoxic mineral salt solution, this matches the amounts of hydrogen generated in similar
abiotic experiments previously conducted (Stevens and McKinley, 2000). However a
maximum of 9 pmol I"1 was produced as opposed to 600 to 700 pmol 11 (Fig 4.8 and 4.9
118

Chapter 4 Temperature characteristics of basalt reactions in sediment slurries
after 3 days) in the presence of microbes is generated. Hydrogen generation increased
with both time and temperature up to 85°C before plateauing for the remainder of the
experiment. Carbon dioxide levels show little temperature effect (Fig 4.21). Sterile
controls with sediment showed a clear temperature effect with a small decrease above
85°C at 3 days (Fig 4.14). This indicates that perhaps the added sediment was involved in
the observed CO2 removal. Carbon dioxide significantly decreased with time from a
maximum concentration of 1891 pmol F1 after 3 days, in the absence of prokaryotes, to
363 pmol l'1 after 28 days. These results shows that mineral only experiments can be
misleading in terms of potential of minerals for hydrogen generation, and that the
presence of a sedimentary matrix has a significant effect.
119

Chapter 4 Temperature characteristics o f basalt reactions in sediment slurries
4.7 Bacterial molecular analysis o f basalt thermal gradient experiment
M 15 34 47 60 6 6 92 98 M +Ve
46
Increasing Temperature Fig 4.22 Bacterial DGGE gel, of basalt thermal gradient incubation after 83 days incubation.
Fig 4.22 is a Bacterial DGGE profile o f Basalt and sediment thermal gradient
experiment after 83 days incubation (Fig 4.9). Gel was a 30-60% denaturing gel using
primers, 27F-1492R nested with 907F-357R bands were excised and certain bands were
chosen for sequencing. Temperature o f samples shown above the profile M= DGGE
marker and +Ve is positive control. The following tables show the bacterial results.
(Additional band shown on the gel are bands extracted and sequenced but deemed to be
not o f sufficient quality for inclusion)
120

Chapter 4 Temperature characteristics of basalt reactions in sediment slurries
Table 4.2. Blastn analysis of bands taken from the basalt DGGE gel using bacterial
primers (Fig 4.22). Given are the nearest match, phylogenetic affiliation of that
match and the isolation environment.
N u m b e rN e a r e s t m a t c h b y B l a s t n
s e a r c h ( A c c e s s i o n n u m b e r )
S e q u e n c eS i m i l a r i t y
(%)
P h y l o g e n e t i cA f f i l i a t i o n
I s o l a t i o n e n v i r o n m e n t n e a r e s t m a t c h
34 UC clone MPCa_6D08
(EF414087)
91% Firmicutes Marine estuary
37 Uncultured Clone M55 D15 L B A12
(EF586041)
96% Firmicutes, Clostridia Anaerobic solid waste digester
39 Thermotogales bacterium Ag55
(AB260049)
80% Firmicutes, Clostridia Laboratory
42 Delftia clone Zy B13 (EU376041)
100% Betaproteobacteria. Burkholderia Soil sample
44 Clone: KW-6.
(AB186284)
97% Gammaproteobacteria Oil storage Reservoir
49 Delftia clone ZY-B13 (EU376041)
96% Betaproteobacteria, Burkholderia Soil
50 Uncultured clone FLSED16 (EU552848)
96% Unknown (possible) Betaproteobacteria;
Gas condensate Aquifer
121

Chapter 4 Temperature characteristics o f basalt reactions in sediment slurries
4.8 Molecular analysis Basalt thermal gradient archaeal profile
M 15 34 47 60 66 92 98 M, +Ve M 15 34 47 60 66 92 98 M +Ve
-{>->
Fig 4.23 (a) :30-60% Archaeal Basalt Fig 4.23 (b) 30%-80% Archaeal Basalt
Increasing Temperature Increasing Temperature
Figs 4.23a And 4.23b Show Archaeal run DGGE profile o f prokaryotic basalt thermal
gradient experiment. Samples were ran on 2 differing percentage gels. This is due to the
high temperature nature o f the samples. Note the appearance o f extra bands at higher
temperature in the 30-80 % gel, this is due to the high GC content o f thermostable
Archaea being “held" on the 80 % gel. Primers were 109F-958R nested with Parch519r-
122

Chapter 4 Temperature characteristics of basalt reactions in sediment slurries
Saf. Bands were excised and certain bands were sequenced. The following tables show
the results
Table 4.3 Blastn analysis of the 30-60% Denaturant DGGE gel (Fig 4.23 a) Archaeal sequences
N u m b e r N e a r e s t m a t c h b y B l a s t n s e a r c h
( A c c e s s i o n n u m b e r )
S e q u e n c e S i m i l a r i t y ( % )
P h y l o g e n e t i cA f f i l i a t i o n
I s o l a t i o n e n v i r o n m e n t o f n e a r e s t m a t c h
1 C l o n e 3 A 0 6 6 9 6 % M B G - D T i d a l s e d i m e n t s
E F 2 0 3 5 5 7
2 T f C 2 0 L 3 7 A r 9 4 % M B G - D T i d a l s e d i m e n t s
( E U 3 6 2 3 5 5 ) Thermoplasmatalaes
3 T f C 2 0 L 3 7 A r 9 6 M B G T i d a l s e d i m e n t s
( E U 3 6 2 3 5 5 ) Th ermoplasmatalaes
4 T f C 2 0 L 3 7 A r 9 2 M B G T i d a l s e d i m e n t s
( E U 3 6 2 3 5 5 ) Thermoplasmatalaes
5 G o m G C 1 8 5 6 0 1 A 9 7 Thermoplasmatalaes M a r i n e G a s H y d r a t e
( A Y 2 1 1 7 1 5 )
6 A J 5 9 6 0 - 5 9 6 % M B G - D D e e p S e a m i c r o b i a l m a t
( A B 4 2 6 4 5 8 )
7 K a z a n - 3 A - 1 0 9 7 % M B G - D M a r i n e s e d i m e n t
( A Y 5 9 2 0 3 4 )
Table 4.4. Showing Blastn analysis of the 30-80% Denaturant DGGE gel (Fig 4.23 (b» Archaeal sequences.
N u m b e r N e a r e s t m a t c h b y B l a s t n s e a r c h
( A c c e s s i o n n u m b e r )
S e q u e n c e S i m i l a r i t y ( % )
P h y l o g e n e t i cA f f i l i a t i o n
I s o l a t i o n e n v i r o n m e n t o f n e a r e s t m a t c h
8 T f € 2 0 L 3 7 A r
( E U 3 6 2 3 5 5 )
9 6 M B G - D
T herm oplasm atalaes
T i d a l s e d i m e n t s
9 T f C 2 0 L 3 7 A r
( E U 3 6 2 3 5 5 )
9 6 M B G - D
Therm oplasm atalaes
T i d a l s e d i m e n t s
11 M ethanotherm us ferv id u s
( M 3 2 2 2 2 )
8 0 M ethanobacteriales;M ethanotherm us
H y d r o t h e r m a l s y s t e m
1 2 T f C 2 0 L 3 7 A r
( E U 3 6 2 3 5 5 )
9 4 M B G - D
Thermoplasmatalaes
T i d a l s e d i m e n t s
123

Chapter 4 Temperature characteristics o f basalt reactions in sediment slurries
Fig 4.24 is a bar chart showing tentative identification based on band position relative to
sequenced bands from the basalt TG and bands from ilmenite and other gels relative to
marker ran. Temperature is plotted against percentage community composition, showing
changes in composition with temperature increase.
Basalt 15°C
Basalt 34°C
2. Basalt 47°C E
% Basalt 60°C
_ Basalt 66°C
Basalt 92°C
Basalt 98°C
■ Marine benthic group D (MBG-D) - Eury■ Thermoplasmatales- Eury□ Thermococcales- Eury■ Methanococcales -Eury■ Methanomicrobiales- Eury□ Methanobacteriales-Eury■ Novel Crenarchaeota -Cren□ Marine Benthic Group B (MBG-B) -Cren□ Unsequenced_______________________
0% 20% 40% 60%Percentage DGGE Band
80% 100%
Fig 4.24. Bar graph showing archaeal changes with temperature
4.8.1 Molecular results
Many more bands were sequenced, but deemed not to be o f suitable quality for inclusion,
only those that had distinguishable base pair amounts o f over 1 OObp, were included. The
bacterial profile, by visual analysis appeared to be more complex at lower temperatures
than the archaeal. Even at higher temperatures (98°C) more bacterial bands are noticeable
in the 60% gradient gel. Bacterial samples were also run on an 80% gradient gel
however, as no new bands appeared this was not included in the results. Those bands,
which were sequenced in the bacterial profile, belonged to the following phylogenetic
groups: Firmicute s . Clostridia and Proteobacteria (Gamma and Beta). Clostridia are
often found in environmental samples, are exclusively anaerobic and are normally
124

Chapter 4 Temperature characteristics of basalt reactions in sediment slurries
associated with fermentation, with end products being acetate and lactate as well
hydrogen in some cases (e.g. C.thermocellum). Clostridia species are used sometimes in
bioreactors for hydrogen generation (Chin et al., 2003). It is possible that the high acetate
amounts being produced during some incubation’s could be the result of the activity of
Clostridia present. The Gammaproteobacteria related species in this sample were related
to species found in a anaerobic oil storage reservoir (Yoshida et al., 2005). The
Gammaproteobacteria are found in the subsurface and include species in the
Acidithiobacillales (Kelly and Wood, 2000) such as Acidithiobacillus ferrooxidans which
is associated with FeS2 deposits and is known to utilise iron in its metabolism (Temple
and Colmer, (1951)). The other class of Proteobacteria found in these samples were the
Betaproteobacteria. Many species found in the Betaproteobacteria class have organic
molecule degradation capabilities. One clone was closely related to Betaproteobacteria,
Burkholderias delftia spp ,100% over 200 base pairs to a clone found in anaerobic soil
sample (physiology unknown). Both Betaproteobacteria were related to Delftia species
and the closest relative by blast search, were all found in anaerobic environmental
samples.
The archaeal community structure was not visually as diverse as the bacterial,
diversity that is based on the number of bands on the DGGE gels. Only sequences of a
certain quality were included. Two gels were run, firstly a 60% denaturant gel, which at
higher temperatures yielded no archaeal bands. Secondly an 80% denaturant gel which
did yield bands at higher temperatures. This is due to the fact that thermophilic and
hyperthermophilic prokaryotes have a higher GC content (for greater thermostability).
Separation of bands during DGGE is based on GC content so a higher gradient is needed
to “catch’* this thermostable DNA. Bands excised and sequenced from the 60%
denaturant gel showed percentage similarities to both marine benthic group D and the
Thermoplasmatalaes. Similarity is quite low in some cases 92% so nothing can be
inferred about the physiological function of these archaea. The Thermoplasma are cell
wall less archaea capable of growth at high temperature and at sometimes low pH, they
are anaerobic and have been found in associations with deep subsurface and sub sea
communities and it is often associated with coal and pynte (Segerer et al., 1988), as
125

Chapter 4 Temperature characteristics of basalt reactions in sediment slurries
metabolism can be based on compounds leeched from coal, it is thought to respire
sulphur.
Sequences excised from the 80% gel were also closely associated with the
miscellaneous benthic group (MBG) and Thermoplasmatales. Also found were species
who’s most closely related match was an 80% match to Methanothermus fervidus (Stetter
et al., 1981) species. Which is a thermophilic methanogen growing optimally at 83°C but
can grow up to 96°C. Again this is quite phylogenetically distant and hence
physiologically distinct from the detected sequence. Closely related archaeal
representatives all come form relevant marine and subsurface(Mills et al., 2003; Heijs et
al., 2007) and tidal flat (Kittelmann and Friedrich, 2008) environments.
The bar graph represents the change in archaeal community structure with
temperature (Fig 4.24). Lower temperatures are dominated by MBG-D and
thermoplasmatales associated sequences. Proportions of MBG-D gradually decreases
with temperature until 6 6 °C disappearing at 92°C. Thermoplasmatales dominates at
medium range temperatures 60°C while the upper temperature range 92 and 98°C is
dominated by Methanococcales and Thermococcales with fewer Methanobacteriales
methanogen sequences.
4.9 Ramping experiment
The ramping experiment was set up as follows: Start temperature was 65°C ramping
10°C every ten days to 155°C. Sampling regime was, gas sampling after 3 days and 10
days at each temperature before ramping to the next temperature and VFA sampling after
10 days at each temperature before ramping. The exception being the 65°C ramp where
VFAs were also taken after 3 days.
126

Chapter 4 Temperature characteristics of basalt reactions in sediment slurries
250000 10000000
200000 8000000
6000000 Q150000oE=JL
(XVXO
PM
4000000 ~100000
200000050000
80 100 120 140 16060
OEa.<D3©o<
Temperature [ C ]1800014000
12000 16000
1000014000
8000
12000
6000
100004000
80002000
60001601401201008060
COo
3o
Temperature [ C]
Fig 4.25 Basalt ramping experiment.
Key CH. (•) , C 0 2 (- ) , H2 (♦ ), acetate (*■) and SO.2' ( )•
127

Chapter 4 Temperature characteristics of basalt reactions in sediment slurries
20000
15000
1200000
oE
X 10000 -
Xo
5000
1000000
800000
600000
400000
200000
Temperature [ C ]
oE
03CO03
£
250006000
500020000
4000
15000
3000
10000
2000
50001000
160140120100
0 3
T3o
Temperature[ C]
Fig 4.26 Basalt ramping sterile control.
Key CH. (•), C 0 2 ( ), H 2 (♦ ), acetate (*) and SO4 2' (c).
128

Chapter 4 Temperature characteristics of basalt reactions in sediment slurries
260000
6000000 o
80 120100 140 16060
150000
100000
50000
n. _ p - -0"o
1 107
60 80 100 120 140 160
14000
12000
10000
6000
6000
4000
2000
0100 140 1608060
14000
12000
8000
4000
2000
016080 100 120 14060
Temperature [ C ] Temperature [ C ]
Biotic Basalt Sterile basalt control
Fig 4.27 Basalt ramping comparison of biotic and sterile control. 130 .
Key CR, (•), C 0 2 ( ), H2 (♦ ), acetate (*) and SO42' (<=).
129
C0
2 ^mo11
SO 2‘
nmol I'1

Chapter 4 Temperature characteristics of basalt reactions in sediment slurries
Comparison of cation concentrations between the Basalt ramping experiment and the Basalt ramping Sterile control.
14
1 7 “
0.8
0.6
0.4
0.2
0
300 3 C
“ <
100 120 140
Temperature [ °C ]
4
3.5 “ ❖3
2.5
2
1.5
1
0.5
012060 100 140 16080
Temperature[ C]
Fig 4.28 Basalt ramping incubation.
Al: inverted triangle. K: transparent DiamondFig 4.29 Basalt sterile control ramping incubation
Al: inverted triangle. K: transparent Diamond
4
3
Dr
D - -DV
160140100 12060 80
6
5
4
3
^ -Q2
1
0120100 16080 14060
Temperature [ C ]Temperature [ C ]
ig 4 JO Basalt ramping incubation.
t: closed circle. Mn: x. Ti: open box
Fig 431 Basalt sterile control ramping incubation.
Fe: closed circle. Mn: x. Ti: open box
130
K [ mg/l ]
Ti, Mn [ m
g/l ]

Chapter 4 Temperature characteristics of basalt reactions in sediment slurries
300 ^X
200 “
0100 140 16012080ec
T em perature [ °C ]
Fig 432 Basalt ramping incubation.
Ca: Diamond. Mg: transparent triangle
4
2
0(X
6
6
4
2
0160100 14060 12080
Tem perature [ °C ]
Fig 434 Basalt ramping incubation.
P: transparent circle. Si: triangle
500
400
300
200
100
0 012060 14080 160100
Temperature [ °C ]
Fig 433 Basalt sterile control ramping incubation.
Ca: Diamond. Mg: transparent triangle
14
12
10
p - - o -8
- o6
4
2
0120 16080 100 14060
Temperature [ °C ]
Fig 435 Basalt sterile control ramping incubation,
P: transparent circle. Si: triangle
131
Mg [m
g/l] Si
[ mg/l ]

Chapter 4 Temperature characteristics of basalt reactions in sediment slurries
4.10 Results ramping experiment
The basalt ramping experiment showed a clear difference between biotic and abiotic
impact on simulated sediment burial. In the biotic experiment methane values remained
low over the course of the experiment with highest concentrations of 7524 pmol I'1 at
155°C, 3 days after temperature increase. Carbon dioxide levels increased with
temperature from 234.95 mmol I'1 at 65°C to 8363 mmol I'1 at 145°C before decreasing
to 4689 mmol I’1 after 3 days at 155°C, increasing again to 7530 mmol I'1 after 10 days.
Hydrogen levels increase with temperature relatively slowly until 145°C 13 mmol f 1 to
51 mmol I’1 at 145°C after 3 days of incubation. From 145 to 155°C concentrations
increase from further to 221 mmol I'1 (after 10 days at 155°C). Acetate concentrations
increase with temperature with a rapid increase occurring between 3 days and 10 days
incubation at 65°C (203 pmol I'1 to 5058 pmol I'1). Increase is then gradual from 65 to
145°C, 5058 to 8094 pmol I"1, increasing substantially from 145 to 155°C (13.2 mmol f
l). Sulphate removal occurs during incubation at 65 and 75°C from 13 mmol I"1 after 3
days at 65°C to 7.65 mmol I"1 after 10 days at 75°C. Sulphate removal stops when
temperature is ramped to 85°C after which sulphate slightly increases with a dip
occurring between 125°C and 145°C. The most rapid increase in sulphate occurs between
145-155°C where sulphate increases from 8.2 to 11.2 mmol I'1. This sulphate increase at
higher temperatures may be due to the oxidation of previously formed FeS.
In the ramped sterile control experiment, low levels of methane were detected,
maximum amount 1144 pmol I' 1 at 75°C, this is less than formed in the biotic experiment
by a factor of 6.5. Carbon dioxide increased with temperature to a maximum of 1030
mmol F1 at 155°C as opposed to 8363 mmol T1 in the biotic experiment which is 8.1
times less. Hydrogen levels increase slowly with temperature from 65 to 145°C (435-
2829 pmol I"1) before a substantial increase to a maximum of 19 mmol I'1 at 155°C.
Compared to the maximum biotic experimental H2 concentration of 221 mmol I’1, this is
11.6 times lower. Acetate values increased exponentially with temperature from 166 to
5583 pmol I'1 (65 to 155°C a smaller increase is noted between 145 and 155°C).
Maximum values are less than biotic experiment by a factor of 2.3. No sulphate removal
132

Chapter 4 Temperature characteristics of basalt reactions in sediment slurries
takes place, in fact sulphate values increase towards the end from 16.5 mmol f 1 at 115°C
to a final concentration of 20.3 mmol I'1 at 155°C this includes a slight decrease between
145-155°C. Concentrations of hydrogen methane and acetate were much higher in the
biotic experiment as opposed to the sterile control (Fig 4.25). Hydrogen levels increased
substantially in the biotic control when ramped to abiotic temperatures (120-155°C)
compared to the abiotic control. It would appear that prior exposure of minerals to
prokaryotic activity in biotic temperature zones (65-120°C) affects the formation of
hydrogen and related products at higher abiotic temperatures.
Cation results are graphed to enable comparison of the biotic experiment and the
sterile control. Al profiles are quite similar. However, the sterile control concentrations
are higher than the biotic with a maximum concentration of 3.8 mg/l as opposed to 1.3
mg/l for the biotic control. Both show an initial increase before decreasing with
temperature the biotic incubation decreases from 105°C and the sterile control decreases
after 85°C. K concentrations for the biotic experiment starts at 509 mg/l 65°C and
finishes at 488 mg/l (155°C ) which is fairly constant, there is however, considerable
variability in between. A large decrease occurs between 85 and 95°C (502 to 224 mg/l).
Before increasing to 467 mg/l, at 105°C . K concentrations in sterile control slowly and
consistently increase with temperature from 520 mg/l at 65°C to 588 mg/l at 155°C. Fe
concentrations in the biotic incubation decreases initially from 2.5 mg/l to 0.3 mg/l whilst
incubated at 65°C then begins to increase from 75°C before increasing to a maximum of
4.8 mg/l at 125°C, before decreasing to 1.4 mg/l at 155°C. In the sterile control, Fe
concentrations more gradually increase with temperature and does not display such a
large concentration decrease as the biotic incubation does, close to the high temperature
zone of maximum hydrogen formation. Sterile Fe concentrations begin at 1.3 mg/l
(65°C) increasing to 4.05 mg/l at 155°C, with a maximum of 5.45 occurring at 145°C. Ti
concentrations in both incubations slightly increase between 65-115°C before decreasing
above 115°C. The biotic experiment starts at a concentration of 0.30 mg/l and concludes
at 155°C with a concentration of 0.19 mg/l. The sterile control starts at a concentrations
of 0.19 mg/l and concludes at a concentration of 0.18 mg/l. Mn concentrations for the
biotic incubation begins at 0.45mg/l decreasing slightly to 0.3mg/l at 155°C. A slight
133

Chapter 4 Temperature characteristics of basalt reactions in sediment slurries
increase occurs around 115°C from 0.33 to 0.42 mg/l. Mn concentrations slowly increase
in sterile control from a start concentration of 0.28mg/l to 0.39 mg/l (155°C). Mg profiles
looks broadly similar for both incubations. Generally decreasing over the course of the
incubation, following a slight initial increase. In the biotic incubation Mg concentrations
start higher than the sterile control 430 mg/l and 127 mg/l respectively. Both decrease
through the temperature profile, with the biotic incubation decreasing to 1 mg/l which is a
decrease of 429mg/l. The sterile control decreased to a final concentration of 30 mg/l,
which is a decrease of 97 mg/l. Ca in contrast increases in both, from a start concentration
101 mg/l and 153 mg/l (biotic and sterile) to final concentrations for each at 155°C of
451 and 400 mg/l (biotic and sterile). In the sterile control the increase is more gradual
increasing from ~105°C with the most rapid increase in the biotic experiment occurring
from 135°C. Phosphorus (P) and silica (Si) profiles in each of the different incubations.
Si increases with temperature broadly for both incubations with a more rapid increase
and higher concentrations found in the sterile control. The sterile control increases till
75°C and remains constant till 120°C and rapidly increases to 36 mg/l at 155°C. The
biotic incubation shows a slightly different profile increasing over the 65°C incubation
remaining constant till 95°C and rapid increase occurs between 95 and 115°C before
decreasing slightly towards the upper temperature, with a final concentration of 18 mg/l
at 155°C
Both biotic and sterile P concentrations follow a similar pattern. Initial increase
until approx 105-115°C followed by a decrease. Biotic concentrations are initially higher
9.5 mg/l as opposed to 4.3 mg/l both finish at a similar concentration at 155°C, biotic
concentrations were 8.4 mg/l ,while sterile control concentrations were 8.7 mg/l.
maximum values were biotic 13.5 mg/l at 105°C and sterile 13.2 mg/l at 75°C.
134

Chapter 4 Temperature characteristics of basalt reactions in sediment slurries
4.12 Discussion
The aim of this chapter was to quantify the effect that addition of basalt, has on set
sediment slurry incubations conducted in the presence and absence of sedimentary
prokaryotes over a defined temperature range (4-105°C). The specific aim was to
examine hydrogen generation, its biogeochemical impact and to compare results obtained
from previous sterile incubations conducted at 30 and 60°C (Stevens and McKinley,
2000). High temperature ramping experiments were also conducted, in order to examine
the effects of sequential heating on mineral : prokaryote interaction and to simulate
continuous temperature increases during deep burial. This included into the high
temperature abiotic ranges 120-150°C investigating whether previous prokaryotic activity
influences subsequent high temperature reactions.
Table 4.5 maximum concentrations for hydrogen methane and acetate (pmol I'1)
Experiment Hydrogen Acetate Methane
Sediment only 3.5 3000 535
Sediment and mineral 766 7100 150
Sterile 0 2401 1.5Sediment and mineral
Mineral and sterile salts. 9 0 0
In Table 4.5 several aspects are distinguishable. In the absence of basalt no significant
amounts of hydrogen were present up to 93 days incubation and to 100°C. Basalt mineral
addition is the key source of hydrogen. Also no significant hydrogen is produced in the
absence of prokaryotes. Hence basalt mineral interactions with sedimentary prokaryotes
are responsible for significant hydrogen generation (Table 4.5). Hydrogen generation is
temperature specific (thermophilic and hyperthermophilic prokaryotes are responsible).
Hydrogen production from basalt minerals seems to be a process dependent on 2 things,
the correct temperature and the presence of sedimentary prokaryotes. Rates of processes
have also previously been shown to be increased by activation of fresh mineral surfaces
135

Chapter 4 Temperature characteristics of basalt reactions in sediment slurries
(Chapter 3) Whether microbes are directly responsible for hydrogen generation or
catalyze another associated reaction necessary for production is unknown e.g. direct
removal of electrons from the basalt surface plus proton reduction, or mineral weathering
producing new reactive surfaces
It is also probable that hydrogen formation increases the rates of acetogenesis and
methanogenesis and sulphate removal, indicated by higher concentrations of end products
or reactant removed (Fig 4.4) H2 formation is sufficient to overcome threshold limitation
for competing terminal electron accepting processes. Such as sulphate reduction methane
production acetate formation which often occur together. The produced acetate may also
be an important substrate for sulphate reduction and methanogenesis. 8 13C-CH4 values
for the basalt incubation are consistent with methane produced biotically via acetoclastic
methanogenesis. (Whiticar, 1999).
The basalt ramping experiment even with very fast ramp rates 10°C/10d showed
very significant prokaryotic impact on reactions (Fig 4.25) This includes mineral
incubations previously subject to prokaryotic activity,that produce more products such as
acetate, hydrogen and methane than sterile systems. In terms of burial of sediment and
possible sources of deep hot microbial energy at depth this has clear implications.
The molecular data shown in this chapter indicates that the prokaryotic
community structure changes with temperature and that at higher temperature (in the
zones of hydrogen generation) the microbial community present is similar to those found
at similar temperatures in environmentally relevant areas (oil reservoirs and hydrothermal
vent areas). This chapter has demonstrated that high concentrations of hydrogen can be
generated from basalt minerals over long time periods (98 days) and that this process is
microbially controlled or driven and is biogeochemically relevant. Further analysis in
Chapter 5 and 6 will investigate what effect mineral composition has on these processes
for example is hydrogen generation dependent on Fe concentrations? Plus provide a more
detailed analysis of microbial community through 16S rRNA gene clone libraries.
136

Chapter 5. Characteristics of ilmenite, pyrite, hematite and magnetite
Chapter 5
Temperature characteristics of ilmenite, pyrite, hematite and
magnetite reactions in sediment slurries
5.1 Introduction
This Chapter presents the results of temperature characterisation experiments conducted
on mineral slurry incubations over a temperature range of 0 to 105°C
Minerals analysed were, ilmenite, pyrite, hematite and magnetite. Minerals were chosen
based on iron concentration and presented in this chapter in that order. Starting with the
lowest, concluding with the highest. Iron was measured in terms of wt% Fe2C>3 (ICP-
OES). Pyrite (theoretically 46.6%), Ilmenite 50.7 %, Hematite 54.2%, and Magnetite
99.4%. Pyrite concentrations are given theoretically due to previous mentioned (Chapter
3) limitations of analysis.
In Chapter 3 it was determined that mineral composition affected rates of
processes such as methanogenesis, sulphate reduction and acetogenesis, at 60°C. In
chapter 4 it was determined that basalt slurry incubations generated hydrogen at high
temperatures between 85 to 100°C. This hydrogen generation was microbially driven and
was the direct result of microbial basalt interactions. Hydrogen fuelled acetogenesis,
methanogenesis and sulphate reduction either directly or indirectly e.g. acetoclastic
sulphate reduction.
During the course of this study much thought has gone into the exact mechanism
of hydrogen production from minerals. One of the aims of this chapter was to investigate
the effect of Fe concentrations on hydrogen generation at a range of temperatures. The
redox transition of iron between Fe(II) and Fe(III) valence states, has a fundamental role
in environmental biogeochemistry. Fe(II) can function as an electron donor for iron-
oxidizing prokaryotes and Fe(III) can function as a terminal electron acceptor for Fe
reducing microbes. Microbial Fe reactions are known to occur at high temperature
(Vargas et al., 1998), and hence, different mineral Fe concentrations might have an effect
137

Chapter 5. Characteristics of ilmenite, pyrite, hematite and magnetite
on high temperature hydrogen generation. The importance of iron and reactions involving
iron is discussed in Chapter 1. If high temperature H2 generation is an iron-controlled
reaction, then the magnetite incubation should produce the greatest amounts, or at least
substantial amounts, considering its composition of 99% iron (Table 3.2). This chapter
provides a comparison with chapter 6 , which shows reactions involving highly felsic
minerals, including 100% SiC>2.
In this Chapter detailed molecular analysis was carried out. Clone Libraries were
constructed for the ilmenite and pyrite incubations at varying temperatures. Phylogenetic
trees were constructed and analysed to gain a more detailed understanding of the
microbial community composition.
138

Chapter 5. Characteristics of ilmenite, pyrite, hematite and magnetite
oEzL
<DOCOQ_CO
■DCO
cm f l)X .c
X - Io —co
1000 5000
800 4000b
600 3000
400 2000
1000200
060 100 12040 800 20
rrco03ClcoT>03OCD
OOO
3o
Temperature [ C ]
oE®CO©o<
300003000
250002500
200002000
150001500
100001000
5000500
0120100806040
0)o1=3o
Temperature [ C ]
Fig 5.1. Pyrite results after 3 days incubation.
Key CH4 (• ) , C 0 2 (□), H2 (♦ ), acetate (*), and S 0 42' (o).
139

Chapter 5. Characteristics of ilmenite, pyrite, hematite and magnetite
2000600
500
1500
400Q.
X ^ 300
-r-V t ^
1000
200
500
100
60 100 12080400 20Temperature [ C ]
to- 2 ^ OCO=X _ CD 5to 3C l O co —
T3 — 0)OCD
30000
250008000
20000
O 6000
15000
400010000
20005000
012010060 8040200
3o
Temperature [ C ]
Fig 5.2. Pyrite results after, 110 days incubation.
Key: CH. (•), C 0 2 (-), H2 (♦ ), acetate (- ), and SO42' (°)
140

Chapter 5. Characteristics of ilmenite, pyrite, hematite and magnetite
Cation concentrations for the pyrite slurry incubation after 110 days
2.5
2
15J
5>CD
I 1
0.5
012060
Tem perature [ UC80 10020 400
Fig 5 J Pyrite incubtation. Al and K cation concentrations at selected temperatures after 110 days incubation.
Al: inverted closed triangle. K: open Diamond
8
7
6
6
4
3
2
1
1 -20 40
012080 1000 60
Tem perature [ °C ]
Fig 5.4 Pyrite incubation. Fe, Mn and Ti cation concentrations at selected temperatures after 110 days incubation.
Fe: closed circle. Mn: x. Ti: open box
500400
350
400300
250 300
200
200150
100100
1201008020 40 600
6
5
4
3
2
1
040 60 100 120
T em perature [ C ] T em perature [ C ]
Fig 55 Pyrite incubation, Ca and Mg cation concentrations at selected temperatures after 110 days incubation.
Fig 5.6 Pyrite incubation, P and Si cation concentrations at selected temperatures after 110 days incubation.
Ca: closed Diamond. Mg: open triangleP: open circle. Si: closed triangle
141
Si [m
g/L]

Chapter 5. Characteristics of ilmenite, pyrite, hematite and magnetite
5.2 Pyrite Results (Figs 5.1-5.6)
After 3 days incubation high amounts of hydrogen were detected at elevated
temperatures, with a maximum concentration of 820 pmol I'1 detected at 97°C (188 pmol
I"1 higher than similar ilmenite incubation). However, unlike the previous ilmenite
incubation (Fig 5.1) methane concentrations produced are relatively high and occur at
high temperature, 125 pmol I'1 at 90°C. Carbon dioxide increases with temperature from
679 pmol I'1 at 7°C to a maximum concentration of 4673 pmol f 1 at 97°C. A slight dip is
noticeable between 65 and 90°C and a decrease is also noted after 97°C with
concentrations of 3798 pmol I 1 at 103°C. Initial concentrations of sulphate were 25
mmol I'1 this was greater than in other thermal gradient incubations, due to the grinding
effect on pyrite as discussed in Chapter 3. However, as the time between grinding and
addition was low (less than 10 minutes). The initial sulphate concentrations are low in
comparison to the 60°C pyrite experiment (Fig 3.7), in which S042’ concentrations were
in excess of 80 mmol I'1. After 3 days sulphate removal had begun from 20°C with a
maximum removal of approx 5 mmol I 1 at 71°C. No removal detected above 78°C.
Acetate values below 78°C are low, 89 pmol I'1 at 71°C, however, a rapid increase occurs
after 71°C with concentrations of 1972 pmol I'1 at 78°C. This rapid increase coincides
with sulphate removal ceasing. Maximum acetate concentrations were detected at 97°C
(2770 pmol f 1), which is 1477 pmol I'1 (114%) higher than the ilmenite experiment.
Maximum acetate concentrations are detected at the same temperature as maximum
hydrogen concentrations.
After 110 days incubation peaks of elevated hydrogen occurred at two
temperatures. Firstly, 154 pmol F1 at 71°C, this was the most active area in terms of
sulphate removal. This indicates that hydrogen is produced at lower temperatures than
97°C, however it may be undetectable due to its use in sulphate reduction and other
metabolisms. Secondly, similar to the 3 day incubation, large amounts of hydrogen were
detected at 97°C (525 pmol F1) 295 pmol F1 less than after 3 days. Carbon dioxide
concentrations increases in a complex manner with temperature, reaching a maximum
142

Chapter 5. Characteristics of ilmenite, pyrite, hematite and magnetite
concentration of 1821 pmol I’1 at 71°C, this coincides with maximum sulphate removal.
CO2 decreases when sulphate removal slows decreasing to 611 pmol I 1 at 78°C. The
carbon dioxide profile can be broken into 3 distinct increases and 3 decreases. Increase
one from 7 to 14°C followed by decrease 1 from 14-52°C, increase 2 from 52-71°C
decrease 2 from 71-87°C and increase 3 from 78-97°C followed by decrease 3 above
97°C . Methane concentrations occurred from 33°C (2.8 pmol I"1) (CO2 decrease 1)
increasing with temperature to a maximum concentration of 443 pmol I'1 at 90°C (active* 13alongside sulphate reduction) decreasing to near zero concentrations above this. 5 C-
CH4 isotope analyses were performed (Table 5.1).
Table 5.1 813C values for pyrite incubation
Temperature 813C-CH4 SD 813C -C 0 2 SD
90°C -42.8%o 0.7 -19.2%o 0.2
84°C -46.9%o 0.9 -19.9%o 0.1
78°C -46.7%o 1.1 -18.6%o 0.2
71°C -52%o 0.8 -24.1%o 0.1
65°C -55.3%o 1.3 -22.4%o 0.3
58°C -56.7%o 1.9 -21.1 %o 0.5
52°C -52.7%o 0.7 -20.9%o 0.1
46°C -53.3%o 1 -20.3%o 0.4
SD= standard deviation. n=4
These indicate methane production probably from an acetoclastic pathway (Whiticar,
1999). However, several values fall outside of the Whiticar model for biological methane
formation, noticeably high temperature values (e.g. -42%o at 90°C). There is a clear
temperature effect on values at elevated temperatures.
143

Chapter 5. Characteristics of ilmenite, pyrite, hematite and magnetite
-42
-44
-46
-48
•50
-52
-54
-56
-587040 50 60 80 90 100
Tem perature [ °C]
Fig 5.7 Pyrite methane isotope data. Temperature effects on 813C values
Maximum sulphate removal takes place at 71°C, with 18.3 mmol I"1 of sulphate
removed, sulphate reduction starts at 20°C. Removal slows dramatically above 71°C with
values of 24 mmol I'1 at 78°C. This coincides with a rapid increase in acetate from 122
pmol f 1 to 7681 pmol I’1, a probable indication of acetate utilisation during sulphate
reduction. Maximum concentrations of acetate were at 97°C (8503 pmol I'1), decreasing
at 100°C, similar to hydrogen concentrations (1916 pmol I'1 at 103°C).
Cation results showed that K concentrations remain relativity constant throughout
the incubation, which is unlike the fluctuations seen during the ilmenite and basalt
incubations (Chapter 4). Al decreases slightly from 1.5 mg/1 at 20°C to 0.9 mg/1 at 90°C
increasing thereafter to a maximum concentration of 2.04 mg/1 at 103°C. This increase
occurs during high acetate concentrations. The most interesting pattern observed are the
Fe and Ti profiles. Both increase substantially in the area of highest hydrogen detection
before decreasing similar to hydrogen at temperatures above 100°C. Fe reaches a
maximum of 7.8 mg/1 at 97°C before decreasing to 4.1 mg/1 at 103°C. Ti increases to 3.5
144

Chapter 5. Characteristics of ilmenite, pyrite, hematite and magnetite
mg/1 at 97°C before decreasing to 0.28 mg/1 at 103°C. Hydrogen and Fe concentration are
plotted below in Fig (5.8)
600
T I
300
X
100
20 40 60 800 100 120T em perature [ °C ]
Fig 5.8 Pyrite incubation showing Fe and Hydrogen concentrations.
In contrast Mn concentrations remain low, decreasing from 2 mg/1 at 20°C to 0.8 mg/1 at
46°C with a slight increase noted similar to Fe and Ti occurring at 97°C, increasing to
1.2 mg/1 before decreasing to 0.97 mg/1 at 103°C.
Ca concentrations initially decrease from 223 mg/1 at 20°C to 116 mg/1 at 46°C
increasing for the remainder of the incubation with temperature, with a maximum
concentration of 393 mg/1 at 103°C. Mg concentrations had a contrasting trend with
decreases with temperature from a concentration of 436 mg/1 at 20°C to 243 mg/1 at
90°C, then a slight increase to 301 mg/1 at 97°C during the period of peak acetate and
hydrogen production, before decreasing again to 252 at 103°C. Si concentrations initially
remain constant at 1.4 mg/1 until 46°C then increases markedly with temperature after
this to 10.9 mg/1 at 90°C plateuing after 90°C to concentrations of 10.5 mg/1 at 103°C. P
concentrations decrease from 4.8 mg/1 at 20°C to 2.3 mg/1 at 83°C. Before increasing to
145

Chapter 5. Characteristics of ilmenite, pyrite, hematite and magnetite
5.2 mg/1 at 97°C. and decreasing to 4.5 mg/1 at 103°C. This rapid increase is similar to
the increase in acetate and peaks at maximum concentrations for acetate and hydrogen
coupled with a decrease above 100°C.
146

Chapter 5. Characteristics of ilmenite, pyrite, hematite and magnetite
a>v o Z ro o 9- c w c -o =s. co
CM ®X -cX 5 O «
700 7000
600 6000
5000500
4000400
3000 "§300
2000200
1000100
80 12060 10020 40
Temperature [ C ]
oO■o
3o
140001400
120001200
100001000
OE3 .
8000800
CD(0 6000600•*->CDO<
4000400
2000200
12080 1006020 400
C/3o
3o
Temperature [ C ]
Fig 5.9 Ilmenite addition, 3 days incubation.
Key C H 4 (•), C 02 (a), H2 (♦ ), acetate ( . ) and S O 4 2' ( )
147

Chapter 5. Characteristics of ilmenite, pyrite, hematite and magnetite
500 1400
1200400
1000
0 -3 0 0■Q 800
.CM 0 )
. sz > ^ 600
200□ o
400
100200
6020 40 80 100 1200
zrCD0)C LCO"O0)OCD
OOO"P3o
Temperature [ C ]150007000
6000
500010000
oEA
4000
CDCO<4—» 30000)O< 5000
2000
1000
100 12020 60 800 40
c/>oT=3o
Temperature [ C ]
Fig 5.10 Ilmenite addition, 83 days incubation.
Key: Cft, (•), C 0 2 (□), H2 (♦), acetate (*) and S 0 42' (o)
148

Chapter 5. Characteristics of ilmenite, pyrite, hematite and magnetite
Cation concentrations for the ilmenite slurry after 83 days of incubation
1.2
0.8
06
0.4
0.2
020 80 12040 60 1000
3
2.5
2
1.5
1
0.5
01000 40 8020 60 120
Temperature [ ° C ] T 4Temperature! C]
Fig 5.11 ilmenite incubation. Al and K cation concentrations at selected temperatures after 83 days incubation.
Al: inverted closed triangle. K: open Diamond
Fig 5.12 ilmenite incubation, Fe, Mn and Ti cation concentrations at selected temperatures after 83 days incubation.
Fe: closed circle. Mn: x. Ti: open box
80
70
60
50
40
30
20
10
012080 10040 600 20
Temperature [ C ]
10
8
6
4
2
0100 1206040 800 20
Temperature [ C ]
Fig 5.13 ilmenite incubation. Ca and Mg cation concentrations at selected temperatures after 83 days incubation.
Ca: closed Diamond. Mg: open triangle
Fig 5.14 ilmenite incubation. P and Si cation concentrations at selected temperatures after 83 days incubation.
P: open circle. Si: closed triangle
149

Chapter 5. Characteristics of ilmenite, pyrite, hematite and magnetite
5.3 Ilmenite results (Figs 5.9-5.14)
In the ilmenite incubation, similar to basalt high concentrations of hydrogen were
produced within 3 days above 69°C, but not above 100°C. Hydrogen concentrations
increased from 8.6 pmol 11 at 69°C, to a maximum concentration of 632 pmol I"1 at
95°C, decreasing to 1.1 pmol I'1 by 102 °C. No significant amounts of methane were
detected after 3 days incubation. Carbon dioxide concentrations overall increased with
temperature, reaching a maximum of 6176 pmol I'1 at 95°C, with a slight decrease to
6002 pmol I’1 by 102°C (but with a plateau in concentrations between ~70-80°C).
Acetate concentrations increase rapidly from 23 pmol I'1 at 37°C to 885 pmol I"1 at 63°C.
Then dipped to 246 pmol I"1 at 69°C, before increasing again to 1159 pmol I"1 by 76°C
and continuing to increase but more slowly reaching a maximum of 1293 pmol I'1 at
95°C. Again similar basalt incubations in (Chapter 4), a decrease occurs above 100°C,
decreasing to 346 pmol T1 at 102°C. Initial sulphate concentrations was 13 mmol I"1
which decrease slightly at 37°C, reaching a concentration of 12.1 mmol I'1 at 102°C.
After 83 days incubation high concentrations of hydrogen were detected at
elevated temperatures. Maximum concentration of 480 pmol I'1 occurs at 95°C, which is
143 pmol I 1 less than the 3 day incubation. Methane concentrations are elevated in two
zones firstly between 35 and 75°C, that has a maximum concentration of 147 pmol I'1 at
63°C. The second peak has a maximum concentration of 230 pmol I"1 at 89°C. The first
methane peak occurs in the zone of sulphate depletion once methane concentrations begin
to decrease a rapid rise in acetate occurs. This also coincides with a rapid decrease in
sulphate removal rates. S13C-CH4 isotope data were obtained for the lower temperature
peak (table 5 .1) and values obtained are consistent with methane produced through the
acetoclastic pathway (Whiticar, 1999). Unfortunately no values for the upper temperature
methane peak were obtained. Carbon dioxide increases with temperature to maximum of
1385 pmol I'1, contiguous with the maximum zone of sulphate removal occurring at
63°C. CO2 concentrations then decrease sharply before slowly increasing with a peak
150

Chapter 5. Characteristics of ilmenite, pyrite, hematite and magnetite
concurrent with that for methane, at 89°C reaching 989 pm ol I '1. This is a good indication
of acetoclastic methanogenesis. The cleavage o f acetate to CH 4 produces CO 2 (Eq 5.1)
CH 3COO- + H20 CH 4 + H CO 3 ' A G°’ = -31 kj/reaction (Eq 5.1)
Table 5.2 813C values for ilmenite incubation
Temperature 5 13C-CH4 SD 5 13C-C0 2 SD
69°C -53.2%o 0.7 -20.8%o 0.3
57°C -55%o 1.1 -20.1%o 0.2
SD, Standard Deviation, n=4
Sulphate removal began at 24°C with m axim um removal occurring at 63 °C to a
concentration o f 90 pm ol I" 1 this is a total removal o f 12.9 mmol I 1. Complete removal
does not occur. Methanogenesis occurs during sulphate removal. Acetate concentrations
rapidly increase when sulphate removal slows. Indicating possible use o f acetate not
alone in methanogenesis, but also in sulphate reduction suggesting excess substrates,
which enables these potentially com petitive processes to co-occur. Acetate increases
from 74 pmol I"1 at 69°C to a m axim um concentration o f 6792 pmol f 1 at 95°C. A rapid
decease occurs above 100°C decreasing to 1569 pmol 1 1 by 102°C therefore acetate
production seems to be biogenic rather than thermogenic.
Cation concentrations after 83 days were as follows. Al values remain constant
throughout the course o f the experiment until 95°C. Starting concentrations were 0.84
mg/1 at 11°C at 95°C concentrations were 0.8 mg/1 after which a 24% increase occurs to
1.04 mg/1 at 102°C. This coincides with a rapid decrease in hydrogen concentrations (Fig
5.10). K concentrations have an initial concentration o f 263mg/l at 11°C fluctuated
slightly with concentrations o f 349 mg/1 at 89°C, decreasing to 153 mg/1 at 95°C before
increases to 265mg/l at 102°C. The decrease at 95°C (56%) coincides with detection of
highest concentrations o f hydrogen and acetate. Mn concentrations at 11°C were 0.42
mg/1 with a concentration at 102°C o f 0.43 mg/1 concentrations are similar at the upper
151

Chapter 5. Characteristics of ilmenite, pyrite, hematite and magnetite
and lower temperature with a decrease to 0.36 mg/1 noted between ~40-90°C. Fe
concentrations show an initial increase with temperature from 0.3 mg/1 at 11°C to 0.92
mg/1 at 95°C. After 95°C a rapid increase to 2.7 mg/1 at 102°C occurs, a 6% increase
between 95 and 102°C. Ti concentrations increase with temperature from 0.1 at 11°C, to
a maximum concentration at 89°C of 0.20 mg/1 co-occurring with the 2nd CH4 peak, and
then decreasing slightly with concentrations of 0.15 found at 102°C. Ca concentrations at
11°C were 32.3 mg/1 decreasing to 5 mg/1 at 37°C before increasing with temperature to a
maximum concentration of 77 mg/1 at 89°C. A dip in concentrations occurs between 89 at
95°C (8.2 mg/1) a decrease of 68 mg/1 this decrease co-insides with maximum
concentrations of hydrogen (Fig 5.15). Once hydrogen concentrations decrease Ca
increases to 54 mg/1 at 102 °C
Mg concentrations initially increase from 256 mg/1 at 11°C to 332 mg/1 at 37°C. Before
decreasing to 6 mg/1 at 95°C (concurrent with elevated hydrogen and acetate) then
increasing to 66 mg/1 at 102°C. Si concentrations generally increase exponentially with
temperature but with a decrease noted, similar to phosphorus, at 95°C, Si increases from
0.08 mg/1 at 11°C to 7.7 mg/1 at 77°C. Decreasing to 2 mg/1 at 95°C. Increasing again to
7.8 mg/1 at 102°C. A similar pattern is noted for phosphorus, except there is a decrease
from 5 mg/1 , at 11°C, to 1.4 mg/1 at 37 °C. Subsequently, there is increasing
concentration with temperature, with a maximum concentration of 8.4 mg/1 at 89°C. A
dip in concentration of 48% occurs to 4.3 mg/1 at 95°C, before an increase close to
maximum values of 8.2 mg/1 at 102°C. Both phosphorus and silica show a similar pattern
of large decreases close to maximum concentrations of hydrogen and acetate.
152

Chapter 5. Characteristics of ilmenite, pyrite, hematite and magnetite
oE
CMX
12010060 804020
O05
T em pera tu re [ C ]
Fig 5.15 ilmenite incubation H2 and Ca concentrations after 83 days incubation
153

Acet
ate
nmol
I''
slur
rV he
adsp
ace
Chapter 5. Characteristics of ilmenite, pyrite, hematite and magnetite
2000 7000
6000
15005000
4000 rr
1000 Q.CA
3000 "§Dr
2000500
1000
00 20 40 60 80 100 120
Temperature [ C ]200001600
1400
150001200
1000
800
600
5000400
200
120100806040
Temperature [ °C ]
Fig 5.16. Hematite addition, 3 days incubation.
Key: CIL, (•) , C 0 2 ( - ) , H2 (♦ ), acetate (‘ ), and SO4 2' ( )

Chapter 5. Characteristics of ilmenite, pyrite, hematite and magnetite
300 1400
1200250
1000
Z TOO Q-C <0 b T3 =*- CO (N (j}r -c
800
150
600D(0
100400
200
20 40 60 80 100
OEaCD -*—• TOO<
(0.I O ^ O
“ 3& I■D — 0) - O CD
120
Tem perature [ C ]1 104 20000
800015000
6000
10000 IE
4000
5000
2000
0120100806040200
Tem perature [ C ]
Fig 5.17 Hematite addition, 100 days incubation.
Key: CHL, (•) , C 0 2 (□), H2 (♦ ), acetate (*), and SO4 2 (o).
155

lma/
L-1
Chapter 5. Characteristics of ilmenite, pyrite, hematite and magnetite
Hematite slurry incubation, cation concentrations after 100 days of incubation
2.5
2
15
1
06020 10040 800
5
4
3
2
1 D- -a"- □
010020 800 6040
Tem perature [ °C ] Tem perature [ °C ]
Fig 5.18 Hematite incubation. Al and K cation concentrations at selected temperatures after 100 days incubation.
Al: inverted closed triangle. K: open Diamond
Fig 5.19 Hematite incubation. Fe, Mn and Ti cation concentrations at selected temperatures after 100 days incubation.
Fe: closed circle. Mn: x. Ti: open box
500250
400200
300
200100
100
10080600 20 40
T em p era tu re ! ° C ]
Fig 5.20 Hematite incubation, Ca and Mg cation concentrations at selected temperatures after 100 days incubation.
Ca: closed Diamond. Mg: open triangle
5
4
3
2
1
010060 8040200
Tem perature [°C ]
Fig 5.21 Hematite incubation. P and Si cation concentrations at selected temperatures after 100 days incubation.
P: open circle. Si: closed triangle
156

Chapter 5. Characteristics of ilmenite, pyrite, hematite and magnetite
5.4 Hematite results (Figs 5.16-5.21)
After 3 days the hematite incubation produced no significant amounts of methane,
a maximum of only 2 pmol I'1 occurring at 105°C this is in contrast to the pyrite
incubation where 125 pmol I'1 was produced despite the higher S042' concentration (Fig
5.1). Significant amounts of hydrogen were also generated with a maximum
concentration of 1155 pmol I'1 at 92°C. Which was 335 pmol I'1 more than during the
pyrite incubation. No hydrogen is detected above 100°C. Carbon dioxide increases with
temperature, with a maximum concentration of 6580 pmol I'1 occurring at 105°C. No
significant sulphate removal took place over the first 3 days, although the small apparent
increase in S042' up to ~ 20°C makes this difficult to judge. Acetate values rapidly
increase at 40°C from 104 pmol l'1 to 1451 pmol f 1 (60°C). After this rapid increase,
acetate decreases to 723 pmol I'1 at 73°C, before increasing to a maximum of 1501 pmol
f 1 at 85°C. Acetate values then decrease up to 100°C to 406 pmol f 1 at 105°C, similar
high temperature decreases have occurred in all incubations thus far. The amount of
acetate generated is substantially less than generated in the pyrite incubation (2770 pmol
I'1, Fig 5.1) this combined with the lack of methane generation, could be a contributing
factor to greater quantities of hydrogen accumulating in this incubation, as opposed to the
pyrite incubation.
After 100 days of incubation elevated hydrogen concentrations were detected at
two temperatures; 25 pmol I’1 at 73°C and 271 pmol I"1 occurring at 98°C. This is similar
to the pyrite incubation. Carbon dioxide increases with temperature up to 60°C a
maximum of 1286 pmol f 1 this occurs in the zone of most sulphate removal. Carbon
dioxide plateaus after this, before a dip in concentration close the end of the 73 °C CH4
peak, decreasing further past 100°C (862 pmol I"1 at 105°C). Methane formation begins
to be detectable at 34°C (10 pmol I'1) increasing to a maximum of 123 pmol f 1 at 73°C.
Two decreases in methane are noted at 47 and 6 6 °C, the second decrease at 6 6 °C co-
157

Chapter 5. Characteristics of ilmenite, pyrite, hematite and magnetite
occurs with an increase in acetate concentrations and a decrease in the sulphate removal
rate.
613C-CH4 isotope values were obtained from these samples and they suggest methane
production via acetoclastic pathway (Table 5.3)
Table 5.3 8 13C values for hematite incubation.
Temperature 8 13C-CH4 SD 813C -C 0 2 SD
60°C -54.6%o 0.9 -20.5%o 0.2
53°C -57.2%o 0.9 -20.3%o 0
40°C -55.4 1.8 -18.2%o 0
SD=standard deviation n=3
Sulphate removal proceeds most rapidly at 73°C with a concentration of 1470 pmol I 1
representing a total removal of 17.1 mmol I'1. Interestingly removal of sulphate at 66°C is
slower than neighbouring temperatures (5510 pmol I'1 remaining). This decrease in
removal rate is coupled to an increase in acetate to 4835 pmol _1. If you normalise
sulphate removal rates to mirror the average removal rates of the adjoining samples e.g.
73°C has a concentration of 1470 pmol I'1 this leaves the sulphate concentration in the
66°C sample in excess by 4040 pmol I"1. Acetate concentrations have risen from zero at
60°C, to 4835 pmol I'1 at 6 6 °C. Considering sulphate reduction using acetate is at a ratio
of 1:1 (Eq 5.2) this to gives S 042' at 4040 pmol I'1 and acetate in excess by 4835 pmol I 1
thus giving possible evidence of growth of sulphate reducers using acetate.
Acetate'1 + S042' + 3H+ -> 2C 02 + H2S + 2H20 AG° = -57.5 kj/reaction (Eq 5.2)
Sulphate removal ceases at 98°C. Acetate rapidly increases when sulphate removal slows
at 73°C from 941 pmol I'1, consistent with acetate being used as a substrate (Eq 5.2) and
continues to increase to a maximum concentration of 10 mmol 1 lat 92°C decreasing
rapidly thereafter to 2007 pmol 11 at 105°C in common with other experiments.
158

Chapter 5. Characteristics of ilmenite, pyrite, hematite and magnetite
Cation analysis showed a slight increase in K concentrations with increasing
temperature from 400 mg/1 at 2°C to 487 mg/1 at 98°C. Al concentrations start at 1.8 mg/1
at 2°C and show an initial decrease to 45°C before increasing to a maximum
concentration of 2.15 mg/1 at 84°C and decreasing at higher temperature to 1.2 mg/1 at
98GC. Fe and Mn values remain level before increasing with temperature. Fe initial
concentrations are 1.9 mg/1 at 2°C decrease to 1.4 mg/1 at 73 °C before increasing
substantially from 74°C to 4.7 mg/1 at 98°C. Mn has an initial concentration of 0.38 mg/1
(2°C) and remains stable until 73°C (0.38 mg/1 at 73°C) before increasing with
temperature reaching a maximum of 0.71 mg/1 at 98°C. Similar to both pyrite and
ilmenite incubations elevated amounts of Fe occur close to the zone of greatest acetate
/hydrogen formation.
Ti remains relatively constant over the course of the experiment between 0.1 and
0.15mg/l. Initial calcium concentrations start at 162 mg/1, calcium concentrations
decrease and plateau in the temperature zone between 47 and 73 °C decreasing to 84 mg/1
at 47°C and 89 mg/1 at 73°C. After 73°C, Ca increases over the remaining temperatures
to a maximum concentration of 209 mg/1 at 98°C. Mg concentrations are constant to
18°C then decrease with temperature from 476 mg/1 at 2°C to 57 mg/1 at 73°C which is
the lowest concentration reached. Increasing after this to 219 mg/1 at 98°C. Si
concentrations remain constant from 2°C until 47°C (2.8 mg/1 at 2°C and 2.6 mg/1 at
47°C). After 47°C Si concentrations exponentially increase with temperature reaching a
maximum concentration of 24 mg/1 at 98°C The most rapid increase occurring in the
zone of hydrogen generation from 92 to 98°C (Fig 5.21). An approximate doubling, of Si
concentrations in this temperature range. High temperature Si increases occurs with all 3
previous examined minerals. P concentrations fluctuate over the course of the incubation,
increasing initially from 2 mg/1 at 2°C to 4.3 mg/1 at 15 °C decreasing to 0.7 mg/1 at 47°C
followed by an increase to 3.0 mg/1 at 73°C and then a decrease to 2.1 mg// at 85°C.
Gradually increasing with temperature after this point to 3.8 mg/1 at 98°C.
159

Chapter 5. Characteristics of ilmenite, pyrite, hematite and magnetite
oE
Xo
0)ocoClw■o<0©JZ
l_
to
oEn
<DO<
2.5 4000
3500
2
□ - 3000
2500.5
2000 q .
11500 CD
1000
0.5
500
020 40 60
Temperature [ C]
oOro*5=3o
100
140001200
120001000
10000
800
8000
600
6000
4004000
200 2000
0100806040
COoT=3
Temperature [ C ]
Fig 5.22. Magnetite addition, 3 days incubation.
Key: CR,(«), C 0 2 (c), H2 (♦ ), acetate (*■), and SO4 2' (°).
160

Chapter 5. Characteristics of ilmenite, pyrite, hematite and magnetite
oEa.
CNX
X
600 1400
1200500
1000400
800
300
600(A
200J 3 \ 400
100200
10040 60 8020
CO
3 ° *3 ozr M 0) 1= 0) gs- IT3 — QJ Z O CD
Temperature [ C ]160004000
140003500
120003000
100002500
80002000
6000O 1500
40001000
2000500
T3o
40 60
Temperature [°C]80 100
Fig 5.23. Magnetite, incubation after 92 days.
Key: CH4 (•), C 0 2 (□), H2 (♦), acetate (*) and SO42' (o).
161

Chapter 5. Characteristics of ilmenite, pyrite, hematite and magnetite
5.5 Magnetite results (Fig 5,22-5,23)
After 3 days incubation no significant hydrogen was detected at any temperature, with the
maximum detectable hydrogen 0.05 pmol I'1 at 14°C. This is in stark contrast with the
previous mineral incubations, which produced hydrogen at elevated temperatures (80°C
plus). Carbon dioxide concentrations increase gradually with temperature up to 60°C,
then more rapidly reaching a maximum of 3776 prnol I'1 at 77°C before decreasing
slightly for the remaining temperatures (3058 pmol I'1 at 95 °C). Detectable methane
concentrations were very low with a maximum concentration of 2.3 pmol I'1 occurring at
46°C. Small quantities of sulphate have been removed from an initial concentration of 13
mmol f 1. A maximum removal of 1.2 mmol l'1 occurs at 71°C (11.8 mmol I"1). Rapid
increase in acetate concentrations occurs from 39°C increasing from 51 pmol f 1 to 1165
pmol I'1 at 58°C. A dip in concentrations occurs at 65°C to 791 pmol I'1 before continuing
to increase to a maximum concentrations are reached of 1190 pmol I'1 at 71°C. This is
lower than achieved in any of the previous incubations. Acetate decreases rapidly above
71°C concentrations reaching 230 pmol I"1 at 95°C.
After 92 days incubation no hydrogen was detected at any temperature. Distinct
peaks of methane however did developed with methane production and sulphate removal
occurring together, however not in the sulphate depletion zone. The first peak at 20°C
had a concentration of 128 pmol I'1. Whilst the second peak accounts for the maximum
concentration of methane detected 536 pmol I"1 at 39°C. The other incubations ilmenite
(Fig.5.10) hematite (Fig 5.17) and pyrite (Fig 5.2 ) all produced methane at high
temperatures (above 60°C) this was not the case with magnetite. Carbon dioxide
increases with temperature from 33°C (413 jumol I’1) to a maximum concentration of
1385 pmol I'1 at 65°C, this coincides with sulphate depletion and hence maximum SRB
activity. After which carbon dioxide decreases rapidly to 317 prnol 11 at 83°C before a
slight increase to 550 pmol I'1 at 95°C. Sulphate removal occurs from 6°C onwards with
maximum removal to 0 pmol I"1 (total removal of 13700 pmol 1 *) occurring between 58
162

Chapter 5. Characteristics of ilmenite, pyrite, hematite and magnetite
and 65°C. with no removal occurring above 78°C. Initial sulphate concentrations were
13.7 mmol I'1, however sulphate increases to 15 mmol I'1 at 95°C.
Acetate formation increases with temperature from 1045 pmol I'1 at 6 °C to 1756
pmol I’1 at 26°C. After 26°C acetate concentration decreases to zero and 11 pmol I"1
between 33 and 39°C respectively. It is in this temperature range that the highest
concentration of methane is detected (536 pmol I"1 at 39°C). This Possibly indicates that
acetoclastic methanogenesis is occurring at this temperature. After this methanogenesis
decrease Acetate increases to a maximum concentration of 3757 pmol I'1 at 71°C, this is
followed by ' rapid decrease to 1078 pmol I 1 at 83°C before a slight increase to 1678
pmol f 1 at 95°C. This increase from 83 to 95°C is similar to the carbon dioxide profile.13Unfortunately magnetite was one of the initial thermal gradients ran and no cation or 8 C
were obtained.
163

Chapter 5. Characteristics of ilmenite, pyrite, hematite and magnetite
5.6AODC counts
AODC counts were conducted on the hematite incubation in order to analysis the effect
of temperature on prokaryote numbers..
Selected hematite samples were counted after 100 days incubation.
10
8
6
4
Max S 0 42 removal2
080 1000 20 40 60 0
Tem perature [ C JCounts courtesy o f Falko
Fig 5.24 Hematite, incubation cell count across selected bathestemperatures after 100 days incubation.
AODC counts (all values are in log cell count/ml). Shows two rates of cell number
decreases a slow decrease from 9.06 (1.14 x 10⁹ cells/ml) at 3°C to 8.3 (1.99 x 10⁸
cells/ml) at 73°C. Interestingly the rate of decrease becomes more rapid above 73°C, after
sulphate reduction becomes inhibited. Perhaps sulphate reducing bacteria and other
prokaryotes are generally being inhibited by the high temperatures. Numbers decrease
from 8.3 (1.99 x 10s cells/ml) at 73°C to 5.85 (7.07 x 10⁵ cells/ml) at 99°C.
164

Chapter 5. Characteristics o f ilmenite, pyrite, hematite and magnetite
5.7 DGGE results fo r ilmenite bacterial incubation after 83 days.
M 18 37 50 63 76 89 95 M
A .
Fig 5.25 Bacterial DGGE Gel ilmenite 30-60%Using primers 27F-1492R Nested with 357F-907R Increasing sample temperature left to right.Temperature [°C] indicated above gel
Increasing Temperature ►Table 5.4 DGGE bacterial results for ilmenite
NumberNearest match by Blastn search
(Accessio n nu mber)Sequence
Similarity (%) Base PairPhylogenetic
affiliationIsolation
environment of nearest match
1(5) Delftia acidovorans SPH-1. (CP000884)
100% 178/178 Burkholderiales, Delftia acidovorans Subsurface marine
2(12) Thermosipho sp. TH70-3 (AB260053)
98% 176/178 Thermotogales, Thermosipho Hydrothermal vent
3(15) Uncultured Delftia (EU376041)
100% 177/177 Burkholderiales. Delftia acidovorans Terrestrial soil sample
4(19) Clone KW-7 (AB186285)
97% 177/182 Gamma proteobacteria Oil reservoir
5(20) Delftia sp. clone M3 11 (EU560926)
97% 189/194 Burkholderiales, Delftia acidovorans Subsurface sediment
6(17) Thermotoga sp. KOL6 (AJ872272),
98% 175/178 Thermotogales; Thermotoga Marine sedimentl 65

Chapter 5. Characteristics of ilmenite, pyrite, hematite and magnetite
5.8 DGGE for ilmenite Archaeal incubation after 83 days
Archaeal primers were used 109F-958R,
Nested with Saf-Parch519r.
M 18 37 50 63 76 89 95 M M 18 37 50 63 76 89 95 M
4 - O s - O
7“>
8- > ->
4 —D>
Increasing Temperature Increasing Temperature
Fig 5.26a Archaeal DGGE profile 60% denaturant gel.
Fig 5.26b Archaeal DGGE profile 30-80% ilmenite.
166

Chapter 5. Characteristics of ilmenite, pyrite, hematite and magnetite
Table 5.5 DGGE Archaea Ilmenite 60% results (18-63°C)
Sample Nearest match by blastn
(accession number)
Percentagesim ilarity
%
Phylogeneticaffiliation
Isolation environment
o f nearest match
1 C l o n eT F C 2 0 L 3 7 A R
( E U 3 6 2 3 5 5 )
9 7 % C ren arch aeo taM B G -C
T i d a l s e d i m e n t s
2 S B A K - m i d - 4 8D Q 6 4 0 2 0 9
9 7 % C ren arch aeo ta M a r i n es e d i m e n t s
3 S B A K - d e e p - 1 8( D Q 5 2 2 9 1 0 )
9 8 % C ren arch aeo ta M a r i n es e d i m e n t s
4 G N A 1 0 H 0 7( E U 7 3 1 6 0 8 )
9 8 % E u rya rch a eo ta ; T herm oplasm ata
H y p e r s a l i n e M i c r o b i a l m a t
5 K a z a n - 2 A - 4 0 ( A Y 5 9 2 0 1 6 )
9 7 % N o v e l cren arch a eo ta C o l d s e e p
6 K a z a n - 2 A - 4 0( A Y 5 9 2 0 1 6 )
9 8 % N o v e l cren arch a eo ta C o l d s e e p
7 T f P 2 0 L 1 5 A r( E U 3 6 2 3 7 7 )
9 6 % C ren arch aeo ta T i d a l s e d i m e n t s
8 T f C 2 0 L 3 6 A r( E U 3 6 2 3 5 4 )
9 9 % C ren arch aeo ta T i d a l s e d i m e n t s
able 5.6 DGGE Archaea Ilmenite 80% results (76-95°C)
Sample Nearest match by blastn
(accession number)
Percentagesimilarity
%
Phylogenetic affiliation Isolation environment
of nearest match
1 P W 1 5 . 7 A( E U 5 7 3 1 5 6 )
9 2 % U n k n o w n H i g h t e m p e r a t u r e O i l r e s e r v o i r
2 P W 1 5 . 7 A( E U 5 7 3 1 5 6 )
9 5 % U n k n o w n H i g h t e m p e r a t u r e
O i l r e s e r v o i r3 P W 1 5 . 7 A
( E U 5 7 3 1 5 6 )9 7 % U n k n o w n H i g h
t e m p e r a t u r e O i l r e s e r v o i r
4 P W 1 5 . 7 A( E U 5 7 3 1 5 6 )
9 7 % U n k n o w n H i g h t e m p e r a t u r e O i l r e s e r v o i r
5 D e s u l f u r o c o c c a l e s a r c h a e o n c l o n e Y N P B P _ A 3 2
( D Q 2 4 3 7 3 0 )
9 3 % Crenarchaeota;Thermoprotei;
Desulfurococcales:
Y e l l o w s t o n e H o t s p r i n g s
6 D e s u l f u r o c o c c a l e s c l o n e : 8 6 % p Y K 0 4 - 8 A - 2
( A B 2 3 5 3 2 7
Crenarchaeota;Thermoprotei;
Desulfurococcales
H y d r o t h e r m a lv e n t
7 T h e r m o c o c c a l e s ( A B 2 0 8 5 6 1 )
9 7 % Euryarchaeota;Thermococci
H y d r o t h e r m a lv e n t
8 T h e r m o c o c c a l e s ( A B 2 0 8 5 6 1 )
9 5 % Euryarchaeota;Thermococci
H y r o t h e r m a lv e n t
167

Chapter 5. Characteristics of ilmenite, pyrite, hematite and magnetite
5.11 Clone libraries
Clone libraries were set up and analysed for the ilmenite and pyrite incubation this was
undertaken in order to achieve a more detailed analysis than can be achieved through
DGGE band extraction. The product size for analysis was 500 bp. Temperature chosen
for clone library construction were ilmenite incubation at 63°C and 89°C, pyrite
incubation at 65°, and 90°C.
The following four trees show the archaeal clone libraries for theses samples Neighbour
joining method was used with the tree based on 500 bases of aligned 16S rRNA gene
sequences all trees are rooted using Korarchaeota species SRI-306 (AF255604).
No bacterial clone libraries were constructed. Test clones for all similar temperatures for
bacterial libraries, indicated all poor quality samples with every clone similar in majority
of samples.
168

52
32
34
81
MBG-C
r- Clone 63-M-20
Clone 63-H-6
Clone 63-H-11
h Clone 63-M-16
Clone 63-H-17
Clone 63-H-10
i - Clone63-il-7
Clone 63-M-3
- Clone 63-H-2
- Clone 63-H-9
r Clone ES9-31 (DQ866032)
Clone oBS65f.41 (DQ146742)
j - Clone SBAK-mid-14 (DQ522918)
74l Clone HMMVPog-29 (AJ704633)
I I Clone 63-H-14
6 l—
p3
68
66100
86 L_ Clone 63-H-19
-Clone MA-C1-5 (AY093451)
r Clone SBAK-deep-53 (DQ640190)
i 1 Clone 63-11-4
nl(
rC
91 I Clone 63-H-12
Clone 63-M-18
82
68
Clone LCKS880A33 (EF201710)
Clone NANK-A106 (AY436518)
--------------- Clone 63-M-8
99
Clone GoMD48 (EF116466)
Clone ZES-98 (EF367535)
i— Clone 63-H-5
34|
51
4446
Clone 63-il-l
h-Clone 63-11-15
Clone 63-H-13
,-Clone TFc20L36ar (EU362354)
Clone BS1-1-104 (AY396704)
Clone BS1-1-41 (AY396674)
100
MCG
• Vent clone VC2.1 (AF068822)
---------------Guaymas clone C1 R043 (AF419642)
100
Cenarchaeum symbiosum (U51469)
-Guaymas clone C1 R010 (AF419636) ,
MBC
MPA-1
93
-Pyrodictium occultum (M21087)
Guaymas clone A2 R048 (AF419633) Cultured crenarchaeotaKorarchaeota SRI-306 (AF255604)
0.02
Fig 5.27. Ilmenite Phylogenetic tree for Archaea clone library, after 83 daysincubations at 63°C
A

26
52
CLONE 89-IL-11
CLONE 89-IL-18
CLONE 89-IL-1
CLONE 89-IL-4
CLONE 89-IL-8
CLONE 89-IL-24
-------------CLONE 89-IL-17
CLONE 89-IL-9
High temperature ilmenite group HTi-1
Thermococcales
— CLONE 89-IL-52
CLONE 89-IL-31
r CLONE 89-IL-48
— P yrococcus sp. TC95-7C-S (AB304881)
l- - T herm ococcus gorgonar ius DSM 10395 (AY099177)
r T herm ococcus g u a y m a se n s is DSM 11113 (AY099178)
- D esu Ifurococcus (AB0179 20)
T herm ococcus sp.Tc-S-85 (AB095157)
- Therm ococcus hydrotherm a lis (Z70244)
Clone ODP1230A17 (AB177098)
h- CLONE 89-IL-30
T herm ococcus a e g a e u s DSM 12767 (AY099171)
CLONE 89-IL-54
T herm ococcus a Icaliphilus DSM 10322 (AB055121)
Clone PW32.5A (EU573164)
Clone PW32.12A (EU573158)
CLONE 89-IL-70
CLONE 89-IL-49
T herm ococcus litoral is DSM 5474 (AY099180)
CLONE 89-IL-32 ^ y /
L Clone PW5.2A (EU573164)
— M etha n o co c cu s ja n n a sch ii (M59126 M e t h a n O C O C C a l e S
M eth a n o co ccu s infernos (AF025822) — '
98 |-------Ferroglobus p lac idus (AF220166)
<-------A rchaeoglobus profu n d u s (AF322 392)
CLONE 89-IL-69
M ethanosarcina therm ophila (M 59140)
M ethanosarcina barkeri (AJ012094)
M ethanothrix therm ophila (M 59148)
M ethanogen ium therm ophilum (M 59129)
Archaeoglobales
99
100c
70
Methanosarcinales
Methano- microbiales
Korarchaeota SRI-306 (AF255604)
Fig 5.28 Ilmenite phylogenetic tree for Archaea clone library after 83 daysincubation at 89°C
B
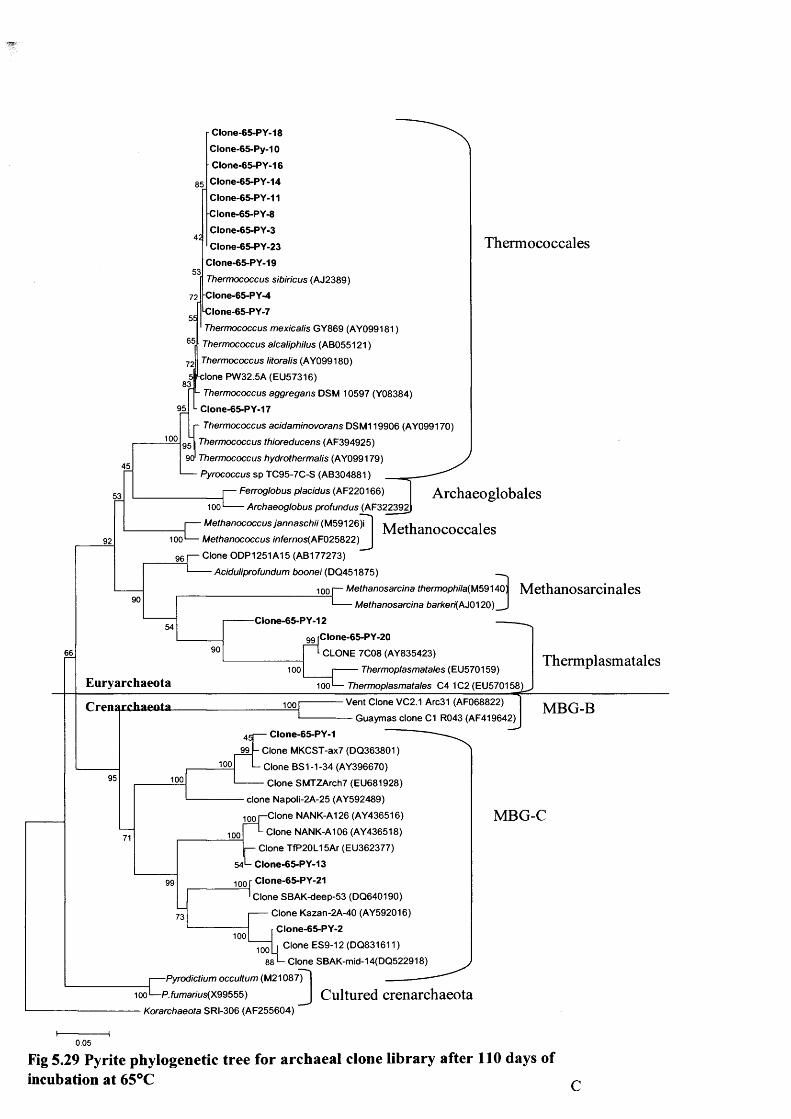
85
42
53
72
55
65
72
83
95
100
53
92
Clone-65-PY-18 Clone-65-Py-10 Clone-65-PY-16 Clone-65-PY-14 Clone-65-PY-11 Clone-65-PY-8 Clone-65-PY-3
Clone-65-PY-23 Clone-65-PY-19
Thermococcus sibiricus (AJ2389)Clone-65-PY-4 Clone-65-PY-7
Thermococcus mexicalis GY869 (AY099181) Thermococcus alcaliphilus (AB055121)Thermococcus litoralis (AY099180) clone PW32.5A (EU57316)
L Thermococcus aggregans DSM 10597 (Y08384) Clone-65-PY-17
r Thermococcus acidaminovorans DSM119906 (AY099170) 9 5 | Thermococcus thioreducens (AF394925)90 Thermococcus hydrothermalis (AY099179)— Pyrococcus sp TC95-7C-S (AB304881)
Ferroglobus placidus (AF220166)
Thermococcales
£ 2
10096
90
Archaeoglobales
Methanococcales1001 Archaeoglobus profundus (AF322392
Methanococcus jannaschii (M59126)i Methanococcus infernos(AF025822)Clone ODP1251A15 (AB177273)— Aciduliprofundum boonei (DQ451875)
1001— Methanosarcina thermophila(M59140
54
)J-'— ■ ■ J
66 90
Euryarchaeota
Methanosarcina barker^ A J0120)_ Clone-65-PY-12 -
99 rClone-65-PY-20* CLONE 7C08 (AY835423)
Thermoplasmatales (EU570159)
Methanosarcinales
£1001— Thermoplasmatales C4 1C2 (EU570158)
Thermplasmatales
C renarchaeota
95
100 Vent Clone VC2.1 Arc31 (AF068822)— Guaymas clone C1 R043 (AF419642)
MBG-B
45|99
100100
— Clone-65-PY-1- Clone MKCST-ax7 (DQ363801) L Clone BS1-1-34 (AY396670)
Clone SMTZArch7 (EU681928)- clone Napoli-2A-25 (AY592489)
100r—Clone NANK-A126 (AY436516) L Clone NANK-A106 (AY436518)
r - Clone TfP20L15Ar (EU362377) 54l Clone-65-PY-13
100
100
Clone-65-PY-21Clone SBAK-deep-53 (DQ640190) Clone Kazan-2A-40 (AY592016)
Clone-65-PY-2Clone ES9-12 (DQ831611)Clone SBAK-mid-14(DQ522918)
100
MBG-C
cPyrodictium occultum (M21087)
100'— P.fumarius(X99555) Korarchaeota SRI-306 (AF255604)
Cultured crenarchaeota
0.05
Fig 5.29 Pyrite phylogenetic tree for archaeal clone library after 110 days of incubation at 65°C

W'
87
Euryarchaeota
60
56
91
48
24
Clone-90-py-9
Clone-90-py-12
Clone-90-py-16
Clone-90-py-17
Clone-90-py-14
Clone-90-py-10
Clone-90-py-18
High temperature pyrite group-1 (HTP-1)
92
■ Clone-90-py-3
5334
• Clone-90-py-15
- Clone-90-py-5
68jClone pCIRA-L (AB095122)
'— Clone pCIRA-12 (AB095137)
Clone CH4 2 9N EPR (AY672469)
■ Clone-90-py-6
HTP-2
95
59H68 I
.Clone CH8 35 (AY672490)
68 I Clone CH1 16 (AY672482)
Methanococcus jannaschii (M59126)
Vent Chimney euryarchaeotal group
Methanococcales
66
991Methanococcus infernos (AF025822)
— Thermococcus acidaminovorans DSM 11906 (AY099170)Clone-90-py-7
— Thermococcus guaymasensis DSM 11113 (AY099178)
— Clone-90-py-4-
Clone-90-py-19
Clone PW25.2 (EU573154)
Thermococcus sp 83-5-2 (AB235309) TheiTOOCOCCalesClone-90-py-13
Thermococcus alcaliphilus (AB055121)
Clone-90-py-8
Thermococcales T17a-44 (AJ585957)
Thermococcus chitonophagus (AY099175)
Pyrococcus sp.MZ4 (AY017173)
Pyrococcus woesei (AY519654)
Pyrococcus furiosus (U20163)
1 0 0 1 Methanosarcina thermophila (M59140)
66
99
Methanosarcina barkeri (AJ012094)
Methanogenium thermophilum (M59129)
Methanosa-rcinales
1001Crenarchaeota
97
52
19
Desulfurococcus fermentans (AY264344)
Clone B1-57 (EU559691)
Clone-90-py-11
------------------Geogemma indica strain 296 (DQ492260)
50 I Ignisphaera sp.Tokl (DQ060320)
72 'Desulfurococcales YNP_BP_A32 (DQ243730)
Korarchaeota SRI-306 (AF255604)
CulturedCrenarchaeota
0.02
Fig 5.30 Pyrite phylogenetic tree for archaeal clone library after 110 daysincubation at 90°C
D

Chapter 5. Characteristics of ilmenite, pyrite, hematite and magnetite
5.12 Molecular results for ilmenite and pyrite thermal gradient incubations
Based on DGGE band sequences from the ilmenite incubation the bacterial composition
is a mixture of 3 different Phylotypes, Burkholderiales (Delftia acidovorans) the
Thermotogales and the Gammaproteobacteria. All species were related to species found
in with high temperature subsurface environments. Delftia is a facultative anaerobe and
has been found in anaerobic high temperature hydrothermal environments (Glamoclija et
al., 2004).Substantial checks were carried out in order to determine, whether this
occurrence of Delftia was contamination, running of blanks from extractions and
checking of all reagents used, but all were negative. Visually the intensity strength of the
Delftia band increased, from ~63°C, this could either be a response to temperature i.e.
thermophilic, or conversely lack of other bacterial species at high temperature, making
the activity of Delftia more noticeable. Thermotoga (Huber et al., 1986) are found in
environments at high temperature, normal salinity and close to neutral pH.
The archaeal diversity from DGGE band sequencing shows interesting diversity.
At lower temperature incubations < 63 °C Crenarchaeota were dominant. At higher
temperatures to 95°C the Euryarchaeota, particularly the Thermococcales dominated. All
species were from relevant marine environments. Visual analysis of both DGGE gels
shows a clear change in community structure with temperature.
Difference in Archaeal phylotypes can be observed depending on incubation
temperature. Two samples, from each mineral incubation were chosen. First temperatures
chosen were samples occurring in the sulphate reduction zone (63°C and 65°C) for
ilmenite and pyrite. The second temperature was 89 and 90°C close to the maximum
upper temperature for both in terms of H2 generation and acetate formation (Fig
5.28,5.30).
The Phylogenetic trees showed differences between the mineral incubated and
differences between the incubation temperatures. At low temperatures, Crenarchaeotic
phylotypes are more prevalent than at the two higher temperature samples. The ilmenite
incubation at 63°C (Fig 5.27). Is totally dominated by the crenarchaeota. The dominant
phylotype belonged to the Miscellaneous Crenarchaeotic group (MCG), with 33% of
clones within Marine Benthic Group-C. The remainder of clones were also MCG which
169

Chapter 5. Characteristics of ilmenite, pyrite, hematite and magnetite
is a large group composed of uncultured phylotypes including sequences from the marine
subsurface (Reed et al., 2002; Inagaki et al., 2003; Webster et al., 2006). Within the
marine benthic group C cluster, clones with similarity to sequences obtained from deep
subsurface Nank-A106(Newberry et al., 2004), clone 63-il-l8 and clone 63-il-8 were
found. Remainder of the clones were found to have similarities to clones found in tidal
flat sediment, clone63-il-13, and 15 and 1.
The 65°C incubation with pyrite addition did not have such a complete bias to the
Crenarchaeota with only 22% of clones falling within this group and all of these are
within the Marine Benthic Group-C. These are similar to clones found in tidal flat
sediments, (Kim et al., 2005) and in the deep marine environment (Newberry et al.,
2004). Unlike the ilmenite incubation however, the majority of clones in the pyrite
incubation fall into the Euryarchaeota {11%) with the majority of these (85%) falling
inside the Thermococcales group. The majority of these Thermococcales sequences are
related to species isolated from hydrothermal systems, Thermococcus mexicalis and
Thermococcus hydrothermalis (Lepage et al., 2004). The only clones in the
Euryarchaeota to fall outside of the Thermococcales, clustered within the
Thermoplasmatales, (clone 65-py-12 and clone 65-py-20), also closely related to species
isolated from hydrothermal systems, Guaymas clone 7C08 (Dhillon et al., 2005).
The high temperature incubation for ilmenite, 89°C, is in contrast to the lower
63°C temperature incubation, as all clones are within the Euryarchaeota (Fig 5.28). All
clones except one are within the Thermococcales with 8 of these clones slightly further
removed from the Thermococcales, provisionally labelled high temperature ilmenite
group 1 (HTi-1) with a similarity matrix average of 96% similarity to closest isolated
clone. The remaining 5 are closely related to previously isolated Thermococcales spp
such as thermococcus aegaeus (Lepage et al., 2004). Only one clone fell outside of the
thermococcales related species, which was clone 20-il-69 and fell within the
Archaeoglobales and was most closely related to Archaeoglobus profundus (Burggraf et
al., 1990) which is an hyperthermophilic sulphate reducing archaeon and hence consistent
with the experimental temperature.
Unlike the high temperature ilmenite incubation, the pyrite clone library did not
consist of Euryarchaeota alone (Fig 5.30). One clone (90-py-ll) was within the
170

Chapter 5. Characteristics of ilmenite, pyrite, hematite and magnetite
Crenarchaeota in the cultured crenarchaeota related to species of high temperature
sulphate reducers such as Desulfurococcus fermentans (Perevalova et al., 2005)
Roughly one-third 29% of clones clustered closely in the Thermococcales, similar to the
ilmenite incubation. The majority of clones however, (65% ) clustered in two groups
named here high temperature pyrite (HTP) group 1 and HTP group 2. These are most
closely related to clones (pCIRA-L and pCIRA-12) taken from possible high temperature
hydrogen driven subsurface communities (HyperSlime) (Takai et al., 2004). These clones
were taken from the hydrothermal vent system in the Indian ridge, close to black smokers
emitting superheated discharges of up to 365°C. They belong to the deep-sea
hydrothermal Vent Euryarchaeotic group. Communities from this proposed ecosystem
were similar to this study mostly dominated by the Thermococcales. To determine the
similarity percentage between these clones and their most closely related isolates a
similarity matrix was performed using RDP (ribosomal database project analysis RDP
version 8.1). Percentage similarities were as follows between clone pCIRA-L and 90-py-
15 was 90%, 90-py-6 was 92%. Between hydrothermal vent clone CHI 16 (Kormas et
al., 2006) and 90-py-15 are 90% ,90-py-6 are 92%.
171

Chapter 5. Characteristics of ilmenite, pyrite, hematite and magnetite
5.13 Discussion
The experiments in this chapter suggests that mineral composition affects
hydrogen production which in turn impacts on processes which use hydrogen as a
substrate, such as acetogenesis, sulphate reduction and methanogenesis. High levels of
hydrogen (1633 prnol I'1 for hematite and 820 pmol l"1 for pyrite) were detected at
elevated temperatures ~ 85-98°C, from all samples except magnetite. This seems to
disprove initial hypothesis linking H2 generation to Fe content. Table.5.7 shows
maximum concentrations of hydrogen, acetate, carbon dioxide and methane over the first
3 days of incubation.
Table 5.7 Maximum concentrations recorded after 3 days,(pmol I"1)
Sample Fe20 3 wt% h 2 c h 4 c o 2 Acetate
Ilmenite 50.7 632 5,7 6176 1293
Pyrite *46.6(% Fe) 820 125 4673 2770
Hematite 54.2 1633 2 6580 1501
Magnetite 99.4 0 2.3 3776 1190
*Theoretical value.
From Table 5.7 it can be seen that Fe concentrations do not play a defining role in
hydrogen generation. This can be seen by the fact that the sample containing the most Fe
(magnetite) produced the lowest concentrations of acetate and carbon dioxide with no
detectable hydrogen. In addition, the amount of ferrous iron does not seem to control H2
generation as proposed for basalt weathering/ serpentinization, as hematite contains
theorectically, fully oxidised ferric (Fe20 3 ), yet this produced the largest initial H2
concentrations. Of interest is the role of other mineral combinations most noticeably Si
Al and Ti (Table 5.8)
172

Chapter 5. Characteristics of ilmenite, pyrite, hematite and magnetite
Table 5.8 Mineral composition and maximum hydrogen generation.
Sample S i0 2
wt%
AIO3
wt%
T i0 2
wt%
h 2
Hematite 20.53 17.7 0.79 1633
Ilmenite 1.06 1.28 47.3 632
Magnetite 2.57 1.05 0.05 0
In terms of mineral composition Si content (Si02) might play a role in hydrogen
generation, as hematite produces the most hydrogen and also has the highest
concentration of Si02 (20.53%) it also has the highest amounts of AIO3 (17.7%). Ilmenite
produced 2.5 times less hydrogen than hematite despite, having similar concentrations of
Fe. Ilmenite has low concentrations of S i02 and AIO3. However unlike hematite and
magnetite, ilmenite has high amounts of TiC>2 (47.3%). Magnetite produces no detectable
hydrogen and has very low levels of Si/Al/Ti , but has high levels of iron. These results
indicate that iron concentration does not play a role in high temperature hydrogen
generation, in fact it may be a barrier to hydrogen production. It seems more likely that in
these experiments hydrogen production is mediated by Si or a combination of factors
involving Ti/Al and Si.
All samples producing H2 have a maximum temperature of 100°C above which no
hydrogen was produced. Noticeably between minerals producing hydrogen and magnetite
is a temperature difference in zones of maximum activity in terms of acetogenesis and
methanogenesis, sulphate reduction occurs at the same temperature with maximum
depletion occurring between 60-70°C. However, methane production and acetate
formation occur at higher temperatures in samples producing hydrogen (Fig 5.2).
Magnetite shows no high temperature methane formation with CH4 formation peaking at
40°C. Ilmenite, pyrite and hematite all show high temperature methane formation
between 60-90°C but not always at the same temperatures. A similar profile is noted
during acetate formation. Acetate formation begins to substantially increase for magnetite
173

Chapter 5. Characteristics of ilmenite, pyrite, hematite and magnetite
at 40°C peaking at ~70°C with no substantial high temperature formation. Acetate
generation in the hydrogen producing incubations substantially increases from 60°C with
maximum concentrations coinciding with maximum hydrogen concentrations 90-100°C.
(Fig 5.30)
10000
/ P^p8000
-q 6000
E©g 4000
2000
10060 80400 20T em p era tu re [ °C ]
600
500
400
300
200
100
00 20 40 60 80 100
T em perature [ ° C ]
Fig 5.31 combined graphs of methane A and acetate BKey: Ilmenite, open triangle. Hematite: closed circle. Pyrite: opensquare. Magnetite: closed Diamond
174

Chapter 5. Characteristics of ilmenite, pyrite, hematite and magnetite
600
500
400
300pg
I
200
100
80400 20 60 100Temperature [ °C ]
Fig 5.32. Combined graph showing hydrogen generation at last sampling point.Key: Ilmenite, open triangle. Hematite: closed circle. Pyrite: open square. Magnetite: closed Diamond
813C-CH4 data is quite interesting with a range of values being found generally increasing
with temperature, e.g -42%o for pyrite at 90°C compared to -55%o at 65°C. Methane13 «produced at these high temperatures is clearly of biotic origin, however 5 C values like
these could be mistaken for methane produced through abiotic thermogeneic reactions
and have been interpreted as such in the past, this includes in the Guaymas basin (Teske
et al., 2002) sediments. Where the inoculum for these incubations was obtained
175

Chapter 5. Characteristics of ilmenite, pyrite, hematite and magnetite_________________
For the major cations. A general profile was observed. Fe concentrations increased with
temperature with all incubations. Highest iron concentrations occur in the zone of
hydrogen generation and highest acetate formation. Silica also increased with
temperature with the maximum concentration for silica occurring at he highest
temperature.
Molecular analysis by the use of clone library construction gave a more detailed
view of the archaeal community structure with temperature for ilmenite and pyrite. The
difference in terms of Crenarchaeota and Euryarchaeota composition is clear with less
Crenarchaeota present at high temperature ~90°C than at lower ~65°C, the ilmenite
incubation has all Crenarchaeota at the lower temperature incubation and all
Euryarchaeota at higher temperature. The dominant species at high temperature are the
Thermococcales for ilmenite, for pyrite however most clones’ fall within two groups
labelled PHT-1 and PHT-2. Most closely related species to these are the vent chimney
Euryarchaeotal group, clones thought to be associated with HyperSlime communities
(Takai K, 2004).
176

Chapter 6 Characteristics of Olivine, Hornblende, Labradorite and Silica
Chapter 6 Temperature characteristics of Olivine,
Hornblende, Labradorite and Silica reactions in sedimentslurries
i l Introduction
This chapter presents the results obtained from mineral addition incubations conducted
over a temperature range of 0 to 105°C. Using olivine, hornblende, labradorite and silica
(quartz). Results are presented in order of increasing silica content (Table 3.2) measured
as SiC>2 using ICP-OES which is olivine 41.82 wt%, hornblende 49.95 wt%, labradorite
52.2 wt% and silica 100 wt%. This chapter is intended to be in contrast to chapter 5,
which describes mineral addition experiments, ordered in terms of increasing iron
content. Ordering minerals in terms of increasing silica also had the effect of arranging
minerals in terms of decreasing iron content. (Fe203 wt%) olivine 7.94, hornblende 7.87,
labradorite 0.62 and silica (quartz) 0 .
This chapter should expand our knowledge of the mechanism responsible for
hydrogen generation and show whether this process is predominantly associated with
silica as previously considered in chapter 5. It has been proposed that freshly fractured
silica, has been responsible for elevated hydrogen concentrations found at fault zones
(Kita et al., 1982). Maybe a similar type of reaction is occurring in our thermal gradient
experiments, with hydrogen production also being enhanced in the presence of
sedimentary prokaryotes and elevated temperature.
If this is the case then incubation of pure silica (quartz) mineral (freshly ground)
sediment slurries, should produce high concentrations of hydrogen comparable if not
greater, than minerals containing mixed amounts of silica and other compounds such as
iron and aluminium.
177

slurry
he
adsp
ace
Chapter 6 Characteristics of Olivine, Hornblende, Labradorite and Silica
1000 60000
50000800
40000W
600
T3400
20000 ®
20010000
□“ □ O
o L d ^ H D -L D • » '♦ •0 20 40 60 80 100 120
Temperature [°C ]250001400
120020000
1000
15000OE 800
4-*TO 60010000
400
5000
200
40 1201008060200
Temperature [ °C ]
Fig 6.1 Olivine incubation after 3 days incubation.
Key CH. (•), C 0 2 (□), H2 (♦ ), Acetate (») and SO.,2’ (o).
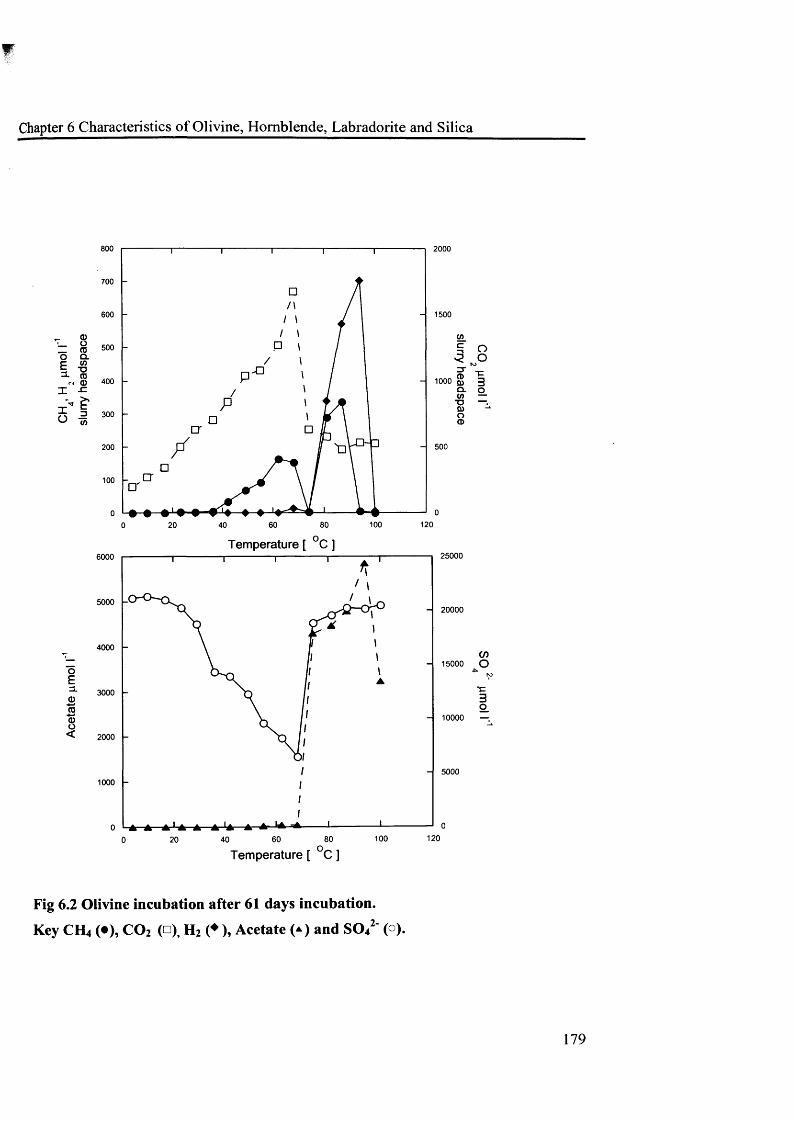
w
Chapter 6 Characteristics of Olivine, Hornblende, Labradorite and Silica
800 2000
700
600 1500
CDO<0Q.</>T3CO0)sz
500
400
; 3 300' CO
500200
100
100 12060 8020 400Temperature [ °C ]
250006000
500020000
4000
15000 OoE
3000CD -*—<
3a>o<10000
2000
50001000
120100806020 400Temperature [ °C ]
Fig 6.2 Olivine incubation after 61 days incubation.
Key C ft, (•), C 0 2 (□), H2 (♦), Acetate (*) and SO„2‘ (o).
179

■ F
Chapter 6 Characteristics of Olivine, Hornblende, Labradorite and Silica
6.2 Olivine Results (Figs 6.1 and 6.2)
After 3 days incubation no significant amounts of methane were detected, a maximum
concentration of 1.9 pmol f 1 was recorded at 87°C (Fig 6.1). Similar to incubations
presented in Chapters 4 and 5, high concentrations of hydrogen were detected at elevated
temperatures (81-100°C), with a maximum concentration of 812 pmol f 1 at 94°C. No
hydrogen was detected at 100°C or below 81°C. Carbon dioxide concentrations overall
increased with temperature reaching a maximum of 50.7 mmol I"1 at 87°C, decreasing
after this to 36.4 mmol I'1 at 94°C. A slight dip in concentrations is also noted at 62°C
during the initial increase in carbon dioxide, this co-occurs with a slight decrease and
plateau in acetate concentrations. No sulphate removal was found to take place; initial
concentrations are approx 19.5 mmol I’1. Interestingly high concentrations of CO2 are not
associated with sulphate reduction, which was the case in previous Chapter 5
experiments. Acetate concentrations remain low until 36°C (3.8 pmol I"1) after which
concentrations increase with temperature up to 94°C except for the 62°C plateau in
concentrations. Acetate continues to increase to a maximum of 1275 pmol I'1 at 94°C.
Highest concentrations of acetate and hydrogen occur at the same temperature.
This incubation and the hornblende incubation are conducted over a shorter time
period 61 d. This is because they were among the first experiments conducted and a
failure in the thermal gradient system meant the last incubation point, scheduled for
sampling at 90d could not be trusted as accurate. After 61 days incubation high amounts
of hydrogen are detected at 94°C. Which is similar to those detected after 3 days but
maximum concentrations were 13% less (704 pmol I"1), and H2 was produced over a
broader temperature range ~75°C-100°C. Two distinct peaks of methane are observed.
First with a maximum of 164 jumol I'1 at 62°C occurring in the zone of most active
sulphate removal 49-74°C and the second peak at higher temperature 74-94°C, with a
maximum of 335 pmol l"1 at 87°C, which is the highest amount of methane detected.
813C-CH4 isotope data was obtained (Table 6.1) for methane at 62°C and suggests an
acetoclastic pathway for methane production (Whiticar, 1999).
180

f
Chapter 6 Characteristics of Olivine, Hornblende, Labradorite and Silica
Table 5.1 8 13C values for olivine incubation
Sample 8 13C-CH4 SD 813C -C 02 SD
Olivine 62°C -54.4%o 0.7 Na Na
SD, standard deviation, n=3
No 8 13C-CC>2 values were obtained as the storage of samples in acidified KC1, renders
these values undetectable. Carbon dioxide increases with temperature to a maximum of
1674 pmol I’1 at 68°C (more rapid increase occurs from ~ 60°C. The carbon dioxide
maximum is contiguous with the maximum temperature for most rapid sulphate removal
and decreases when sulphate removal slows rapidly at elevated temperatures. The amount
of carbon dioxide detected is far less than detected after 3 days (- 48.3 mmol I'1) which is
consistent with previous incubations such as ilmenite, pyrite, and hematite(Chapter 5).
Carbon dioxide decreases rapidly after 6 8 °C before plateauing, and reaching a final of
concentration of 528 pmol f 1 at 100°C.
Sulphate removal is most active at 6 8°C with the removal of approx 14.4 mmol I'1,
leaving a concentration of 6500 pmol I'1 at 6 8°C. Sulphate removal rapidly decreases
after 68°C. Between 68°C and 74°C there is a difference of 11.5 mmol f 1 in terms of
sulphate removed. Interestingly sulphate concentrations even at 100°C, never reach
original concentration (800 pmol I'1 less). This decrease in concentration maybe evidence
of high temperature sulphate removal, or perhaps could be due to analytical error, due to
the difficulty in measuring high temperature samples. High temperature samples produce
a lot of organic compounds that are visible on and lower the sensitivity of IC columns, so
high temperature samples are diluted 1 in 50 or 1 in 100 before analysis which adds some
slight analytical error. Acetate values rapidly increase coinciding with decrease in
sulphate removal, from 40 pmol I'1 at 68°C to 4281 pmol I'1 at 74°C. Acetate continues
to increase with temperature with a peak of maximum concentration at 5841 pmol 11 and
94°C before decreasing rapidly to 3223 pmol I"1 at 100°C. Some acetate was removed
between 40 and 68°C as elevated concentrations were present in this zone at 3 days (>
600 pmol I’1) Fig 6.1.
181

Chapter 6 Characteristics of Olivine, Hornblende, Labradorite and Silica
©T _ O _ TO0 Q- c to^ ■©=3- (0rg Q)1 -Cx" |
i
OE=L<DTO4-*<DO<
800 30000
70025000
600
20000 <0500
400 15000 Q) q
30010000
200
5000100
020 40 60 80 100
Temperature [ C ]
120
200001400
1200
150001000
800
10000
600
4005000
200
01201008060400 20
cn O
T3o
Temperature [ C ]
Fig 6.3. Hornblende incubation, after 3 days.
Key CH. (•), C 0 2 (□), H2 (♦ ), acetate (») and SO .2' ( )■
182
tL

Chapter 6 Characteristics of Olivine, Hornblende, Labradorite and Silica
3500800
700 3000
6002500
- g 500O Q. c «o ^ -o
fs, 2) 400
2000
1500
3 300
1000200
500100
100 120806040
Temperature [ °C]
250007000
600020000
5000
15000oEa.
4000
(0CPo<
300010000
20005000
1000
12010060 80 Temperature [ C]
40200
Fig 6.4 Hornblende incubation, 61 days.
Key: CH4 (•), CO2 (□), H2 (♦ ), acetate (*) and SO4 2' (o).
183
I

I
Chapter 6 Characteristics of Olivine, Hornblende, Labradorite and Silica
6,3 Hornblende results (Figs 6.3-6.4)
After 3 days of incubation high levels of hydrogen were observed at elevated
temperatures ~75-100°C, with a maximum concentration of 798 pmol f 1 occurring at
90°C (Fig 6.3). This is very similar to the concentration detected in the olivine incubation
(812 pmol I'1). This is not surprising as composition of both minerals is similar (Table
3.2). No significant methane formation was detected with a maximum concentration of
10 pmol I 1 at 103°C. Carbon dioxide increases with temperature in a stepwise manner,
with a rapid increase occurring simultaneously to the initial hydrogen increase at 6 8 °C. A
dip to 8454 pmol I'1 occurs between 90-97°C, before carbon dioxide increases to its
maximum of 28.5 mmol I'1 at 103°C. Concentrations of CO2 are not high in comparison
with olivine which had 22.2 mmol I"1 more carbon dioxide than hornblende. No
noticeable sulphate removal took place over the first 3 days with an approximate starting
concentration of 20 mmol I'1 and a final concentration of ~19 mmol I 1 most likely this
variation is due to analytical error. Acetate concentrations increase rapidly from 39 pmol
I'1 at 39°C to 1035 pmol f 1 at 58°C before decreasing slightly to 743 pmol f 1 at 71°C
close to the initial increase in H2. Subsequently acetate continues to increase to a
maximum concentration of 1304 pmol I'1 at 97°C, before deceasing rapidly to 316 pmol
I'1 at 103°C.
After 61 days of incubation high concentrations of hydrogen were detected
between 85 and 100°C with a maximum concentration of 720 pmol I 1 at 90°C. This is
only slightly lower (78 pmol I'1) than detected after 3 days, however high H2 occurs over
a narrower temperature range indicating consumption. Carbon dioxide again increased
stepwise with temperature reaching a maximum concentration of 3413 pmol f 1 at 78°C.
A slight dip of approx 500 pmol I"1 occurs at 63 °C this coincides with a dip in methane
concentrations. Rapid build up of CO2 occurs from 71°C to 78°C increasing from 1472
pmol I*1 to 3413 pmol I 1. The maximum carbon dioxide concentrations do not coincide
with the maximum temperature for sulphate removal as seen with previous incubations
but coincides with slowing of SO42’ and rapid increase in acetate. Carbon dioxide
184

F
Chapter 6 Characteristics of Olivine, Hornblende, Labradorite and Silica
decreases rapidly above 78°C (853 pmol I'1 at 84°C) plateuing around this level with a
concentration of 1163 pmol I"1 at 103°C. Methane production similar to olivine (Fig 6.2)
shows two distinct peaks/zones of methanogenesis and similar concentrations. The first
zone(46-71°C) has a maximum concentration of 192 pmol I'1 at 58°C while the second
zone (71-90°C) has a maximum concentration of 282 pmol l 'at 84°C. The first peaks in
the zone of sulphate reduction and the second occurs during rapid acetate formation and
CO2 decrease. 8 13C-CH4 Isotope values are in Table 6.2.
Table 6.2 8 13C values for hornblende incubation
Zone 2
Zone 1
c
[
Sample 8 13C-CH4 SD 813C-C02 SD
78°C -46.9%o 0.3 Na Na
58°C -53.6%o 1.0 Na Na
46°C -52.8%o 1.1 Na Na
SD, standard deviation. n=4
No CO2 sample data is available due to the long-term storage of methane in
acidified KC1. The isotope data is interesting, and are similar to other incubations
presented in chapter 5 (Pyrite). The value at 78°C achieved are not normally associated
with biotic production of methane (acetoclastic methanogenesis 513C -65 to -50%o. but
are more associated with methane produced via abiotic origins from much higher
temperatures (Whiticar, 1999) although Whiticar does suggest a link between
temperature increases and kinetic isotopic effect (KIE)* decreases which is consistent
with previous values obtained. Sulphate removal begins at 16°C with maximum removal
taking place at 65°C with an approx removal of 14.4 mmol I"1, leaving a remaining
concentration of 5780 pmol I"1, complete removal does not occur, no significant removal
occurs above 90°C. A rapid slow down in removal rates occur at 78°C. Acetate
concentrations increase rapidly when sulphate removal slows from 58 pmol 11 at 71°C
increasing to 4398 pmol I'1 at 78°C. Acetate concentrations reach a maximum of 6238
pmol f 1 at 97°C before decreasing to 1780 pmol I'1 at 103°C.
*KIE is the change in reaction rates that occurs when a isotope is substituted for an atom , also called fractionation
185

Chapter 6 Characteristics of Olivine, Hornblende, Labradorite and Silica
1200 5000
10004000
or© 800 O <0
' 9- </>; -dl<n © 600: -c
3000
Q.w2000"S3
V) 400
1000200
0 20 40 60 80 100 120
Temperature [ °C ]140003000
120002500
10000
2000
8000
1500©©O<
6000
10004000
5002000
40 12060 80 100200Temperature [ °C ]
Fig 6.5 Labradorite incubation after 3 days.
Key: « ! , ( • ) , C 0 2(n), H2(^ ), Acetate (*) and SO4 2' (o).
186

Chapter 6 Characteristics of Olivine, Hornblende, Labradorite and Silica
1200400
3501000
300
800<D— OI 2 .i - 1r ~ o
250
600200
150400
-o /100 □ a200
oE=LBBa>o<
20 40 60 80 100Temperature [ C ]
Fig 6 .6 Labradorite incubation after 108 days.Key: CYUO, C0 2(n), H2(^),Acetate (a) and S 0 42 (o).
q O *5 O s-CD TiS 3Q. o</> — T3 — Q) iO
100 1208040 60
Temperature [ UC ]200
1500010000
8000
10000
6000
4000
5000
2000
0
COOT3o
120
187

Chapter 6 Characteristics of Olivine, Hornblende, Labradorite and Silica
Labradorite slurry incubation, cation concentrations after 108 days incubation.
1.5
1
9.5
080 100 1206020 400
i £
Temperature [ C ]
Fig 6.7 Labradorite incubation, Al and K cation concentrations at selected temperatures after 108 days
3.5
3
2 5
2
1 5
1
- oo - - a -0.5
040 80 1000 20 60 120
Temperature [ C ]
Fig 6.8 Labradorite incubation. Fe, Mn and Ti cation concentrations at selected temperatures after 108 days
Al: inverted closed triangle. K: open Diamond Fe: closed circle. Mn: x. Ti: open box
10
s
c
0
0
0
0
12010020 60 8040
Tem perature [ °C ]
Fig 6.9 Labradorite incubation. Ca and Mg cation concentrations at selected temperatures after 108 days
. Ca: closed Diamond. Mg: open triangle
6
5
4
3
- o2
112060 80 1004020
Temperature [ °C ]
Fig 6.10 Labradorite incubation, P and Si cation concentrations at selected temperatures after 108 days
P: open circle. Si: closed triangle
188
Mn, Ti [ m
g/l ]

Chapter 6 Characteristics of Olivine, Hornblende, Labradorite and Silica
6.4 Labradorite results (Figs 6.5 to 6.10)
After 3 days, high concentrations of hydrogen were detected with a maximum
concentration of 1118 pmol f 1 at 100°C. Two peaks are noticeable between 64-87°C and
94-100°C. Maximum H2 concentrations occur in peak 2 while the maximum
concentration in peak one is 231 pmol I'1 at 81°C. This maximum concentration is higher
than the olivine (812 pmol 1 at 94°C) or hornblende (798 pmol I'1 at 90°C) incubations,
and occurs at a higher temperature. No hydrogen is detected above 100°C. Methane
concentrations were high in comparison to those detected after 3 days in other
incubations (1.9 pmol I"1 at 87°C for olivine) with a maximum of 118 pmol ^detected at
87°C. This overlaps with a decrease in hydrogen concentrations from the first hydrogen
peak. Carbon dioxide increases with temperature reaching a maximum concentration of
4110 pmol I'1 at 103°C. This increase occurs in 3 different phases 1 a slow increase from
4 to 42°C (111-850 pmol f 1) the second a rapid increase from 42 to 87°C (850-3765
pmol I'1) and phase 3 a slow increase between 87-103°C (3795-4110 pmol I'1). Sulphate
removal has begun by day 3 at temperatures above 42°C. Maximum sulphate removal
occurs at 62°C where concentrations are 8190 pmol f 1 which is an approximate removal
of 4.81 mmol f 1. However unlike all previous minerals, sulphate removal occurs at all
sampling temperatures from 42°C to 103°C (103°C has a concentration of 11.1 mmol I'1,
which is an approximate removal of 1.8 mmol f 1). Amounts of acetate generated are low
until 49°C where 382 pmol f 1 is detected, this decreases to 25 pmol I 1 at 55°C. A rapid
increase in acetate occurs at 6 8 °C, coinciding with a slowing in the sulphate reduction
rate. Acetate increases from 21 pmol f 1 at 62°C to 1955 pmol f 1 at 6 8 °C. A decrease in
acetate is noted between 68 and 87°C this u shaped decrease is associated with the
production of methane and the generation of the second peak of hydrogen. After 87°C
acetate concentrations again increase reaching a maximum concentration of 2658 pmol f 1
at 94°C with little change to 103°C.
After 108 days max concentrations of hydrogen occur at 100°C (344 mmol I"1).
Unfortunately due to sample vessel failure after 100 days, no sample above 100°C was
189

m
Chapter 6 Characteristics of Olivine, Hornblende, Labradorite and Silica______
available for analysis. A small hydrogen peak also occurred in the zone of sulphate
depletion (21 pmol 11 at 6 8 °C). This may be an indication of hydrogen usage during
sulphate reduction, as it coincides with the zone of complete S042' removal, hence
substrates that were being used by sulphate reduction could build up transitionally. This
is not seen in the other mineral incubations in this Chapter, as complete sulphate removal
does not occur. Once sulphate reduction ceases hydrogen can be liberated for use in other
processes (e.g. acetogenesis). Carbon dioxide increases stepwise with temperature until
68°C where a maximum concentration of 1062 pmol l'1 occurs. Which is in the zone of
complete sulphate removal, hence maximum activity of sulphate reducers. Carbon
dioxide decreases above this temperature, decreasing to 422 pmol I'1 at 81°C before
increasing to 879 pmol I"1 at 94°C and decreasing again at 100°C. This decrease in
carbon dioxide occurs during a rapid increase in acetate. One explanation of this is, that
acetate production from H2 consumes carbon dioxide; this may also explain the CO2 dip
at 60°C. Methane concentrations start to increase from 36°C (10 pmol f 1) increasing
continually to a maximum concentration of 396 pmol I'1 at 94°C. Methane concentrations
drop to 4 pmol I"1 at 100°C. However two changes in temperature response a rapid
increase from 36°C (10.4 pmol I"1) to 49°C (128 pmol I'1), and then a slower almost
growth curve like response from 49°C to maximum concentrations at 94°C. This could be
perhaps a response to a change in substrates and is similar to the 2 methane peaks seen in1 3other incubations, with the exception that these values are overlapping. 5 C isotope
analysis were performed and the results are shown in table (6.3)
Table 6.3 813C values for labradorite incubation
Sample 813C-CH4 SD 5,3C-C02 SD
87°C -42.8%o 0.6 -19.2%o 0.4
81°C -46.1%o 0.9 -20.3%o 0.2
74°C -46.1 %o 0.7 -21.496® 0.3
SD standard deviation, n = 4
190

Chapter 6 Characteristics of Olivine, Hornblende, Labradorite and Silica
Similar to previous incubations pyrite and hornblende (Tables 6.2 and 6.3) S13C isotope
values for methane produced at higher temperature, gives values more recognisable as
abiotic methane formation (Whiticar, 1999).
Sulphate depletion begins at 2°C with complete removal occurring between 55
and 68°C, which is a total removal of approx 14.7 mmol I'1. Sulphate reduction then
slows rapidly but continues to be removed until 94°C with no removal occurring at
100°C. Acetate values increase once complete sulphate removal is achieved, increasing
from 48 pmol I 1 at 49°C to a maximum concentration of 8757 pmol I'1 at 87°C. Acetate
decreases slightly to 7912 pmol I'1 at 100°C.
K increases with temperature from 246 mg/1 at 23°C to 438 mg/1 at 87°C (which
correlates with the temperature for maximum acetate formation) before decreasing from
87°C to 355 mg/1 at 100°C. Al concentrations remain relatively constant until 81°C 1
mg/1 at 23°C and 0.98 mg/1 at 81°C. A slight dip occurs to 0.7 mg/1 at 87°C before
peaking to 1.4 mg/1 at 94°C. This peak coincides with maximum CH4 concentrations. Al
concentrations decrease to 0.6 mg/1 at 100°C. Iron concentration increase simultaneously
with those of acetate (Fig 6.11) increasing from 0.14 mg/1 at 23°C to a maximum
concentration of 3.2 mg/1 at 94°C (CH4 maximum Fig 6 .6 ) decreasing to 2.2 mg/1 at
100°C. Ti concentrations show a very slight increase with temperature with a peak of
0.26mg/l at 94°C before decreasing to 0.1 mg/1 at 100°C, this peak is close to the
maximum Fe peak. Mn concentrations remain constant to 80°C with a small dip at 85°C
then increasing with temperature to 100°C (0.41 mg/1). Ca concentrations increases with
temperature from an initial concentration of 2 mg/1 at 23°C to 127 mg/1 at 100°C. Mg
concentrations show an initial increase in concentration from 218 mg/1 at 23 °C to 272
mg/1 at 42°C above this mg concentrations decrease steadily until reaching it lowest
concentration of 84 mg/1 at 100°C. Si concentrations have a temperature profile similar to
Fe and acetate concentration increases (Fig 6.11 b). Maximum concentration of Si
detected was 15.5 mg/1 at 87°C, before decreasing to 6.4 mg/1 at 100°C. P concentrations
show a decrease from 5.9 mg/1 at 23°C with a rapid drop at 40°C , where CH4 starts and
191

Chapter 6 Characteristics of Olivine, Hornblende, Labradorite and Silica
is then relatively stable until 100°C w ith a peak at 85°C to 3.55 mg/1 . Final concentration
at 100°C were 2.3 mg/1
10000
8000
6000
4000
2000
400
80 10060 1200 20
3(Q
Temperature [ °C ]
Fig 6.11a Labradorite Acetate and Fe
Acetate: closed triangle. Fe: closed circle.
Temperature [ °C ]
Fig 6.11b Acetate and Silica
Acetate: closed triangle Si: open circle
400
350
300
250
200
150
100
50
00 20 40 60 80 100 120
Temperature [ °C]
Fig 6.12 Labradorite: Methane and Fe concentrations after 108 days incubation.Key; methane: open circle. Fe: closed circle

Chapter 6 Characteristics of Olivine, Hornblende, Labradorite and Silica
2000 7000
6000
15005000
(1)O(0
> CL CO
: ' O1- CO<N ©' x:%r ^
4000 3"
1000 CLCO
3000 "§3CO
2000500
1000
Dl
12010060Tem perature f UC 1
804020
160001500
14000
12000
100010000 cn
oEa©©©o<
8000
6000500
4000
2000
12010080604020
Tem perature [ °C ]
Fig 6.13 Silica addition, 3 days incubation
KeyiCH. (•), C 0 2 (□), H2 (♦ ), acetate (*) and SO4 2' (o).
193

Chapter 6 Characteristics of Olivine, Hornblende, Labradorite and Silica
700 1400
600 1200
1000500
O Cl 400S -o a to
CM f l j
X x:. ^ 300
I ° %200
800
600
400nr'
200100 JD
1201008040 60200
Temperature [ C ]
<w_
§ O< oCD0)Q.Crt■D0)OCD
160007000
140006000
120005000
10000
O 4000E=L 8000CDCOd)o<
30006000
2000 4000
1000 2000
o ie=-0 1201008060
Temperature [ UC ]4020
Fig 6.14 Silica addition, 97 days incubation
Key: C H 4 (•), C 02 (□), H2 (♦ ), acetate (*) and S O 4 2' (o ) .
194

I i/Bui ] iv
f
Chapter 6 Characteristics of Olivine, Hornblende, Labradorite and Silica
Silica (quartz) slurry incubation, cation concentrations after 97 days incubation.
1.4
1.2
1
OJ
M
o8060 100 12020 400
7
6
5
4
3
2o r
O '1
200
80 1200 60 10040
Temperature [ C]Temperature [ C ]
F1g6 .15 Silica incubation, Al and K cation concentrations at selected temperatures after 97 days incubation.
Al: inverted closed triangle. K: open Diamond
Fig 6.16 Silica incubation. Fe, Mn and Ti cation concentrations at selected temperatures after 97 days incubation.
Fe: closed circle. Mn: x. Ti: open box
200
150
100
50
012010080600 20 40
Temperature [ C ]
8
7
6
5
4
3
2
0100 12060 80400 20
Temperature [ C ]
Fig 6.17 Silica incubation. Ca and Mg cation concentrations at selected temperatures after 97 days incubation.
Ca: closed Diamond. Mg: open triangle
Fig 6.18 Silica incubation. P and Si cation concentrations at selected temperatures after 97 days incubation.
P: open circle. Si: closed triangle
195
Si [mg/l]

Chapter 6 Characteristics of Olivine, Hornblende, Labradorite and Silica
6.5 Silica Results (Figs 6.13-6.18)
After 3 days o f incubation high concentrations o f hydrogen were detected between 70
and 102°C, with a maximum concentration o f 1692 pm ol I 1 at 96°C. This is the highest
amount o f hydrogen detected after 3 days o f incubation, o f any thermal gradient
experiment presented in Chapters 4, 5 or 6 . However, no significant concentrations o f
methane were detected, the maximum concentration being 0.75 pmol I"1 at 87°C as
opposed to 118 pmol I' 1 for labradorite. Carbon dioxide concentrations increase almost
exponentially with temperature and reach a m axim um concentration o f 6564 pmol I 1 at
102°C. No significant sulphate removal occurred after 3 days. Acetate concentrations
increase with temperature from 20 pm ol I' 1 at 25°C to a maximum concentration o f 1478
pmol I' 1 at 64°C. A sharp decrease occurs between 64 and 77°C with acetate decreasing
to 718 pmol f 1. Acetate increases rapidly after this dip rising to 1266 pmol I' 1 at 96°C
before, similar to hydrogen and acetate in all other samples decreasing over 100°C,
reaching 258 pmol I' 1 at 102°C.
After 97 days incubation high concentrations o f hydrogen were still present at
elevated temperatures between 64 and 102°C, with a maximum concentration o f 638
pmol 1 1 at 89°C. W hich is 60% lower than after 3 days incubation and at 7°C lower
demonstrating H2 consumption. No hydrogen is detected above 100°C (0 pmol I' 1 at
102°C). Carbon dioxide initially increases exponentially w ith temperature to a maximum
concentration o f 1310 pmol I 1 at 70°C, w hich is in the zone o f maximum sulphate
removal and when H2 first starts to accumulate. After which, carbon dioxide decreases to
546 pmol I' 1 at 77°C. This rapid decrease (58%) co-occurs with rapid slowing in the
sulphate removal rate and a rapid increase in acetate concentrations. Both o f which could
be contributing factors. M ethane was present in two zones, between 32 and 51°C and
between 57 and 70°C. M aximum peak in zone one occurred at 44°C (36 mmol !) and the
highest concentration occurred in zone 2 with a maximum o f 120 pmol I' 1 at 64°C.
Methane in both zones occur during active sulphate removal. Methane concentrations are
low in comparison to some o f the other minerals, labradorite maximum o f 396 pmol 1 1
196

Chapter 6 Characteristics of Olivine, Hornblende, Labradorite and Silica
and olivine o f 335 pmol 1 *. Unfortunately methane never reached sufficient
concentrations during incubation for 5 13C-CH 4 analyses to be performed.
Initial concentrations for sulphate are approxim ately 14.5 mmol I' 1 with maximum
sulphate removal occurring at 64°C, w ith no significant sulphate removal occurring at
77°C (14.08 mmol 1 !). Interestingly a slight increase in sulphate concentrations is noted
at high temperature from 95°C with sulphate concentrations reaching 15 mmol I' 1 at
102°C. Acetate values begin to increase close to the temperature range o f maximum
sulphate removal increasing from 87 m m ol I" 1 at 51°C, to 1542 mmol I" 1 at 70°C. More2 1 rapid increase takes place when S 0 4 ' rem oval slows, increasing to 4395 pmol 1" at
77°C. Acetate continues to increase reaching a m axim um concentration o f 6679 pmol I"1
at 89°C before a slight decrease to 6100 pm ol I 1 at 96°C. A major decrease in acetate
subsequently occurs above 100°C (1710 pm ol I"1 at 102°C) which coincides with the H2
decrease.
Cation concentrations after 97 days. K concentrations show a slight increase with
temperature, increasing from 395 mg/1 at 12°C to 462 mg/1 at 102°C. Al concentrations
conversely, decrease with temperature from 1.2 mg/1 at 12°C to 0.8 mg/1 at 89°C, then
stabilising up to 102°C.
Fe concentrations increase exponentially w ith temperature from 0.04 mg/1 at 12°C to 6 . 8
700
600
500
400
300
200
100
0120100806040200
Temperature [ °C ]
mg/1 at 102°C (which is double the maximum labradorite concentration of 3.2 mg/1).
197

Chapter 6 Characteristics of Olivine, Hornblende, Labradorite and Silica
Fe is plotted against H 2 generation in Fig 6.19. This temperature profile is rather different
to that for H 2 .
Mn concentration also increases exponentially w ith temperature above 44°C,
increasing from 0.34 mg/1 at 44°C to 0.53 mg/1 at 102°C. Ti concentrations only increase
slightly with temperature from 0.08 mg/1 at 12°C to 0.17 mg/1 at 102°C.
Mg concentrations continuously decrease w ith increasing temperature, from 483
mg/1 at 12°C to 197 mg/1 at 77°C. After 77°C the rate o f decrease slows (this coincide
with slowing in rate o f sulphate removal and rapid increase in acetate). Mg decreases to
162 mg/1 at 102°C. Ca concentrations initially decrease from 129 mg/1 at 12°C to 8 8 mg/1
at 44°C. Subsequently increases w ith tem perature to a m axim um concentration o f 184
mg/1 at 102°C (the rate o f increase rises after 98°C. The silica profile is a very similar
profile to Fe (Fig 6.20). There is an initial decrease from 4.2 mg/1 at 12°C to 2 mg/1 at
44°C. Si then starts to increase exponentially w ith temperature to reach a maximum
concentration o f 20.1 mg/1 at 102°C.
25
20
15
10
5
0120100806040200
T em perature [ °C ]
Fig 6.20 Silica and iron concentrations. Silica: closed triangle. Fe: closed circle.
198

Chapter 6 Characteristics of Olivine, Hornblende, Labradorite and Silica
Similar to Fe, Si concentrations are elevated at zones o f high hydrogen concentrations
(Fig 6.20). But unlike H 2 , silica concentrations continue to increase with elevated
temperatures (Fig 6.21) as does Fe (Fig 6.19 & 6.20)
700
600
500
400
CO300
10 ' '
200
100
0100 12080600 20 40
T em pera tu re [ °C ]
Fig 6.21 Hydrogen concentration against porewater silica concentration. Silica, solid triangle: hydrogen, solid diamond.
P concentrations, fluctuates considerably w ith incubation temperatures. Initially
decreasing from 7 mg/1 at 12°C to 1.01 mg/1 at 44°C. Before increasing to 4.8 mg/1 and
4.4 mg./l at 77 and 89°C respectively and decreasing to 1.5 mg/1 at 96°C before reaching
a final concentration o f 2.3 mg/1 at 102°C.
199

f
Chapter 6 Characteristics of Olivine, Hornblende, Labradorite and Silica
6.6 AODC counts on silica incubation
c38
©oO)o
10
8
6 Maximum sulphate Removal — ►
4
Zone of sulphate removal
2
End of sulphate removal
oo 20 40 8060 100 120
Courtesy o f Falko Mathes Temperature! C]
Fig 6.22 AODC counts on silica thermal gradient incubation
AODC counts (all values are in log cell counts/m l) were conducted on the silica
incubation in order to analyze the effect o f tem perature on prokaryotic cell numbers.
Selected silica samples were counted after 97 days incubation. There seems to be two
rates o f cell decrease. Initially reduction in cell numbers is slow from 8.97 (9.33 x 10
cells/ml) at 6 °C to 8.28 (1.90 x 10⁸ cells/m l) at 77°C. Above 77°C cell decrease becomes
more rapid decreasing to 6.33 (2.13 x 10⁶ cells/ml) at 102°C. Interestingly sulphate
removal is inhibited above 77°C perhaps sulphate reducing bacteria and associated
prokaryotes are generally being inhibited by high temperature. In zone two 77-102°C it is
also noteworthy that temperature seems to be the dominant factor controlling cell
numbers as numbers continue to decline irrespective o f high amounts o f acetate and
hydrogen being produced in this temperature zone. This is also true for zone one below
77°C, this indicates that probably term inal oxidizing prokaryotes form only a small part
200

Chapter 6 Characteristics of Olivine, Hornblende, Labradorite and Silica
of the community. At 80°C and above, these constitute hyperthermophilic conditions,
fewer prokaryotes can grow at these tem peratures perhaps this is responsible for this
decrease, which continues with increasing temperature.
6.7 Discussion
Results from incubations conducted in this Chapter clearly show that, iron content o f the
mineral added has no effect on the am ounts o f hydrogen generated. This in turn affects
processes such as sulphate reduction, acetogenesis and methanogenesis, using hydrogen
or hydrogen derived products e.g. acetate as a substrate. This is best shown, after 3 days
incubation, pure silica mineral addition produced the highest quantity o f hydrogen (Table
6.4).
Table 6.4 Maximum H2, CH4 and acetate concentrations after 3 days
incubation (pmol I"1)
Sample SiC>2 wt% Hydrogen Methane Acetate
Olivine 41.82 812 1.9 1273
Hornblende 49.95 798 10.5 1304
Labradorite 52.5 1118 118 2658
Silica 1 0 0 1626 0.7 1266
Although silica addition produced the highest quantities o f hydrogen after 3 days,
labradorite far exceeds all other incubations in the production o f acetate (x2 over
hornblende the next highest) and m ethane ( x l l . 2 over hornblende the next highest in
terms o f methane also).
Table 6.5 Maximum concentrations at final sampling point (pmol I'1)
Sample Si0 2 wt% Days incubation Hydrogen Methane Acetate
Olivine 41.82 61 704 335 5841
Hornblende 49.95 61 720 282 6238
Labradorite 52.5 108 344 396 8757
Silica 1 0 0 97 638 1 2 0 6679

?
Chapter 6 Characteristics of Olivine, Hornblende, Labradorite and Silica
All incubations produced methane, however, silica produced less than all other1 3 *incubations and hence 5 C-CH4 isotope analysis was not possible. Isotope analysis o f the
remaining samples (Tables 6.1, 6.2 and 6.3) showed values distinct for acetoclastic
methanogenesis. Higher temperature incubations however, produced more depleted
values, which normally would be interpreted as being due to abiotic methane formation
(813C-CH4 > -5 0 % o ) . However it is noted (W hiticar, 1 9 9 9 ) that temperature does influence
the 813C-CH4 values, even for biogenic CH4, w ith KIE (Kinetic isotope effect) decreasing
with increasing temperature which is consistent with the findings presented here (Fig
6.23)
-42
-44
^ -46I ©3 -48©_3 (0> -50
oT c -52
-54
-5640 50 60 70 80 90
Temperature [ °C ]
Fig 6.23. 6 13C-CH4 data for all data in chapter 6 plotted
against temperature
Differences in the methane concentration temperature profile at final concentrations are
also noticeable with the highest amounts o f methane produced in the labradorite
incubation (Fig 6.5), labradorite also shows continuous CH 4 production from ~ 4 0 to 95°C
after 1 0 8 d , through the most intense Sulphate reduction zone, where H2 concentrations
202

r
J Chapter 6 Characteristics of Olivine, Hornblende, Labradorite and Silica
increase slightly, both indicating excess H 2 formation. This is in contrast to the olivine
and hornblende incubations, which have two distinct zones o f methanogenesis olivine 36-
74°C and 74 to 94°C with little to no m ethane in the transition zone 74°C and hornblende
33-71°C and 71-90°C a similar scenario o f little methane in the 71°C transition zone this
transition zone occurs close to zone o f maxim um sulphate removal. This does not occur
in the labradorite incubation however, com plete sulphate removal is achieved in this and
not achieved in olivine or hornblende
All final incubations presented show a similar profile o f rapid acetate increases
coupled to the slowing down o f sulphate removal rates. This could either mean that
sulphate reduction is being performed using acetate as a substrate (acetoclastic sulphate
reduction) or hydrogen is being utilised for sulphate reduction and once sulphate
reduction slows hydrogen is liberated for use by acetogens. Highest concentrations o f
acetate always occur in the zone o f highest hydrogen formation. Maximum Sulphate
reduction in all samples occurs in the same tem perature zone 60-70°C. However, again
labradorite seems slightly different, in that sulphate removal also occurs at higher
temperatures than the other incubations up to 94°C (inclusive) silica SO4 ' reduction
stops at ~80°C olivine and hornblende ~ 8 8 °C. This could however, also be the result o f
the slightly longer incubation time associated w ith the labradorite incubation 108 days as
opposed to 61 days for olivine and hornblende.
Pore water cation values were only available for labradorite and silica and show
some broadly similar trends. Iron concentrations exponentially increase with temperature
(Figs 6 . 8 & 6.16) but surprisingly the silica mineral addition produced double the amount
of final total iron concentration than labradorite. Si generally increased with temperature
(Figs 6.10 & 6.18) although for labradorite a dip occurs past approximately 85°C. Not
surprisingly the silica addition contained the most silica in pore water but not
substantially (Si 20.1 mg/1, labradorite 15 mg/1). Also overall Ca increased with
temperature in both and Mg decreased, w hilst there were slight increases in Al with
temperature, decreasing slightly in labradorite at high temperature.
In conclusion this chapter suggests that hydrogen generation is not reliant on Fe
concentrations and in fact could be a reaction-involving silica radials. Possibilities for
this type o f mechanism are discussed in detail in chapter 7.
203

I Chapter 7 Discussion
Chapter 7 Discussion
7.1 Introduction
The main aim o f this research project w as, a) to determ ine i f H 2 could be generated
from the addition o f m inerals to sedim ent slurry incubations, b) whether prokaryotes
are directly involved in this H 2 generation, c) the effect o f tem perature on this process
and biogenic & abiogenic interactions, d) the effect o f m ineral composition. The
minerals used in this study (Table 3.1) w ere all natural rock m inerals from outcrop
sites, no synthesised or purified m inerals w ere used, hence com position (Table 3.2)
may be different to standard, this w as in order to try and accurately represent in situ
mineral composition. H ydrogen is one o f the m ost energetically favourable substrates
for deep subsurface prokaryotes (M orita, 1999; A m end and Shock, 2001). If
additional m echanisms o f hydrogen generation could be found, and if this was
enhanced by prokaryotic activity, th is w ould change the current understanding o f
potential energy sources in the subsurface. Substantial num bers o f prokaryotes are
present at depth (Parkes et al., 1994; Schippers et al., 2005; Lipp et al., 2008; Roussel
et al., 2008) due to nutrient lim itation and the recalcitrance o f sedim entary organic
matter this is surprising, and suggests that, our know ledge o f energy sources
sustaining these com m unities is incom plete. Processes that provide energy and
reducing power for subsurface, anaerobic, chem oautotrophic m icrobial com munities
such as H2, have thus far been thought o f as being derived solely from abiotic activity.
These include; the oxidation o f Fe2+ containing m inerals (Stevens and M cKinley,
1995), serpentinization type reactions (Sleep et al., 2004), the decom position o f
alkanes, which are catalysed by com pounds w ithin certain iron m inerals (Seewald,
2001), radiolytic decom position o f w ater (Lin et al., 2002) and the formation o f pyrite
from H2S and FeS (D robner et al., 1990). All have been hypothesised to produce
enough H 2 to support m icrobial m etabolism s, and not to have any direct prokaryotic
involvement. The arom atization o f organic m atter (Parkes et al., 2007) ,however, is
one exception, as it was argued that prokaryotes are involved in this H 2 producing
reaction at elevated tem perature. This could be an indication that prokaryotes m ay be
involved in other/sim ilar H 2 producing reactions. The m ajority o f abiotic H2
204

rChapter 7 Discussion
formation processes occur at extrem ely high tem peratures, e.g. serpentinization and
decomposition o f alkanes / carboxylic acids (> 300°C), w hich is substantially above
the upper temperature for prokaryotic life (~113-121°C , (Kashefi and Lovley, 2003).
In these circumstances H 2 is then thought to m igrate to cooler zones, where it can be
utilised for microbial activity.
7.2. Concentrations o f hydrogen generated, temperature effects and abiogenic/biogenic reactions.
During the course o f this study, it w as show n (Chapter 3) that specific minerals
incubated at 60°C, produced a peak o f hydrogen over the course o f the first 3 days o f
incubation (e.g. hornblende Fig 3.1, ilm enite Fig.3.2 and olivine Fig 3.3). H 2 utilising
prokaryotic processes such as, acetogenesis, m ethanogenesis and sulphate reduction
all then proceeded rapidly, w ith hydrogen concentrations becom ing undetectable after
3 days. Since H2 is a know substrate for all 3 processes it is reasonable to assum e that
microbial activity is responsible for the H 2 rem oval. O ther processes that could be
responsible for removal o f H 2 include Fe(III) oxidation and some weathering
processes. In the olivine and olivine bom bs incubation (Fig 3.3 and 3.4) H 2
concentrations increased again after ~85 days incubation this coincides with the total
removal o f sulphate, this indicates that H 2 is probably being used as a substrate for
sulphate reduction, once sulphate reduction stops this enables H2 to accumulate. It
also shows that hydrogen generation is sustained throughout the incubation and is not
confined to the early stages, ju s t on initial m ineral addition, unlike previous
abiological experiments (Stevens and M cK inley, 2000). N ot all m inerals however,
produced H 2 to the same extent. W hile others produced no detectable hydrogen, this
does not mean H 2 w asn 't produced, as H 2 can be rapidly consumed for various
metabolic processes as m entioned above (hem atite Fig 3.6, pyrite Fig 3.7, pyrrhotite
Fig 3.8, basalt Fig 3.9). S terile controls produced no H 2 but also had no detectable
sulphate reduction, m ethanogenesis or acetogenesis (Fig 3.10 a+b). Table 7.1 shows
the highest detected am ounts o f hydrogen during the 60°C incubations conducted in
Chapter 3. Olivine and olivine bom bs produced the highest am ounts (9137 and 8898
pmol f 1).
205

fchapter 7 Discussion
The detection o f varying am ounts o f H 2 indicates that H 2 could be produced
from mineral addition, but also that m ineral type and com position were important.
Hydrogen generation appears to be a rapid process, w ith high concentrations
generated during the first 24 hours o f incubation. This is far m ore rapid than some
other suggested processes such as rad io ly tic H 2 generation, w here in the
Witwatersrand Basin in south A frica rates o f generation are estim ated at -In M /y ea r
(Lippmann et al., 2003). But it is sim ilar to abiotic experim ents conducted with
varying basalt m inerals (labradorite, forsterite) w here H 2 also increased rapidly over
die first 3 days however, concentrations w ere m uch low er (-10 -20 nM /g sample) and
the pH was acidic (pH 6 ) (Stevens and M cK inley, 2000). The lack o f H 2 generation in
our study during the initial basalt incubation at pH o f 7.6, over the first 3 days (Table
7.1) correlates with other experim ents conducted on basalts at pH 8 (Anderson et al.,
1998) which is approxim ately the pH in situ in the C olum bia river basin. Lack o f
hydrogen generation at environm entally relevant pH for basaltic aquifers was one o f
die major criticisms o f previous studies w ith production only occurring under acidic
conditions (pH 5-6). O ur study is conducted at pH 7.6, for in situ conditions in marine
sediments which rarely are outside pH 7.0 to 8.2 (Ben-Y aakov, 1973) w hich makes it
more biologically relevant to environm ental conditions.
Table 7.1 Maximum hydrogen concentrations, during 60°C incubations from
Chapter 3
Sample H 2 pmol r 1 Time
O livine 9137 24 hours
O livine bom bs 8898 24 hours
H ornblende 8451 24 hours
Labradorite 2560 24 hours
Ilm enite 1097 24 hours
Pyrite 0 NA
Pyrrhotite 0 N A
H em atite 0 NA
Basalt 0 NA
NA= not applicable since no H2 was detectable
206

■Chapter 7 Discussion
1 In Chapters 4,5 and 6 the tem perature range o f incubations w ere expanded. In
Jthese thermal gradient incubations, high concentrations o f H 2 were generated at
I elevated tem peratures (>85°C). A gain m axim um H 2 concentrations varied w ith
I mineral type (Table 7.2).
I Table 7.2 Maximum concentration of hydrogen generated after 3 days using the
I thermal gradient incubation system (0-105°C )
Sample H2 pmol r 1 Temperature [°C]
H em atite 1633 92
Silica 1626 96
Labradorite 1118 1 0 0
Pyrite 820 97
O livine 812 94
H ornblende 798 90
Basalt 766 92
Ilm enite 632 95
N o m ineral 3 33
M agnetite 0 Na
Basalt Sterile 0 Na
NA= not applicable since no H 2 was detectable
For the therm al gradient incubation in Table 7.2. the results of H 2 generations
are shown after 3 days, this is for 2 reasons firstly, H2 concentrations w ere at a
maximum after 3 days and subsequent values are a balance between formation and
utilisation. Secondly although all experim ents w ere analysed after 3 days, the final
sampling points w ere no t conducted after exactly the sam e length o f incubation.
Hence the initial 3 day sam pling point gives a m ore com parable reflection of potential
for H2 generation. Final concentrations for H 2 a re given in Table 7.4 for comparison.
H2 generation (Table 7.2) w as highest in th e hem atite incubation with similar
concentrations found in the silica incubation. O nly com paratively insignificant
amounts o f H 2 w ere detected in the incubation w ithout mineral addition (m ax o f 3
pmol f 1), and no H 2 was detected in the sterile control or in the m agnetite incubation.
207

■Chapter 7 Discussion
^Crushing o f minerals before addition creating “fresh” reactive surfaces was found to
jspeed up reaction rates e.g. w ith hornblende, fresh grinding increased m ethanogenesis
|(xlO) and C 0 2 generation (x7) (Fig 3.13). H 2 production in Table 7.2 occurs at
I elevated temperatures 90-100°C only trace am ounts o f H 2 w ere produced below this
(no mineral, 3 pm ol 1 ), this indicates that elevated tem perature stimulates H2
; production and m ay increase form ation for som e m inerals e.g. H em atite and Pyrite, as
suggested by (Stevens and M cK inley, 2000).
Nowhere during the course o f th is study w as the im pact o f prokaryotes on
hydrogen generation shown m ore clearly than in the basalt ram ping experim ent (Figs
4.25, 4.26). Throughout the incubation the b io tic experim ent consistently produced
fer more H2 through all bio tic tem peratures (85 -115°C), for exam ple at 95°C the
biotic experiment has a H 2 concentration o f 14968 pm ol I '1, where as the sterile
control has no detectable hydrogen. This w as after 40 days o f incubation and was
similar to the 60°C experim ent m entioned above (olivine and olivine bom bs) that long
term H2 generation in the presence o f prokaryotes is independent o f initial grinding
and production o f fresh surfaces, perhaps a form o f m icrobial w eathering is
maintaining reactive surfaces.
Most interesting o f all is the difference in H 2 concentrations occurring in the
abiotic zone (> 121 °C). The biotic incubation previously experiencing prokaryotic
activity produced H 2 concentrations (x34) greater than the sterile control (Figs 4.25
and 4.26) after 3 days at 155°C. Thus it seem s that not only does prokaryotic mineral
interaction provide substrates during sequential heating at biotic tem peratures, but
also that previous exposure to prokaryotic activ ity has a m ajor effects on subsequent
reactions at abiotic tem peratures. It has already been calculated that high tem perature
abiotically driven reactions could provide substrates for m icrobial activity in
sediments at depth, which then m igrate upw ard, fuelling the base o f the m icrobial
biosphere (Horsfield et al., 2006). The fact that previous exposure to prokaryotes has
such a major effect has clear im plications for these kinds o f calculations and
implications for sedim ent diagenesis w ith increasing tem perature/depth o f sediment.
This result also has significance for all hydrous pyrolysis type experiments used to
estimate high tem perature therm ogenic transform ations (Lewan and Fisher, 1994).
Hydrous pyrolysis experim ents use tem perature as a substitute for time/depth,
in order to provide laboratory sim ulation o f the catagenesis o f organic m atter in
208

Chapter 7 Discussion
sediments and to provide an understanding o f the processes involved in petroleum
generation/organic acid generation. These experim ents involve sediment heating to
high temperatures ~200-500°C and then m easuring the amounts o f products liberated
e.g. low m olecular w eight organic acids (Barth and Bjorlykke, 1993; Dias et al.,
2002). For example in (Barth and Bjorlykke, 1993) samples were incubated between
200-3 50°C for 72 hours after which sam ples w ere analysed for acetate, formate,1 'X
propionate and isotopic 8 C analysis was performed. In (Kharaka et al., 1993)
samples were incubated betw een 200-300°C for between 98-23 8 d hours and again
samples were analysed for acetate form ate propionate, etc.
Results presented here indicate that concentrations o f acetate and CO2 , the
primary compounds analysed in the m ajority o f studies, are significantly greater (Figs
4.25, 4.26) in sedim ents previously exposed to prokaryotic activity. Thus it may be
that experiments incubated only at tem peratures above the biotic temperature zone
may not accurately reflect im portant geochem ical changes with sediment depth or the
amounts o f substrates that could be generated as a potential energy sources in the
deep subsurface.
Experiments reported here show clearly that mineral H2 generation, a)
involves prokaryotic m ediated or catalysed reactions, and hence is dependent on the
presence o f sedim entary prokaryotes, b) it is influenced by the composition o f the
mineral c) enhanced by elevated tem peratures, d) is initially substantially increased by
the creation o f freshly ground surfaces, e) is m aintained in the presence o f prokaryotic
activity, possibly through processes sim ilar to m icrobial weathering.
7.3 Mineral composition and relationship to H 2 generation
Minerals containing a range o f iron and silica were used in this project, from 99 wt%
Fe (magnetite) to 100% Si quartz sand. The rationale behind the use o f such a range
o f minerals (Table 3.2) was two fold, 1) to com pare our biotic experiments with
previously published abiotic experim ents which used a range o f iron minerals
(Anderson et al., 1998; Stevens and M cKinley, 2000), 2) previously hypothesised
mechanisms for H 2 generation from m inerals involved the oxidation o f ferrous in the
mineral com position (Stevens and M cK inley, 1995). A range o f minerals with
different Fe concentrations and oxidation states, including zero iron content, were
used in order to test the validity o f this assertion.
209

Chapter 7 Discussion
Table 7.3 Maximum hydrogen concentrations and relationship with Fe and Si,
after 3 days incubation in the thermal gradient system (0-100°C) (see table 7.2
for temperature).
Sample h 2
pmol' 1
F e 2 0 3 w t% S i0 2 w t%
H em atite 1633 54.12 20.53
Silica 1626 0 1 0 0
Labradorite 1118 0.62 52.5
Pyrite 820 46.6* 0
O livine 812 7.9 41.82
H ornblende 798 7.87 49.9
Basalt 766 1 2 . 6 47.5
Ilm enite 632 50.75 1.06
M agnetite 0 99.49 2.57
No m ineral 0 0 0
Basalt Sterile 0 1 2 . 6 47.5
control
*Theoretical value for pyrite,
The maximum H 2 concentration detected after 3 days incubation is shown in
Table 7.3, also shown is the Fe and Si content for each mineral. It is clear that Fe
content o f the mineral was not positively related to initial hydrogen generation. As the
mineral containing the m ost Fe (m agnetite) produced no detectable hydrogen this
agrees with previous findings (Stevens and M cK inley, 2000). However, this is in
contrast to (Parkes et al., 2007) w here m agnetite incubation at 60°C was found to
produce low am ounts o f H 2 (~350 nM after 55 days). Perhaps in the experiments
reported here some low am ounts o f H 2 are being produced but the active microbial
community present consum es it before it reaches detectable concentrations. If a
comparison is m ade by addition o f the concentration o f various potential
products/uses o f H2, such as CH4, acetate form ation and sulphate reduction. The
difference between no m ineral addition and hem atite is 23% and basalt 16% both
producing more overall product than the m ineral only addition. Even more interesting
210

Chapter 7 Discussion
is the fact that the addition o f pure silica (containing no Fe, Table 3.2) produced
almost the maximum hydrogen concentrations detected.
Freshly ground basalt to w hich w as added anoxic mineral salt solution
incubated in the tem perature zone o f m axim um H 2 generation (~70-100°C) produced
far less hydrogen than in the presence o f sedim entary prokaryotes (Fig 4.21)
(maximum o f ~10 pm ol F1). At 73°C H 2 concentrations (1 pmol I’1) are similar to
incubations conducted abiotically at 60°C (0.6 pm ol F1) in previously published
experiments which w ere trying to m odel hydrogen in groundw ater in the basaltic
system o f the Colum bia river basin (Stevens and M cK inley, 2000). These experiments
also involved “fresh” grinding o f m inerals. In com parison to the experiments with
prokaryotes and sedim ent slurries presented in this study, these hydrogen
concentrations are insignificant. A ccording to (Stevens and McKinley, 2000)
however, even these low concentrations w ould be enough to support a microbial
community. Although this w as highly disputed (Anderson et al., 1998) due to the
composition o f the in situ Colum bia river aquifer, prokaryotic community being
heterotrophic not autotrophic and a great reduction o f hydrogen generation over an
extended incubation after 12.5 days.
600
500 -
8 400 -
| 300 -
Heads? flushed with N3
eceout
? 200 -
100 -
500 600400300100 2000
Incubation time (hours)
Fig 7.1 Production of H2 over time by Snake River Plain basalt when incubated with ground
water collected from the Snake River aquifer or phosphate buffers (oplus , ground water with
basalt; +, ground water alone; triangle , pH 6 phosphate buffer with basalt; downtriangle , pH 8
phosphate buffer with basalt; square , basalt alone; circle , buffer alone) from (Anderson et al.,
1998).
211

Chapter 7 Discussion
W hile there is no relationship betw een iron com position and hydrogen
generation, there seem s to be a relationship betw een silica concentrations in
porewater and hydrogen generation. A com parison o f the initial 3 day hydrogen
concentrations and final m axim um Si concentrations reveals a correlation (Fig 7.2).
The rationale for using the initial 3-day hydrogen concentrations as opposed to the
final concentration is as follows. Initial H 2 generation is quite rapid and gives a good
indication o f mineral potential for hydrogen generation. The final concentration o f H2
is affected by various processes w hich use H 2 (acetogenesis, methanogenesis,
sulphate reduction) this and the varying incubation tim es used, effects the measured
hydrogen concentration, and hence does not necessarily give a good indication o f the
total amount o f H 2 produced by a m ineral over time. H 2 generation is a continuing
processes throughout the course o f the incubation (e.g. as seen in the ramping
experiment m entioned above F ig 4.25, therefore, i f interactions with Si was
responsible for H2, production the longer the incubation is left the more likely a build
up o f a substrate such as Si
25
20
O)E
15
w
10
I
5400 600 800 1000 1200 1400 1600 1800
H2 nmol I' 1
Fig 7.2 Maximum hydrogen concentrations after 3 days incubation, plotted against final Si concentrations (Pore water) in the thermal gradient experiments.
! | | | —i ; |—Hematite •
Silica ^
Labradorite^'"/
ss
s/
//
Basalt , • * o liv ine ✓✓✓
1 menite •
______ i______ i______ i---------- 1----------1----------1—
212

Chapter 7 Discussion
A correlation coefficient o f 0.97 suggests there is a strong relationship (significant at
the 0.01 probability level) betw een initial H 2 form ation and final concentrations o f Si
in porewater. M icrobes have previously been found to influence weathering o f
minerals, particularly silicates (H iebert and Bennett, 1992). Prokaryotes can alter
silicate solubility by directly attaching to the mineral, this affects the mineral-water
equilibria/ reaction dynam ics at the point o f contact (Liermann et al., 2000; Bennett et
al., 2001). A m icroenvironm ent can form around the mineral that can be distinct from
the bulk solution. These can be highly reactive in respect to mineral surfaces (Fisk et
al., 1998) and dissolution o f Si can be speeded up in by the production o f excess
protons, addition o f organic ligands, hydroxyls and extracellular polysaccharides
(Malinovskaya et al., 1990; W elch et al., 1999). Perhaps there is a link between the
reactivity o f m ineral surfaces, hydrogen production and silica dissolution.
W hile it is clear that the Fe concentration in the mineral is not directly related
to H2 generation, this does not m ean that Fe does not play a more subtle or indirect
role in hydrogen generation as both m axim um H 2 and soluble Fe concentrations
detected in porewater, often co-occurred at elevated temperatures (>60°C, e.g. Fig
6.19). In addition, the silica mineral incubation had m axim um concentrations o f Fe in
pore water that was higher (6 . 8 mg/1, Fig 6.16), than several o f the Fe containing
minerals, e.g. hem atite (4.7 mg/1, Fig 5.19) and ilm enite (2.7 mg/1, Fig 5.12) this Fe is
presumably coming from the sedim ent itself. Fe m ay play perhaps an indirect role in
this process e.g. electron shuttling.
Another possible explanation for increasing concentrations o f Fe is,
hyperthermophilic m icro-organism s closely related to the species found at high
temperature in our incubations, such as Thermococcus and Archaeolglobus, which
can use Fe3+ as an electron acceptor, w ith H 2 or organic substrates, producing soluble
ferrous. In addition, some prokaryotes can transfer electrons to humic substances and
other extracellular quinines, given the presence o f H 2 as an electron donor (Lovley et
al., 2000). The ability to use Fe3+ is highly conserved in hyperthermophiles and has
been used as a means o f isolation and characterisation o f previously unculturable
species (Kashefi and Lovley, 2000; Kashefi et al., 2002a; Kashefi et al., 2002b). Thus
reduction o f Fe(III) can proceed w ithout direct contact between the Fe(III) oxide and
prokaryote. Coupled to this prelim inary data (not shown) showed that the majority o f
the Fe in pore w ater in the basalt and ilm enite incubation (>95%) at high temperature
213

Chapter 7 Discussion
was Fe(II) (ferrozine determ ination C hap ter 2). It is possible that such reactions may
be occurring with some F e com ing from th e sediment. M ost o f the mineral additions
with the exception of silica have Fe, and there a difference in pore water
concentrations, the m axim um F e in th e no m ineral addition is 2.5 mg/1 (Fig 4.4) while
pyrite is 8 mg/1 (Fig 5.4) and hem atite is 4 .3 mg/1 (Fig 5.19). This seems to indicated
that there is Fe being added to the pore w ater from the mineral addition. Acetate
oxidation coupled to Fe3+ reduction at h igh tem peratures could also be occurring,
considering the relatively high acetate concentrations in all the thermal gradient
incubations at elevated tem peratures ~ 6 m m ol I '1. Acetate concentrations in the pyrite
and hematite incubation w ere high 9999 and 8503 pttiol l'1.
Acetate oxidation coupled to Fe(III) reduction (Tor et al., 2001) produces Fe(II) and
HCO 3 ' according to the fo llow ing equation
Acetate + 8 Fe(III) + 4 H 20 -» 2 H C 0 3 + 8 Fe(II) + 9H + E q 7.1
prokaryotes such as Ferroglobus placidus a re known to catalyse this reaction, and this
is closely related to clone 89-il-69 (F ig 5.27) present in the ilm enite slurry at 89°C.
7.4 Comparison to H 2 concentrations fo u n d in other experiments andenvironments
Concentrations o f H2 found in ground w ater from previous studies range from
nM levels (Lovley and Goodwin, 1988) to higher concentrations found at the Lidy
hotsprings (0.011-0.015 pM , (C hapelle et a l , 2002) an d Yellowstone hot springs and
(0.002-0.325 pM, (Spear et a l , 2005) and higher still in the Columbia river basin
(Stevens and M cKinley, 1995). In slurry incubations previously conducted with
magnetite mineral addition, w hich had a sim ilar experimental set up to this study,
concentrations o f H 2 in headspace with m agnetite w ere a maximum o f ~350 nM,
without mineral addition maximum concentrations Wefe ~15 nM (Parkes et a l , 2007).
The amounts o f hydrogen generated in our incubations are higher than those found in
these previous incubations (632-1633 pm ol I '1, Table 7.2). However, the previous
results mentioned with the exception of (Parkes et al , 2007), H 2 concentrations are
values for H 2 dissolved in ground w aters , concentrations in this study are for
headspace above the sedim ent/m ineral slurry. H 2 *s poorly soluble in water, (~13 mg
214

Chapter 7 Discussion
gas per 1 Kg o f w ater at 50°C (6500 pM ) w ith solubility decreasing with temperature,
this however is still significant in term s o f prokaryotic m etabolism , partitioning o f H2
to the headspace w ould effectively rem ove product from the reaction system.
Previous experiments found that the difference in incubations with and without
headspace was, approxim ately tw ice the am ount o f dissolved H 2 was found in
samples when incubated w ith headspace as w ithout (Stevens and McKinley, 2000).
Build up o f product appeared to inhibit the H 2 generating reaction, and removal to the
headspace allowed the reaction to proceed, m ore efficiently, thus giving a greater
yield o f H2. In the environm ent the largest concentrations o f H 2 are detected at
oceanic hydrotherm al vent sites such as the Rainbow Field (12-16 mM, (Charlou et
al., 2002) and the Lost C ity (1-15 m M / kg, (K elley et al., 2005) W here
serpentinization type reactions (Eq 7.1) are thought to dom inate (Sleep et al., 2004)
3Fe2 S i0 4 + 2H 20 3SiQ 2 + 2Fe3 Q 4 + 2H 2 (E q 7.2)
At the Kairei hydrotherm al field (Central Indian ridge), H 2 concentrations emitting
from hydrothermal fluids w ere ~2.5 m M , this is the site o f a proposed HyperSlime
community (Takai et al., 2004). H ere H 2 is again considered to be from
serpentinization reactions. High concentrations o f H 2 (~2-8 mM ) were formed in the
absence o f mafic and ultram afic m inerals, at the W hitw atersrand site in South Africa
(Lollar et al., 2007), an alternative m echanism o f radiolytic decom position o f water
producing H 2 (Lin et al., 2002) was suggested as the source. This occurs, when the
decay o f radioactive elem ents ( e.g Th and U) dissociates w ater into H«, OH», H2,
H2 0 2 and H+ (Lin et al., 2005). H 2 concentrations in deep hot subsurface sediments
have also been found to be elevated, recovered during oceanic drilling in (Parkes et
al., 2007) IODP leg 190 site 1173 (nanki trough) , at ~630 mbsf, H2 was ~8200 ppm
(~100°C). Anaerobic respiration in the subsurface also plays a role in maintaining low
hydrogen concentrations. H 2 is an excellent electron donor and used in many
microbial metabolisms. V arying bacterial species can utilise H 2 at differing partial
pressures (Lupton and Zeikus, 1984) leading to the ability to predict the predominant
terminal electron accepting reactions in sedim ents by the H 2 concentration (Lovley
and Goodwin, 1988). Fe(III) reducers utilise H 2 at a lower partial pressure than
sulphate reducers w hich in turn can utilise H 2 at a low er level than methanogens,
215

Chapter 7 Discussion
leading to different H 2 concentrations depending on the process dominating (Lovley
et al., 1994). Hence sulphate reduction and m ethanogenesis tend not to occur
simultaneously, sulphate reducers out com pete m ethanogens (Kristjansson et al.,
1982) until H 2 concentrations are sufficiently high enough, (through the depletion o f a
substrate such as SO4 ) to allow utilisation by m ethanogens the approximate Ks
values were ~1 pM for sulphate reducers and 6 . 6 pM for methanogens (Kristjansson
et al., 1982). V arious m icrobial processes lim it the availability o f H 2 thus the
detectable H 2 m ay not be the am ount generated in the subsurface but rather the excess
between production and consum ption, at high H 2 concentrations certain syntrophic
reactions are no longer therm odynam ically viable.
7.5 H 2 generation and effect on acetogenesis
It is shown in Table 7.4 that overall m inerals generating the highest initial amount o f
H2 produce the highest final concentration o f acetate. In Table 7.4 minerals are
ordered from production o f highest initial acetate concentrations. The H2
concentrations shown the Table 7.4 is the final H 2 concentration, which is the balance
between consumption and production. Through the use o f specific inhibition
experiments acetate w as found to be have a substantial contribution to both
methanogenesis (Fig 5.15, 37.1% ) and sulphate reduction (Fig 5.14, 25.4%). This also
indicated that H 2 production is not ju s t a process occurring at the initial stages o f
incubation, but continues throughout the w hole incubation period up to and exceeding
100 days in the case o f Hem atite, Labradorite and Pyrite in addition, long term H2
formation is dependent on the presence o f m inerals as with minerals H 2 is
undetectable (Table 7.4). Fig 7.3 shows a negative relationship between acetate and
hydrogen for samples in the therm al gradient w hen acetate concentrations are above
6000 pmol I '1. There is a general trend indicated by the line o f decreasing H2 with
increasing acetate this perhaps indicates consum ption, through H2 /C 0 2 acetogenesis.
The exception being m agnetite w here no H2, is detected perhaps H 2 production is too
low and is consumed im m ediately by other prokaryotic activity preferentially, such as
methanogenesis, which m ay lim it acetate production and also m ake H2 undetectable.
This is true also for no m ineral and sterile control.
216

Chapter 7 Discussion
Table 7.4 maximum acetate and hydrogen concentrations with temperature
detected at the final sampling point of thermal gradient experiment.
Sample H 2 pmol r 1 Acetate
pmol r 1
Temperature [°C] Days
Hematite 271 9999 92 1 0 0
Labradorite 344 8757 87 108
Pyrite 525 8503 97 1 1 0
Basalt 300 7117 98 83
Ilmenite 480 6793 95 83
Silica 638 6679 89 97
Hornblende 720 6238 97 61
Olivine 704 5841 94 61
M agnetite 0 3757 71 92
No mineral 0 3750 71 93
Sterile* 0 2401 1 0 0 0
* Basalt used in sterile control
800
Line indicating; a negative relationship be tween hydrogen and acetate production
700
600
500
400
300
200
100
01000080006000400020000
Acetate pmol I*1
Fig 7.3 Final hydrogen concentration plotted against final acetate concentration using data from table 7.4 thermal gradient incubations
217

Chapter 7 Discussion
High acetate formation occurs at elevated tem peratures >89°C similar to H2
concentrations (e.g. Figs 5.15, 5.17). H em atite produced the highest initial
concentration o f H 2 (Table 7.2), w hile the incubation w ithout mineral addition and the
magnetite incubation had the lowest. This is consistent w ith maximum acetate
concentrations (Table 7.4), w hich is not surprising as acetate can be formed by
homoacetogens from H 2 (Eq 7.2). The sterile control produces approximate 24% as
much acetate as the m axim um concentration found in the hem atite incubation but did
not produce initial H2. This m ay be due to the sterilisation technique which was triple
autoclaving the sedim ent at 121 °C, as heating sedim ent slurries can produce acetate
even without prokaryotes (Cooles et al., 1987; Parkes et al., 2007). However in the
absence o f additional active acetogenesis in the sterile control acetate concentrations
are lower than all other TG experim ents, despite the absence o f methanogenesis and
sulphate reduction, rem oving acetate as in b iotic experim ents. A bove 100°C acetate
concentrations drop in all incubations (e.g F ig 5.16 hem atite Fig 6.14 silica). This is
linked to the decrease in H 2 concentrations above 100°C and hence reduction in
autotrophic acetogenesis. A cetogens m ay also start to becom e directly inhibited by
the high temperatures. The acetogen M oorella thermoacetica can grow up to 65°C
(Drake and Daniel, 2004). Certain Archaeoglobus species e.g. Archaeoglobus fulgidus
can also produce acetate through ferm entation ( ~85°C).
4H 2 + 2 H C 0 3' + H+ Acetate* + 4H 20 AG°' -104 kj/reaction (Eq 7.3)
Also quite interesting is the initial acetate concentration, which builds up
rapidly in the 60°C slurry incubations (C hapter 3) as acetate can be used as a substrate
for both m ethanogenesis and sulphate reduction. For exam ple after 2 days incubation
ilmenite slurries (Fig 3.2) reach 3411 pm ol F 1 and labradorite 2655 pmol 1 1 (Fig 3.5).
All Chapter 3 incubations w ith the exception o f pyrite and pyrrohotite (Figs 3.7 and
3.8 -2 to 5 pmol I*1) have initial concentrations > 500 pm ol F1. Previous experiments
heating coastal near-surface sedim ent slurries, but w ithout the addition o f minerals
(Wellsbury et al., 1997) also found high rates o f acetate build up, with concentrations
o f -3 .5 mmol F 1 over 7 days at 60°C. Therm al gradient experiments also have
elevated acetate concentrations at 60°C over the first 3 days (e.g. Figs 5.16, 5.22).
After which acetate is probably utilised for sulphate reduction and methane formation,
218

Chapter 7 Discussion
as concentrations decrease and sulphate reduction and m ethane formation begins,
inhibtion experiments (Fig 3.14, 3.15) indicated that acetate is a substrate in both.
Acetate has been found to be key substrate in m any anaerobic sedimentary
environments due to it use in sulphate reduction w hich is the dominant terminal
oxidising process (Jorgensen, 1982; Parkes et al., 1989). G reater than 60% o f sulphate
reduction in marine sedim ents is thought to involve acetate oxidation (W infrey and
Ward, 1983). All therm al gradient experim ents tend to have low concentrations o f
acetate in the zone o f m axim um sulphate reduction ~ 60-70°C, for example, pyrite
(Fig 5.7/5.8 ), does not have high acetate at 60°C, concentrations o f acetate only occur
from 78°C when sulphate rem oval reduces. This is m ost likely due to the rapid use o f
acetate for SO4 ' reduction, Eq 7.3
Acetate" + SO 4 2" —» 2 H C 0 3 * + HS" AG°’ = -47 .6 kj/reaction Eq 7.4
W hen SO4 ’ is in excess SRBs, w hich can utilise acetate at a lower concentration
making it undetectable (Schonheit et al., 1982). Pyrite has a higher initial start
concentration o f sulphate. A lthough com plete sulphate rem oval did not occur unlike
other slurry incubations, the concentration o f SO 4 " rem oved was greater than any
other sample (Table 7.6). A cetate appears also be key m etabolite in our system with
specific inhibition experim ents for m ethane (Fig 3.15) and sulphate reduction (Fig
3.14) (25.4%), dem onstrating acetate to be a m ajor substrate for both. Methane
isotope values also indicate the predom inant m ethanogen pathw ay to be acetoclastic
(Fig 7.3). Incubations that do not produce detectable H 2 , which are magnetite and
sediment only incubation (Table 7.4) have acetate m axim um s ~ 20°C lower than all
other incubations this shows that possibly the m echanism for H 2 generation may
involve the production o f acetate w hich can be used as a substrate for methane
production, as H 2 can itself. This does not seem to effect sulphate reduction rates
(Table 7.6) however the tem perature range for m ethanogenesis seems to be effected
as high tem perature CH 4 is not detectable (Table 7.5), in the both samples with no H2
production. This is m ost likely a result o f substrate lim itation at higher temperatures.
219

Chapter 7 Discussion
7.6 H 2 generation effect on methanogenesis
Concentrations o f m ethane and the tem perature ranges o f m ethane production varied
depending on the m ineral used during incubation. M axim um m ethane concentrations
occur at a higher tem perature, in sam ples that produced detectable amounts hydrogen
at elevated tem peratures (T able 7.5)
Table 7.5 Maximum methane concentrations with temperature detected at
during final incubation point in thermal gradient experiments.
Sample CH4 pmol r 1
max final
Temp [ °C ] Zones
H em atite 123 73 2 (47-66)
(66-89)
Silica 1 2 0 64 2(32-51)
(57-70)
Labradorite 396 94 1 (42-94)
Pyrite 443 90 1 (39-97)
O livine 335 87 2 (42-74)
(74-94)
H ornblende 282 84 2(33-71)
(71-90)
Basalt 159 6 6 2 (35-60)
(60-80)
Ilm enite 230 89 2 (37-69)
(82-95)
M agnetite 536 39 2 (13-33)
(33-58)
No m ineral 531 41 2 (6-35)
(35-60)
Sterile* 0 0 0
* Basalt mineral usedThe m ethane results in Table 7.5 are arranged in order o f decreasing
concentration o f H 2 detected during the first sam pling point after 3 days (Table 7.2),
which has previously been used as an index for H 2 generating potential. Maximum
220

Chapter 7 Discussion
CH4 does not directly correspond w ith 3 day H 2 m axim um . M aximum methane
concentrations for m agnetite and no m ineral incubation, which have no detectable 3
day H 2 , occurred at 39°C and 41 °C respectively. W hile those producing hydrogen
after 3 days had m axim um m ethane concentrations produced from 6 6 to 94°C.13Unfortunately no 6 C values w ere obtainable for either incubation as they were some
of the first incubations done and storage o f gas sam ples for subsequent analysis was
not successfully.
Tem perature range for m ethanogenesis occurred w ith 2 zones in m ost samples
(Table 7.5). Certain sam ples such as Pyrite (Fig 5.2) had continuous methane
produced from ~35 to 95°C (Fig 5.8). W hich seem s to be a jo in ing together o f the 2
methanogenic zones that occur in som e o f the other m ineral slurries as there is a dip
in CH 4 concentration betw een ~75-85°C. O ne o f the reasons for this dip could be a
stimulation o f anaerobic m ethane oxidation (AOM ), which occurs through a
syntrophic relationship betw een A N M E archaea and sulphate reducers. This dip
occurs when sulphate reduction starts to slow and H 2 levels are still low, if CH 4 is
high and SO 4 2" is dropping at the start o f this dip in CH 4 , then these are conditions
mimicking the S0 4 2 "/CH4 transition zone w here AOM is maximal. Or conversely the
CH4 profile m ay reflect 2 clear populations o f m ethanogens (e.g.
thermophilic/hyperthermophilic) Isotopic 5 1 3C-CH 4 values are clearly influenced by
temperature (Fig 7.4).-40
-45Pyrite 90°C and Labradorite 87°C.
-50
• •V-55
-60
-65
Basalt
-70908070605040
Temperature [ °C ]Fig 7.4. 8 13C-CH4 values for all thermal gradient experiments plotted against temperature.
221

Chapter 7 Discussion
The correlation coefficient is 0.89 between temperature and 8 13C-CH4 values
and is highly significant with a 0.01 probability level. This raises the possibility of a
relationship between the two. Several of these samples (e.g. 90°C pyrite CH4 at -
42.8%o and 87°C labradorite CH4 at -42.8%o Table 5.2 and 6.3) occur outside of the
values normally considered for biotic methane production (Whiticar, 1999) and could
in another context be misidentified as being abiotic CH4. This may call into question
the determination of methane as abiotic based o n 8 13C-CH4 values, of samples
previously analysed, such as, from the Guaymas basin (Teske et al., 2002) and various
mining sites from the Canadian and Fennoscandenavian shields (Lollar et al., 1993).
The majority of the samples however, are indicative o f acetoclastic methanogenesis
(Whiticar, 1999). Spread o f data is getting larger with temperature which may be a
indication of mixed substrates, the 2 most depleted values have the lowest
temperature and are from the basalt incubation (marked). Inhibition of
methanogenesis by the use of BES in 60°C basalt incubations also indicated that
acetate and not H2 was the primary methanogeneic substrate (Fig 3.15). For the1 *1
majority of 8 C-CH4 values the Whiticar model holds, which states that prokaryotic
methane production occurs in the range, -100 to -50%o, the cut of between acetoclastic
methanogenesis and H2/CO2 is considered to be -60%o more depleted to be H2/CO2
and less deplected to be acetoclastic. Values less depleted than -50%o considered
thermogenic. 8 D values plus C l/C l +CM hydreaction values are often used as
additional information to supplement 8 C-CH4 values and effectively determine origin.
However, increasing temperature does have an effect on fractionation although this is
not fully understood. In the original Whiticar paper (Whiticar et al., 1986) a trend
towards lower fractionations with increasing temperature was noted. Most relevant to
this study is the paper of (Botz et al., 1996), who conducted culture experiments using
Methanococcales and noted the temperature dependence of isotope fractionation
during methanogenesis. Their values for incubations from 35-85°C gave a ec value of
76 to 47. It has also been suggested that isotope fractionation may also be depend on
the amount of substrate available (reservoir effect) and rate of methanogenesis
(Zyakun, 1992; Whiticar, 1999). Above all it is clear that mineral addition and H2
generation has an affect on the amount and temperature of methanogenesis through
the use of H2 by homoacetogens producing acetate the main substrate to
222

Chapter 7 Discussion
methanogenesis in this study, and that this temperature affects the isotope
fractionation. This can be seen with the slight dip in acetate concentrations occurring
during high temperature methane formation for example in the pyrite and hematite
incubation (Figs 5.12, 5.17). This isotopic signature is quite unique, methane
produced at higher temperature may have different isotopic signatures than previously
understood, which opens the question whether methane produced in environment such
as hydrothermal systems, hot oil reservoirs (Jones D et al., 2007) or deep mines
normally considered abiotic, may be the result o f biotic interactions and thus further
increases the role prokaryotes play in the subsurface
7.7 Hydrogen influences on sulphate reduction and carbon dioxide generation
Sulphate removal shows that sulphate reduction occurs in all incubations, with the
exception of the sterile controls (Fig 4.15). Which shows sulphate removal is a biotic
process.
Table 7.6 Mineral incubations comparison of sulphate removal rates and
maximum temperature of activity in the thermal gradient experiments.
Sample Start concentration
mmol 1"1
Completeremoval
Amount removed
mmol I'1
Rate of removal per day mmol f 1
Temperature of maximum
removal [°CJ
Daysincubation
Hematite 16.7 No 13.2 0.13 73 100
Silica 14.5 Yes 14.5 0.14. min 64 97
Labradorite 14.3 Yes 14.3 0.13 min 55 to 68 108
Pyrite 28.2 No 19.1 0.17 65 to 71 110
Olivine 21.1 No 14.7 0.24 68 61
Hornblende 20.1 No 14.4 0.22 65 61
Basalt 14 Yes 14.0 0.16 min 53 to 66 83
Ilmenite 14.9 No 14.0 0.16 63 83
No mineral 13.7 Yes 13.7 0.14 min 58 to 65 93
Magnetite 13.7 Yes 13.7 0.14 min 58 to 65 92
“min’" When all sulphate was removed this rate was taken as the minimum rate
Given in Table 7.6 are the approximate concentration of sulphate removed, the rate of
removal/day, the length of incubation and the temperatures of maximum sulphate
223

Chapter 7 Discussion
removal. Minerals are ordered in terms of maximum concentrations of H2 detected
after 3 days incubation (Table 7.3). The amount of H2 generated does not seem to
affect either the amount of sulphate removed which has a mean o f -14.56 mmol I'1 or
the temperature of maximum removal which is between 53 and 73. In the pyrite
incubation complete S 0 42' removal is not achieved, even though 19.1 mmol I'1 is
removed, which is more than any other incubation. Starting concentrations of S042'
are higher in pyrite due to sulphide oxidation of the mineral and perhaps some
oxidation post grinding before addition, as discussed previously in Chapter 3. If given
a longer incubation period complete removal would most likely be achieved, the rate
of sulphate removal (0.17 mM/ per day) is higher than many of the other incubations
and amount removed is greater, it is unlikely that after 110 days o f continuous
sulphate reduction that this would stop before complete S 0 42’ removal. Inhibition
experiments with molybdate, conducted on a 60°C basalt incubation indicated acetate
as one of the primary substrates for sulphate reduction (25.4%) (Fig 3.14) this does
seem quite low, and maybe the result o f the inhibition of sulphate reducing bacteria
could also inhibit other species including acetogens. It has previously been
hypothesized that acetate may account for greater than 60% of sulphate reduction in
marine sediments (Winfrey and Ward, 1983) as mentioned previously in section 7.5.
Which is not the case in this study, other substrates, which can be used; include H2,
propionate, butyrate, lactate, methanol or carbon monoxide.
In the majority o f incubations (e.g. ilmenite Fig 5.10, pyrite Fig 5.2 and
labradorite Fig 6 .6 ), once sulphate reduction slows with increasing temperature,
concentrations of acetate increase rapidly. Also in the majority of incubations
sulphate reduction slows rapidly above 80°C. (e.g. ilmenite Fig 5.10 basalt Fig 4.9)
with the exception of labradorite (Fig 6 .6 and hematite Fig 5.17) where a limited
amount of sulphate reduction occurs at —90°C. This leads to the conclusion that the
highest temperature SRBs present in our samples are thermophilic. AODC counts of
the hematite incubation (Fig 5.24) indicate that prokaryotic numbers decrease
substantially once sulphate reduction slows. Similar incubations with cores taken
from the Guaymas basin (source of the temperature inoculation for these experiments)
also found that certain cores showed no sulphate reduction above —75°C (Jorgensen et
al., 1990). This is a paradox found in our incubations and also in geological settings
such as deep, hot oil reservoirs. Some hyperthermophilic sulphate reducing
224

Chapter 7 Discussion
prokaryotes can function at extremely high temperatures up to 110°C (Jorgensen et
al., 1992; Stetter et al., 1993). But generally in oil reservoirs and similar geological
settings, sulphate reduction ceases above ~80°C, (Machel and Foght, 2000; Wilhelms
et al., 2 0 0 1 ) this is despite the apparent presence of all the components required for
sulphate reduction. Sulphate reduction in geological settings does not necessarily
always have to be biological, a process of thermochemical sulphate reduction may
also occur. The minimum temperature for thermochemical sulphate reduction is
inferred to be between 100-140°C (Machel, 1998). It is thought that a number of
factors such as the concentration of organic acids, presence o f metal complexes and2+ 2+
possibly the action of Fe , Ca or similar, may enhance this process (Machel, 2001).
However this does not appear to be happening in our incubations as the sterile
controls actually show a slight increase in SO 4 2" rather than a reduction at higher
temperatures from ~ >50°C (Fig 4.15)
A slight increase is also noted in the biotic ramping experiments with an
increase of 3.5 mmol T1 from the lowest sulphate concentration at 75°C to the final
sampling point at 155°C (Fig 4.25). This increases in sulphate at high temperatures
maybe the result of anaerobic iron sulphide oxidation, for example has previously
been known that anaerobic oxidation of pyrite iron oxide minerals as an oxidant
(Bottrell et al., 2000)
Carbon dioxide is a product of sulphate reduction Eq 7.3 and occurs in high
concentrations throughout all samples the following section deals with CO2
concentrations in slurry incubations Table 7.7
225

Chapter 7 Discussion
Table 7.7 Comparison of CO2 concentrations with temperature and initial and
final maximum concentration, plus correlation with SO 4 2' reduction in the
thermal gradient experiment.
Sample 3 day
max
pmol r1
Temp
[°C]
Final
concentration
Temp[°C] Days Correlation
with max
so 42'removal
Hematite 6580 105 1286/1249 60/73 100 Yes
Silica 6564 102 1310 70 97 No
Labradorite 4110 103 1002 68 108 Yes
Pyrite 4673 97 1821 71 110 Yes
Olivine 50788 87 1674 68 61 Yes
Hornblende 28596 103 3413 78 61 No
Basalt 7709 98 2160 60 83 Yes
Ilmenite 6176 95 1362 63 83 Yes
No mineral 3700 78 1400 65 93 Yes
Magnetite 3776 77 1385 68 92 Yes
Sterile
control
6303 100 667 100 130 Na
The comparison of C 0 2 value maximums from the thermal gradient
experiment (Table 7 .7 ) reveals some interesting trends. CO2 concentrations after 3
days are consistently higher than concentrations at the final sampling point generally
a factor of 3 to 6 times less; however, olivine is less by a factor of 30, which is the
greatest. It also appears that initially at least the release of CO2 is linked to
temperature a possible product o f CO2 degassing and alteration o f the CO2 /HCO3
equilibrium from the bicarbonate buffer in the mineral salt solution (Table 2.1).
The chemical cycle of C 0 2 in seawater is governed by a series of equilibria, which are
written as follows
C 0 2 (gas) <=> C 0 2 Eq 7.4 (dissolved)
226

Chapter 7 Discussion
CO2 + H2O O H2CO3 Eq 7.5 (dissolved CO2 becomes hydrated)
Rapid dissociation o f carbonic acid
H2CO3 <=> H + HCO3 Eq 7.6 (bicarbonate ion)
HCO3 <=> H + CO32 Eq 7.7 (carbonate ion)
The highest concentrations are always found near the maximum temperature
after the first 3 days. The no mineral incubation (3700 pmol I"1) and the magnetite
incubation (3776 mmol *) produced only ~ 50% of the CO2 that incubation with the
other minerals produced. The sterile control which contained basalt and the biotic
basalt incubation are similar (Table 7.7). This provides a link between the specific
mineral added and CO2 at elevated temperatures. Magnetite was the only mineral to
produce no detectable H2 during thermal gradient incubation. The sterile control,
which contained basalt, produced CO2 concentrations similar to the biotic incubations
initially. The fact that the 2 biotic incubations (magnetite and no mineral) producing
the lowest amount of CO2 also produced no hydrogen at elevated temperature could
be a coincidence, or it could be that a mixture of abiotic process enhanced by
microbes (possibly microbial mineral weathering, as previously mentioned) is
responsible for elevated H2, and this is linked to high initial concentrations of CO2.
Concentrations o f CO2 at the final sampling point are consistently lower for all
incubations. And in nearly all cases the maximum concentration of CO2 coincides
with the maximum temperature for sulphate removal. This indicates another process
of CO2 formation, which is prokaryotic through heterotrophic sulphate reduction.
Sulphate inhibition experiments indicated that in basalt incubations acetoclastic
sulphate reduction was one o f the dominant process (25.4% according to inhibition
experiment) (Eq 7.8).
Acetate' + S 0 42'-» 2C 0 2 + HS' AG°’ -47.7 kj/reaction Eq 7.8
The rapid increase in acetate concentration at elevated temperature may be a
contributing factor to the lowering o f C 0 2 concentrations. There are two possibilities
for this either this could to due to acetate no longer being used for sulphate reduction,
227

Chapter 7 Discussion
or due to the fact that H2 is no longer required for sulphate reduction and is available
for acetogenesis. Inhibition experiments provided evidence approximately 25.4% of
sulphate reduction was as a result of acetate usage. This gives the possibility that
multiple substrates are being used for sulphate reduction, which may include H2. It is
possible that both processes are involved. C 0 2 is used in acetate formation Eq 7.4 e.g.
ilmenite incubation (Fig 5.10) C 0 2 reaches it maximum concentration at 63°C which
is also the maximum for sulphate reduction, sulphate reduction starts to slow after this
and a sharp increase in acetate at 69°C is coupled with an equally sharp drop in C 02.
4H2 +2 HCO3’ + H+—> Acetate* + 4H20 AG°’ -104 kj/reaction Eq 7.9.
Initial C 02 concentrations may be a indicator o f potential for H2 generation, provided
the proper mix of sedimentary prokaryotes are present. Fig 7.5 shows initial H2 and
C02 concentrations plotted against each other (note olivine and hornblende are absent
, due to the enormity of C 0 2 produced which seems to be irregular in comparison to
all the remaining minerals). There seems to be a slight visual correlation between H2
and C 02 however this is not statistically relevant.
9000
8000 -
= 0.3457000 -
6000 -
5000 -
4000 -
3000 -
2000 -
1000 -
180016001400120010008006004002000
H2 m axim um a f te r 3 days ^mol I'
Fig 7.5 Initial C 0 2 and H2 concentrations after 3 days from the thermal gradient incubations
228

Chapter 7 Discussion
7.8 Characterisation o f microbial community.
Microbial communities associated with individual mineral incubations were assessed
using two methods. Firstly by DGGE profiling coupled to extraction of bands and
sequencing. Secondly, by the construction o f clone libraries and phylogenetic trees.
Visual DGGE band analysis indicated that community structure at 60°C (Figs 3.11)
varied significantly with mineral type, with the appearance and disappearance of
bands of different prokaryotes and increases in band intensity indicating dominance of
different prokaryotes with mineral type. Obvious changes are the appearance of bands
related to anaerobic, fermentative and S° respiring Thermotogales (92%) in the
hornblende incubation which are a group of thermophilic/hyperthermophilic Bacteria
(60-90°C) which grow at neutral pH and have been found in thermophilic subsurface
environments (Huber et al., 1991) and have also been isolated from high temperature
oil reservoirs (Stetter et al., 1993). Other bacterial species found in the 60°C
incubation (Table 3.4) include Clostridia (Firmicutes) which are involved in
fermentation of organic matter (sugars etc) often producing acetate and H2. Other
species belonged to candidate division OP9 (98%) which has unknown metabolism
but has been detected in hydrothermal vent systems. Gammaproteobacteria related
species have been found which are the most abundant division in subseafloor
sediment libraries and have been found to be in the majority in some deep sediment
volcanic ash layers (Inagaki et al., 2003). The divisions Chloroflexi and member of
the candidate division JS1 (Webster et al., 2004), together with the
Gammaproteobacteria make up 63% of clones found in subsurface clone libraries to
date (Fry et al., 2008). Only the Gammaproteobacteria were present in DGGE profile
of the mineral sediment slurry samples. DGGE band extracted and sequenced from
the labradorite incubation at 60°C (Table 3.4) was found to be 97% related to an
uncultured clone belonging to the Gammaproteobacteria, Methylococcales this is a
methane oxidising bacterium, which is aerobic. This is surprising since all incubations
were anaerobic, however, the percentage relationship is only 97% related to an
uncultured clone which perhaps from a Gammaproteobacteria with a different
metabolism including the capacity for anaerobic metabolism. It has previously been
found through the isolation o f facultative anaerobic genera both aerobically (Biddle et
al., 2005) and anaerobically (D'Hondt et al., 2004; Batzke et al., 2007) that many
229

Chapter 7 Discussion
heterotrophic bacteria in the deep-sub surface may be facultative anaerobes (Cragg et
al., 1990) ( Delftia acidovorians (Beta proteobacteria) sequences were also found).
Expanding into the higher temperature DGGE profiles similar sequences were
obtained from extracted bands in the ilmenite and basalt incubation (table 5.5 and
Table 4.2) All sequences found were related to bacterial species found previously in
subsurface environments such as hydrothermal vents, oil reservoirs and marine
sediments and hot springs and some that have been isolated from anaerobic biomass
digesters. A more detailed analysis o f individual sequences found is dealt with in the
relevant results Chapters. One Interesting point to note is that although sulphate
reduction occurred in all samples, very few of the extracted bands belonged to the
Deltaproteobacteria species which are the main genera containing sulphate reducers
(1 band sequenced out o f 23, 4 %). This may suggest a bias on the part of general
PCR primers against sulphate reducing bacteria. It has previously been suggested
(Parkes et al., 2005) that absence of SRBs from clones libraries may be in part due to
their relative low abundance despite high activity, results in them being below the
detection limit for PCR using general primers, and are therefore, absent from gene
libraries.
Archaeal communities were assessed much more robustly with more
incubations being analysed, both by the sequencing of extracted bands from DGGE
profiles and the construction of clone libraries. No bacterial clone libraries were
constructed; this was due to initial cloning indicating a possible contamination. A
major problem in dealing with subsurface bacterial communities is the low bacterial
numbers leads to problems with contamination either from the laboratory
surroundings or from the reagents used in PCR or initial DNA extraction. The initial
clone libraries (only 8 clones for each o f the 4 samples chosen for analysis) were
dominated by one phylotype which was related to the Betaproteobacteria, with 3 or 4
amplified bacterial bands in the negative although the positioning did not coincide
with the bacterial profile, but they were Betaproteobacteria, as the results were
unreliable it was decided not to proceed with the bacterial clones, and instead focus
on the archaeal which were definitely free from contamination as all negative controls
had no amplified archaeal DNA.
So far the majority o f the molecular results published for hydrogen driven
communities, only have archaeal results as these dominate at high temperature
(Chapelle et al., 2002; Takai et al., 2004). DGGE profiles are dominated by
230

Chapter 7 Discussion
Thermoplasmatales related species and the Marine Benthic Group D. The ilmenite
DGGE profile bears a resemblance to the ilmenite clone library with the lower
temperature samples (18-63°C) (Table 5.5) being dominated by the Crenarchaeota
j (87%). All extracted bands belonging to Crenarchaeota were related to species from
various marine environments, tidal sediments deep marine sediments and cold seeps
(Heijs et al., 2007; Kendall et al., 2007; Kittelmann and Friedrich, 2008). One
extracted band was related to a Euryarchaeota, Thermoplasmata (98%) clone which
was isolated from a microbial mat, which is S° respiring, found in hot coal deposits.
The higher temperature ilmenite incubation (76-95°C), is dominated equally by
Euryarchaeota (25%) and Crenarchaeota 25% with the remainder being related to
samples of unknown phylogenetic affiliation (Table 5.6).
Studies on the deep marine biosphere from the Pacific and the Atlantic have
shown in the composition o f gene libraries so far that the Crenarchaeota dominate the
archaea (73.4%) while the Euryarchaeota accounted for (24.5%). Within the
Crenarchaeota the Miscellaneous Crenarchaeotic Group (MCG) and Marine benthic
group-B were the most dominant in marine subsurface sediments (Fry et al., 2008).
This is similar to found in this study for samples below ~ 65°C, and shows that or
community composition is similar to that o f marine sediments.
The clone library phylogenetic tree constructed (Fig 5.27) from the ilmenite
incubation at 63°C is dominated by the Miscellaneous crenarchaeota group 100% (20
clones) with clones related to species found in sub seafloor sediments such as the
Nanki trough which has an elevated thermal gradient (Newberry et al., 2004) and
certain mud volcano sites (Losekann et al., 2007). However, the pyrite clone library at
65°C is not dominated by the Crenarchaeota but rather has a mixture of
Crenarchaeota (22%) and Euryarchaeota (78%) with the majority of the
Euryarchaeota (85.7%) falling within the Thermococcales the remainder of the
Euryarchaeota fell within the Thermoplasmatales. This difference may be due to the
slight temperature difference (2°C) although this is unlikely; more likely is the fact
that different minerals seem to actively play a role in selection of associated
prokaryotic community. This difference between clone libraries shows that the major
factor in determining community composition is temperature, but that also the mineral
addition, and substrates generated as a result is also a major factor.
231

Chapter 7 Discussion
Even more interesting is the clone libraries constructed from the higher
temperature samples, within the zone o f high H2/acetate generation. The 89°C
ilmenite (Fig 5.28) clone library in stark contrast to the 63°C library (Fig 5.27), is
dominated by the Euryarcheota (100%) with no Crenarchaeota detected. The
majority of the clones fall with the Thermococcales or Novel Thermococcales related
group (HTi-1). With one clone falling within the Archaeoglobales (89-il-69). This is
most closely related (98%) to Ferroglobus placidus which as mentioned in the acetate
discussion, can oxidise acetate by using Fe(III) as the sole electron acceptor,
producing Fe(II). Thermococccales were also found to be one of the major microbial
components in a proposed H2 driven (HyperSlime) community (Takai et al., 2004),
the other being Methanococcales. Thermococcales are also found to be a major
component in other Hydrothermal vent environments (Lepage et al., 2004) in addition
analysis of the deepest recorded prokaryotes found to date in the sub-sea-floor
biosphere (1626 mbsf) found that in archaeal clone libraries Thermococcales
(Pyrococcus and Thermococcus) were dominate at depths with temperatures in situ
between 60-100°C (Roussel et al., 2008).
The pyrite clone library at 90°C is only slightly more diverse than ilmenite.
One clone fell within the Crenarchaeota most closely related 99% to a clone isolated
from a sulphide chimney in the Juan de Fuca deep marine trench (Bl-57, EU559691)
and other Crenarchaeota. The remaining clones were split between the
Thermococcales and the HTP-1/ HTP-2 groups. Both the HTP groups appear to be
novel with the closest related species again being clones pCIRA-L and pCIRA-12,
which are also associated with high temperature H2 driven ecosystems (Takai et al.,
2004) samples from vent fluids emitting from a hydrothermal chimney. Unfortunately
no physiological function can be inferred about these clones, except there high
temperature capacity. The diversity o f clone libraries presented here is not as great as
one would expect, in general archaeal clone libraries are less diverse than bacterial
generally only containing two of the main 14 archaeal taxa in many subsurface clone
libraries, often in deep biosphere archaeal diversity appears low e.g. Peru margin only
5 main groups (Webster et al., 2006) this may be an artefact due to preferential PCR
amplification of specific groups of genes, or may be a reflection of real variation
(Webster et al., 2003; Fry et al., 2008). A recent paper has found evidence that the
232

Chapter 7 Discussion
amount of Archaea may be underestimated in the subsurface and that in fact archaea
could be dominant (Lipp et al., 2008).
The microbiological results provide strong evidence that our incubations are a
reasonable model for prokaryotic communities and hence processes in environments
where high concentrations of H2 are presents. (Takai et al., 2004) proposes a
subsurface community thriving on H2 sources derived from
magmatic/serpentinization (Eq 7.2) reactions at high temperature >250°C which is
used by microbes when the H2 enriched fluids Migrate to cooler temperatures.
Sampled (250-350°C) Methanococcales and Thermococcales dominate, and the
clones obtained in this study are the most similar to the clones found in Takai’s study.
In deep gold mine studies groundwater, containing high levels of hydrogen were
examined and found to contain only a single phylotype of thermophilic sulphate
reducer belonging to the Firmicutes (Lin et al., 2006) this was because radiolysis of' j
metal sulphides ensured a constant supply of SO 4 ' at elevated temperature in addition
to H2 from H20 radiolysis. Previous studies have found methanogens belong to the
Methanococcales to be dominate in a H2 driven system in a subterranean hot spring
(Chapelle et al., 2002) no clones found in this study were related to known
methanogenic prokaryotes, however many o f the clones were related to prokaryotes
with unknown physiological function, and the production of methane demonstrates
the presence of methanogens. The amount o f studies conducted on hydrogen driven
systems is small and those studies, which also incorporate a significant
microbiological component are, even fewer. However, results presented here are
similar to these studies as experiments contain several sequences that have been found
previously in hydrogen driven communities and in the deep hot sub-surface. AODC
counts of prokaryotic numbers match those from environmentally related sites. For
example the deepest recorded depth of prokaryotes so far have been found (1626
mbsf) are at temperatures between 60-100°C (Roussel et al., 2008) and these fluctuate
around 1.5 x 10⁶ cells m l 1. Incubations in this study at high temperature (e.g.
hematite Fig 5.17) had similar cell numbers 8 6 °C, 6.28 x 10⁶ cells m l l, 93°C 1.81 x
106 cells m l 1, 99°C 6.67 x 10⁵ cells ml'1 which fits into the predicted cell/depth
regression line for deep sub-surface sediments (Parkes et al., 1994). The combination
of correct prokaryotic numbers, and similar molecular sequences from related
233

Chapter 7 Discussion
subsurface, hot environments lends robustness to the approach applied in this study,
and suggests that the experiments are pertinent to the deep sub-seafloor biosphere.
7,9 Possible mechanism o f hydrogen generation
Possible theories for generation o f hydrogen in the environment mentioned previously
have involved the low temperature (20-3 0°C) oxidation of Fe2+ containing minerals
directly supplying prokaryotes (Stevens and McKinley, 1995) or involve very high
temperatures reactions ~300°C such as serpentinization (Sleep et al., 2004) that
indirectly supplies H2 to prokaryotic communities via diffusion or advection.
Temperatures involved in these reactions are far in excess of those used
experimentally in this study (Seewald, 2001; Chapelle et al., 2002; Takai et al., 2004;
Kelley et al., 2005) and are far higher than the known upper temperature for
prokaryotes (120°C, (Kashefi and Lovley, 2003). Both of the above are unlikely to be
the hydrogen generating process in this study. However, one explanation of hydrogen
generation which has not been addressed is the mineral fracture induced reduction of
water (Kita et al., 1982) a process termed mechanochemistry. This process can occur
with a broad range of minerals and temperatures (25-270°C), it is not dependent on
ferrous iron content. A brief summary follows which has been adapted from (Kita et
al., 1982). Quartz contains Si-O bonds and when crushed radicals such as Si* and Si-
0* are created from the breaking o f these. When crushing occurs in the presence of
H2O, SiOH can be formed as follows.
In the process of SiOH formation H* radials that are generated simultaneously cannot
react with Si-O*, which is relatively stable, and hence two H* may combine forming
Eq 7.13 shows the mechanism involved in these reactions in the absence of 0 2.
Si* + H20 SiOH + H*
Si-O* +H* -> SiOH
Si-O-Si + H20 -» 2SiOH
Eq 7.10
Eq 7.11
Eq 7.12
H2.
Si*+ Si-O* +H2O —> SiOH + V2 H2 + (Si-O*) Eq 7.8
234

Chapter 7 Discussion
These radials are stable up to 120°C, which is within the temperature range of most
experiments conducted in this study. This type of reaction would account for the high
concentrations of H2 observed with the silica addition and be consistent with no
relationship between potential H2 formation and iron content o f minerals (Table 7.3)
but a relationship with porewater Si (Fig 7.1) and also why no H2 was evolved from
magnetite, which according to ICP-OES (Table 3.2) analysis has a composition of
99% Fe2C>3 but low levels o f S i02. However an anomaly is ilmenite, in which H2 is
formed but the concentration o f S i0 2 is low (1.06%). Unlike magnetite however
concentrations of T i0 2 is high (47.31%). Also hematite produces the highest initial H2
concentrations, but has not got the highest S i02 (20.5%), but does also have a
relatively large A12C>3 (17.7%) content. It is clear that this hydrogen is a complex
process reliant on a number o f factors, and may be enhanced by the presence of other
compounds in the mineral. Mechanochemical H2 generation is a process that can
occur with a range of minerals including those containing T i02. Ti and Al cannot be
regarded as inert in this process and the reaction of Al* radicals with water is also
thought to produce H2 this has been proven by reactions of A12C>3 with H20
generating as much H2 as quartz (Si radial) reactions at both 25 and 200°C (Kita et al.,
1982). Therefore reactions with Si, Al and Ti oxides plus a range of other minerals,
maybe capable of H2 generation from H20 and these are common constituents of
rocks, with H2 generation increasing with increasing temperature..
Mechanochemical radial reactions, also explains why the addition of freshly
ground minerals is important for rapid initial H2 formation, however H2 is also
produced after long term incubations up to 97 days (silica addition Fig 6.14) 100 days
(hematite Fig 5.15) and pyrite 110 days (Fig 5.2). Hence fresh surfaces appear to be
only one aspect of the reactions observed in the experiments reported here. However
the exact role of prokaryotes in this H2 generation is unknown, but almost zero H2
generation in sterile basalt controls (Fig 4.14), clearly demonstrate that they do have a
considerable impact. It may be that the initial abiotic mechanochemical reaction is
sustained and enhanced by the presence of prokaryotic mineral weathering activity,
creating reactive surface and thus prolonging H2 production. With some minerals iron
compounds may also be involved, as hematite (54% Fe2C>3) produced the largest
initial 3 day H2 concentrations and porewater Fe often increased at high temperature
235

Chapter 7 Discussion
alongside H2 (Figs 5.19,5,17). However oxidation of ferrous directly seems an
unlikely main mechanism as iron in hematite is theoretically completely oxidised.
Although it needs to be noted that natural rock minerals were used for all our samples
and some heterogeneity in composition might be present. However, the quartz sand
was almost 99% silica SiC>2 (Table 3.2) Hence previous sterile water mineral
experiment, conducted to gauge the potential o f minerals for H2 production may be
misleading (Stevens and McKinley, 1995; Anderson et al., 1998; Stevens and
McKinley, 2000; Anderson et al., 2001).
Production of freshly ground surfaces in the subsurface would enhance
mineral H2 production in areas where exposure of fresh surfaces can be achieved,
such as around faults zones, with in excess of 2 0 ,0 0 0 measured significant
earthquakes /year, with many more minor earthquakes (undetected), this may be
reasonably common. The exact amount of H2 formed would also depend on rock
composition and temperature as demonstrated here. Elevated H2 concentrations have
been found previously associated with fault zones and were thought to be purely the
result of abiotic processes (Wakita et al., 1980) which may not be the case. The
production of CH4 has also been previously linked to earthquake activity (Brauer et
al., 2005) and may be a result o f methanogenic activity utilising H2 produced by
mechanochemical process. H2 from more common minor faulting may be consumed
by subsurface prokaryotes and hence none may be detected at the surface, but this
may be an important subsurface energy source
7.10 Conclusions
This study has provided evidence o f the following
• Hydrogen can be generated from a number of minerals previously thought
unreactive. This process is dependent on a number of factors
1) The presence o f sedimentary prokaryotes
2) Elevated temperatures.
3) The composition of the mineral added
4) This reaction is enhanced through initial crushing and exposure of fresh
reactive surfaces
• This reaction is independent o f Fe content in the mineral, unlike in previously
published studies
236

Chapter 7 Discussion
• It is possibly a reaction involving silica and other radicals
• This reaction is possibly facilitated over time by the presence of sedimentary
prokaryotes, keeping the mineral surface active through a process similar to
microbial weathering
• Hydrogen generated from this reaction can fuel subsurface prokaryotic
metabolisms, including “deep” sulphate reduction, acetogenesis and
methanogenesis.
• Hydrogen production can be sustained over prolonged periods >100 days
• Molecular analysis of the prokaryotes in these experiments shows similarities
to those in HyperSLiMe communities proposed to be fuelled by deep sourced
H2
• Sequential temperature ramping experiments to 155°C showed that
prokaryotic activity in the biotic zone (up to 120°C) has an effect on the
products produced during subsequent higher temperature (up to 155°C) and
thermal alteration in the abiotic zone, substantially increasing the amount of
organic acids and gases such as hydrogen produced
• The results of the experiments presented have significant implications for
sources of energy supply in the deep hot, biosphere/geosphere, suggesting
increased energy sources and a greater biosphere than previously considered
7.11 Future work
This study has provided some new and exciting developments in the search for
sources of energy and examining what effects this has on prokaryotes in the deep
biosphere. However there is a lot more work to be done to examine fully the
processes occurring. More research needs to be done on the exact mechanism of
hydrogen production and how specifically prokaryotes interact with the mineral. Also
more mineral specific analysis. Extending and prolonging the temperature ramping
experiment (longer incubations at each temperature and starting at a lower
temperature) could provide more detailed information regarding the transition
between the biotic and abiotic processes and into the oil window. Addition of specific
kerogens as well as differing minerals would be interesting. A more in depth
molecular analysis of the hyperthermophilic community would be interesting, with
substantially more cloning, and gene specific work mcrA / dsrA\B. Culturing although
237

Chapter 7 Discussion
probably quite difficult considering the high temperature involved, would be
interesting. Pure culture and mixed culture mineral experiments would enable the role
of prokaryotes and community interaction to be resolved. Stable isotope probing to
follow the carbon flow, more inhibition and radiotracer work to confirm metabolic
processes at a range of temperatures.
238

References
References
Aeckersberg, F., Bak, F., and F., W. (1991) Anaerobic oxidation of saturated hydrocarbons to C02 by a new type of sulfate-reducing bacterium. Arch. Microbiol. 156: 5-14.
Aeckersberg, F., Rainey, F.A., and Widdel, F. (1998) Growth, natural relationships, cellular fatty acids and metabolic adaptation of sulfate-reducing bacteria that utilize long- chain alkanes under anoxic conditions. Archives o f Microbiology 170: 361-369.
Allen, D.E., and Seyfried, W.E. (2003) compositional controls on vent fluids from ultramafic-hosted hydrothermal systems at mid oceanic ridges: an experimental study at 400°C, 500 bar. Geochemica et Cosmochimica Acta 67: 1531-1542.
Aller, R.C. (1990) Bioturbation and manganese cycling in hemipelagic sediments. Phil. Trans. Roy.Soc.Lon A331: 51-68.
Alt, J.C., and Shanks, W.C. (1998) Sulfur in serpentinized oceanic peridotites: Serpentinization processes and microbial sulfate reduction. Journal o f Geophysical Research-Solid Earth 103: 9917-9929.
Amend, J., P., and Teske, A. (2005) Expanding frontiers in deep subsurface microbiology. Palaeogeography, Palaeoclimatology, Palaeoecology 219: 131-155.
Amend, J.P., and Shock, E.L. (2001) Energetics of overall metabolic rections of thermophilic and hyperthermophilic Archaea and Bacteria. FEMS Microbiology Reviews 25: 175-243.
Anderson, R.T., Chapelle, F.H., and Lovley, D.R. (1998) Evidence against hydrogen- based microbial ecosystems in basalt aquifers. Science 281: 976-977.
Anderson, R.T., Chapelle, F.H., and Lovley, D.R. (2001) Comment on "Abiotic controls on H-2 production from basalt- water reactions and implications for aquifer biogeochemistry". Environmental Science & Technology 35: 1556-1557.
Bach, W., and Edwards, K.J. (2003) Iron and sulfide oxidation within the basaltic ocean crust: Implications for chemolithoautotrophic microbial biomass production. Geochimica Et Cosmochimica Acta 67: 3871-3887.
Bach, W., Garrido, C.J., Harvey, J., Paulick, H., and Rosner, M. (2004) Variable seawater-peridotite interactions-first insights from ODP Leg 209, MAR 15N. Geochemistry, Geophysics, Geosystems 5: Q09F26, doi:10.1029/2004GC000744.
Baena, S., Fardeau, M.L., Labat, M., Ollivier, B., Garcia, J.L., and Patel, B.K.C. (1998) Desulfovibrio aminophilus sp.nov., a novel amino acid degrading and sulphate reducing
239

References
bacterium from an anaerobic diary wasterwater lagoon. J. Syst, Appl Microbiol 21: 498- 504.
Bak, F., and Cypionka, H. (1987) A novel type of energy metabolism involving fermentation of inorganic sulfur compounds. Nature 326: 891-892.
Bak, F., and Pfennig, N. (1987) Chemolithotrophic growth of Desulfovibrio sulfodismutans sp.nov., by disproportionation of inorganic compounds. Archives o f Microbiology 147: 184-189.
Barnes, R.O., and Goldberg, E.D. (1976) Methane production and consumption in anoxic marine sediments. Geology 4: 297-300.
Barth, T., and Bjorlykke, K. (1993) Organic acids from source rock maturation generation potentials, transport mechanisms and relevance for mineral diagenesis. Applied Geochemistry 8 : 325-337.
Batzke, A., Engelen, B., Sass, H., and Cypionka, H. (2007) Phylogenetic and physiological diversity of cultured deep-biosphere bacteria from equatorial Pacific Ocean and Peru margin sediments. Geomicrobiology Journal 24: 261-273.
Ben-Yaakov, S. (1973) pH buffering of pore water of recent anoxic marine sediments. Limnol. Oceanogr. 18: 86-93.
Bennett, P.C., Rogers, J.R., and Choi, W.J. (2001) Silicates, silicate weathering, and microbial ecology. Geomicrobiology Journal 18: 3-19.
Biddle, J.F., House, C.H., and Brenchley, J.E. (2005) Microbial stratification in deeply buried marine sediments reflets changes in sulfate/methane profiles. Geobiology 3: 287- 295.
Bidle, K.A., Kastner, M., and Bartlett, D.H. (1999) A phylogenetic analysis of microbial communities associated with methane hydrate containing marine fluids and sediments in the Cascadia margin (ODP site 892B). Ferns microbial letters: 101 - 108.
Blair, C., D'Hondt, S., Spivack, A., and Kingsley, R.H. (2007) Radiolytic Hydrogen and Microbial Respiration in Subsurface Sediments. Astrobiology 7: 951-966.
Boetius, A., Ravenschlag, K., Schubert, C.J., Rickert, D., Widdel, F., Gieseke, A. et al. (2000) A marine microbial consortium apparently mediating anaerobic oxidation of methane. Nature 407: 623-626.
Boone, D.R., Whitman, W.B., and Rouviere, P. (1993) Methanogenesis. New York & London: Chapman, Hall.
240

References
Bottcher, M.E., Thamdrup, B., M., G., and A., T. (2005) S34/S32 and O^/O16 fractination during sulphur disproportionation by Desulfobulbus propionicus. Geomicrobiology Journal 22\ 219-226.
Bottrell, S.H., Parkes, R.J., Cragg, B.A., and Raiswell, R. (2000) Isotopic evidence for anoxic pynte oxidation and stimulation of bacterial sulphate reduction in marine sediments. Journal o f the Geological Society 157: 711-714.
Botz, R., Pokojski, H.D., Schmitt, M., and Thomm, M. (1996) Carbon isotope fractionation during bacterial methanogenesis by C02 reduction. Organic Geochemistry 25: 255-262.
Brauer, K., Kampf, H., Faber, E., Koch, U., Nitzsche, H., and Strauch, G. (2005) Seismically triggered microbial methane production relating to the Vogtland NW Bohemia earthquake swarm period 2000, Central Europe. Geochemical Journal 39: 441- 450.
Broda, E. (1977) Two kinds of lithotrophs missing in nature. Z. Allg. Mikrobiol 17: 491- 493.
Brosius, J., Dull, T.J., Sleeter, D.D., and Noller, H.F. (1981) Gene organization and primary structure of a ribosomal RNA operon from Escherichia coli. Journal o f Molecular Biology 148: 107-127.
Burggraf, S., Jannasch, H.W., Nicolaus, B., and Stetter, K.O. (1990a) Archaeoglobus- Profundus Sp-Nov, Represents a New Species within the Sulfate-Reducing Archaebacteria. Systematic and Applied Microbiology 13: 24-28.
Burggraf, S., Fricke, H., Neuner, A., Kristjansson, J., Rouvier, P., Mandelco, L. et al. (1990b) Methanococcus-Igneus Sp-Nov, a Novel Hyperthermophilic Methanogen from a Shallow Submarine Hydrothermal System. Systematic and Applied Microbiology 13: 263-269.
Canfield, D.E., and Teske, A. (1996) Late Proterozoic rise in atmospheric oxygen concentration inferred from phylogenetic and sulphur-isotope studies. Nature 382: 127- 132.
Canfield, D.E., Thamdrup, B., and Hansen, J.W. (1993) The Anaerobic Degradation of Organic-Matter in Danish Coastal Sediments - Iron Reduction, Manganese Reduction, and Sulfate Reduction. Geochimica Et Cosmochimica Acta 57: 3867-3883.
Canfield, D.E., Jorgensen, B.B., Fossing, H., Glud, R., Gundersen, J., Ramsing, N.B. et al. (1993 a) Pathways of Organic-Carbon Oxidation in 3 Continental-Margin Sediments. Marine Geology 113: 27-40.
241

References
Chapelle, F.H., and Bradley, P.M. (1996) Microbial acetogenesis as a source of organic acids in ancient Atlantic Coastal Plain sediments. Geology 24: 925-928.
Chapelle, F.H., O'Neill, K., Bradley, P.M., Methe, B.A., Ciufo, S.A., Knobel, L.L., and Lovley, D.R. (2002) A hydrogen-based subsurface microbial community dominated by methanogens. Nature 415: 312-315.
Charlou, J.L., Donval, J.P., Fouquet, Y., Jean-Baptiste, P., and Holm, N. (2002) Geochemistry of high H-2 and CH4 vent fluids issuing from ultramafic rocks at the Rainbow hydrothermal field (36 degrees 14 ’ N, MAR). Chemical Geology 191: 345-359.
Childers, S.E., Ciufo, S., and Lovley, D.R. (2002) Geobacter metallireducens accesses insoluble Fe(III) oxide by chemotaxis. Nature 416: 767-769.
Chin, H., Chen, Z., and Chou, C. (2003) Fedbatch operation using Clostridium acetobutylicum suspension culture as biocatalyst for enhancing hydrogen production. Biotechnol Prog. 19: 383-388.
Codispoti, L.A., Brandes, J.A., Christensen, J.P., Devol, A.H., Naqvi, S.W.A., Paerl, H.W., and Yoshinary, T. (2001) The Oceanic fixed nitrogen and nitrous oxide budgets: moving targets as we enter the anthropocene. Sci. Mar. 65: 85-105.
Cooles, G.P., Mackenzie, A.S., and Parkes, R.J. (1987) Non-hydrocarbons of significance in petroleum-exploration - volatile fatty-acids and non-hydrocarbon gases. Mineralogical Magazine 51: 483-493.
Cragg, B.A., Parkes, R.J., Fry, J.C., Herbert, R.A., Wimpenny, J.W.T., and Getliff, J.M. (1990) Bacterial biomass and activity profiles within deep sediment layers. Proc. Ocean Drilling Program Scientific Results 112: 607-619.
D'Hondt, S., Rutherford, S., and Spivack, A.J. (2002a) Metabolic activity of subsurface life in deep-sea sediments. Science 295: 2067-2070.
D’Hondt, S., Jorgensen, B.B., Blake, R., Dickens, G., Hindrichs, K., Holm, N. et al. (2002b) Microbial activity in deeply buried marine Sediments. Geochimica Et Cosmochimica Acta 6 6 : A163-A163.
D'Hondt, S., Jorgensen, B.B., Miller, D.J., Batzke, A., Blake, R., Cragg, B.A. et al.(2004) Distributions of microbial activities in deep subseafloor sediments. Science 306: 2216-2221.
Dalsgaard, T., and Thamdrup, B. (2002) Factors controlling anaerobic ammonium oxidation with nitrite in marine sediments. Applied and Environmental Microbiology 6 8 : 3802-3808.
242

References
DeLong, E.F. (1992) Archaea in coastal marine environments. Proceedings O f The National Academy O f Sciences O f The United States O f America 89: 5685-5689.
Dhillon, A., Lever, M., Lloyd, K.G., Albert, D.B., Sogin, M.L., and Teske, A. (2005) Methanogen diversity evidenced by molecular characterization of methyl coenzyme M reductase A (mcrA) genes in hydrothermal sediments of the Guaymas Basin. Applied And Environmental Microbiology 71: 4592-4601.
Dias, R.F., Freeman, K.H., Lewan, M.D., and Franks, S.G. (2002) 6 13C of low- molecular-weight organic acids generated by the hydrous pyrolysis of oil-prone source rocks. Geochemica et Cosmochimica Acta 66
Dick, H.J.B., Lin, J., and Schouten, H. (2003) An ultraslow spreading class of ocean ridge. Nature 426: 405-412.
Draganic, I.G., and Draganic, Z.D. (1971) The radiation chemistry o f water. New York: Academic Press.
Drake, H.L. (1994) Acetogenesis, acetogeneic bacteria and the acetyl-CoA "Wood/Ljungdahl" pathway: past present and future prespectives. In Acetogenesis.Drake, H.L. (ed). New york: Chapman &Hall, pp. 3-60.
Drake, H.L., and Daniel, S.L. (2004) Physiology of thermophilic acetogen Moorella thermoacetica. Research in Microbiology 155: 422-436.
Drake, H.L., Gobner, A.S., and Daniel, S.L. (2008) Old Acetogens, New Light. Ann. NY. Acad.Sci. 1125: 100-128.
Drobner, E., Huber, H., Wachtershauser, G., Rose, D., and Stetter, K.O. (1990) Pyrite formation linked with hydrogen evolution under anaerobic conditions. Nature 346: 742- 744.
Edwards, K.J., Rogers, D.R., Wirsen, C.O., and McCollom, T.M. (2003) Isolation and characterization of novel psychrophilic, neutrophilic, Fe-oxidizing, chemolithoautotrophic alpha- and, gamma-Proteobacteria from the deep sea. Applied and Environmental Microbiology 69: 2906-2913.
Ferry, J.G., and Kastead, K.A. (2007) Archaea molecular and cellular biology, (ed. Cavicchioli, R.) ASM Washington DC’. 288-314.
Fisher, A.T., and Becker, K. (1991) Heat-Flow, Hydrothermal Circulation and Basalt Intrusions in the Guaymas Basin, Gulf of California. Earth and Planetary Science Letters 103: 84-99.
Fisk, M.R., Giovannoni, S.J., and Fumes, H. (1998) Alteration of oceanic volcanic glass: textural evidence of microbial activity. Science 281: 978-980.
243

References
Fredrickson, J.K., Zachara, J.M., Kennedy, D.W., Dong, H.L., Onstott, T.C., Hinman, N.W., and Li, S.M. (1998) Biogenic iron mineralization accompanying the dissimilatory reduction of hydrous ferric oxide by a groundwater bacterium. Geochimica Et Cosmochimica Acta 62: 3239-3257.
Frimmer, U.F., and Widdel, F. (1989) Oxidation of ethanol by methanogenic bacteria. Archives o f Microbiology 152: 479-483.
Fry, J.C. (1988) Determination of biomass. In Methods in Aquatic Bacteriology. Austin.B (ed). Chichester: John Wiley, pp. 27-72.
Fry, J.C., Parkes, R.J., Cragg, B.A., Weightman, A.J., and Webster, G. (2008)Prokaryotic biodiversity and activity in the deep subsurface biosphere. Ferns Microbiology ecology: In Press.
Fry, N.K., Fredrickson, J.K., Fishbain, S., Wagner, M., and Stahl, D.A. (1997) Population structure of microbial communities associated with two deep, anaerobic, alkaline aquifers. Applied and Environmental Microbiology 63: 1498-1504.
Garcia, J.L., Patel, B.K.C., and Ollivier, B. (2000) Taxonomic phylogenetic and ecological diversity of methanogenic Archaea. Anaerobe 6 : 205-226.
Glamoclija, M., Garrel, L., Berthon, J., and Lopez-Garcia, P. (2004) Biosignatures and bacterial diversity in hydrothermal deposits of Solfatara Crater, Italy. Geomicrobiology Journal 21: 529-541.
Glasauer, S., Weidler, P.G., Langley, S., and Beveridge, T.J. (2003) Controls on Fe reduction and mineral formation by a subsurface bacterium. Geochemica et Cosmochimica Acta 67: 1277-1288.
Gold, T. (1992) The deep, hot biosphere. Proc. Natl. Acad. Sci USA 89: 6045-6049. Gorby, Y.A., Yanina, S., McLean, J.S., Rosso, K.M., Moyles, D., Dohnalkova, A. et al.(2006) Electrically conductive bacterial nanowires produced by Shewanella oneidensis strain MR-1 and other microorganisms. Proceedings O f The National Academy O f Sciences O f The United States O f America 103: 11358-11363.
Goulder, R. (1977) Attached and Free Bacteria in an Estuary with Abundant Suspended Solids. Journal o f Applied Bacteriology 43: 399-405.
Grossi, V., Cravo-Laureau, C., Meou, A., Raphel, D., Garzino, F., and Hirschler-Rea, A.(2007) Anaerobic 1-Alkene Metabolism by the Alkane- and Alkene-Degrading Sulfate Reducer Desulfatibacillum aliphaticivorans Strain CV2803T. Applied and Environmental Microbiology 73: 7882-7890.
Grosskopf, R., Janssen, P.H., and Liesack, W. (1998) Diversity and structure of the methanogenic community in anoxic rice paddy soil microcosms as examined by
244

References
cultivation and direct 16S rRNA gene sequence retrieval. Applied and Environmental Microbiology 64: 960-969.
Gruber, N., and Sarmiento, J.L. (1997) Global patterens of marine nitrogen fixation and denitrification. Global Biogeochemical Cycles 11: 235-266.
Hafenbradl, D., Keller, M., Dirmeier, R., Rachel, R., Rossnagel, P., Burggraf, S. et al. (1996) Ferroglobus placidus gen nov, sp nov, a novel hyperthermophilic archaeum that oxidizes Fe2+ at neutral pH under anoxic conditions. Archives o f Microbiology 166: 308- 314.
Hall, T. (1999) BioEdit: a user-friendly biological sequence alignment editor and analysis program for Windows 95/98/NT. Nucleic Acids Symp 41: 95-98.
Harris, R.E., and Pimblott, S.M. (2002) ON 3H B-Particle and 60Co y irradiation of aqueous systems. Radiation research 158: 493-504.
Hearn, P.P., Steinkampf, W.C., White, L.D., and Evans, J.R. (1986) Proc, U.S. Geol. Surv. Workshop on Environmental Geochemistry. W. Wood and W.H. Low, Geol.Soc.Am. Bull 97: 1456.
Hedges, J.I., and Keil, R.G. (1995) Marine Chemistry Discussion Paper. Sedimentary organic matter preservation: an assessment and speculative synthesis. Marine Chemistry 4: 81-115.
Heijs, S.K., Haese, R.R., van der Wielen, P.W., Forney, L.J., and van Elsas, J.D. (2007) Use of 16S rRNA Gene Based Clone Libraries to Assess Microbial Communities Potentially Involved in Anaerobic Methane Oxidation in a Mediterranean Cold Seep. Ferns Microbiology Ecology 53: 384-398.
Henstra, A.M., Dijkema, C., and Stams, A., J,M. (2007) Archaeoglobus fulgidus couples CO oxidation to sulphate reduction and acetogenesis with transient formate accumulation. Environmental Microbiology 9: 1836-1841.
Hiebert, F.Z., and Bennett, P.C. (1992) Microbial control of Silicate weathering in organic-rich ground water. Science 258: 278-281.
Hinrichs, K.-U., and Boetius, A. (2002) The anaerobic oxidation of methane: new insights in microbial ecology and biogeochemistry. In Ocean margin systems. G. Wefer, D. Billett, D. Hebbeln, B. B. Jorgensen, M. Schliiter, and Weering, T.V. (eds). Berlin: Springer-verlag, pp. 457-477.
Hinrichs, K.U., Hayes, J.M., Sylva, S.P., Brewer, P.G., and DeLong, E.F. (1999) Methane-consuming archaebacteria in marine sediments. Nature 398: 802-805.
245

References
Hinrichs, K.U., Summons, R.E., Orphan, V., Sylva, S.P., and Hayes, J.M. (2000) Molecular and isotopic analysis of anaerobic methane-oxidizing communities in marine sediments. Organic Geochemistry 31: 1685-1701.
Hirt, R.P., Logsdon, J.M., Healy, B., Dorey, M.W., Doolittle, W.F., and Embley, T.M. (1999) Microsporidia are related to Fungi: Evidence from the largest subunit of RNA polymerase II and other proteins. Proceedings o f the National Academy o f Sciences o f the United States o f America 96: 580-585.
Hoehler, T.M., Alperin, M.J., Albert, D.B., and Martens, C.S. (1994) Field and Laboratory Studies of Methane Oxidation in an Anoxic Marine Sediment - Evidence for a Methanogen-Sulfate Reducer Consortium. Global Biogeochemical Cycles 8 : 451-463.
Horsfield, B., Schenk, H.J., Zink, K., Ondrak, R., Dieckmann, V., Kallmeyer, J. et al.(2006) Living microbial ecosytems within the active zone of catagenesis: implications for feeding the deep biosphere. Earth and Planetary Science Letters 246: 55-69.
Huber, G., Huber, R., Jones, B.E., Lauerer, G., Neuner,A, Segerer, Stetter, K.O., and Degens, E.T. (1991) Hyperthermophilic Archaea and bacteria occurring within Indonesian hydrothermal areas. System. Appl. Microbiol. 14: 397-404.
Huber, R., and Stetter, K. (1992 (a)) The order Thermotogales. In The Prokaryotes. Balows, A., Truper, H., G., Dworkin, M., Harder, W., and Schleifer, K.-H. (eds). Berlin: Springer-Verlag, pp. 3809-3815.
Huber, R., and Stetter, K. (1992 (b)) The Thermotogales. In Hyperthermophilic and extremely thermophilic bacteria. Kristjansson, J.K. (ed). Boca Raton FL: CRC press, pp. 185-194.
Huber, R., Kurr, M., Jannasch, H.W., and Stetter, K.O. (1989) A novel group of abyssal methanogenic archaebacteria (Methanopyrus) growing at 1 lOoC. Nature 424: 833-834.
Huber, R., Langworthy, T.A., Konig, H., Thomm, M., Woese, C.R., Sleytr, U.B., and Stetter, K.O. (1986) Thermotoga-Maritima sp-Nov represents a new genus of unique extremely thermophilic eubacteria growing up to 90-degrees-C. Archives o f microbiology 144: 324-333.
Inagaki, F., Suzuki, M., Takai, K., Oida, H., Sakamoto, T., Aoki, K. et al. (2003) Microbial communities associated with geological horizons in coastal subseafloor sediments from the Sea of Okhotsk. Applied and Environmental Microbiology 69: 7224- 7235.
Isaksen, M.F., Bak, F., and Jorgensen, B.B. (1994) Thermophilic sulfate-reducing bacteria in cold marine sediment. FEMS Microbiol. Ecol. 14: 1-8.
246

References
Itoh, T., Suzuki, K.-I., and Nakase, T. (1998) Thermocladium modestius gen.nov.,sp. nov. a new genus of rod shaped, extremely thermophilic crenarchaeote. Int. J. Syst. Bacteriol 48: 879-887.
Itoh, T., Suzuki, K.-I., Sanches, P.C., and Nakase, T. (1999) Caldivirga maquilingensis gen.nov.,sp.nov. a new genus of rod shaped crenarchaeote isolated from a hot spring in the Philippines. Int. J. Syst. Bacteriol 49: 1157-1163.
Jackson, B.E., and Mclnemey, M.J. (2002) Anaerobic microbial metabolism can proceed close to thermodynamic limits. Nature 415: 454-456.
Jaffe, D.A. (2000) The nitrogen cycle. In Earth System Science. Jacobson, M.C., Charlson, R.J., Rohde, H., and Orians, G.H. (eds). San Diego, CA. USA: Academic press, pp. 322-342.
Janecky, D.R., and Seyfried, W.E. (1986) Hydrothermal serpentinization of peridotite within the oceanic crust: experimental investigations of mineralogy and major element chemistry. Geochemica et Cosmochimica Acta 50: 1357-1378.
Jeter, R.M., and Ingraham, J.L. (1996) The Denitrifying Prokaryotes’. Springer-verlag. Jetten, M.S.M., Cirpus, B., Kartal, B., Van Niftrik, L., van de Pas-Schoonen, K.T., Sliekers, A.O., and Haaijer, W. (2005) 10 years of research on anaerobic oxidation of ammonium. Biochem. Soc. Trans. 33: 119-123.
Jones, D., M., Head, I., M., Gray, N.D., Adams, J.J., Rowan, A.K., Aitken, C.M. et al.(2007) Crude-oil biodegradation via methanogenesis in subsurface petroleum reservoirs. Nature 451: 176-180.
Jones, W.J., Leigh, J.A., Mayer, F., Woese, C.R., and Wolfe, R.S. (1983) Methanococcus-Jannaschii Sp-Nov, an Extremely Thermophilic Methanogen from a Submarine Hydrothermal Vent. Archives o f Microbiology 136: 254-261.
Jonkers, H.M., Van der Maarel, M.J., Van Gemerden, H., and Hansen, T.A. (1996) Dimethylsulfoxide reduction by marine sulphate reducing bacteria. Ferns Microbiol Letters 136: 283-287.
Jorgensen, B.B. (1982) Mineralization of organic matter in the seabed - the role of sulphate reduction. Nature 296: 643-645.
Jorgensen, B.B. (1983) Processes at the Sediment-Water Interface: The Major Biogiochemical Cycles and Their Interactions Ed B.Bolin & R.B. Cook, John Wiley, Chichester.
247

References
Jorgensen, B.B., Zawacki, L.X., and Jannasch, H.W. (1990) Thermophilic bacterial sulfate reduction in deep-sea sediments at the Guayamas Basin hydrothermal vent site (Gulf of California). Deep-Sea Research 37: 695-710.
Jorgensen, B.B., Isaksen, M.F., and Jannasch, H.W. (1992) Bacterial sulphate reduction above 100°C in deep-sea hydrothermal vent sediments. Science 258: 1756-1757.
Kartal, B., Kuypers, Lavik, G., Schalk, J., Op den Camp, H.J.M., Jetten,M.S.M., and Strous, M. (2007) Anammox bacteria disguised as denitrifers: nitrate reduction to dinitrogen gas via nitrite and ammonium. Environmental Microbiology 9: 635-642.
Kashefi, K., and Lovley, D.R. (2000) Reduction of Fe(III), Mn(IV), and toxic metals at 100 degrees C by Pyrobaculum islandicum. Applied and Environmental Microbiology 6 6 : 1050-1056.
Kashefi, K., and Lovley, D.R. (2003) Extending the upper temperature limit for life. Science 301: 934-934.
Kashefi, K., Holmes, D.E., Reysenbach, A.L., and Lovley, D.R. (2002a) Use of Fe(III) as an electron acceptor to recover previously uncultured hyperthermophiles: Isolation and characterization of Geothermobacterium ferrireducens gen. nov., sp nov. Applied and Environmental Microbiology 6 8 : 1735-1742.
Kashefi, K., Tor, J.M., Holmes, D.E., Van Praagh, C.V.G., Reysenbach, A.L., and Lovley, D.R. (2002b) Geoglobus ahangari gen. nov., sp nov., a novel hyperthermophilic archaeon capable of oxidizing organic acids and growing autotrophically on hydrogen with Fe(III) serving as the sole electron acceptor. International Journal o f Systematic and Evolutionary Microbiology 52: 719-728.
Kelley, D.S., Baross, J.A., and Delaney, J.R. (2002) Volcanoes fluids and life at midocean ridge spreading centres. Annu.Rev.Earth planet.Sci 30: 385-491.
Kelley, D.S., Karson, J.A., Fruh-Green, G.L., Yoerger, D.R., Shank, T.M., Butterfield, D.A. et al. (2005) A serpentinite-hosted ecosystem: The lost city hydrothermal field. Science 307: 1428-1434.
Kelly, D.P., and Wood, A.P. (2000) Reclassification of some species of Thiobacillus to the newly designated genera Acidithiobacillus gen. nov., Halothiobacillus gen. nov. and Thermithiobacillus gen. nov.'"’. Int. J. Syst. Evol. Microbiol. 50: 489—500.
Kendall, M.M., Wardlaw, G.D., Tang, C.F., Bonin, A.S., Liu, Y., and Valentine, D.L.(2007) Diversity of Archaea in marine sediments from Skan Bay, Alaska,including cultivated methanogens, and description of Methanogenium boonei sp. nov. Applied and Environmental Microbiology 73: 407-414.
248
References
Kharaka, Y.K., Lundegard, P.D., Ambats, G., Evans, W.C., and Bischoff, J.L. (1993) Generation of aliphatic acid anions and carbon dioxide by hydrous pyrolysis of crude oils .Applied Geochemistiy 8 : 317-324.
Kim, B.S., Oh, H.M., Kang, H., and Chun, J. (2005) Archaeal diversity in tidal flat sediment as revealed by 16S rDNA analysis. Journal O f Microbiology 43: 144-151.
Kirchman, D., Sigda, J., Kapuscinski, R., and Mitchell, R. (1982) Statistical-Analysis of the Direct Count Method for Enumerating Bacteria. Applied and Environmental Microbiology 44: 376-382.
Kita, I., Matsuo, S., and Wakita, H. (1982) H-2 Generation By Reaction Between H2O And Crushed Rock - An Experimental-Study On H-2 Degassing From The Active Fault Zone. Journal O f Geophysical Research 87: 789-795.
Kittelmann, S., and Friedrich, M.W. (2008) Novel uncultured Chloroflexi dechlorinate perchloroethene to trans- dichloroethene in tidal flat sediments. Environmental Microbiology 10: 1557-1570.
Kormas, K.A., Tivey, M.K., Von Damm, K., and Teske, A. (2006) Bacterial and archaeal phylotypes associated with distinct mineralogical layers of a white smoker spire from a deep-sea hydrothermal vent site (9 degrees N, East Pacific Rise). Environmental Microbiology 8 : 909-920.
Kostka, J.E., Stucki, J.W., Nealson, K.H., and Wu, J. (1996) Reduction of structural Fe(III) in Smectite by a pure culture of Shewanella putrefaciens strain MR-1. Clays Clay Miner 44: 522-529.
Kostka, J.E., Dalton, D.D., Skelton, H., Dollhopf, S., and Stucki, J.W. (2002) Growth of Fe(III) reducing bacteria on clay minerals as the sole electron acceptor and comparison of growth yields on a variety of oxidized iron forms. Applied and Environmental Microbiology 6 8 : 6256-6262.
Kristjansson, J.K., Schonheit, P., and Thauer, R.K. (1982) Different Ks-Values for Hydrogen of Methanogenic Bacteria and Sulfate Reducing Bacteria - an Explanation for the Apparent Inhibition of Methanogenesis by Sulfate. Archives o f Microbiology 131: 278-282.
Kuenen, G.J. (2008) Anammox bacteria: from discovery to application. Nature Reviews Microbiology 6 : 320-325.
Kumar, S., Tamura, K., Jakobsen, I.B., and Nei, M. (2001) MEGA2: molecular evolutionary genetics analysis software. Bioinformatics 17: 1244-1245.
249

References
Kuypers, Sliekers, A.O., Lavik, G., Schmid, M., Jorgensen, B.B., and Keunen,J.G. (2003) Anaerobic ammonium oxidation by anammox bacteria in the Black Sea. Nature 422: 608-611.
Lake, J.A. (1994) Reconstructing Evolutionary Trees from DNA and Protein Sequences - Paralinear Distances. Proceedings o f the National Academy o f Sciences o f the United States o f America 91: 1455-1459.
Lane, D.J. (1991) In 6S/23S rRNA sequencing. Nucleic Acid Techniques in Bacterial Systematics. Stackebrandt, E., and Goodfellow, M. (eds). New York: John Wiley and Sons, pp. 115-175.
Lepage, E., Marguet, E., Geslin, C., Matte-Tailliez, O., Zillig, W., Forterre, P., and Tailliez, P. (2004) Molecular diversity of new Thermococcales isolates from a single area of hydrothermal deep-sea vents as revealed by randomly amplified polymorphic DNA fingerprinting and 16S rRNA gene sequence analysis. Applied And Environmental Microbiology 70: 1277-1286.
Lewan, M.D., and Fisher, J.B. (1994) Organic acids from petroleum source rocks. In Pittman, E.D. and Lewan, M.D., eds Organic Acids in Geological Processes: New York, Springer-Verlag: 70-114.
Liermann, L.J., Barnes, A.S., Kalinowski, B.E., Zhou, X.Y., and Susan, L. (2000) Microenvironments of pH in biofilms grown on dissolving silicate surfaces. Chemical Geology 171: 1-16.
Lin, L.H., Slater, G.F., Lollar, B., Sherwood., Lacrampe-Couloume, G., and Onstott, T.C.(2005) The yield and isotopic composition of radiolytic H2, a potential energy source for the deep subsurface biosphere. Geochimica et Cosmochimica Acta 69: 893-903.
Lin, L.H., Onstott, T.C., Lippmann, J., Ward, J., Hall, J., and Lollar, B.S. (2002) Radiolytic H-2 in continental crust: A potential energy source for microbial metabolism in deep biosphere. Geochimica Et Cosmochimica Acta 6 6 : A457-A457.
Lin, L.H., Wang, P.L., Rumble, D., Lippmann-Pipke, J., Boice, E., Pratt, L.M. et al.(2006) Long-term sustainability of a high-energy, low-diversity crustal biome. Science 314: 479-482.
Lipp, J.S., Morono, Y., Inagaki, F., and Hinrichs, K.-U. (2008) Significant contribution of Archaea to extant biomass in marine subsurface sediments. Nature 454: 991-994.
Lippmann, J., Stute, M., Torgersen, T., Moser, D.P., Hall, J.A., Lin, L. et al. (2003) Dating ultra-deep mine waters with noble gases and Cl-36, Witwatersrand Basin, South Africa. Geochimica Et Cosmochimica Acta 67: 4597-4619.
250

References
Ljungdahl, L.G. (1994) The acetyl-CoA pathway and the chemiosmotic generation of ATP during acetogenesis. In: Acetogenesis, H.L Drake, ED: New York: Chapman &Hall: 63-87.
Lockhart, P.J., Larkum, A.W.D., Steel, M.A., Waddell, P.J., and Penny, D. (1996) Evolution of chlorophyll and bacteriochlorophyll: The problem of invariant sites in sequence analysis. Proceedings o f the National Academy o f Sciences o f the United States of America 93: 1930-1934.
Lollar, B., Sherwood., Frape, S.K., Weise, S.M., Fritz, P., Macko, S.A., and Welhan, J.A. (1993) Abiogenic methanogenesis in crystalline rocks. Geochimica et Cosmochimica Acta 57: 5087-5097.
Lollar, B., Sherwood., Voglesonger, K., Lin, L.-K., Lacrampe-couloume, L., Telling, J., Abrajano, T.A. et al. (2007) Hydrogeologic Controls on the Episodic H2 realease from Precambrian fractured rocks-Energy for the Deep Subsurface Life on Earth and Mars. Astrobiology 7: 971-986.
Losekann, T., Knittel, K., Nadalig, T., Fuchs, B., Niemann, H., Boetius, A., and Amann, R. (2007) Diversity and abundance of aerobic and anaerobic methane oxidizers at the haakon mosby mud volcano, barents sea. Applied and Environmental Microbiology 73: 3348-3362.
Lovley, D.R. (1993) Dissimilatory metal reduction. Annual reviews microbiology 47: 263-290.
Lovley, D.R. (2000) Fe(lII) and Mn(IV) reduction. IN: The Prokaryotes; edited by Dworkin M, Falkow S, Rosenburg E, Schleifer K-H, Stackebrandt E. New York;Springer- Verlag, INC.
Lovley, D.R. (2004) Dissimilatory Fe(III) and Mn(IV) reduction. Advances in microbial physiology 49: 219-286.
Lovley, D.R., and Philips, E.J.P. (1987) Competitive mechanisms for inhibition of sulfate reduction and methane production in the zone of ferric iron reduction in sediments. Applied and Environmental Microbiology 53: 2636-2641.
Lovley, D.R., and Goodwin, S. (1988) Hydrogen concentrations as an indicator of the predominant terminal electron-accepting reaction in aquatic sediments. Geochimica et Cosmochimica Acta 52: 2993-3003.
Lovley, D.R., and Phillips, E.J.P. (1994) Novel Processes for anaerobic sulfate production from elemental sulfur by sulfate-reducing bacteria. Applied and Environmental Microbiology 60: 2394-2399.
251

References
Lovley, D.R., and Philips, E.J.P. (1994) Reduction of chromate by Desulfovibrio vulgaris and its C3 cytochrome. Applied and Environmental Microbiology 60: 726-728.
Lovley, D.R., and Chapelle, F.H. (1995) Deep subsurface microbial processes. Reviews o f Geophysics 33: 365-381.
Lovley, D.R., Chapelle, F.H., and Woodward, J.C. (1994) Use of dissolved H2 concentrations to determine the distribution of microbially catalyzed redox reactions in anoxic ground water. Environ. Sci. Technol. 28: 1205-1212.
Lovley, D.R., Roden, E.E., Phillips, E.J.P., and Woodward, J.C. (1993a) Enzymatic iron and uranium reduction by sulfate-reducing bacteria. Marine Geology 113: 41-53.
Lovley, D.R., Coated, J.D., Blunt-Harris, E.L., Phillips, E.L., and Woodward, J.C. (1996) Humic substances as electron acceptors for microbial respiration. Nature 382: 445-448.
Lovley, D.R., Kashefi, K., Vargas, M., Tor, J.M., and Blunt-Harris, E.L. (2000)Reduction of humic substances and Fe(III) by hyperthermophilic microorganisms. Chemical Geology 169: 289-298.
Lovley, D.R., Giovannoai, S.J., White, D.C., Champine, J.E., Philips, E.J.P., Gorby,Y.A., and Goodwin, S. (1993b) Geobacter metallireducens gen.nov.sp.nv., a microorganism capable of coupling the complete oxidation of organic compunds to the redcution of iron and other metals. Archives o f Microbiology 159: 336-344.
Lupton, F.S., and Zeikus, J.G. (1984) Physiological basis for sulfate-dependent hydrogen competition between sulfidogens and methanogens. Current Microbiology 11: 7-12.
Machel, H.G. (1998) Gas souring by thermochemical sulfate reduction at 140 C. Am. Assoc. Pet. Geol. Bull. 82: 1870-1873.
Machel, H.G. (2001) Bacterial and thermochemical sulfate reduction in diagenetic settings-old and new insights. Sedimentaiy Geology 140: 143-175.
Machel, H.G., and Foght, J. (2000) Products and depth limits of microbial activity in petroliferous subsurface settings. In Microbial Sediments. Awramik, R. (ed). Berlin: Springer, pp. 105-120.
Macy, J.M., Santini, J.M., Pauling, B.V., O'Neill, A.H., and Sly, L.I. (2000) Two new arsenate/sulphate-reducing bacteria: Mechanisms of arsenate reduction. Archives o f Microbiology 173: 49-57.
Malinovskaya, I.M., Kosenko, L.V., Votselko, S.K., and Podgorsjkii, V.S. (1990) Role of Bacillus mucilaginosus polysaccharide in degradation of silicate minerals.Mikrobiologiya 59: 49-55.
252

References
Marchesi, J.R., Weightman, A.J., Cragg, B.A., Parkes, R.J., and Fry, J.C. (2001) Methanogen and bacterial diversity and distribution in deep gas hydrate sediments from the Cascadia Margin as revealed by 16S rRNA molecular analysis. FEMS Microbiology Ecology 34: 221-228.
McCollom, T.M., and Shock, E.L. (1997) Geochemical constraints on chemolithoautotrophic metabolism by microorganisms in seafloor hydrothermal systems. Geochimica et Cosmochimica Acta. 61: 4375 - 4391.
McCollom, T.M., and Seewald, J.S. (2001) A reassessment of the potential for the reduction of the dissolved C02 to hydrocarbons during serpentinization of olivine. Geochemica et Cosmochimica Acta 65: 3769-3778.
McCollom, T.M., and Seewald, J.S. (2007) Abiotic sythesis of organic compounds in deep sea hydrothermal environments. Chemical reviews 107: 382-401.
Miller, A.E.J. (1999) Seasonal investigations of dissolved organic carbon dynamics in the Tamar Estuary, UK. Estuarine Coastal and Shelf Science 49: 891-908.
Mills, H.J., Hodges, C., Wilson, K., MacDonald, I.R., and Sobecky, P.A. (2003) Microbial diversity in sediments associated with surface- breaching gas hydrate mounds in the Gulf of Mexico. Ferns Microbiology Ecology 46: 39-52.
Morita, R.Y. (1999) Is H-2 the universal energy source for long-term survival? Microbial Ecology 38: 307-320.
Mulder, A., Vandegraff, A.A., Robertson, L.A., and Kuenen, J.G. (1995) Ananerobic ammonium oxidation discovered in a denitrifying fluidized-bed reactor. Ferns Microbiology ecology 16: 177-183.
Muyzer, G., and Stams, A., J,M. (2008) The ecology and biotechnology of sulphate- reducing bacteria. Nature Reviews Microbiology 6 : 441-454.
Muyzer, G., Dewaal, E.C., and Uitterlinden, A.G. (1993) Profiling of Complex Microbial-Populations by Denaturing Gradient Gel-Electrophoresis Analysis of Polymerase Chain Reaction-Amplified Genes-Coding for 16s Ribosomal-Rna. Applied and Environmental Microbiology 59: 695-700.
Muyzer, G., Brinkhoff, T., Nubel, U., Santegoeds, C., Schafer, H., and Wawer, C. (1998) Denaturing gradient gel electrophoresis (DGGE) in microbial ecology. In Molecular microbial ecology Manual. Akkermans, A., Van Elsas, J.D., and De Bruijin, F., J (eds): Kluwer Academic Publishers, pp. 1-27.
253

References
Nanninga, H.L., and Gottschal, J.C. (1987) Properties of Desulfovibrio carbinolicus sp.nov and other sulfate reducing bacteria isolated from an anaerobic purification planet. Applied and Environmental Microbiology 53: 802-809.
Nazina, T.N., Ivanova, A.E., kanchaveli, L.P., and Rozanova, E.P. (1987) A new spore forming thermophilic methylotrophic sulphate reducing bacterium Desulfotomaculum kuznetsovii sp.nov. Mikrobiologiia 57: 823-827.
Neubauer, H., and Gotz, F. (1996) Physiology and interaction of nitrate and nitrite reduction in Staphylococcus camosus. Journal o f Bacteriology 178: 2005-2009.
Newberry, C.J., Webster, G., Cragg, B.A., Parkes, R.J., Weightman, A.J., and Fry, J.C.(2004) Diversity of prokaryotes and methanogenesis in deep subsurface sediments from the Nankai Trough, Ocean Drilling Program Leg 190. Environmental Microbiology 6 : 274-287.
Newman, D.K., and Kolter, R.A. (2000) A role for excreted quinones in extracellular electron transfer. Nature 405: 94-97.
Nichols, D.S. (2003) Prokaryotes and the input of polyunsaturated fatty acids to the marine food web. Ferns Microbiology Letters 219: 1-7.
Nicol, G.W., Glover, L.A., and Prosser, J.L. (2003) The impact of grassland management on archaeal community structure in upland pasture rhizosphere soil. Environmental Microbiology 5: 152-162.
Niewohner, C., Hensen, C., Kasten, S., Zabel, M., and Schulz, H.D. (1998) Deep sulfate reduction completely mediated by anaerobic methane oxidation in sediments of the upwelling area off Namibia. Geochimica Et Cosmochimica Acta 62: 455-464.
O'Sullivan, L.A., Webster, G., Fry, J.C., Parkes, R.J., and Weightman, A.J. (2008) Modified linker- PCR primers facilitate complete sequencing of DGGE DNA fragments. Journal o f Microbiological Methods: In press doi: 10.1016/j .mimet.2008.1008.1006.
Oremland, R.S., and Polcin, S. (1982) Methanogenesis and Sulfate Reduction - Competitive and Noncompetitive Substrates in Estuarine Sediments. Applied and Environmental Microbiology 44: 1270-1276.
Oremland, R.S., and Capone, D.G. (1988) Use of Specific Inhibitors in Biogeochemistry and Microbial Ecology. Advances in Microbial Ecology 10: 285-383.
Orphan, V.J., House, C.H., Hinrichs, K.U., McKeegan, K.D., and DeLong, E.F. (2001a) Methane-consuming archaea revealed by directly coupled isotopic and phylogenetic analysis. Science 293: 484-487.
254

References
Orphan, V.J., Hinrichs, K.U., Ussier, W., Pauli, C.K., Taylor, L.T., Sylva, S.P. et al. (2001b) Comparative analysis of methane-oxidizing archaea and sulfate- reducing bacteria in anoxic marine sediments. Applied and Environmental Microbiology 67: 1922- 1934.
Pancost, R.D., Damste, J.S.S., de Lint, S., van der Maarel, M., and Gottschal, J.C. (2000) Biomarker evidence for widespread anaerobic methane oxidation in Mediterranean sediments by a consortium of methanogenic archaea and bacteria. Applied and Environmental Microbiology 6 6 : 1126-1132.
Parkes, R.J., Gibson, G.R., Mueller-Harvey, I., Buckingham, W.J., and Herbert, R.A. (1989) Determination of the Substrates for Sulfate-Reducing Bacteria within Marine and Estuarine Sediments with Different Rates of Sulfate Reduction. Journal o f General Microbiology 135: 175-187.
Parkes, R.J., Dowling, N.J.E., White, D.C., Herbert, R.A., and Gibson, G.R. (1993) Characterization of Sulfate-Reducing Bacterial-Populations within Marine and Estuarine Sediments with Different Rates of Sulfate Reduction. Ferns Microbiology Ecology 102: 235-250.
Parkes, R.J., Wellsbury, P., Mather, I.D., Cobb, S.J., Cragg, B.A., Homibrook, E.R.C., and Horsfield, B. (2007) Temperature activation of organic matter and minerals during burial has the potential to sustain the deep biosphere over geological timescales. Organic Geochemistry 38: 845-852.
Parkes, R.J., Cragg, B.A., Bale, S.J., Getliff, J.M., Goodman, K., Rochelle, P.A. et al. (1994) Deep Bacterial Biosphere in Pacific-Ocean Sediments. Nature 371: 410-413.
Parkes, R.J., Cragg, B.A., Webster, G., Weightman, A.J., Newberry, C.J., Ferdelman, T. et al. (2005) Deep sub-seafloor prokaryotes stimulated at interfaces over geological time. Nature 436: 390-394.
Pedersen, K. (1997) Microbial life in deep granitic rock. Episodes 20: 7-9.
Perevalova, A.A., Svetlichny, V.A., Kublanov, I.V., Chernyh, N.A., Kostrikina, N.A., Tourova, T.P. et al. (2005) Desulfurococcus fermentans sp. nov., a novel hyperthermophilic archaeon from a Kamchatka hot spring, and emended description of the genus Desulfurococcus. Int. J. Syst. Evol. Microbiol. 55: 995-999.
Raghoebarsing, A.A., Pol, A., van de Pas-Schoonen, K.T., Smolders, A.J.P., Ettwig, K.F., Rijpstra, W.I.C. et al. (2006) A microbial consortium couples anaerobic methane oxidation to denitrification. Nature 440: 918-921.
Ragsdale, S.W. (1997) The eastern and western branches of the wood/Ljungdahl pathway: How the east and west was won. Biofactors 6 : 3-11.
255

References
Reeburgh, W.S. (1976) Methane consumption in Cariaco trench waters and sediments. Earth and Planetary Science Letters 28: 337-344.
Reeburgh, W.S. (1980) Anaerobic methane oxidation: rate depth distribution in Skan Bay sediments. Earth and Planetary Science Letters 47: 345-352.
Reed, D.W., Fujita, Y., Delwiche, M.E., Blackwelder, D.B., Sheridan, P.P., Uchida, T., and Colwell, F.S. (2002) Microbial communities from methane hydrate-bearing deep marine sediments in a forearc basin. Applied and Environmental Microbiology 6 8 : 3759- 3770.
Reguera, G., McCarthy, K.D., Mehta, T., Nicoll, J.S., Tuominen, M.T., and Lovley, D.R.(2005) Extracellular electron transfer via microbial nanowires. Nature 435: 1098-1101.
Reysenbach, A.L., Liu, Y.T., Banta, A.B., Beveridge, T.J., Kirshtein, J.D., Schouten, S. et al. (2006) A ubiquitous thermoacidophilic archaeon from deep-sea hydrothermal vents. Nature 442: 444-447.
Roden, E.E., and Zachara, J.M. (1996) Microbial reduction of crystalline iron (III) oxides: influence of oxide surface area and potential for cell growth. Environmental Science and Technology 30: 1618-1628.
Roh, Y., Liu, S.V., Li, G.S., Huang, H.S., Phelps, T.J., and Zhou, J.Z. (2002) Isolation and characterization of metal-reducing Thermoanaerobacter strains from deep subsurface environments of the Piceance Basin, Colorado. Applied and Environmental Microbiology 6 8 : 6013-6020.
Rother, M., and Metcalf, W.W. (2004) Anaerobic growth of Methanosarcina acetivorans C2A on carbon monoxide: An unusual way of life for a methanogeneic archaeon. Proceedings o f the National Academy o f Sciences o f the United States o f America 101: 16929-16934.
Roussel, E.G., Cambon, B.M.A., Querellou, J., Cragg, B.A., Webster, G., Prieur, D., and Parkes, R.J. (2008) Extending the Sub-Sea-Floor Biosphere. Science 320: 1046.
Sass, A., Rutters, H., Cypionka, H., and Sass, H. (2002) Desulfobulbus mediterraneus sp nov., a sulfate-reducing bacterium growing on mono- and disaccharides. Archives o f Microbiology 177: 468-474.
Sass, H., Wieringa, E., Cypionka, H., Babenzien, H.D., and J., O. (1998) High genetic and physiological diversity of sulfate-reducing bacteria isolated from an oligotrophic lake sediment. Archives o f Microbiology 170: 243 - 251.
Schink, B. (1997) Energetics of syntrophic cooperation in methanogenic degradation. Microbial. Mol. Biol.Rev 61: 262-280.
256

References
Schippers, A., Neretin, L., N., Kallmeyer, J., Ferdelman, T.G., Cragg, B.A., Parkes, R.J., and J0rgensen, B.B. (2005) Prokaryotic cells of the deep sub-seafloor biosphere identified as living bacteria. Nature 433: 861-864.
Schmid, M., Mass, B., Dapena, K., van de Pas-Schoonen, K.T., van de Vossenberg, B., Kartal, B. et al. (2005) Biomarkers for insitu detection of anaerobic ammonium-oxidizing (anammox) bacteria. Applied and Environmental Microbiology 71: 1677-1684.
Schoell, M. (1988) Origins of methane in the Earth. Chemical Geology 71.Schonheit, P., Knstjensson, J.K., and Thauer, R.K. (1982) Kinetic mechanism for the ability of sulfate-reducers to out-compete methanogenes for acetate. Arcives for Microbiology 132: 285 - 288.
Seewald, J.S. (2001) Aqueous geochemistry of low molecular weight hydrocarbons at elevated temperatures and pressures: constraints from mineral buffered laboratory experiments. Geochimica et Cosmochimica Acta 65: 1641-1664.
Segerer, A., Langworthy, T.A., and Stetter, K.O. (1988) Thermoplasma acidophilum and Thermoplasma volcanium sp. nov. from solfataric fields. Syst Appl Microbiol 10: 161- 171.
Sleep, N.H., Meibom, A., Fridriksson, T., Coleman, R.G., and Bird, D.K. (2004) H2-rich fluids from serpentinization: Geochemical and biotic implications. Proceedings o f the National Academy o f Sciences o f the United States o f America 101: 12818-12823.
Slobodkin, A., Reysenbach, A.L., Mayer, F., and Wiegel, J. (1997) Isolation and characterization of the homoacetogenic thermophilic bacterium Moorella glycerini sp. nov. International Journal O f Systematic Bacteriology 47: 969-974.
Smith, K.L. (1978) Benthic Community Respiration in the N.W, Atlantic Ocean in situ Measurements from 40-5,200 m. Marine Biology 47: 337-347.
Sorensen, K.B., Finster, K., and Ramsing, N.B. (2001) Thermodynamic and Kinetic requirements in anaerobic methane oxidizing consorta exclude hydrogen, acetate and methanol as possible electron shuttles. Microbial Ecology 42: 1-10.
Spear, J.R., Walker, J.L., McCollom, T.M., and Pace, N.R. (2005) Hydrogen and bioenergetics in the yellowstone geothermal ecosytem. Proceedings o f the National Academy o f Sciences o f the United States ofAmerica 102: 2555-2560.
Spinks, J.W.T., and Woods, R.J. (1990) An introduction to Radiation Chemistry. John Wiley & Sons, New York.
Stephens, J.A., Uncles, R.J., Barton, M.L., and F., F. (1992) Bulk properties of intertidal sediments in a muddy, macrotidal estuary. Marine Geology 103: 445-460.
257

References
Stetter, K.O., Huber, R., Blochl, E., Kurr, M., Eden, R.D., Fielder, M. et al. (1993) Hyperthermophilic Archaea Are Thriving in Deep North-Sea and Alaskan Oil- Reservoirs. Nature 365: 743-745.
Stetter, K.O., Thomm, M., Winter, J., Wildgruber, G., Huber, H., Zillig, W. et al. (1981) Methanothermus-Fervidus, Sp-Nov, A Novel Extremely Thermophilic Methanogen Isolated From An Icelandic Hot-Spring. Zentralblatt Fur Bakteriologie Mikrobiologie Und Hygiene I Abteilung Originate C-Allgemeine Angewandte Und Okologische Mikrobiologie 2: 166-178.
Stevens, T.O., and McKinley, J.P. (1995) Lithoautotrophic Microbial Ecosystems in Deep Basalt Aquifers. Science 270: 450-454.
Stevens, T.O., and McKinley, J.P. (2000) Abiotic controls on H-2 production from basalt-water reactions and implications for aquifer biogeochemistry. Environmental Science & Technology 34: 826-831.
Stookey, L.L. (1970) Ferrozine - a new spectrophotometric reagent for iron. Analytical Chemistry 42: 779-781.
Straub, K.L., Benz, M., Schink, B., and Widdel, F. (1996) Anaerobic, nitrate-dependent microbial oxidation of ferrous iron. Applied and Environmental Microbiology 62: 1458- 1460.
Strous, M., Kuenen, J.G., and Jetten, M.S.M. (1999a) Key physiology of anaerobic ammonium oxidation. Applied and Environmental Microbiology 65: 3248-3250.
Strous, M., Fuerst, J.A., Kramer, E.H.M., Logemann, S., Muyzer, G., van de Pas- Schoonen, K.T. et al. (1999b) Missing lithotroph identified as new planctomycete. Nature 400: 446-449.
Stumm, W., and Morgan, J.J. (1996) Aquatic chemistry; chemical equilibra and rates in natural waters. John Wiley & Sons, New York: 1022 pp.
.1Takai, K , Gamo, T., Tsunogai, U., Nakayama, N., Hirayama, H., Nealson, K., and Horikoshi, K. (2004) Geochemical and microbiological evidence for a hydrogen-based, hyperthermophilic subsurface lithoautotrophic microbial ecosystem (HyperSLiME) beneath an active deep-sea hydrothermal field. Extremophiles 8 : 269-282.
Tanimoto, Y., and Bak, F. (1994) Anaerobic degradation of methylmercaptan and dimethyl sulfide by newly isolated thermophilic sulfate-reducing bacteria. Applied and Environmental Microbiology 60: 2450-2455.
Taylor, B.F., and Oremland, R.S. (1979) Depletion Of Adenosine-Triphosphate In Desulfovibrio By Oxyanions Of Group-Vi Elements. Current Microbiology 3: 101-103.
258

References
Taylor, S.R., and McLennan, S.M. (1985) The continental crust; its composition and evolution. Oxford: Blackwell.
Telling, J., Homibrook, E., R,C., and Parkes, R.J. (2004) Microbial reactions in marine sediments. In Hydrogeology o f the oceanic lithosphere. Davis, E., and Elderfield, H.(eds). Cambridge: University Press., pp. 579-605.
Temple, K.L., and Colmer, A.R. (1951) The autotrophic oxidation of iron by a new bacterium, Thiobacillus ferrooxidans. JBacteriol 62 62: 605-611.
Teske, A. (2006) Microbial communities of deep marine subsurface sediments: molecular and cultivation surveys. Geomicrobiology journal 23: 357-368.
Teske, A., and Sorensen, K.B. (2008) Uncultured archaea in deep marine subsurface sediments: have we caught them all? Isme Journal 2: 3-18.
Teske, A., Hinrichs, K.U., Edgcomb, V., Gomez, A.D., Kysela, D., Sylva, S.P. et al. (2002) Microbial diversity of hydrothermal sediments in the Guaymas Basin: Evidence for anaerobic methanotrophic communities. Applied and Environmental Microbiology 6 8 : 1994-2007.
Thamdrup, B., and Dalsgaard, T. (2002) Production of N2 through Anaerobic Ammonium Oxidation Coupled to Nitrate Reduction in Marine Sediments. Applied and Environmental Microbiology 6 8 : 1312-1318.
Thamdrup, B., Finster, K., Hansen, W.J., and Bak, F. (1993) Bacterial disproportionation of elemental sulfur coupled to chemical reduction of iron or manganese. Applied and Environmental Microbiology 59: 101-108.
Thauer, R.K. (1998) Biochemistry of methanogenesis: a tribute to Marjory Stephenson. Microbiology 144: 2377-2406.
Thauer, R.K., Jungerman, K., and Decker, K. (1977) Energy conservation in chemotrophic anaerobic bacteria. Bacteriol. Rev 41: 100-180.
Thiele, J.H., and Zeikus, J.G. (1989) Control of interspecies electron transfere during anaerobic digestion: significance of formate transfer versus hydrogen transfer during synthrophic methanogenesis in floes. Applied and Environmental Microbiology 54: 20- 29.
Thompson, J.D., Gibson, T.J., Plewniak, F., Jeanmougin, F., and Higgins, D.G. (1997) The CLUSTAL X windows interface: flexible strategies for multiple sequence alignment aided by quality analysis tools. Nucleic Acids Research 25: 4876-4882.
259

References
Tor, J.M., Kashefi, K., and Lovley, D.R. (2001) Acetate oxidation coupled to Fe(III) reduction in hyperthermophilic microorganisms. Applied and Environmental Microbiology 1363-1365.
Turick, C.E., Tisa, L., and Caccavo, F. (2002) Melanin production and use as a soluble electron shuttle for Fe(III) oxide reduction and as a terminal electron acceptor by Shewanella algae BrY. Applied and Environmental Microbiology 6 8 : 2436-2444.
Valentine, D.L. (2002) Biogeochemistry and microbiol ecology of methane oxidation in anoixc environments: A review. Antonie Van Leeuwenhoek 81: 271-282.
Vargas, M., Kashefi, K., Blunt-Harris, E.L., and Lovley, D.R. (1998) Microbiological evidence for Fe (III) reduction on early Earth. Nature 395: 065.
Von Damm, K.L. (1995) Controls on the chemistry and temporal variability of seafloor hydrothermal fluids. In Seafloor Hydrothermal systems: Physical, Chemical, Biological and Geological Interactions. Humpris, S.E., Zierenberg, R.A., Mullineaux, L.S., and Thomson, R.E. (eds): American geophysical union, pp. 222-247.
Wakita, H., Nakayama, Y., Kita, I., Fujiii, N., and Notsu, K. (1980) Hydrogen Release: New Indicator of Fault Activity. Science 210: 188-190.
Watson, P.G., Flickers, P.E., and Goodchild, C.M. (1985 a) Spatial and seasonal variations in the chemistry of sediment interstitial waters in the Tamar Estuary. Est. Coastal. Marine Sci. 21: 105-119.
Watson, P.G., Flickers, P.E., and Goodchild, C.M. (1985 b) A comparison of nutrients in the interstitial water of reducing (Tamar) and oxic (Carmarthen Bay) coastal sediments. Netherlands Journal o f Sea Research 19: 231-239.
Weber, K.A., Achenbach, L.A., and Coates, J.D. (2006a) Microorganisms pumping iron: anaerobic microbial iron oxidation and reduction. Nature Reviews Microbiology 4: 752- 764.
Weber, K.A., Urrutia, M.M., Churchill, P.F., Kukkadapu, R.K., and Roden, E.E. (2006b) Anaerobic redox cycling of iron by freshwater sediment microorganisms. Environmental Microbiology8 : 100-113.
Weber, K.A., Pollock, J., Cole, K.A., O’Connor, S.M., Achenbach, L.A., and Coates, J.D. (2006c) Anaerobic nitrate-dependent iron(II) bio-oxidation by a novel lithoautotrophic betaproteobacterium, strain 2002. Applied And Environmental Microbiology 72: 686-694.
Webster, G., Embley, T.M., and Prosser, J.I. (2002) Grassland management regimens reduce small-scale heterogeneity and species diversity of beta-proteobacterial ammonia oxidizer populations. Applied and Environmental Microbiology 6 8 : 20-30.
260

References
Webster, G., Newberry, C.J., Fry, J.C., and Weightman, A.J. (2003) Assessment of bacterial community structure in the deep sub- seafloor biosphere by 16S rDNA-based techniques: a cautionary tale. Journal o f Microbiological Methods 55: 155-164.
Webster, G., Parkes, R.J., Fry, J.C., and Weightman, A.J. (2004) Widespread Occurrence of a Novel Division of Bacteria Identified by 16S rRNA Gene Sequences Originally Found in Deep Marine Sediments. Appl. Environ. Microbiol.
Webster, G., Embley, T.M., Freitag, T.E., Smith, Z., and Prosser, J.I. (2005) Links between ammonia oxidizer species composition, functional diversity and nitrification kinetics in grassland soils. Environmental Microbiology 7: 676-684.
Webster, G., Parkes, R.J., Cragg, B.A., Newberry, C.J., Weightman, A.J., and Fry, J.C.(2006) Prokaryotic community composition and biogeochemical processes in deep subseafloor sediments from the Peru Margin. Fems Microbiology Ecology 58: 65-85.
Welch, S.A., Barker, W.W., and Banfield, J.F. (1999) Microbial extracellular polysaccharides and plagioclase dissolution. Geochemica et Cosmochimica Acta 63: 1405-1419.
Wellsbury, P., and Parkes, R.J. (1995) Acetate Bioavailability and Turnover in an Estuarine Sediment. Fems Microbiology Ecology 17: 85-94.
Wellsbury, P., Mather, I., and Parkes, R.J. (2002) Geomicrobiology of deep, low organic carbon sediments in the Woodlark Basin, Pacific Ocean. FEMS Microbiology Ecology 42: 59-70.
Wellsbury, P., Goodman, K., Barth, T., Cragg, B.A., Barnes, S.P., and Parkes, R.J. (1997) Deep marine biosphere fuelled by increasing organic matter availability during burial and heating. Nature 388: 573-576.
Wetzel, L.R., and Shock, E.L. (2000) Distinguishing ultramafic-hosted from basalt- hosted submarine hydrothermal systems by comparing calculated vent fluid compositions. Journal o f Geophysical Research 105: 8319-8340.
Whiticar, M.J. (1994) Correlation of natural gases with their sources. In: The petroluem system-from source to trap. AAPG memor 60: 261-284.
Whiticar, M.J. (1999) Carbon and hydrogen isotope systematics of bacterial formation and oxidation of methane. Chemical Geology 161: 291-314.
Whiticar, M.J., Faber, E., and Schoell, M. (1986) Biogenic methane formation in marine and freshwater environments: C 0 2 reduction vs acetate fermentation - isotope evidence. Geochim. Cosmochim Acta 50: 693-709.
261

References
Whitman, W.B., Coleman, D.C., and Wiebe, W.J. (1998) Prokaryotes: The unseen majority. Proceedings o f the National Academy o f Sciences o f the United States 95: 6578 -6583.
Widdel, F. (1986) Growth of methanogenic bacteria in pure culture with 2-propanol and other alcohols as hydrogen donors. Applied and Environmental Microbiology 51: 1056- 1062.
Widdel, F. (1988) Microbiology and ecology of sulfate and sulfur reducing bacteria. In Biology o f anaerobic Microorganisms. Zehnder, A.J.B. (ed). New York: John Wiley, pp. 469-585.
Wilhelms, A., Larter, S.R., Head, I., Farrimond, P., di-Primio, R., and Zwach, C. (2001) Biodegradation of oil in uplifted basins prevented by deep- burial sterilization. Nature 411: 1034-1037.
Winfrey, M.R., and Ward, D.M. (1983) Substrates for sulfate reduction and methane production in intertidal sediment. Applied Environ. Micro. 45: 193-199.Wood, H.G. (1991) Life with CO or CO2 and H2 as a soure of carbon and energy. FASEB.J 5: 156-163.
Wood, H.G., and Ljungdahl, L.G. (1991) Autotrophic character of acetogenic bacteria. In Variations in Autotrophic Life. Shively, J.M., and Barton, L.L. (eds). San Diego Ca: Academic Press, pp. 202-250.
Yoshida, N., Yagi, K., Sato, D., Watanabe, N., Kuroishi, T., Nishimoto, K. et al. (2005) Bacterial communities in petroleum oil in stockpiles. J. Biosci. Bioeng.99: 143-149.
Zeikus, J. (1972) Methanobacterium thermoautotrophicus sp. n., an Anaerobic, Autotrophic, Extreme Thermophile. J Bacteriol. 109: 707-713.
Zyakun, A.M. (1992) Isotopes and their possible use as biomarkers of microbial end products. In Bacterial Gas. Vially, R. (ed). Paris: Editions Technip, pp. 27-46.
262

Appendix
Appendix
Appendix 1. 60 degree magnetite experimentType 1 magnetite from Fisher processedType 2 magnetite from natural source (Simon Cobb Bristol) no ICP-OES done
Acetate concentrations pmol I'1, 60°C magnetite incubationDays Control No mineral Type 1 Type 2 Type 2
22-63 pm _____ 22-63 pm 75-105 pm1 161 787 1052 529 3267 338 14.9 30.7 198 4513 9.5 9.6 8.6 4.620 10 34 5.2 8.1 13.427 57.5 14.2 67.7 9.9 9.534 9.7 8.8 7.1 5.7 8.641 15.5 7.1 20.548 45.2 16.919 19.6 25.2 21.554 4.6 2.3 2.8 13.269 9.6 11.5 11.3 12.7 4.376 16.5 15.7 2.2 13.5 17.683 17.1 26.8 19.5 37 22.290 4.6 14.8 8.6 8.5 9.297 14.3 19 14.3 6 12.1104 6.7 18.3 13.6 17.4 16.5111 11 40.1 13.1 11.6 23118 6.3 115.2 12.6 13.2 25.7124 12.7 192 25 14.9 60.8131 10.1 325.3 12.6 16.4 195.2138 1 593 3 6 327145152 1 913 21 9 531159 3 968 83 29 925166 2 1526 120 104 1025
Methane concentrations (PPMV) magnetite experiment 60°CDays Control No mineral Type 1 Type 2 Type 2
22-63 pm _____ 22-63 pm 75-105 pm1 8.3 37.2 32 18 287 134 743 445 384 57313 209 973 627 638 88620 275 1032 682 774 106627 324 1001 696 827 118434 311 1015 660 817 1196

Appendix
41 354 1013 405 891 121848 367 993 460 1031 123154 303 717 306 962 96669 369 790 373 1940 104676 327 873 403 1929 102683 292 879 358 2689 104190 349 901 387 2849 106797 362 930 308 2883 1023104 359 933 356 3746 1115111 376 919 378 4293 1130118 302 930 402 5004 1139124 343 942 377 5459 1144131 347 951 351 5983 1152138 348 973 352 6605 934145 343 989 359 6062 968152 349 1179 372 6923 1081159 391 1455 394 7192 1292166 359 1789 385 7855 1656173 356 1893 386 8089 1966
Carbon dioxide (PPMV) magnetite 60°CDays Control No mineral Type 1 Type 2 Type 2
22-63 pm__________ 22-63 pm 75-105 pm1 8524 2.05E+05 1.42E+05 1.43E+05 1.51E+057 51261 3.44E+05 2.52E+05 3.03E+05 2.82E+0513 68317 3.65E+05 2.95E+05 3.33E+05 2.98E+0520 87400 3.63E+05 3.11E+05 3.57E+05 3.25E+0527 1.10E+05 3.45E+05 3.35E+05 3.86E+05 3.62E+0534 1.06E+05 3.80E+05 3.40E+05 3.92E+05 3.72E+0541 1.35E+05 4.22E+05 3.68E+05 4.43E+05 4.18E+0548 1.68E+05 4.44E+05 3.68E+05 4.78E+05 4.40E+0554 1.42E+05 3.23E+05 2.27E+05 3.70E+05 3.35E+0569 1.83E+05 3.89E+05 2.69E+05 4.02E+05 3.64E+0576 1.69E+05 4.28E+05 3.21E+05 3.50E+05 3.60E+0583 1.54E+05 4.38E+05 3.04E+05 4.30E+05 3.69E+0590 1.99E+05 4.46E+05 3.56E+05 3.84E+05 3.83E+0597 2.11E+05 4.77E+05 2.88E+05 3.85E+05 3.73E+05104 2.13E+05 4.87E+05 3.30E+05 4.31E+05 4.10E+05111 2.15E+05 4.86E+05 3.45E+05 4.50E+05 4.24E+05118 1.84E+05 5.06E+05 3.51E+05 4.53E+05 4.37E+05124 2.18E+05 5.17E+05 3.68E+05 4.63E+05 4.51E+05131 2.27E+05 5.29E+05 3.41E+05 4.81E+05 4.67E+05138 2.31E+05 5.37E+05 3.49E+05 4.83E+05 3.82E+05145 2.42E+05 5.15E+05 3.59E+05 3.93E+05 3.93E+05152 2.48E+05 5.52E+05 3.73E+05 4.50E+05 4.02E+05159 2.58E+05 5.35E+05 3.79E+05 4.52E+05 4.16E+05

Appendix
166 2.67E+05 5.39E+05 3.96E+05 4.68E+05 4.31E+05173 3.07E+05 4.83E+05 4.52E+05 5.28E+05 4.33E+05
Hydrogen concentrations (PPMV) magnetite 60°CDays Control No mineral Type 1 Type 2 Type 2
22-63 pm _____ 22-63 pm 75-105 pm1 0 281 630 304 2997 610 0 0 0 013 0 0 0 0 020 0 609 0 0 027 133 109 0 0 37334 122 0 203 0 32641 163 0 0 235 40348 0 0 0 234 34054 0 0 0 219 069 0 0 0 0 076 0 0 0 0 083 0 0 0 0 090 0 0 0 0 097 0 0 833 359 0104 0 1483 794 1318 0111 0 1040 931 632 335118 0 1079 795 843 0124 0 1051 821 764 284131 0 1041 1055 817 975138 0 1103 1188 886 1465145 0 1559 1244 1069 0152 0 1921 1076 767 923159 0 2168 1395 1288 822166 0 1983 1311 1463 1398173 0 910 1745 597 525
Sulphate pmol I"1 magnetite 60°CDays Control No mineral Type 1 Type 2 Type 2
22-63 pm 22-63 pm 75-105 pm1 17610 15664 15770 15036 69537 15317 10880 11063 12349 1101913 14590 9411 9924 12723 629020 13095 14063 8155.9 9215 796027 12889 6152 6743 8025 708034 12044 5369 6865 7434 651141 11992 1191 5632 655748 9479 4665 5190 5655 493054 7499 3537 6250 556269 7327 2827 3755 4986 402676 8409 3088 4049 4492 3215

Appendix
83 6839 1787 3353 4403 351690 7203 1879 3123 3422 209397 6983 1050 2564 3124 2135104 5588 1061 2697 2768 1649111 5874 790 2447 2183 1238118 5683 488 2166 2067 1148124 5526 956 1315 1731 1671131 5237 509 1463 1495 990
Appendix 2. pH experimentMagnetite experiment using fisher magnetite at 60° not reground mineral. Different buffers and pH
Methane (PPMV)Days pipes bicarbonate
6.5 7.61 12 83 9 288 49 7215 120 19322 190 27929 256 29436 153 27244 164 28350 172 29357 179 30564 187 31871 195 32278 204 33485 214 34492 217 34799 229 348106 220 354
Carbon dioxide(PPMV)Days pipes bicarbonate
6.5 7.61 16595 470363 25178 697988 61563 1.06E+0515 1.09E+05 1.42E+0522 1.30E+05 1.87E+0529 1.43E+05 2.02E+0536 1.45E+05 2 .11E+05

Appendix
44 1.57E+05 2.09E+0550 1.59E+05 2.20E+0557 1.65E+05 2.28E+0564 1.73E+05 2.27E+0571 1.78E+05 2.35E+0578 1.79E+05 2.41E+0585 1.85E+05 2.50E+0592 1.85E+05 2.56E+0599 1.86E+05 2.14E+05106 1.90E+05 2 .18E+05
Hydrogen (PPMV)Days pipes bicarbonate
6.5 7.61 347 2003 0 08 0 015 0 022 0 029 0 036 0 044 0 050 0 057 0 064 0 071 0 078 0 085 0 0
(pmol I*1)Days pipes bicarbonate
6.5 7.6 6.5 7.6Acetate________Acetate sulphate sulphate
1 12.5 8.5 17916 1589249 152.8 161.6 14246 1613916 21 9.6 10978 1330923 19.9 8616 1112830 18 5.7 8642 94613745 7.1 8.9 9079 749351 8.8 8.5 8796 761958 8.1 6.7 7813 802665 7.8 6.4 7507 807972 10.7 6.6 6954 756879 18.1 7.3 6195 6888

Appendix
86 10.8 11.6 6515 6331

Appendix .3Various differing temperature initial experiment Magnetite (fisher) non ground No hydrogen detected.1= Days incubation 3=4°C sterile control 5=30°C sterile control 7=60°C sterile control2= 4°C 4=3 0°C 6=60°C 8= no mineral additonacetate imol I"1
1 2 3 4 5 6 7 80 50.5 270 40 390 640 320 12707 30.6 240.9 30.9 850.7 240.5 1240.9 230.514 20 .6 260.5 30.1 810.9 50.2 510 32021 40.5 260 30.6 930.7 60.3 50 490.528 30.7 240.2 30.8 1060.6 80 50.6 600.435 20.3 260.9 20.2 980.6 100.4 50.5 700.142 20.9 220.9 30.2 990 290.7 60 1170.849 20 .8 270.9 30.1 990.5 420.5 50.6 1220.556 20.9 310.1 40.9 1120.7 720.3 80.9 120063 23 160 10.4 824 664 32.2 924.670 51 56 4 1608 1376 130184 3 163 4 1544 1340 7.6 26.498 0 112 1183 768 26 340105 0 71.7 0 1263.5 436 17.2 226.5112 7.8 61.3 0 1176.1 169 9 416147 0 115 379 1262 1360 1024154 0 94.8 0 1502 1611 369161 0 95 15 1498 1488 314168 0 92.3 0 2006 1893.9 158182 0 209 5.7 1288 1520 89189 0 184 283 141 1353 101196 0 213 768 1166 1178 120231 0 156 2101 934 103 106

Methane (PPMV)1 2 3 4 5 6 7 8
0 25.16 4.6 1243 17.3 971 49.5 704.87 61.14 5.1 1668 29.15 2749 129.7 264314 73.6 5.8 1449 31.07 3939 169 1036121 104 6.3 189 37 5955.7 201 1366728 144 6.2 151.9 40.1 6219.2 216 1590835 178 6.7 178.1 40.4 6475 229 1732642 202 7.2 240 42 7759 236.8 1870449 220 6.2 296 41.1 10154 235 2797656 266 6.6 365 40.51 13630 257 5658363 238 12.7 461.8 40.7 22823 274.8 1.06E+0570 240 7 749 40 37827 298 67677 180 6 1159 40 1912 242 721784 221 7 3074 47 1.18E+05 289 2167191 11 3 4257 48 2260 231 2953198 188 7 6485 54 10032 245 42473105 184 7 10112 56 19222 253 53221112 198 7 15041 63 29107 277 63630119 116 6 16620 55 32026 176 72209126 174 7 32626 71 48859 300 90643133 168 5.7 39658 1490 72122140 158 7 81194 75 51551 1.33E+05147 133 163 93193 67 57545 1.59E+05154 164 5.6 1.06E+05 74 66025 1.87E+05161 182 138 1.04E+05 87 75475168 179 6.7 1.17E+05 122 87388175 183 6.5 1.28E+05 94 97783182 195 9 1.41E+05 848 1.14E+05

189 185 14 1.48E+05 94 1.31E+05196 188 17 1.53E+05 85 1.71E+05203 179 11 1.53E+05 66 1.84E+05 2.29E+05210 176 14 1.57E+05 77 1.88E+05217 159 7.09 1.56E+05 67 1.95E+05 2.31E+05
Carbon dioxide (PPMV)1 2 3 4 5 6 7 87 13825 352 65028 2506 2.54E+05 20188 2.56E+0514 16193 271 90355 4441 3.2395 45018 3.16E+0521 15749 402 98560 8732 3.40E+05 58026 3.09E+0528 20493 425 1.40E+05 12408 4.54E+05 92563 4.12E+0535 21215 133 1.46E+05 16135 4.36E+05 1.04E+05 4.27E+0542 22057 1.48E+05 19402 4.47E+05 1.14E+05 4.26E+0549 22530 1.50E+05 16612 4.62E+05 1.16E+05 3.84E+0556 23775 1.53E+05 22183 4.80E+05 1.18E+05 4.18E+0563 57585 1205 1.63E+05 25124 4.57E+05 1.33E+05 4.04E+0570 31296 1.59E+05 2947 4.93E+05 1.39E+05 4.16E+0577 28045 0 1.59E+05 27467 5.00E+05 1.20E+05 3.94E+0584 21353 1.24E+05 21109 1.39E+05 1.39E+0591 7127 1.26E+05 19639 3.48E+05 1.15E+05 1.97E+0598 3105 1.25E+05 18412 74705 1.16E+05 2.05E+05105 12034 4362 1.27E+05 9613 1.49E+05 1.24E+05 2.12E+05112 23187 3407 1.36E+05 19107 1.79E+05 1.31E+05 2.31E+05119 25706 2081 1.33E+05 19344 1.91E+05 2.36E+05126 15995 1528 1.22E+05 23775 1.74E+05 2.55E+05133 29743 1.62E+05 25549 2.35E+05 1.69E+05 2.86E+05140 29598 1738 1.19E+05 14630 4567 1.89E+05147 30600 0 1.20E+05 26432 1.63E+05 2.43E+05

154 24734 1.26E+05 25690 1.67E+05 2.56E+05161 30301 1.31E+05 25376 1.75E+05 2.64E+05168 36440 1.30E+05 27934 1.78E+05 2.62E+05175 35218 1.37E+05 26779 1.85E+05 2.73E+05182 35392 1.41E+05 30902 1.80E+05 2.69E+05189 41179 1.60E+05 33817 1.94E+05 2.72E+05196 39649 1.74E+05 38215 2.01E+05 2.74E+05203 44606 1.73E+05 39065 2.01E+05 2.79E+05210 43737 1.60E+05 40974 1.98E+05 2.76E+05217 43948 1.67E+05 41622 2.25E+05 2.79E+05224 44062 0 1.67E+05 41805 2.33E+05 2.80E+05
S042' nmol r11 2 3 4 5 6 7 8
0 13409 13898 13649 14490 13171 14113 134587 12783 13053 11498 14356 7295 12768 525514 13142 14095 8846 12227 3604 10455 228221 11065 12509 6925 13053 1889 7614 142828 12678 11050 6078 11855 1130 6215 36635 9069 13848 4898 11634 575 630242 12417 10249 4783 12005 342 5987 7449 9488 12125 4490 11977 350 5008 18056 9969 10207 4009 12476 233 4171 24991 12097 12612 1189 13000 267 2781 19398 11517 12110 796 12748 213 2197 167105 10385 13214 733 13307 239 2021 176140 13256 15304 67 13364 192 183147 12057 14312 475 14847 76 148154 13307 13753 318 15507 57 193161 11628 15487 135 18373 112 457

Appendix. 4. XRD analysis
350
300
250
200
150
100
50
0 10
Hornblende XRD
T= Tremolite Ca2Mg5S18022(H)2
C= Clinochore (Mg, Al, Fe)6Si Al
30 40 50 602 Theta

Ilmenite
I = Ilmenite
H= Hematite
V A, J50 60
ILJ40
2 Theta

OLIVINE
600
500
2 THETA
F=Fosterite C=Clinochlore M= margarite E=Enstatite

BASALT XRD
180A=Anorthite
Q=Quartz160
C=Clinochlore140
120
100
80
60 -
40
20
T
0 10 20 30 40 50 60 70 802 THETA

PYRRHOTITE XRD
1 2 0P= pyrrohotite S=Sphalerite
M= magnetite100
C= Chalcocite
40
20
0 10 20 30 40 50 60 70 802 THETA

PYRITE
140
P=PYRITE
120
100
40
20
8070605040300 10 202 THETA

LABRADORITE
1 2 0 0 7
Poor match close to anorthite
1000
800
600
400
200
8070605040300 1 0 2 0
2 THETA

180Olivine bombs
F= forsterite
E=enstatite160
140
120
100
60
40
7060500 4010 30202 Theta

HEMATITE
160
H = HEMATITE140Q=Quartz
120
100
80
60 -
40 -
20 -
700 801 0 602 0 40 50302 THETA