Embed Size (px)
Citation preview

401
IntroductionTiming and coordination of biological processes are crucial fornormal cellular function and development. For example, cell-cycle events that occur at the wrong time can result in abnormaldevelopment and lead to disease states such as cancer (Sherr,1996; Zou et al., 1999). Early embryonic cycles provide a goodsystem for analyzing such timing mechanisms. Afterfertilization, the earliest embryonic divisions are rapid,synchronous and maternally controlled in many organisms.These early cycles exhibit only S and M phases, essentially astripped-down version of the complete somatic cycles (Murray,1991). Indeed, the feedback loop in which Cdk1-cyclin andanaphase-promoting complex inactivate each other is simplerin early embryonic cycles compared with somatic cell cycles(Morgan and Roberts, 2002).
Studies of early developmental events in Xenopus haveidentified at least two important temporal phases. First, timingof the early synchronous cycles is based on oscillation of Cdk1-CycB activity (Murray and Kirschner, 1991). Second, later cellcycles slow down and become asynchronous, depending on thenucleo-cytoplasmic ratio (Newport and Kirschner, 1982;Kirschner et al., 1985). This transition point for both cell-cyclerate and synchrony is known as mid-blastula transition (Yasudaand Schubiger, 1992). As in Xenopus, the nucleo-cytoplasmicratio also regulates the cell-cycle rate in Drosophilaembryos(Edgar et al., 1986). However, loss of synchrony does not occurat a single time point during the syncytial blastoderm cycles(cycle 10-13) inDrosophilaembryos (Foe and Alberts, 1983).Similarly, zygotic gene transcription begins gradually and asearly as cycle 8 in a gene-specific manner (Pritchard andSchubiger, 1996). During this maternal-zygotic transition,
depletion of mitotic cyclins might cause the elongation ofinterphase, thus permitting sufficient time for zygotictranscription to proceed (Edgar and Datar, 1996; Shermoen andO’Farrell, 1991).
Over the last 60 years, many studies have analyzed thetiming of the first 13 cycles in Drosophilausing two differentapproaches. First, embryos were fixed at different times andstained to estimate the duration of both the total cell cycle andcycle phases based on the percentages of embryos in eachspecific cycle phase. Second, time-lapse recordings of livingembryos were made using either DIC or confocal microscopy.The former approach generated variable, thus potentiallyunreliable, results. For example, metaphase length before cycle10 was estimated as between 0.3 and 0.7 minutes byRabinowitz (Rabinowitz, 1941) and between 2.0 and 2.4minutes by Stiffler et al. (Stiffler et al., 1999). Although thelatter method is useful for estimating total cell-cycle length, theduration of cycle phases cannot be defined becausechromosomal morphology is not discernable with DIC optics.Although time-lapse recordings of embryos labeled withfluorescent markers using confocal microscopy have been usedto analyze interphase and total cell-cycle time of cycles 11-13(Sibon et al., 1997; Yu et al., 2000), this method is ineffectivefor imaging nuclei prior to their migration to the cortex (cycle10). In addition, long-term imaging with standard confocalwavelengths is detrimental to living embryos (Squirrell et al.,1999). These limitations result in a significant gap in ourunderstanding of the specific timing of cell-cycle events duringthe early embryonic cycles, particularly those before cycle 10.
Two-photon laser-scanning microscopy (TPLSM)circumvents the technical problems mentioned above, as it
The earliest embryonic mitoses in Drosophila, as in otheranimals except mammals, are viewed as synchronous andof equal duration. However, we observed that total cell-cycle length steadily increases after cycle 7, solely owing tothe extension of interphase. Between cycle 7 and cycle 10,this extension is DNA-replication checkpoint independent,but correlates with the onset of Cyclin B oscillation. Inaddition, nuclei in the middle of embryos have longermetaphase and shorter anaphase than nuclei at the twopolar regions. Interestingly, sister chromatids move fasterin anaphase in the middle than the posterior region. These
regional differences correlate with local differences inCyclin B concentration. After cycle 10, interphase and totalcycle duration of nuclei in the middle of the embryo arelonger than at the poles. Because interphase also extends incheckpoint mutant (grapes) embryo after cycle 10, althoughless dramatic than wild-type embryos, interphase extensionafter cycle 10 is probably controlled by both Cyclin Blimitation and the DNA-replication checkpoint.
Key words: Early embryonic mitosis, Cdk1-CycB, Drosophila,Metaphase, Interphase
Summary
Both Cyclin B levels and DNA-replication checkpoint control theearly embryonic mitoses in DrosophilaJun-Yuan Ji 1, Jayne M. Squirrell 2 and Gerold Schubiger 1,*
1Department of Biology, University of Washington, Seattle, WA 98195-1800, USA2Laboratory of Molecular Biology, University of Wisconsin, Madison, WI 53706, USA*Author for correspondence (e-mail: [email protected])
Accepted 24 October 2003
Development 131, 401-411Published by The Company of Biologists 2004doi:10.1242/dev.00944
Research article

402
permits high resolution imaging deep within thick, light-scattering tissues (Centonze and White, 1998), as well as long-term imaging of living specimens (Squirrell et al., 1999). Here,by using TPLSM, we characterize cell-cycle progression ofpreblastoderm cycles (before cycle 10) and compare it withsyncytial blastoderm cycles (after cycle 10) in live embryos.Furthermore, we show that crucial CycB concentrationscontrol both interphase duration and the timing of metaphase-anaphase transition.
Materials and methodsFly strainsDrosophila melanogasterstrains were maintained on standardcornmeal-yeast agar medium at 25°C. We used Sevelenflies aswild-type control (+), which is also the genetic background for allthe flies used in this study. Stocks with varied gene doses ofmaternal cycB were provided by Christian Lehner (Jacobs et al.,1998) and their embryos were referred by the same nomenclatureas previously described (Ji et al., 2002). A transgenic lineexpressing a fusion protein of histone H2Av and green fluorescentprotein (referred to as histone-GFP) was obtained from RobertSaint (Clarkson and Saint, 1998). For live imaging, ‘one cycB’embryos refer to embryos from w/+; cycB–/cycB+; histone-GFP/+females, ‘two cycB’ (wild type) embryos are from +; cycB+/ cycB+;histone-GFP/+females, and ‘four cycB’ embryos are fromw/+;cycB+/cycB+, CyO; 2P[w+ cycB+]/histone-GFP females. WilliamSullivan provided us the null allele grapes1 (grp1) (Fogarty et al.,1997; Sullivan et al., 1993). Female flies with grp1/ grp1; histone-GFP genotype were generated through standard genetic crossesfrom grp1/CyO and histone-GFPflies and their embryos werereferred as grp1 embryo (Fig. 1J).
Egg collection and fixation protocolsFor all egg collections, flies were put on new food for 1 hour at 25°C,then placed on agar plates with yeast paste for three times, 30 minuteseach time, to purge the females of over-aged embryos. For liveimaging, embryos expressing histone-GFP (from homozygotictransgenic females) were collected on agar plates for 15 minutes andaged for 20-30 minutes. For mitotic index analyses, embryos werecollected for 90 minutes then fixed immediately. The fixation andimmunostaining protocols were performed as described by Stiffler etal. (Stiffler et al., 1999) and Ji et al. (Ji et al., 2002).
Two-photon laser scanning microscopy (TPLSM)Embryos were manually dechorionated and lined up on a 22×30 mmgluey cover glass (Schubiger and Edgar, 1994). This cover glass wasthen taped to a plastic holder that resembled a 25×76 mm glass slidewith a 20×26 mm hole cut in the center. To prevent dehydration, wecovered embryos with a thin layer of halocarbon oil (HC-700,Halocarbon Products Corp.), which is oxygen permeable.
The two-photon imaging was performed on a BioRad Radiance2000 System equipped with a Mai Tai laser (Spectra Physics) set at900 nm and a Nikon Eclipse E600FN microscope with a 40×/1.3Nikon Plan Apo oil objective. Four-dimensional data were collectedusing Direct Detection System and LaserSharp software (BioRad)with the zoom set at 1.7. Single slow scans of two optical sections (5µm apart) were taken every 10 seconds. The images were compiledinto time-lapse recordings using 4D Turnaround-Java software(Thomas et al., 1996) and then analyzed with 4D Viewer software(Thomas et al., 1996).
Embryos were imaged for up to 2 hours. The room temperature was21.6±0.4°C (n=21 days). We were able to detect the histone-GFPsignal as early as cycle 4. Two hours of laser scanning did not reducethe hatching rates: 86% of the imaged embryos hatched (n=21
randomly chosen embryos) compared with 89% in non-imagedhistone-GFP control embryos (n=210). Time-lapse recordings fromunhatched embryos were not used.
A two-photon optical workstation was used to generate bright fieldtransmission images (Fig. 6A,B). This transmitted light imaging isachieved by simply allowing the scanning infrared laser beam (900nm) to pass through the live embryo and detecting it by an infraredphotodiode (Wokosin et al., 2003).
Estimation of cell-cycle-phase duration with fixedembryosFixed embryos were labeled with an antibody against histone H1 andan antibody against phosphorylated histone H3. Because histone H3is phosphorylated at Ser10 at the beginning of prophase, while thedephosphorylation is initiated at anaphase and completed at the endof telophase (Hendzel et al., 1997; Su et al., 1998; Wei et al., 1999),this double staining method enabled us to clearly distinguishinterphase and the different mitotic phases. The nomenclature andmitotic phases of early embryonic cycles were according to Foe et al.(Foe et al., 1993). Embryos were analyzed with a Nikon Microphot-FX fluorescence microscope using a 20× objective.
With fixed embryos, the duration of a cell-cycle phase wasestimated as the percentage of embryos in the cell-cycle phase withina specific cycle. This fraction, also known as the mitotic index,represents the percentage of the total cell-cycle time spent in thatphase. The total cell cycle duration for a given cycle was determinedfrom the TPLSM recordings, thus the time of the cell-cycle phasecould be calculated. To obtain meaningful estimations, severalhundred embryos of each cell cycle were analyzed. The results wereanalyzed with the exact distribution of Wilcoxon-Mann-Whitneystatistic test (StatXact 4.0 by Cytel Software).
CycB quantification We collected images of embryos immunostained with the anti-CycBantiserum Rb271 (Whitfield et al., 1990) using a BioRad MRC-600confocal microscope system as described in Stiffler et al. (Stiffler etal., 1999). Images of mid-sections through each nucleus were obtainedwith an Olympus microscope using a 60× oil objective and theconfocal settings of Zoom 3.0 and Kalman 6. To outline energids (Fig.3A), we used StackViewer, software written by Eli Meir(http://www.beakerware.org/stackviewer). With the same software wecalculated the average pixel intensity of each energid.
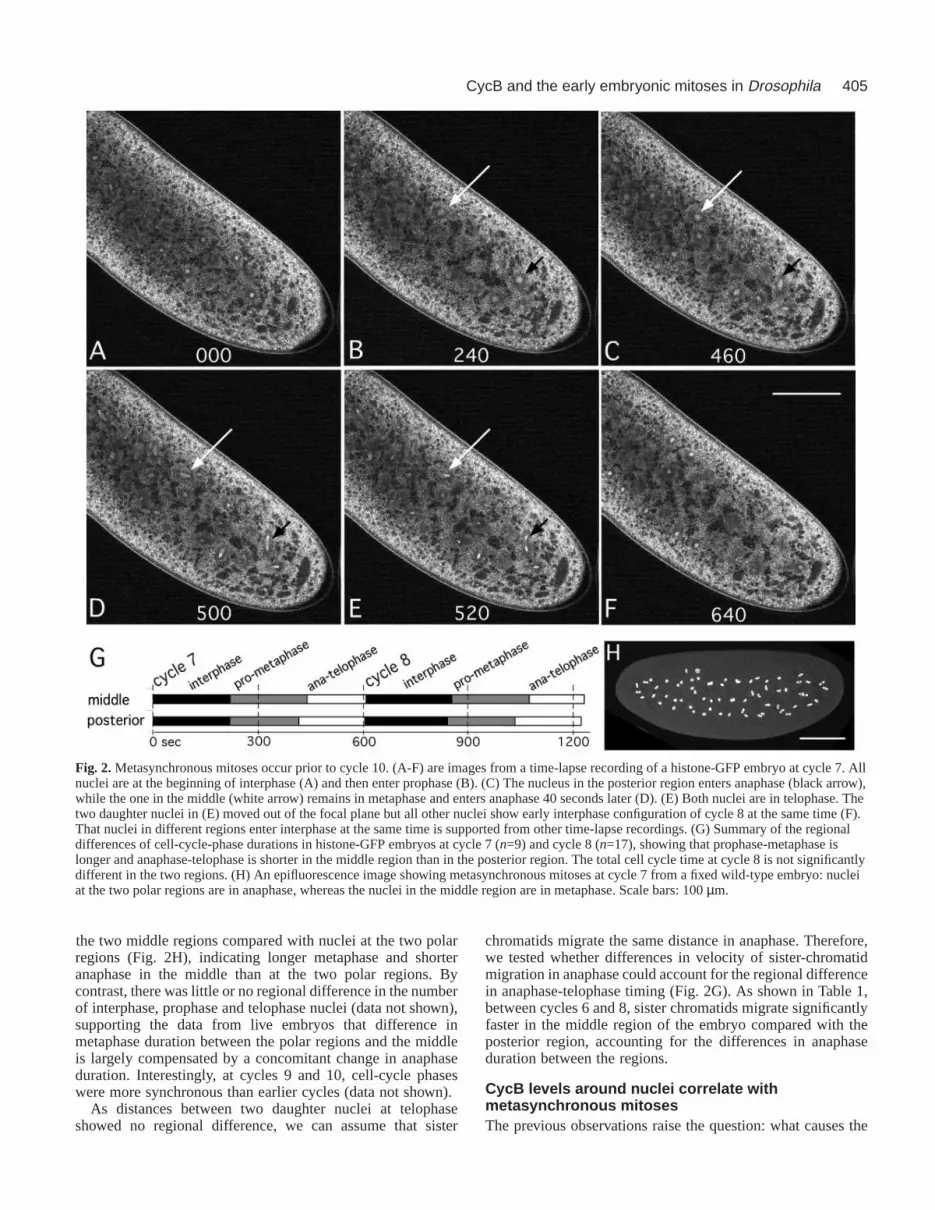
To compare relative CycB levels within embryos, each embryo wasdivided into three regions: anterior, middle and posterior (Fig. 3). Theaverage pixel intensity of CycB staining of three different energids ineach region was measured. For each embryo, the mean values of thethree energids in each region were calculated, representing the CycBlevel in that region. We compared the relative CycB concentration inthe three regions by assigning ranks for each region: the lowest CycBregion is ranked 1, intermediate level ranked 2 and the highest ranked3. The rank sum in different cell-cycle phases (Fig. 3E) wasstatistically analyzed by using Friedman’s Analysis of Variance byRanks (Zar, 1999).
The ranking analysis is based on measurements from two-dimensional (2D) images of mid-nuclear sections instead of three-dimensional (3D) data sets. With confocal microscopy, fluorophoreexcitation occurs above and below the plane of focus, resulting influorophore bleaching even outside the focal plane (White et al.,2001). Indeed, we observed substantial photobleaching whencollecting 3D images for each energid, making quantification of suchdata sets potentially unreliable. Furthermore, when we performed asample analysis of measurements from 3D data sets we found greaterdifferences in intensity among different areas compared to the 2Dmeasurements, but the results of the ranking among the three regionsremained the same, indicating that our method of measuring the 2Ddata sets is justified.
Development 131 (2) Research article

403CycB and the early embryonic mitoses in Drosophila
Measurement of velocity of sister-chromatid separation inanaphase High-resolution (1024×1024 pixels) time-lapse recordings werecollected with TPLSM settings described above. The recordings wereanalyzed by using ImageJ (http://rsb.info.nih.gov/ij/) to measure bothdistance and time elapsed.
ResultsLive analyses of the early embryonic cell cyclesWe combined histone 2AvD-GFP (histone-GFP) expressionwith TPLSM to define the duration of the total cell cycle aswell as the cell-cycle phases of embryos after cycle 5. Fig. 1A-H illustrate the resolution of TPLSM in terms of both nuclearmorphology and timing. In interphase, round nuclei haveuniform histone-GFP signal (Fig. 1A,B). Condensation ofchromosomes occurs 240 seconds after the onset of interphase,indicating the beginning of prophase (Fig. 1C). We could notdefine precisely when metaphase begins, because nuclearenvelope breakdown cannot be detected with the histone-GFPtag. However, metaphase configurations are clearlyrecognizable as the condensed chromosomes align along themetaphase plate (Fig. 1D). The onset of anaphase is preciselyidentified when sister chromatids begin to separate (Fig. 1E).It is difficult to distinguish late anaphase from telophase eventhough the sister chromatids are further apart (Fig. 1F,G), butthe onset of the next interphase is distinguished by the nucleichanging from a teardrop-oval shape to a round configuration(compare Fig. 1G with 1H). Therefore, with this technique, wecan define the beginning of interphase, prophase and anaphasewith 10 second accuracy. This enables us to measure preciselynot only the length of the total cell cycle, but also the durationsof interphase, prophase-metaphase and anaphase-telophase ofdifferent cycles.
We analyzed 39 histone-GFP embryos and found that totalcell-cycle time steadily increases with every cycle after cycle7 (Fig. 1I), which is three cycles earlier than previouslyreported (Foe and Alberts, 1983; Warn and Magrath, 1982;Zalokar and Erk, 1976). Comparing the time of different cell-cycle phases, we found that only interphase increases (Fig. 1I).Other cell-cycle phases were unchanged: prophase-metaphasedurations remained about 230 seconds (s.d.=20 seconds) andanaphase-telophase duration about 160 seconds (s.d.=20seconds). These observations were confirmed by analyses offixed embryos between cycles 6 and 9 (data not shown).
The interphase extension between cycles 7-10 is notdependent on a DNA replication checkpointIn wild-type embryos, a depletion of factor(s) involved in DNAreplication, may lead to slower DNA replication and longerinterphase (S-phase). In DNA-replication checkpoint mutantembryos, such as grapes (grp) or Mei-41, the rapid cyclescontinued after cycle 11 (Sibon et al., 1997; Sibon et al., 1999).Thus, it has been proposed that interphase extension after cycle10 depends on proper function of the DNA-replicationcheckpoint (Nyberg et al., 2002; Sibon et al., 1999; Sibon etal., 1997).
To address whether the DNA-replication checkpointfunction accounts for interphase extension before cycle 10, weanalyzed grp1 embryos from grp1/grp1; histone-GFPmotherswith TPLSM. We found that interphase increased from cycle
7 to cycle 10 (Fig. 1J), as in control embryos, indicating thatinterphase extension between cycle 7 and cycle 10 is DNA-replication checkpoint independent. This observation wasconfirmed by estimating interphase time in fixed grp1 embryos(data not shown). It should be noted that interphase durationafter cycle 10 in grp1 embryos extends, but less dramaticallythan in wild-type embryos (Fig. 1J), confirming previousobservations (Sibon et al., 1997; Sibon et al., 1999; Yu et al.,2000).
The preblastoderm cycles are metasynchronous inwild-type embryosWhen analyzing fixed wild-type embryos, we observedembryos with nuclei at different cell-cycle phases, indicatingmetasynchronous mitoses before cycle 10 (e.g. Fig. 2H). Thus,we asked whether nuclei in different regions extend interphasecoordinately. To exclude fixation artifacts and to measure cell-cycle phases, we examined live preblastoderm embryos withTPLSM. We determined the cell-cycle phases of nuclei indifferent regions of single embryos at cycle 7. At this stage,nuclei are spread along the anteroposterior axis. Fig. 2A-Fshow an embryo with regional differences in cell-cycle phases.We followed two nuclei, one located posteriorly and the otherin the middle of the embryo (Fig. 2B). Both entered mitosis(prophase) at the same time (Fig. 2B). Surprisingly, 220seconds later the posterior nucleus entered anaphase, while themedial one remained in metaphase (Fig. 2C), enteringanaphase 40 seconds later (Fig. 2D). Both nuclei were intelophase by 520 seconds (Fig. 2E) and entered the nextinterphase at the same time (Fig. 2F). Thus, in this particularcase, prophase-metaphase of the medial nucleus was 40seconds longer than that of the more posterior nucleus althoughinterphase showed little regional difference. Similarmetasynchrony was observed in all of the nine embryosanalyzed at cycle 7. The average prophase-metaphase time ofmedial nuclei was 20 seconds longer compared with nuclei inthe posterior region (P=0.0289; n=9, Fig. 2G). This temporaldifference was compensated by a 20 second shorter anaphase-telophase in the middle region so that nuclei entered the nextinterphase at similar times (Fig. 2F,G). Therefore, total cell-cycle duration of medial and posterior nuclei were not different(total cell-cycle duration: medial=620±40 seconds,posterior=600±50 seconds, n=9).
Similar regional differences in cell-cycle-phase durationswere also observed at cycle 8 (n=17 embryos) (Fig. 2G).Again, prophase-metaphase was 30 seconds longer in themiddle region (P=0.0036, n=17) while anaphase-telophase was20 seconds shorter (P=0.0013, n=17), with the total cell-cycletime remaining similar (total cycle duration: medial=640±70seconds, posterior=630±80 seconds, n=17). Theseobservations indicate that metasynchronous mitoses inpreblastoderm cycles result from different cycle-phasedurations.
To confirm these observations, the cell-cycle phases in fourdifferent regions (anterior, anterior medial, posterior medialand posterior) of embryos fixed between cycles 5 and 10 weredetermined. For each cycle, 700 to 1000 fixed embryos wereimmunostained and analyzed. This method has two advantagesover live analysis: the entire embryo is accessible for analysesand all cycle phases can be identified. Between cycles 5 and 8,more metaphase and fewer anaphase nuclei were observed in

404 Development 131 (2) Research article
Fig. 1. Live analyses of cell-cycle durations of histone-GFPembryos between cycles 6 and 13. (A-H) Different cycle phases of an embryo atcycle 8. (A) The earliest interphase (000 seconds); (B) last interphase image recorded (230 seconds). Ten seconds later (C), nuclei are inprophase, which is characterized by punctuated GFP signal and loss of the round nuclear morphology. At 440 seconds (D), an obviousmetaphase configuration is established and 10 seconds later sister chromatids begin to separate (E), indicating the beginning of anaphase.Between 550 and 600 seconds, nuclei progress from anaphase (F, clear teardrop shape) to telophase (G, more rounded). Ten seconds later (H,610 seconds), the beginning of interphase of cycle 9 is observed. With this information, we calculated durations of total cell cycles, interphases,prophase-metaphases and anaphase-telophases between cycles 6 and 13. (I) Overall cell-cycle and interphase duration between cycles 6 and 13,based on time-lapse recordings of 39 embryos. For each cycle, number of embryos (N) differs because the quality of recordings improves aftercycle 5; before cycle 5, abundant maternal loading of histone-GFP obscures the chromosomal histone-GFP. All data points are aligned at cycle9, when nuclei migrate to the cortex and pole buds are formed (Foe and Alberts, 1983). Because the preblastoderm cycles are not exactlysynchronous (Fig. 2), cell-cycle-phase duration within each cycle was defined as the average of 1-2 nuclei in the middle with 1-2 nuclei in theposterior region of each embryo. (J) Interphase durations ofgrp1 embryos do not differ from wild-type embryos before cycle 11. The number ofgrp1 embryos (N’) is shown in J; data for wild-type embryos are taken from I. Scale bar: 30 µm.
405CycB and the early embryonic mitoses in Drosophila
the two middle regions compared with nuclei at the two polarregions (Fig. 2H), indicating longer metaphase and shorteranaphase in the middle than at the two polar regions. Bycontrast, there was little or no regional difference in the numberof interphase, prophase and telophase nuclei (data not shown),supporting the data from live embryos that difference inmetaphase duration between the polar regions and the middleis largely compensated by a concomitant change in anaphaseduration. Interestingly, at cycles 9 and 10, cell-cycle phaseswere more synchronous than earlier cycles (data not shown).
As distances between two daughter nuclei at telophaseshowed no regional difference, we can assume that sister
chromatids migrate the same distance in anaphase. Therefore,we tested whether differences in velocity of sister-chromatidmigration in anaphase could account for the regional differencein anaphase-telophase timing (Fig. 2G). As shown in Table 1,between cycles 6 and 8, sister chromatids migrate significantlyfaster in the middle region of the embryo compared with theposterior region, accounting for the differences in anaphaseduration between the regions.
CycB levels around nuclei correlate withmetasynchronous mitoses The previous observations raise the question: what causes the
Fig. 2.Metasynchronous mitoses occur prior to cycle 10. (A-F) are images from a time-lapse recording of a histone-GFP embryo at cycle 7. Allnuclei are at the beginning of interphase (A) and then enter prophase (B). (C) The nucleus in the posterior region enters anaphase (black arrow),while the one in the middle (white arrow) remains in metaphase and enters anaphase 40 seconds later (D). (E) Both nuclei are in telophase. Thetwo daughter nuclei in (E) moved out of the focal plane but all other nuclei show early interphase configuration of cycle 8 at the same time (F).That nuclei in different regions enter interphase at the same time is supported from other time-lapse recordings. (G) Summary of the regionaldifferences of cell-cycle-phase durations in histone-GFP embryos at cycle 7 (n=9) and cycle 8 (n=17), showing that prophase-metaphase islonger and anaphase-telophase is shorter in the middle region than in the posterior region. The total cell cycle time at cycle 8 is not significantlydifferent in the two regions. (H) An epifluorescence image showing metasynchronous mitoses at cycle 7 from a fixed wild-type embryo: nucleiat the two polar regions are in anaphase, whereas the nuclei in the middle region are in metaphase. Scale bars: 100 µm.
406
regional difference in timing of cell-cycle phases? Because ithas been previously shown that metaphase is longer inpreblastoderm embryos with more CycB (Stiffler et al., 1999),we asked whether higher CycB levels around nuclei within anembryo correlated with longer metaphase. We immunostainedwild-type embryos at cycle 7 with anti-CycB antiserum anddetermined CycB levels within an energid, which comprisesthe nucleus and its associated yolk-free cytoplasmic island(Counce, 1973) (Fig. 3A). For each embryo, CycBimmunofluorescence intensities of three energids in anterior(Fig. 3B), middle (Fig. 3C) and posterior (Fig. 3D) regionswere measured. To compare the regional differences of CycBlevel, we ranked the average pixel intensity values in the threeregions within each embryo. For prophase, metaphase andanaphase, the rank sum was highest in the middle of theembryo and lowest in the posterior region (Fig. 3E). Bycontrast, no regional differences were found in either telophaseor interphase (Fig. 3E). This indicates that there is more CycBaround nuclei in the middle of the embryo at metaphase,correlating with the longer metaphase in this region.
Dosage effects of Cdk1-CycB activity on cell-cyclephasesAlthough immunocytochemistry can detect local difference ofCycB levels, it is not possible to measure regional differencesof Cdk1-CycB activity within a living embryo. Therefore, wevaried Cdk1-CycB levels in the entire embryo by changingmaternal cycB gene copy number and then analyzed theseembryos for alterations in cell-cycle-phase time using TPLSM.We found that higher CycB levels correlated with longerprophase-metaphase between cycles 6 and 10 (Fig. 4A).
We also examined fixed embryos to further test this dosageeffect of CycB on prophase-metaphase duration. Previously,we pooled cell-cycle-phase data between cycle 2 and cycle 8(Stiffler et al., 1999). However, the observation that interphaseduration changes after cycle 7 made it necessary to analyze thecycle phases for each cycle. Because total cell-cycle time isknown from live analyses, the mitotic indices determined fromfixed embryos can be converted into absolute time (Fig. 4C).We estimated that metaphase in one cycBembryos was 35seconds shorter than in two cycBembryos and 62 seconds
Development 131 (2) Research article
Fig. 3. Immunostaining andquantification of CycB.(A-D) Wild-type embryos werestained with both anti-CycB(green) and anti-histone H1 (red)antibodies. (A) An energid isoutlined and the average pixelintensity within the energid(green channel only) wasmeasured. The outline wasdefined by taking the shortestdistance between yolk granules(black) around the nucleus.Because the average pixelintensities (total pixel numberswithin an area divided by thearea) were compared, the exactoutlines were not crucial for thecomparison. (B-D) CycB levelswere quantified from threeregions (anterior, middle andposterior) in each embryo,averaging the data from threenuclei in each region. In thisexample, the mean value of theaverage pixel intensity of theCycB signal was ranked, with the lowest CycB level (74.4±6.3) as 1, the highest (94.6±3.7) as 3 and the middle (85.0±4.1) as 2. (E) Summaryof the rank sum of different cell-cycle phases at cycle 7. The asterisks indicate that the regional difference is statistically significant (P<0.04)based on Friedman’s Analysis of Variance by Ranks (Zar, 1999). Scale bars: 20 µm.
Table 1. Velocity of sister chromatid separation in anaphase is sensitive to the amount of maternal CycBMiddle region Posterior region
Average velocity* Velocity Number of Velocity Number of Number of
Maternal genotype (µm/min) s.d. (µm/min) s.d. measurements (µm/min) s.d. measurements embryos
one cycB† 7.40 0.58 7.85 0.38 26 6.97 0.40 26 14two cycB† 8.17 0.61 8.61 0.45 42 7.81 0.46 51 17four cycB† 8.75 0.53 9.07 0.40 34 8.51 0.49 45 18
*The differences among one cycB, two cycBand four cycBare highly significant [P<0.0001 based on the isotonic regression test (Gaines and Rice, 1990)].†The regional differences in one cycB, two cycBand four cycBembryos are highly significant (P<0.0001 based on one-tailed t-test).
407CycB and the early embryonic mitoses in Drosophila
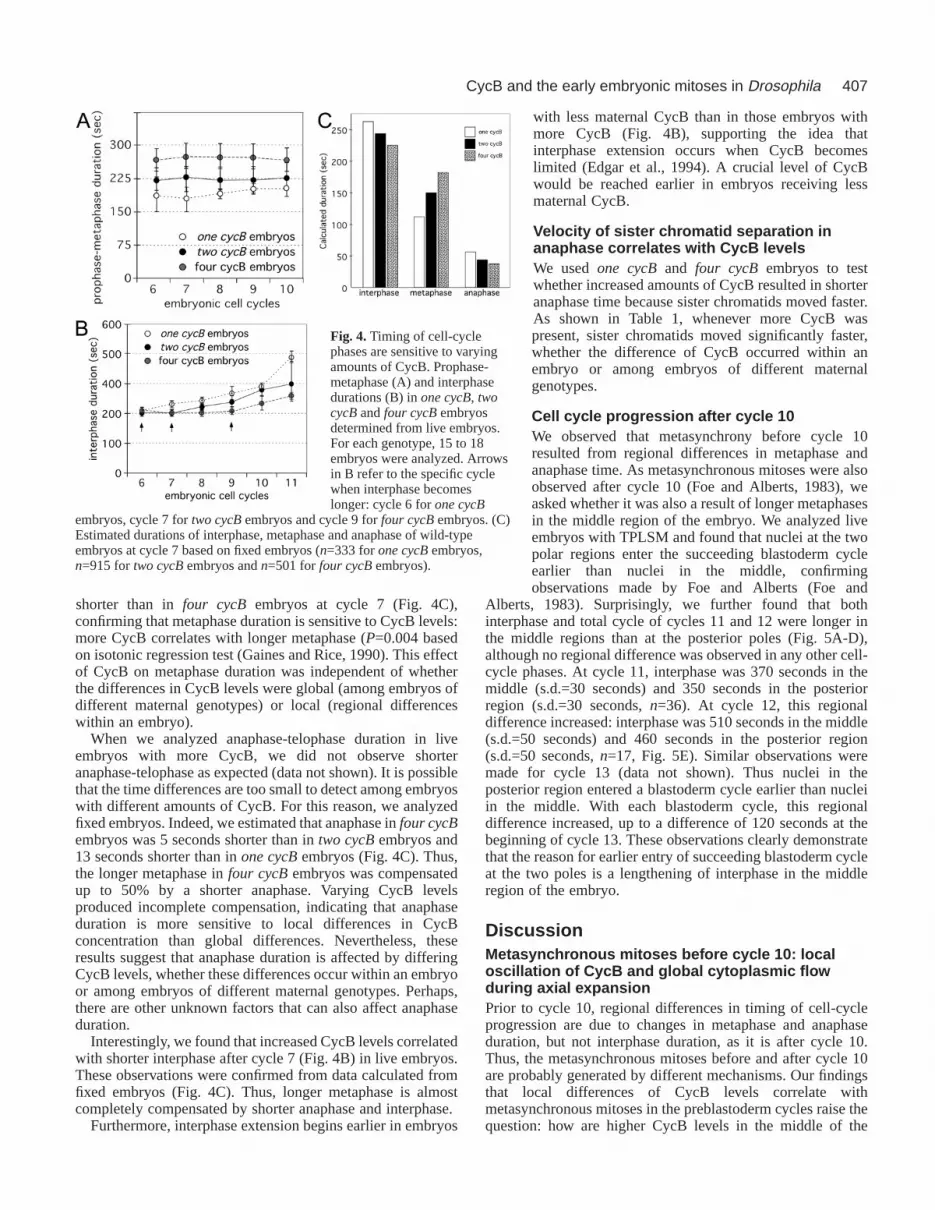
shorter than in four cycB embryos at cycle 7 (Fig. 4C),confirming that metaphase duration is sensitive to CycB levels:more CycB correlates with longer metaphase (P=0.004 basedon isotonic regression test (Gaines and Rice, 1990). This effectof CycB on metaphase duration was independent of whetherthe differences in CycB levels were global (among embryos ofdifferent maternal genotypes) or local (regional differenceswithin an embryo).
When we analyzed anaphase-telophase duration in liveembryos with more CycB, we did not observe shorteranaphase-telophase as expected (data not shown). It is possiblethat the time differences are too small to detect among embryoswith different amounts of CycB. For this reason, we analyzedfixed embryos. Indeed, we estimated that anaphase in four cycBembryos was 5 seconds shorter than in two cycBembryos and13 seconds shorter than in one cycBembryos (Fig. 4C). Thus,the longer metaphase in four cycBembryos was compensatedup to 50% by a shorter anaphase. Varying CycB levelsproduced incomplete compensation, indicating that anaphaseduration is more sensitive to local differences in CycBconcentration than global differences. Nevertheless, theseresults suggest that anaphase duration is affected by differingCycB levels, whether these differences occur within an embryoor among embryos of different maternal genotypes. Perhaps,there are other unknown factors that can also affect anaphaseduration.
Interestingly, we found that increased CycB levels correlatedwith shorter interphase after cycle 7 (Fig. 4B) in live embryos.These observations were confirmed from data calculated fromfixed embryos (Fig. 4C). Thus, longer metaphase is almostcompletely compensated by shorter anaphase and interphase.
Furthermore, interphase extension begins earlier in embryos
with less maternal CycB than in those embryos withmore CycB (Fig. 4B), supporting the idea thatinterphase extension occurs when CycB becomeslimited (Edgar et al., 1994). A crucial level of CycBwould be reached earlier in embryos receiving lessmaternal CycB.
Velocity of sister chromatid separation inanaphase correlates with CycB levelsWe used one cycBand four cycB embryos to testwhether increased amounts of CycB resulted in shorteranaphase time because sister chromatids moved faster.As shown in Table 1, whenever more CycB waspresent, sister chromatids moved significantly faster,whether the difference of CycB occurred within anembryo or among embryos of different maternalgenotypes.
Cell cycle progression after cycle 10We observed that metasynchrony before cycle 10resulted from regional differences in metaphase andanaphase time. As metasynchronous mitoses were alsoobserved after cycle 10 (Foe and Alberts, 1983), weasked whether it was also a result of longer metaphasesin the middle region of the embryo. We analyzed liveembryos with TPLSM and found that nuclei at the twopolar regions enter the succeeding blastoderm cycleearlier than nuclei in the middle, confirmingobservations made by Foe and Alberts (Foe and
Alberts, 1983). Surprisingly, we further found that bothinterphase and total cycle of cycles 11 and 12 were longer inthe middle regions than at the posterior poles (Fig. 5A-D),although no regional difference was observed in any other cell-cycle phases. At cycle 11, interphase was 370 seconds in themiddle (s.d.=30 seconds) and 350 seconds in the posteriorregion (s.d.=30 seconds, n=36). At cycle 12, this regionaldifference increased: interphase was 510 seconds in the middle(s.d.=50 seconds) and 460 seconds in the posterior region(s.d.=50 seconds, n=17, Fig. 5E). Similar observations weremade for cycle 13 (data not shown). Thus nuclei in theposterior region entered a blastoderm cycle earlier than nucleiin the middle. With each blastoderm cycle, this regionaldifference increased, up to a difference of 120 seconds at thebeginning of cycle 13. These observations clearly demonstratethat the reason for earlier entry of succeeding blastoderm cycleat the two poles is a lengthening of interphase in the middleregion of the embryo.
DiscussionMetasynchronous mitoses before cycle 10: localoscillation of CycB and global cytoplasmic flowduring axial expansionPrior to cycle 10, regional differences in timing of cell-cycleprogression are due to changes in metaphase and anaphaseduration, but not interphase duration, as it is after cycle 10.Thus, the metasynchronous mitoses before and after cycle 10are probably generated by different mechanisms. Our findingsthat local differences of CycB levels correlate withmetasynchronous mitoses in the preblastoderm cycles raise thequestion: how are higher CycB levels in the middle of the
Fig. 4. Timing of cell-cyclephases are sensitive to varyingamounts of CycB. Prophase-metaphase (A) and interphasedurations (B) in one cycB, twocycBand four cycBembryosdetermined from live embryos.For each genotype, 15 to 18embryos were analyzed. Arrowsin B refer to the specific cyclewhen interphase becomeslonger: cycle 6 for one cycB
embryos, cycle 7 for two cycBembryos and cycle 9 for four cycBembryos. (C)Estimated durations of interphase, metaphase and anaphase of wild-typeembryos at cycle 7 based on fixed embryos (n=333 for one cycBembryos,n=915 for two cycBembryos and n=501 for four cycBembryos).

408
embryo generated during each prophase and anaphase of cycles4-8? During these cycles, we observed a gradual decline ofCycB in the interior of the embryo. Between late interphaseand early anaphase of cycle 4 to cycle 8, cytoplasm in theinterior, containing less CycB, flows towards the polar regions(Baker et al., 1993). This cytoplasmic movement may causeslightly lower CycB levels at the polar regions duringmetaphase and anaphase. Meanwhile, cytoplasm at the corticalregion with more CycB flows in an opposite direction towardsthe anterior-medial region and then moves slightly inward (Fig.6B,C) (von Dassow and Schubiger, 1994). Therefore, wepropose that the inward cytoplasmic flow might cause thetemporal and local increase of CycB observed in the middleregion of the embryo from prophase to anaphase.
A model to explain the axial expansion process (betweencycle 4 and cycle 8) is based on solation-contraction of themicrofilament network within the embryo (for details, see vonDassow and Schubiger, 1994). Briefly, according to this model,local solation (disassembly) of the contractile microfilamentnetwork in the center of embryo will cause the microfilamentnetwork attached to the cortex to contract away from thesolated site in the center of the embryo. Nuclei and cytoplasmin the center of the embryo move towards the two polar regionsbecause the tension generated by the contraction of the
microfilament network is greatest along the anteroposterioraxis (von Dassow and Schubiger, 1994). This polewardcytoplasmic movement in the interior would force corticalmaterial to flow from poles towards the middle region, wherethe cytoplasm then moves inwards. This then generates twocircular cytoplasmic movement during prophase andmetaphase (Fig. 6B,C). However, the nature of the ‘solatingagent’ remains unknown in this model (von Dassow andSchubiger, 1994). We observed that Cdk1-CycB affects bothmicrotubule and microfilament dynamics (Ji et al., 2002) andthat CycB is higher in the middle region from prophase toanaphase (Fig. 3E), suggesting that Cdk1-CycB is a likelycandidate for the solating agent that initiates axial expansion.Therefore, we see a positive feedback loop between CycBdistribution and cytoplasmic flow (Fig. 6). This feedback loopis disrupted by CycB degradation at anaphase, when weobserve a slight backward cytoplasmic flow.
According to this scenario, the global cytoplasmicmovement and local oscillation of mitotic cyclin concentrationare the two key factors generating metasynchronous mitosesduring preblastoderm cycles. Interestingly, axial expansiononly occurs between cycle 4 and 8 (Baker et al., 1993), thesame period during which we observe regional differences inmetaphase and anaphase duration. This global cytoplasmic
Development 131 (2) Research article
Fig. 5.Metasynchronousmitoses in blastoderm cycles.TPLSM images of a liveembryo showing that, at cycle12, interphase is longer in themiddle region than at theposterior pole. Nuclei at theposterior region enterinterphase (A, arrows) 40seconds earlier than nuclei inthe middle region (B, arrows).(C) Nuclei at the posteriorregion enter prophase,whereas nuclei in the middleenter prophase 90 secondslater (D). In this particularembryo, interphase in themiddle region is 50 secondslonger than in the posteriorregion. (E) Mean values ofregional differences of cell-cycle-phase durations inhistone-GFP embryos at cycle11 (n=36) and cycle 12(n=17), showing thatinterphase and total cycle arelonger in the middle regionthan the posterior region.Scale bar: 50 µm.

409CycB and the early embryonic mitoses in Drosophila
movement is not observed after cycle 8, correlating with theobservation of little regional difference in metaphase andanaphase duration after cycle 8. Direct observation of CycBmovement in embryos with CycB-GFP fusion proteins (Huangand Raff, 1999) would be ideal. However, we were unable todetect CycB-GFP signal prior to cycle 10.
Different control mechanisms of interphaseextension before and after cycle 10Interphase extension after cycle 10 has been explained in twoways. Edgar et al. (Edgar et al., 1994) observed that decreasingCycB correlates with longer interphase after cycle 10, thusproposed that interphase extension after cycle 10 was due toCycB limitation. However, based on the observation that fastcycles continue after cycle 10 in grp mutant embryos, Sibon etal. (Sibon et al., 1997) proposed that in wild-type embryosdepletion of factors involved in DNA replication causes longerinterphase after cycle 10 and the interphase extensions areregulated by the DNA-replication checkpoint pathway.
Several of our observations might resolve this controversy.We report here that interphase extension occurs in grp mutantembryos before cycle 10 (Fig. 1J), thus we propose thatinterphase extension before cycle 10 is solely due to CycB
limitation. This is further supported by the followingobservations. First, interphase extension occurs at an earliercycle when maternal CycB is reduced and later when CycB isincreased (Fig. 4B). Second, looking within a specific cycle,interphase is longer when CycB is lower and shorter whenCycB is higher (Fig. 4B,C). Third, global CycB levels start tooscillate at the beginning of cycle 6 or 7 in wild-type embryos(Edgar et al., 1994), exactly the same time when interphaseduration starts to increase (Fig. 1I).
We also propose that after cycle 10, interphase extension isunder control of both CycB limitation and the DNA-replicationcheckpoint. It was reported that grp1 is a null allele (Fogartyet al., 1997). We observed that interphase continuously extendsin grp1 embryos after cycle 10, although this extension is notas extensive as in wild-type embryos (Fig. 1J). Thisobservation supports the idea that limitation of CycB isresponsible for this increase.
With these two proposals in mind, we re-examined theinterphase extension. Before cycle 10, interphase extensionoccurs coordinately in all nuclei and the nuclei doubling timeshows no regional difference. After cycle 10, nuclei divideslower in the middle because interphase in this region is longer,which correlate with an increase of nuclear density in thisregion of the embryo after cycle 10 (Blankenship andWieschaus, 2001) (G. K. Yasuda, PhD thesis, University ofWashington, 1992). In many organisms, a highernucleocytoplasmic ratio correlates with a slower cell cycle(Sveiczer et al., 2001). A venerable hypothesis is that highernuclear density could result in an earlier depletion of factorsnecessary for DNA replication, such as deoxynucleotidetriphosphates. This may result in slower DNA replication,thereby specifically prolonging interphase and ultimately totalcell-cycle length.
How do Cdk1-CycB levels affect the velocity ofsister chromatid separation?Currently, there are two major mechanisms proposed toregulate sister chromatid separation in anaphase. First,disassembly of microtubules in kinetochore regions shortenskinetochore microtubules and generates the force that pulls thesister chromatids apart once cohesin is cleaved by separase(Compton, 2002). Second, the disassembly of spindlemicrotubules at the centrosomal region induces the polewardmicrotubule movement, which then generates the force thatseparates the sister chromatids (Compton, 2002). In syncytialblastoderm Drosophilaembryos (cycles 10 to 13), it has beendocumented that the poleward microtubule movement is thekey component that separate the sister chromatids in anaphaseA, whereas the disassembly of microtubules at the kinetochoreis a minor factor (Maddox et al., 2002).
How does Cdk1-CycB affect velocity of sister chromatidseparation? We have shown that CycB levels negatively affectmicrotubule stability: higher Cdk1-CycB levels lead to lessstable microtubules and, correspondingly, lower Cdk1-CycBlevels lead to more stable microtubules (Stiffler et al., 1999; Jiet al., 2002). It also takes a longer time to form a stablemetaphase configuration when CycB levels are elevated.Furthermore, when more CycB is present the microtubules ofthe metaphase spindle are weaker than when less CycB isavailable. We speculate that the disassembly of spindlemicrotubule is faster or more efficient at the centrosomal
Fig. 6.Cytoplasmic flow, as indicated by traces of particlemovement, during axial expansion (cycle 4 to cycle 8) maycontribute to uneven distribution of CycB within an embryo. Both Aand B are projections of three-minute time-lapse recordings every 10seconds of a wild-type embryo at cycle 6. These bright-fieldtransmission images were recorded on a two- photon opticalworkstation (Wokosin et al., 2003). There is little particle movementin interphase [A, see Baker et al. (Baker et al., 1993) for staging]. Bycontrast, dramatic particle movement can be observed betweeninterphase and anaphase [B, see Baker et al. (Baker et al., 1993) forstaging]. Note the inward flow in the middle region. (C) Thedirection of the flow in prophase and metaphase. Scale bar: 50 µm.
410
regions because there are fewer microtubules at thecentrosomal regions in embryo with higher Cdk1-CycBactivity (Stiffler et al., 1999), contributing to the fasterpoleward microtubule movement. Alternatively, Cdk1-CycBmight affect the sister chromatid movement via its targetproteins in the centrosomal regions and/or the midzone wherethe interpolar microtubules overlap. For example, Cdk1-CycBphosphorylates p93dis1, which is enriched in the centrosomalregions (Nabeshima et al., 1995) and kinesin Eg5 (Drosophilahomolog KLP61F), which accumulates on the midzone afterphosphorylation (Blangy et al., 1995; Sawin and Mitchison,1995; Sharp et al., 1999). Mutation of p93dis1 in fission yeastresults in failure in sister chromatid separation (Nabeshima etal., 1995), while the phosphorylated bipolar kinesin KLP61Fis thought to be involved in sister chromatid separation byregulating sliding of the interpolar microtubules in anaphase(Sharp et al., 1999).
Our observation that Cdk1-CycB affects the velocity ofsister chromatid movement during anaphase supports the ideathat microtubule dynamics contribute to the mechanical forcefor sister chromatid separation. This novel observationprovides an entry point to further investigate the molecularmechanism that leads to disassembly of spindle microtubulesby analyzing, for example, the possible functions of the targetproteins of Cdk1-CycB in the centrosomal region.
Limitations and opportunities using the TPLSMThe TPLSM provides new opportunities for preciselyanalyzing the timing of biological events (Squirrell et al.,1999). Its major advantages over conventional confocalimaging are that the two-photon excitation generates less photodamage to thick living objects, and is particularly successful atimaging fluorescent signals deep in the specimen (Centonzeand White, 1998; Squirrell et al., 1999; White et al., 2001).Indeed, we found that with traditional confocal microscopy,GFP signals prior to cycle 10 were difficult to detect. Inaddition, we frequently observed cell-cycle arrest andchromosome bridges in the region of focus, indicatingphototoxic effects, confirming the observations made by others(Clarkson and Saint, 1999).
Using TPLSM, we found that in the earliest embryonicstages, an abundance of many maternal proteins obscure theobservation of the product at the target. However, after the firstfew cycles, depending on the protein, the maternal storagedeclines and the GFP signal from the fusion protein becomestarget specific. The time point of detection depends on thelocalization, the amount and function of the protein. Forexample, histone-GFP on chromosome is recognized aftercycle 4, while tubulin-GFP can only be recognized onmicrotubules after cycle 8 (J.-Y.J., J.M.S. and G.S.,unpublished).
The ability to detect fluorescent label within thepreblastoderm embryo and follow changes in this signal overa relatively long period of time without affecting viabilityprovides opportunity to study this early developmental stagethat has been previously inaccessible. For example, there arean abundance of maternal effect mutations that developapparently normal up to cycle 5 or 6, after which developmentarrests, a phenomenon referred to as ‘epigenetic crisis’(Counce, 1973). This phenomenon is observed in manyvertebrates and invertebrates, indicating that mid-cleavage is a
critical developmental stage (Counce, 1973). Although someof the Drosophila mutations have been molecularly identified,a phenotypic analysis using the TPLSM to assess the functionof these genes will increase our understanding of thisdevelopmentally critical period.
We thank Christian Lehner, Jordan Raff, Rob Saint and BillSullivan for providing mutant fly stocks, and Will Whitfield and DavidGlover for anti-CycB antiserum (Rb271). We are especially gratefulto John G. White for allowing us to use the two-photon microscopein his laboratory. We thank Todd Clason, Kevin Eliceiri, CharlesThomas and Haining Zhang for their help with the TPLSM andcomputer analysis. We appreciate Ray Huey’s advice on statisticalanalyses and encouragement throughout this project, and we alsothank Pat O’Farrell, Margrit Schubiger, members in the Schubigerlaboratory and the anonymous reviewers for their very helpfulcomments with the manuscript. This work was supported by NSFgrant IBN 97-27944 and NIH grant GM58282 to G.S.
ReferencesBaker, J., Theurkauf, W. E. and Schubiger, G.(1993). Dynamic changes in
microtubule configuration correlate with nuclear migration in thepreblastoderm Drosophilaembryo. J. Cell Biol. 122, 113-121.
Blangy, A., Lane, H. A., d’Herin, P., Harper, M., Kress, M. and Nigg, E.A. (1995). Phosphorylation by p34cdc2 regulates spindle association ofhuman Eg5, a kinesin-related motor essential for bipolar spindle formationin vivo. Cell 83, 1159-1169.
Blankenship, J. T. and Wieschaus, E.(2001). Two new roles for theDrosophila AP patterning system in early morphogenesis. Development128, 5129-5138.
Centonze, V. E. and White, J. G.(1998). Multiphoton excitation providesoptical sections from deeper within scattering specimens than confocalimaging. Biophys. J. 75, 2015-2024.
Clarkson, M. and Saint, R. (1999). A His2AvDGFP fusion genecomplements a lethal His2AvD mutant allele and provides an in vivo markerfor Drosophilachromosome behavior. DNA Cell Biol. 18, 457-462.
Compton, D. A. (2002). Chromosome segregation: pulling from the poles.Curr. Biol. 12, R651-R653.
Counce, S. J. (1973). The causal analysis of insect embryogenesis. InDevelopmental Systems: Insects(ed. S. J. Counce and C. H. Waddington),pp. 1-156. London, New York: Academic Press.
Edgar, B. A. and Datar, S. A.(1996). Zygotic degradation of two maternalCdc25 mRNAs terminates Drosophila’s early cell cycle program. GenesDev. 10, 1966-1977.
Edgar, B. A., Kiehle, C. P. and Schubiger, G.(1986). Cell cycle control bythe nucleo-cytoplasmic ratio in early Drosophiladevelopment. Cell 44, 365-372.
Edgar, B. A., Sprenger, F., Duronio, R. J., Leopold, P. and O’Farrell, P. H.(1994). Distinct molecular mechanism regulate cell cycle timing atsuccessive stages of Drosophilaembryogenesis. Genes Dev. 8, 440-452.
Foe, V. E. and Alberts, B. M. (1983). Studies of nuclear and cytoplasmicbehavior during the five mitotic cycles that precede gastrulation inDrosophilaembryogenesis. J. Cell Sci.61, 31-70.
Foe, V. E., Odell, G. M. and Edgar, B. A.(1993). Mitosis and morphogenesisin the Drosophilaembryo: point and counterpoint. In The Development ofDrosophila melanogaster (ed. M. Bate and A. M. Arias), pp. 149-300. NewYork, Cold Spring Harbor Laboratory Press.
Fogarty, P., Campbell, S. D., Abu-Shumays, R., Phalle, B. S., Yu, K. R.,Uy, G. L., Goldberg, M. L. and Sullivan, W. (1997). The Drosophilagrapesgene is related to checkpoint gene chk1/rad27and is required forlate syncytial division fidelity. Curr. Biol. 7, 418-426.
Gaines, S. D. and Rice, W. R.(1990). Analysis of biological data when thereare ordered expectations. Am. Nat.135, 310-317.
Hendzel, M. J., Wei, Y., Mancini, M. A., van Hooser, A., Ranalli, T.,Brinkley, B. R., Bazett-Jones, D. P. and Allis, C. D.(1997). Mitosis-specific phosphorylation of histone H3 initiates primarily withinpericentromeric heterochromatin during G2 and spreads in an orderedfashion coincident with mitotic chromosome condensation. Chromosoma106, 348-360.
Huang, J. Y. and Raff, J. W.(1999). The disappearance of cyclin B at the
Development 131 (2) Research article

411CycB and the early embryonic mitoses in Drosophila
end of mitosis is regulated spatially in Drosophilacells. EMBO J. 18, 2184-2195.
Jacobs, H. W., Knoblich, J. A. and Lehner, C. F.(1998). DrosophilaCyclinB3 is required for female fertility and is dispensable for mitosis like CyclinB. Genes Dev. 12, 3741-3751.
Ji, J. Y., Haghnia, M., Trusty, C., Goldstein, L. S. and Schubiger, G.(2002).A genetic screen for suppressors and enhancers of the Drosophila Cdk1-Cyclin B identifies maternal factors that regulate microtubule andmicrofilament stability. Genetics 162, 1179-1195.
Kirschner, M., Newport, J. and Gerhart, J. (1985). The timing of earlydevelopmental events in Xenopus. Trends Genet.1, 41-47.
Maddox, P., Desai, A., Oegema, K., Mitchison, T. J. and Salmon, E. D.(2002). Poleward microtubule flux is a major component of spindledynamics and anaphase A in mitotic Drosophilaembryos. Curr. Biol. 12,1670-1674.
Morgan, D. O. and Roberts, J. M.(2002). Oscillation sensation. Nature 418,495-496.
Murray, A. W. (1991). Remembrance of things past. Nature 349, 367-368.Murray, A. W. and Kirschner, M. W. (1991). What controls the cell cycle?
Sci. Am. 264, 56-63.Nabeshima, K., Kurooka, H., Takeuchi, M., Kinoshita, K., Nakaseko, Y.
and Yanagida, M. (1995). p93dis1, which is required for sister chromatidseparation, is a novel microtubule and spindle pole body-associating proteinphosphorylated at the Cdc2 target sites. Genes Dev.9, 1572-1585.
Newport, J. and Kirschner, M. (1982). A major developmental transition inearly Xenopusembryos: I. characterization and timing of cellular changesat the midblastula stage. Cell 30, 675-686.
Nyberg, K. A., Michelson, R. J., Putnam, C. W. and Weinert, T. A.(2002).Toward maintaining the genome: DNA damage and replication checkpoints.Annu. Rev. Genet. 36, 617-656.
Pritchard, D. K. and Schubiger, G. (1996). Activation of transcription inDrosophilaembryos is a gradual process mediated by the nucleocytoplasmicratio. Genes Dev. 10, 1131-1142.
Rabinowitz, M. (1941). Studies on the cytology and early embryology of theegg in Drosophila melanogaster. J. Morphol. 69, 1-49.
Sawin, K. E. and Mitchison, T, J. (1995). Mutations in the kinesin-likeprotein Eg5 disrupting localization to the mitotic spindle. Proc. Natl. Acad.Sci. USA92, 4289-4293.
Schubiger, G. and Edgar, B.(1994). Using inhibitors to study embryogenesis.Methods Cell Biol. 44, 697-713.
Sharp, D. J., McDonald, K. L., Brown, H. M., Matthies, H. J., Walczak,C., Vale, R. D., Mitchison, T. J. and Scholey, J. M.(1999). The bipolarkinesin, KLP61F, cross-links microtubules within interpolar microtubulebundles of Drosophilaembryonic mitotic spindles. J. Cell Biol.144, 125-138.
Shermoen, A. W. and O’Farrell, P. H.(1991). Progression of the cell cyclethrough mitosis leads to abortion of nascent transcripts. Cell 67, 303-310.
Sherr, C. J. (1996) Cancer cell cycles. Science274, 1672-1677.Sibon, O. C., Stevenson, V. A. and Theurkauf, W. E.(1997). DNA-
replication checkpoint control at the Drosophila midblastula transition.Nature 388, 93-97.
Sibon, O. C., Laurencon, A., Hawley, R. and Theurkauf, W. E.(1999). The
DrosophilaATM homologue Mei-41 has an essential checkpoint functionat the midblastula transition. Curr. Biol. 9, 302-312.
Squirrell, J. M., Wokosin, D. L., White, J. G. and Bavister, B. D.(1999).Long-term two-photon fluorescence imaging of mammalian embryoswithout compromising viability. Nat. Biotechnol. 17, 763-767.
Stiffler, L. A., Ji, J. Y., Trautmann, S., Trusty, C. and Schubiger, G.(1999).Cyclin A and B functions in the early Drosophilaembryo. Development 126,5505-5513.
Su, T. T., Sprenger, F., DiGregorio, P. J., Campbell, S. D. and O’Farrell,P. H. (1998). Exit from mitosis in Drosophilasyncytial embryos requiresproteolysis and cyclin degradation, and is associated with localizeddephosphorylation. Genes Dev. 12, 1495-1503.
Sullivan, W., Fogarty, P. and Theurkauf, W.(1993). Mutations affecting thecytoskeletal organization of syncytial Drosophila embryos. Development118, 1245-1254.
Sveiczer, A., Tyson, J. J. and Novak, B.(2001) A stochastic, molecular modelof the fission yeast cell cycle: role of the nucleocytoplasmic ratio in cycletime regulation. Biophys. Chem.92, 1-15.
Thomas, C., DeVries, P., Hardin, J. and White, J. G.(1996). Four-dimensional imaging: computer visualization of 3D movements in livingspecimens. Science 273, 603-607.
von Dassow, G. and Schubiger, G.(1994). How an actin network might causefountain streaming and nuclear migration in the syncytial Drosophilaembryo. J. Cell Biol. 127, 1637-1653.
Warn, R. M. and Magrath, R. (1982). Observations by a novel method ofsurface changes during the syncytial blastoderm stage of the Drosophilaembryo. Dev. Biol. 89, 540-548.
Wei, Y., Yu, L., Bowen, J., Gorovsky, M. A. and Allis, C. D.(1999).Phosphorylation of histone H3 is required for proper chromosomecondensation and segregation. Cell 97, 99-109.
White, J. G., Squirrell, J. M. and Eliceiri, K. W. (2001). Applyingmultiphoton imaging to the study of membrane dynamics in living cells.Traffic 2, 775-780.
Whitfield, W., Gonzalez, C., Maldonado-Codina, G. and Glover, D.(1990).The A- and B-type cyclins of Drosophilaare accumulated and destroyed intemporally distinct events that define separable phases of the G2-Mtransition. EMBO J. 9, 2563-2572.
Wokosin, D. L., Squirrell, J. M., Eliceiri, K. W. and White, J. G. (2003)Optical workstation with concurrent, independent multiphoton imaging andexperimental laser microbeam capabilities. Rev. Sci. Instrum.74, 1-9.
Yasuda, G. K. and Schubiger, G.(1992). Temporal regulation in the earlyembryo: is MBT too good to be true? Trends Genet.8, 124-127.
Yu, K. R., Saint, R. B. and Sullivan, W.(2000). The Grapes checkpointcoordinates nuclear envelope breakdown and chromosome condensation.Nat. Cell Biol. 2, 609-615.
Zalokar, M. and Erk, I. (1976). Division and migration of nuclei during earlyembryogenesis of Drosophila melanogaster. J. Microscopie Biol. Cell 25,97-106.
Zar, J. H. (1999). Biostatistical Analysis(4th edn). NJ: Prentice Hall.Zou, H., McGarry, T. J., Bernal, T. and Kirschner, M. W. (1999).
Identification of a vertebrate sister-chromatid separation inhibitor involvedin transformation and tumorigenesis. Science285, 418-422.