Embed Size (px)
Citation preview
Assessment of Stress Corrosion Cracking Susceptibility for Austenitic Stainless Steels Exposed to Atmospheric Chloride and Non-Chloride Salts
Office of Nuclear Regulatory Research
NUREG/CR-7170

NRC Reference Material
As of November 1999, you may electronically access NUREG-series publications and other NRC records at NRC’s Public Electronic Reading Room at http://www.nrc.gov/reading-rm.html. Publicly released records include, to name a few, NUREG-series publications; Federal Register notices; applicant, licensee, and vendor documents and correspondence; NRC correspondence and internal memoranda; bulletins and information notices; inspection and investigative reports; licensee event reports; and Commission papers and their attachments.
NRC publications in the NUREG series, NRC regulations, and Title 10, “Energy,” in the Code of Federal Regulations may also be purchased from one of these two sources. 1. The Superintendent of Documents
U.S. Government Printing Office Mail Stop SSOP Washington, DC 20402–0001 Internet: bookstore.gpo.gov Telephone: 202-512-1800 Fax: 202-512-2250
2. The National Technical Information Service Springfield, VA 22161–0002 www.ntis.gov 1–800–553–6847 or, locally, 703–605–6000
A single copy of each NRC draft report for comment is available free, to the extent of supply, upon written request as follows: Address: U.S. Nuclear Regulatory Commission
Office of Administration Publications Branch Washington, DC 20555-0001
E-mail: [email protected] Facsimile: 301–415–2289
Some publications in the NUREG series that are posted at NRC’s Web site address http://www.nrc.gov/reading-rm/doc-collections/nuregs are updated periodically and may differ from the last printed version. Although references to material found on a Web site bear the date the material was accessed, the material available on the date cited may subsequently be removed from the site.
Non-NRC Reference Material
Documents available from public and special technical libraries include all open literature items, such as books, journal articles, transactions, Federal Register notices, Federal and State legislation, and congressional reports. Such documents as theses, dissertations, foreign reports and translations, and non-NRC conference proceedings may be purchased from their sponsoring organization.
Copies of industry codes and standards used in a substantive manner in the NRC regulatory process are maintained at—
The NRC Technical Library Two White Flint North 11545 Rockville Pike Rockville, MD 20852–2738
These standards are available in the library for reference use by the public. Codes and standards are usually copyrighted and may be purchased from the originating organization or, if they are American National Standards, from—
American National Standards Institute 11 West 42nd Street New York, NY 10036–8002 www.ansi.org 212–642–4900
AVAILABILITY OF REFERENCE MATERIALS IN NRC PUBLICATIONS
Legally binding regulatory requirements are stated only in laws; NRC regulations; licenses, including technical specifications; or orders, not in NUREG-series publications. The views expressed in contractor-prepared publications in this series are not necessarily those of the NRC. The NUREG series comprises (1) technical and administrative reports and books prepared by the staff (NUREG–XXXX) or agency contractors (NUREG/CR–XXXX), (2) proceedings of conferences (NUREG/CP–XXXX), (3) reports resulting from international agreements (NUREG/IA–XXXX), (4) brochures (NUREG/BR–XXXX), and (5) compilations of legal decisions and orders of the Commission and Atomic and Safety Licensing Boards and of Directors’ decisions under Section 2.206 of NRC’s regulations (NUREG–0750).
DISCLAIMER: This report was prepared as an account of work sponsored by an agency of the U.S. Government. Neither the U.S. Government nor any agency thereof, nor any employee, makes any warranty, expressed or implied, or assumes any legal liability or responsibility for any third party’s use, or the results of such use, of any information, apparatus, product, or process disclosed in this publication, or represents that its use by such third party would not infringe privately owned rights.

Assessment of Stress Corrosion Cracking Susceptibility for Austenitic Stainless Steels Exposed to Atmospheric Chloride and Non-Chloride Salts Manuscript Completed: March 2013 Date Published: February 2014 Prepared by: Xihua He1 Todd S. Mintz1 Roberto Pabalan1 Larry Miller1 Greg Oberson2
1Center for Nuclear Waste Regulatory Analyses Southwest Research Institute 6220 Culebra Road San Antonio, TX 78238-5166 2U.S. Nuclear Regulatory Commission Greg Oberson, NRC Project Manager NRC Job Code V6288 Office of Nuclear Regulatory Research
NUREG/CR-7170


iii
ABSTRACT Most spent nuclear fuel dry storage canisters used in the United States are fabricated from austenitic stainless steel. Canisters in externally vented shielding structures may be exposed to airborne chemical species during service. Species may include chloride-rich salts from marine environments, de-icing salts, or condensed water from cooling towers, as well as a range of other non-chloride-rich salts originating from industrial, agricultural, and commercial activities. This report documents the results of a systematic study on the stress corrosion cracking (SCC) susceptibility of austenitic stainless steel exposed to these species. It is postulated that with sufficient ambient humidity, SCC could initiate by deliquescence of species on the canister surface, particularly at locations such as welds. A series of tests was performed to gain further insight into the conditions where SCC could occur, investigating such parameters as temperature, humidity, salt concentration, material metallurgical condition, and stress level. The tests included: (i) Measurement of deliquescence relative humidity (DRH) and efflorescence relative
humidity of sea salt and its pure salt constituents;
(ii) SCC testing of austenitic stainless steel specimens exposed to sea salt within the range of absolute humidity expected in natural conditions;
(iii) SCC testing of austenitic stainless steel specimens exposed to sea salt at elevated temperatures;
(iv) SCC testing of austenitic stainless steel specimens exposed to sea salt at high-humidity conditions;
(v) SCC testing of austenitic stainless steel specimens exposed to sea salt with various applied strains and stresses; and
(vi) Deliquescence and efflorescence measurements of non-chloride-rich atmospheric species and limited SCC testing of austenitic stainless steel specimens exposed to these species.
Deliquescence and efflorescence tests of simulated sea salt indicated that the DRH of sea salt is close to that of calcium chloride (CaCl2) and magnesium chloride (MgCl2), in the range of about 20 to 30 percent relative humidity (RH) at temperature less than 80 °C [176 °F]. Type 304 stainless steel U-bend specimens exposed to cyclic AH between 10 and 30 g/m3 at temperatures from 35 to 60 °C [95 to 140 °F] exhibited SCC initiation at a surface salt concentration as low as 0.1 g/m2. For the elevated temperature testing in constant humidity conditions, SCC initiation was observed up to 80 °C [176 °F]. In both the cyclic and constant humidity testing, material in the metallurgically sensitized condition showed greater SCC susceptibility than as-received material or welded specimens. For the high-humidity test condition at 30 °C [86 °F] and 90 percent RH, the deliquescent solution was relatively dilute in chlorides, but SCC initiation was still observed for U-bend specimens. Finally, testing with C-ring specimens strained to 0.4 and 1.5 percent, compared to about 15 percent for U-bend specimens, showed SCC initiation at both levels. The stress level at 0.4 percent strain is approximately the material yield stress. Based on this series of test results, it was concluded that austenitic-stainless steel is susceptible to chloride-induced SCC caused by salt

iv
deliquescence at RH above 20 to 30 percent even at relatively low salt concentrations and stress levels. Concerning non-chloride salt atmospheric species, a literature review indicated that sulfate (SO4
2−), nitrate (NO3−), and ammonium (NH4
+) are the most abundant soluble ions in atmospheric particulate matter at locations near industrial, commercial, or agricultural activities. Chloride (Cl-) and bisulfate (HSO4
-) ions are also present in smaller amounts. Type 304 stainless steel U-bend specimens did not exhibit SCC when exposed to sulfate, bisulfate, and nitrate salts, but SCC was observed when ammonium nitrate (NH4NO3) was mixed with NaCl with nitrate-to-chloride molar concentration ratios of 3.0 and 6.0. The extent of SCC seemed to increase with increasing chloride concentration. Minor pitting corrosion was observed for U-bend specimens exposed to fly ash possibly because of the part per million level of chloride in the fly ash leachate.

v
CONTENTS Section Page ABSTRACT ................................................................................................................................ iii FIGURES ................................................................................................................................... ix TABLES ...................................................................................................................................xvii EXECUTIVE SUMMARY ......................................................................................................... xix FOREWORD .......................................................................................................................... xxiii ACKNOWLEDGMENTS .......................................................................................................... xxv 1 INTRODUCTION ..........................................................................................................1-1 1.1 Background .......................................................................................................1-1 1.2 Previous Studies ...............................................................................................1-2 1.2.1 NUREG/CR–7030 .................................................................................1-3 1.2.2 Japanese Studies ..................................................................................1-3 1.3 Motivation for Current Work ..............................................................................1-4 1.4 Description and Organization of This Report .....................................................1-4 2 EXPERIMENTAL APPROACHES ................................................................................2-1 2.1 Salts and Chemical Species Used in the Tests .................................................2-1 2.1.1 Chloride-Rich Salts ................................................................................2-1 2.1.2 Non-Chloride-Rich Salts ........................................................................2-2 2.1.3 Fly Ash ..................................................................................................2-3 2.2 Materials and Specimens ..................................................................................2-3 2.2.1 Type 304 Stainless Steel, Sensitization, and U-Bend Specimen Fabrication ............................................................................2-3 2.2.2 Type 304L Stainless Steel, Sensitization, Mechanical Properties, C-Ring Specimen Fabrication, and C-Ring Stress Levels ......................2-8 2.3 Deliquescence and Efflorescence Tests ......................................................... 2-13 2.4 Salt Deposition on Specimens ........................................................................ 2-17 2.4.1 Simulated Sea Salt Deposition on U-Bends and C-Rings .................... 2-17 2.4.2 Non-Chloride-Rich Salt Deposition on U-Bends................................... 2-20 2.5 Stress Corrosion Cracking Tests ..................................................................... 2-22 2.5.1 Stress Corrosion Cracking Testing at Absolute Humidity Less Than 30 g/m3 ....................................................................................... 2-23 2.5.2 Stress Corrosion Cracking Testing at Elevated Temperatures ............. 2-24 2.5.3 Stress Corrosion Cracking Testing at High Relative Humidity .............. 2-24 2.5.4 C-Ring Stress Corrosion Cracking Testing .......................................... 2-25 2.5.5 Stress Corrosion Cracking Testing for Non-Chloride-Rich Species...... 2-25 2.5.6 Stress Corrosion Cracking Test Specimen Examination ...................... 2-25 3 RESULTS AND DISCUSSION OF STRESS CORROSION CRACKING TESTS IN CHLORIDE SALTS.......................................................................................................3-1 3.1 Deliquescence and Efflorescence Testing ........................................................3-1 3.1.1 Deliquescence and Efflorescence of Calcium Chloride, Magnesium Chloride, Sodium Chloride, and Sodium Sulfate ....................................3-1 3.1.1.1 Tests at 35 °C [95 °F] ..............................................................3-1 3.1.1.2 Tests at 45 °C [113 °F] ............................................................3-2 3.1.1.3 Tests at 60 °C [140 °F] ............................................................3-2

vi
CONTENTS (continued) Section Page 3.1.1.4 Tests at 80 °C [176 °F] ............................................................3-2 3.1.1.5 Comparisons of Observed and Calculated Deliquescence Relative Humidity and Efflorescence Relative Humidity ..........3-4 3.1.2 Deliquescence and Efflorescence of Sea Salt .......................................3-5 3.1.2.1 Tests at 35 °C [95 °F] ..............................................................3-5 3.1.2.2 Tests at 45 °C [113 °F] ............................................................3-8 3.1.2.3 Tests at 60 °C [140 °F] ............................................................3-8 3.1.2.4 Tests at 80 °C [176 °F] ............................................................3-8 3.1.2.5 Comparisons of Sea Salt Deliquescence Relative Humidity and Efflorescence Relative Humidity to Constituent Species .............................................................. 3-11 3.2 U-Bend Stress Corrosion Cracking Tests at Absolute Humidity Less Than 30 g/m3 .......................................................................................... 3-12 3.2.1 Specimens Deposited With 10 g/m2 Salt ............................................. 3-13 3.2.1.1 Tests at 27 °C [81 °F] .......................................................... 3-13 3.2.1.2 Tests at 35 °C [95 °F] .......................................................... 3-15 3.2.1.3 Tests at 45 °C [113 °F] ........................................................ 3-15 3.2.1.4 Tests at 52 °C [126 °F] ........................................................ 3-17 3.2.1.5 Tests at 60 °C [140 °F] ........................................................ 3-19 3.2.1.6 Summary of Results for Tests With 10 g/m2 Salt ................. 3-21 3.2.2 Specimens Deposited With 1 g/m2 Salt ............................................... 3-21 3.2.2.1 Tests at 35 °C [95 °F] .......................................................... 3-21 3.2.2.2 Tests at 45 °C [113 °F] ........................................................ 3-21 3.2.2.3 Tests at 52 °C [126 °F] ........................................................ 3-22 3.2.2.4 Summary of Results for Tests With 1 g/m2 Salt ................... 3-26 3.2.3 Specimens Deposited With 0.1 g/m2 Salt ............................................ 3-26 3.2.3.1 Tests at 35 °C [95 °F] .......................................................... 3-26 3.2.3.2 Tests at 45 °C [113 °F] ........................................................ 3-26 3.2.3.3 Summary of Results for Tests With 0.1 g/m2 Salt ................ 3-29 3.3 U-Bend Stress Corrosion Cracking Tests at Elevated Temperatures .............. 3-30 3.3.1 Tests at 45 °C [113 °F] ........................................................................ 3-31 3.3.2 Tests at 60 °C [140 °F] ........................................................................ 3-32 3.3.3 Tests at 80 °C [176 °F] ........................................................................ 3-35 3.3.4 Summary of Elevated Temperature Test Results ................................ 3-35 3.4 Stress Corrosion Cracking Initiation in High-Humidity Conditions .................... 3-35 3.4.1 Chloride Concentration Calculation ..................................................... 3-37 3.4.2 Stress Corrosion Cracking Tests ........................................................ 3-39 3.5 C-Ring Stress Corrosion Cracking Tests ......................................................... 3-44 3.5.1 Tests at 35 °C [95 °F] .......................................................................... 3-45 3.5.2 Tests at 45 °C [113 °F] ........................................................................ 3-46 3.5.3 Tests at 52 °C [126 °F] ........................................................................ 3-47 3.5.4 Summary of C-Ring Test Results ........................................................ 3-50 3.6 Discussion of Stress Corrosion Cracking Susceptibility in Chloride Salts ........ 3-50 3.6.1 Temperature and Humidity .................................................................. 3-50 3.6.2 Salt Quantity ........................................................................................ 3-52 3.6.3 Material Condition ............................................................................... 3-52 3.6.4 Stress–-Strain Level ............................................................................ 3-55
vii
CONTENTS (continued)
Section Page 4 RESULTS AND DISCUSSION OF EFFECTS OF NON-CHLORIDE-RICH ATMOSPHERIC SALTS ON STRESS CORROSION CRACKING ...............................4-1 4.1 Survey of Non-Chloride-Rich Atmospheric Species ..........................................4-1 4.1.1 Non-Chloride Atmospheric Salts ............................................................4-2 4.1.2 Non-Chloride and Chloride Salt Mixtures ...............................................4-6 4.2 Deliquescence and Efflorescence Behavior of Non-Chloride Atmospheric Salts .............................................................................................4-6 4.2.1 Tests at 35 °C [95 °F] ............................................................................4-8 4.2.2 Tests at 45 °C [113 °F] ........................................................................ 4-12 4.2.3 Tests at 60 °C [140 °F] ........................................................................ 4-15 4.3 Stress Corrosion Cracking Tests in Non-Chloride Atmospheric Salts ........................................................................................... 4-15 4.4 Tests With Non-Chloride and Chloride Salt Mixtures ....................................... 4-19 4.5 Summary and Discussion of Stress Corrosion Cracking Susceptibility in Non-Chloride-Rich Salts .................................................................................. 4-27 5 CONCLUSIONS ...........................................................................................................5-1 6 REFERENCES .............................................................................................................6-1 APPENDIX A ELECTROCHEMICAL TESTS IN NON-CHLORIDE-RICH SALT
SOLUTIONS ....................................................................................... .A-1

ix
FIGURES Figure Page 1-1 Illustration of a Dry Storage Canister Within a Metal Cask or a Concrete Structure ......1-1 2-1 Type 304 Stainless Steel Material Reactivation Curves Following ASTM G108–94 (ASTM International, 2010). Sensitization Was Conducted at 650 °C [1,202 °F] for 1, 2, and 4 Hours .....................................................................................................2-5 2-2 Micrographs of Type 304 Stainless Steel Material After Electrochemical Reactivation Tests Following ASTM G108–94 (ASTM International, 2010). (a) Base Stainless Steel Without Sensitization, (b) 1-Hour, (c) 2-Hour, and (d) 4-Hour Sensitization at 650 °C [1,202 °F] ................................................................2-6 2-3 (a) Specimen Orientation on Type 304 Stainless Steel Sheet, (b) Schematics of the Specimens Before Bending to Form U-Bends, (c) One U-Bend Specimen, and (d) One Welded Specimen Before Surface Finishing and Bending ...............................2-7 2-4 Type 304L Stainless Steel Tube Material Reactivation Curves Following ASTM G108–94 (ASTM International, 2010). Sensitization Was Conducted at 600 °C [1,112 °F] for 8, 24, and 48 Hours. ................................................................................2-9 2-5 Photos of Type 304L Stainless Steel Tube Material After Electrochemical Reactivation Tests Following ASTM G108–94 (ASTM International, 2010). (a) Base Stainless Steel Without Sensitization, (b) 8-Hour, (c) 24-Hour, and (d) 48-Hour Sensitization. ........................................................................................... 2-10 2-6 Stress-Strain Curves of As-Received and Sensitized Type 304L Stainless Steel ....... 2-11 2-7 (a) Dimensions of C-Ring Specimens Cut From Type 304L Stainless Steel Pipe And (b) One C-Ring Specimen With Test Fixtures on Before Applying Any Stress ..... 2-12 2-8 C-Ring Specimens at Various Strain Levels: (a) Strain at Yield Strength, (b) 1.5 Percent Strain, and (c) 3.0 Percent Strain .................................................................. 2-13 2-9 Schematic of Conductivity Cell Used in Deliquescence and Efflorescence Measurements ............................................................................................................ 2-14 2-10 Schematics of Deliquescence and Efflorescence Curves ........................................... 2-15 2-11 Relative Humidity Chart Showing the Calculated Deliquescence Relative Humidity as a Function of Temperature for (a) Chloride-Rich Salts and (b) Non-
Chloride Salts. The Red Arrows Indicate the Relative Humidity Ranges in the Deliquescence and Efflorescence Tests at 35, 45, 60, and 80 °C [95, 113, 140, and 176 °F]. Also Shown Are the Relative Humidity Versus Temperature Curves for Absolute Humidities of 10 and 30 g/m3. ...................................................................... 2-16
2-12 Simulated Sea Salt Concentration as a Function of Time Determined Using Periodic Salt Fogging in an Atmospheric Chamber (Auto Technology Model Number CFCT–NC–40). The Target Salt Concentrations on the Specimen Surface Were 0.1, 1, and 10 g/m2. The Number of Specimens Measured Per Time Period Ranged From 2 to 4. ............................................................................... 2-19 2-13 Some U-Bend Specimens Deposited With 0.1, 1, and 10 g/m2 Simulated Sea Salt .... 2-20 2-14 Simulated Sea Salt Concentration as a Function of Time Determined Using Periodic Salt Fogging in an Atmospheric Chamber (Singleton Atmospheric Chamber). The Target Salt Concentrations on the Specimen Surface Were 1 and 10 g/m2 ................................................................................................................ 2-21 2-15 Some C-Ring Specimens Deposited With 1 g/m2 Simulated Sea Salt in a Singleton Atmospheric Chamber ................................................................................ 2-21

x
FIGURES (continued) Figure Page 2-16 Specimens Deposited With Non-Chloride-Rich Salts: (a) U-Bend, (b) Flat Specimen, (c) U-Bend Deposited With NH4HSO4 and Optical Micrographs of Surface of Specimens Deposited With (d) NH4NO3 and (e) NH4HSO4 After Cleaning. The Red Circles Highlight the Pit and Etching............................................ 2-22 2-17 Cycling Relative Humidity, Absolute Humidity, and Temperature in the Atmospheric Chamber During Some Stress Corrosion Cracking Tests With Cyclic Environmental Conditions ................................................................................ 2-23 2-18 Stress Corrosion Cracking Tests Exposed to 30 °C [86 °F] and 90 Percent Relative Humidity in Equilibrium With CaCl2, MgCl2, NaCl, and Sea Salt. (a) U-Bend Specimens Hung Up in Solution With Crown Immersed and (b) Deposited Specimens and Salt Beakers. ..................................................................................... 2-25 2-19 U-Bend Specimens Hung Up in Non-Chloride-Rich Salts for Stress Corrosion Cracking Tests at 35 °C [95 °F] and 72 Percent Relative Humidity ............................. 2-26 2-20 Examples of Features Characterized as Stress Corrosion Cracks for (a) Surface Examination and (b) Cross Section ............................................................................ 2-26 3-1 Photographs of Salts in Beakers Showing the Deliquescence Behavior of (a) CaCl2, (b) MgCl2, (c) NaCl, and (d) Na2SO4 at 35 °C [95 °F] at Various Relative Humidities ....................................................................................................................3-2 3-2 Photographs of Salts in Beakers Showing the Deliquescence Behavior of (a) CaCl2, (b) MgCl2, (c) NaCl, and (d) Na2SO4 at 45 °C [113 °F] at Various Relative Humidities ....................................................................................................................3-3 3-3 Photographs of Salts in Beakers Showing the Deliquescence Behavior of (a) CaCl2, (b) MgCl2, (c) NaCl, and (d) Na2SO4 at 60 °C [140 °F] at Various Relative Humidities ....................................................................................................................3-3 3-4 Photographs of Salts in Beakers Showing the Deliquescence Behavior of (a) CaCl2, (b) MgCl2, (c) NaCl, and (d) Na2SO4 at 80 °C [176 °F] at Various Relative Humidities ....................................................................................................................3-3 3-5 Summary of Sodium Sulfate Deliquescence Behavior. Upward Arrows Mean Greater .........................................................................................................................3-4 3-6 Summary of Sodium Chloride Deliquescence Behavior. Upward Arrows Mean Greater .........................................................................................................................3-5 3-7 Summary of Magnesium Chloride Deliquescence and Efflorescence Behavior.
Downward Arrow Means Smaller ..................................................................................3-6 3-8 Summary of Simulated Sea Salt and Calcium Chloride Deliquescence, and Efflorescence Behavior. Downward Arrow Means Smaller. .........................................3-6 3-9 (a) Impedance Measured Using Conductivity Cell for Simulated Sea Salt (Also Shown Is the Measured Impedance for the Blank Filter Paper With No Salt Present) and (b) Beaker Test Showing the Deliquescence Behavior at 35 °C [95 °F] .................3-7 3-10 (a) Impedance Measured Using Conductivity Cell for Simulated Sea Salt and (b) Beaker Test Showing the Deliquescence Behavior at 45 °C [113 °F] ...........................3-9 3-11 (a) Impedance Measured Using Conductivity Cell for Simulated Sea Salt and (b) Beaker Test Showing the Deliquescence Behavior at 60 °C [140 °F] ......................... 3-10 3-12 (a) Impedance Measured Using Conductivity Cell for Simulated Sea Salt and (b) Beaker Test Showing the Deliquescence Behavior at 80 °C [176 °F] ......................... 3-11 3-13 Summary of Simulated Sea Salt Deliquescence and Efflorescence Behavior ............. 3-12
xi
FIGURES (continued) Figure Page 3-14 Photograph of Type 304 U-Bend Specimens Deposited With 10 g/m2 Salt Held at Chamber Temperature {27 °C [81 °F]} for 1 Month ..................................................... 3-14 3-15 Optical Micrographs of Sensitized Type 304 U-Bend Specimens Deposited With 10 g/m2 Salt Held at Chamber Temperature {27 °C [81 °F]} for (a) 1 Month From Cross Section and (b) 8 Months From Surface ........................................................... 3-15 3-16 Photographs of Sensitized Type 304 U-Bend Specimens Deposited With 10 g/m2 Salt Held at 35 °C [95 °F] for (a) 1 Month and (b) 4 Months ........................................ 3-15 3-17 Optical Micrographs of U-Bend Specimens Deposited With 10 g/m2 Salt Held at
35 °C [95 °F]. Sensitized Type 304 Specimens Exposed for (a) 1 Month and (b) 4 Months. As-Received Specimens Exposed for (c) 1 Month and (d) 4 Months.
Welded Specimen Exposed for (e) 4 Months. Red Circles Highlight the Cracks. ....... 3-16 3-18 Photographs of Type 304 U-Bend Specimens Deposited With 10 g/m2 Salt Held at 45 °C [113 °F] for (a) 1 Month and (b) 4 Months ......................................................... 3-17 3-19 Optical Micrographs of U-Bend Specimens Deposited With 10 g/m2 Salt Held at 45 °C [113 °F]. Sensitized Type 304 Specimens Exposed for (a) 1 Month From Cross Section and (b) 4 Months From Surface. As-Received Specimens Exposed
for (c) 1 Month From Cross Section and (d) 4 Months From Surface. Welded Specimen Exposed for (e) 4 Months From surface. Red Circles Highlight the Cracks ........................................................................................................................ 3-18
3-20 Photos of Type 304 U-Bend Specimens Deposited With 10 g/m2 Salt Held at 52 °C [136 °F] for (a) 1 Month and (b) 2.5 Months ................................................................ 3-19 3-21 Optical Micrographs of U-Bend Specimens Deposited With 10 g/m2 Salt Held at 52 °C [136 °F]. Sensitized Type 304 Specimens Exposed for (a) 1 Month From Surface and (b) 2.5 Months From Surface. As-Received Specimens Exposed for
(c) 1 Month From Cross Section and (d) 2.5 Months From Surface. Red Circles Highlight the Cracks. .................................................................................................. 3-20
3-22 Photograph of 10 g/m2 Exposed Type 304 U-Bend Specimens Held at 60 °C [140 °F] for 6.5 Months .............................................................................................. 3-20 3-23 Optical Micrographs of Type 304 U-Bend Specimens Deposited With 10 g/m2 Salt Held at 60 °C [140 °F] and Exposed for 6.5 Months for (a) Sensitized From Surface, Red Circle Highlights the Crack. (b) As-Received Type 304 Specimens From Surface, No Cracking Observed. ....................................................................... 3-21 3-24 Photographs of Type 304 U-Bend Specimens Deposited With 1 g/m2 Salt Held at 35 °C [95 °F] for (a) 1 Month and (b) 4 Months ........................................................... 3-22 3-25 Surface Optical Micrographs of 1 g/m2 U-Bend Specimens Held at 35 °C [95 °F].
Sensitized Type 304 Specimens Exposed for (a) 1 Month and (b) 4 Months. As-Received Specimens Exposed for (c) 1 Month (No Cracking Observed) and (d)
4 Months. Red Circles Highlight the Cracks. ............................................................... 3-23 3-26 Photographs of 1 g/m2 Type 304 U-Bend Specimens Held at 45 °C [113 °F] for
(a) 1 Month and (b) 4 Months ..................................................................................... 3-24 3-27 Surface Optical Micrographs of 1 g/m2 U-Bend Specimens Held at 45 °C [113 °F].
Sensitized Type 304 Specimens Exposed for (a) 1 Month and (b) 4 Months. As-Received Specimens Exposed for (c) 1 Month (No Cracking Observed) and (d) 4 Months. Red Circles Highlight the Cracks. .................................................................. 3-25
3-28 Photograph of 1 g/m2 Exposed Type 304 U-Bend Specimens Held at 52 °C [136 °F] for 8 Months .................................................................................................. 3-25
xii
FIGURES (continued) Figure Page 3-29 Surface Optical Micrographs of 1 g/m2 U-Bend Specimens Held at 52 °C [126 °F] for 8 Months for (a) Sensitized and (b) As-Received Type 304 Specimens. Red Circle Highlights the Crack on the Sensitized Specimen. ............................................ 3-26 3-30 Photographs of 0.1 g/m2 Exposed Type 304 U-Bend Specimens Held at 35 °C [95 °F] for (a) 1 Month, (b) 4 Months, and (c) 12 Months ............................................ 3-27 3-31 Optical Micrographs of 0.1 g/m2 U-Bend Specimens Held at 35 °C [95 °F]. Sensitized Type 304 Specimens Exposed for (a) 4 Months From Surface and (b) 12 Months From Surface. As-Received Specimens Exposed for (c) 4 Months
From Cross Section and (d) 12 Months From Cross Section. Welded Specimens Exposed for (e) 12 Months From Surface. Red Circles Highlight the Cracks. ............. 3-28
3-32 Photographs of 0.1 g/m2 Exposed Type 304 U-Bend Specimens Held at 45 °C [113 °F] for (a) 1 Month and (b) 4 Months ................................................................... 3-29 3-33 Surface Optical Micrographs of 0.1 g/m2 U-Bend Specimens Held at 45 °C [113 °F]
Sensitized Type 304 Specimens Exposed for (a) 4 Months and (b) 12 Months. As- Received Specimen Exposed for (c) 4 Months. Red Circles Highlight the Cracks ..... 3-30
3-34 Photographs of 10 g/m2 Type 304 U-Bend Specimens Held at 45 °C [113 °F] and 44 Percent Relative Humidity for (a) Sensitized and (b) As-Received Conditions ....... 3-32 3-35 Surface Optical Micrographs of 10 g/m2 Type 304 U-Bend Specimens Held at 45 °C [113 °F] and 44 Percent Relative Humidity for (a) Sensitized and (b) As-Received Conditions. Red Circles Highlight the Cracks ........................................ 3-32 3-36 Photographs of 10 g/m2 Type 304 U-Bend Specimens Held at 60 °C [140 °F] and
(a) 25, (b) 30, (c) 35, and (d) 40 Percent Relative Humidity........................................ 3-33 3-37 Optical Micrographs of 10 g/m2 Type 304 U-Bend Specimens Held at 60 °C
[140 °F] and 25 Percent Relative Humidity for (a) Surface of Sensitized;(b) Cross Section of As-Received, 30 Percent Relative Humidity; (c) Surface of Sensitized; (d) Surface of As-Received (No Cracking Observed), 35 Percent Relative Humidity; (e) Cross Section of Sensitized; (f) Cross Section of As-Received Conditions, 40 Percent Relative Humidity; (g) Surface of Sensitized; and (h) Surface of As- Received Conditions. Red Circles Highlight the Cracks. ............................................. 3-34
3-38 Photographs of 10 g/m2 Type 304 U-Bend Specimens Held at 80 °C [176 °F] and (a) 28, (b) 35, and (c) 40 Percent Relative Humidities ................................................ 3-36
3-39 Optical Micrographs of 10 g/m2 Type 304 U-Bend Specimens Held at 80 °C [176 °F] and 28 Percent Relative Humidity for (a) Surface of Sensitized and (b)
Surface of As-Received, 35 Percent Relative Humidity for (c) Cross Section of Sensitized and (d) Cross Section of As-Received Conditions, and 40 Percent Relative Humidity for (e) Cross Section of Sensitized and (f) Cross Section of As-Received Conditions. Red Circles Highlight the Cracks. ............................................. 3-37
3-40 Calculated Chloride Concentrations With Increasing Relative Humidity at 30 °C [86 °F] for (a) NaCl, (b) CaCl2, (c) MgCl2, and (d) Sea Salt ......................................... 3-38 3-41 Posttest Specimens Deposited With 10 g/m2 Sea Salt Exposed to 30 °C [86 °F] and 90 Percent Relative Humidity for 5 Weeks: (a) As-Received and (b) Sensitized ......... 3-40 3-42 (a) NaCl Solution at 5 Weeks and (b) U-Bend Specimens After 5-Week and 4- Month Exposures. Cracks Observed on (c) As-Received and (d) Sensitized Specimens Immersed in NaCl Solution Equilibrated at 30 °C [86 °F] and 90 Percent
Relative Humidity for 5 Weeks. Red Circles Highlight the Cracks. .............................. 3-41

xiii
FIGURES (continued) Figure Page 3-43 (a) CaCl2 Solution at 5 Weeks and (b) U-Bend Specimens After 5-Week and 4- Month Exposures. Cracks Observed on (c) As-Received and (d) Sensitized Specimens Immersed in CaCl2 Solution Equilibrated at 30 °C [86 °F] and 90 Percent Relative Humidity for 5 Weeks. Red Circles Highlight the Cracks. ................. 3-42 3-44 (a) MgCl2 Solution at 5 Weeks and (b) U-Bend Specimens After 5-Week and 4- Month Exposures. Cracks Observed on (c) As-Received and (d) Sensitized Specimens Immersed in MgCl2 Solution Equilibrated at 30 °C [86 °F] and 90 Percent Relative Humidity for 5 Weeks. Red Circles Highlight the Cracks. ................. 3-43 3-45 (a) Sea Salt Solution at 5 Weeks and (b) U-Bend Specimens After 5-Week and 4- Month Exposures. Cracks Observed on (c) As-Received and (d) Sensitized Specimens Immersed in Sea Salt Solution Equilibrated at 30 °C [86 °F] and 90 Percent Relative Humidity for 5 Weeks. Red Circles Highlight the Cracks. ................. 3-44 3-46 Photographs of Type 304L C-Ring Specimens Strained to 0.4 Percent Held at 35 °C [95 °F] and 72 Percent Relative Humidity for (a) 10 g/m2 After 3 Months and (b) 1 g/m2 After 2 Months ............................................................................................ 3-46 3-47 Optical Micrograph of Sensitized Type 304L C-Ring Specimens With 10 g/m2 Strained to 0.4 Percent Held at 35 °C [95 °F] and 72 Percent Relative Humidity. Red Circles Highlight Cracks ...................................................................................... 3-46 3-48 Photographs of Type 304L C-Ring Specimens Held at 45 °C [113 °F] and 44 Percent Relative Humidity for 0.4 Percent Strain Specimens at (a) 10 g/m2,
(b) 1 g/m2 and (c) 1.5 Percent Strain Specimens at 10 g/m2 ....................................... 3-47 3-49 Cross Section Optical Micrographs of 1.5 Percent Strained Type 304L C-Ring Specimens With 10 g/m2 Held at 45 °C [113 °F] and 44 Percent Relative Humidity in the (a) Sensitized and (b) As-Received Condition. Red Circles Highlight the Cracks ........................................................................................................................ 3-48 3-50 Photographs of Type 304L C-Ring Specimens Held at 52 °C [126 °F] and 32 Percent Relative Humidity for 0.4 Percent Strain Specimens for 0.4 Percent Strain Specimens at (a) 10 g/m2, (b) 1 g/m2, and (c) 1.5 Percent Strain Specimens at 10 g/m2 ................................................................................................................... 3-48 3-51 Optical Micrographs of Type 304L C-Ring Specimens Held at 52 °C [126 °F] and 32
Percent Relative Humidity. Cracks Were Observed in (a) Sensitized Specimens Held at 0.4 Percent Strain With 10 g/m2. Cracks Were Also Seen in (b) Sensitized and (c) As-Received C-Rings Held at 0.4 Percent Strain With 1 g/m2. Finally, Cracks Were Observed in (d) Sensitized and (e) As-Received C-Rings Held at 1.5
Percent Strain With 10 g/m2. Red Circles Highlight the Cracks. ................................. 3-49 3-52 Stress Corrosion Cracking Susceptibility Map From Both Cyclic and Static U-Bend Tests ............................................................................................................. 3-51 3-53 (a) Weld Specimen and (b) Electrochemical Reactivation Curves Following ASTM
G108–94 (ASTM International, 2010) for Type 304 Stainless Steel Base, Heat- Affected Zone Sections, and Type 308 Stainless Steel Cut From Weld-Deposited Weld Metal ................................................................................................................. 3-53 3-54 Micrographs of Type 304 Stainless Steel Weld Specimen After Electrochemical
Reactivation Tests Following ASTM G108–94 (ASTM International, 2010): (a) Base, (b) Heat-Affected Zone, and (c) Mainly Deposited Weld Metal ................................... 3-54

xiv
FIGURES (continued) Figure Page 4-1 (a) Regional Trends in Annual Fine Particulate Matter Composition (μg/m3) During
the Period 2002 to 2006 (EPA, 2008a) and (b) Fine Particulate Matter Composition (μg/m3) by Season for 15 U.S. Cities (EPA, 2010) ........................................................4-5
4-2 Locations of Monitoring Sites in the IMPROVE Network (IMPROVE, 2013). Arrows Show the Sites Selected for Determining Stress Corrosion Cracking Test Matrix Composition: (i) Arendtsville, Pennsylvania; (ii) Bondville, Illinois; (iii) Great River Bluffs, Minnesota; (iv) Great Smoky Mountains National Park, Tennessee; and (v) Phoenix, Arizona. .........................................................................................................4-7
4-3 Impedance Measured Using Conductivity Cells at 35 °C [95 °F] for Systems Containing (a) NH4HSO4, (b) NH4NO3, (c) (NH4)2SO4 and Fly Ash, (d) Mixture 1: (NH4)2SO4/NH4NO3 = 0.5, (e) Mixture 2: (NH4)2SO4/NH4NO3 = 1.0, and (f) Mixture 3: (NH4)2SO4/NH4NO3 = 3.0. The Red Star Indicates 72 Percent Relative Humidity (Absolute Humidity of 30 g/m3). Also Shown Is the Measured Impedance for the Blank Filter Paper With No Salt Present. [Note in Figure Legend: NH4HSO4 = NH4HSO4, NH4NO3 = NH4NO3, (NH4)2SO4 = (NH4)2SO4.] .............................................4-9
4-4 Observation From Beakers at 35 °C [95 °F] for Deliquescence Tests at Increasing Relative Humidity : (a) NH4HSO4, (b) NH4NO3, and (c) Mixture 1:
(NH4)2SO4/NH4NO3 = 0.5, Mixture 2: (NH4)2SO4/NH4NO3 = 1.0, and Mixture 3: (NH4)2SO4/NH4NO3 = 3.0 ............................................................................................ 4-11
4-5 Observation From Beakers at 35 °C [95 °F] for Efflorescence Tests at Decreasing Relative Humidity: (a) NH4NO3 and (b) Mixture 1: (NH4)2SO4/NH4NO3 = 0.5, Mixture 2: (NH4)2SO4/NH4NO3 = 1.0, and Mixture 3: (NH4)2SO4/NH4NO3 = 3.0 ............ 4-11 4-6 Impedance Measured Using Conductivity Cells at 45 °C [113 °F] for Systems
Containing (a) NH4HSO4, (b) NH4NO3, (c) (NH4)2SO4 and Fly Ash, (d) Mixture 1: (NH4)2SO4/NH4NO3 = 0.5, (e) Mixture 2: (NH4)2SO4/NH4NO3 = 1.0, and (f) Mixture 3: (NH4)2SO4/NH4NO3 = 3.0. The Red Star Indicates 44 Percent Relative Humidity (Absolute Humidity of 30 g/m3). [Note in Figure Legend: NH4HSO4 = NH4HSO4, NH4NO3 = NH4NO3, and (NH4)2SO4 = (NH4)2SO4.] ..................................... 4-13
4-7 Observation From Beakers at 45 °C [113 °F] for Deliquescence Tests at Increasing Relative Humidity: (a) NH4HSO4 and (b) NH4NO3 ....................................................... 4-14 4-8 Observation From Beakers at 45 °C [113 °F] for Efflorescence Tests at Decreasing Relative Humidity: (a) NH4NO3 and (b) NH4HSO4 ....................................................... 4-14 4-9 Impedance Measured Using Conductivity Cells at 60 °C [140 °F] for Systems
Containing (a) NH4HSO4, (b) NH4NO3, (c) (NH4)2SO4 and Fly Ash, (d) Mixture 1: (NH4)2SO4/NH4NO3 = 0.5, (e) Mixture 2: (NH4)2SO4/NH4NO3 = 1.0, and (f) Mixture 3: (NH4)2SO4/NH4NO3 = 3.0. The Red Star Indicates 22 Percent Relative Humidity (Absolute Humidity of 30 g/m3). [Note in Figure Legend: NH4HSO4 = NH4HSO4, NH4NO3 = NH4NO3, (NH4)2SO4 = (NH4)2SO4.] ............................................................. 4-16
4-10 Observation From Beakers at 60 °C [140 °F] for Deliquescence Tests at Increasing Relative Humidity: (a) NH4HSO4, (b) NH4NO3, and (c) Three (NH4)2SO4 and NH4NO3 Mixtures ........................................................................................................ 4-17 4-11 Observation From Beakers at 60 °C [140 °F] for Efflorescence Tests at Decreasing Relative Humidity: (a) NH4HSO4, (b) NH4NO3, and (c) Three (NH4)2SO4 and NH4NO3 Mixtures ........................................................................................................ 4-17
xv
FIGURES (continued) Figure Page 4-12 Photographs of Specimens (a) Deposited With Salts Before the Test and (b) After
the 6-Week Test Period at 45 °C [113 °F] and 44 Percent Relative Humidity. Photographs and Optical Micrographs of Specimens After Cleaning That Were Previously Deposited With (c) NH4HSO4 Salt, (d) NH4NO3, (e) (NH4)2SO4 + NH4NO3 Mixture (SO4
2-/NO3- = 0.5), (f) (NH4)2SO4 + NH4NO3 Mixture
(SO42-/NO3
- = 1), and (g) (NH4)2SO4 + NH4NO3 Mixture (SO42-/NO3
- = 3). ................... 4-20 4-13 Photographs and Optical Micrographs of Posttest Specimens Exposed at 45 °C [113 °F] and 44 Percent Relative Humidity for 6 Weeks, Then at 35 °C [95 °F] and
72 Percent Relative Humidity to NH4NO3 for 1 Month and (b) Magnified Surface Showing Minor Pitting. Red Circle Highlights Shallow Corrosion Feature on Surface. ...................................................................................................................... 4-21
4-14 Photograph and Optical Micrograph of Posttest Specimens Exposed at 45 °C [113 °F] and 44 Percent Relative Humidity for 6 Weeks, Then at 35 °C [95 °F] and 72 Percent Relative Humidity to Mixture 1 for 1 Month and (b) Magnified Surface Showing Minor Pitting ................................................................................................. 4-21 4-15 Photographs and Optical Micrographs of Posttest Specimens Exposed at 45 °C [113 °F] and 44 Percent Relative Humidity for 6 Weeks, Then at 35 °C [95 °F] and 72 Percent Relative Humidity to Mixture 2 for 1 Month and (b) Magnified Surface Showing Minor Pitting .................................................................................... 4-22 4-16 Photograph and Optical Micrographs of Posttest Specimens Exposed at 45 °C [113 °F] and 44 Percent Relative Humidity for 6 Weeks, Then at 35 °C [95 °F] and 72 Percent Relative Humidity to Mixture 3 for 1 Month and (b) Magnified Surface Showing Minor Pitting .................................................................................... 4-23 4-17 Photograph and Optical Micrographs of Posttest Specimens Exposed at 45 °C [113 °F] and 44 Percent Relative Humidity for 6 Weeks, Then at 35 °C [95 °F] and 72 Percent Relative Humidity to Fly Ash for 1 Month and (b) Magnified Surface Showing Minor Pitting .................................................................................... 4-24 4-18 (a) Photographs, (b) SEM, and (c) EDX of Posttest As-Received, Sensitized, and
Welded Specimens Exposed at 45 °C [113 °F] and 44 Percent Relative Humidity for 6 Weeks, Then at 35 °C [95 °F] and 72 Percent Relative Humidity to NH4HSO4 for 1 Month ...................................................................................................................... 4-25 4-19 Cross Section of (a) As-Received, (b) Sensitized, and (c) Welded Specimens Exposed to NH4HSO4 at 45 °C [113 °F] and 44 Percent Relative Humidity for 6 Weeks, Then at 35 °C [95 °F] and 72 Percent Relative Humidity for 1 Month ............. 4-26 4-20 (a) Photographs of Type 304 Stainless Steel U-Bend Specimens Deposited With
NH4NO3, NaCl Mixture (NO3−/Cl− = 3.0), NH4NO3, and NaCl Mixture (NO3
−/Cl− = 6.0) and (b) Four Specimens Removed After Exposure at 45 °C [113 °F] and 44 Percent Relative Humidity for 47 Days .................................................................................... 4-28
4-21 Surface and Cross Section Optical Micrographs of Cracks Observed From Sensitized Specimens Deposited With (a) NH4NO3 and NaCl Mixture (NO3
−/Cl− = 3.0) and (b) NH4NO3 and NaCl Mixture (NO3
−/Cl− = 6.0) After Exposure at 45 °C [113 °F] and 44 Percent Relative Humidity for 47 Days .............................................. 4-29 4-22 Photographs of Sensitized Specimens Deposited With NH4NO3, NaCl Mixture (NO3
−/Cl− = 3.0), NH4NO3, and NaCl Mixture (NO3−/Cl− = 6.0) Exposed at 45 °C
[113 °F] and 44 Percent Relative Humidity for Eight Weeks. Red Circles Indicate Cracks. ....................................................................................................................... 4-29
xvi
FIGURES (continued) Figure Page 4-23 Photographs and Optical Micrographs From the Surface of As-Received Specimens
Deposited With (a) NH4NO3 and NaCl Mixture (NO3−/Cl− = 3.0) and (b) NH4NO3 and
NaCl Mixture (NO3−/Cl− = 6.0) After a 4-Month Period of Exposure at 45 °C [113 °F]
and 44 Percent Relative Humidity ............................................................................... 4-30 4-24 Observation From Beakers at 45 °C [113 °F] for Deliquescence Tests at Increasing Relative Humidity: (a) NH4NO3/NaCl = 6, (b) NH4NO3/NaCl = 3, and (c) NH4NO3 ....... 4-32 4-25 Observation From Beakers at 45 °C [113 °F] for Efflorescence Test at Decreasing Relative Humidity: (a) NH4NO3 and (b) Mixtures NH4NO3/NaCl = 3 and 6 .................. 4-32
xvii
TABLES Table Page 2-1 Chemical Composition of Simulated Sea Salt (Wt%) ....................................................2-1 2-2 Concentrations and pHs of Non-Chloride-Rich Salt Solutions and Calculated pHs of Deliquescence Brines at Stress Corrosion Cracking Test Conditions ...........................2-2 2-3 Measured Cation and Anion Concentrations in Fly Ash Leachate .................................2-3 2-4 Chemical Composition of Type 304 Stainless Steels and Type 308 Filler Materials (Wt%) ............................................................................................................2-4 2-5 Type 304 Stainless Steel Electrochemical Reactivation Test Results ...........................2-5 2-6 Chemical Composition of Type 304L Stainless Steels Used To Fabricate C-Ring
Specimens (Wt%) .........................................................................................................2-9 2-7 Type 304L Stainless Steel Electrochemical Reactivation Test Results .........................2-9 2-8 Mechanical Properties of Type 304L Stainless Steel Tube To Fabricate C-Ring
Specimens ................................................................................................................. 2-10 2-9 Displacement of C-Ring for Strain at Yield Strength and 1.5 Percent Strain ............... 2-13 2-10 Deliquescence and Efflorescence Test Matrix ............................................................ 2-17 2-11 Calculated Chloride Concentration, pH at 30 °C [86 °F] and 90 Percent Relative Humidity, and Measured Solution pH at Room Temperature {~20 °C [68 °F]} ............ 2-24 3-1 Environmental Cycling Test Matrix at Absolute Humidity Less Than 30 g/m3 .............. 3-14 3-2 Relative Humidity for Specimen Temperatures When Chamber Absolute Humidity Ranged Between 10 and 30 g/m3 ............................................................................... 3-14 3-3 Static Environmental Test Matrix at Elevated Temperatures With 10 g/m2 Salts on U-Bends ................................................................................................................ 3-31 3-4 Chloride Concentration and Solution pH ..................................................................... 3-39 3-5 C-Ring Stress Corrosion Cracking Test Matrix ........................................................... 3-45 3-6 Type 304 Stainless Steel Weld Electrochemical Reactivation Test Results ................ 3-54 4-1 Global Sources of Tropospheric Hydrochloric Acid .......................................................4-7 4-2 Nitrate, Sulfate, and Chloride Concentration in Fine Particulate Matter Collected at Five IMPROVE Monitoring Sites for the Period January 1, 2009, to December 31, 2010 ......................................................................................................4-8 4-3 Mole Ratio of Nitrate to Chloride and Sulfate to Chloride in Fine Particulate Matter Collection at Five IMPROVE Monitoring Sites ..............................................................4-8 4-4 Measured and Calculated Deliquescence Relative Humidity and Efflorescence Relative Humidity of NH4HSO4, NH4NO3, (NH4)2SO4 Pure Salts, and Mixtures of (NH4)2SO4 and NH4NO3 at 35 °C [95 °F] ..................................................................... 4-12 4-5 Measured and Calculated Deliquescence Relative Humidity and Efflorescence Relative Humidity of NH4HSO4, NH4NO3, (NH4)2SO4 Pure Salts, and Mixtures of (NH4)2SO4 and NH4NO3 at 45 °C [113 °F] ................................................................... 4-14 4-6 Measured and Calculated Deliquescence Relative Humidity and Efflorescence Relative Humidity of NH4HSO4, NH4NO3, (NH4)2SO4 Pure Salts, and Mixtures of (NH4)2SO4 and NH4NO3 at 60 °C [140 °F] ................................................................... 4-18 4-7 Stress Corrosion Cracking Test Matrix at 45 °C [113 °F] and 44 Percent Relative
Humidity With Non-Chloride Salts ............................................................................... 4-18 4-8 Specimens Removed After a 6-Week Exposure Period at 45 °C [113 °F] and 44 Percent Relative Humidity ..................................................................................... 4-19

xviii
TABLES (continued) Table Page 4-9 Stress Corrosion Cracking Test Matrix at 45 °C [113 °F] and 44 Percent Relative Humidity With Non-Chloride and Chloride Salt Mixtures ............................... 4-27 4-10 Measured and Calculated Deliquescence Relative Humidity and Efflorescence Relative Humidity of NH4NO3 and NaCl Pure Salts, and Mixtures of NH4NO3 and NaCl at 45 °C [113 °F] ......................................................................................... 4-33

xix
EXECUTIVE SUMMARY At various locations throughout the United States, including some operating and decommissioned reactor sites and Department of Energy facilities, spent nuclear fuel is maintained at independent spent fuel storage installations (ISFSIs) in dry cask storage systems. These storage systems commonly consist of a welded austenitic stainless steel canister within a larger shielding structure that is vented to the external atmosphere to allow airflow for cooling. Canisters are therefore exposed to temperature and humidity variations at the ISFSI site, and potential contact with airborne chemical species. Species may include chloride-rich salts from marine environments, de-icing salts, or condensed water from cooling towers, as well as a range of other non-chloride-rich species originating from industrial, agricultural, and commercial activities. In a number of previous technical reports, the U.S. Nuclear Regulatory Commission (NRC) and the industry have identified a scenario whereby these species are deposited on the canister surface and a brine forms by deliquescence. Deliquescence refers to a process wherein the species, such as a hygroscopic salt, absorbs water from the air in conditions of high relative humidity (RH). Austenitic stainless steel has exhibited susceptibility to stress corrosion cracking (SCC) when exposed to certain brines, particularly those rich in chloride. Stresses to cause cracking in canisters could arise from welding or other fabrication processes. The industry and NRC have recognized the potential for SCC of the dry storage canister for several years. Following literature reviews on this topic by the Electric Power Research Institute, NRC sponsored laboratory testing, as reported in 2010 in NUREG/CR–7030, “Atmospheric Stress Corrosion Cracking Susceptibility of Welded and Unwelded 304, 304L, and 316L Austenitic Stainless Steels Commonly Used for Dry Cask Storage Containers Exposed to Marine Environments” (Caseres and Mintz, 2010). U-bend stainless steel specimens were exposed to a fog of simulated sea salt at temperatures of 43, 85, and 120 °C [109, 185, and 248 °F]. After 1 year of exposure, SCC was only observed for the specimens tested at 43 °C [109 °F]. At the given absolute humidity (AH) for the tests, the RH increases with decreasing temperature, because the water saturation concentration decreases. Thus, it was conjectured that only at the lowest temperature was the RH high enough to cause deliquescence of salt, whereas at the higher temperatures, salt would remain dry. However, certain limitations were noted for this study, including test methodologies that could have directly introduced moisture onto the specimens and very high AH conditions that may not be representative of in-service conditions for the canisters. It was therefore determined that a more refined test program was warranted to evaluate the factors that could affect SCC susceptibility, including temperature, humidity, salt concentration, material metallurgical condition, and stress level. In addition, the effects of non-chloride salt atmospheric species would be investigated. The present report summarizes the results of this program. The series of tests performed as part of the program included: (i) Measurement of deliquescence relative humidity (DRH) and efflorescence RH
of simulated sea salt and its most abundant constituents;
(ii) SCC testing of austenitic stainless steel specimens exposed to simulated sea salt within the range of AH expected in natural conditions;
(iii) SCC testing of austenitic stainless steel specimens exposed to simulated sea salt at elevated temperatures;

xx
(iv) SCC testing of austenitic stainless steel specimens exposed to simulated sea salt at high-humidity conditions;
(v) SCC testing of austenitic stainless steel specimens exposed to simulated sea salt with various applied strains and stresses; and
(vi) Deliquescence and efflorescence measurements of non-chloride-rich atmospheric species and SCC testing of austenitic stainless steel specimens exposed to these species
Deliquescence and efflorescence tests of the most abundant constituents of sea salt, sodium chloride (NaCl), magnesium chloride (MgCl2), sodium sulfate (Na2SO4), and calcium chloride (CaCl2) indicated that calcium chloride had the lowest DRH, followed by magnesium chloride, sodium chloride, and then sodium sulfate with the highest. The DRH for simulated sea salt was measured to be between that of calcium chloride and magnesium chloride, in the range of about 20 to 30 percent RH for temperatures at or below 80 °C [176 °F]. For testing within the range of AH expected in natural conditions, 30 g/m3 was selected as a reference upper limit for AH based on meteorological monitoring data. Type 304 stainless steel U-bend specimens in the as-received, sensitized, and welded metallurgical conditions were deposited with 0.1, 1, or 10 g/m2 of salt on the surface. For the purpose of this study, sensitized specimens refer to those which have been thermally treated to create a chromium-depleted region around the grain boundaries. The specimens were exposed to an AH cycle between 10 and 30 g/m3 at temperatures of 27, 35, 45, 52, and 60 °C [81, 95, 113, 126, and 140 °F]. The specimens were exposed until crack initiation was observed or the test was terminated, which ranged from weeks to months, depending on the condition. Specimens were removed from the chamber and microscopically examined for evidence of SCC initiation or other corrosion products. Crack initiation was observed for specimens with as little as 0.1 g/m2 of salt, with the extent of cracking generally increasing with decreasing temperature (i.e., higher RH) and increasing salt quantity. For testing in elevated temperature conditions, U-bend specimens were deposited with 10 g/m2 of simulated sea salt and exposed to different humidity levels at 45, 60, and 80 °C [113, 140, and 176 °F]. The humidity was held constant for the duration of the exposure period. At 60 and 80 °C [140 and 176 °F], SCC initiation was observed at RH as low as 25 and 28 percent, respectively, which is in the range of the measured DRH for sea salt. For both the cyclic AH and elevated temperature SCC tests, sensitized specimens showed greater SCC susceptibility than as-received or welded specimens. Additional tests were performed at high RH conditions because the equilibrium chloride concentration in a saturated solution decreases with increasing RH. It was hypothesized that the chloride could become diluted to the point that SCC would not initiate. U-bend specimens were submerged in prepared saturated solutions of sea salt, calcium chloride, magnesium chloride, and sodium chloride at 30 °C [86 °F] and 90 percent RH. The chloride concentration in the solutions was less than half of that for the deliquescent brines in most of the cyclic AH and elevated temperature SCC tests. SCC initiation was observed after exposure to all solutions, though to a lesser extent than for the tests in lower humidity conditions. U-bend specimens are useful for testing because they are easy to handle and fabricate in large quantities, but they represent a highly strained condition, where the strain at the apex may be close to 15 percent. It is uncertain whether this is representative of the material state

xxi
in the canisters, even at the welds. Therefore, another series of tests was performed using C-ring specimens in which the strain was manually adjusted to a lower level than in the U-bend specimens. As-received and sensitized C-ring specimens were strained to either 0.4 or 1.5 percent and deposited with 1 or 10 g/m2 sea salt. The stress at the lower strain corresponds approximately to the material yield stress. The specimens were then exposed for several months at AH of 30 g/m3 at 35, 45, and 52 °C [95, 113, and 126 °F]. SCC initiation was observed on some of the specimens with only 0.4 percent strain, or stress near the material yield stress, though to a lesser extent than for the specimens with 1.5 percent strain or for the U-bend specimens. Concerning the testing of non-chloride-rich atmospheric species, a literature review indicated that sulfate (SO4
2−), nitrate (NO3−), and ammonium (NH4
+) ions are the most abundant soluble ions in particulate matter at locations near industrial, commercial, or agricultural activities. Chloride (Cl-) and bisulfate (HSO4
-) ions are also present in smaller amounts. Ammonium sulfate [(NH4)2SO4], ammonium bisulfate (NH4HSO4), ammonium nitrate (NH4NO3), and fly ash were selected to represent the non-chloride-rich species for testing. Deliquescence and SCC tests were performed with the respective species, as well as mixtures of ammonium nitrate and ammonium sulfate with various nitrate-to-sulfate molar ratios. For the SCC tests, relatively large quantities of the species were deposited on Type 304 stainless steel U-bend specimens, which were then exposed in an atmospheric test chamber at 35 and 45 °C [95 and 113 °F]. No SCC was observed on any test specimens exposed to the non-chloride species, even at humidity well above the measured DRH. To evaluate the effects of non-chloride and chloride-rich salt mixtures, a final series of tests was performed in which U-bend specimens were deposited with a mixture of ammonium nitrate and sodium chloride with nitrate-to-chloride molar concentration ratios of 3.0 and 6.0. Extensive cracking was observed on these specimens. Reference Caseres, L. and T.S. Mintz. NUREG/CR–7030, “Atmospheric Stress Corrosion Cracking Susceptibility of Welded and Unwelded 304, 304L, and 316L Austenitic Stainless Steels Commonly Used for Dry Cask Storage Containers Exposed to Marine Environments.” ML103120081. Washington, DC: U.S. Nuclear Regulatory Commission. October 2010.


xxiii
FOREWORD At a number of locations in the United States, including some operating and decommissioned reactor sites and Department of Energy facilities, spent nuclear fuel (SNF) is kept in dry cask storage systems (DCSS). Dry storage of SNF is licensed under Title 10 of the Code of Federal Regulations (10 CFR), Part 72 “Licensing Requirements for the Independent Storage of Spent Nuclear Fuel, High-Level Radioactive Waste, and Reactor-Related Greater than Class C Waste.” The provisions of 10 CFR Part 72 are intended, in part, to ensure that the DCSS will reasonably maintain confinement of radioactive material under normal, off-normal, and credible accident conditions. DCSS most commonly consist of a welded austenitic stainless steel canister within a larger shielding structure that is vented to the external atmosphere to allow airflow for cooling. This design may allow airborne salts or other atmospheric species to deposit on the canister surface while DCSS is in service. A corrosive brine could form by the process of deliquescence, wherein salt absorbs moisture from humid air to form a saturated solution. Laboratory studies and operational experience indicate that austenitic stainless steel is susceptible to stress corrosion cracking (SCC) when exposed to chlorides, which may be present in marine environments, near cooling towers, on treated roads, or from other sources. The occurrence of SCC could compromise the barrier function of the dry storage canister. In 2011, the Office of Nuclear Materials Safety and Safeguards requested that the Office of Nuclear Regulatory Research undertake a test program to systematically evaluate the conditions under which SCC of austenitic stainless steel can occur, including such parameters as the chemistry and quantity of the salt, temperature and humidity, material condition, and stress level. This NUREG/CR report documents the results of the research activity, performed at the Center for Nuclear Waste Regulatory Analyses. Testing was primarily conducted by depositing sea salt onto prestressed Type 304 or 304L stainless steel test specimens, then exposing those specimens in atmospheric chambers at various temperature and humidity levels. In the temperature range of 35 to 80 °C [95 to 176 °F], SCC initiation was observed on specimens deposited with as little as 0.1 g/m2 of simulated sea salt and on specimens with as little as 0.4 percent strain, where the corresponding stress was only slightly above the yield stress. Cracking occurred at relative humidity (RH) above about 20 to 30 percent, which was measured as the range of RH at which sea salt deliquesces. The susceptibility to cracking appears to be greater at lower temperatures, because the RH is higher for given absolute humidity. Additional tests were performed using chemical species other than chloride salts, which may be found in the atmosphere near commercial, industrial, or agricultural activities. These include ammonium sulfate, ammonium bisulfate, and ammonium nitrate. No SCC was observed for test specimens exposed to these species. When ammonium nitrate was mixed with sodium chloride, however, deep cracking was observed. It is expected that the results of these studies will help NRC staff evaluate the conditions in which dry storage canisters may be susceptible to SCC, and facilitate engagement with industry and other stakeholders to determine additional information needed to ensure that the potential for SCC is appropriately evaluated and managed.


xxv
ACKNOWLEDGMENTS
The authors greatly acknowledge the contributions made by B. Derby in preparing the U-bend and C-ring specimens; setting up, conducting, and monitoring the stress corrosion cracking tests; and providing technical support in many other areas. D. Noll also helped in the preparation of the U-bend and C-ring specimens. C. Wolfe helped in cross sectioning and preparing the microstructure evaluation specimens. In the early stages of the program, G. Norman helped in polishing specimens and setting up the environmental chambers for the tests. Staff from the Southwest Research Institute® (SwRI®) Chemistry and Chemical Engineering Division performed the salt chemical analyses. K. Chiang helped the deliquescence and efflorescence testing in the initial stage and performed a literature review on stainless steel corrosion in nitrate-containing solution. The authors wish to acknowledge the valuable contributions of and many helpful discussions with D. Dunn, T. Ahn, and S. Lyons of the U.S. Nuclear Regulatory Commission (NRC) and Y. Pan of SwRI. The authors thank P. Shukla, O. Pensado, and G. Wittmeyer for their review. The authors also thank B. Street for her support in report preparation and L. Mulverhill for her editorial review. This report documents the work performed by the Center for Nuclear Waste Regulatory Analyses (CNWRA®) for NRC under Contract No. NRC–HQ–12–C–02–0089. The studies and analyses reported were performed on behalf of the NRC, Office of Nuclear Regulatory Research. This report is an independent product of CNWRA and does not necessarily reflect the view or regulatory position of NRC. NRC staff views expressed herein are preliminary and do not constitute a final judgment or determination of the matters addressed or of the acceptability of any licensing action that may be under consideration at NRC.

1-1
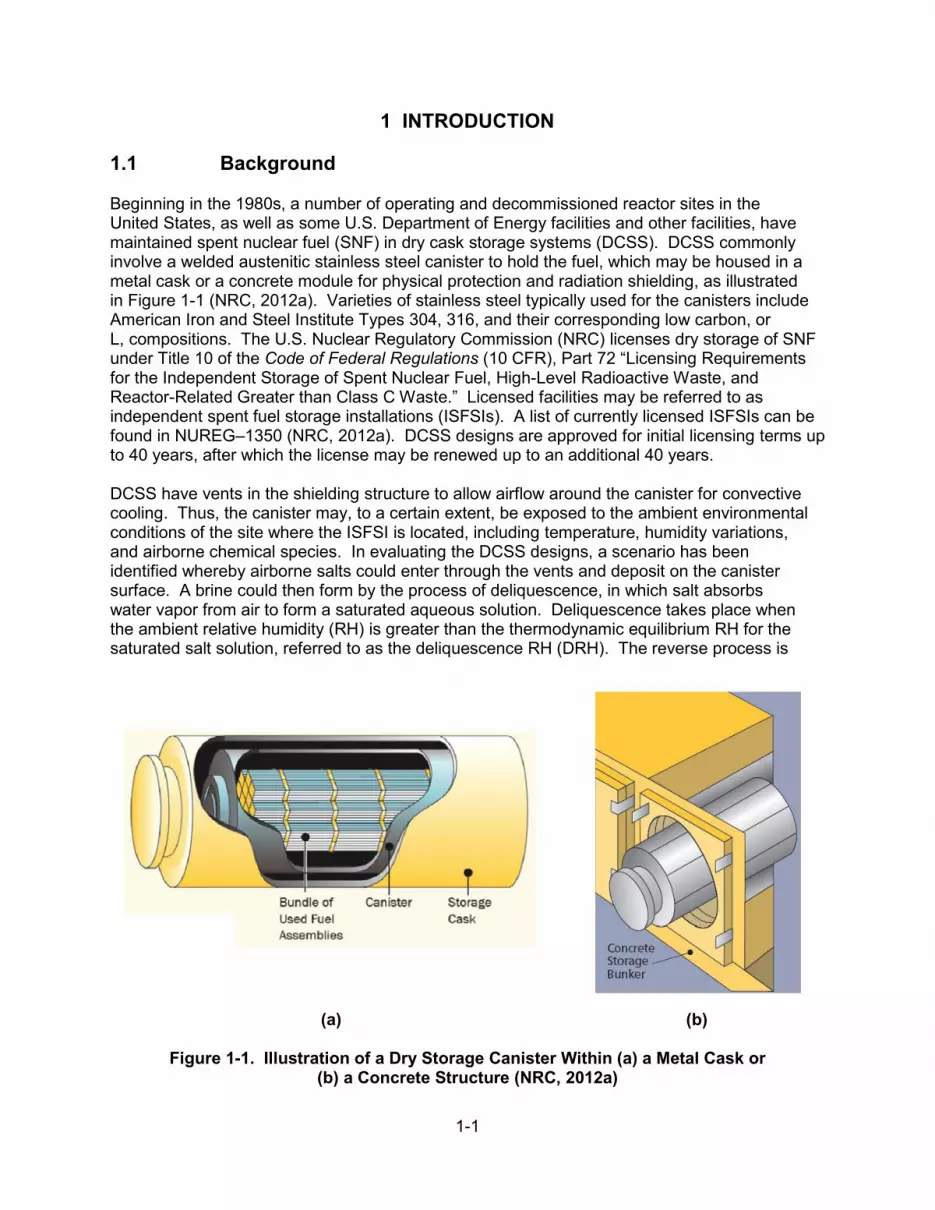
1 INTRODUCTION 1.1 Background Beginning in the 1980s, a number of operating and decommissioned reactor sites in the United States, as well as some U.S. Department of Energy facilities and other facilities, have maintained spent nuclear fuel (SNF) in dry cask storage systems (DCSS). DCSS commonly involve a welded austenitic stainless steel canister to hold the fuel, which may be housed in a metal cask or a concrete module for physical protection and radiation shielding, as illustrated in Figure 1-1 (NRC, 2012a). Varieties of stainless steel typically used for the canisters include American Iron and Steel Institute Types 304, 316, and their corresponding low carbon, or L, compositions. The U.S. Nuclear Regulatory Commission (NRC) licenses dry storage of SNF under Title 10 of the Code of Federal Regulations (10 CFR), Part 72 “Licensing Requirements for the Independent Storage of Spent Nuclear Fuel, High-Level Radioactive Waste, and Reactor-Related Greater than Class C Waste.” Licensed facilities may be referred to as independent spent fuel storage installations (ISFSIs). A list of currently licensed ISFSIs can be found in NUREG–1350 (NRC, 2012a). DCSS designs are approved for initial licensing terms up to 40 years, after which the license may be renewed up to an additional 40 years. DCSS have vents in the shielding structure to allow airflow around the canister for convective cooling. Thus, the canister may, to a certain extent, be exposed to the ambient environmental conditions of the site where the ISFSI is located, including temperature, humidity variations, and airborne chemical species. In evaluating the DCSS designs, a scenario has been identified whereby airborne salts could enter through the vents and deposit on the canister surface. A brine could then form by the process of deliquescence, in which salt absorbs water vapor from air to form a saturated aqueous solution. Deliquescence takes place when the ambient relative humidity (RH) is greater than the thermodynamic equilibrium RH for the saturated salt solution, referred to as the deliquescence RH (DRH). The reverse process is
(a) (b)
Figure 1-1. Illustration of a Dry Storage Canister Within (a) a Metal Cask or
(b) a Concrete Structure (NRC, 2012a)

1-2
called efflorescence and involves the loss of water from the aqueous solution and salt precipitation occurring when the ambient RH is below the thermodynamic equilibrium RH for the saturated salt solution. The DRH and ERH are thermodynamic quantities that depend on the composition and molecular size of the salt and on the temperature (Twomey, 1953; Owens, 1926; Winkler, 1988). A deliquescent brine on the canister surface could lead to a condition of susceptibility known as stress corrosion cracking (SCC), particularly for the case of austenitic stainless steel exposed to chloride-rich salts. Vulnerable locations on the canister include regions of high weld residual stress or where there are contact stresses between the canister and support structures. The potential for SCC could have a number of implications related to the requirements in 10 CFR, Part 72, including the following: (i) Structures, systems, and components important to safety must be designed to
accommodate the effects of site characteristics and environmental conditions associated with normal operation and maintenance [10 CFR 72.122(b)(1)].
(ii) SNF cladding must be protected during storage against degradation that leads to
gross ruptures [10 CFR 72.122(h)(1)]. (iii) Storage systems must be designed to allow ready retrieval of SNF
[10 CFR 72.122(l)].
(iv) Storage casks and systems important to safety must be evaluated to demonstrate that they will reasonably maintain confinement of radioactive material under normal, off-normal, and credible accident conditions [10 CFR 72.236(l)].
Chloride-induced SCC of austenitic stainless steel has long been reported in the literature in locations such as marine environments (Morgan, 1980; Kain, 1990), and concern about dry storage canisters has been recognized for a number of years. The Electric Power Research Institute (EPRI) published review reports on this subject (EPRI, 2005, 2006), as well as the Nuclear Decommissioning Authority in the United Kingdom (Nuclear Decommissioning Authority, 2007). More recently, NRC released Information Notice (IN) 2012-20, “Potential for Chloride-Induced Stress Corrosion Cracking of Austenitic Stainless Steel and Maintenance of Dry Cask Storage Systems” (NRC, 2012b). The IN describes several incidents in commercial nuclear power plants where SCC of austenitic stainless steel components was attributed to atmospheric chloride exposure (NRC, 1999, 2005, 2010; Alexander, et al., 2010). These events involved components such as emergency core cooling system piping, SNF pool cooling lines, and outdoor tanks. The IN notes that chlorides may be present in the atmosphere not only in marine environments, but also near cooling towers, salted roads, or other locations. 1.2 Previous Studies Some experimental work has been done to identify the conditions where austenitic stainless steel dry storage canisters could be susceptible to chloride-induced SCC. NRC previously sponsored a test program reported in NUREG/CR–7030, “Atmospheric Stress Corrosion Cracking Susceptibility of Welded and Unwelded 304, 304L, and 316L Austenitic Stainless Steels Commonly Used for Dry Cask Storage Containers Exposed to Marine Environments.” (Caseres and Mintz, 2010). A number of studies have also been performed in Japan, primarily
1-3
under the sponsorship of the Central Research Institute of Electric Power Industry. These studies are summarized next. 1.2.1 NUREG/CR–7030 As reported in NUREG/CR–7030 (Caseres and Mintz, 2010), tests were performed in which U-bend specimens of Types 304, 304L, and 316L stainless steel were exposed to a fog of simulated sea salt at temperatures of 43, 85, and 120 °C [109, 185, and 248 °F]. It was estimated that approximately 20 g/m2 of salt was deposited on the specimen surfaces. After 1 year of exposure, SCC was only observed for the specimens tested at 43 °C [109 °F]. The specimens with different temperatures were in a single test chamber (individual specimen temperatures were controlled by cartridge heaters) and exposed to the same absolute humidity (AH), at a level of approximately 60 g/m3. At constant pressure at a given AH, the RH increases with decreasing temperature, because the water saturation concentration decreases. Therefore, for the AH level in the test chamber, the RH was estimated to be about 100 percent near the surface of the 43 °C [109 °F] specimens, 17 percent near the 85 °C [185 °F] specimens, and 5 percent near the 120 °C [248 °F] specimens. The observation of SCC at 43 °C [109 °F] was thus rationalized by conjecturing that only at this temperature was the RH high enough to cause salt deliquescence, whereas at the higher temperatures the salt would remain dry, preventing the establishment of an electrolyte. 1.2.2 Japanese Studies The Japanese SCC tests have used different methodologies than those employed for NUREG/CR–7030, primarily relying on constant load tensile testing. To investigate the minimum quantity of chlorides required for SCC initiation, constant load tensile testing was performed on Type 304 at 50 °C [122 °F] and 35 percent RH for specimens sprayed with synthetic sea water (Shirai, et al., 2011). SCC initiation {described as a crack longer than 100 µm [3.94 mil]} was observed at chloride surface concentration less than 1 g/m2 (Saegusa, et al., 2012; Shirai, et al., 2011). This is significantly less chloride than that deposited on the U-bend specimens reported in NUREG/CR–7030 (Caseres and Mintz, 2010). The threshold RH for SCC initiation was also evaluated by constant load tensile testing of Type 304 SS (Mayuzumi, et al., 2008). Specimens were placed in a box where RH was controlled with saturated calcium chloride (CaCl2) solution. For RH in the range of 16 to 20 percent, with solution-annealed and sensitized material, Mayuzumi, et al. (2008) reported no SCC initiation at 60 or 70 °C [140 or 158 °F], but did observe SCC at 80 °C [176 °F]. Additional testing at 80 °C [176 °F] and 15 percent RH showed no cracking. Thus, RH of 15 percent was described as a conservative threshold for SCC initiation. These studies suggest SCC initiation at a higher temperature and lower RH than reported in NUREG/CR–7030 (Caseres and Mintz, 2010). Finally, regarding the stress level for crack initiation, constant load tensile tests were performed on Type 304 between 0.5 and 1.75 times the material yield stress (Mayuzumi, et al., 2008). Surface chloride concentration was estimated to exceed 10 g/m2, while test conditions were 80 °C [176 °F] at 35 percent RH. Specimens failed at the stress level of 0.5 times the yield stress, though at much longer times than at higher stress levels also considered in the studies by these Japanese researchers. This likely corresponds to a much lower stress level than would be expected for U-bend specimens tested in NUREG/CR–7030 (Caseres and Mintz, 2010).

1-4
1.3 Motivation for Current Work NUREG/CR–7030 (Caseres and Mintz, 2010) confirmed that austenitic stainless steel could be susceptible to chloride-induced SCC in certain exposure conditions. In reviewing the findings, however, NRC determined that limitations or drawbacks in terms of scope and test methodology left questions about the applicability of the results to actual in-service canisters. These limitations include the following: • The AH for the tests performed in NUREG/CR–7030 (Caseres and Mintz, 2010) was
about 60 g/m3, which may be higher than expected in natural conditions.
• The salt deposition on test specimens in NUREG/CR–7030 (Caseres and Mintz, 2010) was not well controlled and was of significantly greater quantity than levels at which the Japanese observed SCC initiation.
• There is lack of tests performed between the temperatures of 43 and 85 °C [109 and
185 °F], which the Japanese data indicate that this could be an important temperature range for SCC susceptibility.
• The U-bend test specimens used in NUREG/CR–7030 (Caseres and Mintz, 2010)
represent a highly strained condition, which may not be representative of the state of the canister.
• The testing in NUREG/CR–7030 (Caseres and Mintz, 2010) did not address
non-chloride salt species, which may also be present in the atmosphere. Since the publication of NUREG/CR–7030 (Caseres and Mintz, 2010), NRC initiated a program to review its regulatory framework for the potential extended storage and transportation of SNF. In the report, “Identification and Prioritization of the Technical Information Needs Affecting Potential Regulation of Extended Storage and Transportation of Spent Nuclear Fuel” (NRC, 2012c), NRC staff identified SCC of austenitic stainless steel dry storage canisters as a high priority for further research. Similar conclusions were drawn in gap analysis reports by the U.S. Department of Energy (Hanson, et al., 2012) and Nuclear Waste Technical Review Board (NWTRB, 2010). In this context, it was determined that additional NRC research was warranted to systematically investigate factors that could lead to susceptibility for SCC. 1.4 Description and Organization of This Report This report describes the results of an NRC-sponsored study carried out at the Center for Nuclear Waste Regulatory Analyses of Southwest Research Institute®. The concept for the research program was to build upon work performed in NUREG/CR–7030 (Caseres and Mintz, 2010), using a refined methodology and expanded scope to address some of the limitations described in the previous section. A more systematic approach was undertaken to better resolve the effects of various parameters that could cause SCC, including ranges of temperature and humidity, quantity of salt, material condition, and stress level. The contents of this report are as follows. Chapter 2 describes the test protocols and experimental methods.

1-5
Chapter 3 gives the results of SCC testing in chloride-rich salts. Chapter 4 presents the results for SCC testing with non-chloride-rich species, and Chapter 5 provides the conclusions.

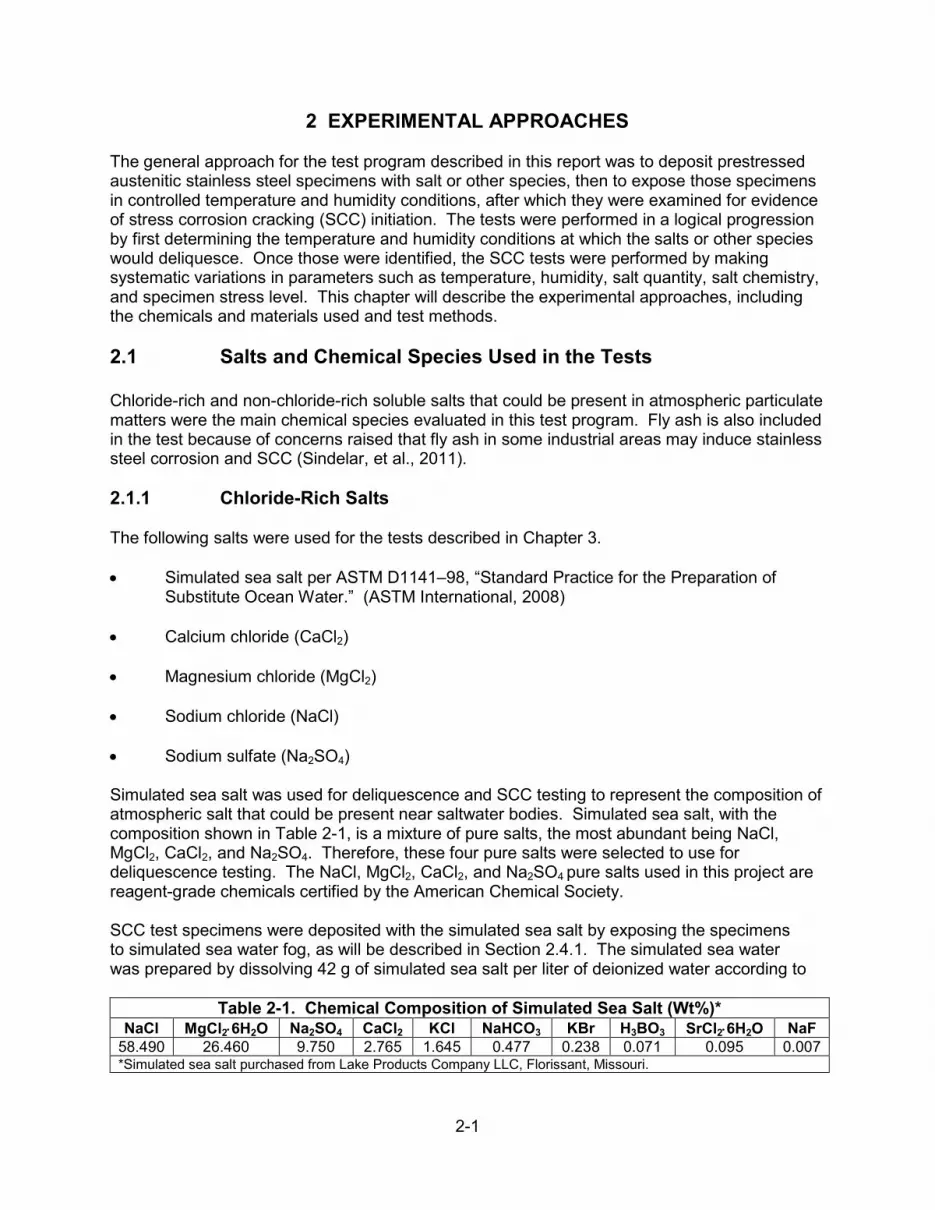
2-1
2 EXPERIMENTAL APPROACHES
The general approach for the test program described in this report was to deposit prestressed austenitic stainless steel specimens with salt or other species, then to expose those specimens in controlled temperature and humidity conditions, after which they were examined for evidence of stress corrosion cracking (SCC) initiation. The tests were performed in a logical progression by first determining the temperature and humidity conditions at which the salts or other species would deliquesce. Once those were identified, the SCC tests were performed by making systematic variations in parameters such as temperature, humidity, salt quantity, salt chemistry, and specimen stress level. This chapter will describe the experimental approaches, including the chemicals and materials used and test methods. 2.1 Salts and Chemical Species Used in the Tests Chloride-rich and non-chloride-rich soluble salts that could be present in atmospheric particulate matters were the main chemical species evaluated in this test program. Fly ash is also included in the test because of concerns raised that fly ash in some industrial areas may induce stainless steel corrosion and SCC (Sindelar, et al., 2011). 2.1.1 Chloride-Rich Salts The following salts were used for the tests described in Chapter 3. • Simulated sea salt per ASTM D1141–98, “Standard Practice for the Preparation of
Substitute Ocean Water.” (ASTM International, 2008)
• Calcium chloride (CaCl2)
• Magnesium chloride (MgCl2)
• Sodium chloride (NaCl)
• Sodium sulfate (Na2SO4) Simulated sea salt was used for deliquescence and SCC testing to represent the composition of atmospheric salt that could be present near saltwater bodies. Simulated sea salt, with the composition shown in Table 2-1, is a mixture of pure salts, the most abundant being NaCl, MgCl2, CaCl2, and Na2SO4. Therefore, these four pure salts were selected to use for deliquescence testing. The NaCl, MgCl2, CaCl2, and Na2SO4 pure salts used in this project are reagent-grade chemicals certified by the American Chemical Society. SCC test specimens were deposited with the simulated sea salt by exposing the specimens to simulated sea water fog, as will be described in Section 2.4.1. The simulated sea water was prepared by dissolving 42 g of simulated sea salt per liter of deionized water according to
Table 2-1. Chemical Composition of Simulated Sea Salt (Wt%)* NaCl MgCl2⋅6H2O Na2SO4 CaCl2 KCl NaHCO3 KBr H3BO3 SrCl2⋅6H2O NaF
58.490 26.460 9.750 2.765 1.645 0.477 0.238 0.071 0.095 0.007 *Simulated sea salt purchased from Lake Products Company LLC, Florissant, Missouri.

2-2
ASTM D1141–98 (ASTM International, 2008). The pH of the simulated sea water solution was about 8.2 at room temperature. 2.1.2 Non-Chloride-Rich Salts The following non-chloride salts were used for the tests described in Chapter 4: • Ammonium sulfate [(NH4)2SO4] • Ammonium nitrate (NH4NO3) • Ammonium bisulfate (NH4HSO4) These species were selected to represent atmospheric species that could arise from industrial, commercial, and agricultural activities. SCC tests were also performed with mixtures of (NH4)2SO4 and NH4NO3 in SO4
2−/NO3− molar ratios of 0.5, 1.0, and 3.0 and with mixtures of
NH4NO3 and NaCl in NO3−/Cl− molar ratios of 3 and 6. The basis for selection of these pure
salts and salt mixtures is given in Section 4.1. As the majority of these mixtures are not chloride, the non-chloride salts [(NH4)2SO4, NH4NO3, NH4HSO4] and these mixtures are categorized as non-chloride-rich salts in this work. The non-chloride-rich solutions were prepared from reagent-grade chemicals and deionized water to deposit the salts on SCC test specimens, as will be described in Section 2.4.2. As shown in Table 2-2, thermodynamic calculations using OLIAnalyzer® Studio Version 3.2 (OLISystems, Inc., 2012) were performed to estimate the pHs of the initial solutions and the deliquescence brines, respectively, that could form in the exposure test conditions. The pHs of the solutions were also measured with a pH electrode. The pH of the as-prepared salt solutions is included in Table 2-2. As expected, the NH4HSO4 solution has the lowest pH of −0.79.
Table 2-2. Concentrations and pHs of Non-Chloride-Rich Salt Solutions and Calculated pHs of Deliquescence Brines at Stress Corrosion Cracking Test Conditions
#
Salt Solution
Calculated Deliquescence Brine pH by
OLIAnalyzer®
Composition
Measured pH at 20 °C
[68 °F]
Calculated pH by
OLIAnalyzer®
45 °C [113 °F] and
44 Percent RH
35 °C [95 °F] and
72 Percent RH 1 4 m (NH4)2SO4 5.28 5.29 5.12 5.21 2 16.8 m NH4NO3 2.82 4.16 3.61 3.99 3 16.2 m NH4HSO4 −0.79 −1.40 −2.1 −0.64
4 3.4 m (NH4)2SO4 + 6.8 m NH4NO3 (SO4
2−/NO3− = 0.5) 4.89 4.73 3.85 4.56
5 4.0 m (NH4)2SO4 + 4.0 m NH4NO3 (SO4
2−/NO3− = 1.0) 5.00 4.93 3.85 4.62
6 4.0 m (NH4)2SO4 + 1.33 m NH4NO3 (SO4
2−/NO3− = 3.0) 5.13 5.15 3.85 4.60
7 5 m NaCl + 15 m NH4NO3 (NO3
−/Cl− = 3.0) 3.91 3.91 3.43 3.92
8 3 m NaCl + 18 m NH4NO3 (NO3
−/Cl− = 6.0) 3.93 3.98 3.50 3.94
RH = relative humidity
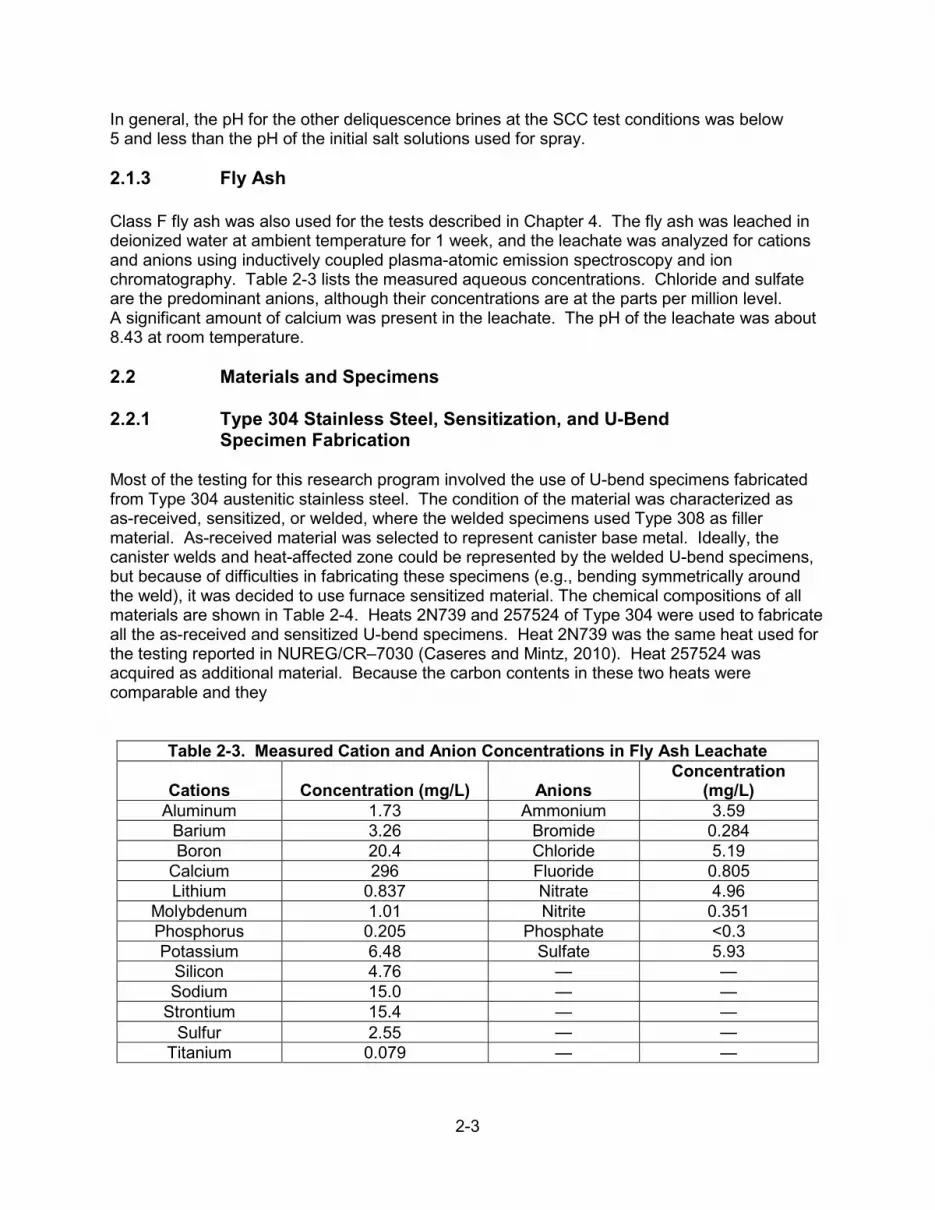
2-3
In general, the pH for the other deliquescence brines at the SCC test conditions was below 5 and less than the pH of the initial salt solutions used for spray. 2.1.3 Fly Ash Class F fly ash was also used for the tests described in Chapter 4. The fly ash was leached in deionized water at ambient temperature for 1 week, and the leachate was analyzed for cations and anions using inductively coupled plasma-atomic emission spectroscopy and ion chromatography. Table 2-3 lists the measured aqueous concentrations. Chloride and sulfate are the predominant anions, although their concentrations are at the parts per million level. A significant amount of calcium was present in the leachate. The pH of the leachate was about 8.43 at room temperature. 2.2 Materials and Specimens 2.2.1 Type 304 Stainless Steel, Sensitization, and U-Bend Specimen Fabrication Most of the testing for this research program involved the use of U-bend specimens fabricated from Type 304 austenitic stainless steel. The condition of the material was characterized as as-received, sensitized, or welded, where the welded specimens used Type 308 as filler material. As-received material was selected to represent canister base metal. Ideally, the canister welds and heat-affected zone could be represented by the welded U-bend specimens, but because of difficulties in fabricating these specimens (e.g., bending symmetrically around the weld), it was decided to use furnace sensitized material. The chemical compositions of all materials are shown in Table 2-4. Heats 2N739 and 257524 of Type 304 were used to fabricate all the as-received and sensitized U-bend specimens. Heat 2N739 was the same heat used for the testing reported in NUREG/CR–7030 (Caseres and Mintz, 2010). Heat 257524 was acquired as additional material. Because the carbon contents in these two heats were comparable and they
Table 2-3. Measured Cation and Anion Concentrations in Fly Ash Leachate
Cations Concentration (mg/L) Anions Concentration
(mg/L) Aluminum 1.73 Ammonium 3.59
Barium 3.26 Bromide 0.284 Boron 20.4 Chloride 5.19
Calcium 296 Fluoride 0.805 Lithium 0.837 Nitrate 4.96
Molybdenum 1.01 Nitrite 0.351 Phosphorus 0.205 Phosphate <0.3 Potassium 6.48 Sulfate 5.93
Silicon 4.76 — — Sodium 15.0 — —
Strontium 15.4 — — Sulfur 2.55 — —
Titanium 0.079 — —

2-4
Table 2-4. Chemical Composition of Type 304 Stainless Steels and
Type 308 Filler Materials (Wt%) Material C S Mn P Si Cr Mo Ni Cu N Fe
Type 304 Heat 2N739
0.039 0.002 1.21 0.026 0.55 18.19 N/A 8.07 N/A 0.042 Bal
Type 304 Heat 257524
0.046 0.003 1.06 0.021 0.50 18.41 0.01 8.23 0.04 0.050 Bal
Type 308 Filler 0.051 0.002 1.35 0.023 0.36 19.92 0.10 9.61 0.14 0.019 Bal C= carbon S = sulfur Mn = manganese P = phosphorus Si = silicon Cr = chromium Mo = molybdenum Ni = nickel Cu = copper N = nitrogen Fe = iron
are in the limits in ASTM A240/A240M–11a, “Standard Specification for Chromium and Chromium-Nickel Stainless Steel Plate, Sheet, and Strip for Pressure Vessels and for General Applications.” (ASTM International, 2011), they will not be differentiated later in the results sections. The welded specimens reported here were left over from the test program reported in NUREG/CR–7030 (Caseres and Mintz, 2010). No new welded specimens were fabricated for this investigation. They were prepared from gas tungsten arc welding. All the Type 304 materials were acquired in sheet form with a nominal thickness of 0.318 cm [0.125 in], meeting the requirements of ASTM A240/A240M–11a (ASTM International, 2011). The sheet was cold rolled and annealed, with no further processing done for the as-received material. For the sensitized condition, the treatment was conducted at 650 °C [1,202 °F] in an open furnace, based on the Type 304 time–temperature sensitization curves in Grubb, et al. (2005). The optimal duration of sensitization was determined by electrochemical reactivation tests following ASTM G108–94, “Standard Test Method for Electrochemical Reactivation (EPR) for Detecting Sensitization of AISI Type 304 and 304L Stainless Steels.” (ASTM International, 2010). Triplicate specimens cut from the Type 304 Heat 2N739 were sensitized for 1, 2, and 4 hours. The surface area of each specimen was approximately 1.3 cm2 [0.20 in2]. The electrochemical reactivation tests were conducted in 0.5 M H2SO4, plus 0.01 M KSCN solution per ASTM G108–94 (ASTM International, 2010) at a temperature of 30 °C [86 °F]. Two base materials were tested for comparison with the sensitized materials. The open circuit potential of the test specimen after 1 to 2 minutes of immersion was −390 to −450 mV versus the saturated calomel electrode, which is consistent with values reported in ASTM G108–94 (ASTM International, 2010). The electrochemical reactivation tests were held at a potentiostatic condition at 200 mV versus the saturated calomel electrode for 2 minutes, followed by a potential scan down to the open circuit potential at a scan rate of 1.67 mV/s. The reactivation curves, which resulted from the corrosion of the chromium-depleted regions surrounding the chromium carbide precipitates, are shown in Figure 2-1. The amount of charge, which is proportional to the area under the reactivation curve, was normalized against surface area and summarized in Table 2-5. The average charge corresponding to the degree of sensitization increased from 1- to 2-hour sensitization, but it was similar at 2- and 4-hour sensitization, suggesting that 2 hours were sufficient to sensitize this material. The post-reactivation specimens were also examined microscopically to determine whether the grain boundaries were attacked. The optical micrographs of the tested specimens are shown in Figure 2-2, and the grain boundary attack results are also included in Table 2-5. All the sensitized specimens showed grain boundary attack, whereas the base material only showed pitting corrosion. Reactivation tests were also conducted for the other Type 304 (Heat

2-5
257524) in Table 2-4, and similar results were obtained. As such, sensitization of all the Type 304 in Table 2-4 was conducted at 650 °C [1,202 °F] for 2 hours.
Figure 2-1. Type 304 Stainless Steel Material Reactivation Curves Following ASTM G108–94 (ASTM International, 2010). Sensitization Was Conducted at
650 °C [1,202 °F] for 1, 2, and 4 Hours.
Table 2-5. Type 304 Stainless Steel Electrochemical Reactivation Test Results
Base (Nonsensitized)
Sensitization Duration at 650 °C [1,202 °F]
1 Hour 2 Hours 4 Hours
Charge Normalized for Surface Area
(Coulombs/cm2)
0.39 1.40 2.37 2.91
1.70 3.64 3.00
0.60 1.71 6.41 (Outlier) 3.01
Average Charge (Coulombs/cm2) 0.50 ± 0.15 1.60 ± 0.18 3.00 ± 0.90 2.97 ± 0.06
Is There Grain Boundary Attack?
No (Pitting only) Yes Yes Yes

2-6
(a)
(b)
(c)
(d)
Figure 2-2. Micrographs of Type 304 Stainless Steel Material After Electrochemical Reactivation Tests Following ASTM G108–94 (ASTM International, 2010). (a) Base Stainless Steel Without Sensitization, (b) 1-Hour, (c) 2-Hour, and
(d) 4-Hour Sensitization at 650 °C [1,202 °F]. The U-bend specimens were fabricated in the same way as described in NUREG/CR–7030 (Caseres and Mintz, 2010). The flat specimens to be bent were initially hydro-jet cut from the stock sheet material. The sheet rolling direction was perpendicular to the length of the specimens as shown in Figure 2-3(a). Figure 2-3(b) shows the flat specimen dimensions before bending into a U-bend. Through-thickness circular holes, 0.95 cm [0.375 in] in diameter and centered at 1.27 cm [0.5 in] from both specimen ends, were machined to accommodate an Alloy C–276 bolt and nut that were used to maintain specimen displacement. The bolt and nut were electrically isolated from the specimen by ceramic shoulder washers. The flat specimens were polished to 320 grit before bending 180° to obtain U-bends around a 1.90-cm [0.75-in]-diameter mandrill in accordance with the ASTM G30–97, “Standard Practice for Making and Using U-Bend Stress-Corrosion Test Specimens” (ASTM International, 2009) standard procedure. The U-bend specimens were kept in the mandrill under stress while the Alloy C–276 stressing elements (bolt and nut) were tightened to maintain specimen displacement. One U-bend specimen is shown as an example in Figure 2-3(c). After bending, each U-bend specimen was inspected under a microscope at 50 times magnification to ensure that no cracks or fissures were present prior to testing. ASTM G30–97 (ASTM International, 2009) indicates that U-bend specimens contain both elastic and plastic strain depending on location, with the maximum

2-7
(a)
(b)
(c)
(d)
Figure 2-3. (a) Specimen Orientation on Type 304 Stainless Steel Sheet,
(b) Schematics of the Specimens Before Bending To Form U-Bends, (c) One U-Bend Specimen, and (d) One Welded Specimen Before Surface
Finishing and Bending
Fusion zone
Heat-affected zone

2-8
plastic strain located at the apex (ASTM International, 2009). Furthermore, an approximate U-bend strain, ε, at the apex can be calculated using Eq. (2-1)
ε = T/2R when T<<R (2-1) where T is specimen thickness and R is the radius of bend curvature. Current U-bend specimens have a T of 0.318 cm [0.125 in] and R of 0.952 cm [0.375 in]. The calculated strain from Eq. (2-1) was 16.7 percent. The stress at the apex is estimated to be approximately 2.5 times the yield strength based on the stress–strain curve of annealed Type 304 (Johnson, et al., 1994). However, as the actual stress–strain curves for the Type 304 as-received and sensitized materials used in this program were not measured, the difference of stress between the two material conditions at the apex is not certain. The strain in the sensitized material for the U-bend specimens is expected to be similar to that of the as-received material because the same geometry is used. The welded specimen fabrication is detailed in NUREG/CR–7030 (Caseres and Mintz, 2010). One welded specimen before surface finishing and bending is shown in Figure 2-3(d). Each welded U-bend specimen was fabricated and inspected in the same way as the as-received and sensitized U-bend specimens. 2.2.2 Type 304L Stainless Steel, Sensitization, Mechanical Properties, C-Ring Specimen Fabrication, and C-Ring Stress Levels A lesser number of tests were performed using C-ring specimens, fabricated according to ASTM G38–01, “Standard Practice for Making and Using C-Ring Stress-Corrosion Test Specimens.” (ASTM International, 2007). C-ring specimens have the advantage of allowing the specimen strain to be set at different levels. The C-ring specimens were fabricated from seamless Type 304L stainless steel pipe with a 5-cm [2-in] outer diameter and 0.3-cm [0.12-in] wall thickness. The Type 304L was used because Type 304 could not be commercially procured in the desired product form. The chemical composition of the Type 304L is shown in Table 2-6. Because Type 304L has a lower carbon content (0.013 wt%) than the Type 304 sheet used to fabricate the U-bend specimens (Table 2-4), the sensitizing temperature was adjusted to 600 °C [1,112 °F] per Grubb, et al. (2005). Electrochemical reactivation tests on the Type 304L material following ASTM G108–94 (ASTM International, 2010) were conducted to determine the time needed for sensitization. Nine specimens cut from the Type 304L pipe were sensitized for 8, 24, and 48 hours, respectively, at 600 °C [1,112 °F], with triplicate specimens at each condition. The electrochemical reactivation tests were conducted in the same way as those for U-bend specimens, as described in Section 2.2.1. Figure 2-4 shows the reactivation curves, and Table 2-7 summarizes the charges. There is no significant difference in the curves and charges for the 8.0-hour and 24-hour sensitizations compared to the base, but there is a higher charge for the 48-hour sensitization. Posttest examination of specimens, shown in Figure 2-5, also confirms that there is grain boundary attack in specimens exposed to 48-hour sensitization, but not in the base and others exposed to shorter sensitization. As such, sensitization of Type 304L in Table 2-6 was conducted at 600 °C [1,112 °F] for 48 hours. For SCC testing of the C-ring specimens, the applied stress was determined in reference to the 0.2 percent offset yield point. Stress–strain curves were obtained by performing mechanical

2-9
Table 2-6. Chemical Composition of Type 304L Stainless Steels Used To Fabricate C-Ring Specimens (Wt%)
C S Mn P Si Cr Mo Ni Cu Co N Fe 0.013 0.004 1.06 0.034 0.39 18.65 0.01 8.18 0.04 0.19 0.085 Balance C = carbon S = sulfur Mn = manganese P = phosphorus Si = silicon Cr = chromium Mo = molybdenum Ni = nickel Cu = copper Co = cobalt N = nitrogen Fe = iron
Figure 2-4. Type 304L Stainless Steel Tube Material Reactivation Curves Following ASTM G108–94 (ASTM International, 2010). Sensitization Was Conducted at 600 °C
[1,112 °F] for 8, 24, and 48 Hours.
Table 2-7. Type 304L Stainless Steel Electrochemical Reactivation Test Results
Base (Nonsensitized)
Sensitized at 600 °C [1,112 °F] 8 Hours 24 Hours 48 Hours
Charge Normalized For Surface Area (Coulombs/Cm2)
1.96 2.05 1.25 3.60 2.41 1.08 2.07 2.23
2.13 1.53 1.75 3.24
Average Charge (Coulombs/Cm2) 2.17 ± 0.23 1.56 ± 0.49 2.53 ± 0.41 3.03 ± 0.71
Is There Grain Boundary Attack?
No (Pitting Only)
No (Pitting Only)
No (Pitting Only)
Yes (Pitting Observed)

2-10
(a)
(b)
(c)
(d)
Figure 2-5. Photos of Type 304L Stainless Steel Tube Material After Electrochemical Reactivation Tests Following ASTM G108–94 (ASTM International, 2010).
(a) Base Stainless Steel Without Sensitization, (b) 8-Hour, (c) 24-Hour, and (d) 48-Hour Sensitization.
tests following ASTM E8/E8M–11, “Standard Test Methods for Tension Testing of Metallic Materials”(ASTM International, 2012), using one as-received and two sensitized specimens. The tensile properties data are summarized in Table 2-8, and the stress–strain curves are shown in Figure 2-6. The as-received specimen was stronger than the sensitized specimens.
Table 2-8. Mechanical Properties of Type 304L Stainless Steel Tube To Fabricate C-Ring Specimens
0.2 Percent Yield Strength MPa [ksi]
Ultimate Tensile Strength MPa [ksi]
Elongation (%)
Modulus of Elasticity MPa [ksi]
As-Received 339 [49.2] 691 [100.2] 68.5 135,516 [19,655]
Sensitized 267 [38.7 ] 687 [99.6] 66.5 141,887 [20,579]
269 [39.0 ] 687 [99.6] 69.5 143,721 [20,845]
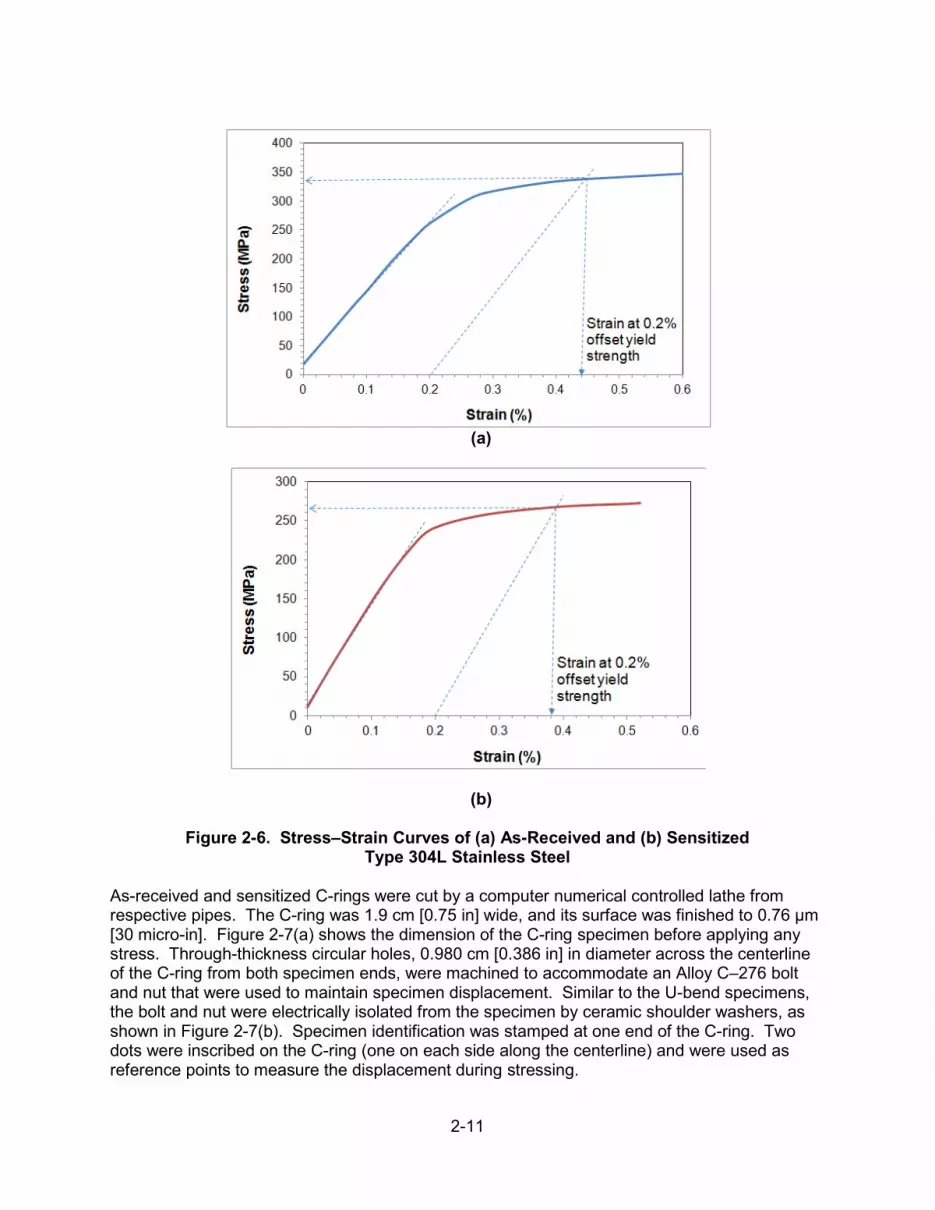
2-11
(a)
(b)
Figure 2-6. Stress–Strain Curves of (a) As-Received and (b) Sensitized Type 304L Stainless Steel
As-received and sensitized C-rings were cut by a computer numerical controlled lathe from respective pipes. The C-ring was 1.9 cm [0.75 in] wide, and its surface was finished to 0.76 µm [30 micro-in]. Figure 2-7(a) shows the dimension of the C-ring specimen before applying any stress. Through-thickness circular holes, 0.980 cm [0.386 in] in diameter across the centerline of the C-ring from both specimen ends, were machined to accommodate an Alloy C–276 bolt and nut that were used to maintain specimen displacement. Similar to the U-bend specimens, the bolt and nut were electrically isolated from the specimen by ceramic shoulder washers, as shown in Figure 2-7(b). Specimen identification was stamped at one end of the C-ring. Two dots were inscribed on the C-ring (one on each side along the centerline) and were used as reference points to measure the displacement during stressing.

2-12
All Dimensions in Inches
(a)
(b)
Figure 2-7. (a) Dimensions of C-Ring Specimens Cut From Type 304L Stainless Steel Pipe and (b) One C-Ring Specimen With Test Fixtures on Before Applying Any Stress
SCC tests using the C-ring were conducted at either the strain corresponding to the 0.2 percent offset yield strength or 1.5 percent strain. The 0.2 percent offset yield strength was determined by the data in Figure 2-6. The strains were 0.44 percent and 0.38 percent, respectively, for the as-received and sensitized Type 304L. In later chapters, 0.4 percent is referred to as the strain at yield strength. Strain is applied to the C-ring specimens by tightening the bolt to bring the ends of the specimens closer together. To determine how much the bolt should be tightened for each strain level, strain gauges were glued on the outside diameter at the apex of dummy specimens. The strain was measured as the bolt was tightened until the desired level was reached. Then the distance between the reference points shown in Figure 2-7 was measured

2-13
to the nearest 0.025 mm [0.0010 in]. Thereafter, the distance between the reference points could be used to set the specimen strain, rather than requiring a strain gauge. Triplicate specimens were used for each type of specimen at each strain level. The displacement of the C-ring at these two strain levels is shown in Table 2-9. Figure 2-8 shows pictures of the specimens strained to the level corresponding to the yield strength and 1.5 percent strain, as well as a specimen strained to 3.0 percent for comparison. The C-ring legs touched each other at 3.0 percent strain. 2.3 Deliquescence and Efflorescence Tests Tests to determine the temperature and humidity conditions at which the species would deliquesce were conducted using two methods. The first method, an electrical conductivity technique Yang, et al. (2006) developed, used a conductivity cell shown in Figure 2-9. The cell has two platinum electrodes, one at each end, and a piece of filter paper placed on an arched polytetrafluoroethylene (PTFE) support. The saturated solution of salt or salt mixture of interest was dripped on the filter paper between the electrodes. The conductivity cell was then placed in
Table 2-9. Displacement of C-Ring for Strain at Yield Strength and 1.5 Percent Strain
Strain at Yield Strength 1.5 Percent Strain As-Received
(cm) [in] Sensitized (cm) [in]
As-Received (cm) [in]
Sensitized (cm) [in]
Specimen #1 0.2083 [0.0820] 0.2001 [0.0790]
0.7048 [0.2775] 0.6845 [0.2695]
Specimen #2 0.1994[0.0785] 0.2019 [0.0795]
0.6706 [0.2640] 0.6756 [0.2660]
Specimen #3 0.2045 [0.0805] 0.1867 [0.0735]
Not Measured 0.6896 [0.2715]
Mean 0.2040 [0.0803] 0.1963 [0.0773]
0.6878 [0.2708] 0.6833 [0.2690]
(a)
(b)
(c)
Figure 2-8. C-Ring Specimens at Various Strain Levels: (a) Strain at Yield Strength, (b) 1.5 Percent Strain, and (c) 3.0 Percent Strain
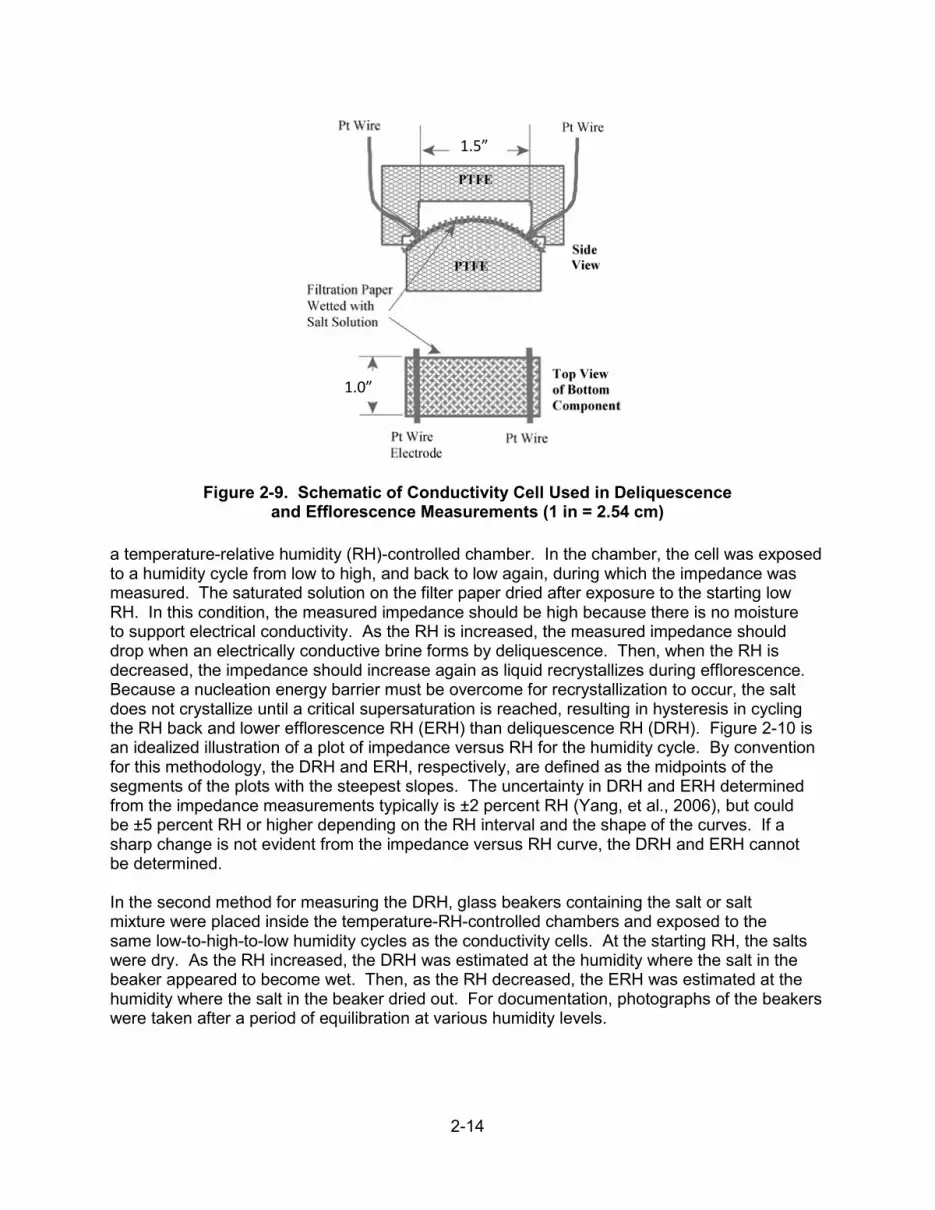
2-14
Figure 2-9. Schematic of Conductivity Cell Used in Deliquescence and Efflorescence Measurements (1 in = 2.54 cm)
a temperature-relative humidity (RH)-controlled chamber. In the chamber, the cell was exposed to a humidity cycle from low to high, and back to low again, during which the impedance was measured. The saturated solution on the filter paper dried after exposure to the starting low RH. In this condition, the measured impedance should be high because there is no moisture to support electrical conductivity. As the RH is increased, the measured impedance should drop when an electrically conductive brine forms by deliquescence. Then, when the RH is decreased, the impedance should increase again as liquid recrystallizes during efflorescence. Because a nucleation energy barrier must be overcome for recrystallization to occur, the salt does not crystallize until a critical supersaturation is reached, resulting in hysteresis in cycling the RH back and lower efflorescence RH (ERH) than deliquescence RH (DRH). Figure 2-10 is an idealized illustration of a plot of impedance versus RH for the humidity cycle. By convention for this methodology, the DRH and ERH, respectively, are defined as the midpoints of the segments of the plots with the steepest slopes. The uncertainty in DRH and ERH determined from the impedance measurements typically is ±2 percent RH (Yang, et al., 2006), but could be ±5 percent RH or higher depending on the RH interval and the shape of the curves. If a sharp change is not evident from the impedance versus RH curve, the DRH and ERH cannot be determined. In the second method for measuring the DRH, glass beakers containing the salt or salt mixture were placed inside the temperature-RH-controlled chambers and exposed to the same low-to-high-to-low humidity cycles as the conductivity cells. At the starting RH, the salts were dry. As the RH increased, the DRH was estimated at the humidity where the salt in the beaker appeared to become wet. Then, as the RH decreased, the ERH was estimated at the humidity where the salt in the beaker dried out. For documentation, photographs of the beakers were taken after a period of equilibration at various humidity levels.
1.5”
1.0”

2-15
Figure 2-10. Schematics of Deliquescence and Efflorescence Curves. The Deliquescence Relative Humidity and Efflorescence Relative Humidity Are Determined
From the Midpoint Along the Segment of the Impedance Versus Relative Humidity Curve With the Steepest Slope.
The deliquescence and efflorescence tests were intended, in part, as experimental confirmation of the calculated values for DRH that are generated using thermodynamic software. Figure 2-11 shows plots that relate RH, AH, and temperature. The green and blue lines represent isolines for 10 and 30 g/m3 AH, respectively. The plot shows that at a given absolute humidity (AH), the RH increases with decreasing temperature. Another set of curves is superimposed on the plots, which is the calculated DRH as a function of temperature for a number of chloride-rich salts, shown in (a), and some non-chloride salts, shown in (b). The DRH curves were calculated using OLIAnalyzer Studio Version 3.2 (OLISystems, Inc., 2012). For the hydrated salts, the water hydration number varies with temperature, so the calculated DRHs correspond to the most thermodynamically stable phase at the temperature of interest. Finally, the red arrows in Figure 2-11 indicate the range of the humidity cycles, from low to high, for the deliquescence and efflorescence tests performed as described previously. For both chloride-rich and non-chloride salts, the tests were conducted at temperatures of 35, 45, and 60 °C [95, 113, and 140 °F], with an additional condition of 80 °C [176 °F] for the chloride-rich salt. The ranges for the test humidity cycles were selected to cross the calculated DRH curves for at least two salts at each temperature. Except for the test at 35 °C [95 °F], the initial RH for the deliquescence tests was 10 percent, which is the lowest RH that the humidity chambers can achieve. The progression for each test was to begin at the lowest humidity, then proceed to the highest humidity in intervals of 3 to 5 percent RH. At each RH, the salts on the conductivity cell and in the beakers were equilibrated for 12 or 24 hours before measuring the impedance between the two platinum electrodes of the cell and taking photos of the salts in beakers. A longer equilibration time was used for larger RH intervals. After reaching the maximum RH, an efflorescence test was initiated by decreasing the RH in the chamber to the starting RH at 3 or 5 percent intervals. Because this work focused on obtaining an estimate of the DRH and ERH within a few percent, additional effort was not spent investigating how the stabilization time at each RH could affect the values obtained from the different methods. The test matrix for the deliquescence and efflorescence tests is shown in Table 2-10. At all temperatures, simulated

2-16
(a)
(b)
Figure 2-11. Relative Humidity Chart Showing the Calculated Deliquescence Relative Humidity as a Function of Temperature for (a) Chloride-Rich Salts and (b) Non-Chloride Salts. The Red Arrows Indicate the Relative Humidity Ranges
in the Deliquescence and Efflorescence Tests at 35, 45, 60, and 80 °C [95, 113, 140, and 176 °F]. Also Shown Are the Relative Humidity Versus Temperature Curves for
Absolute Humidities of 10 and 30 g/m3.
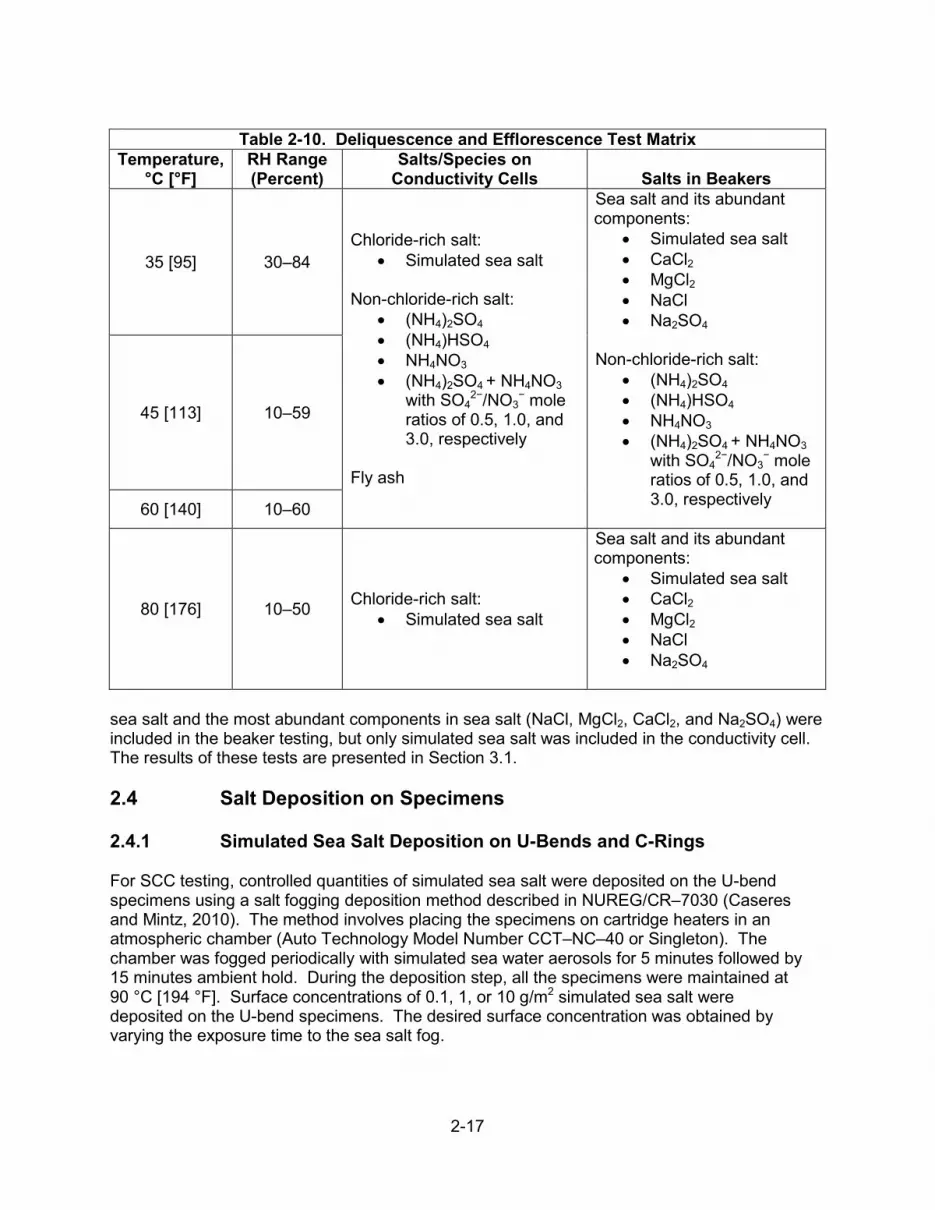
2-17
Table 2-10. Deliquescence and Efflorescence Test Matrix
Temperature, °C [°F]
RH Range (Percent)
Salts/Species on Conductivity Cells Salts in Beakers
35 [95] 30–84 Chloride-rich salt:
• Simulated sea salt Non-chloride-rich salt:
• (NH4)2SO4 • (NH4)HSO4 • NH4NO3 • (NH4)2SO4 + NH4NO3
with SO42−/NO3
− mole ratios of 0.5, 1.0, and 3.0, respectively
Fly ash
Sea salt and its abundant components:
• Simulated sea salt • CaCl2 • MgCl2 • NaCl • Na2SO4
Non-chloride-rich salt:
• (NH4)2SO4 • (NH4)HSO4 • NH4NO3 • (NH4)2SO4 + NH4NO3
with SO42−/NO3
− mole ratios of 0.5, 1.0, and 3.0, respectively
45 [113] 10–59
60 [140] 10–60
80 [176] 10–50 Chloride-rich salt: • Simulated sea salt
Sea salt and its abundant components:
• Simulated sea salt • CaCl2 • MgCl2 • NaCl • Na2SO4
sea salt and the most abundant components in sea salt (NaCl, MgCl2, CaCl2, and Na2SO4) were included in the beaker testing, but only simulated sea salt was included in the conductivity cell. The results of these tests are presented in Section 3.1. 2.4 Salt Deposition on Specimens 2.4.1 Simulated Sea Salt Deposition on U-Bends and C-Rings For SCC testing, controlled quantities of simulated sea salt were deposited on the U-bend specimens using a salt fogging deposition method described in NUREG/CR–7030 (Caseres and Mintz, 2010). The method involves placing the specimens on cartridge heaters in an atmospheric chamber (Auto Technology Model Number CCT–NC–40 or Singleton). The chamber was fogged periodically with simulated sea water aerosols for 5 minutes followed by 15 minutes ambient hold. During the deposition step, all the specimens were maintained at 90 °C [194 °F]. Surface concentrations of 0.1, 1, or 10 g/m2 simulated sea salt were deposited on the U-bend specimens. The desired surface concentration was obtained by varying the exposure time to the sea salt fog.

2-18
The exposure time required to deposit a particular quantity of salt on the U-bend surface was estimated by measuring the weight gain as a function of time using duplicate to quadruplicate dummy flat specimens. For the 1 and 10 g/m2 quantities, the flat specimens had surface dimensions of 2.5 cm × 7.5 cm [1 in × 3 in] and a thickness of 3.2 mm [0.125 in]. For the 0.1 g/m2 quantity, those specimens were too heavy to obtain the needed measurement resolution, so thinner square sheets {10 cm [4 in] per side and 0.1 mm [3.9 mils] thick} were used. After a period of exposure in the Auto Technology atmospheric chamber, the flat specimens were removed and weighed using a balance with an accuracy of 0.001 g. Then the surface concentration was calculated by dividing the weight gain by the flat surface area. Using this methodology, Figure 2-12 shows the plots of salt surface concentration after various exposure times. For clarity, the figure is split into two parts to show times up to 24 hours [Figure 2-12(a)] and up to 144 hours [Figure 2-12(b)]. The data are presented in a box and whiskers plot that shows the distribution of the measurements at each timestep. The median value for the measured concentration at a particular timestep is the intersection of the red and green rectangles. The ends of the box correspond to the 0.25 and 0.75 quartiles. The maximum and minimum values are represented by the end whiskers. As seen in Figure 2-12(a), the flat specimens that were removed after 2 hours had a median surface salt concentration of about 0.14 g/m2 with standard deviation of approximately 0.10 g/m2. The data shown in Figure 2-12(b) indicate that deposition of 1 g/m2 took a little more than 24 hours. From visual inspection, the salt deposition appeared uniform. It took around 144 hours to achieve approximately 10 g/m2 of surface salt concentration. As seen in Figure 2-12(b), the range of deposition concentration at 144 hours is relatively narrow, with a median of 11.3 g/m2 and a standard deviation of 1.16 g/m2. The results from the flat specimens were used to estimate the amount of time that would be needed to deposit the required amount of salt. Based on these results, the U-bend specimens were exposed in the atmospheric chamber for times of about 2, 24, and 144 hours to obtain the surface salt concentrations of 0.1, 1, or 10 g/m2, respectively. As described next, the time duration for each actual deposition was determined by monitoring dummy specimens. To deposit salts on specimens at three concentration levels using one atmospheric chamber, U-bend specimens targeted to have 10 g/m2 of salt were loaded first in the chamber, followed by specimens with target salt surface concentrations of 1 and 0.1 g/m2. Half U-bend specimens, 5.08 cm [2 in] long, 2.54 cm [1 in] wide, and 0.317 cm [0.125 in] thick, were placed on each cartridge heater during the actual salt fogging step. Some half U-bend specimens were for temperature control, and the other preweighed specimens were for monitoring the amount of salt deposited. While the chamber was not fogging, half U-bend specimens were taken out to be weighed as quickly as possible. The specimens were not put back once they were taken out. Figure 2-13 shows specimens deposited with salts at different surface concentrations. Visually, the salt appeared uniformly distributed on the surface. For SCC tests with C-ring specimens, simulated sea salt was deposited on the surface with 1 and 10 g/m2 using the same method as for the U-bends. However, these specimens were deposited in the Singleton atmospheric chamber because testing was ongoing in the Auto Technology chamber. Because the chamber was different for the C-rings, another deposition test using flat dummy specimens was conducted to determine the time necessary to expose the C-rings to reach the desired salt concentrations. The deposition for the C-rings occurred at a

2-19
(a)
(b)
Figure 2-12. Simulated Sea Salt Concentration as a Function of Time (a) up to 24 Hours and (b) up to 144 Hours Determined Using Periodic Salt Fogging in an Atmospheric
Chamber (Auto Technology Model Number CFCT–NC–40). The Target Salt Concentrations on the Specimen Surface Were 0.1, 1, and 10 g/m2. The Number of
Specimens Measured Per Time Period Ranged From 2 to 4.
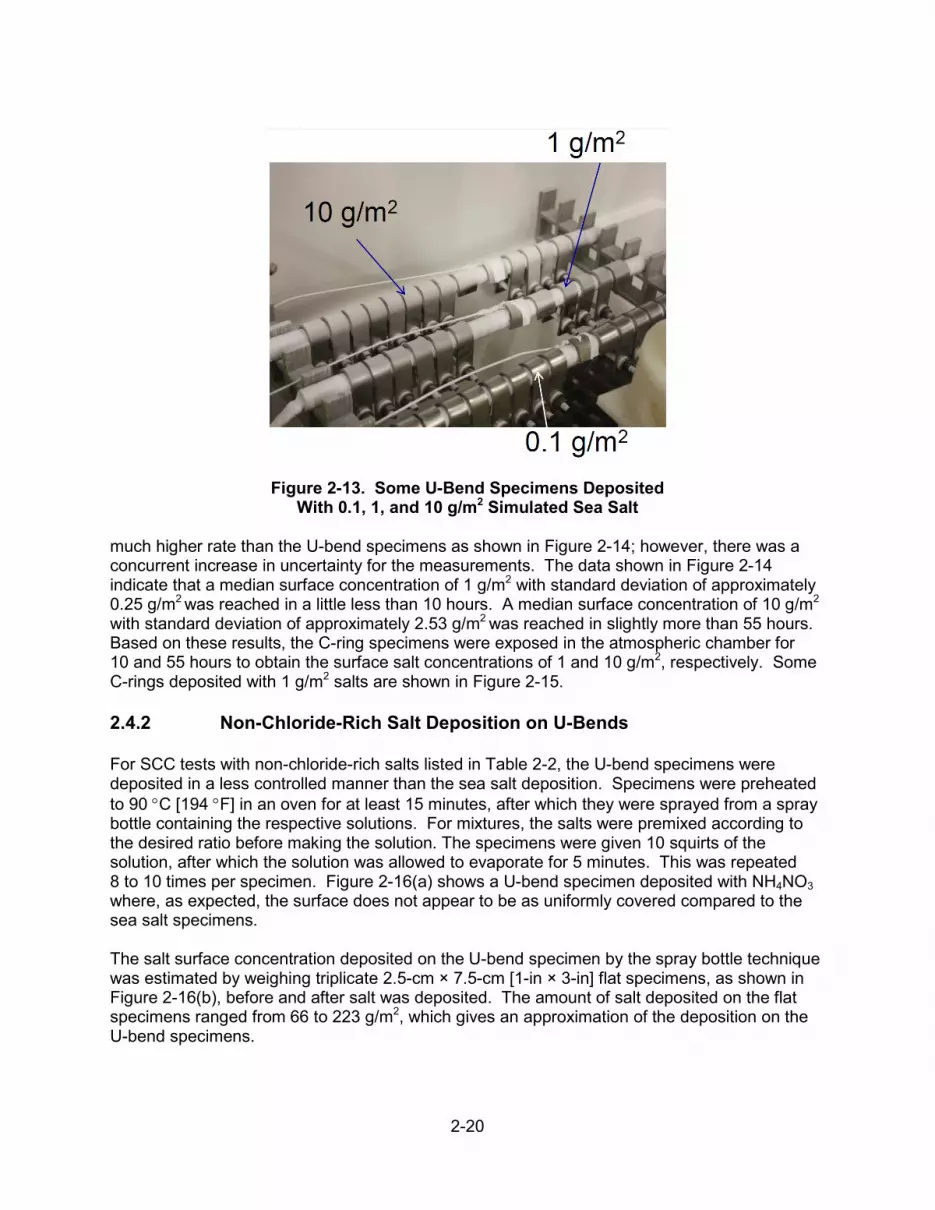
2-20
Figure 2-13. Some U-Bend Specimens Deposited With 0.1, 1, and 10 g/m2 Simulated Sea Salt
much higher rate than the U-bend specimens as shown in Figure 2-14; however, there was a concurrent increase in uncertainty for the measurements. The data shown in Figure 2-14 indicate that a median surface concentration of 1 g/m2 with standard deviation of approximately 0.25 g/m2 was reached in a little less than 10 hours. A median surface concentration of 10 g/m2
with standard deviation of approximately 2.53 g/m2 was reached in slightly more than 55 hours. Based on these results, the C-ring specimens were exposed in the atmospheric chamber for 10 and 55 hours to obtain the surface salt concentrations of 1 and 10 g/m2, respectively. Some C-rings deposited with 1 g/m2 salts are shown in Figure 2-15. 2.4.2 Non-Chloride-Rich Salt Deposition on U-Bends For SCC tests with non-chloride-rich salts listed in Table 2-2, the U-bend specimens were deposited in a less controlled manner than the sea salt deposition. Specimens were preheated to 90 °C [194 °F] in an oven for at least 15 minutes, after which they were sprayed from a spray bottle containing the respective solutions. For mixtures, the salts were premixed according to the desired ratio before making the solution. The specimens were given 10 squirts of the solution, after which the solution was allowed to evaporate for 5 minutes. This was repeated 8 to 10 times per specimen. Figure 2-16(a) shows a U-bend specimen deposited with NH4NO3 where, as expected, the surface does not appear to be as uniformly covered compared to the sea salt specimens. The salt surface concentration deposited on the U-bend specimen by the spray bottle technique was estimated by weighing triplicate 2.5-cm × 7.5-cm [1-in × 3-in] flat specimens, as shown in Figure 2-16(b), before and after salt was deposited. The amount of salt deposited on the flat specimens ranged from 66 to 223 g/m2, which gives an approximation of the deposition on the U-bend specimens.
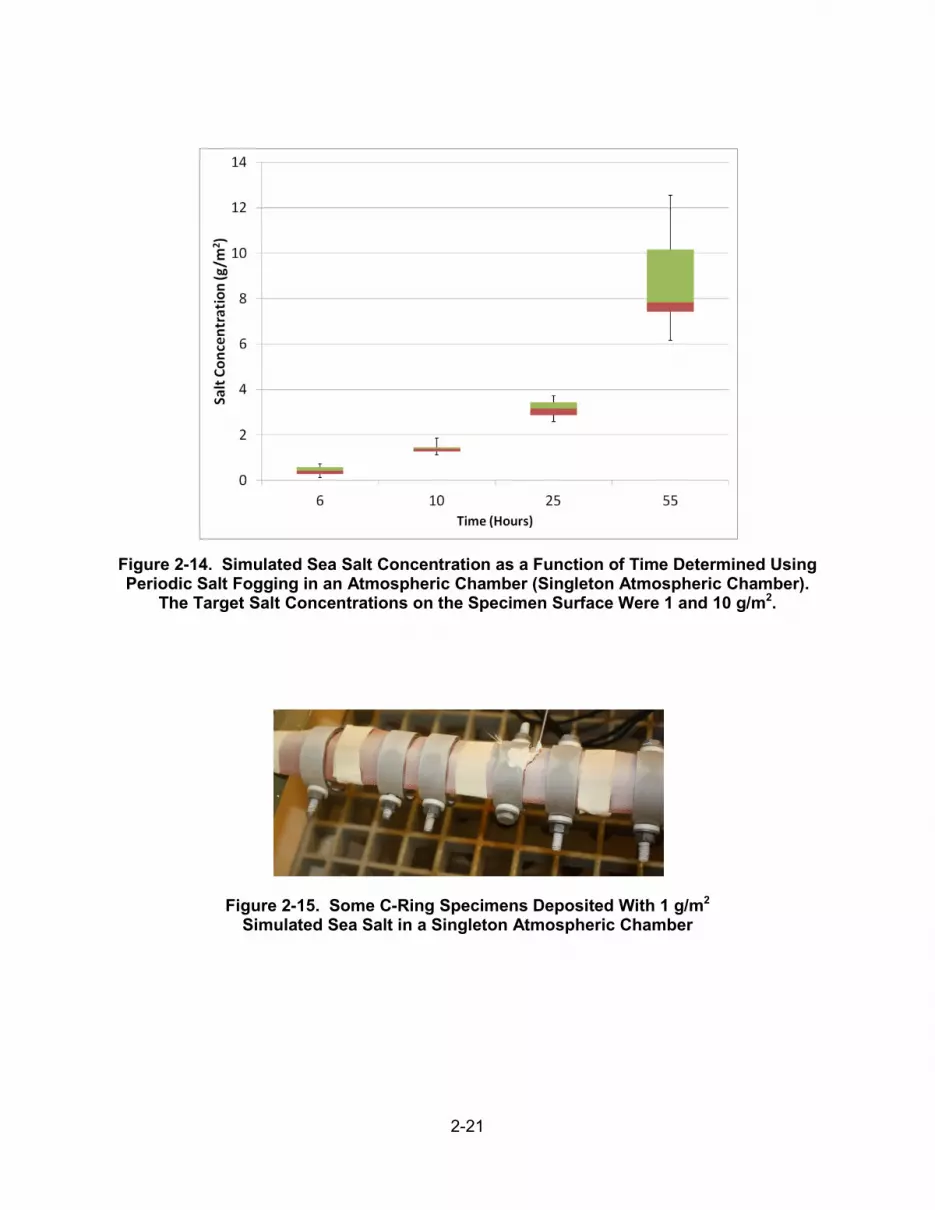
2-21
Figure 2-14. Simulated Sea Salt Concentration as a Function of Time Determined Using Periodic Salt Fogging in an Atmospheric Chamber (Singleton Atmospheric Chamber).
The Target Salt Concentrations on the Specimen Surface Were 1 and 10 g/m2.
Figure 2-15. Some C-Ring Specimens Deposited With 1 g/m2 Simulated Sea Salt in a Singleton Atmospheric Chamber

2-22
During salt deposition, it was observed that the U-bend specimens coated with NH4HSO4 salt had corroded because of the low pH of this solution. The surfaces of those specimens were green, as shown in Figure 2-16(c), because of the formation of ferrous sulfate. Specimens deposited with NH4NO3 and NH4HSO4 were washed and the surface examined. The specimen deposited with NH4NO3 was etched, and there were some stains on the surface [as shown in the magnified surface after salt cleaning in Figure 2-16(d)]. The magnified surface after depositing NH4HSO4 is shown in Figure 2-16(e). However, no cracks were observed on any specimen surface from the control test up to 500 times magnification.
(a) (b) (c)
(d)
(e)
Figure 2-16. Specimens Deposited With Non-Chloride-Rich Salts: (a) U-Bend, (b) Flat Specimen, (c) U-Bend Deposited With NH4HSO4 and Optical Micrographs of Surface of Specimens Deposited With (d) NH4NO3 and (e) NH4HSO4 After Cleaning.
The Red Circles Highlight the Pit and Etching. 2.5 Stress Corrosion Cracking Tests SCC tests were conducted in which U-bend or C-ring specimens deposited with salt were exposed in environmental chambers to different humidity levels and temperatures ranging from 27 to 80 °C [81 to 176 °F]. Both cyclic and static humidity conditions were used. Tests with cyclic humidity were performed in the Auto Technology Model Number CCT–NC–40 chamber. Static humidity tests were performed in ESPEC or Thunder Scientific environmental chambers. Test protocols are detailed next.
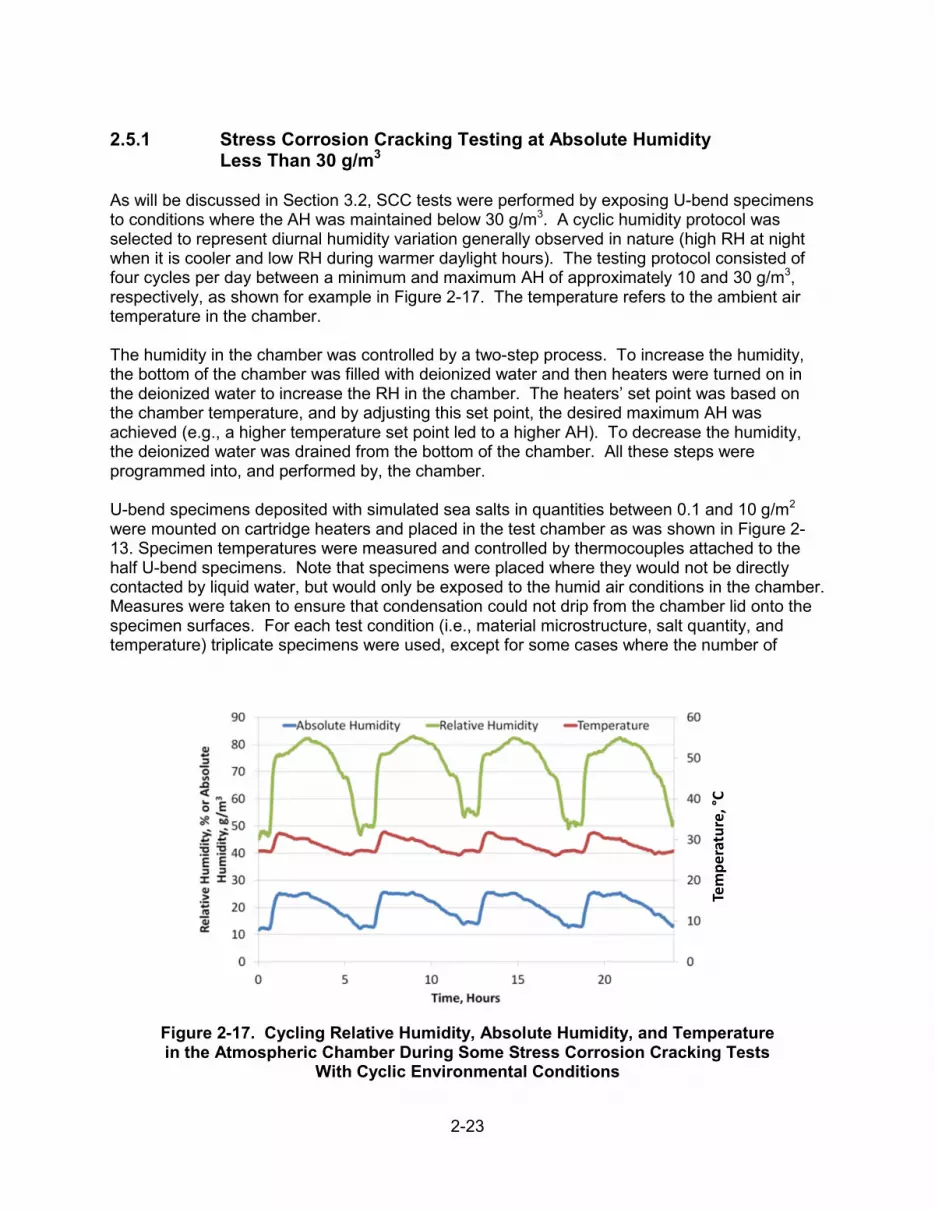
2-23
2.5.1 Stress Corrosion Cracking Testing at Absolute Humidity Less Than 30 g/m3 As will be discussed in Section 3.2, SCC tests were performed by exposing U-bend specimens to conditions where the AH was maintained below 30 g/m3. A cyclic humidity protocol was selected to represent diurnal humidity variation generally observed in nature (high RH at night when it is cooler and low RH during warmer daylight hours). The testing protocol consisted of four cycles per day between a minimum and maximum AH of approximately 10 and 30 g/m3, respectively, as shown for example in Figure 2-17. The temperature refers to the ambient air temperature in the chamber. The humidity in the chamber was controlled by a two-step process. To increase the humidity, the bottom of the chamber was filled with deionized water and then heaters were turned on in the deionized water to increase the RH in the chamber. The heaters’ set point was based on the chamber temperature, and by adjusting this set point, the desired maximum AH was achieved (e.g., a higher temperature set point led to a higher AH). To decrease the humidity, the deionized water was drained from the bottom of the chamber. All these steps were programmed into, and performed by, the chamber. U-bend specimens deposited with simulated sea salts in quantities between 0.1 and 10 g/m2 were mounted on cartridge heaters and placed in the test chamber as was shown in Figure 2-13. Specimen temperatures were measured and controlled by thermocouples attached to the half U-bend specimens. Note that specimens were placed where they would not be directly contacted by liquid water, but would only be exposed to the humid air conditions in the chamber. Measures were taken to ensure that condensation could not drip from the chamber lid onto the specimen surfaces. For each test condition (i.e., material microstructure, salt quantity, and temperature) triplicate specimens were used, except for some cases where the number of
Figure 2-17. Cycling Relative Humidity, Absolute Humidity, and Temperature in the Atmospheric Chamber During Some Stress Corrosion Cracking Tests
With Cyclic Environmental Conditions
Tem
pera
ture
, °C
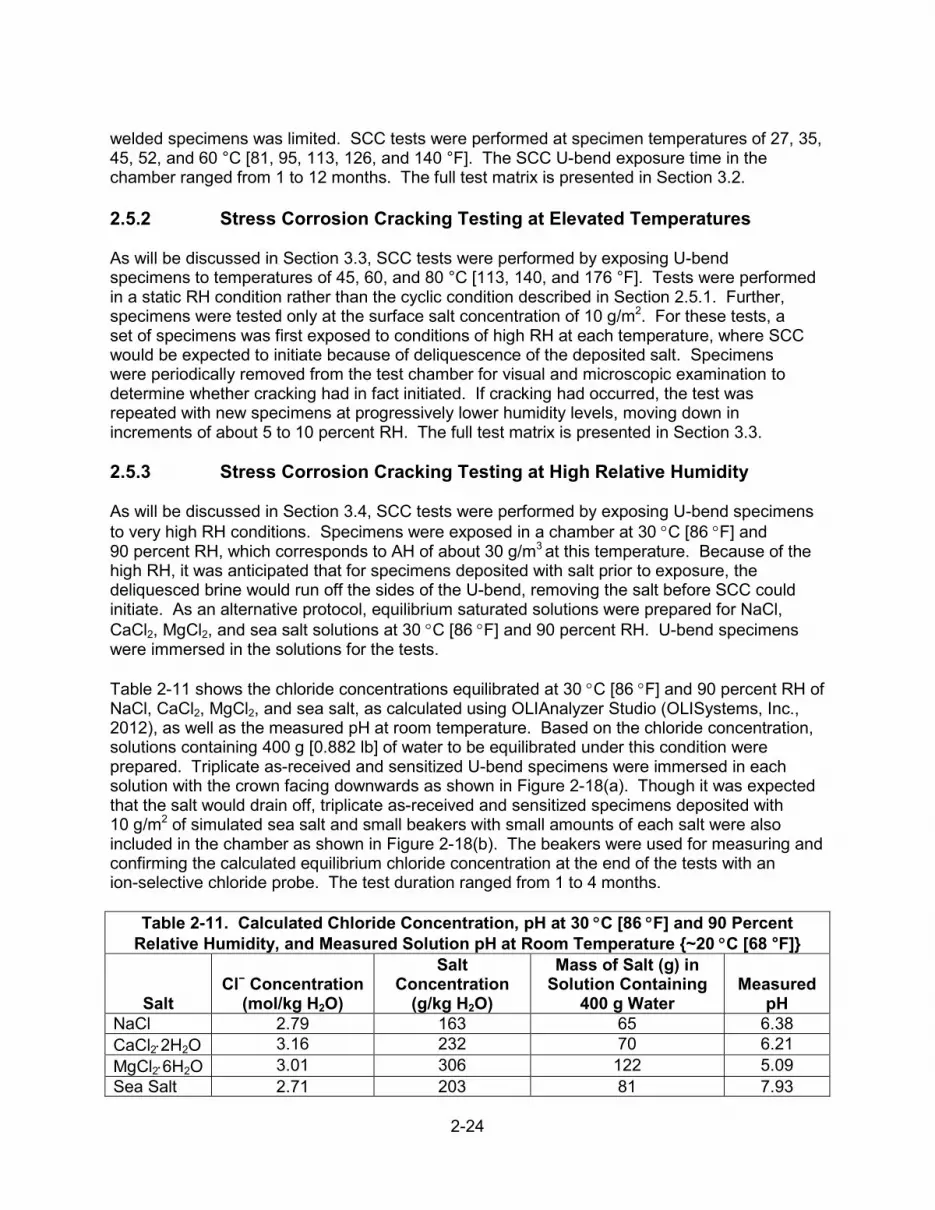
2-24
welded specimens was limited. SCC tests were performed at specimen temperatures of 27, 35, 45, 52, and 60 °C [81, 95, 113, 126, and 140 °F]. The SCC U-bend exposure time in the chamber ranged from 1 to 12 months. The full test matrix is presented in Section 3.2. 2.5.2 Stress Corrosion Cracking Testing at Elevated Temperatures As will be discussed in Section 3.3, SCC tests were performed by exposing U-bend specimens to temperatures of 45, 60, and 80 °C [113, 140, and 176 °F]. Tests were performed in a static RH condition rather than the cyclic condition described in Section 2.5.1. Further, specimens were tested only at the surface salt concentration of 10 g/m2. For these tests, a set of specimens was first exposed to conditions of high RH at each temperature, where SCC would be expected to initiate because of deliquescence of the deposited salt. Specimens were periodically removed from the test chamber for visual and microscopic examination to determine whether cracking had in fact initiated. If cracking had occurred, the test was repeated with new specimens at progressively lower humidity levels, moving down in increments of about 5 to 10 percent RH. The full test matrix is presented in Section 3.3. 2.5.3 Stress Corrosion Cracking Testing at High Relative Humidity As will be discussed in Section 3.4, SCC tests were performed by exposing U-bend specimens to very high RH conditions. Specimens were exposed in a chamber at 30 °C [86 °F] and 90 percent RH, which corresponds to AH of about 30 g/m3 at this temperature. Because of the high RH, it was anticipated that for specimens deposited with salt prior to exposure, the deliquesced brine would run off the sides of the U-bend, removing the salt before SCC could initiate. As an alternative protocol, equilibrium saturated solutions were prepared for NaCl, CaCl2, MgCl2, and sea salt solutions at 30 °C [86 °F] and 90 percent RH. U-bend specimens were immersed in the solutions for the tests. Table 2-11 shows the chloride concentrations equilibrated at 30 °C [86 °F] and 90 percent RH of NaCl, CaCl2, MgCl2, and sea salt, as calculated using OLIAnalyzer Studio (OLISystems, Inc., 2012), as well as the measured pH at room temperature. Based on the chloride concentration, solutions containing 400 g [0.882 lb] of water to be equilibrated under this condition were prepared. Triplicate as-received and sensitized U-bend specimens were immersed in each solution with the crown facing downwards as shown in Figure 2-18(a). Though it was expected that the salt would drain off, triplicate as-received and sensitized specimens deposited with 10 g/m2 of simulated sea salt and small beakers with small amounts of each salt were also included in the chamber as shown in Figure 2-18(b). The beakers were used for measuring and confirming the calculated equilibrium chloride concentration at the end of the tests with an ion-selective chloride probe. The test duration ranged from 1 to 4 months.
Table 2-11. Calculated Chloride Concentration, pH at 30 °C [86 °F] and 90 Percent Relative Humidity, and Measured Solution pH at Room Temperature {~20 °C [68 °F]}
Salt Cl− Concentration
(mol/kg H2O)
Salt Concentration
(g/kg H2O)
Mass of Salt (g) in Solution Containing
400 g Water Measured
pH NaCl 2.79 163 65 6.38 CaCl2⋅2H2O 3.16 232 70 6.21 MgCl2⋅6H2O 3.01 306 122 5.09 Sea Salt 2.71 203 81 7.93

2-25
(a)
(b)
Figure 2-18. Stress Corrosion Cracking Tests Exposed to 30 °C [86 °F] and 90 Percent
Relative Humidity in Equilibrium With CaCl2, MgCl2, NaCl, and Sea Salt. (a) U-Bend Specimens Hung Up in Solution With Crown Immersed and
(b) Deposited Specimens and Salt Beakers. 2.5.4 C-Ring Stress Corrosion Cracking Testing As will be discussed in Section 3.5, SCC testing was performed with C-ring specimens to evaluate SCC initiation at different strain levels than those generated by U-bend specimens. Specimens in the as-received and sensitized condition were strained to the level corresponding to the yield stress (i.e., 0.4 percent) or 1.5 percent plastic strain, then deposited with either 1 or 10 g/m2 of salt. Triplicate specimens were exposed to static conditions at 35 °C [95 °F] and 72 percent RH, 45 °C [113 °F] and 44 percent RH, and 52 °C [126 °F] and 32 percent RH, where the RH at each temperature corresponds to AH of about 30 g/m3. The test duration ranged from 1 to 3 months. The full test matrix will be presented in Section 3.5. 2.5.5 Stress Corrosion Cracking Testing for Non-Chloride-Rich Species As will be discussed in Chapter 4, SCC testing was performed in which U-bend specimens were exposed to the non-chloride species listed in Section 2.1.2, as well as the mixtures of the non-chloride and chloride salts. For those tests with only non-chloride species, specimens were exposed at 45 °C [113 °F] and 44 percent RH for 6 weeks, then an additional month at 35 °C [95 °F] and 72 percent RH. The RH at both temperatures corresponds to AH of about 30 g/m3. At the lower temperature, the specimen apexes were buried in the solid salts, as shown in Figure 2-19. For the mixtures of NH4NO3 and NaCl with NO3
−/Cl−, specimens were exposed at 45 °C [113 °F] and 44 percent RH for 1 to 4 months. 2.5.6 Stress Corrosion Cracking Test Specimen Examination Following the period of exposure, determinations were made as to whether SCC had or had not initiated on test specimens. The primary methodology for making this determination was visual and microscopic examination to identify cracking features. There was necessarily some expert
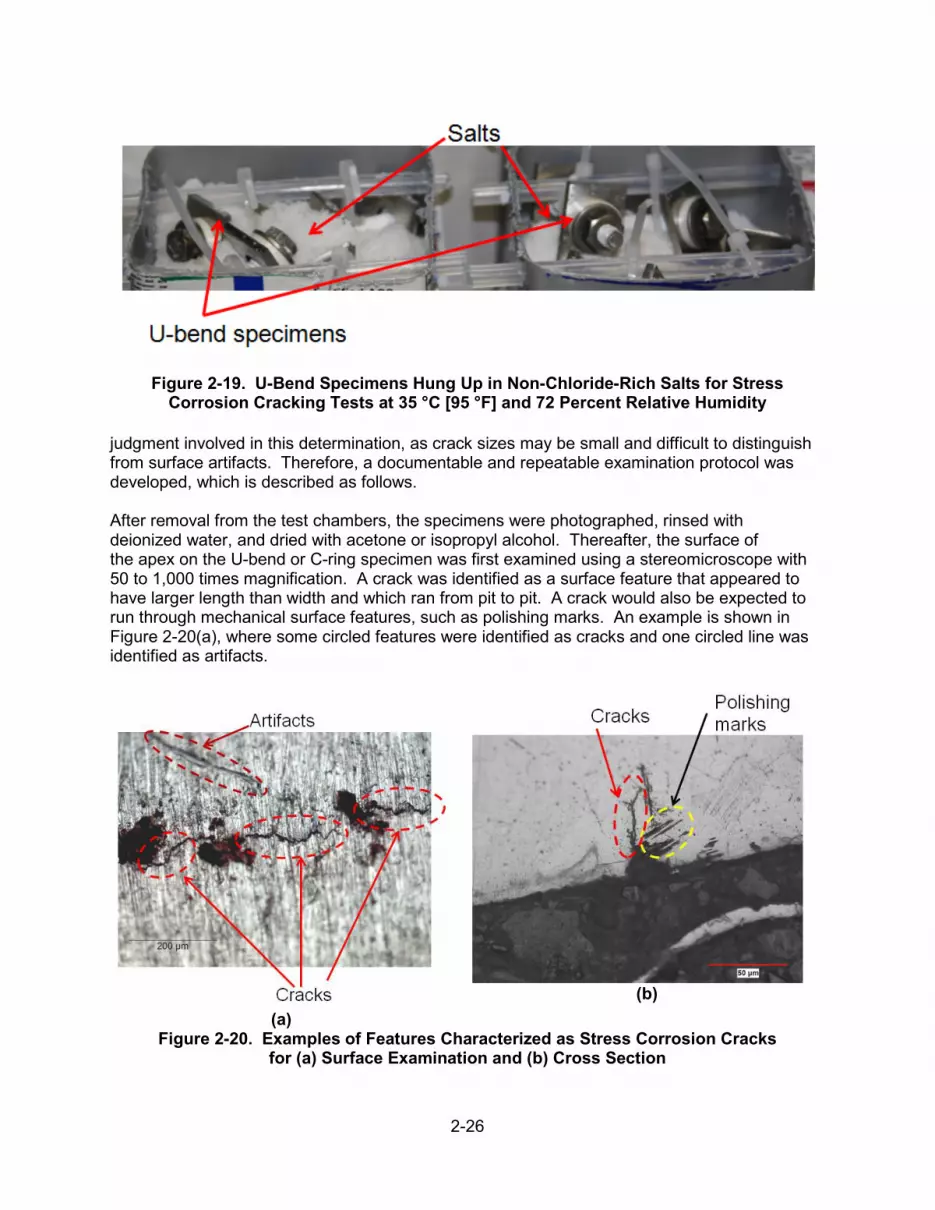
2-26
Figure 2-19. U-Bend Specimens Hung Up in Non-Chloride-Rich Salts for Stress Corrosion Cracking Tests at 35 °C [95 °F] and 72 Percent Relative Humidity
judgment involved in this determination, as crack sizes may be small and difficult to distinguish from surface artifacts. Therefore, a documentable and repeatable examination protocol was developed, which is described as follows. After removal from the test chambers, the specimens were photographed, rinsed with deionized water, and dried with acetone or isopropyl alcohol. Thereafter, the surface of the apex on the U-bend or C-ring specimen was first examined using a stereomicroscope with 50 to 1,000 times magnification. A crack was identified as a surface feature that appeared to have larger length than width and which ran from pit to pit. A crack would also be expected to run through mechanical surface features, such as polishing marks. An example is shown in Figure 2-20(a), where some circled features were identified as cracks and one circled line was identified as artifacts.
(a)
(b)
Figure 2-20. Examples of Features Characterized as Stress Corrosion Cracks for (a) Surface Examination and (b) Cross Section
2-27
If cracks were not visible on the apex surface but extensive pitting was evident, the region around the apex was cross sectioned into three to four pieces perpendicular to the rolling direction of the material, as shown in Figure 2-3. Cross sectioning is challenging because small features may be missed if they are not centered on a cut. Nevertheless, best efforts were made to intersect pits or suspected cracks. The cross section was mounted in resin and polished to 1 µm [0.04 mils] for examination of cracking under the stereomicroscope with at least 50 to 1,000 times magnification. For cross sectioned specimens, cracks were identified as large linear features with some branching. Straight features were not considered to be cracks, but more likely polishing marks. If the feature’s orientation was not aligned with polishing direction, that was considered as further evidence that it was a crack. An example of a cross section crack is shown in Figure 2-20(b), where some circled features were identified as cracks and some lines in one circled area were identified as polishing marks.

3-1
3 RESULTS AND DISCUSSION OF STRESS CORROSION CRACKING TESTS IN CHLORIDE SALTS
This chapter provides the results from a series of tests using chloride salts, primarily simulated sea salt. The tests include (i) deliquescence and efflorescence of simulated sea salt and its most abundant constituents, (ii) U-bend crack initiation tests exposed to cycling relative humidity (RH), (iii) U-bend crack initiation tests at elevated temperature, (iv) U-bend crack initiation tests at high RH, and (v) C-ring crack initiation tests at different stress levels. The implications of the findings for understanding how conditions of temperature, humidity, salt quantity, material condition, and stress level affect the stress corrosion cracking (SCC) susceptibility of austenitic stainless steel will be discussed.
3.1 Deliquescence and Efflorescence Testing It was intended for the SCC tests to be performed by exposing the stainless steel specimens to the temperature and humidity conditions where deliquescent brines could form. Previous testing documented in the literature has examined the deliquescence and efflorescence behavior for pure salts, including some of those found in sea salt. For instance, Greenspan (1977) reported that the NaCl deliquescence RH (DRH) was relatively constant with temperature, varying from 75.5 percent at 0 °C [32 °F] to 76.3 percent at 80 °C [176 °F]. For MgCl2, the DRH was found to vary from 33.7 percent at 0 °C [32 °F] to 22.0 percent at 100 °C [212 °F]. These values are close to those calculated using OLIAnalyzer® and shown in Figure 2-11(a). For this program, additional data points were sought to confirm the calculated values, as well as to relate the behavior of the sea salt mixture to that of its constituent species. The experimental details of the deliquescence and efflorescence tests were described in Section 2.3. The tests were conducted at the following RH ranges and temperatures: • 30–84 percent RH at 35 °C [95 °F] • 10–59 percent RH at 45 °C [113 °F] • 10–60 percent RH at 60 °C [140 °F] • 10–50 percent RH at 80 °C [176 °F] The RH was increased or decreased at 3 and 5 percent increments for the deliquescence and efflorescence tests, respectively. The equilibration time at each RH was roughly 12 hours or 24 hours. Longer equilibration time was used for larger RH intervals. At all temperatures, the deliquescence and efflorescence behaviors of pure NaCl, Na2SO4, MgCl2, and CaCl2 salts were studied using the beaker tests, whereas simulated sea salt was studied using both the beaker tests and the conductivity cells. The results are described in this section. 3.1.1 Deliquescence and Efflorescence of Calcium Chloride, Magnesium Chloride, Sodium Chloride, and Sodium Sulfate 3.1.1.1 Tests at 35 °C [95 °F] Figure 3-1 shows some of the photographs from the beaker tests of the species at 35 °C [95 °F]. CaCl2 in the beaker was damp at the starting RH of 30 percent and more so at 33 percent, as shown in Figure 3-1(a), indicating the lowest DRH of the tested species. Progressing up in RH, MgCl2 deliquesced at about 36 percent as shown in Figure 3-1(b). NaCl was damp, though not completely in solution, at the highest RH of 84 percent, as shown in Figure 3-1(c). Therefore,
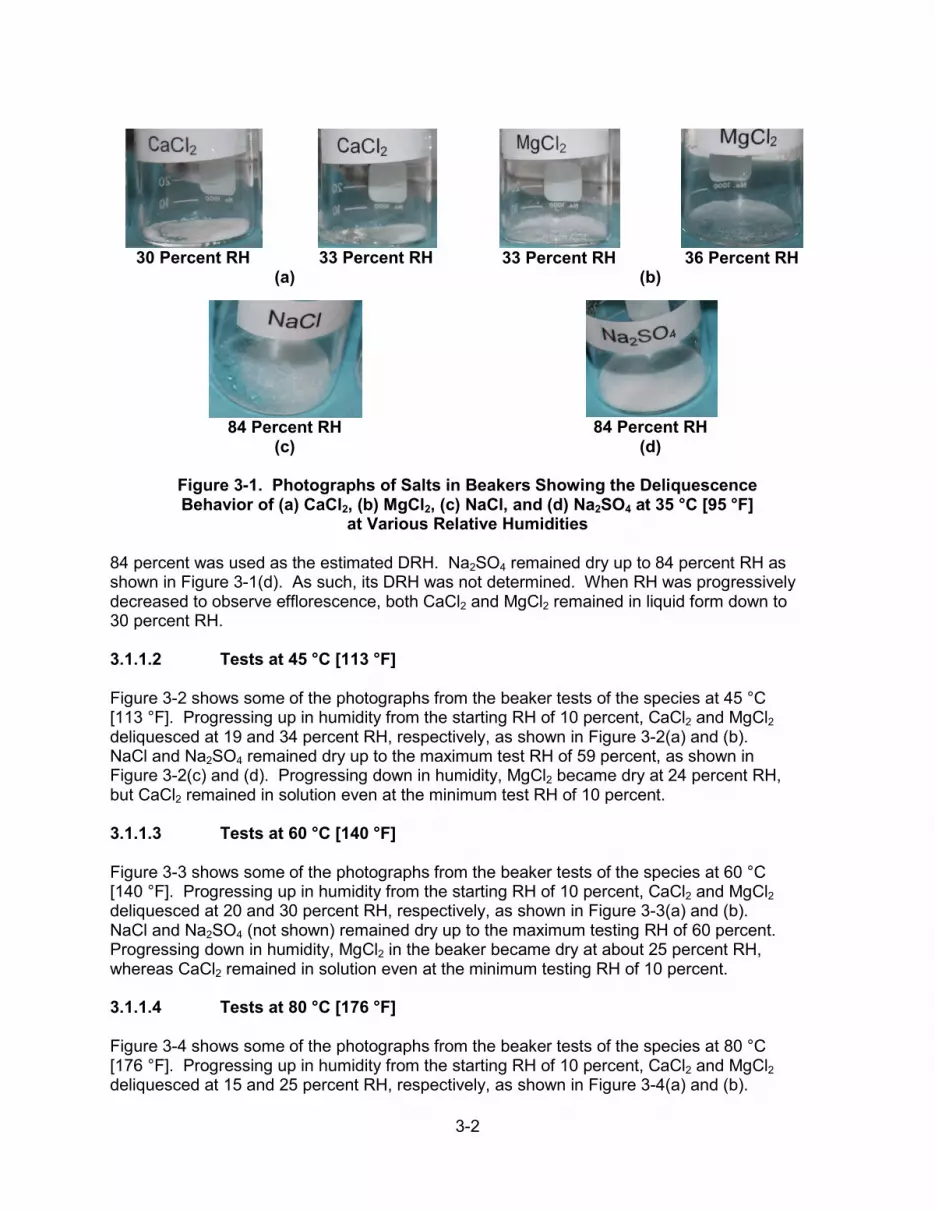
3-2
30 Percent RH
33 Percent RH
33 Percent RH
36 Percent RH
(a) (b)
84 Percent RH
84 Percent RH
(c) (d)
Figure 3-1. Photographs of Salts in Beakers Showing the Deliquescence Behavior of (a) CaCl2, (b) MgCl2, (c) NaCl, and (d) Na2SO4 at 35 °C [95 °F]
at Various Relative Humidities 84 percent was used as the estimated DRH. Na2SO4 remained dry up to 84 percent RH as shown in Figure 3-1(d). As such, its DRH was not determined. When RH was progressively decreased to observe efflorescence, both CaCl2 and MgCl2 remained in liquid form down to 30 percent RH. 3.1.1.2 Tests at 45 °C [113 °F] Figure 3-2 shows some of the photographs from the beaker tests of the species at 45 °C [113 °F]. Progressing up in humidity from the starting RH of 10 percent, CaCl2 and MgCl2 deliquesced at 19 and 34 percent RH, respectively, as shown in Figure 3-2(a) and (b). NaCl and Na2SO4 remained dry up to the maximum test RH of 59 percent, as shown in Figure 3-2(c) and (d). Progressing down in humidity, MgCl2 became dry at 24 percent RH, but CaCl2 remained in solution even at the minimum test RH of 10 percent. 3.1.1.3 Tests at 60 °C [140 °F] Figure 3-3 shows some of the photographs from the beaker tests of the species at 60 °C [140 °F]. Progressing up in humidity from the starting RH of 10 percent, CaCl2 and MgCl2 deliquesced at 20 and 30 percent RH, respectively, as shown in Figure 3-3(a) and (b). NaCl and Na2SO4 (not shown) remained dry up to the maximum testing RH of 60 percent. Progressing down in humidity, MgCl2 in the beaker became dry at about 25 percent RH, whereas CaCl2 remained in solution even at the minimum testing RH of 10 percent. 3.1.1.4 Tests at 80 °C [176 °F] Figure 3-4 shows some of the photographs from the beaker tests of the species at 80 °C [176 °F]. Progressing up in humidity from the starting RH of 10 percent, CaCl2 and MgCl2 deliquesced at 15 and 25 percent RH, respectively, as shown in Figure 3-4(a) and (b).

3-3
16 Percent RH
19 Percent RH
31 Percent RH
34 Percent RH
(a) (b)
59 Percent RH
59 Percent RH (c) (d)
Figure 3-2. Photographs of Salts in Beakers Showing the Deliquescence Behavior of (a) CaCl2, (b) MgCl2, (c) NaCl, and (d) Na2SO4 at 45 °C [113 °F]
at Various Relative Humidities
15 Percent RH
20 Percent RH
25 Percent RH
30 Percent RH
(a) (b) Figure 3-3. Photographs of Salts in Beakers Showing the Deliquescence
Behavior of (a) CaCl2 and (b) MgCl2 at 60 °C [140 °F] at Various Relative Humidities
10 Percent RH
15 Percent RH
20 Percent RH
25 Percent RH
(a) (b)
Figure 3-4. Photographs of Salts in Beakers Showing the Deliquescence Behavior of (a) CaCl2 and (b) MgCl2 at 80 °C [176 °F] at Various Relative Humidities
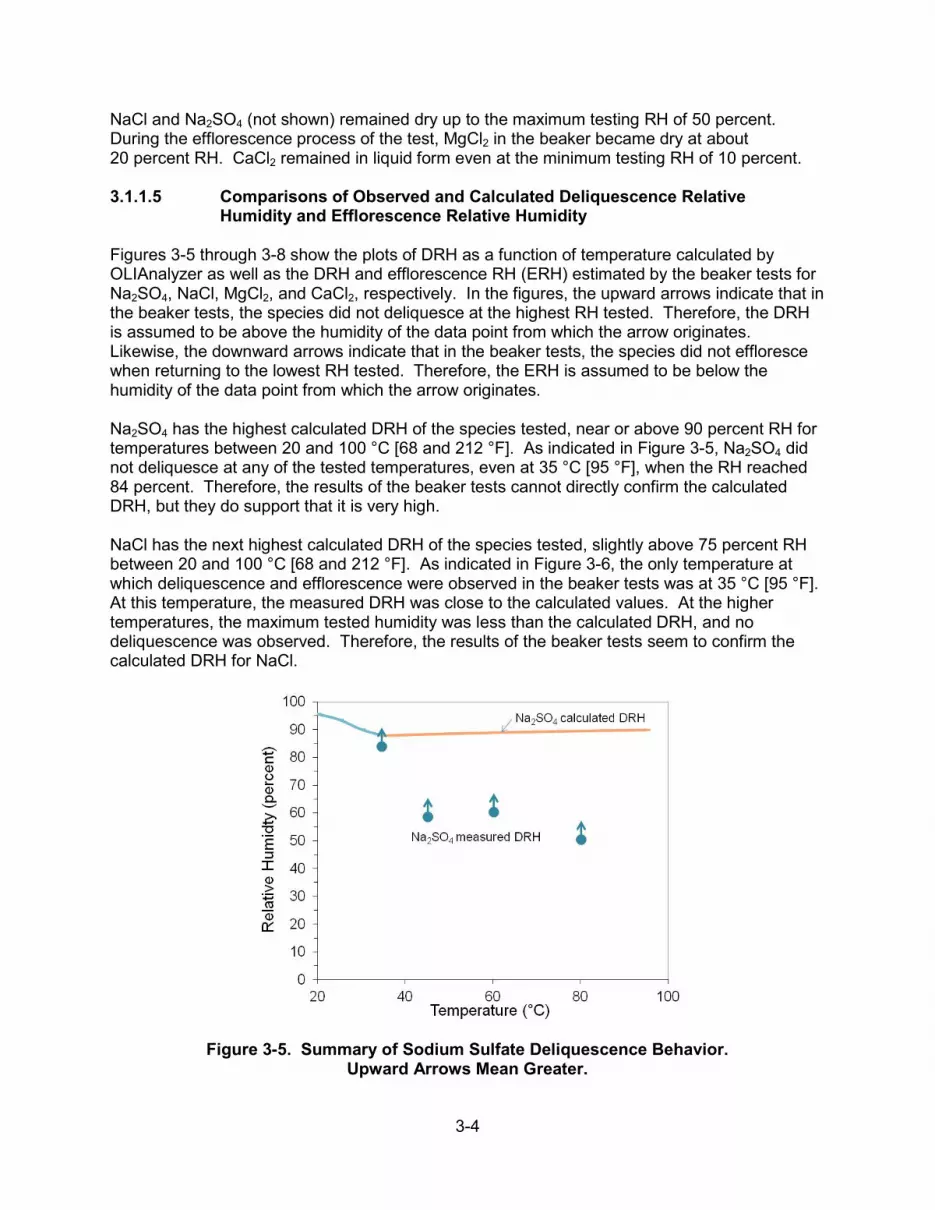
3-4
NaCl and Na2SO4 (not shown) remained dry up to the maximum testing RH of 50 percent. During the efflorescence process of the test, MgCl2 in the beaker became dry at about 20 percent RH. CaCl2 remained in liquid form even at the minimum testing RH of 10 percent. 3.1.1.5 Comparisons of Observed and Calculated Deliquescence Relative Humidity and Efflorescence Relative Humidity Figures 3-5 through 3-8 show the plots of DRH as a function of temperature calculated by OLIAnalyzer as well as the DRH and efflorescence RH (ERH) estimated by the beaker tests for Na2SO4, NaCl, MgCl2, and CaCl2, respectively. In the figures, the upward arrows indicate that in the beaker tests, the species did not deliquesce at the highest RH tested. Therefore, the DRH is assumed to be above the humidity of the data point from which the arrow originates. Likewise, the downward arrows indicate that in the beaker tests, the species did not effloresce when returning to the lowest RH tested. Therefore, the ERH is assumed to be below the humidity of the data point from which the arrow originates. Na2SO4 has the highest calculated DRH of the species tested, near or above 90 percent RH for temperatures between 20 and 100 °C [68 and 212 °F]. As indicated in Figure 3-5, Na2SO4 did not deliquesce at any of the tested temperatures, even at 35 °C [95 °F], when the RH reached 84 percent. Therefore, the results of the beaker tests cannot directly confirm the calculated DRH, but they do support that it is very high. NaCl has the next highest calculated DRH of the species tested, slightly above 75 percent RH between 20 and 100 °C [68 and 212 °F]. As indicated in Figure 3-6, the only temperature at which deliquescence and efflorescence were observed in the beaker tests was at 35 °C [95 °F]. At this temperature, the measured DRH was close to the calculated values. At the higher temperatures, the maximum tested humidity was less than the calculated DRH, and no deliquescence was observed. Therefore, the results of the beaker tests seem to confirm the calculated DRH for NaCl.
Figure 3-5. Summary of Sodium Sulfate Deliquescence Behavior. Upward Arrows Mean Greater.
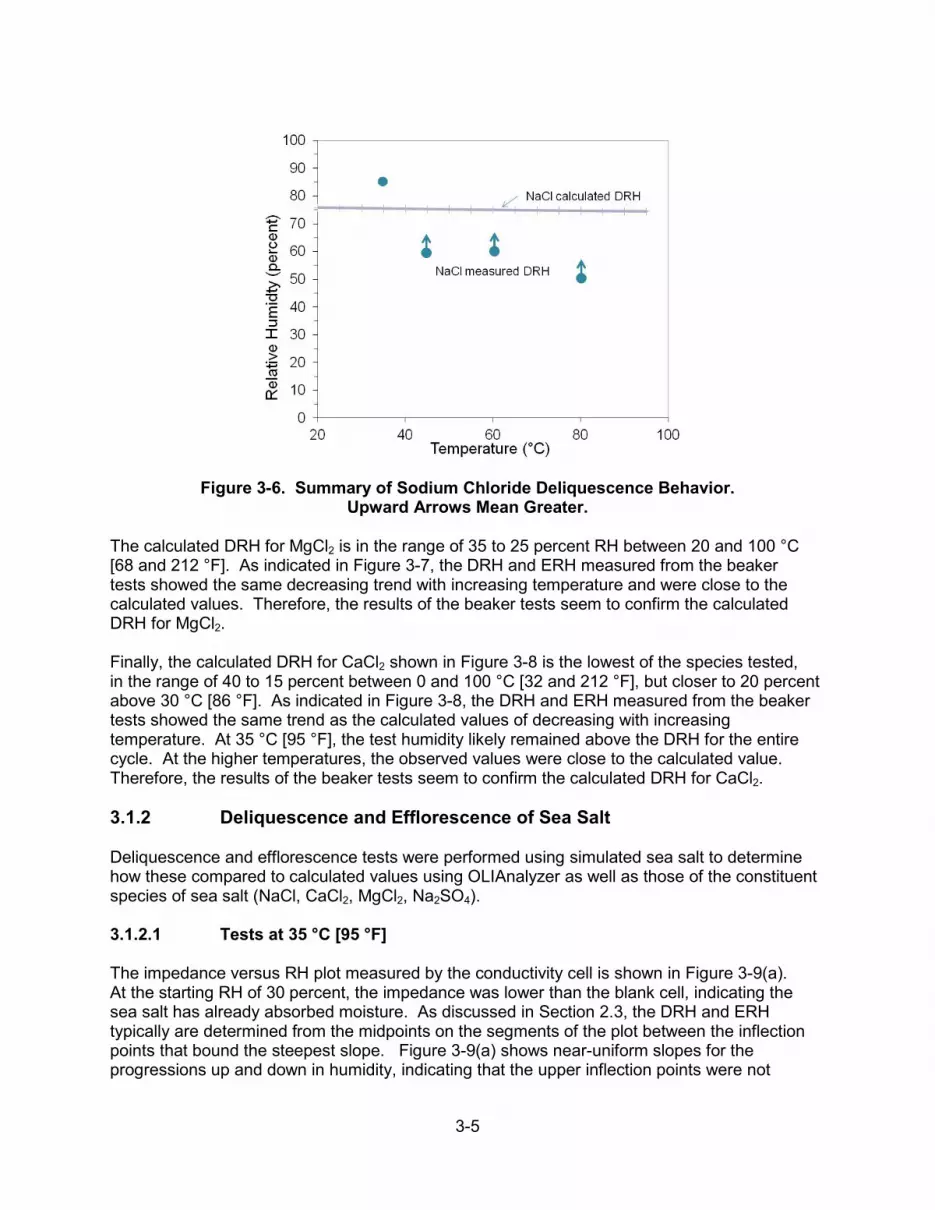
3-5
Figure 3-6. Summary of Sodium Chloride Deliquescence Behavior. Upward Arrows Mean Greater.
The calculated DRH for MgCl2 is in the range of 35 to 25 percent RH between 20 and 100 °C [68 and 212 °F]. As indicated in Figure 3-7, the DRH and ERH measured from the beaker tests showed the same decreasing trend with increasing temperature and were close to the calculated values. Therefore, the results of the beaker tests seem to confirm the calculated DRH for MgCl2. Finally, the calculated DRH for CaCl2 shown in Figure 3-8 is the lowest of the species tested, in the range of 40 to 15 percent between 0 and 100 °C [32 and 212 °F], but closer to 20 percent above 30 °C [86 °F]. As indicated in Figure 3-8, the DRH and ERH measured from the beaker tests showed the same trend as the calculated values of decreasing with increasing temperature. At 35 °C [95 °F], the test humidity likely remained above the DRH for the entire cycle. At the higher temperatures, the observed values were close to the calculated value. Therefore, the results of the beaker tests seem to confirm the calculated DRH for CaCl2. 3.1.2 Deliquescence and Efflorescence of Sea Salt Deliquescence and efflorescence tests were performed using simulated sea salt to determine how these compared to calculated values using OLIAnalyzer as well as those of the constituent species of sea salt (NaCl, CaCl2, MgCl2, Na2SO4). 3.1.2.1 Tests at 35 °C [95 °F] The impedance versus RH plot measured by the conductivity cell is shown in Figure 3-9(a). At the starting RH of 30 percent, the impedance was lower than the blank cell, indicating the sea salt has already absorbed moisture. As discussed in Section 2.3, the DRH and ERH typically are determined from the midpoints on the segments of the plot between the inflection points that bound the steepest slope. Figure 3-9(a) shows near-uniform slopes for the progressions up and down in humidity, indicating that the upper inflection points were not

3-6
Figure 3-7. Summary of Magnesium Chloride Deliquescence and Efflorescence Behavior. Downward Arrow Means Smaller.
Figure 3-8. Summary of Simulated Sea Salt and Calcium Chloride Deliquescence, and Efflorescence Behavior. Downward Arrows Mean Smaller.

3-7
captured in the humidity range tested. Therefore, the DRH and ERH could not be formally defined by this test, but should be less than 30 percent. The data in Figure 3-9(a) also show that there was an initial hysteresis between the deliquescence and efflorescence curves, although the efflorescence curve tracked the deliquescence curve very closely at RHs less than 56 percent. The beaker test results for simulated sea salt at several selected RHs are shown in Figure 3-9(b). Simulated sea salt appeared damp at the initial RH of 30 percent, though it absorbed more moisture with increasing RH. Again, the DRH could not be estimated by this method, but the observation suggests that it is less than 30 percent. At the highest RH
(a)
Before Test
30 Percent RH
84 Percent RH
(b)
Figure 3-9. (a) Impedance Measured Using Conductivity Cell for Simulated Sea Salt (Also Shown Is the Measured Impedance for the Blank Filter Paper With
No Salt Present) and (b) Beaker Test Showing the Deliquescence Behavior at 35 °C [95 °F]

3-8
of this test (84 percent), some solids remained undissolved in the beaker. This was assumed to be due to the presence of sea salt constituents with higher DRH (e.g., Na2SO4). For the progression down in RH, the simulated sea salt was still damp at 30 percent RH, so the ERH could not be estimated by this method, but the observation suggests that it is less than 30 percent. 3.1.2.2 Tests at 45 °C [113 °F] The impedance versus RH plot measured by the conductivity cell is shown in Figure 3-10(a). For the progression up in humidity, the segment with the steepest slope is bounded by inflection points at 22 and 28 percent RH. For the progression down in humidity, the segment with the steepest slope is bounded by inflection points at 28 and 19 percent. These give the DRH and ERH as 25 and 24 percent, respectively. Some photographs from the beaker tests are shown in Figure 3-10(b). For the progression up in humidity, the simulated sea salt in the beaker was observed to be slightly darker in appearance at 25 percent RH compared to the starting condition and visibly damp at 28 percent RH. Therefore, the DRH estimated by this method is about 28 percent. For the progression down in humidity, the simulated sea salt in the beaker became dry at 24 percent RH. The DRH and ERH estimates made from beaker observations are consistent with those made by from the conductivity cell. 3.1.2.3 Tests at 60 °C [140 °F] The impedance versus RH plot measured by the conductivity cell is shown in Figure 3-11(a). For the progression up in humidity, the segment with the steepest slope is bounded by inflection points at 20 and 30 percent RH. For the progression down in humidity, the segment with the steepest slope is bounded by inflection points at 25 and 20 percent. These give the DRH and ERH as 25 percent and 22 percent, respectively. Some photographs from the beaker tests are shown in Figure 3-11(b). For the progression up in RH, the sea salt appeared damp at 25 percent RH and partially liquid at 30 percent RH. Therefore, the DRH estimated by this method is 25 percent. For the progression down in RH, sea salt in the beakers became dry at about 15 percent RH, which is the estimate for the ERH. The DRH and ERH estimates made from beaker observations are consistent with those made from the conductivity cell. 3.1.2.4 Tests at 80 °C [176 °F] The impedance versus RH plot measured by the conductivity cell is shown in Figure 3-12(a). For the progression up in humidity, the segment with the steepest slope is bounded by inflection points at 20 and 25 percent RH. For the progression down in humidity, the segment with the steepest slope is bounded by inflection points at 20 and 15 percent. These give the DRH and ERH as 23 percent and 18 percent, respectively. Some pictures from the beaker tests are shown in Figure 3-12(b). For the progression up in RH, the sea salt appeared damp at 30 percent RH and partially liquid at 35 percent RH. Therefore, the DRH estimated by this method is 30 percent. For the progression down in RH, sea salt in the beakers became dry at about 25 percent RH, which is the estimate for the ERH. The DRH and ERH estimates made from beaker observations are consistent with those made from the conductivity cell.
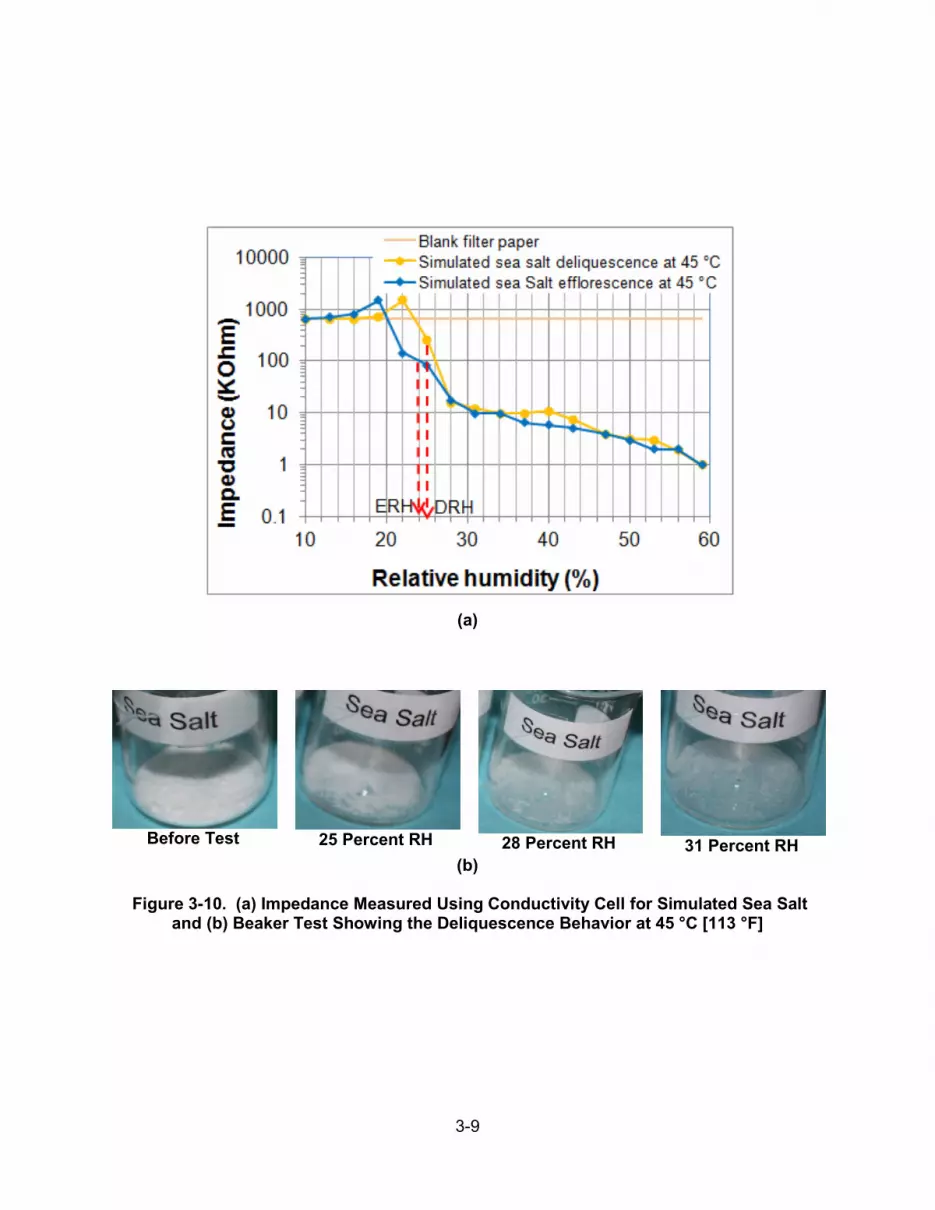
3-9
(a)
Before Test
25 Percent RH
28 Percent RH
31 Percent RH
(b)
Figure 3-10. (a) Impedance Measured Using Conductivity Cell for Simulated Sea Salt and (b) Beaker Test Showing the Deliquescence Behavior at 45 °C [113 °F]

3-10
(a)
Before Test
25 Percent RH
30 Percent RH
35 Percent RH
(b)
Figure 3-11. (a) Impedance Measured Using Conductivity Cell for Simulated Sea Salt and (b) Beaker Test Showing the Deliquescence Behavior at 60 °C [140 °F]

3-11
(a)
Before Test
20 Percent RH
25 Percent RH
30 Percent RH
(b)
Figure 3-12. (a) Impedance Measured Using Conductivity Cell for Simulated Sea Salt and (b) Beaker Test Showing the Deliquescence Behavior at 80 °C [176 °F]
3.1.2.5 Comparison of Sea Salt Deliquescence Relative Humidity and Efflorescence Relative Humidity to Constituent Species The estimated DRHs and ERHs for sea salt, as determined from the conductivity cell and beaker tests, are plotted in Figure 3-13, along with solid lines indicating the DRH as a function of temperature for sea salt and its main constituents, as calculated by OLIAnalyzer. The data points for 35 °C [95 °F] are not plotted, because it is assumed that the humidity was above the DRH for the entire test cycle. For temperatures between 45 and 80 °C [113 and 176 °F], the DRH and ERH generally fall between the calculated values for CaCl2 and MgCl2 and slightly lower than the calculated value for simulated sea salt. Note that these are much lower than the DRH for NaCl though it is the most abundant constituent. These results suggest that if the RH is between that of CaCl2 and MgCl2, a deliquescent brine could form, potentially creating a
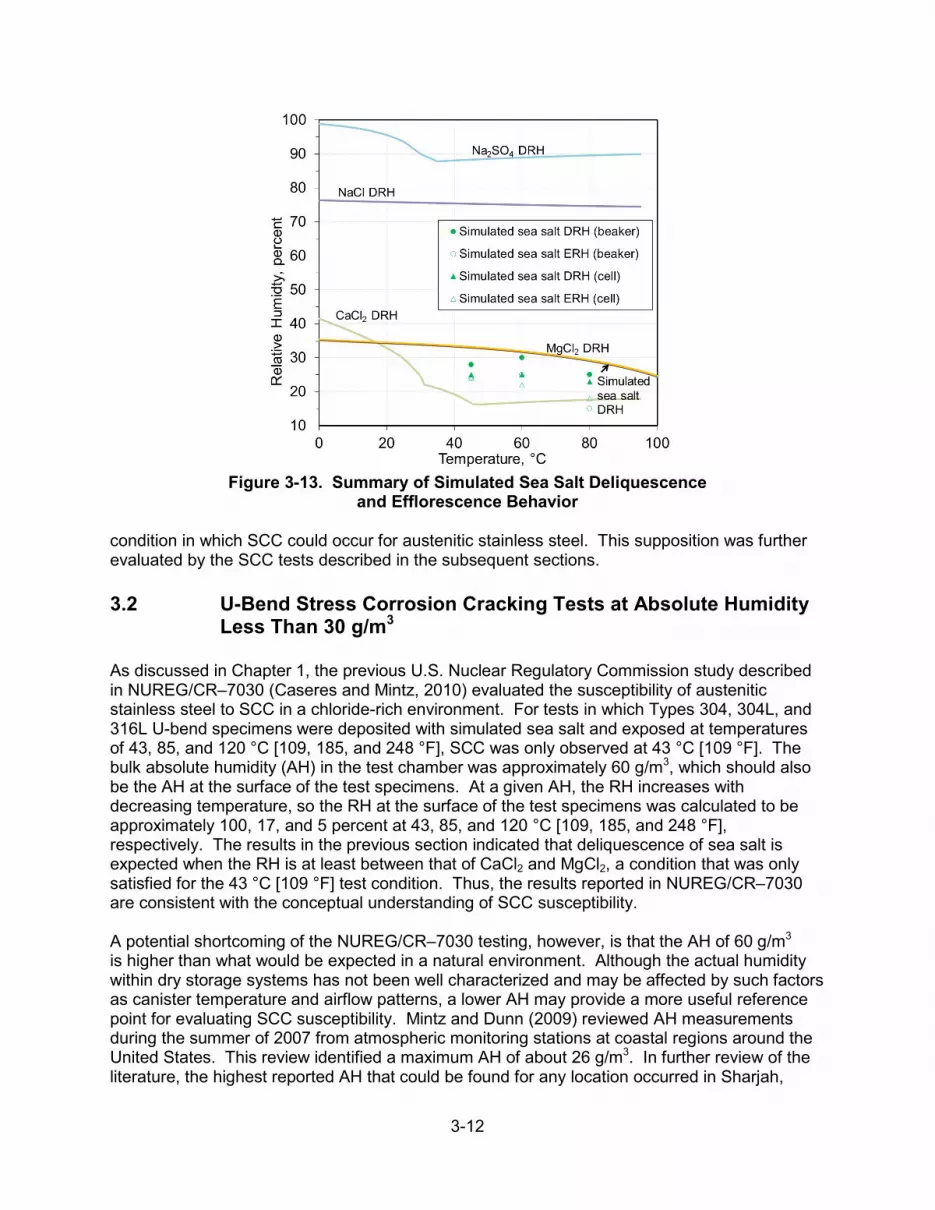
3-12
Figure 3-13. Summary of Simulated Sea Salt Deliquescence
and Efflorescence Behavior condition in which SCC could occur for austenitic stainless steel. This supposition was further evaluated by the SCC tests described in the subsequent sections. 3.2 U-Bend Stress Corrosion Cracking Tests at Absolute Humidity Less Than 30 g/m3 As discussed in Chapter 1, the previous U.S. Nuclear Regulatory Commission study described in NUREG/CR–7030 (Caseres and Mintz, 2010) evaluated the susceptibility of austenitic stainless steel to SCC in a chloride-rich environment. For tests in which Types 304, 304L, and 316L U-bend specimens were deposited with simulated sea salt and exposed at temperatures of 43, 85, and 120 °C [109, 185, and 248 °F], SCC was only observed at 43 °C [109 °F]. The bulk absolute humidity (AH) in the test chamber was approximately 60 g/m3, which should also be the AH at the surface of the test specimens. At a given AH, the RH increases with decreasing temperature, so the RH at the surface of the test specimens was calculated to be approximately 100, 17, and 5 percent at 43, 85, and 120 °C [109, 185, and 248 °F], respectively. The results in the previous section indicated that deliquescence of sea salt is expected when the RH is at least between that of CaCl2 and MgCl2, a condition that was only satisfied for the 43 °C [109 °F] test condition. Thus, the results reported in NUREG/CR–7030 are consistent with the conceptual understanding of SCC susceptibility. A potential shortcoming of the NUREG/CR–7030 testing, however, is that the AH of 60 g/m3 is higher than what would be expected in a natural environment. Although the actual humidity within dry storage systems has not been well characterized and may be affected by such factors as canister temperature and airflow patterns, a lower AH may provide a more useful reference point for evaluating SCC susceptibility. Mintz and Dunn (2009) reviewed AH measurements during the summer of 2007 from atmospheric monitoring stations at coastal regions around the United States. This review identified a maximum AH of about 26 g/m3. In further review of the literature, the highest reported AH that could be found for any location occurred in Sharjah,

3-13
United Arab Emirates, located on the western shore of the Persian Gulf (Salmela and Grantham, 1972). The dew point was recorded as 34 °C [93 °F], which corresponds to AH of 35 g/m3. Based on these findings, AH of 30 g/m3 was selected for the present research program as the reference point for the upper limit expected in natural conditions. A second potential shortcoming of the NUREG/CR–7030 testing relates to the quantity of salt deposited on the specimens. The salt fog technique used for those tests deposited an estimated 20 g/m2 of salt on the specimen surfaces. This is significantly more than the quantity of less than 1 g/m2 of chloride at which SCC was observed in Shirai, et al. (2011). Therefore, the NUREG/CR–7030 testing did not provide the desired insight into whether there is a minimum quantity of salt required for SCC initiation. For the present research program, testing with well-controlled and lesser quantities of salt was used as the approach for investigating this parameter. As described in Section 2.5.1, tests were performed in which Type 304 U-bend specimens with different metallurgical conditions were deposited with 0.1, 1, or 10 g/m2 of simulated sea salt and exposed to cyclic humidity conditions. The temperatures at which specimens were tested were 27,1 35, 45, 52, and 60 °C [81, 95, 113, 126, and 140 °F]. The test matrix is shown in Table 3-1, while the final column summarizes the test results that will be described in the subsequent sections. The AH was varied in four cycles per day between 10 and 30 g/m3. The corresponding RH range at each temperature for this AH range is shown in Table 3-2. If it is assumed that SCC can initiate at RH slightly above the DRH for CaCl2, which is close to 20 percent between 27 and 60 °C [81 and 140 °F], SCC would be expected at each temperature, except possibly 60 °C [140 °F]. The following sections provide the results of the cyclic SCC testing. 3.2.1 Specimens Deposited With 10 g/m2 Salt U-bend specimens deposited with 10 g/m2 salt were exposed in the test chamber at temperatures of 27, 35, 45, 52, and 60 °C [81, 95, 113, 126, and 140 °F]. 3.2.1.1 Tests at 27 °C [81 °F] The temperature of 27 °C [81 °F] is the lowest that was evaluated in this program because this represents the bulk temperature in the test chamber. U-bend specimens in the as-received and sensitized conditions and deposited with 10 g/m2 salt were placed in the chamber and exposed at this temperature, with some specimens removed after 1 month and others after 8 months. Figure 3-14 shows a photograph of some specimens after 1 month. The surfaces appeared shiny, suggesting that the salt had deliquesced and most of the solution drained off because of the high humidity, approaching 100 percent RH at the high end of the cycle. Minor pitting was observed, mainly on the edges of the specimens. Specimens exposed for 8 months were microscopically examined to determine whether cracking had occurred. As seen from the cross section and surface in Figure 3-15, some pits were observed, but no cracking. Because no SCC was observed for specimens with 10 g/m2 of salt, no tests were performed at this temperature with salt quantities of 0.1 or 1 g/m2. Additional tests for SCC susceptibility in high humidity are discussed in Section 3.4.
1The temperature for these specimens was not controlled by heaters. Specimens experienced the ambient chamber temperature. The actual temperatures of the specimens fluctuated with the chamber temperature, but the average temperature was about 27 °C [81 °F].

3-14
Table 3-1. Environmental Cycling Test Matrix at Absolute Humidity
Less Than 30 g/m3
Temperature (°C) [°F]
Salt Surface Concentration
(g/m2) Number* and
Metallurgical Type
Maximum Test Duration (Month)
Number of Specimens
Cracked 27 [81] 10 6 As-Received
6 Sensitized 8 0 As-Received
0 Sensitized* 35 [95] 10 9 As-Received
9 Sensitized 6 Welded
4 6 As-Received 8 Sensitized 2 Welded
1.0 9 As-Received 9 Sensitized
4 5 As-Received 9 Sensitized
0.1 9 As-Received 9 Sensitized 6 Welded
12 2 As-Received 5 Sensitized 1 Welded
45 [113] 10 9 As-Received 9 Sensitized 6 Welded
4 7 As-Received 4 Sensitized 4 Welded
1.0 9 As-Received 9 Sensitized
4 5 As-Received 3 Sensitized
0.1 9 As-Received 9 Sensitized 8 Welded
12 1 As-Received 4 Sensitized 0 Welded
52 [126] 10 6 As-Received 6 Sensitized
2.5 3 As-Received 1 Sensitized
1.0 6 As-Received 6 Sensitized
8 0 As-Received 4 Sensitized
60 [140] 10 6 As-Received 6 Sensitized
6.5 0 As-Received 3 Sensitized
*Some salt ran off the surface after deliquescence occurred.
Table 3-2. Relative Humidity for Specimen Temperatures When Chamber Absolute Humidity Ranged Between 10 and 30 g/m3
Temperature (°C) [°F] Relative Humidity Range (Percent) 27 [81] 58─100 35 [95] 38─76 45 [113] 23─46 52 [126] 16─33 60 [140] 12─23
Figure 3-14. Photograph of Type 304 U-Bend Specimens Deposited With 10 g/m2 Salt Held at Chamber Temperature {27 °C [81 °F]} for 1 Month

3-15
(a)
(b)
Figure 3-15. Optical Micrographs of Sensitized Type 304 U-Bend Specimens Deposited With 10 g/m2 Salt Held at Chamber Temperature {27 °C [81 °F]} for (a) 1 Month From
Cross Section and (b) 8 Months From Surface 3.2.1.2 Tests at 35 °C [95 °F] U-bend specimens in the as-received, sensitized, and welded conditions and deposited with 10 g/m2 salt were exposed in the test chamber at 35 °C [95 °F], with some specimens removed after 1 month and the rest after 4 months. As shown in Figure 3-16(a), after 1 month, salt was still visible on the specimen surfaces, along with significant corrosion products. Corrosion was even more extensive after 4 months, especially on the arc of the U-bends, as shown in Figure 3-16(b). Figure 3-17 shows some optical micrographs of the specimen surfaces for sensitized, as-received, and welded specimens. The images appear to show SCC initiation in all material conditions, with crack lengths of up to several hundred microns. The cracks seem to grow from pit to pit on the surface of the specimens. For the welded specimen, the cracks were observed both in the weld material and in the base material. No cross-sectional micrographs were made because cracking was clearly visible on the surface images. 3.2.1.3 Tests at 45 °C [113 °F] U-bend specimens in the as-received, sensitized, and welded conditions and deposited with 10 g/m2 salt were exposed in the test chamber at 45 °C [113 °F], with some specimens removed after 1 month and the rest after 4 months. As shown in Figure 3-18, salt is still visible on the specimen surfaces after exposure, along with scattered pitting. The corrosion products were not as extensive as those observed at 35 °C [95 °F]. Surface and cross section micrographs
(a)
(b)
Figure 3-16. Photographs of Sensitized Type 304 U-Bend Specimens Deposited With 10 g/m2 Salt Held at 35 °C [95 °F] for (a) 1 Month and (b) 4 Months

3-16
(a)
(b)
(c)
(d)
(e)
Figure 3-17. Optical Micrographs of U-Bend Specimens Deposited With 10 g/m2 Salt Held at 35 °C [95 °F]. Sensitized Type 304 Specimens Exposed for (a) 1 Month and (b) 4 Months. As-Received Specimens Exposed for (c) 1 Month and (d) 4 Months.
Welded Specimen Exposed for (e) 4 Months. Red Circles Highlight the Cracks.

3-17
(a)
(b)
Figure 3-18. Photographs of Type 304 U-Bend Specimens Deposited With
10 g/m2 Salt Held at 45 °C [113 °F] for (a) 1 Month and (b) 4 Months from the as-received, sensitized, and welded specimens are shown in Figure 3-19. The images show SCC initiation in all material conditions, with crack lengths of up to several hundred microns. For the specimens exposed for 4 months, the cracks appear to grow from pit to pit on the surface. For the specimens only exposed for 1 month, the cracks appear at the bottom of the pits. For the welded specimens, the cracks were only observed to occur in the base material. 3.2.1.4 Tests at 52 °C [126 °F] U-bend specimens in the as-received and sensitized conditions and deposited with 10 g/m2 salt were exposed in the test chamber at 52 °C [126 °F], with some specimens removed after 1 month and the rest after 2.5 months. As shown in Figure 3-20, the specimens appear similar to those tested at 45 °C [113 °F]. Salt is still visible on the specimen surfaces after exposure, along with scattered pitting. Surface and cross section optical micrographs from as-received
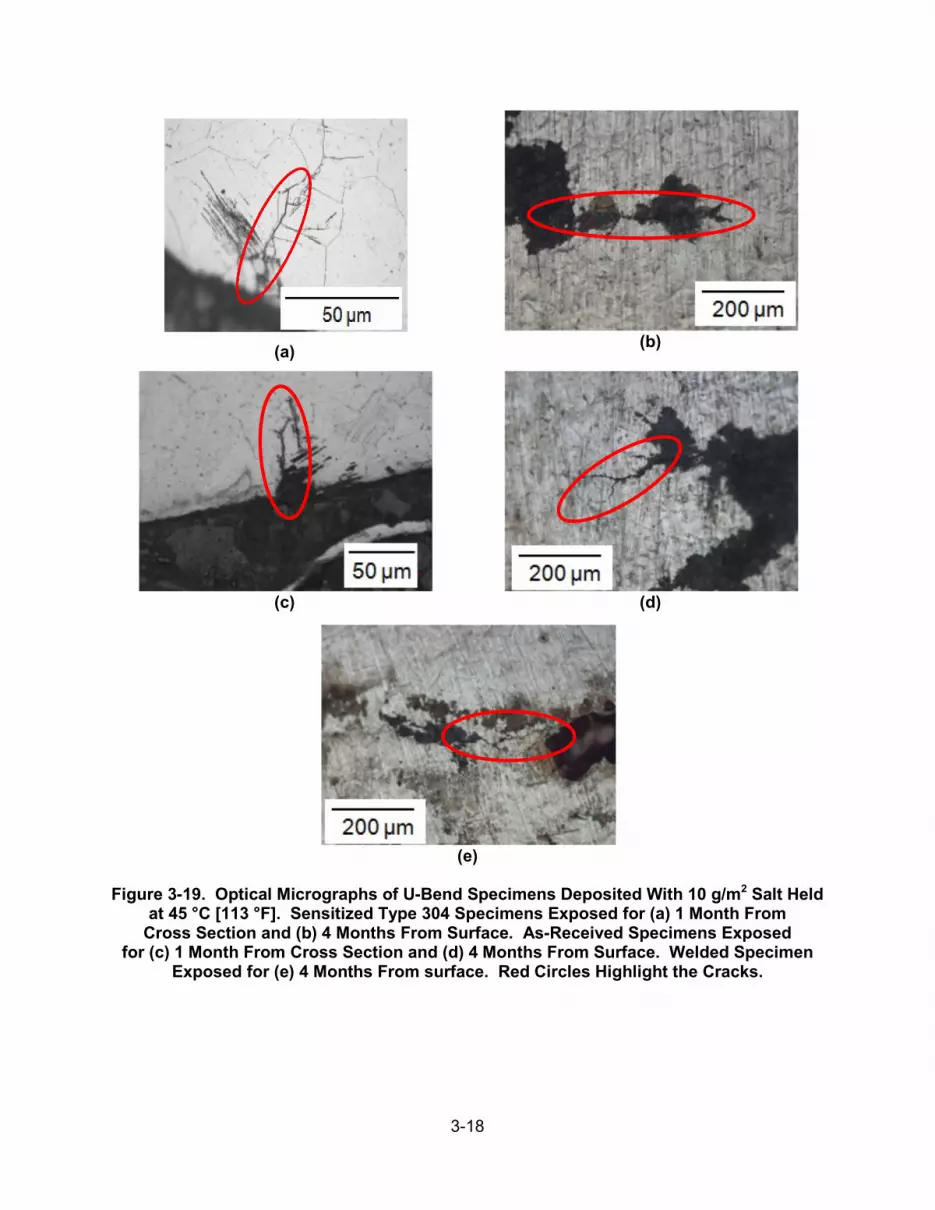
3-18
(a)
(b)
(c)
(d)
(e)
Figure 3-19. Optical Micrographs of U-Bend Specimens Deposited With 10 g/m2 Salt Held at 45 °C [113 °F]. Sensitized Type 304 Specimens Exposed for (a) 1 Month From
Cross Section and (b) 4 Months From Surface. As-Received Specimens Exposed for (c) 1 Month From Cross Section and (d) 4 Months From Surface. Welded Specimen
Exposed for (e) 4 Months From surface. Red Circles Highlight the Cracks.
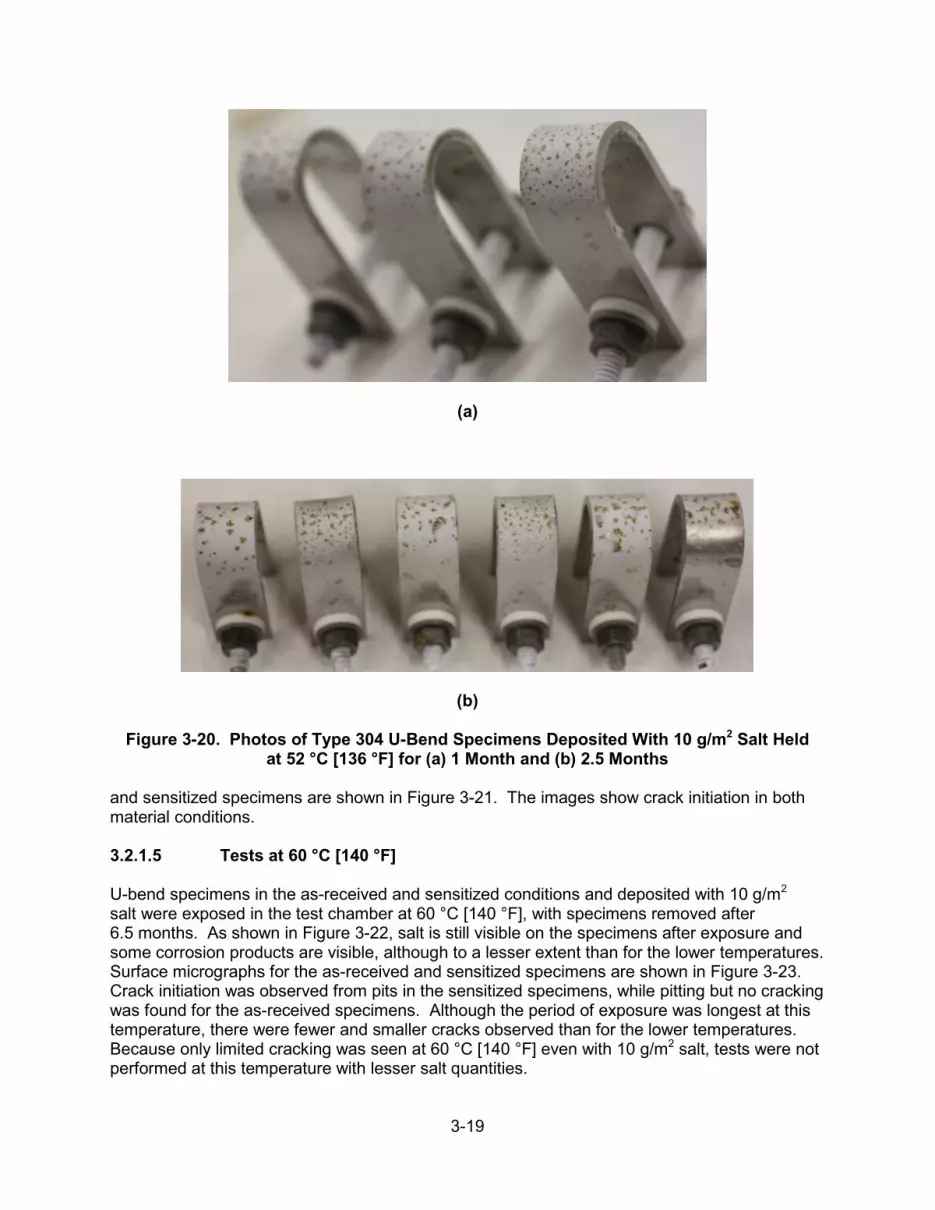
3-19
(a)
(b)
Figure 3-20. Photos of Type 304 U-Bend Specimens Deposited With 10 g/m2 Salt Held at 52 °C [136 °F] for (a) 1 Month and (b) 2.5 Months
and sensitized specimens are shown in Figure 3-21. The images show crack initiation in both material conditions. 3.2.1.5 Tests at 60 °C [140 °F] U-bend specimens in the as-received and sensitized conditions and deposited with 10 g/m2 salt were exposed in the test chamber at 60 °C [140 °F], with specimens removed after 6.5 months. As shown in Figure 3-22, salt is still visible on the specimens after exposure and some corrosion products are visible, although to a lesser extent than for the lower temperatures. Surface micrographs for the as-received and sensitized specimens are shown in Figure 3-23. Crack initiation was observed from pits in the sensitized specimens, while pitting but no cracking was found for the as-received specimens. Although the period of exposure was longest at this temperature, there were fewer and smaller cracks observed than for the lower temperatures. Because only limited cracking was seen at 60 °C [140 °F] even with 10 g/m2 salt, tests were not performed at this temperature with lesser salt quantities.

3-20
(a)
(b)
(c)
(d)
Figure 3-21. Optical Micrographs of U-Bend Specimens Deposited With 10 g/m2 Salt Held at 52 °C [136 °F]. Sensitized Type 304 Specimens Exposed for (a) 1 Month From Surface
and (b) 2.5 Months From Surface. As-Received Specimens Exposed for (c) 1 Month From Cross Section and (d) 2.5 Months From Surface.
Red Circles Highlight the Cracks.
Figure 3-22. Photograph of 10 g/m2 Exposed Type 304 U-Bend Specimens Held at 60 °C [140 °F] for 6.5 Months

3-21
(a)
(b)
Figure 3-23. Optical Micrographs of Type 304 U-Bend Specimens Deposited With 10 g/m2 Salt Held at 60 °C [140 °F] and Exposed for 6.5 Months for (a) Sensitized From
Surface, Red Circle Highlights the Crack. (b) As-Received Type 304 Specimens From Surface, No Cracking Observed.
3.2.1.6 Summary of Results for Tests With 10 g/m2 Salt For Type 304 U-bend specimens deposited with 10 g/m2 salt, SCC initiation was observed at the temperatures of 35, 45, 52, and 60 °C [95, 113, 126, and 140 °F]. Cracks were generally seen in as-received, sensitized, and (for those temperatures tested) welded specimens, except for 60 °C, where SCC was only noted in the sensitized material. SCC initiation was not seen at 27 °C [81 °F], possibly because the salt quickly deliquesced and drained off the specimens. The extent of cracking was greater at 35 and 45 °C [95 and 113 °F], where the RH was higher than that at 52 and 60 °C [126 and 140 °F] as shown in Table 3-2. 3.2.2 Specimens Deposited With 1 g/m2 Salt U-bend specimens deposited with 1 g/m2 salt were exposed in the test chamber at the temperatures of 35, 45, and 52 °C [95, 113, and 126 °F]. Tests were not performed at 27 and 60 °C [81 and 140 °F], because limited or no cracking was observed for these temperatures with 10 g/m2 salt. 3.2.2.1 Tests at 35 °C [95 °F] U-bend specimens in the as-received and sensitized conditions and deposited with 1 g/m2 of salt were exposed in the test chamber at 35 °C [95 °F], with some specimens removed after 1 month and others after 4 months. As shown in Figure 3-24, salt is still visible on the specimens after exposure and abundant corrosion products are present on the arc of the U-bends. Figure 3-25 shows optical micrographs of the specimen surfaces for as-received and sensitized materials. SCC initiation was observed in sensitized specimens after 1 month of exposure but only after 4 months for as-received specimens. The cracks appear to grow from pit to pit on the specimen surfaces. 3.2.2.2 Tests at 45 °C [113 °F] U-bend specimens in the as-received and sensitized conditions and deposited with 1 g/m2 salt were exposed in the test chamber at 45 °C [113 °F], with some specimens removed after

3-22
(a)
(b)
Figure 3-24. Photographs of Type 304 U-Bend Specimens Deposited With 1 g/m2 Salt
Held at 35 °C [95 °F] for (a) 1 Month and (b) 4 Months
1 month and the remainder after 4 months. As shown in Figure 3-26, salt is still visible on the specimen surfaces after exposure and minor pitting is noted, although much less than at 35 °C [95 °F]. Surface and cross section optical micrographs for sensitized and as-received specimens are shown in Figure 3-27. SCC initiation was observed in sensitized specimens after 1 month of exposure but only after 4 months for as-received specimens. The cracks appeared larger in the sensitized specimens. 3.2.2.3 Tests at 52 °C [126 °F] U-bend specimens in the as-received and sensitized conditions and deposited with 1 g/m2 salt were exposed at 52 °C [126 °F] for 8 months. As shown in Figure 3-28, salt is still present on the specimen surfaces after exposure and minor pitting is noted. Figure 3-29 shows optical micrographs of the specimen surfaces for as-received and sensitized materials. SCC initiation was observed for the sensitized specimens, whereas only pitting was observed on the as-received specimens.

3-23
(a)
(b)
(c)
(d)
Figure 3-25. Surface Optical Micrographs of 1 g/m2 U-Bend Specimens Held at 35 °C [95 °F]. Sensitized Type 304 Specimens Exposed for (a) 1 Month and (b) 4 Months.
As-Received Specimens Exposed for (c) 1 Month (No Cracking Observed) and (d) 4 Months. Red Circles Highlight the Cracks.

3-24
(a)
(b)
Figure 3-26. Photographs of 1 g/m2 Type 304 U-Bend Specimens Held at 45 °C [113 °F] for (a) 1 Month and (b) 4 Months

3-25
(a) (b)
(c) (d)
Figure 3-27. Surface Optical Micrographs of 1 g/m2 U-Bend Specimens Held at 45 °C [113 °F]. Sensitized Type 304 Specimens Exposed for (a) 1 Month and (b) 4 Months.
As-Received Specimens Exposed for (c) 1 Month (No Cracking Observed) and (d) 4 Months. Red Circles Highlight the Cracks.
Figure 3-28. Photograph of 1 g/m2 Exposed Type 304 U-Bend Specimens Held at 52 °C [136 °F] for 8 Months
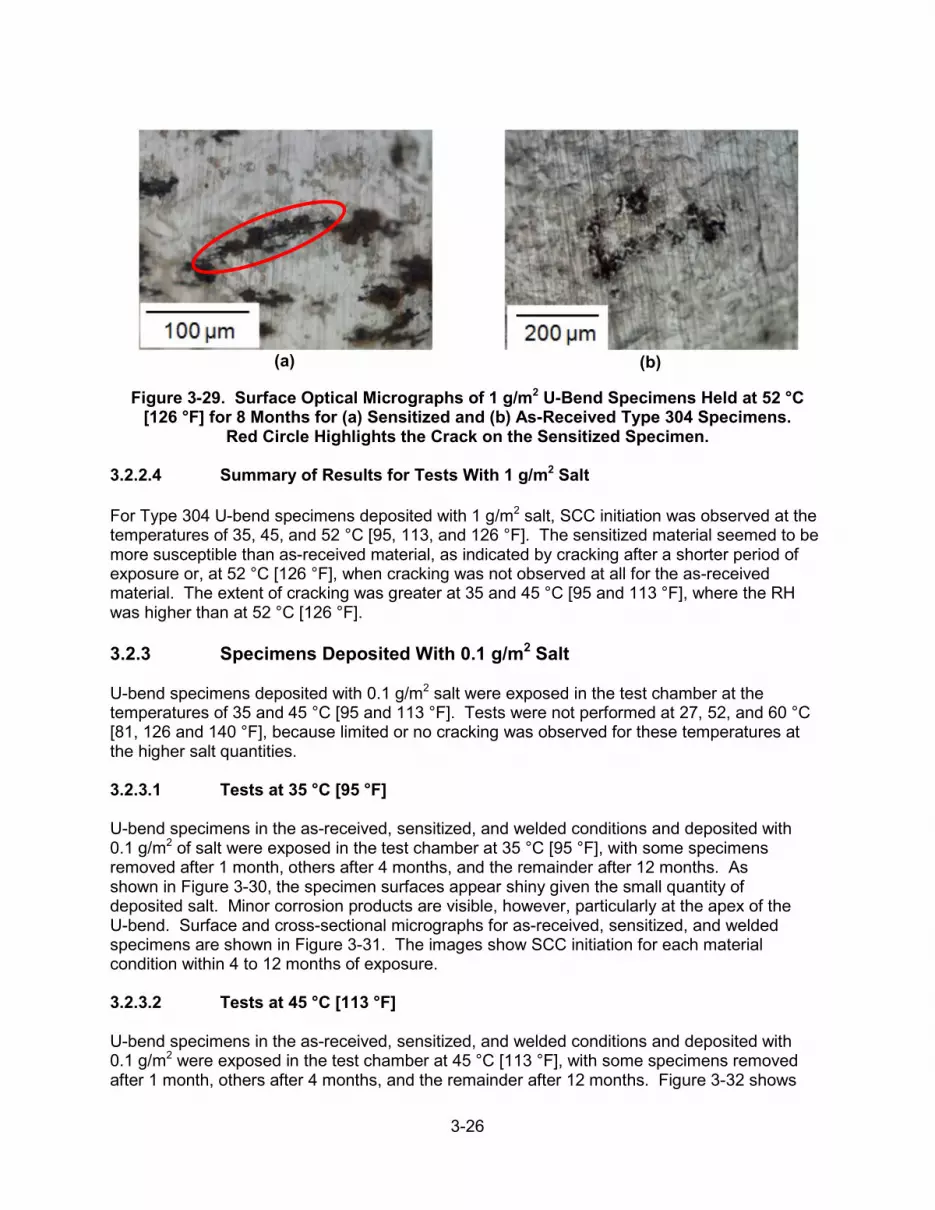
3-26
(a)
(b)
Figure 3-29. Surface Optical Micrographs of 1 g/m2 U-Bend Specimens Held at 52 °C [126 °F] for 8 Months for (a) Sensitized and (b) As-Received Type 304 Specimens.
Red Circle Highlights the Crack on the Sensitized Specimen. 3.2.2.4 Summary of Results for Tests With 1 g/m2 Salt For Type 304 U-bend specimens deposited with 1 g/m2 salt, SCC initiation was observed at the temperatures of 35, 45, and 52 °C [95, 113, and 126 °F]. The sensitized material seemed to be more susceptible than as-received material, as indicated by cracking after a shorter period of exposure or, at 52 °C [126 °F], when cracking was not observed at all for the as-received material. The extent of cracking was greater at 35 and 45 °C [95 and 113 °F], where the RH was higher than at 52 °C [126 °F]. 3.2.3 Specimens Deposited With 0.1 g/m2 Salt U-bend specimens deposited with 0.1 g/m2 salt were exposed in the test chamber at the temperatures of 35 and 45 °C [95 and 113 °F]. Tests were not performed at 27, 52, and 60 °C [81, 126 and 140 °F], because limited or no cracking was observed for these temperatures at the higher salt quantities. 3.2.3.1 Tests at 35 °C [95 °F] U-bend specimens in the as-received, sensitized, and welded conditions and deposited with 0.1 g/m2 of salt were exposed in the test chamber at 35 °C [95 °F], with some specimens removed after 1 month, others after 4 months, and the remainder after 12 months. As shown in Figure 3-30, the specimen surfaces appear shiny given the small quantity of deposited salt. Minor corrosion products are visible, however, particularly at the apex of the U-bend. Surface and cross-sectional micrographs for as-received, sensitized, and welded specimens are shown in Figure 3-31. The images show SCC initiation for each material condition within 4 to 12 months of exposure. 3.2.3.2 Tests at 45 °C [113 °F] U-bend specimens in the as-received, sensitized, and welded conditions and deposited with 0.1 g/m2 were exposed in the test chamber at 45 °C [113 °F], with some specimens removed after 1 month, others after 4 months, and the remainder after 12 months. Figure 3-32 shows

3-27
(a) (b)
(c)
Figure 3-30. Photographs of 0.1 g/m2 Exposed Type 304 U-Bend Specimens Held at 35 °C [95 °F] for (a) 1 Month, (b) 4 Months, and (c) 12 Months

3-28
(a)
(b)
(c)
(d)
(e)
Figure 3-31. Optical Micrographs of 0.1 g/m2 U-Bend Specimens Held at 35 °C [95 °F].
Sensitized Type 304 Specimens Exposed for (a) 4 Months From Surface and (b) 12 Months From Surface. As-Received Specimens Exposed for (c) 4 Months From
Cross Section and (d) 12 Months From Cross Section. Welded Specimens Exposed for (e) 12 Months From Surface. Red Circles Highlight the Cracks.
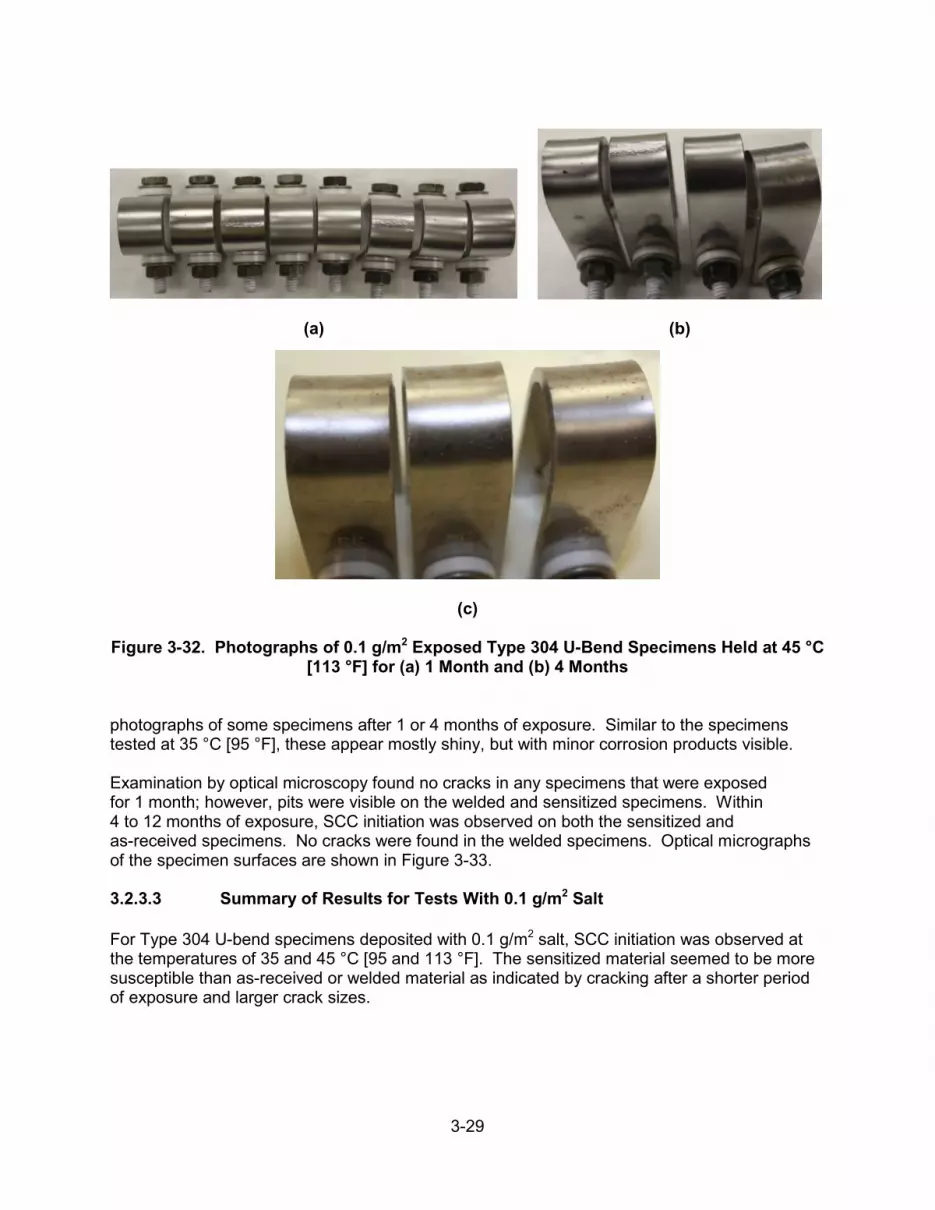
3-29
(a) (b)
(c)
Figure 3-32. Photographs of 0.1 g/m2 Exposed Type 304 U-Bend Specimens Held at 45 °C [113 °F] for (a) 1 Month and (b) 4 Months
photographs of some specimens after 1 or 4 months of exposure. Similar to the specimens tested at 35 °C [95 °F], these appear mostly shiny, but with minor corrosion products visible. Examination by optical microscopy found no cracks in any specimens that were exposed for 1 month; however, pits were visible on the welded and sensitized specimens. Within 4 to 12 months of exposure, SCC initiation was observed on both the sensitized and as-received specimens. No cracks were found in the welded specimens. Optical micrographs of the specimen surfaces are shown in Figure 3-33. 3.2.3.3 Summary of Results for Tests With 0.1 g/m2 Salt For Type 304 U-bend specimens deposited with 0.1 g/m2 salt, SCC initiation was observed at the temperatures of 35 and 45 °C [95 and 113 °F]. The sensitized material seemed to be more susceptible than as-received or welded material as indicated by cracking after a shorter period of exposure and larger crack sizes.

3-30
(a)
(b)
(c)
Figure 3-33. Surface Optical Micrographs of 0.1 g/m2 U-Bend Specimens Held at 45 °C [113 °F] Sensitized Type 304 Specimens Exposed for (a) 4 Months and (b) 12 Months. As-Received Specimen Exposed for (c) 4 Months. Red Circles Highlight the Cracks.
3.3 U-Bend Stress Corrosion Cracking Tests at Elevated Temperatures As discussed in Chapter 1, the SCC tests reported in NUREG/CR–7030 (Caseres and Mintz, 2010) were performed at temperatures of 43, 85, and 125 °C [109, 185, and 257 °F]. SCC was only observed at the lowest temperature, where the relative humidity would be sufficiently high to cause deliquescence of the salt. Japanese studies, however, have reported SCC of stainless steel by salt deliquescence at temperatures between 43 and 85 °C [109 and 185 °F], indicating the potential importance of this temperature range. Shirai, et al. (2011) and Tani, et al. (2009) found SCC of Type 304 at 80 °C [176 °F] and 35 percent RH. Furthermore, Mayuzumi, et al. (2008) observed SCC of Type 304 at 15 percent RH at 80 °C [176 °F]. Because of differing test methodologies and lack of data points, the Japanese results are difficult to directly correlate with the findings in NUREG/CR–7030 to provide a consistent understanding of SCC susceptibility at higher temperatures. Therefore, a more systematic approach was used for this research program. Tests were performed in which U-bend specimens were exposed at temperatures of 45, 60, and 80 °C [113, 140, and 176 °F], but at higher humidity levels than considered in NUREG/CR–7030. For the cyclic humidity tests described in Section 3.2, SCC generally occurred when the RH was at least between the DRH of CaCl2 and MgCl2. This series of tests was conducted to determine whether

3-31
this observation holds true at the higher temperatures. This is an important consideration for understanding the behavior of actual dry storage canisters because the temperature is expected to be initially high after loading, but to decrease over time as the fuel undergoes radioactive decay. The methodology for the elevated temperature tests was given in Section 2.5.2, with the notable feature being static humidity conditions rather than the cyclic humidity described in the previous section. Similar Type 304 U-bend specimens were used, but all specimens were deposited with 10 g/m2 of salt. Table 3-3 gives the full test matrix, and the last column summarizes the results that will be discussed in the subsequent sections. For most test conditions, the AH exceeded 30 g/m3, which was previously described as a reference point for the upper bound of AH in natural conditions. These tests were not conducted to represent natural conditions, but rather to develop a conceptual understanding of SCC susceptibility at elevated temperature. 3.3.1 Tests at 45 °C [113 °F] Although not considered within the high temperature regime of 60 to 80 °C [140 to 176 °F], a test was performed at 45 °C [113 °F] to compare the static humidity behavior to the cyclic humidity behavior described in the previous section. The U-bend specimens in the as-received and sensitized conditions were exposed for 1 month. Figure 3-34 shows a photograph of sensitized and as-received specimens, in which pitting is clearly visible. The specimens appear similar to those exposed in cyclic conditions for 1 month, which were shown in Figure 3-18(a). Surface micrographs are given in Figure 3-35. SCC initiation was observed for both material conditions. For this temperature and salt quantity, the material response seems to be similar for the static and cyclic humidity conditions.
Table 3-3. Static Environmental Test Matrix at Elevated Temperatures With 10 g/m2 Salts on U-Bends
Temperature (°C) [°F]
Relative Humidity
(%)
Absolute Humidity
(g/m3) Specimens
Maximum Test
Duration (Month)
Number of Cracked
Specimens 45 [113] 44 29 6 As-Received
6 Sensitized 1 3 As-Received
6 Sensitized 60 [140] 22 29 3 As-Received
3 Sensitized 1 0 As-Received
0 Sensitized 25 33 3 As-Received
3 Sensitized 2.75 2 As-Received
1 Sensitized 30 39 3 As-Received
3 Sensitized 5.75 0 As-Received
1 Sensitized 35 46 3 As-Received
3 Sensitized 1 1 As-Received
1 Sensitized 40 52 3 As-Received
3 Sensitized 1.5 2 As-Received
3 Sensitized 80 [176] 28 82 3 As-Received
3 Sensitized 2.5 1 As-Received
2 Sensitized 35 102 3 As-Received
3 Sensitized 2.25 1 As-Received
2 Sensitized 40 117 3 As-Received
3 Sensitized 1 1 As-Received
2 Sensitized

3-32
(a) (b)
Figure 3-34. Photographs of 10 g/m2 Type 304 U-Bend Specimens Held at 45 °C [113 °F] and 44 Percent Relative Humidity for (a) Sensitized and
(b) As-Received Conditions
(a) (b)
Figure 3-35. Surface Optical Micrographs of 10 g/m2 Type 304 U-Bend Specimens
Held at 45 °C [113 °F] and 44 Percent Relative Humidity for (a) Sensitized and (b) As-Received Conditions. Red Circles Highlight the Cracks.
3.3.2 Tests at 60 °C [140 °F] SCC tests were performed at 60 °C [140 °F], which was the highest temperature used for the cyclic humidity testing. At this temperature, the calculated DRH for CaCl2 is about 17 percent and the calculated DRH for MgCl2 is about 34 percent. The progression of humidity levels for the series of tests at 60 °C [140 °F] began at RH of 40 percent, which is above the DRH for MgCl2, followed by tests at 35, 30, 25, and finally 22 percent RH, which is slightly above the DRH for CaCl2. Photographs of some test specimens following exposure are shown in Figure 3-36, in which corrosion products are visible on the surfaces. Surface and cross section optical micrographs are shown in Figure 3-37. SCC initiation was observed for both

3-33
Sensitized As-received
(a)
(b)
(c)
(d)
Figure 3-36. Photographs of 10 g/m2 Type 304 U-Bend Specimens Held at
60 °C [140 °F] and (a) 25, (b) 30, (c) 35, and (d) 40 Percent Relative Humidity

3-34
(a)
(b)
(c)
(d)
(e)
(f)
(g)
(h)
Figure 3-37. Optical Micrographs of 10 g/m2 Type 304 U-Bend Specimens Held at 60 °C [140 °F] and 25 Percent Relative Humidity for (a) Surface of Sensitized;
(b) Cross Section of As-Received, 30 Percent Relative Humidity; (c) Surface of Sensitized; (d) Surface of As-Received (No Cracking Observed), 35 Percent Relative
Humidity; (e) Cross Section of Sensitized; (f) Cross Section of As-Received Conditions, 40 Percent Relative Humidity; (g) Surface of Sensitized; and (h) Surface of As-Received
Conditions. Red Circles Highlight the Cracks.
3-35
sensitized and as-received specimens at RH of 40, 35, 30, and 25 percent, except for 30 percent RH, at which it was only observed for the sensitized material. No SCC initiation was seen at 22 percent RH. 3.3.3 Tests at 80 °C [176 °F] Tests were performed at 80 °C [176 °F], which corresponds to the temperature threshold for SCC reported in Japanese studies (Mayuzumi, et al., 2008; Shirai, et al., 2011; Tani, et al., 2008). At this temperature, the calculated DRH for CaCl2 is about 18 percent and the calculated DRH for MgCl2 is about 30 percent. The progression of humidity levels for the series of tests at 80 °C [176 °F] began at RH of 40 percent, which is above the DRH for MgCl2, followed by tests at 35 and 28 percent RH. Photographs of some test specimens following exposure are shown in Figure 3-38, in which corrosion products are visible on the surfaces. Surface and cross-sectional optical micrographs are shown in Figure 3-39. SCC initiation was observed for sensitized and as-received test specimens at 40, 35, and 28 percent RH. On the surface images, it seems that the cracks grow from pit to pit, and in the cross section images, the cracks appear to grow out of the bottom of the pits. 3.3.4 Summary of Elevated Temperature Test Results Type 304 U-bend specimens deposited with 10 g/m2 salt were exposed to static humidity conditions at temperatures of 45, 60, and 80 °C [113, 140, and 176 °F]. The humidity levels for the tests were selected to be above the calculated DRH for MgCl2 or between the calculated DRH for CaCl2 and MgCl2. SCC initiation was observed in sensitized material in all test conditions except for 60 °C [140 °F] and 22 percent RH (AH of 29 g/m3). These specimens, however, were only exposed for 1 month. As reported in Section 3.2.1.5, specimens exposed to cyclic humidity at this temperature and salt quantity did exhibit SCC within 6.5 months. Therefore, the lack of observed SCC may be due to the limited period of exposure. The as-received material showed SCC initiation in all conditions for which it occurred for sensitized material, except for 60 °C [140 °F] and 30 percent RH (AH of 39 g/m3) 3.4 Stress Corrosion Cracking Initiation in High-Humidity Conditions For the tests described in the previous sections, the highest RH at which SCC initiation was observed was for the cyclic humidity condition at 35 °C [95 °F], where the RH was about 76 percent at the high end of the cycle. For the cyclic test at 27 °C [81 °F], where the humidity approached 100 percent, the salt appeared to deliquesce and drain off the specimen before cracking could occur. Additional data were sought to investigate SCC susceptibility in higher humidity conditions. This is of particular interest because the equilibrium chloride concentration of a deliquescent solution decreases with increasing RH beyond its saturation point. Some investigators have reported that for austenitic stainless steel exposed to chloride salts, the SCC susceptibility decreases at high RH (Prosek, et al., 2009; Albores-Silva, et al., 2011). Considering the implication of this observation, it could be posited that rather than a minimum RH threshold above which SCC could occur (e.g., above the DRH for CaCl2), there is instead a humidity window of susceptibility bounded at the high end by the RH at which the solution is too diluted to cause SCC. To further investigate this behavior, tests were performed in which specimens were exposed to sea salt and pure salt constituents at 30 °C [95 °F] and 90 percent RH. The test methodology was described in Section 2.5.3.
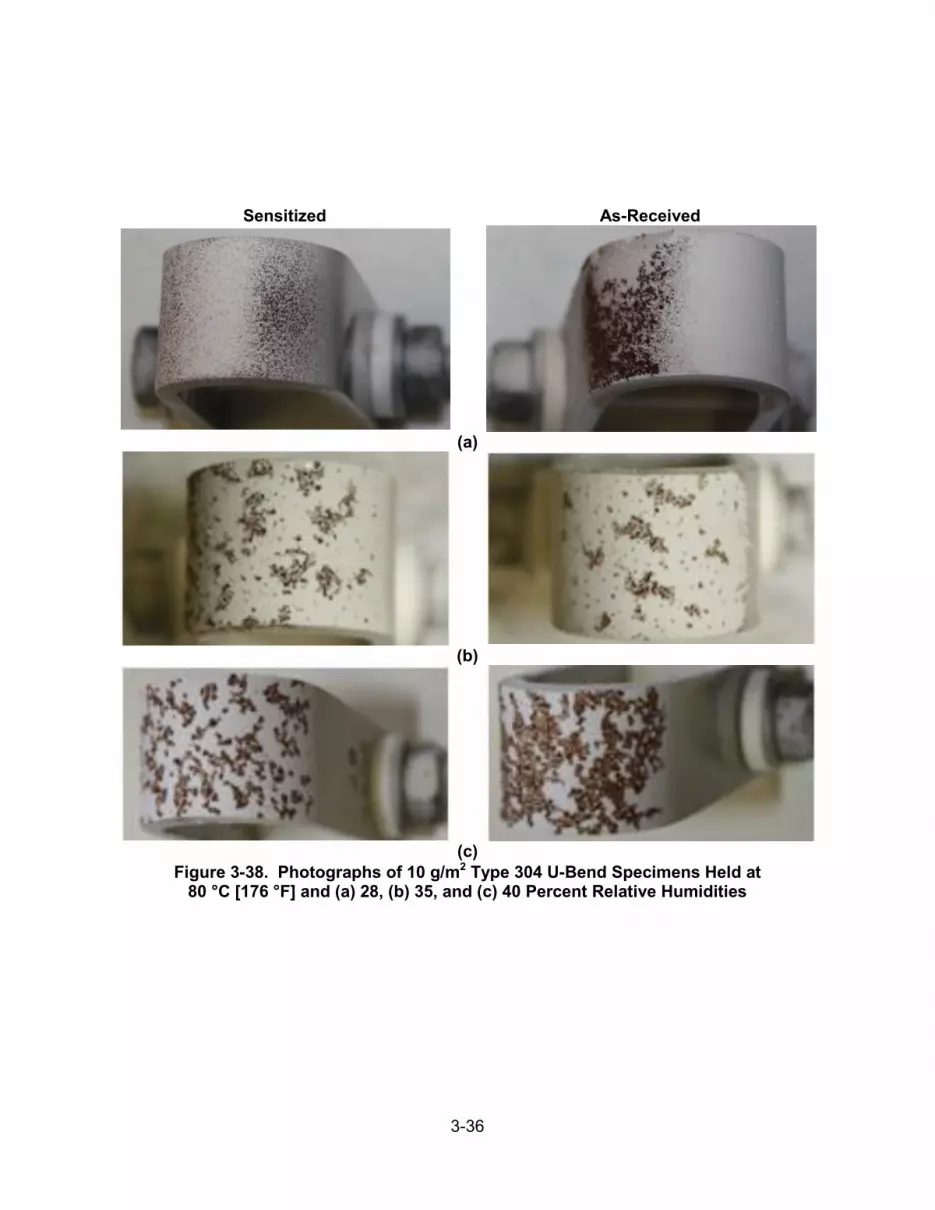
3-36
Sensitized As-Received
(a)
(b)
(c)
Figure 3-38. Photographs of 10 g/m2 Type 304 U-Bend Specimens Held at 80 °C [176 °F] and (a) 28, (b) 35, and (c) 40 Percent Relative Humidities
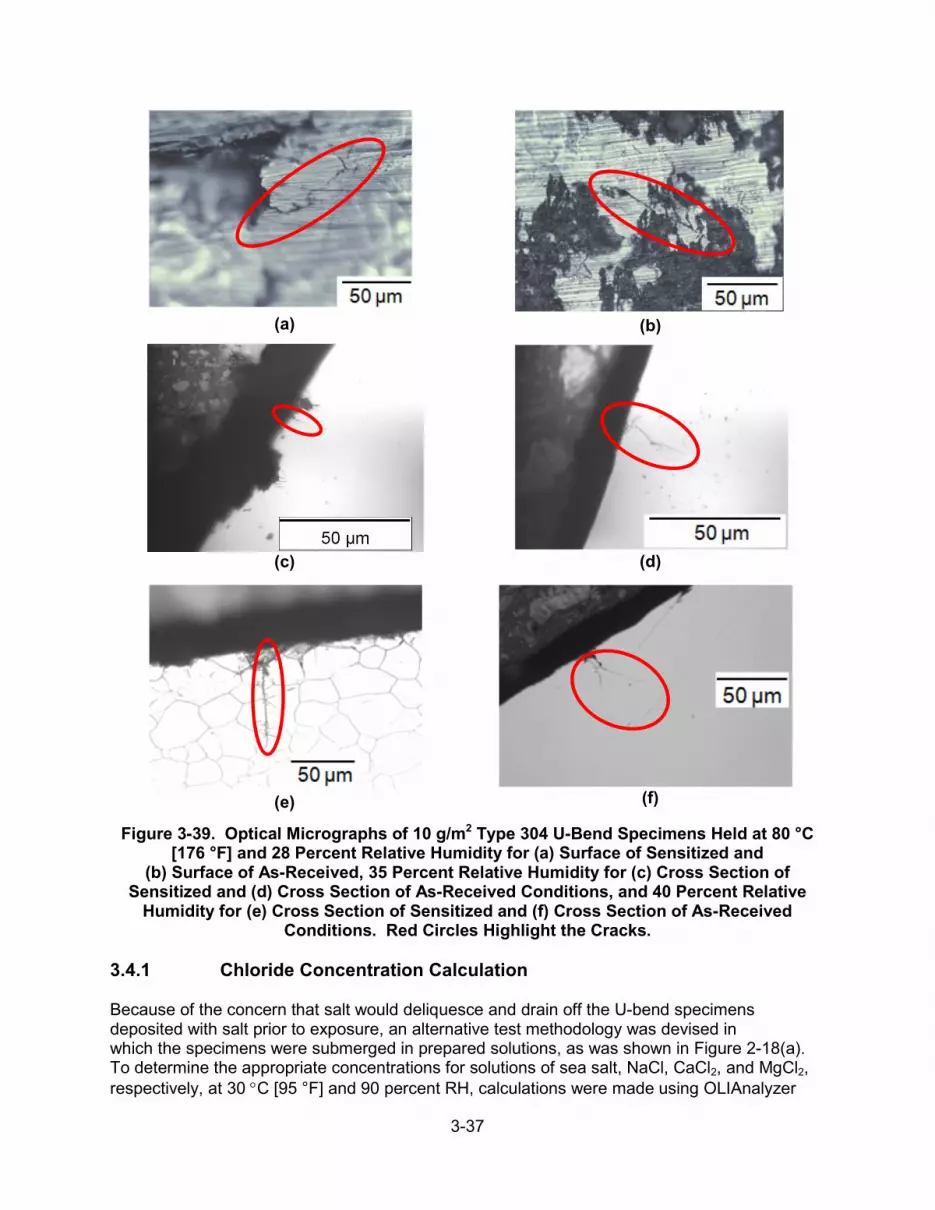
3-37
(a)
(b)
(c)
(d)
(e)
(f)
Figure 3-39. Optical Micrographs of 10 g/m2 Type 304 U-Bend Specimens Held at 80 °C [176 °F] and 28 Percent Relative Humidity for (a) Surface of Sensitized and
(b) Surface of As-Received, 35 Percent Relative Humidity for (c) Cross Section of Sensitized and (d) Cross Section of As-Received Conditions, and 40 Percent Relative
Humidity for (e) Cross Section of Sensitized and (f) Cross Section of As-Received Conditions. Red Circles Highlight the Cracks.
3.4.1 Chloride Concentration Calculation Because of the concern that salt would deliquesce and drain off the U-bend specimens deposited with salt prior to exposure, an alternative test methodology was devised in which the specimens were submerged in prepared solutions, as was shown in Figure 2-18(a). To determine the appropriate concentrations for solutions of sea salt, NaCl, CaCl2, and MgCl2, respectively, at 30 °C [95 °F] and 90 percent RH, calculations were made using OLIAnalyzer
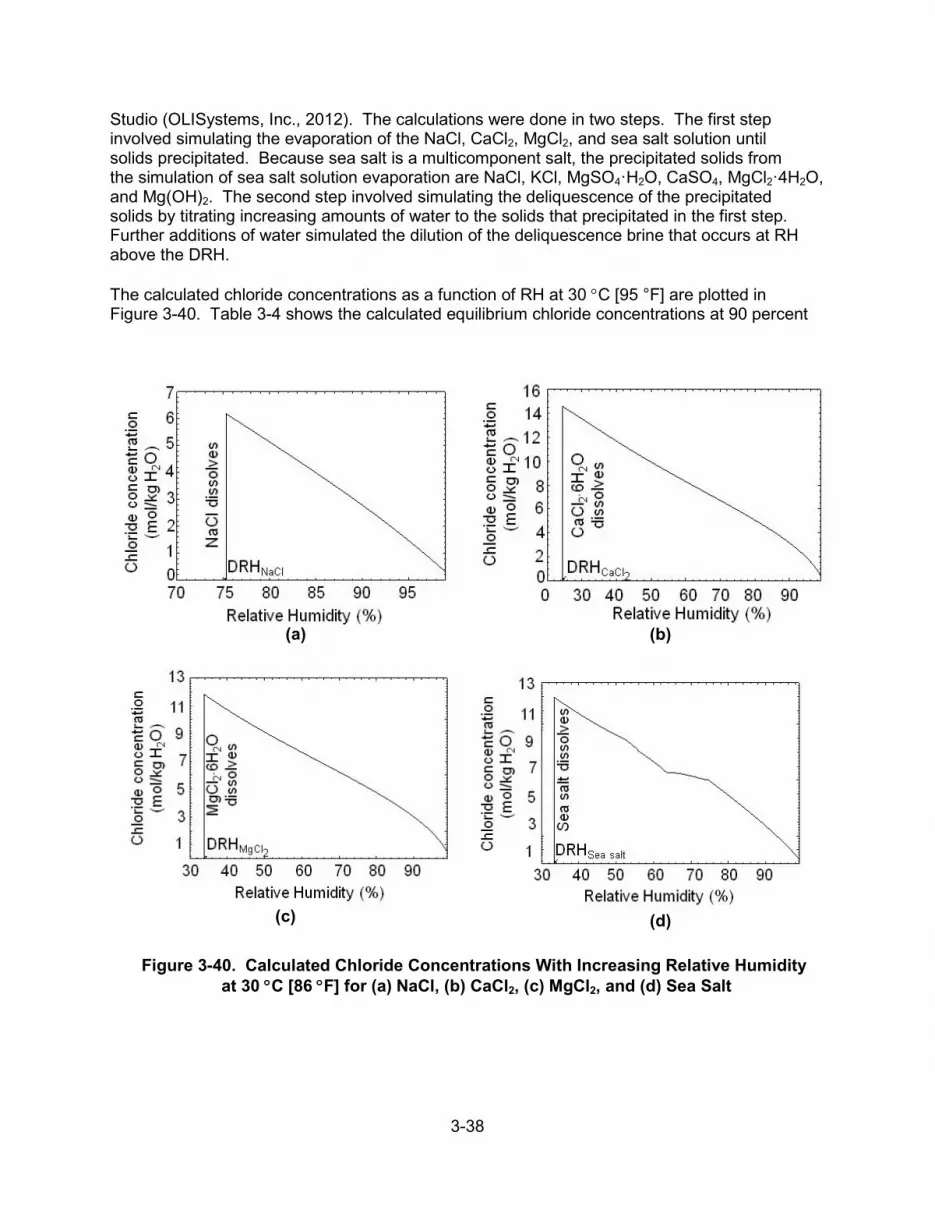
3-38
Studio (OLISystems, Inc., 2012). The calculations were done in two steps. The first step involved simulating the evaporation of the NaCl, CaCl2, MgCl2, and sea salt solution until solids precipitated. Because sea salt is a multicomponent salt, the precipitated solids from the simulation of sea salt solution evaporation are NaCl, KCl, MgSO4·H2O, CaSO4, MgCl2·4H2O, and Mg(OH)2. The second step involved simulating the deliquescence of the precipitated solids by titrating increasing amounts of water to the solids that precipitated in the first step. Further additions of water simulated the dilution of the deliquescence brine that occurs at RH above the DRH. The calculated chloride concentrations as a function of RH at 30 °C [95 °F] are plotted in Figure 3-40. Table 3-4 shows the calculated equilibrium chloride concentrations at 90 percent
(a)
(b)
(c)
(d)
Figure 3-40. Calculated Chloride Concentrations With Increasing Relative Humidity at 30 °C [86 °F] for (a) NaCl, (b) CaCl2, (c) MgCl2, and (d) Sea Salt

3-39
Table 3-4. Chloride Concentration and Solution pH
Salt
Before Test After Test Calculated Cl− Concentration
at 30 °C [86 °F] and 90 Percent
Relative Humidity (mol/kg H2O)
Measured pH (~20 °C)
[68 °F]
Measured Cl− Concentration From Ion
Selective Probe (mol/kg H2O)
Measured pH (~20 °C)
[68 °F] NaCl 2.79 6.38 4.30 ± 0.20 6.52 CaCl2 3.16 6.21 3.16 ± 0.09 6.08 MgCl2 3.01 5.09 2.91 ± 0.07 6.24 Sea Salt 2.71 7.93 2.80 ± 0.08 7.55 RH, which were used to prepare the concentrations in the test solutions. For comparison, the calculated equilibrium chloride concentration for the condition of 35 °C [95 °F] and 76 percent RH is about 5.75 mol/kg H2O. Table 3-4 also shows the measured pH of the test solutions before and after the tests and chloride concentration after the tests, measured using an ion selective electrode. For CaCl2, MgCl2, and sea salt, the measured chloride concentration is consistent with the value calculated using OLIAnalyzer Studio. The measured chloride concentration from NaCl is higher than the calculated value, possibly because this solution still had not reached equilibrium with the 90 percent RH of the test chamber. NaCl is less hygroscopic than other salts used in the test, which may have slowed the equilibration of the NaCl deliquescence brine with the high-humidity environment in the test chamber. 3.4.2 Stress Corrosion Cracking Tests SCC tests were conducted in which Type 304 U-bend specimens were exposed at 30 °C [86 °F] and 90 percent RH. As discussed in Section 2.5.3, the specimens were either deposited with 10 g/m2 of simulated sea salt or immersed in the solutions with concentrations given in Table 3-4. For both methods, triplicate as-received and sensitized specimens were used. After 5 weeks of exposure, all six specimens deposited with 10 g/m2 of sea salt and two out of three as-received and sensitized specimens immersed in solution were removed from the test chamber. The remaining specimens were left in the chamber for 4 months. For the U-bend specimens deposited with sea salt, shown in Figure 3-41, the salt appeared to quickly deliquesce and drain off the side. The specimens were left shiny, with no visible corrosion products but with some white scales, which may be the undeliquesced constituents of the salt. This is similar to the appearance of the specimens used for cyclic humidity testing at 27 °C [81 °F]. The specimens were examined by optical microscopy at up to 500 times magnification. One magnified surface area covered with scale is shown in Figure 3-41(a). There is minor pitting on the surface of all as-received and sensitized specimens, such as the one shown in Figure 3-41(b), but the pits were shallow and small. No SCC initiation was observed. For the specimens immersed in NaCl, MgCl2, and CaCl2 solutions, Figures 3-42 through 3-44 show photographs of the test solutions and specimens after exposure, as well as optical micrographs. The solutions were yellowish in color from corrosion products. Pitting corrosion was observed on all specimens, mostly at the edges and sides. The extent of corrosion was similar after 5-week and 4-month exposures. SCC initiation was observed for specimens immersed in each solution. Cracks were found to grow outward from the pits, with a

3-40
(a)
(b)
Figure 3-41. Posttest Specimens Deposited With 10 g/m2 Sea Salt Exposed to 30 °C [86 °F] and 90 Percent Relative Humidity for 5 Weeks: (a) As-Received
and (b) Sensitized greater number and larger cracks seen on sensitized specimens. The corrosion appears most extensive on the specimens exposed to MgCl2, which has the lowest pH of the respective solutions. For specimens immersed in sea salt, Figures 3-45 shows photographs of the test solutions and specimens after exposure, as well as optical micrographs. The sea salt solution appears clear, even after a 4-month exposure. The specimen surfaces looked pristine except for minor pitting. Cracks were observed from the pits, but the extent of pitting and cracks was much less than those on the specimens exposed to NaCl, MgCl2, and CaCl2 solutions. The difference in the

3-41
(a)
5-Week Exposure As-Received Sensitized
4-Month Exposure As-Received Sensitized
(b)
(c)
(d)
Figure 3-42. (a) NaCl Solution at 5 Weeks and (b) U-Bend Specimens After 5-Week and 4-Month Exposures. Cracks Observed on (c) As-Received and (d) Sensitized Specimens Immersed in NaCl Solution Equilibrated at 30 °C [86 °F] and 90 Percent
Relative Humidity for 5 Weeks. Red Circles Highlight the Cracks.

3-42
(a)
5-Week Exposure As-Received Sensitized
4-Month Exposure As-Received Sensitized
(b)
(c)
(d)
Figure 3-43. (a) CaCl2 Solution at 5 Weeks and (b) U-Bend Specimens After 5-Week and 4-Month Exposures. Cracks Observed on (c) As-Received and (d) Sensitized Specimens
Immersed in CaCl2 Solution Equilibrated at 30 °C [86 °F] and 90 Percent Relative Humidity for 5 Weeks. Red Circles Highlight the Cracks.

3-43
(a)
5-Week Exposure As-Received Sensitized
4-Month Exposure As-Received Sensitized
(b)
(c)
(d)
Figure 3-44. (a) MgCl2 Solution at 5 Weeks and (b) U-Bend Specimens After 5-Week and 4-Month Exposures. Cracks Observed on (c) As-Received and (d) Sensitized Specimens
Immersed in MgCl2 Solution Equilibrated at 30 °C [86 °F] and 90 Percent Relative Humidity for 5 Weeks. Red Circles Highlight the Cracks.

3-44
(a)
5-Week Exposure As-Received Sensitized
4-Month Exposure As-Received Sensitized
(b)
(c)
(d)
Figure 3-45. (a) Sea Salt Solution at 5 Weeks and (b) U-Bend Specimens After 5-Week and 4-Month Exposures. Cracks Observed on (c) As-Received and (d) Sensitized Specimens Immersed in Sea Salt Solution Equilibrated at 30 °C [86 °F] and 90 Percent Relative Humidity
for 5 Weeks. Red Circles Highlight the Cracks. extent of cracking could be due to the lower equilibrium chloride concentration and higher pH of the sea salt solution compared to the other solutions, as shown in Table 3-4. 3.5 C-Ring Stress Corrosion Cracking Tests The tests described in the previous sections utilized U-bend specimens to examine SCC susceptibility. U-bend specimens have a highly strained condition, near 15 percent at the apex (ASTM International, 2009). The stress and strain states of canister welds have not been well-characterized, but measurements from austenitic stainless steel heat-affected zones

3-45
have shown that residual strains of 10 percent can occur (Angeliu, et al., 2000; Andresen, et al., 2000). Nevertheless, additional data would be useful to help determine whether SCC initiation could occur at lower stress and strain levels. As mentioned in Chapter 1, in Japanese studies, chloride-induced SCC was reported for Type 304 stainless steel at stress as low as half of the yield stress at 80 °C [176 °F] and 35 percent RH using constant load tensile tests. To evaluate the effect of varying stress and strain level on SCC initiation, tests were conducted using C-ring specimens per ASTM G38-01 (ASTM International, 2007), following the methodology described in Section 2.5.4. The material used was Type 304L, rather than Type 304, which was used for the U-bend specimens. Lower carbon content reduces sensitization susceptibility; as a result, Type 304L is expected to be less susceptible to sensitization in weld heat-affected zones, which leads to higher cracking resistance than Type 304 (Grubb, et al., 2005). This should be considered when comparing the results of the U-bend tests to those with C-rings. Some C-ring specimens were strained to 0.4 percent, which was the measured strain at the 0.2 percent offset yield strength. Other specimens were strained to 1.5 percent. Specimens were deposited with 1 or 10 g/m2 of sea salt and exposed to static humidity conditions at 35, 45, or 52 °C [95, 113, or 126 °F]. The AH was maintained near 30 g/m3. The full test matrix is shown in Table 3-5, and the last column summarizes the results, which will be discussed in the subsequent sections. 3.5.1 Tests at 35 °C [95 °F] Tests were performed in which C-ring specimens were exposed at 35 °C [95 °F] and 72 percent RH. As-received and sensitized specimens were strained to 0.4 percent and deposited with 1 or 10 g/m2 of sea salt. No specimens at this temperature were tested at 1.5 percent strain. After exposure for 2 months, specimens deposited with 1 g/m2 of sea salt showed some pitting
Table 3-5. C-Ring Stress Corrosion Cracking Test Matrix
Tem
pera
ture
(°
C) [
°F]
Rel
ativ
e H
umid
ity (%
)
Abs
olut
e H
umid
ity (
g/m
3 )
Salt
Con
cent
ratio
n (g
/m2 )
Stra
in (%
)
Spec
imen
s
Max
imum
Tes
t D
urat
ion
(Mon
th)
Num
ber o
f C
rack
ed
Spec
imen
s
35 [95] 72 29 1 0.4 3 As-Received
3 Sensitized 2 0 As-Received 0 Sensitized
10 0.4 3 As-Received 3 Sensitized 3 0 As-Received 1
Sensitized
45 [113] 44 29
1 0.4 3 As-Received 3 Sensitized 3 0 As-Received 0
Sensitized
10 0.4 3 As-Received
3 Sensitized 3 0 As-Received 0 Sensitized
1.5 3 As-Received 3 Sensitized 2 1 As-Received 1
Sensitized
52 [126] 32 29
1 0.4 3 As-Received 3 Sensitized 2 3 As-Received 3
Sensitized
10 0.4 3 As-Received
3 Sensitized 3 0 As-Received 1 Sensitized
1.5 3 As-Received 3 Sensitized 2 3 As-Received 3
Sensitized

3-46
on the surface but no SCC initiation was observed for sensitized or as-received material. After exposure for 3 months, specimens deposited with 10 g/m2 of sea salt also showed some pitting on the surface and SCC initiation was observed in one sensitized specimen. Images of the specimens are shown in Figures 3-46 and 3-47. 3.5.2 Tests at 45 °C [113 °F] Tests were performed in which C-ring specimens were exposed at 45 °C [113 °F] and 44 percent RH. At this temperature, some sensitized and as-received specimens were strained to 0.4 percent and deposited with 1 or 10 g/m2 of salt, while others were strained to 1.5 percent and deposited with 10 g/m2 of salt. After 2 to 3 months of exposure, pitting was visible on the surfaces of all test specimens, as shown in Figure 3-48. Under microscopic
As-Received
Sensitized
(a)
Sensitized As-Received
(b)
Figure 3-46. Photographs of Type 304L C-Ring Specimens Strained to 0.4 Percent Held at 35 °C [95 °F] and 72 Percent Relative Humidity for (a) 10 g/m2 After 3 Months and
(b) 1 g/m2 After 2 Months
Figure 3-47. Optical Micrograph of Sensitized Type 304L C-Ring Specimen With 10 g/m2 Strained to 0.4 Percent Held at 35 °C [95 °F] and 72 Percent Relative Humidity.
Red Circle Highlights the Cracks.

3-47
As-Received
Sensitized
(a)
As-Received
Sensitized
(b)
As-Received
Sensitized
(c)
Figure 3-48. Photographs of Type 304L C-Ring Specimens Held at 45 °C [113 °F] and 44 Percent Relative Humidity for 0.4 Percent Strain Specimens at (a) 10 g/m2,
(b) 1 g/m2, and (c) 1.5 Percent Strain Specimens at 10 g/m2
examination, however, no SCC initiation was observed for the specimens deposited with 1 g/m2 of salt at either strain level. Cracking was observed on some sensitized and as-received specimens strained to 1.5 percent and deposited with 10 g/m2 of salt, as shown in Figure 3-49. The extent of cracking seemed lesser than for U-bend specimens exposed at the same temperature and salt concentration. 3.5.3 Tests at 52 °C [126 °F] Tests were performed in which C-ring specimens were exposed at 52 °C [126 °F] and 32 percent RH. At this temperature, some sensitized and as-received specimens were strained to 0.4 percent and deposited with 1 or 10 g/m2 of salt, while others were strained to 1.5 percent and deposited with 10 g/m2 of salt. After 2 to 3 months of exposure, pitting was visible on the surface of most specimens, as shown in Figure 3-50. For reasons that are unknown, specimens at 0.4 percent strain and salt concentration of 10 g/m2 did not exhibit pitting, though it was observed for similar specimens with only 1 g/m2 of salt. Under microscopic

3-48
(a)
(b)
Figure 3-49. Cross Section Optical Micrographs of 1.5 Percent Strained Type 304L C-Ring Specimens With 10 g/m2 Held at 45 °C [113 °F] and 44 Percent Relative
Humidity in the (a) Sensitized and (b) As-Received Condition. Red Circles Highlight the Cracks.
As-Received
Sensitized
(a)
As-Received
Sensitized
(b)
As-Received
Sensitized
(c)
Figure 3-50. Photographs of Type 304L C-Ring Specimens Held at 52 °C [126 °F] and 32 Percent Relative Humidity for 0.4 Percent Strain Specimens at (a) 10 g/m2,
(b) 1 g/m2, and (c) 1.5 Percent Strain Specimens at 10 g/m2

3-49
examination, SCC initiation was observed in all specimens except for those on which there was no pitting. Optical micrographs are shown in Figure 3-51. The extent of cracking appears greater at 52 °C [126 °F] compared to 35 or 45 °C [95 or 113 °F].
(a)
(b)
(c)
(d)
(e)
Figure 3-51. Optical Micrographs of Type 304L C-Ring Specimens Held at 52 °C [126 °F] and 32 Percent Relative Humidity. Cracks Were Observed in (a) Sensitized Specimens
Held at 0.4 Percent Strain With 10 g/m2. Cracks Were Also Seen in (b) Sensitized and (c) As-Received C-Rings Held at 0.4 Percent Strain With 1 g/m2.
Finally, Cracks Were Observed in (d) Sensitized and (e) As-Received C-Rings Held at 1.5 Percent Strain With 10 g/m2.
Red Circles Highlight the Cracks.

3-50
3.5.4 Summary of C-Ring Test Results Type 304L C-ring specimens were deposited with 1 g/m2 of sea salt and strained to 0.4 percent, or deposited with 10 g/m2 of sea salt and strained to 0.4 or 1.5 percent. They were then exposed to static humidity conditions at 35, 45, or 52 °C [95, 113, or 126 °F], where the AH was maintained near 30 g/m3. After 2 to 3 months of exposure, pitting was visible on most specimen surfaces. For the specimens deposited with 1 g/m2 of sea salt and strained to 0.4 percent, SCC initiation was seen at 52 °C [126 °F] in sensitized and as-received material. For specimens deposited with 10 g/m2 of sea salt and strained to 0.4 percent, SCC initiation was seen in sensitized material at 35 and 52 °C [95 and 126 °F]. Finally, for specimens deposited with 10 g/m2 of sea salt and strained to 1.5 percent, SCC initiation was observed in sensitized and as-received materials at 45 and 52 °C [113 and 126 °F]. 3.6 Discussion of Stress Corrosion Cracking Susceptibility in Chloride Salts Based on the results of the proceeding series of tests, the following sections will discuss the effects of various factors on SCC susceptibility for austenitic stainless steel. These include temperature and humidity, salt quantity, material condition, and stress level. 3.6.1 Temperature and Humidity For the purpose of this discussion, temperature and humidity will be treated together because of their strong interdependence in describing the SCC susceptibility conditions. The results of the deliquescence tests, presented in Section 3.1, indicated that the DRH for simulated sea salt is between that of CaCl2 and MgCl2 pure salts. The former has a calculated DRH close to 20 percent over the 27 to 80 °C [81 to 176 °F] temperature range considered in this investigation, while that of the latter is in the range of about 30 to 35 percent. Therefore, it was postulated that austenitic stainless steel could be susceptible to SCC initiated by sea salt deliquescence if it is exposed to RH at least between the DRH of CaCl2 and MgCl2. With increasing temperature, the AH that corresponds to this range of RH increases significantly, from less than 10 g/m3 at 27 °C [81 °F] to greater than 50 g/m3 at 80 °C [176 °F]. AH of about 30 g/m3 was described as a reference upper limit in natural conditions. The results from the cyclic SCC tests described in Section 3.2 and elevated temperature SCC tests described in Section 3.3 are summarized in the plot on Figure 3-52. The plot shows black lines indicating the variation of RH with temperature for a given AH. Calculated DRH as a function of temperature for CaCl2, MgCl2, NaCl, and Na2SO4 is also shown. The vertical red arrows indicate the span of the humidity cycle for tests in which SCC initiation was observed in the tests in Section 3.2, while the vertical blue arrow indicates the span of the humidity cycle for tests in which SCC initiation was not observed. The red dots indicate the conditions where SCC initiation was observed for the static humidity elevated temperature tests in Section 3.3. Generally, the results are consistent with the expected observation that SCC can occur by sea salt deliquescence at RH at least between the DRH of CaCl2 and MgCl2. The extent of cracking seemed to increase with increasing RH, as more deliquescence would occur. The exception was the cyclic humidity test at 27 °C [81 °F], where no SCC was observed, though this has the highest RH. It is thought that the salt deliquesced and drained off the specimen before SCC initiation could occur. Testing at 30 °C [86 °F] and 90 percent RH, described in Section 3.4, indicated that the chloride concentration in the equilibrium salt solution can be diluted at high RH, but may be still sufficient to cause cracking if it remains in contact with the specimen

3-51
Figure 3-52. Stress Corrosion Cracking Susceptibility Map From Both Cyclic and Static U-Bend Tests
surface. However, further examination of this would be needed as the testing of U-bend specimens at 30 °C [86 °F] and 90 percent RH immersed in aqueous solution has differences from the testing under atmospheric conditions with a limited amount of salt deposited on specimen surface.
3-52
3.6.2 Salt Quantity The quantities of salt deposited on test specimens ranged from 0.1 to 10 g/m2. Specific conditions in which the salt quantity was varied include the cyclic humidity tests at 35, 45, and 52 °C [95, 113, and 126 °F]. At the two lower temperatures, specimens were deposited with 0.1, 1, or 10 g/m2 of sea salt, and at the higher temperature, with 1 or 10 g/m2. Salt quantity was also varied at either 1 or 10 g/m2 for C-ring tests at 45 and 52 °C [113 and 126 °F]. For the U-bend tests, SCC initiation was observed for the specimens deposited with as low as 0.1 g/m2 of sea salt, though to a lesser extent than on specimens with 1 or 10 g/m2. Likewise, the extent of cracking was greater at 10 g/m2 of sea salt compared to 1 g/m2 for the cyclic tests at 52 °C [126 °F] and for the C-ring tests. The quantity of 0.1 g/m2 of simulated sea salt is of the same order of magnitude at which SCC initiation was reported in Shirai, et al. (2011). Note that the cations in the chlorides may affect the quantity at which cracking initiates (e.g., chlorides from MgCl2 versus CaCl2) because the pH and the electrochemical activity of the deliquescence brine could be different. Therefore, the determination of an absolute threshold quantity of chlorides for crack initiation is difficult and not resolved here. 3.6.3 Material Condition The variations in material used for the SCC tests included U-bend specimens of Type 304 in the as-received, sensitized, and welded condition and C-rings of Type 304L in the as-received and sensitized conditions. As-received material was selected to represent a typical base metal, while the furnace sensitized material was intended to represent the weld heat-affected zone. As expected, the sensitized material shows greater susceptibility to SCC initiation than the as-received Type 304, with chromium-depleted grain boundaries being more vulnerable to intergranular cracking. The observation that requires further explanation, however, is why the welded U-bend specimens used for cyclic SCC testing showed SCC susceptibility more similar to the as-received material than the sensitized. To gain further insight, electrochemical reactivation tests were conducted on welded specimens to determine the extent of sensitization. The tests were conducted according to ASTM G108–94 (ASTM International, 2010) in the same manner as described in Section 2.3.1. Duplicate specimens were cut from the base and deposited weld metal of two welded specimens, one of which is shown in Figure 3-53(a), and triplicate specimens were cut from the heat-affected zone of the weld specimens at a temperature of 30 °C [86 °F]. The reactivation curves are shown in Figure 3-53(b). Overall, the specimens cut from the heat-affected zone showed the highest current. The amount of charge, which is proportional to the area under the reactivation curve, was normalized against surface area and summarized in Table 3-6. The charges from base and deposited weld metal were nearly the same. The heat-affected zone specimen showed only slightly higher charge, but remained well below that of the sensitized material shown in Table 2-6. The post-reactivation specimens were also examined microscopically to determine whether the grain boundaries were attacked. The photos of the tested specimens are shown in Figure 3-54, and the results are also included in Table 3-6. The specimen cut from the deposited weld metal has a small portion of heat-affected zone material, which appears darker after the test, but the majority of the material was from the deposited weld metal. All the specimens only showed pitting corrosion, with the least corrosion from the deposited weld metal material and the most from the heat-affected zone material. The lack of grain boundary attack from any specimen cut

3-53
(a)
(b)
Figure 3-53. (a) Weld Specimen and (b) Electrochemical Reactivation Curves Following ASTM G108–94 (ASTM International, 2010) for Type 304 Stainless Steel
Base, Heat-Affected Zone Sections, and Type 308 Stainless Steel Cut From Weld-Deposited Weld Metal
Heat-affected zone
-

3-54
Table 3-6. Type 304 Stainless Steel Weld Electrochemical Reactivation Test Results
Base
Deposited Weld Metal Heat-Affected Zone
Charge Normalized for Surface Area (Coulombs/Cm2)
0.27 0.35
0.49
0.25
0.17 0.14 0.48
Average Charge (Coulombs/Cm2) 0.22 0.24 0.41 ± 0.14
Is There Grain Boundary Attack?
No (Heavy Pitting Only)
No (Light Pitting Only)
No (Pitting Only)
(a)
(b)
(c)
Figure 3-54. Micrographs of Type 304 Stainless Steel Weld Specimen After Electrochemical Reactivation Tests Following ASTM G108–94 (ASTM International, 2010):
(a) Base, (b) Heat-Affected Zone, and (c) Mainly Deposited Weld Metal
3-55
from different regions of the weld indicates that the weld material was not sensitized. This is consistent with the observation that the welded specimens were less susceptible to SCC than the sensitized material. Also note that the Type 308 weld filler material has a higher chromium concentration than the Type 304 base material, with the former having 19.92 wt% and the latter having 18.19 wt% according to Table 2-4; this may also contribute to the cracking resistance of the welded specimens. 3.6.4 Stress–Strain Level The results of tests in this investigation, as well as those reported in NUREG/CR–7030 (Caseres and Mintz, 2010), clearly indicated that there is sufficient stress and strain in U-bend specimens to initiate cracking. Therefore, a more refined determination of the condition required for SCC was attained by tests with C-ring specimens strained to 0.4 or 1.5 percent. In these tests, SCC initiation was observed in specimens with 0.4 percent strain, where the stress is only about the material yield stress. The extent of cracking, however, does appear to increase with increasing stress and strain. For the U-bend and C-ring specimens, calculations were not made to determine the stress profile through the thickness of the specimens. Moreover, rate of crack propagation was not systematically investigated. Therefore, it cannot be concluded whether the cracks shown in the images in this report were still growing at the time the tests were terminated.

4-1
4 RESULTS AND DISCUSSION OF EFFECTS OF NON-CHLORIDE-RICH ATMOSPHERIC SALTS ON STRESS CORROSION CRACKING
Apart from chloride salts, a range of other species could be present in the atmosphere near spent fuel storage locations. These may arise from normal industrial, commercial, or agricultural activities. Relative to chloride-rich salts, there is limited available information about the effects of such species on stress corrosion cracking (SCC) susceptibility for austenitic stainless steel. Atmospheric sampling data were reviewed to identify species other than chloride salts that could be present in the air. This chapter provides the results from a series of tests with these species. These include deliquescence and efflorescence testing, SCC tests with U-bend specimens exposed to the species, and SCC tests with U-bend specimens exposed to a combination of non-chloride and chloride salts. The implications of the findings for understanding the SCC susceptibility of austenitic stainless steel will be discussed. 4.1 Survey of Non-Chloride-Rich Atmospheric Species Particulate matter is a general term that describes a mixture of solid particles and liquid droplets found in air with a broad range of physical characteristics and chemical species (Napoleon, et al., 2007). Environmental scientists usually consider particles with diameters ≥2.5 µm [≥0.1 mil] as coarse particles and those with diameters ≤2.5 µm [≤0.1 mil] as fine particles (Finlayson-Pitts and Pitts, 1986). Coarse particles usually are produced by mechanical or abrasive processes, such as wind-blown sea spray that produces sea salt particles and dust storms that carry mineral dust particles into the atmosphere (Sullivan and Prather, 2005). Thus, in noncoastal or inland environments, the major elements found in coarse particles are silicon, aluminum, calcium, iron, potassium, titanium, magnesium, and strontium, often in ratios the same as those of Earth’s crustal material (Finlayson-Pitts and Pitts, 1986). Fine particles, which typically are formed by combustion or nucleation events and subsequent growth through condensation of organic and inorganic species, have chemical compositions different from those of coarse particles. The major chemical components present in fine particles are sulfate (SO4
2−), nitrate (NO3−),
and ammonium (NH4+) ions, as well as organic carbon, elemental carbon, and crustal material
(Finlayson-Pitts and Pitts, 1986; Napoleon, et al., 2007). A small amount of chloride (Cl-) is present. A variety of trace metals, such as iron, vanadium, copper, nickel, chromium, cadmium, zinc, and arsenic, also are ubiquitous constituents of fine particulate matter derived from anthropogenic fossil fuel combustion. Particulate matter may also be classified as primary or secondary. Primary particles are those that are emitted directly from sources such as vehicles, fires, industrial smoke stacks, construction sites, road dust, and cooking, whereas secondary particles are those that are formed in the atmosphere through chemical reactions of gaseous precursors. Primary and secondary precursor species are emitted from a variety of anthropogenic and natural sources. Particles formed in the atmosphere make up most of the fine particle pollution in the United States. A literature survey was performed to identify a selection of non-chloride salts for SCC testing that would be representative of atmospheric species found throughout the United States.

4-2
Recognizing that both chloride salts and non-chloride salts may be present at a given location, the literature survey was also used to identify representative mixtures for SCC testing. These surveys are described in the following sections.
4.1.1 Non-Chloride Atmospheric Salts Literature data indicate that in environments near industrial, commercial, or agricultural activities, the most abundant soluble inorganic components of atmospheric particulate matter are sulfate, nitrate, and ammonium ions (Wolff, et al., 1983; Finlayson-Pitts and Pitts, 1986; EPA, 2004; Pandis, et al., 2005; Allen, 2005; Turner, 2007; Napoleon, et al., 2007). Sulfate is formed by oxidation of the precursor gas sulfur dioxide (SO2), which is emitted by combustion sources that have sulfur (e.g., coal). Oxidation of SO2 occurs in the atmosphere via gas-phase reactions with the hydroxyl radical (⋅OH), mostly during the daytime when photochemistry results in higher ⋅OH concentrations. SO2 oxidation also can occur in the aqueous phase in clouds, rainwater, or within the water fraction of particulate matter. The sulfate that is formed in sulfuric acid (H2SO4) reacts quickly with ammonia (NH3) to form nonvolatile (NH4)2SO4. The precursor gas NH3 is emitted by several sources, such as livestock, ammonium-containing fertilizers, and motor vehicles. If there is not enough NH3 available to fully neutralize H2SO4, then NH4HSO4 forms and the particles remain acidic. Similar to sulfate, nitrate is formed by oxidation of precursor nitrogen oxide (NOx) gases by ⋅OH during daylight hours to form nitric acid (HNO3). The precursor NOx gases also are emitted mainly from combustion sources (e.g., automotive engines, fossil fuel power plants). Other nighttime and aqueous-phase pathways can form HNO3, such as through the formation of the nitrate radical (NO3⋅) from the reaction of nitrogen dioxide (NO2) and ozone (O3). The latter process dominates at night because the NO3⋅ radical is rapidly photolyzed during the day. The HNO3 reacts quickly with NH3 to form NH4NO3. NH4NO3 is semi-volatile, and its stability is favored by low temperatures. HNO3 also can react with other particle-phase species, such as sea salt and soil dust, resulting in coarse particle nitrate [e.g., sodium nitrate (NaNO3) from reaction with sea salt]. The chemical composition of particulate matter varies with location, weather, time of year, and time of day. Figure 4-1(a) shows the regional differences in fine particulate matter composition (sulfate, nitrate, elemental carbon, organic carbon, and crustal material) across the United States during the period 2002 to 2006. On average, sulfate is the largest component by mass in the eastern United States, generally from electric utilities and industrial boilers (EPA, 2008a). Organic carbon is the second most dominant component in the East, primarily from highway vehicles, nonroad mobile equipment, waste burning, wildfires, and vegetation. Next is nitrate, with the largest sources being highway vehicles, nonroad mobile equipment, electric utilities, and industrial boilers. Elemental carbon, directly emitted from incomplete combustion processes such as fossil fuel and biomass burning, is a small component of the overall fine particulate matter composition (typically, 5 to 10 percent in U.S. cities). Crustal material, typically from suspended soil and metallurgical operations, is normally a small fraction of fine particulate mass. In the western United States, organic carbon, coming mainly from fireplaces and woodstoves, is on average the largest component of fine particulate matter, with nitrate, sulfate, or crustal material also present as substantial components (EPA, 2008b). Figure 4-1(b) shows the variation in fine particulate matter composition by season for several U.S. cities. The figure shows that sulfate is a major component in the eastern United States in the spring and fall and particularly in the summer. The sulfate component during the winter is

4-3
(a)
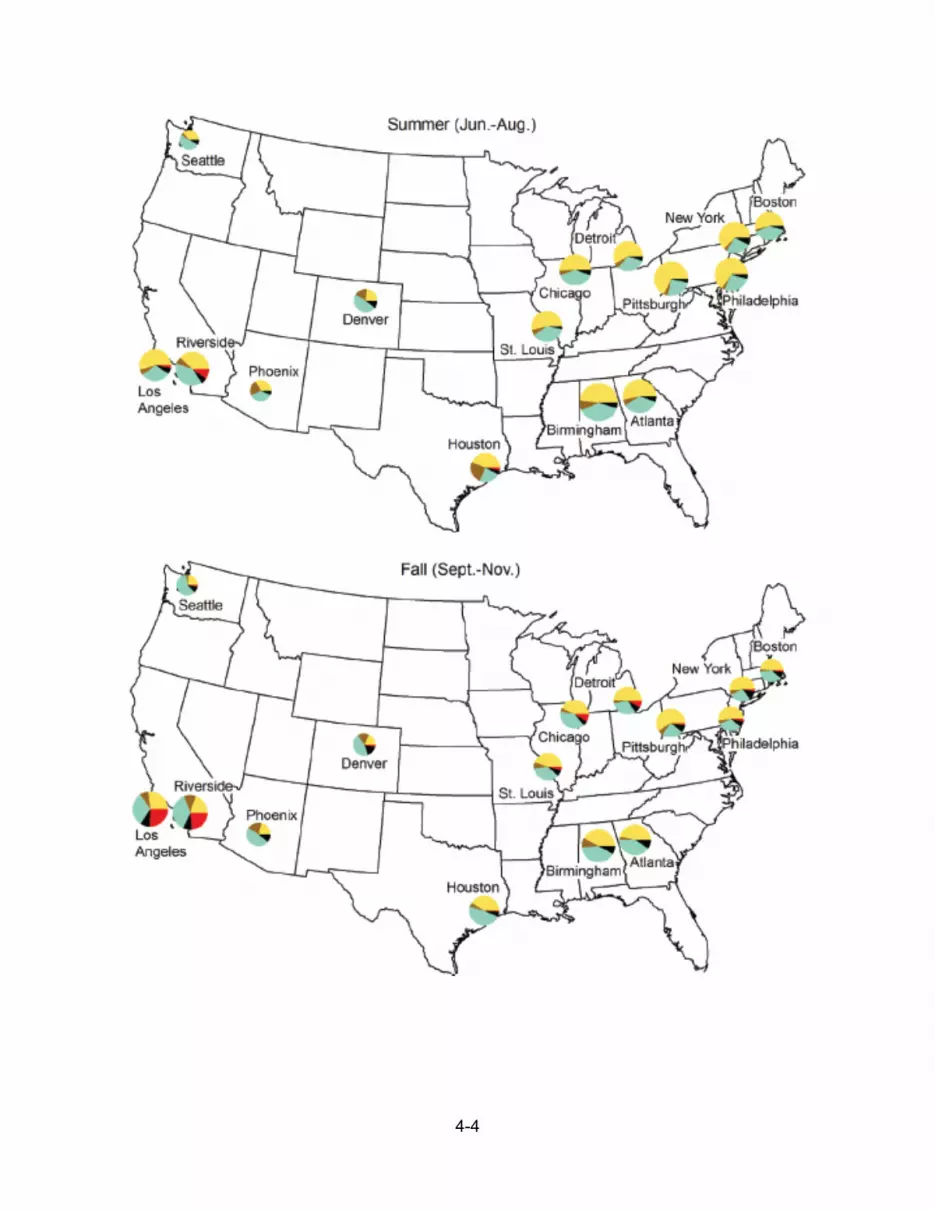
4-4

4-5
(b)
Figure 4-1. (a) Regional Trends in Annual Fine Particulate Matter Composition (μg/m3) During the Period 2002 to 2006 (EPA, 2008a) and (b) Fine Particulate Matter Composition
(μg/m3) by Season for 15 U.S. Cities (EPA, 2010)
offset by larger amounts of nitrate in the Midwest and organic carbon in the Southeast. During spring and fall, the amount of nitrate is lower, particularly in southeastern cities, and is essentially zero during the summer in the eastern United States. In the western United States, organic carbon and elemental carbon are generally the largest components of fine particulate matter in wintertime, followed by nitrate. Nitrate concentration can be higher in the spring and fall. Based on the predominance of sulfate, nitrate, and ammonium ions as soluble species in atmospheric particulate matter, (NH4)2SO4, NH4HSO4, and NH4NO3 were selected as salts to use for the test program, as well as mixtures of (NH4)2SO4 and NH4NO3. The pH of salt solutions and calculated deliquescence relative humidity (DRH) was shown in Table 2-2. The 0.5, 1, and 3 sulfate-to-nitrate (SO4
2−/NO3−) molar ratios were chosen to represent the
geographic, seasonal, and diurnal variation of atmospheric particulate matter salt composition in the United States. For example, Park, et al. (2004) measured mean annual concentrations of (NH4)2SO4 and NH4NO3 in surface air of 0.43 and 0.27 µg/m3, respectively, in the western United States, and 0.38 and 0.37 µg/m3, respectively, in the eastern United States. These correspond to SO4
2−/NO3− molar ratios of 0.96 and 0.62. Hogrefe, et al. (2004) reported average
mass concentrations of sulfate and nitrate in particulate matter in New York City, New York, of 3.9 and 0.8 µg/m3, respectively, in the summer and 3.6 and 2.3 µg/m3, respectively, in the winter. These correspond to SO4
2−/NO3− molar ratios of 3.15 and 1.02. Finally, Ning, et al.
(2007) reported average SO42− and NO3
− concentrations in particulate matter from Los Angeles,

4-6
California, of 0.47 and 0.53 µg/m3, respectively, in the morning and 0.84 and 0.44 µg/m3, respectively, in the afternoon. These correspond to SO4
2−/NO3− molar ratios of 0.57 and 1.23.
4.1.2 Non-Chloride and Chloride Salt Mixtures Literature data indicate that chloride may also be present in the atmosphere in the same locations where the sulfate, nitrate, and ammonium species are found. The majority of inorganic chlorine in the Earth’s troposphere is found as chloride contained in sea salt aerosol generated from ocean–wind and ocean–turf interactions (Knipping and Dabdub, 2003). Recent studies indicate that sea salt aerosol can be transported into the North American interior more than 1,000 km [621 mi] from any ocean water (White, et al., 2010). Another natural source of inorganic chlorine is particulate chloride contained in wind-blown soils from arid regions and hydrochloric acid (HCl) from active volcanoes. Anthropogenic sources of inorganic chlorine include biomass burning, agricultural burning, coal/wood combustions, wildfires, diesel exhaust, and waste incineration (Knipping and Dabdub, 2003; Chang and Allen, 2006; Shapiro, et al., 2007). The principal chlorine-containing byproduct of these activities is HCl or particulate chloride (Reff, et al., 2009). Table 4-1 lists the global sources of tropospheric HCl. HCl can react with NH3 to produce NH4Cl (solid), which can accumulate in atmospheric particulate matter. To define the mole ratios of NO3
−/Cl− and SO42-/Cl-, the measured composition of particulate
matter at five noncoastal sites monitored by the Interagency Monitoring of PROtected Visual Environments (IMPROVE) monitoring network was downloaded from the IMPROVE database (IMPROVE, 2013). The sites were selected to represent geographical diversity within the continental United States and are not intended to correspond to particular ISFSI sites. The arrows in Figure 4-2 show the locations of the five sites selected: (i) Arendtsville, Pennsylvania; (ii) Bondville, Illinois; (iii) Great River Bluffs, Minnesota; (iv) Great Smoky Mountains National Park, Tennessee; and (v) Phoenix, Arizona. Table 4-2 lists the range and median values of the nitrate, sulfate, and chloride concentrations in fine particulates measured at the five sites during the period January 1, 2009, to December 31, 2010. Table 4-3 lists the mole ratios of NO3
− to Cl−, SO42- to Cl−, and SO4
2- to NO3− calculated from the median concentrations given in
Table 4-2. SCC tests were conducted only for a nitrate and chloride salt mixture because of interest in the potential inhibiting effects of nitrate. From the data in Table 4-3, the calculated NO3
−/Cl− mole ratios for the five sites are 2.6, 5.8, 12.1, 12.2, and 21.1. It was thought that a lower NO3
−/Cl− mole ratio would be more likely to cause cracking because of a relatively more abundant quantity of chloride. Therefore, NO3
−/Cl− mole ratios of 3.0 and 6.0 were selected for the SCC tests. Lastly, Class-F fly ash, with its composition shown in Table 2-3, was included in the test program specifically to address the concern for this species raised in Sindelar, et al. (2011). 4.2 Deliquescence and Efflorescence Behavior of Non-Chloride Atmospheric Salts As is the case for chloride salts, SCC initiated by the presence of non-chloride species on a canister surface would require the presence of moisture, which may arise from deliquescence of the deposited species. Figure 2-11(b) showed the DRH as a function of temperature for (from lowest to highest) NH4HSO4, NH4NO3, and (NH4)2SO4, as calculated by OLIAnalyzer. The tests

4-7
Table 4-1. Global Sources of Tropospheric Hydrochloric Acid* Source Amount (Teragram Chloride/Year)
Dechlorination of Sea Salt Aerosols 50 ± 20 Via Acid Displacement 7.6 Coal Combustion 4.6 ± 4.3 Waste Burning 2 ± 1.9 Volcanoes 0.4–11 Biomass Burning <6 Transport From the Stratosphere 0.3 Chlorocarbon Oxidation ~4.2 *Sanhueza, E. “Hydrochloric Acid From Chlorocarbons: A Significant Global Source of Background Rain Acidity.” Tellus B. Vol. 53. pp. 122–132. 2001.
Figure 4-2. Locations of Monitoring Sites in the IMPROVE Network
(IMPROVE, 2013). Arrows Show the Sites Selected for Determining Stress Corrosion Cracking Test Matrix Composition: (i) Arendtsville, Pennsylvania;
(ii) Bondville, Illinois; (iii) Great River Bluffs, Minnesota; (iv) Great Smoky Mountains National Park, Tennessee; and (v) Phoenix, Arizona.

4-8
Table 4-2. Nitrate, Sulfate, and Chloride Concentration in Fine Particulate Matter Collected at Five IMPROVE Monitoring Sites for the Period January 1, 2009, to
December 31, 2010*
Site Location
NO3− Concentration
Median and Range (µg/m3)
SO42− Concentration
Median and Range (µg/m3)
Cl− Concentration Median and Range
(µg/m3) Arendtsville, Pennsylvania 0.5349
(0.0529 to 8.300) 2.2702
(0.366 - 15.2673) 0.0253
(0.0002 to 0.3252) Bondville, Illinois 1.1627
(0.0662 to 8.9192) 2.0517
(0.4084 to 9.0997) 0.0315
(0.0006 to 0.2855) Great River Bluffs, Minnesota 0.4869
(0.0145 to 16.106) 1.1351
(0.1649 to 8.3342) 0.0229
(0.0001 to 0.6104) Great Smoky Mountains National Park, Tennessee
0.1482 (0.0382 to 4.5818)
2.0497 (0.1252 to 7.0209)
0.0145 (0.0007 to 0.1657)
Phoenix, Arizona 0.3837 (0.0638 to 5.9663)
0.7779 (0.1761 to 8.3342)
0.0841 (0.0028 to 1.0963)
*IMPROVE. “Metadata Browser.” Fort Collins, Colorado: Interagency Monitoring of Protected Visual Environments. 2013. <http://vista.cira.colostate.edu/improve/Web/MetadataBrowser/metadatabrowser.aspx> (January 10, 2013). Negative values in the database were excluded.
Table 4-3. Mole Ratio of Nitrate to Chloride and Sulfate to Chloride in Fine Particulate
Matter Collected at Five IMPROVE Monitoring Sites*
Site Location NO3
−/Cl− Mole Ratio
SO42−/Cl−
Mole Ratio SO4
2−/NO3−
Mole Ratio Arendtsville, Pennsylvania 12.1 33.1 2.7 Bondville, Illinois 21.1 24.0 1.1 Great River Bluffs, Minnesota 12.2 18.3 1.5 Great Smoky Mountains National Park, Tennessee 5.8 52.2 8.9 Phoenix, Arizona 2.6 3.4 1.3 *Based on median NO3
−, SO42−, and Cl− aerosol concentration listed in Table 4-2.
IMPROVE. “Metadata Browser.” Fort Collins, Colorado: Interagency Monitoring of Protected Visual Environments. 2013. <http://vista.cira.colostate.edu/improve/Web/MetadataBrowser/metadatabrowser.aspx> (January 10, 2013).
described in this section were undertaken to confirm the calculated values and to determine conditions for SCC tests using the following relative humidity (RH) ranges and temperatures: • 30–84 percent RH at 35 °C [95 °F] • 10–59 percent RH at 45 °C [113 °F] • 10–60 percent RH at 60 °C [140 °F] The deliquescence test matrix was shown in Table 2-10. In the tests, single salts (NH4)2SO4, NH4HSO4, and NH4NO3 and mixtures of (NH4)2SO4 and NH4NO3, with SO4
2−/NO3− mole ratios of
0.5, 1.0, and 3.0, were included in both conductivity cells and beakers. Fly ash was included only in the conductivity cell test. The results are described in the following sections. 4.2.1 Tests at 35 °C [95 °F] Figure 4-3 shows the impedance versus RH plots for (NH4)2SO4, NH4HSO4, and NH4NO3; the mixtures of (NH4)2SO4 and NH4NO3; and fly ash. The deliquescence curve was generated by progressively increasing the RH, and the efflorescence curve was generated by then progressively decreasing the RH back to the starting point. The DRH and efflorescence relative
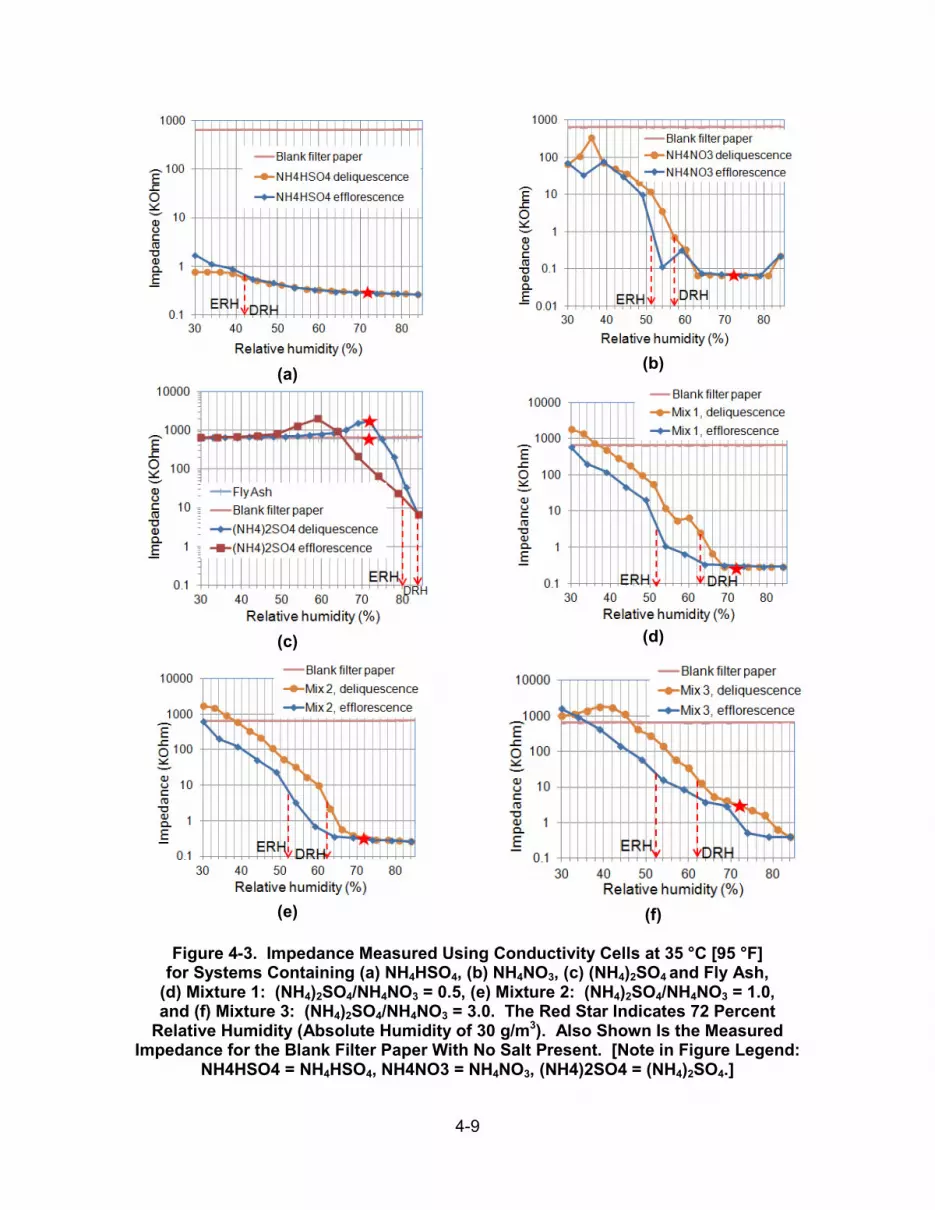
4-9
(a)
(b)
(c)
(d)
(e)
(f)
Figure 4-3. Impedance Measured Using Conductivity Cells at 35 °C [95 °F]
for Systems Containing (a) NH4HSO4, (b) NH4NO3, (c) (NH4)2SO4 and Fly Ash, (d) Mixture 1: (NH4)2SO4/NH4NO3 = 0.5, (e) Mixture 2: (NH4)2SO4/NH4NO3 = 1.0, and (f) Mixture 3: (NH4)2SO4/NH4NO3 = 3.0. The Red Star Indicates 72 Percent
Relative Humidity (Absolute Humidity of 30 g/m3). Also Shown Is the Measured Impedance for the Blank Filter Paper With No Salt Present. [Note in Figure Legend:
NH4HSO4 = NH4HSO4, NH4NO3 = NH4NO3, (NH4)2SO4 = (NH4)2SO4.]
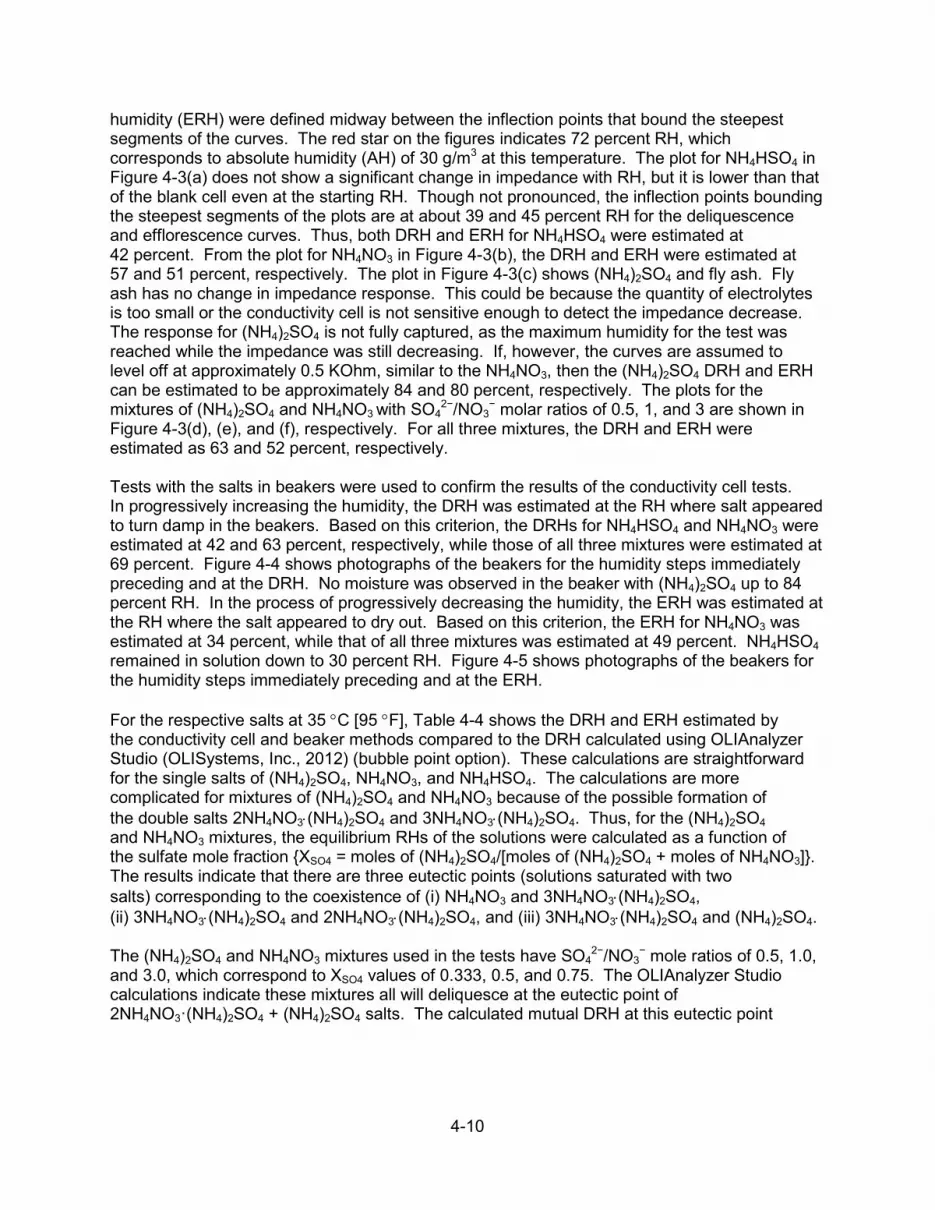
4-10
humidity (ERH) were defined midway between the inflection points that bound the steepest segments of the curves. The red star on the figures indicates 72 percent RH, which corresponds to absolute humidity (AH) of 30 g/m3 at this temperature. The plot for NH4HSO4 in Figure 4-3(a) does not show a significant change in impedance with RH, but it is lower than that of the blank cell even at the starting RH. Though not pronounced, the inflection points bounding the steepest segments of the plots are at about 39 and 45 percent RH for the deliquescence and efflorescence curves. Thus, both DRH and ERH for NH4HSO4 were estimated at 42 percent. From the plot for NH4NO3 in Figure 4-3(b), the DRH and ERH were estimated at 57 and 51 percent, respectively. The plot in Figure 4-3(c) shows (NH4)2SO4 and fly ash. Fly ash has no change in impedance response. This could be because the quantity of electrolytes is too small or the conductivity cell is not sensitive enough to detect the impedance decrease. The response for (NH4)2SO4 is not fully captured, as the maximum humidity for the test was reached while the impedance was still decreasing. If, however, the curves are assumed to level off at approximately 0.5 KOhm, similar to the NH4NO3, then the (NH4)2SO4 DRH and ERH can be estimated to be approximately 84 and 80 percent, respectively. The plots for the mixtures of (NH4)2SO4 and NH4NO3 with SO4
2−/NO3− molar ratios of 0.5, 1, and 3 are shown in
Figure 4-3(d), (e), and (f), respectively. For all three mixtures, the DRH and ERH were estimated as 63 and 52 percent, respectively. Tests with the salts in beakers were used to confirm the results of the conductivity cell tests. In progressively increasing the humidity, the DRH was estimated at the RH where salt appeared to turn damp in the beakers. Based on this criterion, the DRHs for NH4HSO4 and NH4NO3 were estimated at 42 and 63 percent, respectively, while those of all three mixtures were estimated at 69 percent. Figure 4-4 shows photographs of the beakers for the humidity steps immediately preceding and at the DRH. No moisture was observed in the beaker with (NH4)2SO4 up to 84 percent RH. In the process of progressively decreasing the humidity, the ERH was estimated at the RH where the salt appeared to dry out. Based on this criterion, the ERH for NH4NO3 was estimated at 34 percent, while that of all three mixtures was estimated at 49 percent. NH4HSO4 remained in solution down to 30 percent RH. Figure 4-5 shows photographs of the beakers for the humidity steps immediately preceding and at the ERH. For the respective salts at 35 °C [95 °F], Table 4-4 shows the DRH and ERH estimated by the conductivity cell and beaker methods compared to the DRH calculated using OLIAnalyzer Studio (OLISystems, Inc., 2012) (bubble point option). These calculations are straightforward for the single salts of (NH4)2SO4, NH4NO3, and NH4HSO4. The calculations are more complicated for mixtures of (NH4)2SO4 and NH4NO3 because of the possible formation of the double salts 2NH4NO3⋅(NH4)2SO4 and 3NH4NO3⋅(NH4)2SO4. Thus, for the (NH4)2SO4 and NH4NO3 mixtures, the equilibrium RHs of the solutions were calculated as a function of the sulfate mole fraction {XSO4 = moles of (NH4)2SO4/[moles of (NH4)2SO4 + moles of NH4NO3]}. The results indicate that there are three eutectic points (solutions saturated with two salts) corresponding to the coexistence of (i) NH4NO3 and 3NH4NO3⋅(NH4)2SO4, (ii) 3NH4NO3⋅(NH4)2SO4 and 2NH4NO3⋅(NH4)2SO4, and (iii) 3NH4NO3⋅(NH4)2SO4 and (NH4)2SO4. The (NH4)2SO4 and NH4NO3 mixtures used in the tests have SO4
2−/NO3− mole ratios of 0.5, 1.0,
and 3.0, which correspond to XSO4 values of 0.333, 0.5, and 0.75. The OLIAnalyzer Studio calculations indicate these mixtures all will deliquesce at the eutectic point of 2NH4NO3·(NH4)2SO4 + (NH4)2SO4 salts. The calculated mutual DRH at this eutectic point

4-11
39 Percent RH
42 Percent RH
60 Percent RH 63 Percent RH
(a)
(b)
66 Percent RH
69 Percent RH
(c)
Figure 4-4. Observation From Beakers at 35 °C [95 °F] for Deliquescence Tests at Increasing Relative Humidity: (a) NH4HSO4, (b) NH4NO3, and
(c) Mixture 1: (NH4)2SO4/NH4NO3 = 0.5, Mixture 2: (NH4)2SO4/NH4NO3 = 1.0, and Mixture 3: (NH4)2SO4/NH4NO3 = 3.0
39 Percent RH
34 Percent RH
(a)
54 Percent RH
49 Percent RH
(b)
Figure 4-5. Observation From Beakers at 35 °C [95 °F] for Efflorescence Tests at Decreasing Relative Humidity: (a) NH4NO3 and (b) Mixture 1: (NH4)2SO4/NH4NO3 = 0.5,
Mixture 2: (NH4)2SO4/NH4NO3 = 1.0, and Mixture 3: (NH4)2SO4/NH4NO3 = 3.0
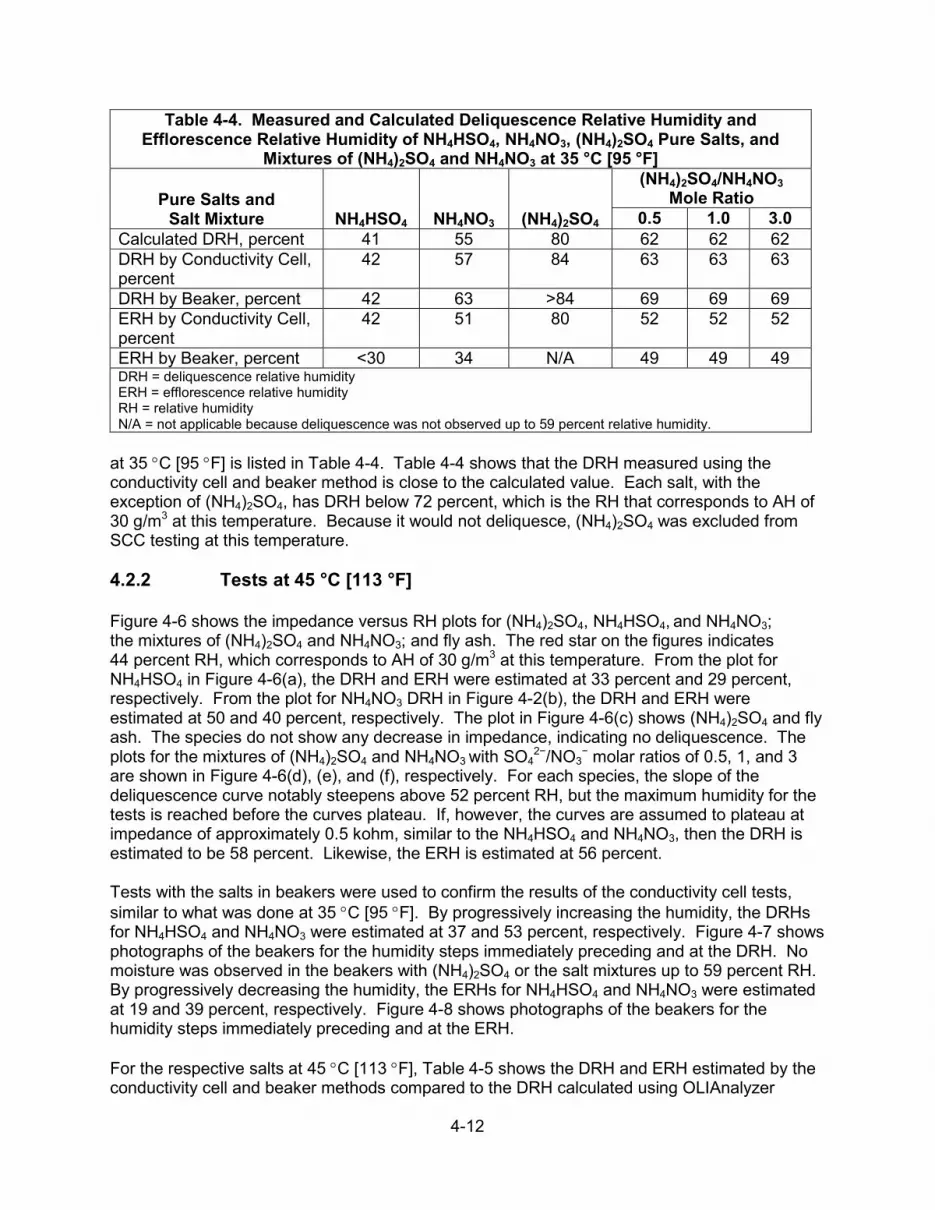
4-12
Table 4-4. Measured and Calculated Deliquescence Relative Humidity and Efflorescence Relative Humidity of NH4HSO4, NH4NO3, (NH4)2SO4 Pure Salts, and
Mixtures of (NH4)2SO4 and NH4NO3 at 35 °C [95 °F]
Pure Salts and Salt Mixture NH4HSO4 NH4NO3 (NH4)2SO4
(NH4)2SO4/NH4NO3 Mole Ratio
0.5 1.0 3.0 Calculated DRH, percent 41 55 80 62 62 62 DRH by Conductivity Cell, percent
42 57 84 63 63 63
DRH by Beaker, percent 42 63 >84 69 69 69 ERH by Conductivity Cell, percent
42 51 80 52 52 52
ERH by Beaker, percent <30 34 N/A 49 49 49 DRH = deliquescence relative humidity ERH = efflorescence relative humidity RH = relative humidity N/A = not applicable because deliquescence was not observed up to 59 percent relative humidity.
at 35 °C [95 °F] is listed in Table 4-4. Table 4-4 shows that the DRH measured using the conductivity cell and beaker method is close to the calculated value. Each salt, with the exception of (NH4)2SO4, has DRH below 72 percent, which is the RH that corresponds to AH of 30 g/m3 at this temperature. Because it would not deliquesce, (NH4)2SO4 was excluded from SCC testing at this temperature. 4.2.2 Tests at 45 °C [113 °F] Figure 4-6 shows the impedance versus RH plots for (NH4)2SO4, NH4HSO4, and NH4NO3; the mixtures of (NH4)2SO4 and NH4NO3; and fly ash. The red star on the figures indicates 44 percent RH, which corresponds to AH of 30 g/m3 at this temperature. From the plot for NH4HSO4 in Figure 4-6(a), the DRH and ERH were estimated at 33 percent and 29 percent, respectively. From the plot for NH4NO3 DRH in Figure 4-2(b), the DRH and ERH were estimated at 50 and 40 percent, respectively. The plot in Figure 4-6(c) shows (NH4)2SO4 and fly ash. The species do not show any decrease in impedance, indicating no deliquescence. The plots for the mixtures of (NH4)2SO4 and NH4NO3 with SO4
2−/NO3− molar ratios of 0.5, 1, and 3
are shown in Figure 4-6(d), (e), and (f), respectively. For each species, the slope of the deliquescence curve notably steepens above 52 percent RH, but the maximum humidity for the tests is reached before the curves plateau. If, however, the curves are assumed to plateau at impedance of approximately 0.5 kohm, similar to the NH4HSO4 and NH4NO3, then the DRH is estimated to be 58 percent. Likewise, the ERH is estimated at 56 percent. Tests with the salts in beakers were used to confirm the results of the conductivity cell tests, similar to what was done at 35 °C [95 °F]. By progressively increasing the humidity, the DRHs for NH4HSO4 and NH4NO3 were estimated at 37 and 53 percent, respectively. Figure 4-7 shows photographs of the beakers for the humidity steps immediately preceding and at the DRH. No moisture was observed in the beakers with (NH4)2SO4 or the salt mixtures up to 59 percent RH. By progressively decreasing the humidity, the ERHs for NH4HSO4 and NH4NO3 were estimated at 19 and 39 percent, respectively. Figure 4-8 shows photographs of the beakers for the humidity steps immediately preceding and at the ERH. For the respective salts at 45 °C [113 °F], Table 4-5 shows the DRH and ERH estimated by the conductivity cell and beaker methods compared to the DRH calculated using OLIAnalyzer

4-13
(a)
(b)
(c)
(d)
(e)
(f)
Figure 4-6. Impedance Measured Using Conductivity Cells at 45 °C [113 °F] for Systems Containing (a) NH4HSO4, (b) NH4NO3, (c) (NH4)2SO4 and Fly Ash,
(d) Mixture 1: (NH4)2SO4/NH4NO3 = 0.5, (e) Mixture 2: (NH4)2SO4/NH4NO3 = 1.0, and (f) Mixture 3: (NH4)2SO4/NH4NO3 = 3.0. The Red Star Indicates 44 Percent Relative
Humidity (Absolute Humidity of 30 g/m3). [Note in Figure Legend: NH4HSO4 = NH4HSO4, NH4NO3 = NH4NO3, and (NH4)2SO4 = (NH4)2SO4.]
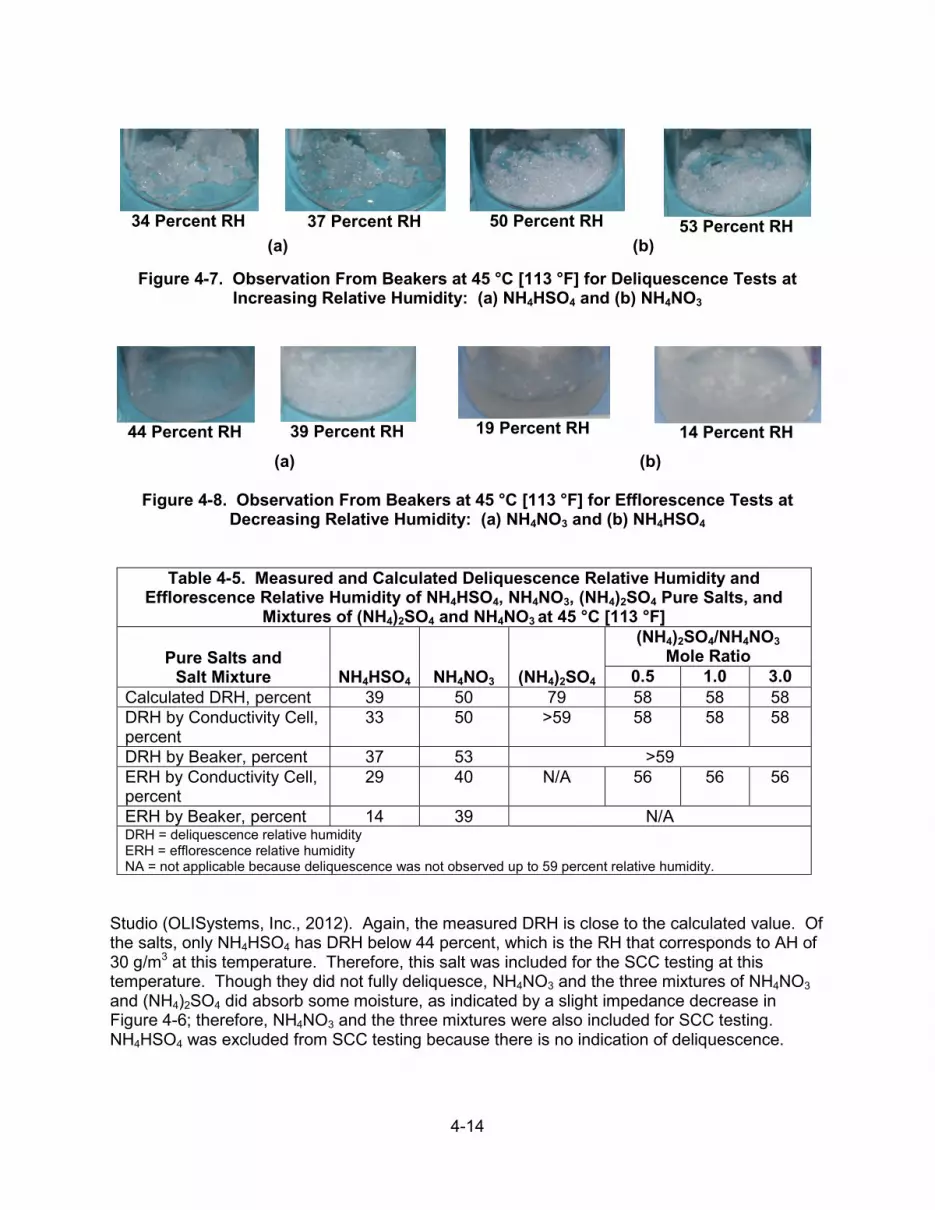
4-14
34 Percent RH
37 Percent RH
50 Percent RH
53 Percent RH (a) (b)
Figure 4-7. Observation From Beakers at 45 °C [113 °F] for Deliquescence Tests at Increasing Relative Humidity: (a) NH4HSO4 and (b) NH4NO3
44 Percent RH
39 Percent RH
19 Percent RH
14 Percent RH (a) (b)
Figure 4-8. Observation From Beakers at 45 °C [113 °F] for Efflorescence Tests at
Decreasing Relative Humidity: (a) NH4NO3 and (b) NH4HSO4
Table 4-5. Measured and Calculated Deliquescence Relative Humidity and Efflorescence Relative Humidity of NH4HSO4, NH4NO3, (NH4)2SO4 Pure Salts, and
Mixtures of (NH4)2SO4 and NH4NO3 at 45 °C [113 °F]
Pure Salts and Salt Mixture NH4HSO4 NH4NO3 (NH4)2SO4
(NH4)2SO4/NH4NO3 Mole Ratio
0.5 1.0 3.0 Calculated DRH, percent 39 50 79 58 58 58 DRH by Conductivity Cell, percent
33 50 >59 58 58 58
DRH by Beaker, percent 37 53 >59 ERH by Conductivity Cell, percent
29 40 N/A 56 56 56
ERH by Beaker, percent 14 39 N/A DRH = deliquescence relative humidity ERH = efflorescence relative humidity NA = not applicable because deliquescence was not observed up to 59 percent relative humidity.
Studio (OLISystems, Inc., 2012). Again, the measured DRH is close to the calculated value. Of the salts, only NH4HSO4 has DRH below 44 percent, which is the RH that corresponds to AH of 30 g/m3 at this temperature. Therefore, this salt was included for the SCC testing at this temperature. Though they did not fully deliquesce, NH4NO3 and the three mixtures of NH4NO3 and (NH4)2SO4 did absorb some moisture, as indicated by a slight impedance decrease in Figure 4-6; therefore, NH4NO3 and the three mixtures were also included for SCC testing. NH4HSO4 was excluded from SCC testing because there is no indication of deliquescence.

4-15
4.2.3 Tests at 60 °C [140 °F] Figure 4-9 shows the impedance versus RH plots for (NH4)2SO4, NH4HSO4, and NH4NO3; the mixtures of (NH4)2SO4 and NH4NO3; and fly ash. The red star on the figures indicates 22 percent RH, which corresponds to AH of 30 g/m3 at this temperature. From the plot for NH4HSO4 in Figure 4-9(a), the DRH and ERH were estimated at 33 and 28 percent, respectively. From the plot for NH4NO3 DRH in Figure 4-9(b), the DRH and ERH were estimated at 40 and 34 percent, respectively. The plot in Figure 4-9(c) shows (NH4)2SO4 and fly ash. The species do not show any decrease in impedance, indicating no deliquescence. The plots for the mixtures of (NH4)2SO4 and NH4NO3 with SO4
2−/NO3− molar ratios of 0.5, 1,
and 3 are shown in Figure 4-9(d), (e), and (f), respectively. The DRH and ERH for each mixture were estimated at 48 and 42 percent, respectively. Tests with the salts in beakers were used to confirm the results of the conductivity cell tests, similar to what was done at the lower temperatures. By progressively increasing the humidity, the DRHs for NH4HSO4 and NH4NO3 were estimated at 30 and 45 percent, respectively, while those of the three mixtures were estimated at 50 percent. Figure 4-10 shows photographs of the beakers for the humidity steps immediately preceding and at the DRH. No moisture was observed in the beaker with (NH4)2SO4 or the salt mixtures up to 59 percent RH. By progressively decreasing the humidity, the ERHs for NH4HSO4 and NH4NO3 were estimated at 15 and 30 percent, respectively, while those of the three mixtures were estimated at 40 percent. Figure 4-11 shows photographs of the beakers for the humidity steps immediately preceding and at the ERH. For the respective salts at 60 °C [140 °F], Table 4-6 shows the DRH and ERH estimated by the conductivity cell and beaker methods compared to the DRH calculated using OLIAnalyzer Studio (OLISystems, Inc., 2012). Again, the measured DRH is close to the calculated value. The DRH for all the salts is above 22 percent, which is the RH that corresponds to AH of 30 g/m3 at this temperature. Because limited deliquescence would be expected, no SCC tests were performed at this temperature. 4.3 Stress Corrosion Cracking Tests in Non-Chloride Atmospheric Salts Based on the results described in the previous section, some of the non-chloride species selected for this study could deliquesce at 35 and 45 °C [95 and 113 °F] at AH less than 30 g/m3. To investigate whether these species could cause SCC of austenitic stainless, tests were performed in which U-bend specimens were deposited with the salts and exposed in environmental chambers, similar to the tests performed using sea salt. The methodology for depositing the species was described in Section 2.4.2, where heated U-bend specimens were sprayed with salt mixture solutions that were then allowed to evaporate. The process was repeated several times to accumulate an estimated salt quantity in the range of 66 to 223 g/m2. The condition selected for the tests was 45 °C [113 °F] and static AH of 30 g/m3, which corresponds to RH of 44 percent at this temperature. The RH was thought to be sufficiently high to cause deliquescence of the deposited species, but not so high that salt would drain off of the specimens. The test matrix is shown in Table 4-7. Note that fly ash is included for the tests to address the concern raised in Sindelar, et al. (2011). For testing with fly ash, U-bend specimens were embedded rather than deposited because the species could not be maintained on the surface by solution spray. The tests used triplicate as-received and sensitized U-bend specimens, whereas only duplicate welded specimens were used because of limited availability.
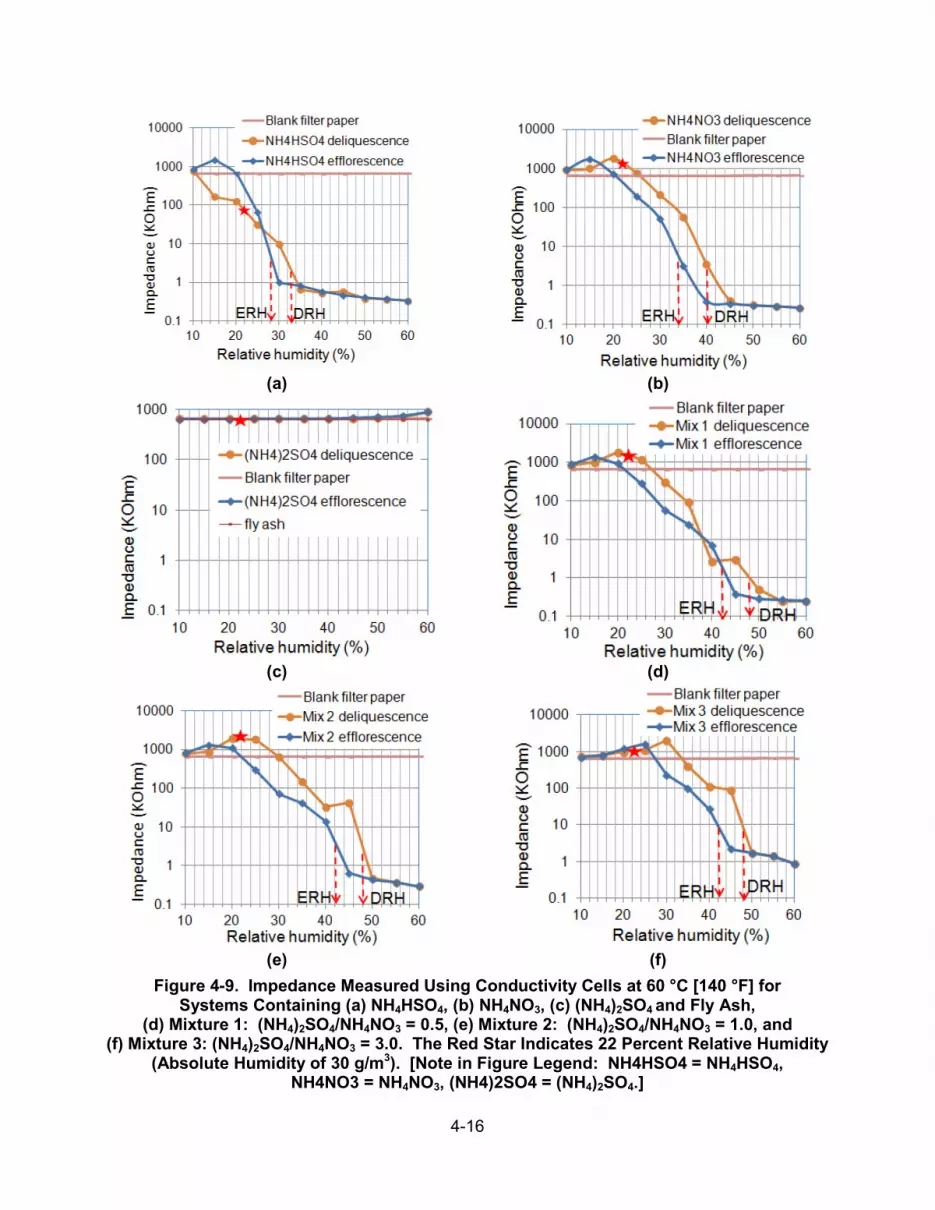
4-16
(a)
(b)
(c)
(d)
(e)
(f)
Figure 4-9. Impedance Measured Using Conductivity Cells at 60 °C [140 °F] for Systems Containing (a) NH4HSO4, (b) NH4NO3, (c) (NH4)2SO4 and Fly Ash,
(d) Mixture 1: (NH4)2SO4/NH4NO3 = 0.5, (e) Mixture 2: (NH4)2SO4/NH4NO3 = 1.0, and (f) Mixture 3: (NH4)2SO4/NH4NO3 = 3.0. The Red Star Indicates 22 Percent Relative Humidity
(Absolute Humidity of 30 g/m3). [Note in Figure Legend: NH4HSO4 = NH4HSO4, NH4NO3 = NH4NO3, (NH4)2SO4 = (NH4)2SO4.]

4-17
25 Percent RH
30 Percent RH
35 Percent RH
40 Percent RH (a) (b)
45 Percent RH
50 Percent RH
(c)
Figure 4-10. Observation From Beakers at 60 °C [140 °F] for Deliquescence Tests at Increasing Relative Humidity: (a) NH4HSO4, (b) NH4NO3, and
(c) Three (NH4)2SO4 and NH4NO3 Mixtures
20 Percent RH
15 Percent RH
35 Percent RH
30 Percent RH (a) (b)
45 Percent RH
40 Percent RH
(c)
Figure 4-11. Observation From Beakers at 60 °C [140 °F] for Efflorescence Tests at Decreasing Relative Humidity: (a) NH4HSO4, (b) NH4NO3, and
(c) Three (NH4)2SO4 and NH4NO3 Mixtures
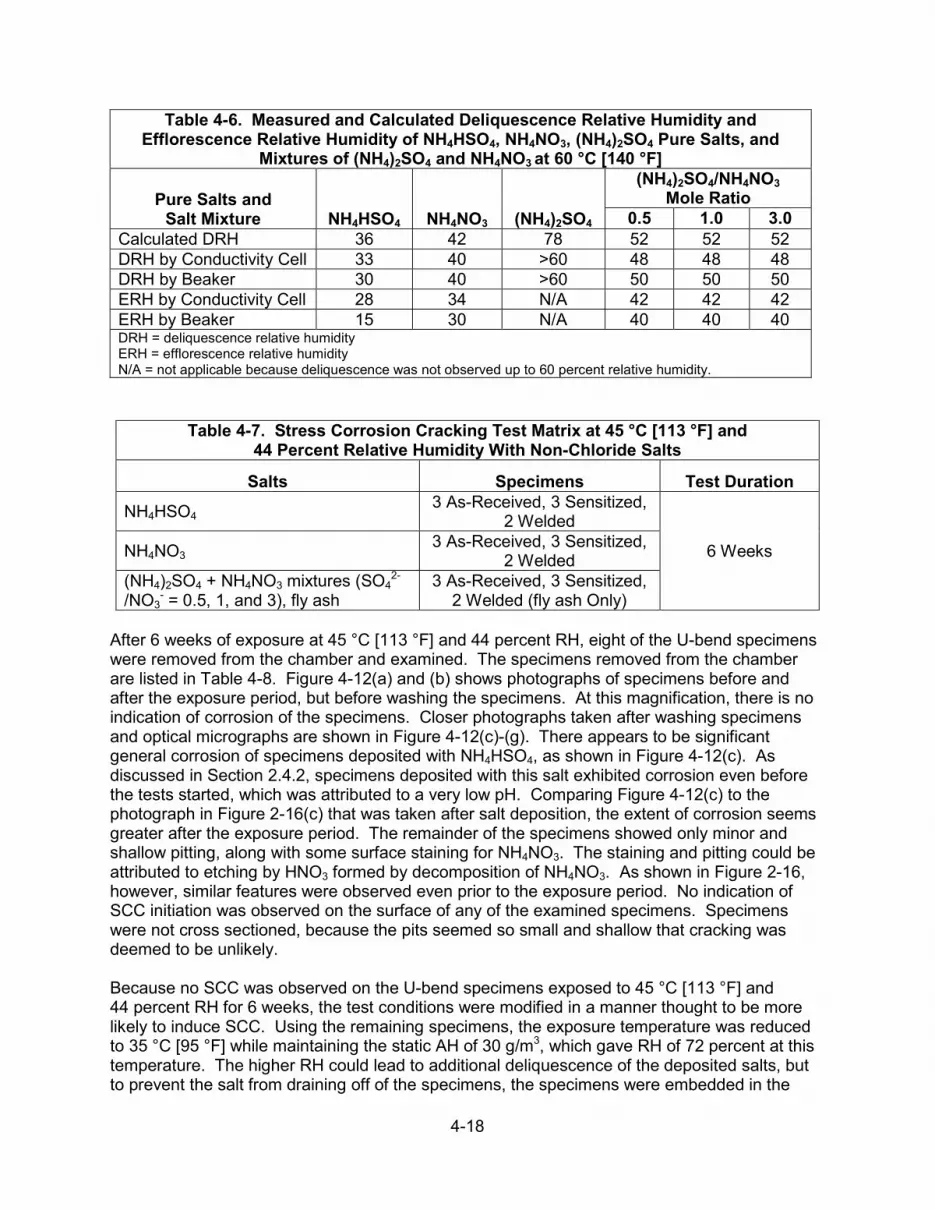
4-18
Table 4-6. Measured and Calculated Deliquescence Relative Humidity and Efflorescence Relative Humidity of NH4HSO4, NH4NO3, (NH4)2SO4 Pure Salts, and
Mixtures of (NH4)2SO4 and NH4NO3 at 60 °C [140 °F]
Pure Salts and Salt Mixture NH4HSO4 NH4NO3 (NH4)2SO4
(NH4)2SO4/NH4NO3 Mole Ratio
0.5 1.0 3.0 Calculated DRH 36 42 78 52 52 52 DRH by Conductivity Cell 33 40 >60 48 48 48 DRH by Beaker 30 40 >60 50 50 50 ERH by Conductivity Cell 28 34 N/A 42 42 42 ERH by Beaker 15 30 N/A 40 40 40 DRH = deliquescence relative humidity ERH = efflorescence relative humidity N/A = not applicable because deliquescence was not observed up to 60 percent relative humidity.
Table 4-7. Stress Corrosion Cracking Test Matrix at 45 °C [113 °F] and 44 Percent Relative Humidity With Non-Chloride Salts
Salts Specimens Test Duration
NH4HSO4 3 As-Received, 3 Sensitized,
2 Welded
6 Weeks NH4NO3 3 As-Received, 3 Sensitized,
2 Welded (NH4)2SO4 + NH4NO3 mixtures (SO4
2-
/NO3- = 0.5, 1, and 3), fly ash
3 As-Received, 3 Sensitized, 2 Welded (fly ash Only)
After 6 weeks of exposure at 45 °C [113 °F] and 44 percent RH, eight of the U-bend specimens were removed from the chamber and examined. The specimens removed from the chamber are listed in Table 4-8. Figure 4-12(a) and (b) shows photographs of specimens before and after the exposure period, but before washing the specimens. At this magnification, there is no indication of corrosion of the specimens. Closer photographs taken after washing specimens and optical micrographs are shown in Figure 4-12(c)-(g). There appears to be significant general corrosion of specimens deposited with NH4HSO4, as shown in Figure 4-12(c). As discussed in Section 2.4.2, specimens deposited with this salt exhibited corrosion even before the tests started, which was attributed to a very low pH. Comparing Figure 4-12(c) to the photograph in Figure 2-16(c) that was taken after salt deposition, the extent of corrosion seems greater after the exposure period. The remainder of the specimens showed only minor and shallow pitting, along with some surface staining for NH4NO3. The staining and pitting could be attributed to etching by HNO3 formed by decomposition of NH4NO3. As shown in Figure 2-16, however, similar features were observed even prior to the exposure period. No indication of SCC initiation was observed on the surface of any of the examined specimens. Specimens were not cross sectioned, because the pits seemed so small and shallow that cracking was deemed to be unlikely. Because no SCC was observed on the U-bend specimens exposed to 45 °C [113 °F] and 44 percent RH for 6 weeks, the test conditions were modified in a manner thought to be more likely to induce SCC. Using the remaining specimens, the exposure temperature was reduced to 35 °C [95 °F] while maintaining the static AH of 30 g/m3, which gave RH of 72 percent at this temperature. The higher RH could lead to additional deliquescence of the deposited salts, but to prevent the salt from draining off of the specimens, the specimens were embedded in the
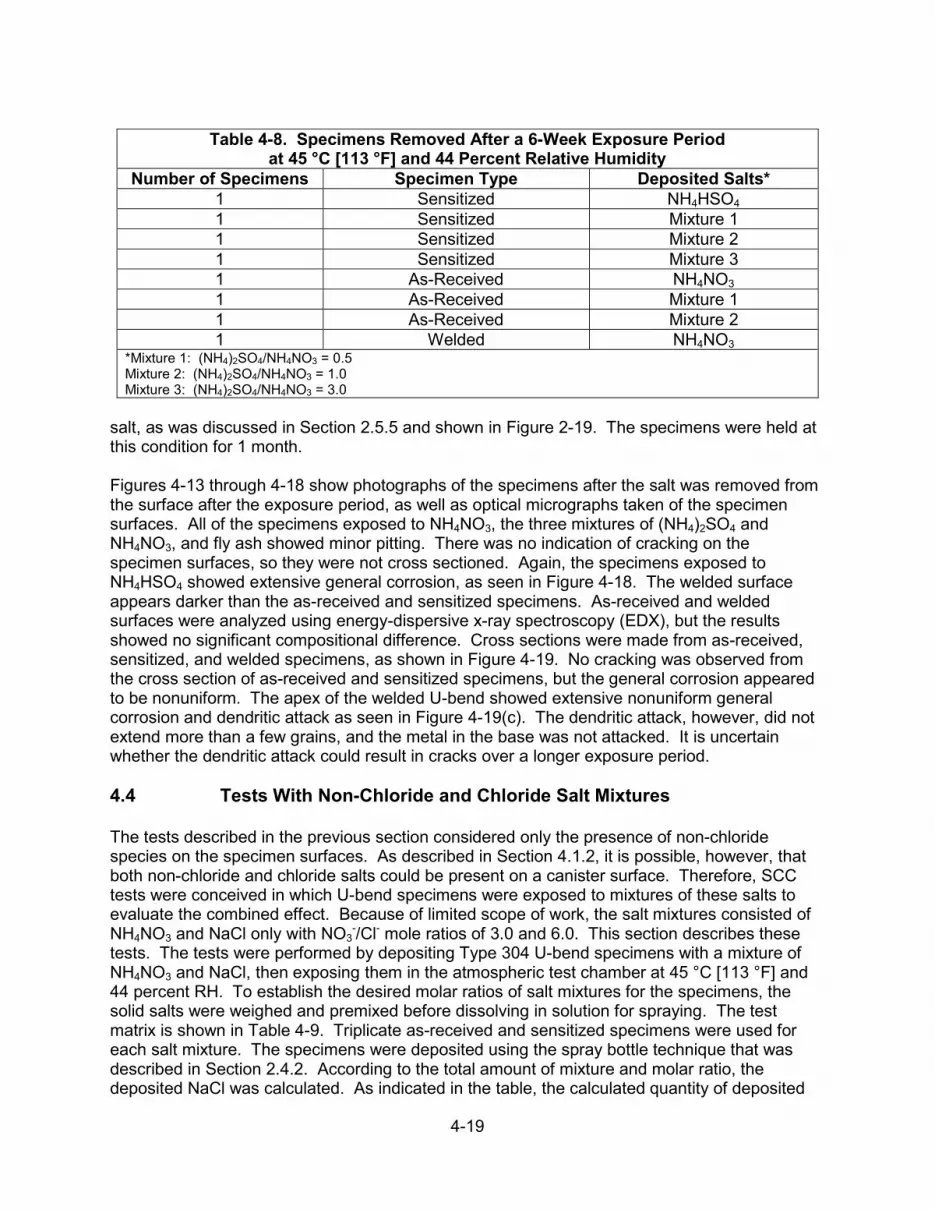
4-19
Table 4-8. Specimens Removed After a 6-Week Exposure Period
at 45 °C [113 °F] and 44 Percent Relative Humidity Number of Specimens Specimen Type Deposited Salts*
1 Sensitized NH4HSO4
1 Sensitized Mixture 1 1 Sensitized Mixture 2 1 Sensitized Mixture 3 1 As-Received NH4NO3 1 As-Received Mixture 1 1 As-Received Mixture 2 1 Welded NH4NO3
*Mixture 1: (NH4)2SO4/NH4NO3 = 0.5 Mixture 2: (NH4)2SO4/NH4NO3 = 1.0 Mixture 3: (NH4)2SO4/NH4NO3 = 3.0
salt, as was discussed in Section 2.5.5 and shown in Figure 2-19. The specimens were held at this condition for 1 month. Figures 4-13 through 4-18 show photographs of the specimens after the salt was removed from the surface after the exposure period, as well as optical micrographs taken of the specimen surfaces. All of the specimens exposed to NH4NO3, the three mixtures of (NH4)2SO4 and NH4NO3, and fly ash showed minor pitting. There was no indication of cracking on the specimen surfaces, so they were not cross sectioned. Again, the specimens exposed to NH4HSO4 showed extensive general corrosion, as seen in Figure 4-18. The welded surface appears darker than the as-received and sensitized specimens. As-received and welded surfaces were analyzed using energy-dispersive x-ray spectroscopy (EDX), but the results showed no significant compositional difference. Cross sections were made from as-received, sensitized, and welded specimens, as shown in Figure 4-19. No cracking was observed from the cross section of as-received and sensitized specimens, but the general corrosion appeared to be nonuniform. The apex of the welded U-bend showed extensive nonuniform general corrosion and dendritic attack as seen in Figure 4-19(c). The dendritic attack, however, did not extend more than a few grains, and the metal in the base was not attacked. It is uncertain whether the dendritic attack could result in cracks over a longer exposure period. 4.4 Tests With Non-Chloride and Chloride Salt Mixtures The tests described in the previous section considered only the presence of non-chloride species on the specimen surfaces. As described in Section 4.1.2, it is possible, however, that both non-chloride and chloride salts could be present on a canister surface. Therefore, SCC tests were conceived in which U-bend specimens were exposed to mixtures of these salts to evaluate the combined effect. Because of limited scope of work, the salt mixtures consisted of NH4NO3 and NaCl only with NO3
-/Cl- mole ratios of 3.0 and 6.0. This section describes these tests. The tests were performed by depositing Type 304 U-bend specimens with a mixture of NH4NO3 and NaCl, then exposing them in the atmospheric test chamber at 45 °C [113 °F] and 44 percent RH. To establish the desired molar ratios of salt mixtures for the specimens, the solid salts were weighed and premixed before dissolving in solution for spraying. The test matrix is shown in Table 4-9. Triplicate as-received and sensitized specimens were used for each salt mixture. The specimens were deposited using the spray bottle technique that was described in Section 2.4.2. According to the total amount of mixture and molar ratio, the deposited NaCl was calculated. As indicated in the table, the calculated quantity of deposited
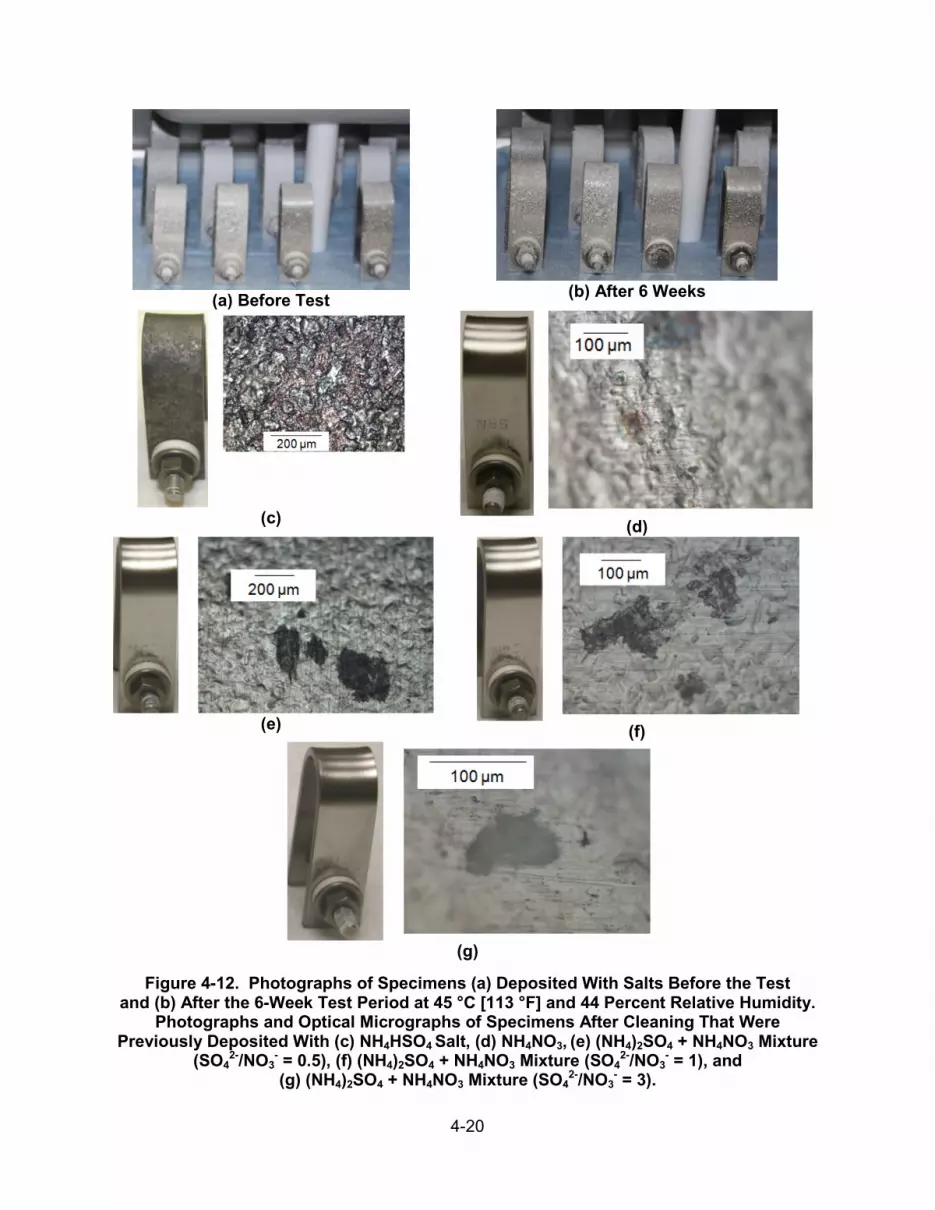
4-20
(a) Before Test
(b) After 6 Weeks
(c)
(d)
(e)
(f)
(g)
Figure 4-12. Photographs of Specimens (a) Deposited With Salts Before the Test and (b) After the 6-Week Test Period at 45 °C [113 °F] and 44 Percent Relative Humidity.
Photographs and Optical Micrographs of Specimens After Cleaning That Were Previously Deposited With (c) NH4HSO4 Salt, (d) NH4NO3, (e) (NH4)2SO4 + NH4NO3 Mixture
(SO42-/NO3
- = 0.5), (f) (NH4)2SO4 + NH4NO3 Mixture (SO42-/NO3
- = 1), and (g) (NH4)2SO4 + NH4NO3 Mixture (SO4
2-/NO3- = 3).
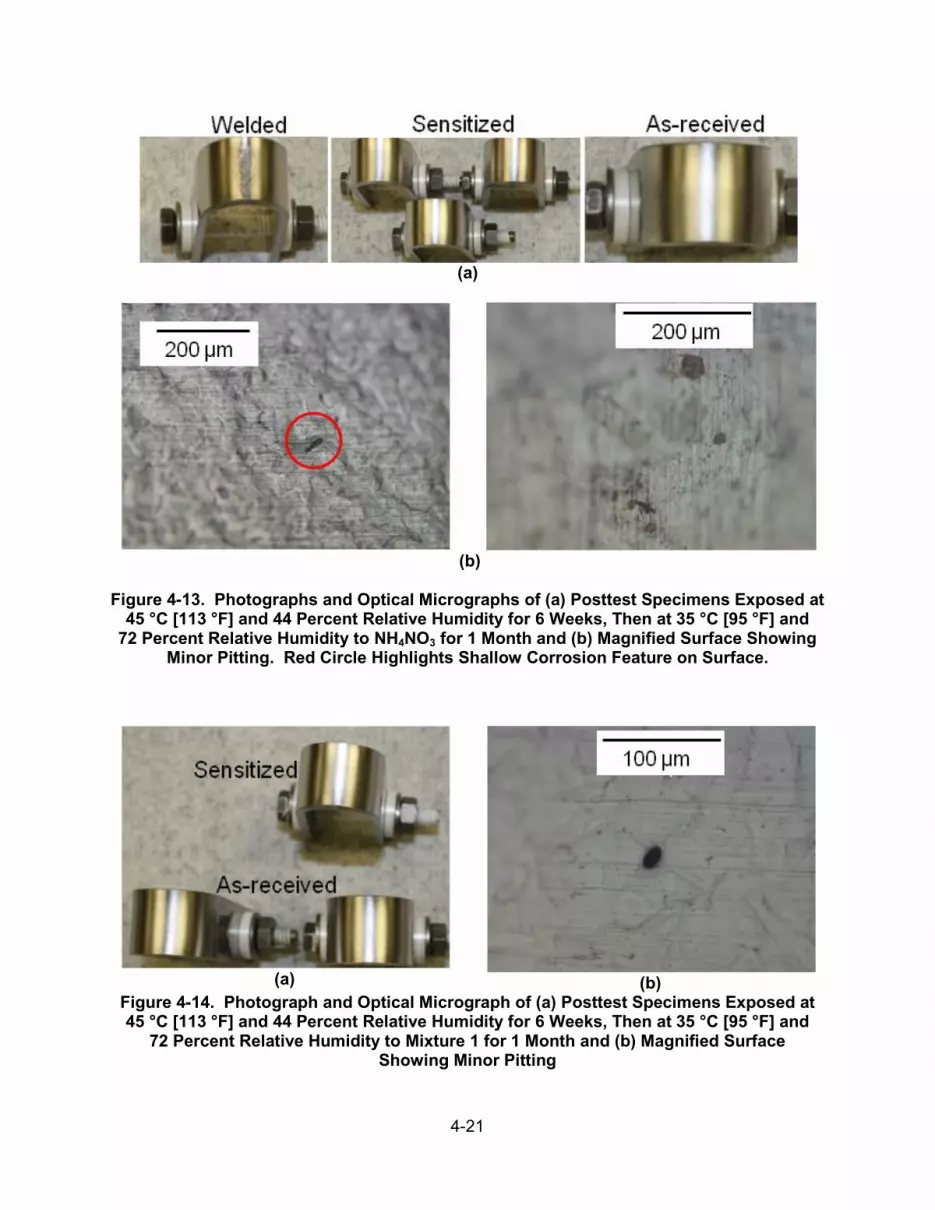
4-21
(a)
(b)
Figure 4-13. Photographs and Optical Micrographs of (a) Posttest Specimens Exposed at
45 °C [113 °F] and 44 Percent Relative Humidity for 6 Weeks, Then at 35 °C [95 °F] and 72 Percent Relative Humidity to NH4NO3 for 1 Month and (b) Magnified Surface Showing
Minor Pitting. Red Circle Highlights Shallow Corrosion Feature on Surface.
(a)
(b) Figure 4-14. Photograph and Optical Micrograph of (a) Posttest Specimens Exposed at 45 °C [113 °F] and 44 Percent Relative Humidity for 6 Weeks, Then at 35 °C [95 °F] and
72 Percent Relative Humidity to Mixture 1 for 1 Month and (b) Magnified Surface Showing Minor Pitting
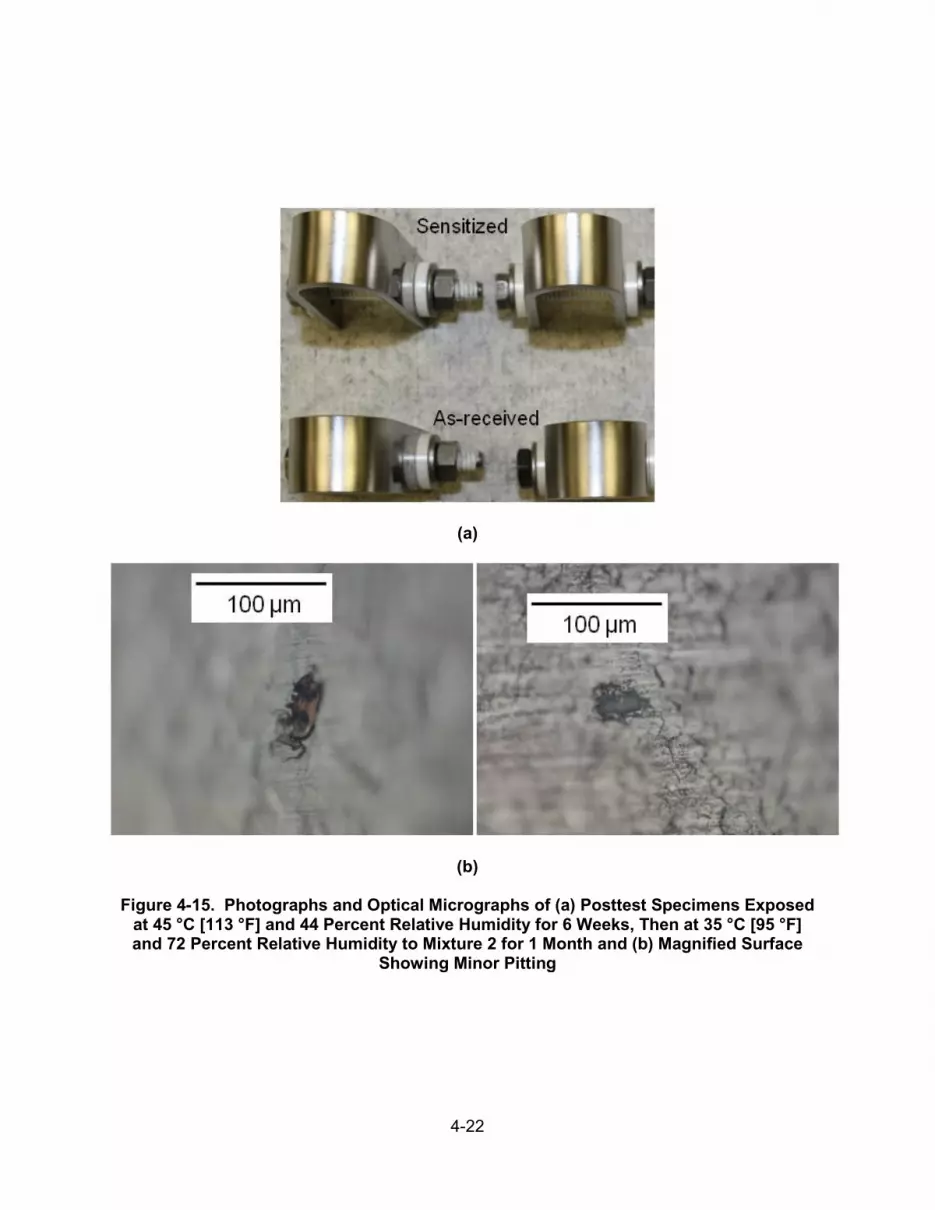
4-22
(a)
(b)
Figure 4-15. Photographs and Optical Micrographs of (a) Posttest Specimens Exposed at 45 °C [113 °F] and 44 Percent Relative Humidity for 6 Weeks, Then at 35 °C [95 °F] and 72 Percent Relative Humidity to Mixture 2 for 1 Month and (b) Magnified Surface
Showing Minor Pitting

4-23
(a)
(b)
Figure 4-16. Photograph and Optical Micrographs of (a) Posttest Specimens Exposed at 45 °C [113 °F] and 44 Percent Relative Humidity for 6 Weeks, Then at 35 °C [95 °F]
and 72 Percent Relative Humidity to Mixture 3 for 1 Month and (b) Magnified Surface Showing Minor Pitting

4-24
(a)
(b)
Figure 4-17. Photograph and Optical Micrographs of (a) Posttest Specimens Exposed at 45 °C [113 °F] and 44 Percent Relative Humidity for 6 Weeks, Then at 35 °C [95 °F]
and 72 Percent Relative Humidity to Fly Ash for 1 Month and (b) Magnified Surface Showing Minor Pitting

4-25
(a)
(b)

4-26
(c)
Figure 4-18. (a) Photographs, (b) SEM, and (c) EDX of Posttest As-Received, Sensitized,
and Welded Specimens Exposed at 45 °C [113 °F] and 44 Percent Relative Humidity for 6 Weeks, Then at 35 °C [95 °F] and 72 Percent Relative
Humidity to NH4HSO4 for 1 Month
(a) As-Received Specimen
(b) Sensitized Specimen
(c) Welded Specimen
Figure 4-19. Cross Section of (a) As-Received, (b) Sensitized, and (c) Welded Specimens
Exposed to NH4HSO4 at 45 °C [113 °F] and 44 Percent Relative Humidity for 6 Weeks, Then at 35 °C [95 °F] and 72 Percent Relative Humidity for 1 Month

4-27
Table 4-9. Stress Corrosion Cracking Test Matrix at 45 °C [113 °F] and
44 Percent Relative Humidity With Non-Chloride and Chloride Salt Mixtures
Specimen Type
Molar Ratio of NH4NO3 to NaCl
Amount of NH4NO3 and NaCl Deposited
(g/m2)
Calculated Amount of NaCl Deposited
(g/m2) As-Received 3 54 6.4
6 74 4.9 Sensitized 3 62 7.4
6 83 5.5 NaCl was in the range of about 5 to 8 g/m2, which though of different composition, is close to the 10 g/m2 of sea salt that was deposited on U-bend specimens for tests in the same conditions, as reported in Section 3.3.1. After 47 days of exposure at 45 °C [113 °F] and 44 percent RH, one as-received and one sensitized specimen were removed from each salt mixture. Figure 4-20(a) shows a photograph of all the specimens after 47 days, and Figure 4-20(b) shows a larger view of the removed specimens. Significant pitting corrosion was observed on all of the specimens, though more notably on the sensitized material. As shown in Figure 4-21, microscopic examination indicated SCC initiation in surface and cross section images of the sensitized material. No SCC was visible in the as-received material. Because the sensitized material already showed SCC initiation, the remaining sensitized specimens were removed from the chamber after 8 weeks of exposure. The remaining as-received specimens were left in the chamber for a total of 4 months. Photographs of the sensitized specimens exposed for 8 weeks are shown in Figure 4-22. SCC is clearly evident from the surface, with one specimen with a NO3
−/Cl− mole ratio of 3.0 having a complete through-going crack. Photographs and optical micrographs of the as-received specimens exposed for 4 months are shown in Figure 4-23. Pitting corrosion occurred on all of the specimens, but to a greater extent on specimens with a NO3
−/Cl− mole ratio of 3.0. The microscopic examination showed SCC initiation from pits on the specimens with a NO3
−/Cl− mole ratio of 3.0. Cracking was less obvious on specimens with a NO3
−/Cl− mole ratio of 6.0, but the crack features were located away from the apex and near the arc-to-leg transition area of the U-bend. The specimens were not cross sectioned for further examination, because the pitting on the specimens was very small and it would be very difficult to capture the small pits with a cross section. 4.5 Summary and Discussion of Stress Corrosion Cracking Susceptibility in Non-Chloride-Rich Salts Tests were performed to evaluate the susceptibility of austenitic stainless steel to SCC when exposed to species, other than chloride-rich salts, that could be present in the atmosphere near spent fuel storage locations. Data from environmental monitoring indicate that sulfate, nitrate, and ammonium are the most abundant soluble ions in the atmosphere, so (NH4)2SO4, NH4HSO4, and NH4NO3 were considered as salts to use for the test program, as well as fly ash, which was identified as a species of concern in Sindelar, et al. (2011). Testing showed that (NH4)2SO4 would not deliquesce at the humidity less than 30 g/m3 at temperatures between 35 and 60 oC [95 and 140 °F], so it was excluded from SCC testing.
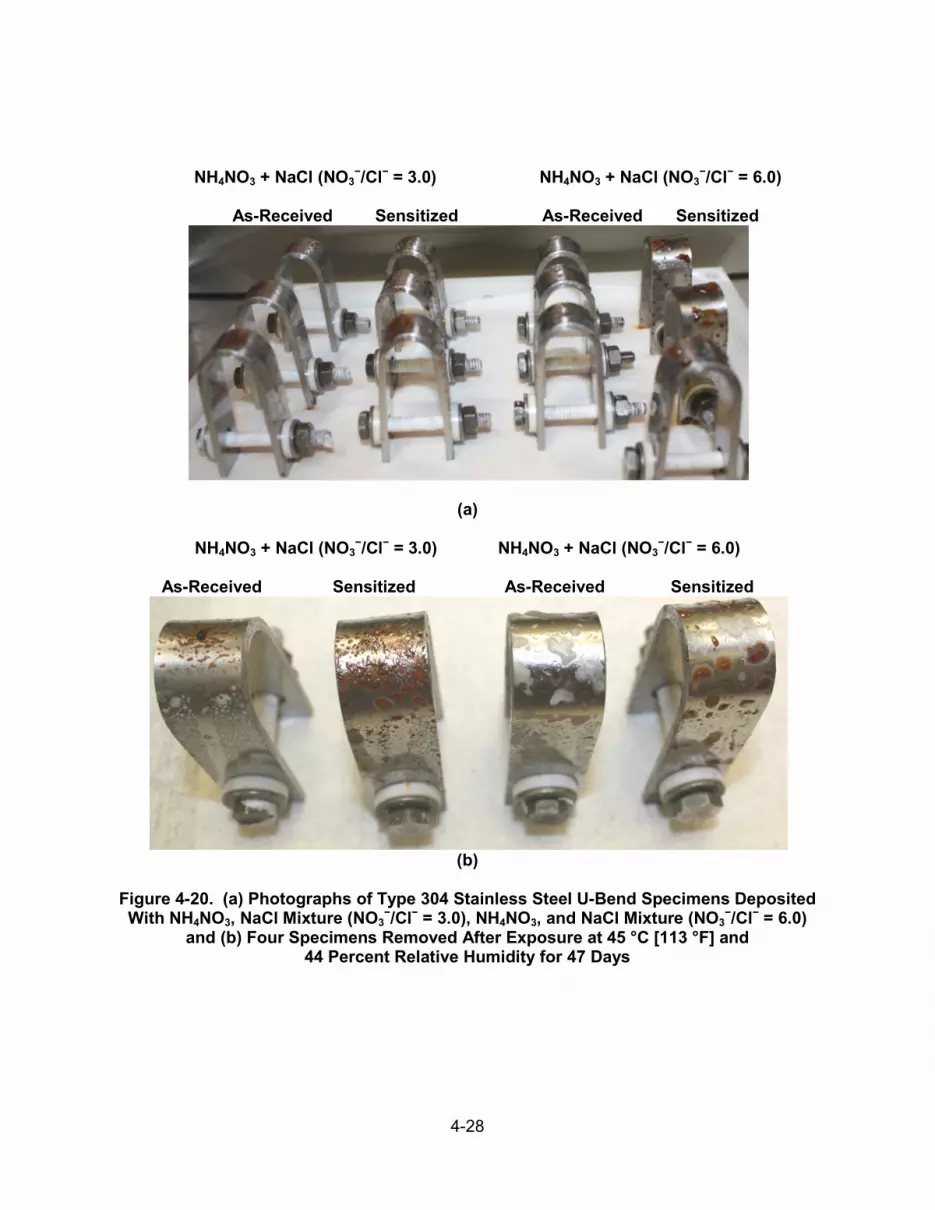
4-28
NH4NO3 + NaCl (NO3
−/Cl− = 3.0) NH4NO3 + NaCl (NO3−/Cl− = 6.0)
As-Received Sensitized As-Received Sensitized
(a)
NH4NO3 + NaCl (NO3−/Cl− = 3.0) NH4NO3 + NaCl (NO3
−/Cl− = 6.0)
As-Received Sensitized As-Received Sensitized
(b)
Figure 4-20. (a) Photographs of Type 304 Stainless Steel U-Bend Specimens Deposited With NH4NO3, NaCl Mixture (NO3
−/Cl− = 3.0), NH4NO3, and NaCl Mixture (NO3−/Cl− = 6.0)
and (b) Four Specimens Removed After Exposure at 45 °C [113 °F] and 44 Percent Relative Humidity for 47 Days
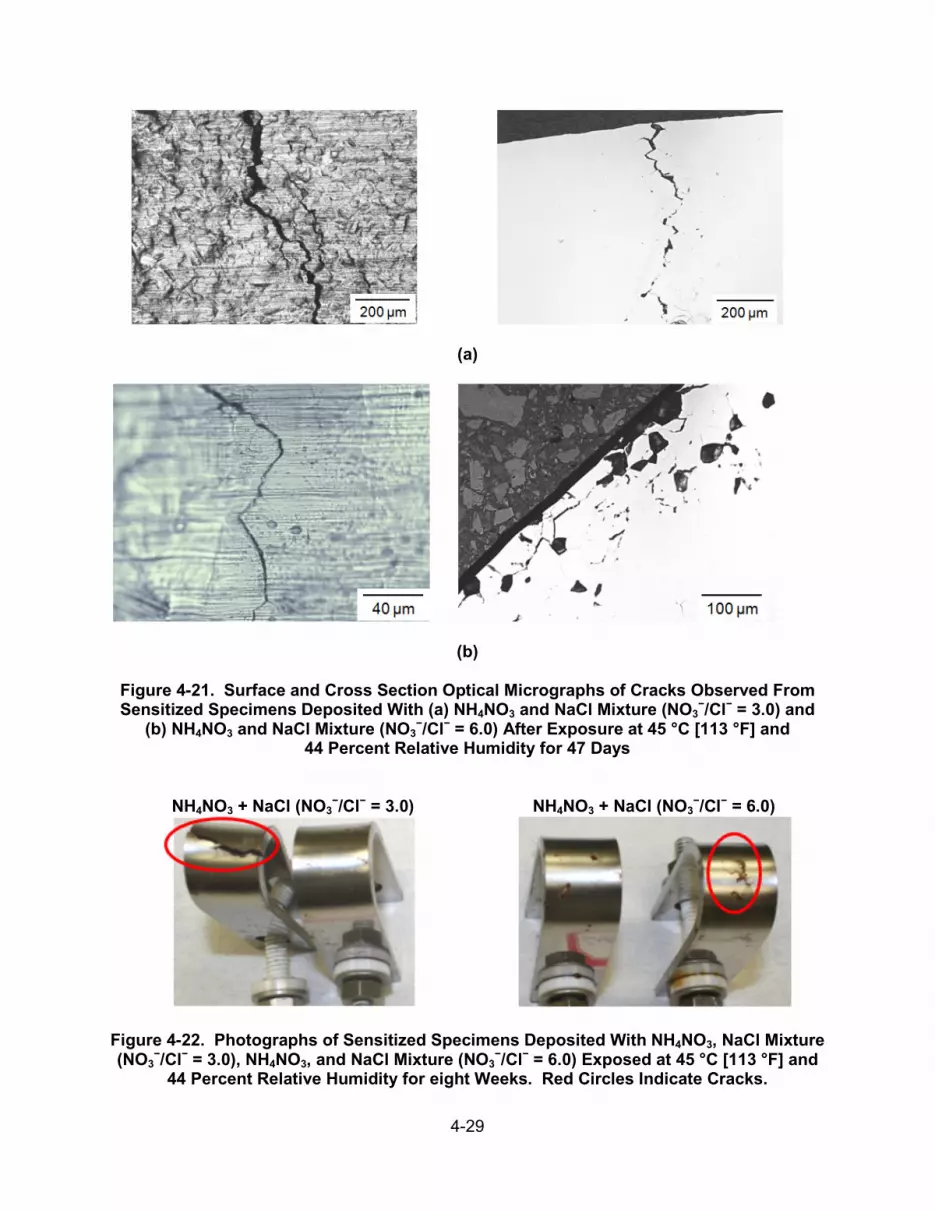
4-29
(a)
(b)
Figure 4-21. Surface and Cross Section Optical Micrographs of Cracks Observed From Sensitized Specimens Deposited With (a) NH4NO3 and NaCl Mixture (NO3
−/Cl− = 3.0) and (b) NH4NO3 and NaCl Mixture (NO3
−/Cl− = 6.0) After Exposure at 45 °C [113 °F] and 44 Percent Relative Humidity for 47 Days
NH4NO3 + NaCl (NO3−/Cl− = 3.0)
NH4NO3 + NaCl (NO3−/Cl− = 6.0)
Figure 4-22. Photographs of Sensitized Specimens Deposited With NH4NO3, NaCl Mixture (NO3
−/Cl− = 3.0), NH4NO3, and NaCl Mixture (NO3−/Cl− = 6.0) Exposed at 45 °C [113 °F] and
44 Percent Relative Humidity for eight Weeks. Red Circles Indicate Cracks.
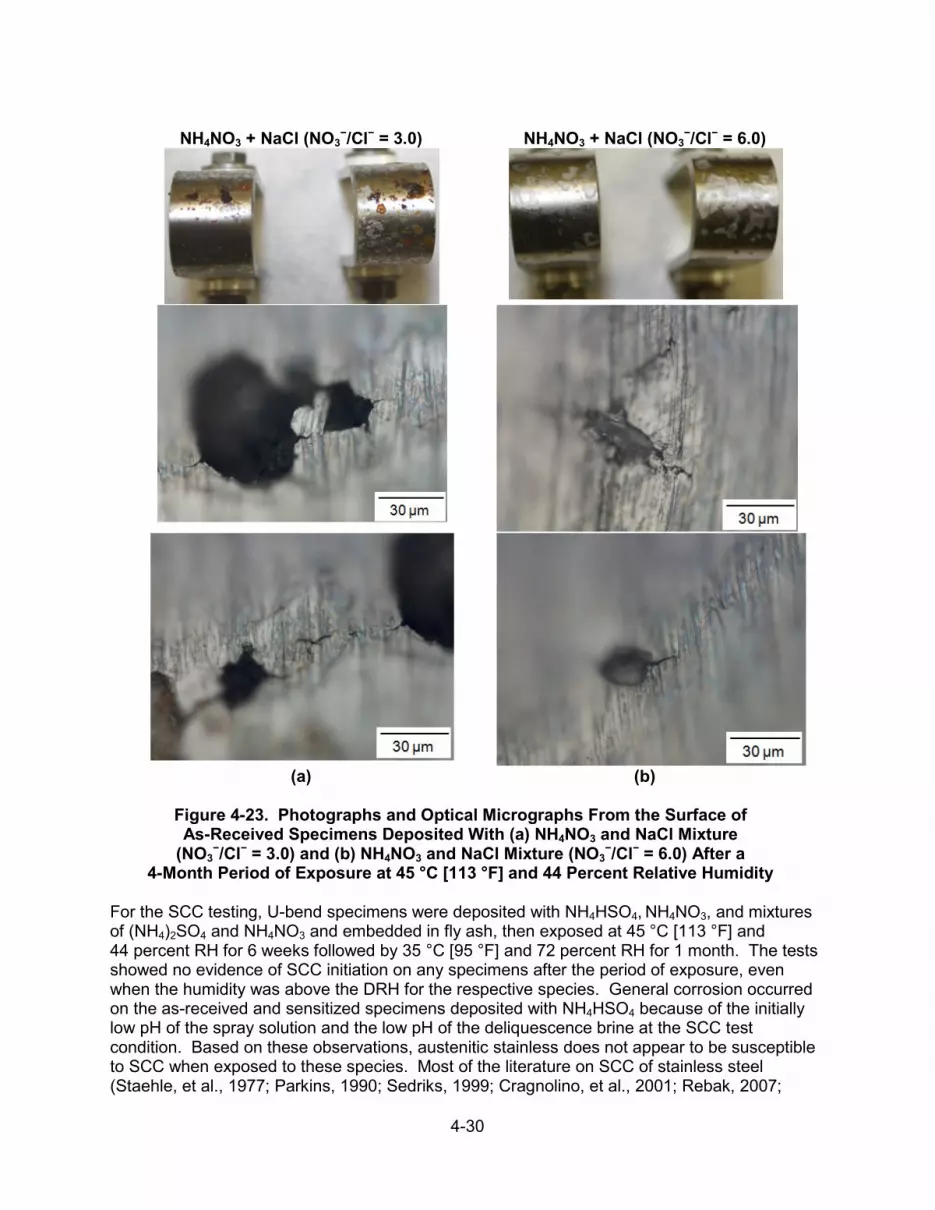
4-30
NH4NO3 + NaCl (NO3
−/Cl− = 3.0)
NH4NO3 + NaCl (NO3−/Cl− = 6.0)
(a) (b)
Figure 4-23. Photographs and Optical Micrographs From the Surface of As-Received Specimens Deposited With (a) NH4NO3 and NaCl Mixture
(NO3−/Cl− = 3.0) and (b) NH4NO3 and NaCl Mixture (NO3
−/Cl− = 6.0) After a 4-Month Period of Exposure at 45 °C [113 °F] and 44 Percent Relative Humidity
For the SCC testing, U-bend specimens were deposited with NH4HSO4, NH4NO3, and mixtures of (NH4)2SO4 and NH4NO3 and embedded in fly ash, then exposed at 45 °C [113 °F] and 44 percent RH for 6 weeks followed by 35 °C [95 °F] and 72 percent RH for 1 month. The tests showed no evidence of SCC initiation on any specimens after the period of exposure, even when the humidity was above the DRH for the respective species. General corrosion occurred on the as-received and sensitized specimens deposited with NH4HSO4 because of the initially low pH of the spray solution and the low pH of the deliquescence brine at the SCC test condition. Based on these observations, austenitic stainless does not appear to be susceptible to SCC when exposed to these species. Most of the literature on SCC of stainless steel (Staehle, et al., 1977; Parkins, 1990; Sedriks, 1999; Cragnolino, et al., 2001; Rebak, 2007;

4-31
Staehle and Gorman, 2003, 2004a,b; Chiang and Shukla, 2011; Chiang, et al., 2007a,b) is concerned with MgCl2 and HCl, and other chloride salts. No other reports have been identified describing SCC caused by the species evaluated in this program. The electrochemical studies to investigate Type 304 passivity discussed in the Appendix show that Type 304 remained passive in nitrate and sulfate salts, which suggests that these salts are not very aggressive. To evaluate the combined effects of non-chloride and chloride salts, additional tests were performed with mixtures of NH4NO3 and NaCl, with NO3
−/Cl− mole ratios of 3.0 and 6.0 at 45 °C [113 °F] and 44 percent RH. A number of literature reports (Brossia and Kelly, 1998; Uhlig and Gilman, 1964; El Dahan, 1999a,b; Tong and Swartz, 1980; Uhlig and Cook, 1969) indicate that nitrate can inhibit localized corrosion of stainless steel in chloride-containing solution. Nevertheless, extensive cracking was observed at both molar ratios, with larger cracks seen than on any other specimens evaluated in the test program. This observation, therefore, seems to contradict the expected inhibiting effect of nitrate. Note, however, that the inhibiting effect of nitrate on SCC reported in the literature was generally observed under immersion conditions and the previous studies likely used sodium or potassium forms of nitrate salts, whereas this study used deliquescent brines and NH4NO3 salt. During the SCC test, it was observed that the salt mixture deliquesced without NaCl solid evident on the surface, as shown in Figure 4-20(a), even though the test was conducted at 44 percent RH, which is below the NaCl DRH of 75 percent shown in Figure 2-11(a). This suggests that the chloride was dissolved in the deliquescence solution. To understand the deliquescence behavior of the salt mixture, the deliquescence and efflorescence of NH4NO3 and NaCl pure salts and their mixtures at 45 °C [113 °F] were measured using the beaker methodology that was described in Section 2.3. NH4NO3 and NaCl were tested and discussed in Sections 4.2.2 and 3.1.1.2, respectively, but they are shown again here for comparison. The RH was started at 10 percent and increased to 59 percent at 3 percent intervals, then subsequently decreased to 10 percent RH. Figure 4-24 shows the beakers at several RHs where deliquescence was observed. Mixtures of NH4NO3 and NaCl, with NO3
−/Cl− mole ratios of 3.0 and 6.0, deliquesced at 31 and 34 percent RH, respectively, as indicated by the wetness of the salt and the presence of liquid in the beakers. Pure NH4NO3 deliquesced at 49 percent RH. Consistent with the test shown in Section 3.1.1.2, deliquescence was not observed for NaCl up to 59 percent RH, so photographs are not shown. The beaker tests clearly show that the DRH of NH4NO3 and NaCl mixtures is lower than either of the pure NH4NO3 and NaCl constituents. Literature reports describe a deliquescence-lowering effect for multicomponent mixtures. Based on the solution thermodynamic theory, it has been shown (Wexler and Seinfeld, 1991; Potukuchi and Wexler, 1995a,b) that the DRH of a multicomponent mixture is lower than the minimum DRH of each component. This minimum RH is known as mutual DRH (MDRH) and “eutonic point” (Tang and Munkelwitz, 1993), at which the mixture has a composition that minimizes water activity; thus it is thermodynamically favored. At the MDRH, the aqueous phase is saturated with respect to all the salts. The MDRH has been demonstrated in numerous systems, such as the atmospheric aerosols (Kelly, et al., 2008) and pharmaceutical systems (Salameh and Taylor, 2005). Figure 4-25 shows the beakers in the process of decreasing RH for the efflorescence test. NH4NO3 and the two mixtures effloresced at 37 and 28 percent RH, respectively. This suggests that the ERH of NH4NO3 and NaCl mixtures is lower than that of NH4NO3, which is consistent
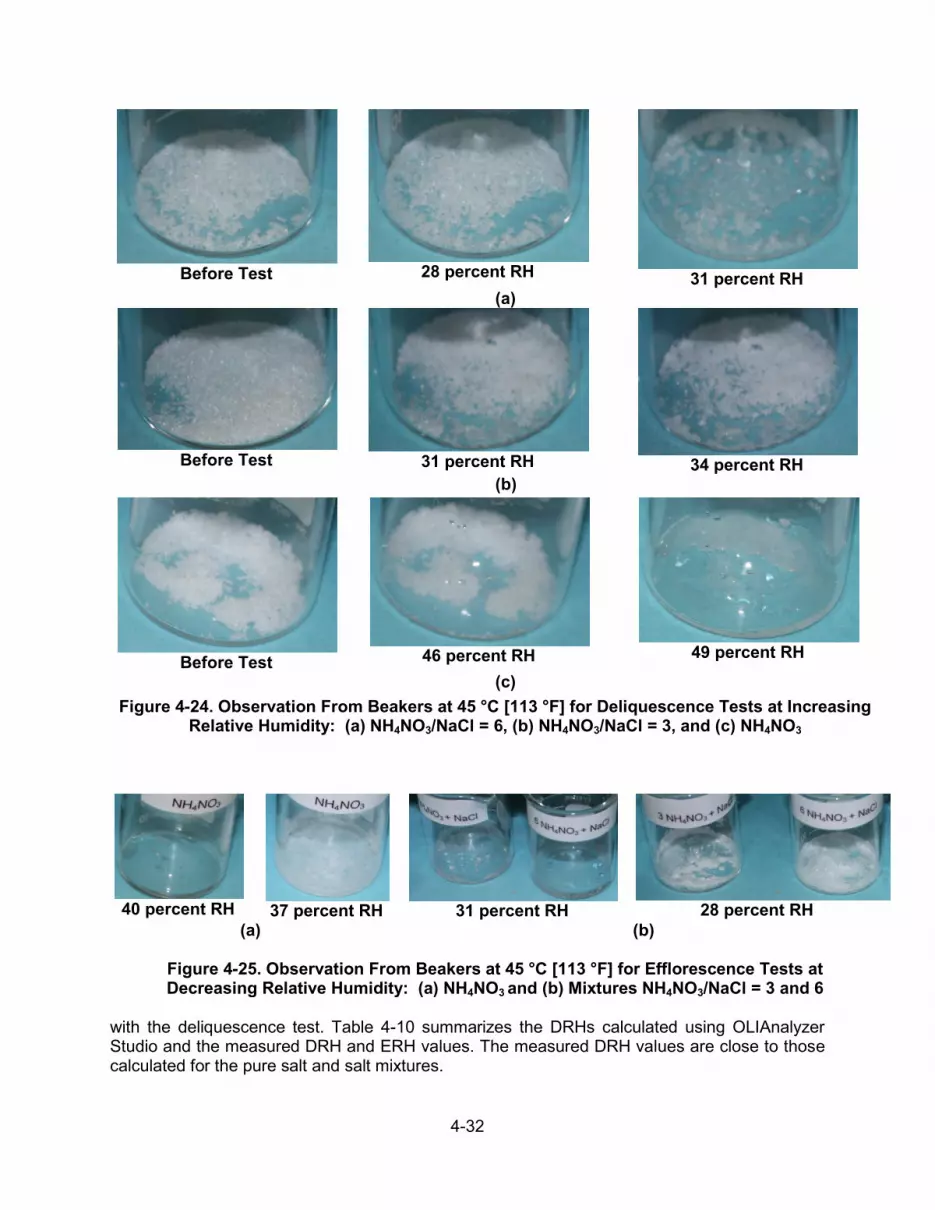
4-32
Before Test
28 percent RH
31 percent RH (a)
Before Test
31 percent RH
34 percent RH
(b)
Before Test
46 percent RH
49 percent RH
(c) Figure 4-24. Observation From Beakers at 45 °C [113 °F] for Deliquescence Tests at Increasing
Relative Humidity: (a) NH4NO3/NaCl = 6, (b) NH4NO3/NaCl = 3, and (c) NH4NO3
40 percent RH
37 percent RH
31 percent RH
28 percent RH
(a) (b)
Figure 4-25. Observation From Beakers at 45 °C [113 °F] for Efflorescence Tests at Decreasing Relative Humidity: (a) NH4NO3 and (b) Mixtures NH4NO3/NaCl = 3 and 6
with the deliquescence test. Table 4-10 summarizes the DRHs calculated using OLIAnalyzer Studio and the measured DRH and ERH values. The measured DRH values are close to those calculated for the pure salt and salt mixtures.

4-33
Table 4-10. Measured and Calculated Deliquescence Relative Humidity and Efflorescence Relative Humidity of NH4NO3 and NaCl Pure Salts and Mixtures of
NH4NO3 and NaCl at 45 °C [113 °F] Pure Salts and
Salt Mixture NH4NO3 NaCl NH4NO3/NaCl Mole Ratio
3 6 Calculated DRH, percent 50 75 35 35 DRH by Beaker, percent 49 >59 34 31 ERH by Beaker, percent 37 N/A 28 28 DRH = deliquescence relative humidity ERH = efflorescence relative humidity
In addition to the lower DRH of the salt mixtures, the deliquescence brine solutions would have low pH. This was listed in Table 2-2 as 3.43 and 3.50 at 45 °C [113 °F] for the salt mixtures with mole ratios of 3 and 6, respectively, as calculated using OLIAnalyzer. The pH is slightly lower compared to the spray solution. The low pH and low DRH of the nitrate and chloride salt mixtures could explain the occurrence of SCC at the tested conditions and the increase in extent of corrosion with chloride concentration observed in this study. Because of the limited scope of this work, tests were not conducted to evaluate the effect of nitrate under immersion conditions.

5-1
5 CONCLUSIONS
This study investigated the various factors that could affect the stress corrosion cracking (SCC) susceptibility of austenitic stainless steel when exposed to chloride-rich and non-chloride-rich brines formed by deliquescence of salts that are present in atmospheric particulate matter. These factors, which include temperature, relative humidity (RH), salt concentration, material metallurgical conditions, and stress level, were evaluated by systematic testing to identify the conditions where SCC could occur. Specific conclusions are as follows: (i) The results of the deliquescence tests, presented in Section 3.1, indicated that among
the dominant sea salt constituents, CaCl2 had the lowest deliquescence RH (DRH), followed by MgCl2, NaCl, and Na2SO4. The DRH of simulated sea salt was between that of pure CaCl2 and MgCl2. CaCl2 has a calculated DRH close to 20 percent over the 27 to 80 °C [81 to 176 °F] temperature range considered in this investigation, while MgCl2 is in the range of about 30 to 35 percent. Even though NaCl is the main constituent of sea salt, the DRH of simulated sea salt is much lower than that of NaCl. DRH and efflorescence RH (ERH) generally decreased with increasing temperature.
(ii) For both the cyclic humidity testing described in Section 3.2 and the elevated
temperature testing described in Section 3.3, SCC initiation was observed on Type 304 U-bend specimens deposited with simulated sea salt, provided that the RH was above the measured DRH for simulated sea salt. As previously mentioned, this generally is between the DRH of CaCl2 and MgCl2. The absolute humidity (AH) required to achieve this RH increases significantly with temperature, from less than 15 g/m3 at 35 °C [95 °F] to above 70 g/m3 at 80 oC [176 °F]. Therefore, at a given AH, it appears that SCC susceptibility increases with decreasing temperature because the RH is higher at the lower temperature.
(iii) The quantity of simulated sea salt deposited on Type 304 U-bend specimens was varied
for the cyclic humidity testing described in Section 3.2. SCC initiation was observed on specimens deposited with as little as 0.1 g/m2 of simulated sea salt. The extent of cracking, however, increased with increasing salt quantity.
(iv) The equilibrium concentration of chloride in a saturated deliquescent solution
decreases with increasing RH. As discussed in Section 3.4, SCC initiation was observed on Type 304 U-bend specimens immersed in saturated chloride solutions at 90 percent RH at 30 oC [86 °F], indicating that there still may be a sufficient quantity of chlorides to cause cracking.
(v) SCC tests were performed with Type 304L C-ring specimens in which the specimen
strain can be varied. Specimens were strained to 0.4 or 1.5 percent, compared to approximately 15 percent strain at the apex of U-bend specimens. It is thought that the high strain of U-bend specimens may not be representative of canister weld conditions. As described in Section 3.5, SCC initiation was observed on specimens deposited with 1 or 10 g/m2 of simulated sea salt at both strain levels. At the strain of 0.4 percent, the stress on the C-ring specimen is approximately equal to the material yield stress.
(vi) To represent atmospheric species associated with industrial, commercial, and
agricultural activities, SCC tests were performed in which Type 304 U-bend specimens were exposed to NH4NO3, NH4HSO4, and fly ash. As discussed in
5-2
Section 4.3, SCC initiation was not observed for these specimens, even for test conditions where the RH was above the DRH of the respective species.
(vii) SCC tests were performed in which Type 304 U-bend specimens were exposed to
mixtures of NH4NO3 and NaCl with NO3−/Cl− mole ratios of 3.0 and 6.0, but less than
10 g/m2 of NaCl. Extensive cracking was observed, although nitrate is understood to have an inhibiting effect on localized corrosion and SCC initiation was not observed on specimens exposed only to NH4NO3. The salt mixture appears to have DRH lower than that of the constituent salts and a low pH, which resulted in the extensive cracking.
(viii) SCC tests were performed with Type 304 in the as-received, furnace sensitized, and
welded with Type 308 filler metal, which has higher chromium content than Type 304. The sensitized material with chromium-depleted grain boundaries was most susceptible to SCC. The welded U-bend specimens used for cyclic SCC testing showed SCC susceptibility more similar to the as-received material than the sensitized material. Examination of the microstructure for welded specimens indicates that the heat-affected zone was not sensitized.
6-1
6 REFERENCES
Albores-Silva, A.G., E.A. Charles, and C. Padovani. “Effect of Chloride Deposition on Stress Corrosion Cracking of 316L Stainless Steel Used for Intermediate Level Radioactive Waste Containers.” Corrosion Engineering, Science, and Technology. Vol. 46. p. 124. 2011. Alexander, D., P. Doubell, and C. Wicker. “Degradation of Safety Injection Systems and Containment Spray Piping and Tank Fracture Toughness Analysis.” Presentation at International Symposium Fontevraud 7, Avignon, France, September 26–30, 2010. Report Number A042 T03. Paris, France: French Nuclear Energy Society. 2010. Allen, D. “Gulf Coast Aerosol Research and Characterization Program (Houston Supersite) Final Report.” Austin, Texas: University of Texas, Austin. 2005. Andresen, P.L., T.M. Angeliu, W.R. Catlin, L.M. Young, and R.M. Horn. “Effect of Deformation on SCC of Unsensitized Stainless Steel.” Presentation at CORROSION 2000, Lvivi, Ukraine, June 6–9, 2000. Houston, Texas: National Association of Corrosion Engineers. 2000. Angeliu, T.M., P.L. Andresen, E. Hall, J.A. Sutliff, and S. Sitzman. “Strain and Microstructure Characterization of Austenitic SS Weld HAZs.” Presentation at CORROSION 2000, Lvivi, Ukraine, June 6–9, 2000. Houston, Texas: National Association of Corrosion Engineers. 2000. ASTM International. “Standard Test Methods for Tension Testing of Metallic Materials.” ASTM E8/E8M–11. West Conshohocken, Pennsylvania: ASTM International. 2012. ASTM International. “Standard Specification for Chromium and Chromium-Nickel Stainless Steel Plate, Sheet, and Strip for Pressure Vessels and for General Applications.” ASTM A240/A240M–11a. West Conshohocken, Pennsylvania: ASTM International. 2011. ASTM International. “Standard Test Method for Electrochemical Reactivation (EPR) for Detecting Sensitization of AISI Type 304 and 304L Stainless Steels.” ASTM G108–94. West Conshohocken, Pennsylvania: ASTM International. 2010. ASTM International. “Standard Practice for Making and Using U-Bend Stress-Corrosion Test Specimens.” ASTM G30–97. West Conshohocken, Pennsylvania: ASTM International. 2009. ASTM International. “Standard Practice for the Preparation of Substitute Ocean Water.” ASTM D1141–98. West Conshohocken, Pennsylvania: ASTM International. 2008. ASTM International. “Standard Practice for Making and Using C-Ring Stress-Corrosion Test Specimens.” ASTM G38–01. West Conshohocken, Pennsylvania: ASTM International. 2007. Brossia, C.S. and R.G. Kelly. “Influence of Alloy Sulfur Content and Bulk Electrolyte Composition on Crevice Corrosion Initiation of Austenitic Stainless Steels.” Corrosion. Vol. 54, No. 2. p. 145. 1998. Caseres, L. and T.S. Mintz. NUREG/CR–7030, “Atmospheric Stress Corrosion Cracking Susceptibility of Welded and Unwelded 304, 304L, and 316L Austenitic Stainless Steels Commonly Used for Dry Cask Storage Containers Exposed to Marine Environments.” ML103120081. Washington, DC: U.S. Nuclear Regulatory Commission. October 2010.
6-2
Chang, S. and D.T. Allen. “Chlorine Chemistry in Urban Atmospheres: Aerosol Formation Associated With Anthropogenic Chlorine Emissions in Southeast Texas.” Atmospheric Environment. Vol. 40. pp. 512–523. 2006. Chiang, K.T. and P.K. Shukla. “Assessment of Stress Corrosion Cracking Susceptibility of 316 Stainless Steel in Different Disposal Environments.” Proceedings of the 13th International High-Level Radioactive Waste Management Conference, Albuquerque, New Mexico, April 10–14, 2011. LaGrange Park, Illinois: American Nuclear Society. pp. 794–799. 2011. Chiang, K.T., D.S. Dunn, Y.-M. Pan, O. Pensado, and P.K. Shukla. “Stress Corrosion Cracking of Waste Package Material―Modeling and Experiments.” CNWRA 2007-01. San Antonio, Texas: Center for Nuclear Waste Regulatory Analyses. 2007a. Chiang, K.T., D.S. Dunn, and G.A. Cragnolino. “Effect of Simulated Groundwater Chemistry on Stress Corrosion Cracking of Alloy 22.” Corrosion. Vol. 63, No. 10. pp. 940–950. 2007b. Cragnolino, G.A., D.S. Dunn, Y.-M. Pan, and N. Sridhar. “The Critical Potential for the Stress Corrosion Cracking of Fe-Cr-Ni Alloys and Its Mechanistic Implications.” Proceeding From Chemistry and Electrochemistry of Corrosion and Stress Corrosion: A Symposium to Honor the Contributions of Professor Roger W. Staehle, New Orleans, Louisiana, February 11–15, 2001. Warrendale, Pennsylvania: The Minerals, Metals, and Materials Society. pp. 83–104. 2001. El Dahan, H.A.. “Pitting Corrosion Inhibition of 316 Stainless Steel in Phosphoric Acid-Chloride Solutions: Part I, Potentiodynamic and Potentiostatic Polarization Studies.” Journal of Materials Science. Vol. 34. p. 851. 1999a. El Dahan, H.A. “Pitting Corrosion Inhibition of 316 Stainless Steel in Phosphoric Acid-Chloride Solutions: Part II, AES Investigation.” Journal of Materials Science. Vol. 34. p. 859. 1999b. EPA. “Our Nation’s Air Status and Trends Through 2008.” EPA–454/R–09–002. Research Triangle Park, North Carolina: U.S. Environmental Protection Agency, Office of Air Quality Planning and Standards. 2010. EPA. “Latest Findings on National Air Quality—Status and Trends Through 2006.” EPA–454/R–07–007. Research Triangle Park, North Carolina: U.S. Environmental Protection Agency, Office of Air Quality Planning and Standards. 2008a. EPA. “National Air Quality Status and Trends Through 2007.” EPA–454/R–08–006. Research Triangle Park, North Carolina: U.S. Environmental Protection Agency, Office of Air Quality Planning and Standards. 2008b. EPA. “Particulate Matter Research Program—Five Years of Progress.” Washington, DC: U.S. Environmental Protection Agency. 2004. EPRI. “Climatic Corrosion Considerations for Independent Spent Fuel Storage Installations in Marine Environments.” ML1013524. Palo Alto, California: Electric Power Research Institute. 2006. EPRI. “Effects of Marine Environments on Stress Corrosion Cracking of Austenitic Stainless Steels.” ML1011820. Palo Alto, California: Electric Power Research Institute. 2005.
6-3
Finlayson-Pitts, B.J. and J.N. Pitts. Atmospheric Chemistry: Fundamentals and Experimental Techniques. New York City, New York: John Wiley & Sons. 1986. Greenspan, L. “Humidity Fixed Points of Binary Saturated Aqueous Solutions.” Journal of Research of the National Bureau of Standards. Vol. 81, No. A. pp. 89–96. 1977. Grubb, J.F., T. DeBold, and J.D. Fritz. “Corrosion of Wrought Stainless Steels.” Corrosion Materials. Vol. 13B. pp. 54–77. 2005. Hanson, B., H. Alsaed, C. Stockman, D. Enos, R. Meyer, and K. Sorensen. “Gap Analysis To Support Extended Storage of Used Nuclear Fuel.” FCRD–USED–2011–000136. PNNL–20509. Rev. 0. Richland, Washington: Pacific Northwest National Laboratory. 2012. Hogrefe, O.J., J. Schwab, F. Drewnick, S. Weimer, D. Orsini, K.L. Demerjian, K. Rhoads, and O.V. Rattigan. “Intercomparison of Semi-Continuous Particulate Sulfate and Nitrate Measurement Technologies in New York City: Summer 2001 and Winter 2004 Intensive Studies.” Presentation at the American Association for Aerosol Research 23rd Annual Conference, Atlanta, Georgia, October 4–8, 2004. Mt. Laurel, New Jersey: American Association for Aerosol Research. 2004. IMPROVE. “Metadata Browser.” Fort Collins, Colorado: Interagency Monitoring of Protected Visual Environments. 2013. <http://vista.cira.colostate.edu/improve/Web/MetadataBrowser/ metadatabrowser.aspx> (January 10, 2013). Johnson, P.C., B.A. Stein, and R.S. Davis. “Basic Parameters of Metal Behavior Under High Rate Forming.” Structural Alloys Handbook. Vol. 2. West Lafayette, Indiana: Purdue University. 1994. Kain, R. “Marine Atmospheric Stress Corrosion Cracking of Austenitic Stainless Steel.” Materials Performance. Vol. 29, No. 12. pp. 60–62. 1990. Kelly, J.T., A.S. Wexler, C.K. Chan, and M.N. Chan. “Aerosol Thermodynamics of Potassium Salts, Double Salts, and Water Content Near the Eutectic.” Atmospheric Environment. Vol. 42. pp. 3,717–3,728. 2008. Knipping, E.M. and D. Dabdub. “Impact of Chlorine Emissions from Sea-Salt Aerosol on Coastal Urban Ozone.” Environmental Science and Technology. Vol. 37. pp. 275–284. 2003. Mayuzumi, M., J. Tani, and T. Arai. “Chloride Induced Stress Corrosion Cracking of Candidate Canister Materials for Dry Storage of Spent Fuel.” Nuclear Engineering and Design. Vol. 238, No. 5. pp. 1,227–1,232. 2008. Mintz, T.S. and D.S. Dunn. “Atmospheric Chamber Testing To Evaluate Chloride Induced Stress Corrosion Cracking of Type 304, 304L, and 316L Stainless Steel.” Presentation at CORROSION/2009, Atlanta, Georgia, March 22–26, 2009. Paper No. 09295. Houston, Texas: National Association of Corrosion Engineers. 2009. Morgan, J.D. “Report on Relative Corrosivity of Atmospheres at Various Distances From the Seacoast.” NASA Report MTB 099-74. Cape Canaveral, Florida: Kennedy Space Center. 1980.
6-4
Napoleon, A., G. Keith, C. Komanoff, D. Gutman, P. Silva, D. Schlissel, A. Sommer, C. Chen, and A. Roschelle. “Quantifying and Controlling Fine Particulate Matter in New York City.” Cambridge, Massachusetts: Synapse Energy Economics, Inc. 2007. Ning, Z., M.D. Geller, K.F. Moore, R. Sheesley, J.J. Schauer, and C. Sioutas. “Daily Variation in Chemical Characteristics of Urban Ultrafine Aerosols and Inference of Their Sources.” Environmental Science and Technology. Vol. 41. pp. 6,000–6,006. 2007. NRC. NUREG–1350, “NRC 2012–2013 Information Digest; Volume 24.” Washington, DC: U.S. Nuclear Regulatory Commission. August 2012a. NRC. “Potential Chloride-Induced Stress Corrosion Cracking of Austenitic Stainless Steel and Maintenance of Dry Cask Storage System Canisters.” NRC Information Notice 2012-20. ML12319A440. Washington, DC: U.S. Nuclear Regulatory Commission. 2012b. NRC. “Identification and Prioritization of the Technical Information Needs Affecting Potential Regulation of Extended Storage and Transportation of Spent Nuclear Fuel (Draft Report).” ML120580143. Washington, DC: U.S. Nuclear Regulatory Commission. 2012c. NRC. “Outside Diameter Initiated Stress Corrosion Cracking Revised Final White Paper, PA–MSC–0474.” Letter (October 14) to NRC From M.L. Arey, Jr. (PWROG Owners Group). ML110400241. Washington, DC: U.S. Nuclear Regulatory Commission. 2010. NRC. “Turkey Point Nuclear Plant Unit 3: 10 CFR 50.55A Request for Temporary Non-Code Repair Spent Fuel Pool Cooling Line (Request No. 6).” Letter (September 23) to NRC From T.O. Jones (Florida Power & Light). ML052780060. Washington, DC: U.S. Nuclear Regulatory Commission. 2005. NRC. “ECCS Suction Header Leaks Result in Both ECCS Trains Inoperable and TS 3.0.3 Entry.” Licensee Event Report 1999-003-00. ADAMS Legacy Library Accession No. 9905130085. Washington, DC: U.S. Nuclear Regulatory Commission. April 1999. Nuclear Decommissioning Authority. “Literature Review of Atmospheric Stress Corrosion Cracking of Stainless Steels Report to Nirex.” Report No. NR3090/043. Cumbria, United Kingdom: Nuclear Decommissioning Authority. 2007. NWTRB. “Evaluation of the Technical Basis for Extended Dry Storage and Transportation of Used Nuclear Fuel.” Washington, DC: U.S. Nuclear Waste Technical Review Board. 2010. OLISystems, Inc. “A Guide to Using OLIAnalyzer Studio, Version 3.2.” Morris Plains, New Jersey: OLISystems, Inc. 2012. Owens, J.S. “Condensation of Water From the Air Upon Hygroscopic Crystals.” The Royal Society of London. Vol. 110. pp. 738–752. 1926. Pandis, S., C. Davidson, and A. Robinson. “The Pittsburgh PM Supersite Program: A Multidisciplinary Consortium for Atmospheric Aerosol Research.” Pittsburgh, Pennsylvania: Carnegie Mellon University. 2005.

6-5
Park, R.J., D.J. Jacob, B.D. Field, R.M. Yantosca, and M. Chin. “Natural and Transboundary Pollution Influences on Sulfate-Nitrate-Ammonium Aerosols in the United States: Implications for Policy.” Journal of Geophysical Research. Vol. 109. pp. D15,204–15,217. 2004. Parkins, R.N. “Stress Corrosion Cracking.” Environmental-Induced Cracking of Metals. R.P. Gangloff and M.B. Ives, eds. NACE-10. Houston, Texas: National Association of Corrosion Engineers. 1990. Potukuchi, S. and A.S. Wexler. “Identifying Solid-Aqueous Phase Transitions in Atmospheric Aerosols–Part I: Neutral-Acidity Solutions.” Atmospheric Environment. Vol. 29. pp.1,663–1,676. 1995a. Potukuchi, S. and A.S. Wexler. “Identifying Solid-Aqueous Phase Transitions in Atmospheric Aerosols–Part II: Acidic Solutions.” Atmospheric Environment. Vol. 29. pp. 3,357–3,364. 1995b. Prosek, T., A. Iversen, C. Taxen, and D. Thierry. “Low-Temperature Stress Corrosion Cracking of Stainless Steels in the Atmosphere in the Presence of Chloride Deposits.” Corrosion. Vol. 65. p. 105. 2009. Rebak, R.B. “Environmental Cracking of Corrosion Resistant Alloys in the Chemical Process Industry—A Review.” Paper No. 07480. Corrosion 2007. Houston, Texas: National Association of Corrosion Engineers. 2007. Reff, A., P.V. Bhave, H. Simon, T.G. Pace, G.A. Pouliot, J.D. Mobley, and M. Houyoux. “Emissions Inventory of PM2.5 Trace Elements Across the United States.” Environmental Science and Technology. Vol. 43. pp. 5,790–5,796. 2009. Saegusa, T., K. Shirai, H. Takeda, M. Wataru, and J. Tani. “Issues and Countermeasures for Long-Term Storage of Spent Fuel by Dry Cask.” NRC’s 25th Annual Regulatory Information Conference. 2012. <http://www.nrc.gov/public-involve/conference-symposia/ric/past/2012/ docs/abstracts/saegusat-hv-w9.pdf> (September 3, 2013). Salameh, A.K. and L.S. Taylor. “Deliquescence in Binary Mixtures.” Pharmaceutical Research. Vol. 22. pp. 318–324. 2005. Salmela, H.A. and D.D. Grantham. “Diurnal Cycles of High Absolute Humidity at the Earth’s Surface.” AD–753 078. Bedford, Massachusetts: Air Force Cambridge Research Laboratories. 1972. Sedriks, A.J. “Stress Corrosion Cracking of Stainless Steel.” Stress-Corrosion Cracking─Materials Performance and Evaluation. R.H. Jones, ed. Materials Park, Ohio: ASM International. pp. 91–130. 1999. Shapiro, J.B., H.J. Simpson, K.L. Griffin, and W.S. Schuster. “Precipitation Chloride at West Point, NY: Seasonal Patterns and Possible Contributions From Non-Seawater Sources.” Atmospheric Environment. Vol. 41. pp. 2,240–2,254. 2007.

6-6
Shirai, K., J. Tani, T. Arai, M. Wataru, H. Takeda, and T. Saegusa. “SCC Evaluation Test of a Multi-Purpose Canister.” Presentation at the 13th International High-Level Radioactive Waste Management Conference, Albuquerque, New Mexico, April 10–14, 2011. LaGrange Park, Illinois: American Nuclear Society. 2011. Sindelar, R.L., A.J. Duncan, M.E. Dupont, P.-S. Lam, M.R. Louthan, Jr., and T.E. Skidmore. NUREG/CR–7116, “Materials Aging Issues and Aging Management for Extended Storage and Transportation of Spent Nuclear Fuel.” SRNL–STI–2011–00005. Washington, DC: U.S. Nuclear Regulatory Commission. 2011. Sjong, A. and L. Edelstein. “Marine Atmospheric SCC of Unsensitized Stainless Steel Rock Climbing Protection.” Journal of Failure Analysis and Prevention. Vol. 8. p. 410. 2008. Staehle, R.W. and J.A. Gorman. “Quantitative Assessment of Submodes of Stress Corrosion Cracking on the Secondary Side of Steam Generator Tubing in Pressurized Water Reactors: Part 2.” Corrosion. Vol. 60, No.11. pp. 5–63. 2004a. Staehle, R.W. and J.A. Gorman. “Quantitative Assessment of Submodes of Stress Corrosion Cracking on the Secondary Side of Steam Generator Tubing in Pressurized Water Reactors: Part 3.” Corrosion. Vol. 60, No.3. pp. 115–160. 2004b. Staehle, R.W. and J.A. Gorman. “Quantitative Assessment of Submodes of Stress Corrosion Cracking on the Secondary Side of Steam Generator Tubing in Pressurized Water Reactors: Part 1.” Corrosion. Vol. 59, No.11. pp. 931–994. 2003. Staehle, R.W., J. Hochmann, R.D. McCright, and J.E. Slater, eds. “Stress Corrosion Cracking and Hydrogen Embrittlement of Iron-Based Alloys.” NACE-5. Houston, Texas: National Association of Corrosion Engineers. 1977. Sullivan, R.C. and K.A. Prather. “Recent Advances in Our Understanding of Atmospheric Chemistry and Climate Made Possible by On-Line Aerosol Analysis Instrumentation.” Analytical Chemistry. Vol. 77. pp. 3,861–3,886. 2005. Tang, I.N. and H.R. Munkelwitz. “Composition and Temperature Dependence of the Deliquescence Properties of Hygroscopic Aerosols.” Atmospheric Environment. Vol. 27A. pp. 467–473. 1993. Tani, J.-I., M. Mayuzumi, and N. Hara. “Initiation and Propagation of SCC of Stainless Steel Canister for Concrete Cask Storage of Spent Nuclear Fuel.” Corrosion. Vol. 65. pp. 187–194. 2009. Tong, H.S. and D.J. Swartz. “The Electrochemical Aspects and Stress Corrosion Cracking Behavior of Type 316 Stainless Steel in Chloride Containing Ammonium Sulfate Solutions.” Corrosion. Vol. 36, No. 12. p. 699. 1980. Toshima, Y. and Y. Ikeno. “Long-Term Exposure Test for External Stress Corrosion Cracking on Austenitic Stainless Steels in Coastal Areas.” Presentation at CORROSION/2000, Lvivi, Ukraine, June 6–9, 2000. Paper No. 597. Houston, Texas: National Association of Corrosion Engineers. 2000.
6-7
Turner, J.R. “St. Louis—Midwest Fine Particulate Matter Supersite Revised Final Report.” St. Louis, Missouri: Washington University. 2007. Twomey, S. “The Identification of Individual Hygroscopic Particles in the Atmosphere by a Phase-Transition Method.” Journal of Applied Physics. Vol. 24. pp. 1,099–1,102. 1953. Uhlig, H.D. and E.W. Cook. “Mechanism of Inhibiting Stress Corrosion Cracking of 18-8 Stainless Steel in MgCI2 by Acetates and Nitrates.” Electrochemical Science. Vol. 116. pp. 173–177. 1969. Uhlig, H.H. and J.R. Gilman. “Pitting of 18-8 Stainless Steel in Ferric Chloride Inhibited by Nitrate.” Corrosion. Vol. 20. p. 289. 1964. Wexler, A.S. and J.H. Seinfeld. “Second-Generation Inorganic Aerosol Model.” Atmospheric Environment. Vol. 25A. pp. 2,731–2,748. 1991. White, W.H., B.P. Perley, R.L. Poirot, T.F. Dann, and E. Dabek-Zlotorzynska. “Continental-Scale Transport of Sea Salt Aerosol.” Presentation at the American Geophysical Union 2010 Fall Meeting, San Francisco, California, December 13–17, 2010. Abstract A43C–0245. Washington, DC: American Geophysical Union. 2010. Winkler, P. “The Growth of Atmospheric Aerosol Particles With Relative Humidity.” Physica Scripta. Vol. 37. pp. 223–230. 1988. Wolff, G.T., N.A. Kelly, M.A. Ferman, and M.L. Morrissey. “Rural Measurements of the Chemical Composition of Airborne Particles in the Eastern United States.” Journal of Geophysical Research. Vol. 88. pp. 10,769–10,775. 1983. Yang, L., R.T. Pabalan, and M.R. Juckett. “Deliquescence Relative Humidity Measurements Using an Electrical Conductivity Method.” Journal of Solution Chemistry. Vol. 35. pp. 583–604. 2006.


APPENDIX A
ELECTROCHEMICAL TESTS IN NON-CHLORIDE-RICH SALT SOLUTIONS

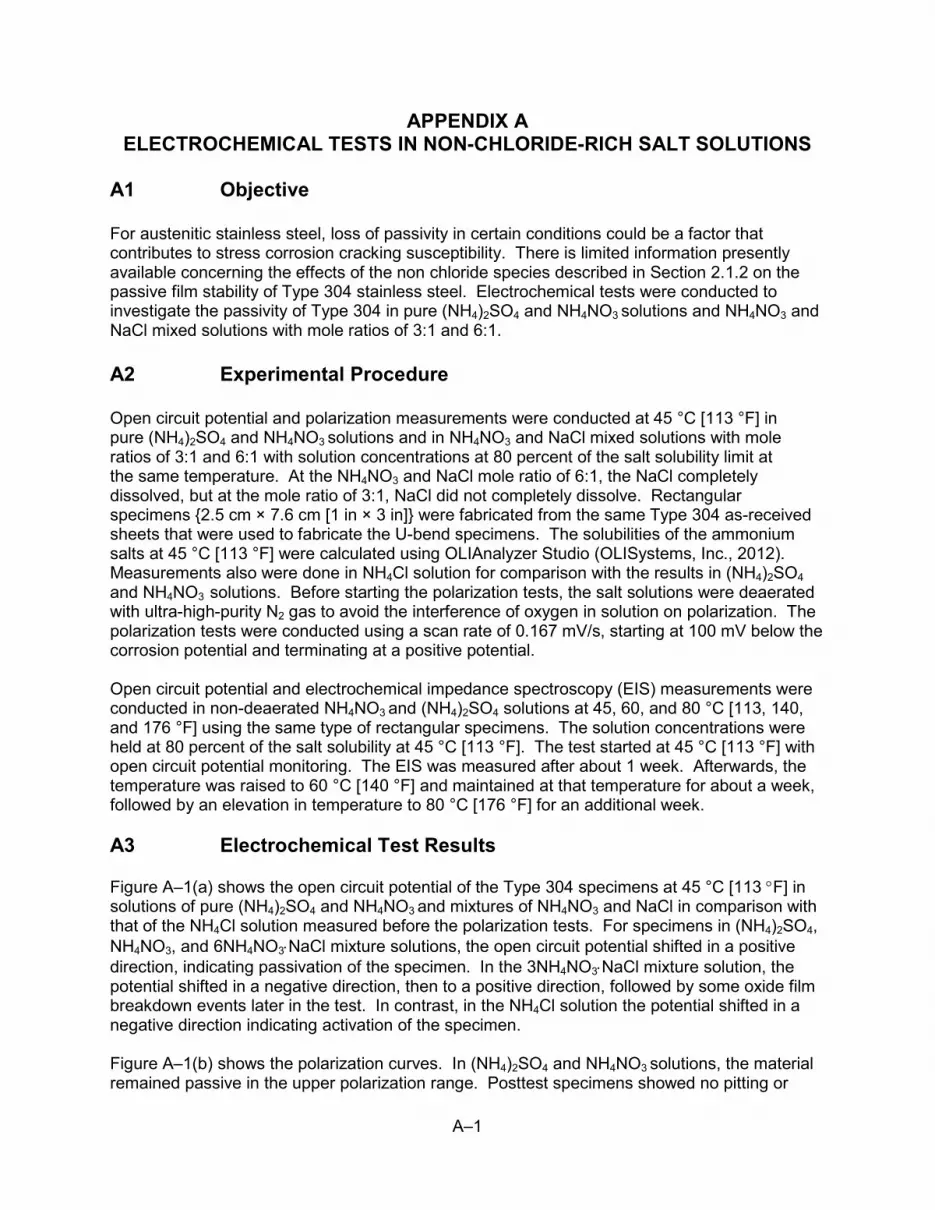
A–1
APPENDIX A ELECTROCHEMICAL TESTS IN NON-CHLORIDE-RICH SALT SOLUTIONS
A1 Objective For austenitic stainless steel, loss of passivity in certain conditions could be a factor that contributes to stress corrosion cracking susceptibility. There is limited information presently available concerning the effects of the non chloride species described in Section 2.1.2 on the passive film stability of Type 304 stainless steel. Electrochemical tests were conducted to investigate the passivity of Type 304 in pure (NH4)2SO4 and NH4NO3 solutions and NH4NO3 and NaCl mixed solutions with mole ratios of 3:1 and 6:1. A2 Experimental Procedure Open circuit potential and polarization measurements were conducted at 45 °C [113 °F] in pure (NH4)2SO4 and NH4NO3 solutions and in NH4NO3 and NaCl mixed solutions with mole ratios of 3:1 and 6:1 with solution concentrations at 80 percent of the salt solubility limit at the same temperature. At the NH4NO3 and NaCl mole ratio of 6:1, the NaCl completely dissolved, but at the mole ratio of 3:1, NaCl did not completely dissolve. Rectangular specimens {2.5 cm × 7.6 cm [1 in × 3 in]} were fabricated from the same Type 304 as-received sheets that were used to fabricate the U-bend specimens. The solubilities of the ammonium salts at 45 °C [113 °F] were calculated using OLIAnalyzer Studio (OLISystems, Inc., 2012). Measurements also were done in NH4Cl solution for comparison with the results in (NH4)2SO4 and NH4NO3 solutions. Before starting the polarization tests, the salt solutions were deaerated with ultra-high-purity N2 gas to avoid the interference of oxygen in solution on polarization. The polarization tests were conducted using a scan rate of 0.167 mV/s, starting at 100 mV below the corrosion potential and terminating at a positive potential. Open circuit potential and electrochemical impedance spectroscopy (EIS) measurements were conducted in non-deaerated NH4NO3 and (NH4)2SO4 solutions at 45, 60, and 80 °C [113, 140, and 176 °F] using the same type of rectangular specimens. The solution concentrations were held at 80 percent of the salt solubility at 45 °C [113 °F]. The test started at 45 °C [113 °F] with open circuit potential monitoring. The EIS was measured after about 1 week. Afterwards, the temperature was raised to 60 °C [140 °F] and maintained at that temperature for about a week, followed by an elevation in temperature to 80 °C [176 °F] for an additional week. A3 Electrochemical Test Results Figure A–1(a) shows the open circuit potential of the Type 304 specimens at 45 °C [113 °F] in solutions of pure (NH4)2SO4 and NH4NO3 and mixtures of NH4NO3 and NaCl in comparison with that of the NH4Cl solution measured before the polarization tests. For specimens in (NH4)2SO4, NH4NO3, and 6NH4NO3⋅NaCl mixture solutions, the open circuit potential shifted in a positive direction, indicating passivation of the specimen. In the 3NH4NO3⋅NaCl mixture solution, the potential shifted in a negative direction, then to a positive direction, followed by some oxide film breakdown events later in the test. In contrast, in the NH4Cl solution the potential shifted in a negative direction indicating activation of the specimen. Figure A–1(b) shows the polarization curves. In (NH4)2SO4 and NH4NO3 solutions, the material remained passive in the upper polarization range. Posttest specimens showed no pitting or

A–2
(a)
(b)
Figure A–1. (a) Open Circuit Potentials of As-Received Type 304 Stainless Steel in (NH4)2SO4, NH4NO3, and NH4Cl Solutions at 45 °C [113 °F] and (b) As-Received Type 304 Stainless Steel Polarization Curves in Ultra-High-Purity N2-Deaerated (NH4)2SO4,
NH4NO3, and NH4Cl Solutions at 45 °C [113 °F] active dissolution. In (NH4)2SO4 and NH4NO3 solutions, the passive current density in Figure A–1(b) is equivalent to a corrosion rate between 5 and 45 µm/yr. In NH4Cl solution, the specimen showed significant dissolution and the material was severely pitted. In 6NH4NO3⋅NaCl solution, the current density is comparable to that from pure NH4NO3 solution, but the current increased with an increase in Cl to NO3 ratio. Overall, compared to the active behavior in NH4Cl, the material remained passive in some potential regions. The open circuit potential in (NH4)2SO4 and NH4NO3 solutions monitored for longer time periods at 45, 60, and 80 °C [113, 140, and 176 °F] is partially shown in Figure A–2. Figure A–2 shows that after resetting to a higher temperature, the open circuit potential decreased momentarily, but it shifted to more noble potentials with time indicating that the oxide film became more passive with increasing temperature. Overall, no oxide film breakdown events were observed in either solution over the 1-month monitoring period. The measured EIS is shown in Figure A–3. In both solutions, the oxide film resistance remained high as indicated by the high impedance and near-constant phase angle in the frequency range of 103 to 10−1 Hz. The oxide film appears to be more resistive in NH4NO3 solution than in (NH4)2SO4 as indicated by the higher impedance and wider range of constant phase angle in Figure A–3(b). A4 Summary Limited electrochemical tests were conducted to explore the passivity of Type 304 in pure (NH4)2SO4 and NH4NO3 solutions and in NH4NO3 and NaCl mixed solutions. In NH4NO3 and (NH4)2SO4 solutions, oxide film remained highly passive up to the maximum testing period of 1 month. The passivity decreased with the addition of chloride.

A–3
(a) (NH4)2SO4
(b) NH4NO3
Figure A–2. Open Circuit Potential Measurement of As-Received Type 304 Stainless Steel at 45, 60, and 80 °C [113, 140, and 176 °F] in (a) (NH4)2SO4 and (b) NH4NO3 Solutions
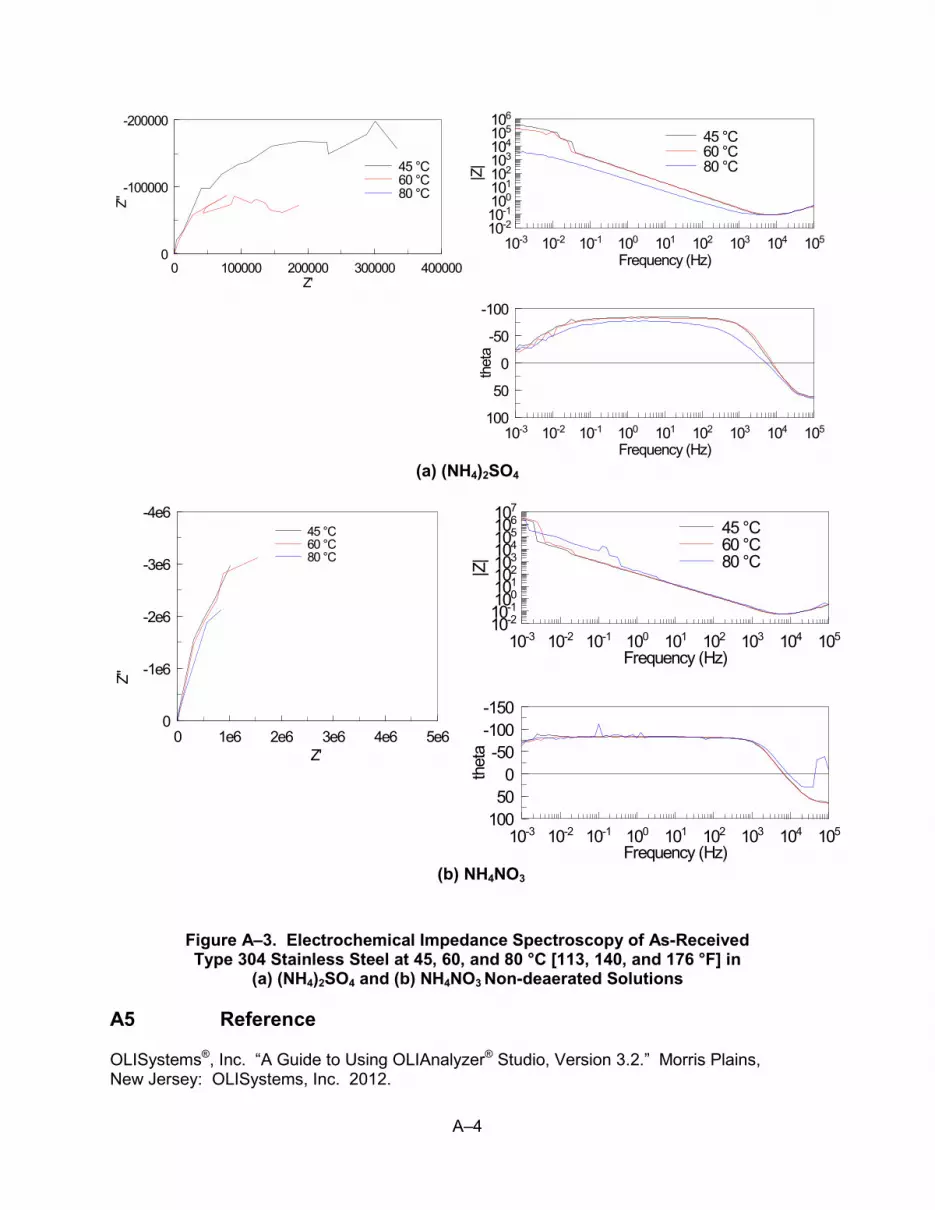
A–4
(a) (NH4)2SO4
(b) NH4NO3
Figure A–3. Electrochemical Impedance Spectroscopy of As-Received Type 304 Stainless Steel at 45, 60, and 80 °C [113, 140, and 176 °F] in
(a) (NH4)2SO4 and (b) NH4NO3 Non-deaerated Solutions A5 Reference OLISystems®, Inc. “A Guide to Using OLIAnalyzer® Studio, Version 3.2.” Morris Plains, New Jersey: OLISystems, Inc. 2012.
0 100000 200000 300000 400000
-200000
-100000
0
Z'
Z''
45 °C60 °C80 °C
10-3 10-2 10-1 100 101 102 103 104 10510-210-1100101102103104105106
Frequency (Hz)
|Z|
45 °C60 °C80 °C
10-3 10-2 10-1 100 101 102 103 104 105
-100
-50
0
50
100
Frequency (Hz)
thet
a
0 1e6 2e6 3e6 4e6 5e6
-4e6
-3e6
-2e6
-1e6
0
Z'
Z''
45 °C60 °C80 °C
10-3 10-2 10-1 100 101 102 103 104 10510-210-1100101102103104105106107
Frequency (Hz)
|Z|
45 °C60 °C80 °C
10-3 10-2 10-1 100 101 102 103 104 105
-150-100-50
050
100
Frequency (Hz)
thet
a


UN
ITED STATES
NU
CLEA
R R
EGU
LATORY C
OM
MISSIO
N
WA
SH
ING
TON
, DC
20555-0001 ------------------
OFFIC
IAL B
US
INE
SS

NU
REG
/CR
-7170
Assessment of Stress C
orrosion Cracking Susceptibility for Austenitic
Stainless Steels Exposed to Atmospheric C
hloride and Non-C
hloride Salts February 2014