Embed Size (px)
Citation preview
Reconnaissance Estimation of Groundwater Recharge to Selected Hydrographic Basins of Eastern Nevada and Western Utah using the Chloride Mass-balance Method
Steve A. Mizell Charles E. Russell Tammy L. Kluesner
June 2007
Publication No. 41232
prepared by
Division of Hydrologic Sciences, Desert Research Institute Nevada System of Higher Education
prepared for
United States Geological Survey

THIS PAGE LEFT INTENTIONALLY BLANK
iii
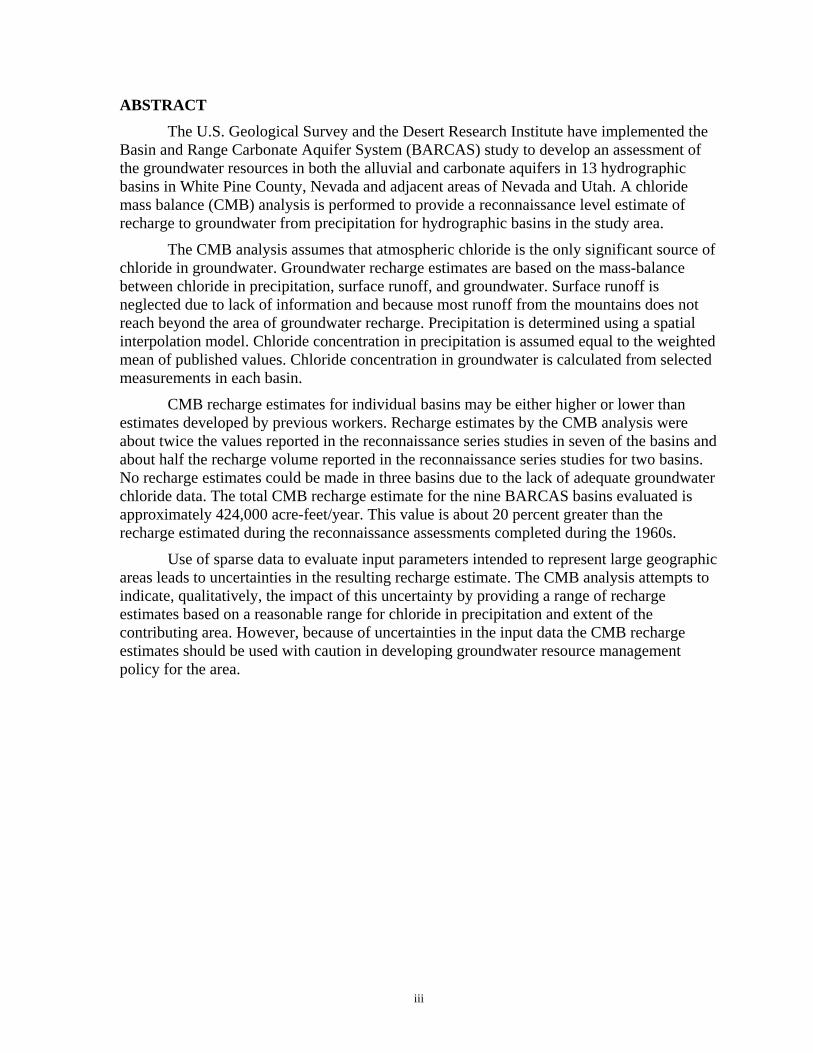
ABSTRACT The U.S. Geological Survey and the Desert Research Institute have implemented the
Basin and Range Carbonate Aquifer System (BARCAS) study to develop an assessment of the groundwater resources in both the alluvial and carbonate aquifers in 13 hydrographic basins in White Pine County, Nevada and adjacent areas of Nevada and Utah. A chloride mass balance (CMB) analysis is performed to provide a reconnaissance level estimate of recharge to groundwater from precipitation for hydrographic basins in the study area.
The CMB analysis assumes that atmospheric chloride is the only significant source of chloride in groundwater. Groundwater recharge estimates are based on the mass-balance between chloride in precipitation, surface runoff, and groundwater. Surface runoff is neglected due to lack of information and because most runoff from the mountains does not reach beyond the area of groundwater recharge. Precipitation is determined using a spatial interpolation model. Chloride concentration in precipitation is assumed equal to the weighted mean of published values. Chloride concentration in groundwater is calculated from selected measurements in each basin.
CMB recharge estimates for individual basins may be either higher or lower than estimates developed by previous workers. Recharge estimates by the CMB analysis were about twice the values reported in the reconnaissance series studies in seven of the basins and about half the recharge volume reported in the reconnaissance series studies for two basins. No recharge estimates could be made in three basins due to the lack of adequate groundwater chloride data. The total CMB recharge estimate for the nine BARCAS basins evaluated is approximately 424,000 acre-feet/year. This value is about 20 percent greater than the recharge estimated during the reconnaissance assessments completed during the 1960s.
Use of sparse data to evaluate input parameters intended to represent large geographic areas leads to uncertainties in the resulting recharge estimate. The CMB analysis attempts to indicate, qualitatively, the impact of this uncertainty by providing a range of recharge estimates based on a reasonable range for chloride in precipitation and extent of the contributing area. However, because of uncertainties in the input data the CMB recharge estimates should be used with caution in developing groundwater resource management policy for the area.

iv
THIS PAGE LEFT INTENTIONALLY BLANK
v
CONTENTS
ABSTRACT............................................................................................................................. iii INTRODUCTION .................................................................................................................... 1 PREVIOUS WORK.................................................................................................................. 1 CONCEPTUAL MODEL......................................................................................................... 5 DATA ACQUISITION............................................................................................................. 6
Precipitation .......................................................................................................................... 6 Chloride in Precipitation....................................................................................................... 7 Chloride in Groundwater ...................................................................................................... 9 Lower Limit of Recharge.................................................................................................... 10
RESULTS ............................................................................................................................... 12 COMPARISON TO PREVIOUS RECHARGE ESTIMATES.............................................. 18
Southern Butte Valley......................................................................................................... 18 Cave Valley......................................................................................................................... 19 Jakes Valley ........................................................................................................................ 19 Lake Valley......................................................................................................................... 19 Little Smoky Valley............................................................................................................ 19 Snake Valley ....................................................................................................................... 20 Spring Valley ...................................................................................................................... 20 Steptoe Valley..................................................................................................................... 20 White River Valley ............................................................................................................. 21
POTENTIAL ERRORS WITH THE CMB APPROACH ..................................................... 21 CONCLUSION....................................................................................................................... 22 REFERENCES ....................................................................................................................... 23 APPENDIX. Groundwater chloride concentrations, by basin, used in the chloride mass balance analysis of the BARCAS area groundwater recharge................................................ 27
vi
LIST OF FIGURES
1. Hydrographic Basins of the BARCAS area, in Nevada and Utah................................... 2
2. Average annual precipitation for the BARCAS area from PRISM precipitation model................................................................................................................................ 8
3. Groundwater chloride data points for CMB recharge assessment in BARCAS area................................................................................................................................. 11
4. Areas contributing recharge for lower limit cut offs of 200mm, 225mm, and 250mm annual precipitation.................................................................................... 13
LIST OF TABLES
1. Estimates of precipitation on the recharge area and recharge to groundwater in BARCAS area basins based on reconnaissance series reports and related publications. ..................................................................................................................... 3
2. Recharge estimates made by Nichols (2000) for hydrographic basins in the BARCAS area.................................................................................................................. 4
3. Estimation of groundwater recharge in Butte and Spring Valley using the chloride mass balance method as published in Dettinger (1989)................................................... 4
4. Inputs for the maximum likely recharge estimate for BARCAS area recharge zones using the chloride mass balance method are shown. ..................................................... 15
5. Inputs for the mid-point likely recharge estimate for BARCAS area recharge zones using the chloride mass balance method are shown. ..................................................... 16
6. Inputs for the minimum likely recharge estimate for BARCAS area recharge zones using the chloride mass balance method are shown. ..................................................... 17
7. Comparison of CMB recharge estimates to other estimates for hydrographic basins in the BARCAS area............................................................... 18
1
INTRODUCTION
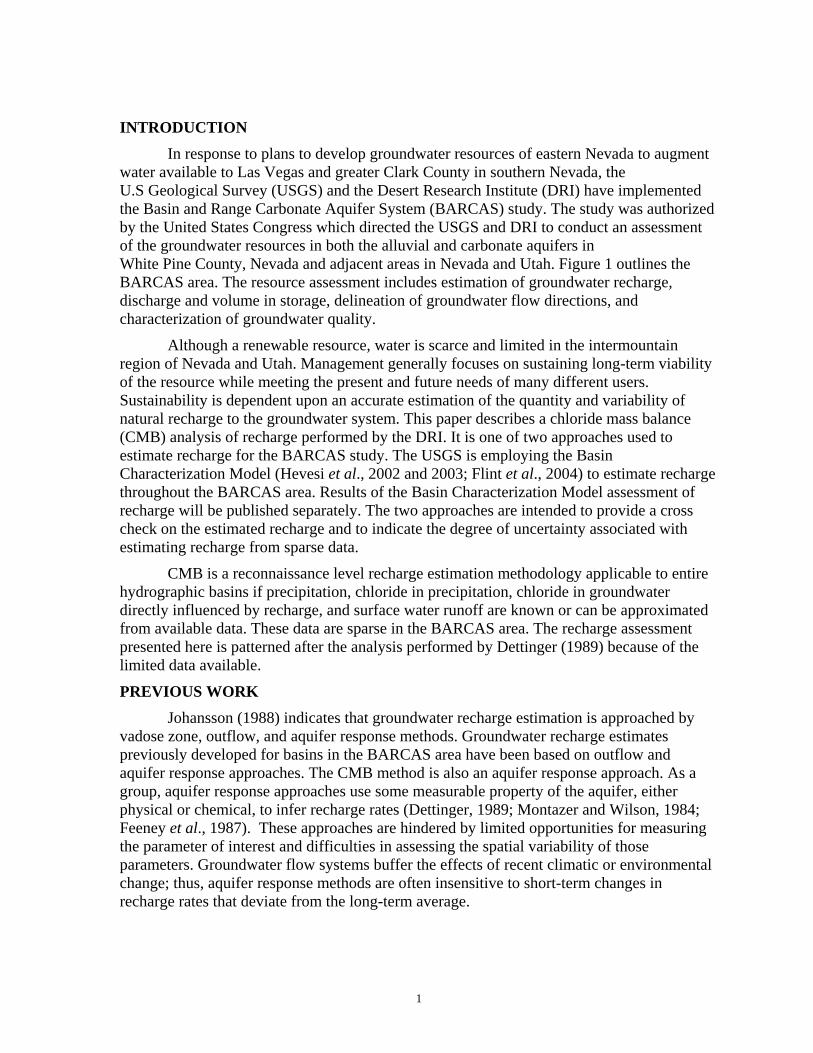
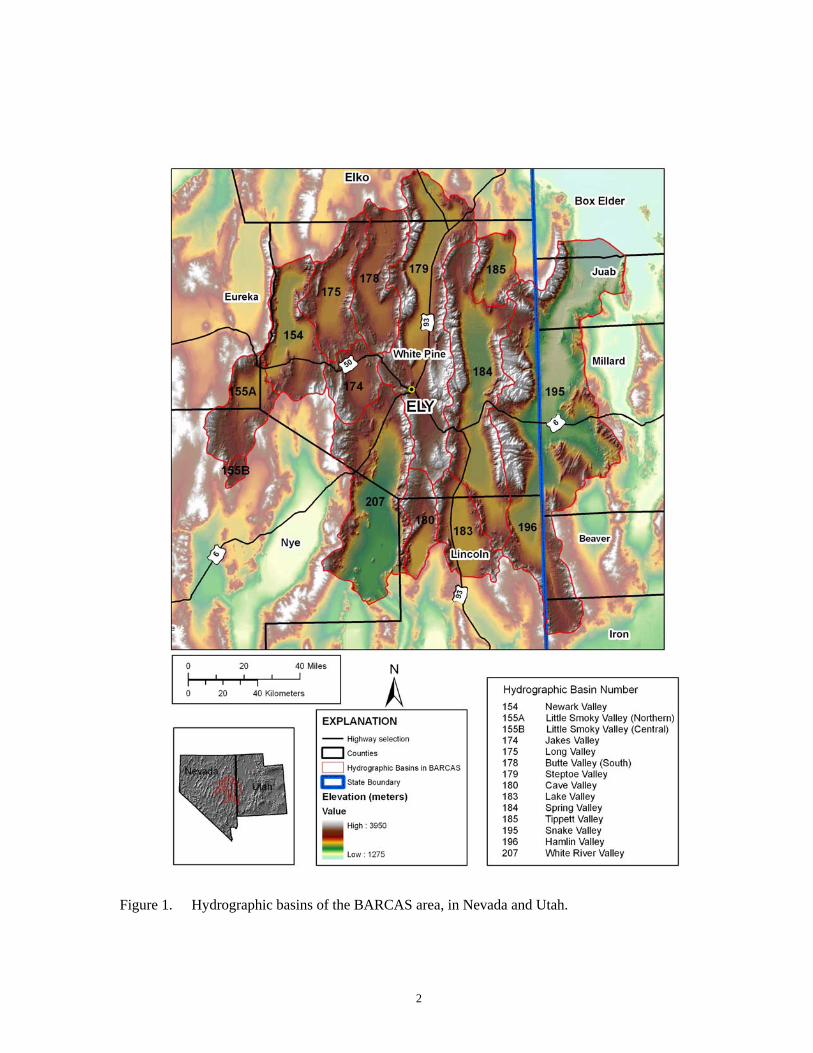
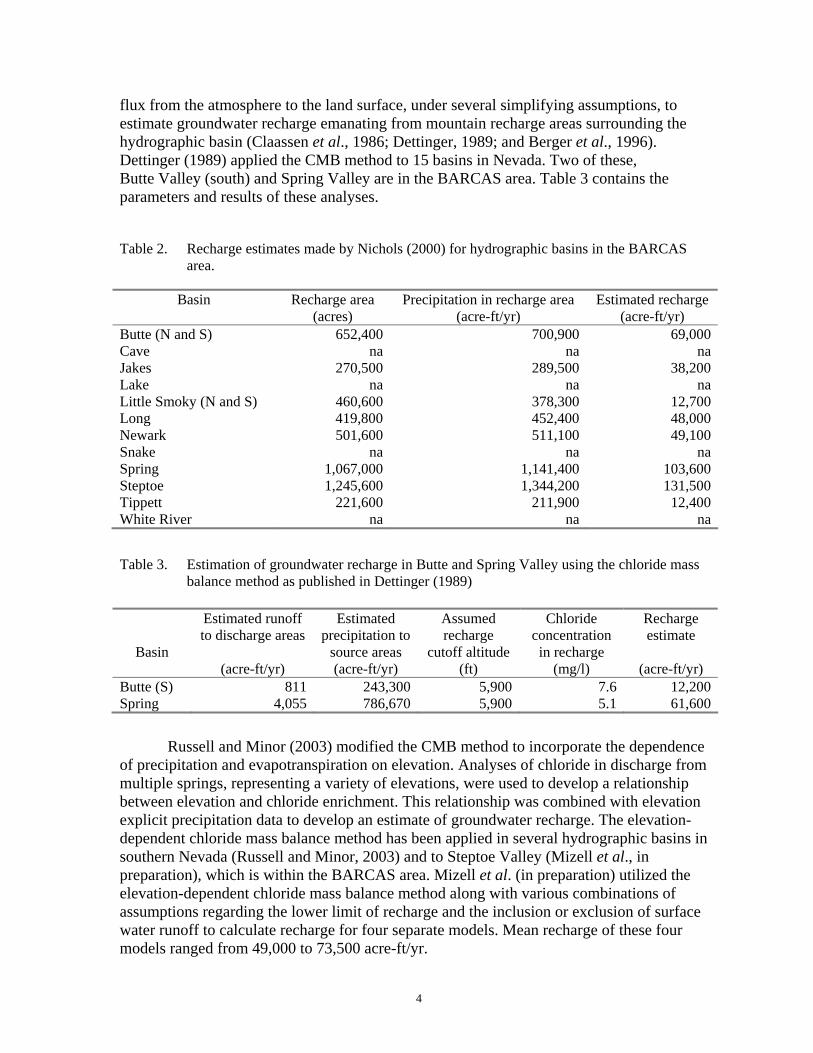
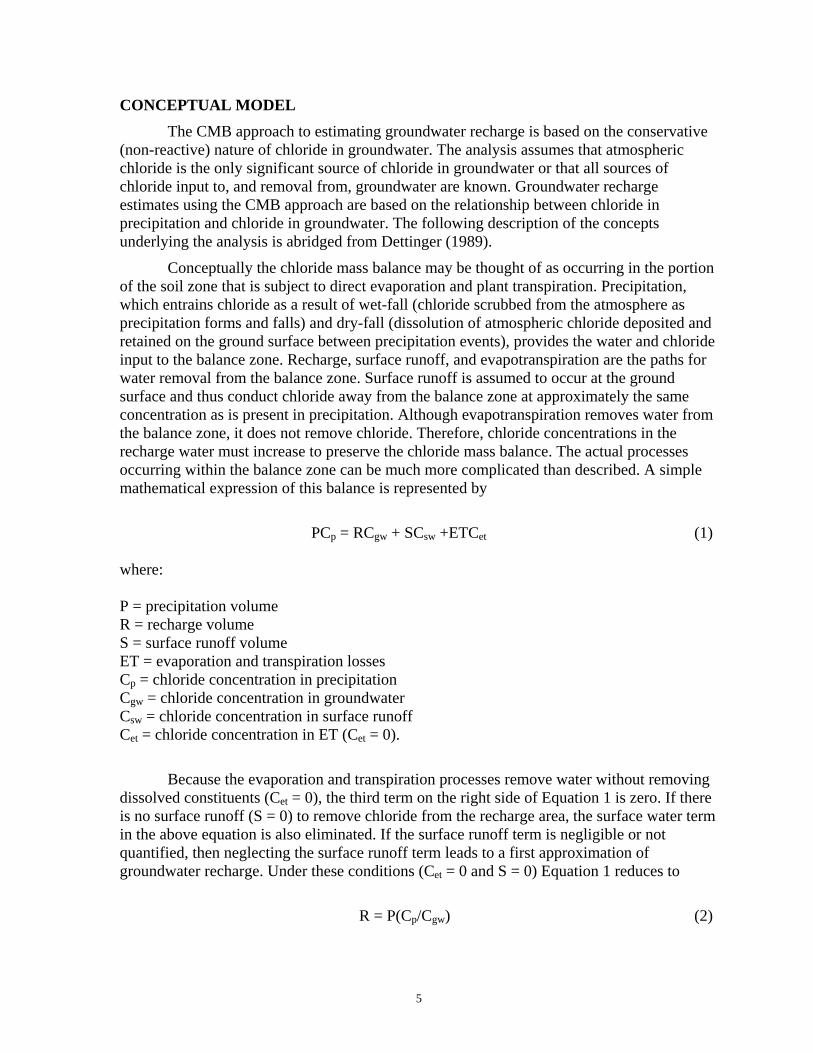
In response to plans to develop groundwater resources of eastern Nevada to augment water available to Las Vegas and greater Clark County in southern Nevada, the U.S Geological Survey (USGS) and the Desert Research Institute (DRI) have implemented the Basin and Range Carbonate Aquifer System (BARCAS) study. The study was authorized by the United States Congress which directed the USGS and DRI to conduct an assessment of the groundwater resources in both the alluvial and carbonate aquifers in White Pine County, Nevada and adjacent areas in Nevada and Utah. Figure 1 outlines the BARCAS area. The resource assessment includes estimation of groundwater recharge, discharge and volume in storage, delineation of groundwater flow directions, and characterization of groundwater quality.
Although a renewable resource, water is scarce and limited in the intermountain region of Nevada and Utah. Management generally focuses on sustaining long-term viability of the resource while meeting the present and future needs of many different users. Sustainability is dependent upon an accurate estimation of the quantity and variability of natural recharge to the groundwater system. This paper describes a chloride mass balance (CMB) analysis of recharge performed by the DRI. It is one of two approaches used to estimate recharge for the BARCAS study. The USGS is employing the Basin Characterization Model (Hevesi et al., 2002 and 2003; Flint et al., 2004) to estimate recharge throughout the BARCAS area. Results of the Basin Characterization Model assessment of recharge will be published separately. The two approaches are intended to provide a cross check on the estimated recharge and to indicate the degree of uncertainty associated with estimating recharge from sparse data.
CMB is a reconnaissance level recharge estimation methodology applicable to entire hydrographic basins if precipitation, chloride in precipitation, chloride in groundwater directly influenced by recharge, and surface water runoff are known or can be approximated from available data. These data are sparse in the BARCAS area. The recharge assessment presented here is patterned after the analysis performed by Dettinger (1989) because of the limited data available.
PREVIOUS WORK
Johansson (1988) indicates that groundwater recharge estimation is approached by vadose zone, outflow, and aquifer response methods. Groundwater recharge estimates previously developed for basins in the BARCAS area have been based on outflow and aquifer response approaches. The CMB method is also an aquifer response approach. As a group, aquifer response approaches use some measurable property of the aquifer, either physical or chemical, to infer recharge rates (Dettinger, 1989; Montazer and Wilson, 1984; Feeney et al., 1987). These approaches are hindered by limited opportunities for measuring the parameter of interest and difficulties in assessing the spatial variability of those parameters. Groundwater flow systems buffer the effects of recent climatic or environmental change; thus, aquifer response methods are often insensitive to short-term changes in recharge rates that deviate from the long-term average.
2
Figure 1. Hydrographic basins of the BARCAS area, in Nevada and Utah.
3
In the early- to mid-1960s, the discharge-based Maxey-Eakin method (Maxey and Eakin, 1949), and variations of the method, were used to evaluate groundwater recharge in hydrographic basins throughout Nevada. These studies were conducted by the USGS and the Nevada Department of Conservation and Natural Resources (DCNR) as part of a state-wide water resource appraisal. Results of these appraisals were published by the Nevada DCNR in what has come to be known as the "reconnaissance series." Eakin (1960, 1961, 1962, 1966), Rush and Eakin (1963), Hood and Rush (1965), Rush and Kazmi (1965), Rush and Everett (1966), Eakin et al. (1967), and Glancy (1968) prepared water resource appraisals of various hydrographic basins in the BARCAS area for this series. The resulting recharge estimates are summarized in Table 1.
Table 1. Estimates of precipitation on the recharge area and recharge to groundwater in BARCAS
area basins based on reconnaissance series reports and related publications.
Basin Recharge Area1 (acres)
Precipitation (acre-ft/yr)
Recharge (acre-ft/yr)
Reference
Butte (S) 633,000 560,000 15,000 Glancy, 1968 Cave 206,000 2,065,000 14,000 Eakin, 1962 Jakes 2,752,002 na 17,000 Eakin, 1966 Lake 243,000 228,900 13,000 Rush and Eakin, 1963 Little Smoky (N) 112,000 100,000 4,000 Rush and Everett, 1966 Long 322,000 296,900 10,000 Eakin, 1961 Newark 362,000 335,500 18,000 Eakin, 1960 Snake 1,818,000 1,794,000 100,000 Hood and Rush, 1965 Spring 743,000 791,000 75,000 Rush and Kazmi, 1965 Steptoe 692,000 860,000 85,000 Eakin, Hughes, and Moore,
1967 Tippett3 na na na White River 1,036,8002 na 38,000 Eakin, 1966 1 Recharge area consists of land area which receives more than 8 in/yr (203 mm/yr) precipitation. 2 Area of basin is given; area of recharge area is not indicated. 3 No recharge estimates are available; na = not available.
Nichols (2000) assessed the groundwater budgets of 16 hydrographic basins in eastern Nevada. He used estimates of evapotranspiration from groundwater and estimates of interbasin flow to evaluate discharge from the basins. Assuming that discharge equals recharge, Nichols (2000) used multiple-linear regression to evaluate the coefficients that provide the required recharge from average annual precipitation volumes in five precipitation zones in all 16 basins. He then used the recharge coefficients in conjunction with precipitation data for each basin to estimate recharge to each of the basins individually. Table 2 lists the recharge estimates for the seven basins from his study that are in the BARCAS area.
The CMB method has been used in several studies in Nevada (Dettinger, 1989; Maurer and Berger, 1997; Maurer et al., 1996; Russell and Minor, 2003). This method employs measured chloride concentrations in the saturated zone and estimates of chloride
4
flux from the atmosphere to the land surface, under several simplifying assumptions, to estimate groundwater recharge emanating from mountain recharge areas surrounding the hydrographic basin (Claassen et al., 1986; Dettinger, 1989; and Berger et al., 1996). Dettinger (1989) applied the CMB method to 15 basins in Nevada. Two of these, Butte Valley (south) and Spring Valley are in the BARCAS area. Table 3 contains the parameters and results of these analyses.
Table 2. Recharge estimates made by Nichols (2000) for hydrographic basins in the BARCAS
area.
Basin Recharge area (acres)
Precipitation in recharge area (acre-ft/yr)
Estimated recharge (acre-ft/yr)
Butte (N and S) 652,400 700,900 69,000Cave na na naJakes 270,500 289,500 38,200Lake na na naLittle Smoky (N and S) 460,600 378,300 12,700Long 419,800 452,400 48,000Newark 501,600 511,100 49,100Snake na na naSpring 1,067,000 1,141,400 103,600Steptoe 1,245,600 1,344,200 131,500Tippett 221,600 211,900 12,400White River na na na Table 3. Estimation of groundwater recharge in Butte and Spring Valley using the chloride mass
balance method as published in Dettinger (1989)
Basin
Estimated runoff to discharge areas
(acre-ft/yr)
Estimated precipitation to
source areas (acre-ft/yr)
Assumed recharge
cutoff altitude (ft)
Chloride concentration in recharge
(mg/l)
Recharge estimate
(acre-ft/yr)
Butte (S) 811 243,300 5,900 7.6 12,200Spring 4,055 786,670 5,900 5.1 61,600
Russell and Minor (2003) modified the CMB method to incorporate the dependence of precipitation and evapotranspiration on elevation. Analyses of chloride in discharge from multiple springs, representing a variety of elevations, were used to develop a relationship between elevation and chloride enrichment. This relationship was combined with elevation explicit precipitation data to develop an estimate of groundwater recharge. The elevation-dependent chloride mass balance method has been applied in several hydrographic basins in southern Nevada (Russell and Minor, 2003) and to Steptoe Valley (Mizell et al., in preparation), which is within the BARCAS area. Mizell et al. (in preparation) utilized the elevation-dependent chloride mass balance method along with various combinations of assumptions regarding the lower limit of recharge and the inclusion or exclusion of surface water runoff to calculate recharge for four separate models. Mean recharge of these four models ranged from 49,000 to 73,500 acre-ft/yr.
5
CONCEPTUAL MODEL The CMB approach to estimating groundwater recharge is based on the conservative
(non-reactive) nature of chloride in groundwater. The analysis assumes that atmospheric chloride is the only significant source of chloride in groundwater or that all sources of chloride input to, and removal from, groundwater are known. Groundwater recharge estimates using the CMB approach are based on the relationship between chloride in precipitation and chloride in groundwater. The following description of the concepts underlying the analysis is abridged from Dettinger (1989).
Conceptually the chloride mass balance may be thought of as occurring in the portion of the soil zone that is subject to direct evaporation and plant transpiration. Precipitation, which entrains chloride as a result of wet-fall (chloride scrubbed from the atmosphere as precipitation forms and falls) and dry-fall (dissolution of atmospheric chloride deposited and retained on the ground surface between precipitation events), provides the water and chloride input to the balance zone. Recharge, surface runoff, and evapotranspiration are the paths for water removal from the balance zone. Surface runoff is assumed to occur at the ground surface and thus conduct chloride away from the balance zone at approximately the same concentration as is present in precipitation. Although evapotranspiration removes water from the balance zone, it does not remove chloride. Therefore, chloride concentrations in the recharge water must increase to preserve the chloride mass balance. The actual processes occurring within the balance zone can be much more complicated than described. A simple mathematical expression of this balance is represented by
PCp = RCgw + SCsw +ETCet (1) where: P = precipitation volume R = recharge volume S = surface runoff volume ET = evaporation and transpiration losses Cp = chloride concentration in precipitation Cgw = chloride concentration in groundwater Csw = chloride concentration in surface runoff Cet = chloride concentration in ET (Cet = 0).
Because the evaporation and transpiration processes remove water without removing dissolved constituents (Cet = 0), the third term on the right side of Equation 1 is zero. If there is no surface runoff (S = 0) to remove chloride from the recharge area, the surface water term in the above equation is also eliminated. If the surface runoff term is negligible or not quantified, then neglecting the surface runoff term leads to a first approximation of groundwater recharge. Under these conditions (Cet = 0 and S = 0) Equation 1 reduces to
R = P(Cp/Cgw) (2)
6
In Equation 2 the ratio Cgw/Cp describes the enrichment of chloride in groundwater related to chloride in precipitation. As a first approximation of groundwater recharge, Equation 2 will result in a larger estimate than would be the case if surface runoff were quantified and included in the calculation.
The CMB approach to estimate average annual groundwater recharge requires that input parameters be characterized as average annual values and that chloride be derived exclusively from atmospheric sources. Spaulding and Graumlich (1986) report that precipitation rates in the southern Great Basin region have been relatively constant over the last several thousand years as evidenced in flora preserved in spatially-distributed packrat middens. In addition, chloride deposition rates in south-central Nevada and the southwest United States have been relatively constant as indicated by correlations between climatic variation and chloride ages calculated from modern accumulation rates (Fouty, 1989; Phillips, 1994; Tyler et al., 1996). Thus, using available precipitation records to represent long-term precipitation conditions and using limited measurements of chloride in precipitation and groundwater appear to be reasonable approximations.
Geologic units in the BARCAS area consist principally of preCambrian quartzite rocks, Paleozoic limestone and shale units, Mesozoic and Tertiary volcanic and sedimentary rocks, and Quaternary alluvium (Stewart and Carlson, 1978; Eakin et al., 1967; and Mast and Clow, 2000). These lithologies led Dettinger (1989) and Mast and Clow (2000) to assume that geologic materials in the region do not contain authigenic chloride that would influence the chloride concentration in groundwater. Chloride that might accumulate in surface features such as playas is presumed to be sufficiently far down the groundwater flow path so as not to influence the chloride concentration in groundwater near the recharge areas. However, these chloride source areas might contribute to precipitation chloride as a result of dust entrainment in the atmosphere. Chloride sources contributing to chloride in the atmosphere, and hence chloride in precipitation, are not distinguished in this analysis.
All of the parameters in Equation 1 or 2 are likely to exhibit both spatial and temporal variability. The precipitation data incorporate this variability through the use of long records at collection stations and interpolation methods that recognize factors influencing spatial variation. Chloride data in precipitation are limited and, for the BARCAS area, lack both spatial and temporal definition. Spatial distribution information for groundwater chloride is somewhat better than for the precipitation data. However, as criterion intended to constrain groundwater chloride data to values representative of the recharge area are applied, the number of usable values diminishes rapidly. Additionally, multiple groundwater chloride data are seldom collected from any of the sample locations in the BARCAS area; therefore, groundwater chloride data lack a temporal dimension. Uncertainty in the input data resulting from spatial and temporal variability and other sources is ignored in the present analysis due to limitations in the available data.
DATA ACQUISITION Precipitation
The Precipitation-elevation Regressions on Independent Slopes Model (PRISM) (Daly et al., 1994 and 2004) is used to interpolate point values of precipitation. It incorporates the influence of elevation, slope, and aspect in the interpolation process. Although it has been shown that the PRISM interpolation scheme does not honor the
7
measured data (Epstein, 2004), it is generally considered the best available methodology for interpolating sparse spatially-distributed precipitation data.
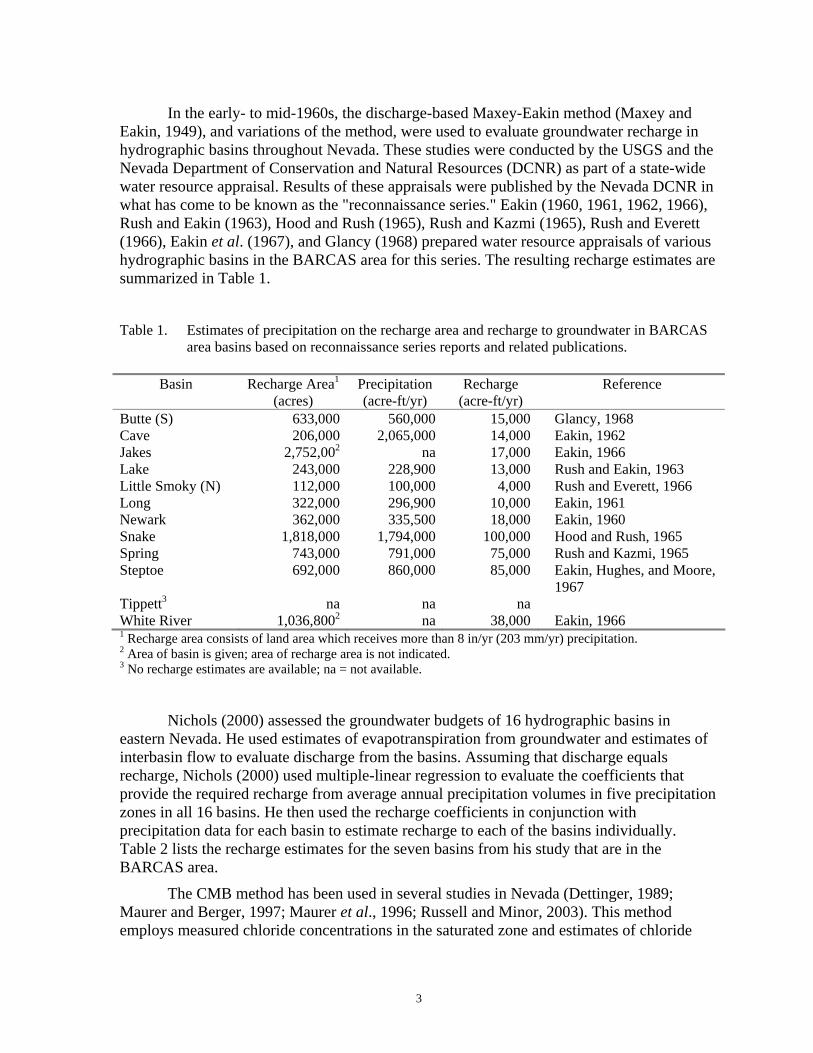
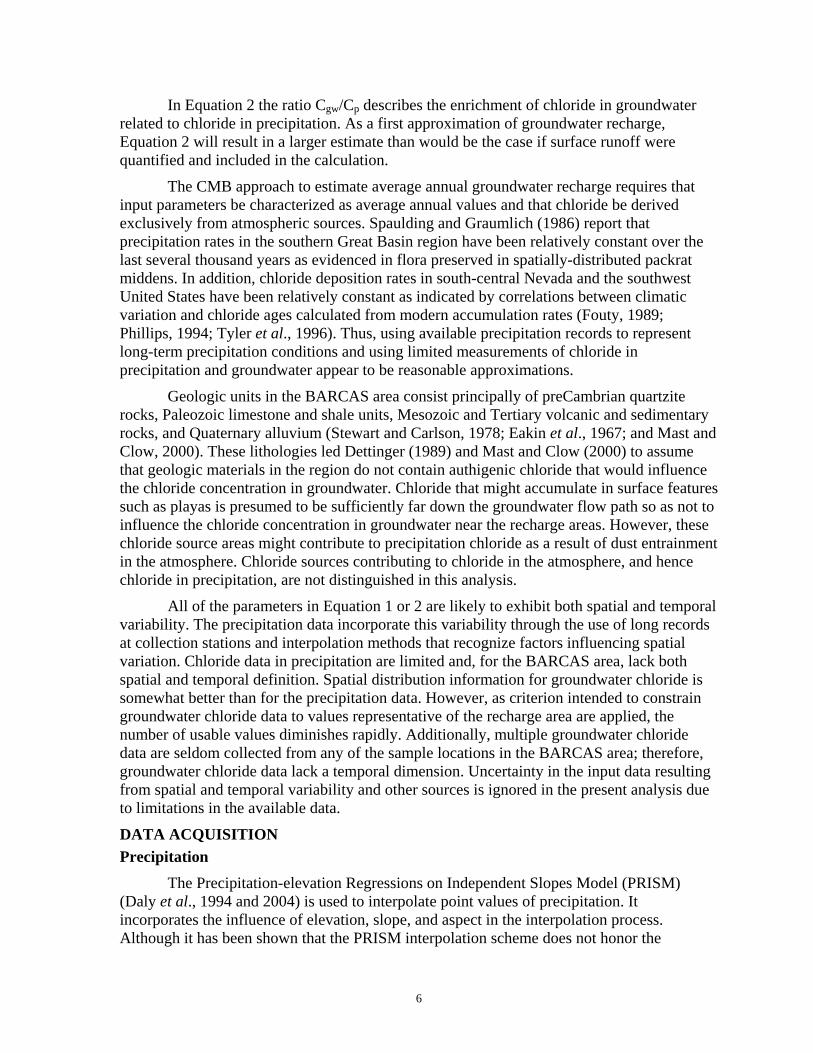
PRISM (Daly et al., 1994 and 2004) generates monthly average precipitation data at a grid spacing of 4,000 m (13,120 ft). These data were downscaled to a grid spacing of 270 m (880 ft) using a model from Nalder and Wein (1998) that combines a spatial gradient plus inverse distance squared weighting to interpolate grid cell values from point data using a multiple regression process. These precipitation data were received, in the downscaled format, from the USGS and are the same data set used by the USGS in estimating recharge for the BARCAS study by the Basin Characterization Model (Flint et al., in preparation), facilitating comparison of results. This comparison will not be made in this report but is expected to be presented in a separate document. Figure 2 shows the distribution of PRISM precipitation estimate across the BARCAS area.
Chloride in Precipitation Several previous studies have attempted to determine the effective concentration of
chloride in precipitation in Nevada. Junge and Werby (1958) reported an effective chloride concentration in precipitation ranging from 0.25 to 0.35 mg/l for that area of the United States in which the BARCAS study occurs. Berger et al., (1996) collected 24 samples of bulk precipitation from five stations in Spanish Springs Valley, west-central Nevada, from 1992 to 1993. The average chloride concentration of these samples was 0.38 mg/l. Fabryka-Martin et al., (1993) and Russell and Minor (2003) used a methodology whereby measured concentrations of 36Cl/Cl ratios, cosmogenic production rates of 36Cl, and precipitation rates were used to estimate the effective concentration of chloride in precipitation. These studies determined the effective concentration of chloride in precipitation as 0.62 mg/l and 0.43 mg/l, respectively. The former value may have been impacted by epigenic production of 36Cl.
Dettinger (1989) collected 75 atmospheric chloride samples from 32 locations across Nevada during the period of 1981 to 1983. This information was compiled with samples collected from 42 other locations in Nevada that had been previously reported. The mean value for all samples was 0.43 mg/l (median was 0.35 mg/l). Both wet-fall and aerosol chloride were collected at eight of the locations. The mean chloride value for the wet-fall and aerosol sites was 0.61 mg/l. The mean chloride value for sites where only wet-fall chloride was measured was 0.4 mg/l. The difference between the two types of measures was largely attributed to remobilization of previously deposited chloride being trapped within the combined wet-fall and aerosol collectors. Using historic data, Dettinger (1989) compared the ratio of recharge to precipitation against chloride concentration in recharge and concluded that the chloride concentration in precipitation should be 0.42 mg/l. Due to the similarity of these two estimates, the small number of bulk chloride collection sites, and the poorly understood relationship between bulk precipitation and total chloride input, Dettinger chose 0.4 mg/l to represent chloride concentration in precipitation.
8
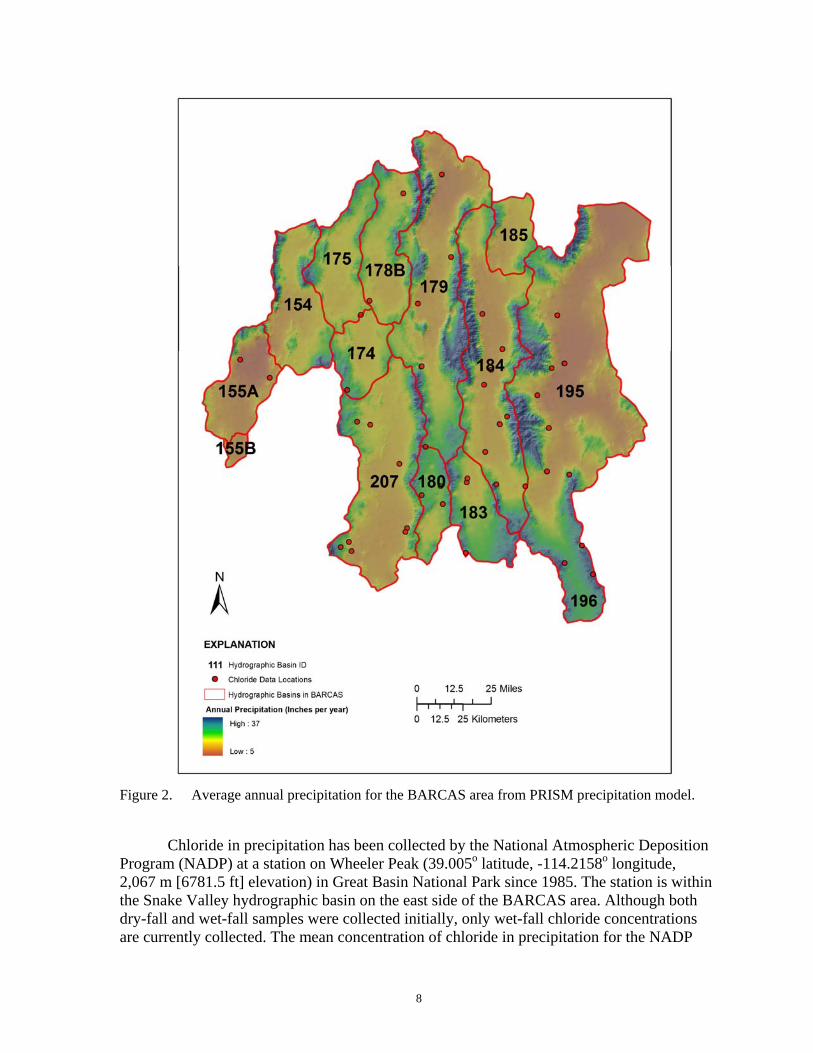
Figure 2. Average annual precipitation for the BARCAS area from PRISM precipitation model.
Chloride in precipitation has been collected by the National Atmospheric Deposition Program (NADP) at a station on Wheeler Peak (39.005o latitude, -114.2158o longitude, 2,067 m [6781.5 ft] elevation) in Great Basin National Park since 1985. The station is within the Snake Valley hydrographic basin on the east side of the BARCAS area. Although both dry-fall and wet-fall samples were collected initially, only wet-fall chloride concentrations are currently collected. The mean concentration of chloride in precipitation for the NADP
9
data is 0.16 mg/l. This value is significantly lower than the means reported for observed data in the studies cited above. The difference is likely due to a bias for collecting predominantly wet-fall samples in the NDAP record. The NADP data can be used to define a lower bound for estimates of effective chloride concentration in precipitation and to characterize the temporal variability of chloride in precipitation.
The mean value of effective chloride concentration in precipitation used in the present analysis (0.4 mg/l) was based on the weighted mean value of the estimates cited by Dettinger (1989), Berger et al. (1996), Russell and Minor (2003), and Fabryka-Martin et al. (1993). Weights were based on the number of samples reported in each of the cited studies.
Uncertainty in the estimate of chloride in precipitation may be largely due to the small number of measurements available. For their data sets, Berger et al. (1996) and Dettinger (1989) reported very large standard deviations that approached the mean value. Such large standard deviations likely represent inter-storm and spatial variability rather than uncertainty in the long-term average. An alternate measure of parametric uncertainty, the standard error of the mean, is used in the present study. Reported values for standard error of the mean range from 0.013 for the NADP data from Wheeler Peak to 0.062 mg/l for data reported by Dettinger (1989). An intermediate value of 0.03 mg/l was chosen to represent parametric uncertainty for the mean effective concentration of chloride in precipitation.
Chloride in Groundwater A water chemistry database (Hershey and Justet written communication,
July 21, 2006; Hershey and Justet, in preparation) was developed to facilitate interpretation of groundwater flow patterns and to support assessment of water quality in the BARCAS area. Development of this chemistry database occurred simultaneously with the CMB recharge assessment. Database contents were drawn from the USGS National Water Information System, National Uranium Resource Evaluation, and Ground-Water Data Network databases and from original sample collection. The sample locations and chloride concentrations in this database were used in the CMB analysis.
Dettinger’s (1989) method is based on chloride concentration for groundwater obtained from springs and wells that are selected to represent water recharged within the hydrographic basin of interest. To represent the recharge area, chloride sample locations must be low enough in the recharge area to intercept groundwater originating at various elevations in the recharge area and close enough to the recharge area so as not to be influenced by chemical evolution along flow paths, underflow from adjacent basins, or concentration due to evaporation in discharge areas.
For the BARCAS CMB application, the database generated by Hershey and Justet (in preparation) was edited to remove samples explicitly identified as having been drawn from surface water and precipitation sources. Samples clearly associated with unique geologic or hydrogeologic conditions that might affect chloride concentration, for example, thermal springs or saline sediments of Pleistocene Lake Bonneville, were also eliminated. Sample locations judged to be some distance down flow-path from the recharge area, as suggested by potentiometric surface maps (Wilson, in preparation), were removed due to the potential for water chemistry changes associated with long residence time in the flow system. Spring samples considered to be at excessively high elevations in the mountains were eliminated on the grounds that they were supplied by a very limited collection area and were not
10
representative of a sufficiently large segment of the recharge area. The ability of groundwater chloride to represent recharge from infiltration of precipitation might also be evaluated using other criteria such as spring catchment area or well screen length and depth. Such additional evaluations were not considered in selection of data for this CMB analysis.
In addition, completeness of the major ion chemistry analyses was considered in choosing data for the CMB analysis. In a complete and perfectly balanced major ion analysis, the ratio of anion milliequivalents to cation milliequivalents will equal one. Anion-cation ratios that lie within the range of one plus or minus 0.05 are generally considered high quality. Similarly, Hem (1985) suggests that the difference between anions and cations, expressed in milliequivalents, in carefully performed major ion analyses generally will not exceed about two percent of the sum of the anion and cation milliequivalents. Chloride data used in the CMB recharge analysis was limited to those samples for which the anion-cation difference was determined to be less than 2.6 percent of the anion-cation sum.
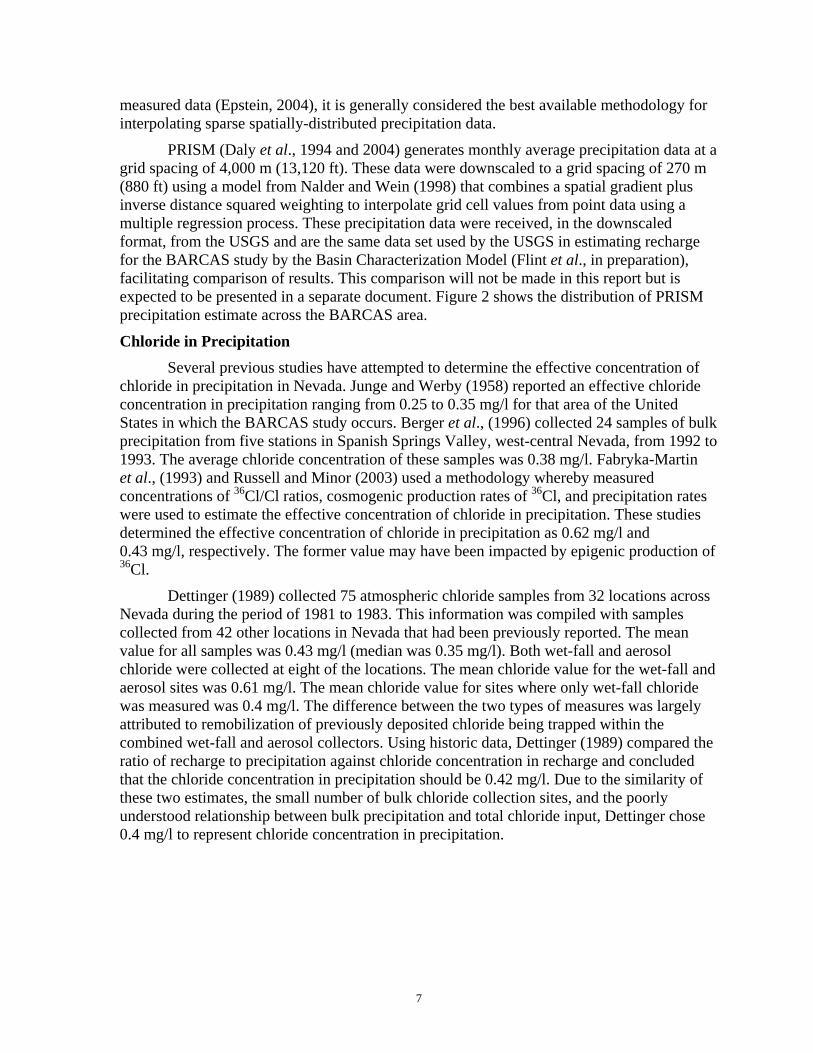
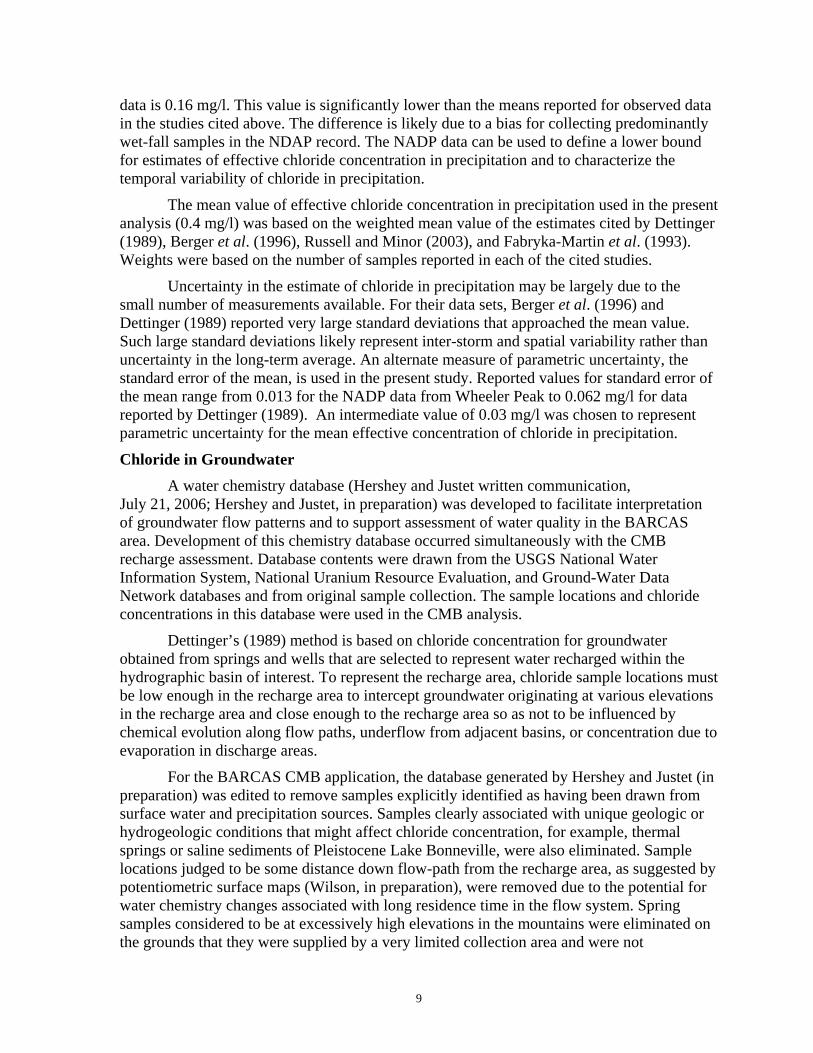
Fifty-eight sample analyses were selected from the BARCAS water chemistry data base using the above criteria (see Appendix). These samples were distributed at 43 locations in nine of the twelve BARCAS area hydrographic basins (Figure 3); some locations were sampled multiple times. Basins with the largest number of sample points were Snake Valley (15), Spring Valley (11), Steptoe Valley (12), and White River Valley (8). Many of the basins contained only two or three sample points. No groundwater chloride values were available for Long Valley, Newark Valley, or Tippett Valley.
Where groundwater chloride data are available, recharge areas within each hydrographic basin were subdivided to accommodate potential variations in precipitation and geologic conditions that might affect recharge. The distribution of groundwater chloride data allowed eight basins to be divided into east and west recharge areas (Figure 3). Steptoe Valley was divided into east, northwest and southwest recharge areas. In many of the subdivided recharge areas only one groundwater chloride value was available. Therefore, it was not possible to quantify uncertainty in the groundwater chloride data and this uncertainty was not included in the recharge estimation.
Lower Limit of Recharge
Recharge to groundwater in the Great Basin is generally considered to occur in the mountains that surround the valleys because they receive noticeably more precipitation than does the valley floor. The lowest elevation at which recharge occurs is likely a function of the relative magnitude of precipitation and evapotranspiration. However, data are not available to determine this boundary. The lower limit of recharge is significant because it defines the recharge contribution area. This in turn controls the volume of precipitation available for recharge.
Previous studies have approximated the lower limit of recharge based on precipitation rates and geologic conditions. Eakin et al. (1967) and Nichols (2000) identified areas receiving mean annual precipitation of 203 mm (8 in) or less as producing negligible recharge. In the reconnaissance series assessments (e.g. Rush and Kazmi, 1965), the precipitation zone receiving less than 8 in a year is generally associated with, and frequently represented by, the 6,000 ft elevation contour. Russell and Minor (2003) suggest the contact between alluvial sediments and consolidated rock identifies the lower limit of recharge; however, their study area in southern Nevada is warmer and dryer than the BARCAS area.
11
Dettinger (1989) adopted 1,800 m (5,900 ft) as the lower limit of recharge for his analysis in several eastern Nevada basins based on the 6,000 ft level used in the reconnaissance series assessments.
Figure 3. Groundwater chloride data points for CMB recharge assessment in the BARCAS area.
12
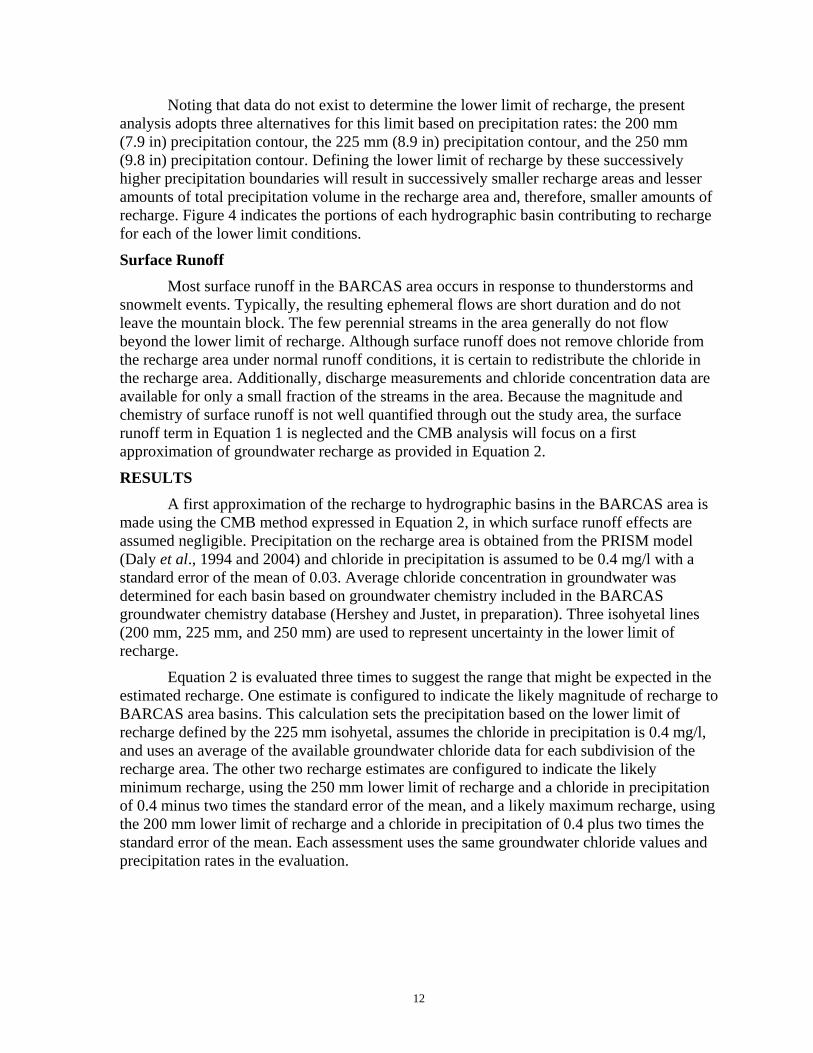
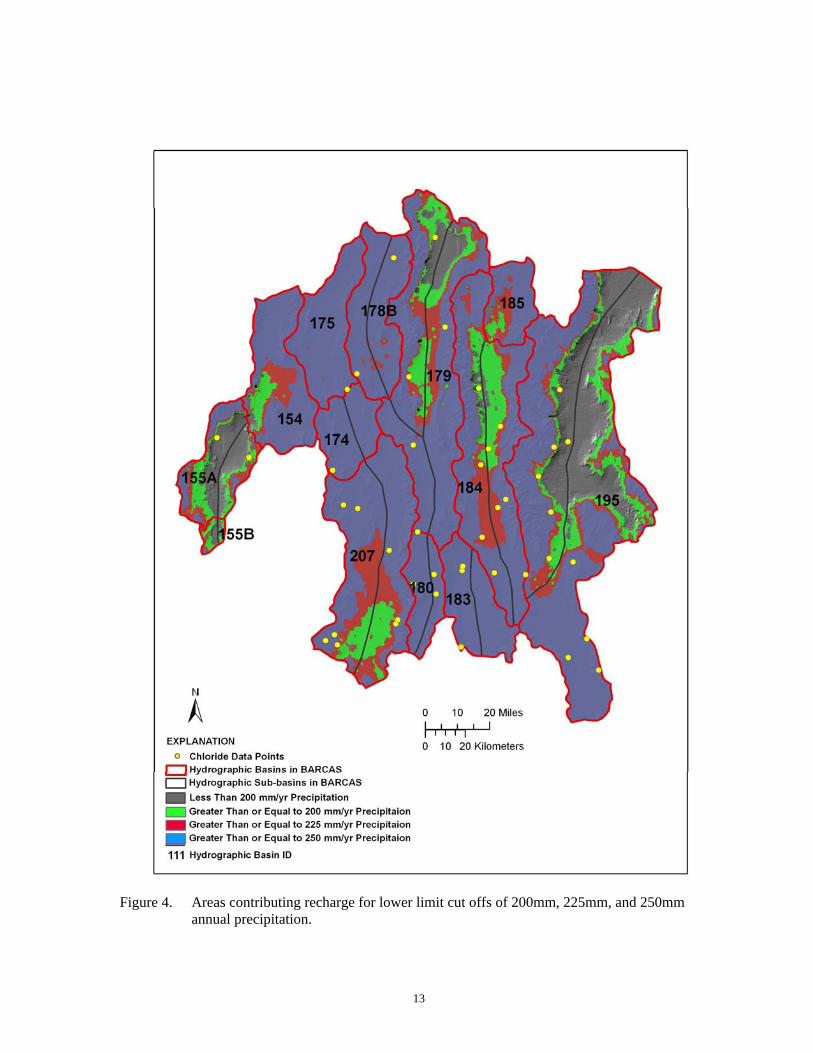
Noting that data do not exist to determine the lower limit of recharge, the present analysis adopts three alternatives for this limit based on precipitation rates: the 200 mm (7.9 in) precipitation contour, the 225 mm (8.9 in) precipitation contour, and the 250 mm (9.8 in) precipitation contour. Defining the lower limit of recharge by these successively higher precipitation boundaries will result in successively smaller recharge areas and lesser amounts of total precipitation volume in the recharge area and, therefore, smaller amounts of recharge. Figure 4 indicates the portions of each hydrographic basin contributing to recharge for each of the lower limit conditions.
Surface Runoff Most surface runoff in the BARCAS area occurs in response to thunderstorms and
snowmelt events. Typically, the resulting ephemeral flows are short duration and do not leave the mountain block. The few perennial streams in the area generally do not flow beyond the lower limit of recharge. Although surface runoff does not remove chloride from the recharge area under normal runoff conditions, it is certain to redistribute the chloride in the recharge area. Additionally, discharge measurements and chloride concentration data are available for only a small fraction of the streams in the area. Because the magnitude and chemistry of surface runoff is not well quantified through out the study area, the surface runoff term in Equation 1 is neglected and the CMB analysis will focus on a first approximation of groundwater recharge as provided in Equation 2.
RESULTS A first approximation of the recharge to hydrographic basins in the BARCAS area is
made using the CMB method expressed in Equation 2, in which surface runoff effects are assumed negligible. Precipitation on the recharge area is obtained from the PRISM model (Daly et al., 1994 and 2004) and chloride in precipitation is assumed to be 0.4 mg/l with a standard error of the mean of 0.03. Average chloride concentration in groundwater was determined for each basin based on groundwater chemistry included in the BARCAS groundwater chemistry database (Hershey and Justet, in preparation). Three isohyetal lines (200 mm, 225 mm, and 250 mm) are used to represent uncertainty in the lower limit of recharge.
Equation 2 is evaluated three times to suggest the range that might be expected in the estimated recharge. One estimate is configured to indicate the likely magnitude of recharge to BARCAS area basins. This calculation sets the precipitation based on the lower limit of recharge defined by the 225 mm isohyetal, assumes the chloride in precipitation is 0.4 mg/l, and uses an average of the available groundwater chloride data for each subdivision of the recharge area. The other two recharge estimates are configured to indicate the likely minimum recharge, using the 250 mm lower limit of recharge and a chloride in precipitation of 0.4 minus two times the standard error of the mean, and a likely maximum recharge, using the 200 mm lower limit of recharge and a chloride in precipitation of 0.4 plus two times the standard error of the mean. Each assessment uses the same groundwater chloride values and precipitation rates in the evaluation.
13
Figure 4. Areas contributing recharge for lower limit cut offs of 200mm, 225mm, and 250mm
annual precipitation.
14
Tables 4, 5, and 6 present the recharge estimates resulting from these calculations. Recharge estimates were not made for Long, Newark, or Tippett valleys because no groundwater chloride data with an acceptable cation-anion balance were available. The total BARCAS area recharge using the CMB method ranges from 328,000 AFY to 539,000 AFY with a likely mid-point recharge value of about 424,000 AFY.
Area contributing recharge in Cave, Jakes, and Lake valleys is the same for all three lower limit conditions because no portion of these valleys receives less than 250 mm (9.8 in) of precipitation. The area contributing recharge in Butte and Long valleys were the same for the 225 mm and 200 mm lower limits of recharge, because no portion of these valleys receives less than 225 mm (8.9 in) of precipitation. When the lower limit of recharge boundaries does not delineate different contributing areas, as in these basins, the difference between the estimated recharge amounts is due to the change in assumed concentration of chloride in precipitation. The chloride in precipitation for the maximum and minimum cases is about 15 percent more or less than the mid-point case, respectively. Associated differences in estimated recharge shown in Tables 4, 5, and 6 are not quite 15 percent due to rounding of the recharge values. Differences in the recharge estimates for the minimum, mid-point, and maximum evaluations in Little Smoky, Snake, Spring, Steptoe, and White River valleys are due to the combined effect of the change in contributing area and the assumed variations in chloride in precipitation.
Butte and Cave valleys are determined by the CMB method to generate about the same volume of groundwater recharge despite the fact that Butte Valley is more than twice the size of Cave Valley. The estimated recharge volumes for these valleys are about the same because the selected groundwater chloride concentrations in Cave Valley are about half of the concentrations in Butte Valley. The area and groundwater chloride concentration differences are approximately offsetting resulting in the similar recharge estimates.
Groundwater chloride concentrations are also the reason for the surprisingly low recharge volume estimated for Snake Valley. Snake Valley contains the largest recharge contributing area in each evaluation and has average precipitation rates that are greater than the average for the BARCAS area. However, the groundwater chloride concentrations for Snake Valley are three or four times higher than commonly found in the BARCAS area. If the groundwater chloride concentrations in Snake Valley were 8 mg/l, about the average value for the BARCAS area, the estimated recharge would be more than twice the value determined. The explanation for the high chloride concentrations in groundwater in Snake Valley is uncertain, however, much of the valley was inundated by or on the shore line of Pleistocene Lake Bonneville which may have resulted in unusually high salinity levels in area sediments.
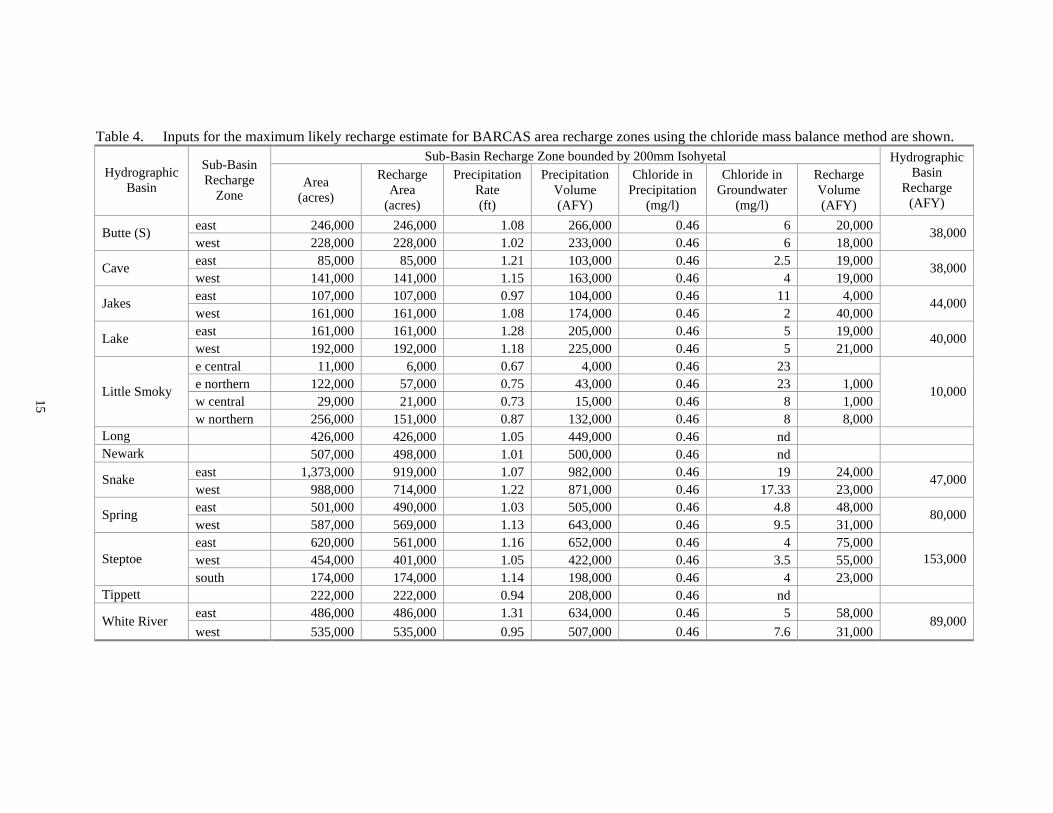
Table 4. Inputs for the maximum likely recharge estimate for BARCAS area recharge zones using the chloride mass balance method are shown. Sub-Basin Recharge Zone bounded by 200mm Isohyetal
Hydrographic Basin
Sub-Basin Recharge
Zone Area
(acres)
Recharge Area
(acres)
Precipitation Rate (ft)
Precipitation Volume (AFY)
Chloride in Precipitation
(mg/l)
Chloride in Groundwater
(mg/l)
Recharge Volume (AFY)
Hydrographic Basin
Recharge (AFY)
east 246,000 246,000 1.08 266,000 0.46 6 20,000 Butte (S) west 228,000 228,000 1.02 233,000 0.46 6 18,000
38,000
east 85,000 85,000 1.21 103,000 0.46 2.5 19,000 Cave west 141,000 141,000 1.15 163,000 0.46 4 19,000
38,000
east 107,000 107,000 0.97 104,000 0.46 11 4,000 Jakes west 161,000 161,000 1.08 174,000 0.46 2 40,000
44,000
east 161,000 161,000 1.28 205,000 0.46 5 19,000 Lake west 192,000 192,000 1.18 225,000 0.46 5 21,000
40,000
e central 11,000 6,000 0.67 4,000 0.46 23 e northern 122,000 57,000 0.75 43,000 0.46 23 1,000 w central 29,000 21,000 0.73 15,000 0.46 8 1,000
Little Smoky
w northern 256,000 151,000 0.87 132,000 0.46 8 8,000
10,000
Long 426,000 426,000 1.05 449,000 0.46 nd Newark 507,000 498,000 1.01 500,000 0.46 nd
east 1,373,000 919,000 1.07 982,000 0.46 19 24,000 Snake west 988,000 714,000 1.22 871,000 0.46 17.33 23,000
47,000
east 501,000 490,000 1.03 505,000 0.46 4.8 48,000 Spring west 587,000 569,000 1.13 643,000 0.46 9.5 31,000
80,000
east 620,000 561,000 1.16 652,000 0.46 4 75,000 west 454,000 401,000 1.05 422,000 0.46 3.5 55,000 Steptoe south 174,000 174,000 1.14 198,000 0.46 4 23,000
153,000
Tippett 222,000 222,000 0.94 208,000 0.46 nd east 486,000 486,000 1.31 634,000 0.46 5 58,000 White River west 535,000 535,000 0.95 507,000 0.46 7.6 31,000
89,000
15
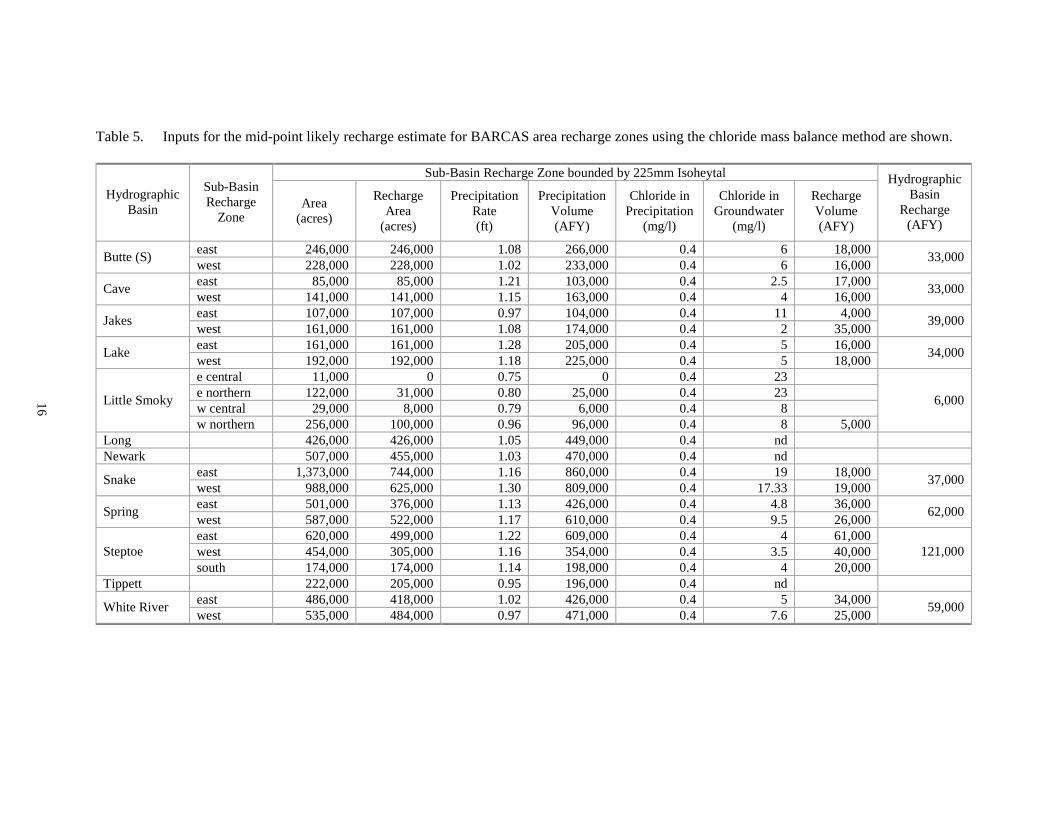
Table 5. Inputs for the mid-point likely recharge estimate for BARCAS area recharge zones using the chloride mass balance method are shown.
Sub-Basin Recharge Zone bounded by 225mm Isoheytal Hydrographic
Basin
Sub-Basin Recharge
Zone Area
(acres)
Recharge Area
(acres)
Precipitation Rate (ft)
Precipitation Volume (AFY)
Chloride in Precipitation
(mg/l)
Chloride in Groundwater
(mg/l)
Recharge Volume (AFY)
Hydrographic Basin
Recharge (AFY)
east 246,000 246,000 1.08 266,000 0.4 6 18,000 Butte (S) west 228,000 228,000 1.02 233,000 0.4 6 16,000 33,000
east 85,000 85,000 1.21 103,000 0.4 2.5 17,000 Cave west 141,000 141,000 1.15 163,000 0.4 4 16,000 33,000
east 107,000 107,000 0.97 104,000 0.4 11 4,000 Jakes west 161,000 161,000 1.08 174,000 0.4 2 35,000 39,000
east 161,000 161,000 1.28 205,000 0.4 5 16,000 Lake west 192,000 192,000 1.18 225,000 0.4 5 18,000 34,000
e central 11,000 0 0.75 0 0.4 23 e northern 122,000 31,000 0.80 25,000 0.4 23 w central 29,000 8,000 0.79 6,000 0.4 8 Little Smoky
w northern 256,000 100,000 0.96 96,000 0.4 8 5,000
6,000
Long 426,000 426,000 1.05 449,000 0.4 nd Newark 507,000 455,000 1.03 470,000 0.4 nd
east 1,373,000 744,000 1.16 860,000 0.4 19 18,000 Snake west 988,000 625,000 1.30 809,000 0.4 17.33 19,000 37,000
east 501,000 376,000 1.13 426,000 0.4 4.8 36,000 Spring west 587,000 522,000 1.17 610,000 0.4 9.5 26,000 62,000
east 620,000 499,000 1.22 609,000 0.4 4 61,000 west 454,000 305,000 1.16 354,000 0.4 3.5 40,000 Steptoe south 174,000 174,000 1.14 198,000 0.4 4 20,000
121,000
Tippett 222,000 205,000 0.95 196,000 0.4 nd east 486,000 418,000 1.02 426,000 0.4 5 34,000 White River west 535,000 484,000 0.97 471,000 0.4 7.6 25,000 59,000
16
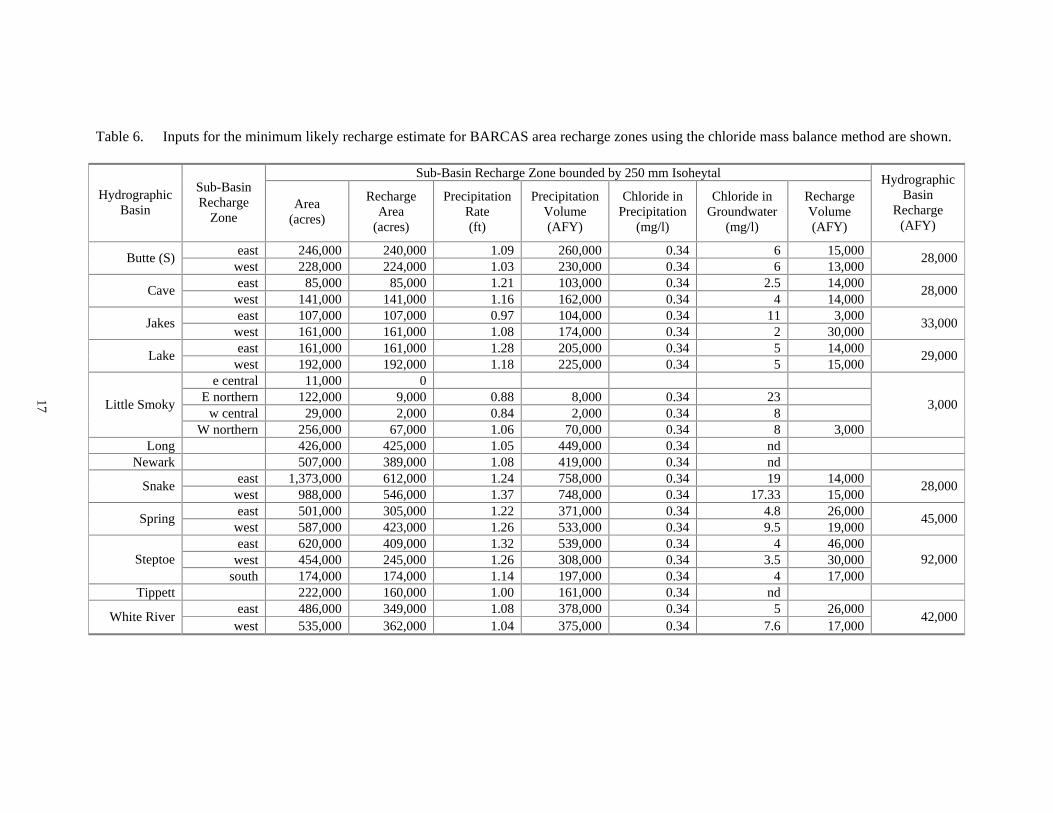
Table 6. Inputs for the minimum likely recharge estimate for BARCAS area recharge zones using the chloride mass balance method are shown.
Sub-Basin Recharge Zone bounded by 250 mm Isoheytal
Hydrographic Basin
Sub-Basin Recharge
Zone Area
(acres)
Recharge Area
(acres)
Precipitation Rate (ft)
Precipitation Volume (AFY)
Chloride in Precipitation
(mg/l)
Chloride in Groundwater
(mg/l)
Recharge Volume (AFY)
Hydrographic Basin
Recharge (AFY)
east 246,000 240,000 1.09 260,000 0.34 6 15,000 Butte (S) west 228,000 224,000 1.03 230,000 0.34 6 13,000 28,000
east 85,000 85,000 1.21 103,000 0.34 2.5 14,000 Cave west 141,000 141,000 1.16 162,000 0.34 4 14,000
28,000
east 107,000 107,000 0.97 104,000 0.34 11 3,000 Jakes west 161,000 161,000 1.08 174,000 0.34 2 30,000 33,000
east 161,000 161,000 1.28 205,000 0.34 5 14,000 Lake west 192,000 192,000 1.18 225,000 0.34 5 15,000 29,000
e central 11,000 0 E northern 122,000 9,000 0.88 8,000 0.34 23
w central 29,000 2,000 0.84 2,000 0.34 8 Little Smoky
W northern 256,000 67,000 1.06 70,000 0.34 8 3,000
3,000
Long 426,000 425,000 1.05 449,000 0.34 nd Newark 507,000 389,000 1.08 419,000 0.34 nd
east 1,373,000 612,000 1.24 758,000 0.34 19 14,000 Snake west 988,000 546,000 1.37 748,000 0.34 17.33 15,000 28,000
east 501,000 305,000 1.22 371,000 0.34 4.8 26,000 Spring west 587,000 423,000 1.26 533,000 0.34 9.5 19,000 45,000
east 620,000 409,000 1.32 539,000 0.34 4 46,000 west 454,000 245,000 1.26 308,000 0.34 3.5 30,000 Steptoe
south 174,000 174,000 1.14 197,000 0.34 4 17,000 92,000
Tippett 222,000 160,000 1.00 161,000 0.34 nd east 486,000 349,000 1.08 378,000 0.34 5 26,000 White River
west 535,000 362,000 1.04 375,000 0.34 7.6 17,000 42,000
17
18
COMPARISON TO PREVIOUS RECHARGE ESTIMATES
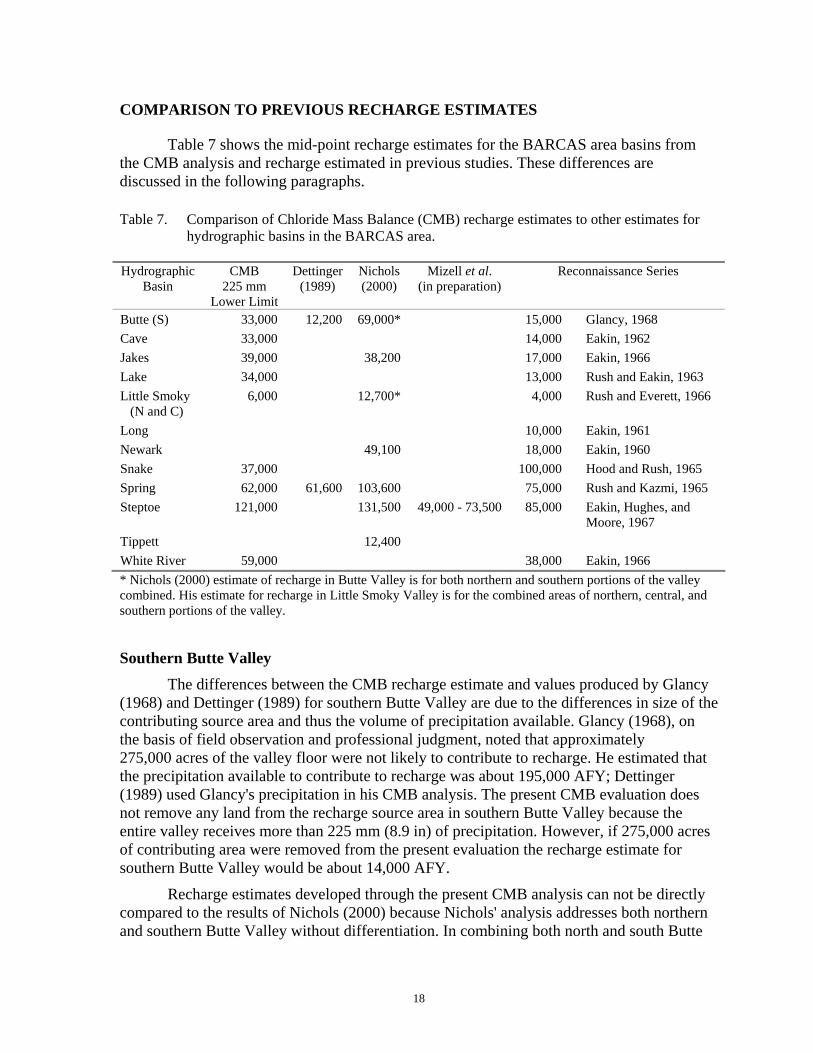
Table 7 shows the mid-point recharge estimates for the BARCAS area basins from the CMB analysis and recharge estimated in previous studies. These differences are discussed in the following paragraphs.
Table 7. Comparison of Chloride Mass Balance (CMB) recharge estimates to other estimates for hydrographic basins in the BARCAS area.
Hydrographic
Basin CMB
225 mm Lower Limit
Dettinger (1989)
Nichols (2000)
Mizell et al. (in preparation)
Reconnaissance Series
Butte (S) 33,000 12,200 69,000* 15,000 Glancy, 1968 Cave 33,000 14,000 Eakin, 1962 Jakes 39,000 38,200 17,000 Eakin, 1966 Lake 34,000 13,000 Rush and Eakin, 1963 Little Smoky (N and C)
6,000 12,700* 4,000 Rush and Everett, 1966
Long 10,000 Eakin, 1961 Newark 49,100 18,000 Eakin, 1960 Snake 37,000 100,000 Hood and Rush, 1965 Spring 62,000 61,600 103,600 75,000 Rush and Kazmi, 1965 Steptoe 121,000 131,500 49,000 - 73,500 85,000 Eakin, Hughes, and
Moore, 1967 Tippett 12,400 White River 59,000 38,000 Eakin, 1966 * Nichols (2000) estimate of recharge in Butte Valley is for both northern and southern portions of the valley combined. His estimate for recharge in Little Smoky Valley is for the combined areas of northern, central, and southern portions of the valley. Southern Butte Valley
The differences between the CMB recharge estimate and values produced by Glancy (1968) and Dettinger (1989) for southern Butte Valley are due to the differences in size of the contributing source area and thus the volume of precipitation available. Glancy (1968), on the basis of field observation and professional judgment, noted that approximately 275,000 acres of the valley floor were not likely to contribute to recharge. He estimated that the precipitation available to contribute to recharge was about 195,000 AFY; Dettinger (1989) used Glancy's precipitation in his CMB analysis. The present CMB evaluation does not remove any land from the recharge source area in southern Butte Valley because the entire valley receives more than 225 mm (8.9 in) of precipitation. However, if 275,000 acres of contributing area were removed from the present evaluation the recharge estimate for southern Butte Valley would be about 14,000 AFY.
Recharge estimates developed through the present CMB analysis can not be directly compared to the results of Nichols (2000) because Nichols' analysis addresses both northern and southern Butte Valley without differentiation. In combining both north and south Butte
19
Valley, Nichols (2000) assumed a recharge area of about 652,000 acres. This is about 1.4 times the area of southern Butte Valley used in the present CBM assessment of recharge.
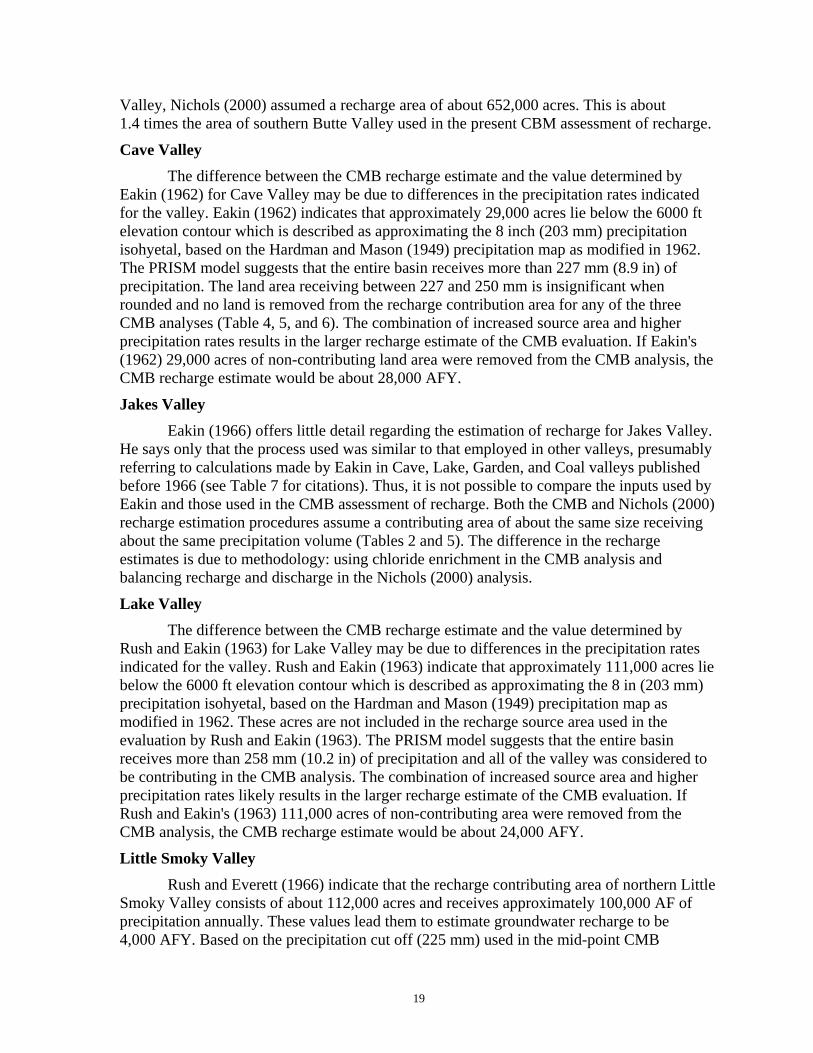
Cave Valley The difference between the CMB recharge estimate and the value determined by
Eakin (1962) for Cave Valley may be due to differences in the precipitation rates indicated for the valley. Eakin (1962) indicates that approximately 29,000 acres lie below the 6000 ft elevation contour which is described as approximating the 8 inch (203 mm) precipitation isohyetal, based on the Hardman and Mason (1949) precipitation map as modified in 1962. The PRISM model suggests that the entire basin receives more than 227 mm (8.9 in) of precipitation. The land area receiving between 227 and 250 mm is insignificant when rounded and no land is removed from the recharge contribution area for any of the three CMB analyses (Table 4, 5, and 6). The combination of increased source area and higher precipitation rates results in the larger recharge estimate of the CMB evaluation. If Eakin's (1962) 29,000 acres of non-contributing land area were removed from the CMB analysis, the CMB recharge estimate would be about 28,000 AFY.
Jakes Valley Eakin (1966) offers little detail regarding the estimation of recharge for Jakes Valley.
He says only that the process used was similar to that employed in other valleys, presumably referring to calculations made by Eakin in Cave, Lake, Garden, and Coal valleys published before 1966 (see Table 7 for citations). Thus, it is not possible to compare the inputs used by Eakin and those used in the CMB assessment of recharge. Both the CMB and Nichols (2000) recharge estimation procedures assume a contributing area of about the same size receiving about the same precipitation volume (Tables 2 and 5). The difference in the recharge estimates is due to methodology: using chloride enrichment in the CMB analysis and balancing recharge and discharge in the Nichols (2000) analysis.
Lake Valley The difference between the CMB recharge estimate and the value determined by
Rush and Eakin (1963) for Lake Valley may be due to differences in the precipitation rates indicated for the valley. Rush and Eakin (1963) indicate that approximately 111,000 acres lie below the 6000 ft elevation contour which is described as approximating the 8 in (203 mm) precipitation isohyetal, based on the Hardman and Mason (1949) precipitation map as modified in 1962. These acres are not included in the recharge source area used in the evaluation by Rush and Eakin (1963). The PRISM model suggests that the entire basin receives more than 258 mm (10.2 in) of precipitation and all of the valley was considered to be contributing in the CMB analysis. The combination of increased source area and higher precipitation rates likely results in the larger recharge estimate of the CMB evaluation. If Rush and Eakin's (1963) 111,000 acres of non-contributing area were removed from the CMB analysis, the CMB recharge estimate would be about 24,000 AFY.
Little Smoky Valley Rush and Everett (1966) indicate that the recharge contributing area of northern Little
Smoky Valley consists of about 112,000 acres and receives approximately 100,000 AF of precipitation annually. These values lead them to estimate groundwater recharge to be 4,000 AFY. Based on the precipitation cut off (225 mm) used in the mid-point CMB
20
recharge evaluation, the recharge source area contains about 140,000 acres and receives precipitation totaling about 127,000 AFY. The combination of larger contributing area and greater precipitation result in the larger recharge estimate using the CMB methodology.
Recharge estimates developed through the present CMB analysis can not be directly compared to the results of Nichols (2000) because Nichols' analysis addresses northern, central, and southern Little Smoky Valley without differentiation. In assessing recharge in the whole of Little Smoky Valley, Nichols (2000) assumed a recharge area of about 460,600 acres. This is about 3.3 times the area of northern and central Little Smoky Valley used in the CBM assessment of recharge.
Snake Valley The difference between the recharge estimated by the CMB analysis and the value
estimated by Hood and Rush (1965) for Snake Valley is the result of differences in assumed contribution area and the extreme chloride enrichment factor found in the CMB analysis. Hood and Rush (1965) remove about 267,000 acres of Hamlin Valley from the recharge area because most of the area is alluvium. As a result they have a recharge contribution area of 1,552,000 acres receiving 1,550,000 AF of precipitation. By comparison the CMB assessment assumes the recharge contribution area above the 225 mm precipitation isohyetal to be about 1,369,000 acres receiving about 1,669,000 AF annually. However, the biggest impact on the CMB recharge estimate is the extremely high chloride enrichment factor; the ratio of groundwater chloride to precipitation chloride is about 45. The high enrichment factor results from the relatively high groundwater chloride concentrations identified in the available chemistry data for the basin. This high enrichment factor results in a very small recharge estimate.
Spring Valley The recharge estimate for Spring Valley by the CMB method is about 20 percent
smaller than the value reported by Rush and Kazmi (1965). The CMB analysis is based on both a larger recharge contributing area and a larger annual precipitation volume at the 225 mm precipitation rate recharge cutoff. The large chloride enrichment factor (groundwater chloride concentration divided by precipitation chloride concentration) results in the smaller recharge estimate. The recharge estimate produced by Dettinger (1989) is about the same magnitude as the value produced in the present analysis.
The CMB recharge estimate for Spring Valley is about 40 percent smaller than the Nichols (2000) estimate. Contributing area in the CMB analysis is about 15 percent smaller than the Nichols (2000) contributing area and the available precipitation volume in the CMB analysis is about 10 percent less than the Nichols (2000) amount (Tables 2 and 5). The difference in the recharge estimates is due to the approach used: using chloride enrichment in the CMB analysis and balancing recharge and discharge in the Nichols (2000) analysis.
Steptoe Valley Eakin et al., (1967) shifted land area from the 12-to-15 in and from the 8-to-12 in
precipitation zones on the basis that the recharge potential of these areas was more appropriately represented by the zones of lower precipitation. These adjustments resulted in a recharge contributing area consisting of 692,000 acres receiving about 810,000 AF of precipitation annually. For the lower limit of recharge delineated by the 225 mm precipitation
21
isohyetal, the recharge contributing area in the CMB analysis consists of 978,000 acres which receive about 1,161,000 AF of precipitation annually. The larger contributing area and the larger precipitation volume generate the larger recharge estimate of the CMB analysis.
The CMB recharge estimate for Steptoe Valley is about 8 percent smaller than the Nichols (2000) estimate. Contributing area in the CMB analysis is about 20 percent smaller than the Nichols (2000) contributing area and the available precipitation volume in the CMB analysis is about 15 percent less than the Nichols (2000) amount (Tables 2 and 5). The difference in the recharge estimates is due to the approach used: using chloride enrichment in the CMB analysis and balancing recharge and discharge in the Nichols (2000) analysis.
White River Valley Maxey and Eakin (1949) offer a general description of the procedure used to estimate
recharge in White River Valley but do not provide sufficient detail to compare size of recharge contributing area or volume of precipitation incident on the recharge area. They identify the Hardman (1936; cited in Maxey and Eakin, 1949) precipitation zone map for Nevada as the source of precipitation data. The highest precipitation levels indicated on the Hardman (1936, 1965) maps are classified simply as greater than 20 in. The PRISM identifies significantly larger estimates of precipitation at higher elevations which in turn may lead to the larger estimates of recharge by the CMB assessment.
POTENTIAL ERRORS WITH THE CMB APPROACH The CMB approach to estimating groundwater recharge is based on a simple
conceptual model and has the great advantage of ease of calculation. However, in characterizing single-valued input parameters as representative of large geographic areas, the method neglects spatial variability and parameter uncertainty.
The PRISM (Daly et al., 1994 and 2004) precipitation interpolator incorporates elevation, aspect, and slope factors to estimate precipitation on 270 m by 270 m (886 ft by 886 ft) grid cells in the modeled area. The precipitation model results thus depict a significant level of spatial variation. However, the spatial variability is neglected when the grid cell values are summed into a total precipitation volume over the recharge area of interest for inclusion in Equation 1.
Other parameters in the CMB analysis are often evaluated from very limited data that are inadequate to evaluate spatial variability, and variability is neglected as the available information is used to generate a single-valued parameter for inclusion in the estimation equation. For example, chloride concentration in groundwater recharge is derived from available data; however, groundwater chemistry data are very sparse and irregularly distributed throughout the BARCAS area. As with the precipitation data, spatial variability information that might be contained in the groundwater chloride data is neglected when a single-valued parameter is developed for the CMB estimation equation.
Additionally, sparse data, available data, and inconsistent collection methodologies used by multiple researchers at various times may lead to uncertainty in the representative value used in the estimation equation. Such uncertainty is neglected in discrete solutions of the estimating equation. This uncertainty could have a significant impact on the recharge estimate. For example, if uncertainty in the chloride concentration in recharge is +/- 10 percent, then the recharge estimate will also have an uncertainty of +/- 10 percent. Similar
22
effects would result from uncertainty in the other input parameters to the CMB equation. However, since these uncertainties are not incorporated in the recharge assessment, uncertainty in the recharge estimate is not indicated. Russell and Minor (2003) and Mizell et al. (in preparation) incorporated some aspects of spatial variability in developing an elevation-dependent modification of the CMB approach and attempted to show the effects of uncertainty in the input data on the recharge estimate using a Monte Carlo solution technique. These modifications, however, are data intensive and outside the scope of the present application.
Potential error in the CMB may also derive from violation of the assumptions underlying application of the method. The method requires knowledge of the chloride concentration in recharge to groundwater. From a practical standpoint, the best that can be done to evaluate this parameter is to collect chloride concentration data from available groundwater sources, wells or springs, on the assumption that these samples access water directly influenced by recharge.
Neglect of surface runoff as a mechanism for removal of chloride from the recharge area is another possible source of error in the recharge estimate. In the present analysis, the assumption that chloride removal with surface runoff from the recharge area is negligible is made due to inadequate data. If the assumption is false and chloride is removed from the recharge area before infiltration, then the present analysis overestimates the recharge volume.
Selection of the lower limit of recharge is critical to the CMB analysis. Changes in delineation of the lower limit of recharge will change the amount of land in the recharge contributing area. The total precipitation on the recharge area is dependent on the land area and elevation of the recharge contribution area; as the land area increases the total precipitation volume increases. Because the lower limit of recharge is associated with lower precipitation rates, the changes in total precipitation on the recharge area are not directly proportional to changes in the recharge area. However, from the simplified CMB equation, it is clear that recharge is directly proportional to total precipitation on the recharge area. For example, in his analysis of recharge from areas in the northwest parts of Las Vegas Valley, Dettinger (1989) reported that a change of +/- 300 m in the elevation of the lower limit of recharge would result in a +/- 20 percent change in the estimated recharge.
Refinement to the CMB analysis would require collection of additional data sufficient to evaluate and quantify uncertainty in the input parameters or, alternatively, development of relationships between input parameters and easily observable information. The latter is the approach of Russell and Minor (2003) in development of the elevation-dependent CMB analysis. Additionally, statistical characterization of uncertainty in the input parameters would allow that uncertainty to be explicitly included in the recharge estimation using a Monte Carlo or similar solution technique.
CONCLUSION
The CMB method described by Dettinger (1989) offers a first approximation of average annual recharge when spatial variations in geologic conditions and vegetation distributions that might influence recharge can be assumed negligible, removal of chloride from the recharge area by surface runoff is insignificant, and available groundwater chloride concentrations are assumed representative of contributions from the recharge area.
23
In general the CMB recharge results are similar to the recharge estimates presented in the reconnaissance series reports. Significant differences appear to be due to differences in the assumed area of recharge contribution and to the fundamental differences in using an aquifer response method and a water-balance method. Recharge estimates from both approaches are likely to be most useful when used in conjunction with other recharge estimation methods to establish the probable range of recharge values for the study area.
Improvement of the CMB recharge estimation procedure requires refinement of the approach to reflect spatial variability and incorporate uncertainty and significant additional data collection to support these improvements. Recognition of spatial variability should include not only precipitation, as incorporated in the PRISM precipitation model (Daly et al., 1994 and 2004), but also variation in chloride enrichment due to evapotranspiration in the recharge area and variation in the atmospheric chloride source term. These improvements require greater understanding of the climatic and terrain factors affecting vegetation distribution and atmospheric deposition in order to develop models to estimate chloride enrichment and chloride source values, respectively.
To incorporate uncertainty in input parameters it is necessary to collect a data set sufficient to evaluate the statistical parameters of each data type and to include those statistical parameters in the recharge estimation routine, perhaps by using a Monte Carlo solution process. Incorporating the statistical character of the input parameters to Equation 1 will allow uncertainty in the resulting recharge estimate to be quantified in terms of statistical parameters defining the distribution function of the recharge estimate.
REFERENCES Berger, D.L., W.C. Ross, C.E. Thodal, and A.R. Robledo, 1996. Hydrogeology and
simulated effects of urban development on water resources of Spanish Springs Valley, Washoe County, West-Central Nevada. U.S. Geological Survey Water-Resources Investigations Report 96-4297.
Claassen, H.C., M.M. Reddy, and D.R. Halm, 1986. Use of the chloride ion in determining hydrologic-basin water budgets, A Three-year case study in the San Juan Mountains, Colorado, U.S.A. Journal of Hydrology. 85, pp 49-71.
Daly, C., R.P. Neilson, and D.L. Philips, 1994. A statistical-topographic model for mapping climatological precipitation over mountainous terrain, Journal of Applied Meteorology, 33:140-158.
Daly, C., W.P. Gibson, M. Doggett, J. Smith, and G. Taylor, 2004. Up-to-date monthly climate maps for the conterminous United States: Proc., 14th AMS Conf. on Applied Climatology, 84th AMS Annual Meeting Combined Preprints, Amer. Meteorological Soc., Seattle, WA, January 13-16, 2004, Paper P5.1, CD-ROM.
Dettinger, M.D., 1989. Reconnaissance estimates of natural recharge to desert basins in Nevada, U.S.A., by using chloride-balance calculations: Journal of Hydrology 106: 55-78.
Eakin, T.E., 1960. Ground-water appraisal of Newark Valley White Pine County, Nevada, Report 1, Ground-Water Resources – Reconnaissance Series, State of Nevada, Department of Conservation and Natural Resources, Carson City, 33 p.
24
Eakin, T.E., 1961. Ground-water appraisal of Long Valley in White Pine and Elko counties, Nevada, Report 3, Ground-Water Resources – Reconnaissance Series, State of Nevada, Department of Conservation and Natural Resources, Carson City, 35 p.
Eakin, T.E., 1962. Ground-water appraisal of Cave Valley in Lincoln and White Pine counties, Nevada, Report 13, Ground-Water Resources – Reconnaissance Series, State of Nevada, Department of Conservation and Natural Resources, Carson City, 19 p.
Eakin, T.E., 1966. A regional interbasin groundwater system in the White River area, southeastern Nevada, Water Resources Research 2(2), 251 – 271.
Eakin, T.E., J.L. Hughes, and D.O. Moore, 1967. Water-resources appraisal of Steptoe Valley, White Pine and Elko counties, Nevada, Water Resources-Reconnaissance Series, Report 42, Nevada Department of Conservation and Natural Resources, Division of Water Resources, 42 p.
Epstein, B.J., 2004. Development and uncertainty analysis of empirical recharge prediction models of Nevada's desert basins, unpublished Master of Science thesis, University of Nevada, Reno, 202 p.
Fabryka-Martin, J., M. Catee, G. Nimz, J. Southon, S. Wightman, W. Murphy, M. Wickham, and P. Sharma, 1993. Distribution of chloride-36 in the unsaturated zone at Yucca Mountain: An indicator of fast transport paths. Paper presented at Focus 93: Site Characterization and Model Validation, Las Vegas, NV, September 26-29, 1993.
Feeney, T.A., M.E. Campana, and R.L. Jacobson, 1987. A deuterium-calibrated groundwater flow model of the western Nevada Test Site and vicinity. Desert Research Institute Publication #45057, 38 p.
Flint, A.L., in preparation. Recharge estimation for the BARCAS area using the Basin Characterization Model.
Flint, A.L., L.E. Flint, J.A. Hevesi, and J.M. Blainey, 2004. Fundamental concepts of recharge in the Desert Southwest: a regional modeling perspective, in Groundwater Recharge in a Desert Environment: The Southwestern United States, edited by J.F. Hogan, F.M. Phillips, and B.R Scanlon, Water Science and Applications Series, vol. 9, American Geophysical Union, Washington, D.C., 159-184.
Fouty, S.C., 1989. Chloride mass-balance as a method for determining long-term groundwater recharge rates and geomorphic-surface stability in arid and semi-arid regions, Whiskey Flat and Beatty, Nevada, University of Arizona, Master of Science Thesis.
Glancy, P.A., 1968. Water-resources appraisal of Butte Valley, Elko and White Pine counties, Nevada, Report 49, Water Resources – Reconnaissance Series, State of Nevada, Department of Conservation and Natural Resources, Carson City, 50 p.
Hardman, G., 1936. Nevada precipitation and acreages of land by rainfall zones, University of Nevada Agriculture Experiment Station, mimeographed report and map, 10 pp.
Hardman, G., and H.G. Mason, 1949. Irrigated lands of Nevada, Bulletin No. 183, Agricultural Experiment Station, University of Nevada, Reno, 57 p.
25
Hardman, G., 1965. Nevada precipitation map, revision of map published as Hardman and Mason, 1949.
Hem, J.D., 1985. Study and Interpretation of the Chemical Characteristics of Natural Water, U.S. Geological Survey Water-Supply Paper 2254, 3rd. ed., p. 118.
Hevesi, J.A., A.L. Flint, and L.E. Flint, L.E., 2002. Preliminary estimates of spatially distributed net infiltration and recharge for the Death Valley Region, Nevada-California, U.S. Geological Survey, Water-Resources Investigations Report 02-4010, 36 p.
Hevesi, J.A., A.L. Flint, and L.E. Flint, 2003. Simulation of net infiltration and potential recharge using a distributed-parameter watershed model of the Death Valley Region, Nevada and California, U.S. Geological Survey, Water-Resources Investigations Report 03-4090, 161 p.
Hershey, R.L. and L. Justet, in preparation, A water chemistry and water quality assessment of groundwater in the BARCAS area.
Hood, J.W. and F.E. Rush, 1965. Water-resources appraisal of the Snake Valley area, Utah and Nevada, Report 34, Water Resources-Reconnaissance Series, State of Nevada, Department of Conservation and Natural Resources, Carson City, 43 p.
Johansson, P.O., 1988. Methods for estimation of natural groundwater recharge directly from precipitation – comparative studies in sandy till, in Simmers (ed.), Estimation of natural groundwater recharge, D. Reidel Publishing Co., Dordrecht, Netherlands, p. 239-270.
Junge, C.E., and R.T. Werby, 1958. The concentration of chloride, sodium, potassium, calcium and sulfate in rainwater over the United States, J. of Meteorology 15(5):417-425.
Mast, M.A. and D.W. Clow, 2000. Environmental characteristics and water-quality of hydrologic benchmark stations in the western United States, U.S. Geological Survey Circular 1173-D, 115 p.
Maurer, D.K. and D.L. Berger, 1997. Subsurface flow and water yield from watersheds tributary to Eagle Valley hydrographic area, west-central Nevada. U.S. Geological Survey Water-Resources Investigations Report 97-4191, 37 p.
Maurer, D.K., D.L. Berger, and D.E. Prudic, 1996. Subsurface flow to Eagle Valley from Vicee, Ash, and Kings canyons, Carson City, Nevada, estimated from Darcy's Law and the chloride-balance method. U.S. Geological Survey Water-Resources Investigations Report 96-4088, 38 p.
Maxey, G.B. and T.E. Eakin, 1949. Ground water in the White River Valley, White Pine, Nye, and Lincoln counties, Nevada. Nevada State Engineer Bulletin 8, 59 p.
Mizell, S.A., C.E. Russell, and T. Minor, in preparation. Estimation of groundwater recharge in Steptoe Valley, Nevada by chloride enrichment in spring discharge, Desert Research Institute, Las Vegas, Nevada, 48 p.
26
Montazer, P. and W.E. Wilson, 1984. Conceptual hydrologic model of flow in the unsaturated zone, Yucca Mountain, Nevada. U.S. Geological Survey Water-Resources Investigations Report 84-4345, 55 p.
Nalder, I.A. and R.W. Wein, 1998. Spatial interpolation of climatic normals: test of a new method in the Canadian boreal forest: Agric. and Forest Meteor. 92(4): 211-225.
Nichols, W.D., 2000. Regional ground-water evapotranspiration and ground-water budgets, Great Basin, Nevada. U.S. Geological Survey Professional Paper 1628, 83 p.
Phillips, F.M., 1994. Environmental tracers for water movement in desert soils of the American southwest, Soil Science Society of America Journal, 58:15-24.
Rush, F.E. and T.E. Eakin, 1963. Ground-water appraisal of Lake Valley in Lincoln and White Pine counties, Nevada, Report 24, Ground-Water Resources-Reconnaissance Series, State of Nevada, Department of Conservation and Natural Resources, Carson City, 29 p.
Rush, F.E. and D.E. Everett, 1966. Water-Resources appraisal of Little Fish Lake, Hot Creek, and Little Smoky valleys, Nevada, Report 38, Water Resources-Reconnaissance Series, State of Nevada, Department of Conservation and Natural Resources, Carson City, 38 p.
Rush, F.E. and S.A.T. Kazmi, 1965. Water resources appraisal of Spring Valley in White Pine and Lincoln counties, Nevada, Report 33, Water Resources-Reconnaissance Series, State of Nevada, Department of Conservation and Natural Resources, Carson City, 36 p.
Russell, C.E. and T. Minor, 2003. Reconnaissance estimate of recharge based on an elevation-dependent chloride mass-balance approach, Desert Research Institute Publication #45164, 50 p.
Spaulding, W.G. and L.J. Graumlich, 1986. The last pluvial climatic episodes in the deserts of southwestern North America, Nature 320:441-444.
Stewart, J.H. and J.E. Carlson, 1978. Geologic map of Nevada, U.S. Geological Survey map MF-930.
Tyler, S.W., J.B. Chapman, S.H. Conrad, D.P. Hammermeister, D.O. Blout, J.J. Miller, M.J. Sully, and J.J. Ginanni, 1996. Soil-water flux in the southern Great Basin, United States: Temporal and spatial variations over the last 120,000 years, Water Resources Research 32:6, 1481-1499.
Wilson, J.W., in preparation, Potentiometric surface maps of the Basin and Range Carbonate Aquifer System in White Pine County, Nevada, and adjacent areas in Nevada and Utah, U.S. Geological Survey, 32 p.
27
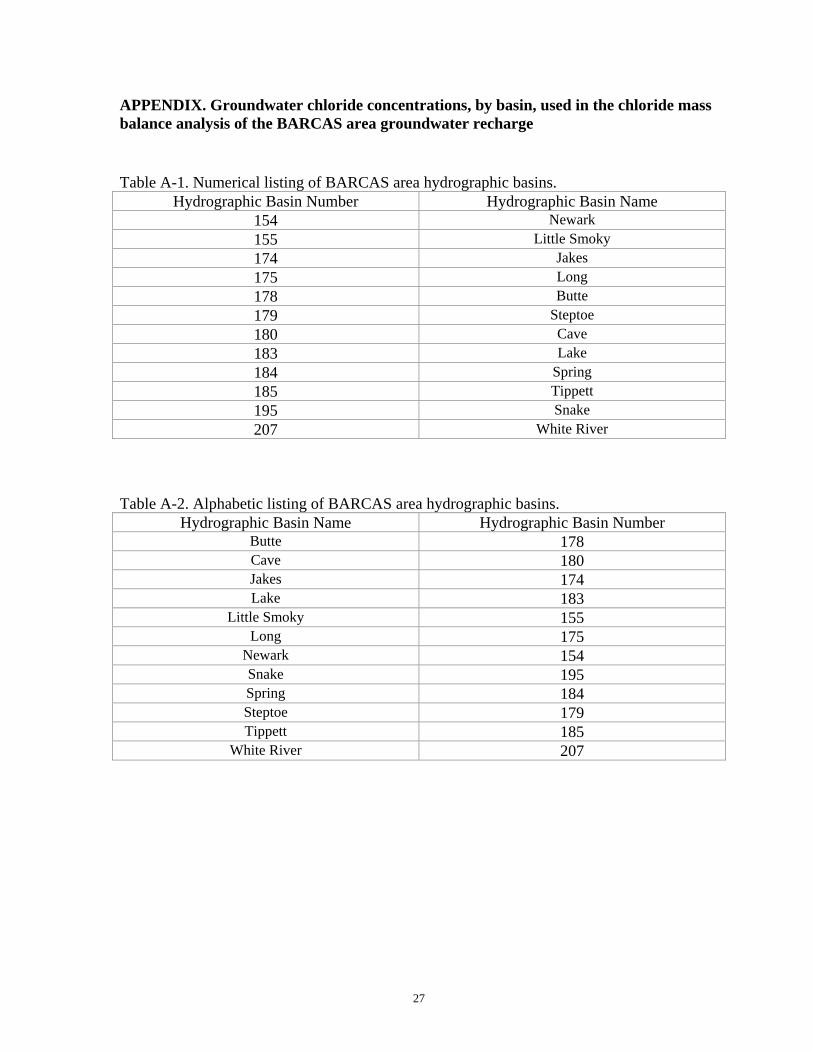
APPENDIX. Groundwater chloride concentrations, by basin, used in the chloride mass balance analysis of the BARCAS area groundwater recharge
Table A-1. Numerical listing of BARCAS area hydrographic basins. Hydrographic Basin Number Hydrographic Basin Name
154 Newark 155 Little Smoky 174 Jakes 175 Long 178 Butte 179 Steptoe 180 Cave 183 Lake 184 Spring 185 Tippett 195 Snake 207 White River
Table A-2. Alphabetic listing of BARCAS area hydrographic basins. Hydrographic Basin Name Hydrographic Basin Number
Butte 178 Cave 180 Jakes 174 Lake 183
Little Smoky 155 Long 175
Newark 154 Snake 195 Spring 184 Steptoe 179 Tippett 185
White River 207
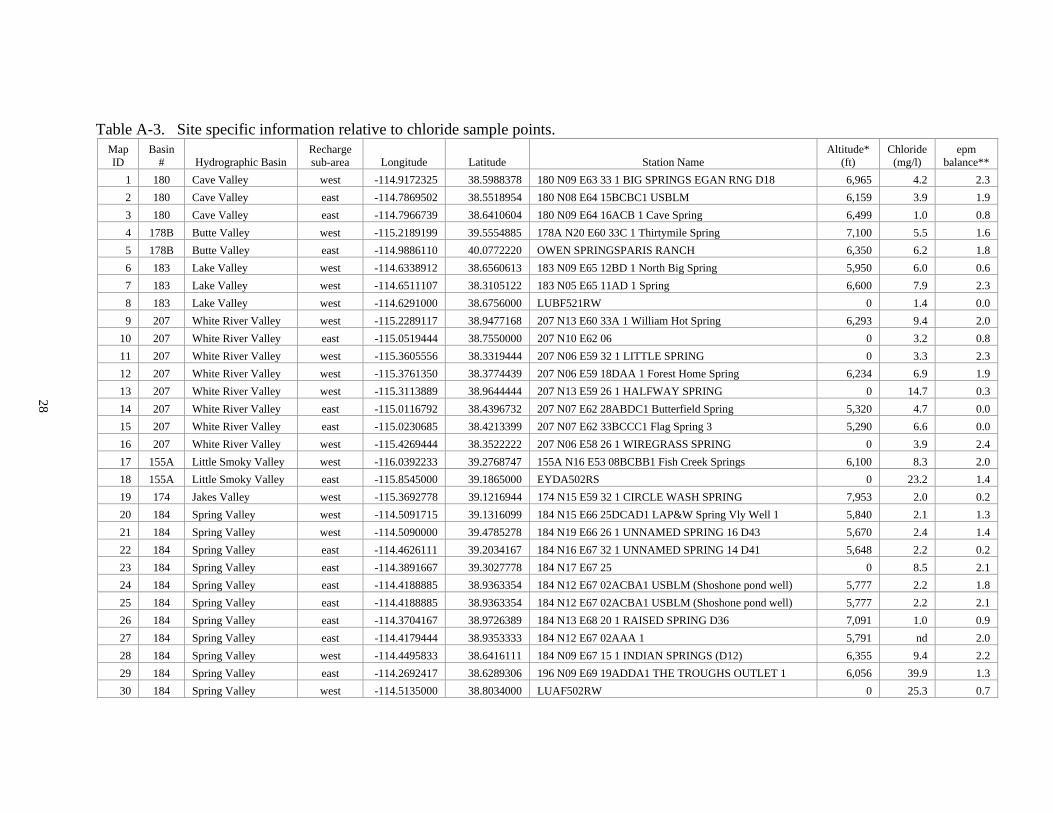
Table A-3. Site specific information relative to chloride sample points. Map ID
Basin # Hydrographic Basin
Recharge sub-area Longitude Latitude Station Name
Altitude* (ft)
Chloride (mg/l)
epm balance**
1 180 Cave Valley west -114.9172325 38.5988378 180 N09 E63 33 1 BIG SPRINGS EGAN RNG D18 6,965 4.2 2.3 2 180 Cave Valley east -114.7869502 38.5518954 180 N08 E64 15BCBC1 USBLM 6,159 3.9 1.9 3 180 Cave Valley east -114.7966739 38.6410604 180 N09 E64 16ACB 1 Cave Spring 6,499 1.0 0.8 4 178B Butte Valley west -115.2189199 39.5554885 178A N20 E60 33C 1 Thirtymile Spring 7,100 5.5 1.6 5 178B Butte Valley east -114.9886110 40.0772220 OWEN SPRINGSPARIS RANCH 6,350 6.2 1.8 6 183 Lake Valley west -114.6338912 38.6560613 183 N09 E65 12BD 1 North Big Spring 5,950 6.0 0.6 7 183 Lake Valley west -114.6511107 38.3105122 183 N05 E65 11AD 1 Spring 6,600 7.9 2.3 8 183 Lake Valley west -114.6291000 38.6756000 LUBF521RW 0 1.4 0.0 9 207 White River Valley west -115.2289117 38.9477168 207 N13 E60 33A 1 William Hot Spring 6,293 9.4 2.0
10 207 White River Valley east -115.0519444 38.7550000 207 N10 E62 06 0 3.2 0.8 11 207 White River Valley west -115.3605556 38.3319444 207 N06 E59 32 1 LITTLE SPRING 0 3.3 2.3 12 207 White River Valley west -115.3761350 38.3774439 207 N06 E59 18DAA 1 Forest Home Spring 6,234 6.9 1.9 13 207 White River Valley west -115.3113889 38.9644444 207 N13 E59 26 1 HALFWAY SPRING 0 14.7 0.3 14 207 White River Valley east -115.0116792 38.4396732 207 N07 E62 28ABDC1 Butterfield Spring 5,320 4.7 0.0 15 207 White River Valley east -115.0230685 38.4213399 207 N07 E62 33BCCC1 Flag Spring 3 5,290 6.6 0.0 16 207 White River Valley west -115.4269444 38.3522222 207 N06 E58 26 1 WIREGRASS SPRING 0 3.9 2.4 17 155A Little Smoky Valley west -116.0392233 39.2768747 155A N16 E53 08BCBB1 Fish Creek Springs 6,100 8.3 2.0 18 155A Little Smoky Valley east -115.8545000 39.1865000 EYDA502RS 0 23.2 1.4 19 174 Jakes Valley west -115.3692778 39.1216944 174 N15 E59 32 1 CIRCLE WASH SPRING 7,953 2.0 0.2 20 184 Spring Valley west -114.5091715 39.1316099 184 N15 E66 25DCAD1 LAP&W Spring Vly Well 1 5,840 2.1 1.3 21 184 Spring Valley west -114.5090000 39.4785278 184 N19 E66 26 1 UNNAMED SPRING 16 D43 5,670 2.4 1.4 22 184 Spring Valley east -114.4626111 39.2034167 184 N16 E67 32 1 UNNAMED SPRING 14 D41 5,648 2.2 0.2 23 184 Spring Valley east -114.3891667 39.3027778 184 N17 E67 25 0 8.5 2.1 24 184 Spring Valley east -114.4188885 38.9363354 184 N12 E67 02ACBA1 USBLM (Shoshone pond well) 5,777 2.2 1.8 25 184 Spring Valley east -114.4188885 38.9363354 184 N12 E67 02ACBA1 USBLM (Shoshone pond well) 5,777 2.2 2.1 26 184 Spring Valley east -114.3704167 38.9726389 184 N13 E68 20 1 RAISED SPRING D36 7,091 1.0 0.9 27 184 Spring Valley east -114.4179444 38.9353333 184 N12 E67 02AAA 1 5,791 nd 2.0 28 184 Spring Valley west -114.4495833 38.6416111 184 N09 E67 15 1 INDIAN SPRINGS (D12) 6,355 9.4 2.2 29 184 Spring Valley east -114.2692417 38.6289306 196 N09 E69 19ADDA1 THE TROUGHS OUTLET 1 6,056 39.9 1.3 30 184 Spring Valley west -114.5135000 38.8034000 LUAF502RW 0 25.3 0.7
28
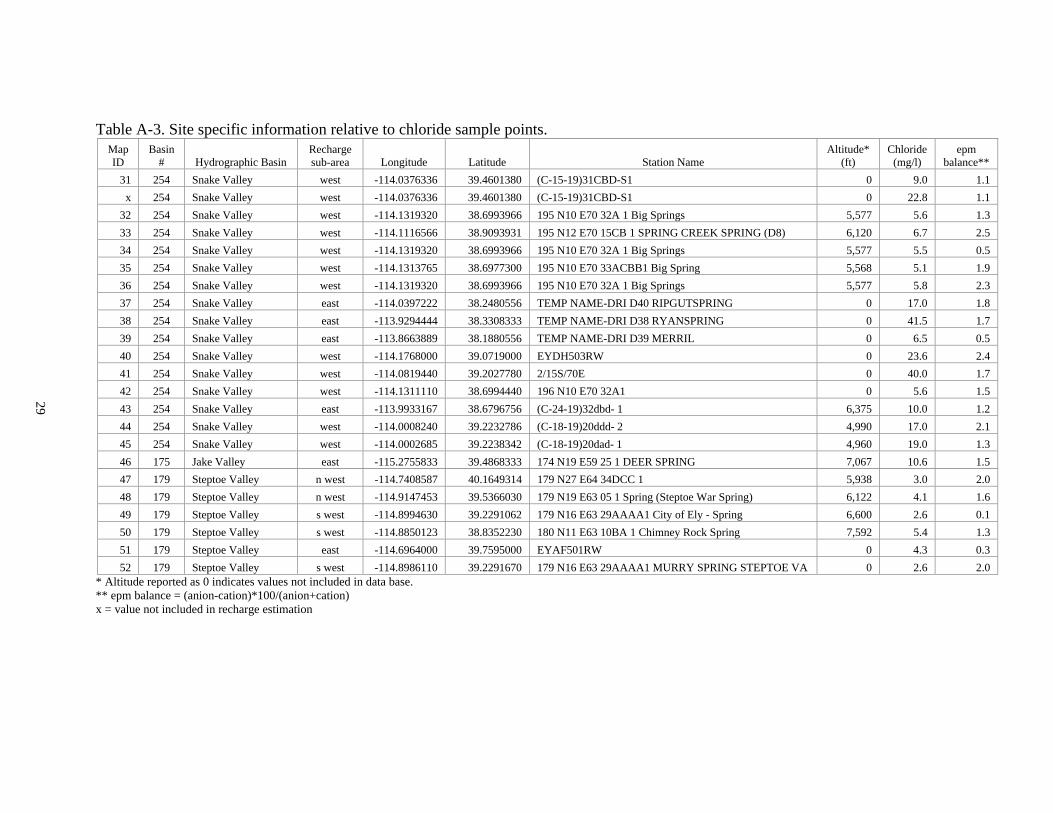
Table A-3. Site specific information relative to chloride sample points. Map ID
Basin # Hydrographic Basin
Recharge sub-area Longitude Latitude Station Name
Altitude* (ft)
Chloride (mg/l)
epm balance**
31 254 Snake Valley west -114.0376336 39.4601380 (C-15-19)31CBD-S1 0 9.0 1.1 x 254 Snake Valley west -114.0376336 39.4601380 (C-15-19)31CBD-S1 0 22.8 1.1
32 254 Snake Valley west -114.1319320 38.6993966 195 N10 E70 32A 1 Big Springs 5,577 5.6 1.3 33 254 Snake Valley west -114.1116566 38.9093931 195 N12 E70 15CB 1 SPRING CREEK SPRING (D8) 6,120 6.7 2.5 34 254 Snake Valley west -114.1319320 38.6993966 195 N10 E70 32A 1 Big Springs 5,577 5.5 0.5 35 254 Snake Valley west -114.1313765 38.6977300 195 N10 E70 33ACBB1 Big Spring 5,568 5.1 1.9 36 254 Snake Valley west -114.1319320 38.6993966 195 N10 E70 32A 1 Big Springs 5,577 5.8 2.3 37 254 Snake Valley east -114.0397222 38.2480556 TEMP NAME-DRI D40 RIPGUTSPRING 0 17.0 1.8 38 254 Snake Valley east -113.9294444 38.3308333 TEMP NAME-DRI D38 RYANSPRING 0 41.5 1.7 39 254 Snake Valley east -113.8663889 38.1880556 TEMP NAME-DRI D39 MERRIL 0 6.5 0.5 40 254 Snake Valley west -114.1768000 39.0719000 EYDH503RW 0 23.6 2.4 41 254 Snake Valley west -114.0819440 39.2027780 2/15S/70E 0 40.0 1.7 42 254 Snake Valley west -114.1311110 38.6994440 196 N10 E70 32A1 0 5.6 1.5 43 254 Snake Valley east -113.9933167 38.6796756 (C-24-19)32dbd- 1 6,375 10.0 1.2 44 254 Snake Valley west -114.0008240 39.2232786 (C-18-19)20ddd- 2 4,990 17.0 2.1 45 254 Snake Valley west -114.0002685 39.2238342 (C-18-19)20dad- 1 4,960 19.0 1.3 46 175 Jake Valley east -115.2755833 39.4868333 174 N19 E59 25 1 DEER SPRING 7,067 10.6 1.5 47 179 Steptoe Valley n west -114.7408587 40.1649314 179 N27 E64 34DCC 1 5,938 3.0 2.0 48 179 Steptoe Valley n west -114.9147453 39.5366030 179 N19 E63 05 1 Spring (Steptoe War Spring) 6,122 4.1 1.6 49 179 Steptoe Valley s west -114.8994630 39.2291062 179 N16 E63 29AAAA1 City of Ely - Spring 6,600 2.6 0.1 50 179 Steptoe Valley s west -114.8850123 38.8352230 180 N11 E63 10BA 1 Chimney Rock Spring 7,592 5.4 1.3 51 179 Steptoe Valley east -114.6964000 39.7595000 EYAF501RW 0 4.3 0.3 52 179 Steptoe Valley s west -114.8986110 39.2291670 179 N16 E63 29AAAA1 MURRY SPRING STEPTOE VA 0 2.6 2.0
* Altitude reported as 0 indicates values not included in data base. ** epm balance = (anion-cation)*100/(anion+cation) x = value not included in recharge estimation
29