Embed Size (px)
Citation preview
�����������������
Citation: Tielidze, L.G.; Jomelli, V.;
Nosenko, G.A. Analysis of Regional
Changes in Geodetic Mass Balance
for All Caucasus Glaciers over the
Past Two Decades. Atmosphere 2022,
13, 256. https://doi.org/10.3390/
atmos13020256
Academic Editor: Lin Zhao
Received: 4 January 2022
Accepted: 30 January 2022
Published: 2 February 2022
Publisher’s Note: MDPI stays neutral
with regard to jurisdictional claims in
published maps and institutional affil-
iations.
Copyright: © 2022 by the authors.
Licensee MDPI, Basel, Switzerland.
This article is an open access article
distributed under the terms and
conditions of the Creative Commons
Attribution (CC BY) license (https://
creativecommons.org/licenses/by/
4.0/).
atmosphere
Article
Analysis of Regional Changes in Geodetic Mass Balance for AllCaucasus Glaciers over the Past Two DecadesLevan G. Tielidze 1,2,3,* , Vincent Jomelli 4 and Gennady A. Nosenko 5
1 Antarctic Research Centre, Victoria University of Wellington, P.O. Box 600, Wellington 6140, New Zealand2 School of Geography, Environment and Earth Sciences, Victoria University of Wellington, P.O. Box 600,
Wellington 6140, New Zealand3 School of Natural Sciences and Medicine, Ilia State University, Cholokashvili Ave 3/5, Tbilisi 0162, Georgia4 Centre for Research and Teaching in Environmental Geoscience (CEREGE), Aix-Marseille University, CNRS, IRD,
College De France, INRA, 13545 Aix-en-Provence, France; [email protected] Department of Glaciology, Institute of Geography, Russian Academy of Sciences, 29 Staromonetniy Pereulok,
119017 Moscow, Russia; [email protected]* Correspondence: [email protected]
Abstract: Glaciers and snow in the Caucasus are major sources of runoff for populated placesin many parts of this mountain region. These glaciers have shown a continuous area decrease;however, the magnitude of mass balance changes at the regional scale need to be further investi-gated. Here, we analyzed regional changes in surface elevation (or thickness) and geodetic massbalance for 1861 glaciers (1186.1 ± 53.3 km2) between 2000 and 2019 from recently published datasetand outlines of the Caucasus glacier inventory. We used a debris-covered glacier dataset to com-pare the changes between debris-free and debris-covered glaciers. We also used 30 m resolutionASTER GDEM (2011) to determine topographic details, such as aspect, slope, and elevation dis-tribution of glaciers. Results indicate that the mean rate of glacier mass loss has accelerated from0.42 ± 0.61 m of water equivalent per year (m w.e. a−1) over 2000–2010, to 0.64± 0.66 m w.e. a−1 over2010–2019. This was 0.53 ± 0.38 m w.e. a−1 in 2000–2019. Mass loss rates differ between the western,central, and eastern Greater Caucasus, indicating the highest mean annual mass loss in the western sec-tion (0.65 ± 0.43 m w.e. a−1) in 2000–2019 and much lower in the central (0.48 ± 0.35 m w.e. a−1) andeastern (0.38 ± 0.37 m w.e. a−1) sections. No difference was found between the northern and south-ern slopes over the last twenty years corresponding 0.53 ± 0.38 m w.e. a−1. The observed decreasein mean annual geodetic mass balance is higher on debris-covered glaciers (0.66 ± 0.17 m w.e. a−1)than those on debris-free glaciers (0.49 ± 0.15 m w.e. a−1) between 2000 and 2019. Thickness changevalues in 2010–2019 were 1.5 times more negative (0.75 ± 0.70 m a−1) than those in 2000–2010(0.50 ± 0.67 m a−1) in the entire region, suggesting an acceleration of ice thinning starting in 2010.A significant positive trend of May-September air temperatures at two selected meteorological stations(Terskol and Mestia) along with a negative trend of October-April precipitation might be responsiblefor the negative mass balances and thinning for all Caucasus glaciers over the study period. Theseresults provide insight into the change processes of regional glaciers, which is key information toimprove glaciological and hydrological projections in the Caucasus region.
Keywords: geodetic mass balance; glacier thickness change; Greater Caucasus
1. Introduction
Glacier mass balance is an important variable for understanding the response ofglaciers to climate change [1] and their contribution to regional water resources [2] as wellas from the perspective of changes in global sea level [3–5]. Glacier mass balance can bederived by two different methods, such as the traditional glaciological method, and thegeodetic method. Glaciological mass balance is based on in-situ measurements of accumu-lation and ablation using snow pits and stakes [1], while the geodetic mass balance can
Atmosphere 2022, 13, 256. https://doi.org/10.3390/atmos13020256 https://www.mdpi.com/journal/atmosphere
Atmosphere 2022, 13, 256 2 of 26
be obtained from observations of elevation change derived from digital elevation models(DEMs) computed from stereo satellite images. Ground-based measurement gives glacio-logical mass balance relatively high accuracy at the point of measurement, which is theninterpolated to the glacier area, while the main advantage of geodetic mass balance is thewide regional coverage, although, the uncertainties of geodetic mass balance measurementsdepend on the satellite source and is often relatively high [6]. However, close range sensingsuch as airborne or terrestrial laser scanning significantly reduces the uncertainty to anorder of decimeters to meter [7,8]. Significant improvements have been made in the lastdecades to improve the accuracy of the geodetic approach [9,10]. Furthermore, this methodhas become widely used in recent years due to the possibility to monitor large glacierisedareas [3,4].
Meltwater of glaciers and snow provides a water source for electricity generation,ecosystems, and communities in the Greater Caucasus. These glaciers also have a positiveimpact on the economy by being a major tourist attraction in this region. Several nationalparks on both sides of the Greater Caucasus (Georgia/Russia) welcome thousands ofvisitors each year. On the other hand, glacier hazards are relatively common in this region,leading to major casualties [11–13]. Thus, estimation of glacier mass change is of greatsignificance in this region. Investigation of glacier mass balance will also provide importantinformation for future research on various socio-economic impacts such as water resourcemanagement, risk assessments, and tourism in this mountain region.
Attempts to organize in-situ regular observations of glacier mass balance have beenmade since the early 1960s on both southern (Georgia) and northern (Russia) slopes ofthe Greater Caucasus [14,15]. The duration of those measurements was short for variousreasons. Long-term glaciological observation campaigns (stake method) on the Russian sideof the Greater Caucasus began in 1967 on Djankuat Glacier (43◦11′57′′ N; 42◦45′24′′ E) [16],which started in 1982 on Garabashi Glacier (43◦18′19” N; 42◦28′13′′ E) [17]. A similarmonitoring program was started in 1968 on Buba (Tbilisa) Glacier (42◦44′57′′ N; 43◦44′45′′ E)on the Georgian side of the Greater Caucasus [18]. After the dissolution of the Soviet Unionin 1990s, the monitoring program was interrupted in Georgia and no glaciological fieldmeasurements were carried out until 2007, when the mass balance monitoring programswere temporarily (2007–2010) initiated on Zopkhito Glacier (42◦52′54′′ N; 43◦25′29′′ E).One-year glaciological mass balance measurement was also initiated on Chalaati Glacier(43◦7′49′′ N; 42◦42′30′′ E) in 2011 [19]. The initiation of other continuous monitoringprograms was difficult mainly due to hard political and social conditions resulting in morethan 30 years of gaps in glaciological mass balance data. Nowadays, continuous series oflong-term observations by traditional glaciological method continue only on Djankuat andGarabashi glaciers from the Russian side of the Greater Caucasus [20].
In the last few decades, research in the Greater Caucasus focused mainly on docu-menting changes in glacier area [21–24], indicating a significant shrinkage in regional icecoverage. Long-term ground-based measurements from Djankuat and Garabashi glaciersalso suggest predominantly negative mass balances over the last few decades from thisregion [17,25]. Recently, geodetic mass balances have also been monitored within thelocal [26,27], and global [3,4] studies. The main limitations of local studies are incompletearea coverage, while the global studies always describe the Caucasus, with the Middle Eastmaking the regional analysis difficult. The vast majority of glaciers in the Middle East arevery small, with mean area of <0.1 km2 [28,29] and the climate is hot and arid (dry) [30],causing a much higher rate of glacier decline [28,29]. Thus, combining these two regionscauses a bias with more negative values over the Caucasus region.
In this study, we use thickness and surface mass balance data from recently publishedglobal study by Hugonnet et al. (2021) [3]. This study offers a unique opportunity toanalyze the behavior of individual glaciers in the Greater Caucasus as the data of massbalance and thickness changes are available for each specific glacier. Thus, the main goal ofthis study is to:
Atmosphere 2022, 13, 256 3 of 26
(i) analyze the behavior of glaciers in the Greater Caucasus separately from theMiddle East;
(ii) estimate changes in surface elevation and geodetic mass balance for all Caucasusglaciers over the past two decades according to river basins and analyze these changeson sub-regional (e.g., western vs. eastern; northern vs. southern) and individualglaciers (e.g., debris-covered vs. debris-free);
(iii) compare this data with those from local existing ground-based and geodetic massbalance measurements along with local climate observations from high-mountainmeteorological stations.
2. Study Area
Caucasus is a complex mountain system located between the Black and Caspian season the border of Europe and Asia consisting of two separate mountain systems such asthe Greater Caucasus and the Lesser Caucasus (Transcaucasian Highlands). The GreaterCaucasus is the higher and more extensive part of this region, extending for about 1100 kmfrom northwest to southeast. The Lesser Caucasus is located approximately 100 km tothe south and characterized by relatively lower elevations and warm climate, providingunfavourable conditions for the existence of modern glaciers. Thus, all contemporaryglaciers of the Caucasian region belong to the Greater Caucasus.
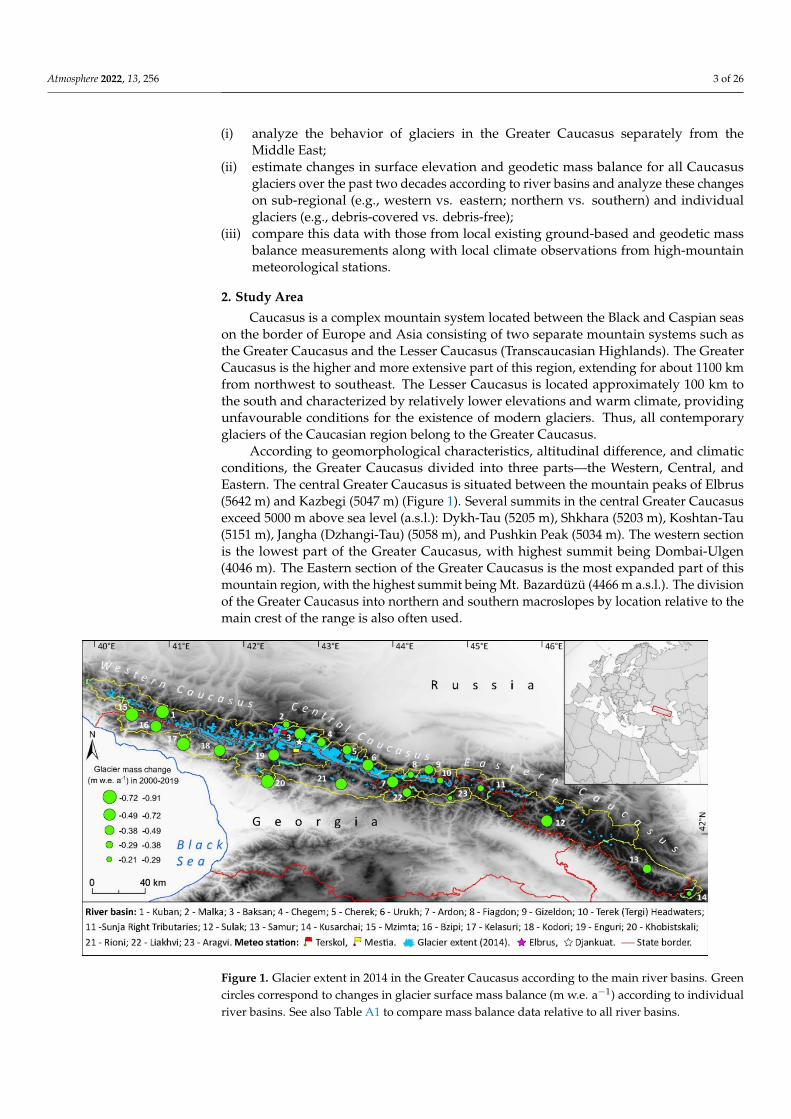
According to geomorphological characteristics, altitudinal difference, and climaticconditions, the Greater Caucasus divided into three parts—the Western, Central, andEastern. The central Greater Caucasus is situated between the mountain peaks of Elbrus(5642 m) and Kazbegi (5047 m) (Figure 1). Several summits in the central Greater Caucasusexceed 5000 m above sea level (a.s.l.): Dykh-Tau (5205 m), Shkhara (5203 m), Koshtan-Tau(5151 m), Jangha (Dzhangi-Tau) (5058 m), and Pushkin Peak (5034 m). The western sectionis the lowest part of the Greater Caucasus, with highest summit being Dombai-Ulgen(4046 m). The Eastern section of the Greater Caucasus is the most expanded part of thismountain region, with the highest summit being Mt. Bazardüzü (4466 m a.s.l.). The divisionof the Greater Caucasus into northern and southern macroslopes by location relative to themain crest of the range is also often used.
Atmosphere 2022, 13, 256 4 of 24
Figure 1. Glacier extent in 2014 in the Greater Caucasus according to the main river basins. Green circles correspond to changes in glacier surface mass balance (m w.e. a−1) according to individual river basins. See also Table A1 to compare mass balance data relative to all river basins.
About 13.4% of the surface area of Caucasus glaciers was covered by debris in 2014 [38]. Nowadays, there are more than 2200 glaciers in the Greater Caucasus, covering an area of about 1060 km2. The northern slopes of the mountain range contain more glaciers than the southern slopes. About 70% of the modern glaciated area is concentrated in the central section. Fourteen glaciers have an area > 10 km2 resulting in ~220 km2 or ~21% of the total glacier area in 2020. The Bezingi Glacier, with an area of ~39 km2, was the largest glacier mapped in the 2020 database [37].
3. Data and Methods In this study, we used geodetic mass balance and ice thickness data from Hugonnet
et al. (2021), [3] obtained from 30 m resolution Terra Advanced Spaceborne Thermal Emission and Reflection Radiometer (ASTER) Global Digital Elevation Model (GDEM) and ASTER L1A stereo images (each covering 60 km × 60 km) between 1 January 2000 and 31 December 2019 (downloaded from https://lpdaac.usgs.gov/products/ast_l1av003/) (Last access 13/12/2021). The specifically developed statistical methods are consistently described in Hugonnet et al. (2021) [3]. Outlines from the Caucasus glacier inventory from 2014 [21] were regarded as glacier boundaries in Hugonnet et al. (2021) [3]. These outlines for most glaciers in this area are identified according to the Landsat 8 Opera-tional Land Imager (OLI) images and downloaded from the EarthExplorer website (http://earthexplorer.usgs.gov/) (Last access 13/12/2021).
The 5-year uncertainties by Hugonet et al., 2021 [3], at the 95% confidence level, were lower than 0.5 m yr−1 for glaciers larger than 1 km2 and conservative for smaller glaciers. They, thus, validated the reliability of improved uncertainty approaches for volume change estimation down to the scale of individual glaciers. A detailed descrip-tion of uncertainty calculation is given in Huggonet et al., 2021 [3]. To check the accuracy of geodetic mass balance data by Hugonnet et al. (2021) [3] relative to the existing ground-based observation from the same period, we selected the Djankuat Glacier (Fig-ure 2a) and extracted its glaciological mass balance data from the WGMS server [20]. For more comparison with other geodetic mass balance studies, we also selected the Kyu-
Figure 1. Glacier extent in 2014 in the Greater Caucasus according to the main river basins. Greencircles correspond to changes in glacier surface mass balance (m w.e. a−1) according to individualriver basins. See also Table A1 to compare mass balance data relative to all river basins.
Atmosphere 2022, 13, 256 4 of 26
The mountain range of the Greater Caucasus represents an orographic barrier to theflow of moisture brought from the west and southwest by Mediterranean and Atlanticcyclones. The greatest amount of precipitation falls on the southern slope of the westernsection. Here, the amount of annual precipitation at an altitude of 3000 m a.s.l. reaches4000 mm. Precipitation gradually decreases from west to east, reaching about 1000 mmon the southern slopes of eastern Greater Caucasus. The northern slope is relativelymore arid (dry) and cold than the southern one, resulting in ~500–1000 mm less annualprecipitation and 1–2 ◦C lower summer temperatures [31,32]. The average regional lapserate is minimum in winter (−2.3 ◦C per 1000 m) and maximum in summer (−5.2 ◦C per1000 m) [33]. Overall, snow depth may reach 5–7 m in winter in several regions of thewestern part of the Greater Caucasus, such as the Upper Svaneti and northern Abkhazetiregions in Georgia [34].
Glacier decrease started from the last advances of the Little Ice Age (LIA) in thenorthern Greater Caucasus, dated approximatively to the late 1840s [35], though it mayhave been slightly earlier, in the 1810s, in the southern slopes [36]. The decrease ratewas relatively small in centennial scale (~0.4% yr−1 in 1911–2014) [22–24], while this hasincreased since the 1960s (0.5% yr−1) [21] and reached its maximum rates over the past twodecades (1.16% yr−1) [37].
About 13.4% of the surface area of Caucasus glaciers was covered by debris in 2014 [38].Nowadays, there are more than 2200 glaciers in the Greater Caucasus, covering an areaof about 1060 km2. The northern slopes of the mountain range contain more glaciers thanthe southern slopes. About 70% of the modern glaciated area is concentrated in the centralsection. Fourteen glaciers have an area > 10 km2 resulting in ~220 km2 or ~21% of the totalglacier area in 2020. The Bezingi Glacier, with an area of ~39 km2, was the largest glaciermapped in the 2020 database [37].
3. Data and Methods
In this study, we used geodetic mass balance and ice thickness data fromHugonnet et al. (2021), [3] obtained from 30 m resolution Terra Advanced Spaceborne Ther-mal Emission and Reflection Radiometer (ASTER) Global Digital Elevation Model (GDEM)and ASTER L1A stereo images (each covering 60 km × 60 km) between 1 January 2000 and31 December 2019 (downloaded from https://lpdaac.usgs.gov/products/ast_l1av003/)(Last access 13 December 2021). The specifically developed statistical methods are con-sistently described in Hugonnet et al. (2021) [3]. Outlines from the Caucasus glacierinventory from 2014 [21] were regarded as glacier boundaries in Hugonnet et al. (2021) [3].These outlines for most glaciers in this area are identified according to the Landsat 8 Op-erational Land Imager (OLI) images and downloaded from the EarthExplorer website(http://earthexplorer.usgs.gov/) (Last access 13 December 2021).
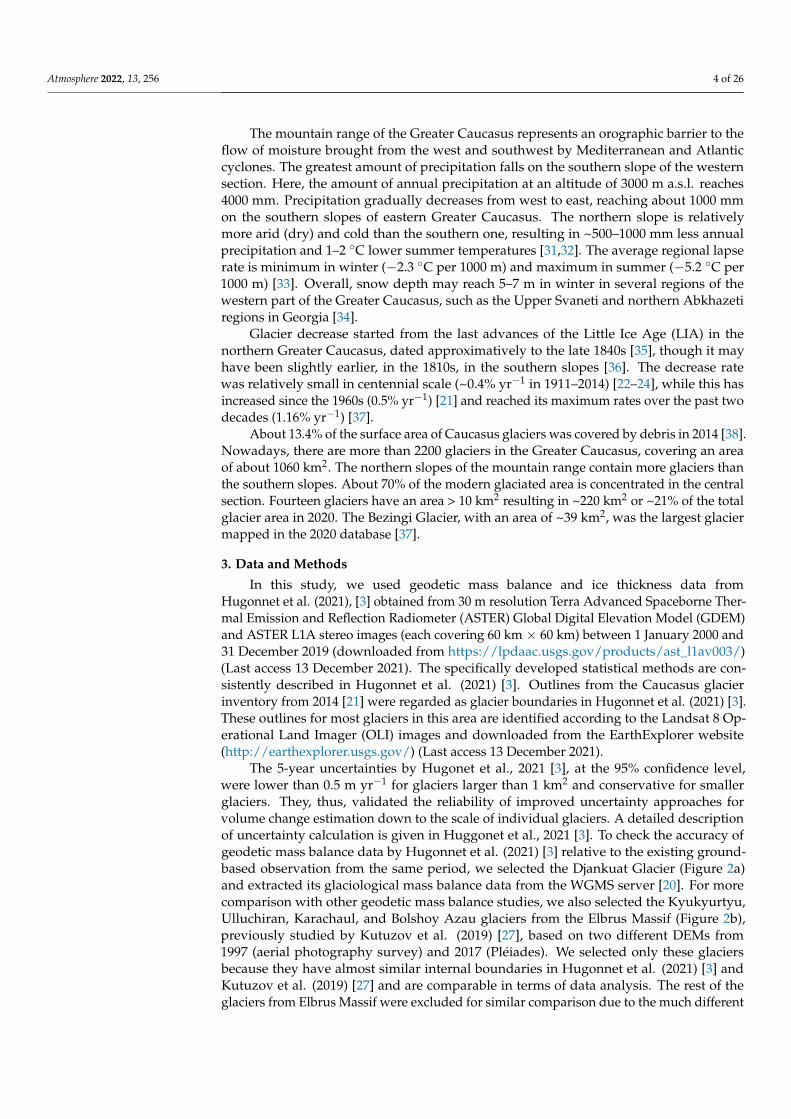
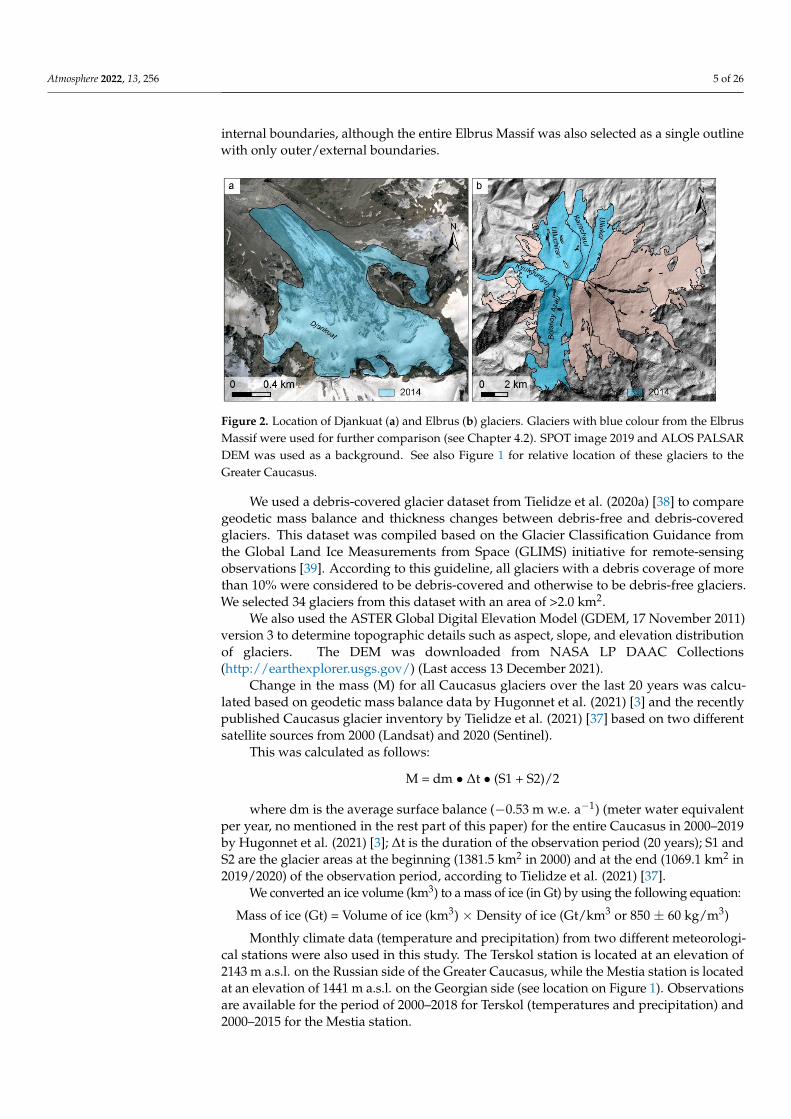
The 5-year uncertainties by Hugonet et al., 2021 [3], at the 95% confidence level,were lower than 0.5 m yr−1 for glaciers larger than 1 km2 and conservative for smallerglaciers. They, thus, validated the reliability of improved uncertainty approaches forvolume change estimation down to the scale of individual glaciers. A detailed descriptionof uncertainty calculation is given in Huggonet et al., 2021 [3]. To check the accuracy ofgeodetic mass balance data by Hugonnet et al. (2021) [3] relative to the existing ground-based observation from the same period, we selected the Djankuat Glacier (Figure 2a)and extracted its glaciological mass balance data from the WGMS server [20]. For morecomparison with other geodetic mass balance studies, we also selected the Kyukyurtyu,Ulluchiran, Karachaul, and Bolshoy Azau glaciers from the Elbrus Massif (Figure 2b),previously studied by Kutuzov et al. (2019) [27], based on two different DEMs from1997 (aerial photography survey) and 2017 (Pléiades). We selected only these glaciersbecause they have almost similar internal boundaries in Hugonnet et al. (2021) [3] andKutuzov et al. (2019) [27] and are comparable in terms of data analysis. The rest of theglaciers from Elbrus Massif were excluded for similar comparison due to the much different
Atmosphere 2022, 13, 256 5 of 26
internal boundaries, although the entire Elbrus Massif was also selected as a single outlinewith only outer/external boundaries.
Atmosphere 2022, 13, 256 5 of 24
kyurtyu, Ulluchiran, Karachaul, and Bolshoy Azau glaciers from the Elbrus Massif (Fig-ure 2b), previously studied by Kutuzov et al. (2019) [27], based on two different DEMs from 1997 (aerial photography survey) and 2017 (Pléiades). We selected only these glac-iers because they have almost similar internal boundaries in Hugonnet et al. (2021) [3] and Kutuzov et al. (2019) [27] and are comparable in terms of data analysis. The rest of the glaciers from Elbrus Massif were excluded for similar comparison due to the much different internal boundaries, although the entire Elbrus Massif was also selected as a single outline with only outer/external boundaries.
Figure 2. Location of Djankuat (a) and Elbrus (b) glaciers. Glaciers with blue colour from the Elbrus Massif were used for further comparison (see Chapter 4.2). SPOT image 2019 and ALOS PALSAR DEM was used as a background. See also Figure 1 for relative location of these glaciers to the Greater Caucasus.
We used a debris-covered glacier dataset from Tielidze et al. (2020a) [38] to compare geodetic mass balance and thickness changes between debris-free and debris-covered glaciers. This dataset was compiled based on the Glacier Classification Guidance from the Global Land Ice Measurements from Space (GLIMS) initiative for remote-sensing observations [39]. According to this guideline, all glaciers with a debris coverage of more than 10% were considered to be debris-covered and otherwise to be debris-free glaciers. We selected 34 glaciers from this dataset with an area of >2.0 km2.
We also used the ASTER Global Digital Elevation Model (GDEM, 17 November 2011) version 3 to determine topographic details such as aspect, slope, and elevation distribution of glaciers. The DEM was downloaded from NASA LP DAAC Collections (http://earthexplorer.usgs.gov/) (Last access 13/12/2021).
Change in the mass (M) for all Caucasus glaciers over the last 20 years was calcu-lated based on geodetic mass balance data by Hugonnet et al. (2021) [3] and the recently published Caucasus glacier inventory by Tielidze et al. (2021) [37] based on two different satellite sources from 2000 (Landsat) and 2020 (Sentinel).
This was calculated as follows:
M = dm • ∆t • (S1 + S2)/2
where dm is the average surface balance (−0.53 m w.e. a−1) (meter water equivalent per year, no mentioned in the rest part of this paper) for the entire Caucasus in 2000–2019 by Hugonnet et al. (2021) [3]; ∆t is the duration of the observation period (20 years); S1 and S2 are the glacier areas at the beginning (1381.5 km2 in 2000) and at the end (1069.1 km2 in 2019/2020) of the observation period, according to Tielidze et al. (2021) [37].
We converted an ice volume (km3) to a mass of ice (in Gt) by using the following equation:
Mass of ice (Gt) = Volume of ice (km3) × Density of ice (Gt/km3 or 850 ± 60 kg/m3).
Figure 2. Location of Djankuat (a) and Elbrus (b) glaciers. Glaciers with blue colour from the ElbrusMassif were used for further comparison (see Chapter 4.2). SPOT image 2019 and ALOS PALSARDEM was used as a background. See also Figure 1 for relative location of these glaciers to theGreater Caucasus.
We used a debris-covered glacier dataset from Tielidze et al. (2020a) [38] to comparegeodetic mass balance and thickness changes between debris-free and debris-coveredglaciers. This dataset was compiled based on the Glacier Classification Guidance fromthe Global Land Ice Measurements from Space (GLIMS) initiative for remote-sensingobservations [39]. According to this guideline, all glaciers with a debris coverage of morethan 10% were considered to be debris-covered and otherwise to be debris-free glaciers.We selected 34 glaciers from this dataset with an area of >2.0 km2.
We also used the ASTER Global Digital Elevation Model (GDEM, 17 November 2011)version 3 to determine topographic details such as aspect, slope, and elevation distributionof glaciers. The DEM was downloaded from NASA LP DAAC Collections(http://earthexplorer.usgs.gov/) (Last access 13 December 2021).
Change in the mass (M) for all Caucasus glaciers over the last 20 years was calcu-lated based on geodetic mass balance data by Hugonnet et al. (2021) [3] and the recentlypublished Caucasus glacier inventory by Tielidze et al. (2021) [37] based on two differentsatellite sources from 2000 (Landsat) and 2020 (Sentinel).
This was calculated as follows:
M = dm • ∆t • (S1 + S2)/2
where dm is the average surface balance (−0.53 m w.e. a−1) (meter water equivalentper year, no mentioned in the rest part of this paper) for the entire Caucasus in 2000–2019by Hugonnet et al. (2021) [3]; ∆t is the duration of the observation period (20 years); S1 andS2 are the glacier areas at the beginning (1381.5 km2 in 2000) and at the end (1069.1 km2 in2019/2020) of the observation period, according to Tielidze et al. (2021) [37].
We converted an ice volume (km3) to a mass of ice (in Gt) by using the following equation:
Mass of ice (Gt) = Volume of ice (km3) × Density of ice (Gt/km3 or 850 ± 60 kg/m3)
Monthly climate data (temperature and precipitation) from two different meteorologi-cal stations were also used in this study. The Terskol station is located at an elevation of2143 m a.s.l. on the Russian side of the Greater Caucasus, while the Mestia station is locatedat an elevation of 1441 m a.s.l. on the Georgian side (see location on Figure 1). Observationsare available for the period of 2000–2018 for Terskol (temperatures and precipitation) and2000–2015 for the Mestia station.
Atmosphere 2022, 13, 256 6 of 26
4. Results4.1. Mass Balance and Thickness Change for the Entire Region
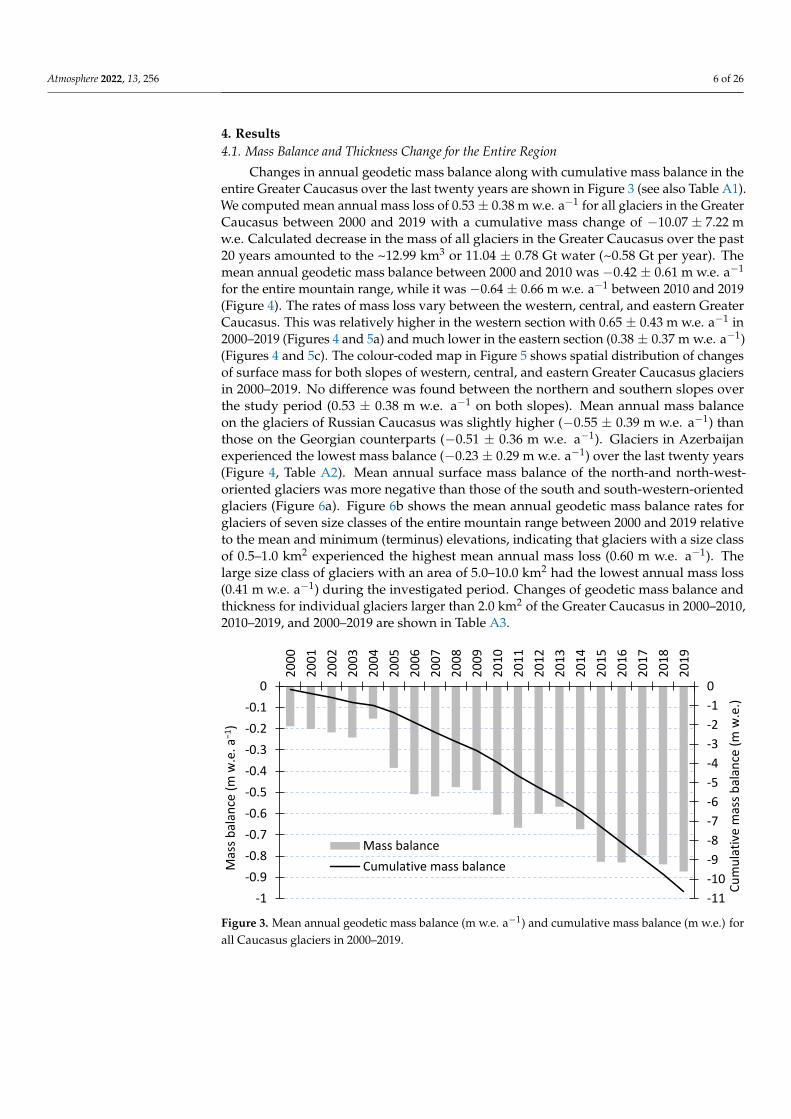
Changes in annual geodetic mass balance along with cumulative mass balance in theentire Greater Caucasus over the last twenty years are shown in Figure 3 (see also Table A1).We computed mean annual mass loss of 0.53± 0.38 m w.e. a−1 for all glaciers in the GreaterCaucasus between 2000 and 2019 with a cumulative mass change of −10.07 ± 7.22 mw.e. Calculated decrease in the mass of all glaciers in the Greater Caucasus over the past20 years amounted to the ~12.99 km3 or 11.04 ± 0.78 Gt water (~0.58 Gt per year). Themean annual geodetic mass balance between 2000 and 2010 was −0.42 ± 0.61 m w.e. a−1
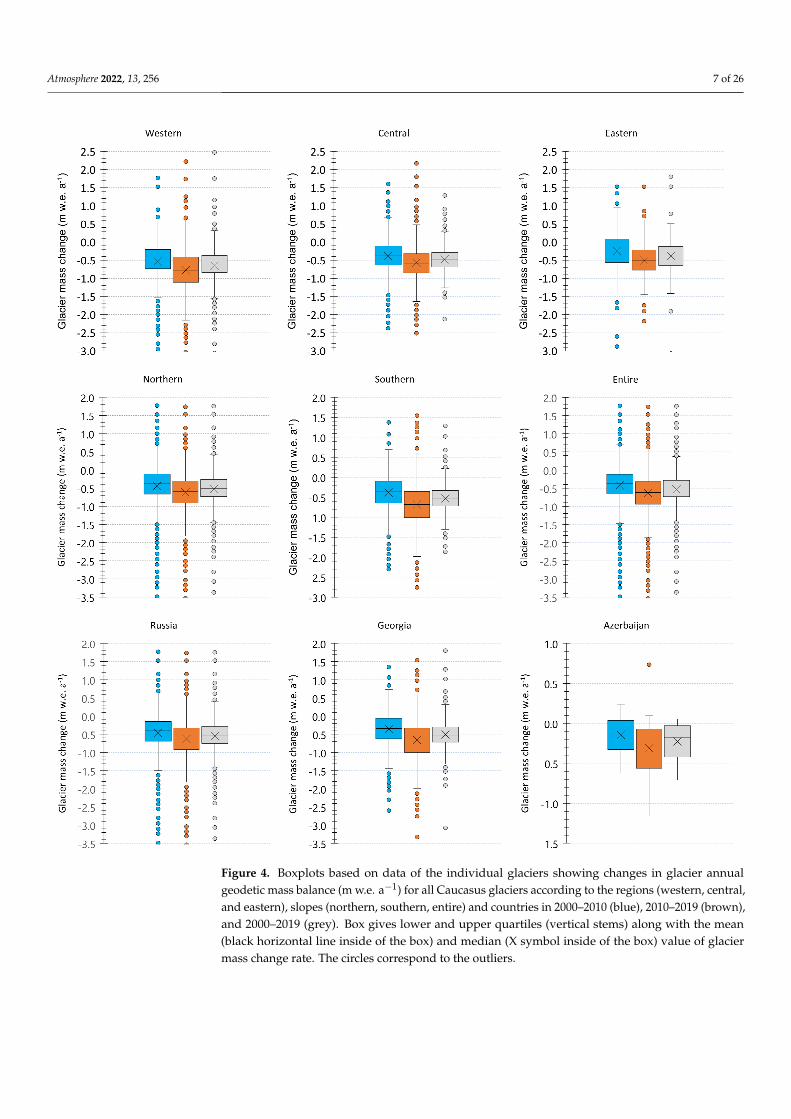
for the entire mountain range, while it was −0.64 ± 0.66 m w.e. a−1 between 2010 and 2019(Figure 4). The rates of mass loss vary between the western, central, and eastern GreaterCaucasus. This was relatively higher in the western section with 0.65 ± 0.43 m w.e. a−1 in2000–2019 (Figures 4 and 5a) and much lower in the eastern section (0.38 ± 0.37 m w.e. a−1)(Figures 4 and 5c). The colour-coded map in Figure 5 shows spatial distribution of changesof surface mass for both slopes of western, central, and eastern Greater Caucasus glaciersin 2000–2019. No difference was found between the northern and southern slopes overthe study period (0.53 ± 0.38 m w.e. a−1 on both slopes). Mean annual mass balanceon the glaciers of Russian Caucasus was slightly higher (−0.55 ± 0.39 m w.e. a−1) thanthose on the Georgian counterparts (−0.51 ± 0.36 m w.e. a−1). Glaciers in Azerbaijanexperienced the lowest mass balance (−0.23 ± 0.29 m w.e. a−1) over the last twenty years(Figure 4, Table A2). Mean annual surface mass balance of the north-and north-west-oriented glaciers was more negative than those of the south and south-western-orientedglaciers (Figure 6a). Figure 6b shows the mean annual geodetic mass balance rates forglaciers of seven size classes of the entire mountain range between 2000 and 2019 relativeto the mean and minimum (terminus) elevations, indicating that glaciers with a size classof 0.5–1.0 km2 experienced the highest mean annual mass loss (0.60 m w.e. a−1). Thelarge size class of glaciers with an area of 5.0–10.0 km2 had the lowest annual mass loss(0.41 m w.e. a−1) during the investigated period. Changes of geodetic mass balance andthickness for individual glaciers larger than 2.0 km2 of the Greater Caucasus in 2000–2010,2010–2019, and 2000–2019 are shown in Table A3.
Atmosphere 2022, 13, 256 6 of 24
Monthly climate data (temperature and precipitation) from two different meteoro-logical stations were also used in this study. The Terskol station is located at an elevation of 2143 m a.s.l. on the Russian side of the Greater Caucasus, while the Mestia station is located at an elevation of 1441 m a.s.l. on the Georgian side (see location on Figure 1). Observations are available for the period of 2000–2018 for Terskol (temperatures and precipitation) and 2000–2015 for the Mestia station.
4. Results 4.1. Mass Balance and Thickness Change for the Entire Region
Changes in annual geodetic mass balance along with cumulative mass balance in the entire Greater Caucasus over the last twenty years are shown in Figure 3 (see also Table A1). We computed mean annual mass loss of 0.53 ± 0.38 m w.e. a−1 for all glaciers in the Greater Caucasus between 2000 and 2019 with a cumulative mass change of −10.07 ± 7.22 m w.e. Calculated decrease in the mass of all glaciers in the Greater Caucasus over the past 20 years amounted to the ~12.99 km3 or 11.04 ± 0.78 Gt water (~0.58 Gt per year). The mean annual geodetic mass balance between 2000 and 2010 was −0.42 ± 0.61 m w.e. a−1 for the entire mountain range, while it was −0.64 ± 0.66 m w.e. a−1 between 2010 and 2019 (Figure 4). The rates of mass loss vary between the western, central, and eastern Greater Caucasus. This was relatively higher in the western section with 0.65 ± 0.43 m w.e. a−1 in 2000–2019 (Figures 4 and 5a) and much lower in the eastern section (0.38 ± 0.37 m w.e. a−1) (Figures 4 and 5c). The colour-coded map in Figure 5 shows spatial distribution of changes of surface mass for both slopes of western, central, and eastern Greater Caucasus glaciers in 2000–2019. No difference was found between the northern and southern slopes over the study period (0.53 ± 0.38 m w.e. a−1 on both slopes). Mean annual mass balance on the glaciers of Russian Caucasus was slightly higher (−0.55 ± 0.39 m w.e. a−1) than those on the Georgian counterparts (−0.51 ± 0.36 m w.e. a−1). Glaciers in Azerbaijan experienced the lowest mass balance (−0.23 ± 0.29 m w.e. a−1) over the last twenty years (Figure 4, Table A2). Mean annual surface mass balance of the north-and north-west-oriented glaciers was more negative than those of the south and south-western-oriented glaciers (Figure 6a). Figure 6b shows the mean annual geodetic mass balance rates for glaciers of seven size classes of the entire mountain range between 2000 and 2019 relative to the mean and minimum (terminus) elevations, indicating that glaciers with a size class of 0.5–1.0 km2 experienced the highest mean annual mass loss (0.60 m w.e. a−1). The large size class of glaciers with an area of 5.0–10.0 km2 had the lowest annual mass loss (0.41 m w.e. a−1) during the investigated period. Changes of ge-odetic mass balance and thickness for individual glaciers larger than 2.0 km2 of the Greater Caucasus in 2000–2010, 2010–2019, and 2000–2019 are shown in Table A3.
Figure 3. Mean annual geodetic mass balance (m w.e. a−1) and cumulative mass balance (m w.e.) for all Caucasus glaciers in 2000–2019.
-11-10-9-8-7-6-5-4-3-2-10
-1-0.9-0.8-0.7-0.6-0.5-0.4-0.3-0.2-0.1
0
2000
2001
2002
2003
2004
2005
2006
2007
2008
2009
2010
2011
2012
2013
2014
2015
2016
2017
2018
2019
Cum
ulat
ive
mas
s bal
ance
(m w
.e.)
Mas
s bal
ance
(m w
.e. a
−1)
Mass balanceCumulative mass balance
Figure 3. Mean annual geodetic mass balance (m w.e. a−1) and cumulative mass balance (m w.e.) forall Caucasus glaciers in 2000–2019.
Atmosphere 2022, 13, 256 7 of 26Atmosphere 2022, 13, 256 7 of 24
Figure 4. Boxplots based on data of the individual glaciers showing changes in glacier annual ge-odetic mass balance (m w.e. a−1) for all Caucasus glaciers according to the regions (western, central, and eastern), slopes (northern, southern, entire) and countries in 2000–2010 (blue), 2010–2019 (brown), and 2000–2019 (grey). Box gives lower and upper quartiles (vertical stems) along with the mean (black horizontal line inside of the box) and median (X symbol inside of the box) value of glacier mass change rate. The circles correspond to the outliers.
Figure 4. Boxplots based on data of the individual glaciers showing changes in glacier annualgeodetic mass balance (m w.e. a−1) for all Caucasus glaciers according to the regions (western, central,and eastern), slopes (northern, southern, entire) and countries in 2000–2010 (blue), 2010–2019 (brown),and 2000–2019 (grey). Box gives lower and upper quartiles (vertical stems) along with the mean(black horizontal line inside of the box) and median (X symbol inside of the box) value of glaciermass change rate. The circles correspond to the outliers.
Atmosphere 2022, 13, 256 8 of 26Atmosphere 2022, 13, 256 8 of 24
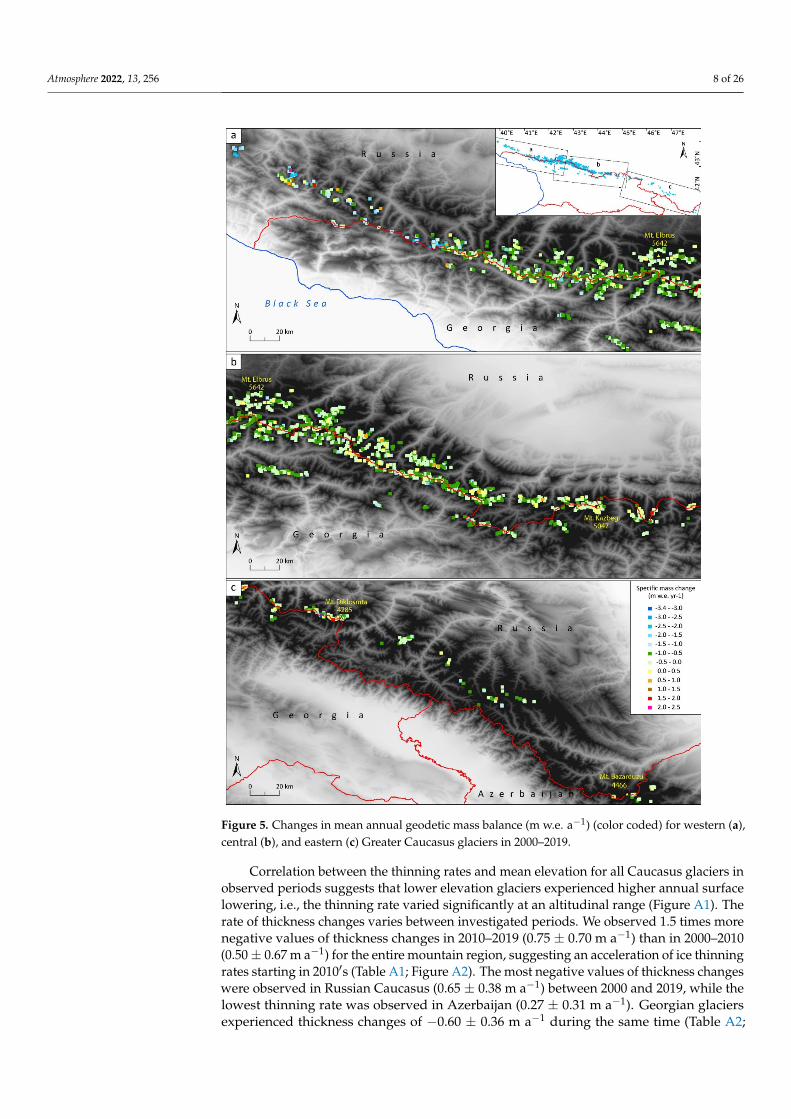
Figure 5. Changes in mean annual geodetic mass balance (m w.e. a−1) (color coded) for western (a), central (b), and eastern (c) Greater Caucasus glaciers in 2000–2019. Figure 5. Changes in mean annual geodetic mass balance (m w.e. a−1) (color coded) for western (a),
central (b), and eastern (c) Greater Caucasus glaciers in 2000–2019.
Correlation between the thinning rates and mean elevation for all Caucasus glaciers inobserved periods suggests that lower elevation glaciers experienced higher annual surfacelowering, i.e., the thinning rate varied significantly at an altitudinal range (Figure A1). Therate of thickness changes varies between investigated periods. We observed 1.5 times morenegative values of thickness changes in 2010–2019 (0.75 ± 0.70 m a−1) than in 2000–2010(0.50± 0.67 m a−1) for the entire mountain region, suggesting an acceleration of ice thinningrates starting in 2010′s (Table A1; Figure A2). The most negative values of thickness changeswere observed in Russian Caucasus (0.65 ± 0.38 m a−1) between 2000 and 2019, while thelowest thinning rate was observed in Azerbaijan (0.27 ± 0.31 m a−1). Georgian glaciersexperienced thickness changes of −0.60 ± 0.36 m a−1 during the same time (Table A2;
Atmosphere 2022, 13, 256 9 of 26
Figure A2). In terms of individual river basins, the most negative elevation and massbalance change were observed between 2000 and 2010 in Bolshaya Laba basin (north-westGreater Caucasus) with 1.57 ± 1.10 m a−1 and 1.34 ± 1.20 m w.e. a−1 loss respectively(27 glaciers with a total area of 4.4 ± 0.2 km2) (Table A1, Figure 1).
Atmosphere 2022, 13, 256 9 of 24
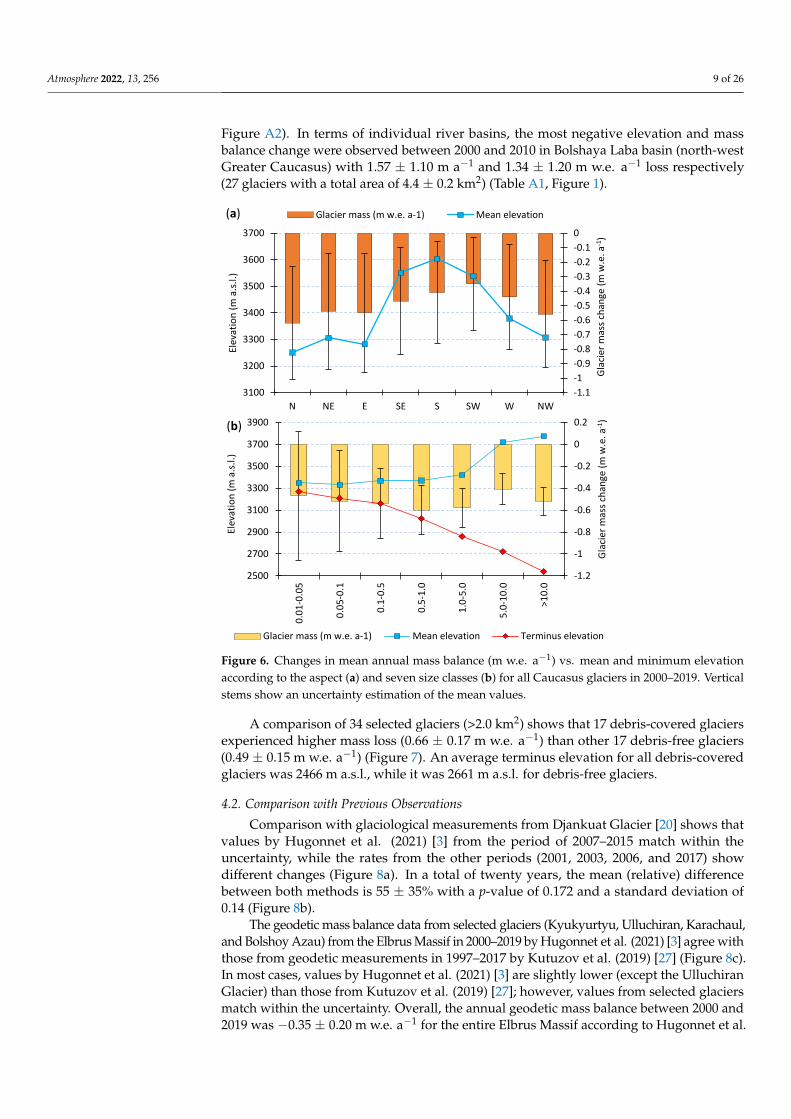
Figure 6. Changes in mean annual mass balance (m w.e. a−1) vs. mean and minimum elevation ac-cording to the aspect (a) and seven size classes (b) for all Caucasus glaciers in 2000–2019. Vertical stems show an uncertainty estimation of the mean values.
Correlation between the thinning rates and mean elevation for all Caucasus glaciers in observed periods suggests that lower elevation glaciers experienced higher annual surface lowering, i.e., the thinning rate varied significantly at an altitudinal range (Figure A1). The rate of thickness changes varies between investigated periods. We observed 1.5 times more negative values of thickness changes in 2010–2019 (0.75 ± 0.70 m a−1) than in 2000–2010 (0.50 ± 0.67 m a−1) for the entire mountain region, suggesting an acceleration of ice thinning rates starting in 2010′s (Table A1; Figure A2). The most negative values of thickness changes were observed in Russian Caucasus (0.65 ± 0.38 m a−1) between 2000 and 2019, while the lowest thinning rate was observed in Azerbaijan (0.27 ± 0.31 m a−1). Georgian glaciers experienced thickness changes of −0.60 ± 0.36 m a−1 during the same time (Table A2; Figure A2). In terms of individual river basins, the most negative eleva-tion and mass balance change were observed between 2000 and 2010 in Bolshaya Laba basin (north-west Greater Caucasus) with 1.57 ± 1.10 m a−1 and 1.34 ± 1.20 m w.e. a−1 loss respectively (27 glaciers with a total area of 4.4 ± 0.2 km2) (Table A1, Figure 1).
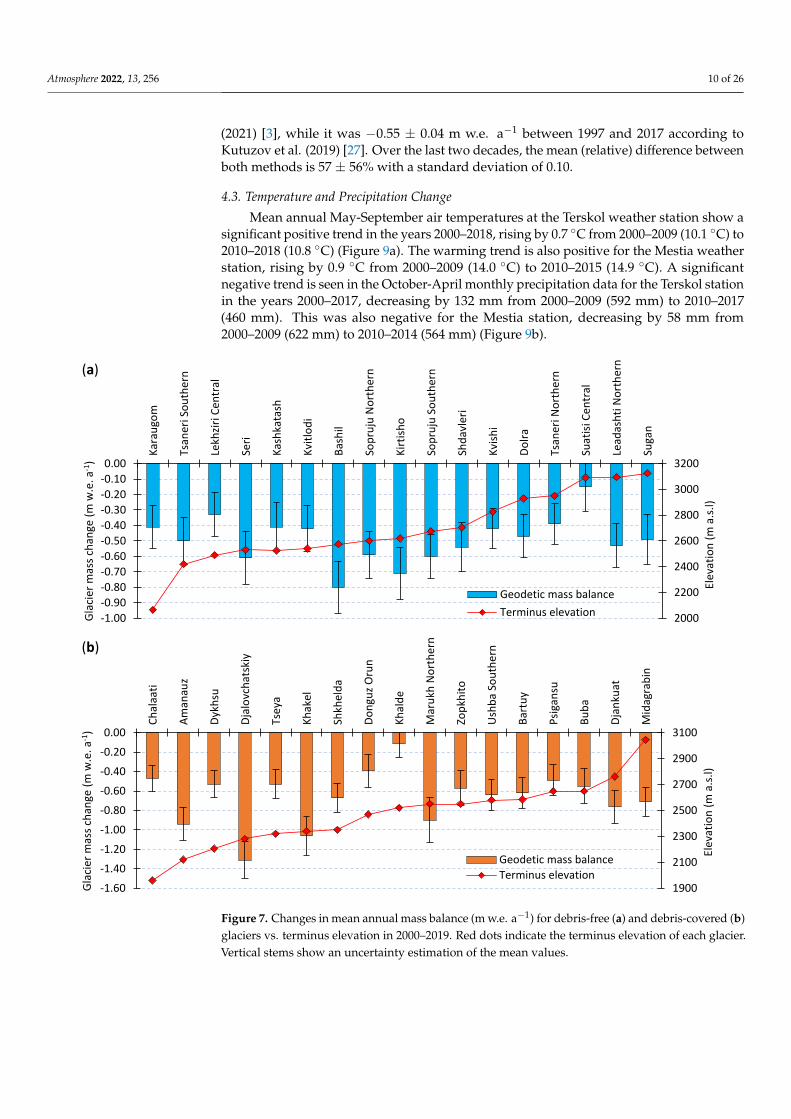
A comparison of 34 selected glaciers (>2.0 km2) shows that 17 debris-covered glaciers experienced higher mass loss (0.66 ± 0.17 m w.e. a−1) than other 17 debris-free glaciers (0.49 ± 0.15 m w.e. a−1) (Figure 7). An average terminus elevation for all debris-covered glaciers was 2466 m a.s.l., while it was 2661 m a.s.l. for debris-free glaciers.
-1.1-1-0.9-0.8-0.7-0.6-0.5-0.4-0.3-0.2-0.10
3100
3200
3300
3400
3500
3600
3700
N NE E SE S SW W NW
Glac
ier m
ass c
hang
e (m
w.e
. a-1
)
Elev
atio
n (m
a.s
.l.)
(a) Glacier mass (m w.e. a-1) Mean elevation
-1.2
-1
-0.8
-0.6
-0.4
-0.2
0
0.2
2500
2700
2900
3100
3300
3500
3700
3900
0.01
-0.0
5
0.05
-0.1
0.1-
0.5
0.5-
1.0
1.0-
5.0
5.0-
10.0
>10.
0
Glac
ier m
ass c
hang
e (m
w.e
. a-1
)
Elev
atio
n (m
a.s
.l.)
(b)
Glacier mass (m w.e. a-1) Mean elevation Terminus elevation
Figure 6. Changes in mean annual mass balance (m w.e. a−1) vs. mean and minimum elevationaccording to the aspect (a) and seven size classes (b) for all Caucasus glaciers in 2000–2019. Verticalstems show an uncertainty estimation of the mean values.
A comparison of 34 selected glaciers (>2.0 km2) shows that 17 debris-covered glaciersexperienced higher mass loss (0.66 ± 0.17 m w.e. a−1) than other 17 debris-free glaciers(0.49 ± 0.15 m w.e. a−1) (Figure 7). An average terminus elevation for all debris-coveredglaciers was 2466 m a.s.l., while it was 2661 m a.s.l. for debris-free glaciers.
4.2. Comparison with Previous Observations
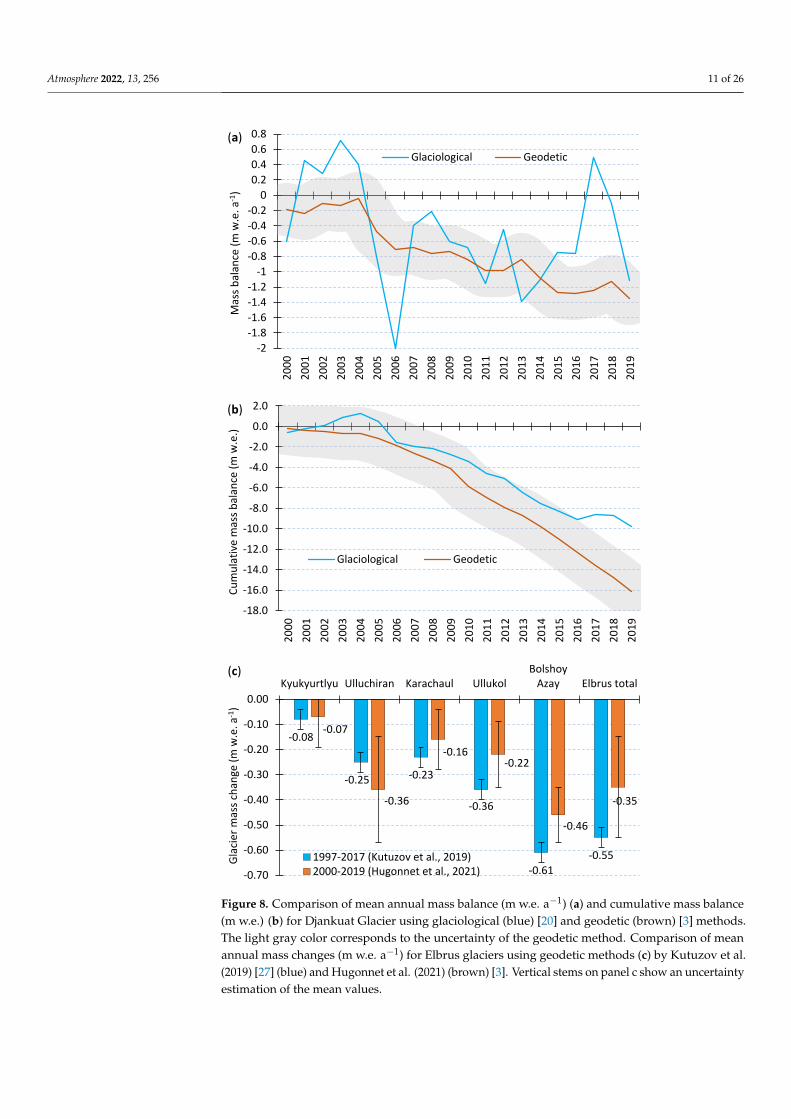
Comparison with glaciological measurements from Djankuat Glacier [20] shows thatvalues by Hugonnet et al. (2021) [3] from the period of 2007–2015 match within theuncertainty, while the rates from the other periods (2001, 2003, 2006, and 2017) showdifferent changes (Figure 8a). In a total of twenty years, the mean (relative) differencebetween both methods is 55 ± 35% with a p-value of 0.172 and a standard deviation of0.14 (Figure 8b).
The geodetic mass balance data from selected glaciers (Kyukyurtyu, Ulluchiran, Karachaul,and Bolshoy Azau) from the Elbrus Massif in 2000–2019 by Hugonnet et al. (2021) [3] agree withthose from geodetic measurements in 1997–2017 by Kutuzov et al. (2019) [27] (Figure 8c).In most cases, values by Hugonnet et al. (2021) [3] are slightly lower (except the UlluchiranGlacier) than those from Kutuzov et al. (2019) [27]; however, values from selected glaciersmatch within the uncertainty. Overall, the annual geodetic mass balance between 2000 and2019 was −0.35 ± 0.20 m w.e. a−1 for the entire Elbrus Massif according to Hugonnet et al.
Atmosphere 2022, 13, 256 10 of 26
(2021) [3], while it was −0.55 ± 0.04 m w.e. a−1 between 1997 and 2017 according toKutuzov et al. (2019) [27]. Over the last two decades, the mean (relative) difference betweenboth methods is 57 ± 56% with a standard deviation of 0.10.
4.3. Temperature and Precipitation Change
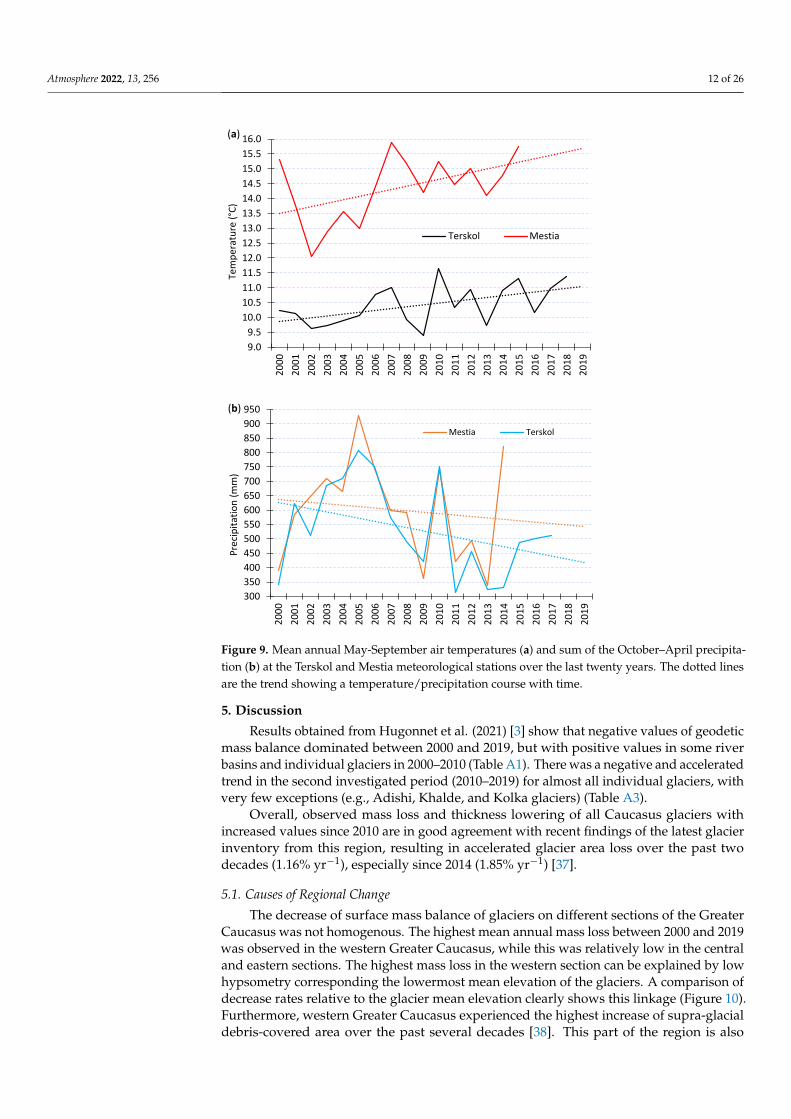
Mean annual May-September air temperatures at the Terskol weather station show asignificant positive trend in the years 2000–2018, rising by 0.7 ◦C from 2000–2009 (10.1 ◦C) to2010–2018 (10.8 ◦C) (Figure 9a). The warming trend is also positive for the Mestia weatherstation, rising by 0.9 ◦C from 2000–2009 (14.0 ◦C) to 2010–2015 (14.9 ◦C). A significantnegative trend is seen in the October-April monthly precipitation data for the Terskol stationin the years 2000–2017, decreasing by 132 mm from 2000–2009 (592 mm) to 2010–2017(460 mm). This was also negative for the Mestia station, decreasing by 58 mm from2000–2009 (622 mm) to 2010–2014 (564 mm) (Figure 9b).
Atmosphere 2022, 13, 256 10 of 24
Figure 7. Changes in mean annual mass balance (m w.e. a−1) for debris-free (a) and debris-covered (b) glaciers vs. terminus elevation in 2000–2019. Red dots indicate the terminus elevation of each glacier. Vertical stems show an uncertainty estimation of the mean values.
4.2. Comparison with Previous Observations Comparison with glaciological measurements from Djankuat Glacier [20] shows that
values by Hugonnet et al. (2021) [3] from the period of 2007–2015 match within the un-certainty, while the rates from the other periods (2001, 2003, 2006, and 2017) show dif-ferent changes (Figure 8a). In a total of twenty years, the mean (relative) difference be-tween both methods is 55 ± 35% with a p-value of 0.172 and a standard deviation of 0.14 (Figure 8b).
The geodetic mass balance data from selected glaciers (Kyukyurtyu, Ulluchiran, Karachaul, and Bolshoy Azau) from the Elbrus Massif in 2000–2019 by Hugonnet et al. (2021) [3] agree with those from geodetic measurements in 1997–2017 by Kutuzov et al. (2019) [27] (Figure 8c). In most cases, values by Hugonnet et al. (2021) [3] are slightly lower (except the Ulluchiran Glacier) than those from Kutuzov et al. (2019) [27]; however, values from selected glaciers match within the uncertainty. Overall, the annual geodetic mass balance between 2000 and 2019 was −0.35 ± 0.20 m w.e. a−1 for the entire Elbrus Massif according to Hugonnet et al. (2021) [3], while it was −0.55 ± 0.04 m w.e. a−1 between 1997 and 2017 according to Kutuzov et al. (2019) [27]. Over the last two decades, the mean (relative) difference between both methods is 57 ± 56% with a standard deviation of 0.10.
2000
2200
2400
2600
2800
3000
3200
-1.00-0.90-0.80-0.70-0.60-0.50-0.40-0.30-0.20-0.100.00
Kara
ugom
Tsan
eri S
outh
ern
Lekh
ziri C
entr
al
Seri
Kash
kata
sh
Kvitl
odi
Bash
il
Sopr
uju
Nor
ther
n
Kirt
isho
Sopr
uju
Sout
hern
Shda
vler
i
Kvish
i
Dolra
Tsan
eri N
orth
ern
Suat
isi C
entr
al
Lead
asht
i Nor
ther
n
Suga
n
Elev
atio
n (m
a.s
.l)
Glac
ier m
ass c
hang
e (m
w.e
. a-1
)
(a)
Geodetic mass balanceTerminus elevation
1900
2100
2300
2500
2700
2900
3100
-1.60
-1.40
-1.20
-1.00
-0.80
-0.60
-0.40
-0.20
0.00
Chal
aati
Aman
auz
Dykh
su
Djal
ovch
atsk
iy
Tsey
a
Khak
el
Shkh
elda
Dong
uz O
run
Khal
de
Mar
ukh
Nor
ther
n
Zopk
hito
Ush
ba S
outh
ern
Bart
uy
Psig
ansu
Buba
Djan
kuat
Mid
agra
bin
Elev
atio
n (m
a.s
.l)
Glac
ier m
ass c
hang
e (m
w.e
. a-1
)
(b)
Geodetic mass balanceTerminus elevation
Figure 7. Changes in mean annual mass balance (m w.e. a−1) for debris-free (a) and debris-covered (b)glaciers vs. terminus elevation in 2000–2019. Red dots indicate the terminus elevation of each glacier.Vertical stems show an uncertainty estimation of the mean values.
Atmosphere 2022, 13, 256 11 of 26Atmosphere 2022, 13, 256 11 of 24
Figure 8. Comparison of mean annual mass balance (m w.e. a−1) (a) and cumulative mass balance (m w.e.) (b) for Djankuat Glacier using glaciological (blue) [20] and geodetic (brown) [3] methods. The light gray color corresponds to the uncertainty of the geodetic method. Comparison of mean annual mass changes (m w.e. a−1) for Elbrus glaciers using geodetic methods (c) by Kutuzov et al. (2019) [27] (blue) and Hugonnet et al. (2021) (brown) [3]. Vertical stems on panel c show an uncer-tainty estimation of the mean values.
-2-1.8-1.6-1.4-1.2
-1-0.8-0.6-0.4-0.2
00.20.40.60.8
2000
2001
2002
2003
2004
2005
2006
2007
2008
2009
2010
2011
2012
2013
2014
2015
2016
2017
2018
2019
Mas
s bal
ance
(m w
.e. a
-1)
(a)Glaciological Geodetic
-18.0
-16.0
-14.0
-12.0
-10.0
-8.0
-6.0
-4.0
-2.0
0.0
2.0
2000
2001
2002
2003
2004
2005
2006
2007
2008
2009
2010
2011
2012
2013
2014
2015
2016
2017
2018
2019
Cum
ulat
ive
mas
s bal
ance
(m w
.e.)
(b)
Glaciological Geodetic
-0.08
-0.25 -0.23
-0.36
-0.61-0.55
-0.07
-0.36
-0.16-0.22
-0.46
-0.35
-0.70
-0.60
-0.50
-0.40
-0.30
-0.20
-0.10
0.00Kyukyurtlyu Ulluchiran Karachaul Ullukol
BolshoyAzay Elbrus total
Gla
cier
mas
s cha
nge
(m w
.e. a
-1)
(c)
1997-2017 (Kutuzov et al., 2019)2000-2019 (Hugonnet et al., 2021)
Figure 8. Comparison of mean annual mass balance (m w.e. a−1) (a) and cumulative mass balance(m w.e.) (b) for Djankuat Glacier using glaciological (blue) [20] and geodetic (brown) [3] methods.The light gray color corresponds to the uncertainty of the geodetic method. Comparison of meanannual mass changes (m w.e. a−1) for Elbrus glaciers using geodetic methods (c) by Kutuzov et al.(2019) [27] (blue) and Hugonnet et al. (2021) (brown) [3]. Vertical stems on panel c show an uncertaintyestimation of the mean values.
Atmosphere 2022, 13, 256 12 of 26
Atmosphere 2022, 13, 256 12 of 24
4.3. Temperature and Precipitation Change Mean annual May-September air temperatures at the Terskol weather station show a
significant positive trend in the years 2000–2018, rising by 0.7 °C from 2000–2009 (10.1 °C) to 2010–2018 (10.8 °C) (Figure 9a). The warming trend is also positive for the Mestia weather station, rising by 0.9 °C from 2000–2009 (14.0 °C) to 2010–2015 (14.9 °C). A sig-nificant negative trend is seen in the October-April monthly precipitation data for the Terskol station in the years 2000–2017, decreasing by 132 mm from 2000–2009 (592 mm) to 2010–2017 (460 mm). This was also negative for the Mestia station, decreasing by 58 mm from 2000–2009 (622 mm) to 2010–2014 (564 mm) (Figure 9b).
Figure 9. Mean annual May-September air temperatures (a) and sum of the October–April precip-itation (b) at the Terskol and Mestia meteorological stations over the last twenty years. The dotted lines are the trend showing a temperature/precipitation course with time.
5. Discussion Results obtained from Hugonnet et al. (2021) [3] show that negative values of geo-
detic mass balance dominated between 2000 and 2019, but with positive values in some river basins and individual glaciers in 2000–2010 (Table A1). There was a negative and accelerated trend in the second investigated period (2010–2019) for almost all individual glaciers, with very few exceptions (e.g., Adishi, Khalde, and Kolka glaciers) (Table A3).
9.09.5
10.010.511.011.512.012.513.013.514.014.515.015.516.0
2000
2001
2002
2003
2004
2005
2006
2007
2008
2009
2010
2011
2012
2013
2014
2015
2016
2017
2018
2019
Tem
pera
ture
(°C)
(a)
Terskol Mestia
300350400450500550600650700750800850900950
2000
2001
2002
2003
2004
2005
2006
2007
2008
2009
2010
2011
2012
2013
2014
2015
2016
2017
2018
2019
Prec
ipita
tion
(mm
)
(b)
Mestia Terskol
Figure 9. Mean annual May-September air temperatures (a) and sum of the October–April precipita-tion (b) at the Terskol and Mestia meteorological stations over the last twenty years. The dotted linesare the trend showing a temperature/precipitation course with time.
5. Discussion
Results obtained from Hugonnet et al. (2021) [3] show that negative values of geodeticmass balance dominated between 2000 and 2019, but with positive values in some riverbasins and individual glaciers in 2000–2010 (Table A1). There was a negative and acceleratedtrend in the second investigated period (2010–2019) for almost all individual glaciers, withvery few exceptions (e.g., Adishi, Khalde, and Kolka glaciers) (Table A3).
Overall, observed mass loss and thickness lowering of all Caucasus glaciers withincreased values since 2010 are in good agreement with recent findings of the latest glacierinventory from this region, resulting in accelerated glacier area loss over the past twodecades (1.16% yr−1), especially since 2014 (1.85% yr−1) [37].
5.1. Causes of Regional Change
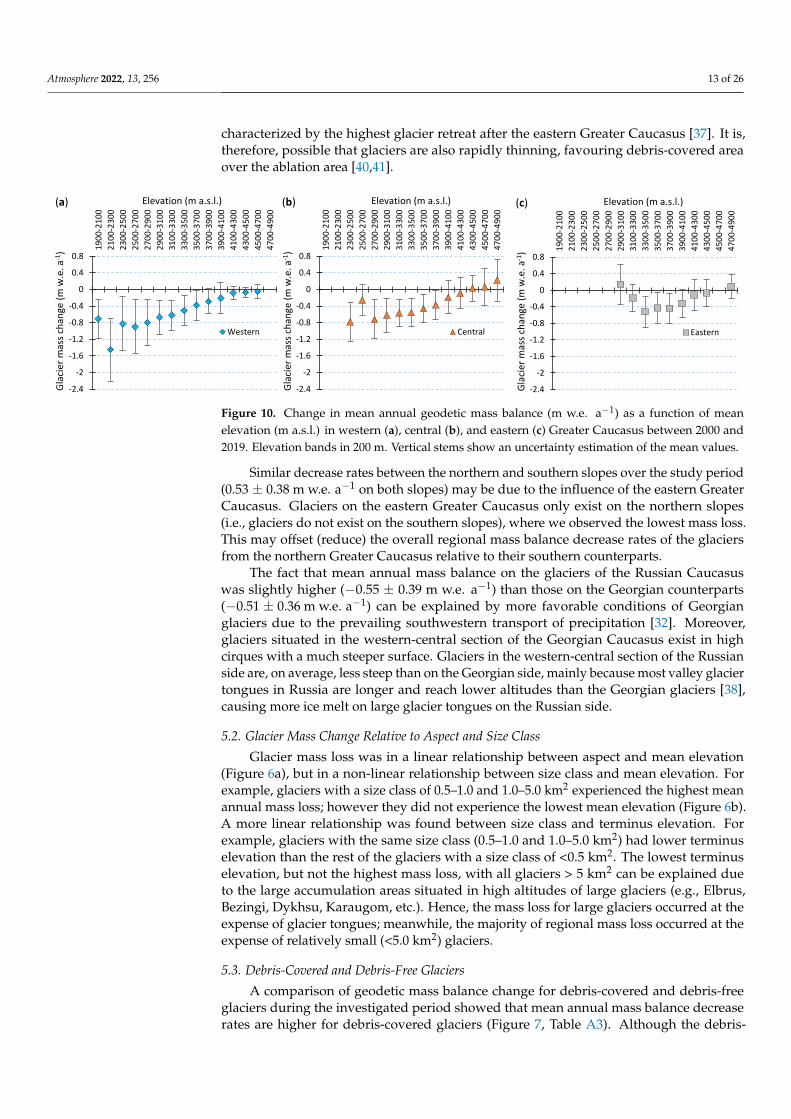
The decrease of surface mass balance of glaciers on different sections of the GreaterCaucasus was not homogenous. The highest mean annual mass loss between 2000 and 2019was observed in the western Greater Caucasus, while this was relatively low in the centraland eastern sections. The highest mass loss in the western section can be explained by lowhypsometry corresponding the lowermost mean elevation of the glaciers. A comparison ofdecrease rates relative to the glacier mean elevation clearly shows this linkage (Figure 10).Furthermore, western Greater Caucasus experienced the highest increase of supra-glacialdebris-covered area over the past several decades [38]. This part of the region is also
Atmosphere 2022, 13, 256 13 of 26
characterized by the highest glacier retreat after the eastern Greater Caucasus [37]. It is,therefore, possible that glaciers are also rapidly thinning, favouring debris-covered areaover the ablation area [40,41].
Atmosphere 2022, 13, 256 13 of 24
Overall, observed mass loss and thickness lowering of all Caucasus glaciers with increased values since 2010 are in good agreement with recent findings of the latest glacier inventory from this region, resulting in accelerated glacier area loss over the past two decades (1.16% yr−1), especially since 2014 (1.85% yr−1) [37].
5.1. Causes of Regional Change The decrease of surface mass balance of glaciers on different sections of the Greater
Caucasus was not homogenous. The highest mean annual mass loss between 2000 and 2019 was observed in the western Greater Caucasus, while this was relatively low in the central and eastern sections. The highest mass loss in the western section can be ex-plained by low hypsometry corresponding the lowermost mean elevation of the glaciers. A comparison of decrease rates relative to the glacier mean elevation clearly shows this linkage (Figure 10). Furthermore, western Greater Caucasus experienced the highest in-crease of supra-glacial debris-covered area over the past several decades [38]. This part of the region is also characterized by the highest glacier retreat after the eastern Greater Caucasus [37]. It is, therefore, possible that glaciers are also rapidly thinning, favouring debris-covered area over the ablation area [40,41].
Figure 10. Change in mean annual geodetic mass balance (m w.e. a−1) as a function of mean eleva-tion (m a.s.l.) in western (a), central (b), and eastern (c) Greater Caucasus between 2000 and 2019. Elevation bands in 200 m. Vertical stems show an uncertainty estimation of the mean values.
Similar decrease rates between the northern and southern slopes over the study pe-riod (0.53 ± 0.38 m w.e. a−1 on both slopes) may be due to the influence of the eastern Greater Caucasus. Glaciers on the eastern Greater Caucasus only exist on the northern slopes (i.e., glaciers do not exist on the southern slopes), where we observed the lowest mass loss. This may offset (reduce) the overall regional mass balance decrease rates of the glaciers from the northern Greater Caucasus relative to their southern counterparts.
The fact that mean annual mass balance on the glaciers of the Russian Caucasus was slightly higher (−0.55 ± 0.39 m w.e. a−1) than those on the Georgian counterparts (−0.51 ± 0.36 m w.e. a−1) can be explained by more favorable conditions of Georgian glaciers due to the prevailing southwestern transport of precipitation [32]. Moreover, glaciers situated in the western-central section of the Georgian Caucasus exist in high cirques with a much steeper surface. Glaciers in the western-central section of the Russian side are, on aver-age, less steep than on the Georgian side, mainly because most valley glacier tongues in Russia are longer and reach lower altitudes than the Georgian glaciers [38], causing more ice melt on large glacier tongues on the Russian side.
5.2. Glacier Mass Change Relative to Aspect and Size Class Glacier mass loss was in a linear relationship between aspect and mean elevation
(Figure 6a), but in a non-linear relationship between size class and mean elevation. For example, glaciers with a size class of 0.5–1.0 and 1.0–5.0 km2 experienced the highest
-2.4
-2
-1.6
-1.2
-0.8
-0.4
0
0.4
0.8
1900
-210
021
00-2
300
2300
-250
025
00-2
700
2700
-290
029
00-3
100
3100
-330
033
00-3
500
3500
-370
037
00-3
900
3900
-410
041
00-4
300
4300
-450
045
00-4
700
4700
-490
0
Glac
ier m
ass c
hang
e (m
w.e
. a-1
)
Elevation (m a.s.l.)(a)
Western
-2.4
-2
-1.6
-1.2
-0.8
-0.4
0
0.4
0.8
1900
-210
021
00-2
300
2300
-250
025
00-2
700
2700
-290
029
00-3
100
3100
-330
033
00-3
500
3500
-370
037
00-3
900
3900
-410
041
00-4
300
4300
-450
045
00-4
700
4700
-490
0
Glac
ier m
ass c
hang
e (m
w.e
. a-1
)
Elevation (m a.s.l.)(b)
Central
-2.4
-2
-1.6
-1.2
-0.8
-0.4
0
0.4
0.8
1900
-210
021
00-2
300
2300
-250
025
00-2
700
2700
-290
029
00-3
100
3100
-330
033
00-3
500
3500
-370
037
00-3
900
3900
-410
041
00-4
300
4300
-450
045
00-4
700
4700
-490
0
Glac
ier m
ass c
hang
e (m
w.e
. a-1
)
Elevation (m a.s.l.)(c)
Eastern
Figure 10. Change in mean annual geodetic mass balance (m w.e. a−1) as a function of meanelevation (m a.s.l.) in western (a), central (b), and eastern (c) Greater Caucasus between 2000 and2019. Elevation bands in 200 m. Vertical stems show an uncertainty estimation of the mean values.
Similar decrease rates between the northern and southern slopes over the study period(0.53 ± 0.38 m w.e. a−1 on both slopes) may be due to the influence of the eastern GreaterCaucasus. Glaciers on the eastern Greater Caucasus only exist on the northern slopes(i.e., glaciers do not exist on the southern slopes), where we observed the lowest mass loss.This may offset (reduce) the overall regional mass balance decrease rates of the glaciersfrom the northern Greater Caucasus relative to their southern counterparts.
The fact that mean annual mass balance on the glaciers of the Russian Caucasuswas slightly higher (−0.55 ± 0.39 m w.e. a−1) than those on the Georgian counterparts(−0.51 ± 0.36 m w.e. a−1) can be explained by more favorable conditions of Georgianglaciers due to the prevailing southwestern transport of precipitation [32]. Moreover,glaciers situated in the western-central section of the Georgian Caucasus exist in highcirques with a much steeper surface. Glaciers in the western-central section of the Russianside are, on average, less steep than on the Georgian side, mainly because most valley glaciertongues in Russia are longer and reach lower altitudes than the Georgian glaciers [38],causing more ice melt on large glacier tongues on the Russian side.
5.2. Glacier Mass Change Relative to Aspect and Size Class
Glacier mass loss was in a linear relationship between aspect and mean elevation(Figure 6a), but in a non-linear relationship between size class and mean elevation. Forexample, glaciers with a size class of 0.5–1.0 and 1.0–5.0 km2 experienced the highest meanannual mass loss; however they did not experience the lowest mean elevation (Figure 6b).A more linear relationship was found between size class and terminus elevation. Forexample, glaciers with the same size class (0.5–1.0 and 1.0–5.0 km2) had lower terminuselevation than the rest of the glaciers with a size class of <0.5 km2. The lowest terminuselevation, but not the highest mass loss, with all glaciers > 5 km2 can be explained dueto the large accumulation areas situated in high altitudes of large glaciers (e.g., Elbrus,Bezingi, Dykhsu, Karaugom, etc.). Hence, the mass loss for large glaciers occurred at theexpense of glacier tongues; meanwhile, the majority of regional mass loss occurred at theexpense of relatively small (<5.0 km2) glaciers.
5.3. Debris-Covered and Debris-Free Glaciers
A comparison of geodetic mass balance change for debris-covered and debris-freeglaciers during the investigated period showed that mean annual mass balance decreaserates are higher for debris-covered glaciers (Figure 7, Table A3). Although the debris-
Atmosphere 2022, 13, 256 14 of 26
covered glaciers, in general, present negative rates, the supraglacial debris clearly reducesthe thinning compared with debris-free surfaces at the same elevation [42]. However, itis likely that altitudinal difference between those two types of glaciers can change thisassumption and play a significant role in glacier thinning. For example, an average terminuselevation for the investigated debris-covered glaciers was ~200 m lower (2466 m a.s.l.) thanthose for the debris-free glaciers (2661 m a.s.l.), suggesting relatively warm temperaturesfor debris-covered glaciers based on the average regional lapse rate in summer (−0.52 ◦Cper 100 m) [33]. Supra-glacial debris thickness can also play a key role in changes of massbalance for individual glaciers. This is broadly confirmed that supra-glacial debris coveraffects surface melt with increasing ablation in cases of thin debris cover (less than a fewcm) or decreasing ablation under continuous thick debris cover [43–45]. It is also possiblethat ice cliffs and supra-glacial ponds play a key role by enhancing the total ablationof debris-covered glaciers in the Greater Caucasus. Ice cliffs have been identified as animportant contribution to the ablation of debris-covered glaciers, even when their spatialextent is very small [46]. This phenomenon was studied by terrestrial photogrammetryand unmanned air vehicle (UAV) surveys confirming that ice cliffs have a net ablation rateabout 3 times higher than the average glacier tongue surface [42]. We note that furtherstudies with high-resolution imagery (e.g., UAV, LiDAR) are required to understand theinfluence of ice cliffs in the mass balance for individual debris-covered glaciers, or at thebasin and region scale in the Greater Caucasus.
5.4. Difference between the Global and Local Studies
The difference between Hugonnet et al. (2021) [3] and Kutuzov et al. (2019) [27] fromElbrus glaciers may be due to the high-resolution DEMs used by Kutuzov (2019) [27] andthe internal boundaries of the selected glaciers, which were very similar, but not the same.In addition, the study by Hugonnet et al. (2021) [3] covers 2000–2019, which is slightlydifferent (1997–2017) than in Kutuzov et al. (2019) [27]. Overall, the difference betweenthose measurements match within the uncertainties, while the difference in geodetic massbalance from Hugonnet et al. (2021) [3] and glaciological mass balance from ground-basedmeasurement [20] of the Djankuat Glacier was relatively high. This can be due to themuch higher accuracy of ground-based measurement [47] or lower accuracy of geodeticmeasurement [3]. However, the results from those two measurements match within theuncertainties and tightly match the first time-period (2000–2010), suggesting that they arecomparable in terms of long-time measurement.
5.5. Glacier Mass Balance Relative to Local Climate Change
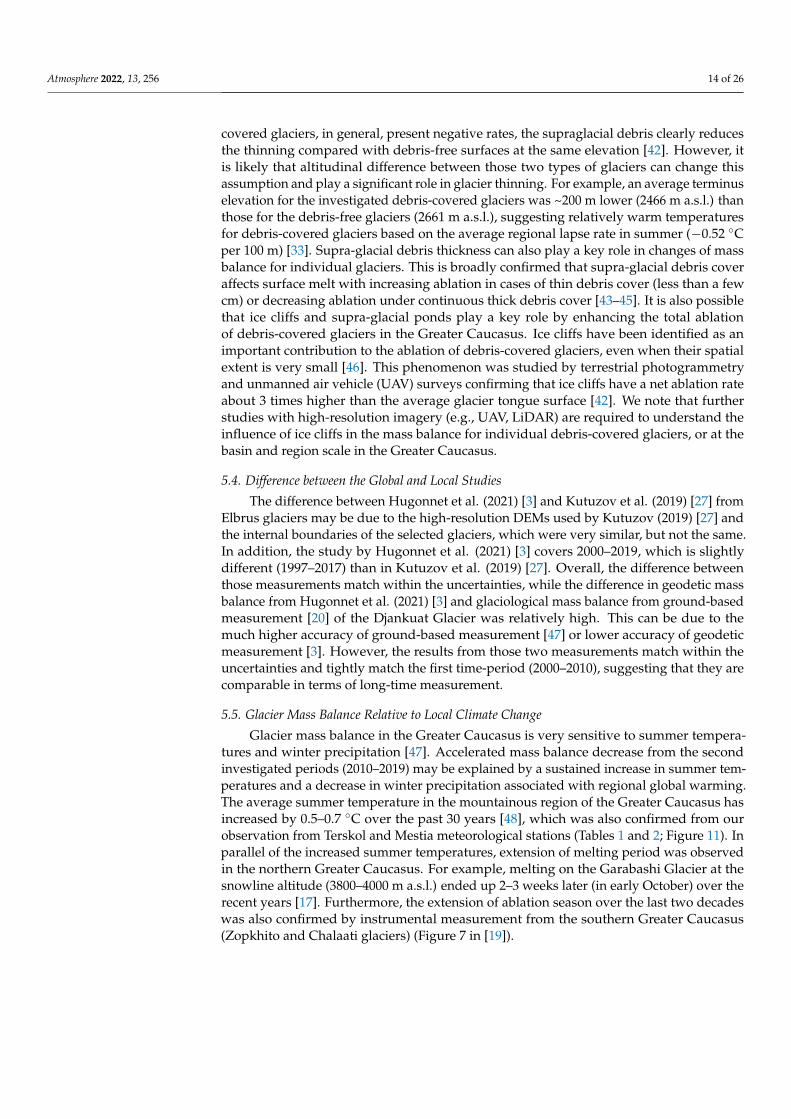
Glacier mass balance in the Greater Caucasus is very sensitive to summer tempera-tures and winter precipitation [47]. Accelerated mass balance decrease from the secondinvestigated periods (2010–2019) may be explained by a sustained increase in summer tem-peratures and a decrease in winter precipitation associated with regional global warming.The average summer temperature in the mountainous region of the Greater Caucasus hasincreased by 0.5–0.7 ◦C over the past 30 years [48], which was also confirmed from ourobservation from Terskol and Mestia meteorological stations (Tables 1 and 2; Figure 11). Inparallel of the increased summer temperatures, extension of melting period was observedin the northern Greater Caucasus. For example, melting on the Garabashi Glacier at thesnowline altitude (3800–4000 m a.s.l.) ended up 2–3 weeks later (in early October) over therecent years [17]. Furthermore, the extension of ablation season over the last two decadeswas also confirmed by instrumental measurement from the southern Greater Caucasus(Zopkhito and Chalaati glaciers) (Figure 7 in [19]).
Atmosphere 2022, 13, 256 15 of 26
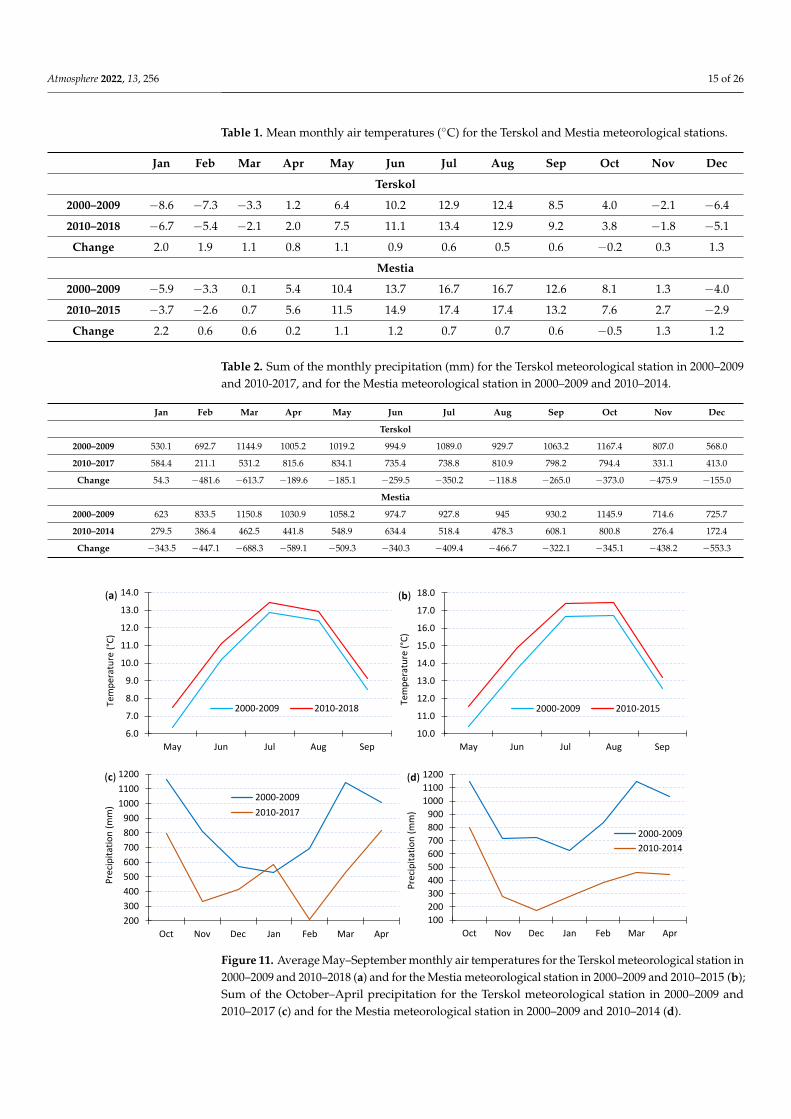
Table 1. Mean monthly air temperatures (◦C) for the Terskol and Mestia meteorological stations.
Jan Feb Mar Apr May Jun Jul Aug Sep Oct Nov Dec
Terskol
2000–2009 −8.6 −7.3 −3.3 1.2 6.4 10.2 12.9 12.4 8.5 4.0 −2.1 −6.4
2010–2018 −6.7 −5.4 −2.1 2.0 7.5 11.1 13.4 12.9 9.2 3.8 −1.8 −5.1
Change 2.0 1.9 1.1 0.8 1.1 0.9 0.6 0.5 0.6 −0.2 0.3 1.3
Mestia
2000–2009 −5.9 −3.3 0.1 5.4 10.4 13.7 16.7 16.7 12.6 8.1 1.3 −4.0
2010–2015 −3.7 −2.6 0.7 5.6 11.5 14.9 17.4 17.4 13.2 7.6 2.7 −2.9
Change 2.2 0.6 0.6 0.2 1.1 1.2 0.7 0.7 0.6 −0.5 1.3 1.2
Table 2. Sum of the monthly precipitation (mm) for the Terskol meteorological station in 2000–2009and 2010-2017, and for the Mestia meteorological station in 2000–2009 and 2010–2014.
Jan Feb Mar Apr May Jun Jul Aug Sep Oct Nov Dec
Terskol
2000–2009 530.1 692.7 1144.9 1005.2 1019.2 994.9 1089.0 929.7 1063.2 1167.4 807.0 568.0
2010–2017 584.4 211.1 531.2 815.6 834.1 735.4 738.8 810.9 798.2 794.4 331.1 413.0
Change 54.3 −481.6 −613.7 −189.6 −185.1 −259.5 −350.2 −118.8 −265.0 −373.0 −475.9 −155.0
Mestia
2000–2009 623 833.5 1150.8 1030.9 1058.2 974.7 927.8 945 930.2 1145.9 714.6 725.7
2010–2014 279.5 386.4 462.5 441.8 548.9 634.4 518.4 478.3 608.1 800.8 276.4 172.4
Change −343.5 −447.1 −688.3 −589.1 −509.3 −340.3 −409.4 −466.7 −322.1 −345.1 −438.2 −553.3Atmosphere 2022, 13, 256 16 of 24
Figure 11. Average May–September monthly air temperatures for the Terskol meteorological sta-tion in 2000-2009 and 2010-2018 (a) and for the Mestia meteorological station in 2000-2009 and 2010-2015 (b); Sum of the October–April precipitation for the Terskol meteorological station in 2000-2009 and 2010-2017 (c) and for the Mestia meteorological station in 2000-2009 and 2010-2014 (d).
Figure 12. Khasankoi glaciers (north-western Greater Caucasus) during the late summer without snowlines. Sentinel 2B image (04/09/2020) is used as a background.
6.0
7.0
8.0
9.0
10.0
11.0
12.0
13.0
14.0
May Jun Jul Aug Sep
Tem
pera
ture
(°C)
(a)
2000-2009 2010-2018
10.0
11.0
12.0
13.0
14.0
15.0
16.0
17.0
18.0
May Jun Jul Aug Sep
Tem
pera
ture
(°C)
(b)
2000-2009 2010-2015
200300400500600700800900
100011001200
Oct Nov Dec Jan Feb Mar Apr
Prec
ipita
tion
(mm
)
(c)
2000-20092010-2017
100200300400500600700800900
100011001200
Oct Nov Dec Jan Feb Mar Apr
Prec
ipita
tion
(mm
)
(d)
2000-20092010-2014
Figure 11. Average May–September monthly air temperatures for the Terskol meteorological station in2000–2009 and 2010–2018 (a) and for the Mestia meteorological station in 2000–2009 and 2010–2015 (b);Sum of the October–April precipitation for the Terskol meteorological station in 2000–2009 and2010–2017 (c) and for the Mestia meteorological station in 2000–2009 and 2010–2014 (d).
Atmosphere 2022, 13, 256 16 of 26
The increased incoming shortwave radiation, observed since the 1980s (10 W/m2
over 10 years), may also play a triggering role in the accelerated mass loss of the Caucasusglaciers over the past several decades. It has been proposed that this trend is associatedwith a weakening of the processes of formation of high and low clouds, which is due to anincrease in the frequency of anticyclones in the warm season [49].
Snow-ice-covered areas of the Greater Caucasus are subject to dust outbreak eventsoriginating from desert regions able to significantly decrease snow albedo. Several dustdepositions events that originated from the Sahara between the 2009–2012 and 2018 periodwere observed in this region [50,51]. Dust events systematically shortened the snowcover duration, especially in the western Greater Caucasus. The shortening was higherfor locations with higher accumulation and higher elevation [51] considering one of thesignificant indicators for glacier thinning in this region.
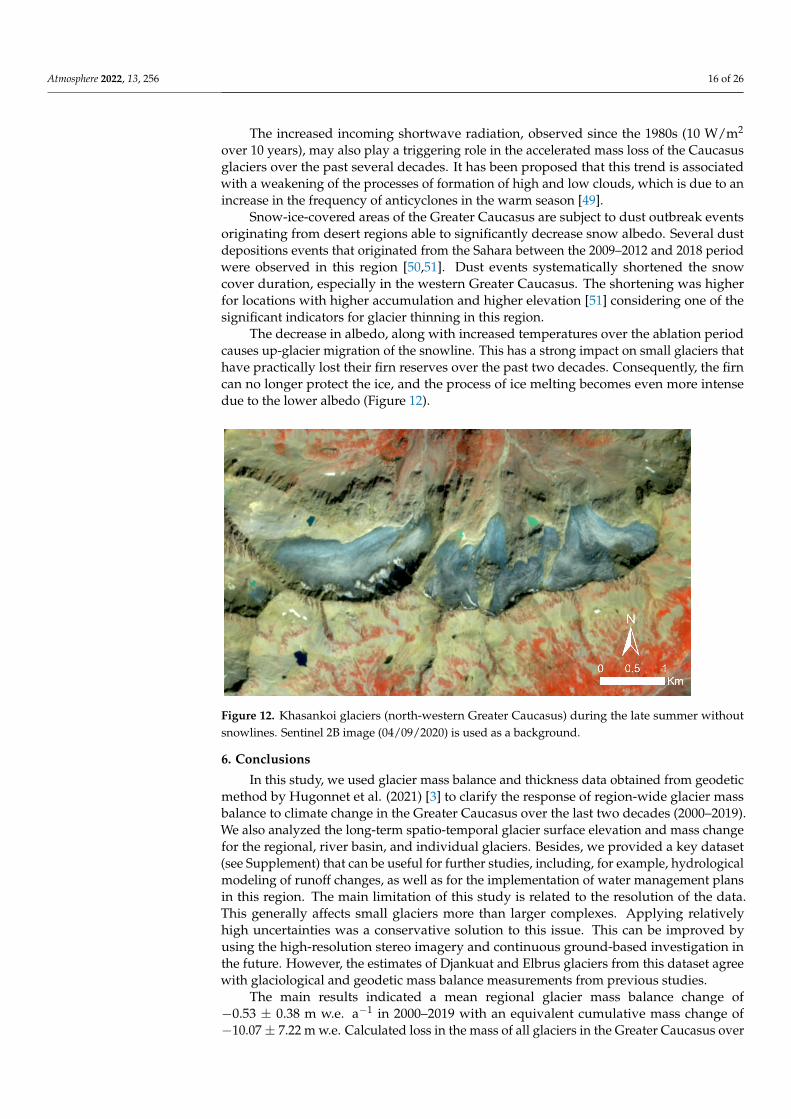
The decrease in albedo, along with increased temperatures over the ablation periodcauses up-glacier migration of the snowline. This has a strong impact on small glaciers thathave practically lost their firn reserves over the past two decades. Consequently, the firncan no longer protect the ice, and the process of ice melting becomes even more intensedue to the lower albedo (Figure 12).
Atmosphere 2022, 13, 256 16 of 24
Figure 11. Average May–September monthly air temperatures for the Terskol meteorological sta-tion in 2000-2009 and 2010-2018 (a) and for the Mestia meteorological station in 2000-2009 and 2010-2015 (b); Sum of the October–April precipitation for the Terskol meteorological station in 2000-2009 and 2010-2017 (c) and for the Mestia meteorological station in 2000-2009 and 2010-2014 (d).
Figure 12. Khasankoi glaciers (north-western Greater Caucasus) during the late summer without snowlines. Sentinel 2B image (04/09/2020) is used as a background.
6.0
7.0
8.0
9.0
10.0
11.0
12.0
13.0
14.0
May Jun Jul Aug Sep
Tem
pera
ture
(°C)
(a)
2000-2009 2010-2018
10.0
11.0
12.0
13.0
14.0
15.0
16.0
17.0
18.0
May Jun Jul Aug Sep
Tem
pera
ture
(°C)
(b)
2000-2009 2010-2015
200300400500600700800900
100011001200
Oct Nov Dec Jan Feb Mar Apr
Prec
ipita
tion
(mm
)
(c)
2000-20092010-2017
100200300400500600700800900
100011001200
Oct Nov Dec Jan Feb Mar Apr
Prec
ipita
tion
(mm
)
(d)
2000-20092010-2014
Figure 12. Khasankoi glaciers (north-western Greater Caucasus) during the late summer withoutsnowlines. Sentinel 2B image (04/09/2020) is used as a background.
6. Conclusions
In this study, we used glacier mass balance and thickness data obtained from geodeticmethod by Hugonnet et al. (2021) [3] to clarify the response of region-wide glacier massbalance to climate change in the Greater Caucasus over the last two decades (2000–2019).We also analyzed the long-term spatio-temporal glacier surface elevation and mass changefor the regional, river basin, and individual glaciers. Besides, we provided a key dataset(see Supplement) that can be useful for further studies, including, for example, hydrologicalmodeling of runoff changes, as well as for the implementation of water management plansin this region. The main limitation of this study is related to the resolution of the data.This generally affects small glaciers more than larger complexes. Applying relativelyhigh uncertainties was a conservative solution to this issue. This can be improved byusing the high-resolution stereo imagery and continuous ground-based investigation inthe future. However, the estimates of Djankuat and Elbrus glaciers from this dataset agreewith glaciological and geodetic mass balance measurements from previous studies.
The main results indicated a mean regional glacier mass balance change of−0.53 ± 0.38 m w.e. a−1 in 2000–2019 with an equivalent cumulative mass change of−10.07± 7.22 m w.e. Calculated loss in the mass of all glaciers in the Greater Caucasus over
Atmosphere 2022, 13, 256 17 of 26
the past 20 years amounted to the ~12.99 km3 or 11.04 ± 0.78 Gt water. Strong accelerationin mass loss and the thinning rates were observed since 2010, which likely occurred due toan increase in summer temperatures, accompanied by a reduction in winter precipitation.
The highest mass loss in the western Greater Caucasus was due to the lowest meanelevation of glaciers. We also hypothesized that the deposition events that originated fromthe Sahara between the 2009–2012 and 2018 periods may have increased glacier melting inthe western section.
Lower terminus elevation in debris-covered glaciers indicated a strong decrease ofsurface mass balance relative to the high-terminated debris-free glaciers. Debris thickness,ice cliffs, and supraglacial ponds may also play a key role in enhancing the total ablation ofdebris-covered glaciers in the Greater Caucasus.
Author Contributions: Conceptualization, L.G.T. and V.J.; methodology, L.G.T. and G.A.N.; software,L.G.T.; validation, L.G.T., V.J. and G.A.N.; formal analysis, L.G.T., V.J. and G.A.N.; investigation,L.G.T., V.J. and G.A.N.; writing—original draft preparation, L.G.T.; review and editing, L.G.T., V.J.and G.A.N.; visualization, L.G.T., V.J. and G.A.N.; funding acquisition, V.J. All authors have read andagreed to the published version of the manuscript.
Funding: This research was funded by the French-Russian-Georgian collaborative project “DEGLacia-tion dans le grAnd Caucase—DEGLAC” (IRP 00008 Deglac).
Institutional Review Board Statement: Not applicable.
Informed Consent Statement: Not applicable.
Data Availability Statement: The data presented in this study are openly available in Zenodohttps://doi.org/10.5281/zenodo.5816997 (Last access 2 February 2022).
Acknowledgments: We gratefully acknowledge the support of the two anonymous reviewers foruseful suggestions and detailed comments which clearly enhanced the quality of the paper.
Conflicts of Interest: The authors declare no conflict of interest. The funders had no role in the designof the study; in the collection, analyses, or interpretation of data; in the writing of the manuscript, orin the decision to publish the results.
Atmosphere 2022, 13, 256 18 of 26
Appendix A
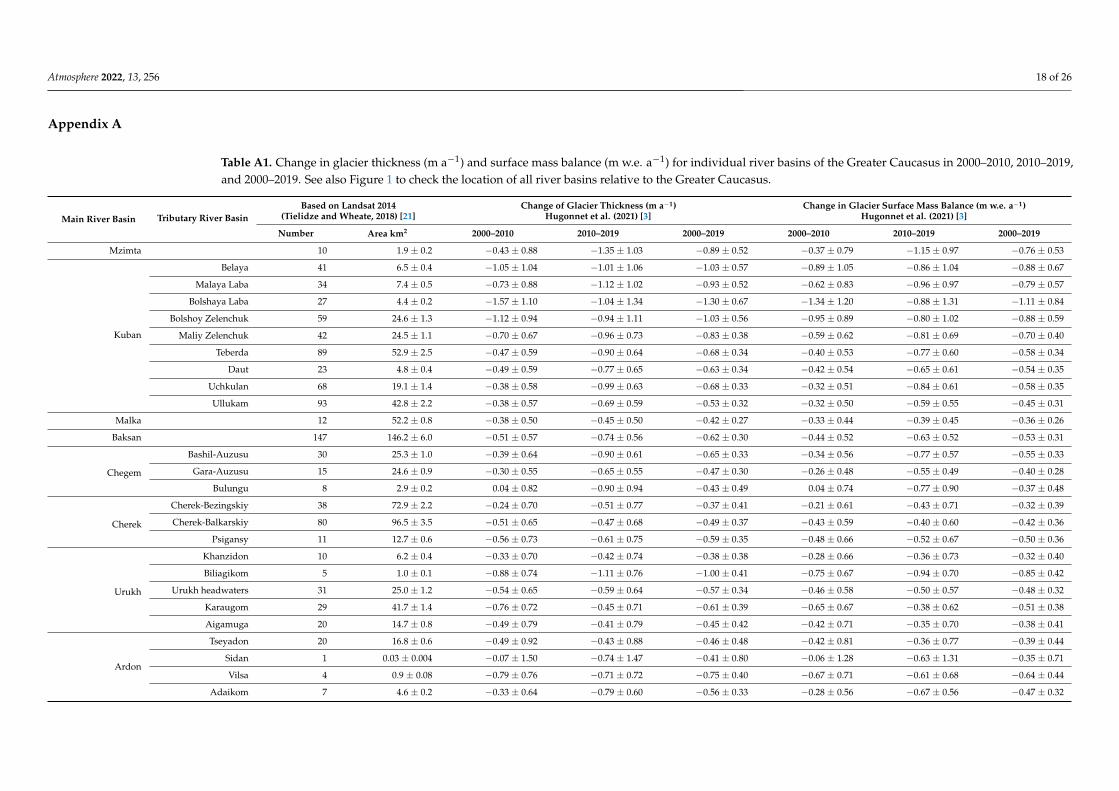
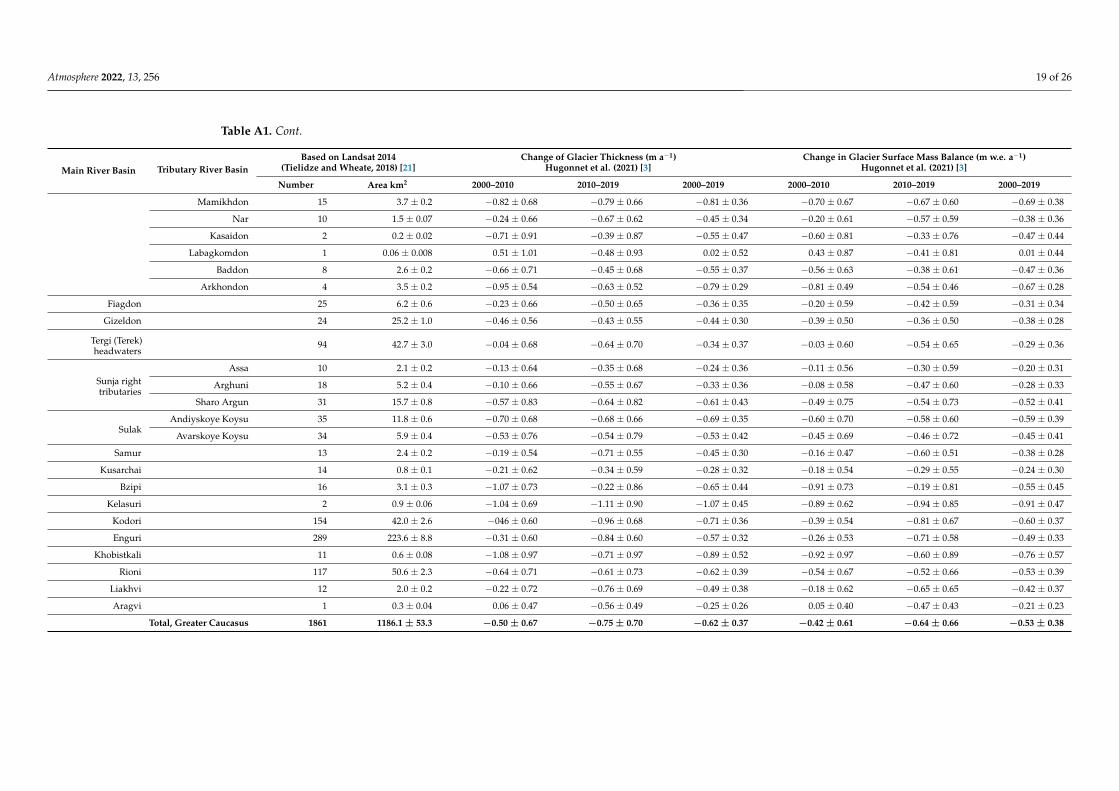
Table A1. Change in glacier thickness (m a−1) and surface mass balance (m w.e. a−1) for individual river basins of the Greater Caucasus in 2000–2010, 2010–2019,and 2000–2019. See also Figure 1 to check the location of all river basins relative to the Greater Caucasus.
Main River Basin Tributary River BasinBased on Landsat 2014
(Tielidze and Wheate, 2018) [21]Change of Glacier Thickness (m a−1)
Hugonnet et al. (2021) [3]Change in Glacier Surface Mass Balance (m w.e. a−1)
Hugonnet et al. (2021) [3]
Number Area km2 2000–2010 2010–2019 2000–2019 2000–2010 2010–2019 2000–2019
Mzimta 10 1.9 ± 0.2 −0.43 ± 0.88 −1.35 ± 1.03 −0.89 ± 0.52 −0.37 ± 0.79 −1.15 ± 0.97 −0.76 ± 0.53
Kuban
Belaya 41 6.5 ± 0.4 −1.05 ± 1.04 −1.01 ± 1.06 −1.03 ± 0.57 −0.89 ± 1.05 −0.86 ± 1.04 −0.88 ± 0.67
Malaya Laba 34 7.4 ± 0.5 −0.73 ± 0.88 −1.12 ± 1.02 −0.93 ± 0.52 −0.62 ± 0.83 −0.96 ± 0.97 −0.79 ± 0.57
Bolshaya Laba 27 4.4 ± 0.2 −1.57 ± 1.10 −1.04 ± 1.34 −1.30 ± 0.67 −1.34 ± 1.20 −0.88 ± 1.31 −1.11 ± 0.84
Bolshoy Zelenchuk 59 24.6 ± 1.3 −1.12 ± 0.94 −0.94 ± 1.11 −1.03 ± 0.56 −0.95 ± 0.89 −0.80 ± 1.02 −0.88 ± 0.59
Maliy Zelenchuk 42 24.5 ± 1.1 −0.70 ± 0.67 −0.96 ± 0.73 −0.83 ± 0.38 −0.59 ± 0.62 −0.81 ± 0.69 −0.70 ± 0.40
Teberda 89 52.9 ± 2.5 −0.47 ± 0.59 −0.90 ± 0.64 −0.68 ± 0.34 −0.40 ± 0.53 −0.77 ± 0.60 −0.58 ± 0.34
Daut 23 4.8 ± 0.4 −0.49 ± 0.59 −0.77 ± 0.65 −0.63 ± 0.34 −0.42 ± 0.54 −0.65 ± 0.61 −0.54 ± 0.35
Uchkulan 68 19.1 ± 1.4 −0.38 ± 0.58 −0.99 ± 0.63 −0.68 ± 0.33 −0.32 ± 0.51 −0.84 ± 0.61 −0.58 ± 0.35
Ullukam 93 42.8 ± 2.2 −0.38 ± 0.57 −0.69 ± 0.59 −0.53 ± 0.32 −0.32 ± 0.50 −0.59 ± 0.55 −0.45 ± 0.31
Malka 12 52.2 ± 0.8 −0.38 ± 0.50 −0.45 ± 0.50 −0.42 ± 0.27 −0.33 ± 0.44 −0.39 ± 0.45 −0.36 ± 0.26
Baksan 147 146.2 ± 6.0 −0.51 ± 0.57 −0.74 ± 0.56 −0.62 ± 0.30 −0.44 ± 0.52 −0.63 ± 0.52 −0.53 ± 0.31
Chegem
Bashil-Auzusu 30 25.3 ± 1.0 −0.39 ± 0.64 −0.90 ± 0.61 −0.65 ± 0.33 −0.34 ± 0.56 −0.77 ± 0.57 −0.55 ± 0.33
Gara-Auzusu 15 24.6 ± 0.9 −0.30 ± 0.55 −0.65 ± 0.55 −0.47 ± 0.30 −0.26 ± 0.48 −0.55 ± 0.49 −0.40 ± 0.28
Bulungu 8 2.9 ± 0.2 0.04 ± 0.82 −0.90 ± 0.94 −0.43 ± 0.49 0.04 ± 0.74 −0.77 ± 0.90 −0.37 ± 0.48
Cherek
Cherek-Bezingskiy 38 72.9 ± 2.2 −0.24 ± 0.70 −0.51 ± 0.77 −0.37 ± 0.41 −0.21 ± 0.61 −0.43 ± 0.71 −0.32 ± 0.39
Cherek-Balkarskiy 80 96.5 ± 3.5 −0.51 ± 0.65 −0.47 ± 0.68 −0.49 ± 0.37 −0.43 ± 0.59 −0.40 ± 0.60 −0.42 ± 0.36
Psigansy 11 12.7 ± 0.6 −0.56 ± 0.73 −0.61 ± 0.75 −0.59 ± 0.35 −0.48 ± 0.66 −0.52 ± 0.67 −0.50 ± 0.36
Urukh
Khanzidon 10 6.2 ± 0.4 −0.33 ± 0.70 −0.42 ± 0.74 −0.38 ± 0.38 −0.28 ± 0.66 −0.36 ± 0.73 −0.32 ± 0.40
Biliagikom 5 1.0 ± 0.1 −0.88 ± 0.74 −1.11 ± 0.76 −1.00 ± 0.41 −0.75 ± 0.67 −0.94 ± 0.70 −0.85 ± 0.42
Urukh headwaters 31 25.0 ± 1.2 −0.54 ± 0.65 −0.59 ± 0.64 −0.57 ± 0.34 −0.46 ± 0.58 −0.50 ± 0.57 −0.48 ± 0.32
Karaugom 29 41.7 ± 1.4 −0.76 ± 0.72 −0.45 ± 0.71 −0.61 ± 0.39 −0.65 ± 0.67 −0.38 ± 0.62 −0.51 ± 0.38
Aigamuga 20 14.7 ± 0.8 −0.49 ± 0.79 −0.41 ± 0.79 −0.45 ± 0.42 −0.42 ± 0.71 −0.35 ± 0.70 −0.38 ± 0.41
Ardon
Tseyadon 20 16.8 ± 0.6 −0.49 ± 0.92 −0.43 ± 0.88 −0.46 ± 0.48 −0.42 ± 0.81 −0.36 ± 0.77 −0.39 ± 0.44
Sidan 1 0.03 ± 0.004 −0.07 ± 1.50 −0.74 ± 1.47 −0.41 ± 0.80 −0.06 ± 1.28 −0.63 ± 1.31 −0.35 ± 0.71
Vilsa 4 0.9 ± 0.08 −0.79 ± 0.76 −0.71 ± 0.72 −0.75 ± 0.40 −0.67 ± 0.71 −0.61 ± 0.68 −0.64 ± 0.44
Adaikom 7 4.6 ± 0.2 −0.33 ± 0.64 −0.79 ± 0.60 −0.56 ± 0.33 −0.28 ± 0.56 −0.67 ± 0.56 −0.47 ± 0.32
Atmosphere 2022, 13, 256 19 of 26
Table A1. Cont.
Main River Basin Tributary River BasinBased on Landsat 2014
(Tielidze and Wheate, 2018) [21]Change of Glacier Thickness (m a−1)
Hugonnet et al. (2021) [3]Change in Glacier Surface Mass Balance (m w.e. a−1)
Hugonnet et al. (2021) [3]
Number Area km2 2000–2010 2010–2019 2000–2019 2000–2010 2010–2019 2000–2019
Mamikhdon 15 3.7 ± 0.2 −0.82 ± 0.68 −0.79 ± 0.66 −0.81 ± 0.36 −0.70 ± 0.67 −0.67 ± 0.60 −0.69 ± 0.38
Nar 10 1.5 ± 0.07 −0.24 ± 0.66 −0.67 ± 0.62 −0.45 ± 0.34 −0.20 ± 0.61 −0.57 ± 0.59 −0.38 ± 0.36
Kasaidon 2 0.2 ± 0.02 −0.71 ± 0.91 −0.39 ± 0.87 −0.55 ± 0.47 −0.60 ± 0.81 −0.33 ± 0.76 −0.47 ± 0.44
Labagkomdon 1 0.06 ± 0.008 0.51 ± 1.01 −0.48 ± 0.93 0.02 ± 0.52 0.43 ± 0.87 −0.41 ± 0.81 0.01 ± 0.44
Baddon 8 2.6 ± 0.2 −0.66 ± 0.71 −0.45 ± 0.68 −0.55 ± 0.37 −0.56 ± 0.63 −0.38 ± 0.61 −0.47 ± 0.36
Arkhondon 4 3.5 ± 0.2 −0.95 ± 0.54 −0.63 ± 0.52 −0.79 ± 0.29 −0.81 ± 0.49 −0.54 ± 0.46 −0.67 ± 0.28
Fiagdon 25 6.2 ± 0.6 −0.23 ± 0.66 −0.50 ± 0.65 −0.36 ± 0.35 −0.20 ± 0.59 −0.42 ± 0.59 −0.31 ± 0.34
Gizeldon 24 25.2 ± 1.0 −0.46 ± 0.56 −0.43 ± 0.55 −0.44 ± 0.30 −0.39 ± 0.50 −0.36 ± 0.50 −0.38 ± 0.28
Tergi (Terek)headwaters
94 42.7 ± 3.0 −0.04 ± 0.68 −0.64 ± 0.70 −0.34 ± 0.37 −0.03 ± 0.60 −0.54 ± 0.65 −0.29 ± 0.36
Sunja righttributaries
Assa 10 2.1 ± 0.2 −0.13 ± 0.64 −0.35 ± 0.68 −0.24 ± 0.36 −0.11 ± 0.56 −0.30 ± 0.59 −0.20 ± 0.31
Arghuni 18 5.2 ± 0.4 −0.10 ± 0.66 −0.55 ± 0.67 −0.33 ± 0.36 −0.08 ± 0.58 −0.47 ± 0.60 −0.28 ± 0.33
Sharo Argun 31 15.7 ± 0.8 −0.57 ± 0.83 −0.64 ± 0.82 −0.61 ± 0.43 −0.49 ± 0.75 −0.54 ± 0.73 −0.52 ± 0.41
SulakAndiyskoye Koysu 35 11.8 ± 0.6 −0.70 ± 0.68 −0.68 ± 0.66 −0.69 ± 0.35 −0.60 ± 0.70 −0.58 ± 0.60 −0.59 ± 0.39
Avarskoye Koysu 34 5.9 ± 0.4 −0.53 ± 0.76 −0.54 ± 0.79 −0.53 ± 0.42 −0.45 ± 0.69 −0.46 ± 0.72 −0.45 ± 0.41
Samur 13 2.4 ± 0.2 −0.19 ± 0.54 −0.71 ± 0.55 −0.45 ± 0.30 −0.16 ± 0.47 −0.60 ± 0.51 −0.38 ± 0.28
Kusarchai 14 0.8 ± 0.1 −0.21 ± 0.62 −0.34 ± 0.59 −0.28 ± 0.32 −0.18 ± 0.54 −0.29 ± 0.55 −0.24 ± 0.30
Bzipi 16 3.1 ± 0.3 −1.07 ± 0.73 −0.22 ± 0.86 −0.65 ± 0.44 −0.91 ± 0.73 −0.19 ± 0.81 −0.55 ± 0.45
Kelasuri 2 0.9 ± 0.06 −1.04 ± 0.69 −1.11 ± 0.90 −1.07 ± 0.45 −0.89 ± 0.62 −0.94 ± 0.85 −0.91 ± 0.47
Kodori 154 42.0 ± 2.6 −046 ± 0.60 −0.96 ± 0.68 −0.71 ± 0.36 −0.39 ± 0.54 −0.81 ± 0.67 −0.60 ± 0.37
Enguri 289 223.6 ± 8.8 −0.31 ± 0.60 −0.84 ± 0.60 −0.57 ± 0.32 −0.26 ± 0.53 −0.71 ± 0.58 −0.49 ± 0.33
Khobistkali 11 0.6 ± 0.08 −1.08 ± 0.97 −0.71 ± 0.97 −0.89 ± 0.52 −0.92 ± 0.97 −0.60 ± 0.89 −0.76 ± 0.57
Rioni 117 50.6 ± 2.3 −0.64 ± 0.71 −0.61 ± 0.73 −0.62 ± 0.39 −0.54 ± 0.67 −0.52 ± 0.66 −0.53 ± 0.39
Liakhvi 12 2.0 ± 0.2 −0.22 ± 0.72 −0.76 ± 0.69 −0.49 ± 0.38 −0.18 ± 0.62 −0.65 ± 0.65 −0.42 ± 0.37
Aragvi 1 0.3 ± 0.04 0.06 ± 0.47 −0.56 ± 0.49 −0.25 ± 0.26 0.05 ± 0.40 −0.47 ± 0.43 −0.21 ± 0.23
Total, Greater Caucasus 1861 1186.1 ± 53.3 −0.50 ± 0.67 −0.75 ± 0.70 −0.62 ± 0.37 −0.42 ± 0.61 −0.64 ± 0.66 −0.53 ± 0.38
Atmosphere 2022, 13, 256 20 of 26
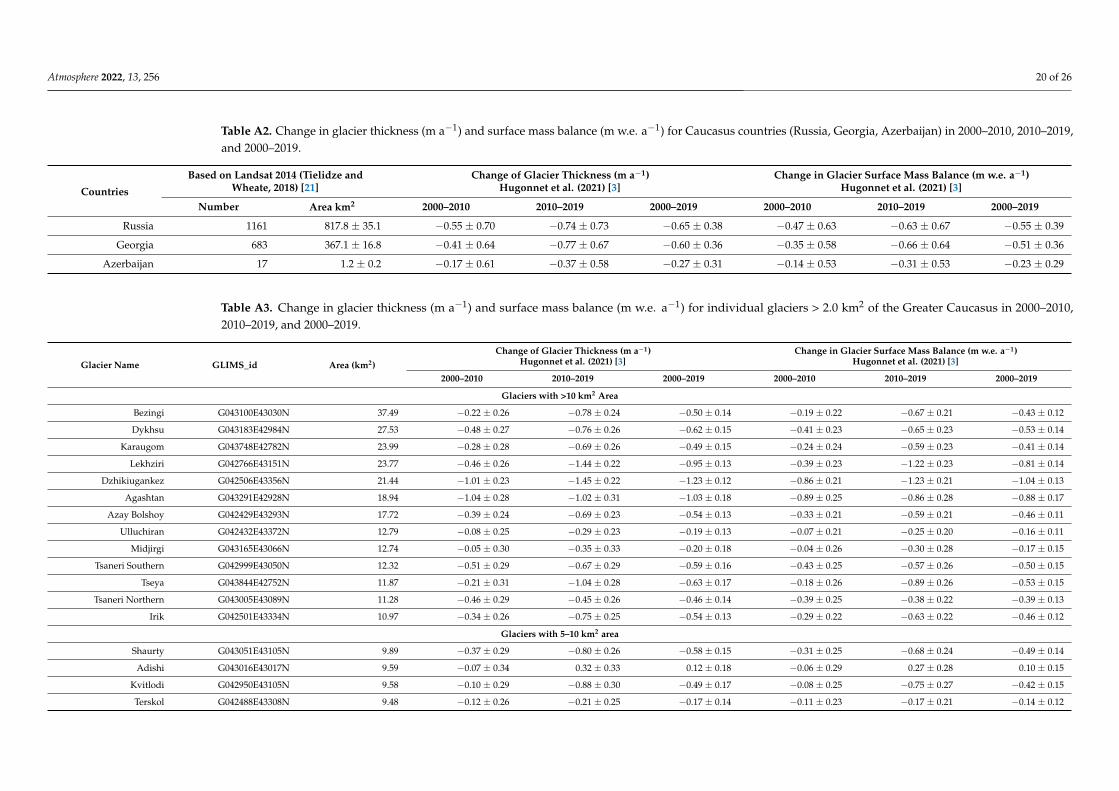
Table A2. Change in glacier thickness (m a−1) and surface mass balance (m w.e. a−1) for Caucasus countries (Russia, Georgia, Azerbaijan) in 2000–2010, 2010–2019,and 2000–2019.
Countries
Based on Landsat 2014 (Tielidze andWheate, 2018) [21]
Change of Glacier Thickness (m a−1)Hugonnet et al. (2021) [3]
Change in Glacier Surface Mass Balance (m w.e. a−1)Hugonnet et al. (2021) [3]
Number Area km2 2000–2010 2010–2019 2000–2019 2000–2010 2010–2019 2000–2019
Russia 1161 817.8 ± 35.1 −0.55 ± 0.70 −0.74 ± 0.73 −0.65 ± 0.38 −0.47 ± 0.63 −0.63 ± 0.67 −0.55 ± 0.39
Georgia 683 367.1 ± 16.8 −0.41 ± 0.64 −0.77 ± 0.67 −0.60 ± 0.36 −0.35 ± 0.58 −0.66 ± 0.64 −0.51 ± 0.36
Azerbaijan 17 1.2 ± 0.2 −0.17 ± 0.61 −0.37 ± 0.58 −0.27 ± 0.31 −0.14 ± 0.53 −0.31 ± 0.53 −0.23 ± 0.29
Table A3. Change in glacier thickness (m a−1) and surface mass balance (m w.e. a−1) for individual glaciers > 2.0 km2 of the Greater Caucasus in 2000–2010,2010–2019, and 2000–2019.
Glacier Name GLIMS_id Area (km2)Change of Glacier Thickness (m a−1)
Hugonnet et al. (2021) [3]Change in Glacier Surface Mass Balance (m w.e. a−1)
Hugonnet et al. (2021) [3]
2000–2010 2010–2019 2000–2019 2000–2010 2010–2019 2000–2019
Glaciers with >10 km2 Area
Bezingi G043100E43030N 37.49 −0.22 ± 0.26 −0.78 ± 0.24 −0.50 ± 0.14 −0.19 ± 0.22 −0.67 ± 0.21 −0.43 ± 0.12
Dykhsu G043183E42984N 27.53 −0.48 ± 0.27 −0.76 ± 0.26 −0.62 ± 0.15 −0.41 ± 0.23 −0.65 ± 0.23 −0.53 ± 0.14
Karaugom G043748E42782N 23.99 −0.28 ± 0.28 −0.69 ± 0.26 −0.49 ± 0.15 −0.24 ± 0.24 −0.59 ± 0.23 −0.41 ± 0.14
Lekhziri G042766E43151N 23.77 −0.46 ± 0.26 −1.44 ± 0.22 −0.95 ± 0.13 −0.39 ± 0.23 −1.22 ± 0.23 −0.81 ± 0.14
Dzhikiugankez G042506E43356N 21.44 −1.01 ± 0.23 −1.45 ± 0.22 −1.23 ± 0.12 −0.86 ± 0.21 −1.23 ± 0.21 −1.04 ± 0.13
Agashtan G043291E42928N 18.94 −1.04 ± 0.28 −1.02 ± 0.31 −1.03 ± 0.18 −0.89 ± 0.25 −0.86 ± 0.28 −0.88 ± 0.17
Azay Bolshoy G042429E43293N 17.72 −0.39 ± 0.24 −0.69 ± 0.23 −0.54 ± 0.13 −0.33 ± 0.21 −0.59 ± 0.21 −0.46 ± 0.11
Ulluchiran G042432E43372N 12.79 −0.08 ± 0.25 −0.29 ± 0.23 −0.19 ± 0.13 −0.07 ± 0.21 −0.25 ± 0.20 −0.16 ± 0.11
Midjirgi G043165E43066N 12.74 −0.05 ± 0.30 −0.35 ± 0.33 −0.20 ± 0.18 −0.04 ± 0.26 −0.30 ± 0.28 −0.17 ± 0.15
Tsaneri Southern G042999E43050N 12.32 −0.51 ± 0.29 −0.67 ± 0.29 −0.59 ± 0.16 −0.43 ± 0.25 −0.57 ± 0.26 −0.50 ± 0.15
Tseya G043844E42752N 11.87 −0.21 ± 0.31 −1.04 ± 0.28 −0.63 ± 0.17 −0.18 ± 0.26 −0.89 ± 0.26 −0.53 ± 0.15
Tsaneri Northern G043005E43089N 11.28 −0.46 ± 0.29 −0.45 ± 0.26 −0.46 ± 0.14 −0.39 ± 0.25 −0.38 ± 0.22 −0.39 ± 0.13
Irik G042501E43334N 10.97 −0.34 ± 0.26 −0.75 ± 0.25 −0.54 ± 0.13 −0.29 ± 0.22 −0.63 ± 0.22 −0.46 ± 0.12
Glaciers with 5–10 km2 area
Shaurty G043051E43105N 9.89 −0.37 ± 0.29 −0.80 ± 0.26 −0.58 ± 0.15 −0.31 ± 0.25 −0.68 ± 0.24 −0.49 ± 0.14
Adishi G043016E43017N 9.59 −0.07 ± 0.34 0.32 ± 0.33 0.12 ± 0.18 −0.06 ± 0.29 0.27 ± 0.28 0.10 ± 0.15
Kvitlodi G042950E43105N 9.58 −0.10 ± 0.29 −0.88 ± 0.30 −0.49 ± 0.17 −0.08 ± 0.25 −0.75 ± 0.27 −0.42 ± 0.15
Terskol G042488E43308N 9.48 −0.12 ± 0.26 −0.21 ± 0.25 −0.17 ± 0.14 −0.11 ± 0.23 −0.17 ± 0.21 −0.14 ± 0.12
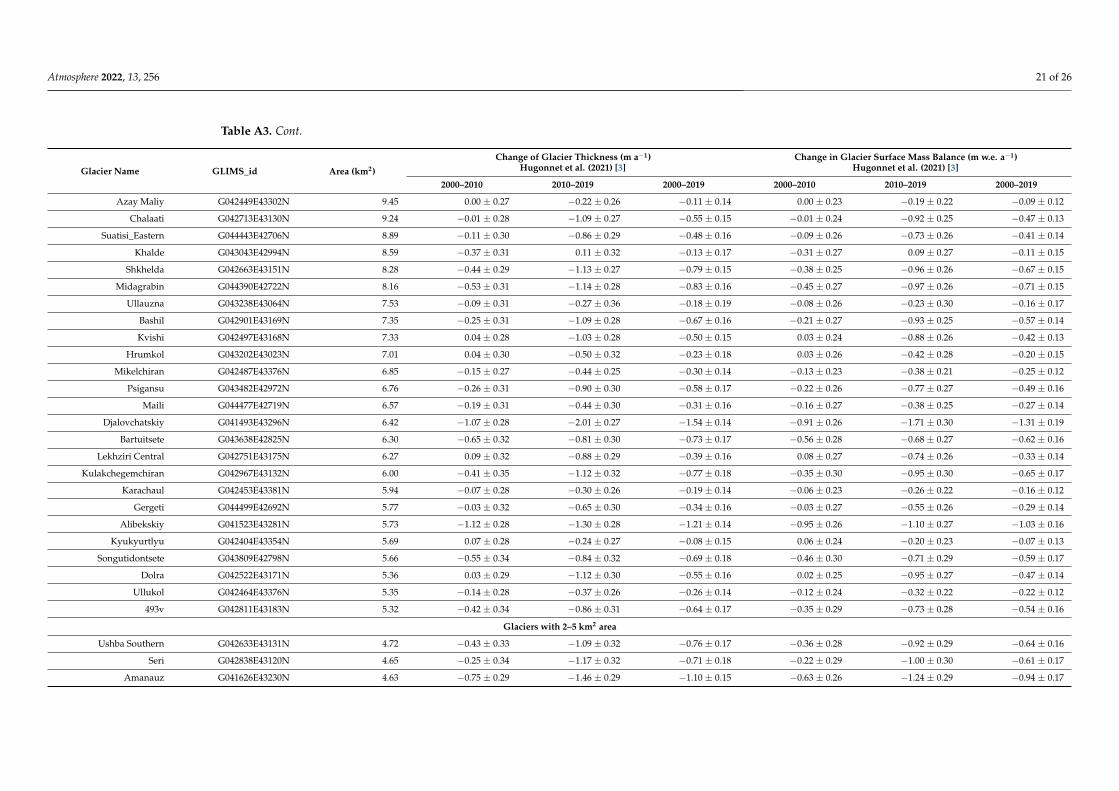
Atmosphere 2022, 13, 256 21 of 26
Table A3. Cont.
Glacier Name GLIMS_id Area (km2)Change of Glacier Thickness (m a−1)
Hugonnet et al. (2021) [3]Change in Glacier Surface Mass Balance (m w.e. a−1)
Hugonnet et al. (2021) [3]
2000–2010 2010–2019 2000–2019 2000–2010 2010–2019 2000–2019
Azay Maliy G042449E43302N 9.45 0.00 ± 0.27 −0.22 ± 0.26 −0.11 ± 0.14 0.00 ± 0.23 −0.19 ± 0.22 −0.09 ± 0.12
Chalaati G042713E43130N 9.24 −0.01 ± 0.28 −1.09 ± 0.27 −0.55 ± 0.15 −0.01 ± 0.24 −0.92 ± 0.25 −0.47 ± 0.13
Suatisi_Eastern G044443E42706N 8.89 −0.11 ± 0.30 −0.86 ± 0.29 −0.48 ± 0.16 −0.09 ± 0.26 −0.73 ± 0.26 −0.41 ± 0.14
Khalde G043043E42994N 8.59 −0.37 ± 0.31 0.11 ± 0.32 −0.13 ± 0.17 −0.31 ± 0.27 0.09 ± 0.27 −0.11 ± 0.15
Shkhelda G042663E43151N 8.28 −0.44 ± 0.29 −1.13 ± 0.27 −0.79 ± 0.15 −0.38 ± 0.25 −0.96 ± 0.26 −0.67 ± 0.15
Midagrabin G044390E42722N 8.16 −0.53 ± 0.31 −1.14 ± 0.28 −0.83 ± 0.16 −0.45 ± 0.27 −0.97 ± 0.26 −0.71 ± 0.15
Ullauzna G043238E43064N 7.53 −0.09 ± 0.31 −0.27 ± 0.36 −0.18 ± 0.19 −0.08 ± 0.26 −0.23 ± 0.30 −0.16 ± 0.17
Bashil G042901E43169N 7.35 −0.25 ± 0.31 −1.09 ± 0.28 −0.67 ± 0.16 −0.21 ± 0.27 −0.93 ± 0.25 −0.57 ± 0.14
Kvishi G042497E43168N 7.33 0.04 ± 0.28 −1.03 ± 0.28 −0.50 ± 0.15 0.03 ± 0.24 −0.88 ± 0.26 −0.42 ± 0.13
Hrumkol G043202E43023N 7.01 0.04 ± 0.30 −0.50 ± 0.32 −0.23 ± 0.18 0.03 ± 0.26 −0.42 ± 0.28 −0.20 ± 0.15
Mikelchiran G042487E43376N 6.85 −0.15 ± 0.27 −0.44 ± 0.25 −0.30 ± 0.14 −0.13 ± 0.23 −0.38 ± 0.21 −0.25 ± 0.12
Psigansu G043482E42972N 6.76 −0.26 ± 0.31 −0.90 ± 0.30 −0.58 ± 0.17 −0.22 ± 0.26 −0.77 ± 0.27 −0.49 ± 0.16
Maili G044477E42719N 6.57 −0.19 ± 0.31 −0.44 ± 0.30 −0.31 ± 0.16 −0.16 ± 0.27 −0.38 ± 0.25 −0.27 ± 0.14
Djalovchatskiy G041493E43296N 6.42 −1.07 ± 0.28 −2.01 ± 0.27 −1.54 ± 0.14 −0.91 ± 0.26 −1.71 ± 0.30 −1.31 ± 0.19
Bartuitsete G043638E42825N 6.30 −0.65 ± 0.32 −0.81 ± 0.30 −0.73 ± 0.17 −0.56 ± 0.28 −0.68 ± 0.27 −0.62 ± 0.16
Lekhziri Central G042751E43175N 6.27 0.09 ± 0.32 −0.88 ± 0.29 −0.39 ± 0.16 0.08 ± 0.27 −0.74 ± 0.26 −0.33 ± 0.14
Kulakchegemchiran G042967E43132N 6.00 −0.41 ± 0.35 −1.12 ± 0.32 −0.77 ± 0.18 −0.35 ± 0.30 −0.95 ± 0.30 −0.65 ± 0.17
Karachaul G042453E43381N 5.94 −0.07 ± 0.28 −0.30 ± 0.26 −0.19 ± 0.14 −0.06 ± 0.23 −0.26 ± 0.22 −0.16 ± 0.12
Gergeti G044499E42692N 5.77 −0.03 ± 0.32 −0.65 ± 0.30 −0.34 ± 0.16 −0.03 ± 0.27 −0.55 ± 0.26 −0.29 ± 0.14
Alibekskiy G041523E43281N 5.73 −1.12 ± 0.28 −1.30 ± 0.28 −1.21 ± 0.14 −0.95 ± 0.26 −1.10 ± 0.27 −1.03 ± 0.16
Kyukyurtlyu G042404E43354N 5.69 0.07 ± 0.28 −0.24 ± 0.27 −0.08 ± 0.15 0.06 ± 0.24 −0.20 ± 0.23 −0.07 ± 0.13
Songutidontsete G043809E42798N 5.66 −0.55 ± 0.34 −0.84 ± 0.32 −0.69 ± 0.18 −0.46 ± 0.30 −0.71 ± 0.29 −0.59 ± 0.17
Dolra G042522E43171N 5.36 0.03 ± 0.29 −1.12 ± 0.30 −0.55 ± 0.16 0.02 ± 0.25 −0.95 ± 0.27 −0.47 ± 0.14
Ullukol G042464E43376N 5.35 −0.14 ± 0.28 −0.37 ± 0.26 −0.26 ± 0.14 −0.12 ± 0.24 −0.32 ± 0.22 −0.22 ± 0.12
493v G042811E43183N 5.32 −0.42 ± 0.34 −0.86 ± 0.31 −0.64 ± 0.17 −0.35 ± 0.29 −0.73 ± 0.28 −0.54 ± 0.16
Glaciers with 2–5 km2 area
Ushba Southern G042633E43131N 4.72 −0.43 ± 0.33 −1.09 ± 0.32 −0.76 ± 0.17 −0.36 ± 0.28 −0.92 ± 0.29 −0.64 ± 0.16
Seri G042838E43120N 4.65 −0.25 ± 0.34 −1.17 ± 0.32 −0.71 ± 0.18 −0.22 ± 0.29 −1.00 ± 0.30 −0.61 ± 0.17
Amanauz G041626E43230N 4.63 −0.75 ± 0.29 −1.46 ± 0.29 −1.10 ± 0.15 −0.63 ± 0.26 −1.24 ± 0.29 −0.94 ± 0.17

Atmosphere 2022, 13, 256 22 of 26
Table A3. Cont.
Glacier Name GLIMS_id Area (km2)Change of Glacier Thickness (m a−1)
Hugonnet et al. (2021) [3]Change in Glacier Surface Mass Balance (m w.e. a−1)
Hugonnet et al. (2021) [3]
2000–2010 2010–2019 2000–2019 2000–2010 2010–2019 2000–2019
Boko G043719E42767N 4.62 −0.03 ± 0.34 −0.60 ± 0.33 −0.31 ± 0.19 −0.03 ± 0.29 −0.51 ± 0.28 −0.27 ± 0.16
Nageba G042959E43036N 4.60 −0.16 ± 0.32 −0.24 ± 0.33 −0.20 ± 0.18 −0.14 ± 0.27 −0.21 ± 0.28 −0.17 ± 0.16
Kirtisho G043596E42832N 4.51 −0.71 ± 0.33 −0.97 ± 0.31 −0.84 ± 0.18 −0.60 ± 0.29 −0.82 ± 0.28 −0.71 ± 0.17
Devdoraki G044517E42715N 4.41 0.03 ± 0.32 −0.30 ± 0.30 −0.13 ± 0.16 0.02 ± 0.28 −0.25 ± 0.26 −0.11 ± 0.14
Tviberi G042838E43099N 4.33 −0.30 ± 0.32 −1.46 ± 0.31 −0.88 ± 0.18 −0.26 ± 0.27 −1.24 ± 0.31 −0.75 ± 0.18
Bashkara G042734E43194N 4.05 −0.48 ± 0.35 −1.02 ± 0.33 −0.75 ± 0.18 −0.41 ± 0.31 −0.87 ± 0.30 −0.64 ± 0.18
Sopruju Southern G041572E43240N 3.96 −0.32 ± 0.29 −1.09 ± 0.29 −0.70 ± 0.14 −0.27 ± 0.25 −0.92 ± 0.27 −0.60 ± 0.14
Belalakaiskiy G041561E43266N 3.88 −0.74 ± 0.30 −1.52 ± 0.29 −1.13 ± 0.15 −0.63 ± 0.26 −1.29 ± 0.30 −0.96 ± 0.18
Tanantsete G043500E42888N 3.88 −0.53 ± 0.34 −0.23 ± 0.34 −0.38 ± 0.19 −0.45 ± 0.29 −0.20 ± 0.29 −0.32 ± 0.16
Djailik G042922E43239N 3.86 −0.49 ± 0.38 −0.73 ± 0.35 −0.61 ± 0.19 −0.42 ± 0.32 −0.62 ± 0.30 −0.52 ± 0.17
Sugan G043454E42991N 3.84 −0.42 ± 0.33 −0.76 ± 0.32 −0.59 ± 0.18 −0.36 ± 0.29 −0.65 ± 0.28 −0.50 ± 0.16
Tyutyun G043249E43041N 3.79 −0.41 ± 0.35 −0.76 ± 0.41 −0.59 ± 0.22 −0.35 ± 0.30 −0.65 ± 0.36 −0.50 ± 0.20
Laila G042534E42928N 3.73 −0.08 ± 0.30 −1.12 ± 0.29 −0.60 ± 0.16 −0.07 ± 0.26 −0.95 ± 0.27 −0.51 ± 0.14
Zaramag G043845E42727N 3.67 −0.61 ± 0.36 −0.80 ± 0.33 −0.70 ± 0.19 −0.51 ± 0.31 −0.68 ± 0.29 −0.60 ± 0.18
Edena Bigger G043380E42886N 3.66 −0.52 ± 0.33 −0.86 ± 0.31 −0.69 ± 0.18 −0.44 ± 0.29 −0.73 ± 0.28 −0.59 ± 0.17
Shkhara G043106E42983N 3.61 −0.54 ± 0.37 −0.08 ± 0.37 −0.31 ± 0.20 −0.46 ± 0.32 −0.07 ± 0.32 −0.26 ± 0.17
Tanantsete G043521E42874N 3.55 −0.80 ± 0.35 −0.83 ± 0.34 −0.81 ± 0.19 −0.68 ± 0.31 −0.70 ± 0.30 −0.69 ± 0.18
Gerti G043276E43053N 3.50 −0.83 ± 0.34 −0.53 ± 0.40 −0.68 ± 0.22 −0.70 ± 0.30 −0.45 ± 0.35 −0.58 ± 0.19
Leadashti Northern G042479E43178N 3.46 −0.17 ± 0.30 −1.08 ± 0.30 −0.63 ± 0.16 −0.15 ± 0.26 −0.92 ± 0.27 −0.53 ± 0.14
Khasautskiy G041439E43313N 3.32 −0.95 ± 0.40 −1.47 ± 0.39 −1.21 ± 0.19 −0.81 ± 0.35 −1.25 ± 0.35 −1.03 ± 0.20
Shtulu Western G043371E42899N 3.30 −0.79 ± 0.34 −0.81 ± 0.32 −0.80 ± 0.18 −0.67 ± 0.30 −0.69 ± 0.28 −0.68 ± 0.18
Buba G043762E42752N 3.26 −0.72 ± 0.36 −0.59 ± 0.33 −0.65 ± 0.19 −0.61 ± 0.32 −0.50 ± 0.29 −0.55 ± 0.18
Mostotsete G043421E42899N 3.24 −1.09 ± 0.34 −1.07 ± 0.33 −1.08 ± 0.19 −0.93 ± 0.31 −0.91 ± 0.30 −0.92 ± 0.20
Morde-auzh G042112E43216N 3.07 −0.50 ± 0.29 −0.98 ± 0.31 −0.74 ± 0.16 −0.43 ± 0.25 −0.84 ± 0.28 −0.63 ± 0.16
Sopruju Northern G041588E43250N 3.06 −0.44 ± 0.31 −0.95 ± 0.31 −0.70 ± 0.16 −0.37 ± 0.27 −0.81 ± 0.28 −0.59 ± 0.15
Kashkatash G042693E43189N 3.05 −0.18 ± 0.34 −0.79 ± 0.32 −0.48 ± 0.17 −0.15 ± 0.29 −0.67 ± 0.29 −0.41 ± 0.16
Donguz_Orun G042509E43213N 3.01 −0.18 ± 0.38 −0.74 ± 0.37 −0.46 ± 0.19 −0.15 ± 0.32 −0.63 ± 0.32 −0.39 ± 0.17
Gvandra G042078E43218N 2.95 −0.50 ± 0.29 −1.00 ± 0.34 −0.75 ± 0.18 −0.43 ± 0.26 −0.85 ± 0.31 −0.64 ± 0.17
Ushba Northern G042613E43151N 2.89 0.06 ± 0.32 −0.80 ± 0.32 −0.37 ± 0.17 0.05 ± 0.27 −0.68 ± 0.28 −0.31 ± 0.15
Marukhi Northern G041420E43362N 2.82 −0.52 ± 0.50 −1.60 ± 0.50 −1.06 ± 0.24 −0.44 ± 0.43 −1.36 ± 0.45 −0.90 ± 0.23
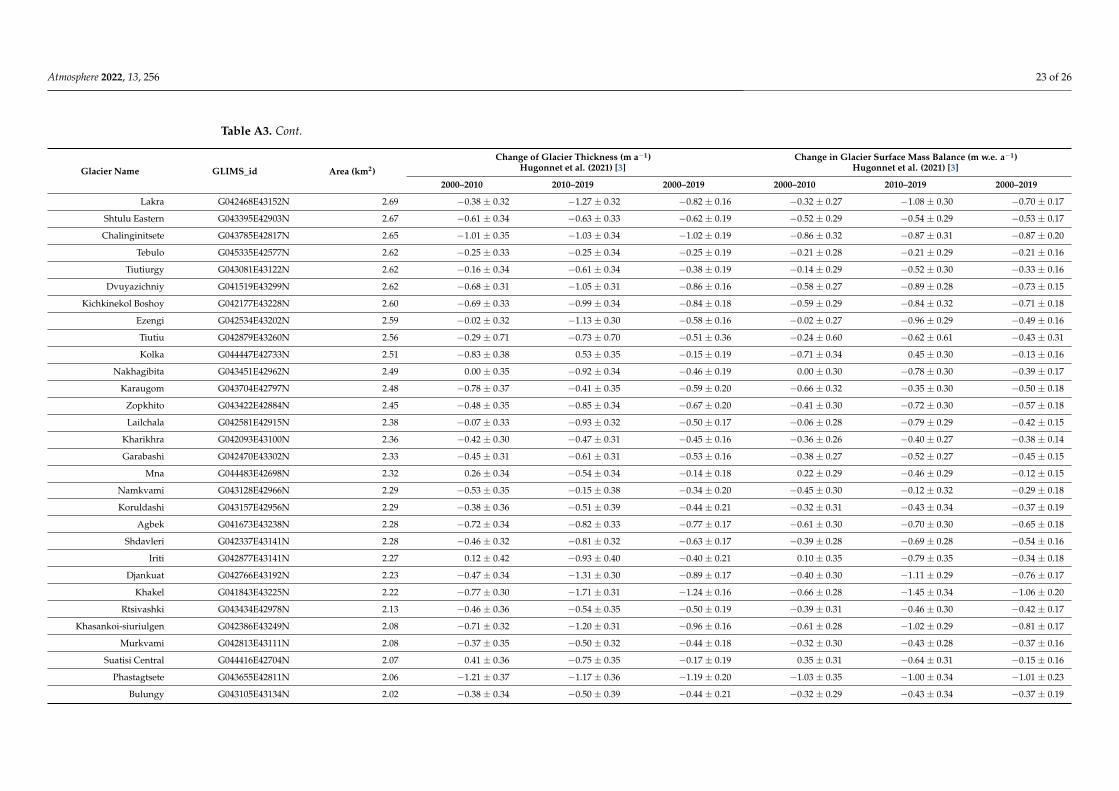
Atmosphere 2022, 13, 256 23 of 26
Table A3. Cont.
Glacier Name GLIMS_id Area (km2)Change of Glacier Thickness (m a−1)
Hugonnet et al. (2021) [3]Change in Glacier Surface Mass Balance (m w.e. a−1)
Hugonnet et al. (2021) [3]
2000–2010 2010–2019 2000–2019 2000–2010 2010–2019 2000–2019
Lakra G042468E43152N 2.69 −0.38 ± 0.32 −1.27 ± 0.32 −0.82 ± 0.16 −0.32 ± 0.27 −1.08 ± 0.30 −0.70 ± 0.17
Shtulu Eastern G043395E42903N 2.67 −0.61 ± 0.34 −0.63 ± 0.33 −0.62 ± 0.19 −0.52 ± 0.29 −0.54 ± 0.29 −0.53 ± 0.17
Chalinginitsete G043785E42817N 2.65 −1.01 ± 0.35 −1.03 ± 0.34 −1.02 ± 0.19 −0.86 ± 0.32 −0.87 ± 0.31 −0.87 ± 0.20
Tebulo G045335E42577N 2.62 −0.25 ± 0.33 −0.25 ± 0.34 −0.25 ± 0.19 −0.21 ± 0.28 −0.21 ± 0.29 −0.21 ± 0.16
Tiutiurgy G043081E43122N 2.62 −0.16 ± 0.34 −0.61 ± 0.34 −0.38 ± 0.19 −0.14 ± 0.29 −0.52 ± 0.30 −0.33 ± 0.16
Dvuyazichniy G041519E43299N 2.62 −0.68 ± 0.31 −1.05 ± 0.31 −0.86 ± 0.16 −0.58 ± 0.27 −0.89 ± 0.28 −0.73 ± 0.15
Kichkinekol Boshoy G042177E43228N 2.60 −0.69 ± 0.33 −0.99 ± 0.34 −0.84 ± 0.18 −0.59 ± 0.29 −0.84 ± 0.32 −0.71 ± 0.18
Ezengi G042534E43202N 2.59 −0.02 ± 0.32 −1.13 ± 0.30 −0.58 ± 0.16 −0.02 ± 0.27 −0.96 ± 0.29 −0.49 ± 0.16
Tiutiu G042879E43260N 2.56 −0.29 ± 0.71 −0.73 ± 0.70 −0.51 ± 0.36 −0.24 ± 0.60 −0.62 ± 0.61 −0.43 ± 0.31
Kolka G044447E42733N 2.51 −0.83 ± 0.38 0.53 ± 0.35 −0.15 ± 0.19 −0.71 ± 0.34 0.45 ± 0.30 −0.13 ± 0.16
Nakhagibita G043451E42962N 2.49 0.00 ± 0.35 −0.92 ± 0.34 −0.46 ± 0.19 0.00 ± 0.30 −0.78 ± 0.30 −0.39 ± 0.17
Karaugom G043704E42797N 2.48 −0.78 ± 0.37 −0.41 ± 0.35 −0.59 ± 0.20 −0.66 ± 0.32 −0.35 ± 0.30 −0.50 ± 0.18
Zopkhito G043422E42884N 2.45 −0.48 ± 0.35 −0.85 ± 0.34 −0.67 ± 0.20 −0.41 ± 0.30 −0.72 ± 0.30 −0.57 ± 0.18
Lailchala G042581E42915N 2.38 −0.07 ± 0.33 −0.93 ± 0.32 −0.50 ± 0.17 −0.06 ± 0.28 −0.79 ± 0.29 −0.42 ± 0.15
Kharikhra G042093E43100N 2.36 −0.42 ± 0.30 −0.47 ± 0.31 −0.45 ± 0.16 −0.36 ± 0.26 −0.40 ± 0.27 −0.38 ± 0.14
Garabashi G042470E43302N 2.33 −0.45 ± 0.31 −0.61 ± 0.31 −0.53 ± 0.16 −0.38 ± 0.27 −0.52 ± 0.27 −0.45 ± 0.15
Mna G044483E42698N 2.32 0.26 ± 0.34 −0.54 ± 0.34 −0.14 ± 0.18 0.22 ± 0.29 −0.46 ± 0.29 −0.12 ± 0.15
Namkvami G043128E42966N 2.29 −0.53 ± 0.35 −0.15 ± 0.38 −0.34 ± 0.20 −0.45 ± 0.30 −0.12 ± 0.32 −0.29 ± 0.18
Koruldashi G043157E42956N 2.29 −0.38 ± 0.36 −0.51 ± 0.39 −0.44 ± 0.21 −0.32 ± 0.31 −0.43 ± 0.34 −0.37 ± 0.19
Agbek G041673E43238N 2.28 −0.72 ± 0.34 −0.82 ± 0.33 −0.77 ± 0.17 −0.61 ± 0.30 −0.70 ± 0.30 −0.65 ± 0.18
Shdavleri G042337E43141N 2.28 −0.46 ± 0.32 −0.81 ± 0.32 −0.63 ± 0.17 −0.39 ± 0.28 −0.69 ± 0.28 −0.54 ± 0.16
Iriti G042877E43141N 2.27 0.12 ± 0.42 −0.93 ± 0.40 −0.40 ± 0.21 0.10 ± 0.35 −0.79 ± 0.35 −0.34 ± 0.18
Djankuat G042766E43192N 2.23 −0.47 ± 0.34 −1.31 ± 0.30 −0.89 ± 0.17 −0.40 ± 0.30 −1.11 ± 0.29 −0.76 ± 0.17
Khakel G041843E43225N 2.22 −0.77 ± 0.30 −1.71 ± 0.31 −1.24 ± 0.16 −0.66 ± 0.28 −1.45 ± 0.34 −1.06 ± 0.20
Rtsivashki G043434E42978N 2.13 −0.46 ± 0.36 −0.54 ± 0.35 −0.50 ± 0.19 −0.39 ± 0.31 −0.46 ± 0.30 −0.42 ± 0.17
Khasankoi-siuriulgen G042386E43249N 2.08 −0.71 ± 0.32 −1.20 ± 0.31 −0.96 ± 0.16 −0.61 ± 0.28 −1.02 ± 0.29 −0.81 ± 0.17
Murkvami G042813E43111N 2.08 −0.37 ± 0.35 −0.50 ± 0.32 −0.44 ± 0.18 −0.32 ± 0.30 −0.43 ± 0.28 −0.37 ± 0.16
Suatisi Central G044416E42704N 2.07 0.41 ± 0.36 −0.75 ± 0.35 −0.17 ± 0.19 0.35 ± 0.31 −0.64 ± 0.31 −0.15 ± 0.16
Phastagtsete G043655E42811N 2.06 −1.21 ± 0.37 −1.17 ± 0.36 −1.19 ± 0.20 −1.03 ± 0.35 −1.00 ± 0.34 −1.01 ± 0.23
Bulungy G043105E43134N 2.02 −0.38 ± 0.34 −0.50 ± 0.39 −0.44 ± 0.21 −0.32 ± 0.29 −0.43 ± 0.34 −0.37 ± 0.19
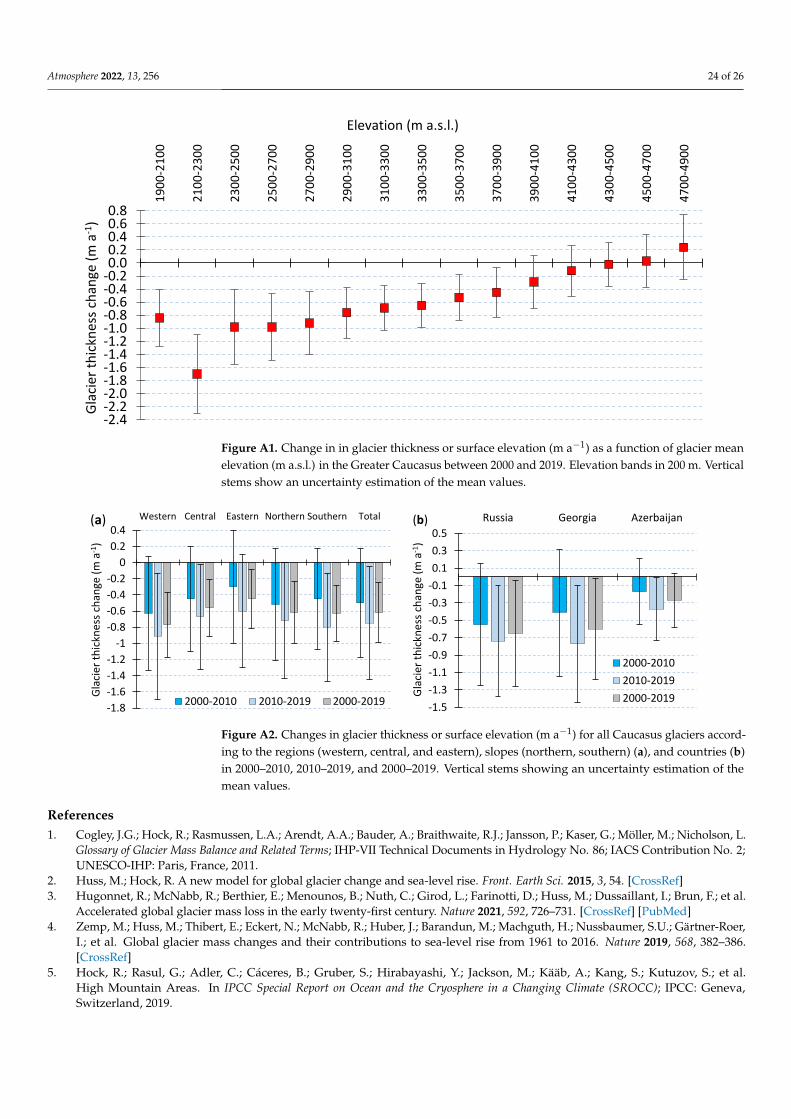
Atmosphere 2022, 13, 256 24 of 26
Atmosphere 2022, 13, 256 21 of 24
Marukhi Northern G041420E43362N 2.82 −0.52 ± 0.50 −1.60 ± 0.50 −1.06 ± 0.24 −0.44 ± 0.43 −1.36 ± 0.45 −0.90 ± 0.23 Lakra G042468E43152N 2.69 −0.38 ± 0.32 −1.27 ± 0.32 −0.82 ± 0.16 −0.32 ± 0.27 −1.08 ± 0.30 −0.70 ± 0.17
Shtulu Eastern G043395E42903N 2.67 −0.61 ± 0.34 −0.63 ± 0.33 −0.62 ± 0.19 −0.52 ± 0.29 −0.54 ± 0.29 −0.53 ± 0.17 Chalinginitsete G043785E42817N 2.65 −1.01 ± 0.35 −1.03 ± 0.34 −1.02 ± 0.19 −0.86 ± 0.32 −0.87 ± 0.31 −0.87 ± 0.20
Tebulo G045335E42577N 2.62 −0.25 ± 0.33 −0.25 ± 0.34 −0.25 ± 0.19 −0.21 ± 0.28 −0.21 ± 0.29 −0.21 ± 0.16 Tiutiurgy G043081E43122N 2.62 −0.16 ± 0.34 −0.61 ± 0.34 −0.38 ± 0.19 −0.14 ± 0.29 −0.52 ± 0.30 −0.33 ± 0.16
Dvuyazichniy G041519E43299N 2.62 −0.68 ± 0.31 −1.05 ± 0.31 −0.86 ± 0.16 −0.58 ± 0.27 −0.89 ± 0.28 −0.73 ± 0.15 Kichkinekol Boshoy G042177E43228N 2.60 −0.69 ± 0.33 −0.99 ± 0.34 −0.84 ± 0.18 −0.59 ± 0.29 −0.84 ± 0.32 −0.71 ± 0.18
Ezengi G042534E43202N 2.59 −0.02 ± 0.32 −1.13 ± 0.30 −0.58 ± 0.16 −0.02 ± 0.27 −0.96 ± 0.29 −0.49 ± 0.16 Tiutiu G042879E43260N 2.56 −0.29 ± 0.71 −0.73 ± 0.70 −0.51 ± 0.36 −0.24 ± 0.60 −0.62 ± 0.61 −0.43 ± 0.31 Kolka G044447E42733N 2.51 −0.83 ± 0.38 0.53 ± 0.35 −0.15 ± 0.19 −0.71 ± 0.34 0.45 ± 0.30 −0.13 ± 0.16
Nakhagibita G043451E42962N 2.49 0.00 ± 0.35 −0.92 ± 0.34 −0.46 ± 0.19 0.00 ± 0.30 −0.78 ± 0.30 −0.39 ± 0.17 Karaugom G043704E42797N 2.48 −0.78 ± 0.37 −0.41 ± 0.35 −0.59 ± 0.20 −0.66 ± 0.32 −0.35 ± 0.30 −0.50 ± 0.18
Zopkhito G043422E42884N 2.45 −0.48 ± 0.35 −0.85 ± 0.34 −0.67 ± 0.20 −0.41 ± 0.30 −0.72 ± 0.30 −0.57 ± 0.18 Lailchala G042581E42915N 2.38 −0.07 ± 0.33 −0.93 ± 0.32 −0.50 ± 0.17 −0.06 ± 0.28 −0.79 ± 0.29 −0.42 ± 0.15
Kharikhra G042093E43100N 2.36 −0.42 ± 0.30 −0.47 ± 0.31 −0.45 ± 0.16 −0.36 ± 0.26 −0.40 ± 0.27 −0.38 ± 0.14 Garabashi G042470E43302N 2.33 −0.45 ± 0.31 −0.61 ± 0.31 −0.53 ± 0.16 −0.38 ± 0.27 −0.52 ± 0.27 −0.45 ± 0.15
Mna G044483E42698N 2.32 0.26 ± 0.34 −0.54 ± 0.34 −0.14 ± 0.18 0.22 ± 0.29 −0.46 ± 0.29 −0.12 ± 0.15 Namkvami G043128E42966N 2.29 −0.53 ± 0.35 −0.15 ± 0.38 −0.34 ± 0.20 −0.45 ± 0.30 −0.12 ± 0.32 −0.29 ± 0.18 Koruldashi G043157E42956N 2.29 −0.38 ± 0.36 −0.51 ± 0.39 −0.44 ± 0.21 −0.32 ± 0.31 −0.43 ± 0.34 −0.37 ± 0.19
Agbek G041673E43238N 2.28 −0.72 ± 0.34 −0.82 ± 0.33 −0.77 ± 0.17 −0.61 ± 0.30 −0.70 ± 0.30 −0.65 ± 0.18 Shdavleri G042337E43141N 2.28 −0.46 ± 0.32 −0.81 ± 0.32 −0.63 ± 0.17 −0.39 ± 0.28 −0.69 ± 0.28 −0.54 ± 0.16
Iriti G042877E43141N 2.27 0.12 ± 0.42 −0.93 ± 0.40 −0.40 ± 0.21 0.10 ± 0.35 −0.79 ± 0.35 −0.34 ± 0.18 Djankuat G042766E43192N 2.23 −0.47 ± 0.34 −1.31 ± 0.30 −0.89 ± 0.17 −0.40 ± 0.30 −1.11 ± 0.29 −0.76 ± 0.17
Khakel G041843E43225N 2.22 −0.77 ± 0.30 −1.71 ± 0.31 −1.24 ± 0.16 −0.66 ± 0.28 −1.45 ± 0.34 −1.06 ± 0.20 Rtsivashki G043434E42978N 2.13 −0.46 ± 0.36 −0.54 ± 0.35 −0.50 ± 0.19 −0.39 ± 0.31 −0.46 ± 0.30 −0.42 ± 0.17
Khasankoi-siuriulgen G042386E43249N 2.08 −0.71 ± 0.32 −1.20 ± 0.31 −0.96 ± 0.16 −0.61 ± 0.28 −1.02 ± 0.29 −0.81 ± 0.17 Murkvami G042813E43111N 2.08 −0.37 ± 0.35 −0.50 ± 0.32 −0.44 ± 0.18 −0.32 ± 0.30 −0.43 ± 0.28 −0.37 ± 0.16
Suatisi Central G044416E42704N 2.07 0.41 ± 0.36 −0.75 ± 0.35 −0.17 ± 0.19 0.35 ± 0.31 −0.64 ± 0.31 −0.15 ± 0.16 Phastagtsete G043655E42811N 2.06 −1.21 ± 0.37 −1.17 ± 0.36 −1.19 ± 0.20 −1.03 ± 0.35 −1.00 ± 0.34 −1.01 ± 0.23
Bulungy G043105E43134N 2.02 −0.38 ± 0.34 −0.50 ± 0.39 −0.44 ± 0.21 −0.32 ± 0.29 −0.43 ± 0.34 −0.37 ± 0.19
Figure A1. Change in in glacier thickness or surface elevation (m a−1) as a function of glacier mean elevation (m a.s.l.) in the Greater Caucasus between 2000 and 2019. Elevation bands in 200 m. Ver-tical stems show an uncertainty estimation of the mean values.
-2.4-2.2-2.0-1.8-1.6-1.4-1.2-1.0-0.8-0.6-0.4-0.20.00.20.40.60.8
1900
-210
0
2100
-230
0
2300
-250
0
2500
-270
0
2700
-290
0
2900
-310
0
3100
-330
0
3300
-350
0
3500
-370
0
3700
-390
0
3900
-410
0
4100
-430
0
4300
-450
0
4500
-470
0
4700
-490
0
Gla
cier
thic
knes
s cha
nge
(m a
-1)
Elevation (m a.s.l.)
Figure A1. Change in in glacier thickness or surface elevation (m a−1) as a function of glacier meanelevation (m a.s.l.) in the Greater Caucasus between 2000 and 2019. Elevation bands in 200 m. Verticalstems show an uncertainty estimation of the mean values.
Atmosphere 2022, 13, 256 22 of 24
Figure A2. Changes in glacier thickness or surface elevation (m a−1) for all Caucasus glaciers ac-cording to the regions (western, central, and eastern), slopes (northern, southern) (a), and countries (b) in 2000–2010, 2010–2019, and 2000–2019. Vertical stems showing an uncertainty estimation of the mean values.
References 1. Cogley, J.G.; Hock, R.; Rasmussen, L.A.; Arendt, A.A.; Bauder, A.; Braithwaite, R.J.; Jansson, P.; Kaser, G.; Möller, M.; Ni-
cholson, L. Glossary of Glacier Mass Balance and Related Terms; IHP-VII Technical Documents in Hydrology No. 86; IACS Con-tribution No. 2; UNESCO-IHP: Paris, France, 2011.
2. Huss, M.; Hock, R. A new model for global glacier change and sea-level rise. Front. Earth Sci. 2015, 3, 54. https://doi.org/10.3389/feart.2015.00054.
3. Hugonnet, R.; McNabb, R.; Berthier, E.; Menounos, B.; Nuth, C.; Girod, L.; Farinotti, D.; Huss, M.; Dussaillant, I.; Brun, F.; et al. Accelerated global glacier mass loss in the early twenty-first century. Nature 2021, 592, 726–731. https://doi.org/10.1038/s41586-021-03436-z.
4. Zemp, M.; Huss, M.; Thibert, E.; Eckert, N.; McNabb, R.; Huber, J.; Barandun, M.; Machguth, H.; Nussbaumer, S.U.; Gärt-ner-Roer, I.; et al. Global glacier mass changes and their contributions to sea-level rise from 1961 to 2016. Nature 2019, 568, 382–386. doi: 10.1038/s41586-019-1071-0.
5. Hock, R.; Rasul, G.; Adler, C.; Cáceres, B.; Gruber, S.; Hirabayashi, Y.; Jackson, M.; Kääb, A.; Kang, S.; Kutuzov, S.; et al. High Mountain Areas. In IPCC Special Report on Ocean and the Cryosphere in a Changing Climate (SROCC); IPCC: Geneva, Switzerland, 2019.
6. Nuth, C.; Kääb, A. Co-registration and bias corrections of satellite elevation data sets for quantifying glacier thickness change. Cryosphere 2011, 5, 271–290, https://doi.org/10.5194/tc-5-271-2011.
7. Fischer, M.; Huss, M.; Kummert, M.; Hoelzle, M. Application and validation of long-range terrestrial laser scanning to monitor the mass balance of very small glaciers in the Swiss Alps. Cryosphere 2016, 10, 1279–1295, https://doi.org/10.5194/tc-10-1279-2016.
8. Klug, C.; Bollmann, E.; Galos, S.P.; Nicholson, L.; Prinz, R.; Rieg, L.; Sailer, R.; Stötter, J.; Kaser, G. Geodetic reanalysis of annual glaciological mass balances (2001–2011) of Hintereisferner, Austria. Cryosphere 2018, 12, 833–849, https://doi.org/10.5194/tc-12-833-2018.
9. Basantes-Serrano, R.; Rabatel, A.; Vincent, C.; And Sirguey, P. An optimized method to calculate the geodetic mass balance of mountain glaciers. J. Glaciol. 2018, 64, 917–931. doi:10.1017/jog.2018.79.
10. Vincent, C.; Cusicanqui, D.; Jourdain, B.; Laarman, O.; Six, D.; Gilbert, A.; Walpersdorf, A.; Rabatel, A.; Piard, L.; Gimbert, F.; et al. Geodetic point surface mass balances: a new approach to determine point surface mass balances on glaciers from remote sensing measurements. Cryosphere 2021, 15, 1259–1276, https://doi.org/10.5194/tc-15-1259-2021.
11. Evans, S.G.; Tutubalina, O.V.; Drobyshev, V.N.; Chernomorets, S.S.; McDougall, S.; Petrakov, D.A.; Hungr, O. Catastrophic detachment and high-velocity long-runout flow of Kolka Glacier, Caucasus Mountains, Russia in 2002. Geomorphol. 2009, 105, 314–321, https://doi.org/10.1016/j.geomorph.2008.10.008.
12. Chernomorets, S.S.; Petrakov, D.A.; Aleynikov, A.A.; Bekkiev, M.Y.; Viskhadzhieva, K.S.; Dokukin, M.D.; Kalov, R.K.; Kidyaeva, V.M.; Krylenko, V.V.; Krylenko, I.V.; et al. The Outburst of Bashkara Glacier Lake (Central Caucasus, Russia) on 1 September 2017. Kriosf. Zemli 2018, XXII, 61–70. https://doi.org/10.21782/EC2541-9994-2018-2(61-70).
13. Tielidze, L.G.; Kumladze, R.M.; Wheate, R.D.; Gamkrelidze, M. The Devdoraki Glacier Catastrophes, Georgian Caucasus. Hung. Geogr. Bull. 2019, 68, 21–35, https://doi.org/10.15201/hungeobull.68.1.2.
14. Tsereteli, D.; Khazaradze, R.; Lomtatidze, G.; Inashvili, S.; Lashkhi, T.; Kurdghelaidze, G.; Kalandadze, G.; Chekurishvili, R. Glaciological observations on the Chalaati and Lechziri Glaciers (Upper Svaneti) in the spring of 1959. Georgian Natl. Acad. Sci. —Work. Vakhushti Inst. Geogr. 1962, XVIII, 223–256. (In Georgian)
-1.8-1.6-1.4-1.2
-1-0.8-0.6-0.4-0.2
00.20.4
Western Central Eastern Northern Southern Total
Gla
cier
thic
knes
s cha
nge
(m a
-1)
(a)
2000-2010 2010-2019 2000-2019 -1.5-1.3-1.1-0.9-0.7-0.5-0.3-0.10.10.30.5
Russia Georgia Azerbaijan
Gla
cier
thic
knes
s cha
nge
(m a
-1)
(b)
2000-20102010-20192000-2019
Figure A2. Changes in glacier thickness or surface elevation (m a−1) for all Caucasus glaciers accord-ing to the regions (western, central, and eastern), slopes (northern, southern) (a), and countries (b)in 2000–2010, 2010–2019, and 2000–2019. Vertical stems showing an uncertainty estimation of themean values.
References1. Cogley, J.G.; Hock, R.; Rasmussen, L.A.; Arendt, A.A.; Bauder, A.; Braithwaite, R.J.; Jansson, P.; Kaser, G.; Möller, M.; Nicholson, L.
Glossary of Glacier Mass Balance and Related Terms; IHP-VII Technical Documents in Hydrology No. 86; IACS Contribution No. 2;UNESCO-IHP: Paris, France, 2011.
2. Huss, M.; Hock, R. A new model for global glacier change and sea-level rise. Front. Earth Sci. 2015, 3, 54. [CrossRef]3. Hugonnet, R.; McNabb, R.; Berthier, E.; Menounos, B.; Nuth, C.; Girod, L.; Farinotti, D.; Huss, M.; Dussaillant, I.; Brun, F.; et al.
Accelerated global glacier mass loss in the early twenty-first century. Nature 2021, 592, 726–731. [CrossRef] [PubMed]4. Zemp, M.; Huss, M.; Thibert, E.; Eckert, N.; McNabb, R.; Huber, J.; Barandun, M.; Machguth, H.; Nussbaumer, S.U.; Gärtner-Roer,
I.; et al. Global glacier mass changes and their contributions to sea-level rise from 1961 to 2016. Nature 2019, 568, 382–386.[CrossRef]
5. Hock, R.; Rasul, G.; Adler, C.; Cáceres, B.; Gruber, S.; Hirabayashi, Y.; Jackson, M.; Kääb, A.; Kang, S.; Kutuzov, S.; et al.High Mountain Areas. In IPCC Special Report on Ocean and the Cryosphere in a Changing Climate (SROCC); IPCC: Geneva,Switzerland, 2019.
Atmosphere 2022, 13, 256 25 of 26
6. Nuth, C.; Kääb, A. Co-registration and bias corrections of satellite elevation data sets for quantifying glacier thickness change.Cryosphere 2011, 5, 271–290. [CrossRef]
7. Fischer, M.; Huss, M.; Kummert, M.; Hoelzle, M. Application and validation of long-range terrestrial laser scanning to monitorthe mass balance of very small glaciers in the Swiss Alps. Cryosphere 2016, 10, 1279–1295. [CrossRef]
8. Klug, C.; Bollmann, E.; Galos, S.P.; Nicholson, L.; Prinz, R.; Rieg, L.; Sailer, R.; Stötter, J.; Kaser, G. Geodetic reanalysis of annualglaciological mass balances (2001–2011) of Hintereisferner, Austria. Cryosphere 2018, 12, 833–849. [CrossRef]
9. Basantes-Serrano, R.; Rabatel, A.; Vincent, C.; And Sirguey, P. An optimized method to calculate the geodetic mass balance ofmountain glaciers. J. Glaciol. 2018, 64, 917–931. [CrossRef]
10. Vincent, C.; Cusicanqui, D.; Jourdain, B.; Laarman, O.; Six, D.; Gilbert, A.; Walpersdorf, A.; Rabatel, A.; Piard, L.; Gimbert, F.; et al.Geodetic point surface mass balances: A new approach to determine point surface mass balances on glaciers from remote sensingmeasurements. Cryosphere 2021, 15, 1259–1276. [CrossRef]
11. Evans, S.G.; Tutubalina, O.V.; Drobyshev, V.N.; Chernomorets, S.S.; McDougall, S.; Petrakov, D.A.; Hungr, O. Catastrophicdetachment and high-velocity long-runout flow of Kolka Glacier, Caucasus Mountains, Russia in 2002. Geomorphology 2009, 105,314–321. [CrossRef]
12. Chernomorets, S.S.; Petrakov, D.A.; Aleynikov, A.A.; Bekkiev, M.Y.; Viskhadzhieva, K.S.; Dokukin, M.D.; Kalov, R.K.; Kidyaeva,V.M.; Krylenko, V.V.; Krylenko, I.V.; et al. The Outburst of Bashkara Glacier Lake (Central Caucasus, Russia) on 1 September 2017.Kriosf. Zemli 2018, XXII, 61–70. [CrossRef]
13. Tielidze, L.G.; Kumladze, R.M.; Wheate, R.D.; Gamkrelidze, M. The Devdoraki Glacier Catastrophes, Georgian Caucasus. Hung.Geogr. Bull. 2019, 68, 21–35. [CrossRef]
14. Tsereteli, D.; Khazaradze, R.; Lomtatidze, G.; Inashvili, S.; Lashkhi, T.; Kurdghelaidze, G.; Kalandadze, G.; Chekurishvili, R.Glaciological observations on the Chalaati and Lechziri Glaciers (Upper Svaneti) in the spring of 1959. Georgian Natl. Acad.Sci. —Work. Vakhushti Inst. Geogr. 1962, XVIII, 223–256. (In Georgian)
15. Menshutin, V.M. Mass balance of the Marukh Glacier (Western Caucasus) 1966–1968. Data Glaciol. Stud. 1970, 17, 292–296.(In Russian)
16. Boyarsky, I.Y. (Ed.) Lednik Djankuat (Djankuat Glacier); Gidrometeoizdat: Saint Petersburg, Russia, 1978.17. Rototaeva, O.V.; Nosenko, G.A.; Kerimov, A.M.; Kutuzov, S.S.; Lavrentiev, I.I.; Nikitin, S.A.; Kerimov, A.A.; Tarasova, L.N.
Changes of the mass balance of the Garabashy Glacier, Mount Elbrus, at the turn of 20th and 21st centuries. Ice Snow 2019, 59,5–22. [CrossRef]
18. Gigineishvili, G. (Ed.) Tbilisa Glacier—Glacial-Hydro-Meteorological Investigation. Monograph; Institute of Geography at GeorgianNational Academy of Sciences: Tbilisi, Georgia; Publishing house Metsniereba: Tbilisi, Georgia, 1986; p. 116. (In Russian)
19. Tielidze, L.G.; Svanadze, D.; Gadrani, L.; Asanidze, L.; Wheate, R.D.; Hamilton, G.S. A 54-year record of changes at Chalaatiand Zopkhito glaciers, Georgian Caucasus, observed from archival maps, satellite imagery, drone survey and ground-basedinvestigation. Hung. Geogr. Bull. 2020, 69, 175–189. [CrossRef]
20. WGMS; Zemp, M.; Nussbaumer, S.U.; GärtnerRoer, I.; Bannwart, J.; Paul, F.; Hoelzle, M. (Eds.) Global Glacier Change Bulletin No. 4(2018–2019); ISC (WDS)/IUGG (IACS)/UNEP/UNESCO/WMO; World Glacier Monitoring Service: Zurich, Switzerland, 2021;p. 278. [CrossRef]
21. Tielidze, L.G.; Wheate, R.D. The Greater Caucasus Glacier Inventory (Russia, Georgia and Azerbaijan). Cryosphere 2018, 12, 81–94.[CrossRef]
22. Lur’e, P.M.; Panov, V.D. Variations of Contemporary Glaciation of the Northern Slope of the Greater Caucasus in the 20th Centuryand the Forecast of Its Degradation in the 21st Century. Russ. Meteorol. Hydrol. 2014, 39, 254–259. [CrossRef]
23. Kotlyakov, V.M.; Khromova, T.E.; Nosenko, G.A.; Popova, V.V.; Chernova, L.P.; Murav’ev, A.Y. New Data on Current Changesin the Mountain Glaciers of Russia. In Doklady Earth Sciences; Pleiades Publishing: Warrensburg, MO, USA, 2015; Volume 464.[CrossRef]
24. Tielidze, L.G. Glacier change over the last century, Caucasus Mountains, Georgia, observed from old topographical maps, Landsatand ASTER satellite imagery. Cryosphere 2016, 10, 713–725. [CrossRef]
25. Rets, E.P.; Popovnin, V.V.; Toropov, P.A.; Smirnov, A.M.; Tokarev, I.V.; Chizhova, J.N.; Budantseva, N.A.; Vasil’chuk, Y.K.;Kireeva, M.B.; Ekaykin, A.A.; et al. Djankuat glacier station in the North Caucasus, Russia: A database of glaciological,hydrological, and meteorological observations and stable isotope sampling results during 2007–2017. Earth Syst. Sci. Data 2019,11, 1463–1481. [CrossRef]
26. Zolotarev, E.A.; Kharkovets, E.G. Development of glaciers of Mount Elbrus after the Little Ice Age. Ice Snow 2012, 52, 15–22.[CrossRef]
27. Kutuzov, S.; Lavrentiev, I.; Smirnov, A.; Nosenko, G.; Petrakov, D. Volume Changes of Elbrus Glaciers From 1997 to 2017. Front.Earth Sci. 2019, 7, 153. [CrossRef]
28. Moussavi, M.; Zoej, M.; Vaziri, F.; Sahebi, M.; Rezaei, Y. A new glacier inventory of Iran. Ann. Glaciol. 2009, 50, 93–103. [CrossRef]29. Azzoni, R.S.; Sarıkaya, M.A.; Fugazza, D. Turkish glacier inventory and classification from high-resolution satellite data. Mediterr.
Geosci. Rev. 2020, 2, 153–162. [CrossRef]30. Olawuyi, D. Climate Change Law and Policy in the Middle East and North Africa Region, 1st ed.; Routledge: London, UK, 2021;
pp. 1–340. ISBN 9780367490324.
Atmosphere 2022, 13, 256 26 of 26
31. World Atlas of Snow and Ice Resources, V. 1.; (V. Kotlyakov editor) Russian Academy of Sciences: Moscow, Russian, 1997; 372p. (InRussian/English)
32. Volodicheva, N. The Caucasus. In The Physical Geography of Northern Eurasia; Shahgedanova, M., Ed.; Oxford University Press:Oxford, UK, 2002; pp. 350–376.
33. Kozachek, A.; Mikhalenko, V.; Masson-Delmotte, V.; Ekaykin, A.; Ginot, P.; Kutuzov, S.; Legrand, M.; Lipenkov, V.; Preunkert, S.Large-scale drivers of Caucasus climate variability in meteorological records and Mt El'brus ice cores. Clim. Past 2017, 13, 473–489.[CrossRef]
34. Sylvén, M.; Reinvang, R.; Andersone-Lilley, Ž. Climate Change in Southern Caucasus: Impacts on nature, people and society(WWF overview report). In WWF Norway WWF Caucasus Programme; WWF Norway: Washington, DC, USA, 2008.
35. Solomina, O.; Bushueva, I.; Dolgova, E.; Jomelli, V.; Alexandrin, M.; Mikhalenko, V.; Matskovsky, V. Glacier variations in theNorthern Caucasus compared to climatic reconstructions over the past millennium. Glob. Planet. Chang. 2016, 140, 28–58.[CrossRef]
36. Tielidze, L.G.; Solomina, O.N.; Jomelli, V.; Dolgova, E.A.; Bushueva, I.S.; Mikhalenko, V.N.; Brauche, R.; ASTER, T. Change ofChalaati Glacier (Georgian Caucasus) since the Little Ice Age based on dendrochronological and Beryllium-10 data. Ice Snow2020, 60, 453–470. [CrossRef]
37. Tielidze, L.G.; Nosenko, G.A.; Khromova, T.E.; Paul, F. Strong acceleration of glacier area loss in the Greater Caucasus over thepast two decades. Cryosphere Discuss 2021, 8, 1–21. [CrossRef]
38. Tielidze, L.G.; Bolch, T.; Wheate, R.D.; Kutuzov, S.S.; Lavrentiev, I.I.; Zemp, M. Supra-glacial debris cover changes in the GreaterCaucasus from 1986 to 2014. Cryosphere 2020, 14, 585–598. [CrossRef]
39. Rau, F.; Mauz, F.; Vogt, S.; Singh Khalsa, S.J.; Raup, B. Illustrated GLIMS Glacier Classification Manual, Glacier Classification Guidancefor the GLIMS Glacier Inventory; 2005.
40. Benn, D.; Bolch, T.; Hands, K.; Gulley, J.; Luckman, A.; Nicholson, L.; Quincey, D.; Thompson, S.; Toumi, R.; Wiseman, S. Responseof debris-covered glaciers in the Mount Everest region to recent warming, and implications for outburst flood hazards. Earth-Sci.Rev. 2012, 114, 156–174. [CrossRef]
41. Pratap, B.; Dobhal, D.; Mehta, M.; Bhambri, R. Influence of debris cover and altitude on glacier surface melting: A case study onDokriani Glacier, central Himalaya, India. Ann. Glaciol. 2015, 56, 9–16. [CrossRef]
42. Brun, F.; Wagnon, P.; Berthier, E.; Shea, J.M.; Immerzeel, W.W.; Kraaijenbrink, P.D.A.; Vincent, C.; Reverchon, C.; Shrestha, D.;Arnaud, Y. Ice cliff contribution to the tongue-wide ablation of Changri Nup Glacier, Nepal, central Himalaya. Cryosphere 2018,12, 3439–3457. [CrossRef]
43. Östrem, G. Ice Melting under a Thin Layer of Moraine, and the Existence of Ice Cores in Moraine Ridges. Geogr. Ann. 1959, 41,228–230. [CrossRef]
44. Nicholson, L.I.; Benn, D.I. Calculating ice melt beneath a debris layer using meteorological data. J. Glaciol. 2006, 52, 463–470.[CrossRef]
45. Nicholson, L.; Benn, D.I. Properties of Natural Supraglacial Debris in Relation to Modelling Sub-debris Ice Ablation. Earth Surf.Process. Landf. 2013, 38, 490–501. [CrossRef]
46. Reid, T.; Brock, B. Assessing ice-cliff backwasting and its contribution to total ablation of debris-covered Miage glacier, MontBlanc massif, Italy. J. Glaciol. 2014, 60, 3–13. [CrossRef]
47. Shahgedanova, M.; Stokes, C.R.; Gurney, S.D.; Popovnin, V.V. Interactions between mass balance, atmospheric circulation andrecent climate change on the Djankuat Glacier, Caucasus Mountains, Russia. J. Geophys. Res. Atmos. 2005, 110, D04108. [CrossRef]
48. Toropov, P.A.; Aleshina, M.A.; Grachev, A.M. Large-scale climatic factors driving glacier recession in the Greater Caucasus,20th–21st century. Int. J. Climatol. 2019, 39, 4703–4720. [CrossRef]
49. Toropov, P.A.; Mikhalenko, V.N.; Kutuzov, S.S.; Morozova, P.A.; Shestakova, A.A. Temperature and radiation regime of glacierson slopes of the Mount Elbrus in the ablation period over last 65 years. Ice Snow 2016, 1, 5–19. [CrossRef]
50. Kutuzov, S.; Shahgedanova, M.; Mikhalenko, V.; Ginot, P.; Lavrentiev, I.; Kemp, S. High-resolution provenance of desert dustdeposited on Mt. Elbrus, Caucasus in 2009–2012 using snow pit and firn core records. Cryosphere 2013, 7, 1481–1498. [CrossRef]
51. Dumont, M.; Tuzet, F.; Gascoin, S.; Picard, G.; Kutuzov, S.; Lafaysse, M.; Cluzet, B.; Nheili, R.; Painter, T.H. Accelerated snowmelt in the Russian Caucasus mountains after the Saharan dust outbreak in March 2018. J. Geophys. Res. Earth Surf. 2020,125, e2020JF005641. [CrossRef]


