Embed Size (px)
Citation preview
1
Published in Cement and Concrete Composites, 38, 65-74, 2013.
Modeling of the Influence of Transverse Cracking on Chloride Penetration into Concrete
Dale P. Bentz
Edward J. Garboczi
Yang Lu
Nicos Martys
Aaron R. Sakulich
W. Jason Weiss
Materials and Structural Systems Division
Engineering Laboratory
National Institute of Standards and Technology
100 Bureau Drive, Stop 8615
Gaithersburg, MD 20899-8615 USA
E-mail: [email protected]
Phone: (301)975-5865
Abstract
Concrete service life models have proliferated in recent years due to increased interest in
designing infrastructure elements with at least a 75-year service life, along with greater emphasis
on life-cycle costing in general. While existing models consider a variety of concrete material
and environmental factors, at varying levels of complexity, in predicting the time until the onset
of chloride-induced corrosion of the steel reinforcement, the influence of cracking is generally
beyond their current scope. This paper presents a preliminary strategy for examining the
influence of transverse cracking on chloride ion penetration into concrete that includes a
graphical approach for adjusting the predicted service life provided by current models to reflect
this influence. Comparison to experimental data for saturated concretes indicates that the
contributions of binding of the chloride ions by the cement paste play a significant role in
slowing the ingress of chlorides and should be accounted for in any modeling efforts.
Keywords: Binding, chloride diffusion, corrosion, service life, transverse cracking.
Introduction
Service life prediction and durability-based design are slowly entering the concrete
design mainstream, as exemplified by recent specifications requiring up to a 75-year service life
for infrastructural elements. The present focus on sustainability requires that accurate service life
predictions be available for a concrete structure in its intended environment to enable life-cycle
cost analysis and to optimize sustainable performance. A variety of numerical models are
available, some commercial and some free of charge, for performing service life prediction,
generally considering chloride-induced corrosion of the steel reinforcement as the major
degradation scenario. The complexity of these models vary widely, with some based on a
straightforward Fick’s second law-type analysis of chloride ion diffusion into saturated concrete,
while others consider multi-species diffusion/convection into partially saturated concrete
undergoing wetting/drying cycles. However, one ubiquitous limitation of existing models is their
2
inability to consider the influence of cracking on concrete service life without extracting cracked
cores. Cracks provide preferential pathways for the ingress of deleterious species such as
chloride ions and surely reduce the service life when present, but by how much do cracks
directly reduce service life?
Cracks can occur due to many causes (e.g., plastic shrinkage, restrained shrinkage,
thermal and mechanical loading, improper design, expansive degradation reactions), and their
three-dimensional geometry can take many forms. Perhaps the simplest case of practical
significance to laboratory studies and field performance is the presence of transverse cracking,
with the cracks often occurring directly above individual lengths of rebar in the top layer of the
steel reinforcement [1-3]. Such cracks can dramatically increase the buildup of chlorides at the
depth of the steel reinforcement. In fact, results of Lindquist et al. [3] indicate that, for cracked
regions of bridge decks, sufficient chloride levels to initiate corrosion of the steel reinforcement
can be reached after as little as one year of field exposure.
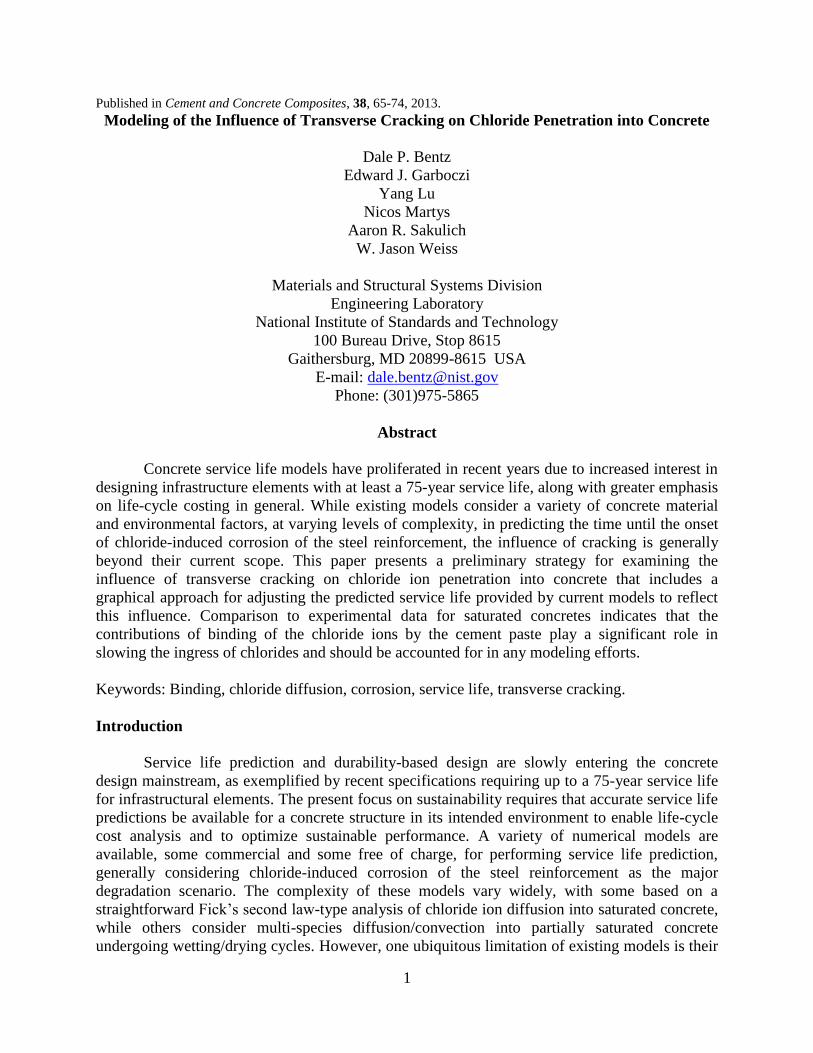
Transverse cracking can be modeled in a simplified form as shown in Figure 1, by
considering a single crack (rectangular or triangular in shape) located directly above the steel
reinforcement, a worst-case scenario, but one that routinely occurs in the field [1]. When
chlorides are present on the concrete surface, due to the application of de-icing salts or the
concrete structure being located in a coastal region, chlorides will penetrate into both the bulk
concrete and into the crack, when water-filled. The chloride transport rate will typically be much
faster into the crack, and, from the crack, the chlorides will spread into the surrounding concrete,
effectively short-circuiting the slower route through the full (cover) depth of the bulk concrete to
the reinforcement. While some research groups have analyzed this problem by determining
effective diffusion coefficients for the crack and for the bulk concrete in a parallel flow-type
model [4], Garces Rodriguez and Hooton [5] have pointed out that transport of chloride ions in
cracked concrete should be analyzed as a two-dimensional problem, with a simple Fickian one-
dimensional analysis being insufficient. In this case, both the crack width and crack depth are
significant parameters influencing the overall chloride penetration, and relations between the
crack width and the effective diffusivity of the crack have been developed in several
cases [6-13]. Clearly, in the case shown in Figure 1, the concentration of chloride ions directly
below the crack at the reinforcement surface will be higher than that obtained just a few
millimeters to the right or to the left of the rebar. Since it is the local (and not the average)
concentration of chlorides that is critical in inducing corrosion, this local value is what must be
assessed in modeling for predicting service life.
This paper explores a variety of two-dimensional models for estimating the local chloride
concentration as a function of crack width and depth, and uses these results to predict the
anticipated reduction in reinforced concrete service life due to the presence of such transverse
cracks. Such an approach was previously considered in the work of Paulsson-Tralla and
Silfwerbrand in 2002 [6]. While their work estimated the increase in concrete cover necessary to
mitigate a reduced service life as a function of crack depth, here the focus will be simply on how
much the service life of the concrete is reduced due to cracking, as a function of crack width and
depth, reinforcement (cover) depth, and bridge deck concrete thickness.
3
Figure 1. Schematic of a transverse rectangular-shaped crack in concrete located directly above
steel reinforcement (not to scale).
Theoretical Background and Computer Models
Solution to Fick’s Second Law
For the case of one-dimensional diffusion with no binding/reaction, no chlorides initially
present in the concrete, and a constant diffusion coefficient D, the following analytical solution
for diffusion, according to Fick’s second law in a semi-infinite media, can be utilized to estimate
the concentration of chloride ions as a function of depth and time [14]:
√ (1)
where CS is the chloride concentration at the top surface of the concrete, D is the chloride ion
diffusion coefficient in the concrete, x is depth, t is time, and erfc indicates the complementary
error function. In this form, the utility of plotting results as dimensionless variables, namely
C(x,t)/CS vs. x/(2√Dt), is apparent. Equation 1 provides a convenient analytical solution to
evaluate the validity of one-dimensional finite element or finite difference models for diffusive
transport. Additionally, if the chloride concentration necessary to initiate corrosion at a known
depth of reinforcement x is supplied, along with the concrete diffusion coefficient and the surface
chloride concentration, equation 1 can be solved to determine the estimated service life, as the
time t to reach this concentration at depth x [15].
ANSYS1modeling approach
While conventionally used for heat transfer and mechanical stress problems, ANSYS has
also recently been applied to consider diffusion in cracked concrete [9,10]. This is typically
accomplished by establishing an analogy between mass transfer and heat transfer; free chloride
content is mapped to temperature, while the diffusion coefficient for the chloride ions is mapped
to thermal conductivity, with the corresponding heat capacity and density parameters set to a
value of 1 [10]. The diffusion coefficient (thermal conductivity) can be further modified to be a
function of time and temperature [10] or converted to an effective diffusion coefficient that
includes equilibrium binding of chloride ions by the hydrated cement paste in the concrete based
1 Certain commercial products are identified in this paper to specify the materials used and procedures employed. In
no case does such identification imply endorsement or recommendation by the National Institute of Standards and
Technology, nor does it indicate that the products are necessarily the best available for the purpose.
4
on various isotherm equations (linear, Langmuir, or Freundlich, etc.) [9]. Such binding typically
includes the combined effects of sorption of the Cl- ions by the calcium silicate hydrate gel
(C-S-H) and other hydration products, as well as the reaction of these ions with aluminate phases
present in the hydrated cement paste to form Friedel’s salt (and perhaps other chloroaluminate
compounds). However, incorporating the kinetics of the binding process is a more challenging
problem that has not yet been effectively addressed. It is well recognized that binding has a
considerable influence on the rate of chloride ingress into concrete and therefore subsequent
service life predictions [16].
When a rectangular crack of known width and depth is introduced into such a model, the
user must supply the diffusion coefficient to be used in the crack, as a function of crack width for
example [4,11]. Alternatively, as implemented in the present study, this diffusion rate could be
assumed equal to that of chloride ions in free water, 1.8x10⁻⁹
m2/s at 20 °C [17]. In the current
effort, ANSYS is used to implement a simplified model for the reduction in service life due to
the presence of a rectangular crack above the reinforcement, neglecting any contributions of
binding or time dependency of the diffusion coefficient. This will be compared to a more
complex and more realistic model implemented in the COMSOL commercial software package,
as described later, to evaluate the importance of including binding rates (kinetics) and crack
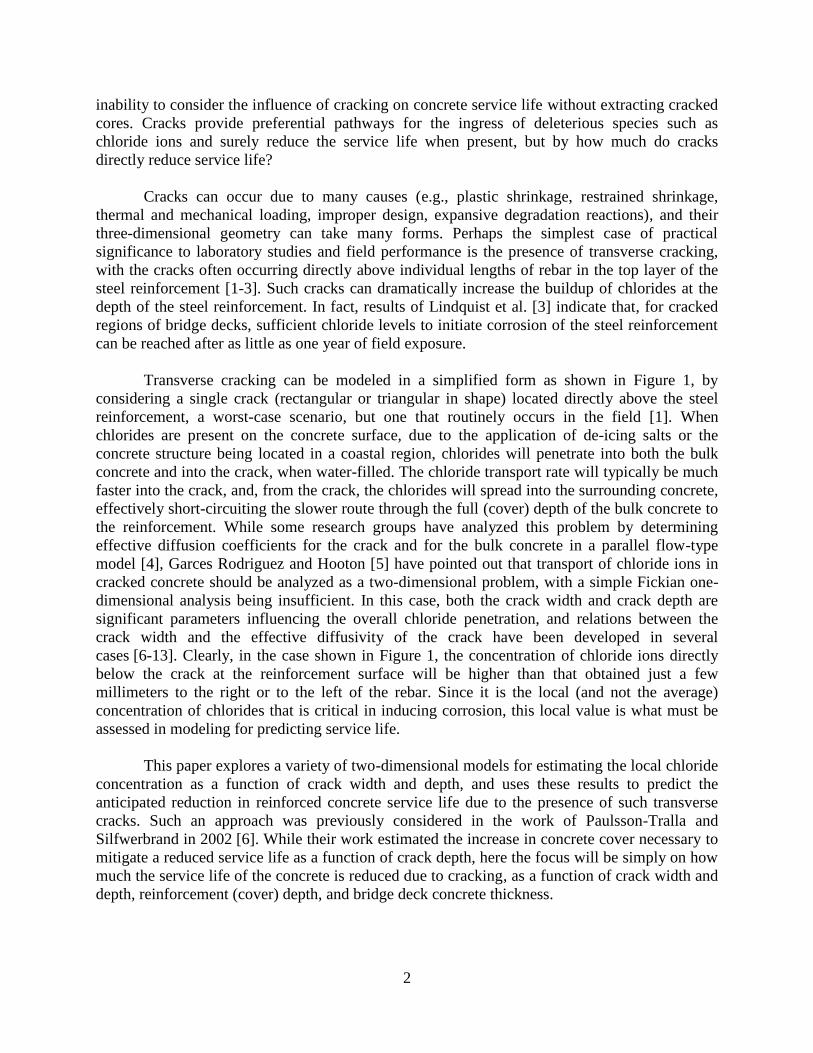
width into such simulations. In the ANSYS model, the crack (of depth Tcrack) is simply modeled
as an additional chloride containing boundary (with an unlimited supply of chloride ions) in a
two-dimensional simulation, and only half of the cracked system is modeled due to symmetry
considerations (e.g., adiabatic boundary at the central axis of the crack as displayed in Figure 2).
This model can be executed for various combinations of reinforcement depth (Trebar) and overall
deck thickness (Tconcrete) and compared to a version where the crack is simply omitted, so as to
determine the reduction in service life produced by the crack’s presence.
Figure 2. Simplified ANSYS geometry for simulating a single crack (2-D line boundary) in a
two-dimensional concrete simulation.
It should be mentioned that, in long-term simulations, the boundary condition applied at
the bottom surface of the concrete can have a significant influence on the buildup of chlorides at
the depth of the top surface of the steel reinforcement. If a no-flux boundary condition is applied
5
(as shown in Figure 2), the long-term equilibrium solution will be one in which the concentration
is uniform throughout the depth of the concrete structure (C=CS at all depths). However, if a
constant boundary condition of C=0 were to be instead applied at the bottom surface (implying,
for example, that the bottom surface was washed periodically in an attempt to remove chlorides
from that surface), the final equilibrium would be a linear profile of chlorides varying from
C=CS at the top surface to C=0 at the bottom surface. In the relatively rare cases where the
surface chloride concentration is only slightly higher than that required for reinforcement
corrosion, such periodic washing could potentially increase the service life of the concrete.
Typically accepted values for the chloride ion concentration necessary to initiate
corrosion of steel reinforcement are on the order of 0.71 kg/m3 concrete to 1.2 kg/m
3 concrete for
bare steel [18] and 2.1 kg/m3 concrete to 4.3 kg/m
3 concrete for epoxy-coated steel
reinforcement [19]. Surface concentrations are generally at least 8.3 kg/m3 concrete [19], and can
be two to three times higher [3,20]. Based on these accepted values, for most practical scenarios
in the U.S., the ratio of the chloride concentration necessary to induce corrosion to that present in
the environment (at the exposed concrete surface) is typically on the order of 0.1 to 0.3, such that
reducing the chloride ion concentration at the bottom surface via washing will have a generally
negligible influence on resultant service life, in terms of the top layer of steel reinforcement
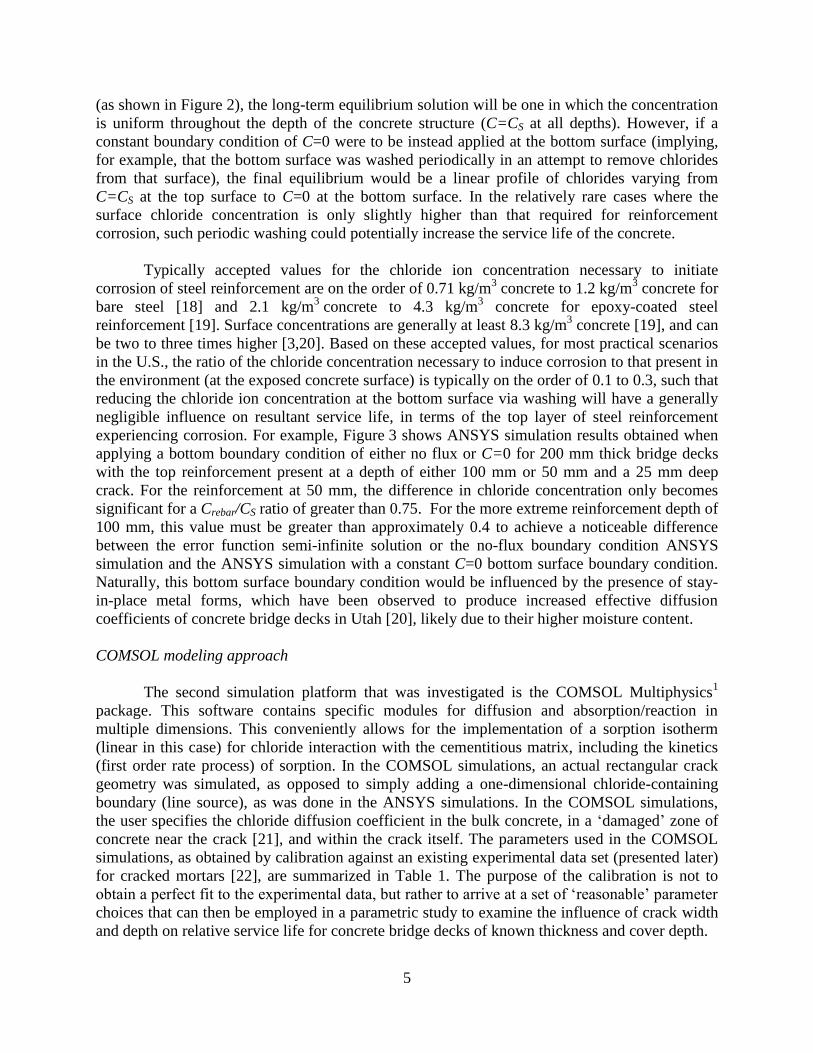
experiencing corrosion. For example, Figure 3 shows ANSYS simulation results obtained when
applying a bottom boundary condition of either no flux or C=0 for 200 mm thick bridge decks
with the top reinforcement present at a depth of either 100 mm or 50 mm and a 25 mm deep
crack. For the reinforcement at 50 mm, the difference in chloride concentration only becomes
significant for a Crebar/CS ratio of greater than 0.75. For the more extreme reinforcement depth of
100 mm, this value must be greater than approximately 0.4 to achieve a noticeable difference
between the error function semi-infinite solution or the no-flux boundary condition ANSYS
simulation and the ANSYS simulation with a constant C=0 bottom surface boundary condition.
Naturally, this bottom surface boundary condition would be influenced by the presence of stay-
in-place metal forms, which have been observed to produce increased effective diffusion
coefficients of concrete bridge decks in Utah [20], likely due to their higher moisture content.
COMSOL modeling approach
The second simulation platform that was investigated is the COMSOL Multiphysics1
package. This software contains specific modules for diffusion and absorption/reaction in
multiple dimensions. This conveniently allows for the implementation of a sorption isotherm
(linear in this case) for chloride interaction with the cementitious matrix, including the kinetics
(first order rate process) of sorption. In the COMSOL simulations, an actual rectangular crack
geometry was simulated, as opposed to simply adding a one-dimensional chloride-containing
boundary (line source), as was done in the ANSYS simulations. In the COMSOL simulations,
the user specifies the chloride diffusion coefficient in the bulk concrete, in a ‘damaged’ zone of
concrete near the crack [21], and within the crack itself. The parameters used in the COMSOL
simulations, as obtained by calibration against an existing experimental data set (presented later)
for cracked mortars [22], are summarized in Table 1. The purpose of the calibration is not to
obtain a perfect fit to the experimental data, but rather to arrive at a set of ‘reasonable’ parameter
choices that can then be employed in a parametric study to examine the influence of crack width
and depth on relative service life for concrete bridge decks of known thickness and cover depth.
6
Figure 3. Normalized concentration vs. x/(2√Dt) for ANSYS simulated cracked concrete bridge
decks with two different boundary conditions imposed at their bottom surface.
Table 1. Parameters used in COMSOL simulations
Parameter Calibrated value
Diffusion coefficient of bulk mortar (Dbulk) 6x10-11
m2/s
Sorption rate constant of bulk mortar (kbulk) 3x10⁻⁷
s-1
Diffusion coefficient of damaged mortar (Ddamaged) 1.2x10⁻⁹
m2/s
Sorption rate constant of damaged mortar (kdamaged) 3x10⁻⁷
s-1
Diffusion coefficient in small crack, CWA < 100 µm 2x10
-9 m
2/s
Diffusion coefficient in large crack, CW ≥ 100 µm 4x10⁻⁹
m2/s
Alpha coefficient in linear isotherm (α) 4
External chloride concentration (3 % NaCl) 523.4 mol/m3 pore solution
Porosity fraction of mortar 0.1828
Size of damaged zone for small crack, CW < 100 µm 1 mm
Size of damaged zone for large crack, CW ≥ 100 µm 4 mm A CW is measured crack width in micrometers [22]
While Freundlich, Langmuir, and linear isotherms [23] have all been employed in past
studies of chloride binding in concrete, for these simulations, to enhance numerical stability, a
simple linear isotherm was utilized to express the relationship between free and bound chlorides:
(2)
where α is a dimensionless fitting parameter, here taken as 4, as obtained by fitting the
experimental data (30 d and 90 d exposure) for a mortar specimen with no cracks [22]. This is
the best fit value for equation 2 when Cfree and Cbound are both expressed in units of mol Cl-/m
3
pore solution. Since the experimental results in [22] are presented in terms of total chlorides
measured as a mass percentage of mortar, the estimated Cfree and Cbound values are multiplied by
the molecular mass of chloride (0.03545 kg/mol) and the estimated total porosity of the mortar

7
(18.28 %) and then divided by the density of the mortar (estimated as 2301.4 kg/m3 based on the
reported mortar mixture proportions [22]). In this study, this single isotherm equation was
utilized to model the combined effects of sorption of the Cl- ions by the C-S-H and other
hydration products, as well as the reaction of these ions with aluminate phases to form Friedel’s
salt and other chloroaluminate compounds.
This sorption/reaction is implemented in COMSOL by adding a first-order reaction term
to the standard diffusion equation, resulting in:
(3)
Here, the driving force for binding is the difference between the equilibrium bound chloride and
its current value, e.g. (Cbound - αC). Using equation 3 and the sorption rate constant, kbulk,
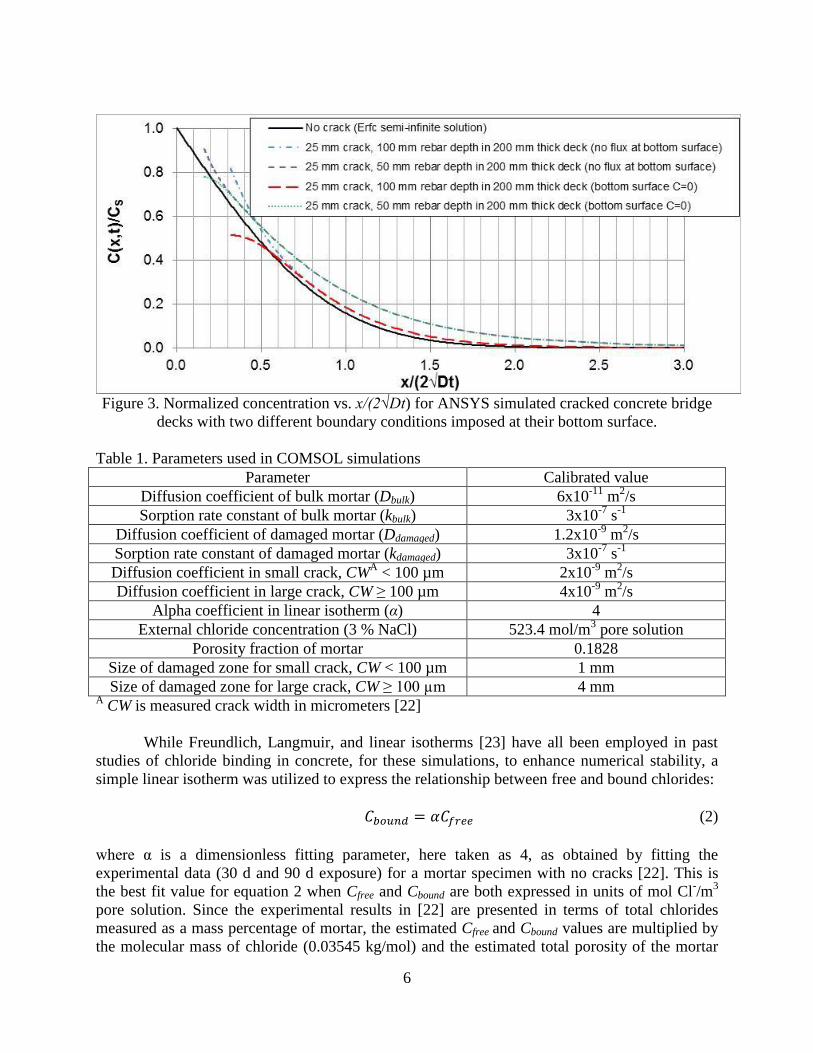
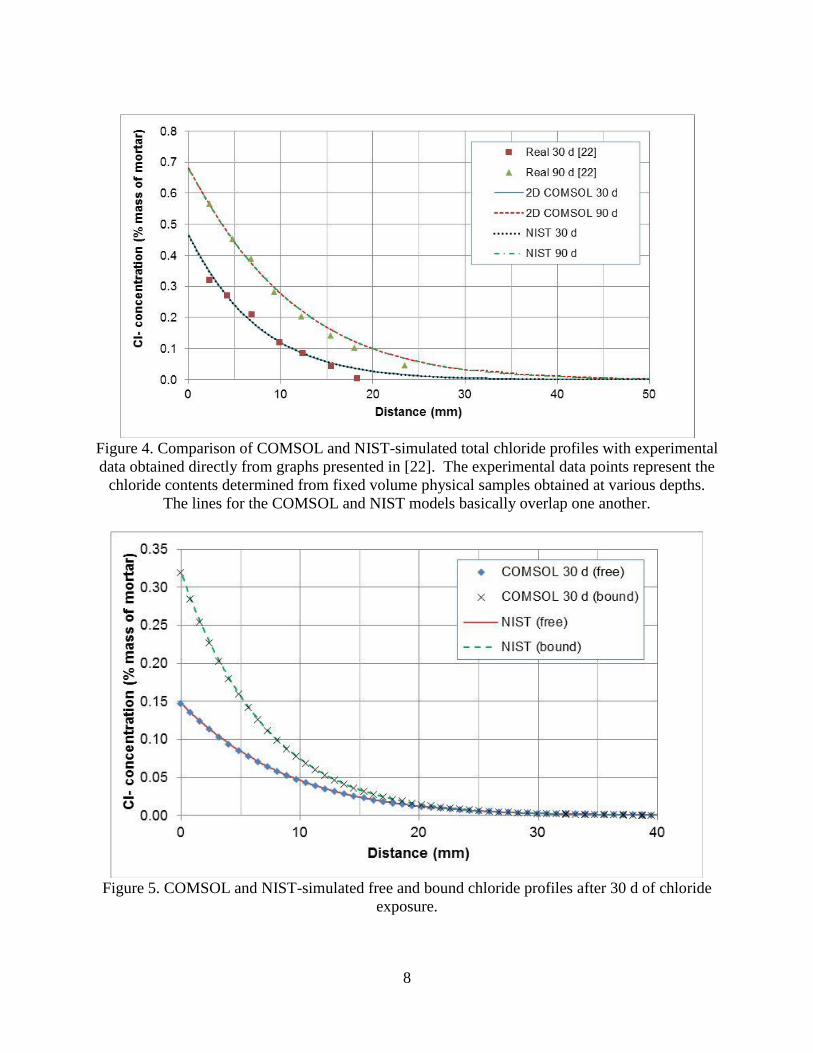
provided in Table 1, the simulation results for the uncracked mortar after 30 d and 90 d of
chloride exposure are compared to the experimental values [22] in Figure 4; in this case, a
reasonable, but not perfect, agreement is obtained between experimental and simulated values.
Without including the sorption/reaction effects, the experimental curves shown in Figure 4 were
previously fitted to equation 1 [22], resulting in diffusion coefficients of 2.34x10⁻¹¹
m2/s and
1.09x10⁻¹¹
m2/s for the 30 d and 90 d results, respectively. While the diffusion coefficient could
be decreasing with time due to continued hydration, the 3 % NaCl solution ponded on top of the
mortar specimens translates into a mortar chloride content of only about 0.15 %, significantly
lower than the projected y-axis intercepts for the two experimental curves shown in Figure 4.
This difference in intercept can be better explained by the binding/reaction of the chlorides
within the cementitious matrix of the mortar, as the results shown in Figure 4 are for total (and
not free) chloride concentrations. For the COMSOL simulations, once an ‘appropriate’ selection
was made for the binding isotherm and its rate constant (Table 1), a reasonable fit to the two
experimental data sets was obtained by using a single value for the diffusion coefficient that does
not decrease over time, effectively assuming that the 43 d of curing applied in [22] was sufficient
to hydrate a majority of the available cement. The importance of binding/reaction in regulating
chloride ion penetration is indicated in Figure 5 by the bound chloride concentration being
significantly higher than the free chloride concentration after only 30 d of chloride exposure.
NIST modeling approach
A third model was developed at the National Institute of Standards and Technology
(NIST) based on a generalized finite-difference solution of the diffusion/binding problem in
three dimensions [24] and also incorporating the kinetics of the chloride ion binding/reaction.
Unlike the COMSOL model, the NIST model features a single element size and does not include
any variable mesh refinement algorithm(s) to reduce memory requirements and computational
times. Results of this model were compared with the COMSOL-generated results (Figures 4
and 5) to provide further confidence that the simulations using the two packages were being
conducted correctly. As shown in Figures 4 and 5, although different meshes and solvers are
employed in each case, the NIST and COMSOL models produce basically identical results for
the case of the uncracked mortar, when provided with the same diffusion coefficient and
binding/reaction parameters. Both models also successfully reproduce Fickian behavior (in
comparison to equation 1) when executed with their binding/reaction terms removed.
8
Figure 4. Comparison of COMSOL and NIST-simulated total chloride profiles with experimental
data obtained directly from graphs presented in [22]. The experimental data points represent the
chloride contents determined from fixed volume physical samples obtained at various depths.
The lines for the COMSOL and NIST models basically overlap one another.
Figure 5. COMSOL and NIST-simulated free and bound chloride profiles after 30 d of chloride
exposure.
9
Results
Calibration of COMSOL model for cracked mortars
As with any modeling effort, assumptions were made in developing the COMSOL
simulations for comparison with experimental data [22]. These fitting hypotheses were obtained
over the course of a trial-and-error fitting process and are detailed as follows:
1) All cracks are assumed to be rectangular in shape, as characterized by their individual width
and depth reported in [22].
2) In addition to the bulk mortar and the crack itself, a third zone consisting of ‘damaged’ mortar
surrounding the crack is modeled. For crack widths less than 100 µm, the damaged zone has a
dimension of 1 mm, while for crack widths greater than or equal to 100 µm, it is set at 4 mm.
Win et al. [21] had previously suggested the existence of such a damaged zone, several mm in
extent, around the crack, based on their observation of a greater penetration depth of chlorides
spreading from the crack than that observed spreading from the top (uncracked) portion of their
exposed specimens. In COMSOL, the damaged zone has the same porosity and sorption
characteristics as the bulk mortar, but a diffusion coefficient, Ddamaged, that was adjusted to be
twenty times higher than the corresponding rate in the bulk mortar (Table 1); this increase could
potentially be due to microcracking and an accompanying increase in capillary pore and
interfacial transition zone connectivity within the damaged zone.
3) For crack widths greater than 100 µm, the diffusion coefficient of chloride ions within the
crack itself is doubled from 2x10⁻⁹
m2/s to 4x10
-9 m
2/s to empirically allow for the expected
increased transport of chloride ions due to the (gravity induced) convection of a higher density
(i.e. higher Cl- concentration) fluid from above the crack into the crack, where the local
concentration of Cl- solution has been decreased due to diffusion of Cl
- ions into the surrounding
mortar. In nature, this would be similar to the sinking of higher concentration salt water towards
the ocean floor, resulting in the spectacular formation of ice ‘brinicles’ in arctic waters [25].
4) The modeled total chloride concentrations within the cylindrical (15 mm) core evaluated in
the experiments were fitted to a quadratic function (Appendix A) for the purpose of comparing to
the experimentally measured chloride contents on a mass of mortar basis for cored cylinders
from the cracked mortar beams (it is further assumed that the cylindrical cores were taken
perfectly centered on the crack). Additionally, these model values were further increased to
include the free chlorides that would be present in the solution in the crack, assuming that these
chlorides would be uniformly deposited on the side crack walls, as the solution evaporates at the
end of the chloride exposure (prior to the coring).
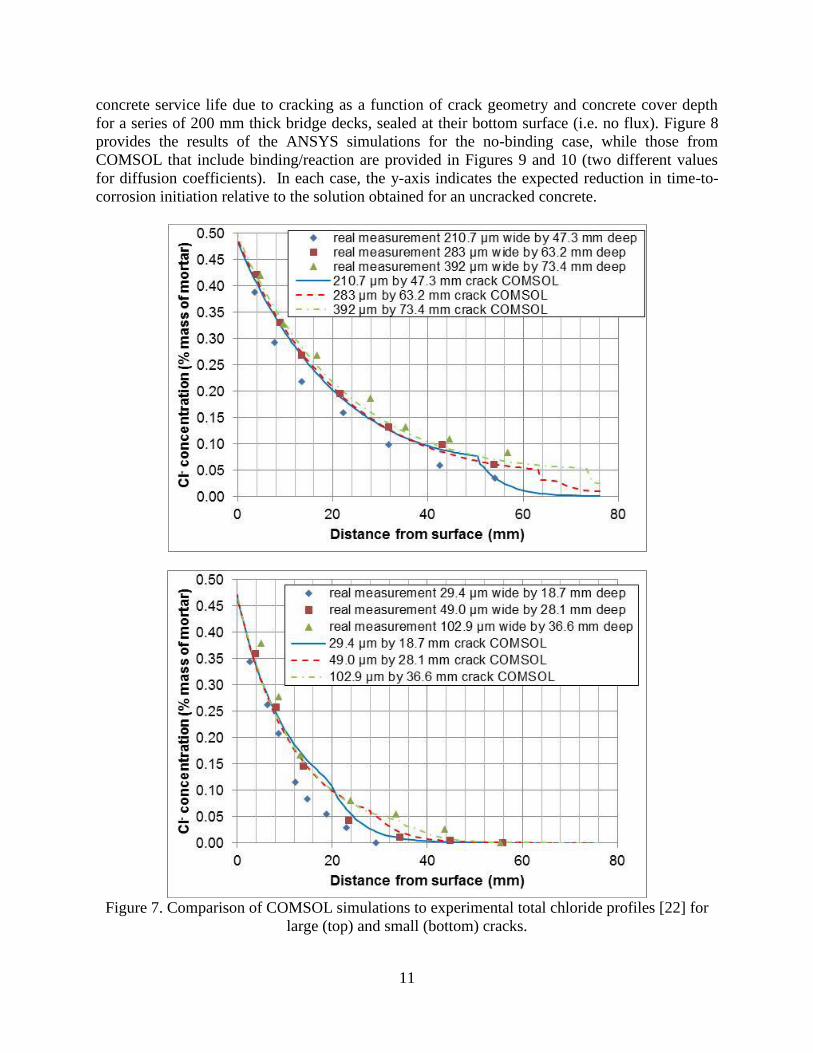
Employing these assumptions, simulations were executed for the six different cracked
specimens prepared and evaluated in reference [22]. Figure 6 provides example two-dimensional
concentration maps for three systems with different crack widths, while Figure 7 provides a
comparison of the experimental data presented in [22] to the COMSOL simulation results for the
76 mm thick specimens, with a no-flux boundary condition applied at their bottom surface.
While not perfect, the agreement observed in Figure 7 is reasonable given the assumptions in the
simulations and the unknowns and variability in the experiment. A better agreement can be
obtained by making the damaged zone size different for each crack or even removing it entirely
in the case of the smallest crack, but it was felt that having a damaged zone that is the same for
‘small’ and ‘large’ cracks made more sense with respect to the ultimate purposes of this study,
10
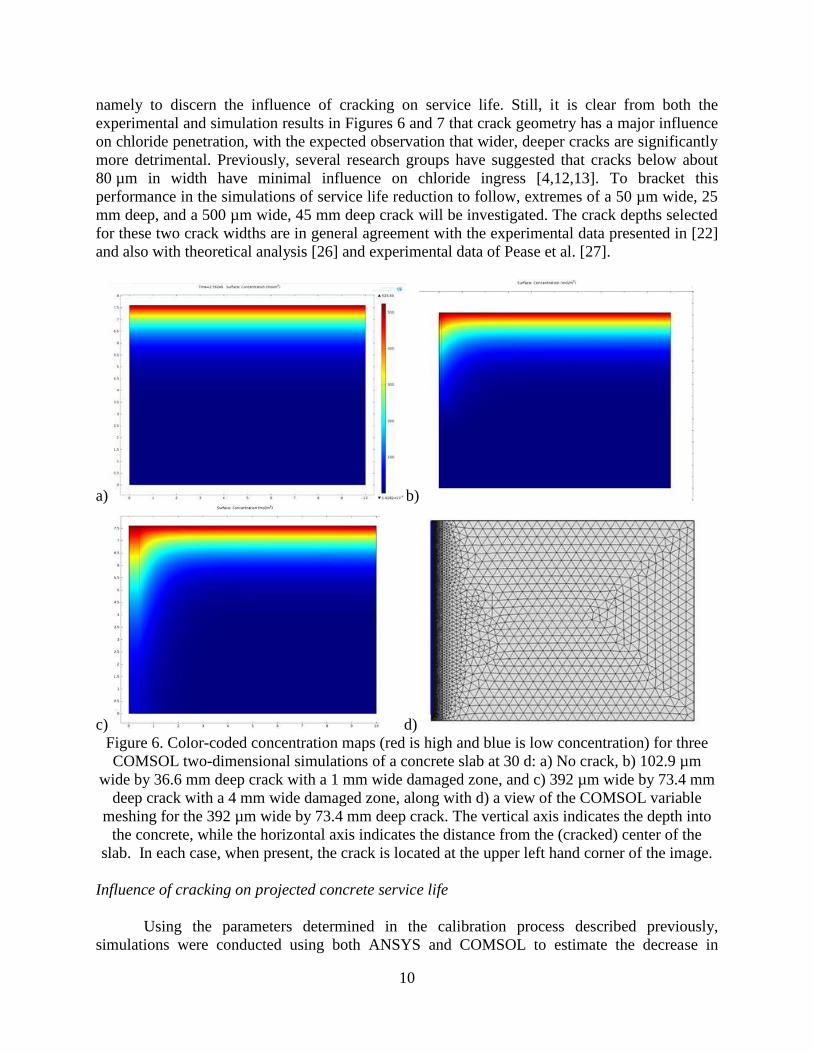
namely to discern the influence of cracking on service life. Still, it is clear from both the
experimental and simulation results in Figures 6 and 7 that crack geometry has a major influence
on chloride penetration, with the expected observation that wider, deeper cracks are significantly
more detrimental. Previously, several research groups have suggested that cracks below about
80 µm in width have minimal influence on chloride ingress [4,12,13]. To bracket this
performance in the simulations of service life reduction to follow, extremes of a 50 µm wide, 25
mm deep, and a 500 µm wide, 45 mm deep crack will be investigated. The crack depths selected
for these two crack widths are in general agreement with the experimental data presented in [22]
and also with theoretical analysis [26] and experimental data of Pease et al. [27].
a) b)
c) d)
Figure 6. Color-coded concentration maps (red is high and blue is low concentration) for three
COMSOL two-dimensional simulations of a concrete slab at 30 d: a) No crack, b) 102.9 µm
wide by 36.6 mm deep crack with a 1 mm wide damaged zone, and c) 392 µm wide by 73.4 mm
deep crack with a 4 mm wide damaged zone, along with d) a view of the COMSOL variable
meshing for the 392 µm wide by 73.4 mm deep crack. The vertical axis indicates the depth into
the concrete, while the horizontal axis indicates the distance from the (cracked) center of the
slab. In each case, when present, the crack is located at the upper left hand corner of the image.
Influence of cracking on projected concrete service life
Using the parameters determined in the calibration process described previously,
simulations were conducted using both ANSYS and COMSOL to estimate the decrease in
11
concrete service life due to cracking as a function of crack geometry and concrete cover depth
for a series of 200 mm thick bridge decks, sealed at their bottom surface (i.e. no flux). Figure 8
provides the results of the ANSYS simulations for the no-binding case, while those from
COMSOL that include binding/reaction are provided in Figures 9 and 10 (two different values
for diffusion coefficients). In each case, the y-axis indicates the expected reduction in time-to-
corrosion initiation relative to the solution obtained for an uncracked concrete.
Figure 7. Comparison of COMSOL simulations to experimental total chloride profiles [22] for
large (top) and small (bottom) cracks.
12
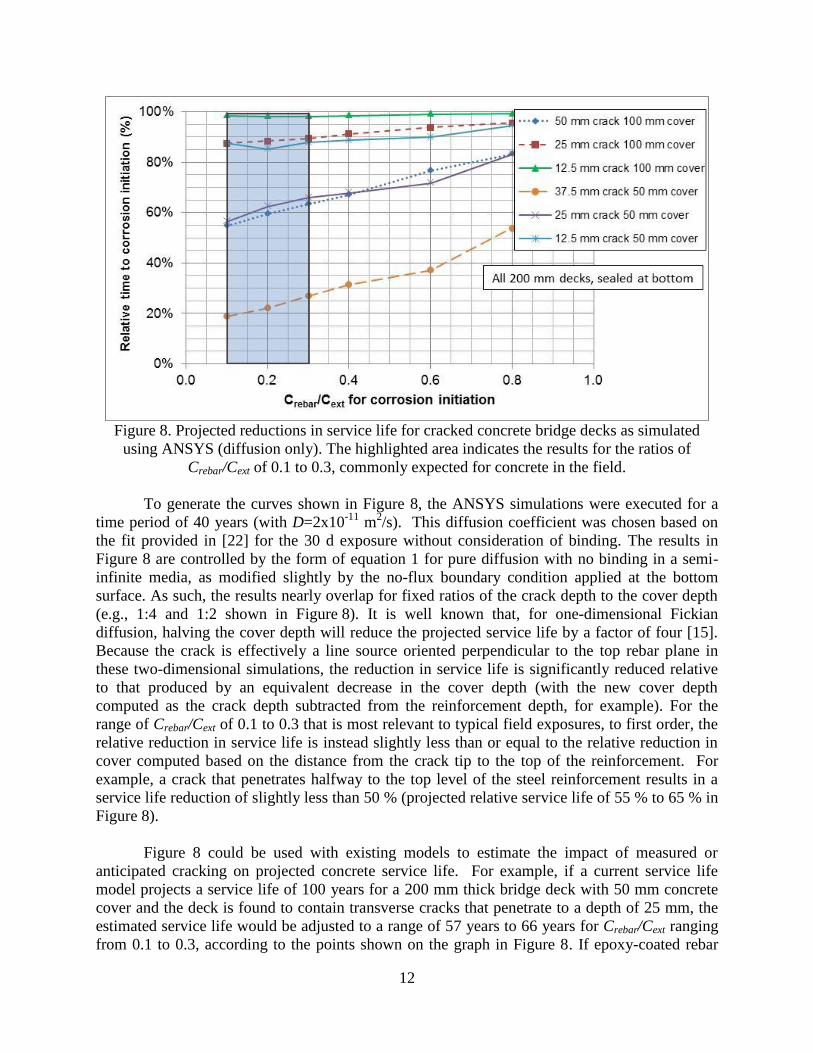
Figure 8. Projected reductions in service life for cracked concrete bridge decks as simulated
using ANSYS (diffusion only). The highlighted area indicates the results for the ratios of
Crebar/Cext of 0.1 to 0.3, commonly expected for concrete in the field.
To generate the curves shown in Figure 8, the ANSYS simulations were executed for a
time period of 40 years (with D=2x10-11
m2/s). This diffusion coefficient was chosen based on
the fit provided in [22] for the 30 d exposure without consideration of binding. The results in
Figure 8 are controlled by the form of equation 1 for pure diffusion with no binding in a semi-
infinite media, as modified slightly by the no-flux boundary condition applied at the bottom
surface. As such, the results nearly overlap for fixed ratios of the crack depth to the cover depth
(e.g., 1:4 and 1:2 shown in Figure 8). It is well known that, for one-dimensional Fickian
diffusion, halving the cover depth will reduce the projected service life by a factor of four [15].
Because the crack is effectively a line source oriented perpendicular to the top rebar plane in
these two-dimensional simulations, the reduction in service life is significantly reduced relative
to that produced by an equivalent decrease in the cover depth (with the new cover depth
computed as the crack depth subtracted from the reinforcement depth, for example). For the
range of Crebar/Cext of 0.1 to 0.3 that is most relevant to typical field exposures, to first order, the
relative reduction in service life is instead slightly less than or equal to the relative reduction in
cover computed based on the distance from the crack tip to the top of the reinforcement. For
example, a crack that penetrates halfway to the top level of the steel reinforcement results in a
service life reduction of slightly less than 50 % (projected relative service life of 55 % to 65 % in
Figure 8).
Figure 8 could be used with existing models to estimate the impact of measured or
anticipated cracking on projected concrete service life. For example, if a current service life
model projects a service life of 100 years for a 200 mm thick bridge deck with 50 mm concrete
cover and the deck is found to contain transverse cracks that penetrate to a depth of 25 mm, the
estimated service life would be adjusted to a range of 57 years to 66 years for Crebar/Cext ranging
from 0.1 to 0.3, according to the points shown on the graph in Figure 8. If epoxy-coated rebar
13
were used and the value of Crebar/Cext was increased to 0.6, for example, the expected service life
would only be reduced to 72 years. Figure 8 (as well as Figures 9 and 10) indicates that field
exposures with higher values of Crebar/Cext are less sensitive to the presence of cracks. Of course,
there are two ways to increase the value of this ratio, either by increasing the threshold value of
Crebar necessary to initiate corrosion via use of epoxy-coated rebar, corrosion inhibitors, etc. or
by decreasing the value of Cext, typically by decreasing the amount of chlorides applied to the
concrete surface during the winter months or switching to a non-chloride-based source of deicing
chemicals.
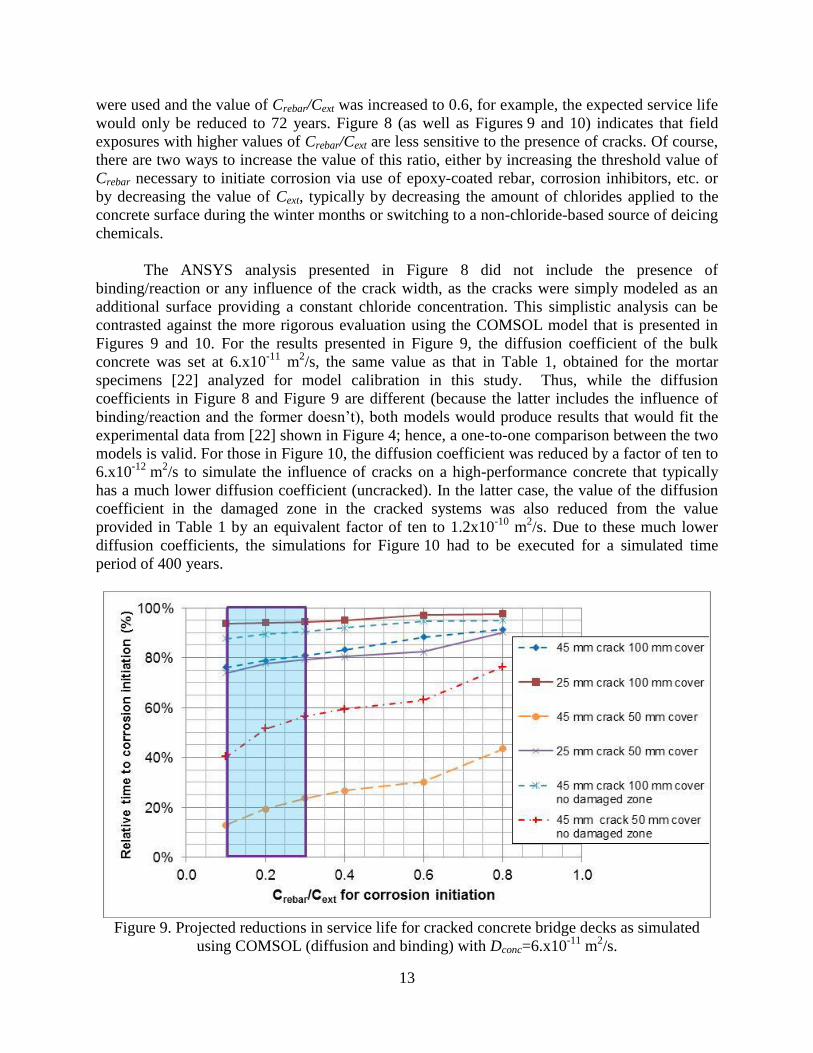
The ANSYS analysis presented in Figure 8 did not include the presence of
binding/reaction or any influence of the crack width, as the cracks were simply modeled as an
additional surface providing a constant chloride concentration. This simplistic analysis can be
contrasted against the more rigorous evaluation using the COMSOL model that is presented in
Figures 9 and 10. For the results presented in Figure 9, the diffusion coefficient of the bulk
concrete was set at 6.x10-11
m2/s, the same value as that in Table 1, obtained for the mortar
specimens [22] analyzed for model calibration in this study. Thus, while the diffusion
coefficients in Figure 8 and Figure 9 are different (because the latter includes the influence of
binding/reaction and the former doesn’t), both models would produce results that would fit the
experimental data from [22] shown in Figure 4; hence, a one-to-one comparison between the two
models is valid. For those in Figure 10, the diffusion coefficient was reduced by a factor of ten to
6.x10-12
m2/s to simulate the influence of cracks on a high-performance concrete that typically
has a much lower diffusion coefficient (uncracked). In the latter case, the value of the diffusion
coefficient in the damaged zone in the cracked systems was also reduced from the value
provided in Table 1 by an equivalent factor of ten to 1.2x10⁻¹⁰
m2/s. Due to these much lower
diffusion coefficients, the simulations for Figure 10 had to be executed for a simulated time
period of 400 years.
Figure 9. Projected reductions in service life for cracked concrete bridge decks as simulated
using COMSOL (diffusion and binding) with Dconc=6.x10-11
m2/s.
14
The results in Figure 9 indicate that binding and its kinetics have a significant impact on
the influence of cracking on projected service life. In comparing the 25 mm crack systems in
Figure 9 (with Dconc=6.x10-11
m2/s) to those in Figure 8, for example, it is clearly observed that
the reduction in projected service life is significantly less when the binding of chlorides is
included in the simulations and when the crack is modeled by its actual geometry as opposed to
being an additional line source of chlorides. As the binding removes chlorides from the pore
solution, it helps mitigate the negative impact of the cracking on chloride penetration. For the
example of a current service life model projecting a service life of 100 years for a 200 mm thick
bridge deck with 50 mm concrete cover, when the deck is found to contain transverse cracks that
penetrate to a depth of 25 mm, the estimated service life would be adjusted to a range of 74 years
to 79 years for Crebar/Cext ranging from 0.1 to 0.3, versus the range of 57 years to 66 years
determined above for the ANSYS diffusion-only simulations. In this case, employing the
simplified diffusion-only analysis with an additional line source of chlorides would
underestimate the projected service lives by about 15 years, or about 25 %.
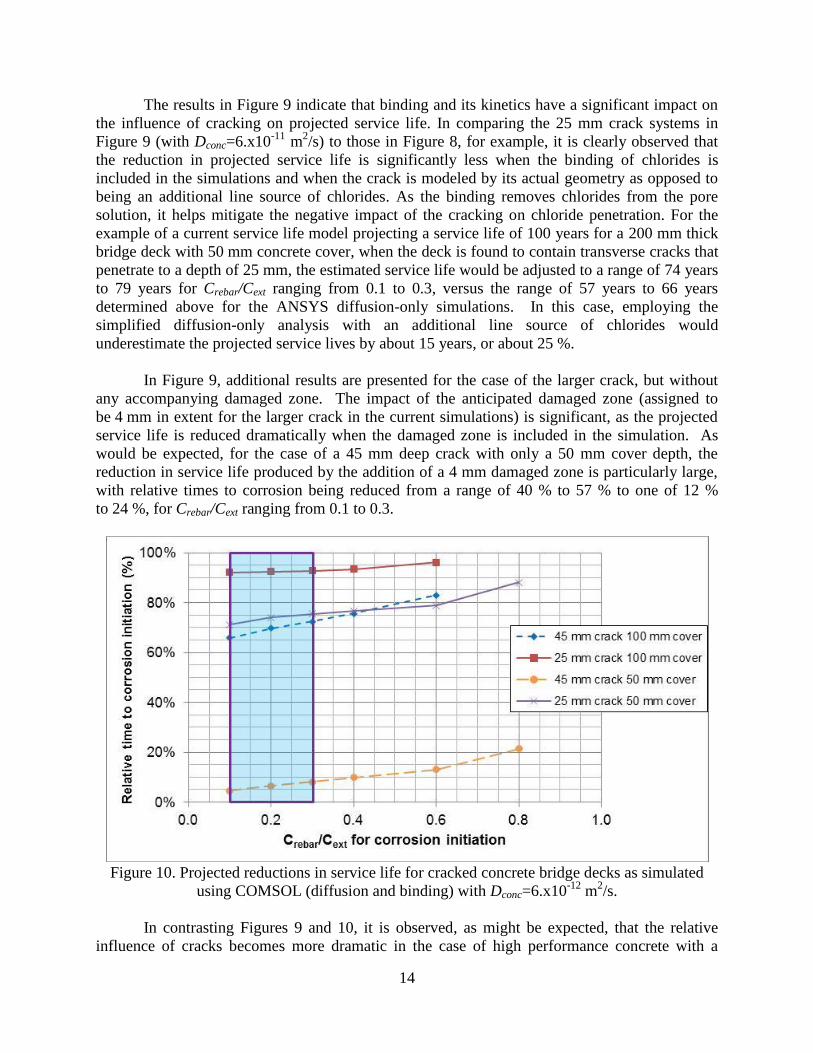
In Figure 9, additional results are presented for the case of the larger crack, but without
any accompanying damaged zone. The impact of the anticipated damaged zone (assigned to
be 4 mm in extent for the larger crack in the current simulations) is significant, as the projected
service life is reduced dramatically when the damaged zone is included in the simulation. As
would be expected, for the case of a 45 mm deep crack with only a 50 mm cover depth, the
reduction in service life produced by the addition of a 4 mm damaged zone is particularly large,
with relative times to corrosion being reduced from a range of 40 % to 57 % to one of 12 %
to 24 %, for Crebar/Cext ranging from 0.1 to 0.3.
Figure 10. Projected reductions in service life for cracked concrete bridge decks as simulated
using COMSOL (diffusion and binding) with Dconc=6.x10-12
m2/s.
In contrasting Figures 9 and 10, it is observed, as might be expected, that the relative
influence of cracks becomes more dramatic in the case of high performance concrete with a
15
lower (bulk) diffusion coefficient. For the 200 mm thick bridge deck with 50 mm cover depth
and an anticipated service life of 100 years in uncracked condition, for example, the estimated
service life range is 72 years to 75 years, moving from the range of 74 years to 79 years for the
higher Dconc COMSOL simulation towards the ANSYS/diffusion-only range of 57 years
to 66 years. Even when considering a high-performance concrete, the diffusion-only (ANSYS)
analysis is conservative in over-predicting the projected service life reduction due to the presence
of cracking.
As illustrated by the 45 mm depth crack with 50 mm cover, as cracks approach the
reinforcement depth, their relative influence in a high-performance concrete becomes even more
significant. In this case, the high-performance concrete service life (Figure 10) is reduced to only
5 % to 8 % of its initial (uncracked) value, while the ordinary concrete service life (Figure 9) is
only reduced to about 12 % to 24 % of its initial (but lower) value. Thus, avoiding or minimizing
cracks is seen to be particularly important in applications employing high-performance concrete,
in order to achieve its intended service life.
Conclusions
A comprehensive approach for estimating the influence of transverse cracking directly
above the steel reinforcement on chloride penetration and concrete service life has been
presented, concluding that:
- A simple 2-D simulation that considers only diffusion can be used to provide a
conservative estimate on the influence of cracking on projected concrete service life.
- Because of the significant impact of chloride binding on chloride penetration into
concrete, more accurate estimates of the influence of cracking on chloride penetration
and service life require a two-dimensional simulation that includes the influence of
binding and its kinetics. Such a simulation can be developed from the ground up based on
a set of diffusion and reaction equations, or adapted from existing commercial simulation
software packages (such as COMSOL).
- The incorporation of binding into such models increases the projected service life of the
cracked concrete, relative to that predicted by a model that includes only diffusion.
- Cracking has a relatively larger impact on chloride penetration in high-performance
concrete systems. Unfortunately, high-performance concretes are often more prone to
cracking than conventional concretes. It must be noted, however, that the present study
did not consider whether cracks in high-performance concrete may have different
dimensions (e.g., being narrower or even many times wider) and damaged zone
characteristics than their counterparts in ordinary concrete.
This analysis considered only cracks that penetrate partway to the depth of the reinforcement,
nominally considering any cracks that do reach the reinforcement depth to be sufficient to allow
immediate chloride access to the bar. It is recognized that additional efforts in characterizing
what comprises ‘typical’ cracking for field concretes (number, size, and depth) are sorely
needed. Additionally, it is recognized that the simulations in this paper were developed for
concretes under continuously saturated conditions. That is one of the reasons that the graphs in
Figures 8 to 10 were developed to express the relative reduction in concrete service life, relative
to that predicted by any existing concrete service life model. These existing models may or may
16
not include the influence of partial saturation (wetting/drying) on concrete service life. It is
proposed that the presented graphs may be used with any of these existing models to estimate the
projected relative reduction in service life due to the presence of cracking, whether these cracks
are measured ones from existing structures or hypothetical ones. In the future, more complex
simulations of chloride penetration that include both cracking and wetting and drying exposures,
among other factors, could be developed using COMSOL or other simulation platforms.
Appendix A – Derivation of Cylindrical Sampling Average Concentration
In many real world studies, a circular drill bit is used to obtain a series of powder samples
at different depths from a concrete surface, which are then analyzed for their chloride contents.
For a one-dimensional diffusion scenario in a homogeneous media, the measured concentration,
per gram of powder for example, accurately represents the one-dimensional diffusion profile.
However, in the case of a cracked specimen that is cored “through” the crack, the two-
dimensional boundary conditions established for the diffusion create variations in chloride
concentrations in two dimensions, both as a function of depth and as a function of distance from
the crack. To compare numerical and experimental results in this case, the numerical profiles
must be properly integrated over the circular sampling area. A procedure for estimating these
values from a set of three simulated linear profiles measured at different distances from the crack
center is presented here.
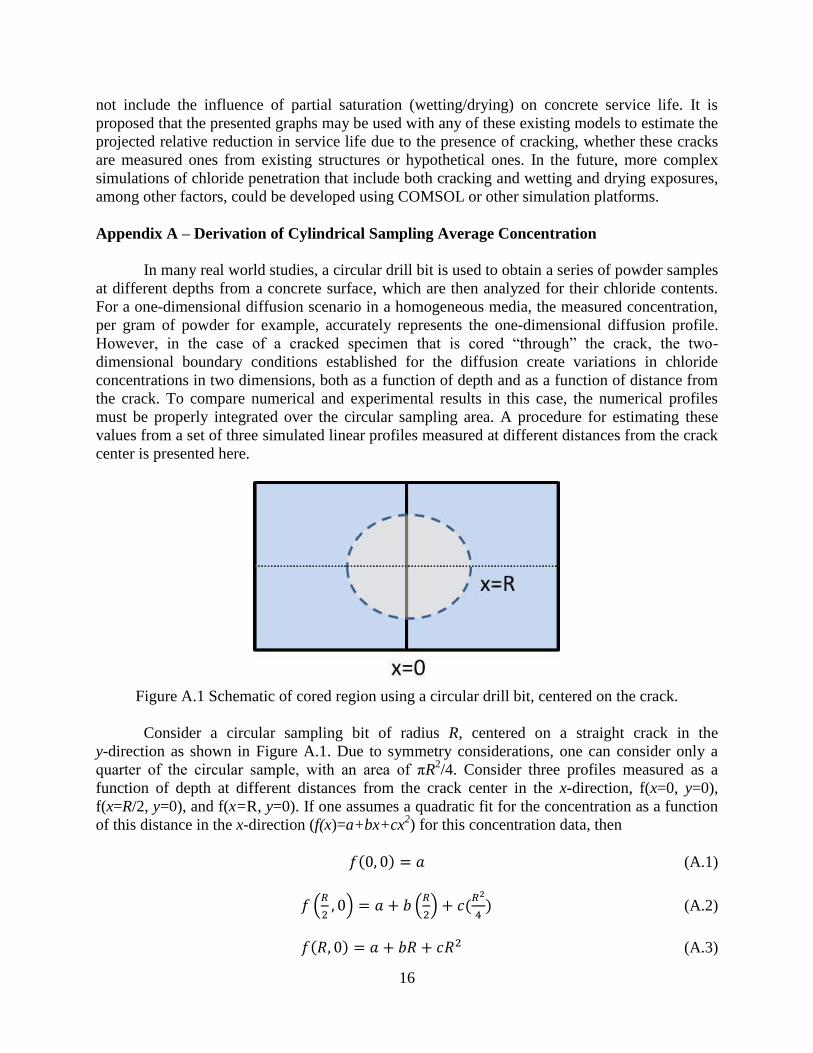
Figure A.1 Schematic of cored region using a circular drill bit, centered on the crack.
Consider a circular sampling bit of radius R, centered on a straight crack in the
y-direction as shown in Figure A.1. Due to symmetry considerations, one can consider only a
quarter of the circular sample, with an area of πR2/4. Consider three profiles measured as a
function of depth at different distances from the crack center in the x-direction, f(x=0, y=0),
f(x=R/2, y=0), and f(x=R, y=0). If one assumes a quadratic fit for the concentration as a function
of this distance in the x-direction (f(x)=a+bx+cx2) for this concentration data, then
(A.1)
(
) (
)
(A.2)
(A.3)
17
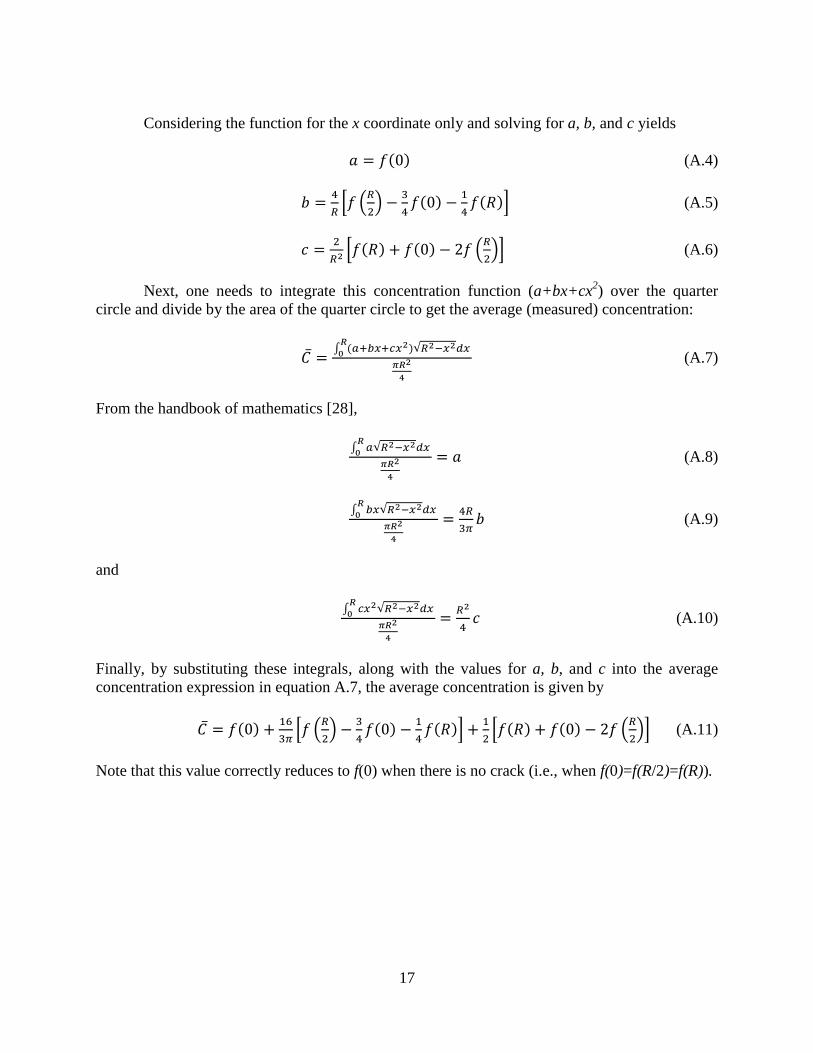
Considering the function for the x coordinate only and solving for a, b, and c yields
(A.4)
[ (
)
] (A.5)
[ (
)] (A.6)
Next, one needs to integrate this concentration function (a+bx+cx2) over the quarter
circle and divide by the area of the quarter circle to get the average (measured) concentration:
∫ √
(A.7)
From the handbook of mathematics [28],
∫ √
(A.8)
∫ √
(A.9)
and
∫ √
(A.10)
Finally, by substituting these integrals, along with the values for a, b, and c into the average
concentration expression in equation A.7, the average concentration is given by
[ (
)
]
[ (
)] (A.11)
Note that this value correctly reduces to f(0) when there is no crack (i.e., when f(0)=f(R/2)=f(R)).
18
References
[1] Kyle NL. Subsidence cracking of concrete over steel reinforcement bar in bridge decks. M.S.
Thesis, Virginia Polytechnic Institute and State University; 2001.
[2] Darwin D, Browning J, and Lindquist WD. Control of cracking in bridge decks: Observations
from the field. Cem Concr Agg 2004;26(2):148-54.
[3] Lindquist WD, Darwin D, Browning J, and Miller GG. Effect of cracking on chloride content
in concrete bridge decks. ACI Mater J 2006;103(6):467-73.
[4] Djerbi A, Bonnet S, Khelidj A, and Baroghel-Bouny V. Influence of traversing crack on
chloride diffusion into concrete. Cem Concr Res 2008;38:877-83.
[5] Garces Rodriguez O, and Hooton RD. Influence of cracks on chloride ingress into concrete.
ACI Mater J 2003;100(2):120-6.
[6] Paulsson-Tralla J, and Silfwerbrand J. Estimation of chloride ingress in uncracked and
cracked concrete using measured surface concentrations. ACI Mater J 2002;99(1):27-36.
[7] Kato E, Kato Y, and Uomoto T. Development of simulation model of chloride ion
transportation in cracked concrete. J Adv Concr Tech 2005;3(1):85-94.
[8] Ishida T, Iqbal PO, and Anh HTL. Modeling of chloride diffusivity coupled with non-linear
binding capacity in sound and cracked concrete. Cem Concr Res 2009;39:913-23.
[9] Fu C, Jin X, and Jin N. Modeling of chloride ions diffusion in cracked concrete. Earth and
Space 2010: Engineering, Science, Construction, ASCE 2010:3579-89.
[10] Wang Q, Xu G, and Wei J. Numerical simulation on chloride ions diffusion in concrete.
Adv Mater Res 2011;261-263:348-51.
[11] Park SS, Kwon S-J, and Jung SH. Analysis technique for chloride penetration in cracked
concrete using equivalent diffusion and permeation. Constr Building Mater 2012;29:183-92.
[12] Jang SY, Kim BS, and Oh BH. Effect of crack width on chloride diffusion coefficients of
concrete by steady-state migration tests. Cem Concr Res 2011;41(1):9-19.
[13] Wang L, and Ueda T. Mesoscale modeling of chloride diffusion in cracks and cracked
concrete. J Adv Concr Tech 2011;9(3):241-9.
[14] Crank J. The Mathematics of Diffusion, Oxford University Press, USA, 1980, 424 p.
[15] Bentz DP, Clifton JR, and Snyder KA. Predicting service life of chloride-exposed steel-
reinforced concrete. Concr Inter 1996;18(12):41-7.
19
[16] Martin-Perez B, Zibara H, Hooton RD, and Thomas MDA. A study of the effect of chloride
binding on service life predictions. Cem Concr Res 2000;30:1215-23.
[17] Mills R, and Lobo VMM. Self-Diffusion in Electrolyte Solutions, Elsevier, Amsterdam,
1989, p. 317.
[18] Cady PD, and Weyers RE. Chloride penetration and the deterioration of concrete bridge
decks. Cem Concr Agg 1983;5(2):81-7.
[19] Fanous FS, and Wu H-C. Service life of Iowa bridge decks reinforced with epoxy-coated
bar. Mid Continent Transportation Symposium Proceedings, Center for Transportation Research
and Education, Iowa State University 2000:259-62.
[20] Birdsall AW, Guthrie WS, and Bentz DP. Effects of initial surface treatment timing on
chloride concentrations in concrete bridge decks. Trans Res Rec: J Trans Res Board
2007;2028:103-10.
[21] Win PP, Watanabe M, and Machida A. Penetration profile of chloride ion in cracked
reinforced concrete. Cem Concr Res 2004;34:1073-9.
[22] Sahmaran M, and Özgür Yaman I. Influence of transverse crack width on reinforcement
corrosion initiation and propagation in mortar beams. Can J Civil Eng 2008;35:236-45.
[23] Luping T, and Nilsson LO. Chloride binding capacity and binding isotherms of OPC pastes
and mortars. Cem Concr Res 1993;23:247-53.
[24] Martys, N. Diffusion in partially-saturated porous materials. Mater Struct 1999;32:555-62.
[25] Davies E. ’Brinicle’ ice finger of death filmed in Antarctic. available at:
http://www.bbc.co.uk/nature/15835017, access verified April 2012.
[26] Tada H, Paris PC, and Irwin GR. The Stress Analysis of Cracks Handbook, 3rd
Edition,
American Society of Mechanical Engineers, 2000.
[27] Pease BJ, Geiker MR, Stang HR, and Weiss WJ. Cracking behavior of reinforced concrete
beams under service loads. Advances in Concrete through Science and Engineering, RILEM
Quebec 2006:281.
[28] C.R.C. Standard Mathematical Tables, 12th
edition, Chemical Rubber Publishing Company,
Cleveland, OH, 1959.