Embed Size (px)
Citation preview
HYDROGEN EMBRITTLEMENT TESTING OF AUSTENITIC STAINLESS STEELS SUS 316 AND 316L
by
DARREN MICHAEL BROMLEY
B.A.Sc., The University of British Columbia, 2005
A THESIS SUBMITTED IN PARTIAL FULFILLMENT OF THE REQUIREMENTS FOR THE DEGREE OF
MASTER OF APPLIED SCIENCE
in
THE FACULTY OF GRADUATE STUDIES
(Materials Engineering)
THE UNIVERSITY OF BRITISH COLUMBIA
(Vancouver)
April 2008
© Darren Michael Bromley, 2008
ii
Abstract
The imminent emergence of the hydrogen fuel industry has resulted in an urgent
mandate for very specific material testing. Although storage of pressurized hydrogen gas
is both practical and attainable, demands for increasing storage pressures (currently
around 70 MPa) continue to present unexpected material compatibility issues. It is
imperative that materials commonly used in gaseous hydrogen service are properly tested
for hydrogen embrittlement resistance. To assess material behavior in a pressurized
hydrogen environment, procedures were designed to test materials for susceptibility to
hydrogen embrittlement.
Of particular interest to the field of high-pressure hydrogen in the automotive
industry, austenitic stainless steels SUS 316 and 316L were used to validate the test
programs. Tests were first performed in 25 MPa helium and hydrogen at room
temperature and at -40oC. Tests in a 25 MPa hydrogen atmosphere caused embrittlement
in SUS 316, but not in 316L. This indicated that alloys with higher stacking fault
energies (316L) are more resistant to hydrogen embrittlement. Decreasing the test
temperature caused slight embrittlement in 316L and significantly enhanced it in 316.
Alternatively, a second set of specimens was immersed in 70 MPa hydrogen at 100oC
until reaching a uniform concentration of absorbed hydrogen. Specimens were then
loaded in tension to failure to determine if a bulk saturation of hydrogen provided a
similar embrittling effect. Neither material succumbed to the effects of gaseous pre-
charging, indicating that the embrittling mechanism requires a constant supply of
hydrogen at the material surface rather than having bulk concentration of dissolved
hydrogen. Permeation tests were also performed to ensure that hydrogen penetrated the
samples and to develop material specific permeation constants.
To pave the way for future work, prototype equipment was constructed allowing
tensile or fatigue tests to be performed at much higher hydrogen pressures. To determine
the effect of pressure on hydrogen embrittlement, additional tests can be performed in
hydrogen pressures up to 85 MPa hydrogen. The equipment will also allow for cyclic
loading of notched tensile or compact tension specimens for fatigue studies.
iii
Table of Contents
Abstract ............................................................................................................................... ii Table of Contents............................................................................................................... iii List of Tables ...................................................................................................................... v List of Figures .................................................................................................................... vi List of Abbreviations ......................................................................................................... ix List of Symbols ................................................................................................................... x 1.0 Introduction............................................................................................................. 1 2.0 Literature Review.................................................................................................... 3
2.1 Mechanism of Hydrogen Ingress ........................................................................ 3 2.1.1 Electrolytic Hydrogen Charging ................................................................. 4 2.1.2 Gaseous Hydrogen Charging ...................................................................... 4
2.2 Proposed Mechanisms of Hydrogen Embrittlement ........................................... 5 2.2.1 Hydrogen-Enhanced Decohesion................................................................ 5 2.2.2 Hydrogen-Enhanced Localized Plasticity................................................... 7 2.2.3 Hydride-Induced Embrittlement (HIE)....................................................... 9
2.3 Effect of Strain Rate on Hydrogen Embrittlement ........................................... 10 2.4 Hydrogen’s Effect on Austenite Stability ......................................................... 11
2.4.1 The Martensite Phase Transformation ...................................................... 12 2.4.2 Phase Transformation from Hydrogen Charging...................................... 14 2.4.3 Change in Ms and Md Temperatures ......................................................... 15 2.4.4 Decrease in Stacking Fault Energy ........................................................... 17
2.5 Martensite’s Role in Hydrogen Embrittlement................................................. 18 2.5.1 Opposing Arguments ................................................................................ 18 2.5.2 Supporting Arguments .............................................................................. 19 2.5.3 Comparison of Views ............................................................................... 21
3.0 Scope and Objectives............................................................................................ 23 4.0 Experimental Design and Development ............................................................... 24
4.1 Materials Tested................................................................................................ 24 4.2 Hydrogen Environment Tensile Tests .............................................................. 25 4.3 Bulk Material Hydrogen Effects....................................................................... 31
4.3.1 Permeation Tests....................................................................................... 31 4.3.2 Tensile Tests ............................................................................................. 36
4.4 Martensite Content Analysis............................................................................. 41 4.4.1 Ferritescope Validity Testing.................................................................... 42 4.4.2 Magnetic Measurement Procedure ........................................................... 45
4.5 Microscopy ....................................................................................................... 51 5.0 Results................................................................................................................... 53
5.1 Hydrogen Environment Tensile Tests .............................................................. 53 5.1.1 Tensile Test Results .................................................................................. 53 5.1.2 Stereo Microscopy .................................................................................... 58 5.1.3 Optical Microscopy................................................................................... 60 5.1.4 Scanning Electron Microscopy ................................................................. 65 5.1.5 Martensite Content Analysis..................................................................... 69
iv
5.2 Hydrogen Charge Tensile Tests........................................................................ 69 5.2.1 Permeation Test Results............................................................................ 70 5.2.2 Tensile Test Results .................................................................................. 70 5.2.3 Scanning Electron Microscopy ................................................................. 74
6.0 Discussion............................................................................................................. 78 6.1 Permeation Properties of SS 316L.................................................................... 78 6.2 Phase Stability and Hydrogen Embrittlement................................................... 81 6.3 Martensite’s Role in Hydrogen Embrittlement................................................. 82 6.4 Surface Versus Bulk Hydrogen Concentration................................................. 83 6.5 Effect of Temperature on Hydrogen Embrittlement......................................... 84
7.0 Future Work .......................................................................................................... 87 8.0 Conclusions........................................................................................................... 89 References......................................................................................................................... 91
v
List of Tables
Table 1: SUS 316 and 316L chemical compositions ........................................................ 24 Table 2: Initial geometry measurements........................................................................... 26 Table 3: Tension test parameters ...................................................................................... 27 Table 4: Parameters used in calculation of maximum permeation pressure..................... 36 Table 5: Thin tensile test conditions ................................................................................. 41 Table 6: Mechanical properties of SS 301LN................................................................... 42 Table 7: Martensite measurement results ......................................................................... 44 Table 8: Reference sample martensite measurements ...................................................... 48 Table 9: Initial magnetic attraction measurements ........................................................... 51 Table 10: Summary of tensile test results for SUS 316 .................................................... 56 Table 11: Summary of tensile test results for SUS 316L.................................................. 57 Table 12: Martensite content of fractured tensile specimens............................................ 69 Table 13: Hydrogen charge tensile test results ................................................................. 73 Table 14: Measured permeability values .......................................................................... 79
vi
List of Figures
Figure 1: Carbon fibre fully wrapped tank with SS 316 liner............................................. 2 Figure 2: Effect of absorbed hydrogen on the shear stress of dislocation interaction ........ 8 Figure 3: Variation in normalized dislocation velocity with hydrogen gas pressure ......... 9 Figure 4: Ratio of fracture load in hydrogen to air versus displacement rate................... 11 Figure 5: Variation of SFE of SS 304 with temperature change ...................................... 13 Figure 6: Martensite transformation regimes.................................................................... 16 Figure 7: Round tensile specimen geometry..................................................................... 25 Figure 8: Integration of pressure vessel, environment chamber, and tensile test frame... 28 Figure 9: Setting balance point for load cell reading........................................................ 29 Figure 10: Measured versus calculated strains ................................................................. 31 Figure 11: Permeation test setup schematic...................................................................... 32 Figure 12: Permeation sample jig ..................................................................................... 33 Figure 13: Diffusion of hydrogen through thin disk sample............................................. 34 Figure 14: Time to reach steady state hydrogen diffusion for SS 316.............................. 35 Figure 15: Strength of SS 316L as a function of temperature .......................................... 36 Figure 16: Dimensions of thin tensile specimens ............................................................. 37 Figure 17: Hydrogen concentration profiles for samples stored in 70 MPa at 373 K ...... 38 Figure 18: High-temperature hydrogen charge apparatus ................................................ 39 Figure 19: Estimated desorption of hydrogen from a saturated sample in contact with a
vacuum...................................................................................................................... 40 Figure 20: Actual applied strains for ferritescope validity test......................................... 43 Figure 21: Diffraction patterns of deformed specimens ................................................... 44 Figure 22: Martensite measurements from ferritescope and XRD ................................... 45 Figure 23: XRD scan of reference sample R1 .................................................................. 47 Figure 24: XRD scan of reference sample R2 .................................................................. 47 Figure 25: XRD scan of reference sample R3 .................................................................. 48 Figure 26: Magnetic balance method test setup................................................................ 49 Figure 27: Magnetic response of reference samples......................................................... 50 Figure 28: 316 tested in 25 MPa He at 20oC .................................................................... 54 Figure 29: 316 tested in 25 MPa H2 at 20oC..................................................................... 54 Figure 30: 316 tested in 25 MPa He at -40oC ................................................................... 54 Figure 31: 316 tested in 25 MPa H2 at -40oC.................................................................... 54 Figure 32: 316L tested in 25 MPa He at 20oC.................................................................. 55 Figure 33: 316L tested in 25 MPa H2 at 20oC .................................................................. 55 Figure 34: 316L tested in 25 MPa He at -40oC................................................................. 55 Figure 35: 316L tested in 25 MPa H2 at -40oC ................................................................. 55 Figure 36: Stress-strain behavior of SUS 316 tested in helium and hydrogen ................. 56 Figure 37: Stress-strain behavior of SUS 316L tested in helium and hydrogen............... 57 Figure 38: 316 tested in 25 MPa He at 20oC (7x)............................................................. 58 Figure 39: 316 tested in 25 MPa H2 at 20oC (7x) ............................................................. 58 Figure 40: 316 tested in 25 MPa He at -40oC (7x) ........................................................... 59 Figure 41: 316 tested in 25 MPa H2 at -40oC (7x)............................................................ 59
vii
Figure 42: 316L tested in 25 MPa He at 20oC (7x) .......................................................... 59 Figure 43: 316L tested in 25 MPa H2 at 20oC (7x)........................................................... 59 Figure 44: 316L tested in 25 MPa He at -40oC (7x) ......................................................... 60 Figure 45: 316L tested in 25 MPa H2 at -40oC (7x) ......................................................... 60 Figure 46: SS 316 microstructure as-received (200x) ...................................................... 61 Figure 47: SS 316L microstructure as-received (200x).................................................... 61 Figure 48: Example of martensite distribution in hydrogen environment tensile sample 62 Figure 49: 316 tested in 25 MPa He at 20oC showing very little martensite (200x) ........ 62 Figure 50: 316 tested in 25 MPa H2 at 20oC showing nearly no martensite (500x) ......... 62 Figure 51: 316 tested in 25 MPa He at –40oC showing lots of martensite (500x) ........... 63 Figure 52: 316 tested in 25 MPa H2 at –40oC showing lots of martensite (200x)............ 63 Figure 53: 316L tested in 25 MPa He at 20oC showing almost no martensite (200x) ..... 63 Figure 54: 316L tested in 25 MPa H2 at 20oC showing almost no martensite (200x)...... 63 Figure 55: 316L tested in 25 MPa He at -40oC showing some martensite (200x) ........... 63 Figure 56: 316L tested in 25 MPa H2 at –40oC showing some martensite (200x) ........... 63 Figure 57: 316 tested in 25 MPa H2 at 20oC showing martensite ahead of a crack tip
(500x)........................................................................................................................ 65 Figure 58: 316 tested in 25 MPa He at 20oC showing ductile fracture (1000x)............... 66 Figure 59: 316 tested in 25 MPa H2 at 20oC showing brittle fracture (1000x)................. 66 Figure 60: 316 tested in 25 MPa He at -40oC showing ductile fracture (1000x).............. 66 Figure 61: 316 tested in 25 MPa H2 at -40oC showing brittle fracture (1000x) ............... 66 Figure 62: 316 tested in 25 MPa H2 at -40oC showing ductile features near center (220x)
................................................................................................................................... 67 Figure 63: 316L tested in 25 MPa He at 20oC showing ductile fracture (1000x) ............ 67 Figure 64: 316L tested in 25 MPa H2 at 20oC showing ductile fracture (1000x)............. 67 Figure 65: 316L tested in 25 MPa He at -40oC showing ductile fracture (1000x) ........... 68 Figure 66: 316L tested in 25 MPa H2 at -40oC showing ductile fracture (1000x)............ 68 Figure 67: 316L tested in 25 MPa H2 at -40oC showing brittle-to-ductile transition (300x)
................................................................................................................................... 68 Figure 68: Permeation test results..................................................................................... 70 Figure 69: 316 sample 1 tested as received ...................................................................... 71 Figure 70: 316 sample 2 tested as received ...................................................................... 71 Figure 71: 316 sample 3 charged in 100oC air.................................................................. 71 Figure 72: 316 sample 4 charged in 100oC air.................................................................. 71 Figure 73: 316 sample 5 charged in 100oC H2.................................................................. 71 Figure 74: 316 sample 6 charged in 100oC H2.................................................................. 71 Figure 75: 316L sample L1 tested as received.................................................................. 71 Figure 76: 316L sample L2 tested as received.................................................................. 71 Figure 77: 316L sample L3 charged in 100oC air............................................................. 71 Figure 78: 316L sample L4 charged in 100oC air............................................................. 71 Figure 79: 316L sample L5 charged in 100oC H2............................................................. 71 Figure 80: 316L sample L6 charged in 100oC H2............................................................. 71 Figure 81: Stress-strain curves of samples 1 through 6 .................................................... 72 Figure 82: Stress-strain curves of samples L1 through L6 ............................................... 73 Figure 83: Sample 1 tested as-received (300x)................................................................. 74 Figure 84: Sample 1 tested as-received (1000x)............................................................... 74
viii
Figure 85: Sample 4 thermally aged (300x) ..................................................................... 75 Figure 86: Sample 4 thermally aged (1000x) ................................................................... 75 Figure 87: Sample 6 hydrogen charged (300x)................................................................. 75 Figure 88: Sample 6 hydrogen charged (1000x)............................................................... 75 Figure 89: Sample L1 tested as-received (300x) .............................................................. 76 Figure 90: Sample L1 tested as-received (1000x) ............................................................ 76 Figure 91: Sample L4 thermally aged (300x) ................................................................... 76 Figure 92: Sample L4 thermally aged (1000x) ................................................................. 76 Figure 93: Sample L6 hydrogen charged (300x) .............................................................. 77 Figure 94: Sample L6 hydrogen charged (1000x) ............................................................ 77 Figure 95: Permeation test ln(PH) versus 1/T ................................................................... 80 Figure 96: Austenite phase stability grid .......................................................................... 81 Figure 97: Surface crack experiencing dislocation emission versus crack propagation... 86
ix
List of Abbreviations BCC Body centered cubic COD Crack-opening displacement EDM Electrical discharge machining FCC Face centered cubic GC Gas chromatograph HCP Hexagonal close packed HEDE Hydrogen-enhanced decohesion HELP Hydrogen-enhanced localized plasticity HIE Hydride-induced embrittlement Md Highest temperature for strain-induced martensite Ms Highest temperature for spontaneous martensite formation Ms
σ Highest temperature for stress-assisted martensite PTFE Polytetrafluoroethylene SEM Scanning electron microscope SFE Stacking fault energy SS Stainless steel TEM Transmission electron microscope XRD X-ray diffraction
x
List of Symbols A Exposed area of permeation disk sample b Burgers vector Bmeas Force of magnetic attraction Bref Force of magnetic attraction of reference sample cα’ α’-martensite concentration cα’ref α’-martensite concentration of reference sample cH Local concentration of hydrogen Co Hydrogen-to-metal atomic ratio cS Concentration of hydrogen at the surface CTS Terminal solid solubility CTS,0 Terminal solid solubility in absence of applied stress DH Diffusivity of hydrogen through the metal εf Strain to failure for sub-sized tensile specimens η Hydrogen overpotential Ed Activation energy for diffusion Ep Activation energy for permeation F Applied force Fc Fracture load in hydrogen Fm Resistive force between atoms Fo Fracture load in air γ Number of hydrogen atoms in a metal hydride molecule J Hydrogen flux keff Effective spring constant km Spring constant of tensile test frame ks Spring constant of specimen gauge section L Disk sample thickness Lm Deflection of tensile test frame Mijkl Elastic compliance tensor n Number of hydrogen atoms in a metal hydride molecule nH Moles of hydrogen nN Moles of nitrogen ν Poisson’s ratio P Hydrogen gas pressure PH Permeability of hydrogen through a material Pmax Maximum allowable gas pressure to avoid yielding PN Nitrogen gas pressure Po Permeability at absolute zero Q Amount of solute penetrating per unit area at a given time R Ideal gas constant σij Applied stress tensor σkl Applied stress tensor σUTS Ultimate tensile strength σys 0.2% offset yield strength

xi
σz Local maximum tensile stress normal to the plane of a crack T Temperature t Exposure time θ Coverage of hydrogen on a surface VH Partial molal volume of hydrogen wacc Material strain energy per mole of hydride in absence of applied stress wint Interaction energy per mole of hydride while under applied stress x Depth into sample
1
1.0 Introduction
The issue of hydrogen embrittlement has been prominent in discussions of
welding, material processing, and corrosion for many years. With the potential for using
hydrogen as a fuel, it is natural to question whether hydrogen will have the same
detrimental effect on components incorporated in our personal fuel cells or related
equipment.
Currently, austenitic stainless steel AISI 316 (SS 316) is the predominant material
of construction for high-pressure hydrogen components and tubing, and has recently been
incorporated into the construction of high-pressure hydrogen storage tank liners. A type-
III storage tank consists of a metallic liner fully wrapped in glass or carbon fibres1. The
main function of the fibre is to provide the strength required to contain the pressure.
Tanks with higher storage pressure capacity will typically use a carbon fibre wrap
because glass fibres can be susceptible to stress corrosion cracking. The principal
function of the liner is to prevent escape of the gas, although it will also offer
contribution to the overall strength. On average, metallic liner materials are expected to
sustain about 20% of the load imparted during pressurization1. It is important for the
liner material to have low permeability of hydrogen for containment of the gas, high
toughness for impact resistance, and resistance to corrosion and hydrogen embrittlement,
but would it would be an additional asset to have high strength for additional support
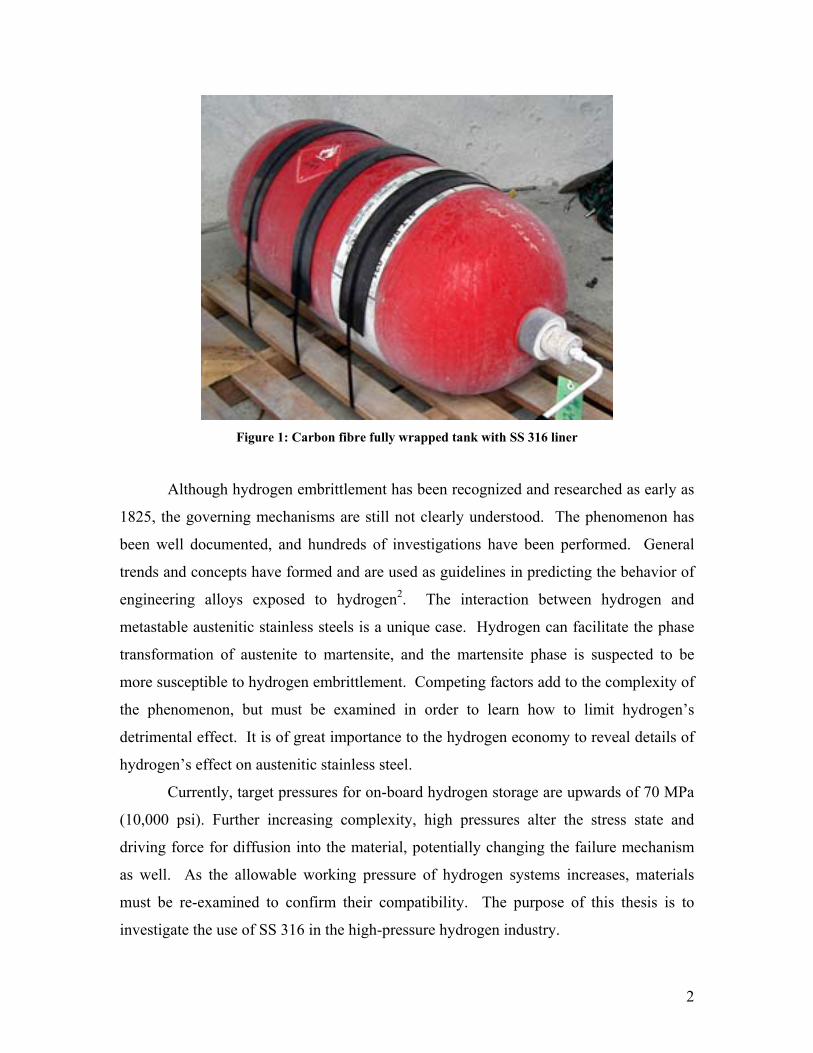
during pressurization. Figure 1 shows an example of a type-III cylinder that incorporates
a SS 316 liner.
2
Figure 1: Carbon fibre fully wrapped tank with SS 316 liner
Although hydrogen embrittlement has been recognized and researched as early as
1825, the governing mechanisms are still not clearly understood. The phenomenon has
been well documented, and hundreds of investigations have been performed. General
trends and concepts have formed and are used as guidelines in predicting the behavior of
engineering alloys exposed to hydrogen2. The interaction between hydrogen and
metastable austenitic stainless steels is a unique case. Hydrogen can facilitate the phase
transformation of austenite to martensite, and the martensite phase is suspected to be
more susceptible to hydrogen embrittlement. Competing factors add to the complexity of
the phenomenon, but must be examined in order to learn how to limit hydrogen’s
detrimental effect. It is of great importance to the hydrogen economy to reveal details of
hydrogen’s effect on austenitic stainless steel.
Currently, target pressures for on-board hydrogen storage are upwards of 70 MPa
(10,000 psi). Further increasing complexity, high pressures alter the stress state and
driving force for diffusion into the material, potentially changing the failure mechanism
as well. As the allowable working pressure of hydrogen systems increases, materials
must be re-examined to confirm their compatibility. The purpose of this thesis is to
investigate the use of SS 316 in the high-pressure hydrogen industry.
3
2.0 Literature Review
Possessing a large internal hydrogen concentration and fluctuating pressures,
metallic hydrogen components and storage cylinders are susceptible to formation of
blisters or cracks on internal surfaces, both indications of hydrogen embrittlement. Such
flaw initiation can be detrimental to the lifetime of a cylinder and, therefore, to the safety
of its user. In order to prevent damage, it is essential to understand how it occurs. In this
section, background will be provided on how hydrogen enters and moves through the
metallic structure. The various mechanisms of embrittlement will be reviewed as well as
the effect of strain rate. Hydrogen’s influence on the austenite phase stability will be
discussed with particular reference to martensite’s role in the embrittlement process.
Providing the relevant research to date will justify the need for the testing and research
described in this master’s thesis.
2.1 Mechanism of Hydrogen Ingress
Hydrogen is absorbed at the metallic surface as atomic hydrogen. The atomic
hydrogen may form due to dissociation of gaseous (molecular) hydrogen at the metal
surface due to reaction of metal hydrides, or may arise due to electrochemical reactions.
The atomic hydrogen is transported by diffusion through the metallic lattice either
interstitially or by dislocation movement2.
The diffusion of hydrogen through lattice sites is primarily governed by a
hydrogen chemical potential gradient. For a given region, this is affected both by the
hydrogen concentration as well as the mechanical and chemical environment. For
example, in regions of tensile hydrostatic stress, there is an increase in free volume so the
chemical potential of interstitial hydrogen is low. Thus, such regions will tend to attract
hydrogen atoms. Similarly, hydrogen may be trapped in the tensile field surrounding a
dislocation and move with the dislocation motion. This generally constitutes a faster
mode of transport and is primarily affected by plastic strain. With regards to hydrogen
embrittlement testing, two methods are generally employed to infuse a material with
hydrogen: electrolytic and gaseous charging.

4
2.1.1 Electrolytic Hydrogen Charging
When a metal is exposed to a hydrogen-containing environment, it is possible for
hydrogen to be adsorbed onto the surface3. When the hydrogen-containing medium is
aqueous, more severe conditions are encountered. This is due to the high fugacity
involved with corrosion reactions3. As a hydrogen atom is adsorbed onto the surface of
the metal, it will either combine with another to form hydrogen gas (equation 1) or it will
be absorbed into the bulk of the material (equation 2)3,4.
Hads + Hads → H2 [1]
Hads → Habs [2]
It is the energetics of a metal’s surface that dictates which of the two reactions
will occur3. The kinetics of the permeation is governed by the nature of the metal,
applied potential, state of the cathodic surface, pH, and chemical composition of the
charging solution5. Generally, the rate of reaction 2 is governed by the coverage of
hydrogen on the steel surface, θ3,5. Chou and Makhlouf3 report that since θ is directly
proportional to the hydrogen overpotential, η, a surface with a higher value of hydrogen
overpotential will have more adsorbed hydrogen atoms, and, thus, more hydrogen
transported into the bulk of the metal.
Applying a current density provides added driving force for the diffusion of
hydrogen. A very large hydrogen concentration is produced at the surface, but not as
large a concentration in the bulk of the material. A similar state of material might be seen
in processes such as electroplating, cathodic protection, acidic pickling, or welding, but
gaseous exposure will provide a different gradient.
2.1.2 Gaseous Hydrogen Charging
In the hydrogen fueled vehicle industry, less severe conditions of hydrogen
ingress will be encountered. This is mostly because much smaller gradients in absorbed
hydrogen concentration will be present. In order to more accurately represent conditions
5
faced by the liner material for on-board storage of compressed hydrogen, test specimens
should be gaseously charged.
Molecular hydrogen cannot enter into the stainless steel components in the
molecular state. In order for hydrogen to be absorbed, the gas molecule, H2, must
dissociate into two hydrogen atoms. This typically occurs due to the reaction of metal
hydrides or from electrochemical reactions6. As reported by H.W. Liu and P.J. Ficalora7,
an energy of 434.2 kJ/mol is required for the dissociation of a hydrogen gas molecule. It
was proposed that the energy requirement may be supplemented at the specimen surface
via a dislocation terminus. From here, the atomic hydrogen can be transported through
the atomic lattice by diffusion or by dislocation movement.
In the case of high-pressure gaseous charging, diffusion is the main method of
transport. Diffusion of hydrogen is driven both by temperature and chemical potential
gradients8-10. Compared to electrolytic charging, gaseous charging provides a reduced
concentration gradient more representative of what would be encountered in service.
2.2 Proposed Mechanisms of Hydrogen Embrittlement
Hydrogen embrittlement is a very complicated process with many underlying
mechanisms. Often, failure will result from a combination of several influences, making
the determination of governing mechanism very difficult. To date, three main
embrittlement mechanisms have been proposed: hydrogen-enhanced decohesion (HEDE),
hydrogen-enhanced localized plasticity (HELP), and hydride-induced embrittlement
(HIE). In the following sections, each mechanism will be reviewed.
2.2.1 Hydrogen-Enhanced Decohesion
Early results from tests dealing with steel temper embrittlement show that there
are chemical interactions of impurities with metallic components11. This reveals that a
transition from ductile to brittle fracture can depend on electrons and their bonding
characteristics. As hydrogen is absorbed at an atomically sharp crack tip, there is a
decrease in electron charge density between metal atoms12,13. It has been claimed that
there exists an electron transfer from the 1s band of hydrogen to the 3d and 4s bands of
6
the metal that decreases the cohesive energy (results are presented for both nickel and
iron)11,14. The final decohesion results from tensile separation of the atoms, which is
planar in nature15. Fracture by the HEDE mechanism is characterized by limited activity
of dislocations12. By performing scanning electron microscopy, this becomes evident by
the appearance of atomically flat fracture surfaces (i.e. the absence of microvoids and
dimples).
Diffusion of hydrogen is influenced both by temperature and chemical potential
gradients8-10. In this case, the chemical potential gradient refers to the force imposed on
the atoms due to a concentration gradient. A lattice expansion caused by the hydrostatic
tensile stress surrounding a crack tip locally reduces the effective hydrogen concentration
and, thus, the chemical potential, resulting in a flux of hydrogen toward it.
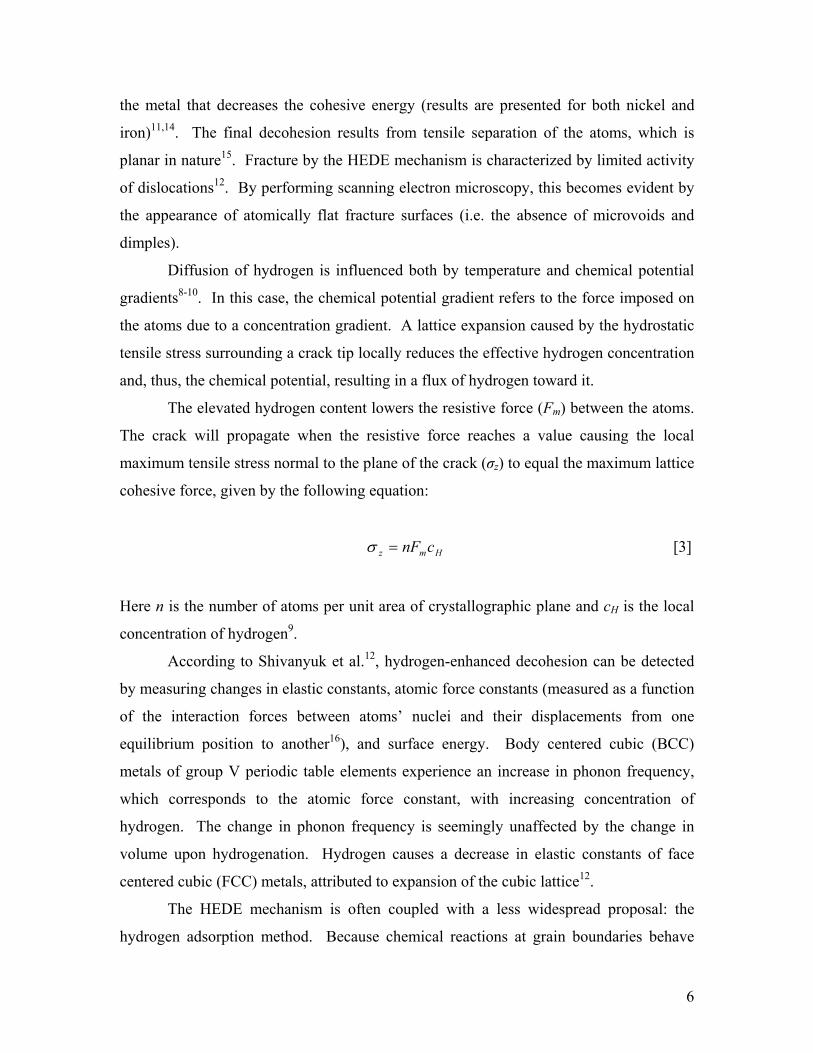
The elevated hydrogen content lowers the resistive force (Fm) between the atoms.
The crack will propagate when the resistive force reaches a value causing the local
maximum tensile stress normal to the plane of the crack (σz) to equal the maximum lattice
cohesive force, given by the following equation:
Hmz cnF=σ [3]
Here n is the number of atoms per unit area of crystallographic plane and cH is the local
concentration of hydrogen9.
According to Shivanyuk et al.12, hydrogen-enhanced decohesion can be detected
by measuring changes in elastic constants, atomic force constants (measured as a function
of the interaction forces between atoms’ nuclei and their displacements from one
equilibrium position to another16), and surface energy. Body centered cubic (BCC)
metals of group V periodic table elements experience an increase in phonon frequency,
which corresponds to the atomic force constant, with increasing concentration of
hydrogen. The change in phonon frequency is seemingly unaffected by the change in
volume upon hydrogenation. Hydrogen causes a decrease in elastic constants of face
centered cubic (FCC) metals, attributed to expansion of the cubic lattice12.
The HEDE mechanism is often coupled with a less widespread proposal: the
hydrogen adsorption method. Because chemical reactions at grain boundaries behave
7
similarly to free surfaces in some respect, the local affinity for hydrogen at grain
boundaries may lower the free energy, thus promoting fracture11,14,17. The segregation of
hydrogen along a developing fracture path can, thus, reduce the cohesive energy,
resulting in a reduction in atomic binding.
2.2.2 Hydrogen-Enhanced Localized Plasticity
The main principal behind the HELP mechanism is that increases in hydrogen
concentration on a local scale can increase dislocation activity in the immediate
vicinity11,15,18,19. As reported by Abraham and Altstetter10, it has been suggested that
absorbed hydrogen at a crack tip will facilitate the injection of dislocations. The increase
in local dislocation activity causes local stress concentration, contributing to failure
initiation at planar defects where hydrogen is not present15. A brittle fracture surface
facilitated by the HELP mechanism will have evidence of slip, dimples, and tear
ridges11,19.
The increase in dislocation activity stems from the affinity of absorbed hydrogen
for dislocations and other defects (e.g. precipitates, interstitial impurities, grain
boundaries). As earlier mentioned, hydrogen is attracted to areas of local hydrostatic
tensile stress, such as those surrounding defects. As two dislocations on the same slip
plane having the same Burgers vector approach one another, their stress fields merge and
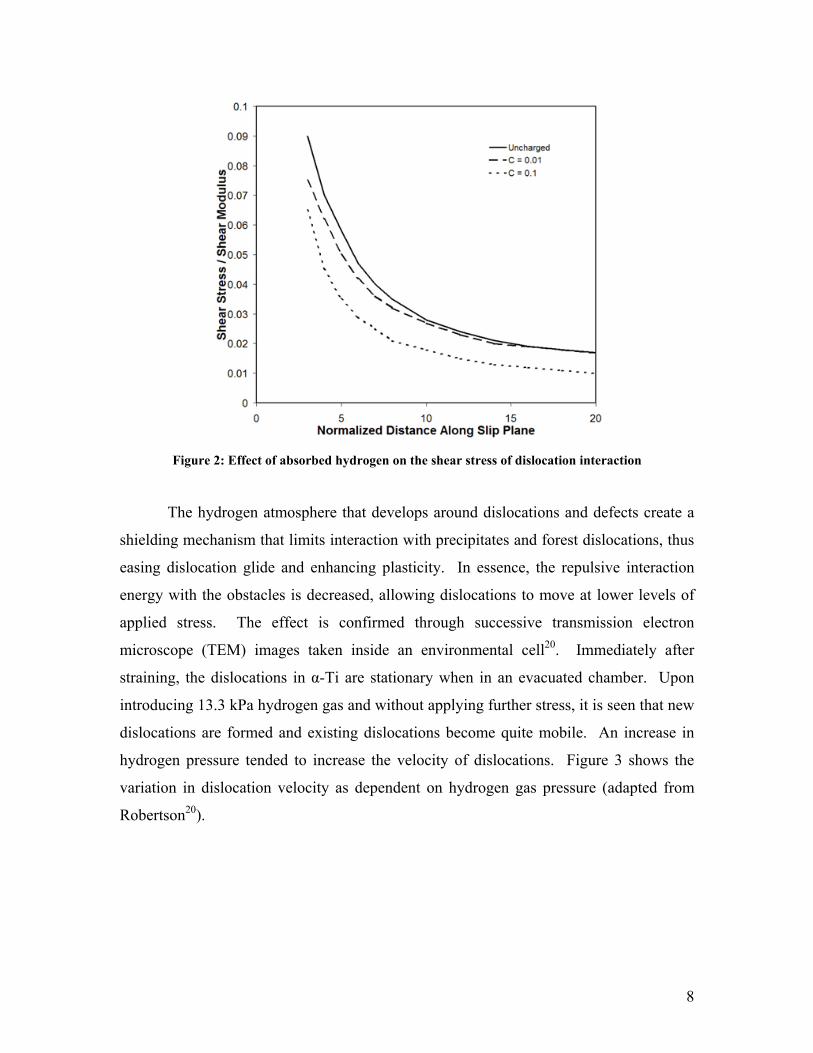
the surrounding hydrogen atmosphere is redistributed. As the hydrogen concentration
increases, there is a decrease in shear stress experienced by one dislocation due to the
other20. The effect is enhanced with increasing hydrogen contents and is graphically
represented in Figure 2 (adapted from Robertson20) with Co as the hydrogen-to-metal
atomic ratio H/M). For edge dislocations separated by three times the Burgers vector, b,
an H/M ratio of 0.01 decreases the separation force by 8% and an H/M ratio of 0.1
decreases the separation force by 21%20.
8
Figure 2: Effect of absorbed hydrogen on the shear stress of dislocation interaction
The hydrogen atmosphere that develops around dislocations and defects create a
shielding mechanism that limits interaction with precipitates and forest dislocations, thus
easing dislocation glide and enhancing plasticity. In essence, the repulsive interaction
energy with the obstacles is decreased, allowing dislocations to move at lower levels of
applied stress. The effect is confirmed through successive transmission electron
microscope (TEM) images taken inside an environmental cell20. Immediately after
straining, the dislocations in α-Ti are stationary when in an evacuated chamber. Upon
introducing 13.3 kPa hydrogen gas and without applying further stress, it is seen that new
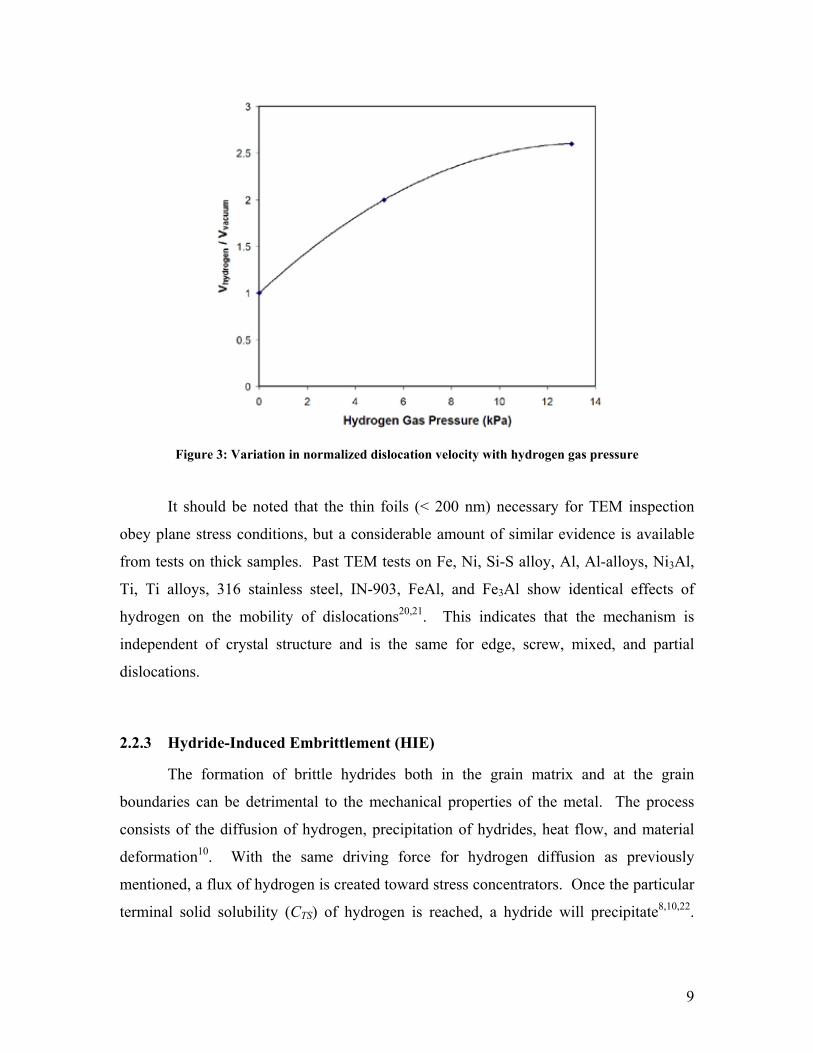
dislocations are formed and existing dislocations become quite mobile. An increase in
hydrogen pressure tended to increase the velocity of dislocations. Figure 3 shows the
variation in dislocation velocity as dependent on hydrogen gas pressure (adapted from
Robertson20).
9
Figure 3: Variation in normalized dislocation velocity with hydrogen gas pressure
It should be noted that the thin foils (< 200 nm) necessary for TEM inspection
obey plane stress conditions, but a considerable amount of similar evidence is available
from tests on thick samples. Past TEM tests on Fe, Ni, Si-S alloy, Al, Al-alloys, Ni3Al,
Ti, Ti alloys, 316 stainless steel, IN-903, FeAl, and Fe3Al show identical effects of
hydrogen on the mobility of dislocations20,21. This indicates that the mechanism is
independent of crystal structure and is the same for edge, screw, mixed, and partial
dislocations.
2.2.3 Hydride-Induced Embrittlement (HIE)
The formation of brittle hydrides both in the grain matrix and at the grain
boundaries can be detrimental to the mechanical properties of the metal. The process
consists of the diffusion of hydrogen, precipitation of hydrides, heat flow, and material
deformation10. With the same driving force for hydrogen diffusion as previously
mentioned, a flux of hydrogen is created toward stress concentrators. Once the particular
terminal solid solubility (CTS) of hydrogen is reached, a hydride will precipitate8,10,22.
10
The terminal solid solubility is dependant also on temperature and applied stress8,10. As
derived by Varias and Massih23, the terminal solid solubility for a system is:
−
+= klijijkl
mnHintaccTSTS M
RTV
RTww
CC σσσ
γ 21
3expexp0, [4]
where CTS,0 is the terminal solid solubility in absence of applied stress, wacc is the material
strain energy per mole of hydride in absence of applied stress, wint is the interaction
energy per mole of hydride while under applied stress, γ is the number of hydrogen atoms
in the metal hydride molecule, R is the ideal gas constant, T is the temperature, VH is the
partial molal volume of hydrogen, Mijkl is the elastic compliance tensor, and σij and σkl are
the applied stress tensors .
Crack propagation is assisted through the repeated formation and cleavage of
hydrides in the stress zone at the crack tip10. A hydride nucleates in an area reaching
terminal solid solubility, and creates an additional stress concentration at its tip. The
stress field between the hydride and crack tips facilitates the growth of the precipitate
toward the crack24.
2.3 Effect of Strain Rate on Hydrogen Embrittlement
All the embrittlement mechanisms discussed above require the presence of
sufficient levels of hydrogen at specific locations. Thus, the embrittlement is limited by
the capacity of the hydrogen atoms to move through the metallic lattice by interstitial
diffusion. As assisted by dislocation transport, diffusion of hydrogen can be accelerated.
Völkl and Wipf25 have summarized a number of studies on diffusion of H in Fe.
Diffusivity values range from 10-7 to 10-11 m2/s at room temperature. For fracture
processes critically dependent on hydrogen diffusion, an increase in the loading rate
signifies less time for hydrogen diffusion and thus less embrittlement.
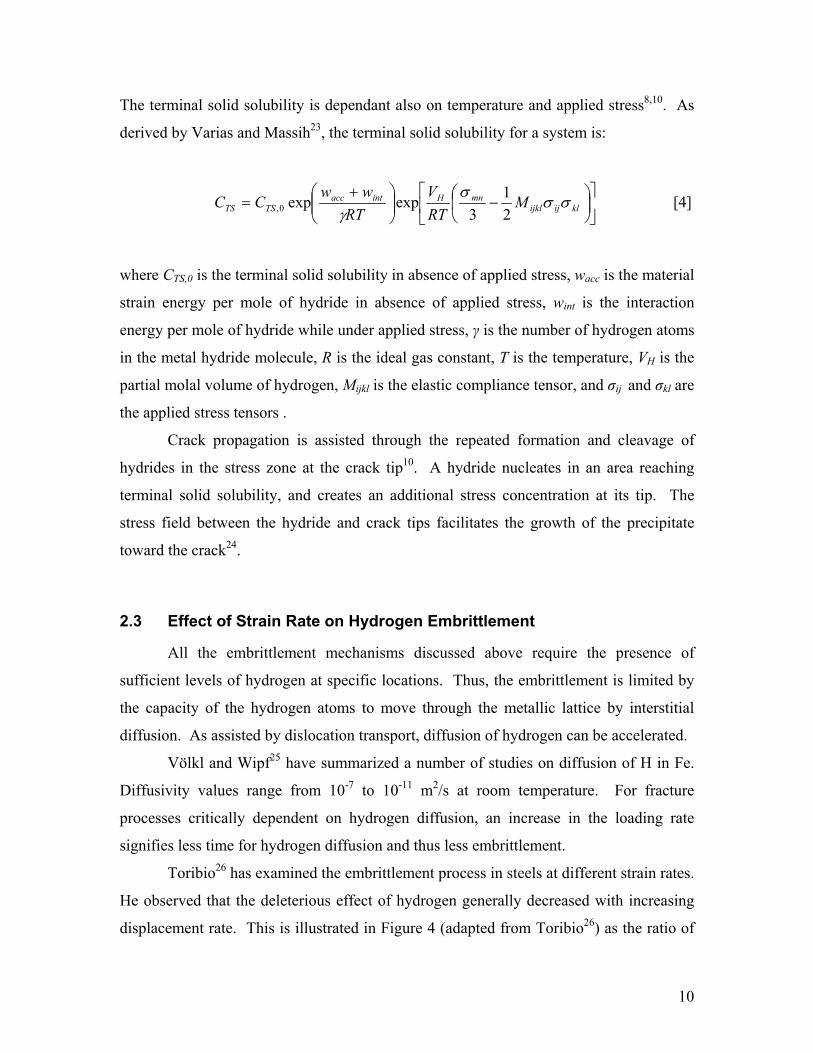
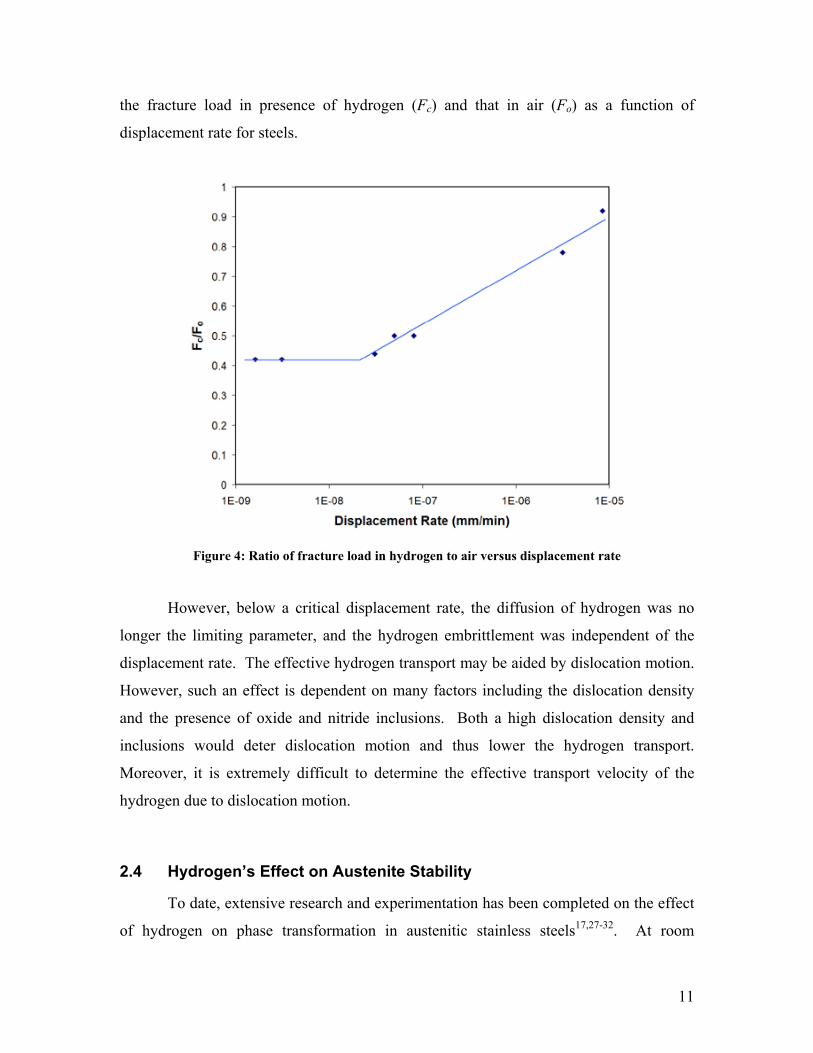
Toribio26 has examined the embrittlement process in steels at different strain rates.
He observed that the deleterious effect of hydrogen generally decreased with increasing
displacement rate. This is illustrated in Figure 4 (adapted from Toribio26) as the ratio of
11
the fracture load in presence of hydrogen (Fc) and that in air (Fo) as a function of
displacement rate for steels.
Figure 4: Ratio of fracture load in hydrogen to air versus displacement rate
However, below a critical displacement rate, the diffusion of hydrogen was no
longer the limiting parameter, and the hydrogen embrittlement was independent of the
displacement rate. The effective hydrogen transport may be aided by dislocation motion.
However, such an effect is dependent on many factors including the dislocation density
and the presence of oxide and nitride inclusions. Both a high dislocation density and
inclusions would deter dislocation motion and thus lower the hydrogen transport.
Moreover, it is extremely difficult to determine the effective transport velocity of the
hydrogen due to dislocation motion.
2.4 Hydrogen’s Effect on Austenite Stability
To date, extensive research and experimentation has been completed on the effect
of hydrogen on phase transformation in austenitic stainless steels17,27-32. At room
12
temperature, SS 316 has a fully austenitic FCC structure, but is metastable. Hydrogen is
said to lower the driving force required for a phase transformation even further. Although
the literature review focuses on austenitic stainless steels, a more direct link to SS 316
will be made.
It has been observed that γ-austenite can be transformed into either hexagonal
close packed (HCP) ε-martensite or BCC α’-martensite under various conditions, and
effects are often enhanced in the presence of hydrogen. In this report, the transformation
from austenite to martensite will first be presented, including an overview of the
influence of temperature, stress, and chemistry. The effects of hydrogen and the current
models to predict austenite stability will be discussed and each will be critically evaluated
and the results of a comparison will suggest the most logical direction for future research.
2.4.1 The Martensite Phase Transformation
A martensitic phase transformation is classified as being diffusionless and
involving coordinated shear33-35. It is usually associated with very large distortions due to
the accompanying volume change. A transformation from FCC to HCP involves an
increase in volume of approximately 1.5-3.5%27. The dilation experienced induces slip
or twinning in the austenite matrix. The martensitic transformation has been proposed to
evolve in any of the following sequences:
γ → ε FCC to HCP
γ → ε → α’ FCC to HCP to BCC
γ → α’ FCC to BCC
The path of martensite formation is said to depend on the stacking fault energy
(SFE). The SFE is a material property that dictates a material’s propensity to form planar
dislocation structures35. As a Shockley partial dislocation, possibly originating from a
pole mechanism36-38, is passed through the {111} plane of the FCC lattice, the regular
stacking sequence of ABCABC is altered to ABABC. The ABAB stacking sequence is
the HCP structure of ε-martensite, so a single stacking fault will nucleate an ε-martensite
13
layer two atoms in thickness. The passage of successive Shockley partial dislocations
(Burgers vector of a/6 <112>) across every other {111} plane will control the martensite
growth29,36-38,40.
Intersecting bands of ε-martensite have been noticed to host nucleation sites of α’-
martensite13,33,36,40-42. The α’ phase forms when a fault on the {111} plane is traversed by
a second with a Burgers vector of a/6 in the < 121 > direction. The volume at the
intersection is BCC, forming a lath or needle of α’-martensite in the <110> direction33,36.
At the conjunction, the α’-martensite is only a few nanometers in diameter and is
surrounded by the HCP ε-martensite, rather than the FCC γ-austenite matrix33,40.
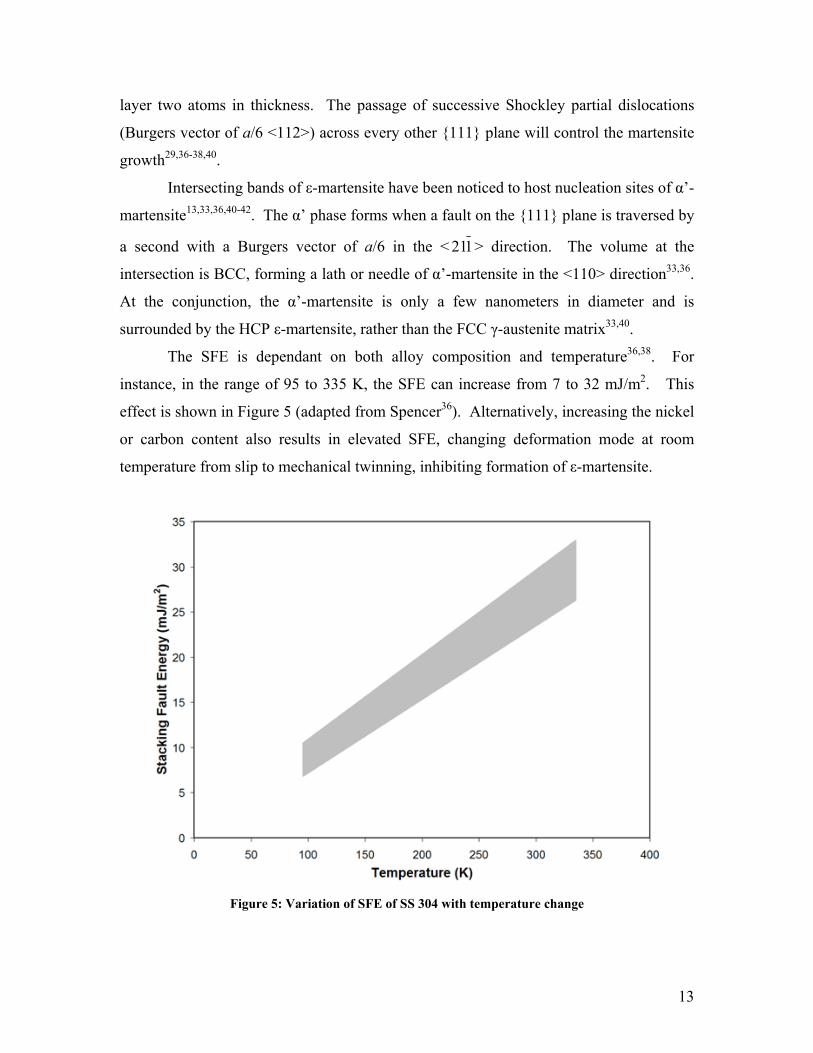
The SFE is dependant on both alloy composition and temperature36,38. For
instance, in the range of 95 to 335 K, the SFE can increase from 7 to 32 mJ/m2. This
effect is shown in Figure 5 (adapted from Spencer36). Alternatively, increasing the nickel
or carbon content also results in elevated SFE, changing deformation mode at room
temperature from slip to mechanical twinning, inhibiting formation of ε-martensite.
Figure 5: Variation of SFE of SS 304 with temperature change
14
2.4.2 Phase Transformation from Hydrogen Charging
Phase transformation can occur spontaneously upon charging a sample with
hydrogen27-29,32,34,43. This is more frequently seen when performing cathodic charging (as
opposed to loading via diffusion during gaseous hydrogen exposure) because relatively
large surface concentrations of hydrogen can be obtained. By supersaturating the surface
with hydrogen, a large compressive stress is developed over a thin surface layer32,34.
Combined with the effect of the small lattice diffusivity of austenite, the result is a large
concentration gradient through the thickness27,29,32. Derived from Fick’s second law, an
expression is developed for the concentration of hydrogen (cH) through the thickness of
the sample:
=
tDxerfccc
HSH 2
[5]
where cs is the concentration of hydrogen at the surface, x is the depth into the sample,
DH is the diffusivity coefficient, and t is the duration of exposure. According to Hwang,
Chiu, and Johnson, the “solubility is given by the ratio of permeability to diffusivity”44.
By applying Sievert’s law to the equilibrium of hydrogen at the surface, the solubility is
shown to be dependent on the square root of hydrogen gas pressure. The surface
concentration can then be expressed as:
PDPc
H
HS = [6]
where P is hydrogen pressure and PH is the permeability of hydrogen through SS 316.
Yang and Luo report a transformation from 100% γ-austenite to a combined 70%
of ε-martensite and α’-martensite after a 16 hour charging period (measured using XRD,
confirmed with optical microscopy)27. From tests performed on SS 304 samples, it was
determined that a current density of 0.2 mA/cm2 is for the formation of martensite.
Below this threshold current density, the hydrogen concentrations reached are not
sufficient to lower the chemical free energy of the system.
15
Using Rietveld x-ray diffraction (XRD) analysis, Sugiyama et al. report a
decrease in γ-austenite coinciding with an increase in both ε-martensite and α’-
martensite31. Similar XRD techniques have shown a noted increase in lattice parameter
of the γ-austenite phase of stainless steel 310 with continued hydrogenation4. The
expansion of the austenite lattice upon hydrogenation can result in high multiaxial
compressive stresses at the surface and tension beneath30,31. As ample experimentation
has shown9,29,33,41,45-47, the transformation from austenite to martensite can be strain-
induced or stress-assisted. With the volume change experienced, both the lattice strain
and the internal stress state (in addition to the lack of constraint at the surface) lowers the
free energy for martensite formation, thus facilitating transformation30.
During room temperature ageing of hydrogen charged specimens, hydrogen is
permitted to diffuse out of the crystal lattice. Just as before, the surface concentration
changes more rapidly than the bulk material (due to small diffusivity coefficient),
creating a severe gradient. In the outgassing process, hydrogen leaves the ε-martensite
near the surface, decreasing the lattice parameter of cubic cell and again changing the
internal stress state of the material27,30,31. The high tensile stresses formed are said to
assist the transformation of ε-martensite to both γ-austenite and α’-martensite27,30,31,34.
2.4.3 Change in Ms and Md Temperatures
Another way in which hydrogen effects the stability of the austenite phase is by
raising the maximum temperature at which thermal martensite will form (Ms) and the
highest temperature for martensite induced by plastic deformation (Md)27-30,34. With a
significant enough increase in Ms, martensite can become the stable phase at room
temperature. Between the Ms and Md is the Msσ temperature. Up to the Ms
σ temperature,
an applied stress below the elastic limit may supplement sufficient energy for a
transformation to occur36,40,42. The apparent “yielding” occurs due to the phase
transformation. The effect is deemed “stress-assisted” nucleation. Above Msσ, elastic
stress still contributes chemical driving force, but not enough to supplement a
spontaneous transformation. Even stress up to the elastic limit will be insufficient to
induce transformation; therefore, yielding occurs due to the regular slip processes. In this
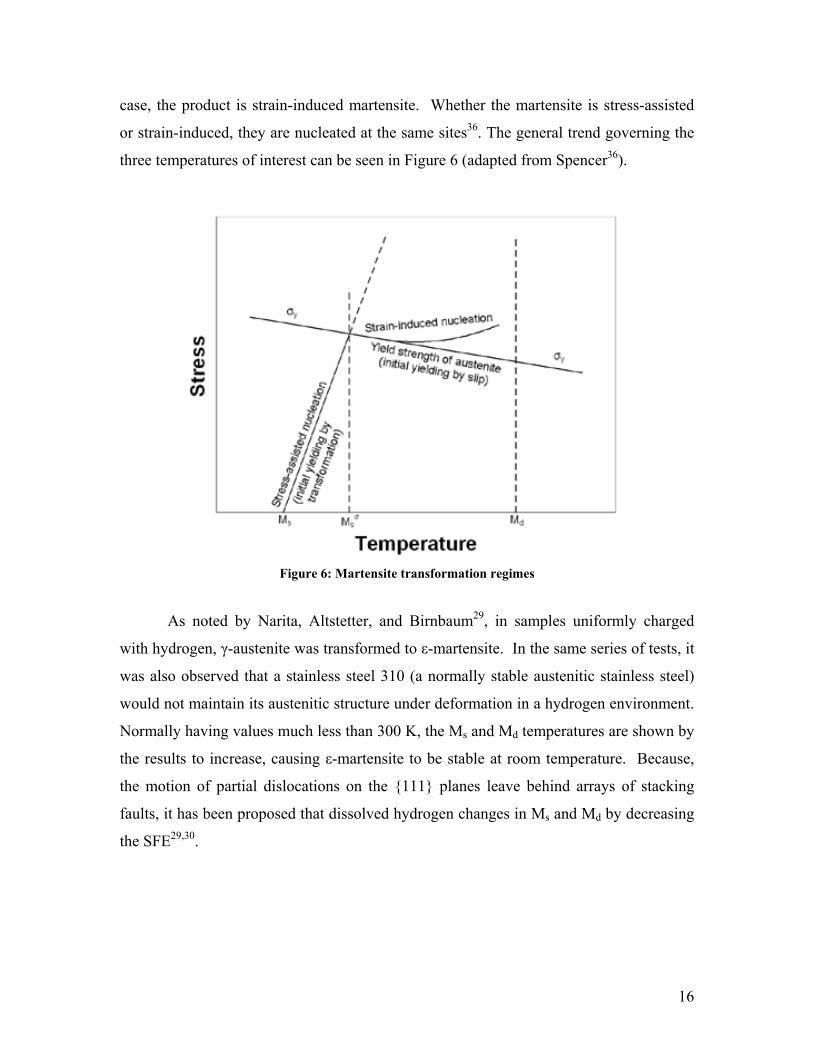
16
case, the product is strain-induced martensite. Whether the martensite is stress-assisted
or strain-induced, they are nucleated at the same sites36. The general trend governing the
three temperatures of interest can be seen in Figure 6 (adapted from Spencer36).
Figure 6: Martensite transformation regimes
As noted by Narita, Altstetter, and Birnbaum29, in samples uniformly charged
with hydrogen, γ-austenite was transformed to ε-martensite. In the same series of tests, it
was also observed that a stainless steel 310 (a normally stable austenitic stainless steel)
would not maintain its austenitic structure under deformation in a hydrogen environment.
Normally having values much less than 300 K, the Ms and Md temperatures are shown by
the results to increase, causing ε-martensite to be stable at room temperature. Because,
the motion of partial dislocations on the {111} planes leave behind arrays of stacking
faults, it has been proposed that dissolved hydrogen changes in Ms and Md by decreasing
the SFE29,30.
17
2.4.4 Decrease in Stacking Fault Energy
The SFE of an alloy has a significant influence on its properties because of its
dependence on temperature and composition38. Properties such as strength, toughness,
and fracture are dictated by the prominent role of the SFE in slip mode, deformation
twinning, and phase transformation48.
Resulting from the relationship between material characteristics and SFE,
numerous attempts have been made at modelling changes in stacking fault energy. A
thermodynamically based approach was employed by authors of several papers38,48-50.
Since stacking faults are nucleation sites for the martensite transformation, they supposed
that the SFE will equal the Gibbs energy required to create a platelet of ε-martensite two
atomic layers thick. As an alternate model, other researchers claim that the decrease in
SFE is due to the recombination of hydrogen atoms occupying neighboring interstitial
lattice sites17,29,32. It is believed that the binding energy released during the formation of
a hydrogen pair is equal to the decrease in SFE. While both models are supported by
reasonable conclusions from particular test results, neither is completely accepted by the
community of embrittlement researchers.
Several different testing methods have been employed to show a decrease in SFE
due to the presence of solute hydrogen17,27. Because each stacking fault is, in essence, a
nucleation of HCP ε-martensite, a shift in the energy required to form the fault will
unavoidably change the metal’s inclination to phase transformation. As reported by
Hermida and Roviglione, an unstable austenitic stainless steel 304 showed a 37%
decrease in SFE in the presence of 274 ppm hydrogen at room temperature17. As studied
by Pontini and Hermida, there occurs a significant drop in SFE of 304 austenitic stainless
steel cathodically charged with hydrogen32.
Using XRD and a transmission electron microscope, the SFE was quantified and
related to hydrogen content prior to martensite transformation. A plausible cause for the
phenomenon is from the electronic effect of the formation of hydrogen pairs17. Further
Rietveld analysis has been performed to confirm the presence of hydrogen in octahedral
sites in 304 and 310 austenitic steels30. From calculations of binding energy for H-H pair
formation in a faulted zone, it has been suggested that the pair formation is most likely to
occur along directions connecting octahedral interstices of HCP stacking sequences
18
(normal to {111} planes). Slip on the {111} plane causes hydrogen in the octahedral
interstices of austenite to become close to those of HCP martensite17. Thus, in order to
predict the formation of martensite, a model must be developed to estimate changes in
stacking fault energy.
2.5 Martensite’s Role in Hydrogen Embrittlement
Although the formation of martensite in austenitic stainless steels is believed to be
a route to hydrogen embrittlement, research and experimentation has yet to confirm its
role in the process. Some hypotheses claim that martensite formation is the sole
contributor to the embrittlement, some testify it is a partial contributor, and some say it
plays no role at all2,8,9,12-15. All agree that martensite is often present at the fracture
surface, but to date, very little work has been done to verify martensite’s role, or lack
thereof, in hydrogen assisted fracture.
2.5.1 Opposing Arguments
The main argument against martensite’s role in hydrogen embrittlement is that the
original theory was based on the embrittled fracture surface coinciding with the (111)
habit plane of BCC martensite12-15. Some researchers state that this is a coincidence
rather than the cause because the role of ε-martensite has yet to be proven12. As reported
by Shivanyuk, Foct, and Gavriljuk12, (111) is also a slip plane of the FCC crystal
structure, which is an important factor when considering the FCC γ-austenite matrix. The
same paper also mentioned that high nitrogen austenitic stainless steels also experience
slip band cleavage-like cracking along (111) without the presence of any second phase.
Han, He, Fukuyama, and Yokogawa13 present tensile test results from both
hydrogen environment and cathodic charging of a range of austenitic stainless steels. It
was shown that although the stable grade 310 was embrittled by severe cathodic
hydrogen charging, it remained unaffected by a gaseous hydrogen environment.
Unstable and metastable grades 304 and 316, however, displayed signs of embrittlement
in all cases. It was then proposed that strain-induced martensite is not responsible for the
19
embrittlement of the stable grade of austenitic stainless steel because it was not formed13.
The embrittlement was claimed to be due to its low stacking fault energy.
Tensile tests performed by Han et al.13 show the effect of hydrogen on the
properties of SS 304. Tests were performed at 80, 220, and 295 K in both helium and
hydrogen atmospheres to produce varying amounts of strain-induced martensite. As
indicated by the slope of the stress-strain curve, hydrogen was not shown to enhance the
formation of martensite as both the hydrogen and helium curves share the same work
hardening rates. With decreasing temperature, a higher degree of martensite was formed.
The point of interest here is that hydrogen seemed to cause premature failure in the
samples forming the least amount of martensite.
Another concept investigates the cause of embrittlement using silicon as an
alloying element to compare altered properties of austenitic stainless steels12,15. The
intent was to use silicon to decrease the stacking fault energy of the γ-austenite phase,
thus promoting the formation of ε-martensite. Comparing XRD patterns of a Cr25Ni20
to a Cr25Ni20Si3 alloy (SS 310) show that more martensite was formed upon charging
the alloy containing silicon additions. Due to the additional alloying, the material
experienced an increase in ductility, suggesting that ε-martensite does not have a
deleterious effect on the integrity of the steel. The ε-martensite plates are claimed to
strengthen the material by acting as obstacles for dislocation slip12.
2.5.2 Supporting Arguments
Two alternate mechanisms of hydrogen embrittlement were compared by Han et
al.13: hydrogen embrittlement due to strain-induced martensite versus the presence of
carbides. At grain boundaries, chromium carbides precipitate, forming a zone depleted of
chromium and carbon. Hydrogen is accumulated and trapped at the precipitate and
intergranular fracture results13. Strain-induced ε- and α’-martensite are also found along
the grain boundaries, indicating that they are preferentially formed in chromium and
carbon depleted zones. Because both occur simultaneously along grain boundaries, it is
difficult to distinguish whether intergranular cracking is the result of one or the other.
20
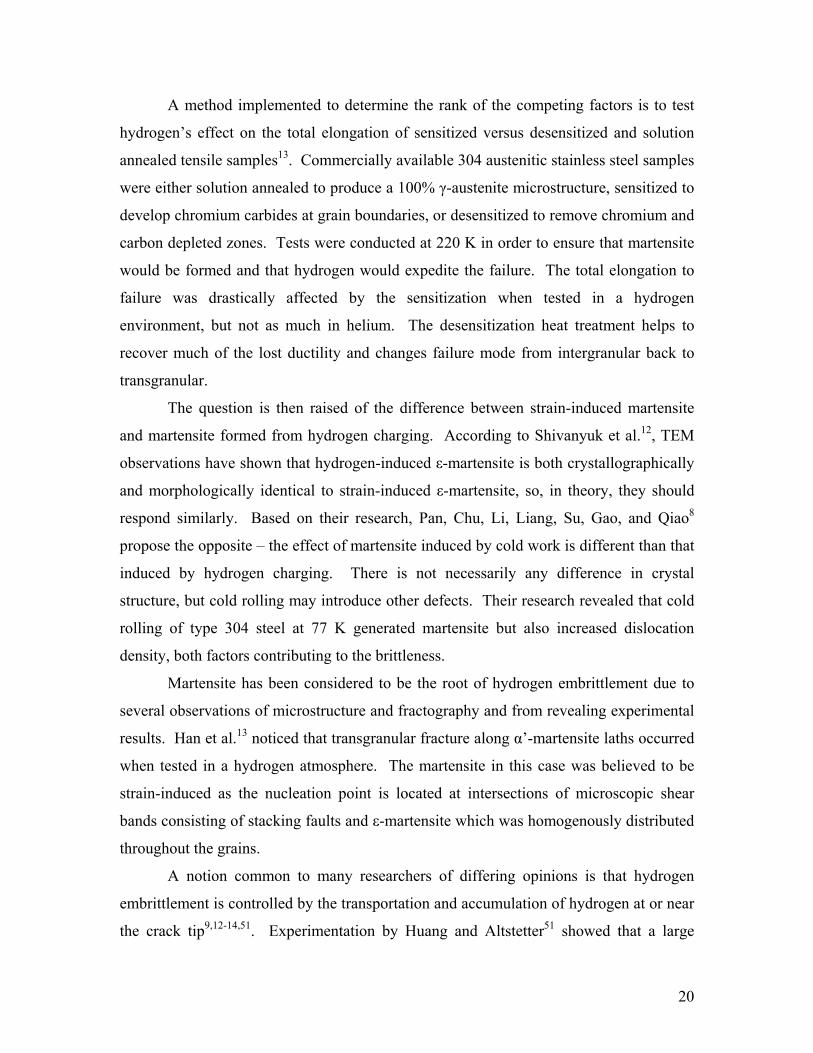
A method implemented to determine the rank of the competing factors is to test
hydrogen’s effect on the total elongation of sensitized versus desensitized and solution
annealed tensile samples13. Commercially available 304 austenitic stainless steel samples
were either solution annealed to produce a 100% γ-austenite microstructure, sensitized to
develop chromium carbides at grain boundaries, or desensitized to remove chromium and
carbon depleted zones. Tests were conducted at 220 K in order to ensure that martensite
would be formed and that hydrogen would expedite the failure. The total elongation to
failure was drastically affected by the sensitization when tested in a hydrogen
environment, but not as much in helium. The desensitization heat treatment helps to
recover much of the lost ductility and changes failure mode from intergranular back to
transgranular.
The question is then raised of the difference between strain-induced martensite
and martensite formed from hydrogen charging. According to Shivanyuk et al.12, TEM
observations have shown that hydrogen-induced ε-martensite is both crystallographically
and morphologically identical to strain-induced ε-martensite, so, in theory, they should
respond similarly. Based on their research, Pan, Chu, Li, Liang, Su, Gao, and Qiao8
propose the opposite – the effect of martensite induced by cold work is different than that
induced by hydrogen charging. There is not necessarily any difference in crystal
structure, but cold rolling may introduce other defects. Their research revealed that cold
rolling of type 304 steel at 77 K generated martensite but also increased dislocation
density, both factors contributing to the brittleness.
Martensite has been considered to be the root of hydrogen embrittlement due to
several observations of microstructure and fractography and from revealing experimental
results. Han et al.13 noticed that transgranular fracture along α’-martensite laths occurred
when tested in a hydrogen atmosphere. The martensite in this case was believed to be
strain-induced as the nucleation point is located at intersections of microscopic shear
bands consisting of stacking faults and ε-martensite which was homogenously distributed
throughout the grains.
A notion common to many researchers of differing opinions is that hydrogen
embrittlement is controlled by the transportation and accumulation of hydrogen at or near
the crack tip9,12-14,51. Experimentation by Huang and Altstetter51 showed that a large
21
concentration of α’ distributed throughout the bulk of a specimen facilitated the
distribution of hydrogen in the specimen. Because crack propagation is governed by
hydrogen penetration of the metal by diffusion, it really becomes a function of
temperature, chemical potential, and microstructure13,14. Strain-induced α’-martensite has
higher diffusion and permeation coefficients than both ε-martensite and γ-austenite,
giving it the potential to act as a path for hydrogen transportation to the triaxial stress
field ahead of the crack tip2,13,52. This phenomenon was confirmed through
measurements of diffusivity and permeability of deformed unstable austenitic stainless
steels9. In type 301 stainless steel, it was shown that increased deformation caused
elevations in diffusivity and permeability. By comparing to test results of a stable
austenitic sample (type 310), it was confirmed that the change in properties was a
function of martensite content rather than the deformation9. Also shown by Perng and
Alstetter9 was that γ-austenite could dissolve much more hydrogen than α’-martensite.
The same increase in deformation (that is, the same increase in α’-martensite content)
produced a considerable decrease in hydrogen solubility. Herms, Olive, and Puiggali2
and Chêne, Aucouturier, Arnould-Laurent, Tison, and Fidelle52 agree that the high
solubility of hydrogen in face centered cubic structures, such as austenite, contributes to
its resistance to hydrogen embrittlement.
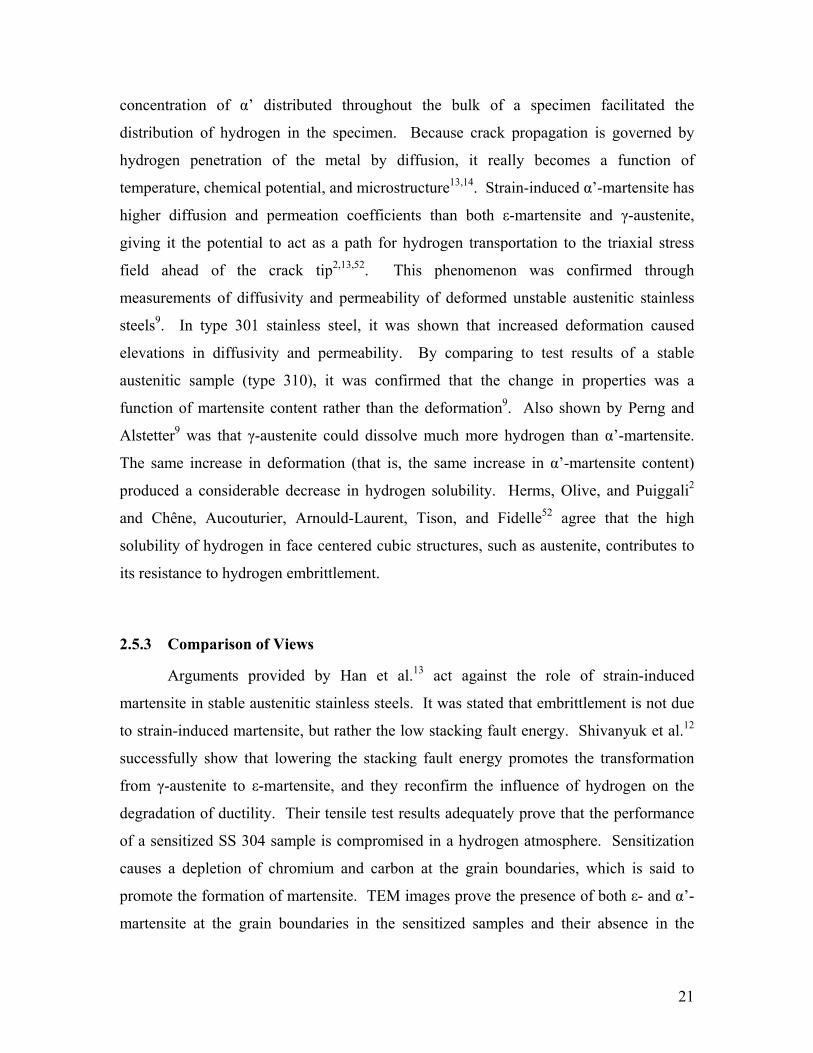
2.5.3 Comparison of Views
Arguments provided by Han et al.13 act against the role of strain-induced
martensite in stable austenitic stainless steels. It was stated that embrittlement is not due
to strain-induced martensite, but rather the low stacking fault energy. Shivanyuk et al.12
successfully show that lowering the stacking fault energy promotes the transformation
from γ-austenite to ε-martensite, and they reconfirm the influence of hydrogen on the
degradation of ductility. Their tensile test results adequately prove that the performance
of a sensitized SS 304 sample is compromised in a hydrogen atmosphere. Sensitization
causes a depletion of chromium and carbon at the grain boundaries, which is said to
promote the formation of martensite. TEM images prove the presence of both ε- and α’-
martensite at the grain boundaries in the sensitized samples and their absence in the
22
desensitized and solution annealed samples. Because the sensitized material contained
carbides and martensite at the grain boundaries and the desensitized material had
carbides, but no martensite at the grain boundaries, it is assumed that the transition from
ductile to brittle is due to the presence of martensite.
Huang and Altstetter51 claim that martensite formation is not a necessary
condition for hydrogen embrittlement, but it will aide in the transport of hydrogen
through the metallic lattice. This means that an evenly distributed martensite
concentration will help to evenly distribute dissolved hydrogen. On the other hand, if
martensite formed locally at the crack tip, a local concentration of hydrogen would be
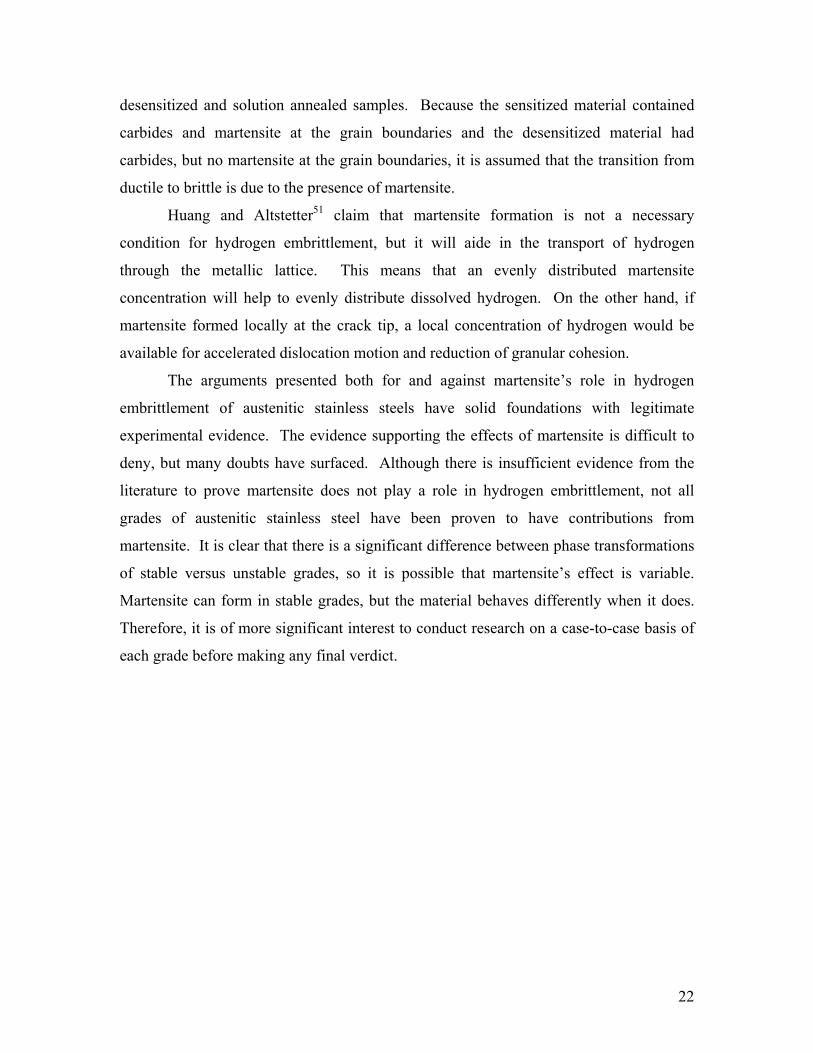
available for accelerated dislocation motion and reduction of granular cohesion. The arguments presented both for and against martensite’s role in hydrogen
embrittlement of austenitic stainless steels have solid foundations with legitimate
experimental evidence. The evidence supporting the effects of martensite is difficult to
deny, but many doubts have surfaced. Although there is insufficient evidence from the
literature to prove martensite does not play a role in hydrogen embrittlement, not all
grades of austenitic stainless steel have been proven to have contributions from
martensite. It is clear that there is a significant difference between phase transformations
of stable versus unstable grades, so it is possible that martensite’s effect is variable.
Martensite can form in stable grades, but the material behaves differently when it does.
Therefore, it is of more significant interest to conduct research on a case-to-case basis of
each grade before making any final verdict.
23
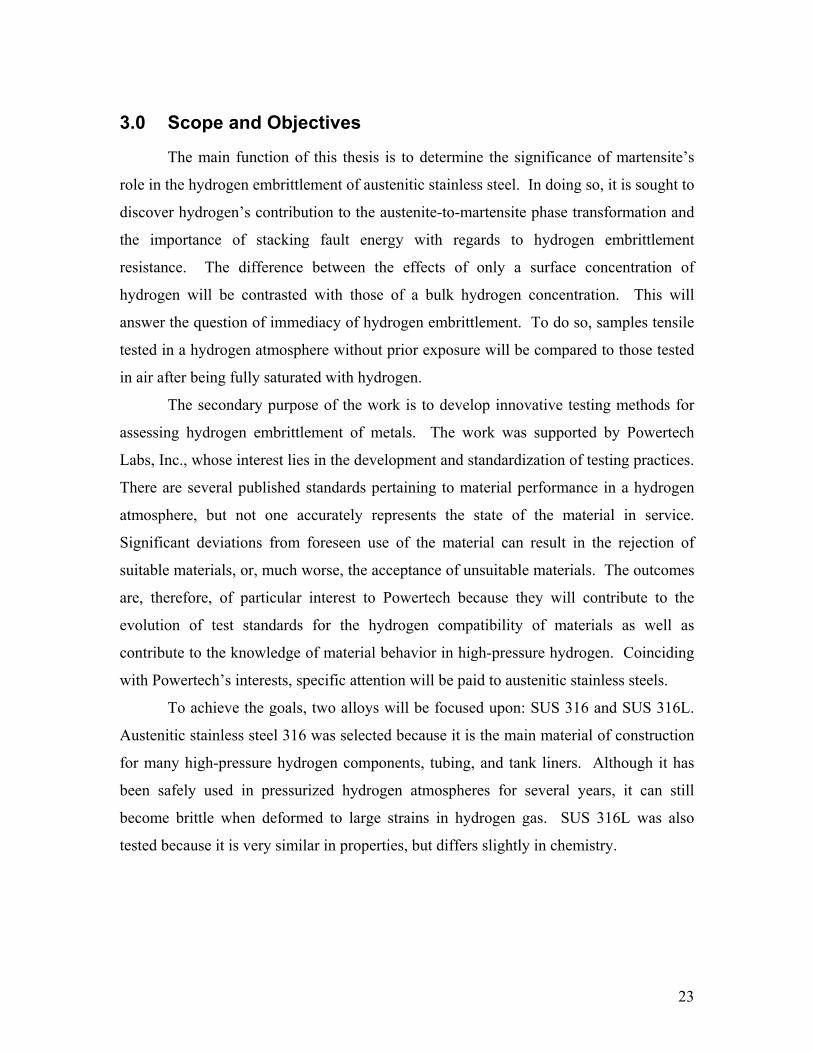
3.0 Scope and Objectives
The main function of this thesis is to determine the significance of martensite’s
role in the hydrogen embrittlement of austenitic stainless steel. In doing so, it is sought to
discover hydrogen’s contribution to the austenite-to-martensite phase transformation and
the importance of stacking fault energy with regards to hydrogen embrittlement
resistance. The difference between the effects of only a surface concentration of
hydrogen will be contrasted with those of a bulk hydrogen concentration. This will
answer the question of immediacy of hydrogen embrittlement. To do so, samples tensile
tested in a hydrogen atmosphere without prior exposure will be compared to those tested
in air after being fully saturated with hydrogen.
The secondary purpose of the work is to develop innovative testing methods for
assessing hydrogen embrittlement of metals. The work was supported by Powertech
Labs, Inc., whose interest lies in the development and standardization of testing practices.
There are several published standards pertaining to material performance in a hydrogen
atmosphere, but not one accurately represents the state of the material in service.
Significant deviations from foreseen use of the material can result in the rejection of
suitable materials, or, much worse, the acceptance of unsuitable materials. The outcomes
are, therefore, of particular interest to Powertech because they will contribute to the
evolution of test standards for the hydrogen compatibility of materials as well as
contribute to the knowledge of material behavior in high-pressure hydrogen. Coinciding
with Powertech’s interests, specific attention will be paid to austenitic stainless steels.
To achieve the goals, two alloys will be focused upon: SUS 316 and SUS 316L.
Austenitic stainless steel 316 was selected because it is the main material of construction
for many high-pressure hydrogen components, tubing, and tank liners. Although it has
been safely used in pressurized hydrogen atmospheres for several years, it can still
become brittle when deformed to large strains in hydrogen gas. SUS 316L was also
tested because it is very similar in properties, but differs slightly in chemistry.
24
4.0 Experimental Design and Development
In order to achieve the objectives of this thesis, a series of experiments were
designed to thoroughly examine the behavior of the material. Since the principal function
of this thesis is to develop new experimental techniques, not only will the methodology
be discussed, but the supporting rationale will also be presented with attention to how and
why the tests were developed. The following section describes the materials tested and a
detailed procedure of tests performed, including discussions of calculations supporting
the designs, setup, and apparatus involved.
4.1 Materials Tested
Stainless steels SUS 316 and 316L were selected as test materials because they
are both used in the high-pressure hydrogen industry and they represent varying degrees
of austenite stability. Powertech Labs supplied the materials, as 316 and 316L were the
focus of an ongoing study and the work conducted in this thesis was of particular interest.
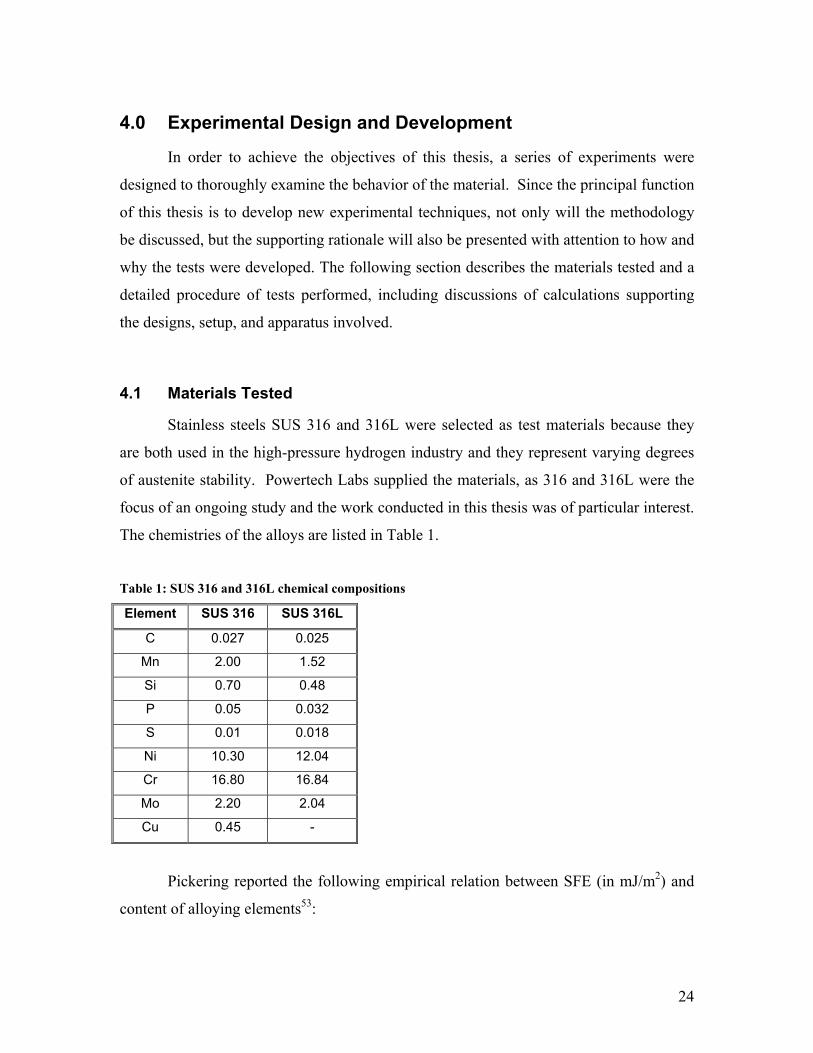
The chemistries of the alloys are listed in Table 1.
Table 1: SUS 316 and 316L chemical compositions
Element SUS 316 SUS 316L
C 0.027 0.025
Mn 2.00 1.52
Si 0.70 0.48
P 0.05 0.032
S 0.01 0.018
Ni 10.30 12.04
Cr 16.80 16.84
Mo 2.20 2.04
Cu 0.45 -
Pickering reported the following empirical relation between SFE (in mJ/m2) and
content of alloying elements53:
25
SFE = 25.7+2(%Ni)+410(%C)–0.9(%Cr)–77(%N)–13(%Si)–1.2(%Mn) [7]
Here, it is seen that higher nickel content increases its stacking fault energy, and thus its
phase stability. According to equation 7, SUS 316 has a SFE of 30.8 mJ/m2 and 316L
has a SFE of 36.8 mJ/m2. Therefore, SUS 316L is meant to demonstrate a higher
resistance to phase transformation for a basis of comparison. Conclusions will be drawn
on the importance of phase stability with regards to hydrogen embrittlement.
4.2 Hydrogen Environment Tensile Tests
In order to test the effect of hydrogen acting at the surface of the material,
cylindrical tensile samples were pulled in uniaxial tension within various pressures of
gaseous hydrogen atmospheres. Assuming a local equilibrium of hydrogen will exist
directly at the surface, its concentration is not a function of time (it depends only on
temperature and pressure). Therefore, by performing tensile tests in a gaseous hydrogen
environment, the immediate effect of hydrogen can be established.
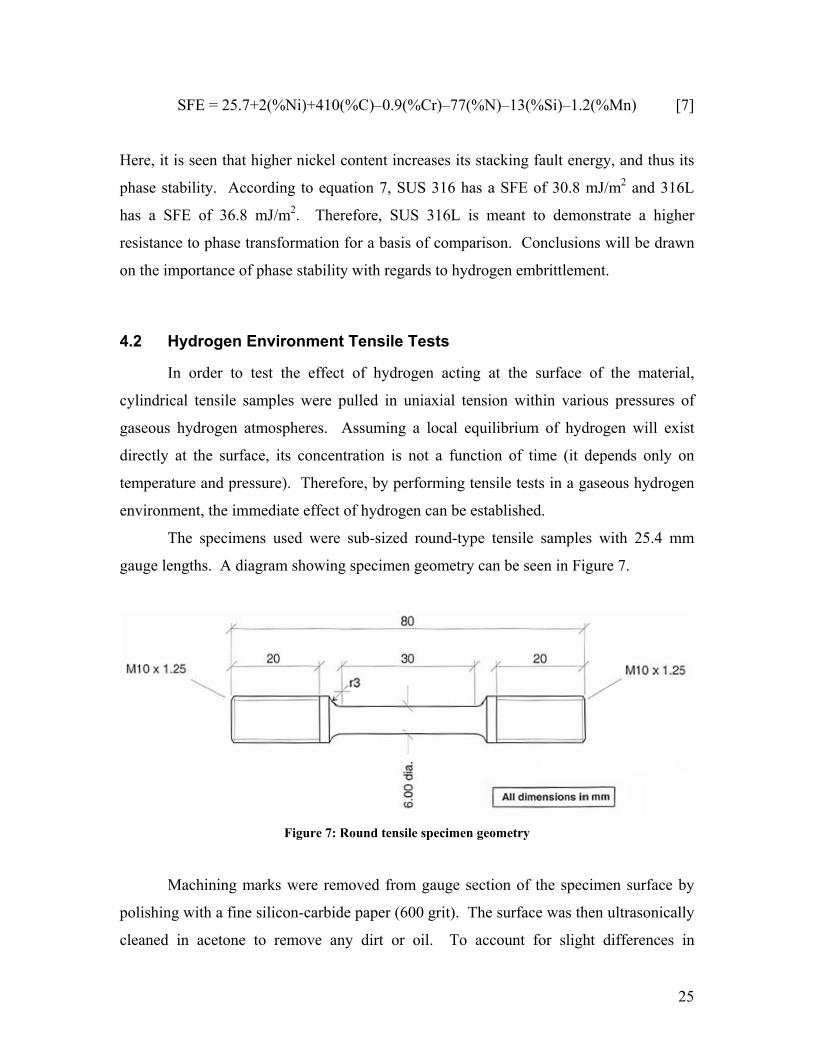
The specimens used were sub-sized round-type tensile samples with 25.4 mm
gauge lengths. A diagram showing specimen geometry can be seen in Figure 7.
Figure 7: Round tensile specimen geometry
Machining marks were removed from gauge section of the specimen surface by
polishing with a fine silicon-carbide paper (600 grit). The surface was then ultrasonically
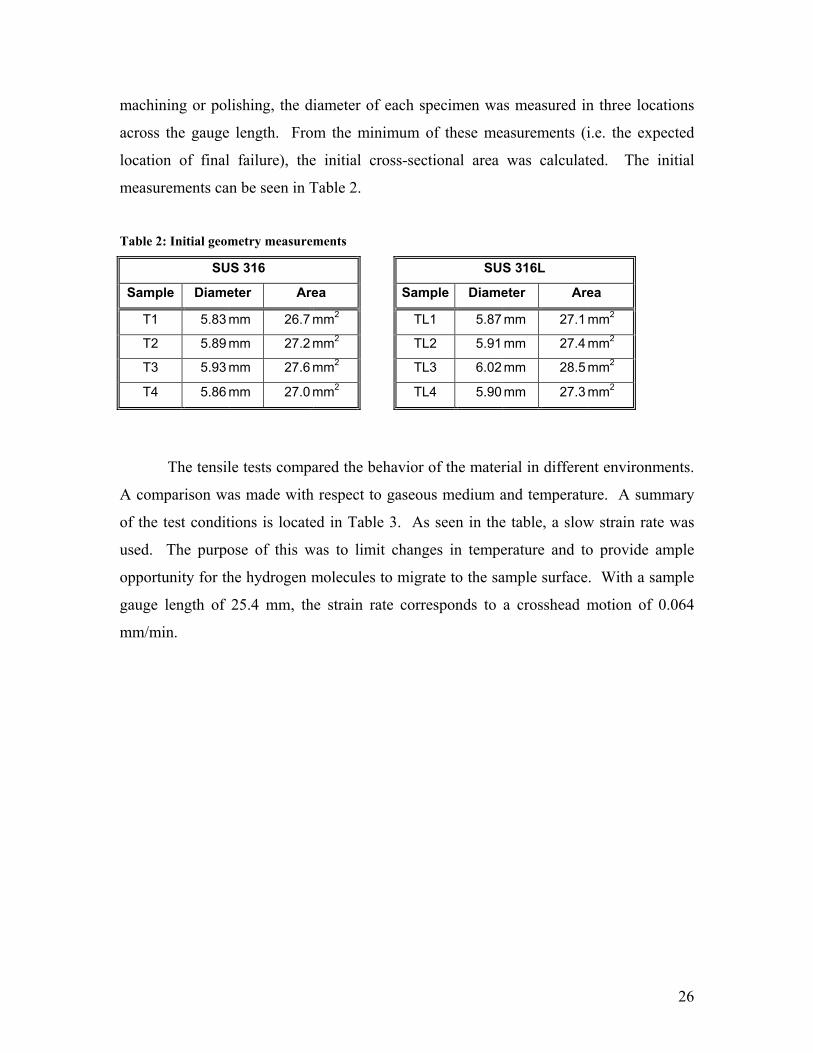
cleaned in acetone to remove any dirt or oil. To account for slight differences in
26
machining or polishing, the diameter of each specimen was measured in three locations
across the gauge length. From the minimum of these measurements (i.e. the expected
location of final failure), the initial cross-sectional area was calculated. The initial
measurements can be seen in Table 2.
Table 2: Initial geometry measurements
SUS 316 SUS 316L
Sample Diameter Area Sample Diameter Area
T1 5.83 mm 26.7 mm2 TL1 5.87 mm 27.1 mm2
T2 5.89 mm 27.2 mm2 TL2 5.91 mm 27.4 mm2
T3 5.93 mm 27.6 mm2 TL3 6.02 mm 28.5 mm2
T4 5.86 mm 27.0 mm2 TL4 5.90 mm 27.3 mm2
The tensile tests compared the behavior of the material in different environments.
A comparison was made with respect to gaseous medium and temperature. A summary
of the test conditions is located in Table 3. As seen in the table, a slow strain rate was
used. The purpose of this was to limit changes in temperature and to provide ample
opportunity for the hydrogen molecules to migrate to the sample surface. With a sample
gauge length of 25.4 mm, the strain rate corresponds to a crosshead motion of 0.064
mm/min.
27
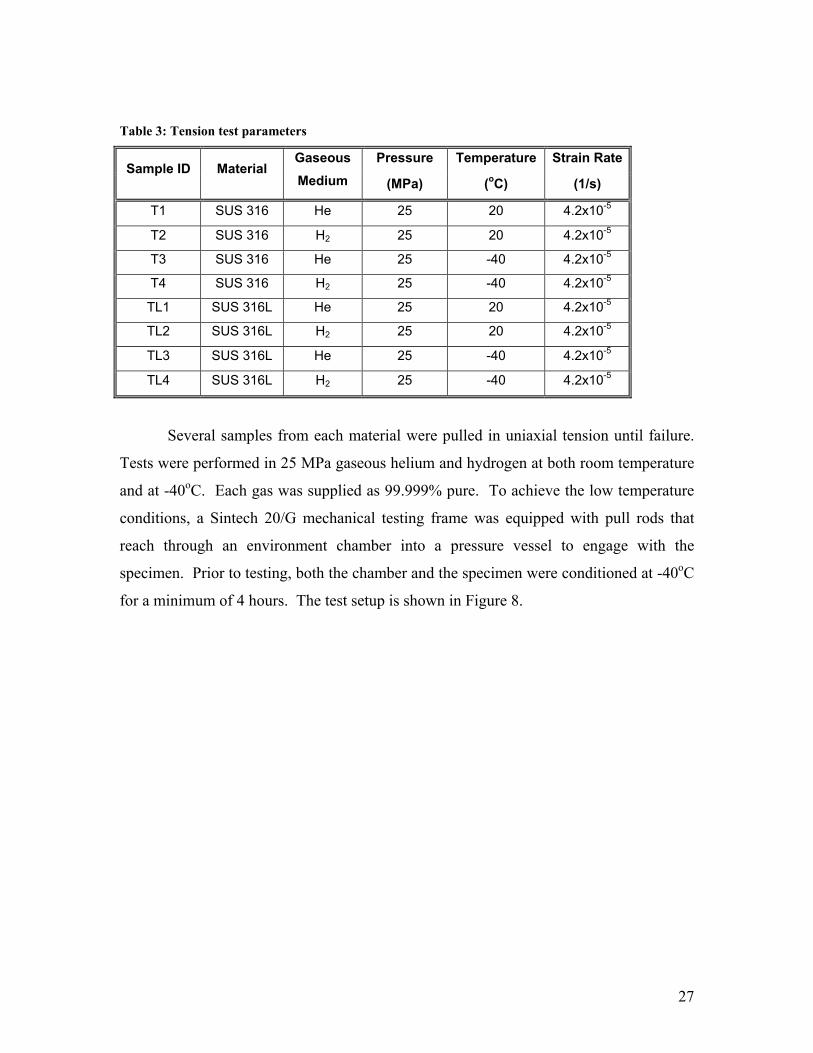
Table 3: Tension test parameters
Pressure Temperature Strain Rate Sample ID Material
Gaseous Medium (MPa) (oC) (1/s)
T1 SUS 316 He 25 20 4.2x10⁻⁵
T2 SUS 316 H2 25 20 4.2x10⁻⁵
T3 SUS 316 He 25 -40 4.2x10⁻⁵
T4 SUS 316 H2 25 -40 4.2x10⁻⁵
TL1 SUS 316L He 25 20 4.2x10⁻⁵
TL2 SUS 316L H2 25 20 4.2x10⁻⁵
TL3 SUS 316L He 25 -40 4.2x10⁻⁵
TL4 SUS 316L H2 25 -40 4.2x10⁻⁵
Several samples from each material were pulled in uniaxial tension until failure.
Tests were performed in 25 MPa gaseous helium and hydrogen at both room temperature
and at -40oC. Each gas was supplied as 99.999% pure. To achieve the low temperature
conditions, a Sintech 20/G mechanical testing frame was equipped with pull rods that
reach through an environment chamber into a pressure vessel to engage with the
specimen. Prior to testing, both the chamber and the specimen were conditioned at -40oC
for a minimum of 4 hours. The test setup is shown in Figure 8.
28
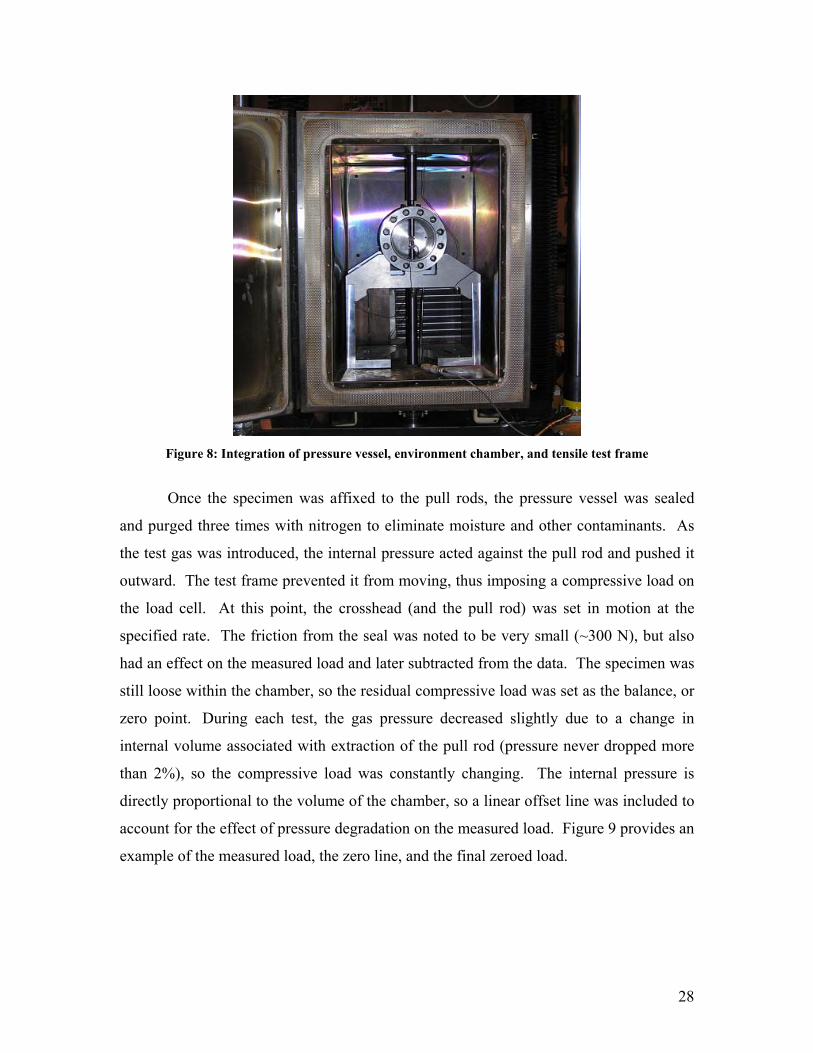
Figure 8: Integration of pressure vessel, environment chamber, and tensile test frame
Once the specimen was affixed to the pull rods, the pressure vessel was sealed
and purged three times with nitrogen to eliminate moisture and other contaminants. As
the test gas was introduced, the internal pressure acted against the pull rod and pushed it
outward. The test frame prevented it from moving, thus imposing a compressive load on
the load cell. At this point, the crosshead (and the pull rod) was set in motion at the
specified rate. The friction from the seal was noted to be very small (~300 N), but also
had an effect on the measured load and later subtracted from the data. The specimen was
still loose within the chamber, so the residual compressive load was set as the balance, or
zero point. During each test, the gas pressure decreased slightly due to a change in
internal volume associated with extraction of the pull rod (pressure never dropped more
than 2%), so the compressive load was constantly changing. The internal pressure is
directly proportional to the volume of the chamber, so a linear offset line was included to
account for the effect of pressure degradation on the measured load. Figure 9 provides an
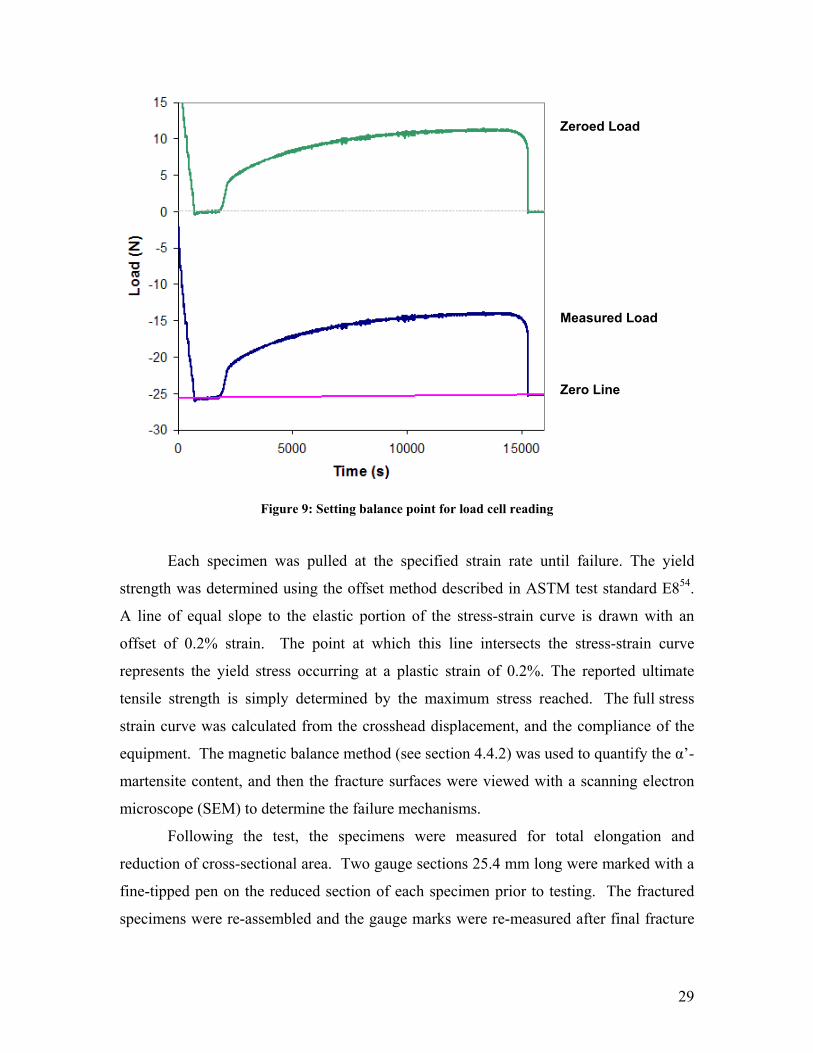
example of the measured load, the zero line, and the final zeroed load.
29
Figure 9: Setting balance point for load cell reading
Each specimen was pulled at the specified strain rate until failure. The yield
strength was determined using the offset method described in ASTM test standard E854.
A line of equal slope to the elastic portion of the stress-strain curve is drawn with an
offset of 0.2% strain. The point at which this line intersects the stress-strain curve
represents the yield stress occurring at a plastic strain of 0.2%. The reported ultimate
tensile strength is simply determined by the maximum stress reached. The full stress
strain curve was calculated from the crosshead displacement, and the compliance of the
equipment. The magnetic balance method (see section 4.4.2) was used to quantify the α’-
martensite content, and then the fracture surfaces were viewed with a scanning electron
microscope (SEM) to determine the failure mechanisms.
Following the test, the specimens were measured for total elongation and
reduction of cross-sectional area. Two gauge sections 25.4 mm long were marked with a
fine-tipped pen on the reduced section of each specimen prior to testing. The fractured
specimens were re-assembled and the gauge marks were re-measured after final fracture
Measured Load
Zero Line
Zeroed Load
30
to calculate the percent elongation. The diameter of the specimens at the point of fracture
was measured and used to calculate the total reduction of cross-sectional surface area.
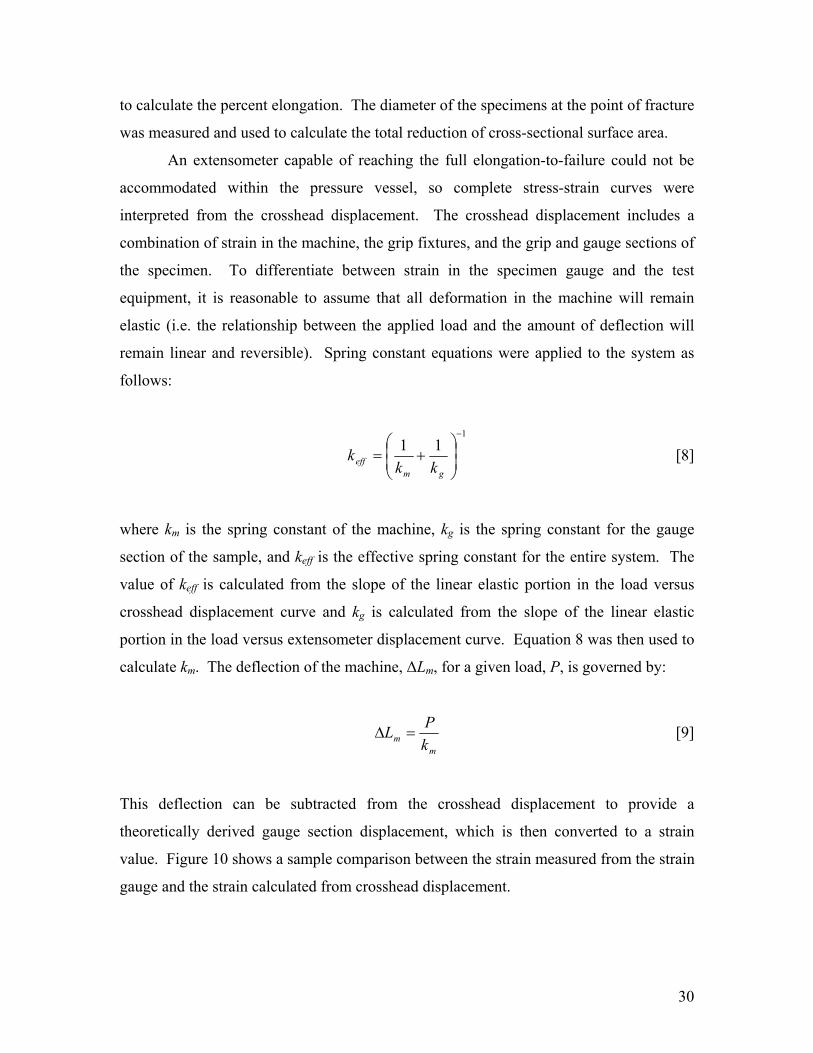
An extensometer capable of reaching the full elongation-to-failure could not be
accommodated within the pressure vessel, so complete stress-strain curves were
interpreted from the crosshead displacement. The crosshead displacement includes a
combination of strain in the machine, the grip fixtures, and the grip and gauge sections of
the specimen. To differentiate between strain in the specimen gauge and the test
equipment, it is reasonable to assume that all deformation in the machine will remain
elastic (i.e. the relationship between the applied load and the amount of deflection will
remain linear and reversible). Spring constant equations were applied to the system as
follows:
1
11−
+=
gmeff kk
k [8]
where km is the spring constant of the machine, kg is the spring constant for the gauge
section of the sample, and keff is the effective spring constant for the entire system. The
value of keff is calculated from the slope of the linear elastic portion in the load versus
crosshead displacement curve and kg is calculated from the slope of the linear elastic
portion in the load versus extensometer displacement curve. Equation 8 was then used to
calculate km. The deflection of the machine, ∆Lm, for a given load, P, is governed by:
m
m kPL =∆ [9]
This deflection can be subtracted from the crosshead displacement to provide a
theoretically derived gauge section displacement, which is then converted to a strain
value. Figure 10 shows a sample comparison between the strain measured from the strain
gauge and the strain calculated from crosshead displacement.
31
Figure 10: Measured versus calculated strains
4.3 Bulk Material Hydrogen Effects
To determine how absorbed hydrogen affects the bulk of the material, it was
desired to test samples uniformly charged with hydrogen. A series of permeation tests
were conducted to determine how much hydrogen exposure would result in a fully
saturated sample. Specimens could then be tested in different conditions to determine the
effect of hydrogen.
4.3.1 Permeation Tests
In order to resolve the effect of solute hydrogen on bulk material properties,
tensile tests were performed on samples charged with hydrogen. Because a concentration
gradient will affect both the stability of the austenite phase and the internal stress, an even
distribution of absorbed hydrogen was sought. Although a higher concentration of solute
hydrogen can be obtained from electrolytic charge techniques, large concentration
gradients are often associated. In order to achieve the appropriate hydrogen distribution,
specimens were gaseously charged at elevated temperature.
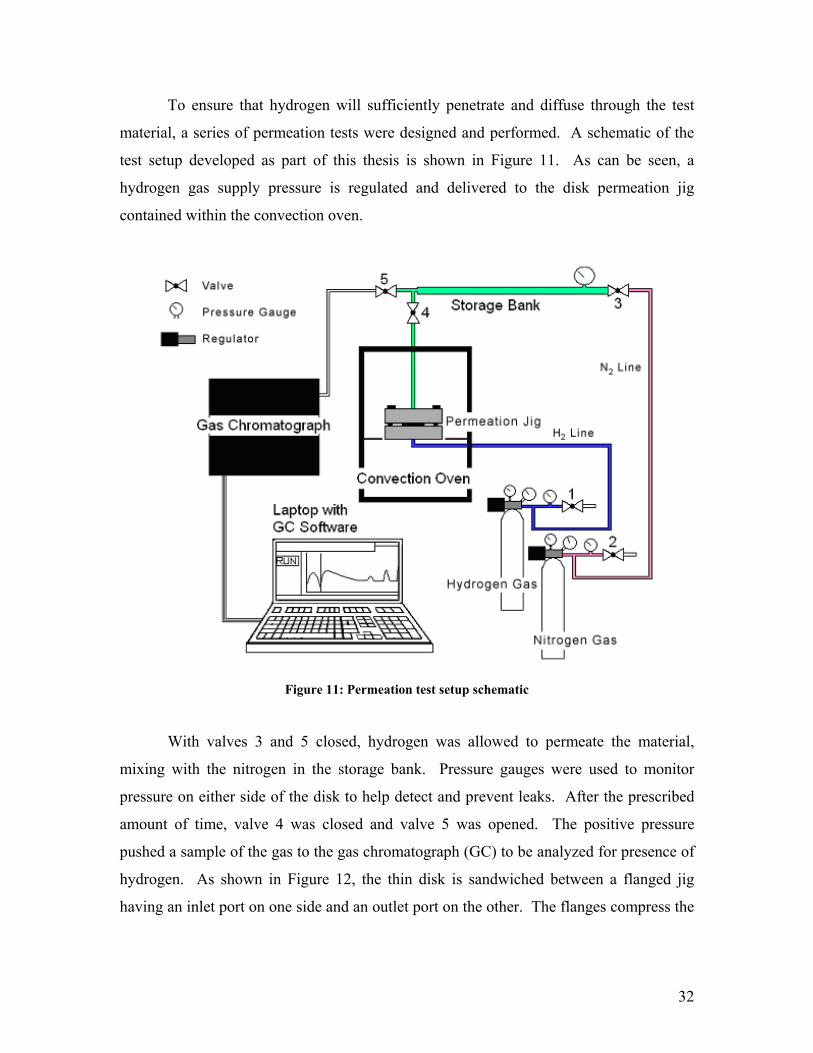
32
To ensure that hydrogen will sufficiently penetrate and diffuse through the test
material, a series of permeation tests were designed and performed. A schematic of the
test setup developed as part of this thesis is shown in Figure 11. As can be seen, a
hydrogen gas supply pressure is regulated and delivered to the disk permeation jig
contained within the convection oven.
Figure 11: Permeation test setup schematic
With valves 3 and 5 closed, hydrogen was allowed to permeate the material,
mixing with the nitrogen in the storage bank. Pressure gauges were used to monitor
pressure on either side of the disk to help detect and prevent leaks. After the prescribed
amount of time, valve 4 was closed and valve 5 was opened. The positive pressure
pushed a sample of the gas to the gas chromatograph (GC) to be analyzed for presence of
hydrogen. As shown in Figure 12, the thin disk is sandwiched between a flanged jig
having an inlet port on one side and an outlet port on the other. The flanges compress the
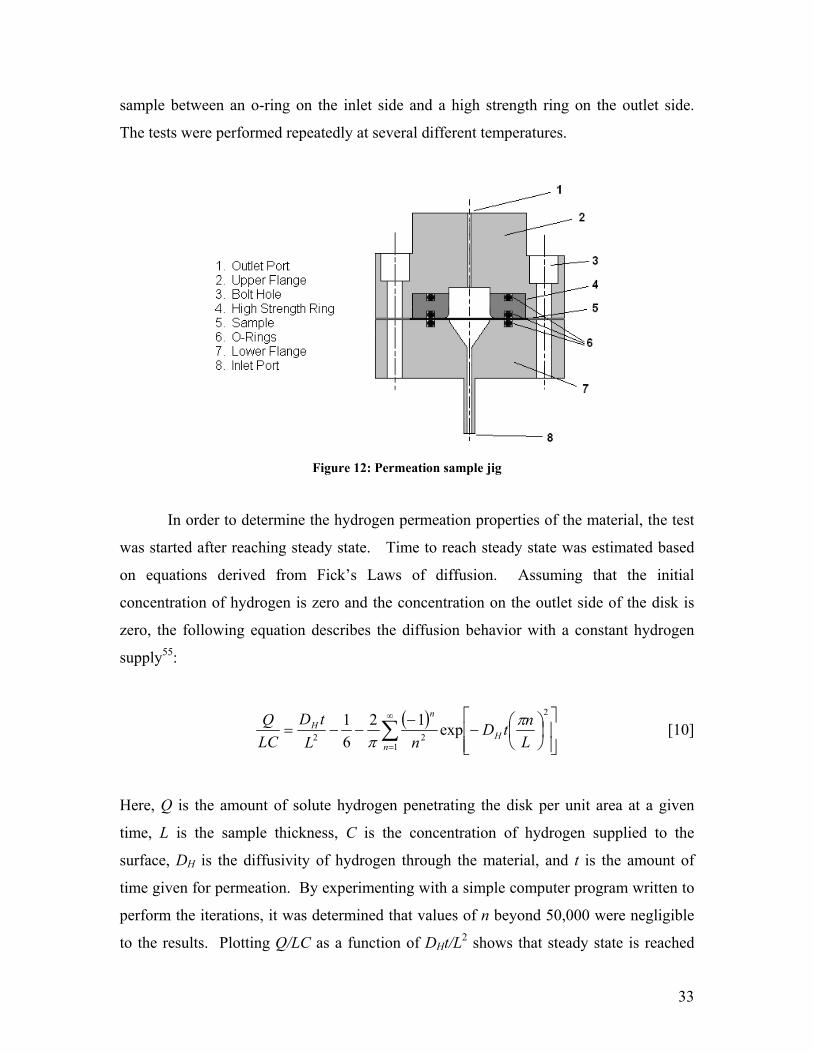
33
sample between an o-ring on the inlet side and a high strength ring on the outlet side.
The tests were performed repeatedly at several different temperatures.
Figure 12: Permeation sample jig
In order to determine the hydrogen permeation properties of the material, the test
was started after reaching steady state. Time to reach steady state was estimated based
on equations derived from Fick’s Laws of diffusion. Assuming that the initial
concentration of hydrogen is zero and the concentration on the outlet side of the disk is
zero, the following equation describes the diffusion behavior with a constant hydrogen
supply55:
( )∑∞
=
−
−−−=
1
2
22 exp1261
nH
nH
LntD
nLtD
LCQ π
π [10]
Here, Q is the amount of solute hydrogen penetrating the disk per unit area at a given
time, L is the sample thickness, C is the concentration of hydrogen supplied to the
surface, DH is the diffusivity of hydrogen through the material, and t is the amount of
time given for permeation. By experimenting with a simple computer program written to
perform the iterations, it was determined that values of n beyond 50,000 were negligible
to the results. Plotting Q/LC as a function of DHt/L2 shows that steady state is reached
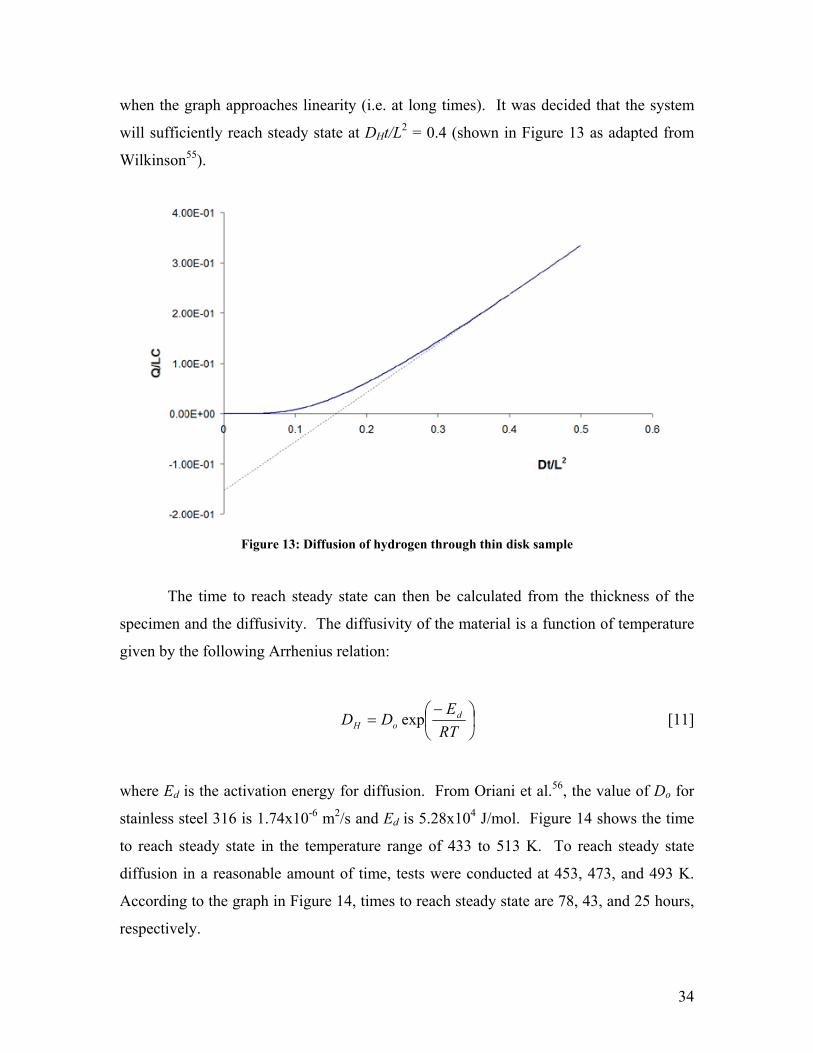
34
when the graph approaches linearity (i.e. at long times). It was decided that the system
will sufficiently reach steady state at DHt/L2 = 0.4 (shown in Figure 13 as adapted from
Wilkinson55).
Figure 13: Diffusion of hydrogen through thin disk sample
The time to reach steady state can then be calculated from the thickness of the
specimen and the diffusivity. The diffusivity of the material is a function of temperature
given by the following Arrhenius relation:
−
=RTE
DD doH exp [11]
where Ed is the activation energy for diffusion. From Oriani et al.56, the value of Do for
stainless steel 316 is 1.74x10⁻⁶ m2/s and Ed is 5.28x10⁴ J/mol. Figure 14 shows the time
to reach steady state in the temperature range of 433 to 513 K. To reach steady state
diffusion in a reasonable amount of time, tests were conducted at 453, 473, and 493 K.
According to the graph in Figure 14, times to reach steady state are 78, 43, and 25 hours,
respectively.
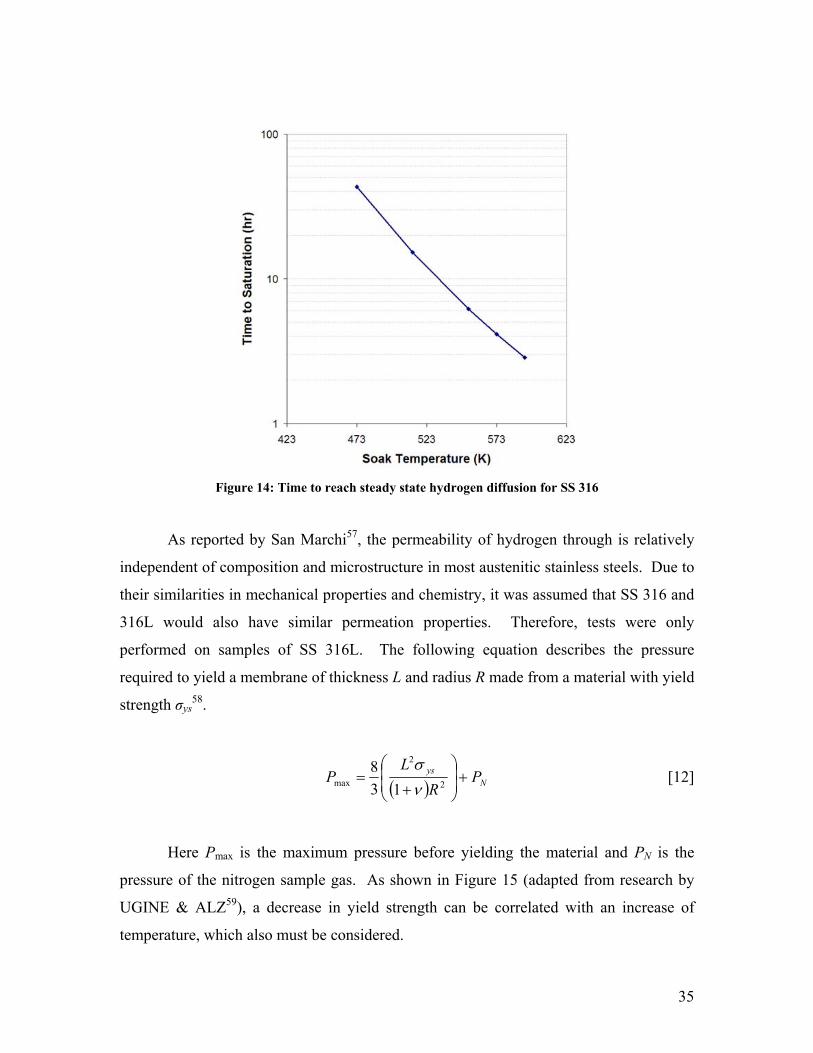
35
Figure 14: Time to reach steady state hydrogen diffusion for SS 316
As reported by San Marchi57, the permeability of hydrogen through is relatively
independent of composition and microstructure in most austenitic stainless steels. Due to
their similarities in mechanical properties and chemistry, it was assumed that SS 316 and
316L would also have similar permeation properties. Therefore, tests were only
performed on samples of SS 316L. The following equation describes the pressure
required to yield a membrane of thickness L and radius R made from a material with yield
strength σys58.
( ) Nys PR
LP +
+= 2
2
max 138
νσ
[12]
Here Pmax is the maximum pressure before yielding the material and PN is the
pressure of the nitrogen sample gas. As shown in Figure 15 (adapted from research by
UGINE & ALZ59), a decrease in yield strength can be correlated with an increase of
temperature, which also must be considered.
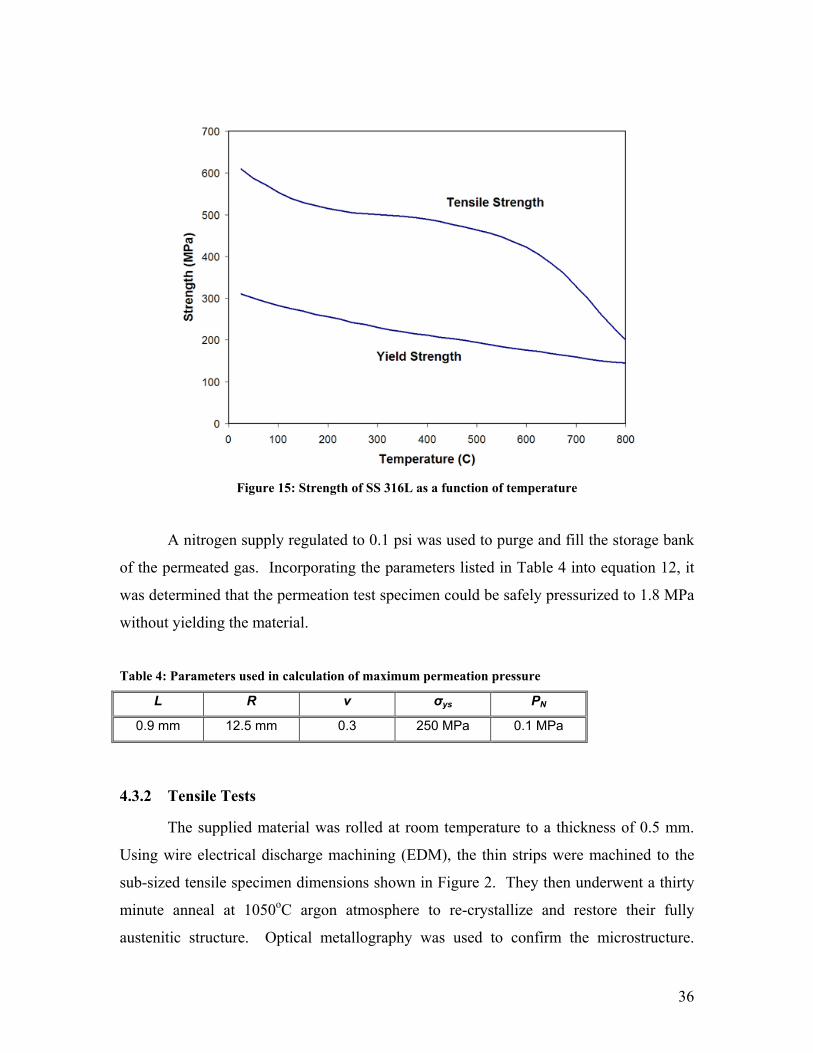
36
Figure 15: Strength of SS 316L as a function of temperature
A nitrogen supply regulated to 0.1 psi was used to purge and fill the storage bank
of the permeated gas. Incorporating the parameters listed in Table 4 into equation 12, it
was determined that the permeation test specimen could be safely pressurized to 1.8 MPa
without yielding the material.
Table 4: Parameters used in calculation of maximum permeation pressure
L R ν σys PN
0.9 mm 12.5 mm 0.3 250 MPa 0.1 MPa
4.3.2 Tensile Tests
The supplied material was rolled at room temperature to a thickness of 0.5 mm.
Using wire electrical discharge machining (EDM), the thin strips were machined to the
sub-sized tensile specimen dimensions shown in Figure 2. They then underwent a thirty
minute anneal at 1050oC argon atmosphere to re-crystallize and restore their fully
austenitic structure. Optical metallography was used to confirm the microstructure.
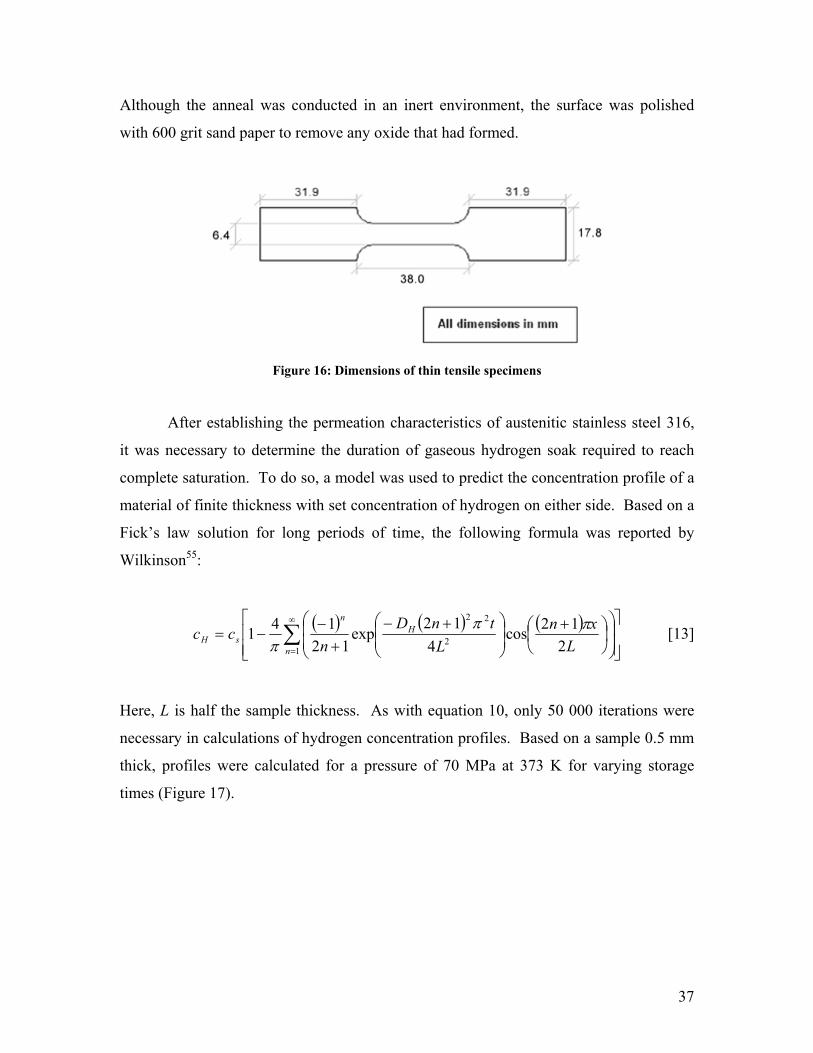
37
Although the anneal was conducted in an inert environment, the surface was polished
with 600 grit sand paper to remove any oxide that had formed.
Figure 16: Dimensions of thin tensile specimens
After establishing the permeation characteristics of austenitic stainless steel 316,
it was necessary to determine the duration of gaseous hydrogen soak required to reach
complete saturation. To do so, a model was used to predict the concentration profile of a
material of finite thickness with set concentration of hydrogen on either side. Based on a
Fick’s law solution for long periods of time, the following formula was reported by
Wilkinson55:
( ) ( ) ( )
+
+−+
−−= ∑
∞
=12
22
212cos
412
exp12
141n
Hn
sH Lxn
LtnD
ncc ππ
π [13]
Here, L is half the sample thickness. As with equation 10, only 50 000 iterations were
necessary in calculations of hydrogen concentration profiles. Based on a sample 0.5 mm
thick, profiles were calculated for a pressure of 70 MPa at 373 K for varying storage
times (Figure 17).
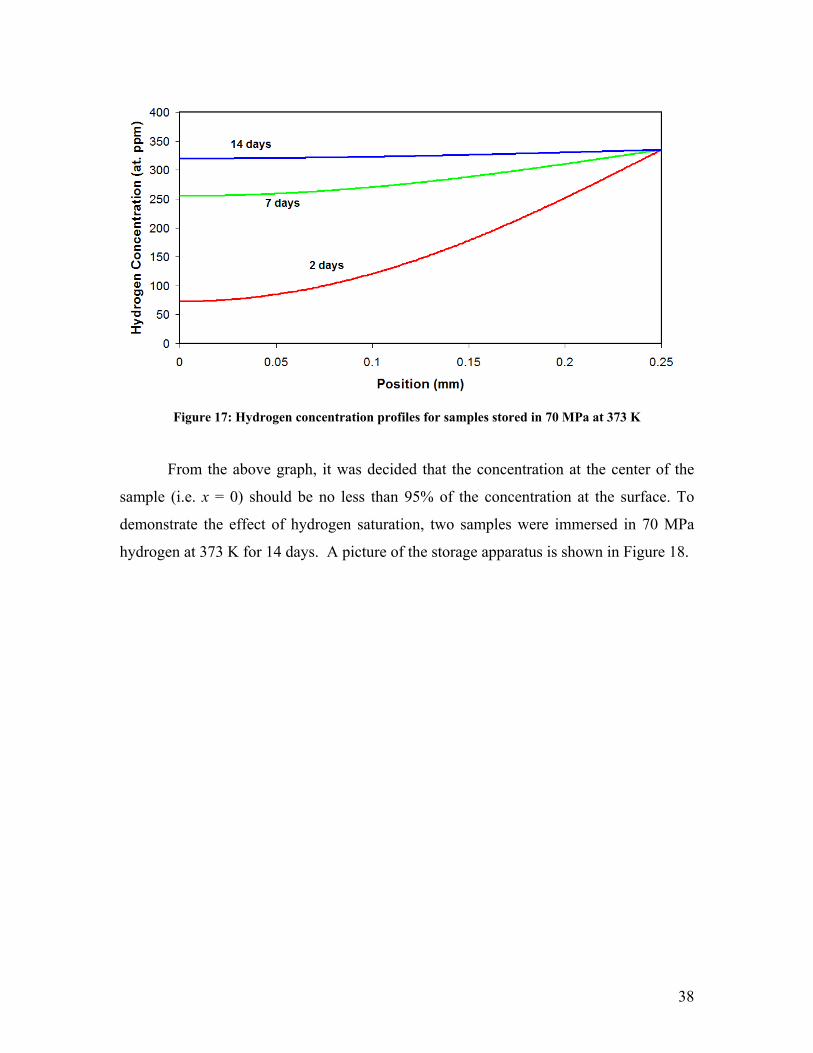
38
Figure 17: Hydrogen concentration profiles for samples stored in 70 MPa at 373 K
From the above graph, it was decided that the concentration at the center of the
sample (i.e. x = 0) should be no less than 95% of the concentration at the surface. To
demonstrate the effect of hydrogen saturation, two samples were immersed in 70 MPa
hydrogen at 373 K for 14 days. A picture of the storage apparatus is shown in Figure 18.
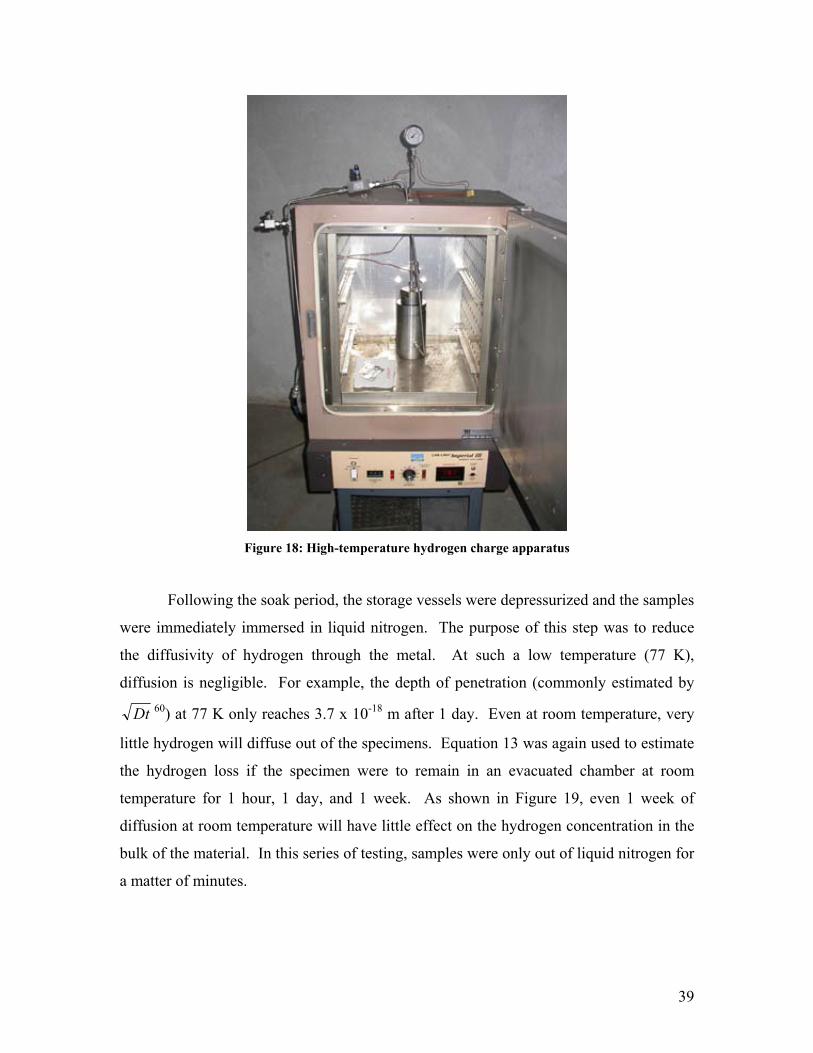
39
Figure 18: High-temperature hydrogen charge apparatus
Following the soak period, the storage vessels were depressurized and the samples
were immediately immersed in liquid nitrogen. The purpose of this step was to reduce
the diffusivity of hydrogen through the metal. At such a low temperature (77 K),
diffusion is negligible. For example, the depth of penetration (commonly estimated by
Dt 60) at 77 K only reaches 3.7 x 10⁻¹⁸ m after 1 day. Even at room temperature, very
little hydrogen will diffuse out of the specimens. Equation 13 was again used to estimate
the hydrogen loss if the specimen were to remain in an evacuated chamber at room
temperature for 1 hour, 1 day, and 1 week. As shown in Figure 19, even 1 week of
diffusion at room temperature will have little effect on the hydrogen concentration in the
bulk of the material. In this series of testing, samples were only out of liquid nitrogen for
a matter of minutes.
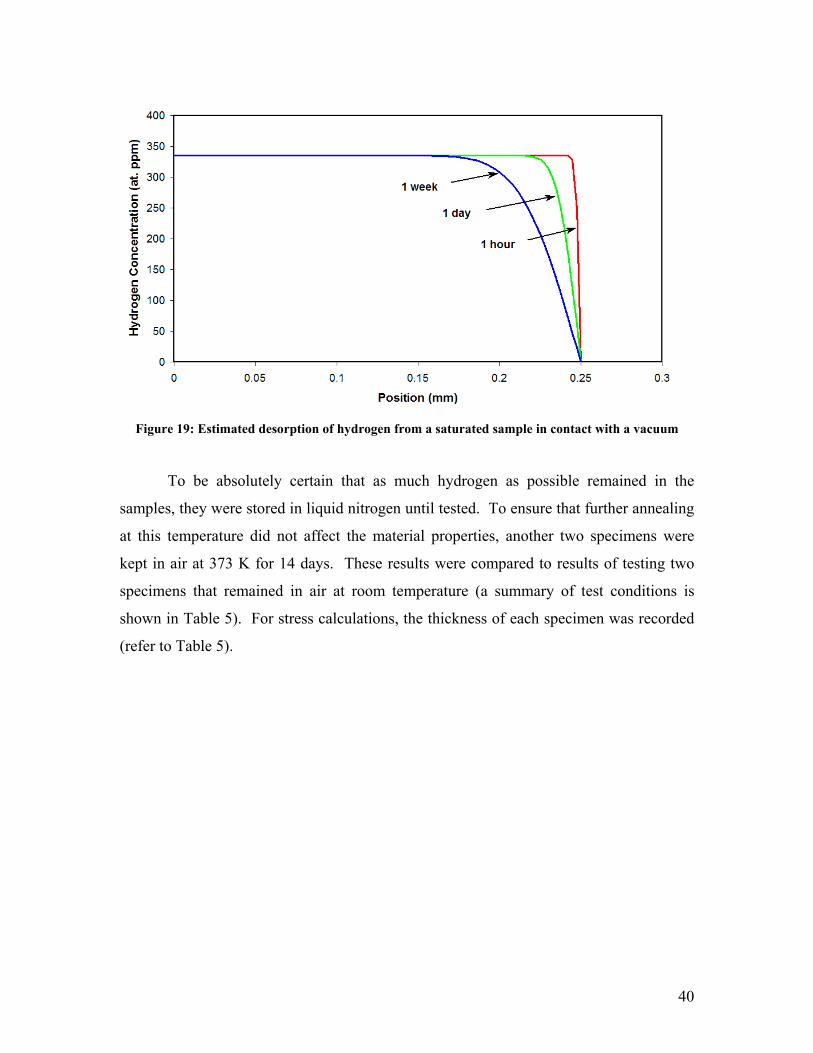
40
Figure 19: Estimated desorption of hydrogen from a saturated sample in contact with a vacuum
To be absolutely certain that as much hydrogen as possible remained in the
samples, they were stored in liquid nitrogen until tested. To ensure that further annealing
at this temperature did not affect the material properties, another two specimens were
kept in air at 373 K for 14 days. These results were compared to results of testing two
specimens that remained in air at room temperature (a summary of test conditions is
shown in Table 5). For stress calculations, the thickness of each specimen was recorded
(refer to Table 5).

41
Table 5: Thin tensile test conditions
Sample ID Material Storage
Pressure (MPa) Storage
Temperature (K) Storage
Time (days) Thickness
(mm)
1 316 As-received 0.66
2 316 As-received 0.65
3 316 Ambient 373 14 0.66
4 316 Ambient 373 14 0.66
5 316 70 MPa 373 14 0.66
6 316 70 MPa 373 14 0.65
L1 316L As-received 0.52
L2 316L As-received 0.51
L3 316L Ambient 373 14 0.50
L4 316L Ambient 373 14 0.51
L5 316L 70 MPa 373 14 0.49
L6 316L 70 MPa 373 14 0.51
A Sintech testing frame equipped with serrated flat face wedge grips was used to
pull the specimens in uniaxial tension until fracture. In accordance with ASTM test
standard E854, all samples were tested at a crosshead displacement rate of 5.0 mm/minute.
4.4 Martensite Content Analysis
Quite often in testing of austenitic stainless steels, the ferritescope is used as a
quick and convenient method of quantifying martensite content. Basically, the
instrument creates a magnetic field and measures the response of the material. Since the
ferritescope is calibrated using standard samples of known delta-ferrite concentrations,
there is inherent concern of its compatibility with a martensite system. A series of tests
were performed to determine if a martensite concentration could be accurately measured
using a ferritescope.
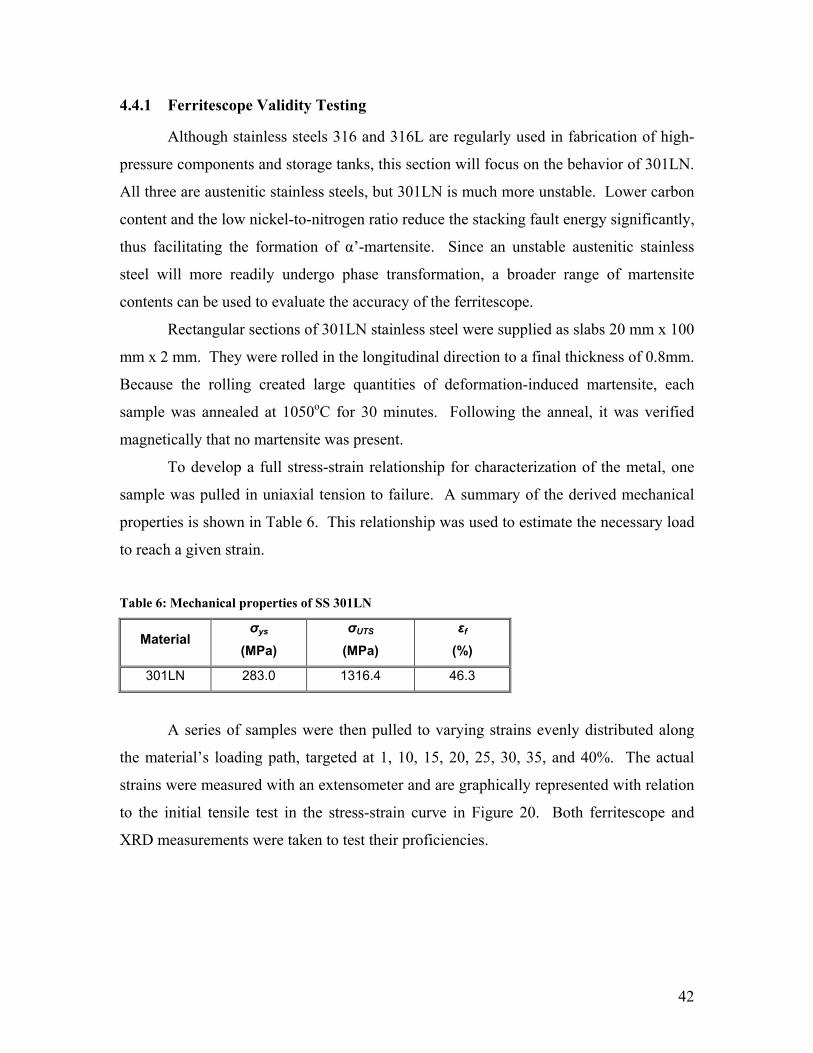
42
4.4.1 Ferritescope Validity Testing
Although stainless steels 316 and 316L are regularly used in fabrication of high-
pressure components and storage tanks, this section will focus on the behavior of 301LN.
All three are austenitic stainless steels, but 301LN is much more unstable. Lower carbon
content and the low nickel-to-nitrogen ratio reduce the stacking fault energy significantly,
thus facilitating the formation of α’-martensite. Since an unstable austenitic stainless
steel will more readily undergo phase transformation, a broader range of martensite
contents can be used to evaluate the accuracy of the ferritescope.
Rectangular sections of 301LN stainless steel were supplied as slabs 20 mm x 100
mm x 2 mm. They were rolled in the longitudinal direction to a final thickness of 0.8mm.
Because the rolling created large quantities of deformation-induced martensite, each
sample was annealed at 1050oC for 30 minutes. Following the anneal, it was verified
magnetically that no martensite was present.
To develop a full stress-strain relationship for characterization of the metal, one
sample was pulled in uniaxial tension to failure. A summary of the derived mechanical
properties is shown in Table 6. This relationship was used to estimate the necessary load
to reach a given strain.
Table 6: Mechanical properties of SS 301LN
Material σys
(MPa) σUTS
(MPa) εf
(%)
301LN 283.0 1316.4 46.3
A series of samples were then pulled to varying strains evenly distributed along
the material’s loading path, targeted at 1, 10, 15, 20, 25, 30, 35, and 40%. The actual
strains were measured with an extensometer and are graphically represented with relation
to the initial tensile test in the stress-strain curve in Figure 20. Both ferritescope and
XRD measurements were taken to test their proficiencies.
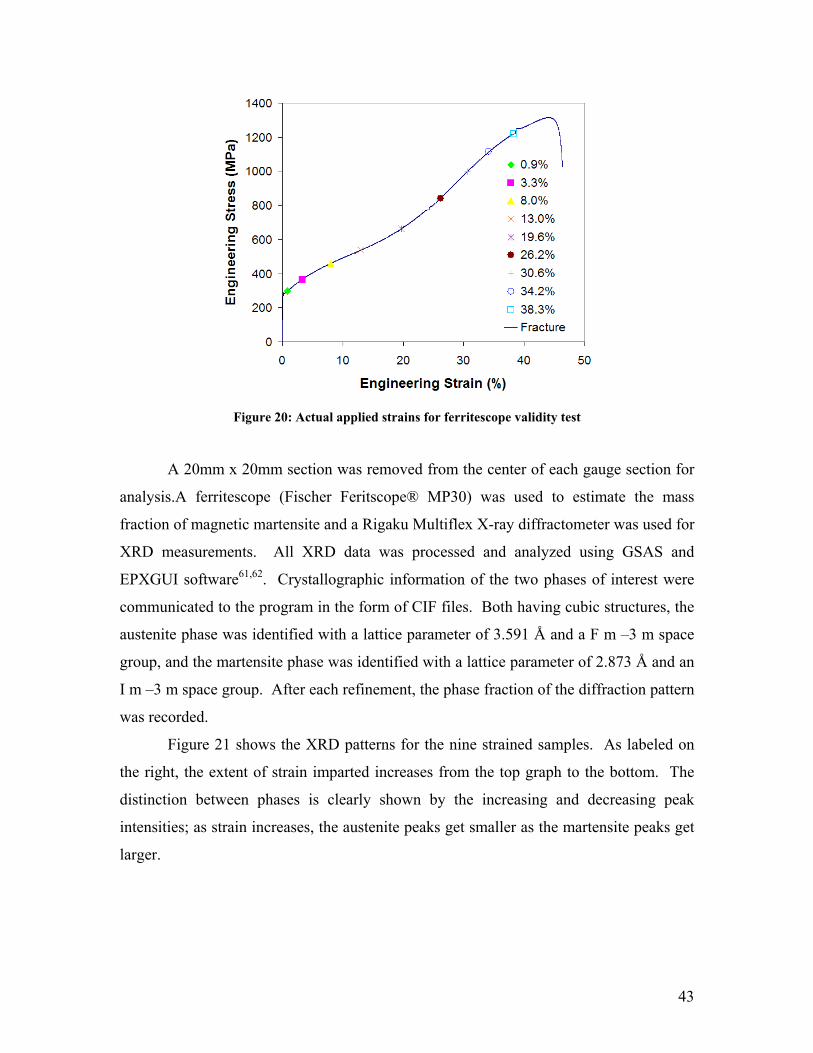
43
Figure 20: Actual applied strains for ferritescope validity test
A 20mm x 20mm section was removed from the center of each gauge section for
analysis.A ferritescope (Fischer Feritscope® MP30) was used to estimate the mass
fraction of magnetic martensite and a Rigaku Multiflex X-ray diffractometer was used for
XRD measurements. All XRD data was processed and analyzed using GSAS and
EPXGUI software61,62. Crystallographic information of the two phases of interest were
communicated to the program in the form of CIF files. Both having cubic structures, the
austenite phase was identified with a lattice parameter of 3.591 Å and a F m –3 m space
group, and the martensite phase was identified with a lattice parameter of 2.873 Å and an
I m –3 m space group. After each refinement, the phase fraction of the diffraction pattern
was recorded.
Figure 21 shows the XRD patterns for the nine strained samples. As labeled on
the right, the extent of strain imparted increases from the top graph to the bottom. The
distinction between phases is clearly shown by the increasing and decreasing peak
intensities; as strain increases, the austenite peaks get smaller as the martensite peaks get
larger.
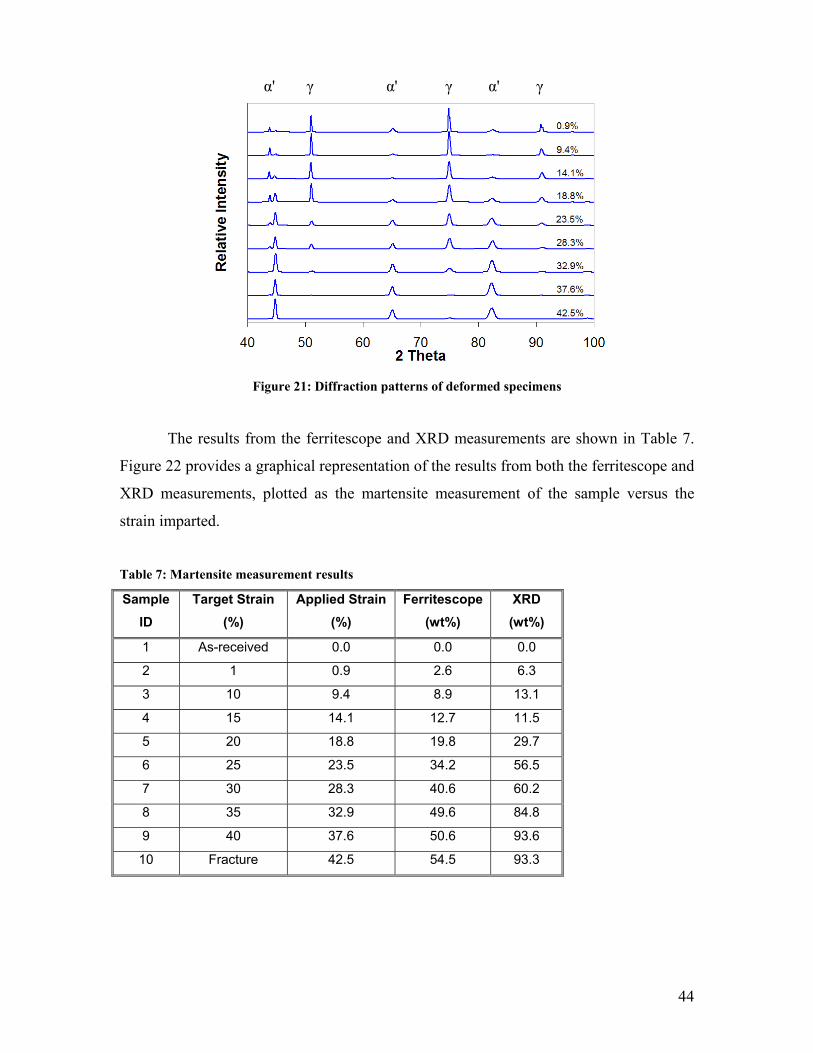
44
Figure 21: Diffraction patterns of deformed specimens
The results from the ferritescope and XRD measurements are shown in Table 7.
Figure 22 provides a graphical representation of the results from both the ferritescope and
XRD measurements, plotted as the martensite measurement of the sample versus the
strain imparted.
Table 7: Martensite measurement results
Sample ID
Target Strain (%)
Applied Strain (%)
Ferritescope (wt%)
XRD (wt%)
1 As-received 0.0 0.0 0.0
2 1 0.9 2.6 6.3
3 10 9.4 8.9 13.1
4 15 14.1 12.7 11.5
5 20 18.8 19.8 29.7
6 25 23.5 34.2 56.5
7 30 28.3 40.6 60.2
8 35 32.9 49.6 84.8
9 40 37.6 50.6 93.6
10 Fracture 42.5 54.5 93.3
α' γα'γ α' γ
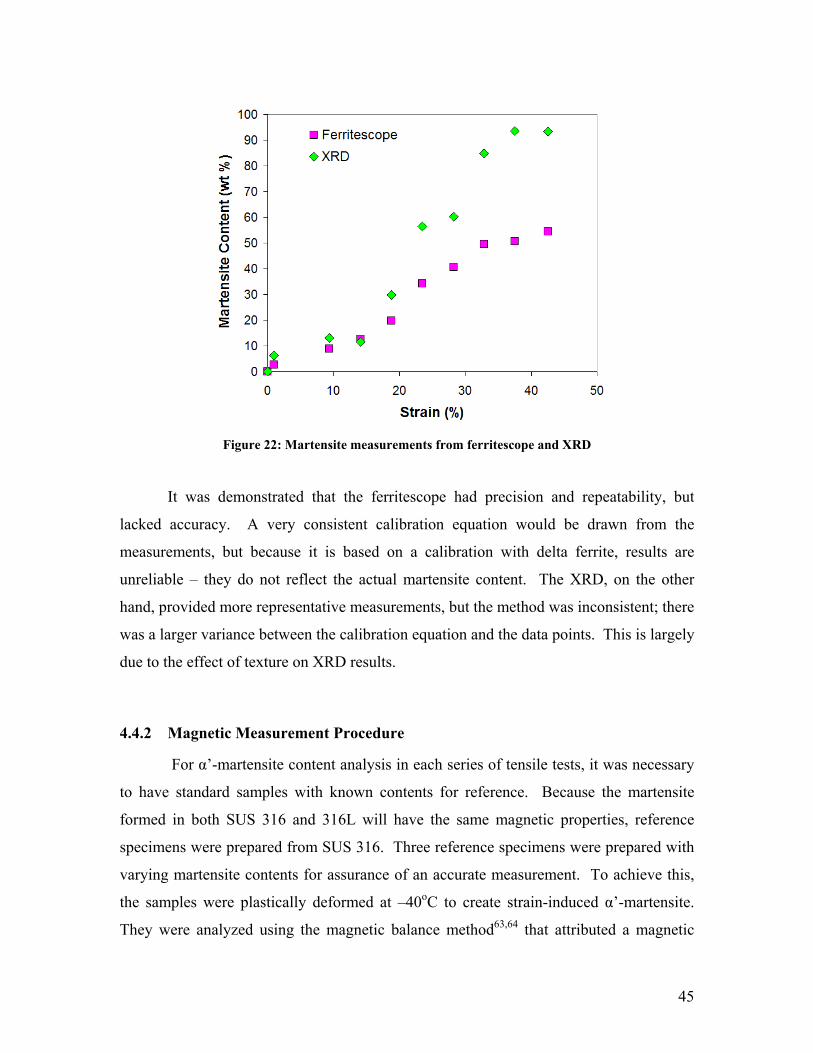
45
Figure 22: Martensite measurements from ferritescope and XRD
It was demonstrated that the ferritescope had precision and repeatability, but
lacked accuracy. A very consistent calibration equation would be drawn from the
measurements, but because it is based on a calibration with delta ferrite, results are
unreliable – they do not reflect the actual martensite content. The XRD, on the other
hand, provided more representative measurements, but the method was inconsistent; there
was a larger variance between the calibration equation and the data points. This is largely
due to the effect of texture on XRD results.
4.4.2 Magnetic Measurement Procedure
For α’-martensite content analysis in each series of tensile tests, it was necessary
to have standard samples with known contents for reference. Because the martensite
formed in both SUS 316 and 316L will have the same magnetic properties, reference
specimens were prepared from SUS 316. Three reference specimens were prepared with
varying martensite contents for assurance of an accurate measurement. To achieve this,
the samples were plastically deformed at –40oC to create strain-induced α’-martensite.
They were analyzed using the magnetic balance method63,64 that attributed a magnetic
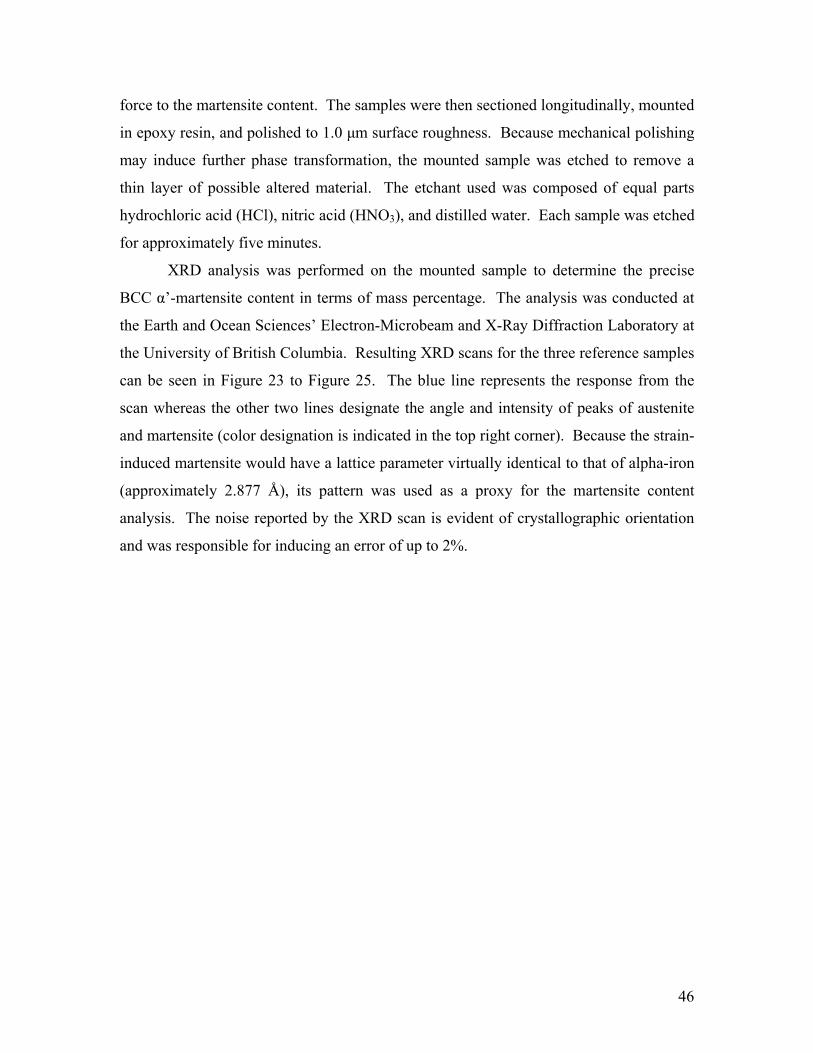
46
force to the martensite content. The samples were then sectioned longitudinally, mounted
in epoxy resin, and polished to 1.0 µm surface roughness. Because mechanical polishing
may induce further phase transformation, the mounted sample was etched to remove a
thin layer of possible altered material. The etchant used was composed of equal parts
hydrochloric acid (HCl), nitric acid (HNO3), and distilled water. Each sample was etched
for approximately five minutes.
XRD analysis was performed on the mounted sample to determine the precise
BCC α’-martensite content in terms of mass percentage. The analysis was conducted at
the Earth and Ocean Sciences’ Electron-Microbeam and X-Ray Diffraction Laboratory at
the University of British Columbia. Resulting XRD scans for the three reference samples
can be seen in Figure 23 to Figure 25. The blue line represents the response from the
scan whereas the other two lines designate the angle and intensity of peaks of austenite
and martensite (color designation is indicated in the top right corner). Because the strain-
induced martensite would have a lattice parameter virtually identical to that of alpha-iron
(approximately 2.877 Å), its pattern was used as a proxy for the martensite content
analysis. The noise reported by the XRD scan is evident of crystallographic orientation
and was responsible for inducing an error of up to 2%.
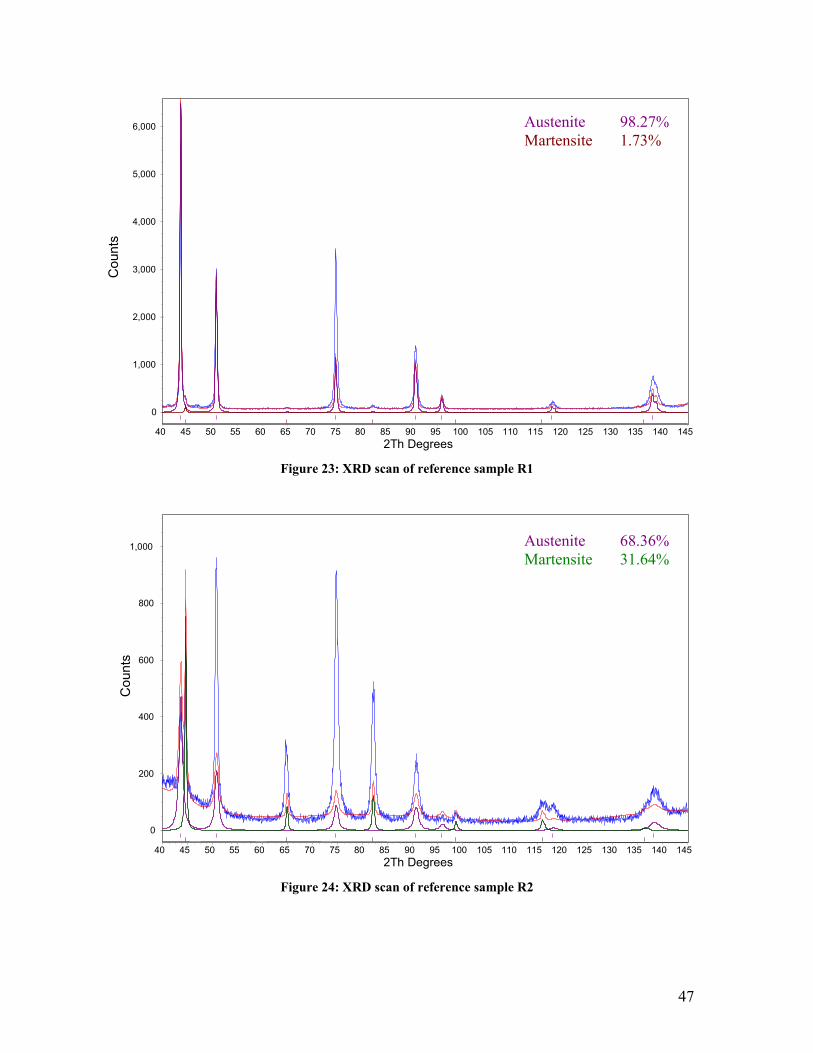
47
2Th Degrees145140135 130 125 120115110105100959085807570 65 60 55 50 45 40
Counts
6,000
5,000
4,000
3,000
2,000
1,000
0
Figure 23: XRD scan of reference sample R1
2Th Degrees145140135 130 125 120115110105100959085807570 65 60 55 50 45 40
Counts
1,000
800
600
400
200
0
Figure 24: XRD scan of reference sample R2
Austenite 98.27%Martensite 1.73%
Austenite 68.36%Martensite 31.64%
Cou
nts
Cou
nts
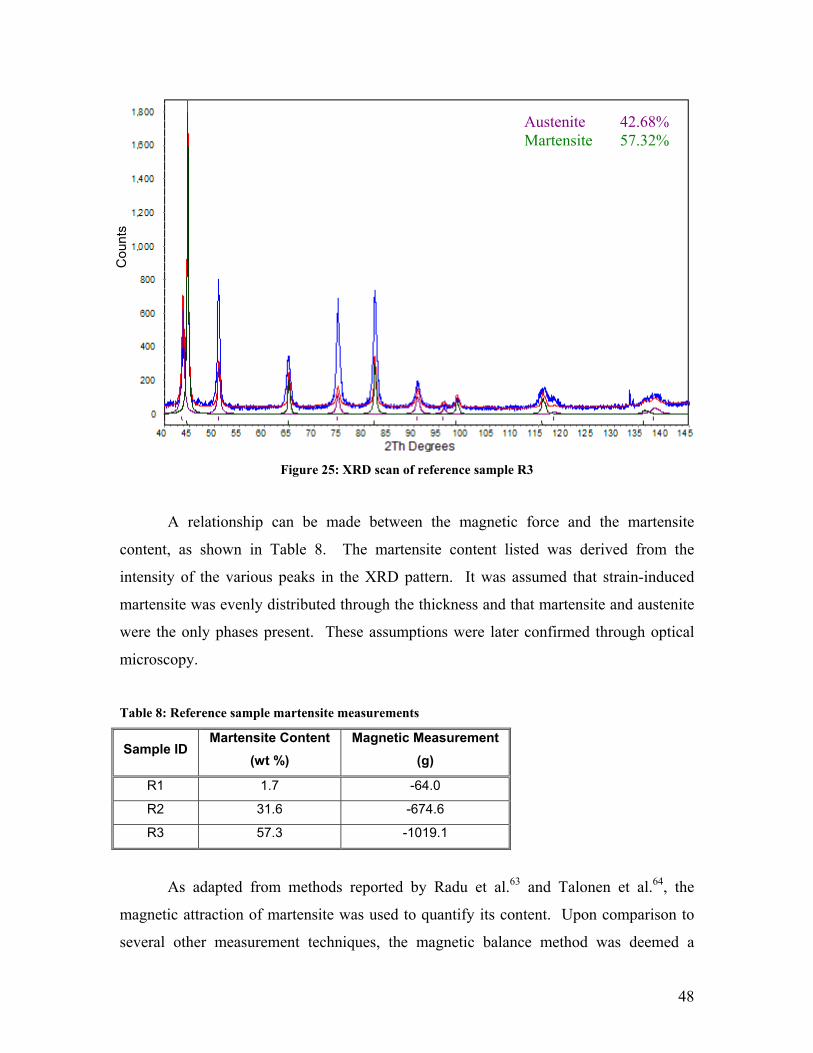
48
Figure 25: XRD scan of reference sample R3
A relationship can be made between the magnetic force and the martensite
content, as shown in Table 8. The martensite content listed was derived from the
intensity of the various peaks in the XRD pattern. It was assumed that strain-induced
martensite was evenly distributed through the thickness and that martensite and austenite
were the only phases present. These assumptions were later confirmed through optical
microscopy.
Table 8: Reference sample martensite measurements
Sample ID Martensite Content
(wt %) Magnetic Measurement
(g)
R1 1.7 -64.0
R2 31.6 -674.6
R3 57.3 -1019.1
As adapted from methods reported by Radu et al.63 and Talonen et al.64, the
magnetic attraction of martensite was used to quantify its content. Upon comparison to
several other measurement techniques, the magnetic balance method was deemed a
Austenite 42.68%Martensite 57.32%
Cou
nts
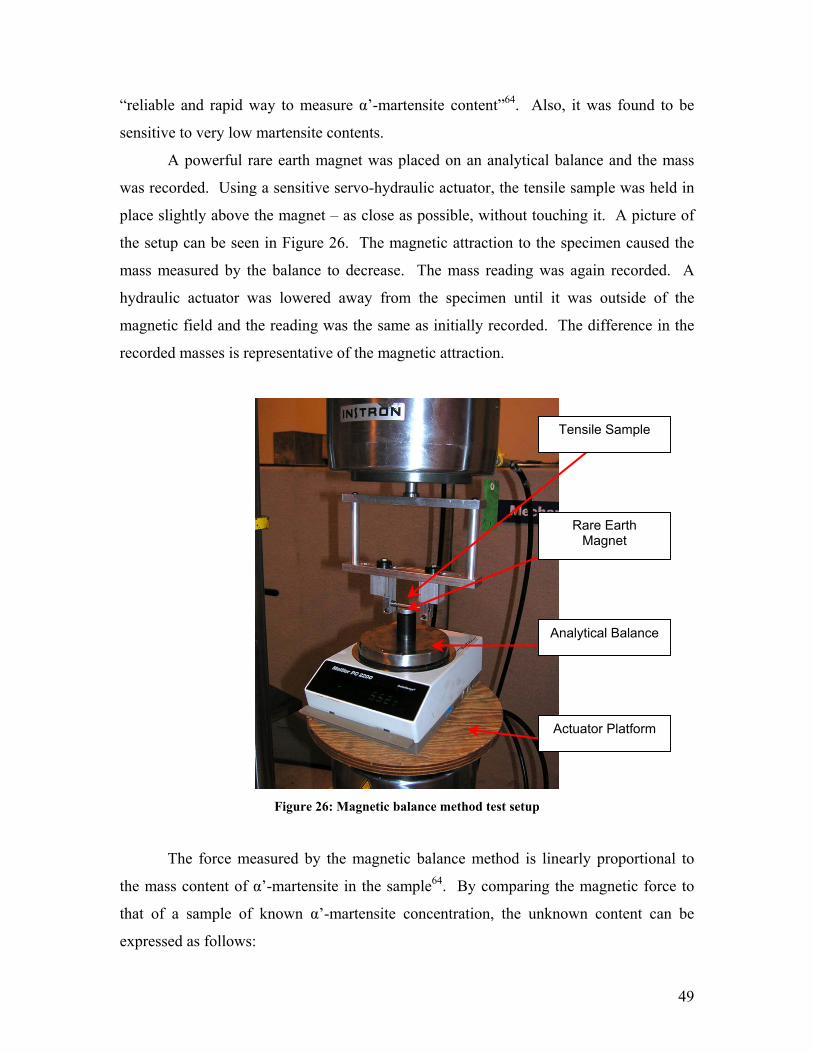
49
“reliable and rapid way to measure α’-martensite content”64. Also, it was found to be
sensitive to very low martensite contents.
A powerful rare earth magnet was placed on an analytical balance and the mass
was recorded. Using a sensitive servo-hydraulic actuator, the tensile sample was held in
place slightly above the magnet – as close as possible, without touching it. A picture of
the setup can be seen in Figure 26. The magnetic attraction to the specimen caused the
mass measured by the balance to decrease. The mass reading was again recorded. A
hydraulic actuator was lowered away from the specimen until it was outside of the
magnetic field and the reading was the same as initially recorded. The difference in the
recorded masses is representative of the magnetic attraction.
Figure 26: Magnetic balance method test setup
The force measured by the magnetic balance method is linearly proportional to
the mass content of α’-martensite in the sample64. By comparing the magnetic force to
that of a sample of known α’-martensite concentration, the unknown content can be
expressed as follows:
Tensile Sample
Rare Earth Magnet
Analytical Balance
Actuator Platform
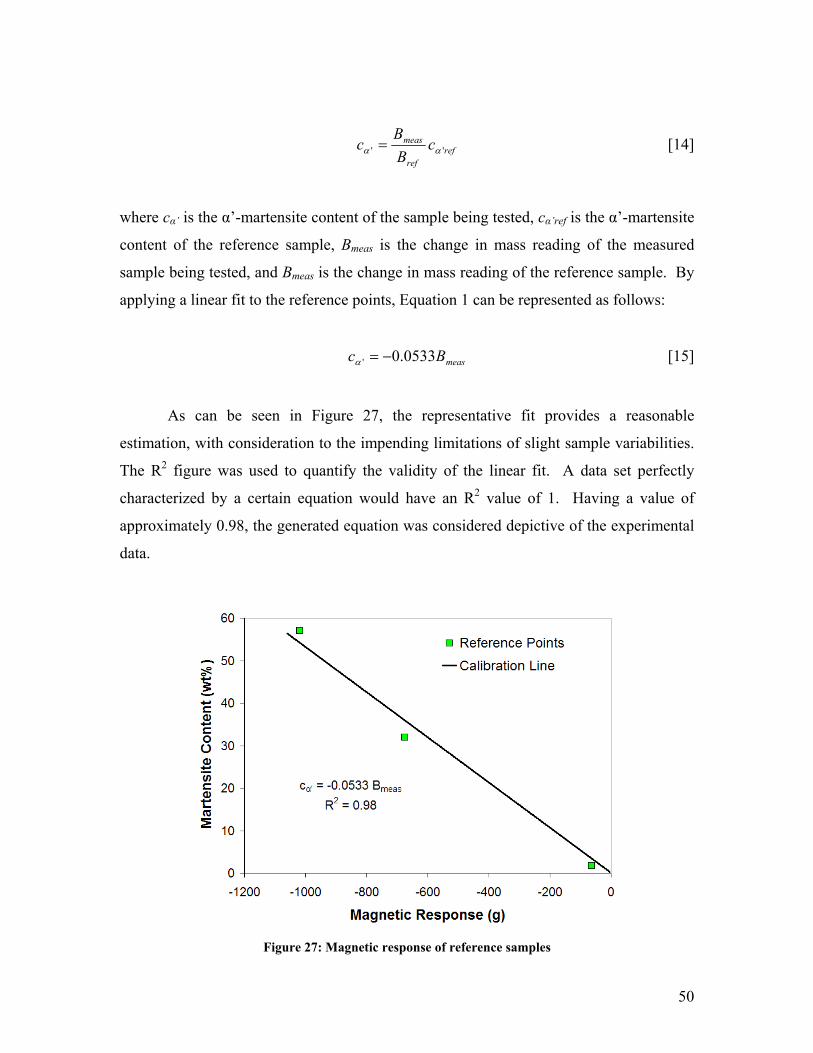
50
refref
meas cBB
c '' αα = [14]
where cα’ is the α’-martensite content of the sample being tested, cα’ref is the α’-martensite
content of the reference sample, Bmeas is the change in mass reading of the measured
sample being tested, and Bmeas is the change in mass reading of the reference sample. By
applying a linear fit to the reference points, Equation 1 can be represented as follows:
measBc 0533.0' −=α [15]
As can be seen in Figure 27, the representative fit provides a reasonable
estimation, with consideration to the impending limitations of slight sample variabilities.
The R2 figure was used to quantify the validity of the linear fit. A data set perfectly
characterized by a certain equation would have an R2 value of 1. Having a value of
approximately 0.98, the generated equation was considered depictive of the experimental
data.
Figure 27: Magnetic response of reference samples
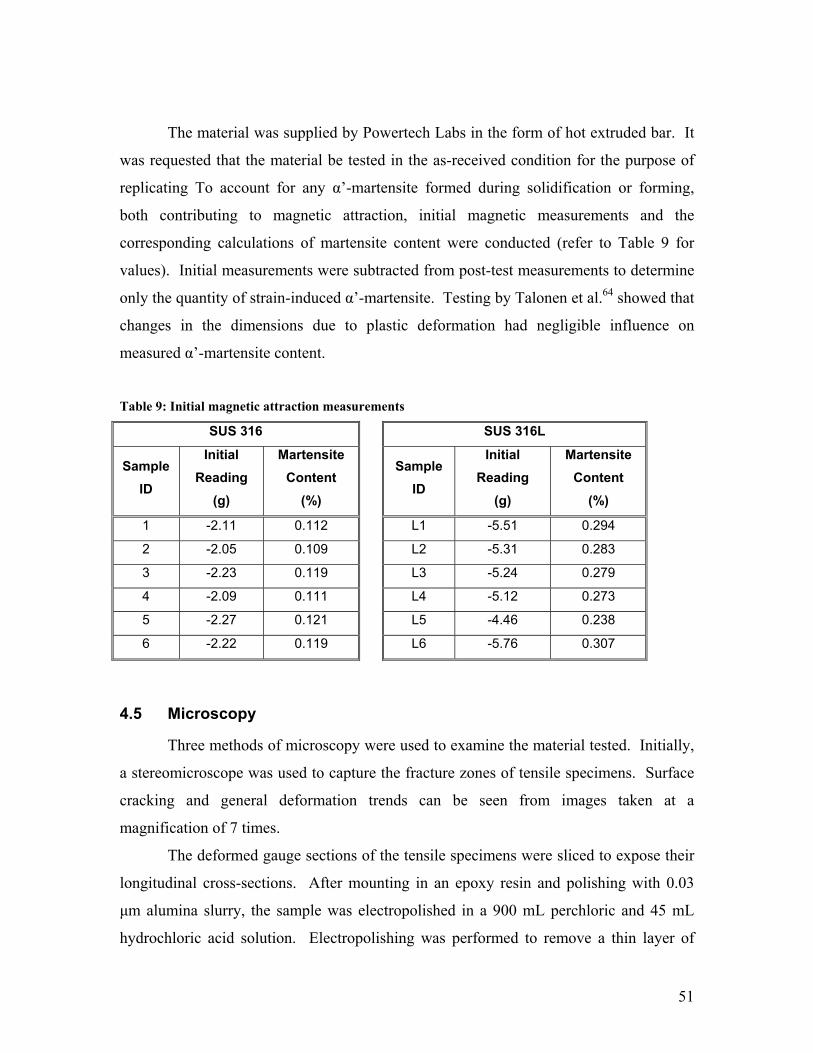
51
The material was supplied by Powertech Labs in the form of hot extruded bar. It
was requested that the material be tested in the as-received condition for the purpose of
replicating To account for any α’-martensite formed during solidification or forming,
both contributing to magnetic attraction, initial magnetic measurements and the
corresponding calculations of martensite content were conducted (refer to Table 9 for
values). Initial measurements were subtracted from post-test measurements to determine
only the quantity of strain-induced α’-martensite. Testing by Talonen et al.64 showed that
changes in the dimensions due to plastic deformation had negligible influence on
measured α’-martensite content.
Table 9: Initial magnetic attraction measurements
SUS 316 SUS 316L
Sample ID
Initial Reading
(g)
Martensite Content
(%)
Sample ID
Initial Reading
(g)
Martensite Content
(%)
1 -2.11 0.112 L1 -5.51 0.294
2 -2.05 0.109 L2 -5.31 0.283
3 -2.23 0.119 L3 -5.24 0.279
4 -2.09 0.111 L4 -5.12 0.273
5 -2.27 0.121 L5 -4.46 0.238
6 -2.22 0.119 L6 -5.76 0.307
4.5 Microscopy
Three methods of microscopy were used to examine the material tested. Initially,
a stereomicroscope was used to capture the fracture zones of tensile specimens. Surface
cracking and general deformation trends can be seen from images taken at a
magnification of 7 times.
The deformed gauge sections of the tensile specimens were sliced to expose their
longitudinal cross-sections. After mounting in an epoxy resin and polishing with 0.03
µm alumina slurry, the sample was electropolished in a 900 mL perchloric and 45 mL
hydrochloric acid solution. Electropolishing was performed to remove a thin layer of
52
material that may have been affected by mechanically polishing. The microstructure was
revealed by etching with a solution of 50 mL distilled water, 10 mL hydrochloric acid,
and 0.15 g potassium metabisulfite. Under a fume hood, the chemical attach continued
until the surface attained a faint brown hue. A Zeiss optical microscope was used to take
representative photos of the specimen microstructure at various magnifications.
Finally, the fracture surface of each specimen was viewed at high magnification
with a Hitachi S-2500 SEM. The SEM was used to ascertain more detailed features to
characterize the mode of failure. Representative micrographs were taken at a
magnification of one thousand times.
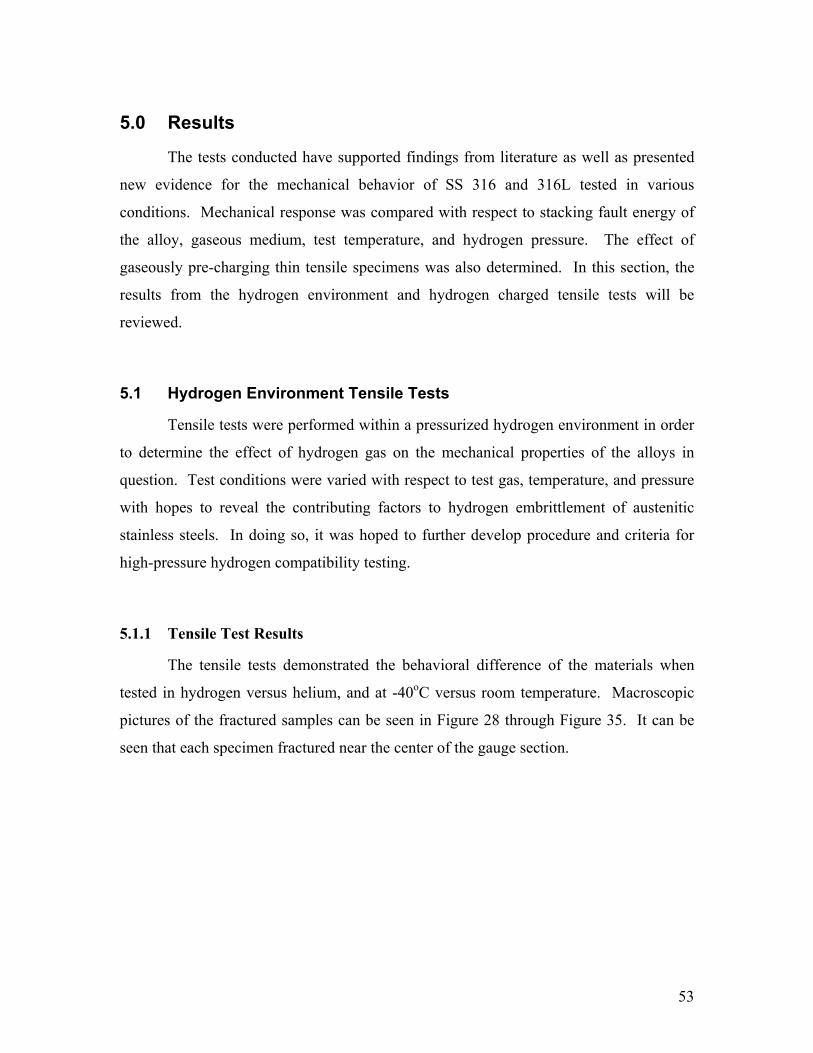
53
5.0 Results
The tests conducted have supported findings from literature as well as presented
new evidence for the mechanical behavior of SS 316 and 316L tested in various
conditions. Mechanical response was compared with respect to stacking fault energy of
the alloy, gaseous medium, test temperature, and hydrogen pressure. The effect of
gaseously pre-charging thin tensile specimens was also determined. In this section, the
results from the hydrogen environment and hydrogen charged tensile tests will be
reviewed.
5.1 Hydrogen Environment Tensile Tests
Tensile tests were performed within a pressurized hydrogen environment in order
to determine the effect of hydrogen gas on the mechanical properties of the alloys in
question. Test conditions were varied with respect to test gas, temperature, and pressure
with hopes to reveal the contributing factors to hydrogen embrittlement of austenitic
stainless steels. In doing so, it was hoped to further develop procedure and criteria for
high-pressure hydrogen compatibility testing.
5.1.1 Tensile Test Results
The tensile tests demonstrated the behavioral difference of the materials when
tested in hydrogen versus helium, and at -40oC versus room temperature. Macroscopic
pictures of the fractured samples can be seen in Figure 28 through Figure 35. It can be
seen that each specimen fractured near the center of the gauge section.
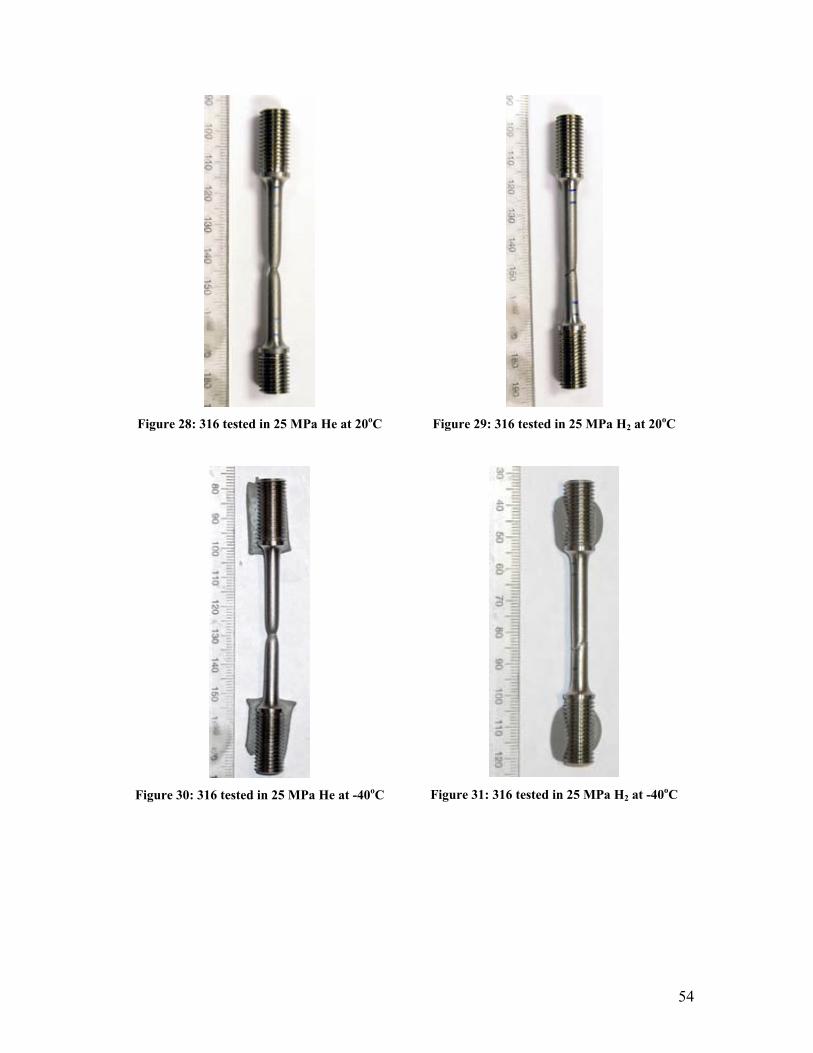
54
Figure 28: 316 tested in 25 MPa He at 20oC
Figure 29: 316 tested in 25 MPa H2 at 20oC
Figure 30: 316 tested in 25 MPa He at -40oC
Figure 31: 316 tested in 25 MPa H2 at -40oC
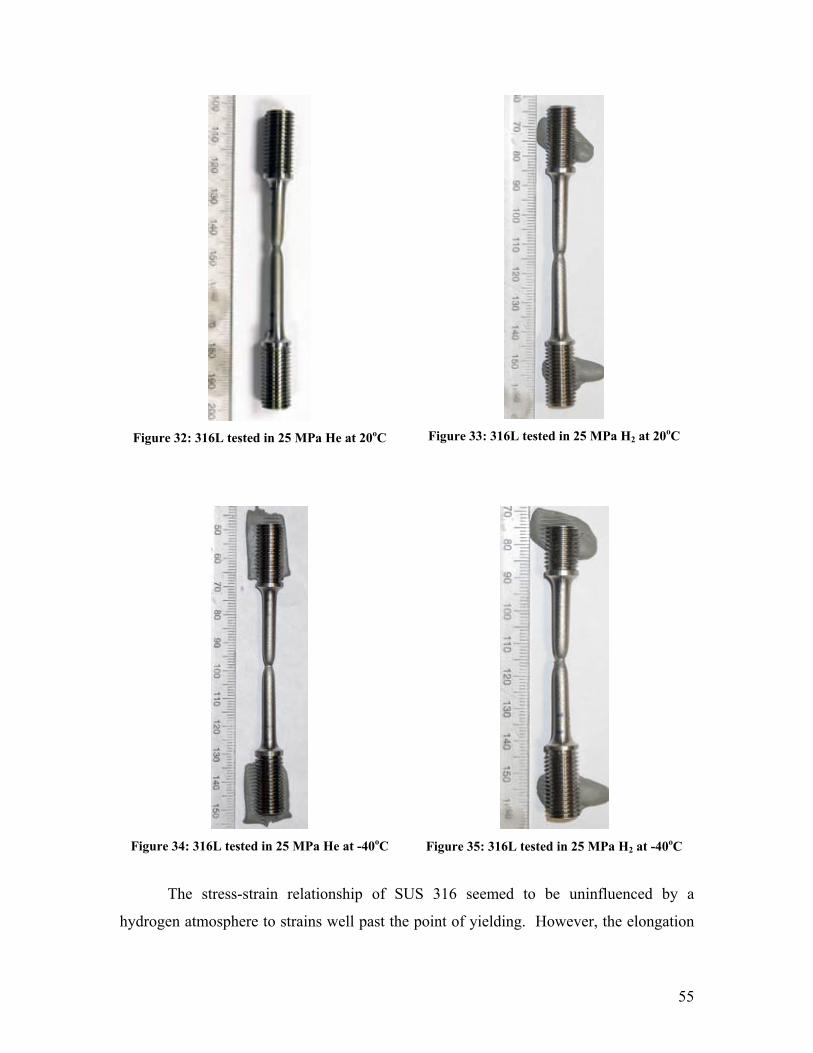
55
Figure 32: 316L tested in 25 MPa He at 20oC
Figure 33: 316L tested in 25 MPa H2 at 20oC
Figure 34: 316L tested in 25 MPa He at -40oC
Figure 35: 316L tested in 25 MPa H2 at -40oC
The stress-strain relationship of SUS 316 seemed to be uninfluenced by a
hydrogen atmosphere to strains well past the point of yielding. However, the elongation
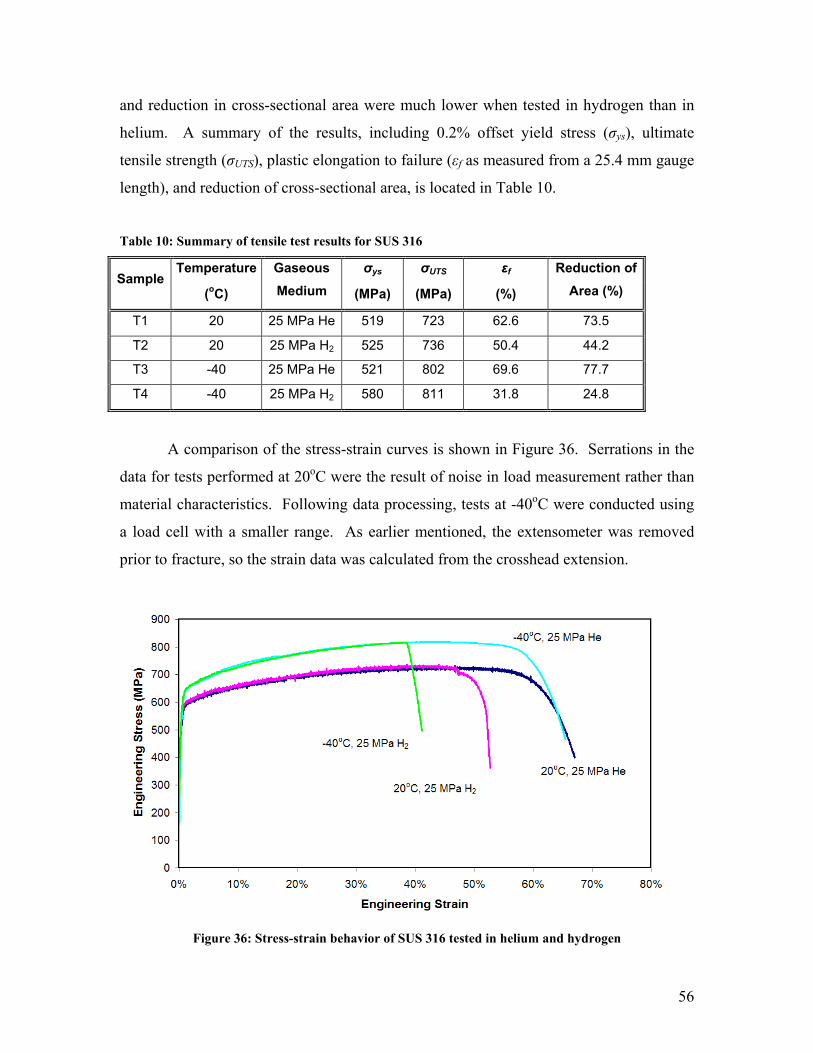
56
and reduction in cross-sectional area were much lower when tested in hydrogen than in
helium. A summary of the results, including 0.2% offset yield stress (σys), ultimate
tensile strength (σUTS), plastic elongation to failure (εf as measured from a 25.4 mm gauge
length), and reduction of cross-sectional area, is located in Table 10.
Table 10: Summary of tensile test results for SUS 316
Temperature σys σUTS εf Sample (oC)
Gaseous Medium (MPa) (MPa) (%)
Reduction of Area (%)
T1 20 25 MPa He 519 723 62.6 73.5
T2 20 25 MPa H2 525 736 50.4 44.2
T3 -40 25 MPa He 521 802 69.6 77.7
T4 -40 25 MPa H2 580 811 31.8 24.8
A comparison of the stress-strain curves is shown in Figure 36. Serrations in the
data for tests performed at 20oC were the result of noise in load measurement rather than
material characteristics. Following data processing, tests at -40oC were conducted using
a load cell with a smaller range. As earlier mentioned, the extensometer was removed
prior to fracture, so the strain data was calculated from the crosshead extension.
Figure 36: Stress-strain behavior of SUS 316 tested in helium and hydrogen
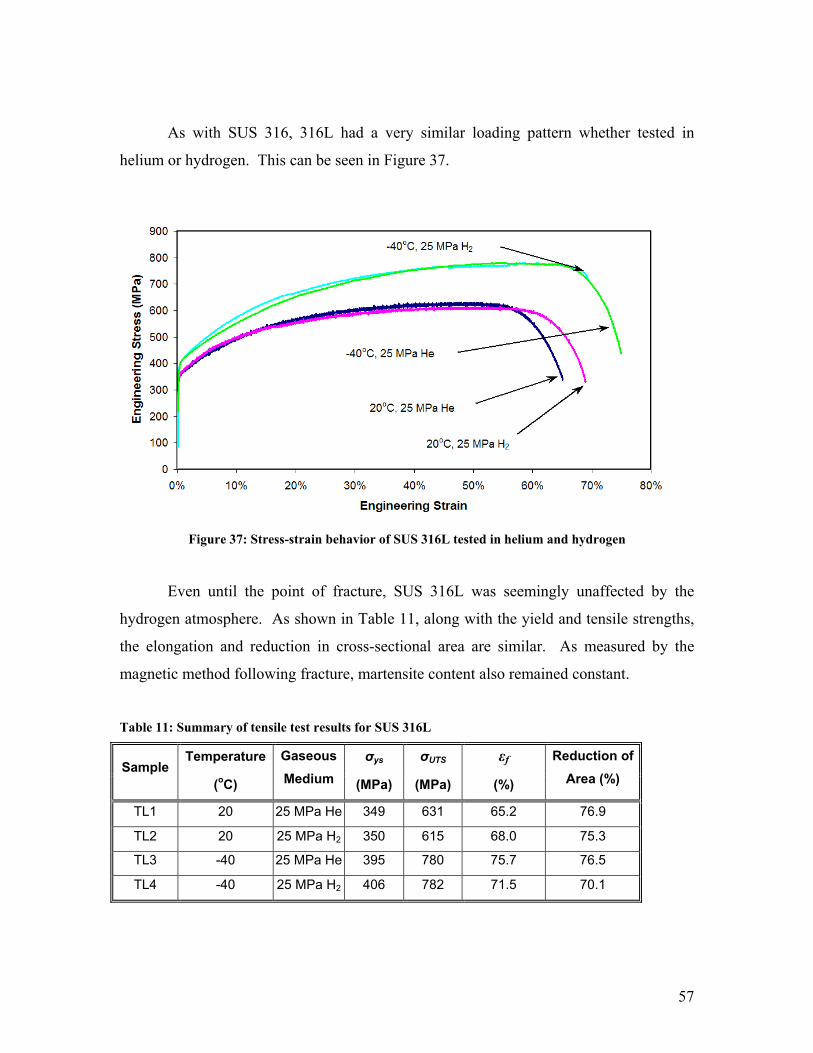
57
As with SUS 316, 316L had a very similar loading pattern whether tested in
helium or hydrogen. This can be seen in Figure 37.
Figure 37: Stress-strain behavior of SUS 316L tested in helium and hydrogen
Even until the point of fracture, SUS 316L was seemingly unaffected by the
hydrogen atmosphere. As shown in Table 11, along with the yield and tensile strengths,
the elongation and reduction in cross-sectional area are similar. As measured by the
magnetic method following fracture, martensite content also remained constant.
Table 11: Summary of tensile test results for SUS 316L
Temperature σys σUTS εf Sample (oC)
Gaseous Medium (MPa) (MPa) (%)
Reduction of Area (%)
TL1 20 25 MPa He 349 631 65.2 76.9
TL2 20 25 MPa H2 350 615 68.0 75.3
TL3 -40 25 MPa He 395 780 75.7 76.5
TL4 -40 25 MPa H2 406 782 71.5 70.1
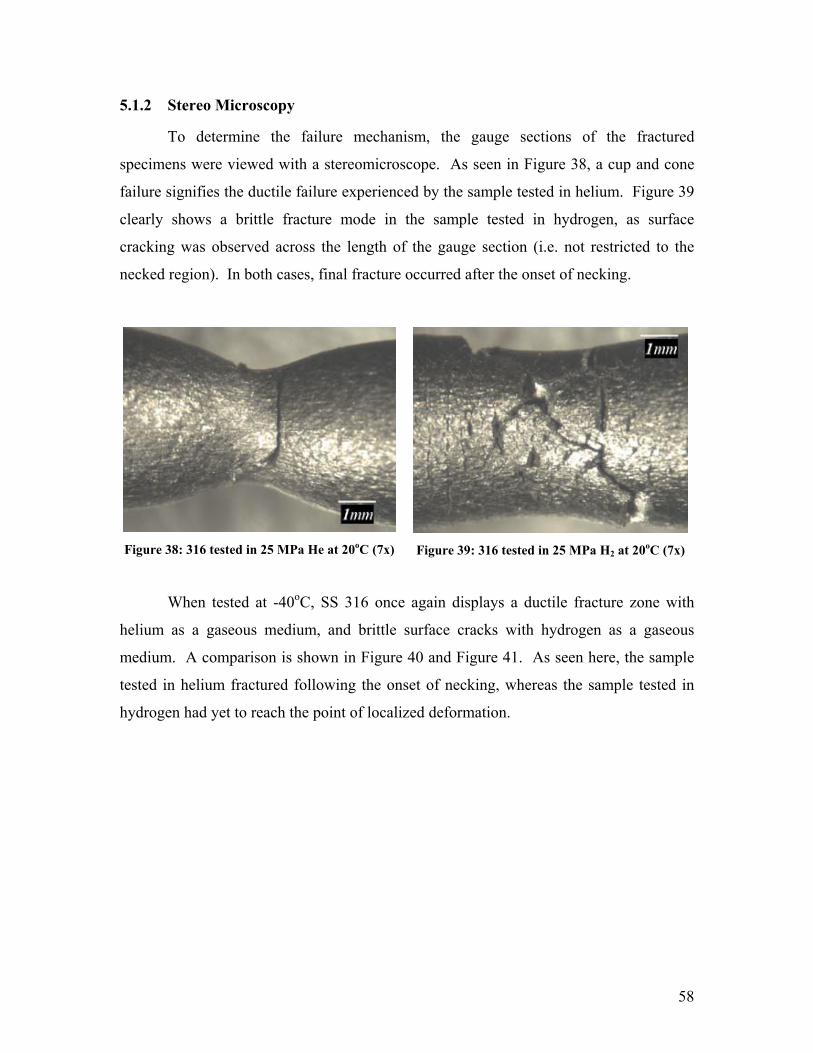
58
5.1.2 Stereo Microscopy
To determine the failure mechanism, the gauge sections of the fractured
specimens were viewed with a stereomicroscope. As seen in Figure 38, a cup and cone
failure signifies the ductile failure experienced by the sample tested in helium. Figure 39
clearly shows a brittle fracture mode in the sample tested in hydrogen, as surface
cracking was observed across the length of the gauge section (i.e. not restricted to the
necked region). In both cases, final fracture occurred after the onset of necking.
When tested at -40oC, SS 316 once again displays a ductile fracture zone with
helium as a gaseous medium, and brittle surface cracks with hydrogen as a gaseous
medium. A comparison is shown in Figure 40 and Figure 41. As seen here, the sample
tested in helium fractured following the onset of necking, whereas the sample tested in
hydrogen had yet to reach the point of localized deformation.
Figure 38: 316 tested in 25 MPa He at 20oC (7x) Figure 39: 316 tested in 25 MPa H2 at 20oC (7x)
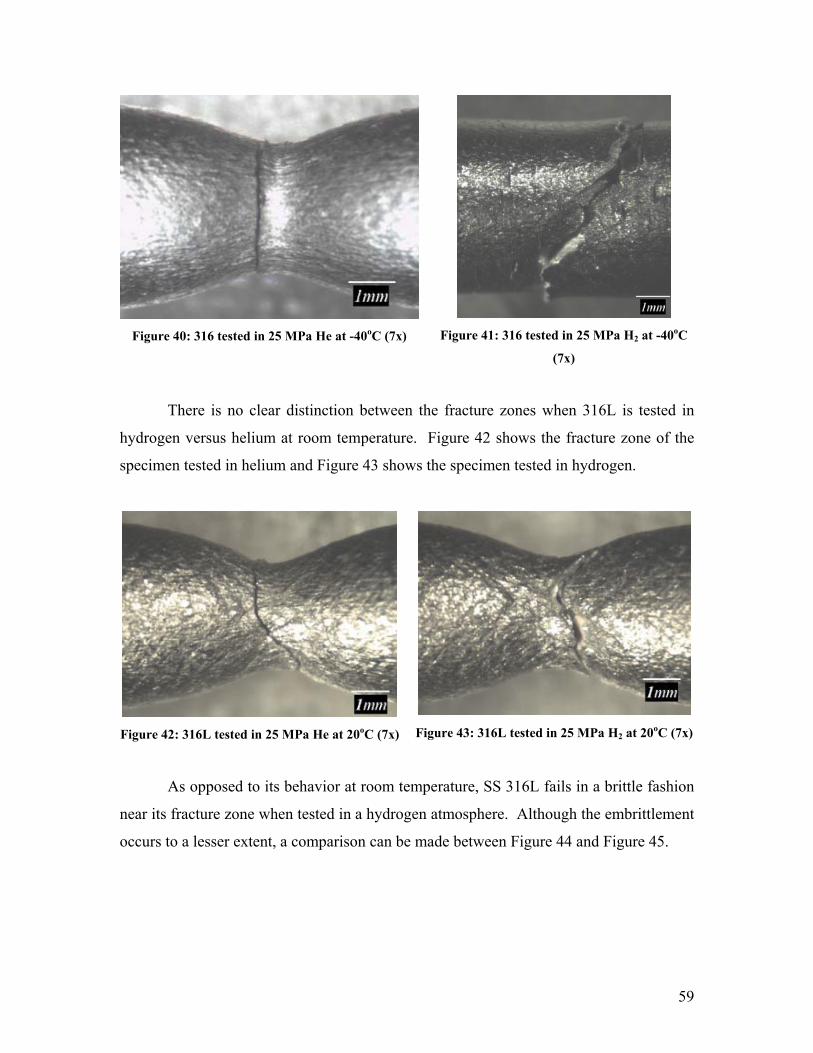
59
Figure 40: 316 tested in 25 MPa He at -40oC (7x)
Figure 41: 316 tested in 25 MPa H2 at -40oC
(7x)
There is no clear distinction between the fracture zones when 316L is tested in
hydrogen versus helium at room temperature. Figure 42 shows the fracture zone of the
specimen tested in helium and Figure 43 shows the specimen tested in hydrogen.
Figure 42: 316L tested in 25 MPa He at 20oC (7x)
Figure 43: 316L tested in 25 MPa H2 at 20oC (7x)
As opposed to its behavior at room temperature, SS 316L fails in a brittle fashion
near its fracture zone when tested in a hydrogen atmosphere. Although the embrittlement
occurs to a lesser extent, a comparison can be made between Figure 44 and Figure 45.
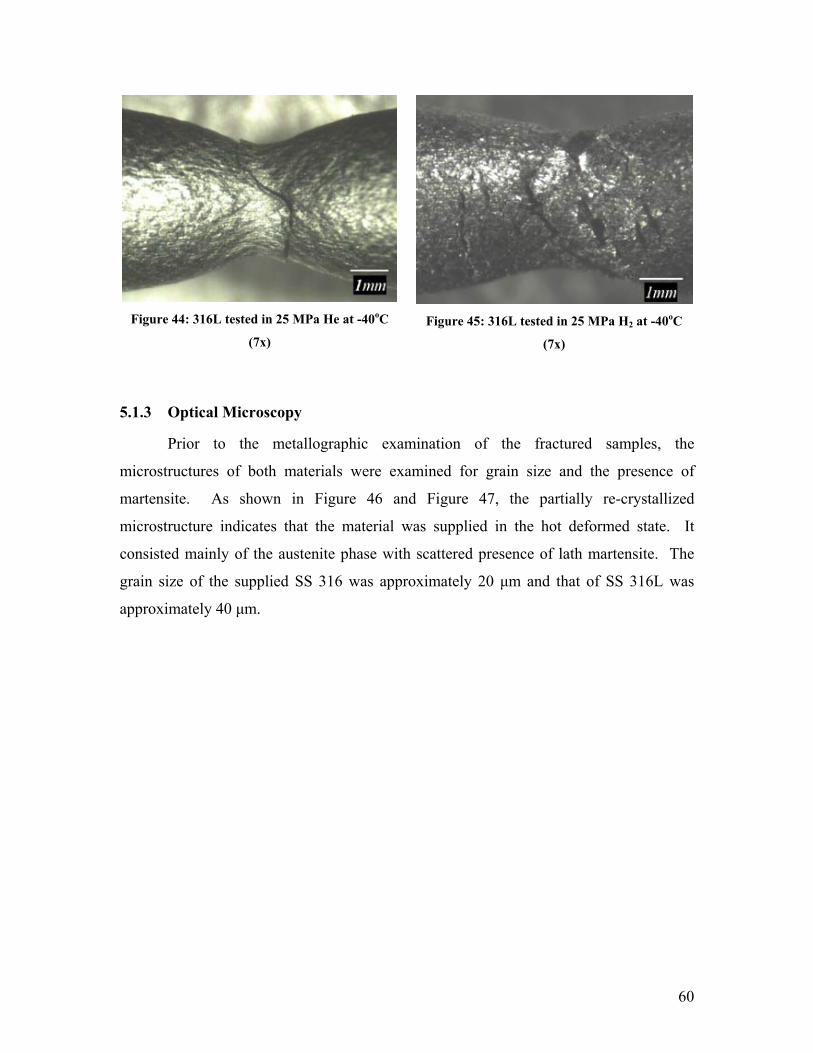
60
Figure 44: 316L tested in 25 MPa He at -40oC
(7x)
Figure 45: 316L tested in 25 MPa H2 at -40oC
(7x)
5.1.3 Optical Microscopy
Prior to the metallographic examination of the fractured samples, the
microstructures of both materials were examined for grain size and the presence of
martensite. As shown in Figure 46 and Figure 47, the partially re-crystallized
microstructure indicates that the material was supplied in the hot deformed state. It
consisted mainly of the austenite phase with scattered presence of lath martensite. The
grain size of the supplied SS 316 was approximately 20 µm and that of SS 316L was
approximately 40 µm.
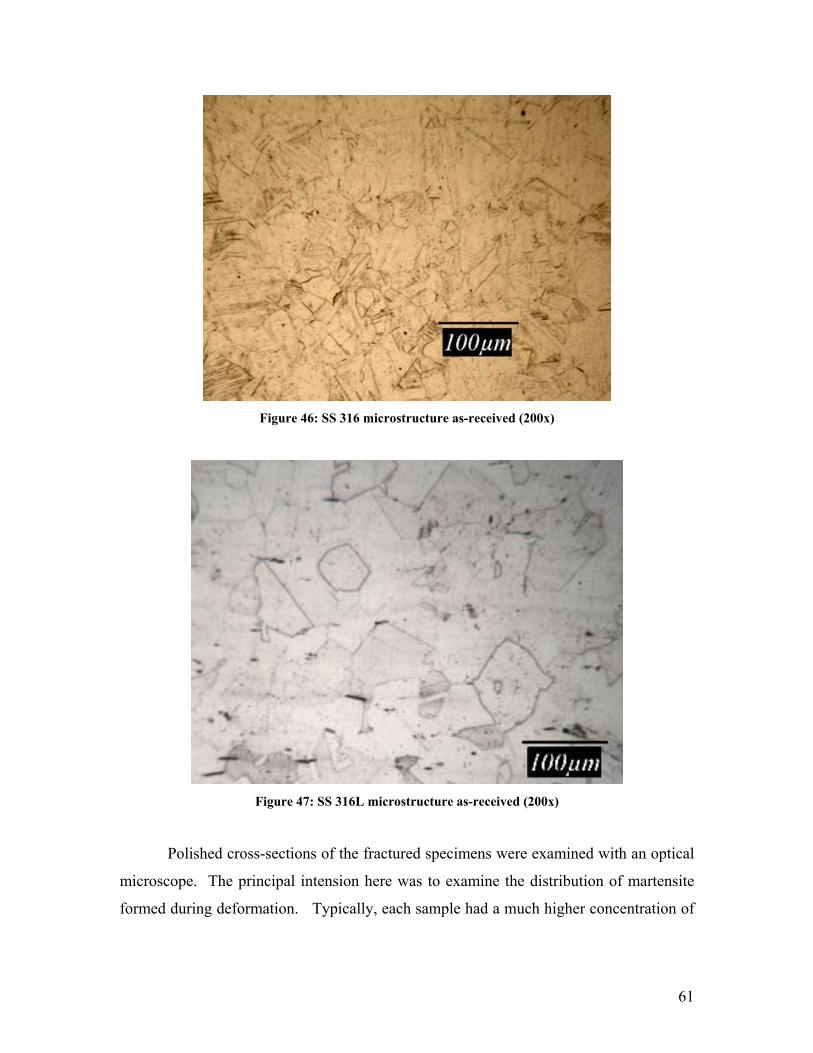
61
Figure 46: SS 316 microstructure as-received (200x)
Figure 47: SS 316L microstructure as-received (200x)
Polished cross-sections of the fractured specimens were examined with an optical
microscope. The principal intension here was to examine the distribution of martensite
formed during deformation. Typically, each sample had a much higher concentration of
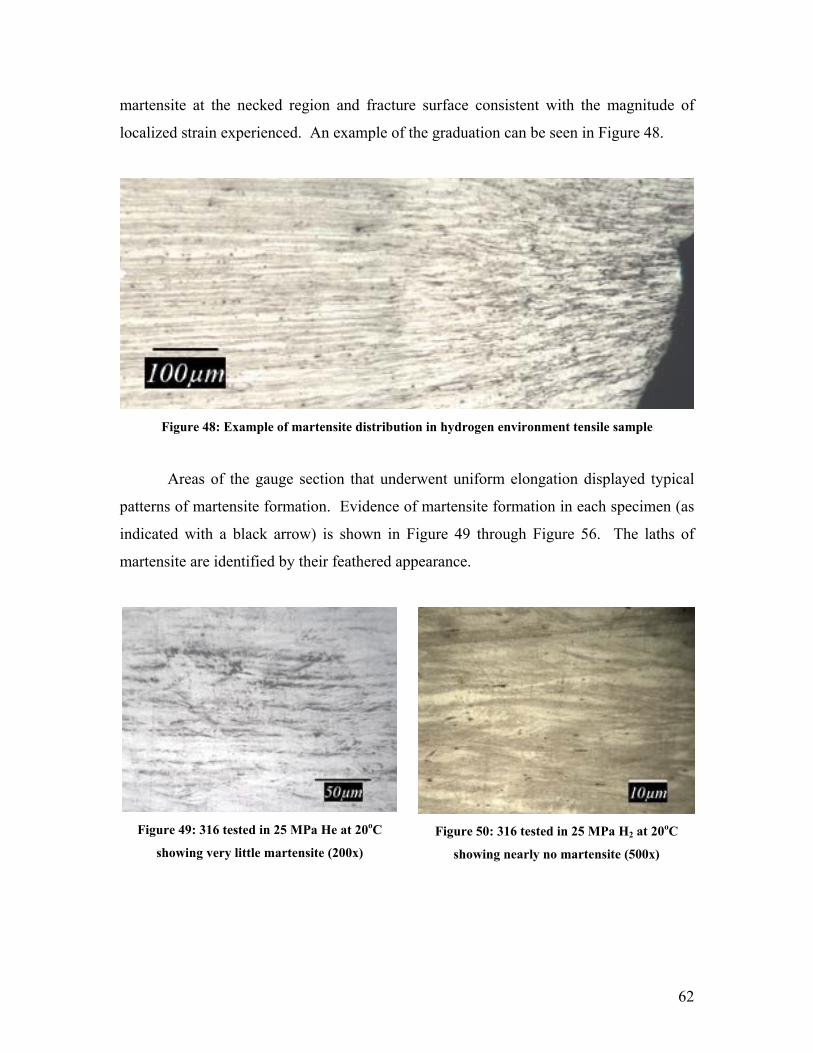
62
martensite at the necked region and fracture surface consistent with the magnitude of
localized strain experienced. An example of the graduation can be seen in Figure 48.
Figure 48: Example of martensite distribution in hydrogen environment tensile sample
Areas of the gauge section that underwent uniform elongation displayed typical
patterns of martensite formation. Evidence of martensite formation in each specimen (as
indicated with a black arrow) is shown in Figure 49 through Figure 56. The laths of
martensite are identified by their feathered appearance.
Figure 49: 316 tested in 25 MPa He at 20oC
showing very little martensite (200x)
Figure 50: 316 tested in 25 MPa H2 at 20oC
showing nearly no martensite (500x)
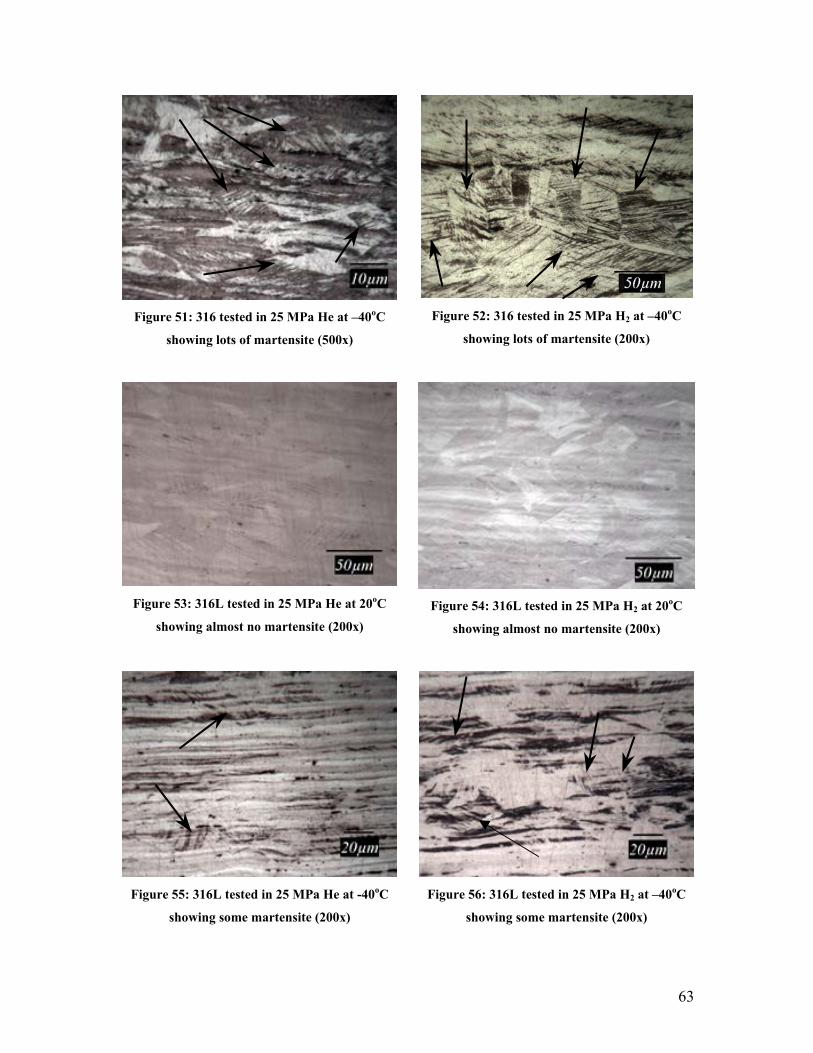
63
Figure 51: 316 tested in 25 MPa He at –40oC
showing lots of martensite (500x)
Figure 52: 316 tested in 25 MPa H2 at –40oC
showing lots of martensite (200x)
Figure 53: 316L tested in 25 MPa He at 20oC
showing almost no martensite (200x)
Figure 54: 316L tested in 25 MPa H2 at 20oC
showing almost no martensite (200x)
Figure 55: 316L tested in 25 MPa He at -40oC
showing some martensite (200x)
Figure 56: 316L tested in 25 MPa H2 at –40oC
showing some martensite (200x)
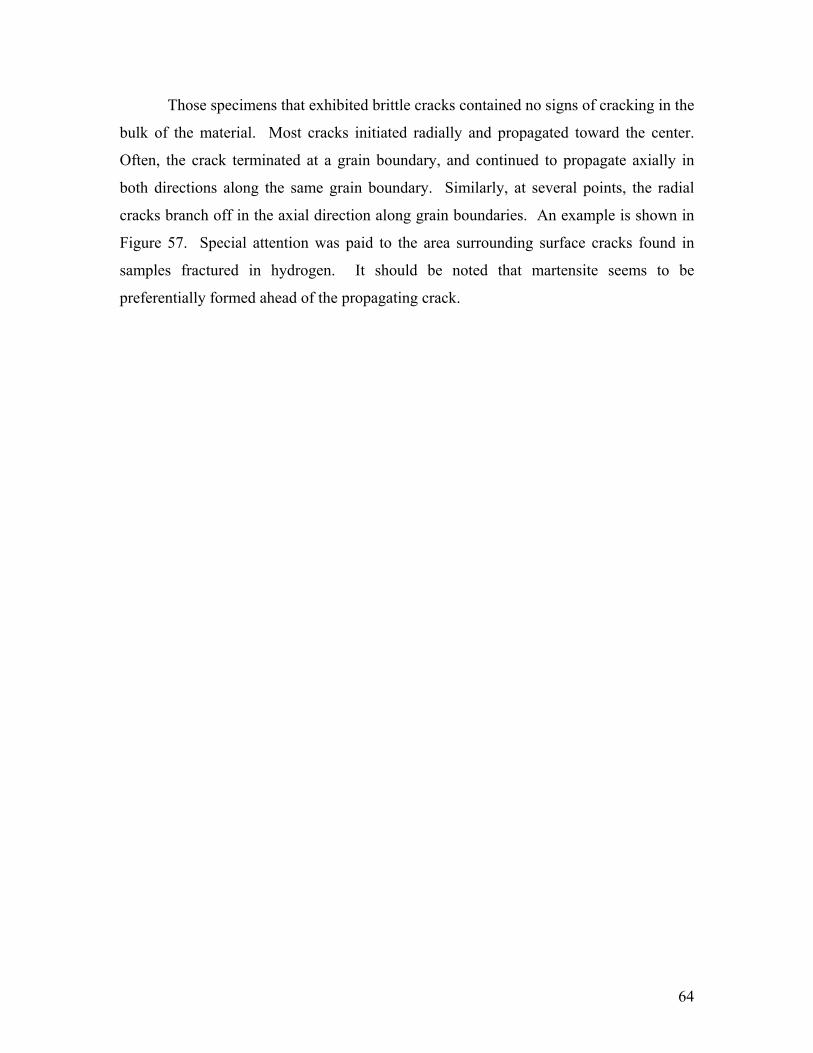
64
Those specimens that exhibited brittle cracks contained no signs of cracking in the
bulk of the material. Most cracks initiated radially and propagated toward the center.
Often, the crack terminated at a grain boundary, and continued to propagate axially in
both directions along the same grain boundary. Similarly, at several points, the radial
cracks branch off in the axial direction along grain boundaries. An example is shown in
Figure 57. Special attention was paid to the area surrounding surface cracks found in
samples fractured in hydrogen. It should be noted that martensite seems to be
preferentially formed ahead of the propagating crack.
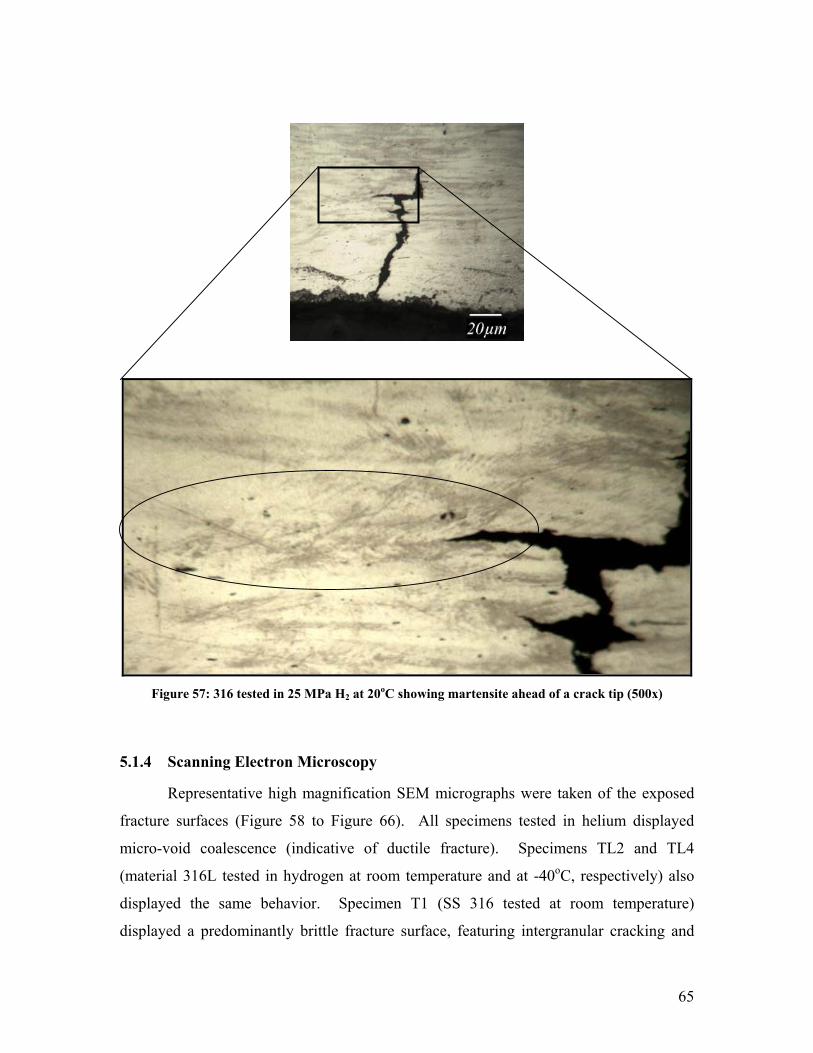
65
Figure 57: 316 tested in 25 MPa H2 at 20oC showing martensite ahead of a crack tip (500x)
5.1.4 Scanning Electron Microscopy
Representative high magnification SEM micrographs were taken of the exposed
fracture surfaces (Figure 58 to Figure 66). All specimens tested in helium displayed
micro-void coalescence (indicative of ductile fracture). Specimens TL2 and TL4
(material 316L tested in hydrogen at room temperature and at -40oC, respectively) also
displayed the same behavior. Specimen T1 (SS 316 tested at room temperature)
displayed a predominantly brittle fracture surface, featuring intergranular cracking and
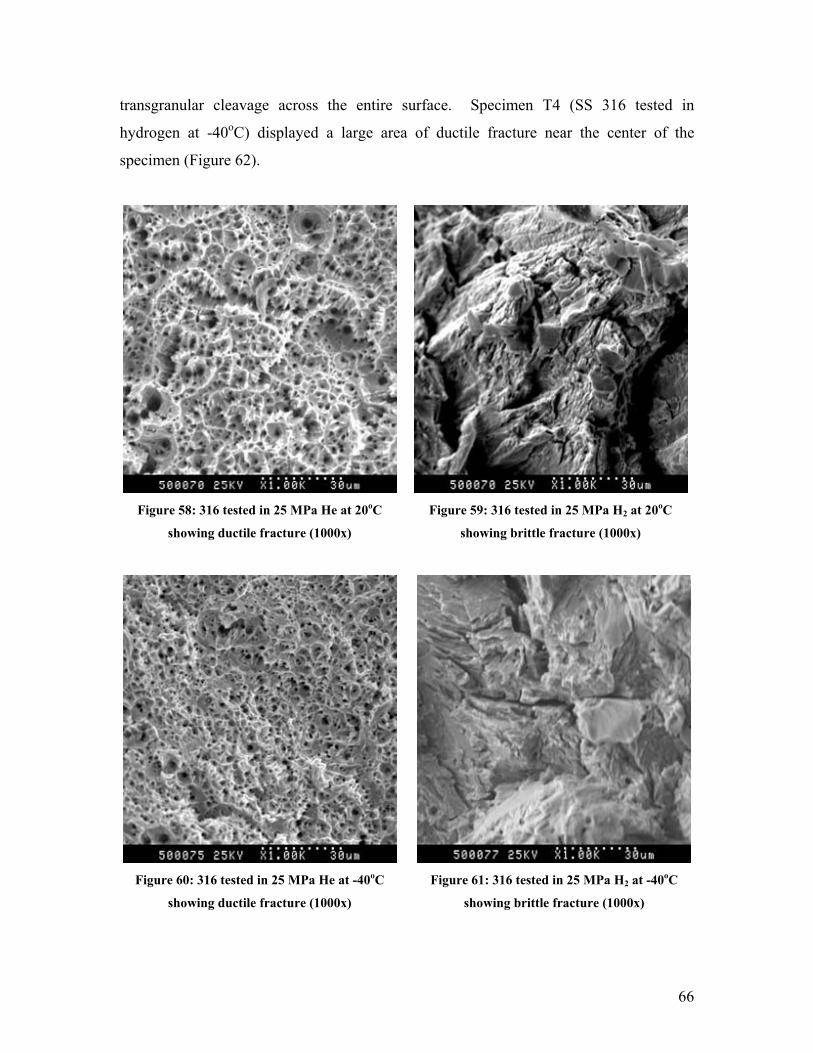
66
transgranular cleavage across the entire surface. Specimen T4 (SS 316 tested in
hydrogen at -40oC) displayed a large area of ductile fracture near the center of the
specimen (Figure 62).
Figure 58: 316 tested in 25 MPa He at 20oC
showing ductile fracture (1000x)
Figure 59: 316 tested in 25 MPa H2 at 20oC
showing brittle fracture (1000x)
Figure 60: 316 tested in 25 MPa He at -40oC
showing ductile fracture (1000x)
Figure 61: 316 tested in 25 MPa H2 at -40oC
showing brittle fracture (1000x)
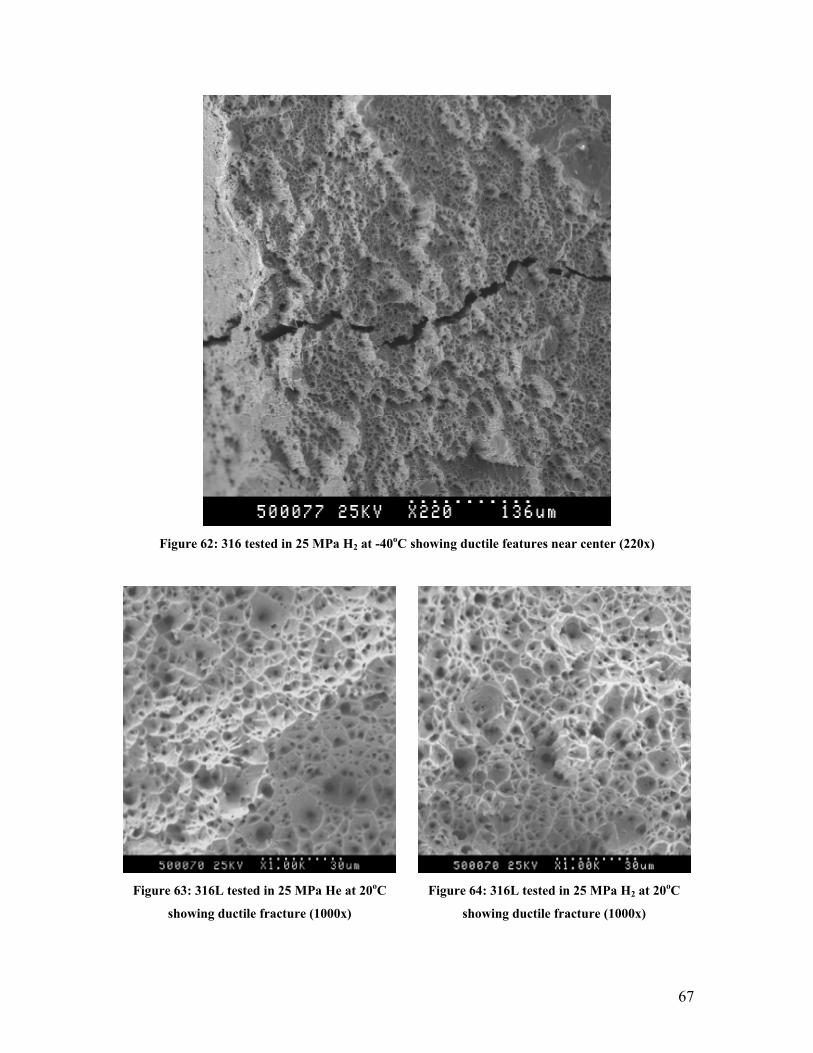
67
Figure 62: 316 tested in 25 MPa H2 at -40oC showing ductile features near center (220x)
Figure 63: 316L tested in 25 MPa He at 20oC
showing ductile fracture (1000x)
Figure 64: 316L tested in 25 MPa H2 at 20oC
showing ductile fracture (1000x)
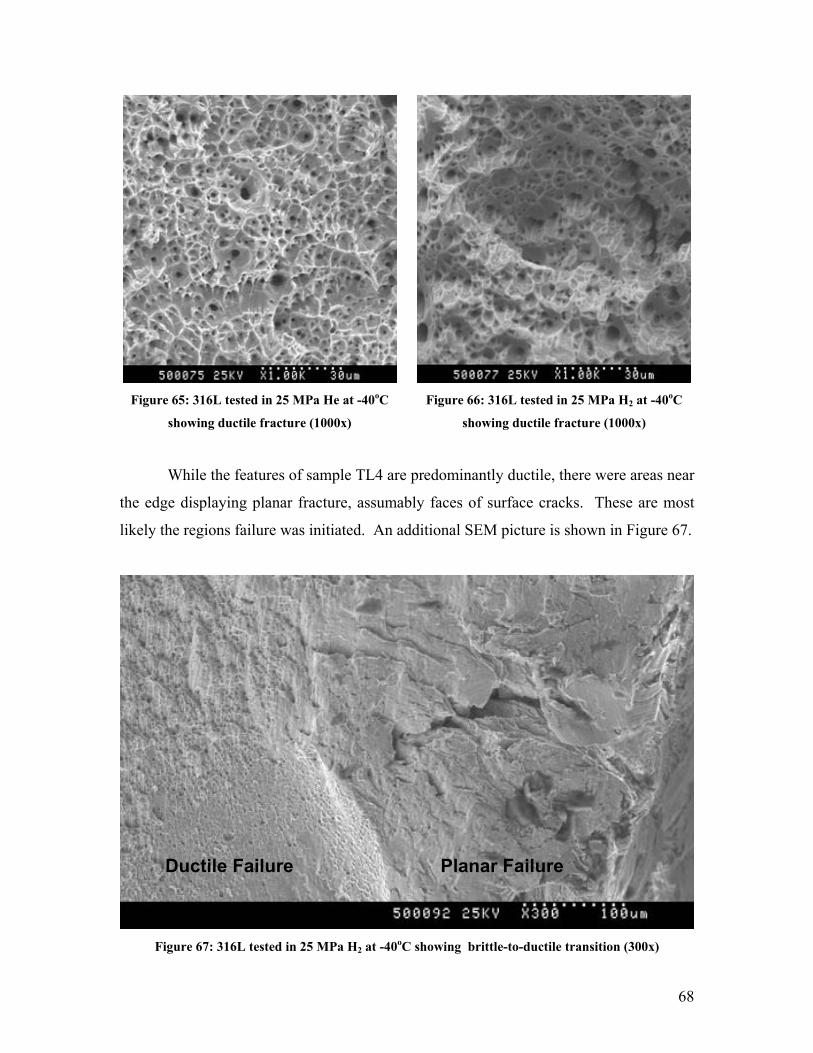
68
Figure 65: 316L tested in 25 MPa He at -40oC
showing ductile fracture (1000x)
Figure 66: 316L tested in 25 MPa H2 at -40oC
showing ductile fracture (1000x)
While the features of sample TL4 are predominantly ductile, there were areas near
the edge displaying planar fracture, assumably faces of surface cracks. These are most
likely the regions failure was initiated. An additional SEM picture is shown in Figure 67.
Figure 67: 316L tested in 25 MPa H2 at -40oC showing brittle-to-ductile transition (300x)
Ductile Failure Planar Failure
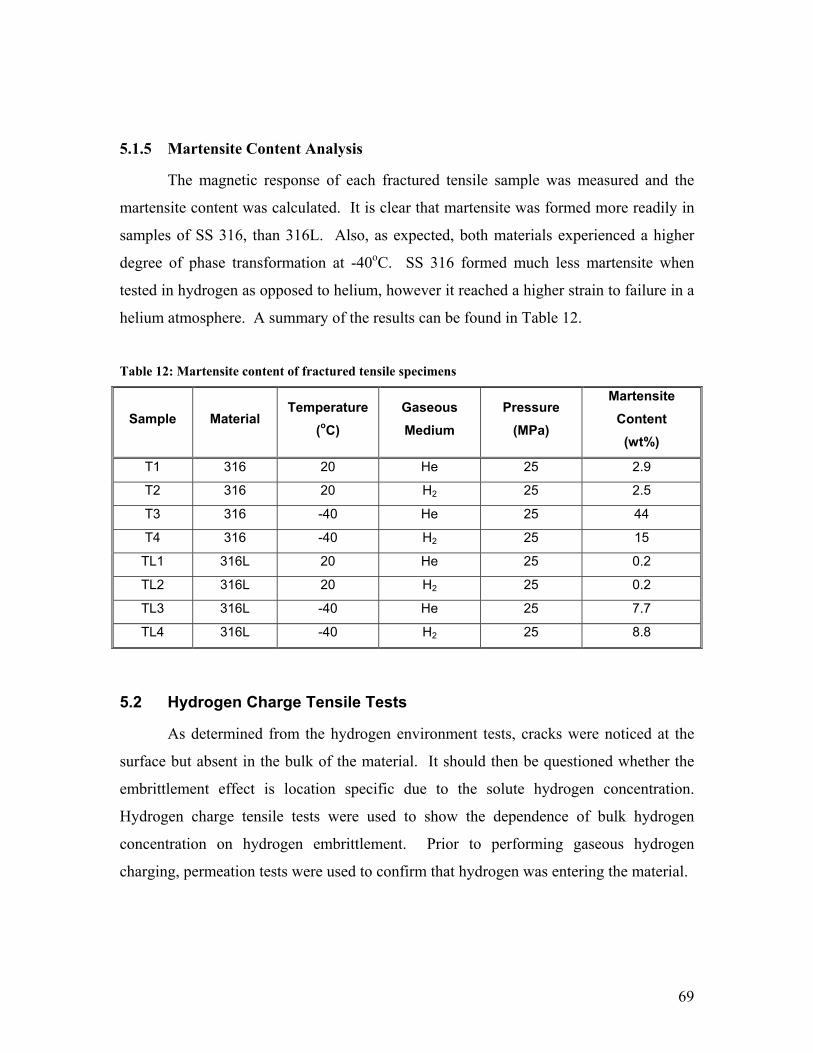
69
5.1.5 Martensite Content Analysis
The magnetic response of each fractured tensile sample was measured and the
martensite content was calculated. It is clear that martensite was formed more readily in
samples of SS 316, than 316L. Also, as expected, both materials experienced a higher
degree of phase transformation at -40oC. SS 316 formed much less martensite when
tested in hydrogen as opposed to helium, however it reached a higher strain to failure in a
helium atmosphere. A summary of the results can be found in Table 12.
Table 12: Martensite content of fractured tensile specimens
Sample Material Temperature
(oC) Gaseous Medium
Pressure (MPa)
Martensite Content
(wt%)
T1 316 20 He 25 2.9
T2 316 20 H2 25 2.5
T3 316 -40 He 25 44
T4 316 -40 H2 25 15
TL1 316L 20 He 25 0.2
TL2 316L 20 H2 25 0.2
TL3 316L -40 He 25 7.7
TL4 316L -40 H2 25 8.8
5.2 Hydrogen Charge Tensile Tests
As determined from the hydrogen environment tests, cracks were noticed at the
surface but absent in the bulk of the material. It should then be questioned whether the
embrittlement effect is location specific due to the solute hydrogen concentration.
Hydrogen charge tensile tests were used to show the dependence of bulk hydrogen
concentration on hydrogen embrittlement. Prior to performing gaseous hydrogen
charging, permeation tests were used to confirm that hydrogen was entering the material.
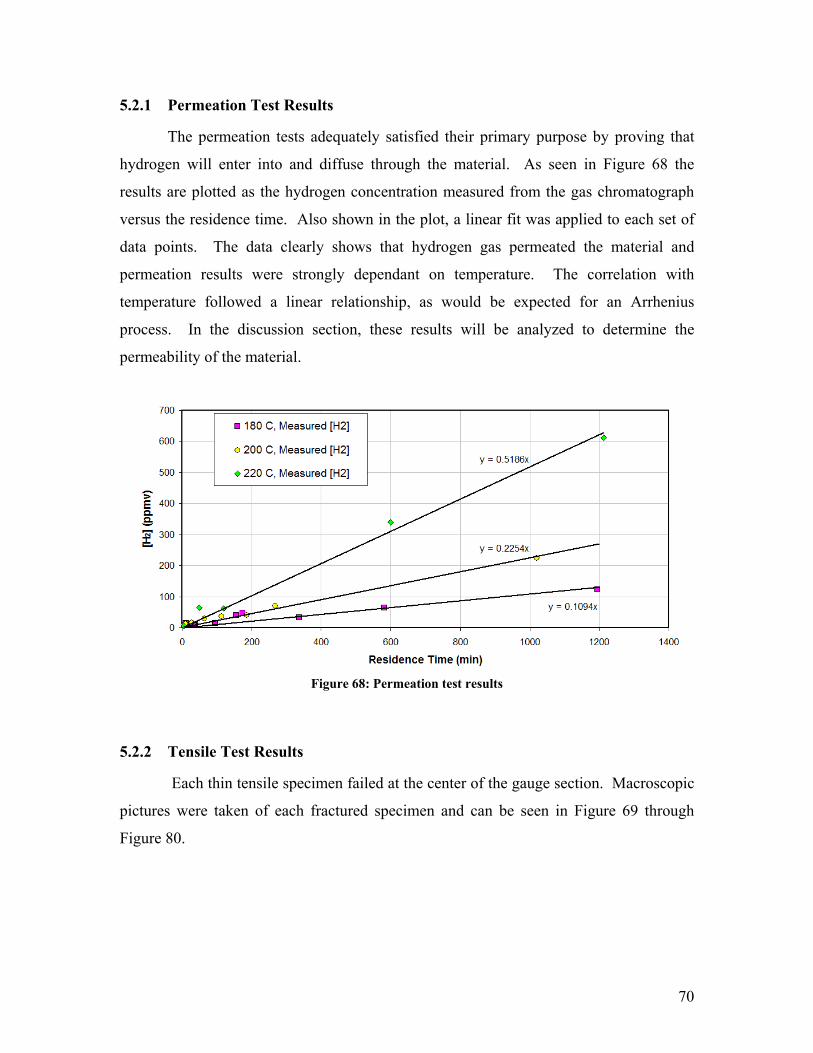
70
5.2.1 Permeation Test Results
The permeation tests adequately satisfied their primary purpose by proving that
hydrogen will enter into and diffuse through the material. As seen in Figure 68 the
results are plotted as the hydrogen concentration measured from the gas chromatograph
versus the residence time. Also shown in the plot, a linear fit was applied to each set of
data points. The data clearly shows that hydrogen gas permeated the material and
permeation results were strongly dependant on temperature. The correlation with
temperature followed a linear relationship, as would be expected for an Arrhenius
process. In the discussion section, these results will be analyzed to determine the
permeability of the material.
Figure 68: Permeation test results
5.2.2 Tensile Test Results
Each thin tensile specimen failed at the center of the gauge section. Macroscopic
pictures were taken of each fractured specimen and can be seen in Figure 69 through
Figure 80.
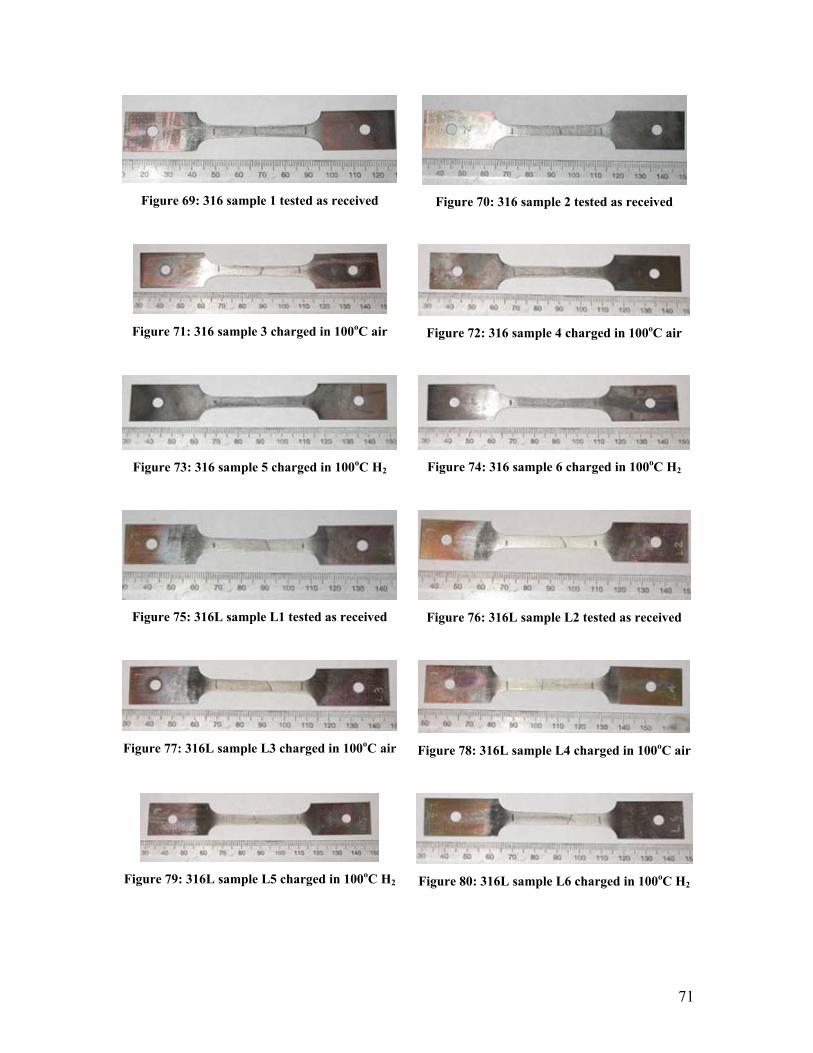
71
Figure 69: 316 sample 1 tested as received
Figure 70: 316 sample 2 tested as received
Figure 71: 316 sample 3 charged in 100oC air
Figure 72: 316 sample 4 charged in 100oC air
Figure 73: 316 sample 5 charged in 100oC H2
Figure 74: 316 sample 6 charged in 100oC H2
Figure 75: 316L sample L1 tested as received
Figure 76: 316L sample L2 tested as received
Figure 77: 316L sample L3 charged in 100oC air
Figure 78: 316L sample L4 charged in 100oC air
Figure 79: 316L sample L5 charged in 100oC H2
Figure 80: 316L sample L6 charged in 100oC H2
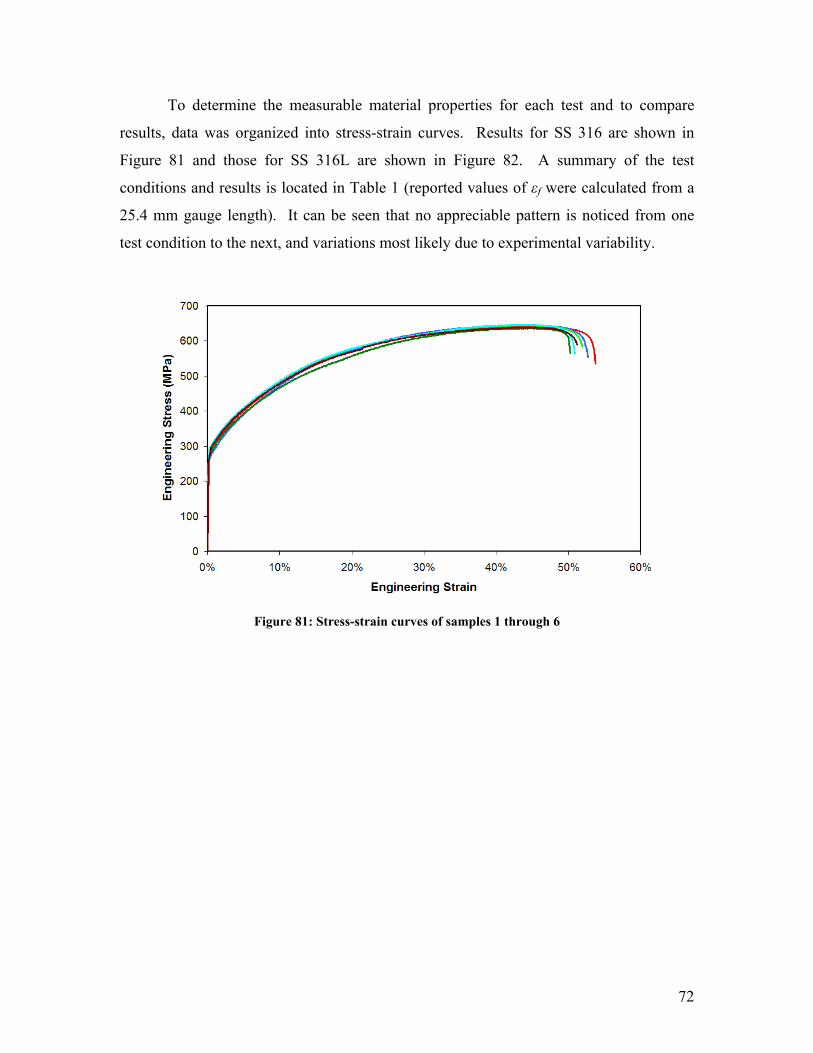
72
To determine the measurable material properties for each test and to compare
results, data was organized into stress-strain curves. Results for SS 316 are shown in
Figure 81 and those for SS 316L are shown in Figure 82. A summary of the test
conditions and results is located in Table 1 (reported values of εf were calculated from a
25.4 mm gauge length). It can be seen that no appreciable pattern is noticed from one
test condition to the next, and variations most likely due to experimental variability.
Figure 81: Stress-strain curves of samples 1 through 6
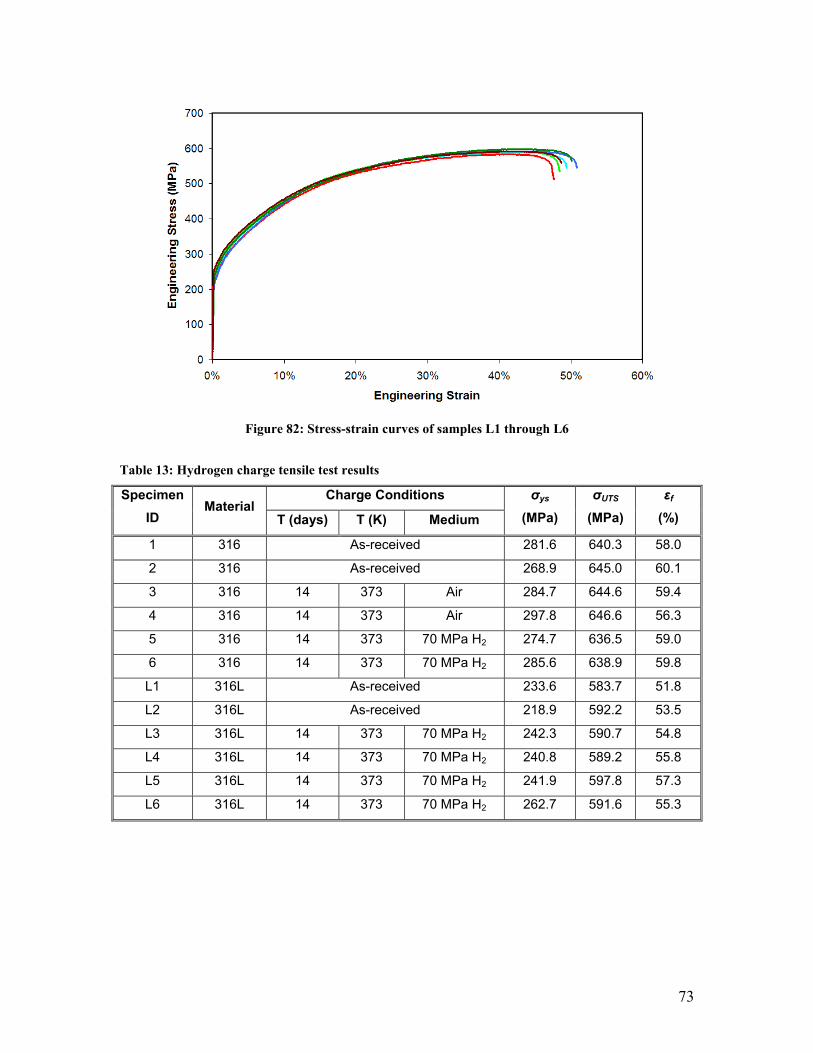
73
Figure 82: Stress-strain curves of samples L1 through L6
Table 13: Hydrogen charge tensile test results
Charge Conditions Specimen ID
Material T (days) T (K) Medium
σys (MPa)
σUTS (MPa)
εf
(%)
1 316 As-received 281.6 640.3 58.0
2 316 As-received 268.9 645.0 60.1
3 316 14 373 Air 284.7 644.6 59.4
4 316 14 373 Air 297.8 646.6 56.3
5 316 14 373 70 MPa H2 274.7 636.5 59.0
6 316 14 373 70 MPa H2 285.6 638.9 59.8
L1 316L As-received 233.6 583.7 51.8
L2 316L As-received 218.9 592.2 53.5
L3 316L 14 373 70 MPa H2 242.3 590.7 54.8
L4 316L 14 373 70 MPa H2 240.8 589.2 55.8
L5 316L 14 373 70 MPa H2 241.9 597.8 57.3
L6 316L 14 373 70 MPa H2 262.7 591.6 55.3
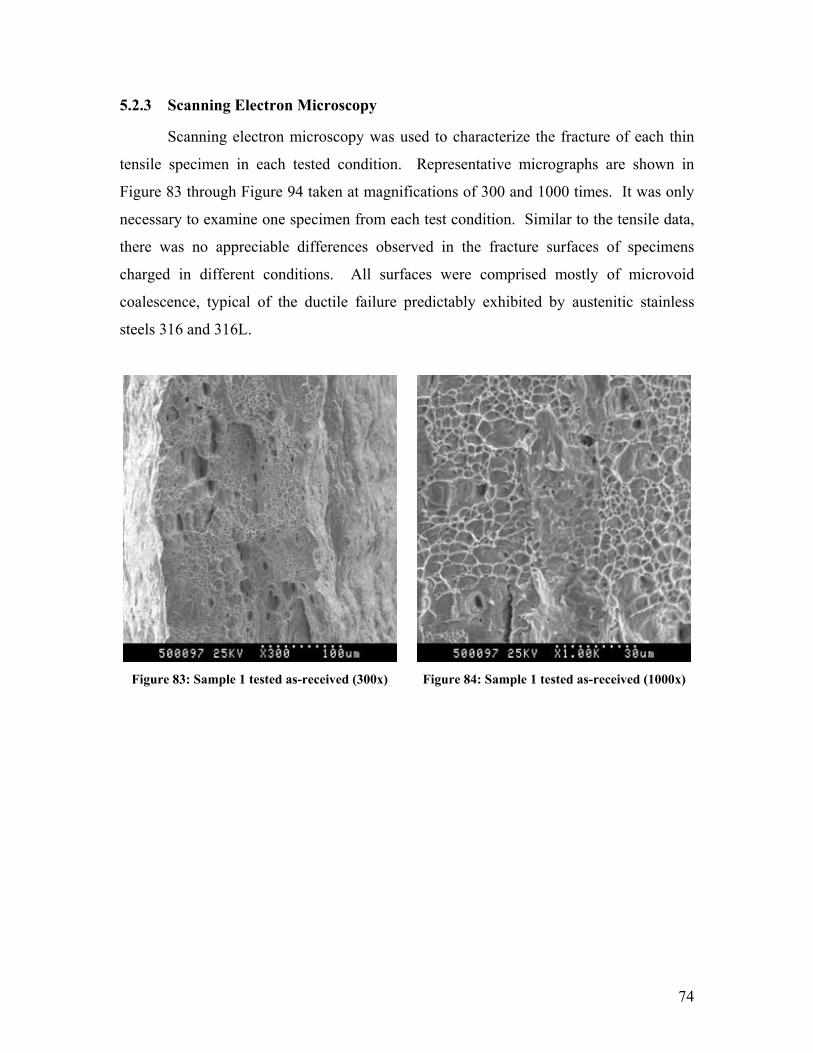
74
5.2.3 Scanning Electron Microscopy
Scanning electron microscopy was used to characterize the fracture of each thin
tensile specimen in each tested condition. Representative micrographs are shown in
Figure 83 through Figure 94 taken at magnifications of 300 and 1000 times. It was only
necessary to examine one specimen from each test condition. Similar to the tensile data,
there was no appreciable differences observed in the fracture surfaces of specimens
charged in different conditions. All surfaces were comprised mostly of microvoid
coalescence, typical of the ductile failure predictably exhibited by austenitic stainless
steels 316 and 316L.
Figure 83: Sample 1 tested as-received (300x)
Figure 84: Sample 1 tested as-received (1000x)
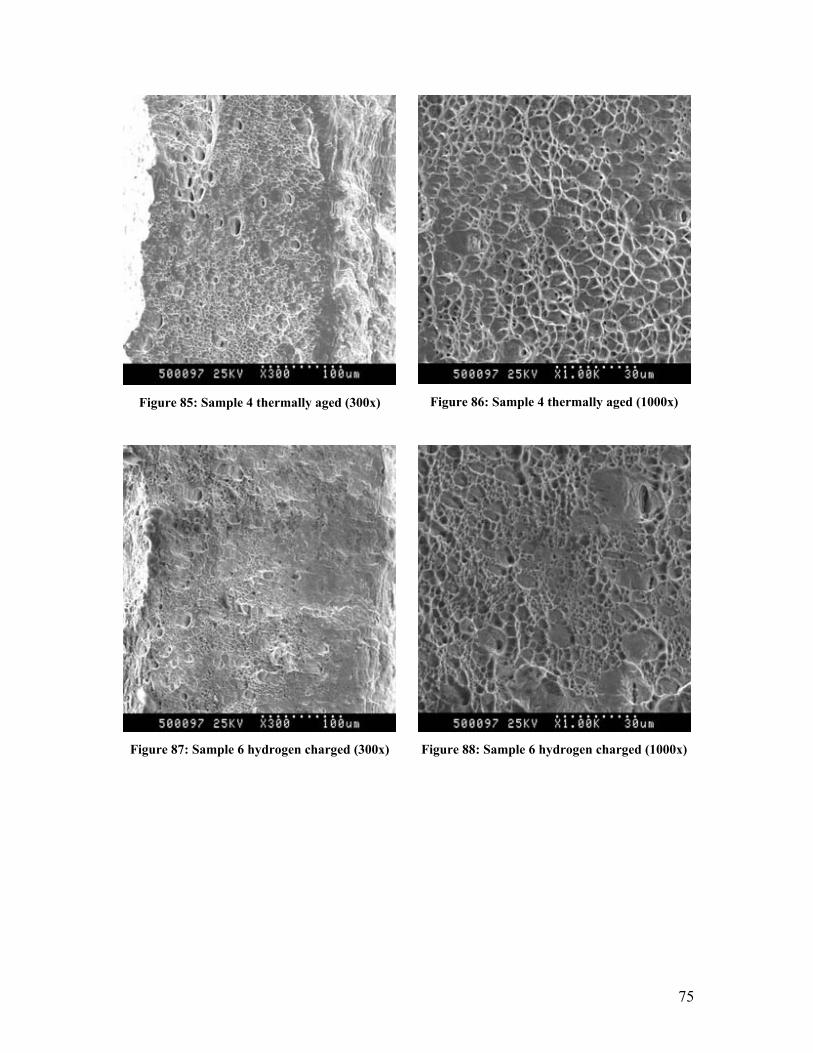
75
Figure 85: Sample 4 thermally aged (300x)
Figure 86: Sample 4 thermally aged (1000x)
Figure 87: Sample 6 hydrogen charged (300x)
Figure 88: Sample 6 hydrogen charged (1000x)
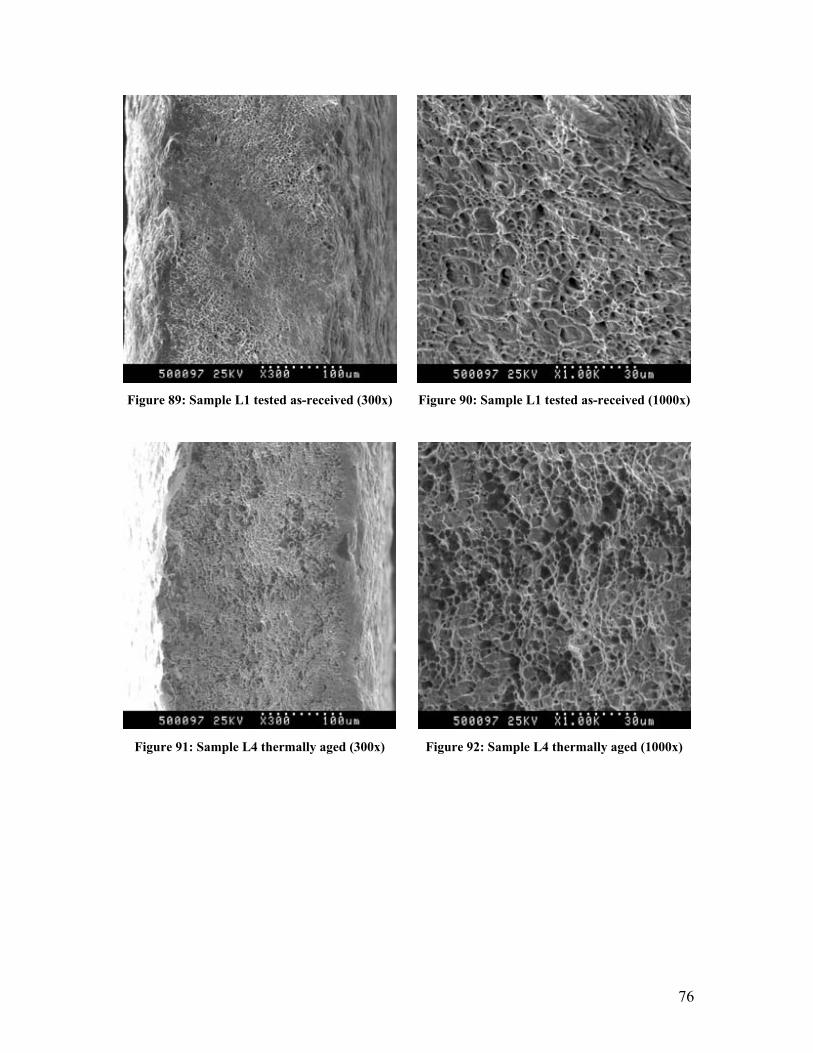
76
Figure 89: Sample L1 tested as-received (300x)
Figure 90: Sample L1 tested as-received (1000x)
Figure 91: Sample L4 thermally aged (300x)
Figure 92: Sample L4 thermally aged (1000x)
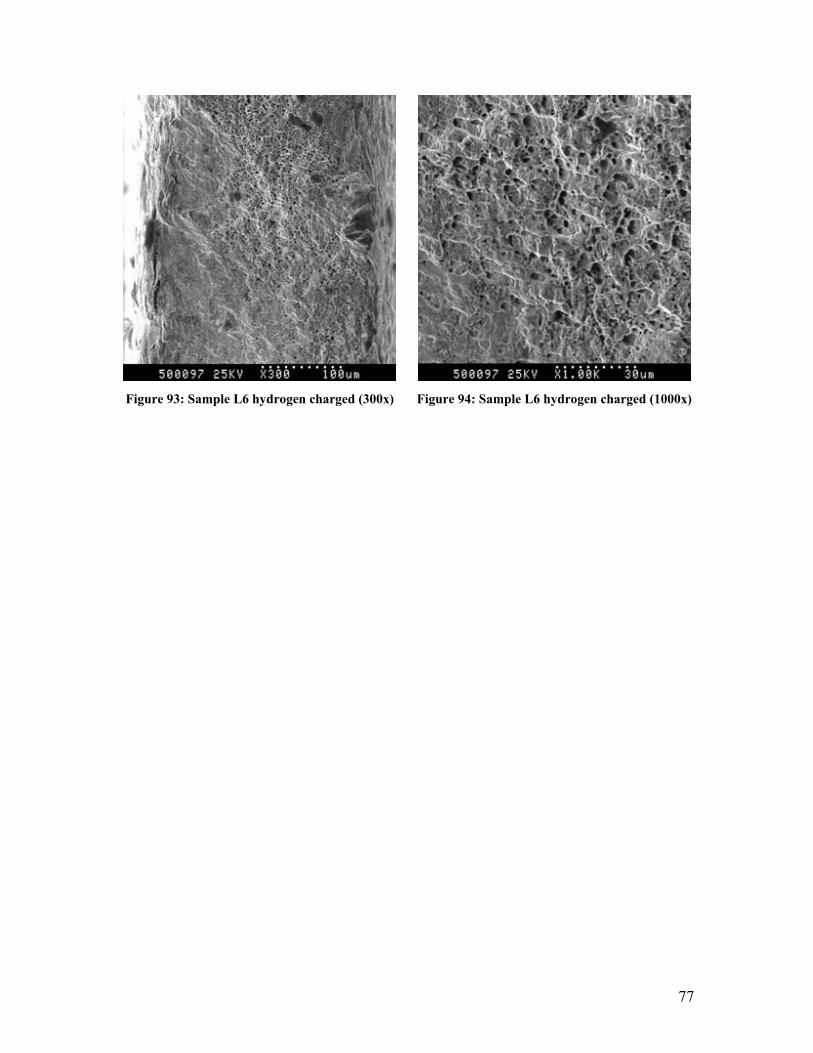
77
Figure 93: Sample L6 hydrogen charged (300x)
Figure 94: Sample L6 hydrogen charged (1000x)
78
6.0 Discussion
In the results section of this thesis, we have compared changes in material
properties of SS 316 and 316L under different test conditions. Following are notable
observations worthy of further discussion.
• Permeation properties of hydrogen through austenitic stainless steel
• Influence of phase stability on hydrogen embrittlement
• Martensite’s role in hydrogen embrittlement
• Bulk versus surface effects of solute hydrogen
• Effect of temperature on both phase stability and hydrogen embrittlement
• Dependence of embrittling effects on hydrogen gas pressure
By reviewing the results and observations and comparing to literature, these points will
be systematically discussed in preparation for the conclusions drawn in section 8.0.
6.1 Permeation Properties of SS 316L
As expected, the permeability of SS 316L was measured to be slightly different
than values reported in literature. This was likely due to the presence of a surface oxide
layer, which is more representative of the state of the steel used in hydrogen components.
Fick’s Law of diffusion (equation 16) was used to check the validity of the results and to
calculate a permeability value.
LPPJ H= [16]
where J is the flux, and PH is the permeability. Flux is alternatively expressed in
equation 17.
Atn
J H= [17]
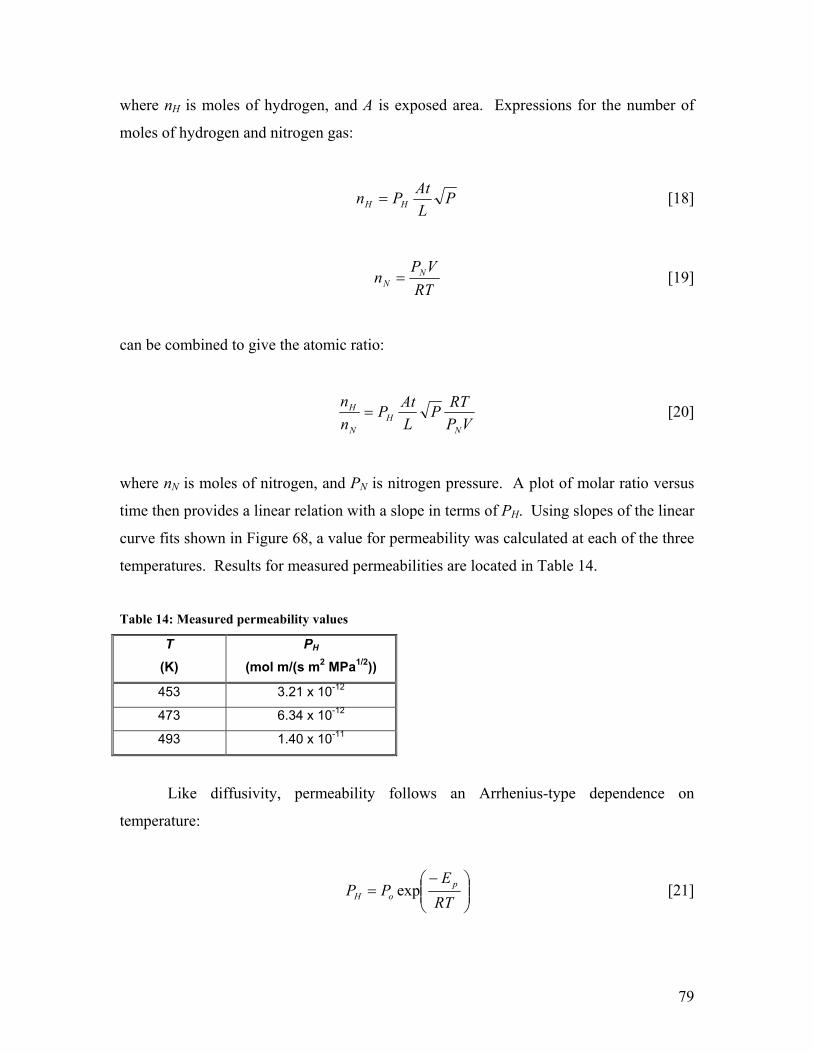
79
where nH is moles of hydrogen, and A is exposed area. Expressions for the number of
moles of hydrogen and nitrogen gas:
PLAtPn HH = [18]
RT
VPn N
N = [19]
can be combined to give the atomic ratio:
VP
RTPLAtP
nn
NH
N
H = [20]
where nN is moles of nitrogen, and PN is nitrogen pressure. A plot of molar ratio versus
time then provides a linear relation with a slope in terms of PH. Using slopes of the linear
curve fits shown in Figure 68, a value for permeability was calculated at each of the three
temperatures. Results for measured permeabilities are located in Table 14.
Table 14: Measured permeability values
T (K)
PH (mol m/(s m2 MPa1/2))
453 3.21 x 10⁻¹²
473 6.34 x 10⁻¹²
493 1.40 x 10⁻¹¹
Like diffusivity, permeability follows an Arrhenius-type dependence on
temperature:
−=
RTE
PP poH exp [21]
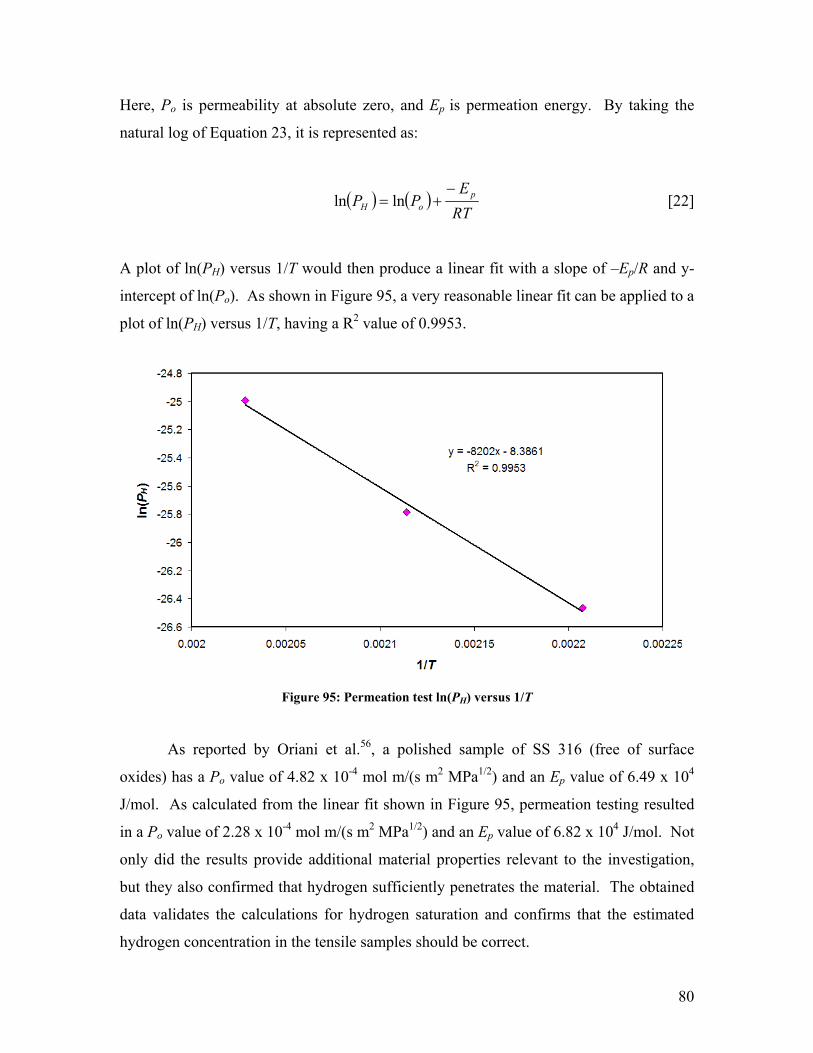
80
Here, Po is permeability at absolute zero, and Ep is permeation energy. By taking the
natural log of Equation 23, it is represented as:
( ) ( )RTE
PP poH
−+= lnln [22]
A plot of ln(PH) versus 1/T would then produce a linear fit with a slope of –Ep/R and y-
intercept of ln(Po). As shown in Figure 95, a very reasonable linear fit can be applied to a
plot of ln(PH) versus 1/T, having a R2 value of 0.9953.
Figure 95: Permeation test ln(PH) versus 1/T
As reported by Oriani et al.56, a polished sample of SS 316 (free of surface
oxides) has a Po value of 4.82 x 10⁻⁴ mol m/(s m2 MPa1/2) and an Ep value of 6.49 x 10⁴
J/mol. As calculated from the linear fit shown in Figure 95, permeation testing resulted
in a Po value of 2.28 x 10⁻⁴ mol m/(s m2 MPa1/2) and an Ep value of 6.82 x 10⁴ J/mol. Not
only did the results provide additional material properties relevant to the investigation,
but they also confirmed that hydrogen sufficiently penetrates the material. The obtained
data validates the calculations for hydrogen saturation and confirms that the estimated
hydrogen concentration in the tensile samples should be correct.
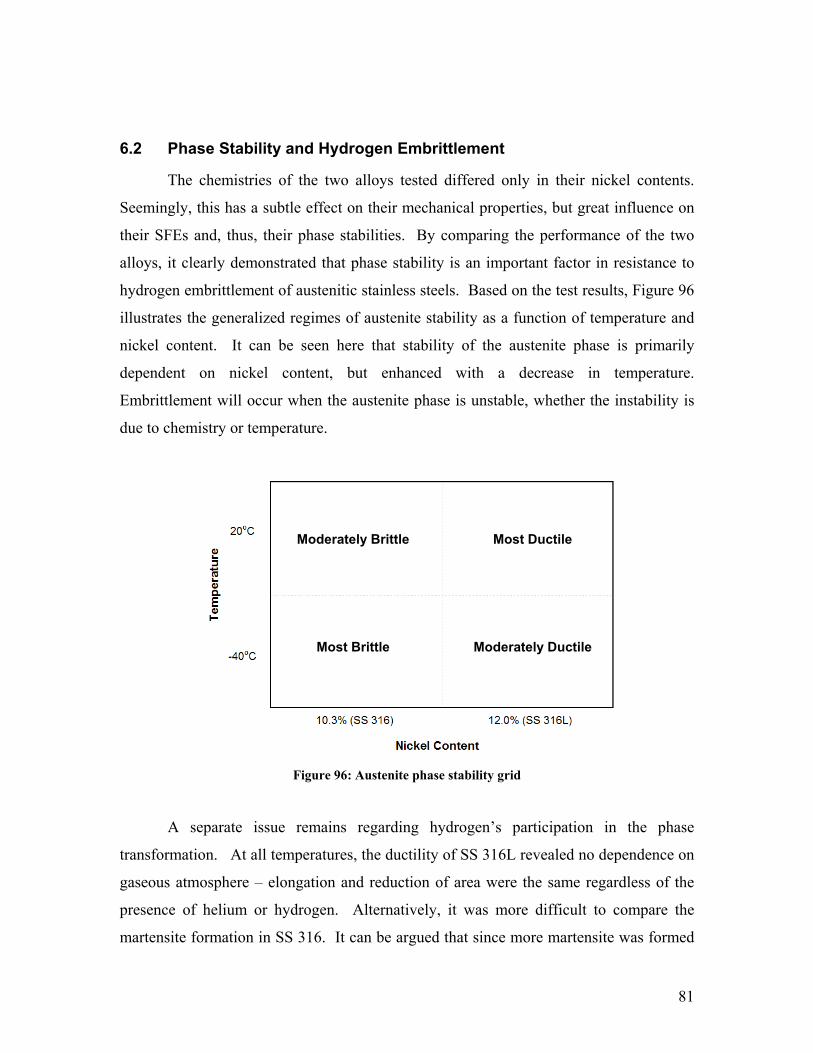
81
6.2 Phase Stability and Hydrogen Embrittlement
The chemistries of the two alloys tested differed only in their nickel contents.
Seemingly, this has a subtle effect on their mechanical properties, but great influence on
their SFEs and, thus, their phase stabilities. By comparing the performance of the two
alloys, it clearly demonstrated that phase stability is an important factor in resistance to
hydrogen embrittlement of austenitic stainless steels. Based on the test results, Figure 96
illustrates the generalized regimes of austenite stability as a function of temperature and
nickel content. It can be seen here that stability of the austenite phase is primarily
dependent on nickel content, but enhanced with a decrease in temperature.
Embrittlement will occur when the austenite phase is unstable, whether the instability is
due to chemistry or temperature.
Figure 96: Austenite phase stability grid
A separate issue remains regarding hydrogen’s participation in the phase
transformation. At all temperatures, the ductility of SS 316L revealed no dependence on
gaseous atmosphere – elongation and reduction of area were the same regardless of the
presence of helium or hydrogen. Alternatively, it was more difficult to compare the
martensite formation in SS 316. It can be argued that since more martensite was formed
Moderately Brittle
Most Brittle
Most Ductile
Moderately Ductile
82
in a helium environment than in hydrogen, martensite must not be responsible for the
failure, but the samples were pulled to different strains before the martensite
measurement was made. Because there were large variations in elongation to failure, the
martensite contents cannot be directly compared. To adequately evaluate, samples
should be deformed to equal strains in each condition and martensite content
measurements should be taken. Since martensite is a stronger phase than austenite, a
method for detecting its formation is by examining the shape of the stress-strain curve.
As shown in Figure 36 and Figure 37, whether tested in helium or hydrogen, the shape of
the deformation curve remains the same. Similar results were found in testing performed
by Han et al13. Although further testing should be performed to confirm it, this is
evidence that hydrogen did not affect the stability of the austenite phase.
Several researchers have claimed that the presence of solute hydrogen will
decrease the stability of the austenite phase27-29,32. Although their methods and test
practices are sound, the conditions are very different and are not relevant to a strictly
gaseous system. Cathodic charging will nominally produce much larger hydrogen
concentrations at the surface, with an enormous gradient, than can be obtained under the
most extreme operating conditions in a gaseous environment expected in the hydrogen
vehicle industry30. The metallic lattice is heavily strained and spontaneous phase
transformation can occur. Also, aside from the phase transformation, the simple presence
of large hydrogen concentrations will impose a compressive stress at the surface of the
material. For these reasons, it is extremely important to test materials according to their
intended use. Previous claims made about hydrogen embrittlement based on cathodically
charged samples may not necessarily apply to pressurized gas conditions.
6.3 Martensite’s Role in Hydrogen Embrittlement
Supporting the findings in this thesis, reporting by Han et al.13 opposed the idea
that strain-induced martensite contributes to hydrogen embrittlement of stable austenitic
stainless steels. Rather than resulting from the formation of strain-induced martensite, it
was claimed that hydrogen embrittlement was due to a low value of stacking fault energy.
Since the martensite phase is nucleated from a stacking fault, the two cases are strongly
83
related. A lower value of stacking fault energy results in a slip system providing more
faulted planes (i.e. increased nucleation of martensite). An alternate suggestion is that the
growth of the martensite phase, rather than its nucleation, is hindered. Their results give
the initial impression that a higher content of martensite reduces the consequences of
testing in a hydrogen atmosphere. This is not necessarily true. A change in temperature
will not only affect the rate of martensite formation, but also the diffusivity of hydrogen.
At very low temperatures, hydrogen diffusion in austenitic stainless steels slows
appreciably. The failure mechanism faces competing influences: hydrogen diffuses faster
through strain-induced martensite than austenite, and martensite is formed more easily at
low temperatures, but low enough temperatures will nearly halt hydrogen diffusion.
Work by Shivanyuk et al.12 compared behavior of materials of varying stacking
fault energies. It was shown that a lower stacking fault energy promoted transformation
from austenite to martensite, but the manner in which they decrease the stacking fault
energy altered the chemistry of the specimen. In order to directly compare the effect of
martensite content, all other variables must be eliminated, including a change in
chemistry. Because the martensite transformation is diffusionless and does not involve a
change in chemistry, the samples of similar chemistry can be fully austenitic or contain
martensite. To be able to directly compare the results, the variable of chemistry must
first be eliminated.
6.4 Surface Versus Bulk Hydrogen Concentration
From the tests performed, it can be concluded that hydrogen embrittlement is
more prevalent when hydrogen exists at the material surface at relatively low
concentrations (~335 atomic ppm). This is evident by first comparing the lack of
embrittlement in samples that are gaseously pre-charged and tested in air versus those
simply tested in pressurized hydrogen. By looking at their stress-strain curves and their
fracture surfaces, no change in seen between the charged and uncharged conditions. By
charging specimens at 100oC in 70 MPa hydrogen, the bulk hydrogen concentration will
be larger than the surface concentration of uncharged samples tested in 25 MPa
hydrogen.
84
Although different experiments were performed, Brass and Chêne65 used similar
sample preparation as in the aforementioned hydrogen charge tests. By gaseously
charging thin specimens in 18 MPa hydrogen at 600oC, they reported an absorbed
hydrogen concentration of 2854 atomic ppm. Their work, however, included no results
from mechanical testing for basis of comparison. Because the temperature has greater
influence on the surface concentration than the pressure (see equations 6, 11, and 21), a
higher solute hydrogen concentration can be reached. Although it is possible to perform
the same tests in more severe conditions, testing was performed according to industry
standards with respect to maximum operating temperature and pressure1. In other words,
it may be possible to induce hydrogen embrittlement by increasing hydrogen charge
temperature, but the situation is not realistic and is beyond a worst-case scenario.
Witnessing a greater effect from hydrogen environment than hydrogen charge
testing supports the hydrogen enhanced decohesion mechanism of embrittlement. It has
been stated that hydrogen atoms are attracted to the tensile field ahead of a crack tip8-10.
According to the HEDE theory, the presence of solute hydrogen atoms decreases the
electron charge density between the metallic atoms, resulting in the tensile separation of
atoms in a planar nature12,13,15. This is also evidenced in the formation of surface cracks
when tested in a hydrogen atmosphere.
6.5 Effect of Temperature on Hydrogen Embrittlement
Aside from the well established effect temperature has on the strength of a
material, it also had a significant effect on hydrogen embrittlement. The results of the
hydrogen environment tensile tests show that decreasing test temperature to -40oC has a
significant effect on the ductility of SS 316. In both alloys, the mode of failure remained
ductile when tested in helium at a low temperature. The values of elongation and
reduction in cross-sectional surface area varied only marginally. Once tested in 25 MPa
hydrogen gas at -40oC, the elongation to failure of SS 316 dropped by over 35%, as
opposed to a drop of only 12% at room temperature (the reduction in cross-sectional
surface area behaved similarly). Considering the large drop in elongation to failure, it is
more surprising to see areas of ductility in the fracture surface (see Figure 62). Hydrogen
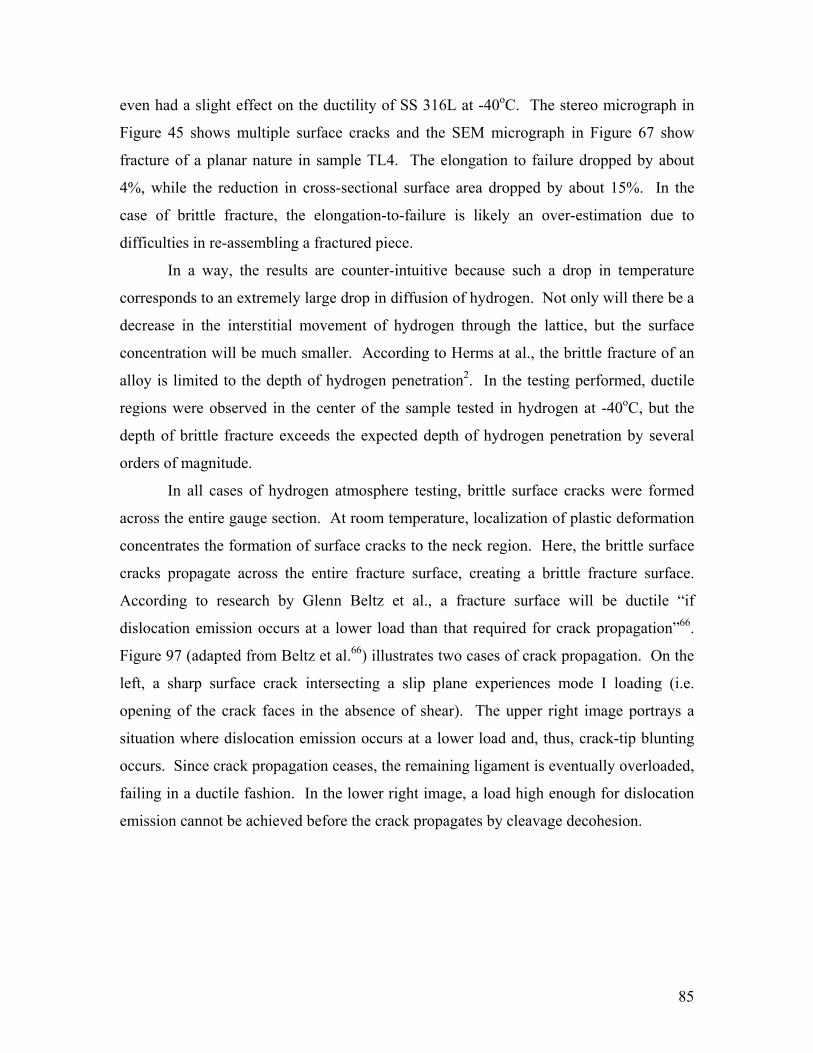
85
even had a slight effect on the ductility of SS 316L at -40oC. The stereo micrograph in
Figure 45 shows multiple surface cracks and the SEM micrograph in Figure 67 show
fracture of a planar nature in sample TL4. The elongation to failure dropped by about
4%, while the reduction in cross-sectional surface area dropped by about 15%. In the
case of brittle fracture, the elongation-to-failure is likely an over-estimation due to
difficulties in re-assembling a fractured piece.
In a way, the results are counter-intuitive because such a drop in temperature
corresponds to an extremely large drop in diffusion of hydrogen. Not only will there be a
decrease in the interstitial movement of hydrogen through the lattice, but the surface
concentration will be much smaller. According to Herms at al., the brittle fracture of an
alloy is limited to the depth of hydrogen penetration2. In the testing performed, ductile
regions were observed in the center of the sample tested in hydrogen at -40oC, but the
depth of brittle fracture exceeds the expected depth of hydrogen penetration by several
orders of magnitude.
In all cases of hydrogen atmosphere testing, brittle surface cracks were formed
across the entire gauge section. At room temperature, localization of plastic deformation
concentrates the formation of surface cracks to the neck region. Here, the brittle surface
cracks propagate across the entire fracture surface, creating a brittle fracture surface.
According to research by Glenn Beltz et al., a fracture surface will be ductile “if
dislocation emission occurs at a lower load than that required for crack propagation”66.
Figure 97 (adapted from Beltz et al.66) illustrates two cases of crack propagation. On the
left, a sharp surface crack intersecting a slip plane experiences mode I loading (i.e.
opening of the crack faces in the absence of shear). The upper right image portrays a
situation where dislocation emission occurs at a lower load and, thus, crack-tip blunting
occurs. Since crack propagation ceases, the remaining ligament is eventually overloaded,
failing in a ductile fashion. In the lower right image, a load high enough for dislocation
emission cannot be achieved before the crack propagates by cleavage decohesion.
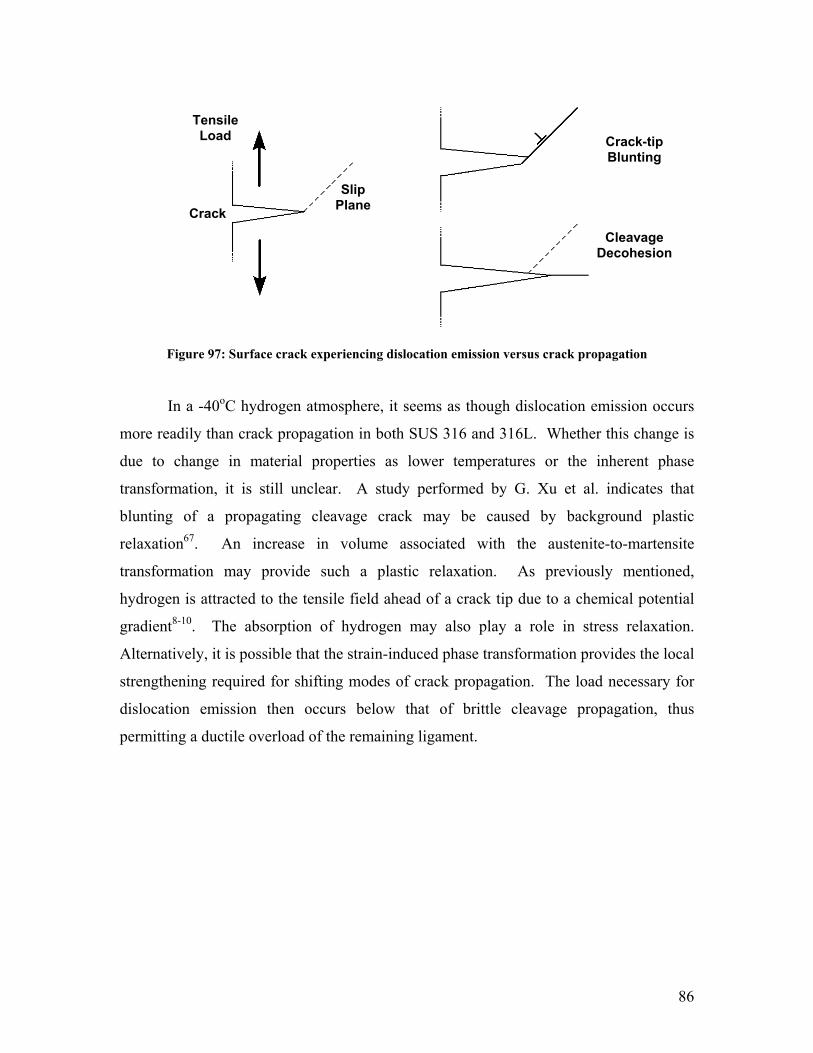
86
Figure 97: Surface crack experiencing dislocation emission versus crack propagation
In a -40oC hydrogen atmosphere, it seems as though dislocation emission occurs
more readily than crack propagation in both SUS 316 and 316L. Whether this change is
due to change in material properties as lower temperatures or the inherent phase
transformation, it is still unclear. A study performed by G. Xu et al. indicates that
blunting of a propagating cleavage crack may be caused by background plastic
relaxation67. An increase in volume associated with the austenite-to-martensite
transformation may provide such a plastic relaxation. As previously mentioned,
hydrogen is attracted to the tensile field ahead of a crack tip due to a chemical potential
gradient8-10. The absorption of hydrogen may also play a role in stress relaxation.
Alternatively, it is possible that the strain-induced phase transformation provides the local
strengthening required for shifting modes of crack propagation. The load necessary for
dislocation emission then occurs below that of brittle cleavage propagation, thus
permitting a ductile overload of the remaining ligament.
Crack
Slip Plane
Tensile Load Crack-tip
Blunting
Cleavage Decohesion
87
7.0 Future Work
The concentration of hydrogen exposed to the surface of hydrogen environment
tensile samples is a function of pressure as well as temperature. According to equation 6
(page 15), the surface concentration is proportional to the square root of the applied gas
pressure. As it has been determined that embrittlement occurs largely due to surface
effects of hydrogen concentration, it is imperative that materials be tested in pressures
equal to or greater than the intended operating pressure.
To support future work, prototype test equipment was designed and built to
provide testing up to 85 MPa hydrogen pressure. With the new test equipment, a
material’s susceptibility to hydrogen environment embrittlement can be characterized
over a complete range of test pressures. Difficulties remain, however, in maintaining a
gas-tight seal at low temperatures. The nitrile o-rings used are effective in preventing
leaks at room temperature, but a decrease in temperature causes a decrease in the
material’s compliance, preventing it from forming an acceptable seal. To remedy the
situation, the equipment can be modified to include a method of locally heating the
elastomer seal. Care must be taken to avoid implementing potential ignition sources in
areas of potential hydrogen leaks.
A test program must also be developed to help establish hydrogen’s influence in
the formation of martensite. To do so, a tensile sample can be strained to a desired value,
and then removed and magnetically tested for martensite content. The process can be
repeated numerous times to develop a relationship between strain and martensite
formation in a given environment. By comparing the results between hydrogen and
helium atmospheres at various temperatures and pressures, the effect of hydrogen can be
determined in any condition. Alternatively, the presence of martensite ahead of a
growing crack can be examined using a fatigue precracked compact tension specimen. In
a helium atmosphere, the compact tension specimen can be loaded to propagate the
precrack. The helium should then be replaced with hydrogen and the crack propagated
further. A metallographic examination could then reveal if a difference exists between
martensite formation in the regions of crack propagation in helium versus hydrogen.
88
The fatigue behavior of a material in a hydrogen atmosphere is another area of
interest within the field of hydrogen compatibility testing. Components for hydrogen
storage and delivery are experiencing constantly fluctuating stresses. For lifecycle
assessment, it is important to study the effects of hydrogen on the initiation and
propagation of a fatigue crack. The newly developed high-pressure equipment can also
be adapted to accommodate specimens for cyclic loading applications necessary for
fatigue studies. The cycles required to nucleate a crack and the crack growth rate can be
quantified over a range of applied stress intensities and contrasted to that in air.
89
8.0 Conclusions
Although much more testing is required to approach certainty, many of the
questions posed have been answered in this thesis. The most obvious of the conclusions
is that SS 316L outperforms SS 316 with regards to hydrogen embrittlement resistance.
The mechanical properties are very similar, but having higher nickel content provides
316L with a higher stacking fault energy, and thus higher austenite phase stability. When
selecting an austenitic stainless steel compatible with high-pressure hydrogen
environments, after satisfying strength and toughness requirements, requirements for
stacking fault energy should be addressed.
The result most relative to the field of material testing and certification for use in
the hydrogen industry is that hydrogen environment embrittlement is dominant at the
material surface. Once a crack forms, a constant supply of hydrogen to its tip will
facilitate propagation via the decohesion model of hydrogen embrittlement. This
discovery helps focus the testing for material compatibility testing in pressurized
hydrogen environments. It was determined that hydrogen environment tensile testing is
more useful than hydrogen charge testing in inducing hydrogen embrittlement. Tests can
be performed for much cheaper because they are quicker and involve less preparation.
The test also better replicates the natural state of high-pressure hydrogen components. It
is important, however, to refine performance qualifications. Stainless steel 316 has
proven to be adequate for high-pressure use through years of service and very few
unexpected failures. The hydrogen environment tensile tests caused embrittlement
because very large stresses and strains were involved.
In reality, stresses will remain below those required to yield the material, so
embrittlement will not normally occur. Thus, it is suggested that a proper test for
material compatibility involve imposing a predetermine amount of strain in a hydrogen
environment of the intended operating pressure. The imposed strain should be based on a
reasonable safety factor of the strain to reach the material’s yield point. Since the most
important goal is to prevent the formation of stress concentrations caused by surface
cracks, the sample would be removed from the hydrogen environment and examined for
such cracks. A set of pass/fail criteria would need to be established based on numerous

90
additional hydrogen environment tensile tests and evidence from the history of successful
and unsuccessful candidate materials.
91
References
[1] Philip Horacek, P.Eng. Gas Systems Engineering, Powertech Labs, Inc. Personal
communication, June 8th, 2007.
[2] E. Herms, J.M. Olive, and M. Puiggali. “Hydrogen Embrittlement of 316L Type
Stainless Steel”. Materials Science and Engineering A272 (1999) 279-283.
[3] S.C. Chou and M.M. Makhlouf. “The Effect of Ion Implanting on Hydrogen Entry
Into Metals”. Metallurgical and Materials Transactions A 30 (1999) 1535-1540.
[4] Richard A. Oriani, John P. Hirth, and Michael Smialowski. “Hydrogen
Degradation of Ferrous Alloys”. Noyes Publications (1985).
[5] C. Gabrielli, G Maurin, L. Mirkova, H. Perrot, and B Tribollet. “Transfer Function
Analysis of Hydrogen Permeation Through an Iron Membrane in a Devanathan
Cell”. Impedance Contributions Online 2 (2004) P1.1-P1.9.
[6] H.G. Nelson. Treatise on Materials Science and Technology 25 (1981) 291.
[7] H.W. Liu and P.J. Ficalora. “Catalytic Dissociation, Hydrogen Embrittlement, and
Stress Corrosion Cracking”. International Journal of Fracture Mechanics 8 2 (1972)
223-226.
[8] C. Pan, W.Y. Chu, Z.B. Li, D.T. Liang, Y.J. Su, K.W. Gao, and L.J. Qiao.
“Hydrogen Embrittlement Induced By Atomic Hydrogen and Hydrogen-Induced
Martensites in Type 304L Stainless Steel”. Materials Science and Engineering
A351 (2003) 293-298.
92
[9] Tsong-Pyng Perng and C.J. Altstetter. “Effects of Deformation on Hydrogen
Permeation in Austenitic Stainless Steels”. Acta Metallurgica 34 9 (1986) 1771-
1781.
[10] Daniel P. Abraham and Carl J. Altstetter. “Hydrogen-Enhanced Localization of
Plasticity in an Austenitic Stainless Steel”. Metallurgical and Materials
Transactions 26A (1995) 2859-2871.
[11] Wolfgang Losch. “Hydrogen Embrittlement: A New Model for the Mechanism of
Reduction of Metallic Cohesion”. Scripta Metallurgica 13 (1979) 661-664.
[12] V.N. Shivanyuk, J. Foct, V.G. Gavriljuk. “On a Role of Hydrogen-Induced ε-
Martensite in Embrittlement of Stable Austenitic Steel”. Scripta Materialia 49
(2003) 601-606.
[13] G. Han, J. He, S. Fukuyama, and K. Yokogawa. “Effect of Strain-Induced
Martensite on Hydrogen Environment Embrittlement of Sensitized Austenitic
Stainless Steels at Low Temperatures”. Acta Materialia 46 13 (1998) 4559-4570.
[14] A. Toshimitsu Yokobori Jr., Takenao Nemoto, Koji Satoh, and Tetsuya Yamada.
“The Characteristics of Hydrogen Diffusion and Concentration Around a Crack Tip
Concerned With Hydrogen Embrittlement”. Corrosion Science 44 (2002) 407-424.
[15] V.G. Gavriljuk, V.N. Shivanyuk, and J. Foct. “Diagnostic Experimental Results on
the Hydrogen Embrittlement of Austenitic Steels”. Acta Materialia 51 (2003)
1293-1305.
[16] Harrison C. White. “Atomic Force Constants of Copper From Feynman’s
Theorem”. Physical Review 112 4 (1958) 1092-1105.
93
[17] J.D. Hermida, and A. Roviglione. “Stacking Fault Energy Decrease in Austenitic
Stainless Steels Induced By Hydrogen Pairs Formation”. Scripta Materialia 39 8
(1998) 1145-1149.
[18] Pekka Nevasmaa. “Predictive Model for the Weld Metal Hydrogen Cracking in
High-Strength Multipass Welds”. Acta University of Oulu 191 (2003).
[19] Y. Liang, D.C. Ahn, P. Sofronis, R.H. Dodds Jr., D. Bammann. “Effect of
Hydrogen Trapping on Void Growth and Coalescence in Metals and Alloys”.
Mechanics of Materials 40 (2008) 115-132.
[20] I.M. Robertson. “The Effect of Hydrogen on Dislocation Dynamics”. Engineering
Fracture Mechanics 64 (1999) 649-673.
[21] P. Sofronis, Y. Liang, and N. Aravas. “Hydrogen Induced Shear Localization of
the Plastic Flow in Metals and Alloys”. European Journal of Mechanics A/solids
20 (2001) 857-872.
[22] V.N. Shivanyuk, B.D. Shanina, A.V. Tarasenko, V.G. Gavriljuk, and J. Foct.
“Effect of Hydrogen on Atomic Bonds in Autenitic Stainless Steel”. Scripta
Materialia 44 (2001) 2765-2773.
[23] A.G. Varias and A.R. Massih. “Hydride-Induced Embrittlement and Fracture in
Metals – Effect of Stress and Temperature Distribution”. Journal of the Mechanics
and Physics of Solids 50 (2002) 1469-1510.
[24] K. Sieradzki and P. Ficalora. “The Mechanism of Hydrogen Embrittlement
Adsorption or Decohesion”. Scripta Metallurgica 14 (1980) 641-644.
[25] J. Völkl, and H. Wipf. “Diffusion of Hydrogen in Metals”. Hyperfine Interactions,
8 (1981) 631-638.
94
[26] J. Toribio. “The Role of Crack Tip Strain Rate in Hydrogen Assisted Cracking”.
Corrosion Science, 39 9 (1997) 1687-1697.
[27] Q. Yang, and J.L. Luo. “Martensite Transformation and Surface Cracking of
Hydrogen Charged and Outgassed Type 304 Stainless Steel”. Materials Science and
Engineering A288 (2000) 75-83.
[28] Q. Yang, L.J. Qiao, S. Chiovelli, and J.L. Luo. “Critical Hydrogen Charging
Conditions for Martensite Transformation and Surface Cracking in Type 304
Stainless Steel”. Scripta Materialia 40 11 (1999) 1209-1214.
[29] N. Narita, C.J. Altstetter, and H.K. Birnbaum. “Hydrogen-Related Phase
Transformations in Austenitic Stainless Steels”. Metallurgical Transactions 13A
(1982) 1355-1365.
[30] M. Hoelzel, S.A. Danilkin, H. Ehrenberg, D.M. Toebbens, T.J. Udovic, H. Fuess,
and H. Wipf. “Effects of High-Pressure Hydrogen Charging on the Structure of
Austenitic Stainless Steels”. Materials Science and Engineering A 384 (2004) 255-
261.
[31] S. Sugiyama, H. Ohkubo, M. Takenaka, K. Ohsawa, M.I. Ansari, N. Tsukuda and
E. Kuramoto. “The Effect of Electrical Hydrogen Charging on the Strength of 316
Stainless Steel”. Journal of Nuclear Materials 283-287 (2000) 863-867.
[32] Adriana Estela Pontini and Jorge Daniel Hermida. “X-Ray Diffraction
Measurement of the Stacking Fault Energy Reduction Induced By Hydrogen in an
AISI 304 Steel”. Scripta Materialia 37 11 (1997) 1831-1837.
95
[33] T. Inamura, K. Takashima, and Y. Higo. “Crystallography of Nanometre-Sized α’-
Martensite Formed at Intersections of Mechanical γ-Twins in an Austenitic
Stainless Steel”. Philosophical Magazine 83 8 (2003) 935-954.
[34] J.C. Bavay. “Austenitic Stainless Steels” in Stainless Steels, P. Lacombe, B.
Baroux, G. Beranger, Editors (1993) 551-591.
[35] I. Karaman, H. Sehitoglu, Y.I. Chumlyakov, and H.J. Maier. “The Deformation of
Low-Stacking-Fault-Energy Austenitic Steels”. JOM 54 7 (2002) 31-37.
[36] Kevin Spencer. “The Work Hardening of Austenitic Stainless Steels, Applied to
the Fabrication of High-Strength Conductors”. PhD Thesis, McMaster University
(2004).
[37] L. Remy and A. Pineau. “Observation of Stacked Layers of Twins and ε Martensite
in a Deformed Austenitic Stainless Steel”. Metallurgical Transactions 5 (1974)
963-965.
[38] S. Allain, J.P. Chateau, O. Bouaziz, S. Migot and N. Guelton. “Correlations
Between the Calculated Stacking Fault Energy and the Plasticity Mechanisms in Fe-
Mn-C Alloys”. Materials Science Engineering A 387-389 (2004) 158-162.
[39] Alfredo Juan, Lilian Moro, Graciela Brizuela, and Estela Pronsato. “The Electronic
Structure and Bonding of an Hydrogen Pair Near a FCC Fe Stacking Fault”.
International Journal of Hydrogen Energy 27 (2002) 333-338.
[40] G.B. Olson, Morris Cohen. “A Mechanism for the Strain-Induced Nucleation of
Martensitic Transformations”. Journal of the Less-Common Metals 28 (1972) 107-
117.
96
[41] Amar K. De, David C. Murdock , Martin C. Mataya , John G. Speer and David K.
Matlock. “Quantitative Measurement of Deformation-Induced Martensite in 304
Stainless Steel by X-Ray Diffraction”. Scripta Materialia 50 (2004) 1445-1449.
[42] S. Ganesh Sundara Raman, K.A. Padmanabhan. “Tensile Deformation-Induced
Martensitic Transformation in AISI 304LN Austenitic Stainless Steel”. Journal of
Materials Science Letters 13 (1994) 389-392.
[43] C.M. Lepienski, N.K. Kuromoto, J.F.P. Souza, C.E. Foerster, F.C. Serbena, S.L.R.
Silva. “Effect of Hydrogen on Mechanical Properties of Nitrided Austenitic
Steels”. Philosophical Magazine 86 33-35 (2006) 5407-5418.
[44] D. Hwang, L.H. Chiu, D.L. Johnson. “Gas-Phase Hydrogen Permeation and
Diffusion in Vanadium”. Journal of Materials Science Letters 10 (1991) 605-607.
[45] G.B. Olson and Morris Cohen. “Kinetics of Strain-Induced Martensitic
Nucleation”. Metallurgical Transactions 6A (1975) 791-795.
[46] J.R. Patel, and M. Cohen. “Criterion for the Action of Applied Stress in the
Martensitic Transformation”. Acta Metallurgica 1 (1953) 531-538.
[47] Vijay Shrinivas, S.K. Varma, and L.E. Murr. “Deformation-Induced Martensitic
Characteristics in 304 and 316 Stainless Steels During Room-Temperature
Rolling”. Metallurgical and Materials Transactions 26A (1995) 661-670.
[48] P.J. Ferreira, and P. Müllner. “A Thermodynamic Model for the Stacking-Fault
Energy”. Acta Metallurgica 46 13 (1998) 4479-4484.
[49] Lin Li and T.Y. Hsu (Xu Zuyao). “Gibbs Free Energy Evaluation of the FCC (γ)
and HCP (ε) Phases in Fe-Mn-Si Alloys”. Calphad 21 3 (1997) 443-448.

97
[50] I.A. Yakubtsov, A. Ariapour, and D.D. Perovic. “Effect of Nitrogen on Stacking
Fault Energy of FCC Iron-Based Alloys”. Acta Materialia 47 4 (1999) 1271-1279.
[51] J.H. Huang and C.J. Altstetter. “Internal Hydrogen-Induced Subcritical Crack
Growth in Austenitic Stainless Steels”. Metallurgical Transactions A 22 (1991)
2605-2618.
[52] J. Chêne, M. Aucouturier, R. Arnould-Laurent, P. Tison, J.-P. Fidelle. “Hydrogen
Transport by Deformation and Hydrogen Embrittlement in Selected Stainless
Steels”. Hydrogen Effects in Metals. The Metallurgical Society of AIME (1980)
583-595.
[53] F.P. Pickering. “Physical Metallurgical Development of Stainless Steels”. Proc.
Conf. Stainless Steels, Gothenburg (1984) 2-28.
[54] ASTM International. “Standard Test Methods for Tension Testing of Metallic
Materials” Designation E8 (2001) 60-81.
[55] David S. Wilkinson. Cambridge Sold State Science Series. Mass Transport in
Solids and Fluids (1999).
[56] Richard A. Oriani, John P. Hirth, and Michael Smialowski. “Hydrogen
Degradation of Ferrous Alloys”. Noyes Publications (1985).
[57] C. San Marchi. “Technical Reference on Hydrogen Compatibility of Materials –
Austenitic Stainless Steels: Type 316”. Sandia National Laboratories (2005).
[58] Michael F. Ashby. “Materials Selection in Mechanical Design” 2nd Ed., Woburn,
Massachusetts. Butterworth-Heinemann (1999).
98
[59] UGINE & ALZ, Arcelor Group. Material data sheet UGINOX 18-12ML.
<http://www.ugine-alz.com>. Accessed July 2007.
[60] Chad Sinclair. Advanced Phase Transformation, MTRL 575, University of British
Columbia. Lecture Notes (2006).
[61] A.C. Larson, R.B Von Dreele. “General Structure Analysis System (GSAS)”. Los
Alamos National Laboratory.
[62] B.H. Toby. EXPGUI, a graphical user interface for GSAS. Journal of Applied
Crystallography 34 (2001) 210-213.
[63] M. Radu, J. Valy, A.F. Gourgues, F. Le Strat, and A. Pineau. “Continuous
Magnetic Method for Quantitative Monitoring of Martensitic Transformation in
Steels Containing Metastable Austenite”. Scripta Materialia 52 (2005) 525-530.
[64] J. Talonen, P. Aspegren, and H. Hänninen. “Comparison of Different Methods for
Measuring Strain Induced α’-Martensite Content in Austenitic Steels”. Materials
Science and Technology 20 (2004) 1506-1512.
[65] A.M. Brass, J. Chêne. “Hydrogen Uptake in 316L Stainless Steel: Consequences on
Tensile Properties”. Corrosion Science 48 (2006) 3222-3242.
[66] Glenn E. Beltz, Don M. Lipkin, Lisa L. Fischer. “Role of Crack Blunting in Ductile
Versus Brittle Response of Crystalline Materials”. Physical Review Letters 82 22
(1999) 4468-4471.
[67] G. Xu, A.S. Argon. “Critical Configurations for Dislocation Nucleation From
Crack Tips”. Philosophical Magazine A 75 2 (1997) 341-367.


