Embed Size (px)
Citation preview

This article appeared in a journal published by Elsevier. The attachedcopy is furnished to the author for internal non-commercial researchand education use, including for instruction at the authors institution
and sharing with colleagues.
Other uses, including reproduction and distribution, or selling orlicensing copies, or posting to personal, institutional or third party
websites are prohibited.
In most cases authors are permitted to post their version of thearticle (e.g. in Word or Tex form) to their personal website orinstitutional repository. Authors requiring further information
regarding Elsevier’s archiving and manuscript policies areencouraged to visit:
http://www.elsevier.com/copyright

Author's personal copy
An elasto-plastic fracture mechanics based model for assessment of hydrideembrittlement in zircaloy cladding tubes
Karl-Fredrik Nilsson *, Nikola Jakšic, Vratko VokálEuropean Commission, DG-JRC, Institute for Energy, P.O. Box 2, 1755 ZG Petten, The Netherlands
a r t i c l e i n f o
Article history:Received 26 March 2009Accepted 25 October 2009
a b s t r a c t
This paper describes a finite element based fracture mechanics model to assess how hydrides affect theintegrity of zircaloy cladding tubes. The hydrides are assumed to fracture at a low load whereas the prop-agation of the fractured hydrides in the matrix material and failure of the tube is controlled by non-linearfracture mechanics and plastic collapse of the ligaments between the hydrides. The paper quantifies therelative importance of hydride geometrical parameters such as size, orientation and location of individualhydrides and interaction between adjacent hydrides. The paper also presents analyses for some differentand representative multi-hydride configurations. The model is adaptable to general and complex crackconfigurations and can therefore be used to assess realistic hydride configurations. The mechanism ofcladding failure is by plastic collapse of ligaments between interacting fractured hydrides. The resultsshow that the integrity can be drastically reduced when several radial hydrides form continuous patterns.
� 2009 Elsevier B.V. All rights reserved.
1. Introduction
Intermediate long-term storage of spent nuclear fuel is an inte-grated part of radioactive waste management strategies in manycountries [1–3]. Storage times up to 50 years were considered inthe past but much longer storage times, up to 300 years, are nowalso considered. Safety under normal, off-normal and accident con-ditions is ensured by the facility and the container where the spentfuel is placed. The fuel cladding constitutes the first barrier againstrelease of radionuclides and its integrity is therefore crucial. Ingeological disposal on the other hand there is generally no creditfor the cladding as a barrier. Spent fuel storage has an excellentsafety record and claddings that have been in dry storage for afew decades are generally in good state [4,5], but the new trendswith higher fuel burn-up (>65GWd/MTHm) and reprocessed fuelssuch as MOX fuel, which lead to higher temperatures and stresses,and the much longer storage times has lead to an increased need offurther studies to ensure continued safety.
The fuel cladding in most of today’s Light Water Reactors (LWR)is made of zirconium alloys such as Zircaloy-2 for Boiling WaterReactors (BWR) and Zircaloy-4 for Pressurized Water Reactors(PWR). For the integrity assessment all relevant degradation andfailure mechanisms need to be considered [6,4]. In addition to irra-diation damage the cladding corrodes during the reactor operationwhereby an oxidation layer develops and hydrogen is picked up
[7]. When the spent fuel is removed from the reactor and put intowet storage the hydrogen precipitates as hydrides. The hydrides of-ten appear in more concentrated form as a hydride rim close to thesurface and as individual elongated hydrides aligned primarily inthe circumferential direction due to the metallurgical texture ofthe tube [8]. The internal pressure at room temperature is typically3–7 MPa [9]. When the spent fuel is transferred from wet to drystorage the temperature increases to 400 �C, the hydrides dissolveand the pressure increases (6–16 MPa). The hydrides are then rep-recitated as partially radial hydrides as the temperature drops. Thishydride re-orientation is a function of the temperature and thehoop stress. At 400 �C typical threshold values for re-orientationare 60–100 MPa [10,11]. The ratio between the radius and the wallthickness is typically 8 for cladding tubes so the hoop stress ðpR=tÞis sufficient for hydride re-orientation. It was shown in the early1960s by Louthan and Marshall [12,13] that radial hydrides maydrastically reduce the ductility of zircaloy claddings. There is alsoa large number of more recent data that demonstrate the ductilityreduction under ring-compression, tensile and pressure tests [14–19]. The hydride effect may actually be stronger for a modest hy-dride content (100–200 ppm) than for a very high hydride content(1000 ppm). One explanation is that more long radial hydrides maybe formed with the lower content [14,10], but the interaction be-tween hydrides and percentage of re-dissolution will also play arole. It should be noted though that the strength may increase withincreased hydride content, in particular for circumferential hy-drides, and this effect is stronger for higher temperatures[20,18,21]. The increased strength is because hydrides are stifferthan the matrix and hence this increase of the strength applies
0022-3115/$ - see front matter � 2009 Elsevier B.V. All rights reserved.doi:10.1016/j.jnucmat.2009.10.056
* Corresponding author. Tel.: +31 224 565420.E-mail addresses: [email protected] (K.-F. Nilsson), nikola.jaksic@guest.
arnes.si (N. Jakšic), [email protected] (V. Vokál).
Journal of Nuclear Materials 396 (2010) 71–85
Contents lists available at ScienceDirect
Journal of Nuclear Materials
journal homepage: www.elsevier .com/ locate / jnucmat

Author's personal copy
only to non-fractured hydrides. Radial hydrides, however, fractureat low loads and the strength is then also generally reduced,although much less that the total elongation [14,15].
Creep is the major failure mechanism considered under normalconditions. It has been demonstrated that creep rupture strain maybe significantly reduced by radial hydrides [16,22,23]. Delayed hy-dride cracking (DHC), where dissolved hydrogen migrates towardsexisting small cracks and precipitates, is the second potential timedependent failure mechanism [24]. Most studies indicate that clad-dings should not fail by creep or DHC under long-term storage con-ditions due to the relatively low stresses and temperatures thatalso decrease with time. For creep a 1% strain criterion is often usedand considered to give sufficient safety margin. For future long-term spent fuel storage with higher burn-up and increased radialhydride content this needs to be verified. There are however recentstudies that indicate that DHC failure may occur after several dec-ades of long-term storage [25]. In transport and for off-normal andaccident conditions in long-term storage the cladding may be sub-jected to impact loads and the impact energy, which can be signif-icantly reduced by hydrides [26], is then a more relevant measureof the ductility.
Between room temperature and 300 �C the hydrides are muchmore brittle than the zircaloy matrix and hydrides crack whenthe strain component normal to the hydride reaches typically 1%[27–29]. The hydride fracture strain is however not purely a mate-rial property. Its deformation is a result of the interaction betweenthe hydride and the matrix so the failure strain depends on the hy-dride length and the stiffness of the matrix [28], and d-hydrides aregenerally more brittle than c-hydrides, [20]. For pressurized tubeswith a dominating hoop stress, this implies that cracking of radialhydrides precedes failure of the tube. It is natural to treat fracturedhydrides as cracks and assume that crack growth can be modelledby fracture mechanics. With this assumption the load at which thecomponent fails depends on the size, location and orientation ofthe hydrides as well as the material’s fracture toughness. The sizeof individual hydrides may vary from less than a lm to severalhundreds of lm in extreme cases [30–32,14,33]. The hydride ori-entation is primarily related to the stress directions, whereas thesize of the hydrides depends on the temperatures involved andthe rates, where very slow cooling times promotes long radial hy-drides [34,33]. The fracture toughness of the hydrides is very low,5–10 N/m from nano-indentation tests [35], as compared to 10–100 kN/m for zircaloy fracture mechanics tests [36–40], and thethreshold fracture toughness for delayed hydride cracking (250–1000 N/m [24]).
Ductility loss induced by radial hydrides has been modelled byfracture mechanics [41] for specific crack configurations that allowsemi-analytical expressions for J and crack-tip stresses and strains.With the view to analyse more complex hydride configurations amore general model is developed and presented in this paper.The most basic assumption is that hydrides can be modelled ascracks. An elasto-plastic fracture mechanics finite element analysisis then used to assess how the ductility is affected by hydrides. Theanalysis in this paper includes single straight and kinked crackswith different crack length, orientation and locations; two interact-ing cracks with different distances between them and a case withrepresentative multi-crack configuration with differentorientations.
2. Single and double crack analysis
Onset of crack growth is expected to take place when the J-inte-gral attains a critical value, which we refer to as ‘JIC ’. A fracturetoughness value, JIC , is normally determined from a specimen witha fabricated macro-crack under pure Mode I loading. The crack ini-
tiation from such tests is physically not well defined since it isimpossible to distinguish between crack blunting and stable tear-ing. JIC is therefore taken from the J with 200 lm apparent crackextensions, which is much larger than the typical distance betweenhydrides. Due to the small dimensions the ‘JIC ’ corresponds to amuch smaller crack growth than a 0.2 mm offset value. The com-puted J-integral depends on the applied load and the size, location,orientation and shape of the crack but it is also affected by interac-tion between neighbouring cracks. The commercial finite elementcode ABAQUS has been used for all the numerical analyses. The fi-nite element model is a two-dimensional plane strain cracked tubesegment with section angle 20� and with symmetry conditions im-posed on the ends (Fig. 2). A plane strain model is reasonable andcaptures the main features as long as the hoop stress is the domi-nant stress direction. A complete 3D model would also drasticallyincrease the computational effort and the complexity of the finiteelement model. The inner and outer radii are 4.4165 mm and5.0305 mm respectively, which gives a wall thickness of 614 lm.The finite element mesh is generated automatically by auxiliarypython scripts that allow user-defined mesh refinements to ensurenumerical convergence of the results. The number of degrees offreedom and the computational times depend on the crack config-uration. The Young’s modulus, the Poisson’s number and the truestress–strain curve are given in Table 1 and in Fig. 1. The constitu-tive data are typical for Zircaloy-4 cladding at room temperatureand have been provided by AREVA Fig. 1. The applied load is alwaysmonotonically increasing. There could in principle be very smallregions with local unloading from load redistribution but therewas no distinction in the stress-curve for loading and unloadingin the analysis.
2.1. Single straight crack
The single straight crack is the simplest case that allows us toassess some relevant characteristics such as size, orientation andlocation of cracked hydrides, which influence the failure load in afracture mechanics approach. Fig. 2 depicts the geometry parame-ters that were used to characterize a single straight crack. As seenin Fig. 2 two crack tip mesh types were adopted: a circular focusedmesh with three collapsed nodes at the crack tip and a rectangularmesh. The analysis also included numerical convergence analysiswhere Rc varied from 0.1 lm to 50 lm. The element size in thecrack tip region was prescribed to be one eighth of this value.The parameter values for the six single crack analyses are summa-rized in Table 2.
Fig. 3a depicts the computed J-integral versus the applied loadfor a radial crack with length 150 lm located in the center of thetube and for an inner surface breaking crack respectively (Case1). The result is for crack tip B, but the value was almost identicalfor the crack tip A for the internal crack. The very steep increase inthe computed J occurs when the ligament between the crack tip
Table 1Parameter values.
Parameter Denotation Value Unit
Young modulus E 100.5 GPaPoisson number m 0.3 –True plastic stress and strain ðrt ; etÞ (339.0, 0.0000) (MPa, –)
(384.4, 0.0025) (MPa, –)(408.0, 0.0059) (MPa, –)(429.3, 0.0106) (MPa, –)(461.4, 0.0250) (MPa, –)(483.0, 0.0440) (MPa, –)(543.4, 0.1103) (MPa, –)(665.8, 0.2444) (MPa, –)(749.0, 0.3441) (MPa, –)
72 K.-F. Nilsson et al. / Journal of Nuclear Materials 396 (2010) 71–85

Author's personal copy
and the free surface is completely yielded. As expected J is system-atically higher for the surface breaking defect. It can also be notedthat J-values are low compared to the fracture toughness of zirca-loys (10–100 kN/m with 0.2 mm off-set). The stiffness of the tubeis also lowered by cracks. Fig. 3b shows the computed hoop strainðe/ ¼ ur=RÞ at the inner surface versus the load. The steep increasein J and e/ coincides with plastic collapse of the tube.
As mentioned above this case was also used to assess the con-vergence and stability of the numerical results by varying the ele-ment size near the crack tip, comparing J for different contours and
comparing results from the circular and squared crack tip mesh.The computed J was insensitive to the crack tip mesh length whenRc was larger than 1 lm. Because the loading increases monotoni-cally the J-integral should be independent of the contour fromwhich it is evaluated. For the squared crack tip mesh there wasno difference between J evaluated from different contours,whereas for the circular mesh the computed J was smaller for con-tours very close to the crack tip at onset of ligament yield. In theresults presented for the rest of the paper a squared mesh withRc ¼ 5 lm has been used if not stated otherwise. This value is as-sumed to provide converged results. The single crack model withRc ¼ 5 lm had about 1:5� 104 degrees of freedom.
The numerical results are affected by the boundary conditions.To assess this, the radial central crack analysis (Case 2) was per-formed with the crack located at different circumferential locations(h in Fig. 2). A crack close to the symmetry line had a lower J andthe ‘end effect’ increased with the applied load, but for h > 3� itwas negligible. In all cases below the cracks will be placed suffi-ciently far away from the symmetry boundary conditions to havenegligible end effects.
The computed J-integrals versus crack length for a radial andcentrally located crack (Case 3) are plotted in Fig. 4 for five pres-sure values ranging from 1.5 to 20 MPa. As mentioned above onset
0 0.05 0.1 0.15 0.2 0.25 0.3 0.35350
400
450
500
550
600
650
700
750
True plastic strain εt [/]
True
pla
stic
str
ess
σ t [MPa
]
Fig. 1. Experimental material data for the plastic region.
Fig. 2. Description of the geometrical parameters for the single crack model and the circular and square crack tip mesh configurations.
Table 2The crack parameter values for the single crack analysis, where T is center point withcoordinates r and h;/ is crack tilt angle, a is crack length, d is distance from crack tip Ato the inner boundary and w is kink angle.
Case Tðr; hÞðmm;� Þ /ð�Þ aðlmÞ dðlmÞ wð�Þ
1 (4.7235; 10) 0 150 232 and 0 –2 (4.7235; [0.2–5]) 0 150 232 –3 (4.7235; 10) 0 [10–550] [32–302] –4 ([4.9455–4.5015]; 10) 0 150 [10–454] –5 (4.7235; 10) [0–180] 150 [232–307] –6 (4.7235; 10) [�50 to 50] 150 [232–307] [�30 to 30]
K.-F. Nilsson et al. / Journal of Nuclear Materials 396 (2010) 71–85 73

Author's personal copy
of crack growth can only be attained when the ligament yields andthe J-values increases drastically. For a pressure of 7.5 MPa that re-quires a crack length of 500 lm.
The closer the crack is to the inner or outer surface, the lowerthe load will be when ligament yield occurs. This is illustrated inFig. 5 (Case 4), where the computed J-integral for a radial150 lm crack is plotted versus the distance to the inner surfacefor the same pressure levels as in Fig. 4.
Fig. 6 shows how the computed J-integral for a 150 lm crack lo-cated in the center of the tube is affected by the crack orientationat p ¼ 5, 7.5, 10 and 20 MPa (Case 5). The computed J dependsstrongly on the crack orientation and it decreases monotonicallyas the crack rotates from the radial to the circumferential direction,and J is essentially zero when the crack is in the circumferential
direction. It can also be noted that the relative difference in theJ-distribution increases with the load.
2.2. Single kinked crack
As a first approximation it is natural to assume cracked hy-drides to be straight cracks as in the examples above. In realitythe geometry is more complex. At a macro-level hydrides are of-ten kinked and at a micro-level hydrides always contain a largenumber of small kinks. When the crack tip loading is mixed mode(Mode I opening and Mode II in-plane shearing), the crack willgenerally kink at onset of crack growth and the kink angle isdetermined from the condition that the crack tip loading is pureMode I or maximum energy release rate [42]. A less restrictive
0 5 10 15 20 25 30 35 40 45 500
200
400
600
800
1000
1200
1400
1600
1800
2000a
b
p [MPa]
J B [N
/m]
center crack, contour 5edge crack, contour 5
0 10 20 30 40 50 600
1
2
3
4
5
6
p [MPa]
ε φ [%]
uncracked specimencentered crackedge crack
Fig. 3. ðaÞ Computed J-integral versus applied load at crack tip B for a radial crack of length 150 lm that is located in the middle of the tube and at inner surface respectively(Case 1) and ðbÞ the associated hoop strain e/ versus the load p for the uncracked specimen, single centered crack and single edge crack.
74 K.-F. Nilsson et al. / Journal of Nuclear Materials 396 (2010) 71–85

Author's personal copy
assumption is to model the fractured hydride as a kinked crack asin Fig. 7. To assess how a small kink affects the computed J, thefracture analysis was performed for a 150 lm crack rotated inthe interval ±50� from the radial direction and where the crackwas kinked by an interval w ¼ ½�30�;30�� from the radial directionwith 5� increments and where the length of the kinked part was1.5 lm.
Fig. 8 shows the computed J versus the crack orientation for astraight crack and a kinked crack respectively at p ¼ 10 MPa. Forthe kinked crack the kink angle that maximizes the J is computed
using cubic spline interpolation. This angle is given in Table 3 forthe different orientation angles. The important observation is thata small kink increases the computed J for non-radial cracks, whichsignificantly flattens the J-distribution and cracks that are tilted inthe interval ±50� from the radial direction are equally critical. Thetilt angle in an elastic analysis increases with the mode mixity [42],which is in line with the results in this paper. For a radial crack theloading is pure Mode I and the shearing component (Mode II) in-creases as the crack becomes more circumferential. For practicalreasons hydrides that are within ±45� from the radial direction
0 0.1 0.2 0.3 0.4 0.5 0.60
20
40
60
80
100
120
140
160
180
200
a [mm]
J A [N
/m]
p=2.5MPap=5.0MPap=7.5MPap=10.0MPap=20.0MPa
Fig. 4. Computed J-integral for crack tip A versus crack length for p ¼ 2:5, 5, 7.5, 10 and 20 MPa.
0 0.1 0.2 0.3 0.4 0.5 0.60
50
100
150
200
250
300
Distance from the inner tube boundary [mm]
JA [N
/m]
p=2.5MPap=5.0MPap=7.5MPap=10.0MPap=20.0MPainner tube boundaryouter tube boundary
00.10.20.30.40.50.6 Distance from the outer tube boundary [mm]
Fig. 5. Computed J-integral at crack tip A versus distance from the inner tube surface for p ¼ 2:5, 5, 7.5, 10 and 20 MPa.
K.-F. Nilsson et al. / Journal of Nuclear Materials 396 (2010) 71–85 75

Author's personal copy
are often defined as re-oriented. The results in Fig.8 indicate thatsuch a characterization makes sense in a fracture mechanics ap-proach. To model the small kink, the squared element size, Rc
was reduced to 0.3 lm. The number of degrees of freedom in-creased drastically to typically 3� 105. It can be seen that the J va-lue for the kinked (dotted line) and straight crack model (solid line)give the same result for a radial crack. Thus the difference in Rc didnot affect the result. For each crack orientation 13 kink angles wereevaluated and the total computational times were consequentlymuch higher than for a straight crack analysis.
2.3. Two interacting cracks
A zircaloy cladding tube may contain a very large number of hy-drides where the distance between hydrides is smaller that thelength of individual hydrides. This indicates that cracked hydrideswill interact in a complex manner that depends on the size, orien-tation and distance between adjacent hydrides.
0 20 40 60 80 100 120 140 160 1800
10
20
30
40
50
60
φ [°]
J A [N
/m]
p=5.0MPap=7.5MPap=10.0MPap=20.0MPa
Fig. 6. Computed J-integral at crack tip A versus crack orientation for p = 5, 7.5, 10 and 20 MPa.
Fig. 7. The parameters used to describe the kinked crack.
−50 −40 −30 −20 −10 0 10 20 30 40 505
6
7
8
9
10
11
12
13
14
φ [ [°]
J A [N
/m]
no kinkkinked crack
Fig. 8. Computed J-integral value at crack tip A for kinked crack � and crack with no kink �; p ¼ 10 MPa.
76 K.-F. Nilsson et al. / Journal of Nuclear Materials 396 (2010) 71–85
Author's personal copy
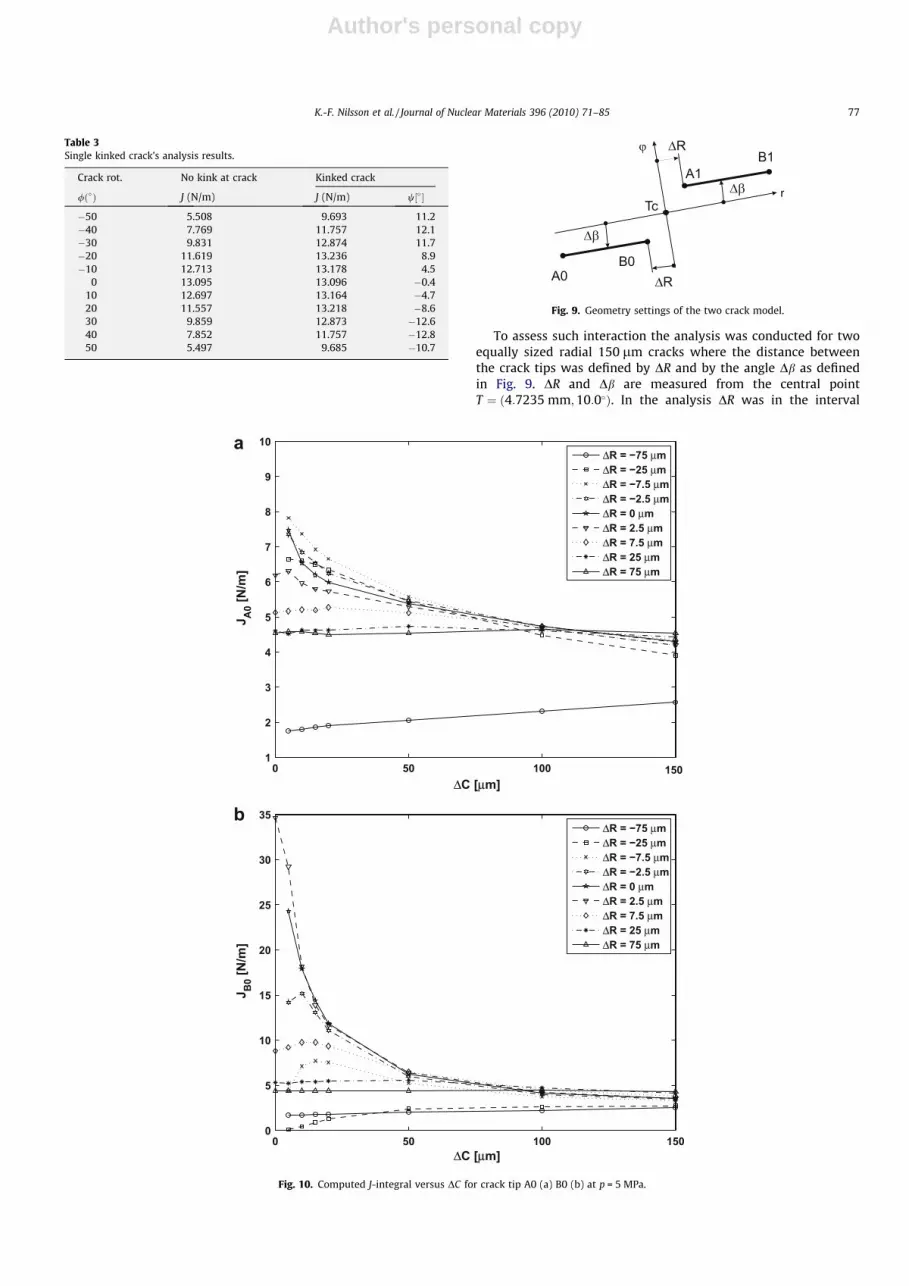
To assess such interaction the analysis was conducted for twoequally sized radial 150 lm cracks where the distance betweenthe crack tips was defined by DR and by the angle Db as definedin Fig. 9. DR and Db are measured from the central pointT ¼ ð4:7235 mm;10:0�Þ. In the analysis DR was in the interval
Table 3Single kinked crack’s analysis results.
Crack rot. No kink at crack Kinked crack
/ð�Þ J (N/m) J (N/m) w½��
�50 5.508 9.693 11.2�40 7.769 11.757 12.1�30 9.831 12.874 11.7�20 11.619 13.236 8.9�10 12.713 13.178 4.5
0 13.095 13.096 �0.410 12.697 13.164 �4.720 11.557 13.218 �8.630 9.859 12.873 �12.640 7.852 11.757 �12.850 5.497 9.685 �10.7
R
A0B0
A1B1
Tc
R
r
Fig. 9. Geometry settings of the two crack model.
0 50 1001
2
3
4
5
6
7
8
9
10
ΔC [μm]
J A0 [N
/m]
ΔR = −75 μmΔR = −25 μmΔR = −7.5 μmΔR = −2.5 μmΔR = 0 μmΔR = 2.5 μmΔR = 7.5 μmΔR = 25 μmΔR = 75 μm
0 50 100 150
150
0
5
10
15
20
25
30
35
ΔC [μm]
J B0 [N
/m]
ΔR = −75 μmΔR = −25 μmΔR = −7.5 μmΔR = −2.5 μmΔR = 0 μmΔR = 2.5 μmΔR = 7.5 μmΔR = 25 μmΔR = 75 μm
a
b
Fig. 10. Computed J-integral versus DC for crack tip A0 (a) B0 (b) at p = 5 MPa.
K.-F. Nilsson et al. / Journal of Nuclear Materials 396 (2010) 71–85 77

Author's personal copy
±57lm and 2Db between 0� and 1.8195� (which corresponds to acircumferential distance, DC ¼ 2Db � pRTc=180 ¼ 150 lm). A nega-tive DR implies overlapping of cracks. The analyses were performedfor a load up to 20 MPa.
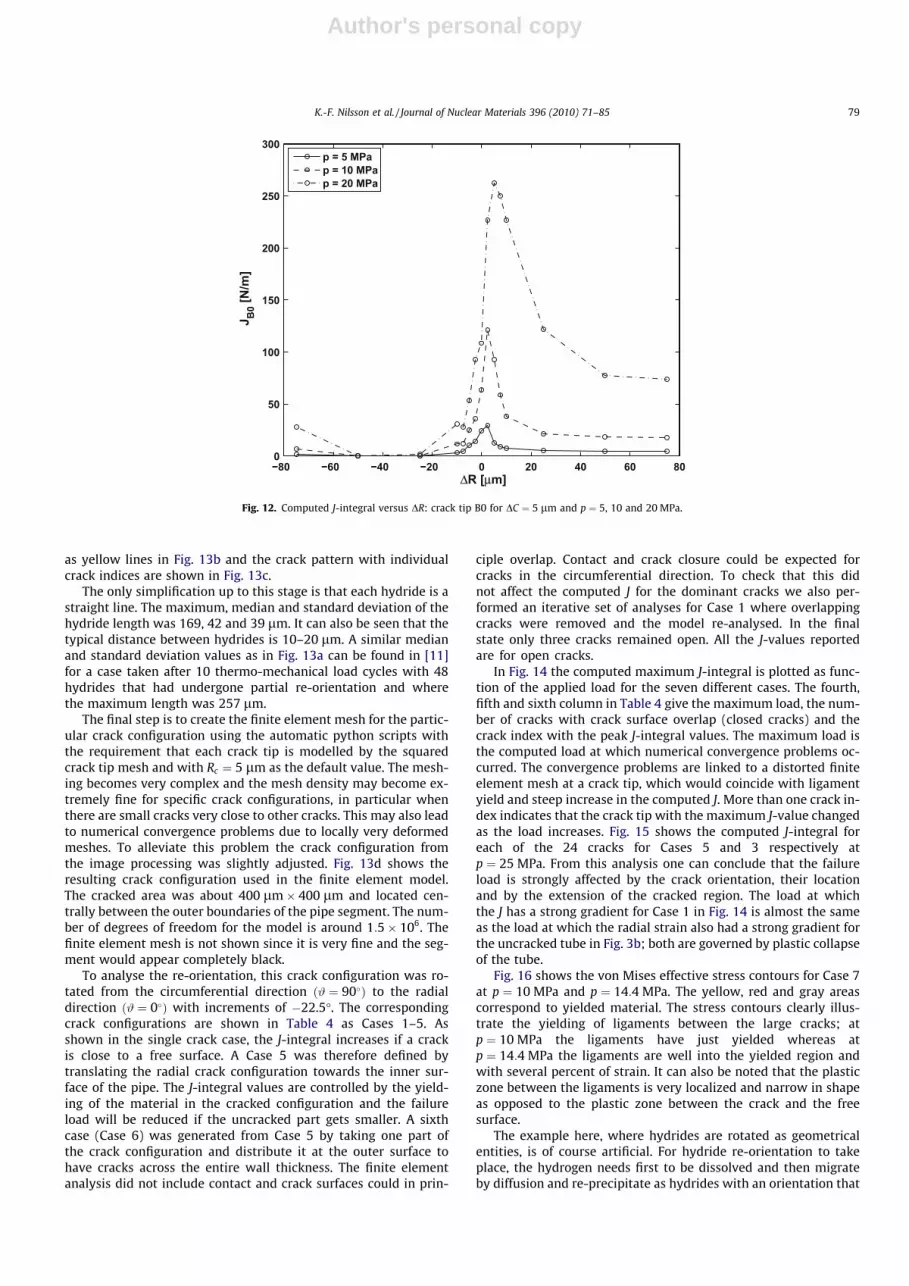
The computed J at p ¼ 5 MPa for the crack tips A0 and B0 versusDC are plotted in Fig. 10a and b respectively for different values ofDR. Fig. 11a and b show the corresponding J-values versus DR fordifferent DC. It follows directly that there is a strong crack interac-tion effect when the cracks are close to each other. For a positiveDR, the interaction factor increases monotonically with decreasingdistance and for negative DR there is a shielding effect if the over-lap is large due to local unloading. When the overlap is very smallthe interaction becomes very complex. The J-integral value in-creases when ligaments yield and consequently the crack interac-tion is expected to extend to larger crack distances with increasingyielding. One therefore expects the crack interaction to be more
pronounced with increasing load. This is illustrated by Fig. 12where the computed J is plotted for crack tip B0 for p ¼ 5, 10 and20 MPa and DC ¼ 5 lm.
3. Multi crack configuration
In this section we will analyse a more realistic crack configura-tion. To this end we use a set of 24 hydrides located primarily inthe circumferential orientation. The micrographs were taken di-rectly from [11] and analysed by an in-house image processing toolthat uses the MATLAB image processing tool box. Fig. 13a showsthe micrograph picture after it has been digitalized into a numericmatrix and contrasted by image processing procedures so that thedarker hydrides appear more clearly. Each hydride was subse-quently characterized with respect to its length ðaÞ, locationTðr; hÞ and orientation ð/Þ. The mapped hydrides are represented
−80 −60 −40 −20 0 20 40 60 801
2
3
4
5
6
7
8a
b
ΔR [μm]
J A0 [N
/m]
ΔC = 0μmΔC = 5μmΔC = 10μmΔC = 15μmΔC = 20μmΔC = 50μmΔC = 100μmΔC = 150μm
−80 −60 −40 −20 0 20 40 60 800
5
10
15
20
25
30
35
ΔR [μm]
J B0 [N
/m]
ΔC = 0μmΔC = 5μmΔC = 10μmΔC = 15μmΔC = 20μmΔC = 50μmΔC = 100μmΔC = 150μm
Fig. 11. Computed J-integral versus DR for crack tip A0 (a) and B0 (b) at p = 5 MPa.
78 K.-F. Nilsson et al. / Journal of Nuclear Materials 396 (2010) 71–85
Author's personal copy
as yellow lines in Fig. 13b and the crack pattern with individualcrack indices are shown in Fig. 13c.
The only simplification up to this stage is that each hydride is astraight line. The maximum, median and standard deviation of thehydride length was 169, 42 and 39 lm. It can also be seen that thetypical distance between hydrides is 10–20 lm. A similar medianand standard deviation values as in Fig. 13a can be found in [11]for a case taken after 10 thermo-mechanical load cycles with 48hydrides that had undergone partial re-orientation and wherethe maximum length was 257 lm.
The final step is to create the finite element mesh for the partic-ular crack configuration using the automatic python scripts withthe requirement that each crack tip is modelled by the squaredcrack tip mesh and with Rc ¼ 5 lm as the default value. The mesh-ing becomes very complex and the mesh density may become ex-tremely fine for specific crack configurations, in particular whenthere are small cracks very close to other cracks. This may also leadto numerical convergence problems due to locally very deformedmeshes. To alleviate this problem the crack configuration fromthe image processing was slightly adjusted. Fig. 13d shows theresulting crack configuration used in the finite element model.The cracked area was about 400 lm� 400 lm and located cen-trally between the outer boundaries of the pipe segment. The num-ber of degrees of freedom for the model is around 1:5� 106. Thefinite element mesh is not shown since it is very fine and the seg-ment would appear completely black.
To analyse the re-orientation, this crack configuration was ro-tated from the circumferential direction ð# ¼ 90�Þ to the radialdirection ð# ¼ 0�Þ with increments of �22.5�. The correspondingcrack configurations are shown in Table 4 as Cases 1–5. Asshown in the single crack case, the J-integral increases if a crackis close to a free surface. A Case 5 was therefore defined bytranslating the radial crack configuration towards the inner sur-face of the pipe. The J-integral values are controlled by the yield-ing of the material in the cracked configuration and the failureload will be reduced if the uncracked part gets smaller. A sixthcase (Case 6) was generated from Case 5 by taking one part ofthe crack configuration and distribute it at the outer surface tohave cracks across the entire wall thickness. The finite elementanalysis did not include contact and crack surfaces could in prin-
ciple overlap. Contact and crack closure could be expected forcracks in the circumferential direction. To check that this didnot affect the computed J for the dominant cracks we also per-formed an iterative set of analyses for Case 1 where overlappingcracks were removed and the model re-analysed. In the finalstate only three cracks remained open. All the J-values reportedare for open cracks.
In Fig. 14 the computed maximum J-integral is plotted as func-tion of the applied load for the seven different cases. The fourth,fifth and sixth column in Table 4 give the maximum load, the num-ber of cracks with crack surface overlap (closed cracks) and thecrack index with the peak J-integral values. The maximum load isthe computed load at which numerical convergence problems oc-curred. The convergence problems are linked to a distorted finiteelement mesh at a crack tip, which would coincide with ligamentyield and steep increase in the computed J. More than one crack in-dex indicates that the crack tip with the maximum J-value changedas the load increases. Fig. 15 shows the computed J-integral foreach of the 24 cracks for Cases 5 and 3 respectively atp ¼ 25 MPa. From this analysis one can conclude that the failureload is strongly affected by the crack orientation, their locationand by the extension of the cracked region. The load at whichthe J has a strong gradient for Case 1 in Fig. 14 is almost the sameas the load at which the radial strain also had a strong gradient forthe uncracked tube in Fig. 3b; both are governed by plastic collapseof the tube.
Fig. 16 shows the von Mises effective stress contours for Case 7at p ¼ 10 MPa and p ¼ 14:4 MPa. The yellow, red and gray areascorrespond to yielded material. The stress contours clearly illus-trate the yielding of ligaments between the large cracks; atp ¼ 10 MPa the ligaments have just yielded whereas atp ¼ 14:4 MPa the ligaments are well into the yielded region andwith several percent of strain. It can also be noted that the plasticzone between the ligaments is very localized and narrow in shapeas opposed to the plastic zone between the crack and the freesurface.
The example here, where hydrides are rotated as geometricalentities, is of course artificial. For hydride re-orientation to takeplace, the hydrogen needs first to be dissolved and then migrateby diffusion and re-precipitate as hydrides with an orientation that
−80 −60 −40 −20 0 20 40 60 800
50
100
150
200
250
300
ΔR [μm]
J B0 [N
/m]
p = 5 MPap = 10 MPap = 20 MPa
Fig. 12. Computed J-integral versus DR: crack tip B0 for DC ¼ 5 lm and p ¼ 5, 10 and 20 MPa.
K.-F. Nilsson et al. / Journal of Nuclear Materials 396 (2010) 71–85 79

Author's personal copy
depends on the stress and texture. In [11] only relatively few hy-drides were radial even after 10 thermo-mechanical load cycles.There are, however, many examples in the literature where mosthydrides are radial after load cycles [14,10,15,30,22], so the Cases5–7 are not unrealistic.
4. Analysis of co-linear crack configurations
The hydrides in a zircaloy cladding tube have a very complexpattern and it is impossible from a practical point-of-view to assessevery combination. The number of hydrides, their length, the liga-ment lengths and the circumferential distance are important crackcharacteristics. For a more systematic analysis a set of 12 co-linearradial crack configurations described by crack length ðaÞ, the num-ber of cracks ðN�Þ, the normalized fracture area ðnk ¼
PN�
i¼1ðakÞi=tÞ,where t is the tube thickness, k is the case index, and the angle be-tween the cracks ð2DbÞwas defined. The mean circumferential dis-tance is given by DC ¼ 2Db � pRTc=180. Table 5 gives the parameterconfiguration for each case together with a small picture of eachcrack configuration.
The computed J-integral versus the applied load are shown inFigs. 17–19. The maximum load and the crack tip with the highestJ-value are given in Table 5. The crack indexing starts from thecrack closest to the inner surface and the crack tip convention isthe same as in Fig. 7.
Fig. 17 allows us to compare the effect of crack length, a, and thecrack/ligament ratio, n. It is obvious that the failure load is muchmore affected by the crack/ligament ratio than the crack size. Thisis in line with the conjecture that failure is primarily controlledby ligament yield. As a consequence of the very non-linear stress–strain curve, the reduction in failure load is much stronger than
Table 4Pattern rotation cases overview.
Case c ð�Þa Picture pm ðMPaÞb N�c C-CTd
1 90.0 55.0 18 1B
2 67.5 40.8 6 9A ? 9B ? 9A
3 45.0 32.6 1 9A ? 9B
4 22.5 29.5 1 9B ? 18A
5 0.0 28.0 0 9B ? 9A
6 0.0,nb 22.7 0 9B ? 9A ? 0B
7 0.0,ww 14.4 0 18A ? 9B ? 9A
nb = Near boundary, ww = whole width.a Rotation angle.b Load at which the numerical divergence has occurred.c Number of the closed cracks.d A crack index and a crack tip where the maximal value of the J-integral is
reached.
0
1
2
3
4 5
6
7
8
9
10
11
12
13
14
15
16
17
18
19
20
21
22
23
0 50 100 150 200 250 300 350 400
−300
−250
−200
−150
−100
−50
0
X [μm]
Y [μ
m]
0
1
2
3
4 5
6
7
8
9
10
11
12
13
14
15
16
17
18
19 20
21
22
23
a
b
c
d
Fig. 13. Schematic illustration of the steps to define the crack real configuration in afinite element model (a) micrograph with hydrides (b) hydrides marked from imageprocessing (c) hydrides with indices after image processing (d) cracks with indicesas used in the finite element.
80 K.-F. Nilsson et al. / Journal of Nuclear Materials 396 (2010) 71–85

Author's personal copy
the reduction in the crack/ligament ratio. The computed J versus theload for the three different values of circumferential distance be-tween the co-linear cracks is shown in Figs. 18 and 19 for cracklengths of 50 and 100 lm respectively. The load distribution isquite different when the cracks are spread out whereby the crackinteraction becomes much weaker. This effect is more pronouncedfor the shorter crack since the ratio a=DC is twice as large. It also fol-lows from Figs. 17–19 that the crack length has a relatively strongereffect when cracks are separated by a circumferential distance.
5. Discussion
In this paper we have assumed that hydrides first crack and thatcomponent failure can be modelled by classical fracture mechan-ics. Such an approach is by no means obvious since the geometrical
scale of hydrides is quite small and the material is heterogeneous.One important question is which criterion one should use for thecrack growth. It can be assumed that the crack growth occurs bysuccessive tearing of ligaments between fractured hydrides asshown in for instance [8,31], but the concept of J-controlled frac-ture implies that J completely characterizes the crack tip situation.When the plastic zone is large compared to a characteristic length,such as the crack ligament, and the shape of the plastic zone de-pends on the crack geometry then one should not expect that asimple 1-parameter such as J is an accurate parameter for fracture.This is clearly the case here where the plastic deformation is con-strained to the crack ligaments and therefore depends on the crackconfiguration. Another issue is the transferability of toughness datafrom large component tests. As mentioned above, a fracture tough-ness value, JIC , is determined from a specimen with a fabricated
0 2 4 6 8 10 12 14 16 18 20 220
50
100
150
200
250
300
350
400
Crack index
J [N
/m]
γ = 0.0°, crack tip Aγ = 0.0°, crack tip Bγ = 45.0°, crack tip Aγ = 45.0°, crack tip B
Fig. 15. Computed J-integral values for p ¼ 25 MPa for each crack for Case 4 ðc ¼ 0�Þ and Case 2 ðc ¼ 45�Þ.
0 10 20 30 40 50 600
100
200
300
400
500
600
700
800
900
p [MPa]
J [N
/m]
γ = 90.0°
γ = 67.5°
γ = 45.0°
γ = 22.5°
γ = 0
.0°
γ = 0.0°,nb
γ = 0.0°,ww
Fig. 14. Computed maximal J versus the applied load for the different cases in Table 4.
K.-F. Nilsson et al. / Journal of Nuclear Materials 396 (2010) 71–85 81

Author's personal copy
macro-crack with 200 lm apparent crack extensions, which ismuch larger than the typical distance between hydrides. The local-ized plastic yielding of the ligaments as illustrated in Fig. 16 sug-gests that a cohesive zone with a crack tip opening displacementcriterion could be a more appropriate model. On the other handif the failure is controlled by ligament yield and plastic collapse,then fracture parameters (J, CTOD) will increase drastically andthe load will be rather insensitive to the criterion for onset of crackgrowth. Hence J becomes a paremater for ligament yield. Zirco-
nium alloys usally exhibit crack growth resistance, i.e. the J-valueneeded to propagate the crack increases with the crack extension(R-curve) and build-up of a plastic wake behind the advancingcrack tip. In a situation where crack propagation occurs by succes-sive tearing of ligaments and crack coalescence, there would be nosignificant crack growth resistance since there was no tearing forthe already cracked section. Moreover as the crack propagatesthe J-integral will also increase with the crack length. These twofactors indicate an unstable crack growth mechanism. Although
Table 5Different cases of the ligament analysis setting.
ka ak ðlmÞb N�c nkd 2Db ð�Þe Picture pm ðMPaÞf C-CTg
1 50 10 0.814 0.0 14.1 0B ´ 1A ´ 1B ´ 2A ´ 1B
2 100 5 0.814 0.0 13.2 0B ´ 1A
3 50 8 0.651 0.0 24.9 0B ´ 1A ´ 1B
4 100 4 0.651 0.0 23.2 0B ´ 1A
5 50 6 0.489 0.0 34.7 0B ´ 1A
6 100 3 0.489 0.0 32.6 0B ´ 1A
7 50 10 0.814 0.1 15.0 1A ´ 1B
8 100 5 0.814 0.1 13.3 0B ´ 1A
9 50 10 0.814 0.3 21.7 1A ´ 0A
10 100 5 0.814 0.3 15.3 0B ´ 1A ´ 1B ´ 0A
11 50 10 0.814 0.6 33.7 0A
12 100 5 0.814 0.6 20.0 0A
a Case.b Length of a crack.c Number of cracks.d nk ¼
PN�
i¼1ðakÞi=t, portion of the tube wall cross-section occupied by the cracks.e Circumferential distance between cracks.f Load at which the numerical divergence has occurred.g A crack index and a crack tip where the maximal value of the J-integral is reached.
Fig. 16. Mises stress at p ¼ 10 MPa and p ¼ 14:4 MPa for Case 7.
82 K.-F. Nilsson et al. / Journal of Nuclear Materials 396 (2010) 71–85

Author's personal copy
the propagarion is driven by the successive yielding of the liga-ments and hence ductile, the global response may appear as morebrittle since the load may be significantly lower than the globalplastic collapse load. After re-orientation there will normally alsobe circumferential hydrides. Such hydrides could act as crackarresters either as ‘crack branchers’, if the hydride is fratured, oras inclusions if the hydride is intact and where the stiffness de-pends on the Zr/H ratio.
To verify the fracture model and to address fundamental issueswe have started an experimental programme. In the test pro-gramme, hydrogen charged specimens with nominally 0, 100,200 and 300 ppm of hydrogen will be tested. To create different
hydride configurations, the specimens will first be subjected tothermo-mechanical load cycles with prescribed pressure at differ-ent temperatures. The specimens will subsequently be analysed bythe image processing approach to quantify hydride configurations.The tested tubes will then be cut into smaller segments and loadedin radial displacement controlled tests until failure. The tests willbe analysed using the model outlined in this paper.
In practice one does not know the hydride configuration. It de-pends on the stress and temperature history as well as the manu-facturing process of the tube material. The first step in a totalassessment would be to compute hydride uptake and nucleation,growth and precipitation from corrosion theories, hydrogen diffu-
0 5 10 15 20 25 30 350
100
200
300
400
500
600
p [MPa]
J [N
/m]
ξ = 0.814
ξ = 0.651
ξ = 0.489
Cases: 1 & 2
Cases: 3 & 4
Cases: 5 & 6
a = 50 μm a = 100 μm
Fig. 17. Computed J-integral versus applied load values for the Cases 1–6.
0 5 10 15 20 25 30 350
100
200
300
400
500
600
p [MPa]
J [N
/m]
ΔC = 0.0 μm
ΔC = 8.2 μm
ΔC = 24.7 μm
ΔC = 49.5 μm case 1 case 7 case 9 case 11
Fig. 18. Computed J-integral versus applied load values when a = 50 lm, N� = 10, n ¼ 0:814 and DC ¼ 0, 8.2, 24.7 and 49.5 lm.
K.-F. Nilsson et al. / Journal of Nuclear Materials 396 (2010) 71–85 83

Author's personal copy
sion and re-precipitation [33]. The second step is the fracture of thebrittle hydrides that could probably be estimated by strain orstress criteria [20,43]. The final step would be the mechanical fail-ure analysis studied in this paper. The complexity of the hydrideconfiguration leads naturally to a probabilistic approach wherefailure is assumed to be governed by onset of crack growth. TheJ-integral needs to be computed for a set of given crack configura-tions, Jðp; aiðT;/ÞÞ, and where cracks need to be described by somedistribution function. Such an approach has been used to studyhow the ductility of ductile cast iron is affected by casting defects[44].
Hydride embrittlement is a key degradation mechanisms butthere are others that affect the ductility of spent fuel claddings.Residual stresses result from the corrosion during operation andtensile stresses could be as large as 600 MPa at the outer surface[7]. Incorporating residual stresses in a finite element analysescan be rather straightforward since the value can be estimatedfrom the volume difference between corroded and un-corrodedmaterial. The stress from the internal pressure will drop as thetemperature drops unless additional gas pressure is built-up. Onemechanism for increased gas pressure could be radioactive decayof alpha emitters which potentially could result in additional pres-sure of 12 MPa after 300 years of storage for MOX fuel [23]. Theirradiation induces point and line defects that embrittle the mate-rial. To address this properly requires a multi-scale approachwhich is presently basic research and beyond engineering ap-proaches. The approach for engineering analysis could be semi-empirical by determining the material properties such as fracturetoughness and stress–strain curves experimentally and then usingthese data directly in the analysis.
6. Conclusions
The basic assumption in this paper is that hydrides are brittleand fracture at incipient global plastic deformation and that crackgrowth of fractured hydrides can be modelled with non-linear frac-ture mechanics. The hydride induced failure in cladding tubes forlong-term storage is controlled by the hydride configuration andin particular the size, orientation of individual hydrides and the
number of hydrides that interact in a complex way. The main con-clusions from the analysis in these paper are:
� The load at which a cladding tube fails can be reduced by anorder of magnitude and cladding failure become more unstable,as seen in Fig. 14, if there are several interacting radial hydridesacross the wall thickness. The failure probability in a specificscenario would then be controlled by the probability of havinga critical, but perhaps very local, hydride configuration.
� Hydride induced failure of zircaloy cladding is controlled byyielding of the ligaments between fractured hydrides as shownin Fig. 16. The relative length of hydrides across the wall thick-ness is therefore the parameter that most affects the failure load(Fig. 17).
� The probability for onset of crack growth from hydridesincreases when hydrides become more radial as shown in Fig. 6.
� The distance between hydrides is often smaller than the lengthof the individual hydrides and crack interaction plays thereforean important role and must be accounted for.
� Hydrides have a complex shape and crack growth from non-radial cracks is more likely from kinked cracks (Fig. 8).
An experimental programme where the hydride configurationhas been quantified, is needed to verify how well a fracturemechanics based model can predict failure loads. Such work hasnow started.
References
[1] The Roles of Storage in the Management of Long-lived Radioactive Waste –Practices and Potentialities in OECD Countries, 2006 NEA No. 6043.
[2] The Long-term Storage of Radioactive Waste: Safety and Sustainability – APosition Paper of International Experts, 2003 IAEA.
[3] Spent fuel performance assessment and research, Final report of a co-ordinated Research Project on Spent Fuel Performance Assessment andResearch (SPAR) 1997-2001, 2003 IAEA-TECDOC-1343.
[4] Technical Basis for Extended Storage of Spent Nuclear Fuel, EPRI, Palo Alto, CA,USA, 2002 EPRI-Report-1003416.
[5] A. Sasahara, T. Matsamura, Nuclear Engineering and Design 238 (2008) 1250.[6] Standard Guide for Evaluation of Materials Used in Extended Service of Interim
Spent Nuclear Fuel Dry Storage Systems, 2004 ASTM Standard C1562-03.
0 5 10 15 20 25 30 350
100
200
300
400
500
600
p [MPa]
J [N
/m]
ΔC = 0.0 μm
ΔC = 8.2 μm
ΔC = 24.7 μm
ΔC = 49.5 μm
case 2 case 8 case 10 case 12
Fig. 19. Computed J-integral versus applied load values when a = 100 lm, N� = 5, n ¼ 0:814 and DC ¼ 0, 8.2, 24.7 and 49.5 lm.
84 K.-F. Nilsson et al. / Journal of Nuclear Materials 396 (2010) 71–85

Author's personal copy
[7] H.M. Chung, Hydride-related Degradation of SNF Cladding under RepositoryConditions, Office of Civilian Radioactive Waste Management, ANL-EBS-MD-000011 REV 00 ICN 01, 2000.
[8] R.S. Daum, S. Majumdar, D.W. Bates, A.T. Motta, D.A. Koss, M.C. Billone, ASTMSpecial Technical Publication 1423 (2002) 696.
[9] R.E. Einziger, R. Kohli, Nuclear Technology 67 (1984) 107.[10] H.C. Chu, S.K. Wu, R.C. Kuo, Journal of Nuclear Materials 373 (2008) 319.[11] K. Sakamoto, M. Nakatsuka, Journal of Nuclear Science and Technology 43 (9)
(2006) 1136.[12] M.R. Louthan, R.P. Marshall, Journal of Nuclear Materials 9 (2) (1963) 170.[13] R.P. Marshall, M.R. Louthan, ASM Transactions Quarterly 56 (1963) 693.[14] H.C. Chu, S.K. Wu, K.F. Chien, R.C. Kuo, Journal of Nuclear Materials 362 (2007)
93.[15] R.S. Daum, S. Majumdar, Y. Liu, M.C. Billone, Journal of Nuclear Science and
Technology 43 (9) (2006) 1054.[16] C. Ferry, C. Poinssot, C. Cappelaere, L. Desgranges, C. Jegou, F. Miserque, J.P.
Pirion, D. Roudil, J.M. Gras, Journal of Nuclear Materials 352 (2006) 246.[17] F. Nagase, T. Fuketa, Journal of Nuclear Science and Technology 41 (12) (2004)
1211.[18] M. Veleva, S. Arsène, M.-C. Record, J.L. Bechade, J.B. Bai, Metallurgical and
Materials Transactions A 34A (2003) 567.[19] S. Arsène, J.B. Bai, P. Bompard, Metallurgical and Materials Transactions A 34A
(2003) 579.[20] S. Arsène, J.B. Bai, P. Bompard, Metallurgical and Materials Transactions A 34A
(2003) 553.[21] M. Grange, J. Besson, E. Andrieu, Metallurgical and Materials Transactions A
31A (2000) 679.[22] H. Tsai, M.C. Billone, Journal of ASTM International 3 (1) (2006) 14.[23] C. Poinssot, C. Ferry, J.-M. Gras, Materials Research Society Symposium
Proceedings 807 (2004) 29–34.[24] Delayed hydride cracking in zirconium alloys in pressure tube nuclear
reactors, Final report of a co-ordinated research project 1998–2002, 2004IAEA-TECDOC-1410.
[25] S.-K. Kim, Journal of Nuclear Materials 378 (2008) 30.
[26] M. Sugisaki, K. Hashizume, Y. Hatano, Estimation of hydrogen redistribution inzircaloy cladding of spent fuel under thermal conditions of dry storage andevaluation of its influence on mechanical properties, IAEA-TECDOC-1316,International Atomic Energy Agency.
[27] M.P. Puls, Metallurgical Transactions A 19A (1988) 1507.[28] M.P. Puls, Metallurgical Transactions A 22A (1991) 2327.[29] M. Kerr, M.R. Daymond, R.A. Holt, J.D. Almer, Journal of Nuclear Materials 380
(2008) 70.[30] S.I. Hong, K.W. Lee, Journal of Nuclear Materials 340 (2005) 203.[31] H. Haysashi, K. Ogata, T. Baba, K. Kamimura, Journal of Nuclear Science and
Technology 43 (9) (2006) 1128.[32] H.M. Chung, Understanding hydride and hydrogen-related processes in high
burn-up cladding in spent nuclear fuel storage and accident situations, in:Proceeding of the 2004 International Meeting on LWR Fuel Performance,Orlando, FL, September 2004 (Paper 1065).
[33] K.S. Chan, Journal of Nuclear Materials 227 (1996) 220.[34] K.W. Lee, S.I. Hong, Journal of Alloys and Compounds 346 (2002) 302.[35] J. Xu, S.-Q. Shi, Journal of Nuclear Materials 327 (2004) 165.[36] M. Kuroda, S. Yamanaka, Journal of Nuclear Science and Technology 39 (3)
(2002) 234.[37] G. Bertolino, G. Meyer, J. Perez Ipina, Journal of Alloys and Compounds 330–
332 (2002) 408.[38] G. Bertolino, G. Meyer, J. Perez Ipina, Journal of Nuclear Materials 320 (2002)
272.[39] G. Bertolino, G. Meyer, J. Perez Ipina, Journal of Nuclear Materials 322 (2002)
57.[40] J. Bertsch, W. Hoffelner, Journal of Nuclear Materials 352 (2006) 116.[41] K.S. Chan, Acta Metallurgica et Materialia 43 (1995) 4325.[42] M.Y. He, A. Bartlett, A.G. Evans, J.W. Hutchinson, Journal of the American
Ceramic Society 74 (1991) 767.[43] R. Choubey, M.P. Puls, Metallurgical and Materials Transactions A 25A (1994)
993.[44] K.-F. Nilsson, V. Vokál, Materials Science and Engineering A 502 (2009)
54.
K.-F. Nilsson et al. / Journal of Nuclear Materials 396 (2010) 71–85 85


