Embed Size (px)
Citation preview
Investigations on Hydrogen Embrittlement of Advanced High
Strength Steels for Automotive Applications
Von der Fakultät für Georessourcen und Materialtechnik
der Rheinisch-Westfälischen Technischen Hochschule Aachen
zur Erlangung des akademischen Grades eines
Doktors der Ingenieurwissenschaften
Genehmigte Dissertation
Vorgelegt von M.Sc.
Qi Gao
Aus Nei Mongol, China
Berichter: Univ.-Prof. Dr.-Ing. Wolfgang Bleck
Univ.-Prof. Dr.-Ing.habil. Brita Daniela Zander
Tag der mündlichen Prüfung: 06. März 2017
Diese Dissertation ist auf den Internetseiten der Hochschulbibliothek online verfügbar

Abstract
The utilization of Advanced High Strength Steels (AHSS) in automotive applications is motivated by a
push to reduce the weight of cars in order to minimize CO2 emissions. The potential risk of Hydrogen
Embrittlement (HE) limits the widespread application of AHSS, making it one of the hottest topics in
materials engineering and the automobile industry.
The current work focused on the hydrogen-induced cracking of 1180 MPa steels for car body
constructions. Various mechanical tests and forming tests to investigate internal hydrogen assisted
cracking as well as hydrogen environment assisted cracking were conducted, concerning the automobile
production processes and conditions during the life of a car. Tests of component-similar samples were
carried out to compare laboratory results with those from the situation close to reality. The
susceptibilities of various steels to HE were characterized and compared. The test methods were
evaluated in the terms of differentiation and simplicity. Additionally, the material- and process-
immanent factors on HE-susceptibility were elucidated and discussed.
The results obtained in this work reveal that the immersion test with U-bend samples and the
incremental loading test are appropriate to evaluate the HE-susceptibility for the material release
process. Factors such as the presence of retained austenite, the high content of carbon equivalent and
the coarse grain size increase the HE-susceptibility of AHSS. However, the addition of carbide-
immanent elements Ti and Nb, and the alloying elements related to pitting corrosion resistance like Cr,
Mo, N reduces the material HE-susceptibility. In the production processes the welding point and
punched edges are sensitive to HE. The strain state during the forming process and the corrosive
surroundings during the life of a car are also significant in the safe application of AHSS in car bodies.
On the basis of these results, by controlling the factors influencing on HE-susceptibility, roughly
divided into the three areas of material, hydrogen and stress, significant steps toward the safe usage of
AHSS in component parts have been made.

Kurzfassung
Die Verwendung von höchstfesten Stählen in Automobilen hat eine hohe Bedeutung bei der
Verringerung des Fahrzeuggewichts und damit bei der Reduzierung der CO2-Emissionen. Der Einsatz
dieser Stähle ist jedoch zum Teil noch limitiert. Ein Grund dafür ist die bei diesen Stählen potentiell
auftretende Wasserstoffversprödung, die daher in den Materialwissenschaften und in der
Automobil-Industrie eine bedeutende Rolle spielt, um diese Stähle industriell einsetzen zu können.
Der Schwerpunkt der vorliegenden Arbeit liegt auf der Untersuchung des wasserstoffinduzierten
Sprödbruchverhaltens von Stählen mit einer Zugfestigkeit von 1180 MPa, für den Einsatz in
Karosseriebauteilen. Die Stähle wurden in verschiedenen mechanischen und umformtechnischen
Versuchen, die die Verhältnisse bzw. die Beanspruchungen der Stähle bei der Produktion sowie der
Verwendung im Fahrzeug widerspiegeln, untersucht und bewertet. Nachfolgend erfolgte eine
Validierung anhand von bauteilähnlichen Versuchen aus dem Karosseriebau zum Abgleich der
Ergebnisse zwischen Laborversuchen und Realität. Gleichzeitig erfolgte auf Basis dieser Bewertungen
ein Vergleich der verschiedenen Prüfmethoden im Hinblick auf die Eignung als Standard für zukünftige
Untersuchungen zur Wasserstoffversprödung. Zusätzlich wurden die wichtigsten Einflüsse der
Materialien sowie der Verarbeitungsprozesse auf die wasserstoffinduzierte Rissbildung von
höchstfesten Stählen für Karosserieanwendung bewertet.
Die Ergebnisse zeigen, dass zwei Methoden sehr geeignet sind, um die Wasserstoffversprödung von
höchstfesten Stählen für Karosserieanwendung zu bewerten: Versuche mit U-Biege-Proben, die in
korrosive Medien getaucht werden und Stufenversuche, bei denen eine Last an zugprobenähnliche
Geometrien in korrosiver Umgebung stufenförmig gesteigert wird. Faktoren wie die Anwesenheit von
Restaustenit, ein hohes Kohlenstoffäquivalent und eine große Korngröße steigern die
Wasserstoffversprödungsneigung. Entgegengesetzt wirkt die Zugabe von Carbid-Bildnern wie Ti
und Nb sowie von Cr, Mo und N, die die Anfälligkeit gegen Lochkorrosion vermindern. Im
Herstellungsprozess haben Schweißpunkte sowie hohe Spannungen an der Kante, wie sie beim
Stanzen auftreten, einen negative Einfluss auf die Neigung zur Wasserstoffversprödung. Weitere
untersuchte und bewertet Einflüsse sind die Dehnungszustände im Umformprozessen sowie
verschiedene korrosive Einflüsse. Die Arbeit bietet damit einen wissenschaftlich fundierten Beitrag zur
Bewertung der Wasserstoffversprödung von höchstfesten Stählen für den sicheren Einsatz von
höchstfesten Stählen in Karosseriebauteilen.

VII
Contents
Abstract ................................................................................................................................................. III
Kurzfassung ........................................................................................................................................... V
Abbreviations and symbols ................................................................................................................... XI
1 Introduction and Objective.............................................................................................................. 1
2 Theoretical Fundamentals ............................................................................................................... 3
2.1 Developments and applications of HSS and AHSS ................................................................ 3
2.2 Hydrogen sources in automotive production processes .......................................................... 7
2.3 Hydrogen absorption and transport in steels ........................................................................... 9
2.3.1 Hydrogen absorption ....................................................................................................... 9
2.3.2 Hydrogen transport ....................................................................................................... 11
2.4 Hydrogen-induced cracking in steels .................................................................................... 16
2.5 Mechanism of hydrogen-induced cracking ........................................................................... 17
2.6 Important factors influencing hydrogen-induced cracking ................................................... 20
3 Materials and Experimental Methods ........................................................................................... 24
3.1 Investigated materials ........................................................................................................... 24
3.2 Material characterization....................................................................................................... 24
3.3 Hydrogen charging and analysis ........................................................................................... 27
3.3.1 Galvano-static charging and electro-galvanizing .......................................................... 27
3.3.2 Thermal desorption spectroscopy measurement ........................................................... 28
3.4 Mechanical tests to investigate HE behavior ........................................................................ 29
3.4.1 Slow Strain Rate Test (SSRT) ...................................................................................... 29
3.4.2 Incremental Loading Test (ILT).................................................................................... 29
3.4.3 Constant Loading Test (CLT) ....................................................................................... 30
3.4.4 U-bending test ............................................................................................................... 31
3.4.5 Four-point-bending test ................................................................................................. 33
3.5 Forming tests ......................................................................................................................... 34
3.5.1 Determination of the Forming Limit Curve (FLC) ....................................................... 34
VIII
3.5.2 Determination of the Bending Limit Curve (BLC) ....................................................... 36
3.6 Investigation of the car component-similar samples ............................................................. 37
4 Characterization of As-delivered Materials .................................................................................. 40
4.1 Chemical composition........................................................................................................... 40
4.2 Microstructure characterization ............................................................................................ 40
4.3 Mechanical properties ........................................................................................................... 47
5 Characterization of Pre-charged Materials.................................................................................... 49
5.1 TDS analysis of pre-charged samples ................................................................................... 49
5.2 GDOES analysis of electro-galvanized samples ................................................................... 51
6 Effects of Hydrogen on Mechanical Properties ............................................................................ 53
6.1 Results from Slow Strain Rate Test (SSRT) ......................................................................... 53
6.2 Results of Incremental Loading Test (ILT) .......................................................................... 62
6.2.1 Hydrogen-induced cracking on holed samples ............................................................. 62
6.2.2 Hydrogen-induced cracking on welded samples ........................................................... 65
6.3 Results of Constant Loading Test (CLT) .............................................................................. 69
6.4 Results of U-bending tests .................................................................................................... 71
6.4.1 U-bending on pre-charged samples ............................................................................... 71
6.4.2 U-bend samples in salt solution .................................................................................... 77
6.4.3 U-bend samples in other corrosion mediums ................................................................ 82
6.4.4 Characterization of different edges ............................................................................... 85
6.5 Results of four-point-bending test ......................................................................................... 89
7 Effects of Hydrogen on Forming Behavior ................................................................................... 92
7.1 Forming Limit Curve (FLC) ................................................................................................. 92
7.2 Bending Limit Curve (BLC) ................................................................................................. 96
8 Behaviors of Component-similar Samples.................................................................................... 98
8.1 Results of 90° V-bend samples ............................................................................................. 98
8.2 Results of cross-die samples ................................................................................................. 99
9 Discussion ................................................................................................................................... 102
9.1 Evaluation of testing methods to investigate HE of AHSS ................................................. 102
9.2 Evaluation of susceptibility to HE in different materials .................................................... 109
IX
9.3 Influence of process-immanent parameters ........................................................................ 116
9.3.1 Influence of welding ................................................................................................... 116
9.3.2 Influence of the edge condition ................................................................................... 118
9.3.3 Influence of strain state ............................................................................................... 120
9.3.4 Influence of corrosive surroundings............................................................................ 121
9.4 Validation of mechanical tests with component-similar tests ............................................. 122
9.5 Consequences for using AHSS for car body applications .................................................. 123
10 Conclusion .............................................................................................................................. 127
Reference ............................................................................................................................................ 130
Curriculum Vitae ................................................................................................................................ 139

X
XI
Abbreviations and symbols
AHSS Advanced High Strength Steels
bcc Body-centered cubic
BH Bake-Hardenable
BLC Bending Limit Curve
CE Carbon Equivalent
CLT Constant Loading Test
CP Complex Phase
DF Delayed Fracture
DP Dual Phase
EBSD Electron Back Scatter Diffraction
eBLC enhanced Bending Limit Curve
EDX Energy-Dispersive X-Ray
EI Embrittlement Index
EG Electro-galvanized
FE Finite Element
fcc Face-centered cubic
FLC Forming Limit Curve
FPZ Fracture Process Zone
GDOES Glow Discharge Optical Emission Spectrometry
GI Hot-dip galvanized
HAR Hydrogen Absorption Reaction
HAT Hydrogen Adsorption Theory
HAZ Heat Affected Zone
HE Hydrogen Embrittlement
HEAC Hydrogen Environment Assisted Cracking
HEDE Hydrogen Enhanced De-cohesion
HELP Hydrogen Enhanced Localized Plasticity
HER Hydrogen Evolution Reaction
HFT Hydrides Formation Theory
HIC Hydrogen-Induced Cracking
HISCC Hydrogen-Induced Stress Corrosion Cracking
HSLA High-Strength, Low-Alloy
HSS High Strength Steel
IHAE Internal Hydrogen Assisted Embrittlement
ILT Incremental Loading Test
HPT Hydrogen Pressure Theory
IQ Image Quality
IR-trap Irreversible trapping site
IZ Inside Zone
KAM Kernel Average Misorientation
LME Liquid Metal Embrittlement
LOM Light Optical Microscope
LS Localized Slip
MS Martensitic
MS-W Martensitic (warm rolled)
PREN Pitting Resistance Equivalent Number
QP Quenching and Partitioning
R-trap Reversible trapping site
RD Rolling Direction
SCC Stress Corrosion Cracking
SEM Scanning Electron Microscopy
SFE Stacking Fault Energy
SSRT Slow Strain Rate Test
SZ Surface Zone
TBF TRIP-aided Bainitic-Ferrite
TD Transverse Direction
TDS Thermal Desorption Spectroscopy
TRIP Transformation Induced Plasticity
TWIP Twinning Induced Plasticity
WZ Welded Zone
XII
Au Uniform elongation
Af Total elongation
c Equilibrium concentration of hydrogen under stress
C Hydrogen concentration
c0 Constant of hydrogen concentration
cH Hydrogen solubility in iron substrate
D Hydrogen diffusion coefficient in crystallographic lattice of metallic solid
D0 Pre-exponential factor of hydrogen diffusion coefficient
E´, ∆Ex Barrier energy to activate the hydrogen from trapping sites
Ea Activation energy for hydrogen diffusion in perfect crystal lattice
∆Etrap Activation energy for hydrogen interaction with trapping sites
F Force
Fmax Maximal force until fracture
n Number of cracks
H2 Molecule hydrogen
Hab Absorbed hydrogen atoms
Had Adsorbed hydrogen atoms
∆H Partial molar heat
∆HV Hardness difference
JD Diffusion flux density
JH Diffusion flux density of hydrogen
ltot Total length of cracks
L Distance between the mounted rollers in bending test
PH Hydrogen partial pressure
Q Activation energy of hydrogen
R Universal gas constant, 3.814×10⁻³
R Bending radius
Ra Surface roughness
Rm Tensile strength
Rp0.2 Yield strength
Rp0.2/ Rm Yield ratio
t Thickness of steel sheet
tc Time to crack initiation
tf Incubation time to delayed fracture
T Temperature
Mole volume of hydrogen
y Displacement of lower points in four-point-bending test
ymax Maximum allowed bending grade
α Pre-coefficient of hydrogen solubility in iron substrate
α Ferrite phase
α´ Alpha martensite phase
γ, γA retained austenite
ε Epsilon martensite phase
σ Applied stress
σf Applied stress to fracture
Hydrostatic stress
σlocal Local stress
σmarco Marco-stress
σmax Maximum allowed stress
φv Effective strain
φ1 Major deformation degree
φ2 Minor deformation degree
1
1 Introduction and Objective
The utilization of Advanced High Strength Steels (AHSS) in the automobile industry has brought great
advances in increased passenger safety and weight reduction of the car body construction to meet the
requirements of fuel efficiency. In recent years, the steel grades of AHSS have typically been developed
to get a better balance between strength and ductility. These materials are required to produce the
components in body-in-white structures with minimal forming, such as the center tunnel and crash
boxes [WOR14]. As reported by Voestalpine, the newly developed third generation of AHSS with
excellent ductility and no loss of strength are a cost-efficient option in comparison to Twinning Induced
Plasticity (TWIP) Steel and press hardening steels [HEB14].
To make further progress in the automotive lightweight construction, the phenomenon of Hydrogen
Embrittlement (HE) in the materials needs to be paid attention to. HE in metals is defined as a loss in
ductility leading to brittle fracture due to the introduction and diffusion of hydrogen into the crystal
structure of the metal [KAE03]. It has been shown in previous work that with increasing tensile strength
the hydrogen influence on the material properties is more pronounced [DEP11]. Hydrogen uptake can
take place in steel-making or the automobile manufacture processes because of the high mobility of the
hydrogen atom in the steel crystal structure. In the service life of an automobile, Hydrogen-Induced
Cracking (HIC) may occur along with environment-assisted corrosion. Accordingly, a good
understanding of the susceptibility to HE of steels, especially AHSS with tensile strength over
1000 MPa, is necessary to ensure their safe application in automobiles.
The influence of hydrogen on the mechanical properties of steels has been reported in several scientific
works [MOL14] [THI11a] [DEP11] [GUO14] [ZHO14]. The previous investigations usually focused
on the mechanism of HIC and the mechanical properties of special steel grades via different testing
methods. Few studies compared the various testing methods to evaluate the HE of AHSS. There is still
a limited understanding of how to interpret the research results and apply them to industrial applications.
Hydrogen embrittlement of AHSS is still a big challenge for the automobile industry since it can be
influenced by many factors and its mechanisms are quite complex.
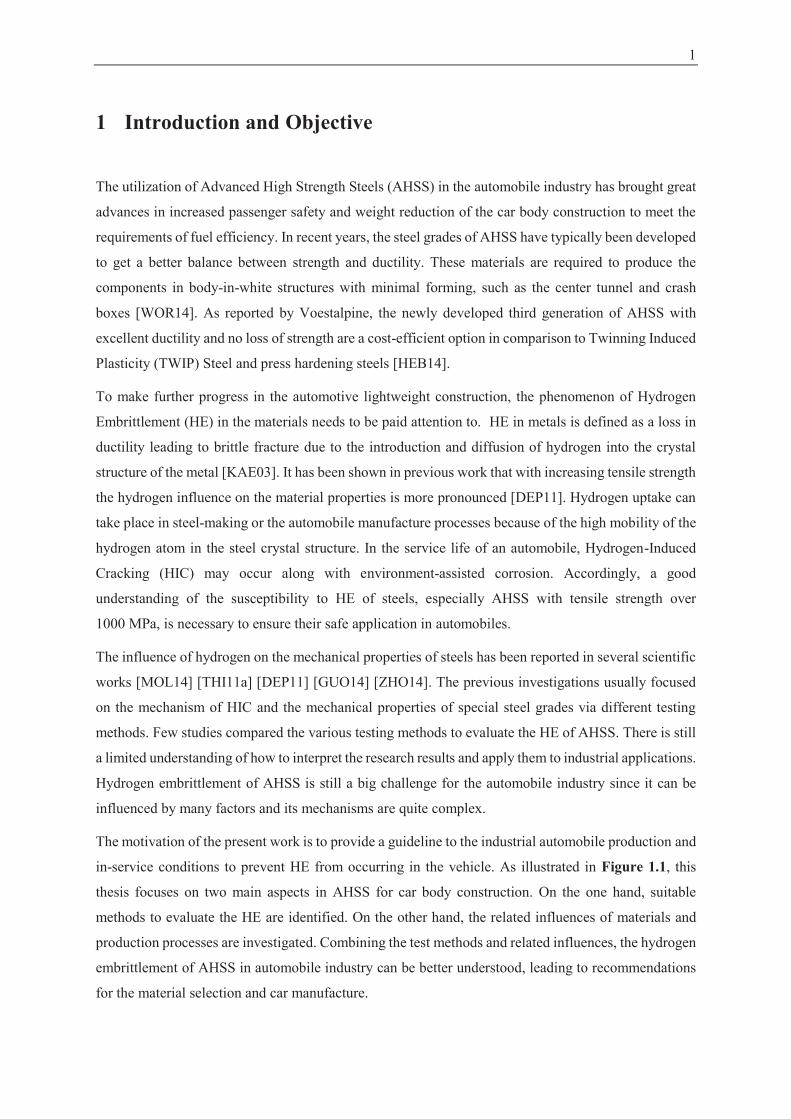
The motivation of the present work is to provide a guideline to the industrial automobile production and
in-service conditions to prevent HE from occurring in the vehicle. As illustrated in Figure 1.1, this
thesis focuses on two main aspects in AHSS for car body construction. On the one hand, suitable
methods to evaluate the HE are identified. On the other hand, the related influences of materials and
production processes are investigated. Combining the test methods and related influences, the hydrogen
embrittlement of AHSS in automobile industry can be better understood, leading to recommendations
for the material selection and car manufacture.
2
For the aims of this work, various steel grades with tensile strengths of 1180 MPa were selected and
characterized; the 980 MPa steels were investigated as a reference. The phenomena of Internal
Hydrogen Assisted Cracking (IHAC) and Hydrogen Environment Assisted Cracking (HEAC) of the
materials are both studied. To investigate IHAC, the materials were pre-charged to modify their internal
hydrogen content. The hydrogen content was determined by Thermal Desorption Spectroscopy (TDS)
measurement. Corrosive mediums were applied to investigate the HEAC. Different mechanical tests,
such as Slow Strain Rate Test (SSRT), Incremental Loading Test (ILT), Constant Loading Test (CLT),
U-bending test and four-point-bend testing were carried out to investigate the mechanical properties
and delayed fracture behavior as a function of hydrogen content or stress distribution. The influence of
hydrogen on the formability of the materials was quantified by determining the Forming Limit Curve
(FLC) and Bending Limit Curve (BLC). Additionally, the component-similar parts were tested to
validate the HE of the components similar to typical automobile parts. Fractography using a Scanning
Electron Microscopy (SEM) helped to understand the damage mechanisms of different materials in
varying test conditions.
Figure 1.1: Structure of the present work, to investigate the HE of AHSS for automotive applications.
3
2 Theoretical Fundamentals
2.1 Developments and applications of HSS and AHSS
In the last decades, many efforts have been made to meet the requirements of lightweight constructions
in the field of steels development. The European legislation requirement specifies a target in the
reduction of CO2 emissions. How to make the car body lighter is therefore one of the biggest challenges
in the automobile industry. The purposes of high vehicle safety combined with thin-walled car
components are realized by the application of steels with high strength and elongation.
In 1990s, the High-Strength, Low-Alloy (HSLA) steels became the commonly-used materials in the
automobile industry, and its application achieved approx. 50% in mass. Since then, High Strength Steels
(HSS) and Advanced High Strength Steels (AHSS) have been replacing mild steels due to the higher
deformation energy absorption in crash situation [MA11]. The HSS, e.g., Bake-Hardenable (BH) steels
were used in many car components like body closures [BIL13]. In the 3rd International Conference on
Steels in Cars and Trucks, the FutureSteelVehicle programs showed that with the intensive use of new
HSS combining optimized steel design, a weight-reduction of 25%-35% in body-in-white structure
could be reached [CLA11]. In recent decades, AHSS was developed and replaced parts of HSS, thus
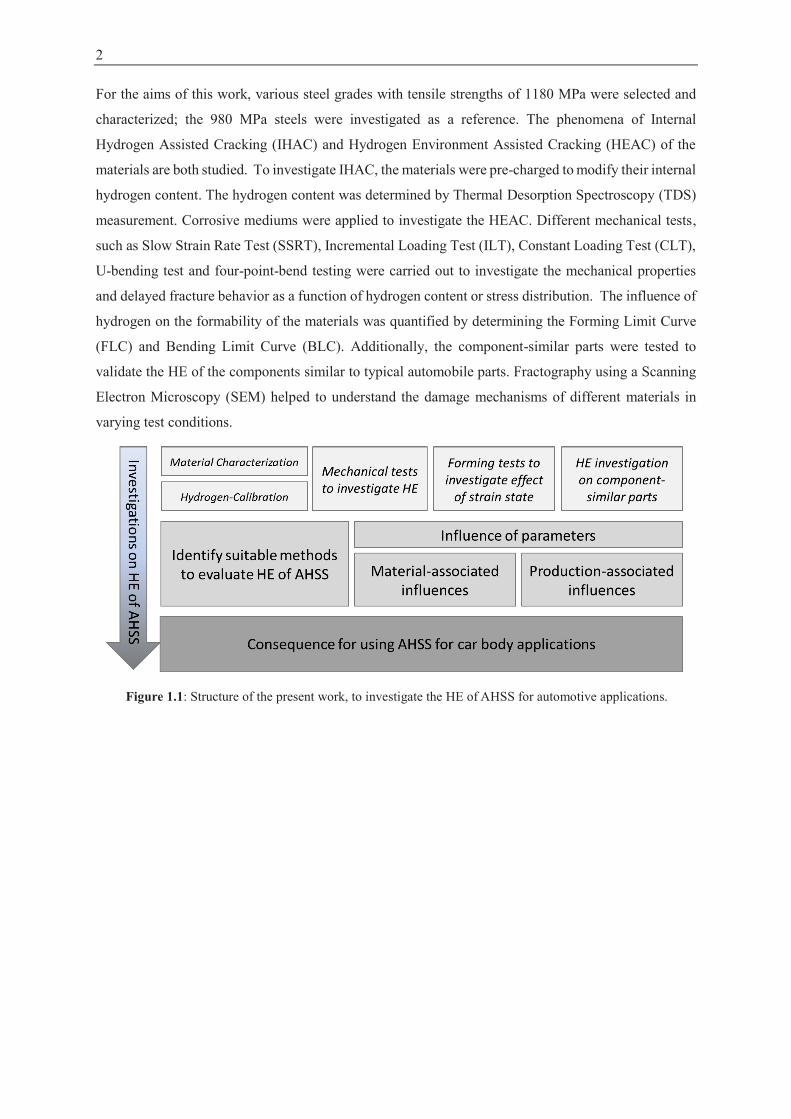
the application was significantly growing [WOR14]. Thanks to an excellent balance of tensile strength
(over 600 MPa) and formability, currently AHSS are developed and applied in various components in
body-in-white constructions, such as crash boxes, front end structures, A and B pillars, roof rails and
sill reinforcements [WOR14], as shown in Figure 2.1. As reported by TATA steel in 2014, the
application of new developed HSS/AHSS instead of HSLA led to a 23% weight reduction of the
longitudinal parts and reduction of 42.6 kg CO2 emissions, considering the product lifecycle [LAH14].
Figure 2.1: Application of steel and aluminum in the body-in-white construction [LAH14].
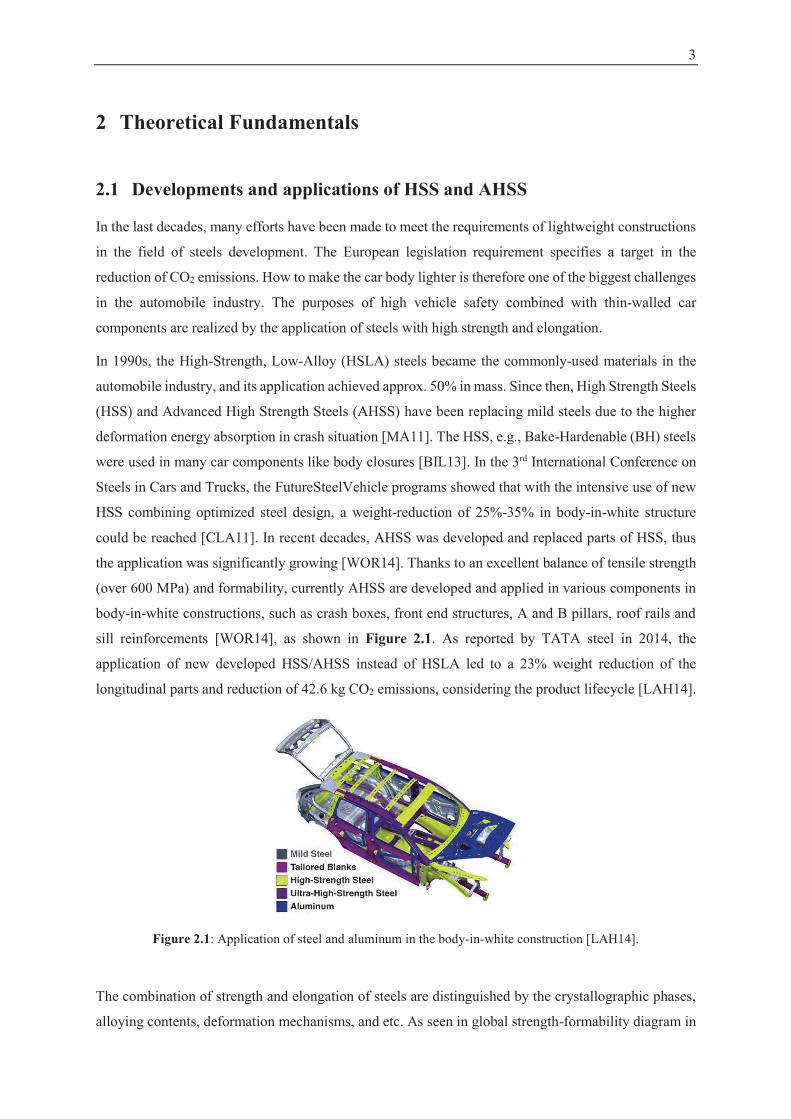
The combination of strength and elongation of steels are distinguished by the crystallographic phases,
alloying contents, deformation mechanisms, and etc. As seen in global strength-formability diagram in
4 Theoretical Fundamentals
Figure 2.2, it illustrates the range of properties available from today’s AHSS grades. AHSS is
developed from the first generation to the third generation, towards better performances with more
excellent formability, lightweight potential and higher strength level [BIL13]. However, material
strength improves at the expense of its ductility.
Figure 2.2: Global strength-formability diagram, illustrating the range of properties available from today’s
AHSS grades [BIL13].
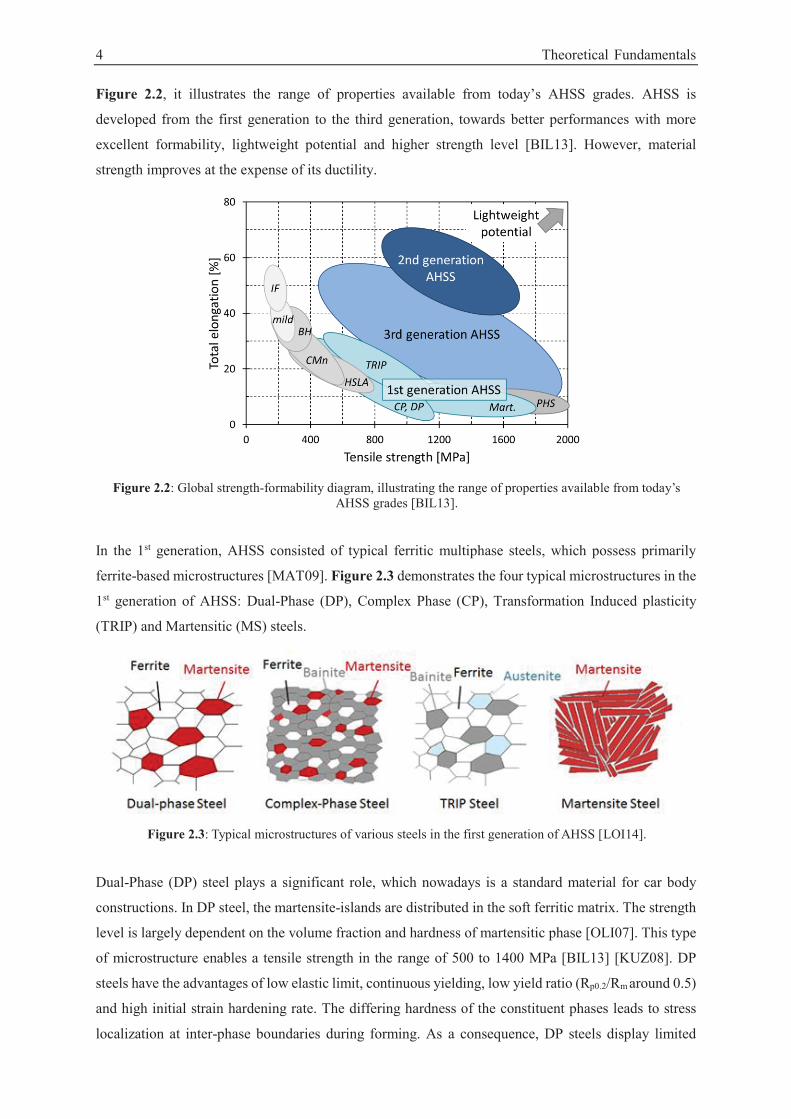
In the 1st generation, AHSS consisted of typical ferritic multiphase steels, which possess primarily
ferrite-based microstructures [MAT09]. Figure 2.3 demonstrates the four typical microstructures in the
1st generation of AHSS: Dual-Phase (DP), Complex Phase (CP), Transformation Induced plasticity
(TRIP) and Martensitic (MS) steels.
Figure 2.3: Typical microstructures of various steels in the first generation of AHSS [LOI14].
Dual-Phase (DP) steel plays a significant role, which nowadays is a standard material for car body
constructions. In DP steel, the martensite-islands are distributed in the soft ferritic matrix. The strength
level is largely dependent on the volume fraction and hardness of martensitic phase [OLI07]. This type
of microstructure enables a tensile strength in the range of 500 to 1400 MPa [BIL13] [KUZ08]. DP
steels have the advantages of low elastic limit, continuous yielding, low yield ratio (Rp0.2/Rm around 0.5)
and high initial strain hardening rate. The differing hardness of the constituent phases leads to stress
localization at inter-phase boundaries during forming. As a consequence, DP steels display limited
2.1 Developments and applications of HSS and AHSS 5
drawability and bendability. The additional of Ti can induce precipitation strengthening in ferrite
reducing the differences in hardness [KUZ08].
In the production process of CP steel, the cooling rate is controlled to promote the formation of the
bainitic phase. The microstructure of CP steel consists of very fine ferrite with a high volume fraction
of martensite and bainite. The less diffusion-controlled bainite transformation leads to a smaller
hardness difference between bainite and ferrite and allows a higher yield point and better formability in
CP steel compared to DP steel. The yield ratio of CP steel can reach 0.7 by controlling the average
temperature of the cold rolling process [BHA05]. The existence of soft ferrite exhibits better strain
hardening properties than that in full bainitic steel. The grain refinement of ferrite is associated with the
additional micro-alloying elements like Nb, Ti and V, which promote precipitation strengthening.
In TRIP steel, the transformation induced plasticity is related to the retained austenite (γA, 7-15%) in
addition to ferrite (50-55%), bainite (30%-35%) and possible martensite (1-5%). During deformation,
phase transformation from austenite to martensite occurs, providing high strength behavior. Compared
to traditional DP steel, TRIP steels display high n-values up to the limit of uniform elongation [MOR02]
and bake hardening [YAK02]. The excellent formability and drawability of TRIP steel enables forming
into complex components in car bodies. By adjusting alloying elements such as Si and Mn for solution
hardening, the available tensile strength level of low alloyed TRIP steel can currently reach 1200 MPa
[BIL13].
Martensitic steel consists of 100% martensitic structure, which mostly consists of martensite with lath
or needle-like morphology. The martensitic structure can be achieved by quenching after annealing (e.g.,
water quenching) to reach the martensitic transformation temperature. As generally known, martensite,
in which C is concentrated, is the hardest phase in steel. Thus martensitic steels display the highest
strength compared to other steel groups in the 1st generation of AHSS. The uniform tensile strength can
be as high as 1600 MPa. The disadvantage of the uniformly hard phase is the lowest formability [MA11].
In order to improve the formability/ductility, a tempering process is industrially applied. In some cases,
the temper-modified martensitic steel is also named as tempered martensitic steel.
In the group of 1st generation of AHSS, the formability is greatly reduced due to the introduction of a
secondary hard phase to achieve a higher strength level. Thus, the available geometries are quite limited.
The development of second generation of AHSS enables excellent formability. In the austenitic high
Mn steels the strength is achieved through a plastic forming process. The Transformation Induced
Plasticity (TRIP) steels and Twinning Induced Plasticity (TWIP) steels are involved in the 2nd
generation of AHSS. The high Mn content (15-30%) stabilizes austenite at room temperature, achieving
the change from body centered cubic (bcc) matrix to face centered cubic (fcc) matrix in the steel
[BLE14].
An essential concept for understanding high Mn steels is the Stacking Fault Energy (SFE). SFE
describes the interaction between the extended dislocations on the closely spaced slip planes [GUO12]
6 Theoretical Fundamentals
[VIT06] in the fcc crystal. SFE is the most crucial nucleation parameter related to the dominant
deformation mechanism of austenitic Mn steels [CUR10]. The deformation mechanisms in high Mn
steels are discussed based on SFE [LEE12] [CUR10] [COO11]. Table 2.1 summarizes the dominant
deformation mechanism according to different ranges of SFE. Various calculations and research
revealed that SFE depends on the alloying elements such as C and Mn [SCO06]. The additional of Al
in austenitic steel greatly raises the SFE [DUM08] [KIM11].
Table 2.1: SFE and the dominant deformation mechanism in high-Mn steels [GUO12].
SFE [mJ·m-2] Dominant deformation mechanism
<12 austenite→α´martensite or austenite→ε martensite→ α´martensite
12 – 18 formation of ε-martensite 18 – 45 twinning mechanism
>45 dislocation gliding
Owing to the fcc matrix and deformation mechanisms, the 2nd generation of AHSS display excellent
formability and drawability combined with high strength. Typical TWIP steel can achieve over 50%
total elongation at a strength level of around 1000 MPa [BIL14a]. Application in the automobile
industry is, however, greatly limited by its tendency for Delayed Fracture (DF), difficulties in
weldability and the high cost of alloying elements.
The research and development of the 3rd generation AHSS focused on the improvement of formability
of steel without significant sacrifice of strength. The new version multiphase steels with more balanced
formability are economically attractive [SUG08] [HEB08] [HEB14]. In order to provide a maximum
of strain hardening, elongation and thus deep drawability, the introducing of austenite into the
microstructure is the key step [HEB14]. The 3rd generation of AHSS have a medium alloying content
of maximum 10 vol.% of Mn, Si and Cr combined in the steelmaking process of 3rd generation AHSS,
quenching is interrupted by subsequent partitioning, where the C and Mn partition between bcc and fcc
phases during the long diffusion treatment [BIL14b] [BLE14]. The addition of Mn, Si and Cr avoids
iron-carbides precipitation. The redistribution and enrichment of C in austenite effectively increases the
strength of steel due to solid solution strengthening [HEB14]. The existence of retained austenite, as
the key component in this kind of AHSS, leads to phase transformation via the TRIP mechanism into
martensite. The multiphase microstructure can achieve the targeted mechanical properties such as high
tensile strength (uniform tensile strength more than 1000 MPa [BLE14]) and combined better
formability than 1st AHSS; on the other hand, the medium alloying content makes the production cost
is lower than 2nd AHSS.
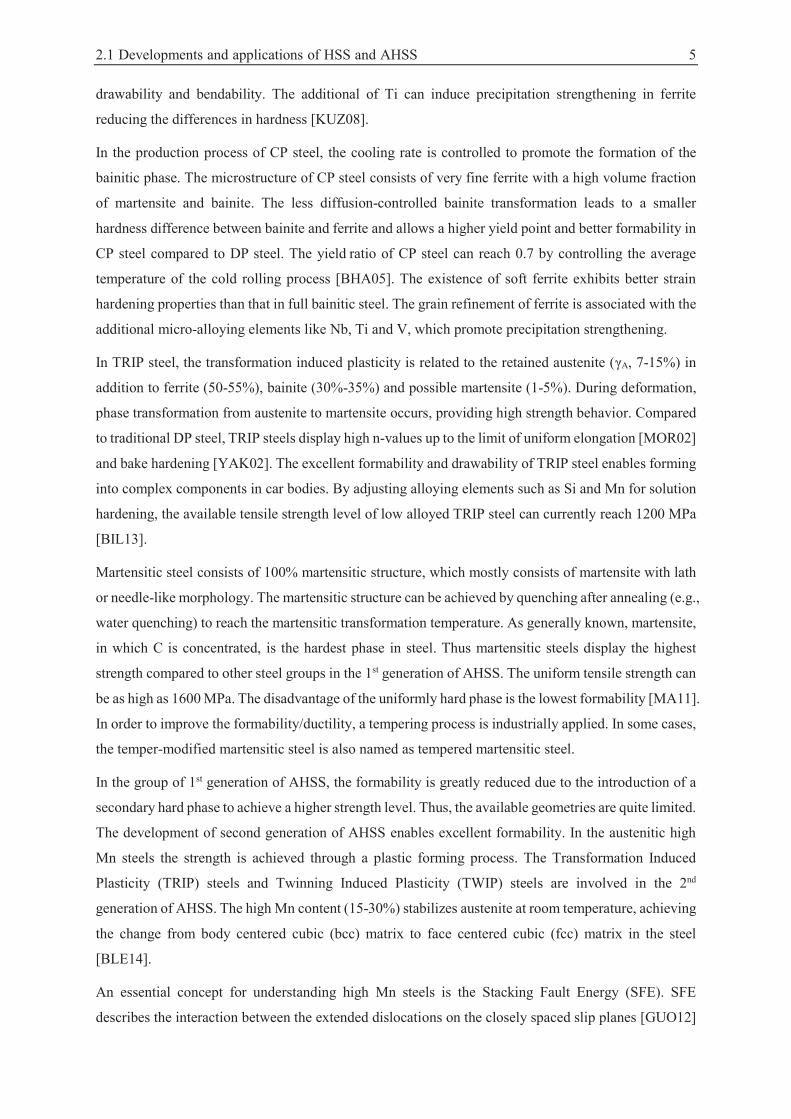
Figure 2.4 shows a comparison of the characteristic mechanical properties, volume fractions of retained
austenite and additional Mn contents in three typical grades of AHSS for automotive applications. The
Index of Rm·Af is referred to a rough indicator for the overall mechanical properties [BLE14]. The 3rd
2.2 Hydrogen sources in automotive production processes 7
generation of AHSS is still under development. In this classification of AHSS with medium Mn-content,
the Quenching and Partitioning (QP) steel and TRIP-aided Bainitic-Ferrite (TBF) are nowadays
commercially produced by steel makers.
Figure 2.4: Summary of three generations of AHSS for automotive applications [BLE14].
2.2 Hydrogen sources in automotive production processes
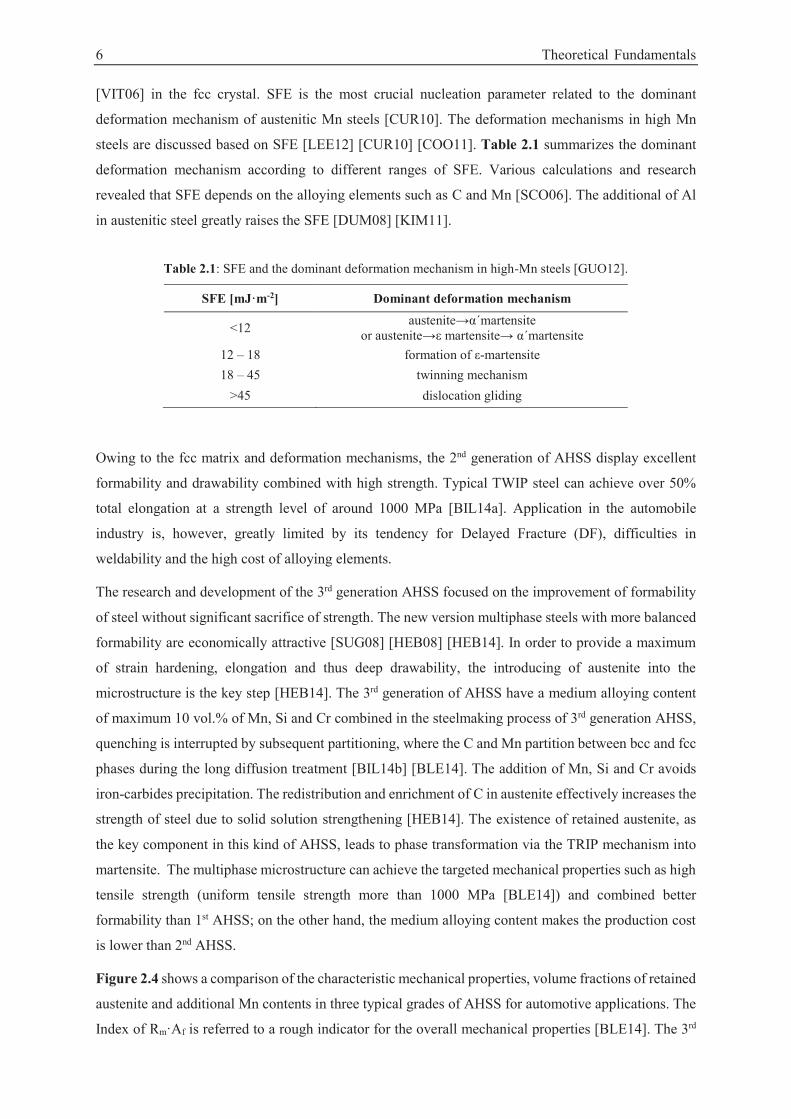
Hydrogen atom has small radius of 0.32 Å (1 Å=10-10 m), and its high mobility makes it especially
active in the metal lattice. The hydrogen atoms accumulate and interact with the matrix, especially when
defects in steel exist [PUN05]. Figure 2.5 schematically illustrates the hydrogen accumulation in the
lattice defects in the steel [PUN05]. Thus, the hydrogen transfer from an ambient medium into the solid
steels involves several necessary steps, including the uptake of hydrogen on the medium/steel interface,
the adsorption of the hydrogen atoms, the trapping and diffusivity of hydrogen in steels. The kinetics
of each step is influenced by various conditions such as the ambient medium, surface quality,
temperature, partial pressing and so on. The details of hydrogen behavior in steels will be outlined in
the following sections.
a) hydrogen solubility in the matrix
b) trapping sites on the surface
c) trapping sites on the subsurface
d) cylindrically shaped region
e) edge dislocations
f) vacancies
Figure 2.5: Schematic presentation of defects in metal and accumulation of hydrogen atoms in the low-concentration range [PUN05].
8 Theoretical Fundamentals
Concerning automotive production and application, hydrogen uptake during steelmaking and car
production processes is considered.
Steel manufacturing processes
In steelmaking processes, hydrogen uptake starts during melting. In metallurgical processes Ca(OH)2
is formed in a highly humid atmosphere. It can decompose into CaO in the slag and water vapor. During
the reaction between iron and water atomic hydrogen enters into the melt [NAB10]. During the followed
procedures of annealing, rolling and cooling, various oxides and hydroxides are formed on the sheet
surface. In the procedure of pickling prior to cold rolling or galvanizing, the sheet surfaces are treated
with solution of sulphuric acid or hydrochloric acid and hydrogen uptake occurs [MAA08].
Before galvanization, the steel sheets are cleaned in an alkaline electrolyte. The steel coils are connected
as a cathode in direct current cycles in order to remove the oil, emulsion and impurities on the band
surfaces. During cathodic cleaning, hydrogen is partially absorbed into the steel [SCH01]. In the process
of hot-dip galvanizing, a mixed nitrogen and hydrogen gas atmosphere is used. Before going to Zn-bath,
an annealing process was carried out in order to achieve aimed microstructure and reduce the iron-oxide
production on the surfaces. Therefore hydrogen uptake takes place [SCH01]. In comparison, hydrogen
is absorbed on the Fe/Zn interface during electro-galvanizing. And the following galvanizing provides
the Zn-layer which plays a role of barrier to prevent hydrogen from effusion [HIL04] [THI11b].
Car body manufacturing processes
The different manufacturing processes in the body-in-white plant also lead to the risk of hydrogen entry.
Figure 2.6 indicates the trend in of hydrogen content and stress levels in variable manufacturing steps.
In car production processes, the hydrogen uptake is measured from joining onwards. During welding
the hydrogen content in car components is increased. The operation of pre-treatment before painting is
carried out in order to optimize the adherence of coating. In the pre-treatment, the car body is firstly
cleaned and degreased. After phosphating, the hydrogen concentration in car body is increased. The
process of cathodic electrophoresis for the painting also causes hydrogen uptake. However, during the
bake operation to finish the E-coating the absorbed hydrogen can effuse from the car body, resulting in
a reduction in hydrogen content [LOI14] [COR14].
2.3 Hydrogen absorption and transport in steels 9
Figure 2.6: Schematic hydrogen and stress levels during steel making, vehicle production and in-service
processes.
Service life of vehicle
During the life of the vehicle, hydrogen uptake occurs during the corrosion process. The painting from
E-coating and Zn-coating on the substrate steel protects the car body from corrosion. But in some special
locations, especially when there are defects on the coating, the direct connection between steel and
surroundings allows the entry of hydrogen. Many environmental factors such as temperature and
humidity affect the corrosion behavior of the car. Acid corrosion takes place when acidic solution or
surroundings exist. In contrast, when oxygen concentration is sufficient or in the condition of alkaline
electrolyte, oxygen corrosion is preferred. The hydrogen entry reactions are described in the following
section.
In general, hydrogen uptake occurs not only from various sources during the steelmaking process
[RAT07], but also from the body-in-white shop during the vehicle manufacturing. Nowadays most
sources of hydrogen are well recognized and several methods are applied to reduce the hydrogen entry.
For instance, the addition of pickling inhibitors effectively reduces the solution of iron and formation
of hydrogen in steels by pre-sorption on the steel surface [MAA08] [SCH01]. However, the introduction
of hydrogen from manufacturing procedure and service life of vehicle is still unavoidable and the
hydrogen concentration cannot be reduced by process control. Therefore, further treatment is essential
to achieve a lower hydrogen concentration.
2.3 Hydrogen absorption and transport in steels
2.3.1 Hydrogen absorption
Atmosphere
In the atmosphere hydrogen is present as a molecule in the gas phase. The thermodynamic equilibrium
on the interphase H2/steel surface is achieved. At room temperature and atmospheric pressure the
10 Theoretical Fundamentals
tendency to hydrogen absorption is low, because the thermodynamic driving force to dissociate the
molecule hydrogen into the atomic hydrogen is not sufficient. Only in the condition of high purity of
hydrogen gas in partial pressure over 100 bar molecular hydrogen adsorb from gas phase into the solid
metallic phase [SPA00]. The hydrogen adsorption under high partial pressure involves three procedures,
which are illustrated in Figure 2.7 [GEH94] [REH13]. After the deposition of the molecule hydrogen
on the steel surfaces the adsorbed hydrogen molecule is dissociated into hydrogen atoms. The chemical
absorption of hydrogen atoms ( ) may take place.
Figure 2.7: Illustration of the reactions in hydrogen absorption from atmosphere [REH13].
Corrosion medium
When the steel is exposed to corrosive mediums, cathodic corrosion plays a crucial role for hydrogen
absorption. For blank steels, the reduction reaction takes place on the surfaces:
(2-1)
A zinc coating can protect the bare steel from cathodic corrosion, due to the fact that zinc has more
negative corrosion potential than iron, which is more favorable to be dissolved as an anode. However,
when there is a defect in the Zn-coating or the anode is dissolved, the hydrogen attacks the base material
directly. The hydrogen activity deeply depends upon the presence of catalysts or re-combination
inhibitors. Once the hydrogen activity at the interphase between steel substrate and corrosion medium
is achieved, hydrogen adsorption occurs. Regarding the corrosive medium, Hydrogen Evolution
Reactions (HER) take place [ZAK85] [MOO09]:
in acid solution: (2-2)
in neutral or alkaline solution: (2-3)
During the HER, some hydrogen atoms are adsorbed to the surfaces of steel. Here, the hydrogen ion is
oxidized into atomic hydrogen which is adsorbed according to Volmer reactions [KAE03] [GEH94].
This kind of transfer reactions of hydrogen deposition take place on the interface corrosion
medium/steel substrate, as explained in Figure 2.8. After adsorption, a portion of adsorbed atomic
hydrogen is absorbed by the substrate, where the Hydrogen Absorption Reaction (HAR) takes place:
(2-4)
A portion is transferred into adsorbed molecular hydrogen according to the Heyrovsky reaction or the
Tafel reaction [REH13]. The recombination of atomic hydrogen into molecular hydrogen is impeded in
2.3 Hydrogen absorption and transport in steels 11
the process [KAE03] [GEH94]. Figure 2.8 shows the schematic illustration of possible reactions in the
process of hydrogen absorption.
Briefly, the process of hydrogen absorption in steel substrate combines several steps, which is
dependent on the factors like cathodic current density, type of the solution, solution composition,
surface condition of substrate, et al. The hydrogen absorbed in steel substrate in two formats: atomic
hydrogen and molecular hydrogen. The absorption is controlled by the rate of HER and HAR [CHA03].
(a) In acidic solution
(b) In neutral or alkaline solution
Figure 2.8: Illustration of the reactions in hydrogen absorption from: (a) acid corrosion mediums and (b) neutral or alkaline solution [REH13].
2.3.2 Hydrogen transport
Hydrogen transport in steels is enabled by interstitial diffusion or the movement of defects. The
generation of Hydrogen-Induced Cracking (HIC) requires the achievement of critical hydrogen
concentration. The dissolved hydrogen diffuses into the region where crack potentially occurs and leads
to the fracture [HWA94]. Hence the study of hydrogen solubility and diffusivity is essential for
understanding the mechanism of HIC.
Hydrogen solubility
Once the interstitial atom of hydrogen enters into the steel substrate, it is dissociated into proton and
electron. The repulsive force between the proton and iron nuclei causes the local lattice distortion.
According to the crystal structure, two typical lattice structures are mentioned here: body-centered cubic
(bcc) structure and face-centered cubic (fcc) structure. In Table 2.2 it shows the spacing and number of
tetrahedral/octahedral interstitial sites in the Fe-alloys with bcc and fcc lattice structure respectively
[BLE07] [GOT04].
12 Theoretical Fundamentals
Table 2.2: Description of interstitial sites in iron with bcc and fcc lattice structure [BLE07].
Lattice structure bcc fcc
Type interstitial sites Tetrahedral Octahedral Tetrahedral Octahedral
Number of interstitial sites 12 6 8 4
Size of interstitial sites 0.36 Å 0.19 Å 0.28 Å 0.53 Å
On the basis of the interstitial sites of iron lattice, the hydrogen atoms with radius of 0.32 Å can occupy
the tetrahedral interstitial sites in bcc structure (diameter 0.36 Å) and octahedral interstitial sites in fcc
structure (diameter 0.53 Å) without causing any lattice distortion. Moreover, the fcc and bcc lattice
structures display different solubility behaviors for hydrogen atoms. The solubility of hydrogen in fcc
iron is higher than that in bcc iron, because of the higher ability of octahedral interstitial sites to expand
[BLE07]. Once the hydrogen atom enters into iron substrate as an interstitial atom, the solubility in
atomic fraction cH can be described by Sievert’s law [MIS05]:
(2-5)
where stands for the pre-coefficient, presents for the partial molar heat, T presents for the
temperature in unite of K and is the hydrogen partial pressure.
Concerning the equilibrium based on Sievert’s law, the solubility of interstitial hydrogen is deeply
dependent on the temperature and partial pressure. Generally, hydrogen originally dissolved in pure
iron at high temperatures, in the state of liquid iron. During solidification the dissolved hydrogen has a
tendency to effuse from the substrate. As the temperature decreases, hydrogen solubility is decreased
at the same time, in particular when austenite-ferrite transformation occurs. At room temperature and
external hydrogen pressure of 105 Pa, the atomic fraction of hydrogen in pure iron is extremely low
with a value of 2×10⁻⁸ [HIR80].
Nevertheless, in real condition of commercial steels, the hydrogen solubility stays at a higher level due
to the presence of lattice defects [HIR80]. With the existence of crystallographic defects, a certain
amount of hydrogen is able to be retained, even below the specific temperatures. In some cases the
hydrogen contents in the steels after cold working process are many times higher than that after the hot
working process [ORI85]. The explanation is that during the cold working process, more lattice defects
were introduced than that in hot working process, resulting in a measurable increasing of hydrogen
content. The details of trapping sites of hydrogen are illustrated in the following section. Besides defects,
alloying elements also play a role in the effect of hydrogen solubility. Like lattice defects, the
introduction of mostly alloying elements such as Mo, W, Ni and Cr decrease the maximum solubility
of hydrogen in the steels through reducing the grain boundary areas [CHO81].
2.3 Hydrogen absorption and transport in steels 13
Hydrogen diffusivity
Once the hydrogen atoms occupy the interstitial sites, it can rapidly diffuse in the steel [STR06]. The
hydrogen concentration gradient is decisive to hydrogen diffusion, providing the driving force to
hydrogen atoms [GUO12]. Fick’s first law describes the diffusion flux density , which is defined as
the number of hydrogen atoms that passing through a unit area in the unit time, is proportional to the
concentration gradient (equation (2-6)).
(2-6)
where C stands for the hydrogen concentration and D is referred to hydrogen diffusion coefficient in
crystallographic lattice of metallic solid, which can be expressed by the Arrhenius equation (2-7):
(2-7)
where D0 is a pre-exponential factor, Q is the activation energy, which differs between different crystal
structures. R is the universal gas constant with a value 3.814×10⁻³ J·mol-1·K-1 and T is the temperature.
The diffusion coefficient is a characteristic factor for the materials and varies with different
microstructures. The difference between ferritic steel ( -Fe) and austenitic steel ( -Fe) is also
mentioned here. In austenitic steels the diffusion coefficient differs by several orders of magnitude
compared to that of ferritic steels. Austenitic steels display high hydrogen solubility but low hydrogen
diffusivity [FIG10]. The theory of trapping can be the explanation for hydrogen behavior in the various
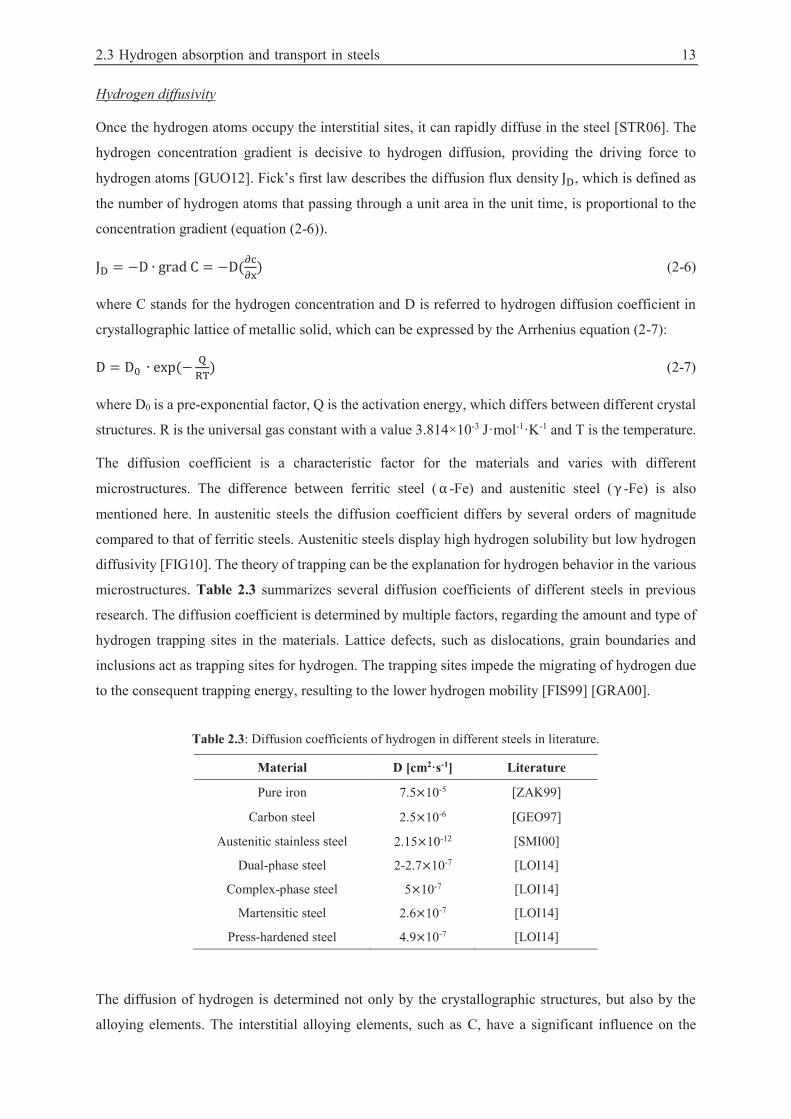
microstructures. Table 2.3 summarizes several diffusion coefficients of different steels in previous
research. The diffusion coefficient is determined by multiple factors, regarding the amount and type of
hydrogen trapping sites in the materials. Lattice defects, such as dislocations, grain boundaries and
inclusions act as trapping sites for hydrogen. The trapping sites impede the migrating of hydrogen due
to the consequent trapping energy, resulting to the lower hydrogen mobility [FIS99] [GRA00].
Table 2.3: Diffusion coefficients of hydrogen in different steels in literature.
Material D [cm2·s-1] Literature
Pure iron 7.5 10-5 [ZAK99]
Carbon steel 2.5 10-6 [GEO97]
Austenitic stainless steel 2.15 10-12 [SMI00]
Dual-phase steel 2-2.7 10-7 [LOI14]
Complex-phase steel 5 10-7 [LOI14]
Martensitic steel 2.6 10-7 [LOI14]
Press-hardened steel 4.9 10-7 [LOI14]
The diffusion of hydrogen is determined not only by the crystallographic structures, but also by the
alloying elements. The interstitial alloying elements, such as C, have a significant influence on the
14 Theoretical Fundamentals
diffusion behavior of hydrogen and increase hydrogen diffusivity. Additionally, the introduction of
substitutional alloying elements such as Ni, Mn and Cr leads to a reduction of hydrogen diffusivity
[GRA00] [RIE85].
Considering the external conditions, temperature has the highest influence on the hydrogen diffusivity
in the materials. As expressed in equation (2-7), the diffusion coefficient is proportional to the
temperature [GOT04]. Another factor affecting hydrogen diffusivity is the stress state. Hydrostatic
stress is introduced in the area ahead of a crack tip, and consequently reaches a maximum within a short
distance from the crack tip. When a crack exists, hydrogen atoms in the metal bulk diffuse and
accumulated at the deformed site due to the expansion of the lattice [OLD09].
Hydrogen trapping
Usually, the distribution of hydrogen in a steel substrate is not homogenous. Many heterogeneous
structures (such as vacancies, dislocations, grain boundaries, voids and inclusions) are present in the
steels. These defect structures change the ideal hydrogen behavior and cause localized hydrogen
enrichment, acting as trapping site for hydrogen atoms. The presence of trapping sites increases the
hydrogen solubility and decreases the apparent hydrogen diffusivity. If the hydrogen is passing through
a trapping site, a longer residence time is required than that in the situation of normal interstitial lattice
site. As a consequence, the transport rate of hydrogen atoms through the material is reduced and the
hydrogen permeability in the steels is lowered [CHA03].
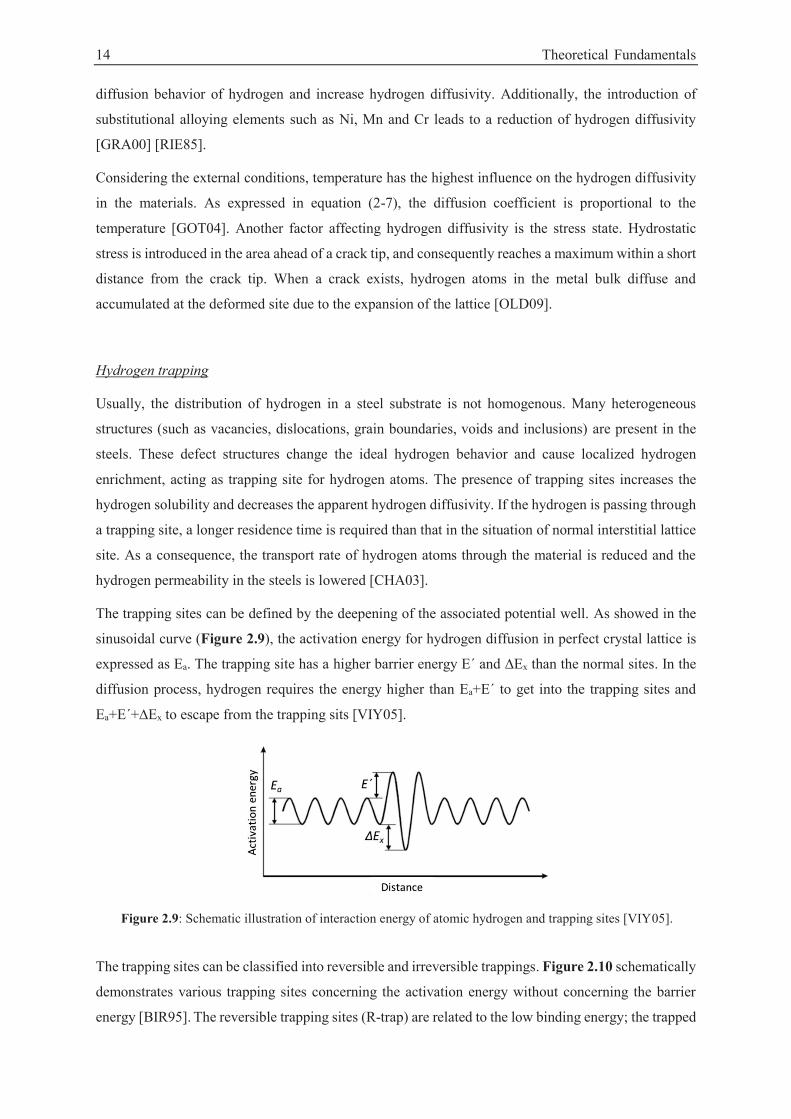
The trapping sites can be defined by the deepening of the associated potential well. As showed in the
sinusoidal curve (Figure 2.9), the activation energy for hydrogen diffusion in perfect crystal lattice is
expressed as Ea. The trapping site has a higher barrier energy E´ and ∆Ex than the normal sites. In the
diffusion process, hydrogen requires the energy higher than Ea+E´ to get into the trapping sites and
Ea+E´+∆Ex to escape from the trapping sits [VIY05].
Figure 2.9: Schematic illustration of interaction energy of atomic hydrogen and trapping sites [VIY05].
The trapping sites can be classified into reversible and irreversible trappings. Figure 2.10 schematically
demonstrates various trapping sites concerning the activation energy without concerning the barrier
energy [BIR95]. The reversible trapping sites (R-trap) are related to the low binding energy; the trapped
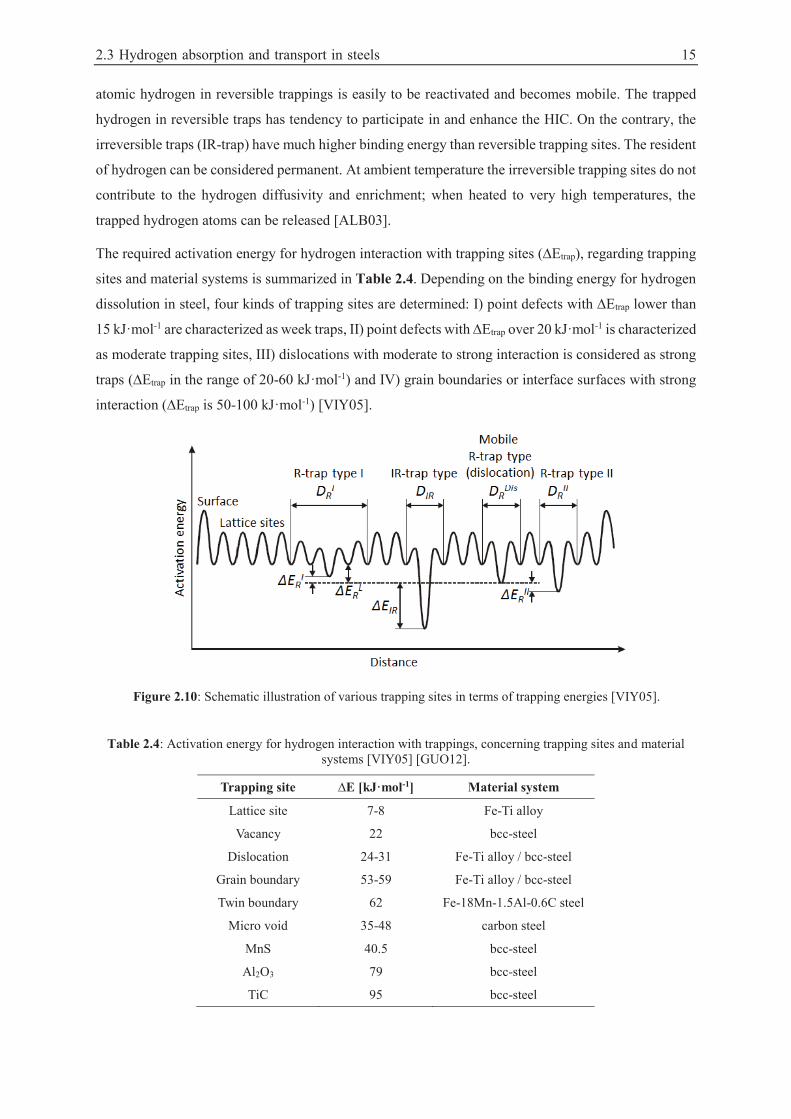
2.3 Hydrogen absorption and transport in steels 15
atomic hydrogen in reversible trappings is easily to be reactivated and becomes mobile. The trapped
hydrogen in reversible traps has tendency to participate in and enhance the HIC. On the contrary, the
irreversible traps (IR-trap) have much higher binding energy than reversible trapping sites. The resident
of hydrogen can be considered permanent. At ambient temperature the irreversible trapping sites do not
contribute to the hydrogen diffusivity and enrichment; when heated to very high temperatures, the
trapped hydrogen atoms can be released [ALB03].
The required activation energy for hydrogen interaction with trapping sites (∆Etrap), regarding trapping
sites and material systems is summarized in Table 2.4. Depending on the binding energy for hydrogen
dissolution in steel, four kinds of trapping sites are determined: I) point defects with ∆Etrap lower than
15 kJ·mol-1 are characterized as week traps, II) point defects with ∆Etrap over 20 kJ·mol-1 is characterized
as moderate trapping sites, III) dislocations with moderate to strong interaction is considered as strong
traps (∆Etrap in the range of 20-60 kJ·mol-1) and IV) grain boundaries or interface surfaces with strong
interaction (∆Etrap is 50-100 kJ·mol-1) [VIY05].
Figure 2.10: Schematic illustration of various trapping sites in terms of trapping energies [VIY05].
Table 2.4: Activation energy for hydrogen interaction with trappings, concerning trapping sites and material systems [VIY05] [GUO12].
Trapping site ∆E [kJ·mol-1] Material system
Lattice site 7-8 Fe-Ti alloy
Vacancy 22 bcc-steel
Dislocation 24-31 Fe-Ti alloy / bcc-steel
Grain boundary 53-59 Fe-Ti alloy / bcc-steel
Twin boundary 62 Fe-18Mn-1.5Al-0.6C steel
Micro void 35-48 carbon steel
MnS 40.5 bcc-steel
Al2O3 79 bcc-steel
TiC 95 bcc-steel
16 Theoretical Fundamentals
2.4 Hydrogen-induced cracking in steels
The term of Hydrogen Embrittlement (HE) is defined as “An important danger subject to tensile load
is unexpected brittle, instead of usually predictable ductile, fracture and a notorious variety is
embrittlement by uptake of atomic hydrogen as a solute in the metal lattice” [KAE03]. For AHSS, the
interaction of dislocations and existing hydrogen atoms aggravate the danger of cracking under
mechanical stress [KAE03]. The Hydrogen Induced Stress Corrosion Cracking (HISCC) is regarded as
the cooperation of hydrogen and mechanical loading. According to the source of affected hydrogen,
HISCC can be classified into Internal Hydrogen Assisted Cracking (IHAC) and Hydrogen Environment
Assisted Cracking (HEAC).
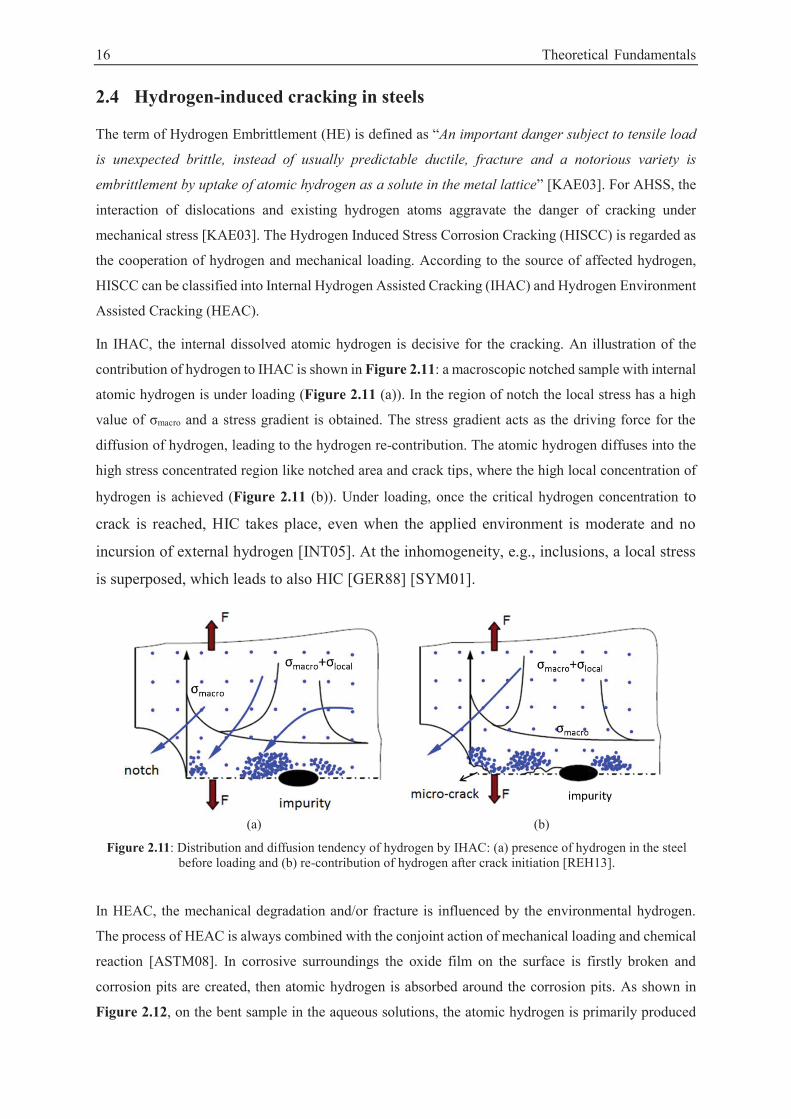
In IHAC, the internal dissolved atomic hydrogen is decisive for the cracking. An illustration of the
contribution of hydrogen to IHAC is shown in Figure 2.11: a macroscopic notched sample with internal
atomic hydrogen is under loading (Figure 2.11 (a)). In the region of notch the local stress has a high
value of σmacro and a stress gradient is obtained. The stress gradient acts as the driving force for the
diffusion of hydrogen, leading to the hydrogen re-contribution. The atomic hydrogen diffuses into the
high stress concentrated region like notched area and crack tips, where the high local concentration of
hydrogen is achieved (Figure 2.11 (b)). Under loading, once the critical hydrogen concentration to
crack is reached, HIC takes place, even when the applied environment is moderate and no
incursion of external hydrogen [INT05]. At the inhomogeneity, e.g., inclusions, a local stress
is superposed, which leads to also HIC [GER88] [SYM01].
(a) (b)
Figure 2.11: Distribution and diffusion tendency of hydrogen by IHAC: (a) presence of hydrogen in the steel before loading and (b) re-contribution of hydrogen after crack initiation [REH13].
In HEAC, the mechanical degradation and/or fracture is influenced by the environmental hydrogen.
The process of HEAC is always combined with the conjoint action of mechanical loading and chemical
reaction [ASTM08]. In corrosive surroundings the oxide film on the surface is firstly broken and
corrosion pits are created, then atomic hydrogen is absorbed around the corrosion pits. As shown in
Figure 2.12, on the bent sample in the aqueous solutions, the atomic hydrogen is primarily produced
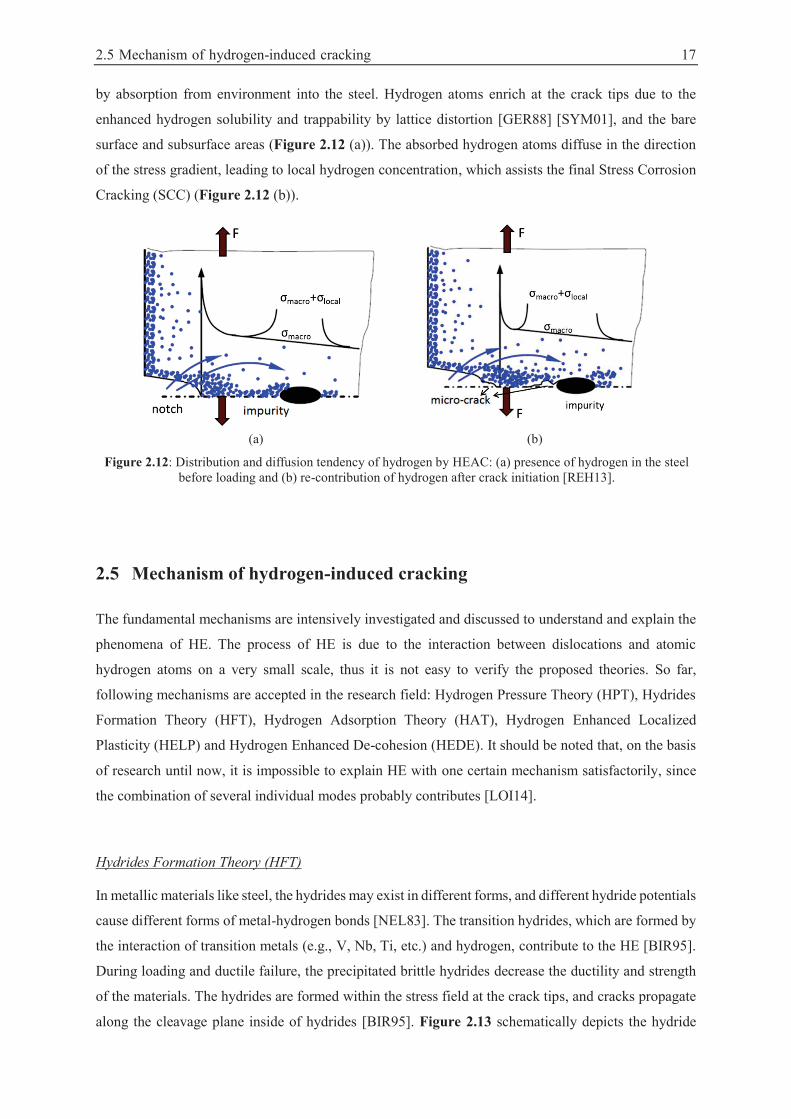
2.5 Mechanism of hydrogen-induced cracking 17
by absorption from environment into the steel. Hydrogen atoms enrich at the crack tips due to the
enhanced hydrogen solubility and trappability by lattice distortion [GER88] [SYM01], and the bare
surface and subsurface areas (Figure 2.12 (a)). The absorbed hydrogen atoms diffuse in the direction
of the stress gradient, leading to local hydrogen concentration, which assists the final Stress Corrosion
Cracking (SCC) (Figure 2.12 (b)).
(a) (b)
Figure 2.12: Distribution and diffusion tendency of hydrogen by HEAC: (a) presence of hydrogen in the steel before loading and (b) re-contribution of hydrogen after crack initiation [REH13].
2.5 Mechanism of hydrogen-induced cracking
The fundamental mechanisms are intensively investigated and discussed to understand and explain the
phenomena of HE. The process of HE is due to the interaction between dislocations and atomic
hydrogen atoms on a very small scale, thus it is not easy to verify the proposed theories. So far,
following mechanisms are accepted in the research field: Hydrogen Pressure Theory (HPT), Hydrides
Formation Theory (HFT), Hydrogen Adsorption Theory (HAT), Hydrogen Enhanced Localized
Plasticity (HELP) and Hydrogen Enhanced De-cohesion (HEDE). It should be noted that, on the basis
of research until now, it is impossible to explain HE with one certain mechanism satisfactorily, since
the combination of several individual modes probably contributes [LOI14].
Hydrides Formation Theory (HFT)
In metallic materials like steel, the hydrides may exist in different forms, and different hydride potentials
cause different forms of metal-hydrogen bonds [NEL83]. The transition hydrides, which are formed by
the interaction of transition metals (e.g., V, Nb, Ti, etc.) and hydrogen, contribute to the HE [BIR95].
During loading and ductile failure, the precipitated brittle hydrides decrease the ductility and strength
of the materials. The hydrides are formed within the stress field at the crack tips, and cracks propagate
along the cleavage plane inside of hydrides [BIR95]. Figure 2.13 schematically depicts the hydride
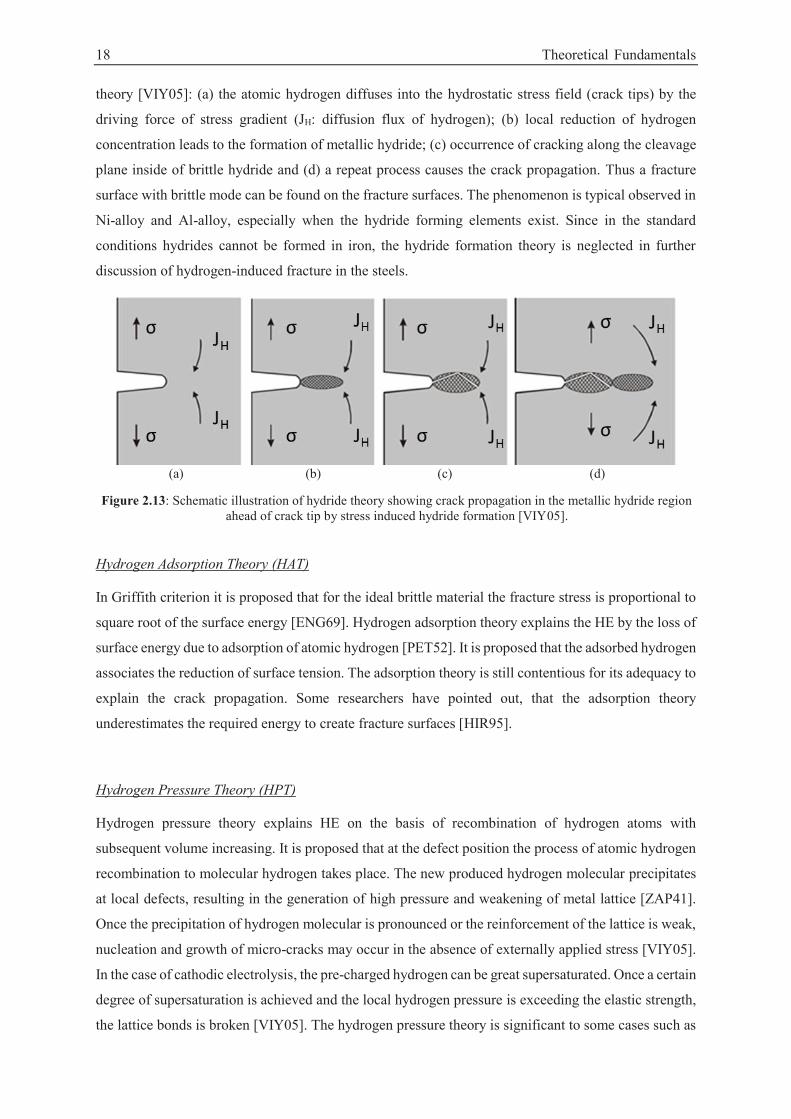
18 Theoretical Fundamentals
theory [VIY05]: (a) the atomic hydrogen diffuses into the hydrostatic stress field (crack tips) by the
driving force of stress gradient (JH: diffusion flux of hydrogen); (b) local reduction of hydrogen
concentration leads to the formation of metallic hydride; (c) occurrence of cracking along the cleavage
plane inside of brittle hydride and (d) a repeat process causes the crack propagation. Thus a fracture
surface with brittle mode can be found on the fracture surfaces. The phenomenon is typical observed in
Ni-alloy and Al-alloy, especially when the hydride forming elements exist. Since in the standard
conditions hydrides cannot be formed in iron, the hydride formation theory is neglected in further
discussion of hydrogen-induced fracture in the steels.
(a) (b) (c) (d)
Figure 2.13: Schematic illustration of hydride theory showing crack propagation in the metallic hydride region ahead of crack tip by stress induced hydride formation [VIY05].
Hydrogen Adsorption Theory (HAT)
In Griffith criterion it is proposed that for the ideal brittle material the fracture stress is proportional to
square root of the surface energy [ENG69]. Hydrogen adsorption theory explains the HE by the loss of
surface energy due to adsorption of atomic hydrogen [PET52]. It is proposed that the adsorbed hydrogen
associates the reduction of surface tension. The adsorption theory is still contentious for its adequacy to
explain the crack propagation. Some researchers have pointed out, that the adsorption theory
underestimates the required energy to create fracture surfaces [HIR95].
Hydrogen Pressure Theory (HPT)
Hydrogen pressure theory explains HE on the basis of recombination of hydrogen atoms with
subsequent volume increasing. It is proposed that at the defect position the process of atomic hydrogen
recombination to molecular hydrogen takes place. The new produced hydrogen molecular precipitates
at local defects, resulting in the generation of high pressure and weakening of metal lattice [ZAP41].
Once the precipitation of hydrogen molecular is pronounced or the reinforcement of the lattice is weak,
nucleation and growth of micro-cracks may occur in the absence of externally applied stress [VIY05].
In the case of cathodic electrolysis, the pre-charged hydrogen can be great supersaturated. Once a certain
degree of supersaturation is achieved and the local hydrogen pressure is exceeding the elastic strength,
the lattice bonds is broken [VIY05]. The hydrogen pressure theory is significant to some cases such as
2.5 Mechanism of hydrogen-induced cracking 19
welding process, in which it is generally considered that the molecules are formed at high temperature
and high pressure is generated during cooling procedure [VIY05].
Hydrogen Enhanced Localized Plasticity (HELP)
The fundamental of Hydrogen Enhanced Localized Plasticity (HELP) is the interaction between
hydrogen and dislocations. The dissolved hydrogen atoms exist in the dislocation spacing and strain
fields around dislocations [TAB84]. The presence of hydrogen influences the dislocation mobility,
representing hardening effect or softening effect [NEL83].
The hardening effect can be explained by the formation of Cottrell-atmosphere in the high tensile stress
fields. The Cottrell-atmosphere hinders the movement of dislocations, making the deformation at crack
tip more difficult [VIY05]. As studied, the stabilizing of micro-cracks as well as the effect on work
hardening rate by hydrogen, a degradation of mechanical properties can be found. [LOU72]. By contrast,
in the effect of softening it is proposed that hydrogen reduces the fracture strength by facilitating the
movement of hydrogen on the crack tip surface; because the introduction of high concentrated hydrogen
increases the neighbor atoms on the surface, resulting in easier dislocation nucleation [LYN79].
The dissolved hydrogen reduced the interaction between the dislocations by shielding the elastic
interaction between dislocations with each other as well as with lattice defects. With the existence of
hydrogen, the pile-up dislocations move closer to each other [FER98]. In this manner, the elastic
energies of interaction between dislocations and other internal elastic stress fields are reduced by the
accumulation of hydrogen. Dislocation movement is eased by the elastic shielding effect and thus the
dislocation mobility is increased [BIR90]. The more easily overcome slip barrier makes the local
dislocation movement occur even at low shearing stress and thus deformation is facilitated [WAN01].
Due to supporting shielding calculations and microscopic observations, the HELP mechanism is well
established respect to the influence of hydrogen on the dislocation behavior [STR06] [TAH01].
Hydrogen Enhanced De-cohesion (HEDE)
In the mechanism of Hydrogen Enhanced De-cohesion (HEDE), the HE is related to the weakening of
the cohesion force between metallic atoms in the matrix due to the partial crucial accumulations of
hydrogen. In the elastic stress field the crystal lattice is dilated, providing spacing for hydrogen
accumulation. The trapped hydrogen diffuses into this region and is concentrated a short distance from
the crack tips. This reduces the atomic cohesive binding strength of metallic lattice [ORI72] [TRO60].
In non-hydride metals, the propagation of the crack is determined by the maximum tensile stress and
the maximum cohesive resistive force of the matrix metal. Once the maximum tensile stress at crack
tips is equal to the maximum cohesive force between the metallic atoms, crack propagation occurs
20 Theoretical Fundamentals
[ORI72] Thus, it is considered that hydrogen damage sites are located in the vicinity ahead of the crack
tip surface where tensile stress reaches maximum [GAN03].
HEDE explains delayed cracking in HE and is appropriate for the explanation of intergranular fracture.
It is considered that when the high concentration of hydrogen accumulates at energetically favorable
positions like grain boundaries, the cleavage fracture in intergranular mode occurs once the critical
concentration is reached [STR06]. However, the HEDE mechanism cannot explain the plastic parts on
the hydrogen embrittlement fracture surfaces. The theoretically predicted weakening on the metallic
matrix by interstitial dissolved hydrogen has not yet been experimentally confirmed [HIR87].
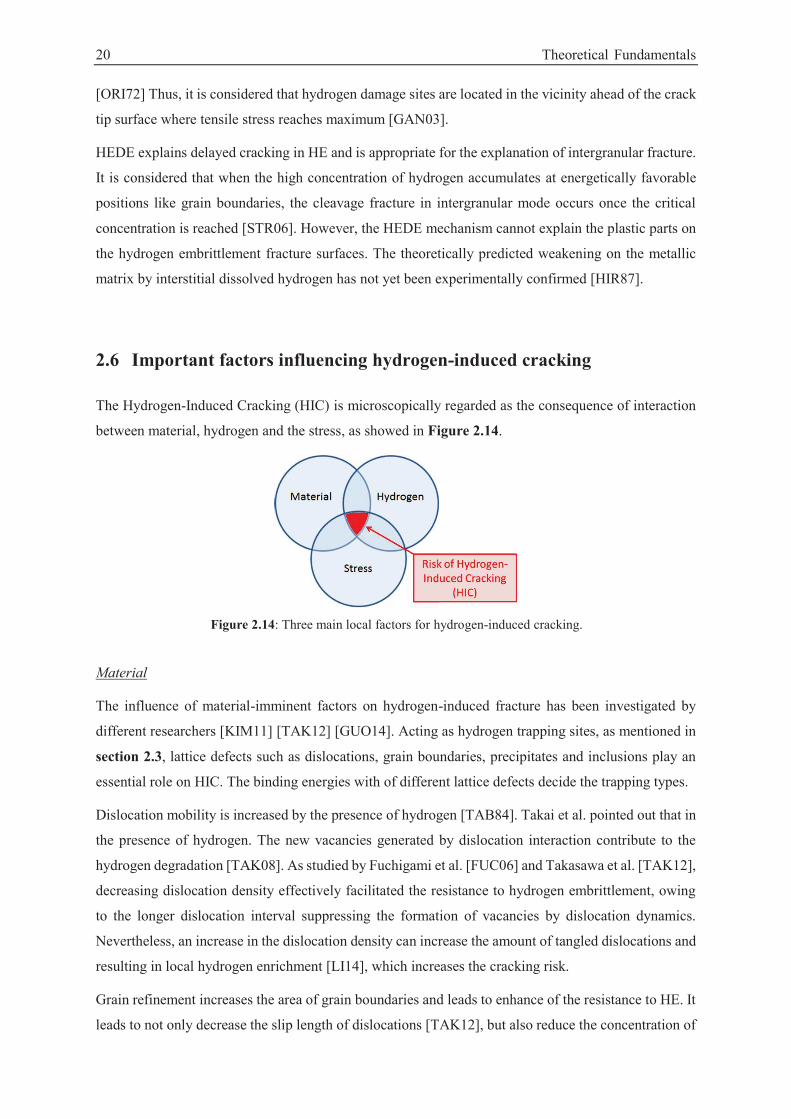
2.6 Important factors influencing hydrogen-induced cracking
The Hydrogen-Induced Cracking (HIC) is microscopically regarded as the consequence of interaction
between material, hydrogen and the stress, as showed in Figure 2.14.
Figure 2.14: Three main local factors for hydrogen-induced cracking.
Material
The influence of material-imminent factors on hydrogen-induced fracture has been investigated by
different researchers [KIM11] [TAK12] [GUO14]. Acting as hydrogen trapping sites, as mentioned in
section 2.3, lattice defects such as dislocations, grain boundaries, precipitates and inclusions play an
essential role on HIC. The binding energies with of different lattice defects decide the trapping types.
Dislocation mobility is increased by the presence of hydrogen [TAB84]. Takai et al. pointed out that in
the presence of hydrogen. The new vacancies generated by dislocation interaction contribute to the
hydrogen degradation [TAK08]. As studied by Fuchigami et al. [FUC06] and Takasawa et al. [TAK12],
decreasing dislocation density effectively facilitated the resistance to hydrogen embrittlement, owing
to the longer dislocation interval suppressing the formation of vacancies by dislocation dynamics.
Nevertheless, an increase in the dislocation density can increase the amount of tangled dislocations and
resulting in local hydrogen enrichment [LI14], which increases the cracking risk.
Grain refinement increases the area of grain boundaries and leads to enhance of the resistance to HE. It
leads to not only decrease the slip length of dislocations [TAK12], but also reduce the concentration of
2.6 Important factors influencing hydrogen-induced cracking 21
segregated hydrogen at grain boundaries [TAK12] [CHE14]. In TWIP steels, grain refinement plays an
essential role on HE, because it reduces the volume fraction of mechanical twins [KAN10] [PAR15]
[BOU11]. As investigated by Park et al. [PAR15], owing to the low volume fraction of twins, the
migration of hydrogen atoms in grain-refined TWIP steels is less prevalent than in coarse-grained
materials.
Du et al. [DU15] have reported that the HIC primarily nucleates at the non-metallic inclusions such as
MnS and Al2O3 in A537 Steel. Jin et al [JIN10] investigated in AP15L X100 steels and made the
conclusion that “The cracks are primarily associated with the Al- and Si-enriched inclusions, rather
than the elongated MnS inclusion”. In TWIP steel, the Nano-sized (Fe, Mn)3C cementite precipitates
along grain boundaries and reduce the DF resistance [HON13]. On the contrary, the homogeneously
distributed Ti(C,N) is reported as a beneficial trapping site for hydrogen, which can prevent the
formation of MnS and reduce diffusive hydrogen in the welded X70 pipeline steel [BEI09]. Generally,
the inclusions/precipitates play a detrimental role on HIC, since they act as affective hydrogen trapping
sites.
Hydrogen
In IHAC, the internal hydrogen dominates the cracking. As mentioned in Section 2.2, hydrogen entry
as well as residual stress cannot be eliminated in the steel manufacturing process. Inhomogeneity such
as hard second phases, inclusions, precipitates, micro-cracks on the surface or in the bulk enhance the
enrichment of redistributed hydrogen. In this case, HIC takes place easily [GER88] [SYM01].
Hydrogen-induced mechanical degradation and DF should be carefully considered before application.
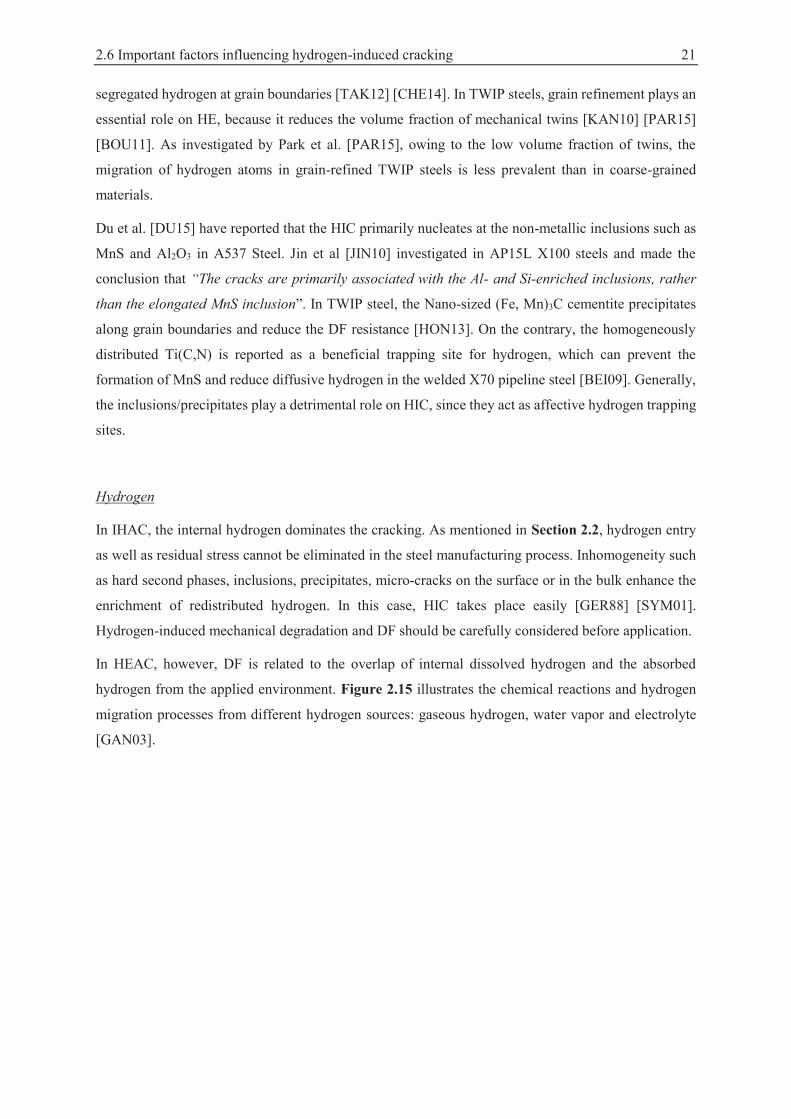
In HEAC, however, DF is related to the overlap of internal dissolved hydrogen and the absorbed
hydrogen from the applied environment. Figure 2.15 illustrates the chemical reactions and hydrogen
migration processes from different hydrogen sources: gaseous hydrogen, water vapor and electrolyte
[GAN03].
22 Theoretical Fundamentals
Gaseous hydrogen Water vapor Electrolyte
(1) Molecular transport Molecular transport Oxygen depletion
(2) Physical adsorption H2 Physical adsorption H2O Cation dissolution, hydrolysis
(3) H2 migration, dissociation to atomic H Chemical reaction to FexOy·H2O, H H+ reduction to H
(4) Chemical adsorption Water reduction to H
(5) Solution to lattice, trap sides
(6) Bulk diffusion to FPZ
(7) Enhanced fatigue damage
Figure 2.15: The sequence of elemental processes that supply damaging H to the crack tip Fracture Process Zone (FPZ) [GAN03].
Stress
Both external and local residual stresses play an essential role in HE. During deformation, the plastic
incompatibility provides the crack initiation sites and the high stress concentration and deformation
strain distribute inhomogeneous. The stress gradient dominates the diffusion of atomic hydrogen.
Hydrogen assisted cracking takes place when the internal hydrogen atoms agglomerate at the crack
initiation sites, even in high purity material in which there is no segregation at grain boundaries [LIU08].
As assumed by Sidorenko et al. [SID75], the equilibrium concentration of hydrogen under stress c is
raised with local stress in (2-8):
) (2-8)
where c0 is the constant of hydrogen concentration, stands for mole volume of hydrogen and
stands for the hydrostatic stress.
The local stress dominates the crack initiation and propagation. Stress gradient functions as the driving
force of hydrogen diffusion and re-contribution. Rehrl has described the relationship between local
stress and concentration profile of hydrogen at the crack tip [REH13]. As illustrated in Figure 2.16, at
the crack tip both the hydrogen concentration and local stress are close to the peak value. The
concentrated hydrogen reacts with the matrix, by enhancing the plasticity (HELP mechanism) or
reducing the cohesion force of matrix (HEDE mechanism). Thereby the critical hydrogen content for
HIC is reduced because of the concentrated stress. As consequence, HIC takes place when the hydrogen
content achieves the threshold value.
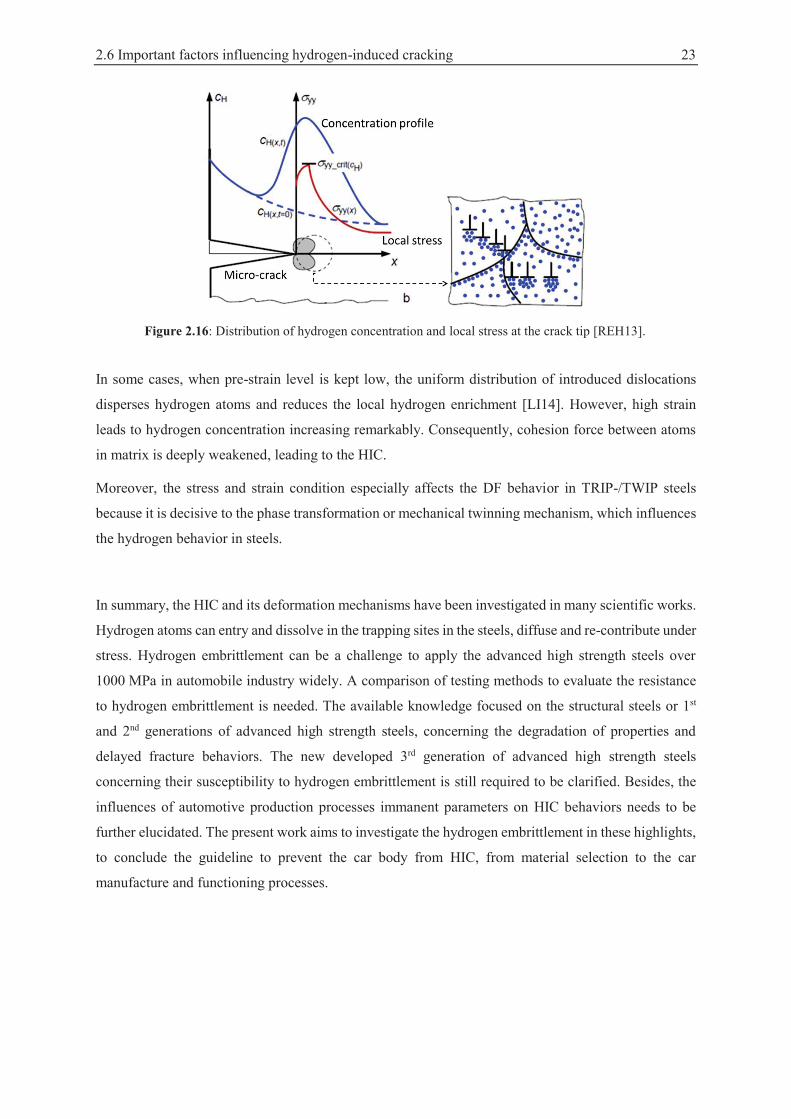
2.6 Important factors influencing hydrogen-induced cracking 23
Figure 2.16: Distribution of hydrogen concentration and local stress at the crack tip [REH13].
In some cases, when pre-strain level is kept low, the uniform distribution of introduced dislocations
disperses hydrogen atoms and reduces the local hydrogen enrichment [LI14]. However, high strain
leads to hydrogen concentration increasing remarkably. Consequently, cohesion force between atoms
in matrix is deeply weakened, leading to the HIC.
Moreover, the stress and strain condition especially affects the DF behavior in TRIP-/TWIP steels
because it is decisive to the phase transformation or mechanical twinning mechanism, which influences
the hydrogen behavior in steels.
In summary, the HIC and its deformation mechanisms have been investigated in many scientific works.
Hydrogen atoms can entry and dissolve in the trapping sites in the steels, diffuse and re-contribute under
stress. Hydrogen embrittlement can be a challenge to apply the advanced high strength steels over
1000 MPa in automobile industry widely. A comparison of testing methods to evaluate the resistance
to hydrogen embrittlement is needed. The available knowledge focused on the structural steels or 1st
and 2nd generations of advanced high strength steels, concerning the degradation of properties and
delayed fracture behaviors. The new developed 3rd generation of advanced high strength steels
concerning their susceptibility to hydrogen embrittlement is still required to be clarified. Besides, the
influences of automotive production processes immanent parameters on HIC behaviors needs to be
further elucidated. The present work aims to investigate the hydrogen embrittlement in these highlights,
to conclude the guideline to prevent the car body from HIC, from material selection to the car
manufacture and functioning processes.
24
3 Materials and Experimental Methods
3.1 Investigated materials
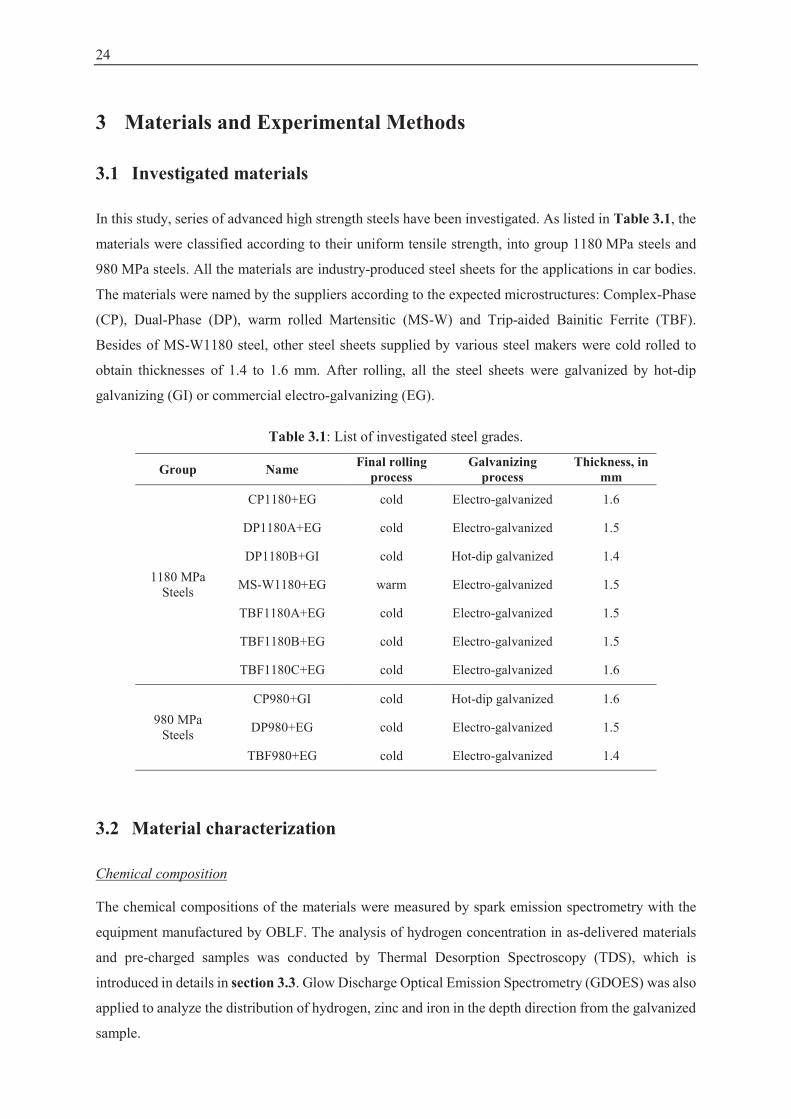
In this study, series of advanced high strength steels have been investigated. As listed in Table 3.1, the
materials were classified according to their uniform tensile strength, into group 1180 MPa steels and
980 MPa steels. All the materials are industry-produced steel sheets for the applications in car bodies.
The materials were named by the suppliers according to the expected microstructures: Complex-Phase
(CP), Dual-Phase (DP), warm rolled Martensitic (MS-W) and Trip-aided Bainitic Ferrite (TBF).
Besides of MS-W1180 steel, other steel sheets supplied by various steel makers were cold rolled to
obtain thicknesses of 1.4 to 1.6 mm. After rolling, all the steel sheets were galvanized by hot-dip
galvanizing (GI) or commercial electro-galvanizing (EG).
Table 3.1: List of investigated steel grades.
Group Name Final rolling process
Galvanizing process
Thickness, in mm
1180 MPa Steels
CP1180+EG cold Electro-galvanized 1.6
DP1180A+EG cold Electro-galvanized 1.5
DP1180B+GI cold Hot-dip galvanized 1.4
MS-W1180+EG warm Electro-galvanized 1.5
TBF1180A+EG cold Electro-galvanized 1.5
TBF1180B+EG cold Electro-galvanized 1.5
TBF1180C+EG cold Electro-galvanized 1.6
980 MPa Steels
CP980+GI cold Hot-dip galvanized 1.6
DP980+EG cold Electro-galvanized 1.5
TBF980+EG cold Electro-galvanized 1.4
3.2 Material characterization
Chemical composition
The chemical compositions of the materials were measured by spark emission spectrometry with the
equipment manufactured by OBLF. The analysis of hydrogen concentration in as-delivered materials
and pre-charged samples was conducted by Thermal Desorption Spectroscopy (TDS), which is
introduced in details in section 3.3. Glow Discharge Optical Emission Spectrometry (GDOES) was also
applied to analyze the distribution of hydrogen, zinc and iron in the depth direction from the galvanized
sample.
3.2 Material characterization 25
Microstructure analysis
To characterize the microstructure of multi-phase steels, Light Optical Microscope (LOM) combined
with color-etching technology was widely applied [ANG06]. In the current work, the steel samples were
mechanically ground with conventional grinding paper and the final polishing step was conducted with
suspension of 1μm diameter silica particles. In DP and MS-W steels, etching was performed in 3%
Nital solution. In other steel grades, etching was carried out with Klemm solution. Due to different
solubility in the relevant etching agents, different phases are differed by varying colors under LOM
[ANG06].
The samples for Scanning Electron Microscope (SEM) were etched with 3% Nital solution. Under SEM
the C-enriched phases like austenite and martensite were stripped less than other phases.
Electron Back Scatter Diffraction (EBSD) based orientation microscopy was applied to quantitatively
analyze the phase fractions of the materials. The samples were electro-polished with commercial
electrolyte A2. The orientation microscopy was carried out on the RD-TD plane (RD: rolling direction,
TD: transverse direction) with a JEOL JSM 7000F SEM. EDAX-TSL camera “Hikari” was used as
EBSD system. The analysis was carried out with an acceleration voltage of 20 keV and a beam current
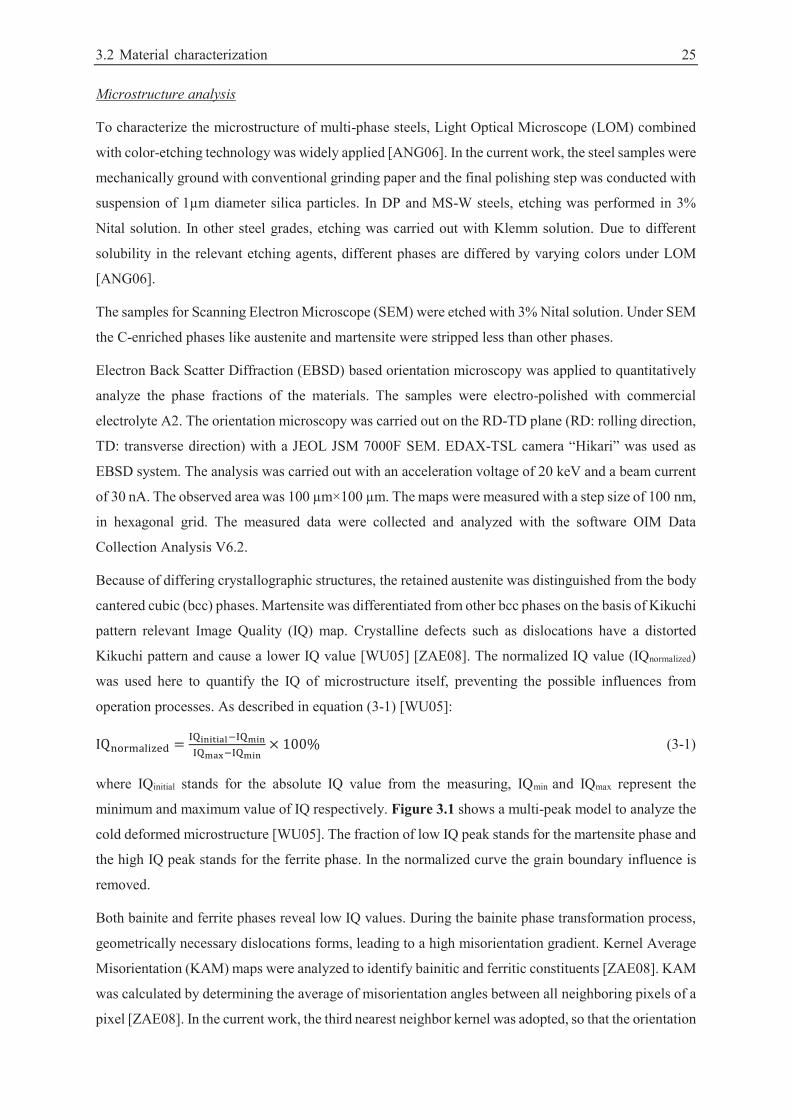
of 30 nA. The observed area was 100 μm×100 μm. The maps were measured with a step size of 100 nm,
in hexagonal grid. The measured data were collected and analyzed with the software OIM Data
Collection Analysis V6.2.
Because of differing crystallographic structures, the retained austenite was distinguished from the body
cantered cubic (bcc) phases. Martensite was differentiated from other bcc phases on the basis of Kikuchi
pattern relevant Image Quality (IQ) map. Crystalline defects such as dislocations have a distorted
Kikuchi pattern and cause a lower IQ value [WU05] [ZAE08]. The normalized IQ value (IQnormalized)
was used here to quantify the IQ of microstructure itself, preventing the possible influences from
operation processes. As described in equation (3-1) [WU05]:
(3-1)
where IQinitial stands for the absolute IQ value from the measuring, IQmin and IQmax represent the
minimum and maximum value of IQ respectively. Figure 3.1 shows a multi-peak model to analyze the
cold deformed microstructure [WU05]. The fraction of low IQ peak stands for the martensite phase and
the high IQ peak stands for the ferrite phase. In the normalized curve the grain boundary influence is
removed.
Both bainite and ferrite phases reveal low IQ values. During the bainite phase transformation process,
geometrically necessary dislocations forms, leading to a high misorientation gradient. Kernel Average
Misorientation (KAM) maps were analyzed to identify bainitic and ferritic constituents [ZAE08]. KAM
was calculated by determining the average of misorientation angles between all neighboring pixels of a
pixel [ZAE08]. In the current work, the third nearest neighbor kernel was adopted, so that the orientation
26 Materials and Experimental Methods
variation achieved 300 nm. A maximum value of KAM (KAMmax) of 0.6 was adopted as the boundary
value between ferrite and bainite. The microstructure with KAM value lower that 0.6º was defined as
ferrite while that with KAM value higher than 0.6º was identified as bainite and tempered martensite
structures.
Figure 3.1: The IQ distribution analysis using multi-peak model [WU05].
Quasi-static tensile test
The mechanical properties of the investigated materials were characterized by the quasi-static tensile
test according to SEP1240. The samples were manufactured according to ISO EN 10002, with a gauge
length of 80 mm. A universal extension machine Zwick Z100 was applied for quasi-static tensile test.
The strain rate for testing was set to a constant of 10-3 s-1. A laser extension sensor laserXtens was used
to measure the strain in the axial loading direction. The engineering stress-strain curves of each material
were recorded. The mechanical properties of each material were calculated as the average of three repeat
tests.
Hardness test
The local hardness on the edge surface and the cross section of welding point was measured. The
Vickers hardness test according to DIN EN ISO 6507-1 was carried out with a hardness machine
DuraScan from company Struers. A Vickers pyramid with surface angel 136° was applied. HV0.3 was
selected to characterize the edge surfaces and HV0.5 was selected for the analysis of welding point. The
hardness was analyzed by the software “ecos Workflow” automatically.
Roughness test
The roughness of the edge surface was measured using μsurf surface measurement. A confocal
microscope from the company NanoFocus was used for 3D measurement. The measured area was
320 μm × 320 μm on the sample. The data were analyzed by the software μsoft.
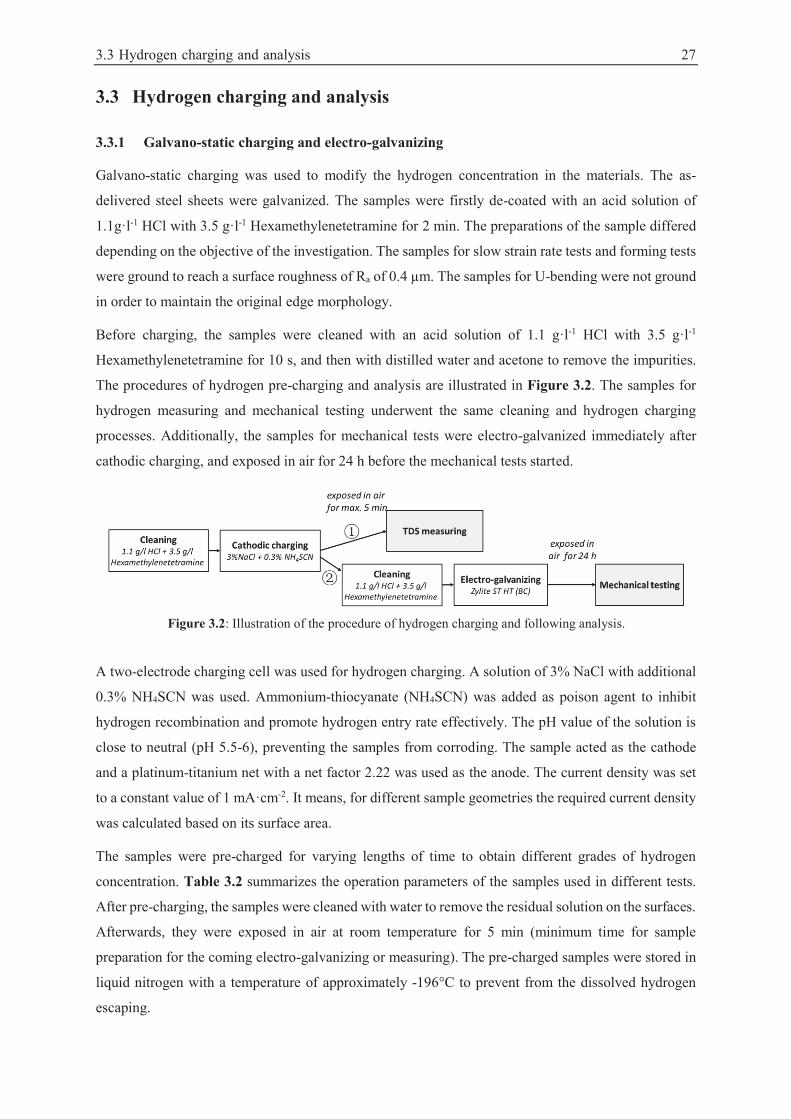
3.3 Hydrogen charging and analysis 27
3.3 Hydrogen charging and analysis
3.3.1 Galvano-static charging and electro-galvanizing
Galvano-static charging was used to modify the hydrogen concentration in the materials. The as-
delivered steel sheets were galvanized. The samples were firstly de-coated with an acid solution of
1.1g·l-1 HCl with 3.5 g·l-1 Hexamethylenetetramine for 2 min. The preparations of the sample differed
depending on the objective of the investigation. The samples for slow strain rate tests and forming tests
were ground to reach a surface roughness of Ra of 0.4 μm. The samples for U-bending were not ground
in order to maintain the original edge morphology.
Before charging, the samples were cleaned with an acid solution of 1.1 g·l-1 HCl with 3.5 g·l-1
Hexamethylenetetramine for 10 s, and then with distilled water and acetone to remove the impurities.
The procedures of hydrogen pre-charging and analysis are illustrated in Figure 3.2. The samples for
hydrogen measuring and mechanical testing underwent the same cleaning and hydrogen charging
processes. Additionally, the samples for mechanical tests were electro-galvanized immediately after
cathodic charging, and exposed in air for 24 h before the mechanical tests started.
Figure 3.2: Illustration of the procedure of hydrogen charging and following analysis.
A two-electrode charging cell was used for hydrogen charging. A solution of 3% NaCl with additional
0.3% NH4SCN was used. Ammonium-thiocyanate (NH4SCN) was added as poison agent to inhibit
hydrogen recombination and promote hydrogen entry rate effectively. The pH value of the solution is
close to neutral (pH 5.5-6), preventing the samples from corroding. The sample acted as the cathode
and a platinum-titanium net with a net factor 2.22 was used as the anode. The current density was set
to a constant value of 1 mA·cm-2. It means, for different sample geometries the required current density
was calculated based on its surface area.
The samples were pre-charged for varying lengths of time to obtain different grades of hydrogen
concentration. Table 3.2 summarizes the operation parameters of the samples used in different tests.
After pre-charging, the samples were cleaned with water to remove the residual solution on the surfaces.
Afterwards, they were exposed in air at room temperature for 5 min (minimum time for sample
preparation for the coming electro-galvanizing or measuring). The pre-charged samples were stored in
liquid nitrogen with a temperature of approximately -196°C to prevent from the dissolved hydrogen
escaping.
28 Materials and Experimental Methods
Table 3.2: Operated parameters of galvano-static charging for different kinds of samples.
Tests Solution Current density Duration Temperature
SSRT
3% NaCl +0.3% NH4SCN 1 mA/cm2
2.5/15/30 min (all the tests were carried out at room
temperature)
U-bend 10/30 min
Nakajima 30 min
VDA-bend 10/30 min
After pre-charging, the samples were electro-galvanized in order to effectively prevent hydrogen
effusion during following testing. The samples were activated with the HCl solution (1.1 g·l-1) with
3.5 g·l-1 Hexamethylenetetramine for 10 s and cleaned by distilled water and acetone. The commercial
acid zinc-chloride electrolyte Zylite ST HT (BC) (ZnCl2 concentration of 70 g·l-1) from Atotech was
applied for electro-galvanizing process. The samples functioned as the cathode and the anode was a
zinc bar. The parameters for galvanizing are listed in Table 3.3. The Zn-coated samples were exposed
in air for 24 h before the following mechanical testing, in order to homogenize the hydrogen in the
transverse direction.
Table 3.3: Operation parameters of electro-galvanizing for the different test samples.
Tests Solution Current density Duration Temperature
SSRT
Zylite ST HT (BC)
40 mA/cm2 10 min (all the tests
were carried out at room
temperature)
U-bend 40 mA/cm2 10 min
Nakajima 10 mA/cm2 30 min
VDA-bend 40 mA/cm2 10 min
3.3.2 Thermal desorption spectroscopy measurement
The hydrogen concentration was determined by Thermal Desorption Spectroscopy (TDS). The
apparatus of TDS is shown schematically in Figure 3.3. In the furnace, the samples were placed in a
glass pipe and the thermocouple was placed outside in another glass chamber in an equivalent location.
Before measuring the system was vacuumed so that the pressure inside the measuring system was in
the range of 10-8 to 10-2 Pa. The surrounding conditions of the sample and the thermocouple were quite
similar under high vacuum [ZEP03]. In the heating process the temperature of the radiation furnace was
measured by the thermocouple. The absorbed atomic hydrogen (Hab) desorbs from the substrate with
increased temperature and re-combination takes place at the sample surfaces. Thereby the amount of
desorbed molecule hydrogen was measured by quadruple spectrometers and recorded by computer. In
this study, the TDS apparatus was calibrated by standard TiH2. The heating rate was 0.1°C·s-1.
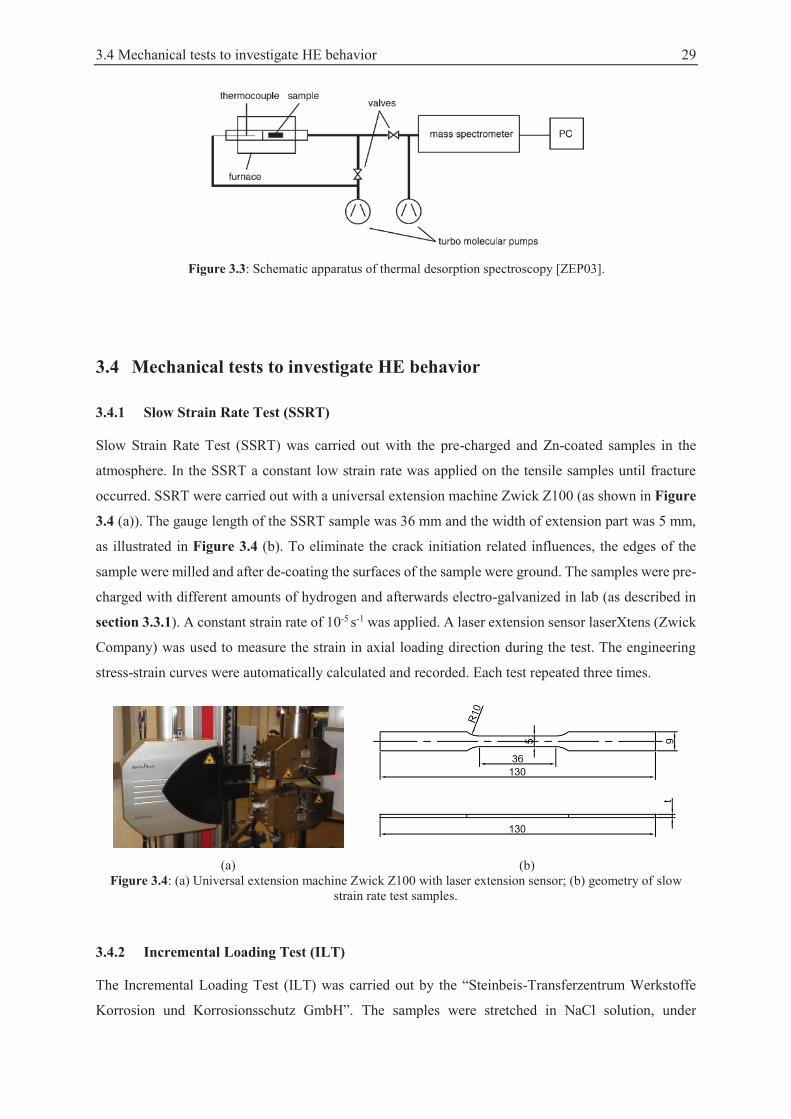
3.4 Mechanical tests to investigate HE behavior 29
Figure 3.3: Schematic apparatus of thermal desorption spectroscopy [ZEP03].
3.4 Mechanical tests to investigate HE behavior
3.4.1 Slow Strain Rate Test (SSRT)
Slow Strain Rate Test (SSRT) was carried out with the pre-charged and Zn-coated samples in the
atmosphere. In the SSRT a constant low strain rate was applied on the tensile samples until fracture
occurred. SSRT were carried out with a universal extension machine Zwick Z100 (as shown in Figure
3.4 (a)). The gauge length of the SSRT sample was 36 mm and the width of extension part was 5 mm,
as illustrated in Figure 3.4 (b). To eliminate the crack initiation related influences, the edges of the
sample were milled and after de-coating the surfaces of the sample were ground. The samples were pre-
charged with different amounts of hydrogen and afterwards electro-galvanized in lab (as described in
section 3.3.1). A constant strain rate of 10-5 s-1 was applied. A laser extension sensor laserXtens (Zwick
Company) was used to measure the strain in axial loading direction during the test. The engineering
stress-strain curves were automatically calculated and recorded. Each test repeated three times.
(a) (b)
Figure 3.4: (a) Universal extension machine Zwick Z100 with laser extension sensor; (b) geometry of slow strain rate test samples.
3.4.2 Incremental Loading Test (ILT)
The Incremental Loading Test (ILT) was carried out by the “Steinbeis-Transferzentrum Werkstoffe
Korrosion und Korrosionsschutz GmbH”. The samples were stretched in NaCl solution, under
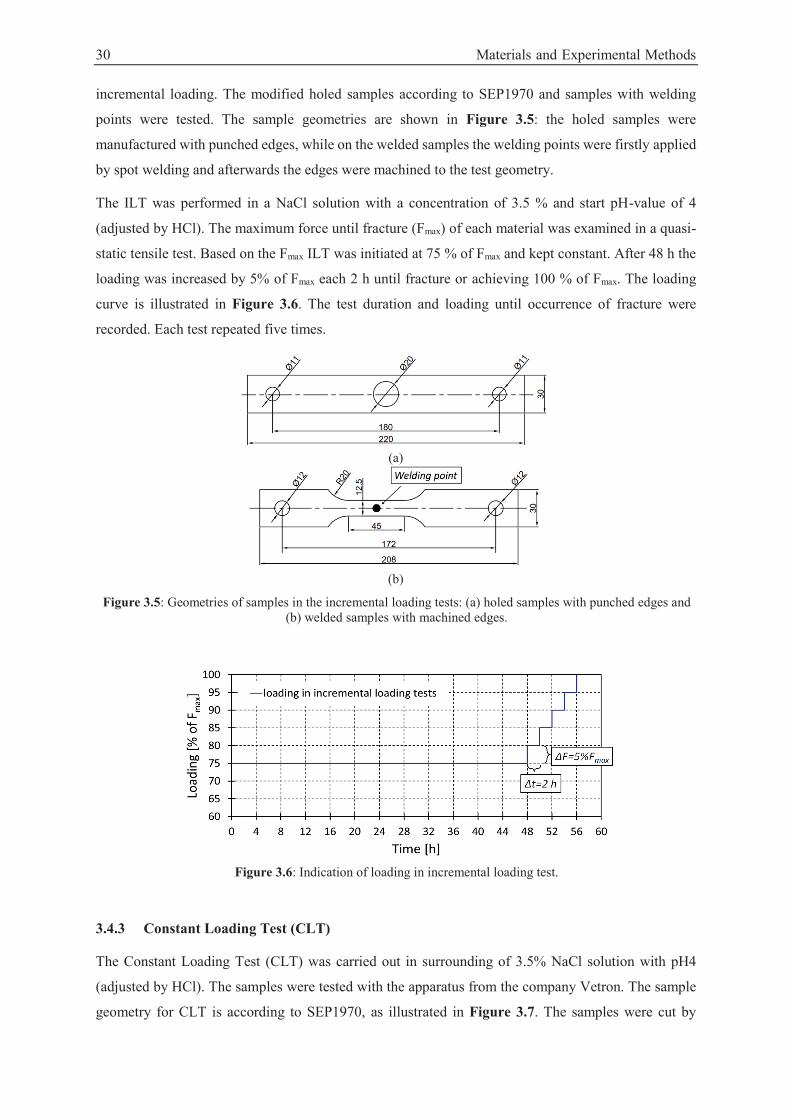
30 Materials and Experimental Methods
incremental loading. The modified holed samples according to SEP1970 and samples with welding
points were tested. The sample geometries are shown in Figure 3.5: the holed samples were
manufactured with punched edges, while on the welded samples the welding points were firstly applied
by spot welding and afterwards the edges were machined to the test geometry.
The ILT was performed in a NaCl solution with a concentration of 3.5 % and start pH-value of 4
(adjusted by HCl). The maximum force until fracture (Fmax) of each material was examined in a quasi-
static tensile test. Based on the Fmax ILT was initiated at 75 % of Fmax and kept constant. After 48 h the
loading was increased by 5% of Fmax each 2 h until fracture or achieving 100 % of Fmax. The loading
curve is illustrated in Figure 3.6. The test duration and loading until occurrence of fracture were
recorded. Each test repeated five times.
(a)
(b)
Figure 3.5: Geometries of samples in the incremental loading tests: (a) holed samples with punched edges and (b) welded samples with machined edges.
Figure 3.6: Indication of loading in incremental loading test.
3.4.3 Constant Loading Test (CLT)
The Constant Loading Test (CLT) was carried out in surrounding of 3.5% NaCl solution with pH4
(adjusted by HCl). The samples were tested with the apparatus from the company Vetron. The sample
geometry for CLT is according to SEP1970, as illustrated in Figure 3.7. The samples were cut by
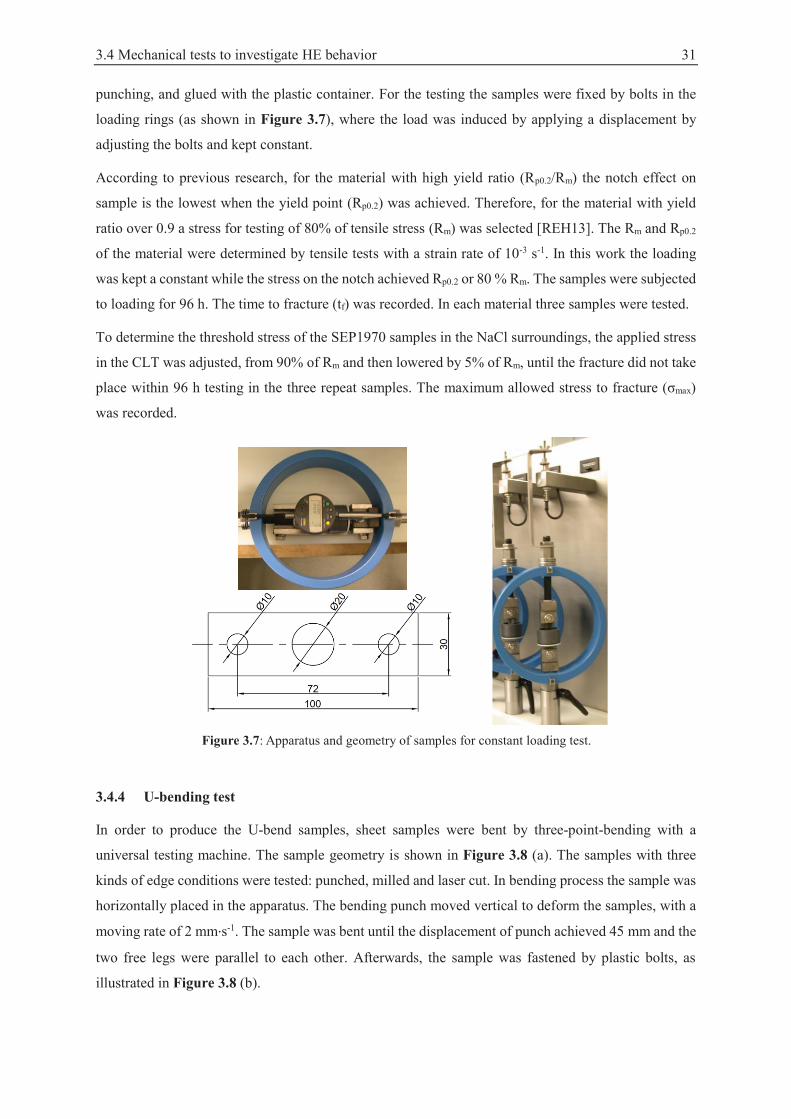
3.4 Mechanical tests to investigate HE behavior 31
punching, and glued with the plastic container. For the testing the samples were fixed by bolts in the
loading rings (as shown in Figure 3.7), where the load was induced by applying a displacement by
adjusting the bolts and kept constant.
According to previous research, for the material with high yield ratio (Rp0.2/Rm) the notch effect on
sample is the lowest when the yield point (Rp0.2) was achieved. Therefore, for the material with yield
ratio over 0.9 a stress for testing of 80% of tensile stress (Rm) was selected [REH13]. The Rm and Rp0.2
of the material were determined by tensile tests with a strain rate of 10-3 s-1. In this work the loading
was kept a constant while the stress on the notch achieved Rp0.2 or 80 % Rm. The samples were subjected
to loading for 96 h. The time to fracture (tf) was recorded. In each material three samples were tested.
To determine the threshold stress of the SEP1970 samples in the NaCl surroundings, the applied stress
in the CLT was adjusted, from 90% of Rm and then lowered by 5% of Rm, until the fracture did not take
place within 96 h testing in the three repeat samples. The maximum allowed stress to fracture (σmax)
was recorded.
Figure 3.7: Apparatus and geometry of samples for constant loading test.
3.4.4 U-bending test
In order to produce the U-bend samples, sheet samples were bent by three-point-bending with a
universal testing machine. The sample geometry is shown in Figure 3.8 (a). The samples with three
kinds of edge conditions were tested: punched, milled and laser cut. In bending process the sample was
horizontally placed in the apparatus. The bending punch moved vertical to deform the samples, with a
moving rate of 2 mm·s-1. The sample was bent until the displacement of punch achieved 45 mm and the
two free legs were parallel to each other. Afterwards, the sample was fastened by plastic bolts, as
illustrated in Figure 3.8 (b).
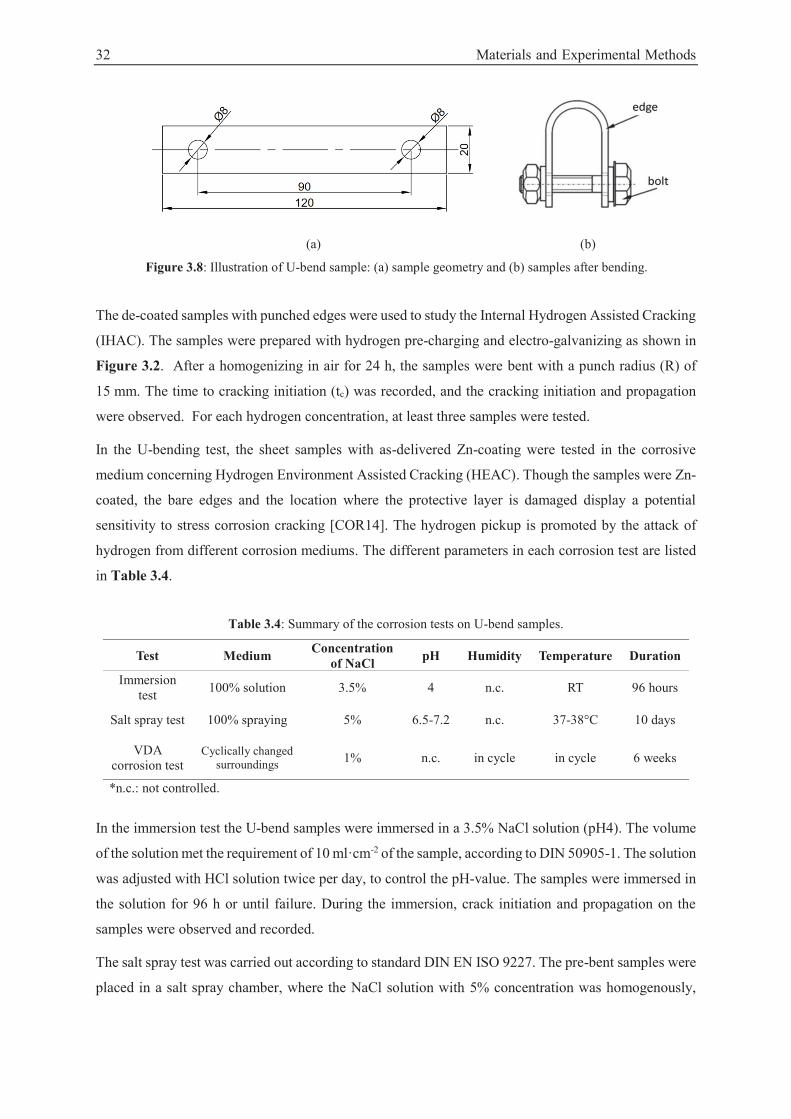
32 Materials and Experimental Methods
(a) (b)
Figure 3.8: Illustration of U-bend sample: (a) sample geometry and (b) samples after bending.
The de-coated samples with punched edges were used to study the Internal Hydrogen Assisted Cracking
(IHAC). The samples were prepared with hydrogen pre-charging and electro-galvanizing as shown in
Figure 3.2. After a homogenizing in air for 24 h, the samples were bent with a punch radius (R) of
15 mm. The time to cracking initiation (tc) was recorded, and the cracking initiation and propagation
were observed. For each hydrogen concentration, at least three samples were tested.
In the U-bending test, the sheet samples with as-delivered Zn-coating were tested in the corrosive
medium concerning Hydrogen Environment Assisted Cracking (HEAC). Though the samples were Zn-
coated, the bare edges and the location where the protective layer is damaged display a potential
sensitivity to stress corrosion cracking [COR14]. The hydrogen pickup is promoted by the attack of
hydrogen from different corrosion mediums. The different parameters in each corrosion test are listed
in Table 3.4.
Table 3.4: Summary of the corrosion tests on U-bend samples.
Test Medium Concentration of NaCl pH Humidity Temperature Duration
Immersion test 100% solution 3.5% 4 n.c. RT 96 hours
Salt spray test 100% spraying 5% 6.5-7.2 n.c. 37-38°C 10 days
VDA corrosion test
Cyclically changed surroundings 1% n.c. in cycle in cycle 6 weeks
*n.c.: not controlled.
In the immersion test the U-bend samples were immersed in a 3.5% NaCl solution (pH4). The volume
of the solution met the requirement of 10 ml·cm-2 of the sample, according to DIN 50905-1. The solution
was adjusted with HCl solution twice per day, to control the pH-value. The samples were immersed in
the solution for 96 h or until failure. During the immersion, crack initiation and propagation on the
samples were observed and recorded.
The salt spray test was carried out according to standard DIN EN ISO 9227. The pre-bent samples were
placed in a salt spray chamber, where the NaCl solution with 5% concentration was homogenously,
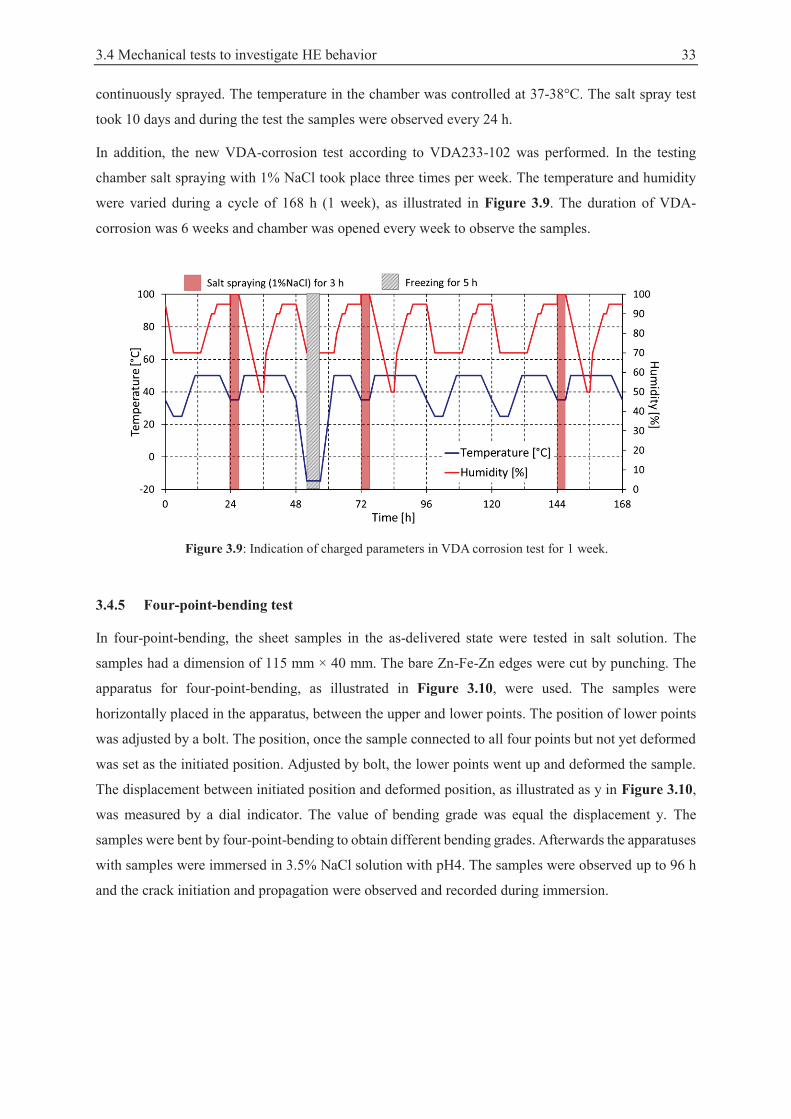
3.4 Mechanical tests to investigate HE behavior 33
continuously sprayed. The temperature in the chamber was controlled at 37-38°C. The salt spray test
took 10 days and during the test the samples were observed every 24 h.
In addition, the new VDA-corrosion test according to VDA233-102 was performed. In the testing
chamber salt spraying with 1% NaCl took place three times per week. The temperature and humidity
were varied during a cycle of 168 h (1 week), as illustrated in Figure 3.9. The duration of VDA-
corrosion was 6 weeks and chamber was opened every week to observe the samples.
Figure 3.9: Indication of charged parameters in VDA corrosion test for 1 week.
3.4.5 Four-point-bending test
In four-point-bending, the sheet samples in the as-delivered state were tested in salt solution. The
samples had a dimension of 115 mm × 40 mm. The bare Zn-Fe-Zn edges were cut by punching. The
apparatus for four-point-bending, as illustrated in Figure 3.10, were used. The samples were
horizontally placed in the apparatus, between the upper and lower points. The position of lower points
was adjusted by a bolt. The position, once the sample connected to all four points but not yet deformed
was set as the initiated position. Adjusted by bolt, the lower points went up and deformed the sample.
The displacement between initiated position and deformed position, as illustrated as y in Figure 3.10,
was measured by a dial indicator. The value of bending grade was equal the displacement y. The
samples were bent by four-point-bending to obtain different bending grades. Afterwards the apparatuses
with samples were immersed in 3.5% NaCl solution with pH4. The samples were observed up to 96 h
and the crack initiation and propagation were observed and recorded during immersion.
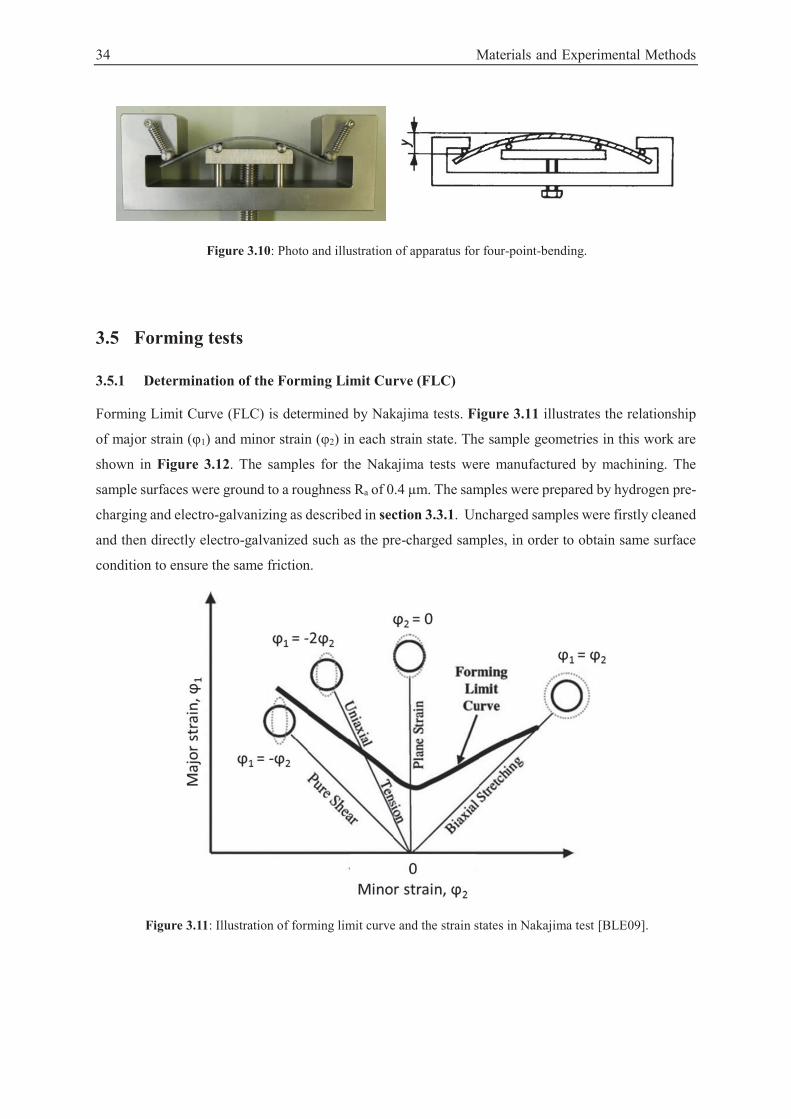
34 Materials and Experimental Methods
Figure 3.10: Photo and illustration of apparatus for four-point-bending.
3.5 Forming tests
3.5.1 Determination of the Forming Limit Curve (FLC)
Forming Limit Curve (FLC) is determined by Nakajima tests. Figure 3.11 illustrates the relationship
of major strain (φ1) and minor strain (φ2) in each strain state. The sample geometries in this work are
shown in Figure 3.12. The samples for the Nakajima tests were manufactured by machining. The
sample surfaces were ground to a roughness Ra of 0.4 μm. The samples were prepared by hydrogen pre-
charging and electro-galvanizing as described in section 3.3.1. Uncharged samples were firstly cleaned
and then directly electro-galvanized such as the pre-charged samples, in order to obtain same surface
condition to ensure the same friction.
Figure 3.11: Illustration of forming limit curve and the strain states in Nakajima test [BLE09].
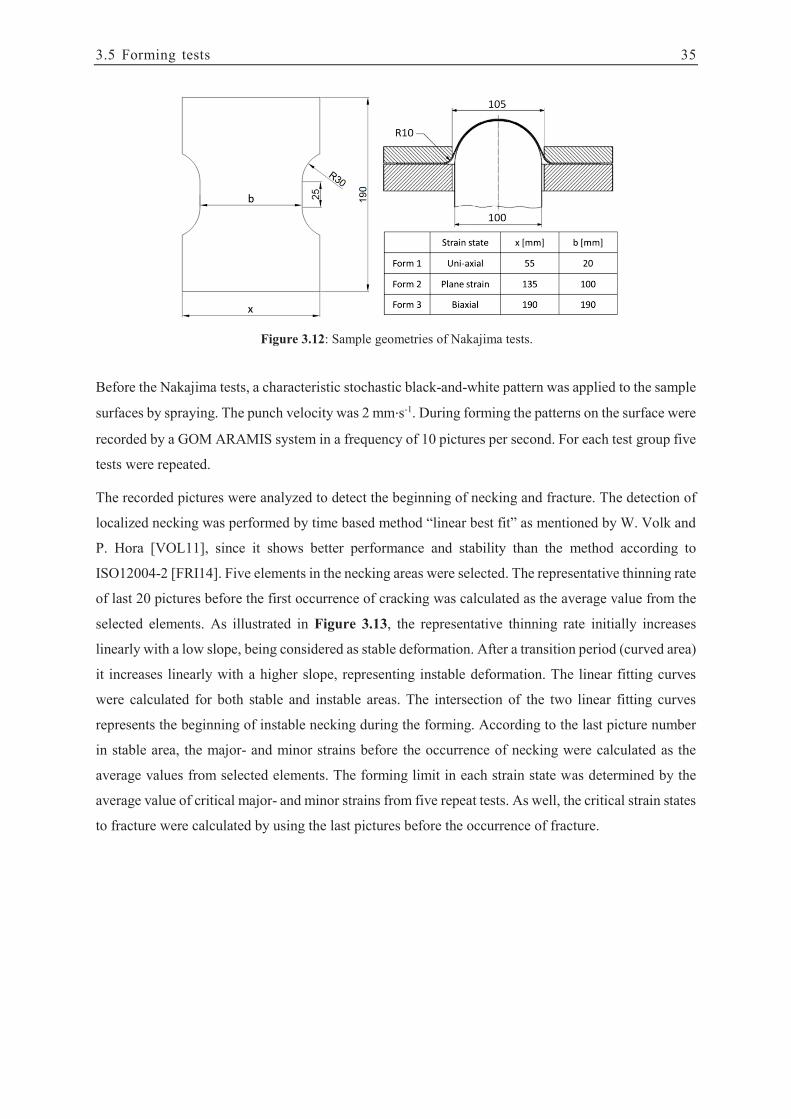
3.5 Forming tests 35
Figure 3.12: Sample geometries of Nakajima tests.
Before the Nakajima tests, a characteristic stochastic black-and-white pattern was applied to the sample
surfaces by spraying. The punch velocity was 2 mm·s-1. During forming the patterns on the surface were
recorded by a GOM ARAMIS system in a frequency of 10 pictures per second. For each test group five
tests were repeated.
The recorded pictures were analyzed to detect the beginning of necking and fracture. The detection of
localized necking was performed by time based method “linear best fit” as mentioned by W. Volk and
P. Hora [VOL11], since it shows better performance and stability than the method according to
ISO12004-2 [FRI14]. Five elements in the necking areas were selected. The representative thinning rate
of last 20 pictures before the first occurrence of cracking was calculated as the average value from the
selected elements. As illustrated in Figure 3.13, the representative thinning rate initially increases
linearly with a low slope, being considered as stable deformation. After a transition period (curved area)
it increases linearly with a higher slope, representing instable deformation. The linear fitting curves
were calculated for both stable and instable areas. The intersection of the two linear fitting curves
represents the beginning of instable necking during the forming. According to the last picture number
in stable area, the major- and minor strains before the occurrence of necking were calculated as the
average values from selected elements. The forming limit in each strain state was determined by the
average value of critical major- and minor strains from five repeat tests. As well, the critical strain states
to fracture were calculated by using the last pictures before the occurrence of fracture.
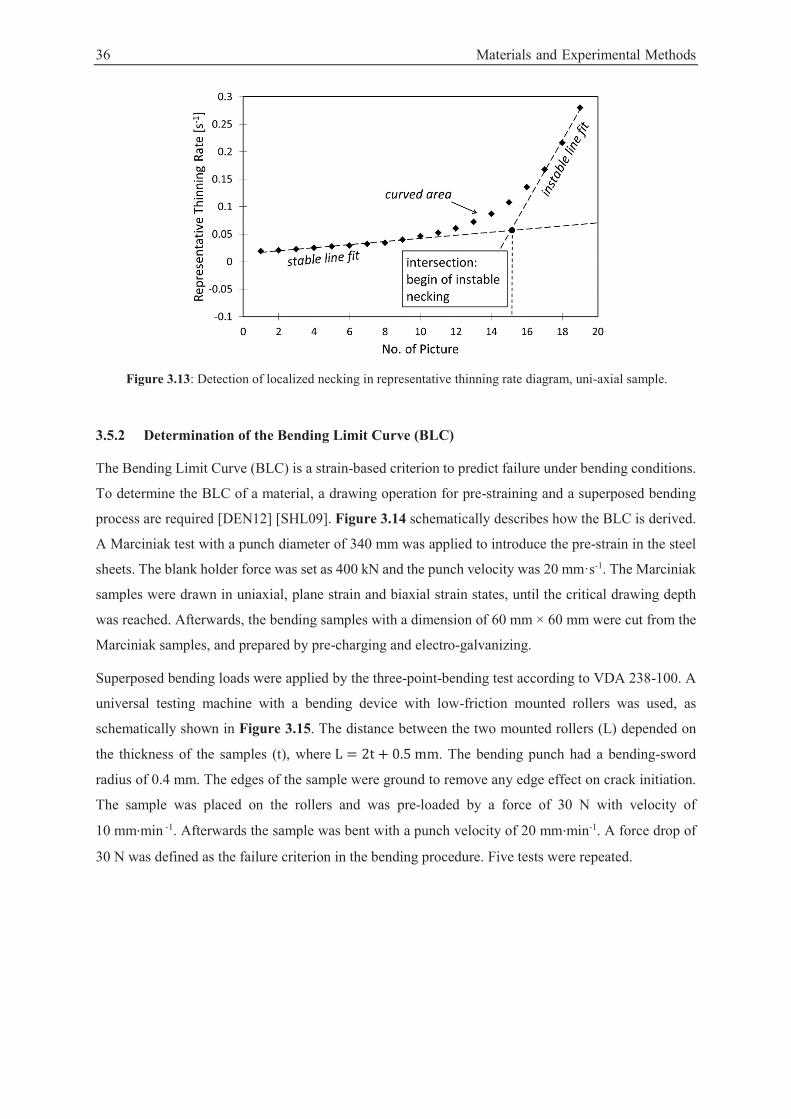
36 Materials and Experimental Methods
Figure 3.13: Detection of localized necking in representative thinning rate diagram, uni-axial sample.
3.5.2 Determination of the Bending Limit Curve (BLC)
The Bending Limit Curve (BLC) is a strain-based criterion to predict failure under bending conditions.
To determine the BLC of a material, a drawing operation for pre-straining and a superposed bending
process are required [DEN12] [SHL09]. Figure 3.14 schematically describes how the BLC is derived.
A Marciniak test with a punch diameter of 340 mm was applied to introduce the pre-strain in the steel
sheets. The blank holder force was set as 400 kN and the punch velocity was 20 mm·s-1. The Marciniak
samples were drawn in uniaxial, plane strain and biaxial strain states, until the critical drawing depth
was reached. Afterwards, the bending samples with a dimension of 60 mm × 60 mm were cut from the
Marciniak samples, and prepared by pre-charging and electro-galvanizing.
Superposed bending loads were applied by the three-point-bending test according to VDA 238-100. A
universal testing machine with a bending device with low-friction mounted rollers was used, as
schematically shown in Figure 3.15. The distance between the two mounted rollers (L) depended on
the thickness of the samples (t), where . The bending punch had a bending-sword
radius of 0.4 mm. The edges of the sample were ground to remove any edge effect on crack initiation.
The sample was placed on the rollers and was pre-loaded by a force of 30 N with velocity of
10 mm·min -1. Afterwards the sample was bent with a punch velocity of 20 mm·min-1. A force drop of
30 N was defined as the failure criterion in the bending procedure. Five tests were repeated.
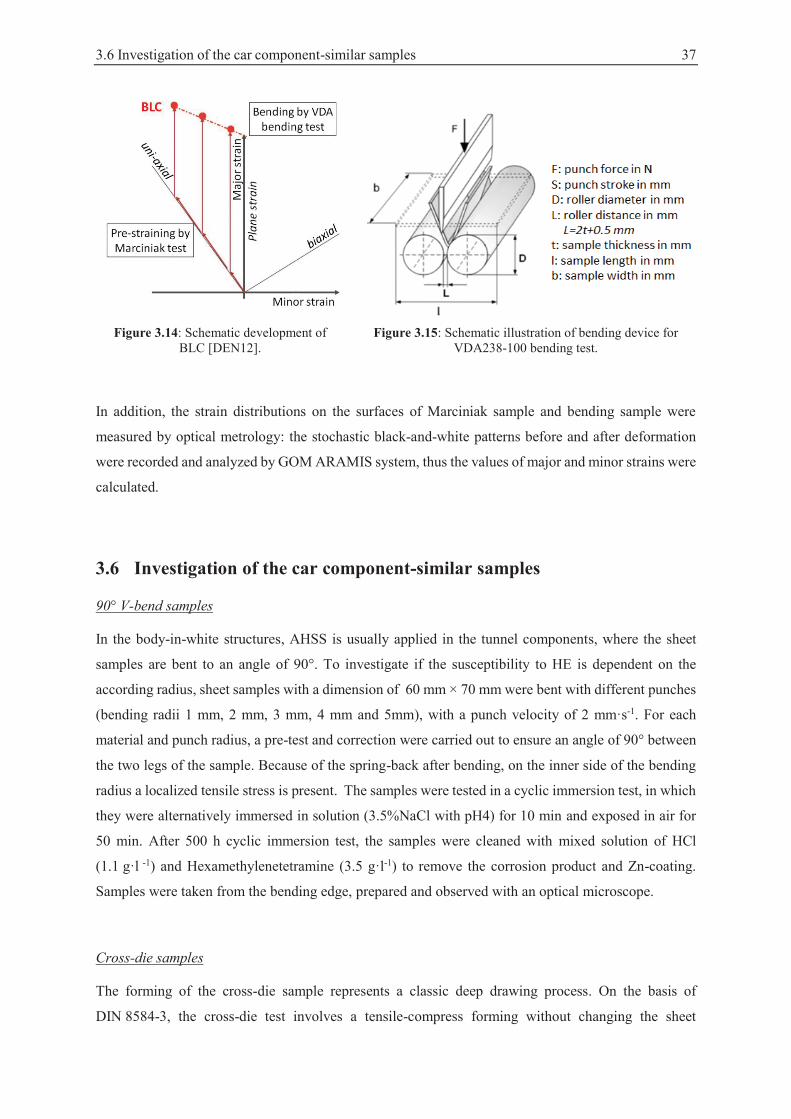
3.6 Investigation of the car component-similar samples 37
Figure 3.14: Schematic development of
BLC [DEN12]. Figure 3.15: Schematic illustration of bending device for
VDA238-100 bending test.
In addition, the strain distributions on the surfaces of Marciniak sample and bending sample were
measured by optical metrology: the stochastic black-and-white patterns before and after deformation
were recorded and analyzed by GOM ARAMIS system, thus the values of major and minor strains were
calculated.
3.6 Investigation of the car component-similar samples
90° V-bend samples
In the body-in-white structures, AHSS is usually applied in the tunnel components, where the sheet
samples are bent to an angle of 90°. To investigate if the susceptibility to HE is dependent on the
according radius, sheet samples with a dimension of 60 mm × 70 mm were bent with different punches
(bending radii 1 mm, 2 mm, 3 mm, 4 mm and 5mm), with a punch velocity of 2 mm·s-1. For each
material and punch radius, a pre-test and correction were carried out to ensure an angle of 90° between
the two legs of the sample. Because of the spring-back after bending, on the inner side of the bending
radius a localized tensile stress is present. The samples were tested in a cyclic immersion test, in which
they were alternatively immersed in solution (3.5%NaCl with pH4) for 10 min and exposed in air for
50 min. After 500 h cyclic immersion test, the samples were cleaned with mixed solution of HCl
(1.1 g·l -1) and Hexamethylenetetramine (3.5 g·l-1) to remove the corrosion product and Zn-coating.
Samples were taken from the bending edge, prepared and observed with an optical microscope.
Cross-die samples
The forming of the cross-die sample represents a classic deep drawing process. On the basis of
DIN 8584-3, the cross-die test involves a tensile-compress forming without changing the sheet
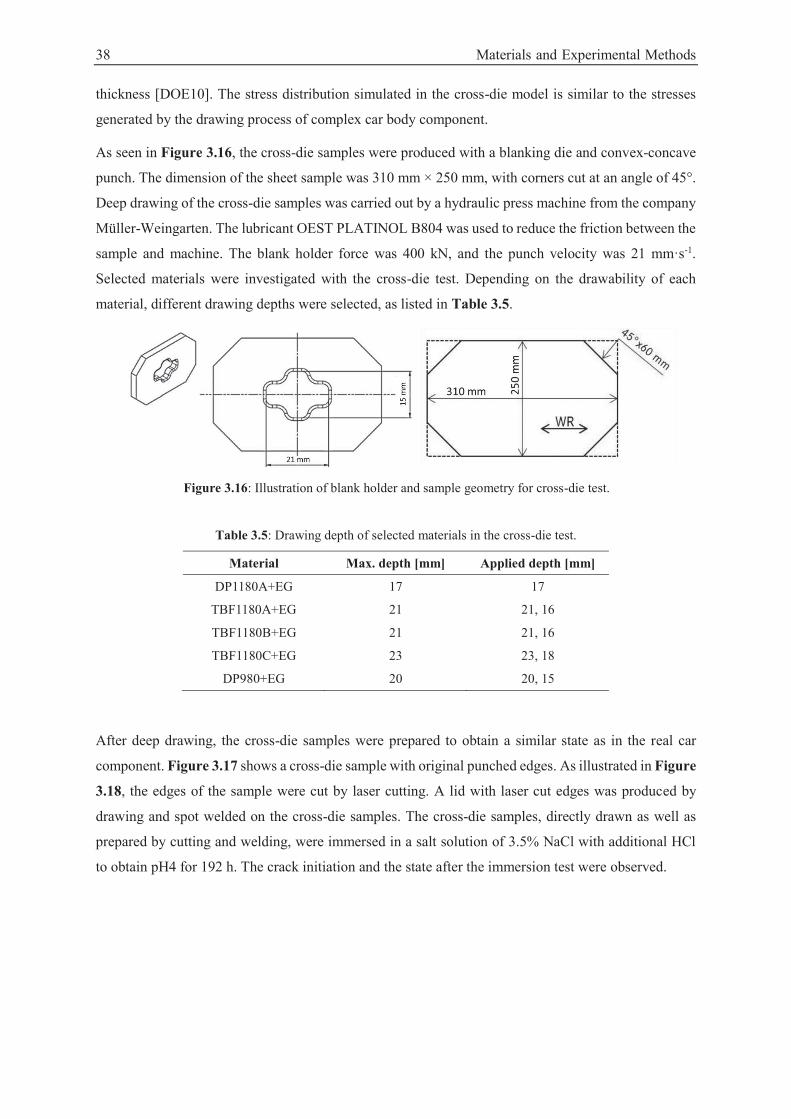
38 Materials and Experimental Methods
thickness [DOE10]. The stress distribution simulated in the cross-die model is similar to the stresses
generated by the drawing process of complex car body component.
As seen in Figure 3.16, the cross-die samples were produced with a blanking die and convex-concave
punch. The dimension of the sheet sample was 310 mm × 250 mm, with corners cut at an angle of 45°.
Deep drawing of the cross-die samples was carried out by a hydraulic press machine from the company
Müller-Weingarten. The lubricant OEST PLATINOL B804 was used to reduce the friction between the
sample and machine. The blank holder force was 400 kN, and the punch velocity was 21 mm·s-1.
Selected materials were investigated with the cross-die test. Depending on the drawability of each
material, different drawing depths were selected, as listed in Table 3.5.
Figure 3.16: Illustration of blank holder and sample geometry for cross-die test.
Table 3.5: Drawing depth of selected materials in the cross-die test.
Material Max. depth [mm] Applied depth [mm]
DP1180A+EG 17 17
TBF1180A+EG 21 21, 16
TBF1180B+EG 21 21, 16
TBF1180C+EG 23 23, 18
DP980+EG 20 20, 15
After deep drawing, the cross-die samples were prepared to obtain a similar state as in the real car
component. Figure 3.17 shows a cross-die sample with original punched edges. As illustrated in Figure
3.18, the edges of the sample were cut by laser cutting. A lid with laser cut edges was produced by
drawing and spot welded on the cross-die samples. The cross-die samples, directly drawn as well as
prepared by cutting and welding, were immersed in a salt solution of 3.5% NaCl with additional HCl
to obtain pH4 for 192 h. The crack initiation and the state after the immersion test were observed.
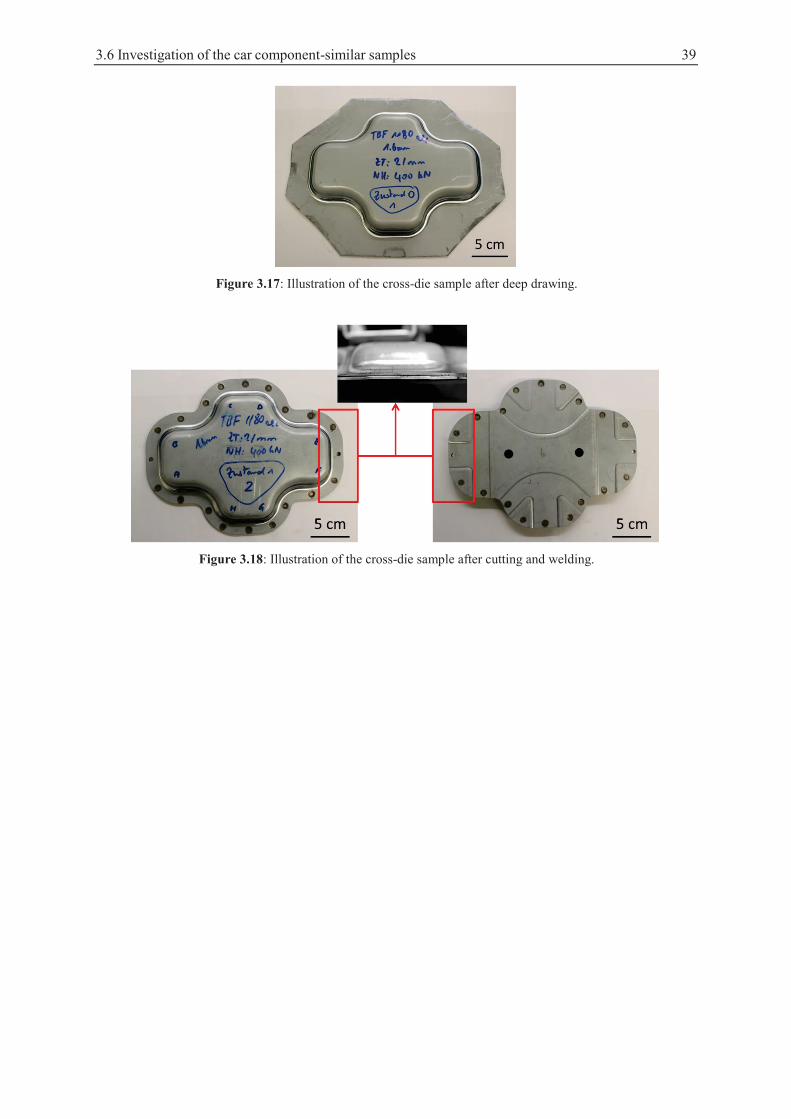
3.6 Investigation of the car component-similar samples 39
Figure 3.17: Illustration of the cross-die sample after deep drawing.
Figure 3.18: Illustration of the cross-die sample after cutting and welding.
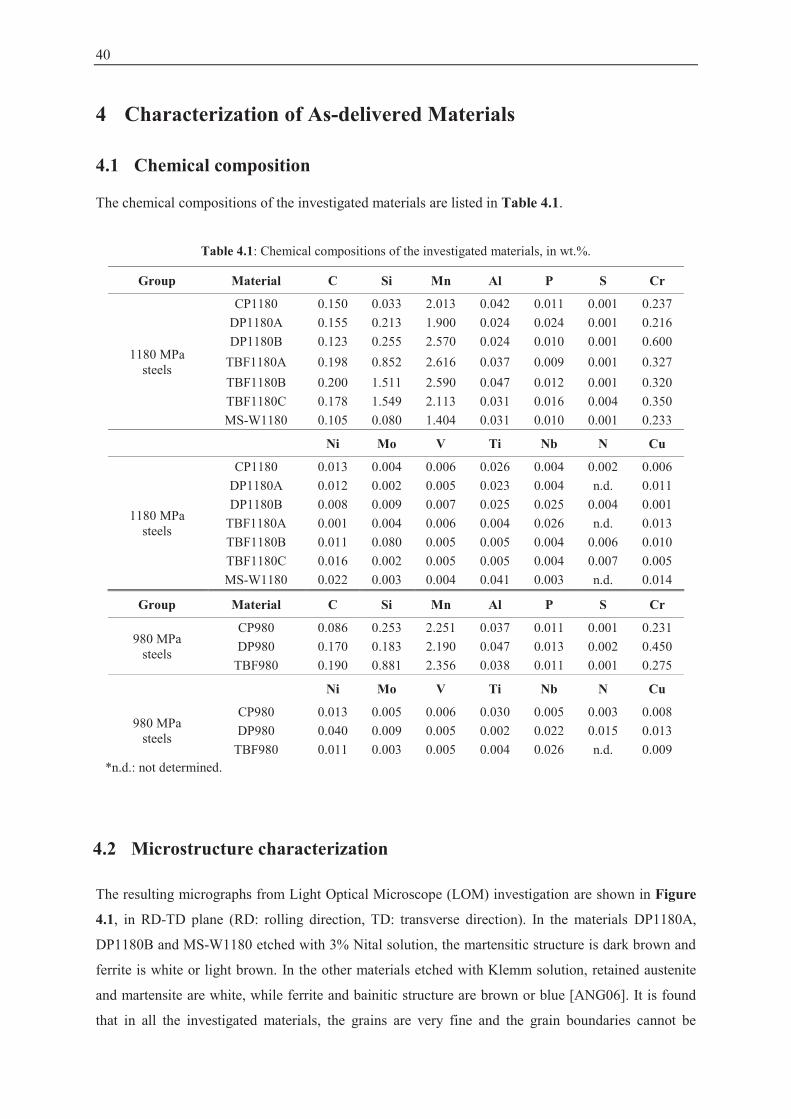
40
4 Characterization of As-delivered Materials
4.1 Chemical composition
The chemical compositions of the investigated materials are listed in Table 4.1.
Table 4.1: Chemical compositions of the investigated materials, in wt.%.
Group Material C Si Mn Al P S Cr
1180 MPa steels
CP1180 0.150 0.033 2.013 0.042 0.011 0.001 0.237 DP1180A 0.155 0.213 1.900 0.024 0.024 0.001 0.216 DP1180B 0.123 0.255 2.570 0.024 0.010 0.001 0.600
TBF1180A 0.198 0.852 2.616 0.037 0.009 0.001 0.327 TBF1180B 0.200 1.511 2.590 0.047 0.012 0.001 0.320 TBF1180C 0.178 1.549 2.113 0.031 0.016 0.004 0.350 MS-W1180 0.105 0.080 1.404 0.031 0.010 0.001 0.233
Ni Mo V Ti Nb N Cu
1180 MPa steels
CP1180 0.013 0.004 0.006 0.026 0.004 0.002 0.006 DP1180A 0.012 0.002 0.005 0.023 0.004 n.d. 0.011 DP1180B 0.008 0.009 0.007 0.025 0.025 0.004 0.001
TBF1180A 0.001 0.004 0.006 0.004 0.026 n.d. 0.013 TBF1180B 0.011 0.080 0.005 0.005 0.004 0.006 0.010 TBF1180C 0.016 0.002 0.005 0.005 0.004 0.007 0.005 MS-W1180 0.022 0.003 0.004 0.041 0.003 n.d. 0.014
Group Material C Si Mn Al P S Cr
980 MPa steels
CP980 0.086 0.253 2.251 0.037 0.011 0.001 0.231 DP980 0.170 0.183 2.190 0.047 0.013 0.002 0.450
TBF980 0.190 0.881 2.356 0.038 0.011 0.001 0.275
Ni Mo V Ti Nb N Cu
980 MPa steels
CP980 0.013 0.005 0.006 0.030 0.005 0.003 0.008 DP980 0.040 0.009 0.005 0.002 0.022 0.015 0.013
TBF980 0.011 0.003 0.005 0.004 0.026 n.d. 0.009 *n.d.: not determined.
4.2 Microstructure characterization
The resulting micrographs from Light Optical Microscope (LOM) investigation are shown in Figure
4.1, in RD-TD plane (RD: rolling direction, TD: transverse direction). In the materials DP1180A,
DP1180B and MS-W1180 etched with 3% Nital solution, the martensitic structure is dark brown and
ferrite is white or light brown. In the other materials etched with Klemm solution, retained austenite
and martensite are white, while ferrite and bainitic structure are brown or blue [ANG06]. It is found
that in all the investigated materials, the grains are very fine and the grain boundaries cannot be
4.2 Microstructure characterization 41
determined. The microstructure in the materials is homogeneously distributed, displaying no
segregation. The determination of specific phase fraction of the materials via LOM is impossible.
(a) CP1180 (Klemm) (b) DP1180A (Nital)
(c) DP1180B (Nital) (d) TBF1180A (Klemm)
(e) TBF1180B (Klemm) (f) TBF1180C (Klemm)
42 Characterization of As-delivered Materials
(g) MS-W1180 (Nital) (h) CP980 (Klemm)
(i) DP980 (Klemm) (j) TBF980 (Klemm)
Figure 4.1: Light optical micrographs of the investigated materials, etched with Nital or Klemm.
Further microstructure analysis was conducted by Scanning Electron Microscope (SEM) and Electron
Back Scatter Diffraction (EBSD), as described in Section 3.2. In the CP1180, as shown in Figure 4.2,
the microstructure is fine and homogeneous. In the SEM image the characteristic sub-boundaries and
carbide distribution is observed. In the IQ-map the overall microstructure displays as the light region,
implying that quenched martensite is not present. Based on the analysis of IQ-map and KAM, it reveals
that CP1180 consists of mixed phase of bainite and tempered martensite.
(a) SEM image, etched with Nital (b) Details from (a)
4.2 Microstructure characterization 43
(c) IQ-map (d) Phase-map
Figure 4.2: Micrographs of CP1180 in RD-TD plane, characterized by SEM and EBSD. (a) and (b): SEM image, etched with Nital, (c): IQ-map and (d): Phase-map.
In DP1180A as shown in Figure 4.3, ferrite is observed via SEM, featuring a uniform contrast inside
the grains. After tempering, the martensitic structure is differentiated with the typical, well-delineated
substructure and particular carbide. The IQ-map does not reveal any dark blocks with high dislocation
density, indicating that in DP1180A quenched martensite does not exist.
(a) SEM image, etched with Nital (b) Details from (a)
(c) IQ-map (d) Phase-map
Figure 4.3: Micrographs of DP1180A in RD-TD plane, characterized by SEM and EBSD. (a) and (b): SEM image, etched with Nital, (c): IQ-map and (d): Phase-map.
44 Characterization of As-delivered Materials
Figure 4.4 shows the micrographs of TBF1180A. Under SEM both retained austenite and martensite
islands are smooth and featureless. Tempered martensite and bainite mix together. In the IQ-map after
EBSD analysis, the martensite appears dark because of its high IQ-value. According to the phase map,
retained austenite (red) and small amount of martensite (blue) are present in the material. Besides, small
fraction of ferrite (green) is determined, because both IQ and KAM have low values.
(a) SEM image, etched with Nital (b) Details from (a)
(c) IQ-map (d) Phase-map
Figure 4.4: Micrographs of TBF1180A in RD-TD plane, characterized by SEM and EBSD. (a) and (b): SEM image, etched with Nital, (c): IQ-map and (d): Phase-map.
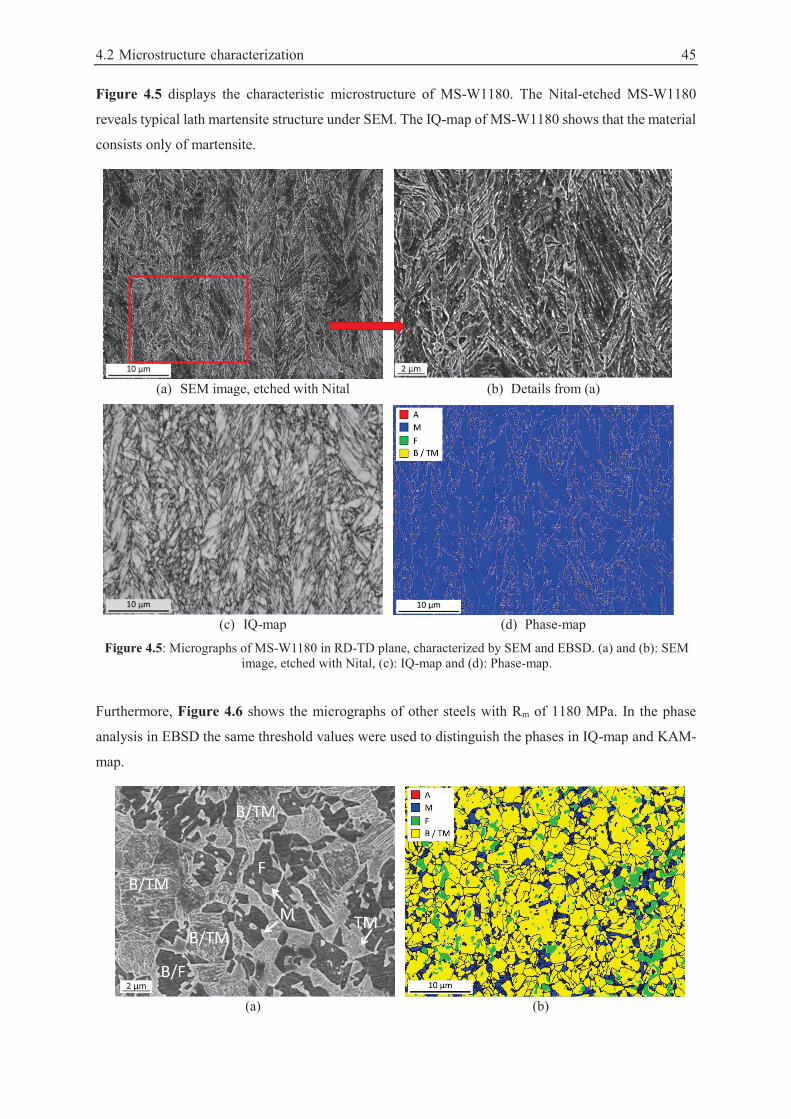
4.2 Microstructure characterization 45
Figure 4.5 displays the characteristic microstructure of MS-W1180. The Nital-etched MS-W1180
reveals typical lath martensite structure under SEM. The IQ-map of MS-W1180 shows that the material
consists only of martensite.
(a) SEM image, etched with Nital (b) Details from (a)
(c) IQ-map (d) Phase-map
Figure 4.5: Micrographs of MS-W1180 in RD-TD plane, characterized by SEM and EBSD. (a) and (b): SEM image, etched with Nital, (c): IQ-map and (d): Phase-map.
Furthermore, Figure 4.6 shows the micrographs of other steels with Rm of 1180 MPa. In the phase
analysis in EBSD the same threshold values were used to distinguish the phases in IQ-map and KAM-
map.
(a) (b)
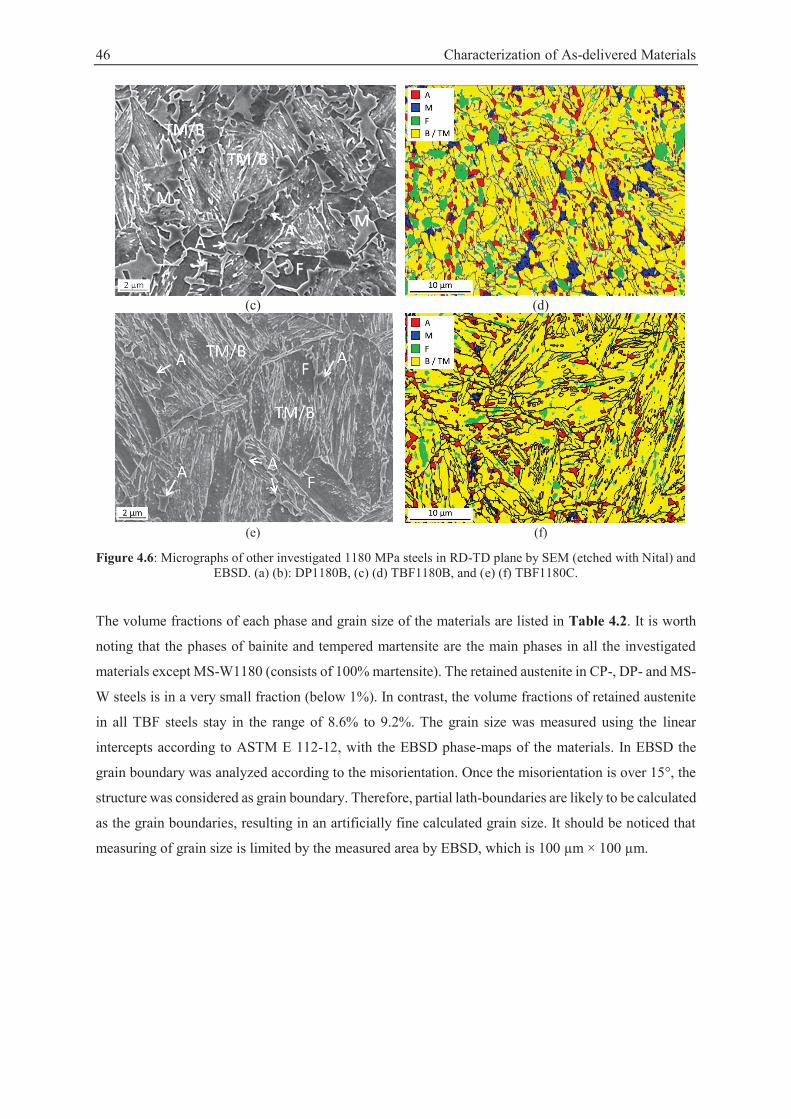
46 Characterization of As-delivered Materials
(c) (d)
(e) (f)
Figure 4.6: Micrographs of other investigated 1180 MPa steels in RD-TD plane by SEM (etched with Nital) and EBSD. (a) (b): DP1180B, (c) (d) TBF1180B, and (e) (f) TBF1180C.
The volume fractions of each phase and grain size of the materials are listed in Table 4.2. It is worth
noting that the phases of bainite and tempered martensite are the main phases in all the investigated
materials except MS-W1180 (consists of 100% martensite). The retained austenite in CP-, DP- and MS-
W steels is in a very small fraction (below 1%). In contrast, the volume fractions of retained austenite
in all TBF steels stay in the range of 8.6% to 9.2%. The grain size was measured using the linear
intercepts according to ASTM E 112-12, with the EBSD phase-maps of the materials. In EBSD the
grain boundary was analyzed according to the misorientation. Once the misorientation is over 15°, the
structure was considered as grain boundary. Therefore, partial lath-boundaries are likely to be calculated
as the grain boundaries, resulting in an artificially fine calculated grain size. It should be noticed that
measuring of grain size is limited by the measured area by EBSD, which is 100 μm × 100 μm.
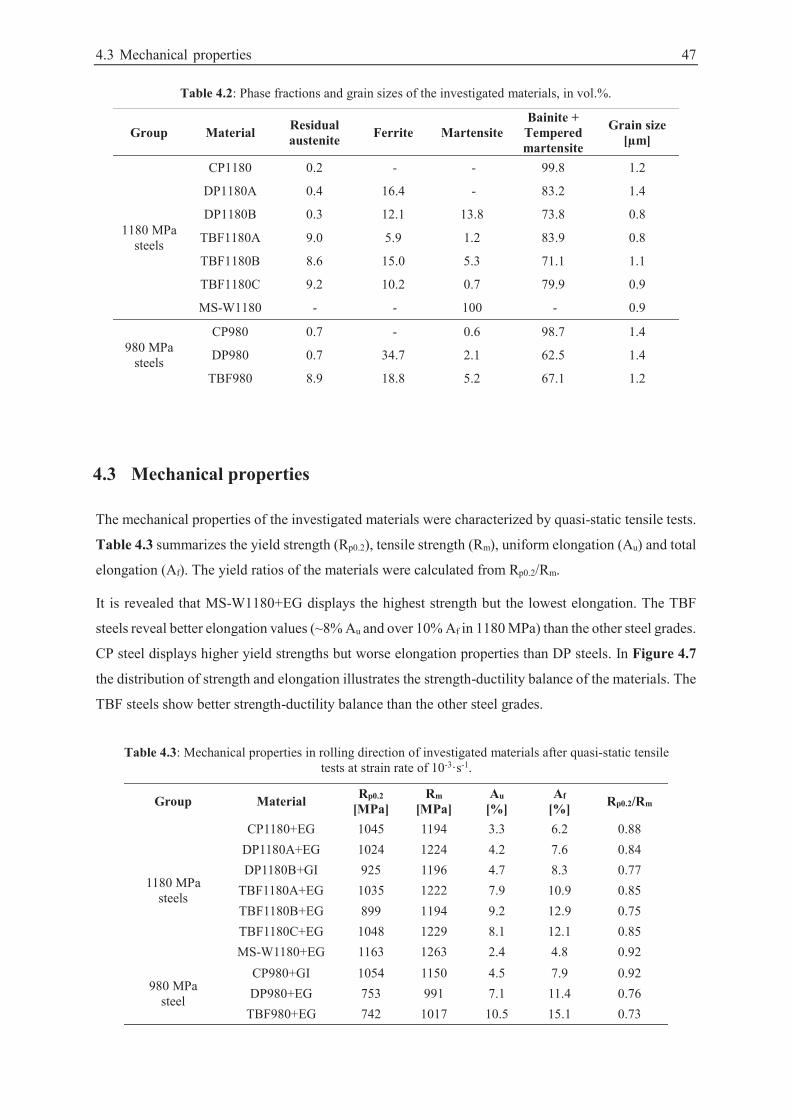
4.3 Mechanical properties 47
Table 4.2: Phase fractions and grain sizes of the investigated materials, in vol.%.
Group Material Residual austenite Ferrite Martensite
Bainite + Tempered martensite
Grain size [μm]
1180 MPa steels
CP1180 0.2 - - 99.8 1.2
DP1180A 0.4 16.4 - 83.2 1.4
DP1180B 0.3 12.1 13.8 73.8 0.8
TBF1180A 9.0 5.9 1.2 83.9 0.8
TBF1180B 8.6 15.0 5.3 71.1 1.1
TBF1180C 9.2 10.2 0.7 79.9 0.9
MS-W1180 - - 100 - 0.9
980 MPa steels
CP980 0.7 - 0.6 98.7 1.4
DP980 0.7 34.7 2.1 62.5 1.4
TBF980 8.9 18.8 5.2 67.1 1.2
4.3 Mechanical properties
The mechanical properties of the investigated materials were characterized by quasi-static tensile tests.
Table 4.3 summarizes the yield strength (Rp0.2), tensile strength (Rm), uniform elongation (Au) and total
elongation (Af). The yield ratios of the materials were calculated from Rp0.2/Rm.
It is revealed that MS-W1180+EG displays the highest strength but the lowest elongation. The TBF
steels reveal better elongation values (~8% Au and over 10% Af in 1180 MPa) than the other steel grades.
CP steel displays higher yield strengths but worse elongation properties than DP steels. In Figure 4.7
the distribution of strength and elongation illustrates the strength-ductility balance of the materials. The
TBF steels show better strength-ductility balance than the other steel grades.
Table 4.3: Mechanical properties in rolling direction of investigated materials after quasi-static tensile tests at strain rate of 10-3·s-1.
Group Material Rp0.2 [MPa]
Rm [MPa]
Au [%]
Af [%] Rp0.2/Rm
1180 MPa steels
CP1180+EG 1045 1194 3.3 6.2 0.88 DP1180A+EG 1024 1224 4.2 7.6 0.84 DP1180B+GI 925 1196 4.7 8.3 0.77
TBF1180A+EG 1035 1222 7.9 10.9 0.85 TBF1180B+EG 899 1194 9.2 12.9 0.75 TBF1180C+EG 1048 1229 8.1 12.1 0.85 MS-W1180+EG 1163 1263 2.4 4.8 0.92
980 MPa steel
CP980+GI 1054 1150 4.5 7.9 0.92 DP980+EG 753 991 7.1 11.4 0.76
TBF980+EG 742 1017 10.5 15.1 0.73
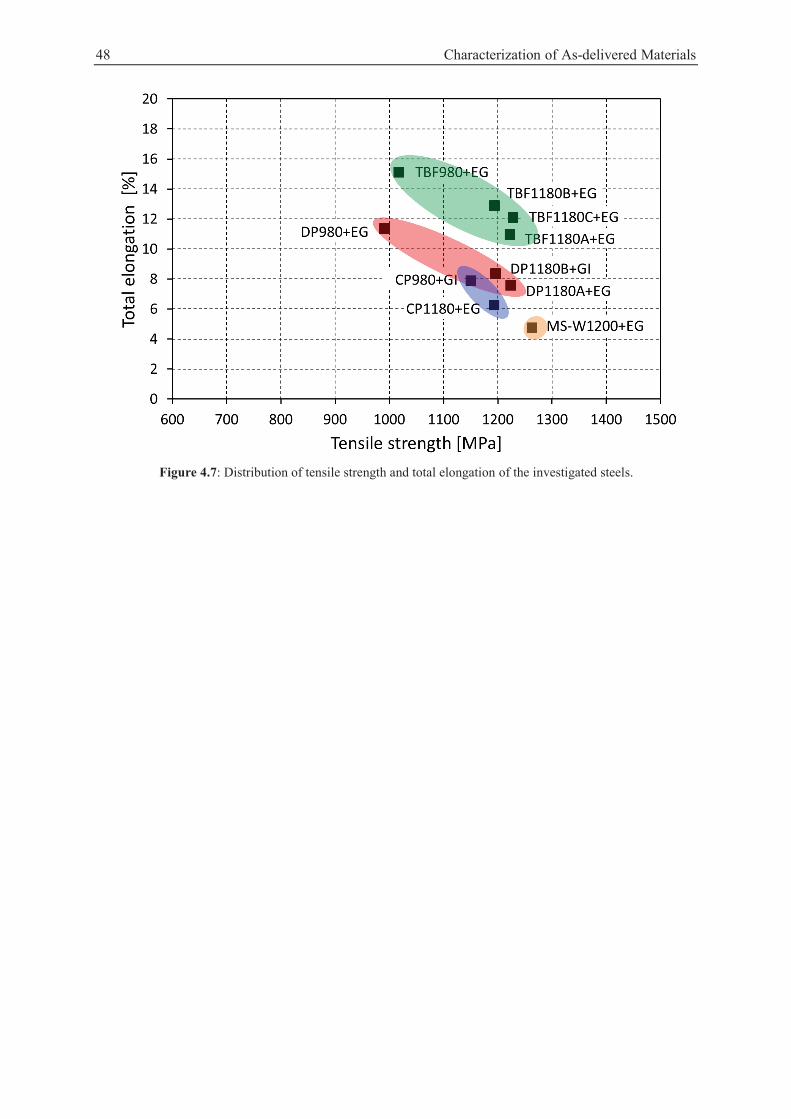
48 Characterization of As-delivered Materials
Figure 4.7: Distribution of tensile strength and total elongation of the investigated steels.
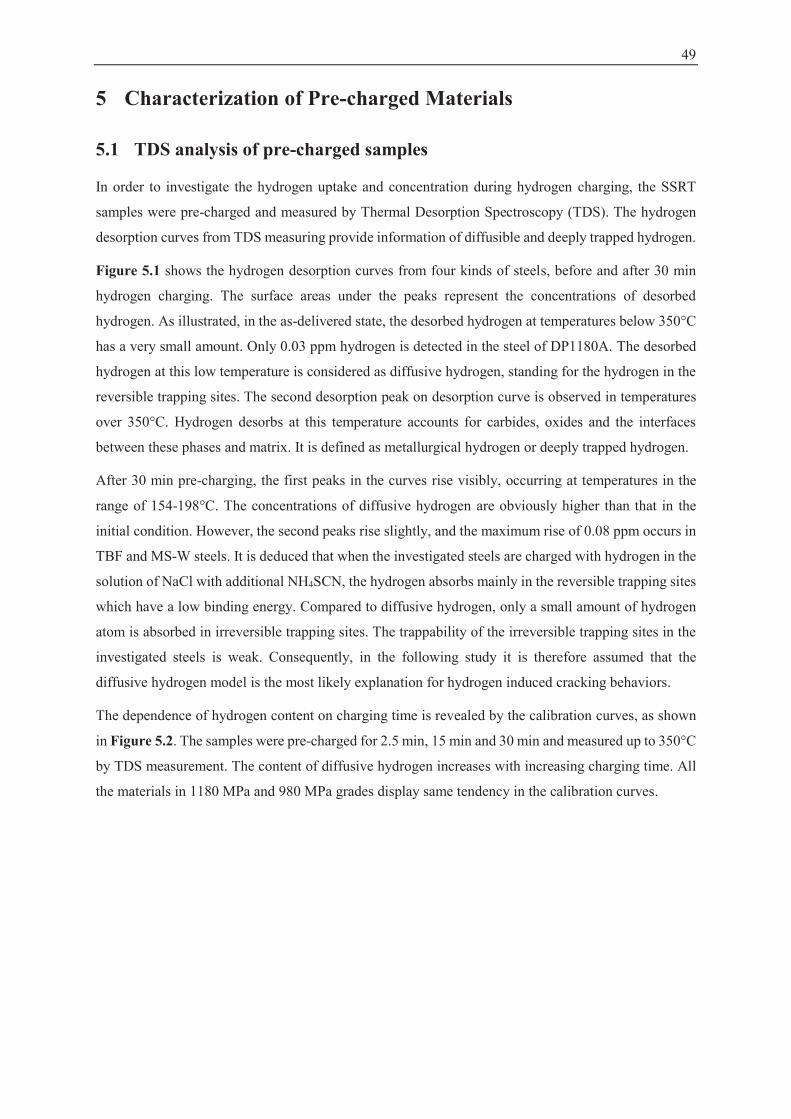
49
5 Characterization of Pre-charged Materials
5.1 TDS analysis of pre-charged samples
In order to investigate the hydrogen uptake and concentration during hydrogen charging, the SSRT
samples were pre-charged and measured by Thermal Desorption Spectroscopy (TDS). The hydrogen
desorption curves from TDS measuring provide information of diffusible and deeply trapped hydrogen.
Figure 5.1 shows the hydrogen desorption curves from four kinds of steels, before and after 30 min
hydrogen charging. The surface areas under the peaks represent the concentrations of desorbed
hydrogen. As illustrated, in the as-delivered state, the desorbed hydrogen at temperatures below 350°C
has a very small amount. Only 0.03 ppm hydrogen is detected in the steel of DP1180A. The desorbed
hydrogen at this low temperature is considered as diffusive hydrogen, standing for the hydrogen in the
reversible trapping sites. The second desorption peak on desorption curve is observed in temperatures
over 350°C. Hydrogen desorbs at this temperature accounts for carbides, oxides and the interfaces
between these phases and matrix. It is defined as metallurgical hydrogen or deeply trapped hydrogen.
After 30 min pre-charging, the first peaks in the curves rise visibly, occurring at temperatures in the
range of 154-198°C. The concentrations of diffusive hydrogen are obviously higher than that in the
initial condition. However, the second peaks rise slightly, and the maximum rise of 0.08 ppm occurs in
TBF and MS-W steels. It is deduced that when the investigated steels are charged with hydrogen in the
solution of NaCl with additional NH4SCN, the hydrogen absorbs mainly in the reversible trapping sites
which have a low binding energy. Compared to diffusive hydrogen, only a small amount of hydrogen
atom is absorbed in irreversible trapping sites. The trappability of the irreversible trapping sites in the
investigated steels is weak. Consequently, in the following study it is therefore assumed that the
diffusive hydrogen model is the most likely explanation for hydrogen induced cracking behaviors.
The dependence of hydrogen content on charging time is revealed by the calibration curves, as shown
in Figure 5.2. The samples were pre-charged for 2.5 min, 15 min and 30 min and measured up to 350°C
by TDS measurement. The content of diffusive hydrogen increases with increasing charging time. All
the materials in 1180 MPa and 980 MPa grades display same tendency in the calibration curves.
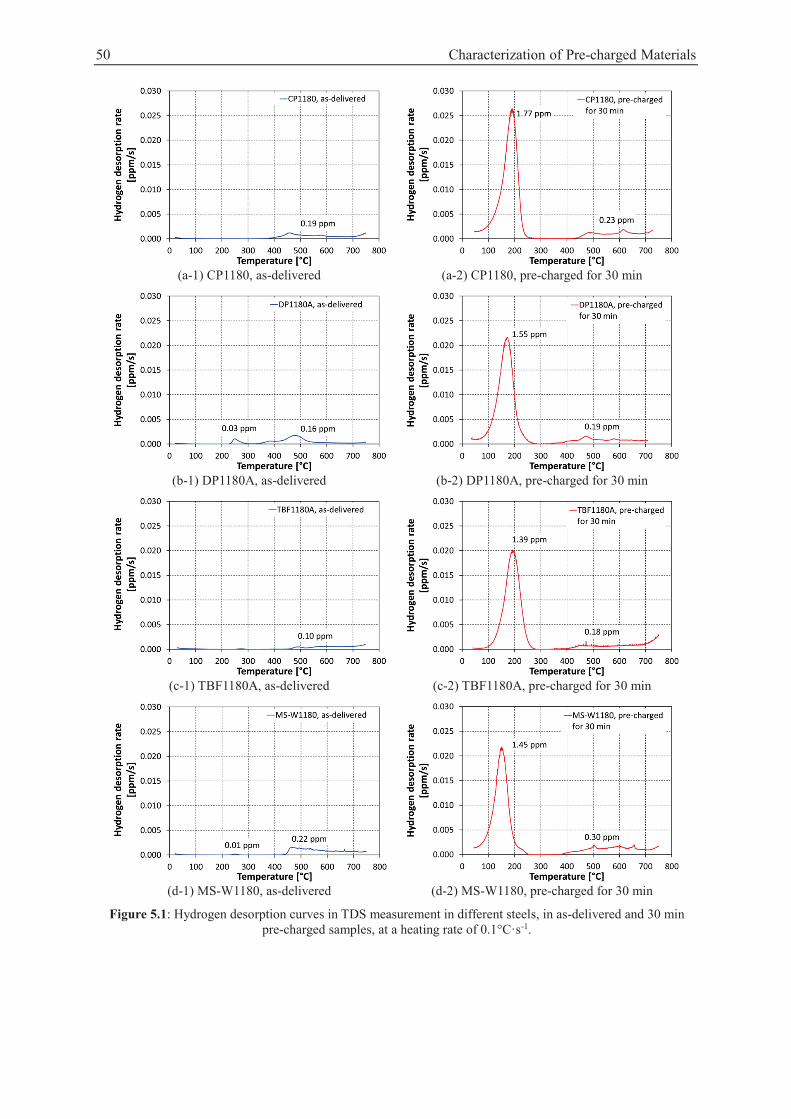
50 Characterization of Pre-charged Materials
(a-1) CP1180, as-delivered (a-2) CP1180, pre-charged for 30 min
(b-1) DP1180A, as-delivered (b-2) DP1180A, pre-charged for 30 min
(c-1) TBF1180A, as-delivered (c-2) TBF1180A, pre-charged for 30 min
(d-1) MS-W1180, as-delivered (d-2) MS-W1180, pre-charged for 30 min
Figure 5.1: Hydrogen desorption curves in TDS measurement in different steels, in as-delivered and 30 min pre-charged samples, at a heating rate of 0.1°C·s-1.
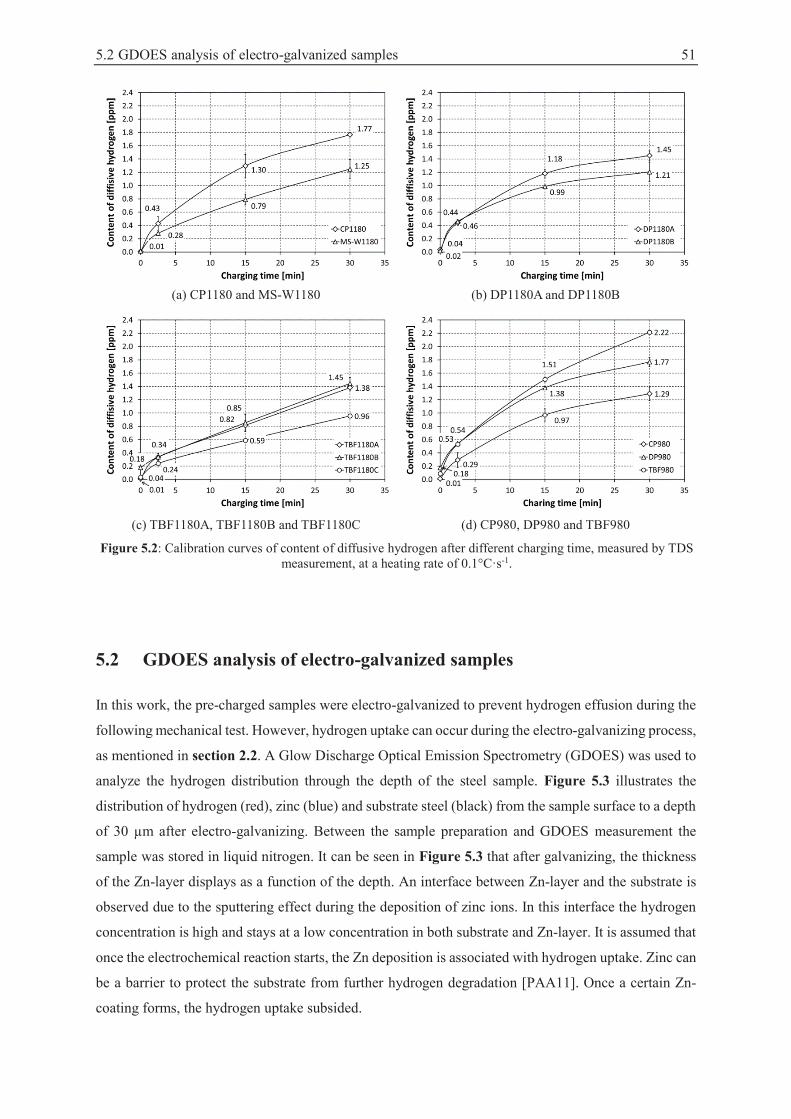
5.2 GDOES analysis of electro-galvanized samples 51
(a) CP1180 and MS-W1180 (b) DP1180A and DP1180B
(c) TBF1180A, TBF1180B and TBF1180C (d) CP980, DP980 and TBF980
Figure 5.2: Calibration curves of content of diffusive hydrogen after different charging time, measured by TDS measurement, at a heating rate of 0.1°C·s-1.
5.2 GDOES analysis of electro-galvanized samples
In this work, the pre-charged samples were electro-galvanized to prevent hydrogen effusion during the
following mechanical test. However, hydrogen uptake can occur during the electro-galvanizing process,
as mentioned in section 2.2. A Glow Discharge Optical Emission Spectrometry (GDOES) was used to
analyze the hydrogen distribution through the depth of the steel sample. Figure 5.3 illustrates the
distribution of hydrogen (red), zinc (blue) and substrate steel (black) from the sample surface to a depth
of 30 μm after electro-galvanizing. Between the sample preparation and GDOES measurement the
sample was stored in liquid nitrogen. It can be seen in Figure 5.3 that after galvanizing, the thickness
of the Zn-layer displays as a function of the depth. An interface between Zn-layer and the substrate is
observed due to the sputtering effect during the deposition of zinc ions. In this interface the hydrogen
concentration is high and stays at a low concentration in both substrate and Zn-layer. It is assumed that
once the electrochemical reaction starts, the Zn deposition is associated with hydrogen uptake. Zinc can
be a barrier to protect the substrate from further hydrogen degradation [PAA11]. Once a certain Zn-
coating forms, the hydrogen uptake subsided.
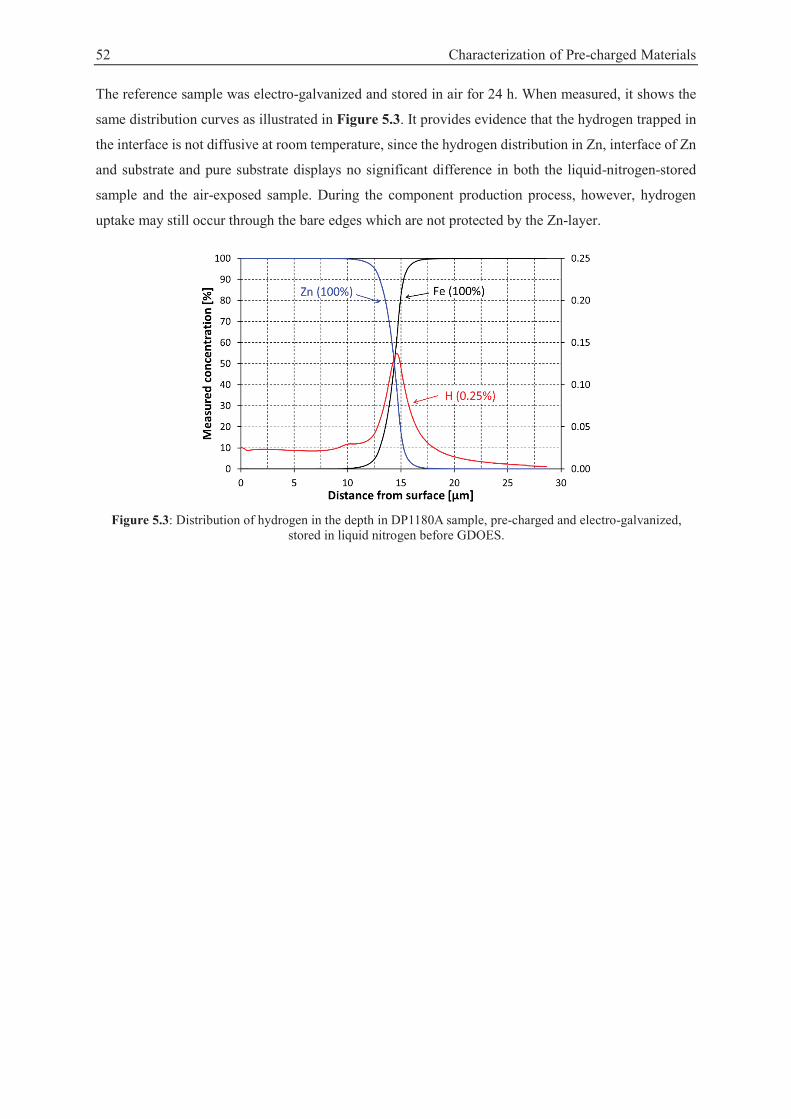
52 Characterization of Pre-charged Materials
The reference sample was electro-galvanized and stored in air for 24 h. When measured, it shows the
same distribution curves as illustrated in Figure 5.3. It provides evidence that the hydrogen trapped in
the interface is not diffusive at room temperature, since the hydrogen distribution in Zn, interface of Zn
and substrate and pure substrate displays no significant difference in both the liquid-nitrogen-stored
sample and the air-exposed sample. During the component production process, however, hydrogen
uptake may still occur through the bare edges which are not protected by the Zn-layer.
Figure 5.3: Distribution of hydrogen in the depth in DP1180A sample, pre-charged and electro-galvanized,
stored in liquid nitrogen before GDOES.
53
6 Effects of Hydrogen on Mechanical Properties
6.1 Results from Slow Strain Rate Test (SSRT)
Degradation of property
In the SSRT, the materials with different contents of hydrogen were strained in room atmosphere, at a
rate of 10-5 s-1 until failure. Figure 6.1 displays the selected engineering stress-strain curves on the
uncharged and pre-charged samples. The enriched hydrogen in the steels leads to earlier failure in the
tensile process. The reduction of strains depends on the hydrogen concentration. In CP1180 and MS-
W1180 steels, the degradations of mechanical properties are moderate compared to those in DP and
TBF steels with 1180 MPa tensile strength. The hydrogen-induced degradation of TBF1180 steels is
more obvious compared to other steel grades. Concerning the 980 MPa steels, in CP980 and DP980 the
influence of hydrogen on the stress-strain curves is not significant. In contrast, TBF980 degrades more
obviously than CP- and DP980 steels once the samples are pre-charged with hydrogen.
(a) CP1180
(b) DP1180A
(c) DP1180B
(d) TBF1180A
54 Effects of Hydrogen on Mechanical Properties
(e) TBF1180B
(f) TBF1180C
(g) MS-W1180
(h) CP980
(i) DP980
(j) TBF980
Figure 6.1: Engineering stress-strain curves of uncharged and pre-charged materials, at strain rate of 10-5 s-1.
To evaluate the susceptibility to HE, the percentage loss of mechanical property after hydrogen charging
was calculated from the equation (6-1):
(6-1)
where M represents the studied mechanical parameter (Rp0.2, Rm, Au and Af) of uncharged material and
MH indicates the same parameter of the charged material. A higher value of loss of property indicates
that the material is more susceptive to HE. A negative value of loss of property signifies that the property
is intensified due to increasing H contents. According to the hydrogen calibration curves as shown in
Figure 5.2, the degradations of strength of each material with different hydrogen concentrations are t,
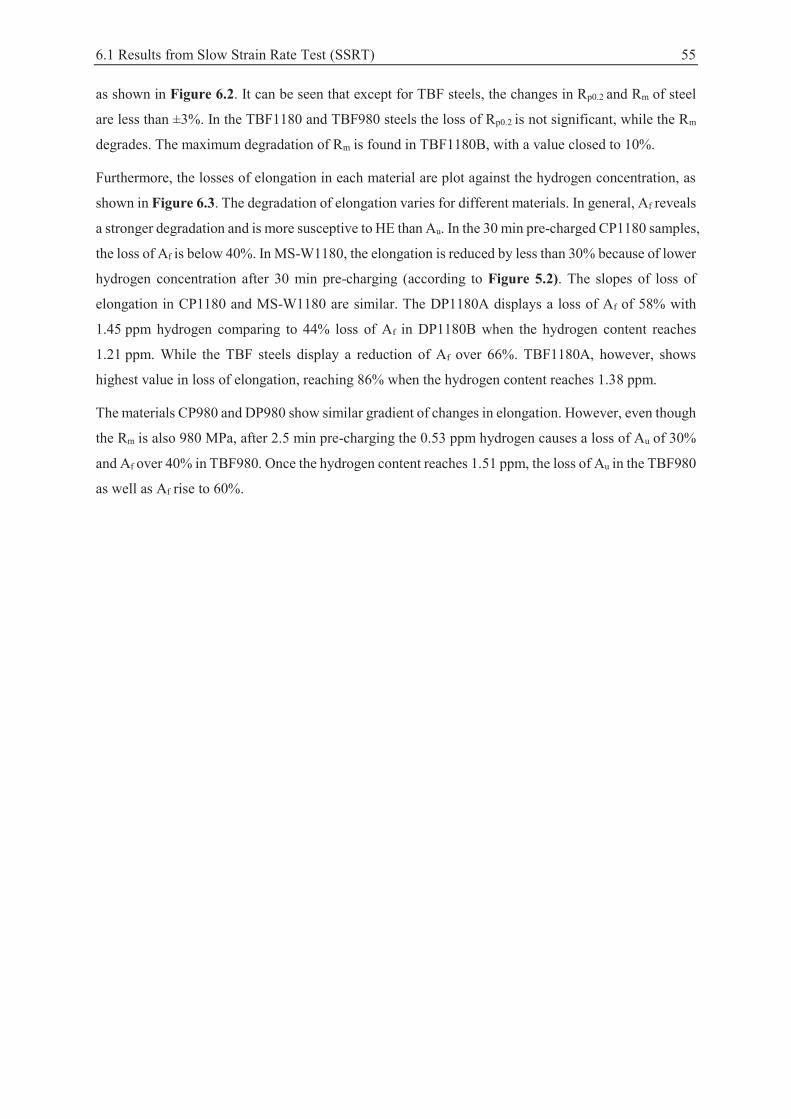
6.1 Results from Slow Strain Rate Test (SSRT) 55
as shown in Figure 6.2. It can be seen that except for TBF steels, the changes in Rp0.2 and Rm of steel
are less than ±3%. In the TBF1180 and TBF980 steels the loss of Rp0.2 is not significant, while the Rm
degrades. The maximum degradation of Rm is found in TBF1180B, with a value closed to 10%.
Furthermore, the losses of elongation in each material are plot against the hydrogen concentration, as
shown in Figure 6.3. The degradation of elongation varies for different materials. In general, Af reveals
a stronger degradation and is more susceptive to HE than Au. In the 30 min pre-charged CP1180 samples,
the loss of Af is below 40%. In MS-W1180, the elongation is reduced by less than 30% because of lower
hydrogen concentration after 30 min pre-charging (according to Figure 5.2). The slopes of loss of
elongation in CP1180 and MS-W1180 are similar. The DP1180A displays a loss of Af of 58% with
1.45 ppm hydrogen comparing to 44% loss of Af in DP1180B when the hydrogen content reaches
1.21 ppm. While the TBF steels display a reduction of Af over 66%. TBF1180A, however, shows
highest value in loss of elongation, reaching 86% when the hydrogen content reaches 1.38 ppm.
The materials CP980 and DP980 show similar gradient of changes in elongation. However, even though
the Rm is also 980 MPa, after 2.5 min pre-charging the 0.53 ppm hydrogen causes a loss of Au of 30%
and Af over 40% in TBF980. Once the hydrogen content reaches 1.51 ppm, the loss of Au in the TBF980
as well as Af rise to 60%.
56 Effects of Hydrogen on Mechanical Properties
(a-1) (a-2)
(b-1) (b-2)
(c-1) (c-2)
(d-1) (d-2)
Figure 6.2: The loss of strength with increasing hydrogen content after SSRT, at strain rate of 10-5 s-1.
6.1 Results from Slow Strain Rate Test (SSRT) 57
(a-1) (a-2)
(b-1) (b-2)
(c-1) (c-2)
(d-1) (d-2)
Figure 6.3: The loss of elongation with increasing hydrogen content after SSRT, at a strain rate of 10-5 s-1.
58 Effects of Hydrogen on Mechanical Properties
Fractography of SSRT samples
Fractography is vital in understanding the fracture mode of uncharged and pre-charged samples during
the SSRT. Compared to the uncharged sample, fracture surfaces of pre-charged samples displays two
different zones. The area located at the edges is named Surface Zone (SZ) and the area inside is called
Inside Zone (IZ), as shown in Figure 6.4. The microscopic fracture surfaces of the fractured samples
are shown in Figure 6.5 to Figure 6.8.
(a) uncharged (b) pre-charged
Figure 6.4: Macroscopic fracture surfaces of TBF1180A after SSRT: (a) uncharged and (b) 30 min pre-charged.
The fracture surfaces from CP1180 uncharged sample show overall ductile fracture mode with fine
dimples with the size of 1-2 μm or below, as displayed in Figure 6.5. After 30 min pre-charging, the
SZ on the fracture surface displays quasi-cleavage fracture mode with a small amount of dimples. The
IZ fracture surface still exhibits ductile fracture behavior. The size of the dimples in the IZ of pre-
charged samples is not larger than that in the uncharged sample.
Figure 6.6 shows the fracture surfaces from DP1180A after SSRT. The dimples on the fracture surfaces
from uncharged samples have an average size of 4-5 μm. The fracture surfaces in the SZ of pre-charged
DP1180A exhibit brittle fracture in transgranular mode with small amount of brittle facets. The IZ
fracture surfaces displays ductile fracture similar to the uncharged ones.
In the uncharged sample and the IZ of the pre-charged sample from TBF1180A, fine dimples with 1 to
2 μm diameters are observed (Figure 6.7 (a)). In the SZ of samples after pre-charging, the fracture
surfaces displays intergranular fracture with substantial amounts of brittle facets, as shown in Figure
6.7 (b). The IZ of fracture surface displays ductile fracture featured with dimples (Figure 6.7 (c)).
Figure 6.8 the fracture surfaces of the uncharged MS-W1180 reveal a great amount of substantial brittle
facets, resulting from an overload of plastic strain and brittle martensite phase. However, after pre-
charging, the SZ of fracture surfaces reveals quasi-cleavage fracture mode. The tearing under load
indicates that the hydrogen embrittled the material.
In general, except for MS-W1180, other uncharged materials show ductile fracture on the fracture
surfaces after SSRT. After H-charging, fracture surfaces in the SZ display quasi-cleavage fracture mode,
6.1 Results from Slow Strain Rate Test (SSRT) 59
however, dimples can be found in the IZ, indicating that the hydrogen-induced cracking initiates from
the edge location. In the materials CP1180 and MS-W1180, transgranular fracture is the major fracture
mode when the crack initiates. In DP1180A, the brittle facets are found in the SZ, mixed with the
transgranular fracture, which is assumed as the accumulation of hydrogen at the grain boundaries. In
the case of TBF1180A, intergranular fracture is dominant, where the ESSRT displays the lowest value in
these four materials.
Generally, in the SSRT the strength of the materials degrades moderately compared to the degradation
of elongation, which is accordant to the results from other researchers [GUO12]. The Embrittlement
Index (EISSRT) is defined by using the loss of Af, as shown in equation (6-2):
EISSRT= (6-2)
The material with a higher strength displays a lower EISSRT, indicating a higher susceptibility to HE. It
should be noted that the gradient of change in EISSRT is not constant, but varies when the hydrogen
content increases. Table 6.1 summarizes the EISSRT of different materials when the hydrogen content is
in the range of 1.2–1.5 ppm. On the basis of EISSRT the HE-Susceptibilities of the investigated materials
are ranked in the following order:
For 1180 MPa steels:
TBF1180A > TBF1180B > TBF1180C > DP1180A > DP1180B > CP1180 > MS-W1180
And for 980 MPa steels:
TBF980 > DP980 > CP980
Table 6.1: EISSRT of investigated materials in the SSRT, when the hydrogen content is in range of 1.2-1.5 ppm.
Group Material H content [ppm] EISSRT [%]
1180 MPa steels
CP1180 1.30 68.9
DP1180A 1.45 41.9
DP1180B 1.21 56.4
TBF1180A 1.38 14.0
TBF1180B 1.45 26.1
TBF1180C 1.0* 33.7
MS-W1180 1.25 75.1
980 MPa steels
CP980 1.29 78.7
DP980 1.38 70.6
TBF980 1.51 35.8 * In TBF1180C, the hydrogen content can reach maximum 1 ppm, after 30 min pre-charging.
60 Effects of Hydrogen on Mechanical Properties
(a) uncharged (b) pre-charged, SZ
(c) pre-charged, IZ
Figure 6.5: Micrographs of fracture surface from CP1180 after SSRT: (a) uncharged, (b) SZ of 30 min pre-charged and (c) IZ of 30 min pre-charged.
(a) uncharged (b) pre-charged, SZ
(c) pre-charged, IZ
Figure 6.6: Micrographs of fracture surface from DP1180A after SSRT: (a) uncharged, (b) SZ of 30 min pre-charged and (c) IZ of 30 min pre-charged.
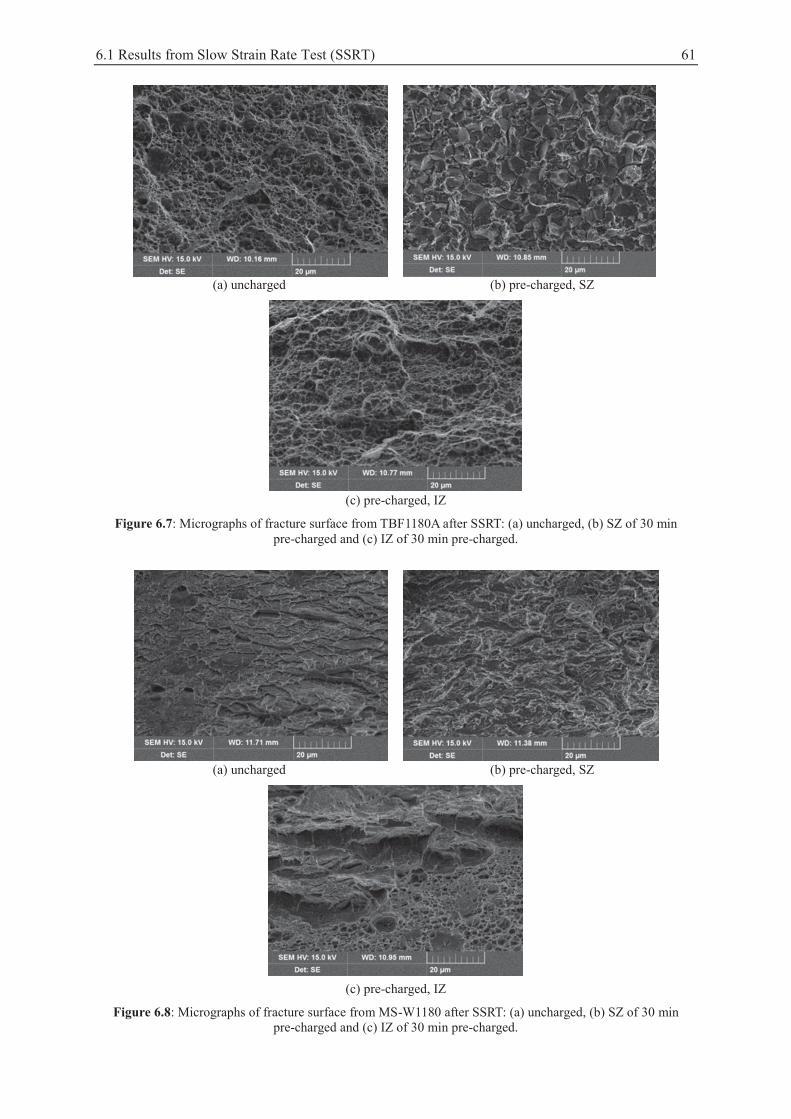
6.1 Results from Slow Strain Rate Test (SSRT) 61
(a) uncharged (b) pre-charged, SZ
(c) pre-charged, IZ
Figure 6.7: Micrographs of fracture surface from TBF1180A after SSRT: (a) uncharged, (b) SZ of 30 min pre-charged and (c) IZ of 30 min pre-charged.
(a) uncharged (b) pre-charged, SZ
(c) pre-charged, IZ
Figure 6.8: Micrographs of fracture surface from MS-W1180 after SSRT: (a) uncharged, (b) SZ of 30 min pre-charged and (c) IZ of 30 min pre-charged.
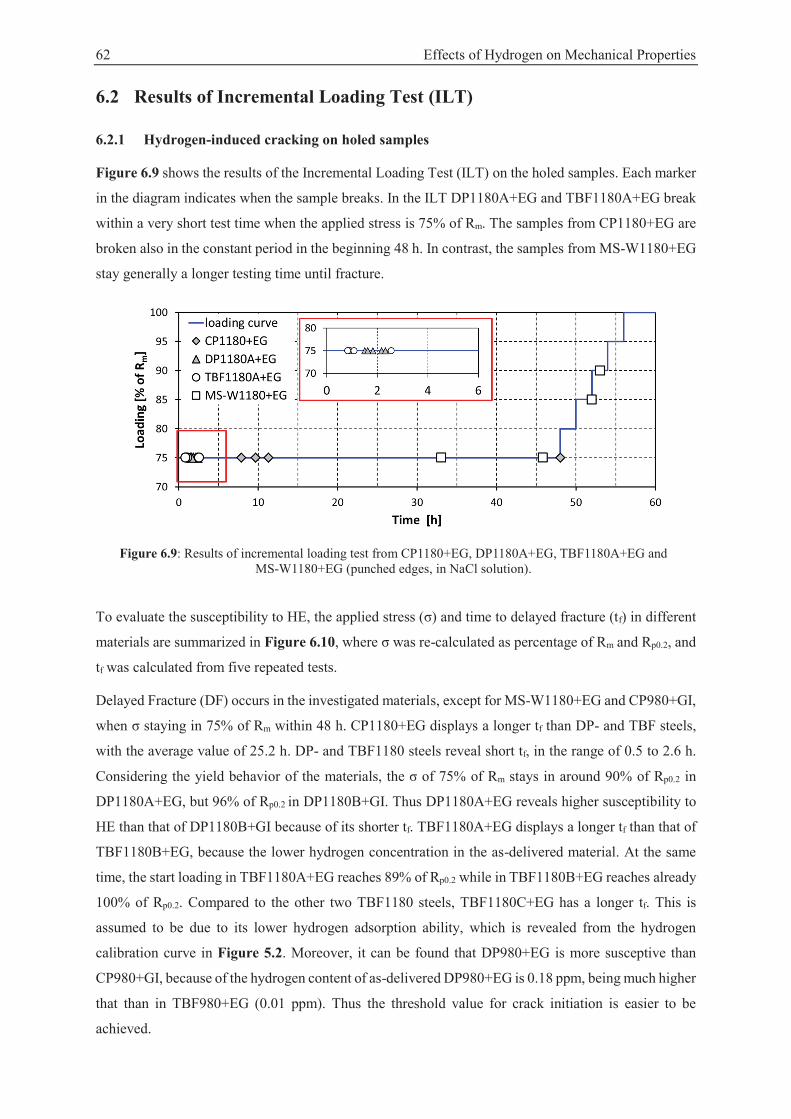
62 Effects of Hydrogen on Mechanical Properties
6.2 Results of Incremental Loading Test (ILT)
6.2.1 Hydrogen-induced cracking on holed samples
Figure 6.9 shows the results of the Incremental Loading Test (ILT) on the holed samples. Each marker
in the diagram indicates when the sample breaks. In the ILT DP1180A+EG and TBF1180A+EG break
within a very short test time when the applied stress is 75% of Rm. The samples from CP1180+EG are
broken also in the constant period in the beginning 48 h. In contrast, the samples from MS-W1180+EG
stay generally a longer testing time until fracture.
Figure 6.9: Results of incremental loading test from CP1180+EG, DP1180A+EG, TBF1180A+EG and
MS-W1180+EG (punched edges, in NaCl solution).
To evaluate the susceptibility to HE, the applied stress (σ) and time to delayed fracture (tf) in different
materials are summarized in Figure 6.10, where σ was re-calculated as percentage of Rm and Rp0.2, and
tf was calculated from five repeated tests.
Delayed Fracture (DF) occurs in the investigated materials, except for MS-W1180+EG and CP980+GI,
when σ staying in 75% of Rm within 48 h. CP1180+EG displays a longer tf than DP- and TBF steels,
with the average value of 25.2 h. DP- and TBF1180 steels reveal short tf, in the range of 0.5 to 2.6 h.
Considering the yield behavior of the materials, the σ of 75% of Rm stays in around 90% of Rp0.2 in
DP1180A+EG, but 96% of Rp0.2 in DP1180B+GI. Thus DP1180A+EG reveals higher susceptibility to
HE than that of DP1180B+GI because of its shorter tf. TBF1180A+EG displays a longer tf than that of
TBF1180B+EG, because the lower hydrogen concentration in the as-delivered material. At the same
time, the start loading in TBF1180A+EG reaches 89% of Rp0.2 while in TBF1180B+EG reaches already
100% of Rp0.2. Compared to the other two TBF1180 steels, TBF1180C+EG has a longer tf. This is
assumed to be due to its lower hydrogen adsorption ability, which is revealed from the hydrogen
calibration curve in Figure 5.2. Moreover, it can be found that DP980+EG is more susceptive than
CP980+GI, because of the hydrogen content of as-delivered DP980+EG is 0.18 ppm, being much higher
that than in TBF980+EG (0.01 ppm). Thus the threshold value for crack initiation is easier to be
achieved.
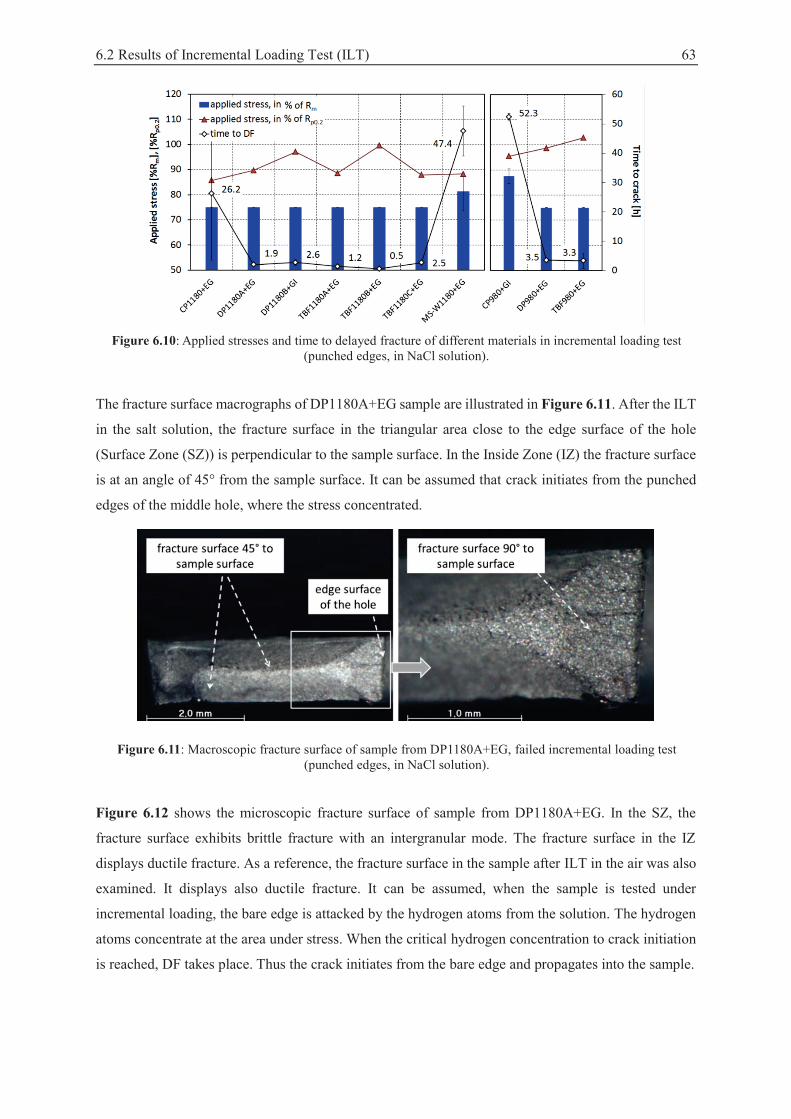
6.2 Results of Incremental Loading Test (ILT) 63
Figure 6.10: Applied stresses and time to delayed fracture of different materials in incremental loading test
(punched edges, in NaCl solution).
The fracture surface macrographs of DP1180A+EG sample are illustrated in Figure 6.11. After the ILT
in the salt solution, the fracture surface in the triangular area close to the edge surface of the hole
(Surface Zone (SZ)) is perpendicular to the sample surface. In the Inside Zone (IZ) the fracture surface
is at an angle of 45° from the sample surface. It can be assumed that crack initiates from the punched
edges of the middle hole, where the stress concentrated.
Figure 6.11: Macroscopic fracture surface of sample from DP1180A+EG, failed incremental loading test (punched edges, in NaCl solution).
Figure 6.12 shows the microscopic fracture surface of sample from DP1180A+EG. In the SZ, the
fracture surface exhibits brittle fracture with an intergranular mode. The fracture surface in the IZ
displays ductile fracture. As a reference, the fracture surface in the sample after ILT in the air was also
examined. It displays also ductile fracture. It can be assumed, when the sample is tested under
incremental loading, the bare edge is attacked by the hydrogen atoms from the solution. The hydrogen
atoms concentrate at the area under stress. When the critical hydrogen concentration to crack initiation
is reached, DF takes place. Thus the crack initiates from the bare edge and propagates into the sample.
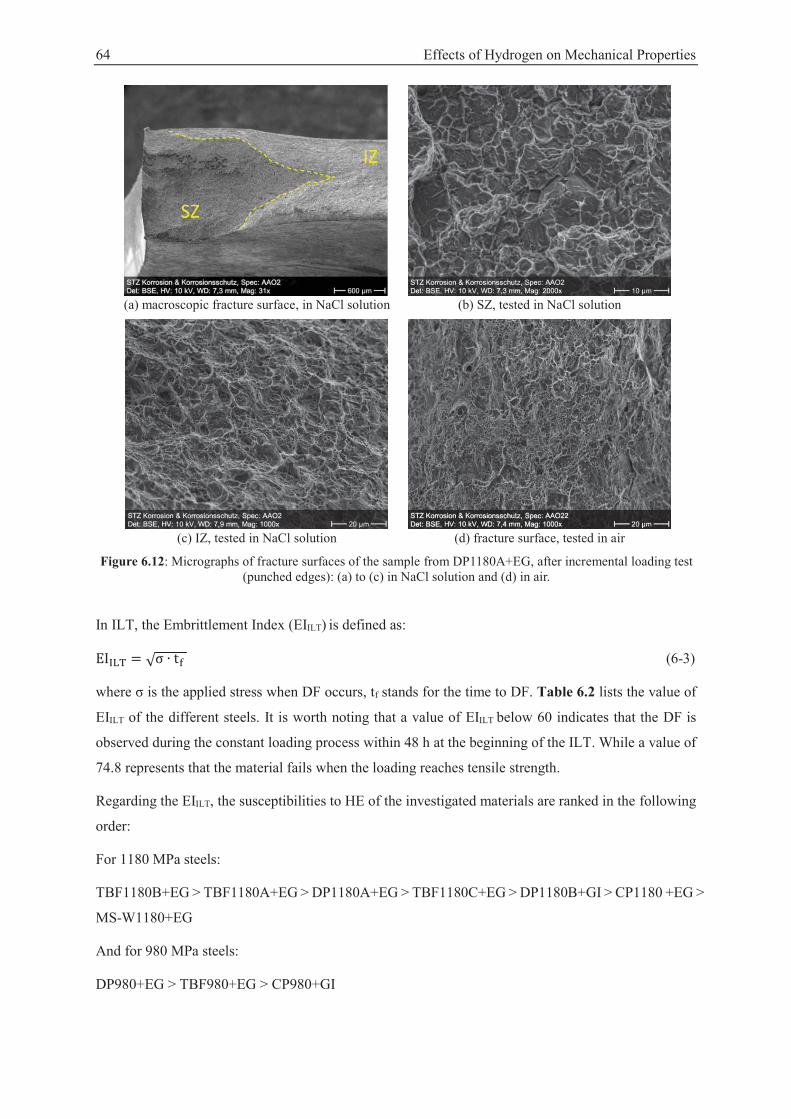
64 Effects of Hydrogen on Mechanical Properties
(a) macroscopic fracture surface, in NaCl solution
(b) SZ, tested in NaCl solution
(c) IZ, tested in NaCl solution
(d) fracture surface, tested in air
Figure 6.12: Micrographs of fracture surfaces of the sample from DP1180A+EG, after incremental loading test (punched edges): (a) to (c) in NaCl solution and (d) in air.
In ILT, the Embrittlement Index (EIILT) is defined as:
(6-3)
where σ is the applied stress when DF occurs, tf stands for the time to DF. Table 6.2 lists the value of
EIILT of the different steels. It is worth noting that a value of EIILT below 60 indicates that the DF is
observed during the constant loading process within 48 h at the beginning of the ILT. While a value of
74.8 represents that the material fails when the loading reaches tensile strength.
Regarding the EIILT, the susceptibilities to HE of the investigated materials are ranked in the following
order:
For 1180 MPa steels:
TBF1180B+EG > TBF1180A+EG > DP1180A+EG > TBF1180C+EG > DP1180B+GI > CP1180 +EG >
MS-W1180+EG
And for 980 MPa steels:
DP980+EG > TBF980+EG > CP980+GI
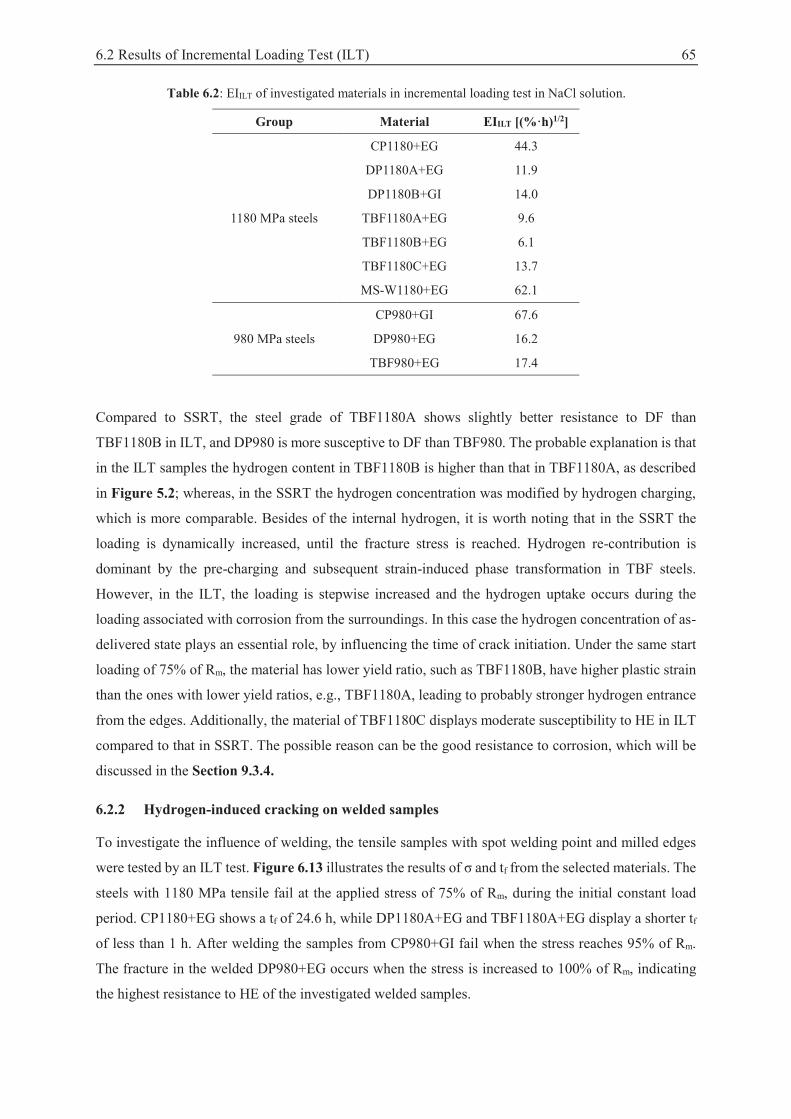
6.2 Results of Incremental Loading Test (ILT) 65
Table 6.2: EIILT of investigated materials in incremental loading test in NaCl solution.
Group Material EIILT [(%·h)1/2]
1180 MPa steels
CP1180+EG 44.3
DP1180A+EG 11.9
DP1180B+GI 14.0
TBF1180A+EG 9.6
TBF1180B+EG 6.1
TBF1180C+EG 13.7
MS-W1180+EG 62.1
980 MPa steels
CP980+GI 67.6
DP980+EG 16.2
TBF980+EG 17.4
Compared to SSRT, the steel grade of TBF1180A shows slightly better resistance to DF than
TBF1180B in ILT, and DP980 is more susceptive to DF than TBF980. The probable explanation is that
in the ILT samples the hydrogen content in TBF1180B is higher than that in TBF1180A, as described
in Figure 5.2; whereas, in the SSRT the hydrogen concentration was modified by hydrogen charging,
which is more comparable. Besides of the internal hydrogen, it is worth noting that in the SSRT the
loading is dynamically increased, until the fracture stress is reached. Hydrogen re-contribution is
dominant by the pre-charging and subsequent strain-induced phase transformation in TBF steels.
However, in the ILT, the loading is stepwise increased and the hydrogen uptake occurs during the
loading associated with corrosion from the surroundings. In this case the hydrogen concentration of as-
delivered state plays an essential role, by influencing the time of crack initiation. Under the same start
loading of 75% of Rm, the material has lower yield ratio, such as TBF1180B, have higher plastic strain
than the ones with lower yield ratios, e.g., TBF1180A, leading to probably stronger hydrogen entrance
from the edges. Additionally, the material of TBF1180C displays moderate susceptibility to HE in ILT
compared to that in SSRT. The possible reason can be the good resistance to corrosion, which will be
discussed in the Section 9.3.4.
6.2.2 Hydrogen-induced cracking on welded samples
To investigate the influence of welding, the tensile samples with spot welding point and milled edges
were tested by an ILT test. Figure 6.13 illustrates the results of σ and tf from the selected materials. The
steels with 1180 MPa tensile fail at the applied stress of 75% of Rm, during the initial constant load
period. CP1180+EG shows a tf of 24.6 h, while DP1180A+EG and TBF1180A+EG display a shorter tf
of less than 1 h. After welding the samples from CP980+GI fail when the stress reaches 95% of Rm.
The fracture in the welded DP980+EG occurs when the stress is increased to 100% of Rm, indicating
the highest resistance to HE of the investigated welded samples.
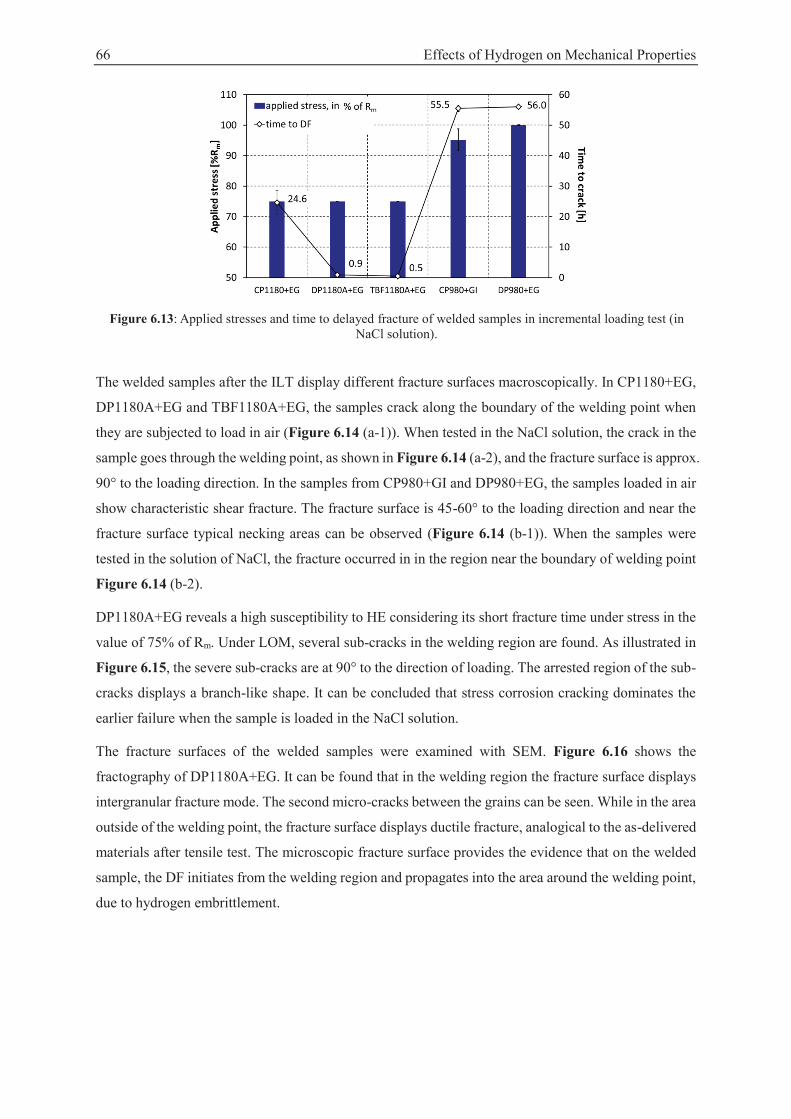
66 Effects of Hydrogen on Mechanical Properties
Figure 6.13: Applied stresses and time to delayed fracture of welded samples in incremental loading test (in
NaCl solution).
The welded samples after the ILT display different fracture surfaces macroscopically. In CP1180+EG,
DP1180A+EG and TBF1180A+EG, the samples crack along the boundary of the welding point when
they are subjected to load in air (Figure 6.14 (a-1)). When tested in the NaCl solution, the crack in the
sample goes through the welding point, as shown in Figure 6.14 (a-2), and the fracture surface is approx.
90° to the loading direction. In the samples from CP980+GI and DP980+EG, the samples loaded in air
show characteristic shear fracture. The fracture surface is 45-60° to the loading direction and near the
fracture surface typical necking areas can be observed (Figure 6.14 (b-1)). When the samples were
tested in the solution of NaCl, the fracture occurred in in the region near the boundary of welding point
Figure 6.14 (b-2).
DP1180A+EG reveals a high susceptibility to HE considering its short fracture time under stress in the
value of 75% of Rm. Under LOM, several sub-cracks in the welding region are found. As illustrated in
Figure 6.15, the severe sub-cracks are at 90° to the direction of loading. The arrested region of the sub-
cracks displays a branch-like shape. It can be concluded that stress corrosion cracking dominates the
earlier failure when the sample is loaded in the NaCl solution.
The fracture surfaces of the welded samples were examined with SEM. Figure 6.16 shows the
fractography of DP1180A+EG. It can be found that in the welding region the fracture surface displays
intergranular fracture mode. The second micro-cracks between the grains can be seen. While in the area
outside of the welding point, the fracture surface displays ductile fracture, analogical to the as-delivered
materials after tensile test. The microscopic fracture surface provides the evidence that on the welded
sample, the DF initiates from the welding region and propagates into the area around the welding point,
due to hydrogen embrittlement.
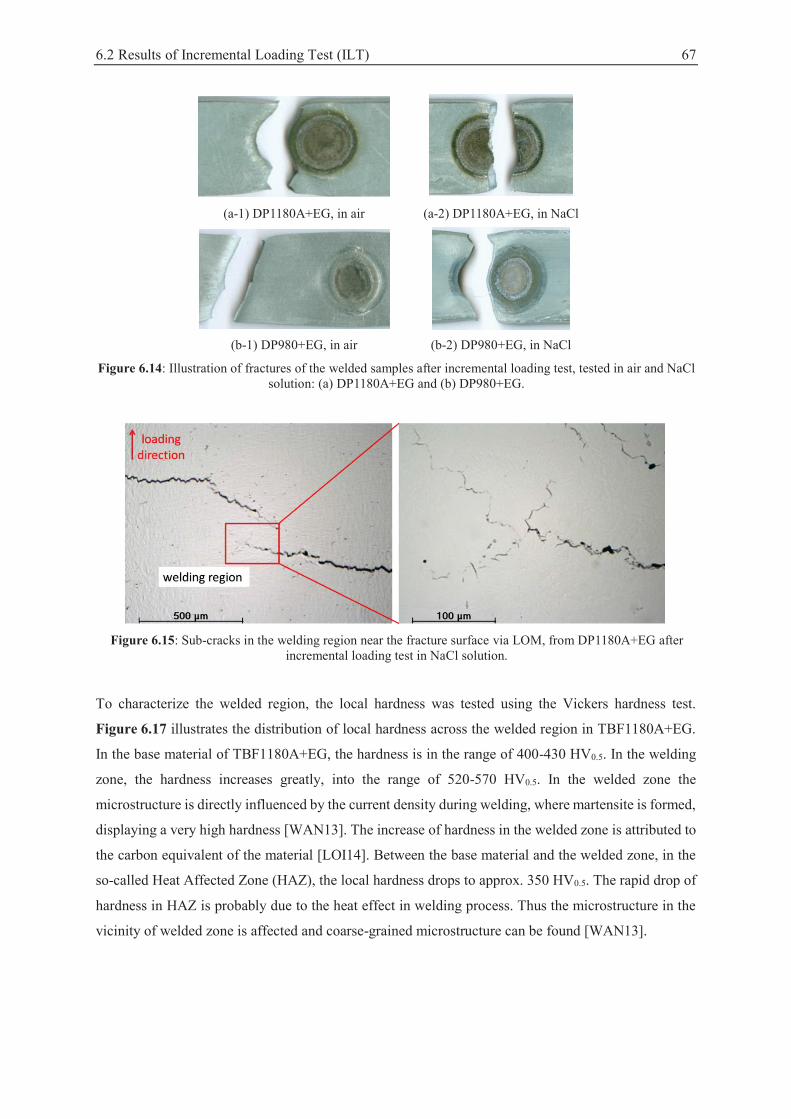
6.2 Results of Incremental Loading Test (ILT) 67
(a-1) DP1180A+EG, in air (a-2) DP1180A+EG, in NaCl
(b-1) DP980+EG, in air (b-2) DP980+EG, in NaCl
Figure 6.14: Illustration of fractures of the welded samples after incremental loading test, tested in air and NaCl solution: (a) DP1180A+EG and (b) DP980+EG.
Figure 6.15: Sub-cracks in the welding region near the fracture surface via LOM, from DP1180A+EG after
incremental loading test in NaCl solution.
To characterize the welded region, the local hardness was tested using the Vickers hardness test.
Figure 6.17 illustrates the distribution of local hardness across the welded region in TBF1180A+EG.
In the base material of TBF1180A+EG, the hardness is in the range of 400-430 HV0.5. In the welding
zone, the hardness increases greatly, into the range of 520-570 HV0.5. In the welded zone the
microstructure is directly influenced by the current density during welding, where martensite is formed,
displaying a very high hardness [WAN13]. The increase of hardness in the welded zone is attributed to
the carbon equivalent of the material [LOI14]. Between the base material and the welded zone, in the
so-called Heat Affected Zone (HAZ), the local hardness drops to approx. 350 HV0.5. The rapid drop of
hardness in HAZ is probably due to the heat effect in welding process. Thus the microstructure in the
vicinity of welded zone is affected and coarse-grained microstructure can be found [WAN13].
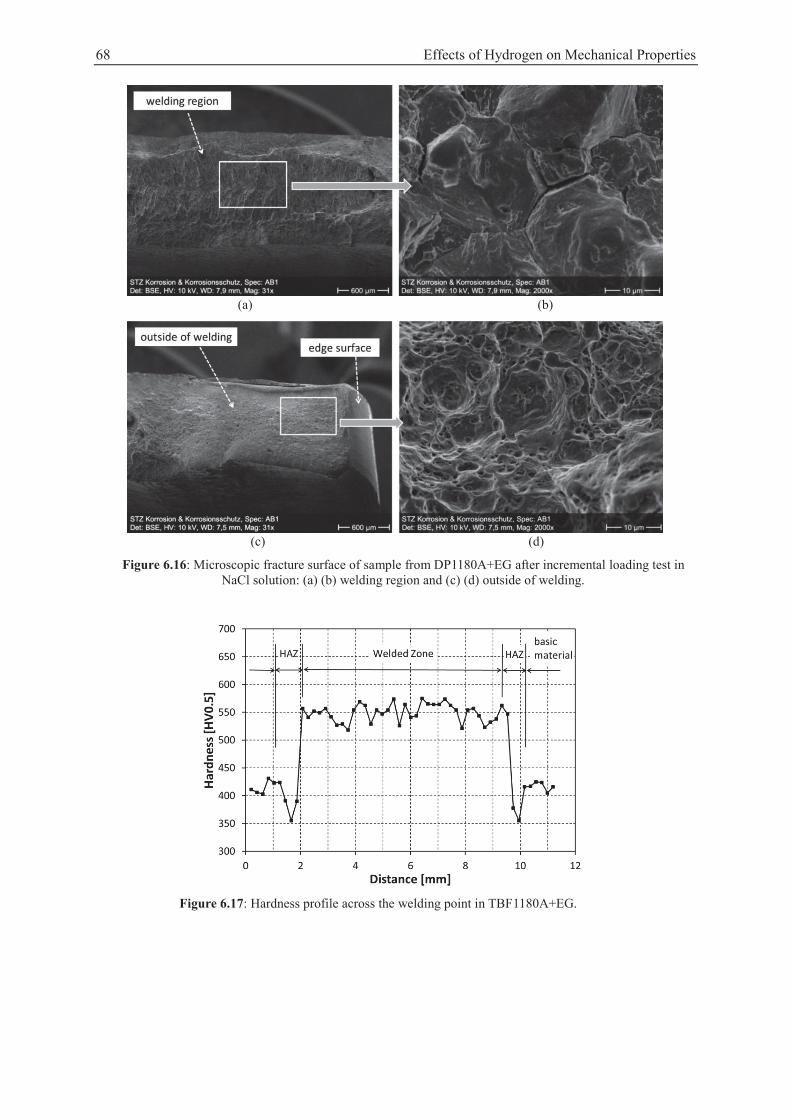
68 Effects of Hydrogen on Mechanical Properties
(a) (b)
(c) (d)
Figure 6.16: Microscopic fracture surface of sample from DP1180A+EG after incremental loading test in NaCl solution: (a) (b) welding region and (c) (d) outside of welding.
Figure 6.17: Hardness profile across the welding point in TBF1180A+EG.
6.3 Results of Constant Loading Test (CLT) 69
6.3 Results of Constant Loading Test (CLT)
In the CLT the Zn-coated samples with bare cutting edges were immersed in salt solution and subjected
to constant stress. Figure 6.18 illustrates the time to fracture (tf) of the investigated materials, in
minimum value of time to fracture (gray) and the average value of time to fracture from 5 repeat tests
(blue). Because the bare edges had been cut by punching, the tf in the CLT reveals the resistance to HE
combined with material edge sensitivity.
When the applied stress was Rp0.2 (when Rp0.2/Rm<0.9) or 80% Rm (when Rp0.2/Rm>0.9), all 1180 MPa
steels fail within 96 h of testing time. CP1180+EG reveals a longer tf compared with other materials,
indicating a better resistance to HE. DP1180A and DP1180B have tf in an average value of 5.2 h and
9.4 h respectively. TBF1180A+EG and TBF1180B+EG show a short tf, while TBF1180C+EG performs
better with a tf of 8.6 h. The samples from MS-W1180+EG fail after 13.5 h testing. In the group of
980 MPa steels, DF does not occur in CP980+GI after 96 h testing, demonstrating an excellent
resistance to HE. The materials of DP980+EG and TBF980+EG fail after 6.4 h and 8.9 h respectively.
Figure 6.18: Comparison of time to fracture in constant loading test in the NaCl solution. Applied stress σ=80%
Rm (MS-W1180+EG and CP980+GI, with Rp0.2/Rm>0.9) or σ=Rp0.2 (other materials, with Rp0.2/Rm<0.9).
Generally, the result of CLT under certain stress is consistent with that of ILT. The shorter incubation
time to DF of MS-W1180 in CLT compared with that in ILT can be explained by the different loading
grades. Similar to ILT, on the fracture surface the area close to the punched edge reveals a brittle fracture
mode, as shown in Figure 6.19. In the SZ the fracture surface from CP1180+EG (Figure 6.19 (a))
reveals quasi-cleavage fracture with transgranular mode. In the sample from DP1180A+EG (Figure
6.19 (b)) and TBF1180B+EG (Figure 6.19 (c)) the brittle facets and second cracks can be observed.
The fracture surface of MS-W1180+EG in Figure 6.19 (d) demonstrates also transgranular fracture and
micro-cracks, characterized as the hydrogen-induced fracture. DF initiates at the bare Zn-Fe-Zn edges
before the maximum tensile stress had been reached, because of hydrogen uptake in the aqueous
surroundings (as mentioned in section 2.3.1).
70 Effects of Hydrogen on Mechanical Properties
(a) CP1180+EG
(b) DP1180A+EG
(c) TBF1180B+EG (d) MS-W1180+EG
Figure 6.19: Fracture surfaces in surface zone after constant loading test (in 3.5%NaCl). Applied stress σ=80%Rm (MS-W1180+EG with Rp0.2/R m>0.9) or σ=Rp0.2 (other materials, with Rp0.2/Rm<0.9).
For industrial production it is important to learn the critical loading for the material so as to ensure
suitable applications. To identify the theoretical allowed applied loading, each material was additionally
tested in salt solution under different loads. The maximum allowed stress (σmax) was defined when all
three repeat tests run 96 h without showing DF. Figure 6.20 illustrates the σmax for the investigated
materials, expressed as in percent of Rm.
Figure 6.20: Maximum allowed applied stress of the investigated materials in constant loading tests in NaCl
solution.
6.4 Results of U-bending tests 71
The σmax indicates the HE-susceptibility of galvanized materials with punched edges, limiting further
application. The Embrittlement Index in CLT (EICLI) can be expressed by σmax:
EICLT= (6-4)
Table 6.3 lists the EICLI of the various materials. The lower value of EICLI stands for shorter time to DF,
indicating a higher susceptibility to HE. In general, the ranking of HE-susceptibility for 1180 MPa steels
is:
TBF1180A+EG / TBF1180B+EG > TBF1180C+EG / DP1180A+EG /DP1180B+GI > CP1180+EG
>MS-W1180+EG
And for 980 MPa steels: DP980+EG / TBF980+EG > CP980+GI
Table 6.3: EICLT of investigated materials in constant loading test in NaCl solution.
Group Material EICLT [% of Rm]
1180 MPa steels
CP1180+EG 65
DP1180A+EG 55
DP1180B+GI 55
TBF1180A+EG 50
TBF1180B+EG 50
TBF1180C+EG 55
MS-W1180+EG 70
980 MPa steels
CP980+GI 85
DP980+EG 65
TBF980+EG 65
6.4 Results of U-bending tests
6.4.1 U-bending on pre-charged samples
When the pre-charged and Zn-coated samples were bent via three-point-bending test and fixed by bolts,
DF can be observed after a certain incubation time, thus the Internal Hydrogen Assisted Cracking
(IHAC) occurs. Figure 6.21 shows exemplarily the observed normal crack initiation in the U-bend
samples. On the pre-charged samples, the crack initiates at the edges and then propagates into the
sample, perpendicular to the sample edges. The cracks from both edges can stop after some hours, but
most frequently they meet and lead to fracture.
72 Effects of Hydrogen on Mechanical Properties
(a) directly after bending (b) 1 h after bending
Figure 6.21: Crack initiation in a delayed fractured U-bend sample from TBF1180A (punched edges, 30 min pre-charged, R=15 mm): (a) directly after bending and (b) 1 h after bending.
Different materials show varying characteristics of crack initiation and propagation behaviors. Figure
6.22 describes the crack propagation in the samples from DP1180A and TBF1180A. In both materials,
the incubation period is short. The cracks in DP1180A grow rapidly, and after as long as 10 h they
propagate and meet together, thus the cracks go through the U-bend sample. In contrast, in TBF1180A,
after initiation the propagation is more moderate than that in DP1180A.
(a) DP1180A (b) TBF1180A
Figure 6.22: Crack propagation and divided propagation phases in delayed fractured U-bend samples (punched edges, 30 min pre-charged, R=15 mm): (a) DP1180A and (b) TBF1180A.
The average value of time to crack incubation (tc) for various materials is illustrated in Figure 6.23.
After 30 min pre-charging, tc of U-bend samples is obviously shorter than that of the 10 min pre-charged
samples due to the higher hydrogen concentration (Figure 5.2). In some materials such as CP steels and
MS-W1180, DF does not take place. After 10 min pre-charging, DF does not occur in DP1180A samples.
While when the pre-charging time is increased to 30 min, the DF initiates in the sample after 2 to 3 h.
DP1180B shows also a short tc in the 30 min pre-charged samples, but only 2 from 5 samples show DF
when the pre-charging time is 10 min. In the TBF steels, tc from TBF1180A and TBF1180B display a
low value. In TBF1180C tc is longer than that in TBF1180A and TBF1180B, but the range error in
TBF1180C is higher than in other TBF steels. All the TBF steels with 1180 MPa are susceptive to HE.
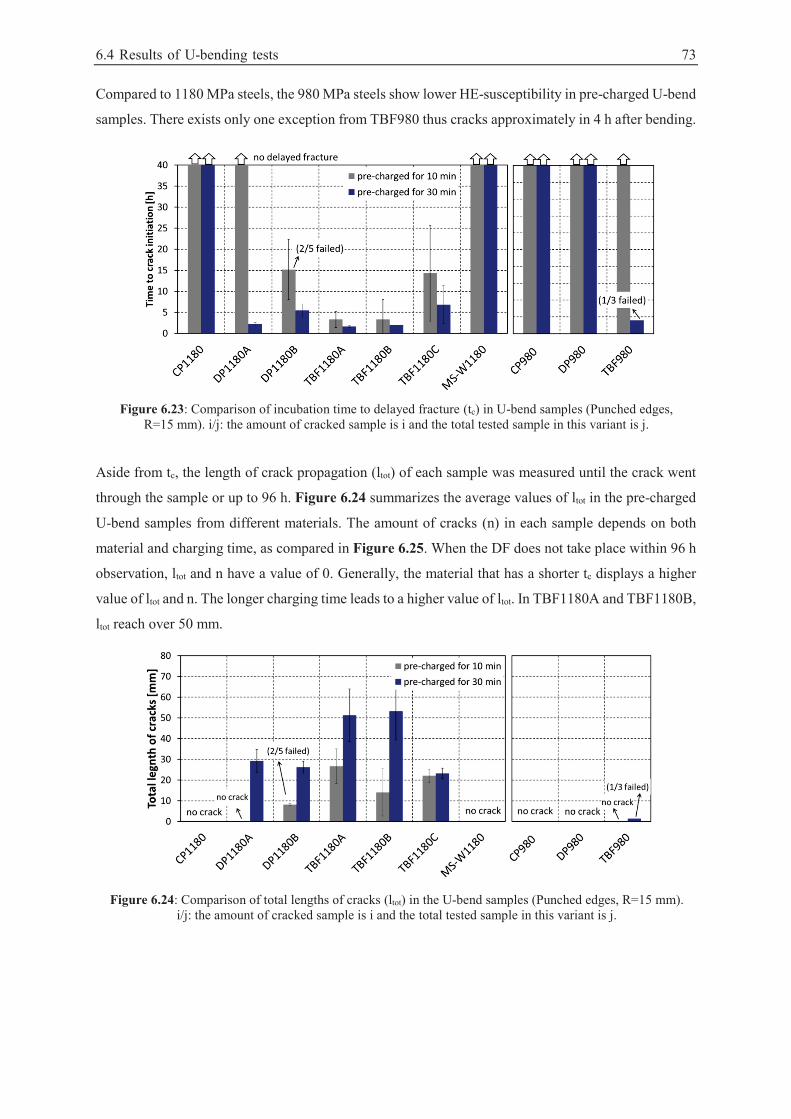
6.4 Results of U-bending tests 73
Compared to 1180 MPa steels, the 980 MPa steels show lower HE-susceptibility in pre-charged U-bend
samples. There exists only one exception from TBF980 thus cracks approximately in 4 h after bending.
Figure 6.23: Comparison of incubation time to delayed fracture (tc) in U-bend samples (Punched edges,
R=15 mm). i/j: the amount of cracked sample is i and the total tested sample in this variant is j.
Aside from tc, the length of crack propagation (ltot) of each sample was measured until the crack went
through the sample or up to 96 h. Figure 6.24 summarizes the average values of ltot in the pre-charged
U-bend samples from different materials. The amount of cracks (n) in each sample depends on both
material and charging time, as compared in Figure 6.25. When the DF does not take place within 96 h
observation, ltot and n have a value of 0. Generally, the material that has a shorter tc displays a higher
value of ltot and n. The longer charging time leads to a higher value of ltot. In TBF1180A and TBF1180B,
ltot reach over 50 mm.
Figure 6.24: Comparison of total lengths of cracks (ltot) in the U-bend samples (Punched edges, R=15 mm).
i/j: the amount of cracked sample is i and the total tested sample in this variant is j.
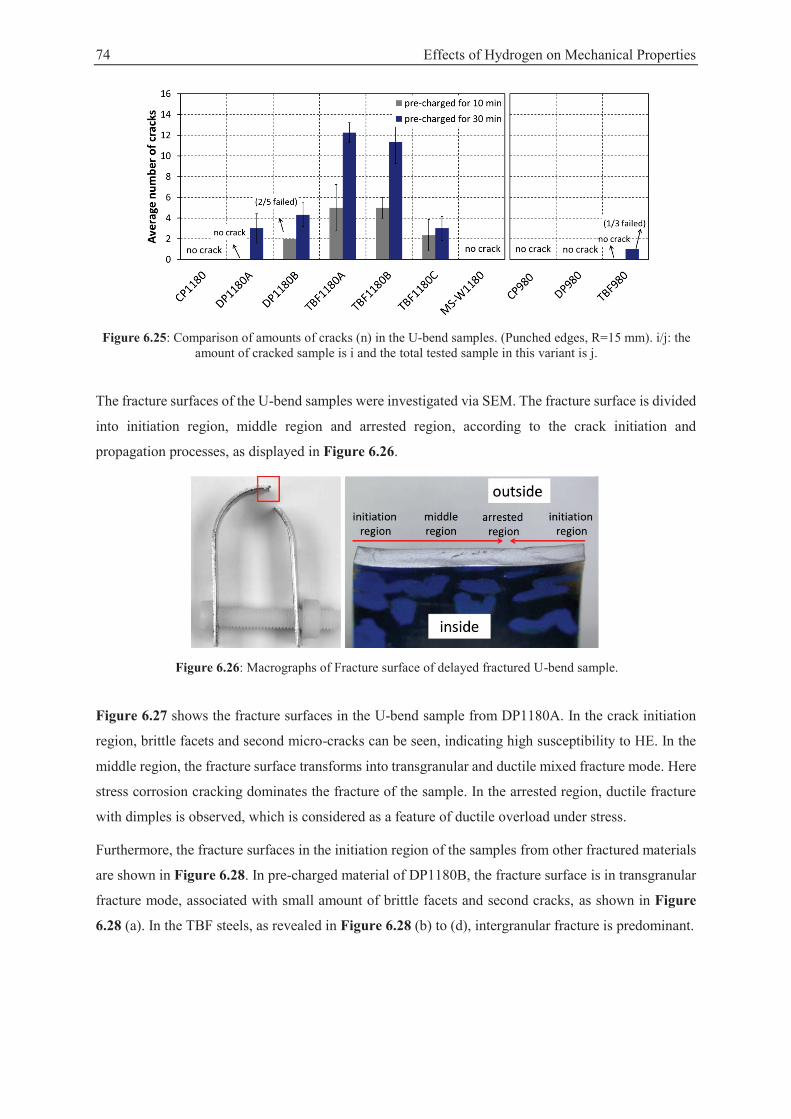
74 Effects of Hydrogen on Mechanical Properties
Figure 6.25: Comparison of amounts of cracks (n) in the U-bend samples. (Punched edges, R=15 mm). i/j: the
amount of cracked sample is i and the total tested sample in this variant is j.
The fracture surfaces of the U-bend samples were investigated via SEM. The fracture surface is divided
into initiation region, middle region and arrested region, according to the crack initiation and
propagation processes, as displayed in Figure 6.26.
Figure 6.26: Macrographs of Fracture surface of delayed fractured U-bend sample.
Figure 6.27 shows the fracture surfaces in the U-bend sample from DP1180A. In the crack initiation
region, brittle facets and second micro-cracks can be seen, indicating high susceptibility to HE. In the
middle region, the fracture surface transforms into transgranular and ductile mixed fracture mode. Here
stress corrosion cracking dominates the fracture of the sample. In the arrested region, ductile fracture
with dimples is observed, which is considered as a feature of ductile overload under stress.
Furthermore, the fracture surfaces in the initiation region of the samples from other fractured materials
are shown in Figure 6.28. In pre-charged material of DP1180B, the fracture surface is in transgranular
fracture mode, associated with small amount of brittle facets and second cracks, as shown in Figure
6.28 (a). In the TBF steels, as revealed in Figure 6.28 (b) to (d), intergranular fracture is predominant.
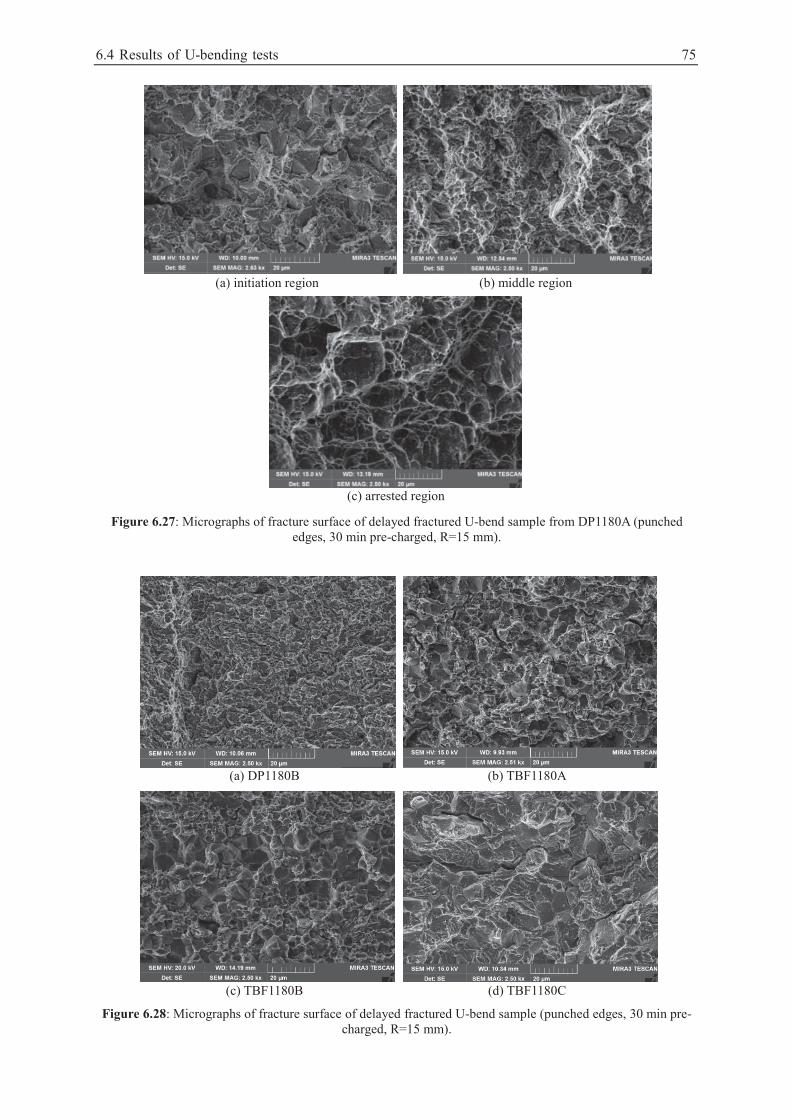
6.4 Results of U-bending tests 75
(a) initiation region (b) middle region
(c) arrested region
Figure 6.27: Micrographs of fracture surface of delayed fractured U-bend sample from DP1180A (punched edges, 30 min pre-charged, R=15 mm).
(a) DP1180B
(b) TBF1180A
(c) TBF1180B
(d) TBF1180C
Figure 6.28: Micrographs of fracture surface of delayed fractured U-bend sample (punched edges, 30 min pre-charged, R=15 mm).
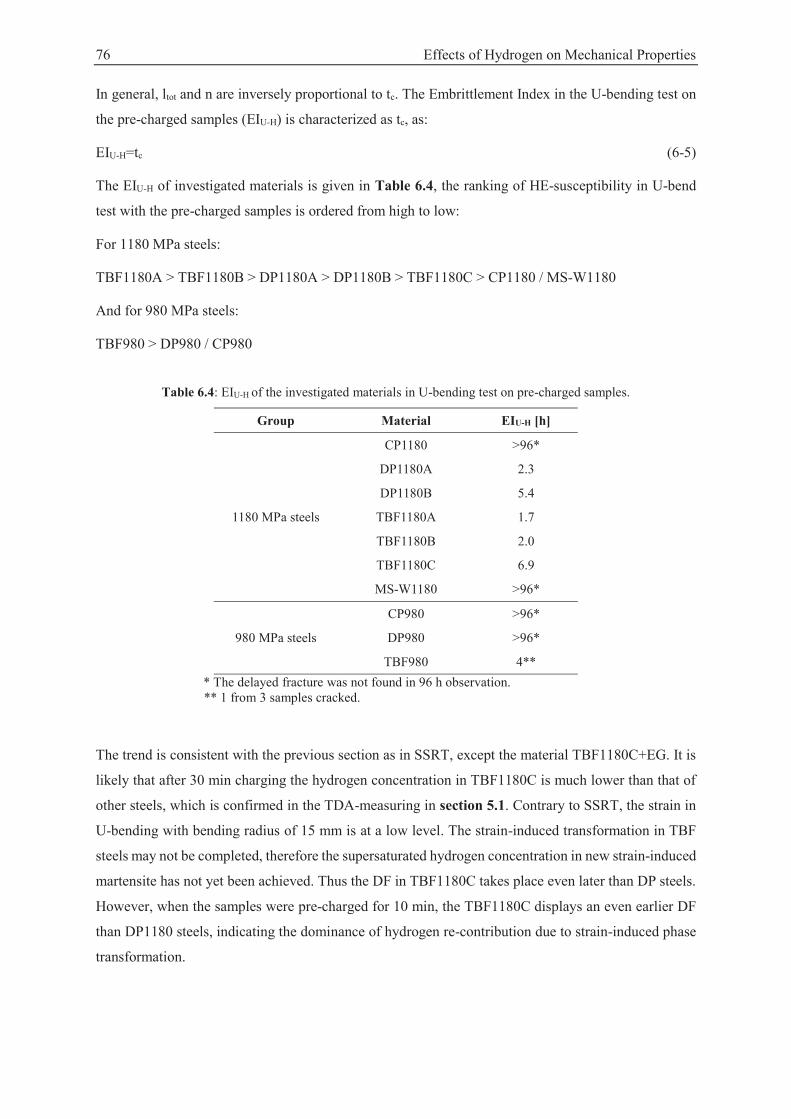
76 Effects of Hydrogen on Mechanical Properties
In general, ltot and n are inversely proportional to tc. The Embrittlement Index in the U-bending test on
the pre-charged samples (EIU-H) is characterized as tc, as:
EIU-H=tc (6-5)
The EIU-H of investigated materials is given in Table 6.4, the ranking of HE-susceptibility in U-bend
test with the pre-charged samples is ordered from high to low:
For 1180 MPa steels:
TBF1180A > TBF1180B > DP1180A > DP1180B > TBF1180C > CP1180 / MS-W1180
And for 980 MPa steels:
TBF980 > DP980 / CP980
Table 6.4: EIU-H of the investigated materials in U-bending test on pre-charged samples.
Group Material EIU-H [h]
1180 MPa steels
CP1180 >96*
DP1180A 2.3
DP1180B 5.4
TBF1180A 1.7
TBF1180B 2.0
TBF1180C 6.9
MS-W1180 >96*
980 MPa steels
CP980 >96*
DP980 >96*
TBF980 4** * The delayed fracture was not found in 96 h observation. ** 1 from 3 samples cracked.
The trend is consistent with the previous section as in SSRT, except the material TBF1180C+EG. It is
likely that after 30 min charging the hydrogen concentration in TBF1180C is much lower than that of
other steels, which is confirmed in the TDA-measuring in section 5.1. Contrary to SSRT, the strain in
U-bending with bending radius of 15 mm is at a low level. The strain-induced transformation in TBF
steels may not be completed, therefore the supersaturated hydrogen concentration in new strain-induced
martensite has not yet been achieved. Thus the DF in TBF1180C takes place even later than DP steels.
However, when the samples were pre-charged for 10 min, the TBF1180C displays an even earlier DF
than DP1180 steels, indicating the dominance of hydrogen re-contribution due to strain-induced phase
transformation.
6.4 Results of U-bending tests 77
6.4.2 U-bend samples in salt solution
Punched samples
The U-bend samples were immersed in 3.5%NaCl (pH4, adjusted with HCl) to investigate the Hydrogen
Environment Assisted Cracking (HEAC) in the materials. In the salt solution, a great amount of
hydrogen and hydroxyl ions are present. All the samples were used in the as-delivered state with original
Zn-layer, with bare Zn-Fe-Zn edges. The samples were bent with punch radius of 15 mm and fixed with
bolts. All the edges of the substrate steels were bare to the solution, which allows directly attack by
hydrogen ions and chlorine ions.
Figure 6.29 illustrates the comparison of tc of different materials, which was calculated as the average
value from five repeat tests. The edges were cut by punching. It shows that in CP1180+EG, MS-
W1180+EG, CP980+GI and DP980+EG, DF is not observed within a 96 h immersion tests. The
TBF1180 and DP1180 samples start to crack within the first 8 h after immersion.
Figure 6.29: Comparison of incubation time to delayed fracture on the U-bend samples (punched edges,
R=15 mm, in NaCl solution). i/j: the amount of cracked sample is i and the amount of total tested sample in this variant is j.
During the immersion the cracks propagate rapidly after initiation. The sample was taken out of the
solution once completely fractured. The total length of cracks (ltot) and number of cracks (n) were
measured. Figure 6.30 illustrates the ltot and n of the investigated materials. Briefly, the comparisons
of ltot and n are in accordance with the ranking by tc.
78 Effects of Hydrogen on Mechanical Properties
Figure 6.30: Comparison of total length of cracks and amount of cracks on the U-bend samples (punched
edges, R=15 mm, in NaCl solution). i/j: the amount of cracked sample is i and the amount of total tested sample in this variant is j.
The microscopic fracture surfaces of the fractured samples were characterized via SEM, as displayed
in Figure 6.31 and Figure 6.32. In DP1180A+EG, the fracture surface close to punched edge reveals a
quasi-cleavage fracture mode. Secondary cracks and brittle facets are found and are considered to be
the result of hydrogen attack from the NaCl solution. In the middle region of the fracture surface, both
intergranular fracture and shear ridges can be observed. However, in the middle of fracture surface
ductile fracture is observed, which is considered as a feature of ductile overload due to high stress. In
TBF1180A+EG, the fracture surface in the edge region reveal intergranular fracture mode, and the
brittle facets is finer than that of DP1180A+EG. This is probably due to finer grain size of
TBF1180A+EG, as analyzed by the phase maps of EBSD. In the middle region, the friction of
characteristic intergranular fracture in TBF1180A+EG is higher than that of DP1180A+EG. Indicating
that under the attack of hydrogen in HEAC, degradation of de-cohesion force of TBF1180A+EG matrix
is more severe. Furthermore, in the crack arrested region of TBF1180A+EG samples, the quasi-cleavage
fracture mode is found, which is mostly likely that stress corrosion cracking dominates the fracture.
6.4 Results of U-bending tests 79
(a) initiated region (b) middle region
(c) arrested region
Figure 6.31: Fracture surfaces of U-bend samples from DP1180A+EG (punched edges, R=15 mm, in NaCl solution).
(a) initiated region (b) middle region
(c) arrested region
Figure 6.32: Fracture surfaces of U-bend samples TBF1180A+EG (punched edges, R=15 mm, in NaCl solution).
80 Effects of Hydrogen on Mechanical Properties
The Embrittlement Index of U-bending samples in NaCl solution (EIU-NaCl) is identified as tc:
EIU-NaCl=tc (6-6)
Table 6.5 gives the values of EIU-NaCl of the investigated steel grades regarding to the punched edges.
The HE-susceptibilities of different steels are ranked as follows:
For 1180 MPa steels:
TBF1180A+EG > TBF1180B+EG > TBF1180C+EG > DP1180B+GI > DP1180A+EG > CP1180+EG
/ MS-W1180+EG
And for 980 MPa steels:
TBF980+EG > DP980+EG / CP980+GI
Table 6.5: EIU-NaCl of investigated materials in U-bending samples in the NaCl solution.
Group Material EIU-NaCl [h]
1180 MPa steels
CP1180+EG >96*
DP1180A+EG 7.6
DP1180B+GI 5.3
TBF1180A+EG 3.8
TBF1180B+EG 4.8
TBF1180C+EG 4.9
MS-W1180+EG >96*
980 MPa steels
CP980+GI >96*
DP980+EG >96*
TBF980+EG 26.1** * The delayed fracture was not found in 96 h observation. ** 3 from 5 samples cracked.
The HE-susceptibilities of the investigated material by using the U-bend samples in the NaCl solution
surroundings is similar as that by ILT and CLT. In the study of U-bend samples in the salt solution, the
crack initiation in DP1180B+GI takes place earlier than that in DP1180A+EG. It is assumed probably
due to two reasons. Firstly, the lower yield ratio of DP1180B+GI results in the higher plastic strain than
that of DP1180A+EG when the bending radius is the same. Secondly, the DP1180B+GI is hot-dip
galvanized material, thus the Zn-coating is different from the one by electro-galvanizing of
DP1180A+EG. The Zn-Fe intermetallic phase after hot-dip galvanizing is likely to reduce the corrosion
resistance of the material, therefore promotes the possibility of hydrogen pickup from the salt solution.
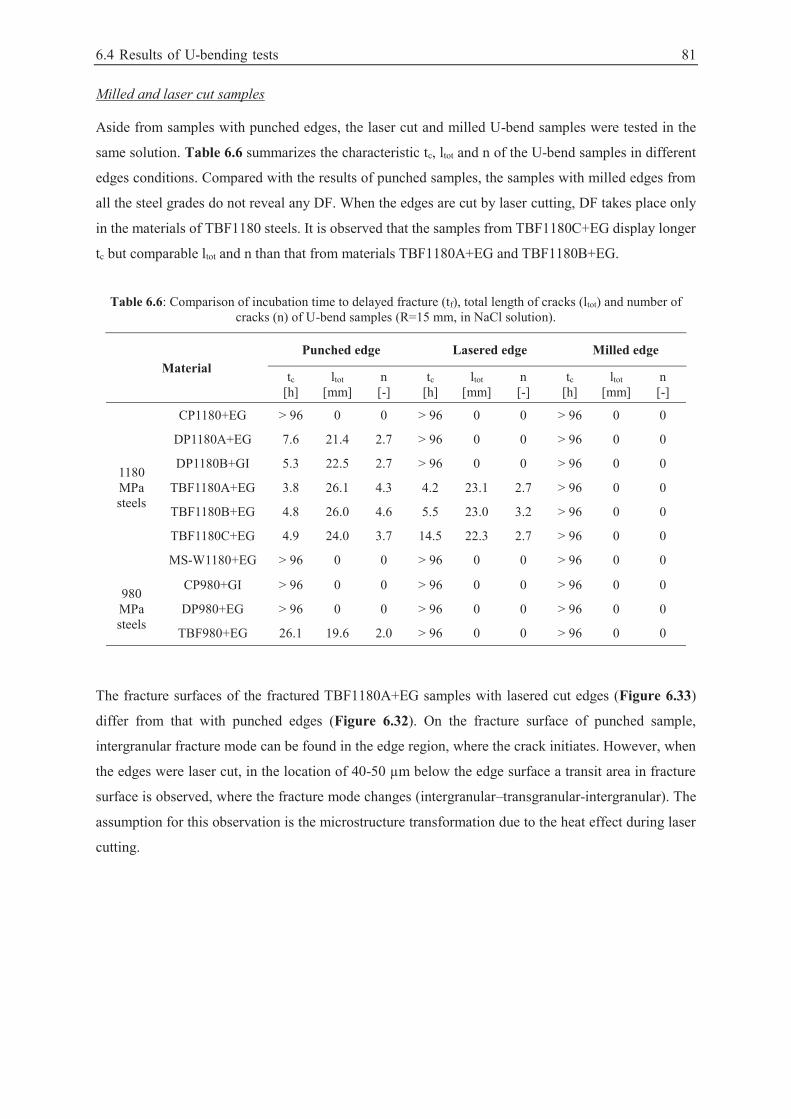
6.4 Results of U-bending tests 81
Milled and laser cut samples
Aside from samples with punched edges, the laser cut and milled U-bend samples were tested in the
same solution. Table 6.6 summarizes the characteristic tc, ltot and n of the U-bend samples in different
edges conditions. Compared with the results of punched samples, the samples with milled edges from
all the steel grades do not reveal any DF. When the edges are cut by laser cutting, DF takes place only
in the materials of TBF1180 steels. It is observed that the samples from TBF1180C+EG display longer
tc but comparable ltot and n than that from materials TBF1180A+EG and TBF1180B+EG.
Table 6.6: Comparison of incubation time to delayed fracture (tf), total length of cracks (ltot) and number of cracks (n) of U-bend samples (R=15 mm, in NaCl solution).
Material Punched edge Lasered edge Milled edge
tc [h]
ltot [mm]
n [-]
tc [h]
ltot [mm]
n [-]
tc [h]
ltot [mm]
n [-]
1180 MPa steels
CP1180+EG > 96 0 0 > 96 0 0 > 96 0 0
DP1180A+EG 7.6 21.4 2.7 > 96 0 0 > 96 0 0
DP1180B+GI 5.3 22.5 2.7 > 96 0 0 > 96 0 0
TBF1180A+EG 3.8 26.1 4.3 4.2 23.1 2.7 > 96 0 0
TBF1180B+EG 4.8 26.0 4.6 5.5 23.0 3.2 > 96 0 0
TBF1180C+EG 4.9 24.0 3.7 14.5 22.3 2.7 > 96 0 0
MS-W1180+EG > 96 0 0 > 96 0 0 > 96 0 0
980 MPa steels
CP980+GI > 96 0 0 > 96 0 0 > 96 0 0
DP980+EG > 96 0 0 > 96 0 0 > 96 0 0
TBF980+EG 26.1 19.6 2.0 > 96 0 0 > 96 0 0
The fracture surfaces of the fractured TBF1180A+EG samples with lasered cut edges (Figure 6.33)
differ from that with punched edges (Figure 6.32). On the fracture surface of punched sample,
intergranular fracture mode can be found in the edge region, where the crack initiates. However, when
the edges were laser cut, in the location of 40-50 μm below the edge surface a transit area in fracture
surface is observed, where the fracture mode changes (intergranular–transgranular-intergranular). The
assumption for this observation is the microstructure transformation due to the heat effect during laser
cutting.
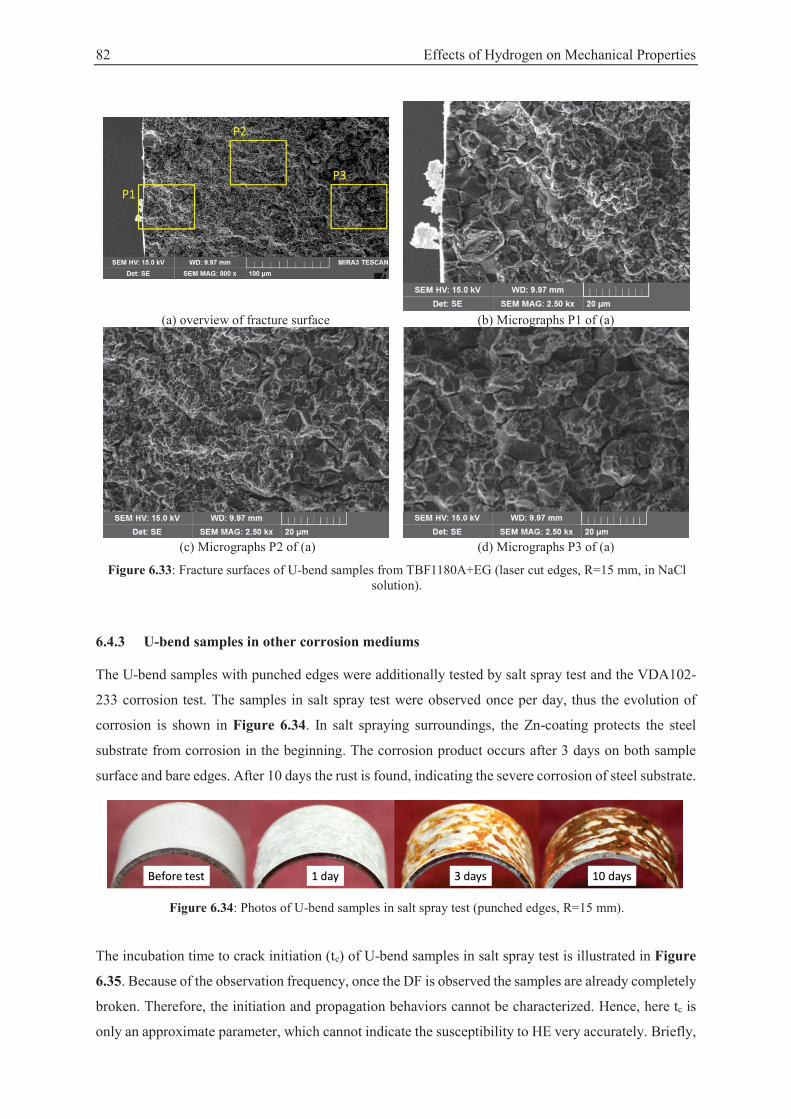
82 Effects of Hydrogen on Mechanical Properties
(a) overview of fracture surface (b) Micrographs P1 of (a)
(c) Micrographs P2 of (a) (d) Micrographs P3 of (a)
Figure 6.33: Fracture surfaces of U-bend samples from TBF1180A+EG (laser cut edges, R=15 mm, in NaCl solution).
6.4.3 U-bend samples in other corrosion mediums
The U-bend samples with punched edges were additionally tested by salt spray test and the VDA102-
233 corrosion test. The samples in salt spray test were observed once per day, thus the evolution of
corrosion is shown in Figure 6.34. In salt spraying surroundings, the Zn-coating protects the steel
substrate from corrosion in the beginning. The corrosion product occurs after 3 days on both sample
surface and bare edges. After 10 days the rust is found, indicating the severe corrosion of steel substrate.
Figure 6.34: Photos of U-bend samples in salt spray test (punched edges, R=15 mm).
The incubation time to crack initiation (tc) of U-bend samples in salt spray test is illustrated in Figure
6.35. Because of the observation frequency, once the DF is observed the samples are already completely
broken. Therefore, the initiation and propagation behaviors cannot be characterized. Hence, here tc is
only an approximate parameter, which cannot indicate the susceptibility to HE very accurately. Briefly,
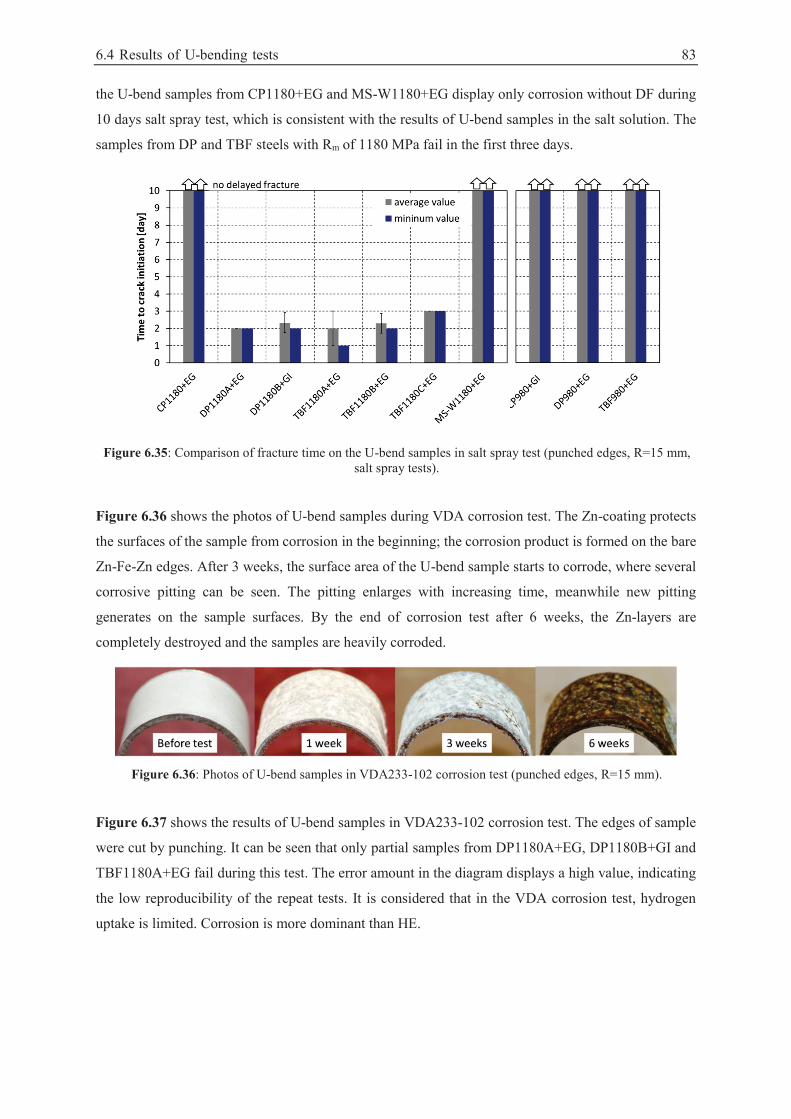
6.4 Results of U-bending tests 83
the U-bend samples from CP1180+EG and MS-W1180+EG display only corrosion without DF during
10 days salt spray test, which is consistent with the results of U-bend samples in the salt solution. The
samples from DP and TBF steels with Rm of 1180 MPa fail in the first three days.
Figure 6.35: Comparison of fracture time on the U-bend samples in salt spray test (punched edges, R=15 mm, salt spray tests).
Figure 6.36 shows the photos of U-bend samples during VDA corrosion test. The Zn-coating protects
the surfaces of the sample from corrosion in the beginning; the corrosion product is formed on the bare
Zn-Fe-Zn edges. After 3 weeks, the surface area of the U-bend sample starts to corrode, where several
corrosive pitting can be seen. The pitting enlarges with increasing time, meanwhile new pitting
generates on the sample surfaces. By the end of corrosion test after 6 weeks, the Zn-layers are
completely destroyed and the samples are heavily corroded.
Figure 6.36: Photos of U-bend samples in VDA233-102 corrosion test (punched edges, R=15 mm).
Figure 6.37 shows the results of U-bend samples in VDA233-102 corrosion test. The edges of sample
were cut by punching. It can be seen that only partial samples from DP1180A+EG, DP1180B+GI and
TBF1180A+EG fail during this test. The error amount in the diagram displays a high value, indicating
the low reproducibility of the repeat tests. It is considered that in the VDA corrosion test, hydrogen
uptake is limited. Corrosion is more dominant than HE.
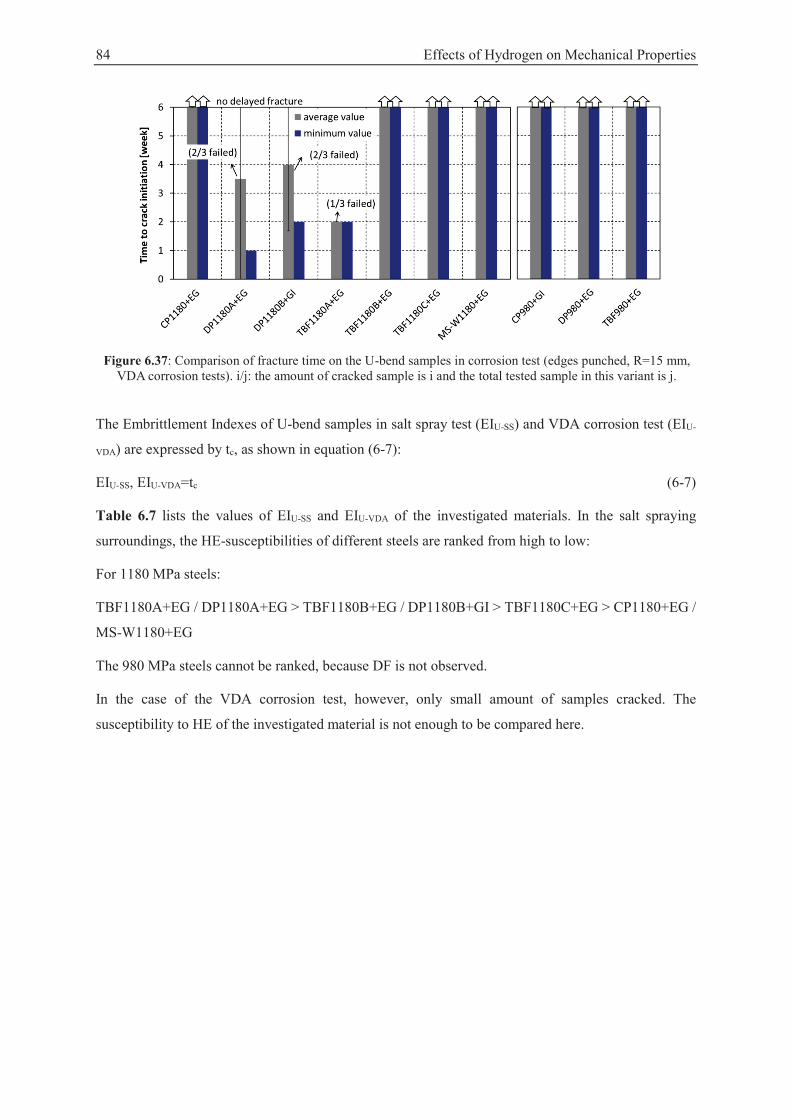
84 Effects of Hydrogen on Mechanical Properties
Figure 6.37: Comparison of fracture time on the U-bend samples in corrosion test (edges punched, R=15 mm,
VDA corrosion tests). i/j: the amount of cracked sample is i and the total tested sample in this variant is j.
The Embrittlement Indexes of U-bend samples in salt spray test (EIU-SS) and VDA corrosion test (EIU-
VDA) are expressed by tc, as shown in equation (6-7):
EIU-SS, EIU-VDA=tc (6-7)
Table 6.7 lists the values of EIU-SS and EIU-VDA of the investigated materials. In the salt spraying
surroundings, the HE-susceptibilities of different steels are ranked from high to low:
For 1180 MPa steels:
TBF1180A+EG / DP1180A+EG > TBF1180B+EG / DP1180B+GI > TBF1180C+EG > CP1180+EG /
MS-W1180+EG
The 980 MPa steels cannot be ranked, because DF is not observed.
In the case of the VDA corrosion test, however, only small amount of samples cracked. The
susceptibility to HE of the investigated material is not enough to be compared here.
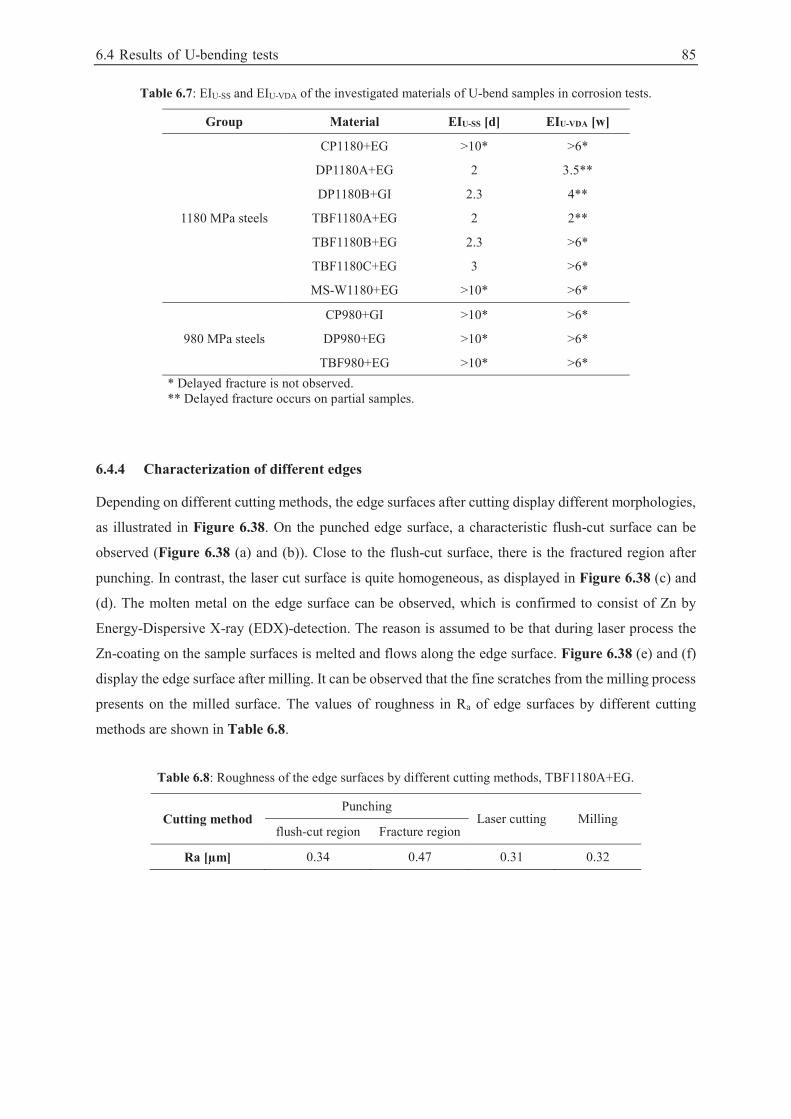
6.4 Results of U-bending tests 85
Table 6.7: EIU-SS and EIU-VDA of the investigated materials of U-bend samples in corrosion tests.
Group Material EIU-SS [d] EIU-VDA [w]
1180 MPa steels
CP1180+EG >10* >6*
DP1180A+EG 2 3.5**
DP1180B+GI 2.3 4**
TBF1180A+EG 2 2**
TBF1180B+EG 2.3 >6*
TBF1180C+EG 3 >6*
MS-W1180+EG >10* >6*
980 MPa steels
CP980+GI >10* >6*
DP980+EG >10* >6*
TBF980+EG >10* >6* * Delayed fracture is not observed. ** Delayed fracture occurs on partial samples.
6.4.4 Characterization of different edges
Depending on different cutting methods, the edge surfaces after cutting display different morphologies,
as illustrated in Figure 6.38. On the punched edge surface, a characteristic flush-cut surface can be
observed (Figure 6.38 (a) and (b)). Close to the flush-cut surface, there is the fractured region after
punching. In contrast, the laser cut surface is quite homogeneous, as displayed in Figure 6.38 (c) and
(d). The molten metal on the edge surface can be observed, which is confirmed to consist of Zn by
Energy-Dispersive X-ray (EDX)-detection. The reason is assumed to be that during laser process the
Zn-coating on the sample surfaces is melted and flows along the edge surface. Figure 6.38 (e) and (f)
display the edge surface after milling. It can be observed that the fine scratches from the milling process
presents on the milled surface. The values of roughness in Ra of edge surfaces by different cutting
methods are shown in Table 6.8.
Table 6.8: Roughness of the edge surfaces by different cutting methods, TBF1180A+EG.
Cutting method Punching
Laser cutting Milling flush-cut region Fracture region
Ra [μm] 0.34 0.47 0.31 0.32
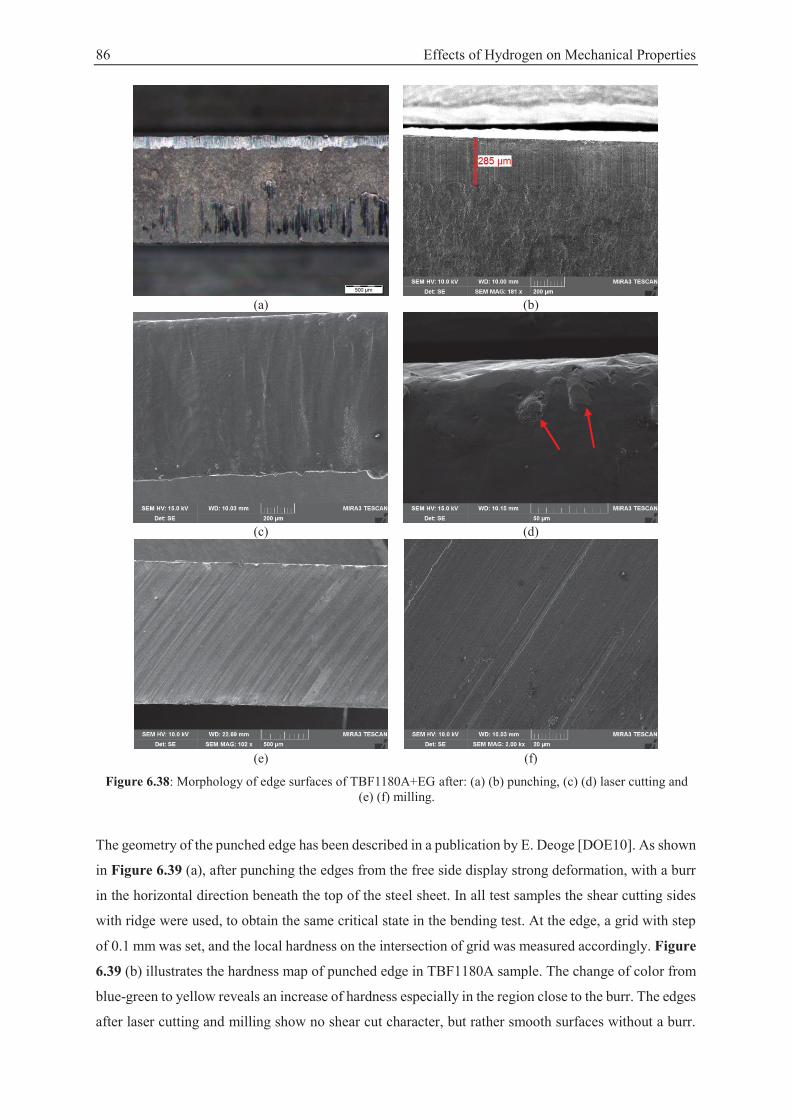
86 Effects of Hydrogen on Mechanical Properties
(a) (b)
(c) (d)
(e) (f)
Figure 6.38: Morphology of edge surfaces of TBF1180A+EG after: (a) (b) punching, (c) (d) laser cutting and (e) (f) milling.
The geometry of the punched edge has been described in a publication by E. Deoge [DOE10]. As shown
in Figure 6.39 (a), after punching the edges from the free side display strong deformation, with a burr
in the horizontal direction beneath the top of the steel sheet. In all test samples the shear cutting sides
with ridge were used, to obtain the same critical state in the bending test. At the edge, a grid with step
of 0.1 mm was set, and the local hardness on the intersection of grid was measured accordingly. Figure
6.39 (b) illustrates the hardness map of punched edge in TBF1180A sample. The change of color from
blue-green to yellow reveals an increase of hardness especially in the region close to the burr. The edges
after laser cutting and milling show no shear cut character, but rather smooth surfaces without a burr.
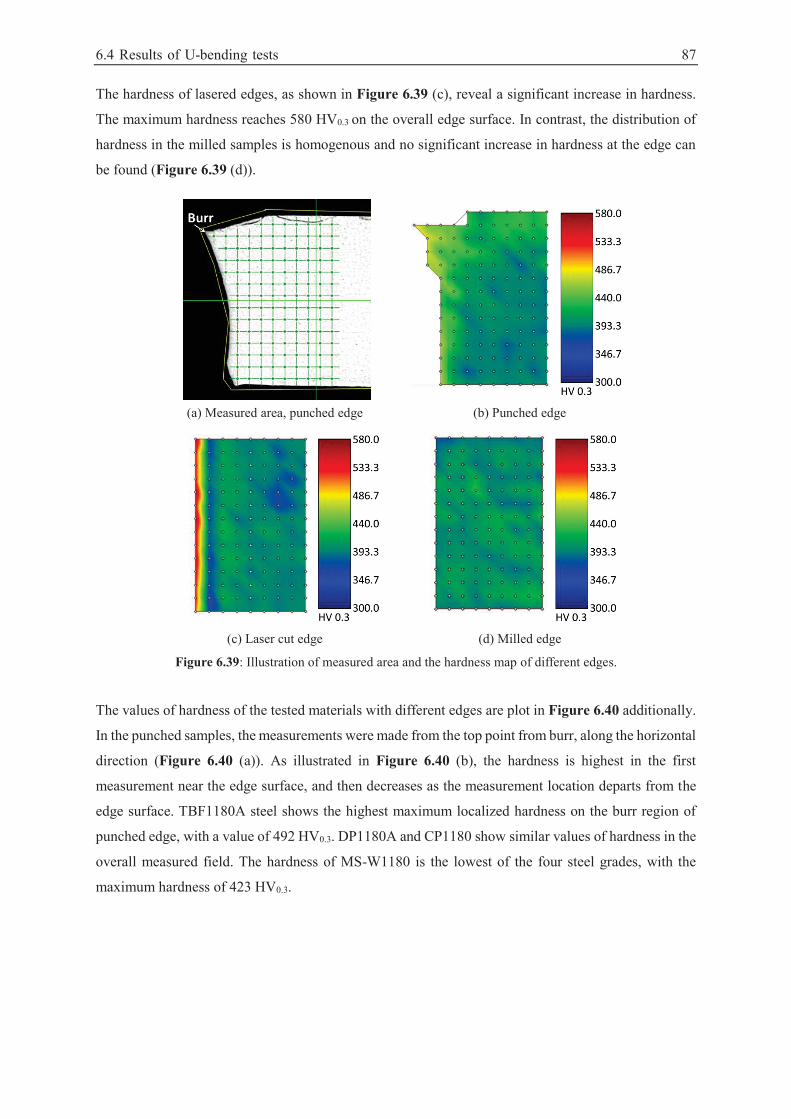
6.4 Results of U-bending tests 87
The hardness of lasered edges, as shown in Figure 6.39 (c), reveal a significant increase in hardness.
The maximum hardness reaches 580 HV0.3 on the overall edge surface. In contrast, the distribution of
hardness in the milled samples is homogenous and no significant increase in hardness at the edge can
be found (Figure 6.39 (d)).
(a) Measured area, punched edge (b) Punched edge
(c) Laser cut edge (d) Milled edge
Figure 6.39: Illustration of measured area and the hardness map of different edges.
The values of hardness of the tested materials with different edges are plot in Figure 6.40 additionally.
In the punched samples, the measurements were made from the top point from burr, along the horizontal
direction (Figure 6.40 (a)). As illustrated in Figure 6.40 (b), the hardness is highest in the first
measurement near the edge surface, and then decreases as the measurement location departs from the
edge surface. TBF1180A steel shows the highest maximum localized hardness on the burr region of
punched edge, with a value of 492 HV0.3. DP1180A and CP1180 show similar values of hardness in the
overall measured field. The hardness of MS-W1180 is the lowest of the four steel grades, with the
maximum hardness of 423 HV0.3.
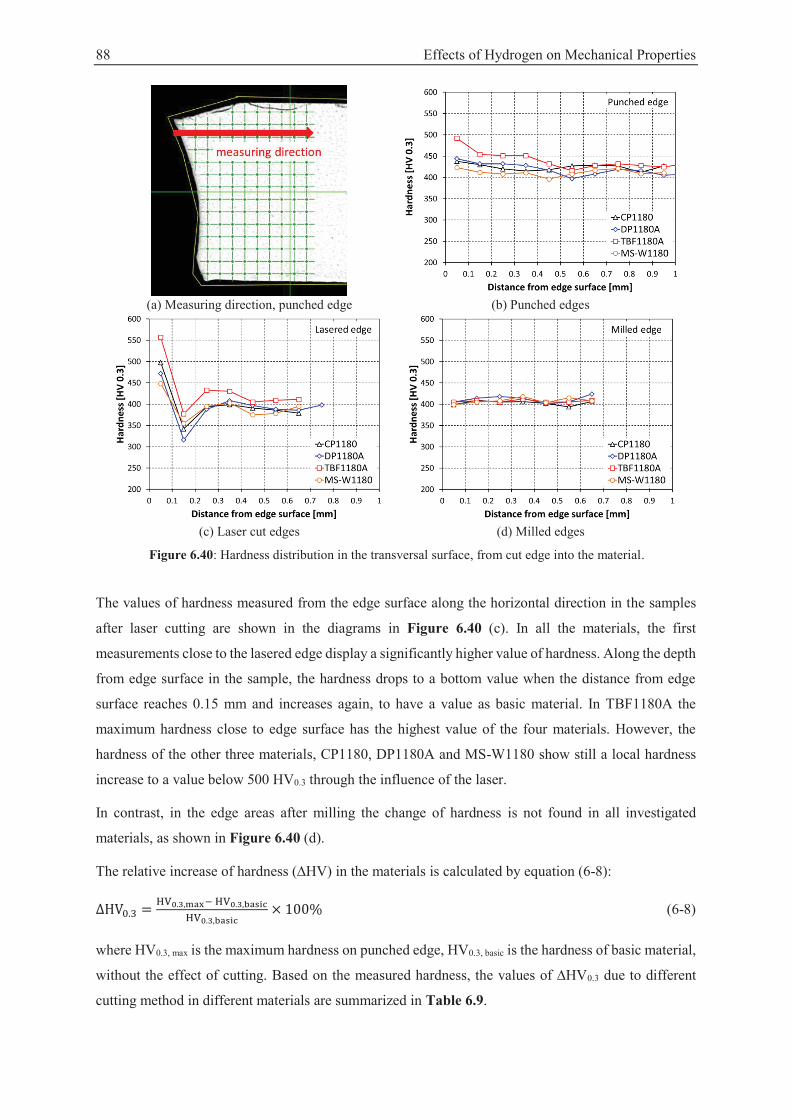
88 Effects of Hydrogen on Mechanical Properties
(a) Measuring direction, punched edge (b) Punched edges
(c) Laser cut edges (d) Milled edges
Figure 6.40: Hardness distribution in the transversal surface, from cut edge into the material.
The values of hardness measured from the edge surface along the horizontal direction in the samples
after laser cutting are shown in the diagrams in Figure 6.40 (c). In all the materials, the first
measurements close to the lasered edge display a significantly higher value of hardness. Along the depth
from edge surface in the sample, the hardness drops to a bottom value when the distance from edge
surface reaches 0.15 mm and increases again, to have a value as basic material. In TBF1180A the
maximum hardness close to edge surface has the highest value of the four materials. However, the
hardness of the other three materials, CP1180, DP1180A and MS-W1180 show still a local hardness
increase to a value below 500 HV0.3 through the influence of the laser.
In contrast, in the edge areas after milling the change of hardness is not found in all investigated
materials, as shown in Figure 6.40 (d).
The relative increase of hardness (∆HV) in the materials is calculated by equation (6-8):
(6-8)
where HV0.3, max is the maximum hardness on punched edge, HV0.3, basic is the hardness of basic material,
without the effect of cutting. Based on the measured hardness, the values of ∆HV0.3 due to different
cutting method in different materials are summarized in Table 6.9.
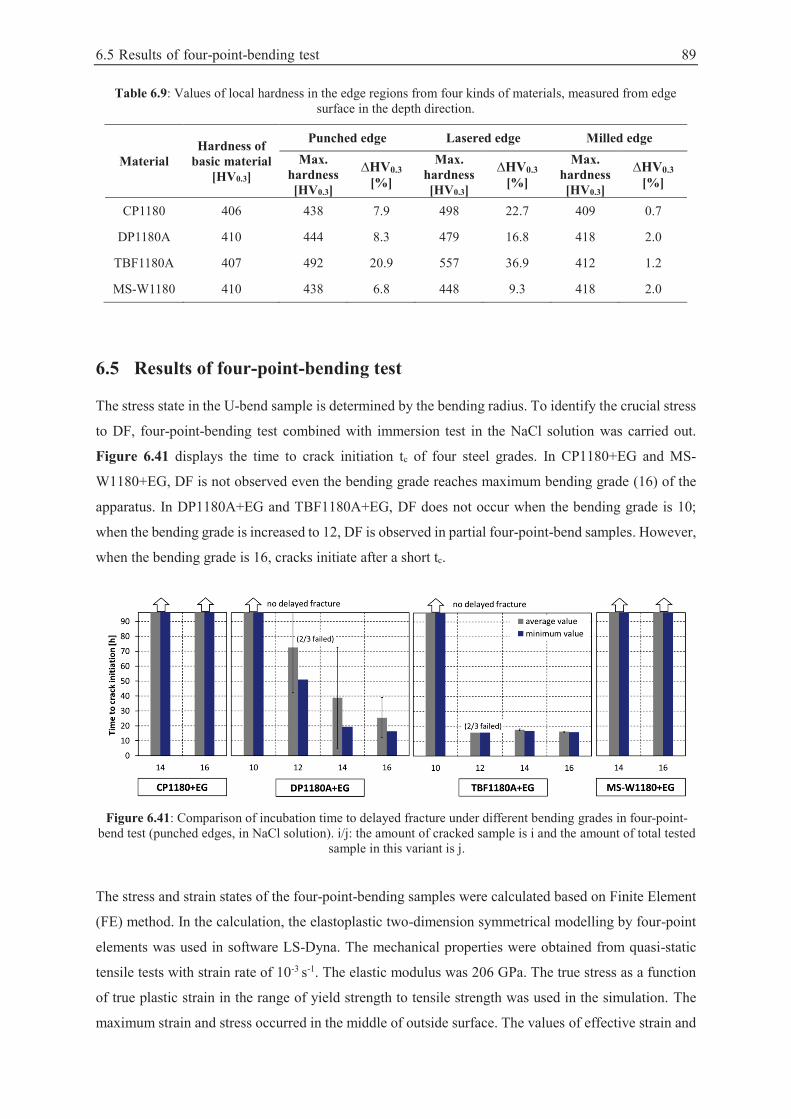
6.5 Results of four-point-bending test 89
Table 6.9: Values of local hardness in the edge regions from four kinds of materials, measured from edge surface in the depth direction.
Material Hardness of
basic material [HV0.3]
Punched edge Lasered edge Milled edge Max.
hardness [HV0.3]
∆HV0.3 [%]
Max. hardness [HV0.3]
∆HV0.3 [%]
Max. hardness [HV0.3]
∆HV0.3 [%]
CP1180 406 438 7.9 498 22.7 409 0.7
DP1180A 410 444 8.3 479 16.8 418 2.0
TBF1180A 407 492 20.9 557 36.9 412 1.2
MS-W1180 410 438 6.8 448 9.3 418 2.0
6.5 Results of four-point-bending test
The stress state in the U-bend sample is determined by the bending radius. To identify the crucial stress
to DF, four-point-bending test combined with immersion test in the NaCl solution was carried out.
Figure 6.41 displays the time to crack initiation tc of four steel grades. In CP1180+EG and MS-
W1180+EG, DF is not observed even the bending grade reaches maximum bending grade (16) of the
apparatus. In DP1180A+EG and TBF1180A+EG, DF does not occur when the bending grade is 10;
when the bending grade is increased to 12, DF is observed in partial four-point-bend samples. However,
when the bending grade is 16, cracks initiate after a short tc.
Figure 6.41: Comparison of incubation time to delayed fracture under different bending grades in four-point-
bend test (punched edges, in NaCl solution). i/j: the amount of cracked sample is i and the amount of total tested sample in this variant is j.
The stress and strain states of the four-point-bending samples were calculated based on Finite Element
(FE) method. In the calculation, the elastoplastic two-dimension symmetrical modelling by four-point
elements was used in software LS-Dyna. The mechanical properties were obtained from quasi-static
tensile tests with strain rate of 10-3 s-1. The elastic modulus was 206 GPa. The true stress as a function
of true plastic strain in the range of yield strength to tensile strength was used in the simulation. The
maximum strain and stress occurred in the middle of outside surface. The values of effective strain and
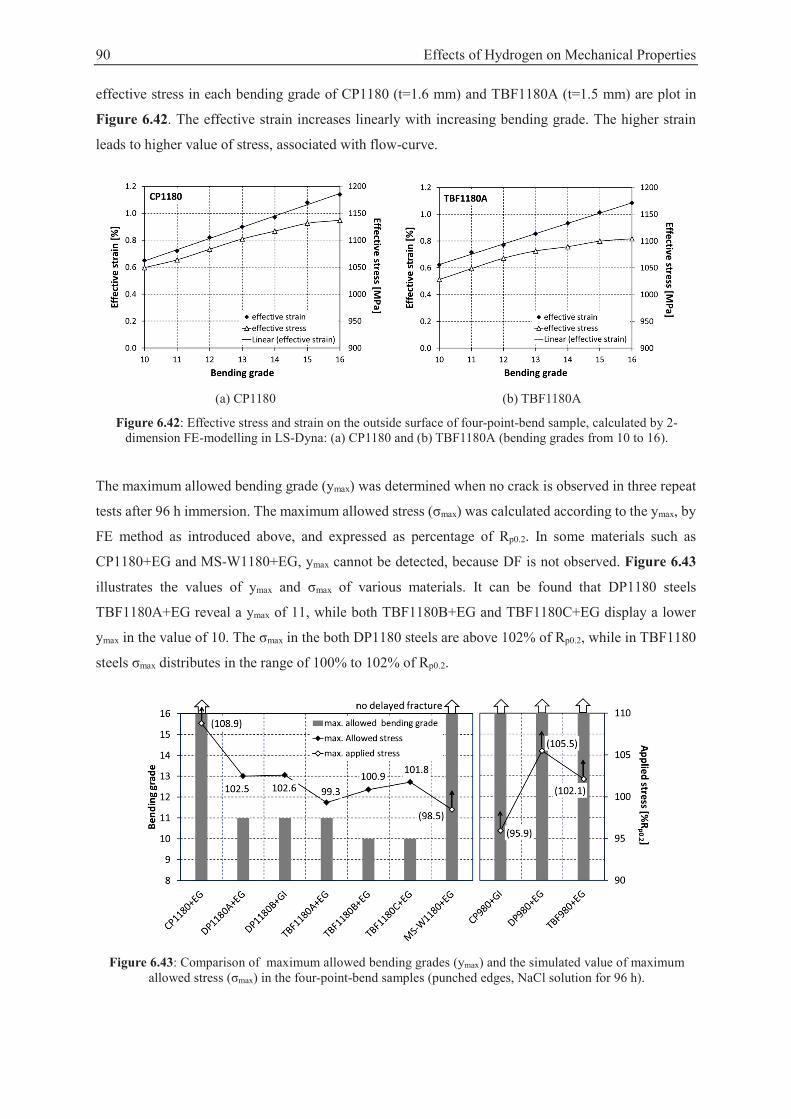
90 Effects of Hydrogen on Mechanical Properties
effective stress in each bending grade of CP1180 (t=1.6 mm) and TBF1180A (t=1.5 mm) are plot in
Figure 6.42. The effective strain increases linearly with increasing bending grade. The higher strain
leads to higher value of stress, associated with flow-curve.
(a) CP1180 (b) TBF1180A
Figure 6.42: Effective stress and strain on the outside surface of four-point-bend sample, calculated by 2-dimension FE-modelling in LS-Dyna: (a) CP1180 and (b) TBF1180A (bending grades from 10 to 16).
The maximum allowed bending grade (ymax) was determined when no crack is observed in three repeat
tests after 96 h immersion. The maximum allowed stress (σmax) was calculated according to the ymax, by
FE method as introduced above, and expressed as percentage of Rp0.2. In some materials such as
CP1180+EG and MS-W1180+EG, ymax cannot be detected, because DF is not observed. Figure 6.43
illustrates the values of ymax and σmax of various materials. It can be found that DP1180 steels
TBF1180A+EG reveal a ymax of 11, while both TBF1180B+EG and TBF1180C+EG display a lower
ymax in the value of 10. The σmax in the both DP1180 steels are above 102% of Rp0.2, while in TBF1180
steels σmax distributes in the range of 100% to 102% of Rp0.2.
Figure 6.43: Comparison of maximum allowed bending grades (ymax) and the simulated value of maximum
allowed stress (σmax) in the four-point-bend samples (punched edges, NaCl solution for 96 h).
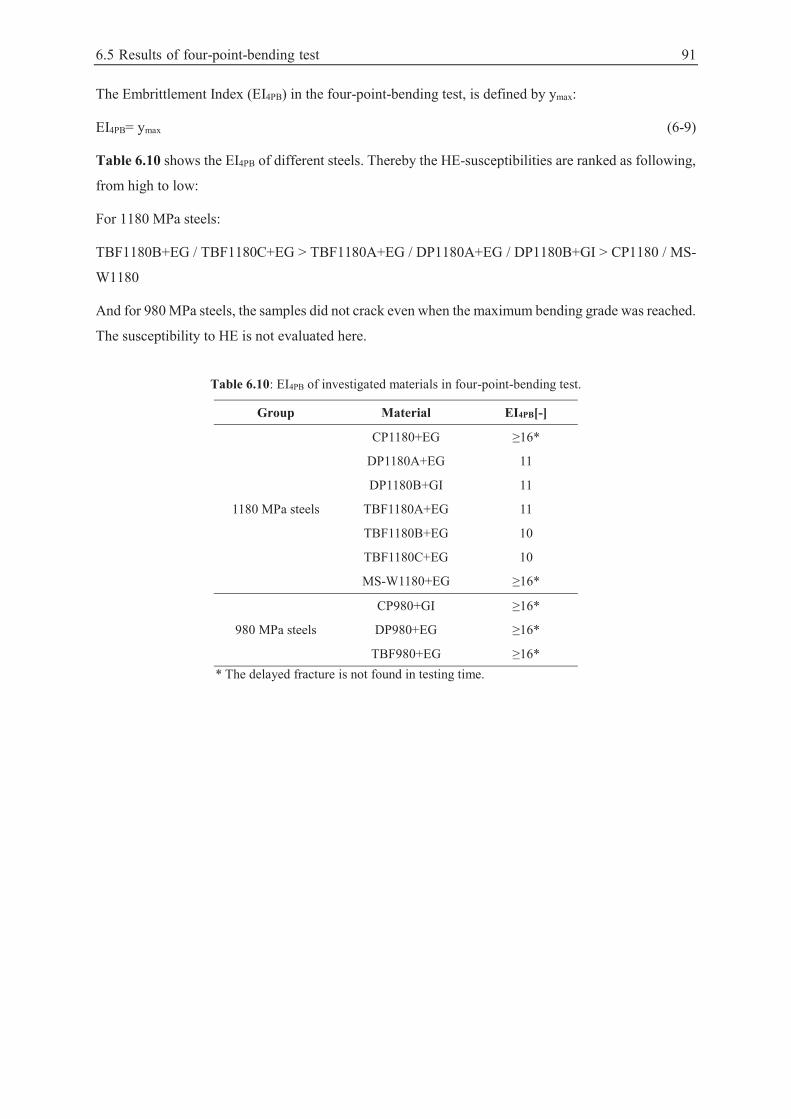
6.5 Results of four-point-bending test 91
The Embrittlement Index (EI4PB) in the four-point-bending test, is defined by ymax:
EI4PB= ymax (6-9)
Table 6.10 shows the EI4PB of different steels. Thereby the HE-susceptibilities are ranked as following,
from high to low:
For 1180 MPa steels:
TBF1180B+EG / TBF1180C+EG > TBF1180A+EG / DP1180A+EG / DP1180B+GI > CP1180 / MS-
W1180
And for 980 MPa steels, the samples did not crack even when the maximum bending grade was reached.
The susceptibility to HE is not evaluated here.
Table 6.10: EI4PB of investigated materials in four-point-bending test.
Group Material EI4PB[-]
1180 MPa steels
CP1180+EG ≥16*
DP1180A+EG 11
DP1180B+GI 11
TBF1180A+EG 11
TBF1180B+EG 10
TBF1180C+EG 10
MS-W1180+EG ≥16*
980 MPa steels
CP980+GI ≥16*
DP980+EG ≥16*
TBF980+EG ≥16* * The delayed fracture is not found in testing time.
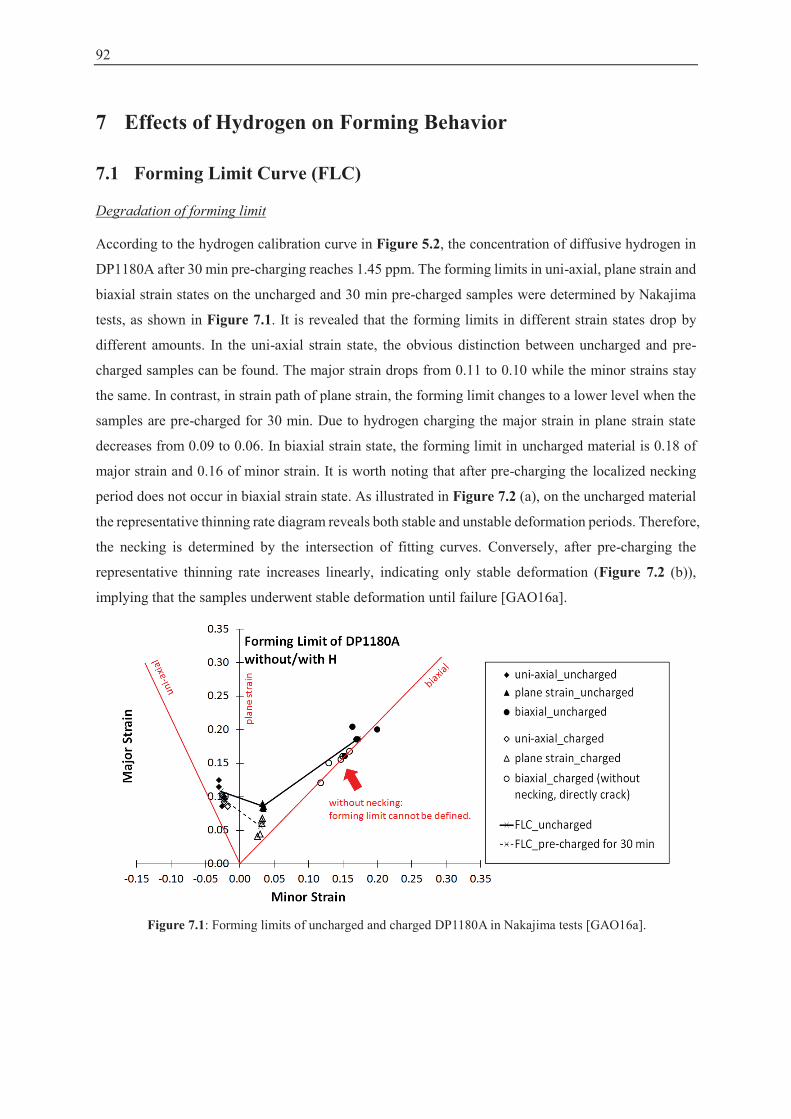
92
7 Effects of Hydrogen on Forming Behavior
7.1 Forming Limit Curve (FLC)
Degradation of forming limit
According to the hydrogen calibration curve in Figure 5.2, the concentration of diffusive hydrogen in
DP1180A after 30 min pre-charging reaches 1.45 ppm. The forming limits in uni-axial, plane strain and
biaxial strain states on the uncharged and 30 min pre-charged samples were determined by Nakajima
tests, as shown in Figure 7.1. It is revealed that the forming limits in different strain states drop by
different amounts. In the uni-axial strain state, the obvious distinction between uncharged and pre-
charged samples can be found. The major strain drops from 0.11 to 0.10 while the minor strains stay
the same. In contrast, in strain path of plane strain, the forming limit changes to a lower level when the
samples are pre-charged for 30 min. Due to hydrogen charging the major strain in plane strain state
decreases from 0.09 to 0.06. In biaxial strain state, the forming limit in uncharged material is 0.18 of
major strain and 0.16 of minor strain. It is worth noting that after pre-charging the localized necking
period does not occur in biaxial strain state. As illustrated in Figure 7.2 (a), on the uncharged material
the representative thinning rate diagram reveals both stable and unstable deformation periods. Therefore,
the necking is determined by the intersection of fitting curves. Conversely, after pre-charging the
representative thinning rate increases linearly, indicating only stable deformation (Figure 7.2 (b)),
implying that the samples underwent stable deformation until failure [GAO16a].
Figure 7.1: Forming limits of uncharged and charged DP1180A in Nakajima tests [GAO16a].

7.1 Forming Limit Curve (FLC) 93
(a) uncharged (b) pre-charged
Figure 7.2: Representative thinning rate diagrams at strain state of biaxial from (a) uncharged and (b) pre-charged DP1180A samples in Nakajima tests [GAO16a].
To study the strain state effect on the degradation of forming limit, the critical strains to fracture in the
sample without and with 1.45 ppm diffusive hydrogen are compared in Figure 7.3. It can be seen that
in all three investigated strain states, the threshold strains leading to fracture are decreased due to the
hydrogen enrichment. The degradation of critical strain to fracture is more significant than that of
forming limit. In Table 7.1 the values of critical effective strains to necking and fracture on the
uncharged and pre-charged samples are compared. After hydrogen charging the critical effective strains
to fracture is reduced from 0.26 to 0.18 in the uni-axial state, from 0.17 to 0.10 in the plane strain state
and from 0.46 to 0.30 in the biaxial state respectively [GAO16a].
Figure 7.3: Critical strains to fracture of uncharged and charged DP1180A in Nakajima tests [GAO16a].
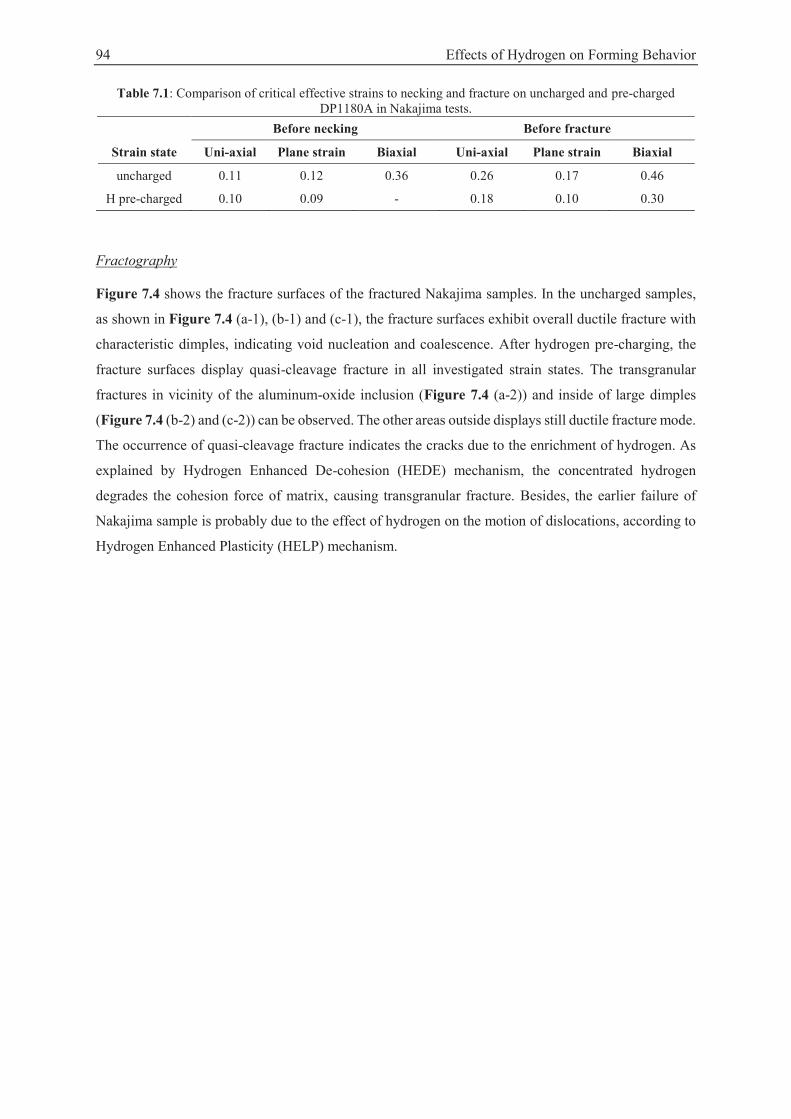
94 Effects of Hydrogen on Forming Behavior
Table 7.1: Comparison of critical effective strains to necking and fracture on uncharged and pre-charged DP1180A in Nakajima tests.
Before necking Before fracture
Strain state Uni-axial Plane strain Biaxial Uni-axial Plane strain Biaxial
uncharged 0.11 0.12 0.36 0.26 0.17 0.46
H pre-charged 0.10 0.09 - 0.18 0.10 0.30
Fractography
Figure 7.4 shows the fracture surfaces of the fractured Nakajima samples. In the uncharged samples,
as shown in Figure 7.4 (a-1), (b-1) and (c-1), the fracture surfaces exhibit overall ductile fracture with
characteristic dimples, indicating void nucleation and coalescence. After hydrogen pre-charging, the
fracture surfaces display quasi-cleavage fracture in all investigated strain states. The transgranular
fractures in vicinity of the aluminum-oxide inclusion (Figure 7.4 (a-2)) and inside of large dimples
(Figure 7.4 (b-2) and (c-2)) can be observed. The other areas outside displays still ductile fracture mode.
The occurrence of quasi-cleavage fracture indicates the cracks due to the enrichment of hydrogen. As
explained by Hydrogen Enhanced De-cohesion (HEDE) mechanism, the concentrated hydrogen
degrades the cohesion force of matrix, causing transgranular fracture. Besides, the earlier failure of
Nakajima sample is probably due to the effect of hydrogen on the motion of dislocations, according to
Hydrogen Enhanced Plasticity (HELP) mechanism.
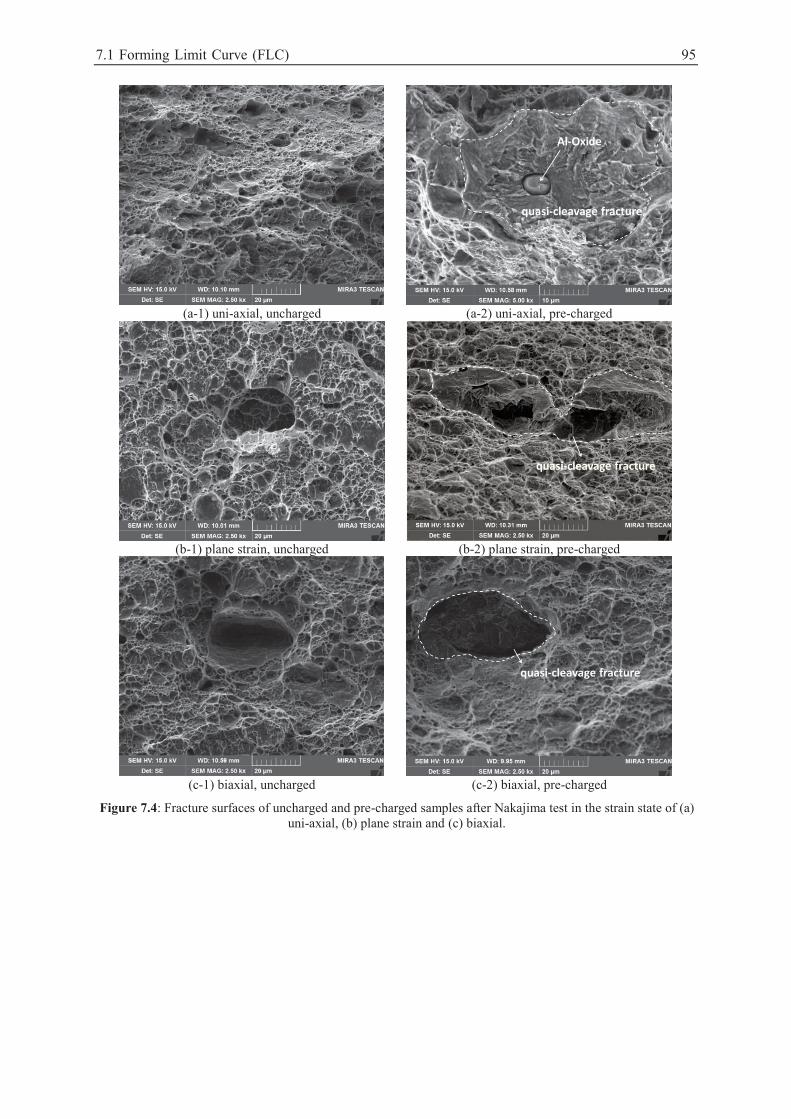
7.1 Forming Limit Curve (FLC) 95
(a-1) uni-axial, uncharged (a-2) uni-axial, pre-charged
(b-1) plane strain, uncharged (b-2) plane strain, pre-charged
(c-1) biaxial, uncharged (c-2) biaxial, pre-charged
Figure 7.4: Fracture surfaces of uncharged and pre-charged samples after Nakajima test in the strain state of (a) uni-axial, (b) plane strain and (c) biaxial.
96 Effects of Hydrogen on Forming Behavior
7.2 Bending Limit Curve (BLC)
Bending Limit Curve (BLC) was obtained by superimposing of pre-strain by Marciniak test and bending
load via VDA 238-100 bending test. Hydrogen concentration in the samples was modified by electro-
charging before the bending test. The contents of diffusive hydrogen in the pre-strained samples are
listed in Table 7.2. Though the hydrogen pre-charging processes of all the samples were same, the
samples with pre-strain adsorbed more hydrogen than the samples without pre-strain. The similar results
have been studied in the previous investigations from Li et al. and Ronevich et al. [LI14] [RON12]. The
rising of hydrogen content can be explained by the introduction of dislocations and the extension of
lattice structures during pre-strain, which provide more trapping sites for hydrogen atoms [LI14].
Table 7.2: Diffusive hydrogen content of VDA bend samples after pre strain via Marciniak test. Pre-charged for 30 min.
Pre-strain Without pre-strain Uni-axial Plane strain Biaxial
Content of diffusive hydrogen [ppm] 1.45 1.52 1.60 1.63
The strain states after pre-strain in uni-axial, plane strain and biaxial states and VDA bending test,
namely enhanced Bending Limit Curve (eBLC) [DEN11], are shown in Figure 7.5. The pre-strain
processes in three investigated strain states provide the distribution of major and minor strains. After
pre-strain the effective strain in the sample in three investigated strain states reached 0.02. As exhibited
in Figure 7.5, a major strain is superimposed in the pre-strained samples. By comparing the eBLC in
the uncharged and pre-charged samples, it can be found that the enrichment of hydrogen lowers the
eBLC of the material.
Figure 7.5: eBLC of DP1180A by pre-straining in Marciniak test and superimposed VDA-bending test
[GAO16b].
7.2 Bending Limit Curve (BLC) 97
The effective strains to bending fracture in the samples via different pre-strain paths are calculated and
listed in Table 7.3. The degradation of effective strain is defined as an Embrittlement Index (EIBL) to
evaluate susceptibility to hydrogen, which was calculated according to equation (7-1):
(7-1)
where is the maximum allowed effective strain without bending fracture. The higher represents
higher susceptibility to HE during bending process. For the material without pre-strain, the is 27.6 %
after 10 min pre-charging and 31.5% after 30 min pre-charging. The degradation of critical effective
strain of pre-strained material has a higher value compared to the uncharged material. The samples pre-
strained in biaxial strain state displays the highest degradation of critical effective strain after hydrogen
pre-charging. After 30 min pre-charging the effective strain to bending fracture reduces from 0.177 to
0.116. After pre-straining in plane strain the effective strains degrade in 32.5% and 33.9% after 10 min
and 30 min pre-charging respectively. The bend samples pre-strained in uni-axial strain state show
lower degradation of bending limit compared to other two strain states.
Table 7.3: Comparison of critical effective strains to bending fracture on as-delivered and pre-strained DP1180A samples VDA238-100 bending test.
Charging time [min]
As-delivered
Pre-strained
Uni-axial Plane strain Biaxial
Effective strain [-]
0 min 0.159 0.184 0.188 0.177
10 min 0.115 0.131 0.127 0.119
30 min 0.109 0.127 0.124 0.116
EIBL [%] 10 min 27.6 28.8 32.5 32.9
30 min 31.5 31.3 33.9 34.3
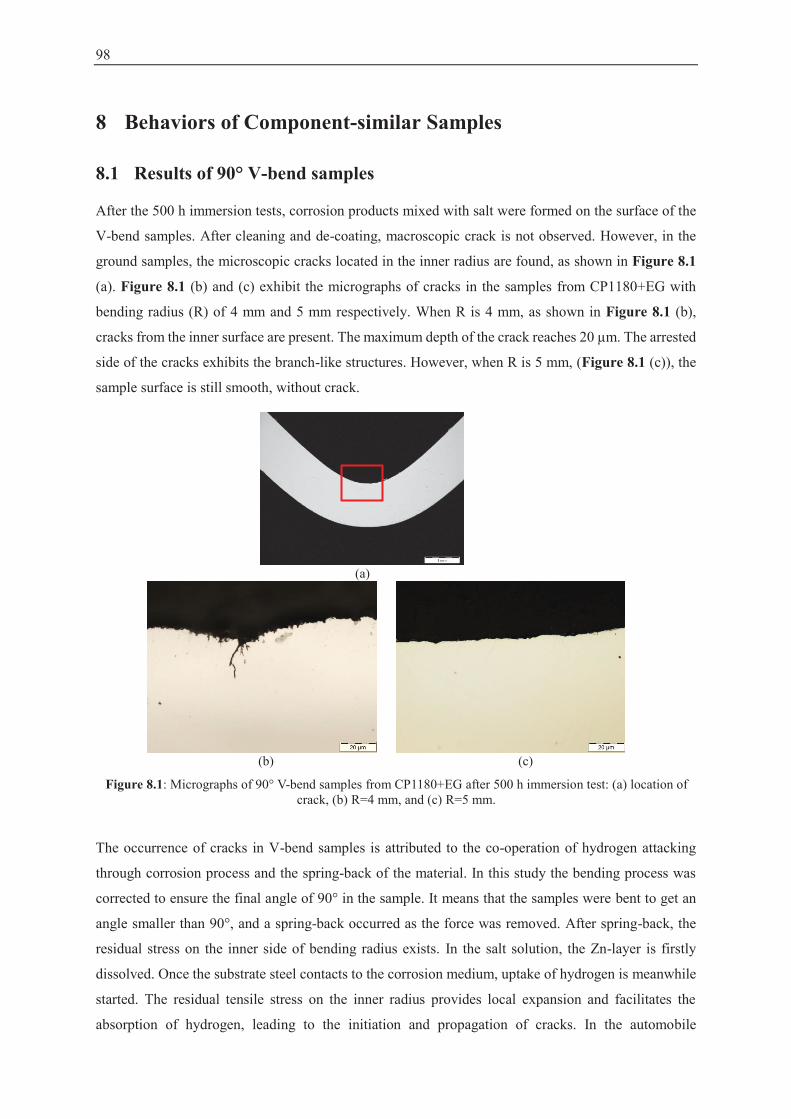
98
8 Behaviors of Component-similar Samples
8.1 Results of 90° V-bend samples
After the 500 h immersion tests, corrosion products mixed with salt were formed on the surface of the
V-bend samples. After cleaning and de-coating, macroscopic crack is not observed. However, in the
ground samples, the microscopic cracks located in the inner radius are found, as shown in Figure 8.1
(a). Figure 8.1 (b) and (c) exhibit the micrographs of cracks in the samples from CP1180+EG with
bending radius (R) of 4 mm and 5 mm respectively. When R is 4 mm, as shown in Figure 8.1 (b),
cracks from the inner surface are present. The maximum depth of the crack reaches 20 μm. The arrested
side of the cracks exhibits the branch-like structures. However, when R is 5 mm, (Figure 8.1 (c)), the
sample surface is still smooth, without crack.
(a)
(b) (c)
Figure 8.1: Micrographs of 90° V-bend samples from CP1180+EG after 500 h immersion test: (a) location of crack, (b) R=4 mm, and (c) R=5 mm.
The occurrence of cracks in V-bend samples is attributed to the co-operation of hydrogen attacking
through corrosion process and the spring-back of the material. In this study the bending process was
corrected to ensure the final angle of 90° in the sample. It means that the samples were bent to get an
angle smaller than 90°, and a spring-back occurred as the force was removed. After spring-back, the
residual stress on the inner side of bending radius exists. In the salt solution, the Zn-layer is firstly
dissolved. Once the substrate steel contacts to the corrosion medium, uptake of hydrogen is meanwhile
started. The residual tensile stress on the inner radius provides local expansion and facilitates the
absorption of hydrogen, leading to the initiation and propagation of cracks. In the automobile

8.2 Results of cross-die samples 99
components, the structure of tunnel is in the same situation. The initiation of hydrogen-induced cracks
is not allowed. According to the assumption above, the minimum allowed ratios of R/t (R: bending
radius, t: thickness) are calculated, which can be used as the Embrittlement Index (EIV). As summarized
in Table 8.1, different steel grades display similar values of minimum R/t. It can be concluded that the
1180 MPa steels are allowed to be bent until the angle of 90° in car body constructions, when R/t is
over 3.
Table 8.1: Comparison of minimum allowed punch radius (R) and thickness (t) of the investigated materials.
Material t [mm] Min. R [mm] Min. ratio of R/t
CP1180+EG 1.6 5 3.1
DP1180A+EG 1.5 5 3.4
DP1180B+GI 1.4 5 3.6
TBF1180A+EG 1.5 5 3.4
TBF1180B+EG 1.5 5 3.4
TBF1180C+EG 1.6 5 3.1
8.2 Results of cross-die samples
Table 8.2 gives the results of cross-die samples after immersion tests. It reveals that after 192 h
immersion in the 3.5%NaCl solution (pH4), DF is not detected in the lasered and welded samples
(Figure 3.18). However, in the samples with original punched edges from three Zn-coated TBP1180
steels, the cracks from free edges are observed after 17 h immersion, and then propagated in the location
of angle, as shown in Figure 8.2. However, the samples from DP1180A+EG and DP980+EG exhibit
no DF.
Table 8.2: Time to DF of the cross-die samples, immersion in 3.5%NaCl solution for 192 h.
Material drawn sample (free edges) drawn sample + cutting + welding
drawing depth [mm] time to DF [h] drawing depth
[mm] time to DF [h]
DP1180A+EG 17 n.d. 17 n.d.
TBF1180A+EG 21 17 21 n.d.
16 n.d. 16 n.d.
TBF1180B+EG 21 17 21 n.d.
16 n.d. 16 n.d.
TBF1180C+EG 23 17 23 n.d.
18 n.d. 18 n.d.
DP980+EG 20 n.d. 20 n.d.
15 n.d. 15 n.d. *n.d.: DF was not detected after 192 immersions.
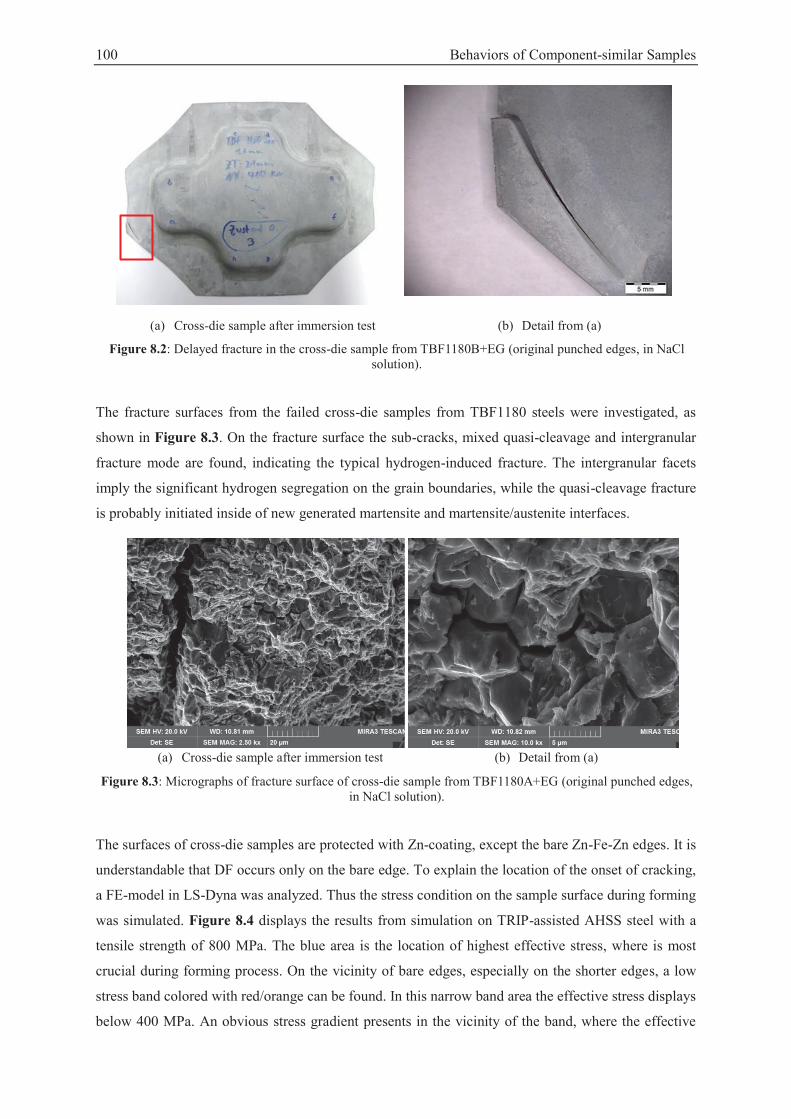
100 Behaviors of Component-similar Samples
(a) Cross-die sample after immersion test (b) Detail from (a)
Figure 8.2: Delayed fracture in the cross-die sample from TBF1180B+EG (original punched edges, in NaCl solution).
The fracture surfaces from the failed cross-die samples from TBF1180 steels were investigated, as
shown in Figure 8.3. On the fracture surface the sub-cracks, mixed quasi-cleavage and intergranular
fracture mode are found, indicating the typical hydrogen-induced fracture. The intergranular facets
imply the significant hydrogen segregation on the grain boundaries, while the quasi-cleavage fracture
is probably initiated inside of new generated martensite and martensite/austenite interfaces.
(a) Cross-die sample after immersion test (b) Detail from (a)
Figure 8.3: Micrographs of fracture surface of cross-die sample from TBF1180A+EG (original punched edges, in NaCl solution).
The surfaces of cross-die samples are protected with Zn-coating, except the bare Zn-Fe-Zn edges. It is
understandable that DF occurs only on the bare edge. To explain the location of the onset of cracking,
a FE-model in LS-Dyna was analyzed. Thus the stress condition on the sample surface during forming
was simulated. Figure 8.4 displays the results from simulation on TRIP-assisted AHSS steel with a
tensile strength of 800 MPa. The blue area is the location of highest effective stress, where is most
crucial during forming process. On the vicinity of bare edges, especially on the shorter edges, a low
stress band colored with red/orange can be found. In this narrow band area the effective stress displays
below 400 MPa. An obvious stress gradient presents in the vicinity of the band, where the effective
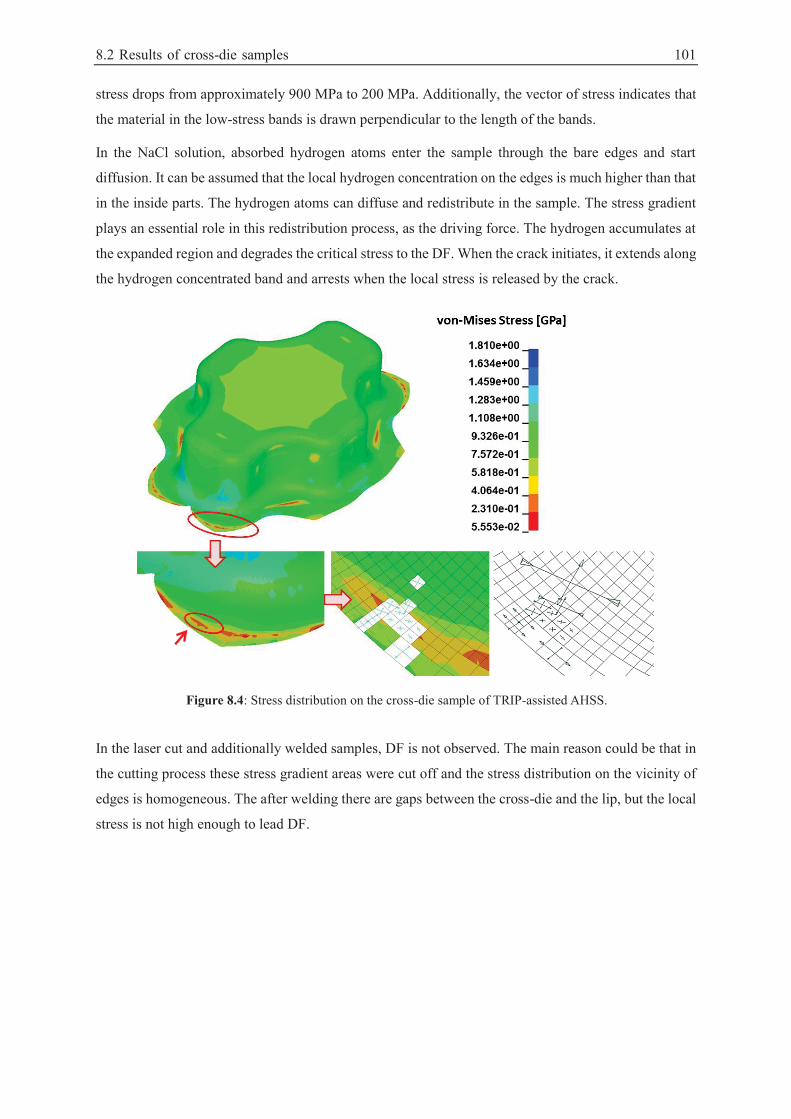
8.2 Results of cross-die samples 101
stress drops from approximately 900 MPa to 200 MPa. Additionally, the vector of stress indicates that
the material in the low-stress bands is drawn perpendicular to the length of the bands.
In the NaCl solution, absorbed hydrogen atoms enter the sample through the bare edges and start
diffusion. It can be assumed that the local hydrogen concentration on the edges is much higher than that
in the inside parts. The hydrogen atoms can diffuse and redistribute in the sample. The stress gradient
plays an essential role in this redistribution process, as the driving force. The hydrogen accumulates at
the expanded region and degrades the critical stress to the DF. When the crack initiates, it extends along
the hydrogen concentrated band and arrests when the local stress is released by the crack.
Figure 8.4: Stress distribution on the cross-die sample of TRIP-assisted AHSS.
In the laser cut and additionally welded samples, DF is not observed. The main reason could be that in
the cutting process these stress gradient areas were cut off and the stress distribution on the vicinity of
edges is homogeneous. The after welding there are gaps between the cross-die and the lip, but the local
stress is not high enough to lead DF.
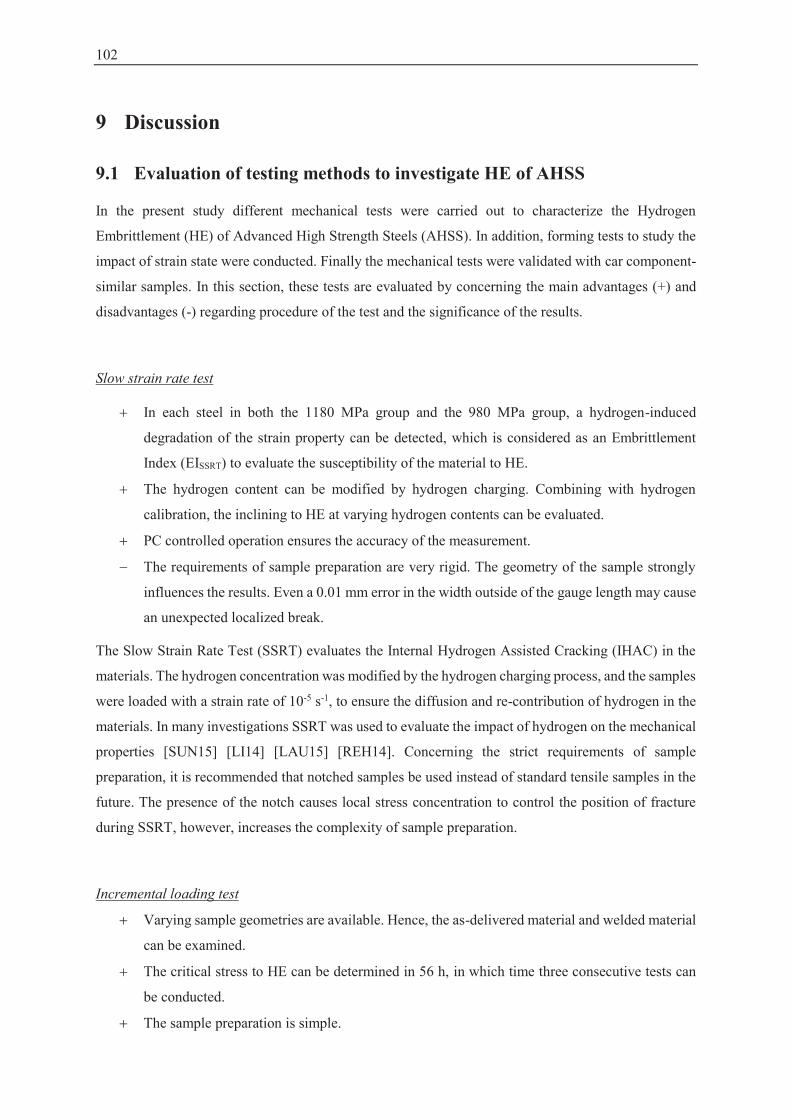
102
9 Discussion
9.1 Evaluation of testing methods to investigate HE of AHSS
In the present study different mechanical tests were carried out to characterize the Hydrogen
Embrittlement (HE) of Advanced High Strength Steels (AHSS). In addition, forming tests to study the
impact of strain state were conducted. Finally the mechanical tests were validated with car component-
similar samples. In this section, these tests are evaluated by concerning the main advantages (+) and
disadvantages (-) regarding procedure of the test and the significance of the results.
Slow strain rate test
In each steel in both the 1180 MPa group and the 980 MPa group, a hydrogen-induced
degradation of the strain property can be detected, which is considered as an Embrittlement
Index (EISSRT) to evaluate the susceptibility of the material to HE.
The hydrogen content can be modified by hydrogen charging. Combining with hydrogen
calibration, the inclining to HE at varying hydrogen contents can be evaluated.
PC controlled operation ensures the accuracy of the measurement.
The requirements of sample preparation are very rigid. The geometry of the sample strongly
influences the results. Even a 0.01 mm error in the width outside of the gauge length may cause
an unexpected localized break.
The Slow Strain Rate Test (SSRT) evaluates the Internal Hydrogen Assisted Cracking (IHAC) in the
materials. The hydrogen concentration was modified by the hydrogen charging process, and the samples
were loaded with a strain rate of 10-5 s-1, to ensure the diffusion and re-contribution of hydrogen in the
materials. In many investigations SSRT was used to evaluate the impact of hydrogen on the mechanical
properties [SUN15] [LI14] [LAU15] [REH14]. Concerning the strict requirements of sample
preparation, it is recommended that notched samples be used instead of standard tensile samples in the
future. The presence of the notch causes local stress concentration to control the position of fracture
during SSRT, however, increases the complexity of sample preparation.
Incremental loading test
Varying sample geometries are available. Hence, the as-delivered material and welded material
can be examined.
The critical stress to HE can be determined in 56 h, in which time three consecutive tests can
be conducted.
The sample preparation is simple.
9.1 Evaluation of testing methods to investigate HE of AHSS 103
In the current work, many materials failed in the constant loading procedure, where the stress
was held at 75% of Rm.
The Incremental Loading Test (ILT) evaluates the Hydrogen Environment Assisted cracking (HEAC)
in the materials. The ILT was carried out in the solution of 3.5%NaCl with pH4. Due to a strong reaction
with hydrogen in the test surroundings, Delayed Fracture (DF) occurred within a short amount of time.
Therefore, the threshold stress to delayed fracture in the ILT had been exceeded. In this case, the
embrittlement Index EIILT was calculated based on the applied stress and time to delayed fracture.
Thereby the HE behavior in the investigated AHSS was clearly evaluated. In the current work, the initial
load was 75% of Rm, and most 1180 MPa steels broke in a short time when subjected to this load (Figure
6.10). In order to investigate the threshold stress to DF in the ILT and obtain a better differentiation of
the results, a lower starting load is recommended. A start loading for future tests could be reduced to
50% or 60% of Rm of the materials.
Constant loading test
Threshold stress to hydrogen-induced DF of each material can be determined.
Sample preparation is simple.
The loading is achieved by adjusting the fixed bolt to control the distance between free sides of
the samples. This loading process is operated by hand. Hence errors may occur during the
testing procedure.
To determine the threshold stress the sample should be tested under different loads. The
required time is several weeks.
The Constant Loading Test (CLT) is considered as a simplified test, which separates each loading step
into an individual test. CLT evaluates the HEAC as well as ILT. In this work the time to DF and the
threshold stress in the corrosive medium (3.5%NaCl solution with pH4) were studied. Actually, in some
literature CLT has been usually used to determine the critical fracture stress of the materials with
varying hydrogen contents, for instance, after hydrogen charging [WAN06] [TAK14]. The results of
CLT are consistent with the results from ILT, but the testing time is much longer than that of ILT.
U-bending test
Sample preparation is simple.
The sample geometry is simple, thus different edge conditions are available.
The bending process is easy.
The investigation of the U-bend samples is very flexible. The samples can be tested in different
corrosive mediums to study the HEAC, and be available to examine the IHAC associated with
hydrogen pre-charging process. Additionally, many samples can be tested at the same time.
104 Discussion
The stress distribution of the U-bend sample is limited by the bending radius. The critical stress
to DF cannot be directly detected.
The results from pre-charged samples (referring to IHAC) and immersed sample (referring to HEAC)
in the U-bending test displayed a similar ranking of the different materials. The time to crack initiation
(tc) is used as the EI to evaluate the susceptibility to HE of different AHSS. In the research from Takagi
et al., U-bending tests were carried out to evaluate HE for two kinds of 1180 MPa steels [TAK10]. But
in their work the strain state on the bent surface was not mentioned. Rehrl reported the stress distribution
through the thickness, but did not compare the DF behavior with localized stress [REH13]. Actually, to
clearly evaluate the susceptibility of the materials to HE, a good understanding of the stress distribution
in the U-bend sample is very important.
Four-point-bending test
The sample has a simple geometry.
The four-point-bending test procedure is easy.
The bending grade of the sample can be adjusted continuously. Thereby the stress distribution
on the investigated sample is no longer limited by the regular bending radii.
The use of a four-point-bending apparatus limits the variation of the test conditions (for
example corrosive surroundings are not possible).
To determine the critical bending grade to delayed fracture, several series of test are needed.
The testing time is up to several weeks.
To understand the stress distribution in the sample, further analysis like simulation is required.
Four-point-bending test is considered as an additional test to the U-bending test. The main difference
between four-point-bending and U-bending is the way to tighten the sample. In four-point-bending test,
the critical bending grades on the investigated materials displayed similar values. Concerning the local
stress on the bent surface, the maximum allowed stresses reflect the susceptibility to HE. The ranking
of the investigated material is consistent with the EI in U-bending tests.
90° V-bend test
Component-similar test, in which the test condition is close to reality.
The sample preparation is complex, including the production of sample, and the 90° bending.
The testing time is up to 500 h.
To analyze the results, the samples need to be additionally prepared for microscopy.
In some materials, like MS-W1180+EG, the maximum bending radius of 5 mm is not possible.
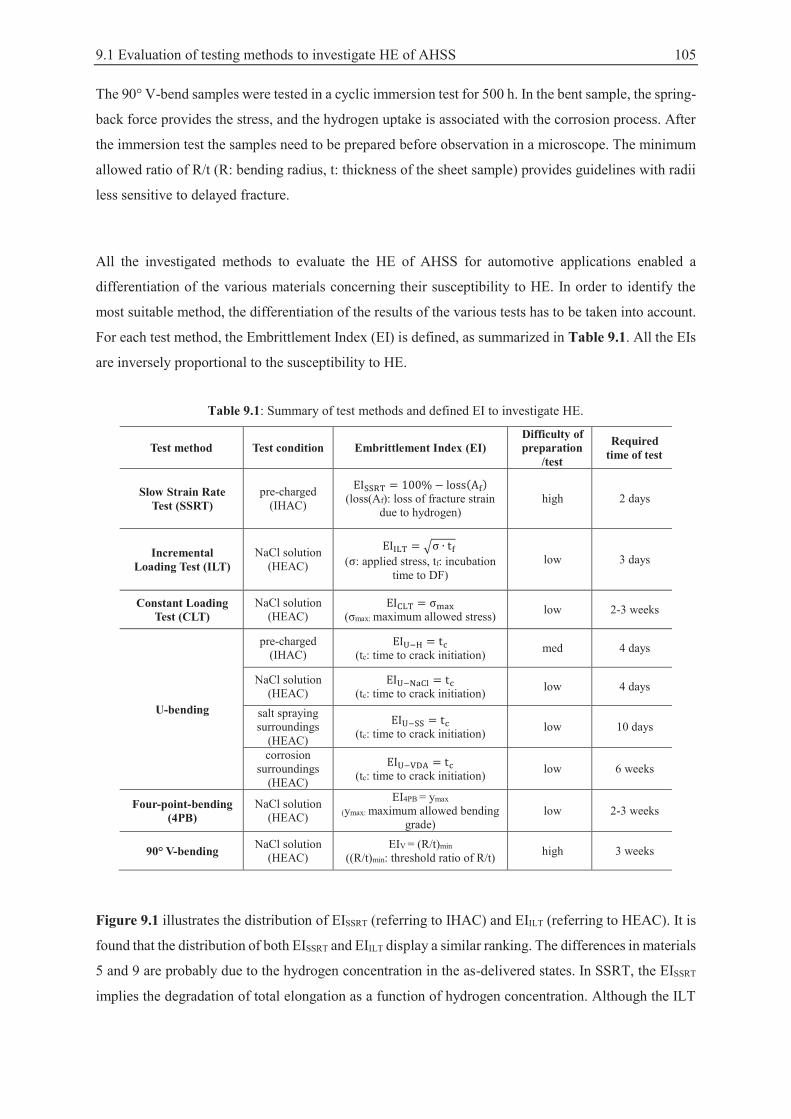
9.1 Evaluation of testing methods to investigate HE of AHSS 105
The 90° V-bend samples were tested in a cyclic immersion test for 500 h. In the bent sample, the spring-
back force provides the stress, and the hydrogen uptake is associated with the corrosion process. After
the immersion test the samples need to be prepared before observation in a microscope. The minimum
allowed ratio of R/t (R: bending radius, t: thickness of the sheet sample) provides guidelines with radii
less sensitive to delayed fracture.
All the investigated methods to evaluate the HE of AHSS for automotive applications enabled a
differentiation of the various materials concerning their susceptibility to HE. In order to identify the
most suitable method, the differentiation of the results of the various tests has to be taken into account.
For each test method, the Embrittlement Index (EI) is defined, as summarized in Table 9.1. All the EIs
are inversely proportional to the susceptibility to HE.
Table 9.1: Summary of test methods and defined EI to investigate HE.
Test method Test condition Embrittlement Index (EI) Difficulty of preparation
/test
Required time of test
Slow Strain Rate Test (SSRT)
pre-charged (IHAC)
(loss(Af): loss of fracture strain
due to hydrogen) high 2 days
Incremental Loading Test (ILT)
NaCl solution (HEAC)
( : applied stress, tf: incubation
time to DF) low 3 days
Constant Loading Test (CLT)
NaCl solution (HEAC)
(σmax: maximum allowed stress) low 2-3 weeks
U-bending
pre-charged (IHAC)
(tc: time to crack initiation) med 4 days
NaCl solution (HEAC)
(tc: time to crack initiation) low 4 days
salt spraying surroundings
(HEAC)
(tc: time to crack initiation) low 10 days
corrosion surroundings
(HEAC)
(tc: time to crack initiation) low 6 weeks
Four-point-bending (4PB)
NaCl solution (HEAC)
EI4PB = ymax
(ymax: maximum allowed bending grade)
low 2-3 weeks
90° V-bending NaCl solution (HEAC)
EIV = (R/t)min ((R/t)min: threshold ratio of R/t) high 3 weeks
Figure 9.1 illustrates the distribution of EISSRT (referring to IHAC) and EIILT (referring to HEAC). It is
found that the distribution of both EISSRT and EIILT display a similar ranking. The differences in materials
5 and 9 are probably due to the hydrogen concentration in the as-delivered states. In SSRT, the EISSRT
implies the degradation of total elongation as a function of hydrogen concentration. Although the ILT
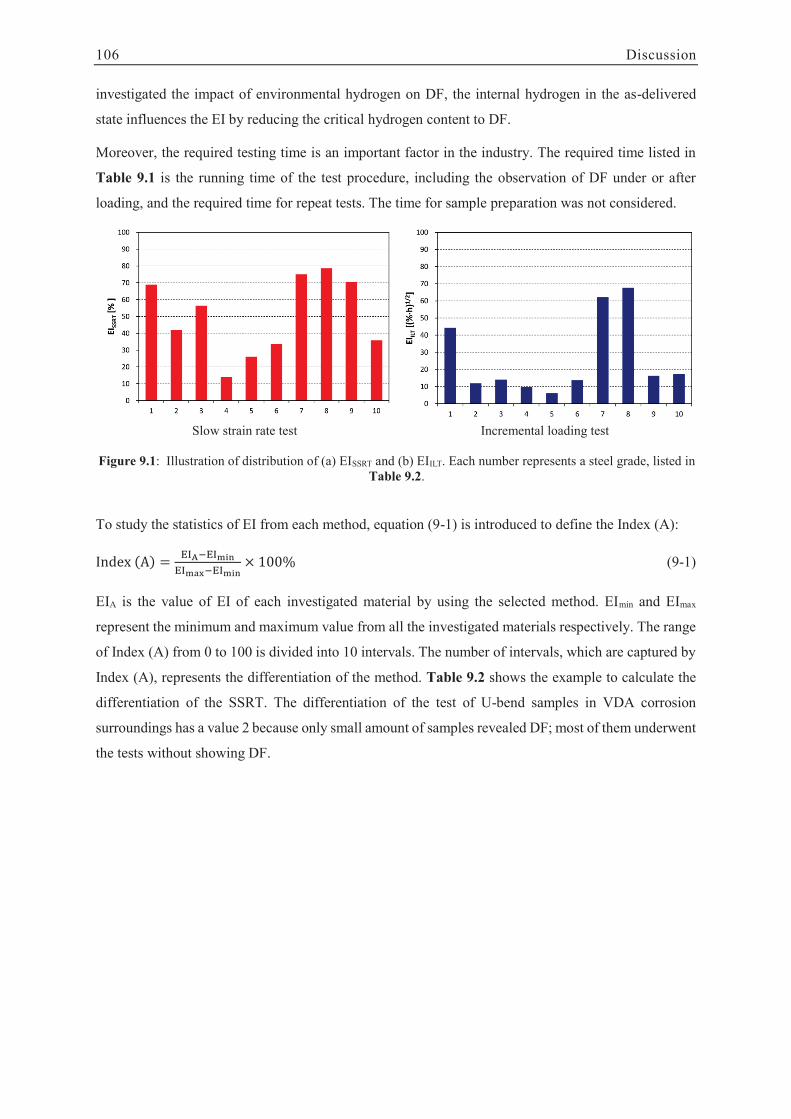
106 Discussion
investigated the impact of environmental hydrogen on DF, the internal hydrogen in the as-delivered
state influences the EI by reducing the critical hydrogen content to DF.
Moreover, the required testing time is an important factor in the industry. The required time listed in
Table 9.1 is the running time of the test procedure, including the observation of DF under or after
loading, and the required time for repeat tests. The time for sample preparation was not considered.
Slow strain rate test Incremental loading test
Figure 9.1: Illustration of distribution of (a) EISSRT and (b) EIILT. Each number represents a steel grade, listed in Table 9.2.
To study the statistics of EI from each method, equation (9-1) is introduced to define the Index (A):
(9-1)
EIA is the value of EI of each investigated material by using the selected method. EImin and EImax
represent the minimum and maximum value from all the investigated materials respectively. The range
of Index (A) from 0 to 100 is divided into 10 intervals. The number of intervals, which are captured by
Index (A), represents the differentiation of the method. Table 9.2 shows the example to calculate the
differentiation of the SSRT. The differentiation of the test of U-bend samples in VDA corrosion
surroundings has a value 2 because only small amount of samples revealed DF; most of them underwent
the tests without showing DF.
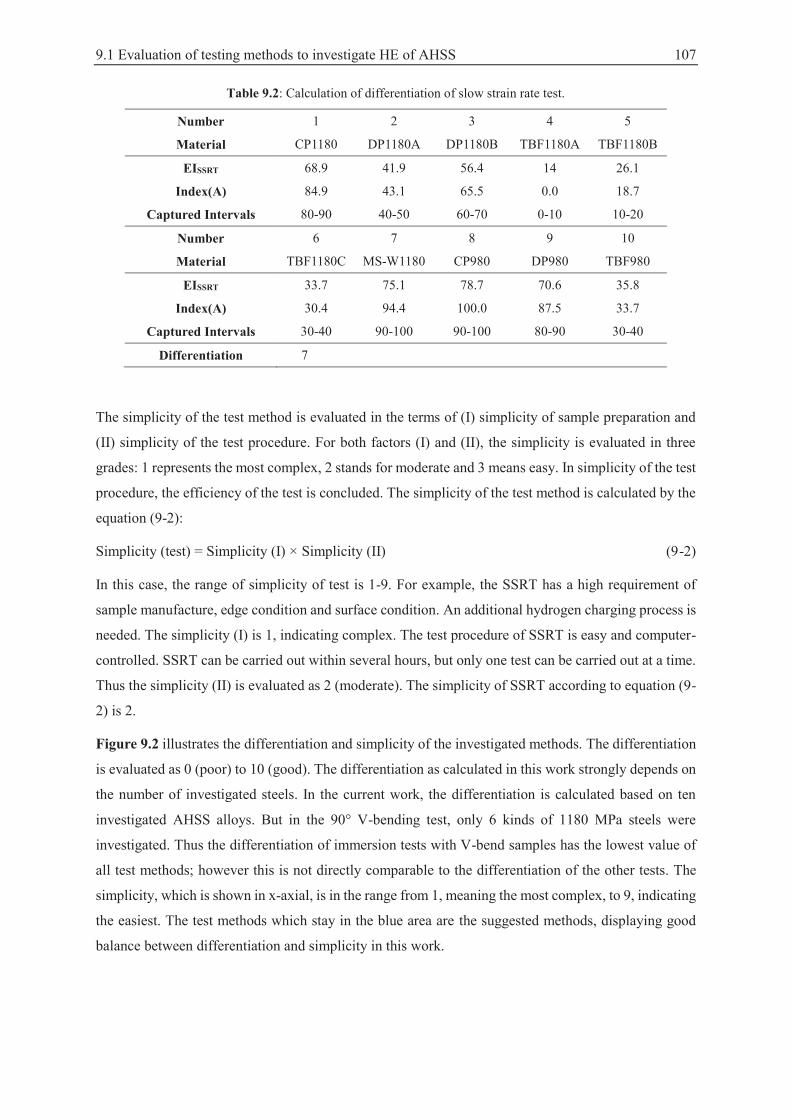
9.1 Evaluation of testing methods to investigate HE of AHSS 107
Table 9.2: Calculation of differentiation of slow strain rate test.
Number 1 2 3 4 5
Material CP1180 DP1180A DP1180B TBF1180A TBF1180B
EISSRT 68.9 41.9 56.4 14 26.1
Index(A) 84.9 43.1 65.5 0.0 18.7
Captured Intervals 80-90 40-50 60-70 0-10 10-20
Number 6 7 8 9 10
Material TBF1180C MS-W1180 CP980 DP980 TBF980
EISSRT 33.7 75.1 78.7 70.6 35.8
Index(A) 30.4 94.4 100.0 87.5 33.7
Captured Intervals 30-40 90-100 90-100 80-90 30-40
Differentiation 7
The simplicity of the test method is evaluated in the terms of (I) simplicity of sample preparation and
(II) simplicity of the test procedure. For both factors (I) and (II), the simplicity is evaluated in three
grades: 1 represents the most complex, 2 stands for moderate and 3 means easy. In simplicity of the test
procedure, the efficiency of the test is concluded. The simplicity of the test method is calculated by the
equation (9-2):
Simplicity (test) = Simplicity (I) × Simplicity (II) (9-2)
In this case, the range of simplicity of test is 1-9. For example, the SSRT has a high requirement of
sample manufacture, edge condition and surface condition. An additional hydrogen charging process is
needed. The simplicity (I) is 1, indicating complex. The test procedure of SSRT is easy and computer-
controlled. SSRT can be carried out within several hours, but only one test can be carried out at a time.
Thus the simplicity (II) is evaluated as 2 (moderate). The simplicity of SSRT according to equation (9-
2) is 2.
Figure 9.2 illustrates the differentiation and simplicity of the investigated methods. The differentiation
is evaluated as 0 (poor) to 10 (good). The differentiation as calculated in this work strongly depends on
the number of investigated steels. In the current work, the differentiation is calculated based on ten
investigated AHSS alloys. But in the 90° V-bending test, only 6 kinds of 1180 MPa steels were
investigated. Thus the differentiation of immersion tests with V-bend samples has the lowest value of
all test methods; however this is not directly comparable to the differentiation of the other tests. The
simplicity, which is shown in x-axial, is in the range from 1, meaning the most complex, to 9, indicating
the easiest. The test methods which stay in the blue area are the suggested methods, displaying good
balance between differentiation and simplicity in this work.
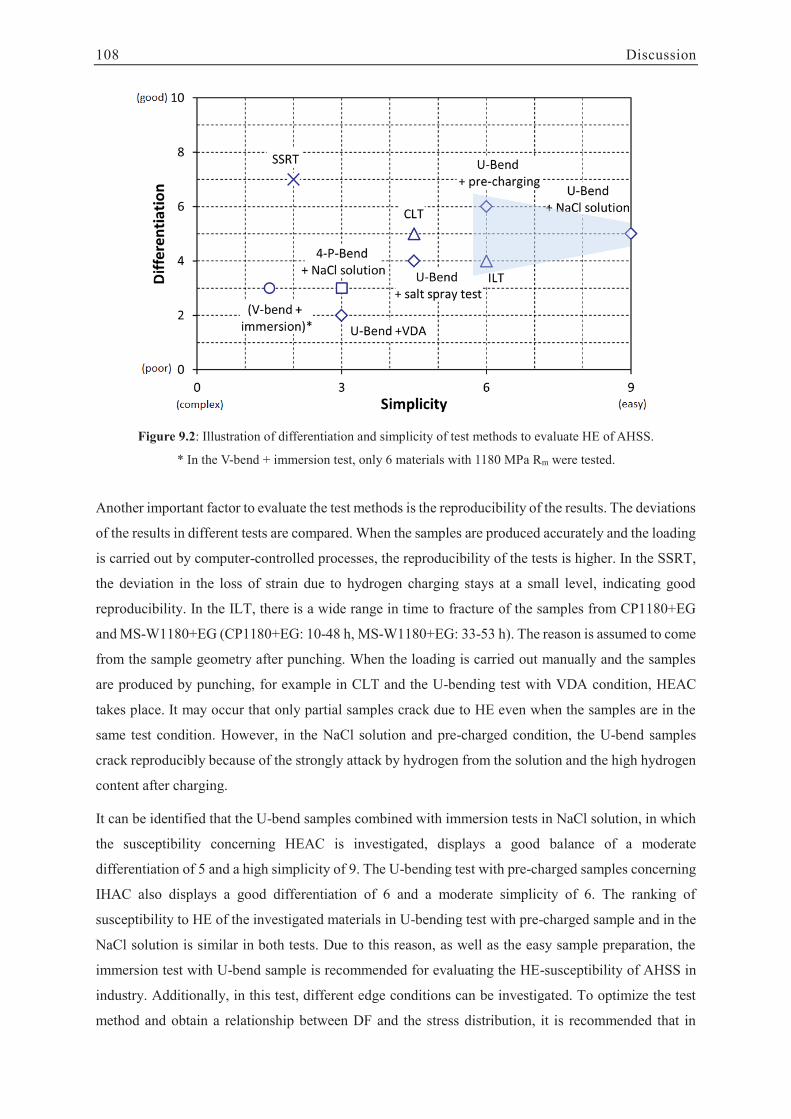
108 Discussion
Figure 9.2: Illustration of differentiation and simplicity of test methods to evaluate HE of AHSS.
* In the V-bend + immersion test, only 6 materials with 1180 MPa Rm were tested.
Another important factor to evaluate the test methods is the reproducibility of the results. The deviations
of the results in different tests are compared. When the samples are produced accurately and the loading
is carried out by computer-controlled processes, the reproducibility of the tests is higher. In the SSRT,
the deviation in the loss of strain due to hydrogen charging stays at a small level, indicating good
reproducibility. In the ILT, there is a wide range in time to fracture of the samples from CP1180+EG
and MS-W1180+EG (CP1180+EG: 10-48 h, MS-W1180+EG: 33-53 h). The reason is assumed to come
from the sample geometry after punching. When the loading is carried out manually and the samples
are produced by punching, for example in CLT and the U-bending test with VDA condition, HEAC
takes place. It may occur that only partial samples crack due to HE even when the samples are in the
same test condition. However, in the NaCl solution and pre-charged condition, the U-bend samples
crack reproducibly because of the strongly attack by hydrogen from the solution and the high hydrogen
content after charging.
It can be identified that the U-bend samples combined with immersion tests in NaCl solution, in which
the susceptibility concerning HEAC is investigated, displays a good balance of a moderate
differentiation of 5 and a high simplicity of 9. The U-bending test with pre-charged samples concerning
IHAC also displays a good differentiation of 6 and a moderate simplicity of 6. The ranking of
susceptibility to HE of the investigated materials in U-bending test with pre-charged sample and in the
NaCl solution is similar in both tests. Due to this reason, as well as the easy sample preparation, the
immersion test with U-bend sample is recommended for evaluating the HE-susceptibility of AHSS in
industry. Additionally, in this test, different edge conditions can be investigated. To optimize the test
method and obtain a relationship between DF and the stress distribution, it is recommended that in
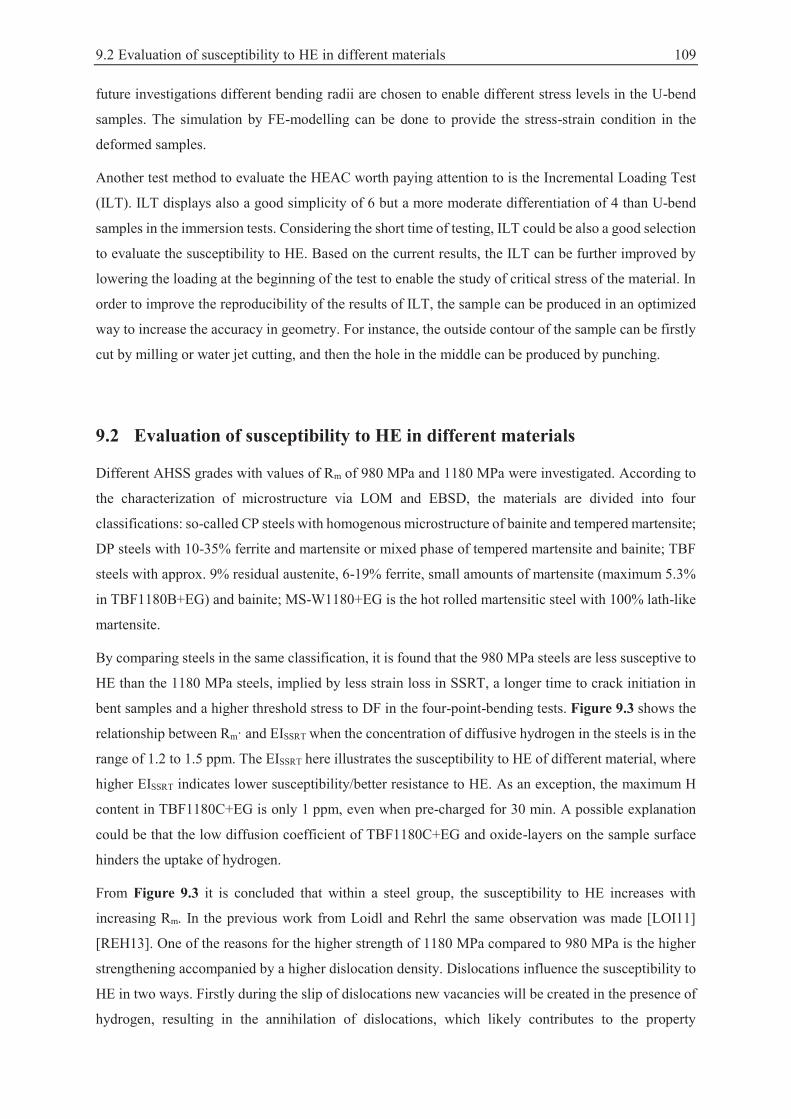
9.2 Evaluation of susceptibility to HE in different materials 109
future investigations different bending radii are chosen to enable different stress levels in the U-bend
samples. The simulation by FE-modelling can be done to provide the stress-strain condition in the
deformed samples.
Another test method to evaluate the HEAC worth paying attention to is the Incremental Loading Test
(ILT). ILT displays also a good simplicity of 6 but a more moderate differentiation of 4 than U-bend
samples in the immersion tests. Considering the short time of testing, ILT could be also a good selection
to evaluate the susceptibility to HE. Based on the current results, the ILT can be further improved by
lowering the loading at the beginning of the test to enable the study of critical stress of the material. In
order to improve the reproducibility of the results of ILT, the sample can be produced in an optimized
way to increase the accuracy in geometry. For instance, the outside contour of the sample can be firstly
cut by milling or water jet cutting, and then the hole in the middle can be produced by punching.
9.2 Evaluation of susceptibility to HE in different materials
Different AHSS grades with values of Rm of 980 MPa and 1180 MPa were investigated. According to
the characterization of microstructure via LOM and EBSD, the materials are divided into four
classifications: so-called CP steels with homogenous microstructure of bainite and tempered martensite;
DP steels with 10-35% ferrite and martensite or mixed phase of tempered martensite and bainite; TBF
steels with approx. 9% residual austenite, 6-19% ferrite, small amounts of martensite (maximum 5.3%
in TBF1180B+EG) and bainite; MS-W1180+EG is the hot rolled martensitic steel with 100% lath-like
martensite.
By comparing steels in the same classification, it is found that the 980 MPa steels are less susceptive to
HE than the 1180 MPa steels, implied by less strain loss in SSRT, a longer time to crack initiation in
bent samples and a higher threshold stress to DF in the four-point-bending tests. Figure 9.3 shows the
relationship between Rm· and EISSRT when the concentration of diffusive hydrogen in the steels is in the
range of 1.2 to 1.5 ppm. The EISSRT here illustrates the susceptibility to HE of different material, where
higher EISSRT indicates lower susceptibility/better resistance to HE. As an exception, the maximum H
content in TBF1180C+EG is only 1 ppm, even when pre-charged for 30 min. A possible explanation
could be that the low diffusion coefficient of TBF1180C+EG and oxide-layers on the sample surface
hinders the uptake of hydrogen.
From Figure 9.3 it is concluded that within a steel group, the susceptibility to HE increases with
increasing Rm. In the previous work from Loidl and Rehrl the same observation was made [LOI11]
[REH13]. One of the reasons for the higher strength of 1180 MPa compared to 980 MPa is the higher
strengthening accompanied by a higher dislocation density. Dislocations influence the susceptibility to
HE in two ways. Firstly during the slip of dislocations new vacancies will be created in the presence of
hydrogen, resulting in the annihilation of dislocations, which likely contributes to the property
110 Discussion
degradation [TAK08]. Secondly the dislocations travel in the steels, and pile up when they meet obstacle
or boundaries. The hydrogen will accumulate in the vicinities of the obstacle and boundaries, where the
high dislocation density localizes, and reduce the cohesion of the matrix [TAK12] [BAI16] [PAR15].
Hence, when the dislocation density in the steel is in a higher level after strengthening, the susceptibility
to HE is clearly increased.
Figure 9.3: Embrittlement Index in SSRT against tensile strength of the materials. Diffusive hydrogen
concentration is in the range of 1.2-1.5 ppm. (*the H-content TBF1180C is 1 ppm). Higher EI means better resistance to HE.
By comparing the results from investigations concerning Internal Hydrogen Assisted Cracking (IHAC)
(SSRT and pre-charged samples in U-bending test), the ranking of HE-susceptibilities of four
classifications of materials from high to low is:
TBF steel > DP steel > CP steel > MS-W steel
The results of the investigations concerning the behavior of Hydrogen Environment Assisted Cracking
(HEAC) are consistent with that of the IHAC-related tests. There are only some exceptions to this trend.
In ILT and CLT DP980+EG reveals higher susceptibility to HE than TBF980+EG, because of the higher
hydrogen concentration of DP980 in as-delivered state. Furthermore, when the sheet samples were
deformed to a certain deformation level and tested in moderate corrosive mediums, such as U-bend
sample in salt spray test or VDA corrosion test, some TBF1180 steel are slightly more resistance to DF
than the DP1180 steels. This is assumed to be due to either the differing stress level after bending or
the higher resistance to corrosion.
To discuss the susceptibility of different steels to HE, possible influences such as the volume fraction
of retained austenite and the grain size are discussed in this work. As investigated, the content of C
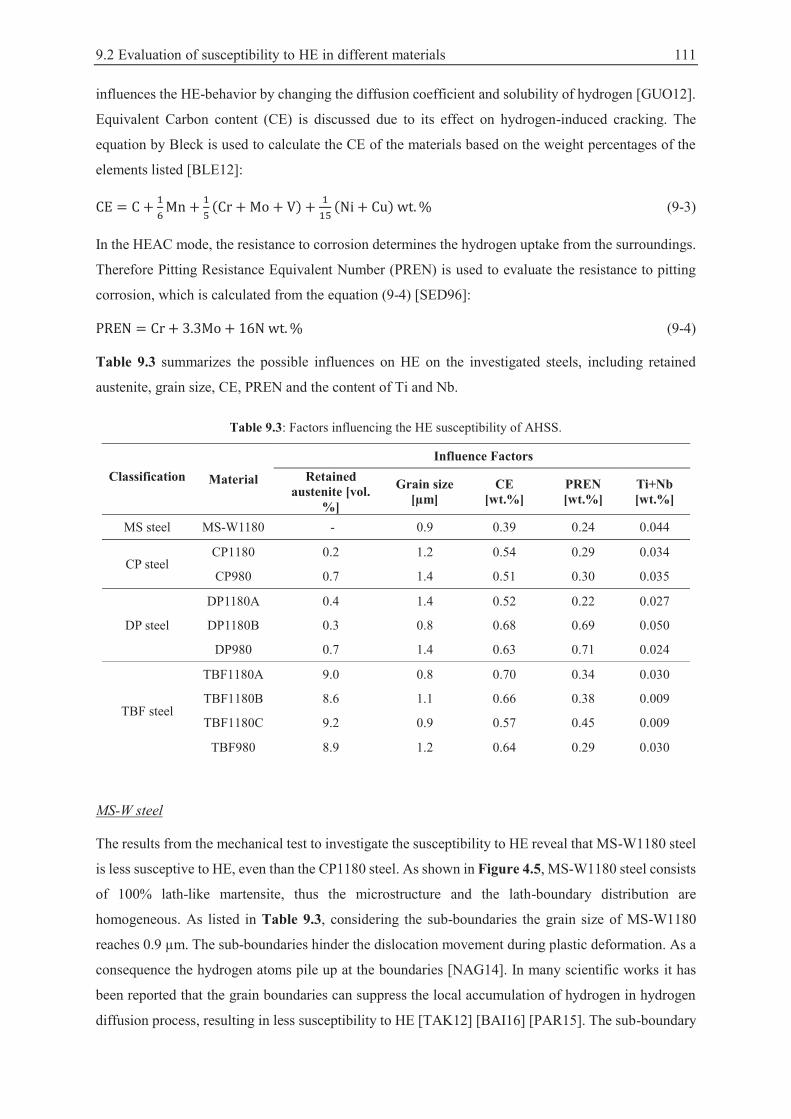
9.2 Evaluation of susceptibility to HE in different materials 111
influences the HE-behavior by changing the diffusion coefficient and solubility of hydrogen [GUO12].
Equivalent Carbon content (CE) is discussed due to its effect on hydrogen-induced cracking. The
equation by Bleck is used to calculate the CE of the materials based on the weight percentages of the
elements listed [BLE12]:
(9-3)
In the HEAC mode, the resistance to corrosion determines the hydrogen uptake from the surroundings.
Therefore Pitting Resistance Equivalent Number (PREN) is used to evaluate the resistance to pitting
corrosion, which is calculated from the equation (9-4) [SED96]:
(9-4)
Table 9.3 summarizes the possible influences on HE on the investigated steels, including retained
austenite, grain size, CE, PREN and the content of Ti and Nb.
Table 9.3: Factors influencing the HE susceptibility of AHSS.
Material
Influence Factors Classification Retained
austenite [vol. %]
Grain size [μm]
CE [wt.%]
PREN [wt.%]
Ti+Nb [wt.%]
MS steel MS-W1180 - 0.9 0.39 0.24 0.044
CP steel CP1180 0.2 1.2 0.54 0.29 0.034
CP980 0.7 1.4 0.51 0.30 0.035
DP steel
DP1180A 0.4 1.4 0.52 0.22 0.027
DP1180B 0.3 0.8 0.68 0.69 0.050
DP980 0.7 1.4 0.63 0.71 0.024
TBF steel
TBF1180A 9.0 0.8 0.70 0.34 0.030
TBF1180B 8.6 1.1 0.66 0.38 0.009
TBF1180C 9.2 0.9 0.57 0.45 0.009
TBF980 8.9 1.2 0.64 0.29 0.030
MS-W steel
The results from the mechanical test to investigate the susceptibility to HE reveal that MS-W1180 steel
is less susceptive to HE, even than the CP1180 steel. As shown in Figure 4.5, MS-W1180 steel consists
of 100% lath-like martensite, thus the microstructure and the lath-boundary distribution are
homogeneous. As listed in Table 9.3, considering the sub-boundaries the grain size of MS-W1180
reaches 0.9 μm. The sub-boundaries hinder the dislocation movement during plastic deformation. As a
consequence the hydrogen atoms pile up at the boundaries [NAG14]. In many scientific works it has
been reported that the grain boundaries can suppress the local accumulation of hydrogen in hydrogen
diffusion process, resulting in less susceptibility to HE [TAK12] [BAI16] [PAR15]. The sub-boundary
112 Discussion
has a lower misorietation angle than grain boundary, but is assumed to influence the interaction with
slip system and reduce the susceptibility to HE as well. Nagao found that when the slip band interacts
with the sub-boundary-like lath structure the fracture surface reveals quasi-cleavage mode [NAG14],
which is in accordance with our observation.
According to the hydrogen calibration curves under electro-charging, as illustrated in Figure 5.2, after
the same charging time the hydrogen concentration in MS-W1180 is lower than that in CP1180. It can
be deduced that in MS-W1180 the hydrogen diffuses more slowly than that in CP1180. The research
of Loidl confirmed that the diffusion coefficient of hydrogen in Martensitic steel is much lower than
that in complex-phase steel [LOI14]. Additionally, the CE value of MS-W1180 is the lowest in the
investigated material (0.39%, as shown in Table 9.3), which can be also prove that the diffusion of
hydrogen is at a slow velocity.
CP steels
CP1180 displays a higher EI in the mechanical tests of this work, indicating a lower susceptibility to
HE compared to DP and TBF steels. Loidl et al. have reported similar observation when the steel
samples are loaded in H2 atmosphere [LOI11].
As illustrated in Figure 4.2, in the SEM images in the Nital-etched samples from CP1180, mixed bainite
and tempered martensite phases with boundaries (grain boundary and sub-boundary) and carbides have
been observed. The grain size of CP1180 is 1.2 μm and a sub-boundary structure has been found. The
grain boundaries and sub-boundaries in CP steels play an important role in HIC processes. Usually the
hydrogen segregated to the grain boundary causes intergranular fracture [PAR15]. But in the current
work, on the fracture surfaces of CP1180 quasi-cleavage fracture mode can be found Figure 6.5 and
Figure 6.19 (a). Because of the function of boundaries, CP1180 displayed higher EI in the mechanical
test indicating HE. The dispersed carbides are also seen as a reason for the low susceptibility to HE in
CP steels. According to the chemical composition, as shown in Table 4.1, it can be deduced that the
carbides in CP1180 are TiC. TiC acts as a beneficial trapping site for hydrogen atoms during the
hydrogen diffusion and trapping processes, due to its high required activation energy for hydrogen (
[VIY05][BEI09]. The homogeneously distributed TiC in CP1180 effectively prevents the local
hydrogen accumulation process. In the mechanical tests investigating both IHAC and HEAC, CP1180
displayed low sensitivity to HE.
DP steels
DP1180A and DP1180B display a higher susceptibility to HE than the CP1180 and MS-W1180 steels,
shown by a value of EISSRT in the range of 40-60% and a lower threshold stress to DF in the CLT and
the four-point-bending test.
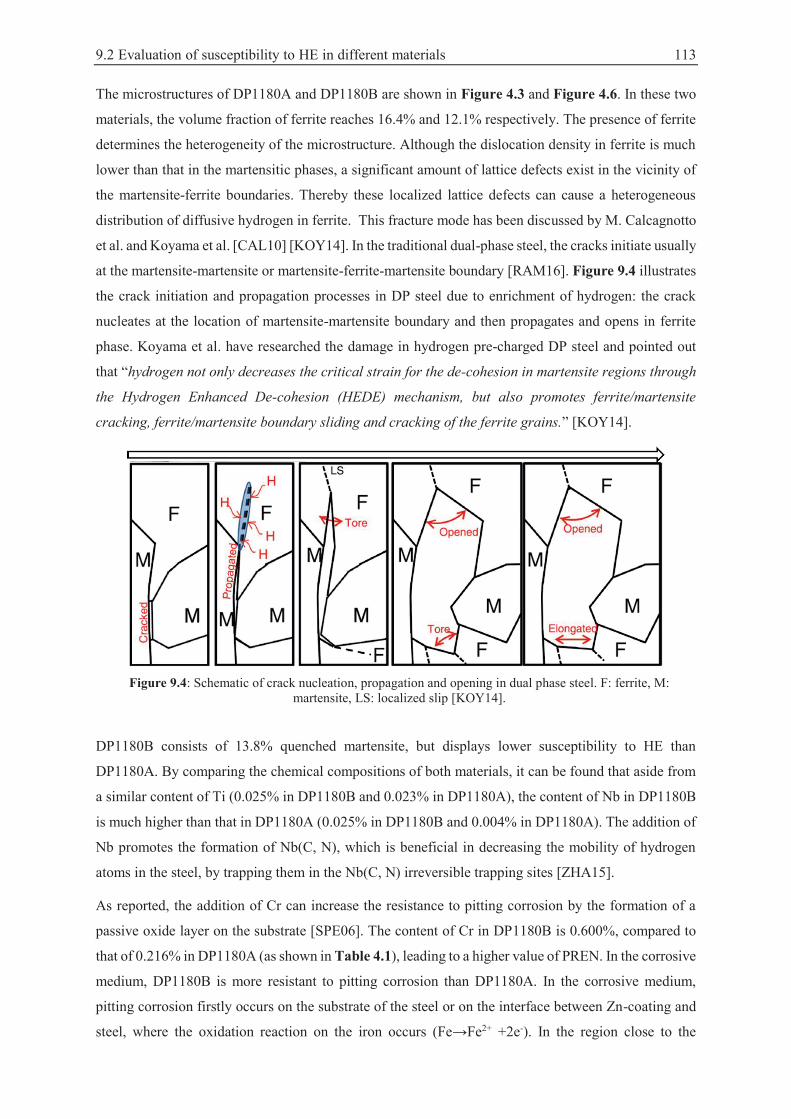
9.2 Evaluation of susceptibility to HE in different materials 113
The microstructures of DP1180A and DP1180B are shown in Figure 4.3 and Figure 4.6. In these two
materials, the volume fraction of ferrite reaches 16.4% and 12.1% respectively. The presence of ferrite
determines the heterogeneity of the microstructure. Although the dislocation density in ferrite is much
lower than that in the martensitic phases, a significant amount of lattice defects exist in the vicinity of
the martensite-ferrite boundaries. Thereby these localized lattice defects can cause a heterogeneous
distribution of diffusive hydrogen in ferrite. This fracture mode has been discussed by M. Calcagnotto
et al. and Koyama et al. [CAL10] [KOY14]. In the traditional dual-phase steel, the cracks initiate usually
at the martensite-martensite or martensite-ferrite-martensite boundary [RAM16]. Figure 9.4 illustrates
the crack initiation and propagation processes in DP steel due to enrichment of hydrogen: the crack
nucleates at the location of martensite-martensite boundary and then propagates and opens in ferrite
phase. Koyama et al. have researched the damage in hydrogen pre-charged DP steel and pointed out
that “hydrogen not only decreases the critical strain for the de-cohesion in martensite regions through
the Hydrogen Enhanced De-cohesion (HEDE) mechanism, but also promotes ferrite/martensite
cracking, ferrite/martensite boundary sliding and cracking of the ferrite grains.” [KOY14].
Figure 9.4: Schematic of crack nucleation, propagation and opening in dual phase steel. F: ferrite, M:
martensite, LS: localized slip [KOY14].
DP1180B consists of 13.8% quenched martensite, but displays lower susceptibility to HE than
DP1180A. By comparing the chemical compositions of both materials, it can be found that aside from
a similar content of Ti (0.025% in DP1180B and 0.023% in DP1180A), the content of Nb in DP1180B
is much higher than that in DP1180A (0.025% in DP1180B and 0.004% in DP1180A). The addition of
Nb promotes the formation of Nb(C, N), which is beneficial in decreasing the mobility of hydrogen
atoms in the steel, by trapping them in the Nb(C, N) irreversible trapping sites [ZHA15].
As reported, the addition of Cr can increase the resistance to pitting corrosion by the formation of a
passive oxide layer on the substrate [SPE06]. The content of Cr in DP1180B is 0.600%, compared to
that of 0.216% in DP1180A (as shown in Table 4.1), leading to a higher value of PREN. In the corrosive
medium, DP1180B is more resistant to pitting corrosion than DP1180A. In the corrosive medium,
pitting corrosion firstly occurs on the substrate of the steel or on the interface between Zn-coating and
steel, where the oxidation reaction on the iron occurs (Fe→Fe2+ +2e-). In the region close to the
114 Discussion
steel/solution interface, a great amount of Cr ions are generated. The hydrogen ions are enriched in the
vicinity of the locations of pitting corrosion. Thereby the hydrogen uptake is enhanced locally. A better
resistance to pitting corrosion weakens the accompanied hydrogen penetration into the material. As a
consequence, the DF due to HEAC in DP1180B occurs more moderately than that of DP1180A, which
is confirmed by ILT and U-bending test in NaCl solution.
In addition, the grain boundaries in DP1180B are assumed to be to the reason for its lower susceptibility
to HE than DP1180A. The grain size of DP1180B (0.82 μm) is finer than that of DP1180A (1.38 μm).
The explanation could be that the presence of more grain boundaries suppresses the local concentration
of hydrogen under deformation, thereby increasing the resistance to HE.
TBF steels
TBF steels have a total elongation over 10% when the tensile strength is 1180 MPa and over 15% when
the tensile strength is 980 MPa. The ductility of the material is due to the retained austenite and ferrite
phases. Meanwhile the susceptibility to HE of TBF steels is higher than that in other steels. The crystal
structure of austenite, a face-centered cubic (fcc) lattice, dictates the high solubility and low diffusivity
of hydrogen [BLE07] [LAU15]. The hydrogen effect in Transformation-Induced-Plasticity (TRIP)
steels has been investigated in many scientific works [GUO12] [LAU15]. It has been found that the
hydrogen solubility in austenite is much higher than that of phases with body-centered cubic (bcc)
structures like martensite and ferrite [ZHU14] [LAU15]. The phase transformation of retained austenite
decomposing into martensite can occur under plastic deformation [GUO12], leading to an increase of
hydrogen diffusivity [KIM12]. Thus the newly generated martensite is supersaturated with hydrogen
because of its lower hydrogen solubility than that of austenite, thus explaining the high susceptibility
of TRIP steels to HE [LAU15] [ZHU16] [ZHU13]. In this damage mechanism, ferrite does not play an
essential role, contrary to DP steel. Evidence suggesting the segregation of hydrogen to the grain
boundaries are the intergranular facets on the fracture surfaces [PAR15]. According to the research of
Zhu et al., in TRIP-assisted AHSS the supersaturated diffusive hydrogen segregates quickly to the misfit
strained locations between transformed martensite and austenite or inside of martensite blocks [ZHU14],
as illustrated in Figure 9.5.
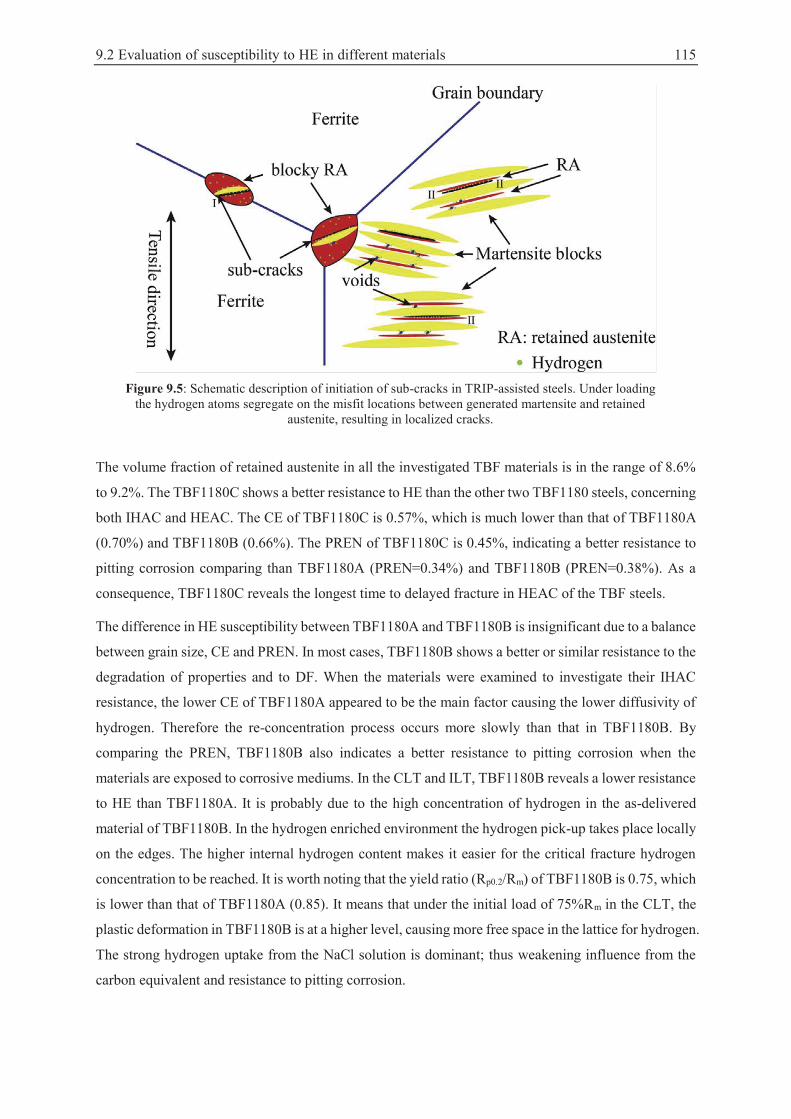
9.2 Evaluation of susceptibility to HE in different materials 115
Figure 9.5: Schematic description of initiation of sub-cracks in TRIP-assisted steels. Under loading
the hydrogen atoms segregate on the misfit locations between generated martensite and retained austenite, resulting in localized cracks.
The volume fraction of retained austenite in all the investigated TBF materials is in the range of 8.6%
to 9.2%. The TBF1180C shows a better resistance to HE than the other two TBF1180 steels, concerning
both IHAC and HEAC. The CE of TBF1180C is 0.57%, which is much lower than that of TBF1180A
(0.70%) and TBF1180B (0.66%). The PREN of TBF1180C is 0.45%, indicating a better resistance to
pitting corrosion comparing than TBF1180A (PREN=0.34%) and TBF1180B (PREN=0.38%). As a
consequence, TBF1180C reveals the longest time to delayed fracture in HEAC of the TBF steels.
The difference in HE susceptibility between TBF1180A and TBF1180B is insignificant due to a balance
between grain size, CE and PREN. In most cases, TBF1180B shows a better or similar resistance to the
degradation of properties and to DF. When the materials were examined to investigate their IHAC
resistance, the lower CE of TBF1180A appeared to be the main factor causing the lower diffusivity of
hydrogen. Therefore the re-concentration process occurs more slowly than that in TBF1180B. By
comparing the PREN, TBF1180B also indicates a better resistance to pitting corrosion when the
materials are exposed to corrosive mediums. In the CLT and ILT, TBF1180B reveals a lower resistance
to HE than TBF1180A. It is probably due to the high concentration of hydrogen in the as-delivered
material of TBF1180B. In the hydrogen enriched environment the hydrogen pick-up takes place locally
on the edges. The higher internal hydrogen content makes it easier for the critical fracture hydrogen
concentration to be reached. It is worth noting that the yield ratio (Rp0.2/Rm) of TBF1180B is 0.75, which
is lower than that of TBF1180A (0.85). It means that under the initial load of 75%Rm in the CLT, the
plastic deformation in TBF1180B is at a higher level, causing more free space in the lattice for hydrogen.
The strong hydrogen uptake from the NaCl solution is dominant; thus weakening influence from the
carbon equivalent and resistance to pitting corrosion.
116 Discussion
In summary, the susceptibility to HE is usually proportional to the tensile strength of AHSS, because
strengthening is usually associated with an increase in dislocation density. The susceptibility to HE is
influenced by various material-based parameters. To compare the different steel groups, various factors
influence the HE behavior of AHSS, like volume friction of retained austenite, chemical compositions
and grain size of the microstructure. Martensitic steel shows the lowest sensitivity in the four
investigated steel groups, which is attributed to its homogeneous fine lath-like structure and low CE.
The CP steel also displays low susceptibility to HE due to its homogenous microstructure of mixed
tempered martensite and bainite. Moreover, the dispersed TiC in CP1180 is assumed to reduce the
susceptibility to HE by the trapping effect on the mobility of hydrogen, thereby the resistance to DF of
CP1180 is increased. The DP steels show a higher susceptibility to HE than CP and MS-W steels. The
presence of ferrite in the martensite/tempered martensite structure increases the heterogeneity of the
microstructure. Aside from the phase fraction, the most dominant factor contributing to the higher HE
susceptibility of DP1180A is the coarser grain size than that of other materials. Meanwhile, the high
CE of DP1180B reduces its resistance to HE. The TBF steels reveal the highest susceptibility to HE of
the four steel groups. The explanation is the presence of retained austenite and a high CE value of the
material.
9.3 Influence of process-immanent parameters
9.3.1 Influence of welding
In the ILT in a NaCl solution, DF occurs in the welded samples when the loading was below the Rm of
the welded material. In DP1180A+EG and TBF1180A+EG steels, the time to fracture is very short,
even when the load stays at 75% of Rm, indicating high susceptibility to HE in the tested medium. This
result is consistent with previous work in the literature, in which it has been reported that after welding
the risk to HE of the material is increased [STO94] [PER15] [LOI14].
In the fracture surface analyzed by SEM it can be seen that the hydrogen-induced crack initiates from
the welded zone (Figure 6.16). The high susceptibility of the welded material can be explained by the
phase transformation during the welding process, which leads to an increase in hardness. As shown in
Figure 6.17, the hardness in welding zone of TBF1180A+EG is increased from 400-430 HV0.5 to 520-
570 HV0.5, and in the Heat Affected Zone (HAZ) the hardness is only 350 HV0.5. The increase in
hardness depends on the C content of the material, as illustrated in Figure 9.6. A higher C content leads
to a higher hardness in the welded zone. When the tensile test is carried out in air, the softened
microstructure in the HAZ results in fracture initiation locally. In contrast, when the welded samples
are exposed to a hydrogen-containing environment, reversible hydrogen embrittlement causes
unpredictable failure of the material under low loads [SUN15] [SHV00]. The diffusivity and solubility
of hydrogen are discretized in terms of microstructures in the divided zones after welding.
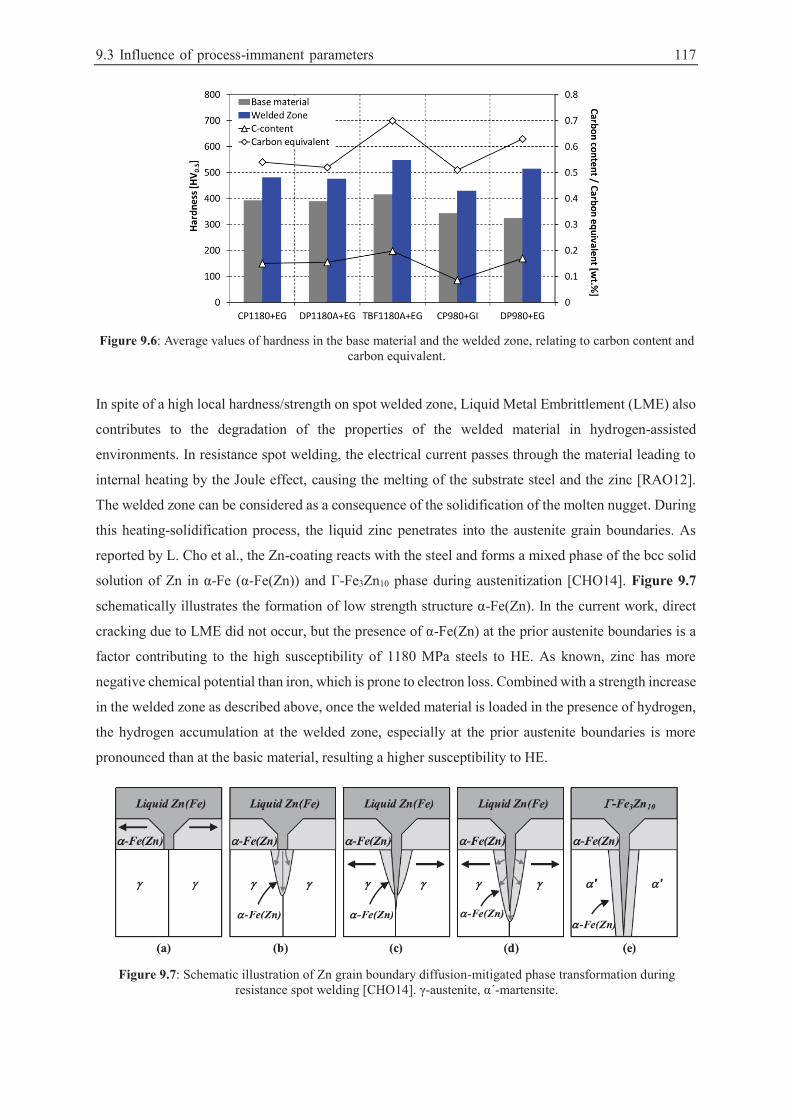
9.3 Influence of process-immanent parameters 117
Figure 9.6: Average values of hardness in the base material and the welded zone, relating to carbon content and
carbon equivalent.
In spite of a high local hardness/strength on spot welded zone, Liquid Metal Embrittlement (LME) also
contributes to the degradation of the properties of the welded material in hydrogen-assisted
environments. In resistance spot welding, the electrical current passes through the material leading to
internal heating by the Joule effect, causing the melting of the substrate steel and the zinc [RAO12].
The welded zone can be considered as a consequence of the solidification of the molten nugget. During
this heating-solidification process, the liquid zinc penetrates into the austenite grain boundaries. As
reported by L. Cho et al., the Zn-coating reacts with the steel and forms a mixed phase of the bcc solid
solution of Zn in α-Fe (α-Fe(Zn)) and Г-Fe3Zn10 phase during austenitization [CHO14]. Figure 9.7
schematically illustrates the formation of low strength structure α-Fe(Zn). In the current work, direct
cracking due to LME did not occur, but the presence of α-Fe(Zn) at the prior austenite boundaries is a
factor contributing to the high susceptibility of 1180 MPa steels to HE. As known, zinc has more
negative chemical potential than iron, which is prone to electron loss. Combined with a strength increase
in the welded zone as described above, once the welded material is loaded in the presence of hydrogen,
the hydrogen accumulation at the welded zone, especially at the prior austenite boundaries is more
pronounced than at the basic material, resulting a higher susceptibility to HE.
Figure 9.7: Schematic illustration of Zn grain boundary diffusion-mitigated phase transformation during resistance spot welding [CHO14]. γ-austenite, α´-martensite.
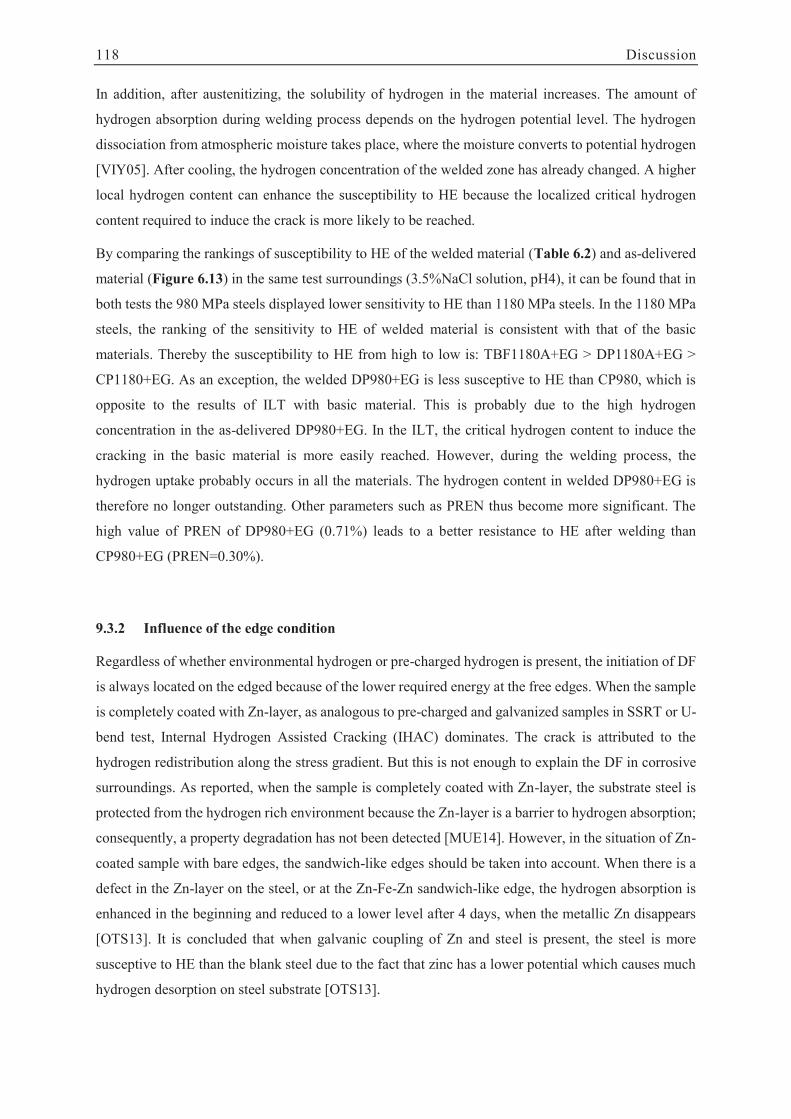
118 Discussion
In addition, after austenitizing, the solubility of hydrogen in the material increases. The amount of
hydrogen absorption during welding process depends on the hydrogen potential level. The hydrogen
dissociation from atmospheric moisture takes place, where the moisture converts to potential hydrogen
[VIY05]. After cooling, the hydrogen concentration of the welded zone has already changed. A higher
local hydrogen content can enhance the susceptibility to HE because the localized critical hydrogen
content required to induce the crack is more likely to be reached.
By comparing the rankings of susceptibility to HE of the welded material (Table 6.2) and as-delivered
material (Figure 6.13) in the same test surroundings (3.5%NaCl solution, pH4), it can be found that in
both tests the 980 MPa steels displayed lower sensitivity to HE than 1180 MPa steels. In the 1180 MPa
steels, the ranking of the sensitivity to HE of welded material is consistent with that of the basic
materials. Thereby the susceptibility to HE from high to low is: TBF1180A+EG > DP1180A+EG >
CP1180+EG. As an exception, the welded DP980+EG is less susceptive to HE than CP980, which is
opposite to the results of ILT with basic material. This is probably due to the high hydrogen
concentration in the as-delivered DP980+EG. In the ILT, the critical hydrogen content to induce the
cracking in the basic material is more easily reached. However, during the welding process, the
hydrogen uptake probably occurs in all the materials. The hydrogen content in welded DP980+EG is
therefore no longer outstanding. Other parameters such as PREN thus become more significant. The
high value of PREN of DP980+EG (0.71%) leads to a better resistance to HE after welding than
CP980+EG (PREN=0.30%).
9.3.2 Influence of the edge condition
Regardless of whether environmental hydrogen or pre-charged hydrogen is present, the initiation of DF
is always located on the edged because of the lower required energy at the free edges. When the sample
is completely coated with Zn-layer, as analogous to pre-charged and galvanized samples in SSRT or U-
bend test, Internal Hydrogen Assisted Cracking (IHAC) dominates. The crack is attributed to the
hydrogen redistribution along the stress gradient. But this is not enough to explain the DF in corrosive
surroundings. As reported, when the sample is completely coated with Zn-layer, the substrate steel is
protected from the hydrogen rich environment because the Zn-layer is a barrier to hydrogen absorption;
consequently, a property degradation has not been detected [MUE14]. However, in the situation of Zn-
coated sample with bare edges, the sandwich-like edges should be taken into account. When there is a
defect in the Zn-layer on the steel, or at the Zn-Fe-Zn sandwich-like edge, the hydrogen absorption is
enhanced in the beginning and reduced to a lower level after 4 days, when the metallic Zn disappears
[OTS13]. It is concluded that when galvanic coupling of Zn and steel is present, the steel is more
susceptive to HE than the blank steel due to the fact that zinc has a lower potential which causes much
hydrogen desorption on steel substrate [OTS13].
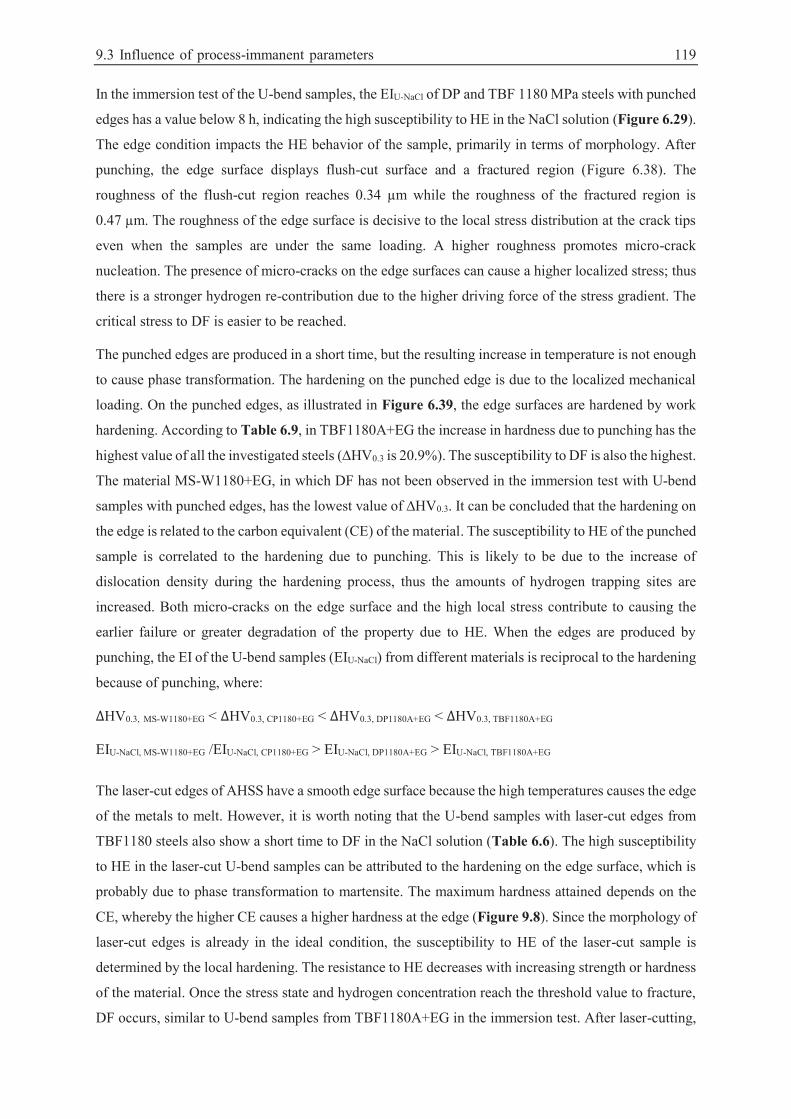
9.3 Influence of process-immanent parameters 119
In the immersion test of the U-bend samples, the EIU-NaCl of DP and TBF 1180 MPa steels with punched
edges has a value below 8 h, indicating the high susceptibility to HE in the NaCl solution (Figure 6.29).
The edge condition impacts the HE behavior of the sample, primarily in terms of morphology. After
punching, the edge surface displays flush-cut surface and a fractured region (Figure 6.38). The
roughness of the flush-cut region reaches 0.34 μm while the roughness of the fractured region is
0.47 μm. The roughness of the edge surface is decisive to the local stress distribution at the crack tips
even when the samples are under the same loading. A higher roughness promotes micro-crack
nucleation. The presence of micro-cracks on the edge surfaces can cause a higher localized stress; thus
there is a stronger hydrogen re-contribution due to the higher driving force of the stress gradient. The
critical stress to DF is easier to be reached.
The punched edges are produced in a short time, but the resulting increase in temperature is not enough
to cause phase transformation. The hardening on the punched edge is due to the localized mechanical
loading. On the punched edges, as illustrated in Figure 6.39, the edge surfaces are hardened by work
hardening. According to Table 6.9, in TBF1180A+EG the increase in hardness due to punching has the
highest value of all the investigated steels (∆HV0.3 is 20.9%). The susceptibility to DF is also the highest.
The material MS-W1180+EG, in which DF has not been observed in the immersion test with U-bend
samples with punched edges, has the lowest value of ∆HV0.3. It can be concluded that the hardening on
the edge is related to the carbon equivalent (CE) of the material. The susceptibility to HE of the punched
sample is correlated to the hardening due to punching. This is likely to be due to the increase of
dislocation density during the hardening process, thus the amounts of hydrogen trapping sites are
increased. Both micro-cracks on the edge surface and the high local stress contribute to causing the
earlier failure or greater degradation of the property due to HE. When the edges are produced by
punching, the EI of the U-bend samples (EIU-NaCl) from different materials is reciprocal to the hardening
because of punching, where:
HV0.3, MS-W1180+EG < HV0.3, CP1180+EG < HV0.3, DP1180A+EG < HV0.3, TBF1180A+EG
EIU-NaCl, MS-W1180+EG /EIU-NaCl, CP1180+EG > EIU-NaCl, DP1180A+EG > EIU-NaCl, TBF1180A+EG
The laser-cut edges of AHSS have a smooth edge surface because the high temperatures causes the edge
of the metals to melt. However, it is worth noting that the U-bend samples with laser-cut edges from
TBF1180 steels also show a short time to DF in the NaCl solution (Table 6.6). The high susceptibility
to HE in the laser-cut U-bend samples can be attributed to the hardening on the edge surface, which is
probably due to phase transformation to martensite. The maximum hardness attained depends on the
CE, whereby the higher CE causes a higher hardness at the edge (Figure 9.8). Since the morphology of
laser-cut edges is already in the ideal condition, the susceptibility to HE of the laser-cut sample is
determined by the local hardening. The resistance to HE decreases with increasing strength or hardness
of the material. Once the stress state and hydrogen concentration reach the threshold value to fracture,
DF occurs, similar to U-bend samples from TBF1180A+EG in the immersion test. After laser-cutting,
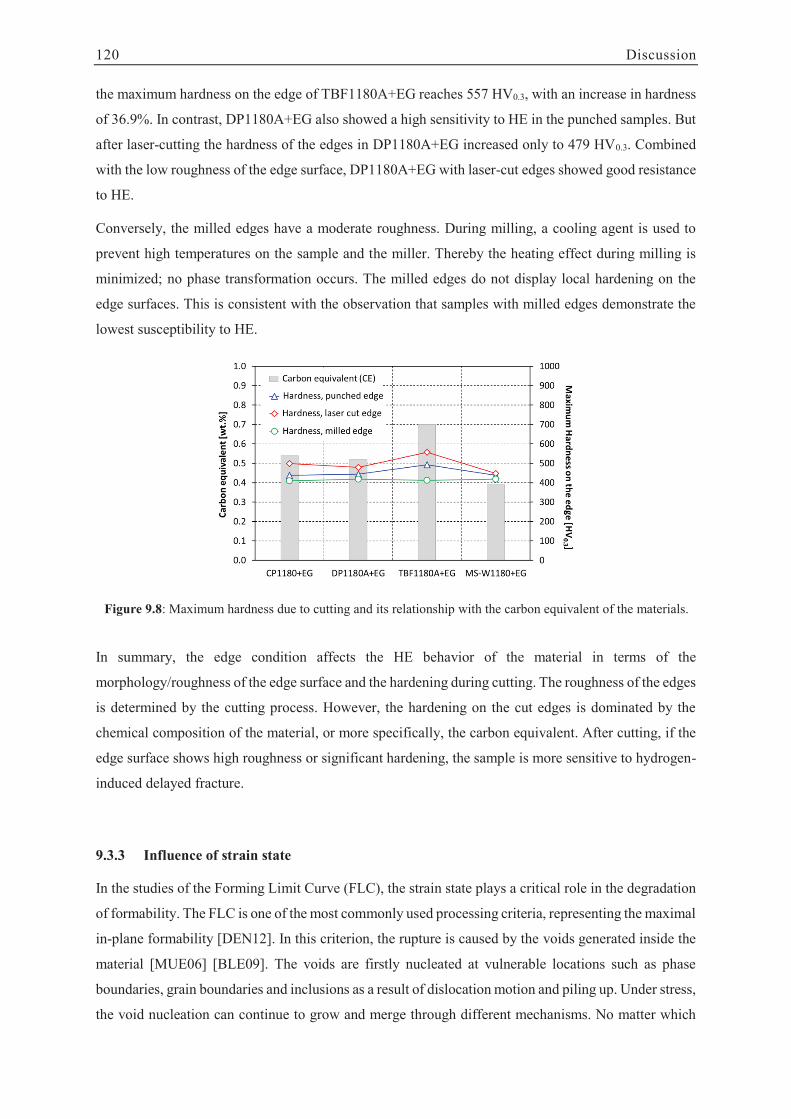
120 Discussion
the maximum hardness on the edge of TBF1180A+EG reaches 557 HV0.3, with an increase in hardness
of 36.9%. In contrast, DP1180A+EG also showed a high sensitivity to HE in the punched samples. But
after laser-cutting the hardness of the edges in DP1180A+EG increased only to 479 HV0.3. Combined
with the low roughness of the edge surface, DP1180A+EG with laser-cut edges showed good resistance
to HE.
Conversely, the milled edges have a moderate roughness. During milling, a cooling agent is used to
prevent high temperatures on the sample and the miller. Thereby the heating effect during milling is
minimized; no phase transformation occurs. The milled edges do not display local hardening on the
edge surfaces. This is consistent with the observation that samples with milled edges demonstrate the
lowest susceptibility to HE.
Figure 9.8: Maximum hardness due to cutting and its relationship with the carbon equivalent of the materials.
In summary, the edge condition affects the HE behavior of the material in terms of the
morphology/roughness of the edge surface and the hardening during cutting. The roughness of the edges
is determined by the cutting process. However, the hardening on the cut edges is dominated by the
chemical composition of the material, or more specifically, the carbon equivalent. After cutting, if the
edge surface shows high roughness or significant hardening, the sample is more sensitive to hydrogen-
induced delayed fracture.
9.3.3 Influence of strain state
In the studies of the Forming Limit Curve (FLC), the strain state plays a critical role in the degradation
of formability. The FLC is one of the most commonly used processing criteria, representing the maximal
in-plane formability [DEN12]. In this criterion, the rupture is caused by the voids generated inside the
material [MUE06] [BLE09]. The voids are firstly nucleated at vulnerable locations such as phase
boundaries, grain boundaries and inclusions as a result of dislocation motion and piling up. Under stress,
the void nucleation can continue to grow and merge through different mechanisms. No matter which
9.3 Influence of process-immanent parameters 121
mechanism, the local stress in the vicinity of the voids is not constant but rather a gradient. The absorbed
hydrogen is activated from the reversible trapping sites, diffuses along the stress gradient from high to
low stress, accumulates at the tips and influences the formability through Hydrogen Enhanced Plasticity
(HELP) or Hydrogen Enhanced De-cohesion (HEDE) mechanisms.
The strain state is determined by the major deformation degree (φ1) and minor deformation degree (φ2)
of the sheet sample. In the uni-axial strain state the sheet material is in the uniaxial tension stress, where
φ1= -2φ2. In the state of plane strain, the sheet sample does not deform in the direction of minor
deformation (φ2=0). In the biaxial strain state, the sheet material is equally stretched in both major and
minor stress directions; thereby the φ1 is equal to φ2, in which the sheet is deformed with uniform sheet
thickness reduction [BLE09]. It is noteworthy that the sample is deformed in Nakajima test with a high
deformation velocity (the punch velocity 2 mm·s-1). The hydrogen re-contribution can occur only
locally, in limited locations. The hydrogen diffusion through the thickness of the material when the
material is drawn in a biaxial strain state is assumed to be stronger. Thus the degradation of formability
is most obvious in the biaxial strain state [GAO16a] [GAO16b].
The influence of the strain state on the bendability of pre-strained samples was studied by the
determination of the Bending Limit Curve (BLC). In the previous studies, it is concluded that the
hydrogen concentration increases with increasing pre-straining [LI14]. The explanation is probably due
to the generation of defects, which act as trapping sites for hydrogen atoms; and/or the interaction
between hydrogen and dislocations. The strain in the tensile direction is more significant than that in
the compressive direction, since the expanded lattices provide the space for hydrogen atoms. The
hydrogen concentration of the pre-strained samples reveals that the biaxial pre-strained samples have a
higher hydrogen concentration. It is assumed that pre-strain in the biaxial state provides more defects
for hydrogen because of the expanded lattice. The bending fracture is dominated by the shear stress on
the outside of bending edge, where the local stress and strain display the maximum values in the
thickness direction. Because of the punch velocity, (20 mm·s-1), the diffusion of hydrogen occurs within
a limited distance. The higher hydrogen concentration leads to a stronger degradation of the bendability
[GAO16b].
9.3.4 Influence of corrosive surroundings
U-bend samples were tested in three different corrosive surroundings: 3.5% NaCl solution (pH 4), 5%
NaCl spray surroundings, and VDA233-102 corrosive surroundings in cyclically changed 1% NaCl
spraying, humidity and temperature (Table 3.4). The EI is defined as the time to crack imitation (tc) to
evaluate the susceptibility to HE, concerning the HEAC. In the U-bend samples in the NaCl solution,
the Hydrogen-Induced Cracking (HIC) initiated in DP and TBF 1180 MPa steels after 3-8 h immersion
(Figure 6.29). However, in the salt spray surroundings, HIC was found the samples from the same
122 Discussion
materials after 1-3 days (Figure 6.35). In the VDA corrosive surroundings, the DF was observed after
1-2 weeks in small amount of samples (Figure 6.37).
In the NaCl solution, a high concentration of Cl- is present, which can destroy the oxide-layer on the
substrate, resulting in pitting corrosion. The oxidation reaction of Fe takes place. As a consequence,
hydrogen absorption occurs (Figure 2.8), leading to HIC. In the solution without blowing gas, a very
small fraction of O2 dissolves in the solution, hence the surroundings are considered be anaerobic. As
investigated, the substrate of the steel becomes more susceptible to HE when the surroundings are
anaerobic [MAY15]. When the U-bend samples are placed in the salt spray chamber, the surroundings
are regarded as aerobic; only when the O2 is exhausted does it becomes anaerobic. Though the Cl- is
enough in the salt spray surroundings, the reduction reaction 2H2O +O2 +4e- 4OH- is preferred,
thereby the Volmer reaction in hydrogen adsorption (H2O +e- Had +OH-) is compressed, resulting in
the longer time to HIC than in the NaCl solution. In the VDA corrosion test, the amount of Cl- is at a
small level due to the cyclic spraying of 1% NaCl solution (1 h, 3 times per week, Figure 3.9). In this
case, the destruction of the oxide-layer on the substrate surface takes a longer time than that in the NaCl
solution and spraying conditions. Additionally, the large chamber of VDA test allows that the test
surrounding is aerobic for a long time. All these reasons lead to a longer tc in the VDA corrosion test.
Changes in humidity and temperature are likely to affect the HE behaviors slightly.
In general, the HE of the materials is related to the corrosive surroundings. The corrosive ions and
aerobic/anaerobic conditions are the predominant factors influencing the HEAC related HE-
susceptibility of the materials.
9.4 Validation of mechanical tests with component-similar tests
As described in Section 3.6, HE-related tests on component-similar samples were conducted to validate
the results gained on regular sample geometries with geometries which reflect the shape of car body
components. The 90° V-samples were chosen to represent the conditions that are present on radii found
on automotive components, like tunnel parts, which are produced mainly by bending operations. The
choice of cross die samples is related to deep drawn parts like B-pillars. The testing of these samples
took place in corrosive mediums which were supposed to reflect realistic or even worse conditions than
what is typical during the production and life of the car.
The V-bend sample enables the identification of the minimum ratio of R/t (R: bending radius, t:
thickness of sheet material) up to which DF takes place. This information can be used to design the radii
of component parts providing higher safety against DF. In the cross-die samples, the maximum allowed
drawing depth in each steels was reached, then the samples were immersed in a NaCl solution. The
TBF1180 steels with original punched edges displayed delayed fracture, while in the other steels
(DP1180A+EG and 980 MPa steels) delayed fracture was not observed.
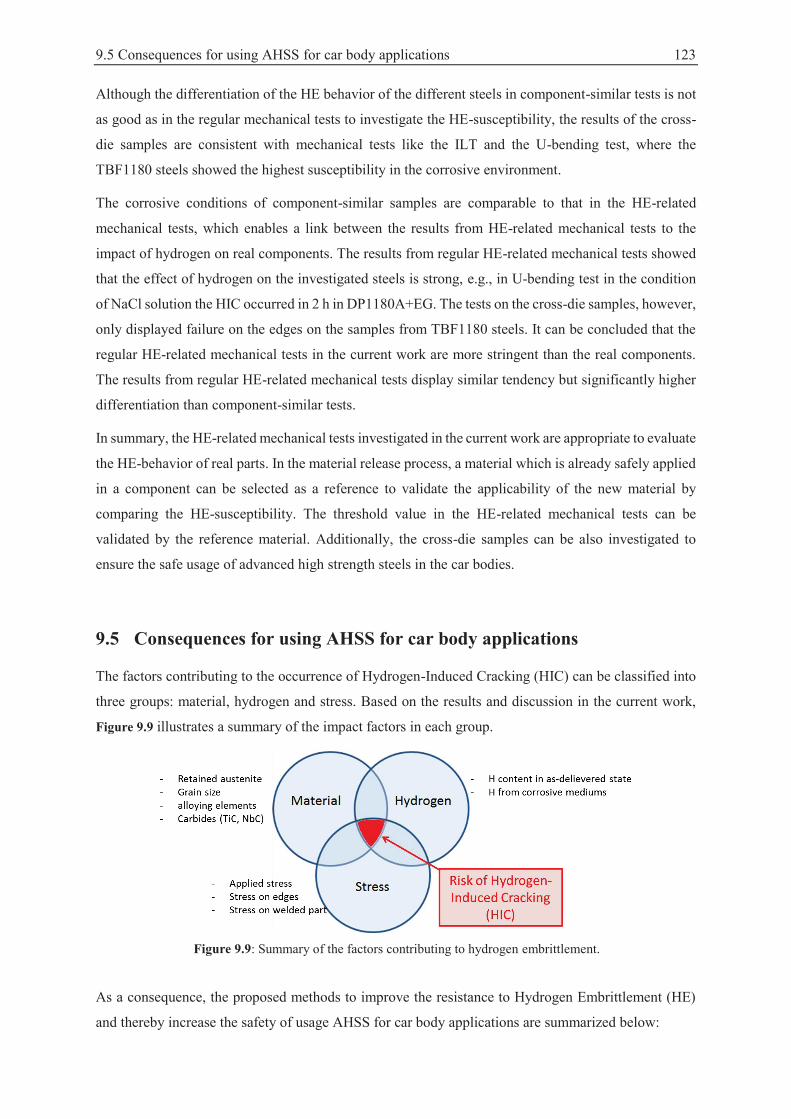
9.5 Consequences for using AHSS for car body applications 123
Although the differentiation of the HE behavior of the different steels in component-similar tests is not
as good as in the regular mechanical tests to investigate the HE-susceptibility, the results of the cross-
die samples are consistent with mechanical tests like the ILT and the U-bending test, where the
TBF1180 steels showed the highest susceptibility in the corrosive environment.
The corrosive conditions of component-similar samples are comparable to that in the HE-related
mechanical tests, which enables a link between the results from HE-related mechanical tests to the
impact of hydrogen on real components. The results from regular HE-related mechanical tests showed
that the effect of hydrogen on the investigated steels is strong, e.g., in U-bending test in the condition
of NaCl solution the HIC occurred in 2 h in DP1180A+EG. The tests on the cross-die samples, however,
only displayed failure on the edges on the samples from TBF1180 steels. It can be concluded that the
regular HE-related mechanical tests in the current work are more stringent than the real components.
The results from regular HE-related mechanical tests display similar tendency but significantly higher
differentiation than component-similar tests.
In summary, the HE-related mechanical tests investigated in the current work are appropriate to evaluate
the HE-behavior of real parts. In the material release process, a material which is already safely applied
in a component can be selected as a reference to validate the applicability of the new material by
comparing the HE-susceptibility. The threshold value in the HE-related mechanical tests can be
validated by the reference material. Additionally, the cross-die samples can be also investigated to
ensure the safe usage of advanced high strength steels in the car bodies.
9.5 Consequences for using AHSS for car body applications
The factors contributing to the occurrence of Hydrogen-Induced Cracking (HIC) can be classified into
three groups: material, hydrogen and stress. Based on the results and discussion in the current work,
Figure 9.9 illustrates a summary of the impact factors in each group.
Figure 9.9: Summary of the factors contributing to hydrogen embrittlement.
As a consequence, the proposed methods to improve the resistance to Hydrogen Embrittlement (HE)
and thereby increase the safety of usage AHSS for car body applications are summarized below:
124 Discussion
Optimize material selection
The application of AHSS in the body-in-white structure usually depends on the strength, ductility and
weldability of the material. However, is also important to take into account the susceptibility to HE of
high strength steels. When the strength and ductility levels are comparable, the material which is less
susceptive to HE takes precedence.
The material-related factors influence the susceptibility to HE in various ways. The presence of retained
austenite ensures a good performance in ductility, but meanwhile increases the susceptibility to HE, as
observed in the TBF steels in this study. To optimize the material selection for body-in-white
construction, the fraction of retained austenite should be minimized. The susceptibility to HE can be
reduced by increasing the number of effective grain boundaries using a fine-grained microstructure.
Hence in the material selection procedure, an AHSS with a homogenous, fine grain size takes
precedence. Additionally, the HE-susceptibility is related to the chemical composition of the material.
Once the steels are in the same classification, e.g., DP steel, the material with a lower CE has a higher
resistance to HE. The addition of alloying elements, such as Ti and Nb, can reduce the susceptibility to
HE, because the formation of carbides of TiC or NbC hinders hydrogen diffusion and re-contribution
by the trapping effect. In most cases the hydrogen uptake occurs accompanied with corrosion processes.
Thus the addition of Cr, Mo, and N can decrease the HE-susceptibility by decelerating the adsorption
of hydrogen with increased resistance to pitting corrosion.
Prevent hydrogen uptake
When the hydrogen content in the as-delivered material is increased, the potential to HE is also
increased because the critical hydrogen concentration to HIC becomes more easily to be reached. The
results of the investigations on IHAC (mechanical tests on pre-charged materials) also provide evidence
that higher hydrogen content leads to higher susceptibility to HE. Therefore, the first solution to improve
the resistance to HE is minimization of the hydrogen content in as-delivered material from the steel-
making process.
Aside from the internal hydrogen in the steels, hydrogen from the environment can also cause a strong
enrichment of hydrogen in the material and lead to HIC. As discussed in section 9.3.4, the hydrogen
concentration is always accompanied with corrosion reactions. Once the corrosive ions enrich the
surroundings, especially when the corrosive medium is anaerobic, HE becomes critical to the
components (section 9.3.4). The protective layer in the body-in-white component plays an important
role in increasing of resistance to HE. In most vehicles Zn-coated steel sheets are used. The Zn-coating
can provide the first protective layer to suppress the uptake of hydrogen and protect the steel substrate
from corrosion. The following E-coating and painting can also enhance the protection to the substrate.
However, during the car making process the edges and welded parts are exposed to air and the pre-
treatment solution before E-coating. Thus external methods, such as sealing the exposed edges with
9.5 Consequences for using AHSS for car body applications 125
wax or protecting with oil can protect the susceptive parts from direct contact with the possible corrosive
surroundings, thus improving the resistance to HE of components.
Another vulnerable factor in car components is the gap between the components. Moisture can easily
be retained in these small gaps. The corrosion in this kind of location is strong. In the case of defects in
the Zn-coating, hydrogen uptake may occur. In the construction process the amount of gaps in the car
body design should be reduced to avoid local corrosion. Sealing fine gaps can protect the components
from the corrosive surroundings, thus the hydrogen uptake can be reduced and the susceptibility to DF
of the body-in-white is decreased.
Avoid stress concentration
It has been confirmed that a stress gradient acts as the driving force of the diffusion of absorbed
hydrogen and the consequent re-contribution leads to HIC. To improve the resistance to HE, the stress
distribution should be paid attention to. Based on Figure 2.6, the maximum increase of stress takes
place during the forming of the component parts. To avoid critical stress leading to DF, the local stress
concentration needs to be kept below the yield strength. For the bending and hemming parts, high local
stresses can be reduced by avoiding a small bending radius. As studied in the 90° V-bend samples, the
steel sheet has an allowed minimum bending radius, with which the V-bend sample does not reveal HIC
on the inner radius, when the sample is exposed to corrosive mediums.
In some special regions like cut edges and welded parts, which are susceptive to HE, the applied stress
needs to be minimized. The parts with edges or welding should be designed far away from the highly
deformed regions, particularly under tensile stress, to avoid high local hydrogen concentration. In some
cases, it is not possible to change the location of the edge. Here it is particularly important to optimize
the cutting method. As investigated, punched edges reveal the highest susceptibility to HE compared to
laser-cut and milled edges. Avoiding punched edges and preferring laser-cut or milled edges can
improve the condition of the edge surface, thus reducing the local stress concentration at the micro-
crack tips on the edge surfaces. It is worth noting that different materials reveal different DF behavior
on the laser-cut edges. TBF1180 steels, with laser--cut edges show also high susceptibility to delayed
fracture because of their microstructure and chemical compositions. To improve the resistance to HE,
theoretically, the edge of TBF1180 should be milled to minimize work-hardening and ensure a
homogeneous surface condition, although it is acknowledged that milling is not feasible in an industrial
setting.
Tensile stress is more harmful than compressive stress in most materials subject to HIC, as investigated
by Chu et al [CHU84]. In this work it is found that when the strain state is in biaxial, where the major
and minor stresses are both tensile stresses, the degradation of the properties due to hydrogen
enrichment is more significant than other in other strain states. It is assumed that avoiding high local

126 Discussion
tensile stresses, or the modification the tensile stress to become compressive stress, can prevent the
component from cracking due to HE.
In summary, a component part will be at risk of HIC once the mentioned three factors (material,
hydrogen and stress) are in the critical level at the same time as illustrated in Section 9.5. To reduce the
susceptibility to HE to a safe level, at least one of the three factors should be minimized. This is the
most essential guideline for enabling the safe, widespread use of AHSS in car-making, enabling
reduction in weight, and contributing ultimately to the goal of reducing CO2 emissions.
127
10 Conclusion
The current work investigated the Hydrogen Embrittlement (HE) behaviors of different Advanced High
Strength Steels (AHSS) by various hydrogen-related mechanical tests and component-similar samples.
On the basis of the obtained results the following conclusions can be drawn:
Suitable test method to evaluate the susceptibility to HE
Various mechanical tests to evaluate the reduction in properties due to hydrogen enrichment were
compared in the terms of differentiation of the results and the simplicity of the test method and sample
preparation. The reproducibility of the test was also taken into account. The tests related to Hydrogen
Environment Assisted Cracking (HEAC) (e.g., immersion test with U-bend samples) and Internal
Hydrogen Assisted Cracking (IHAC) (e.g., slow strain rate test) displayed a similar ranking in the
susceptibility to HE. This demonstrates that it is not necessary to test both HEAC and IHAC, but that
one of these types of test is sufficient. In an industrial setting it is recommended to conduct a HEAC-
related test rather than an IHAC-related test, due to the simplicity of sample preparation.
The immersion test of U-bend samples in NaCl solution is identified as a suitable method to investigate
HE of AHSS. This method has the highest value of simplicity in all investigated methods, combined
with a good differentiation of 5 and high reproducibility. In addition, the investigation of different edge
conditions is possible.
Another appropriate method is the Incremental Loading Test (ILT). ILT requires a short time to evaluate
the susceptibility to HE (max. 56 h), and meanwhile displays a high value of simplicity. Although the
differentiation of ILT was moderate, further optimization in future work could be done. It is
recommended to reduce the initial load from 75% to 50% or 60% of Rm. The reproducibility of ILT can
be further improved by optimizing sample preparation, such as cutting the outside contour with other
methods such as milling and water jet cutting instead of punching.
The results from hydrogen-related mechanical tests are consistent with that of the investigations on
component-similar samples, although the occurrence of HE was less pronounced in the component-
similar samples. The test conditions of the hydrogen-related mechanical tests were more sensitive to
HE than the component-similar samples, which is significant for the material release process. The
selection of reference material or identification of the threshold value in the HE-related mechanical tests
can validate the HE-susceptibility for further applications, ensuring the safe usage of AHSS in car body
construction.
128 Conclusion
Material-associated influences on HE
The 1180 MPa steels are more susceptible to HE than 980 MPa steels, owing to the higher dislocation
density after strengthening. The ranking of susceptibility to HE of the 1180 MPa steels from high to
low is:
TBF steel > DP steel > CP steel > MS-W steel
In the TBF steels the presence of approx. 9% retained austenite is the main factor causing the highest
HE-susceptibility. In the DP steels, the ferrite increases the heterogeneity of the microstructure and
meanwhile hinders crack propagation, decreasing the susceptibility to HE. The higher resistance to HE
in CP steels is attributed to the homogenous fine microstructure and dispersions of carbides. The highest
HE-resistance in MS-W1180 is due to the lath-like microstructure and the low C content of the material.
The material-related influences on the susceptibility to HE can be classified into two groups, depending
on their positive or negative effect on the HE-susceptibility. Briefly, HE-susceptibility is proportional
to the volume fraction of retained austenite (γ), grain size and the content of C, as well as the Carbon
Equivalent (CE) of the material. Once retained austenite is present, the strain-induced phase
transformation may take place, generating martensite (α'). Owing to the difference of hydrogen
solubility in γ and α' the hydrogen supersaturates in α', and concentrates in the misfit region between
these two phases, resulting in HIC. The grain size influences the HE-susceptibility by suppressing
hydrogen diffusion and accumulation through the irreversible trapping in grain boundaries and sub-
boundaries. Increasing C content as well as CE reduces the hydrogen solubility and increases the
hydrogen diffusibility, thereby increasing the HE-susceptibility.
In contrast, the addition of Ti and Nb in the steel can improve the resistance to HE, since TiC and NbC
function as irreversible trapping sites and are favorable for hindering hydrogen re-contribution. The
addition of alloying elements Cr, Mo and N are also advantageous in decreasing the susceptibility to
HE. They increase the resistance to pitting corrosion and delay the hydrogen uptake when the material
is exposed to corrosive surroundings.
Production-associated influences on HE
After spot welding, the welded material is particularly susceptible to HE when the sample is exposed
to corrosive mediums like NaCl solutions. The unpredictable failure may initiate in the welded zone,
where the microstructure is strengthened by welding. The formation of Zn-Fe mixture phase at the prior
austenite grain boundaries due to liquid metal embrittlement is also a reason for the high susceptibility
to HE. Additionally, the welding process itself can cause further hydrogen absorption, thereby
increasing the risk of the hydrogen content reaching the critical concentration for HE.
HE-susceptibility is related to the edge condition of the sample. The bare Zn-Fe-Zn edge is sensitive to
the initiation of delayed fracture once anaerobic corrosive surroundings are present. The punched edges
9.5 Consequences for using AHSS for car body applications 129
are susceptible to HE, since the work hardening on the edges increases the dislocation density and the
coarse edge surfaces enables micro-crack initiation. TBF 1180 samples with laser-cut edges are also
critical to HIC because the laser-cutting process hardens the edges by phase transformation. Therefore,
the milled edges offer the highest resistance to HE, owing to a smooth edge surface and homogenous
hardness distribution in the transverse surface.
A forming path in the biaxial strain state is more susceptible than that in uni-axial and plane strain states,
because the expanded lattice facilitates the re-contribution of hydrogen. Similarly, pre-straining in the
biaxial strain state facilitates hydrogen adsorption, resulting in more degradation of bendability.
Consequences for using AHSS for car body applications
To enable the safe application of AHSS in car bodies, the possible following three factors must be taken
into account:
i) Material: microstructure, chemical composition, and carbides (NbC, TiC)
ii) Hydrogen: internal hydrogen and hydrogen from surroundings
iii) Stress: parts subject to local tensile stress
According to the requirements on the material strength and ductility, at least one of the three factors
should be optimized to reduce the susceptibility of component parts to hydrogen embrittlement.
In summary, this research work evaluated different testing methods to investigate hydrogen
embrittlement of advanced high strength steel sheets and gave recommendations to select and improve
the suitable methods. The results identified the material-associated factors and clarified the critical
factors in car manufacture and during the life of the car which could lead to hydrogen embrittlement,
whether from internal or environmental hydrogen. The current thesis made recommendations for
materials selection and car manufacture. The results of the work provide a scientific basis for the
industrial use of advanced high strength steels in car body constructions, including essential guidelines
to avoid the occurrence of hydrogen embrittlement in safety-relevant components.
130
Reference
[ALB03] S.K. Albert, V. Ramasubbu, Influence of alloying on hydrogen assisted cracking and diffusible hydrogen content in Cr-Mo steel welds. Academy Proceedings in Engineering Sciences 28 (2003) 383-393.
[ANG06] J. Angeli, E. Füreder, M. Panholzer, A.C. Kneissl, Ätztechniken für die Phasencharakterisierung von niedriglegierten Dual-Phasen- und TRIP-Stählen. Practical Metallography 43 (2006) 489-504.
[ASTM08] ASTM G5-94 Standard reference test method for making potentiostatic and potentiodynamic anodic polarization measurements. ASTM, 2008.
[BAI16] Y. Bai, Y. Monotan, M.C. Chen, A. Shibata, N. Tsuji, Effect of grain refinement on hydrogen embrittlement behaviors of high-Mn TWIP steel. Materials Science and Engineering A 651 (2016) 935-944.
[BHA05] D. Bhattacharya, Developments in advanced high strength steels, Proceeding of the fifth International Conference on HSLA Steels, 2005, Sanya, China, 1-7.
[BEI09] B. Beidokhti, A. Dolati, A.H. Koukabi, Effects of allying elements and microstructure on the susceptibility of the welded HSLA steel to hydrogen-induced cracking and sulfide stress cracking. Materials Science and Engineering A 507 (2009) 167-173.
[BIL13] E. Billur, T. Altan, Three generations of advanced high-strength steels for automotive applications, Part 1 - The first generation. Stamping Journal, November-December (2013) 16-17.
[BIL14a] E. Billur, T. Altan, Three generations of advanced high-strength steels for automotive applications, Part 2 - The second generation. Stamping Journal, January-February (2014) 12-13.
[BIL14b] E. Billur, T. Altan, Three generations of advanced high-strength steels for automotive applications, Part 3 - The third generation. Stamping Journal, March-April (2014), 12-13.
[BLE07] W. Bleck, Material Science of Steel. Textbook for RWTH students, 2007.
[BLE09] W. Bleck, Material Characterisation. Texbook for RWTH students, 2009.
[BLE12] W. Bleck, Spezielle Werkstoffkunde der Stähle für Studium und Praxis, 2012.
[BLE14] W. Bleck, Advanced high strength steels for the automotive industry-from microstructures to nanostructures. Stahl und Eisen 134 (2014) 25-33.
[BIR90] H.K. Birnbaum, Mechanism of hydrogen related fracture of metals. In Hydrogen Effects on Material Behavior, Eds. N. R. Moody and A. W. Thompson, Warrendale PA and The Metallurgical Society Inc, 1990, 629-660.
[BIR95] H.K. Birnbaum, Hydrogen related second phase embrittlement of solids. In Hydrogen Embrittlement and stress Corrosion Cracking, Eds. R. Gibala and R. F. Hehemann, ASM International, 1995, 153-177.
[BOU11] O. Bouaziz, S. Allain, C.P. Scott, P. Cugy, D. Barbier, High manganese austenitic twinning induced plasticity steels: a review of the microstructure properties relationships. Current Opinion in Solid State & Materials Science 15 (2011) 141-168.
[CAL10] M. Calcagnotto, D. Ponge, E. Demir, D. Raabe, Orientation gradients and geometrically necessary dislocations in ultrafine grained dual-phase steels studied by 2D and 3D EBSD. Materials Science and Engineering A 527 (2010) 2738-2746.
131
[CHA03] G. Chalaftris, Evaluation of aluminum-based coatings for cadmium replacement. PhD thesis, Granfield University, 2003.
[CHE14] S. Chen, M. Zhao, L. Rong, Effect of grain size on the hydrogen embrittlement sensitivity of a precipitation strengthened Fe–Ni based alloy. Materials Science and Engineering A 594 (2014) 98-102.
[CHO81] W.Y. Choo, J.Y. Lee, C.G. Cho, Hydrogen solubility in pure iron and effects of alloying elements on the solubility in the temperature range 20 to 500°C. Journal of Materials Science 16 (1981) 1285-1292.
[CHO14] L. Cho, H. Kang, C. Lee, B.C. De Cooman, Microstructure of liquid metal embrittlement cracks on Zn-coated 22MnB5 press-hardened steel. Scripta Materialia 90-91 (2014) 25-28.
[CLA11] O. Clauzeau, N. Le Bozec, D. Thierry, Hydrogen embrittlement and delayed fracture of advanced high-strength steels for the automotive industry. Research report, Institut de la Corrosion 2011: 4.
[COO11] B.C. De Cooman, K. Chin, J. Kim, High Mn TWIP steels for automotive applications. In New Trends and Developments in Automotive System Engineering, Eds. M. Chiaberge, InTech, 2011, 101-128.
[COR14] D. Cornette, C. Allely. P. Dietsch, B. Weber, T. Sturel et al. No detrimental impact of car manufacturing process and simulation of vehicle in-service conditions on DP1180 hydrogen embrittlement. Proceedings of 2nd Steely Hydrogen Conference, 2014, Gent, 45-58.
[CUR10] S. Curtze, V.T. Kuokkala, Dependence of tensile deformation behavior of TWIP steels on stacking fault energy, temperature and strain rate. Acta Materialia 58 (2010) 5129-5141.
[DEN11] R. Denninger and M. Liewald, C. Held, M. Sindel, Investigation on bendability of lightweight materials for various load paths. Proceedings of ESAFORM2011, 1601-1604.
[DEN12] R. Denninger, M. Liewald, M. Sindel, Failure prediction in sheet metal forming depending in pre-straining and bending superposition. Proceedings of ESAFORM 2012, 101-106.
[DEP11] T. Depover, D. Perez Escobar, E. Wallaert, M. Verhaege, In-situ mechanical evaluation of hydrogen embrittlement for TRIP, FB, DP, and HSLA steels. Proceedings of 1st Steely Hydrogen Conference, 2011, Ghent, 31-42.
[DU15] X.S. Du, W.B. Cao, S.J. Li, J.Y. Zhao, Y.F. Sun, Effect of microstructures and inclusions on hydrogen-induced cracking and blistering of A537 steel. Materials Science and Engineering A 642 (2015) 181-186.
[DUM08] A. Dumay, J. Chateau, S. Allain, S. Migot, O. Bouaziz, Influence of addition elements on the stacking-fault energy and mechanical properties of an austenitic Fe-Mn-C steel. Materials Science and Engineering A 483-484 (2008) 184-187.
[DOE10] E. Deoge B.A. Behrens, Handbuch Umformtechnik: Grundlagen, Technologien, Maschinen. Springer-Verlag Berlin Heidelberg 2010.
[ENG69] H.J. Engell, M.O. Speidel, Ursachen und Mechanismen der Spannungsrisskorrosion. Material and Corrosion 20 (1969) 281-300.
[FER98] P.J. Ferreira, I.M. Robertson, H.K. Birnbaum, Hydrogen effects on the interaction between dislocations. Acta Materialia 46 (1998) 1749-1757.
[FIG10] D. Figueroa, M.J. Robinson, Hydrogen transport and embrittlement in 300M and AerMet100 ultra high strength steels. Corrosion Science 52 (2010) 1593-1602.
132 Reference
[FIS99] D.J. Fisher, Hydrogen diffusion in metals. Defect and Diffusion Forum (1999) 167-168.
[FRI14] H. Friebe, Optical 3D metrology for sheet metal analysis and material parameters determination. FLC workshop, Zurich, 2014.
[FUC06] H. Fuchigami, H. Minami, M. Nagumo, Effect of grain size on the susceptibility of martensitic steel to hydrogen-related failure. Philosophical Magazine Letters 86 (2006) 21-29.
[FUJ85] F.E. Fujita, The iron-hydrogen phase diagram. In Hydrogen degradation of ferrous alloys, Eds. R.A. Oriani, J.P. Hirth, M. Smialowski, Park Ridge, N.J.: Noyes Publications, 1985, 1-15.
[GAN03] R.P. Gangloff, Hydrogen assisted cracking of high strength alloys. Comprehensive Structural Integrity 6 (2003) 131-101.
[GAO16a] Q. Gao, F. Han, D. Wortberg, W. Bleck, M. Liewald, The impact of hydrogen on the formability of AHSS in Nakajima tests. Proceedings of 19th ESAFORM, 2016, Nantes.
[GAO16b] Q. Gao, F. Han, D. Wortberg, W. Bleck, M. Liewald, Influence of hydrogen on formability and bendability of DP1180 steel for car body application. Proceedings of IDDRG2016, 2016, Linz.
[GEH94] F. Gehrmann, Einfluß der Nitride von V, Nb und Ti auf die Diffusion und Löslichkeit von Wasserstoff in Eisen. PhD thesis, Universität Dortmund, 1994.
[GEO97] J.S. Georgiev, L.A. Anestiev, Influence of the surface processes on the hydrogen permeation through ferric steel and amorphous Fe-40Ni-40Mo-4B alloy specimens. Journal of Nuclear Material 249 (1997) 133-141.
[GER88] W.W. Gerberich, S. Chen, Environment-induced cracking of metals fundamental processes: micromechanics. Proceedings of 1st International Conference on Environment-induced Cracking of Metals, 1988, NACE, Houston, 167-187.
[GOT04] G. Gottstein, Physical foundations of materials science. Springer-Verlag Berlin Heidelberg, 2004.
[GRA00] H.J. Grabke, E. Riecke, Absorption and diffusion of hydrogen in steels. Materials and Technology 331 (2000) 331-342.
[GUO12] X. Guo, Influences of microstructure, alloying elements and forming parameters on delayed fracture in TRIP/TWIP-aided austenitic steels. PhD. thesis, RWTH-Aachen University, 2012.
[GUO14] X. Guo, Q. Gao, W. Bleck, S. Kim, Mechanical properties and delayed fracture behavior of a hot dip galvanized Fe-15Mn-0.6C-2Al TWIP steel. Proceedings of 4th International Conference on Steels in Cars and Trucks, 2014, Braunschweig, 605-612.
[HEB08] T. Hebesberger, A. Pichler, H. Pauli, S. Ritsche, Dual-phase and complex-phase steels: AHSS Material for a wide range of applications. Proceedings of 2nd International Conference on Steels in Cars and Trucks, 2008, Wiesbaden, 456-463.
[HEB14] T. Hebesberger, A. Pichler, D. Kriyan, F. Winkelhofer, C. Walch et al., High Ductility AHSS Grades: Dual-Phase and Complex-Phase Grades with Improved Formability. Proceedings of 4th International Conference on Steels in Cars and Trucks, 2014, Braunschweig, 79- 86.
[HIL04] E.M.K. Hiller, M.J. Robinson, Hydrogen embrittlement of high strength steel electro-plated with zinc-cobalt alloys. Corrosion Science 46 (2004) 715-727.
[HIR80] J.P. Hirth, Effects of hydrogen on the properties of iron and steel. Metallurgical TransActions A 11 (1980) 861-890.
133
[HIR87] J.P. Hirth, Hydrogen Induced Fracture. In Chemistry and Physics of Fracture. Eds. R. M. Latanison, R. H. Jones, Martinus Nijhoff Publishers, 1987, 538-551.
[HIR95] J.P. Hirth, Theories of hydrogen induced cracking of steels. In hydrogen embrittlement and stress corrosion cracking, Eds. R. Gibala, R.F. Hehenmann, ASM, 1995, 29-41.
[HON13] S. Hong, J. Lee, B.-J. Lee, H.S. Kim, S.-K. Kim et al., Effects of intergranular carbide precipitation on delayed fracture behavior in three Twinning Induced Plasticity (TWIP) steels. Materials Science and Engineering A 587 (2013) 85-99.
[HWA94] L.C. Hwang, T.P. Perng, Hydrogen transport in ferritic stainless steel under elastic stress. Materials Chemistry and Physics 36 (1994) 231-235.
[IML04] K.-P. Imlau, T. Heller, U. Etzold, O. Hoffmann, Neue Stähle für Fahrzeugkarosserien. Praktische Metallographie Sonderband 36, Frankfurt, Werkstoffinformations- gesellschaft, 2004, 9-20.
[INT05] C.G. Interrante, L. Raymond, Hydrogen Damage. In Corrosion tests and standards: Application and Interpretation, Eds. R. Baboian, West Conshohocken, ASTM International, 2005, 322-340.
[JIN10] T.Y. Jin, Z.Y. Liu, Y.F. Cheng, Effect of ono-metallic inclusions on hydrogen-induced cracking of AP15LX100 steel. International Journal of Hydrogen Energy 35 (2010) 8014-8021.
[KAE03] H. Kaesche, Corrosion of Metals: Physical chemical Principles and current problems. Springer-Verlag Berlin Heidelberg, 2003.
[KAN10] S. Kang, Y.S. Jung, J.H. Jun, Y.-K. Lee, Effects of recrystallization annealing temperature on carbide precipitation, microstructure, and mechanical properties in Fe-18Mn-0.6C-1.5Al TWIP steel. Materials Science and Engineering A 527 (2010) 745–751.
[KIM11] J. Kim, S.J. Lee, B.C. De Cooman, Effect of Al on the stacking fault energy of Fe-18Mn-0.6C twinning-induced plasticity. Scripta Materialia 65 (2011) 363-366.
[KIM12] S.J. Kim, D.W. Yun, D.W. Suh, and K.Y. Kim, Electrochemical hydrogen permeation measurement through TRIP steel under loading condition of phase transition. Electrochemistry Communications 24 (2012) 112-115.
[KOY14] M. Koyama, C.C. Tasan, E. Akiyama, K. Tsuzaki, D. Raabe, Hydrogen-assisted decohesion and localized plasticity in dua-phase steel. Acta Materialia 70 (2014) 174-187.
[KUZ08] R. Kuyiak, R. Kawalla, S. Waengler, Advanced high strength steels for automotive industry. Archives of Civil and Mechanical Engineering 8 (2008) 103- 117.
[LAH14] C. Lahaijie, A. Blowey, J. Loisaux B. Ennis, Mass Saving Potential of dual phase steels with improved formability, Proceedings of 4th International Conference on Steels in Cars and Trucks, 2014, Braunschweig, 103-108.
[LAU15] A. Laureys, T. Depover, R. Petrov, K. Verbeken, Characterization of hydrogen induced cracking in TRIP-assisted steels. International Journal of Hydrogen Energy 40 (2015) 16901-16912.
[LI14] X. Li, Y. Wang, P. Zhang, B. Li, X. Song et al., Effect of pre-strain on Hydrogen embrittlement of high strength steels. Materials Science and Engineering A 616 (2014) 116-112.
[LIU08] X.Y. Liu, J. Kameda, J.W. Anderegg, S. Takaki, K. Abiko et al., Hydrogen-induced cracking in a very-high-purity high-strength steel. Materials Science and Engineering A 492 (2008) 218-220.
134 Reference
[LEE12] Y.K. Lee, Microstructural evolution during plastic deformation of twinning-induced plasticity steels. Scripta Materialia 66 (2012) 1002-1006.
[LOI11] M. Loidl, O. Kolk, S. Veith, T. Göbel, Charaterization of hydrogen embrittlement in automotive advanced high strength steels. Materialwissenschaft und Werkstofftechnik 42 (2011) 1105-1110.
[LOI14] M. Loidl, Entwicklung einer Prüfmethodik zur Charakterisierung höchstfester Karosseriestähle hinsichtlich des Risikos zur Wasserstoff induzierten Rissbildung. PhD thesis, Universität Stuttgart, 2014.
[LOU72] M.R. Louthan, G.R. Caskey, J.A. Donovan, D.E. Rawl, Hydrogen embrittlement of metals, Materials Science and Engineering 10 (1972) 357-346.
[LYN79] S.P. Lynch, Mechanisms of hydrogen assisted cracking. Metals Forum 2 (1979) 189-200.
[MA11] M. Ma, H. Yi, Lightweight car body and application of high strength steels. In Advanced Steels, Eds. Y. Wenig, H. Dong, Y. Gan, Springer-Verlag Berlin Heidelberg, 2011, 187-198.
[MAA08] P. Maaß, P. Peißker, Handbuch Feuerverzinken, Wiley-VCH Verlag, 2008.
[MAT09] D.K. Matlock, J.G. Speer, Third Generation of AHSS: Microstructure design concepts. In Microstructure and Texture in Steels, Eds. A. Haldar, S. Suwas, D. Bhattacharjee, Springer-Verlag London, 2008, 185-205.
[MAY15] R. Mayrhofer, Wasserstoffsensitität durch Korrosion bei UHSS, Workshop, Sindelfingen, 2015.
[MIS05] B. Mishra, D.L. Olson, F. Sanchez, An assessment of magnetization effects on hydrogen cracking for thick weld pipelines. Academic report to US Department of Transportation, Report-No.: CSM/MT/CWJCR/2005/009.
[MOL14] L. Moli-Sanchez, Z. Zermout, L. Duprez, L. Malet, Hydrogen embrittlement of 4 martensitic steels with strength levels above 1000 MPa. Proceedings of 2nd Steely Hydrogen Conference, 2014, Ghent, 70-84.
[MOO09] A. Moon, R. Balasubramaniam, Determination of Hydrogen Diffusivity in Rail Steels by Sub-Scale Microhardness Profiling Technique. Defect and Diffusion Forum 293 (2009) 41-45.
[MOR02] O. Moriau, L.T. Martinez, P. Verleyzen, J. Degrieck, Dynamic mechanical properties of cold rolled TRIP steels for crash-relevant applications. Proceedings of International Conference on TRIP Aided High Strength Ferrous Alloys, 2002, Ghent, 247-251.
[MUE06] S. Münstermann, Numerische Beschreibung des duktilen Versagensverhaltens von hochfesten Baustählen unter Berücksichtigung der Mikrostruktur, Berichte aus dem Institut für Eisenhüttenkunde, Band 4/06, Verlag Shaker, 2006.
[MUE14] T. Müller, Hydrogen embrittlement resistant electro galvanized martensitic steels for the automotive industry. Proceedings of 4th International Conference on Steels in Cars and Trucks, 2014, Braunschweig, 410-417.
[NAB10] N. Mabho, Determination of diffusible and total hydrogen concentration in coated and uncoated steel, Ph.D thesis, Universität Duisburg-Essen, 2010.
[NAG14] A. Nagao, C.D. Smith, M. Dadfarni, P. Sofronis, I.M. Robertson, Interpretation of hydrogen-induced fracture surface morphologies for lath martensitic steel. Procedia Materials Science 3 (2014) 1700-1705.
[NEL83] H.G. Nelson, Hydrogen Embrittlement. Treatise on materials science and technology 25 (1983) 275-359.
135
[OLD09] V. Olden, C. Thaulow, R. Johnsen, E. Østby, T. Berstad, Influence of hydrogen from cathodic protection on the fracture susceptibility of 25% Cr duplex stainless steel-Constant load SENT testing and FE-modelling using hydrogen influenced cohesive zone elements. Engineering Fracture Mechanics 76 (2009) 827-844.
[OLI07] S. Oliver, T.B. Jones, G. Fourlaris, Dual phase versus TRIP strip steels: microstructural changes as a consequence of quasi-static and dynamic tensile testing. Materials Characterization 58 (2007), 4, 390-400.
[ORI72] R. Oriani, A mechanistic theory of hydrogen embrittlement of steels. Berichte der Bunsengesellschaft für physikalische Chemie 76 (1972) 848-857.
[ORI74] R. Orini, P. Josephic, Equilibrium aspects of hydrogen-induced cracking of steels. Acta Metallurgica 22 (1974) 1065-1074.
[ORI85] R.A. Oriani, J.P. Hirth, M. Smialowski, Hydrogen degradation of ferrous alloys. Park Ridge, N.J., U.S.A.: Noyes Publications, 1985, 799-813.
[OTS13] S. Otsuka, Y. Sugimoto, S. Fujita, E. Tada, A. Nishikata et al., Behavior of hydrogen absorption on Zn-coated steel sheet under dry-wet cyclic corrosion environment. Proceedings of 9th International Conference on Zinc and Zinc Alloy Coated Steel Sheet & 2nd Asia-Pacific Galvanizing Conference, 2013, Beijing, China, 679-683.
[PAA11] W. Paatsch, Wasserstoffbestimmung und Wasserstoffversprödung – Sinn und Nutzen. In Galvanotechnik, Eds. G. Eugen, Leuze Verlag, 2011. 48-55.
[PAR15] I. Park, S. Lee, H. Jeon, Y. Lee, The advantage of grain refinement in the hydrogen embrittlement of Fe-18Mn-0,6C twinning-induced plasticity steel. Corrosion Science 93 (2015) 63-69.
[PER15] P.A.S. Pereria, C.S.G. Franco, J.L.M. Guerra Filho, D.S. dos Santos, Hydrogen effects on the microstructure of a 2.25Cr-1Mo-0.25V steel welded joint. International Journal of Hydrogen Energy 40 (2015) 17136-17143.
[PET52] N.J. Petch, Delayed fracture of metals under static load. Nature 169 (1952) 482-483.
[PUN05] A. Pundt, R. Kirchheim, Hydrogen in metals: microstructural aspects. Annual Review of Materials Research 36 (2006) 555-608.
[RAO12] R. Raoelison, A. Fuentes, Ph. Rogeon, P. Carre, T. Loulou et al., Contact conditions on nugget development during resistance spot welding of Zn coated steel sheets using rounded tip electrodes. Journal of Materials Processing Technology 212 (2012) 1663-1669.
[RAM16] A. Ramazani, M. Abbasi, S. Kazemiabnavi, S. Schmauder, R. Larson et al., Development and application of a microstructure-based approach to Characterize and model failure initiation in DP steels using XFEM. Materials Science and Engineering A 660 (2016) 181-194.
[RAT07] E. Ratte, Wasserstoffinduzierte verzoegerte Rissbildung austenitischer Stähle auf CrNi(Mn)- und Mn-Basis. PhD thesis, RWTH-Aachen University,2007.
[REH13] J. Rehrl, Wasserstoffversprödung in hochfesten, mikrolegierten Stählen. PhD Thesis, TU-München, 2013.
[REH14] J. Rehrl, K. Mraczek, A. Pichler, E. Werner, The impact of hydrogen on the mechanical properties of AHSS/UHSS grades at low- and high strain rates. Proceedings of 2nd Steely Hydrogen Conference, 2014, Gent, 21-32.
[RON12] J A Ronevich, B.C. De Cooman, J.G. Speer, E. De Moor, D.K. Matlock, Hydrogen Effects in Prestrained Transformation Induced Plasticity steel. Metallurgical and Materials Transaction A 43A (2012) 2012-2293.
[SED96] A.J. Sedriks, Corrosion of stainless steels. Wiley-Interscience, 1996.
136 Reference
[SCH01] T. Schlueter, Wasserstoffaufnahme während des Beizens und des Glühens von warmgewalztem Stahlband vor der Feuerverzinkung. PhD thesis, Universität Dortmund, 2001.
[SCO06] C. Scott, S. Allain, M. Faral, N. Guelton, The development of a new Fe-Mn-C austenitic steel for automotive applications. Revue de Metallurgy Paris 103 (2006) 293-302.
[SHL09] R. Shleich, C. Held, M. Sindel, M. Liewald, Investigation on the effect of curvature and sheet thickness on forming limit prediction for aluminium sheet metal alloys. International Journal of Material Forming 2 (2009) 411-414.
[SHV00] V.I. Shvachko, Cold cracking of structural steel weldments as reversible hydrogen embrittlement effect. International Journal of Hydrogen Energy 25 (2000) 473-480.
[SID75] V.M. Sidorenko, B.F. Kachmar, N.S. Borisova, Effect of deformation and stress on the diffusion characteristics of hydrogen in metals. Materials Science 9 (1975) 500-504.
[SMI00] L. Smith, M. Celant, A. Pourbaix, A guideline to the successful use of duplex. Proceedings of Duplex America 2000 Conference, Houston, Texas, 2000.
[SPA00] H. Spähn, Druckwasserstoffangriff auf unlegierte und niedriglegierte Stähle im Temperaturbereich oberhalb 200°C. In Wasserstoff und Korrosion, Eds. Kuron, Verlag Irene Kuron Bonn, 2000, 127-183.
[SPE06] M.O. Speidel, Nitrogen containing austenitic stainless steels. Material Wissenschaft und Werkstofftechnik 37 (10): 875-880.
[STO94] M.R. Stoudt, R.E. Ricker, Characterizatijon of the hydrogen induced cold cracking susceptibility at simulated weld zones in HSLA-100 steel. Academic report for Office of Naval Research, U.S. Department of Commerce, 1994.
[STR06] M.E. Stroe, Hydrogen embrittlement of ferrous materials. PhD Thesis, Universite Libre de Bruxelles, 2006.
[SUN15] Y. Sun, J. Chen, J. Liu, Effect of hydrogen on ductility of high strength quenched and tempered (QT) Cr-Ni-Mo steels. Materials Science and Engineering A 625 (2015) 89-97.
[SUG08] K. Sugimoto, M. Murata, Y. Mukai, Stretch-Flangeability of C-Mn-Si-Al-Nb Ultra High-Strength Cold Rolled Sheet Steels. Proceedings of Advanced High Strength Sheet Steels for Automotive Applications, 2008, Orlando, Fla., USA, 57-67.
[SYM01] D.M. Symons, A comparison of internal hydrogen embrittlement and hydrogen environment embrittlement of X-750. Engineering Fracture Mechanics 68 (2001) 751-771.
[TAB84] T. Tabata, H.K. Birnbaum, Direct observations of hydrogen enhanced crack propagation in iron. Scripta Metallurgica 18 (1984) 231-236.
[TAH01] A. Taha, P. Sofronis, A micromechanics approach to the study of hydrogen transport and embrittlement. Engineering Fracture Mechanics 68 (2001) 803-837.
[THI11a] R.G. Thiessen, T. Heller, K. Mraczek . Nitschke, A. Pichler, Influence of microstructure on the susceptibility to hydrogen embrittlement. Proceedings of 1st. Steely Hydrogen Conference, 2011 Ghent, 43-51.
[THI11b] R.G. Thiessen, K. Bergers, T. Heller, Influence of electro-galvanizing parameters on absorbed hydrogen content in AHSS. Proceedings of 1st. Steely Hydrogen Conference, 2011 Ghent, 249-259.
[TAK08] K. Takai, H. Shoda, H. Suzuki, M. Nagumo, Lattice defects dominating hydrogen-related failure of metals. Acta Materialia 56 (2008) 5158-5167.
137
[TAK10] S. Takagi, Y. Toji, K. Hasegawa, Y. Tanaka, Evaluation methods of hydrogen embrittlement for ultra-high strength steel sheets for automobiles. Materials Science and Technology October (2010) 17-21.
[TAK12] K. Takasawa, R. Ikeda, N. Ishikawa, R. Ishigaki, Effects of grain size and dislocation density on the susceptibility to high-pressure hydrogen environment embrittlement of high-strength low-alloy steels. International Journal of Hydrogen Energy 37 (2012) 2669–2675.
[TAK14] S. Takaji, Y.Toji, M. Yoshino, K. Hasegawa, N. Wada et al., Hydrogen embrittlement resistance of 1180 MPa grade automotive steel sheet evaluated by various methods. Proceedings of 2nd Steely Hydrogen Conference, 2014, Ghent, 13-20.
[TAV15] S. Tavares, I. Bastos, J. M. Pardal, T.R. Montenegro, M.R. da Silva, Slow strain rate tensile test results of new multiphase 17% Cr Stainless steel under hydrogen cathodic charging. International Journal of Hydrogen Energy 40 (2015) 16992-16999.
[THI11] R.G. Thiessen, T. Heller, K. Mraczek, A. Nitschke, A. Pichler, Influence of Microstructure on the susceptibility to hydrogen embrittlement. Proceedings of 1st Steely Hydrogen Conference, 2011, Ghent, 43-51.
[TRO60] A. Troiano, The role of hydrogen and other interstitials in the mechanical behavior of metals. Transactions of the American Society of Metals 52 (1960) 54-80.
[VIT06] L. Vitos, J.O. Nilsson, B. Johansson, Alloying effects on the stacking fault energy in austenitic stainless steels from first-principles theory. Acta Materialia 54 (2006) 3821-3826.
[VIY05] E. Viyanit, Numerical simulation of hydrogen assisted cracking in supermartensitic stainless steel welds. PhD thesis, Federal Institute for Materials Research and Testing Berlin, 2005.
[VOL11] W. Volk, P. Hora, New algorithm for a robust user-independent evaluation of beginning instability for the experimental FLC determination. International Journal of Material Forming 4 (2011) 339-346.
[WAN01] J.S. Wang, The thermodynamics aspects of hydrogen induced embrittlement. Engineering Fracture Mechanics 68 (2001) 647-669.
[WAN06] M.Q. Wang, E. Akiyama, K. Tsuzaki, Determination of the critical hydrogen concentration for delayed fracture of high strength steel by constant loading test and numerical calculation. Corrosion Science 48 (2006) 2189-2202.
[WAN13] L. Wang, J.G. Speer, Quenching and Partitioning Steel Heat Treatment. Metallography, Microstructure, and Analysis 2 (2013) 268-281.
[WOR14] www.WorldAutoSteel.com, Advanced High-Strength Steels Application Guidelines: Section 1 – Introduction to advanced high-strength steels (AHSS), Version 5.0, 2014.
[WU05] J. Wu, P.J. Wray, C.I. Garcia, M. Hua, A.J. Deardo, Image quality analysis: a new method of characterizing microstructures. ISIJ International 45 (2005) 254-262.
[YAK02] O. Yakubovsky, N. Fonstein, D. Bhattacharya, Stress-strain behavior and bake hardenability of TRIP and TRIP-aided multiphase steels. Proceedings of International Conference on TRIP Aided High Strength Ferrous Alloys, 2002, Ghent, 263-270.
[ZAE08] S. Zaefferer, P. Romano, F. Friedel, EBSD as a tool to identify and quantify bainite and ferrite in low-alloyed Al-TRIP steels. Journal of Microscopy 230 (2008) 499-508.
[ZAK85]
T. Zakroczymski, Entry of hydrogen into iron alloys from the liquid phase. In Hydrogen degradation of ferrous alloys, Eds. R. Oriani, J. Hirth, M. Smialowski, Park Ridge, N.J., U.S.A.: Noyes Publications, 1985, 215-250.
[ZAK99] T. Zakroczymski, Elektrochemical Determination of Hydrogen in Metals. Journal of Electroanalytical Chemistry 82-88 (1999).
138 Reference
[ZAP41] C.A. Zappe, C.E. Sims, Hydrogen embrittlement, internal stress and defects in steel. Transactions of the Metallurgical Society of AIME 145 (1941) 225-259.
[ZEP03] F. von Zeppelin, M. Haluska, M. Hirscher; Thermal desorption spectroscopy as a quantitative tool to determine the hydrogen content in solids. Thermochimica Acta 404 (2003) 251-258.
[ZHA15] S. Zhang, Y. Huang, B. Sun, Q. Liao, H. Lu et al., Effect of Nb on hydrogen-induced delayed fracture in high strength hot stamping steels. Materials Science and Engineering A 626 (2015) 136-143.
[ZHO14] Q.J. Zhou, L. Wang, J.X. Li, Experimental study on delayed fracture of TS 980 MPa grade steels for automotive applications. Proceedings of 2nd Steely Hydrogen Conference, 2014, Ghent, 35-44.
[ZHU13] X. Zhu, W. Li, H. Zhao, X. Jin, Effects of cryogenic and tempered treatment on the hydrogen embrittlement susceptibility of TRIP-780 steels. International Journal of Hydrogen Energy 38 (2013) 10694-10703.
[ZHU14] X. Zhu, W. Li, H. Zhao L. Wang, X. Jin, Hydrogen trapping sites and hydrogen-induced cracking in high strength quenching & partitioning (Q&P) treated steel. International Journal of Hydrogen Energy 39 (2014) 13031-13040.
[ZHU16] X. Zhu, K. Zhang, W. Li, X. Jin, Effect of retained austenite stability and morphology on the hydrogen embrittlement susceptibility in quenching and partitioning treated steels. Materials Science and Engineering A 658 (2016) 400-408.
139
Curriculum Vitae
PERSONAL DATA
Family name, given name: Gao, Qi
Date and place of birth: 19.05.1986, in Nei Mongol, China
Gender: Female
Nationality: Chinese
EDUCATION
10.2009-09.2012 Master of Science in Metallurgical Engineering RWTH-Aachen University, Germany
09.2005-06.2009 Bachelor of Engineering in Material Science and Engineering
University of Science and Technology Beijing, China
RELEVANT EXPERIENCE
08.2013-12.2016 Ph.D student in Group Material Engineering of Metals
Process Development and Materials Daimler AG, Sindelfingen, Germany
04.2012-09.2012 Master thesis in Group of Material Characterization
Department of Ferrous Metallurgy RWTH-Aachen University
05.2010-08.2012 Student Assistant in Group of Advanced Material Simulation
Department of Ferrous Metallurgy RWTH-Aachen University


