Embed Size (px)
Citation preview

Microarrays 2015, 4, 287-310; doi:10.3390/microarrays4020287
microarrays ISSN 2076-3905
www.mdpi.com/journal/microarrays
Article
An Optimization-Driven Analysis Pipeline to Uncover Biomarkers and Signaling Paths: Cervix Cancer
Enery Lorenzo 1, Katia Camacho-Caceres 1, Alexander J. Ropelewski 2, Juan Rosas 1,
Michael Ortiz-Mojer 1, Lynn Perez-Marty 1, Juan Irizarry 1, Valerie Gonzalez 1,
Jesús A. Rodríguez 1, Mauricio Cabrera-Rios 1 and Clara Isaza 1,3,*
1 Bio IE Lab, The Applied Optimization Group at UPRM, Industrial Engineering Department,
University of Puerto Rico at Mayaguez, Call Box 9000, Mayagüez, PR 00681, USA;
E-Mails: [email protected] (E.L.); [email protected] (K.C.-C.);
[email protected] (J.R.); [email protected] (M.O.-M.); [email protected] (J.I.);
[email protected] (V.G.); [email protected] (J.A.R.);
[email protected] (M.C.-R.) 2 Pittsburgh Supercomputing Center, 300 S. Craig Street, Pittsburgh, PA 15213, USA;
E-Mail: [email protected] 3 Department of Pharmacology and Toxicology, Ponce School of Medicine, PO Box 700, Ponce,
PR 00732, USA
* Author to whom correspondence should be addressed; E-Mail: [email protected];
Tel.: +1-787-840-2575 (ext. 2198).
Academic Editor: Shu-Kay Ng
Received: 22 February 2015 / Accepted: 13 May 2015 / Published: 28 May 2015
Abstract: Establishing how a series of potentially important genes might relate to each
other is relevant to understand the origin and evolution of illnesses, such as cancer.
High-throughput biological experiments have played a critical role in providing information
in this regard. A special challenge, however, is that of trying to conciliate information from
separate microarray experiments to build a potential genetic signaling path. This work
proposes a two-step analysis pipeline, based on optimization, to approach meta-analysis
aiming to build a proxy for a genetic signaling path.
Keywords: traveling salesman problem; signaling pathways; cancer biology
OPEN ACCESS

Microarrays 2015, 4 288
1. Introduction
Technology advancement has accelerated the capability to generate large amounts of biological
data. The capability to translate these data into usable knowledge has, however, grown at a much
slower rate. The technologies used to generate these data are often rendered obsolete by newer ones
before the data already available are fully analyzed and taken to their full potential for biological and
medical advancement. Microarrays constitute a technology of this sort: one used to generate a large
number of experiments, many of which will be greatly under-utilized. The analysis of microarrays,
however, still holds a large potential for the discovery of genetic biomarkers for all types of cancer, as
well as elicit their signaling pathways. Extracting this kind of knowledge from microarray experiments
has historically been considered challenging, largely due to two main difficulties: (i) the use of
incommensurable units across different experiments, and (ii) the lack of analysis techniques that
converge to a consistent set of biomarkers. These two difficulties propagate uncertainty to the task of
determining a reliable signaling pathway. To this end, this work proposes a two-step pipeline that
involves (1) a meta-analysis strategy, based on multiple-criteria optimization, which circumvents both
of the main difficulties described previously to detect highly differentially expressed genes; and (2) a
method, based on integer programming to find the most correlated path among the genes from the
previous step. The central hypothesis is that there is a strong signal of relative expression in
microarrays that is effectively discoverable through mathematical optimization.
It is critical that the detection of genetic cancer biomarkers through meta-analysis can be carried out
faster, more consistently, and more accurately in order to shorten the lead-time from data generation to
data interpretation and knowledge application. The simultaneous meta-analysis of multiple experiments
via optimization and the subsequent identification of the highest correlated genetic path described in
this work offer these capabilities. Microarray data already in repositories can be readily analyzed and,
prospectively, new high-throughput biological technologies could be fully utilized earlier in the fight
against cancer. The gap between raw data and applicable biomedical/medical knowledge can be
reduced significantly; especially when considering that historic biological data will now be able to be
brought into perspective to design new experiments and focus on more precise aspects of exploration.
2. Method
The proposed analysis pipeline has two sequential stages: (1) Meta-analysis for detection of highly
differentially expressed genes and (2) finding the most correlated path. These are explained next.
2.1. Stage 1: Meta-Analysis for Detection of Highly Differentially Expressed Genes
Meta-analysis involves the joint study of multiple databases to obtain conclusions that apply across
all of them. Meta-analysis can help detect potential genetic cancer biomarkers through the study of
microarray databases. However, to this end, a series of difficulties are apparent: (a) Microarray
experiments that are publicly available use different technologies, platforms and, most of the times,
different scales. Incommensurability renders many meta-analyses efforts unfeasible [1] due to the
inability to make comparisons across all experiments of interest. Even when the same units are used,
often time, data normalization is required for comparability. (b) There is not an efficient, systematic

Microarrays 2015, 4 289
method to carry out meta-analysis. Most of the studies analyze one particular database and try to
generalize the results to other databases or analyze several databases separately and try to make sense
of all the independent results [2]. (c) The issue of having a large number of measurements and genes
generally results in large number of significant genes that must be validated [3]. (d) Meta-analysis of
microarrays—and of high throughput biological experiments in general—is a laborious process that is
often outpaced by the development of technology to generate ever-larger data sets. That is, data
generation capabilities are larger and grow faster than our abilities to make sense and translate these
data into usable knowledge. (e) Large repositories of public data generated through costly microarray
experiments could go underanalyzed and underutilized in the fight for cancer when the researchers’
attention shifts to the next high-throughput technology. The problem of making sense of large
quantities of data, however, will persist.
2.2. Multiple Criteria Optimization
Multiple Criteria Optimization (MCO) is a field from Engineering Mathematics that deals with
making decisions in the presence of multiple performance measures in conflict, i.e., decisions where
optimizing one criterion results in moving away from optimality in at least another criterion. Because
of the presence of conflict, an MCO problem does not find a single best solution but rather a set of best
compromising solutions in light of the performance measures under analysis. The best compromises
define solutions called Pareto-Efficient (or simply Efficient, for short) that define the Efficient Frontier
of the MCO problem at hand. A typical multiple criteria optimization with two conflicting
performance measures (objectives), PMs, can be visualized as in Figure 1. In this figure, a set of seven
candidate points, characterized by their values on both performance measures, are shown. The
performance measure represented in the x-axis is to be maximized while the performance measure in
the y-axis is to be minimized in this example. The problem is to find those candidate points that
dominate all of the other points in both performance measures. In the face of conflict, this will result in
a group of candidates in the southeast extreme of the set in Figure 1, solutions 3 and 5. These are
Pareto-efficient solutions and, when all of them are accounted for, they integrate the Efficient Frontier
of the MCO problem. In this example, it can be noted that among efficient solutions, an improvement
in one performance measure can only come strictly at the detriment of another one: moving from
solution 5 to solution 3 will result in an improvement in the performance measure associated to the
vertical direction, but in a loss in the performance measure associated to the horizontal direction. Note
that the general problem involves at least two performance measures to be optimized, where only the
case with two performance measures has a convenient graphical representation. An MCO problem,
however, can include as many dimensions (or performance measures) as necessary.
The general mathematical formulation of an unconstrained MCO problem is as follows:
= 1,2, … , (1)
The MCO problem in (1) can be discretized onto a set with | | points in the space of the decision
variables so as to define particular solutions , = 1,2, … , | |) which can, in turn, be evaluated in the performance measures to result in values . That is, the combination of values for the

Microarrays 2015, 4 290
decision variables evaluated in the objective function. The illustrative example in Figure 1 follows
this discretization with = 2 performance measures and | | = 7 solutions.
The MCO formulation under such discretization is, then as follows: ∈ = 1,2,… , (2)
The solutions to (2) are, then, the Pareto-efficient solutions of the discretized MCO problem. Considering formulation (2), a particular combination with evaluations will yield a
Pareto-Efficient solution to (2) if and only if no other solution exists that meets two conditions,
from this point on called Pareto-optimality conditions: ≤ ∀ (Condition 1)< (Condition 2)
Conditions (1) and (2) imply that no other solution dominates the solution under evaluation, ,
in all performance measures simultaneously.
Figure 1. Representation of a multiple criteria optimization problem with two performance measures.
In previous publications [3,4] our group has demonstrated that if a set of candidate solutions
evaluated by multiple performance measures is available, it is possible to determine a series of best
compromises between all criteria through a technique called Data Envelopment Analysis (DEA). The
idea behind DEA is to use an optimization model to compute a relative efficiency score for each
particular solution with respect to the rest of the candidate solutions. The resulting best compromises,
identified through their efficiency score, form the envelope of the solution set, therefore the name Data
Envelopment Analysis. These solutions are indeed Pareto-efficient solutions of the problem under analysis.

Microarrays 2015, 4 291
The DEA linear programming formulations proposed by Banks, Charnes, and Cooper [5] are shown
below: , , , + − = 1 − + − ≤ 0 = 1,… , ≥ ∙ ≥ ∙ , ≥ 0
(3)
, , − + − = 1 − + − ≥ 0 = 1,… , ≥ ∙ ≥ ∙ , ≥ 0
(4)
where μ and ν are column vectors containing multipliers to be optimally determined together with
scalar variables and in the first case and together with and in the second case;
and are column vectors containing the values of the jth combination of performance measures to
be minimized and maximized respectively; and ε is a scalar usually set to a value of 1 × 10⁻⁶.
Model (3) is called the BCC Input Oriented Model and Model (4) is called the BCC Output
Oriented Model. Both models are applied to each of the n candidate solutions. A particular solution
with an objective function score of 1 (i.e., an efficiency score of 1) using both formulations is in the
envelope of the set and is considered to be an efficient solution to the MCO problem. The BCC model
is just one of many possible DEA formulations, albeit a very powerful one. This model’s mathematical
linear nature provides it with the capability of finding efficient solutions associated with the data set
under analysis through a series of piece-wise linear segments. Nonlinear behavior is, then, approached
with tractability and with the certainty that at least the efficient solutions lying in the convex part of the
frontier are being found. Figure 2 shows an MCO problem solved through with DEA, specifically with
the BCC model.
DEA has several advantages including: (i) computational efficiency owing to its linear optimization
structure; (ii) objectivity and consistency of results, which follows from not requiring the adjustment of
parameters or assigning weights to the different performance measures by the user, and (iii) capability
of analyzing several microarray experiments with incommensurate units. Appendix A discusses the
volcano plot, a widely used tool to detect differentially expressed genes, to illustrate how the analyst
can bias the results. On the other hand, one limitation of DEA is that of depending on a series of local
linear approximations, as shown in Figure 2. Every time that a linear segment is superimposed over the
set under analysis, there are genes lying in the nonconvex part of the set frontier that escape detection.
+0μ −
0μ +0ν −
0ν minjY
maxjY

Microarrays 2015, 4 292
These genes could be potential biomarkers, however. In order to circumvent the said disadvantage, the
authors proposed that DEA be applied successively 10 times, each time removing the genes found in a
particular iteration from the set for subsequent analyses. This strategy results in 10 frontiers, as seen in
Figure 3. The number of efficient frontiers is, admittedly, an arbitrary number at this point, thus further
refinement is necessary in this aspect.
Figure 2. Multiple Criteria Optimization Problem solved using Data Envelopment
Analysis (BCC model). The efficient solutions are identified through the use of
piecewise-linear segments.
Figure 3. A case with genes characterized by two performance measures. Referring to this
figure, and following the proposed method, at this point it is recommended to identify the
first 10 efficient frontiers. This can be easily done by identifying the genes in the first
efficient frontier through DEA, then removing them from the set and continue with a
second DEA iteration.

Microarrays 2015, 4 293
At the end of Stage 1, the analyst is left with a set of differentially expressed genes that can be
investigated to establish their role in the condition or illness under study, cancer in this case. This set
of genes in the proposed method, however, will be used to determine how these are maximally
correlated in Stage 2.
2.3. Stage 2: Finding the Most Correlated Path
It is proposed that the most correlated path among the list of candidate genes identified in the
previous stage can be found optimally. To this end, the optimization problem identified in the literature
as the Travelling Salesman Problem (TSP), is introduced here as a viable model.
The TSP is generally stated as follows: a salesman needs to visit n cities and needs to minimize the
travel distance starting and finishing in the city of origin. Each city must be visited only once. The
solution, then, is a tour. In n cities, there is a total of n! tours. If a particular city of origin is selected a
priori, then the number of tours is (n-1)!. In our case, the objective is to find the tour among n genes of
interest that maximizes the sum of the absolute values of pairwise correlations. This tour would then be
interpreted as a surrogate for a biological pathway, defined as “a series of actions among molecules in
a cell” [6], and more specifically for a genetic signaling pathway. A biological pathway “can provide
clues about what goes wrong when a disease strikes.” [6].
As a first approximation, it is proposed that the absolute values of linear correlation coefficients
computed among a list of genes of potential biomarkers be used to construct networks such as the one
presented in Figure 4, where the TSP can be readily applied. The idea of using a linear statistical
correlation is, indeed, widely used in the literature as a means to uncover genetic coexpression. This
information, in turn, should help cancer researchers in understanding the disease as well as look for
targeted treatments. The paper by Kumari et al. [7] has studied different coexpression measurements,
recommending to carry out a preliminary study to determine the most appropriate one for different
objectives. It is, then, convenient at this point to resort to the use of the Pearson correlation coefficient
as a starting point in this work.
Figure 4. Representation of the many options for a cyclic path for 5 genes.

Microarrays 2015, 4 294
The TSP can, indeed, be understood as an optimization problem. Consider that cij represents the
cost of traveling from city i to city j and let yij be a binary variable, indicating whether or not the
salesman travels from city i to city j. Additionally let us define flow variables xij on each arc (i,j) and
assume that the salesman has n-1 units available at node 1, which is arbitrarily selected as a “source
node”, and he must deliver 1 unit to each of the other nodes [7]. The optimization model is as follows:
, ∈ (5a)
= 1 ∀ = 1,2, … , (5b)
= 1 ∀ = 1,2,… , (5c)= (5d)≤ − 1 ∀ , ∈ (5e)≥ 0 ∀ , ∈ (5f)= 0 1 ∀ , ∈ (5g)
Following the description in [8], let A’ = {(i,j): yij =1} and let A’’ ={(i,j): xij >0}. The constraints
(5b) and (5c) imply that exactly one arc of A’ leaves and enters any node i; therefore, A’ is the union of
node disjoint cycles containing all of the nodes of N. In general, any integer solution satisfying (5b)
and (5c) will be a union of disjoint cycles; if any such solution contains more than once cycle; they are
referred to as subtours, since they pass through only a subset of nodes.
In constraint (5d) N is an nxm matrix, called the node-arc incidence matrix of the minimum cost
flow problem. Each column Nij in the matrix corresponds to the variable xij. The column Nij has a +1 in
the ith row, a −1 in the jth row; the rest of its entries are zero. Constraint (5d) ensures that A” is
connected since we need to send 1 unit of flow from node 1 to every other node via arcs in A”. The
forcing constraints (5e) imply that A” is a subset A’. These conditions imply that the arc set A’ is
connected and thus cannot contain subtours [8].
The TSP is known to be a hard problem to solve to optimality; however, with a manageable number
of entities (nodes) optimality is well within reach. In our group’s experience it has been possible to
obtain the optimal TSP tour with a list of up to 100 genes in less than 1 hour of computing time in a
personal computer. The Branch and Bound—an exact algorithm—was used to this end, as coded in
Matlab. An exact algorithm is defined as one capable to arrive to a global optimal solution—provided
that one exists—with certainty. Although it is also possible to use heuristics to approach the TSP, it
must be understood that a heuristic method by definition does not provide certainty on arriving to a
global optimal solution.
Referring back to Figure 4, it should be now apparent that in n genes associated to the nodes in the
network, it is possible to obtain pairwise correlations to connect all genes among them resulting in a
fully connected network. This network, in turn, can be mathematically translated into formulation
(5a)–(5g) to identify the most correlated path. Thus, at the end of this stage, the most correlated path
Microarrays 2015, 4 295
among all candidate genes from Stage 1, will be available as a proxy for a signalling path. The
application of this two-stage analysis pipeline is demonstrated next in the context of cervix cancer.
3. Results for Cervix Cancer
3.1. Stage 1
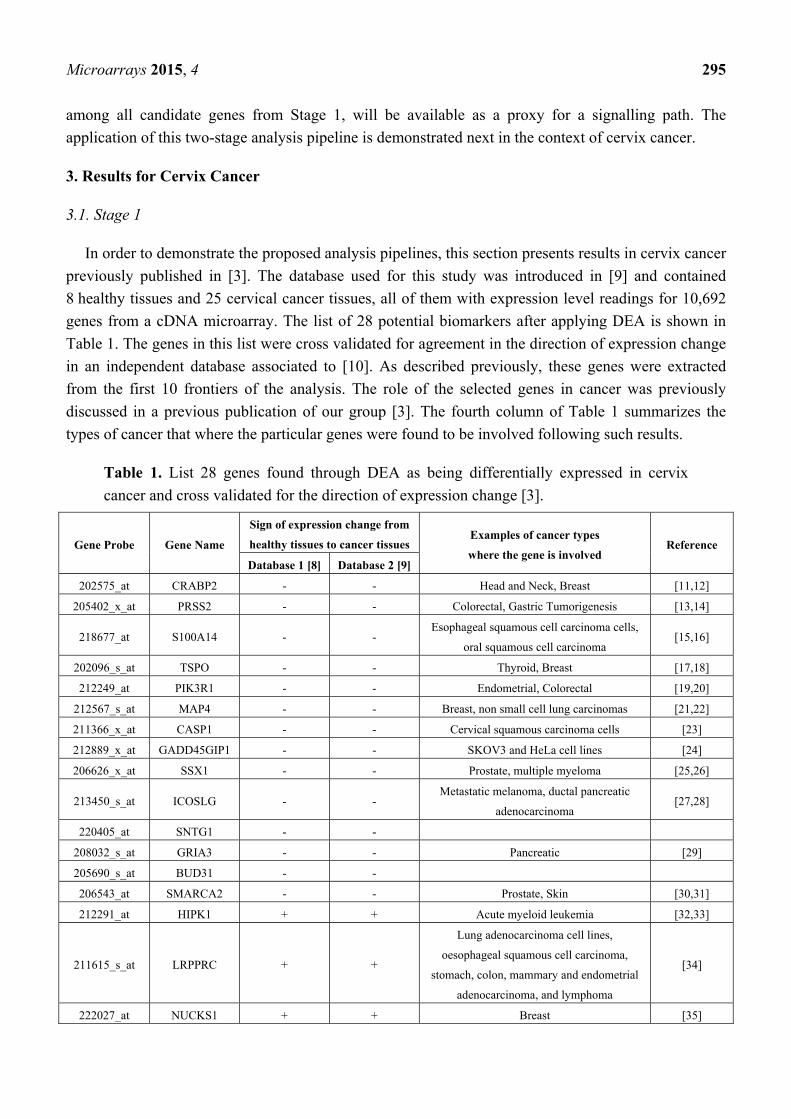
In order to demonstrate the proposed analysis pipelines, this section presents results in cervix cancer
previously published in [3]. The database used for this study was introduced in [9] and contained
8 healthy tissues and 25 cervical cancer tissues, all of them with expression level readings for 10,692
genes from a cDNA microarray. The list of 28 potential biomarkers after applying DEA is shown in
Table 1. The genes in this list were cross validated for agreement in the direction of expression change
in an independent database associated to [10]. As described previously, these genes were extracted
from the first 10 frontiers of the analysis. The role of the selected genes in cancer was previously
discussed in a previous publication of our group [3]. The fourth column of Table 1 summarizes the
types of cancer that where the particular genes were found to be involved following such results.
Table 1. List 28 genes found through DEA as being differentially expressed in cervix
cancer and cross validated for the direction of expression change [3].
Gene Probe Gene Name
Sign of expression change from
healthy tissues to cancer tissues Examples of cancer types
where the gene is involved Reference
Database 1 [8] Database 2 [9]
202575_at CRABP2 - - Head and Neck, Breast [11,12]
205402_x_at PRSS2 - - Colorectal, Gastric Tumorigenesis [13,14]
218677_at S100A14 - - Esophageal squamous cell carcinoma cells,
oral squamous cell carcinoma [15,16]
202096_s_at TSPO - - Thyroid, Breast [17,18]
212249_at PIK3R1 - - Endometrial, Colorectal [19,20]
212567_s_at MAP4 - - Breast, non small cell lung carcinomas [21,22]
211366_x_at CASP1 - - Cervical squamous carcinoma cells [23]
212889_x_at GADD45GIP1 - - SKOV3 and HeLa cell lines [24]
206626_x_at SSX1 - - Prostate, multiple myeloma [25,26]
213450_s_at ICOSLG - - Metastatic melanoma, ductal pancreatic
adenocarcinoma [27,28]
220405_at SNTG1 - -
208032_s_at GRIA3 - - Pancreatic [29]
205690_s_at BUD31 - -
206543_at SMARCA2 - - Prostate, Skin [30,31]
212291_at HIPK1 + + Acute myeloid leukemia [32,33]
211615_s_at LRPPRC + +
Lung adenocarcinoma cell lines,
oesophageal squamous cell carcinoma,
stomach, colon, mammary and endometrial
adenocarcinoma, and lymphoma
[34]
222027_at NUCKS1 + + Breast [35]

Microarrays 2015, 4 296
Table 1. Cont.
Gene Probe Gene Name
Sign of expression change from
healthy tissues to cancer tissues Examples of cancer types
where the gene is involved Reference
Database 1 [8] Database 2 [9]
205362_s_at PFDN4 + + Colorectal [36]
211929_at HNRNPA3 + + Non-small cell lung cancer [37]
203738_at C5orf22 + +
201794_s_at SMG7 + +
200607_s_at RAD21 + + Breast [38]
201011_at RPN1 + + Hematologic malignancies [39]
201761_at MTHFD2 + + Bladder, breast [40,41]
203880_at COX17 + + Non-small cell lung cancer [42]
212255_s_at ATP2C1 + + Breast, Cervical [43,44]
205112_at PLCE1 + + Gastric adenocarcinoma, colorectal [45,46]
201663_s_at
201664_at SMC4 + + Breast, cervical [9,47,48]
3.2. Stage 2
Correlation is used in this project as a proxy for inhibitory or excitatory behavior between
differences in the expression levels of two genes. As a first step, the linear correlation values between
potential biomarkers are obtained. The following step was to arrange the correlation values in a matrix.
To construct this matrix, first the differences between control and cancer tissues had to be calculated
for each gene. Then, the absolute values of the correlation coefficients were calculated among each
pair of genes based on these differences and stored in the said matrix. The absolute correlation values
were consequently associated to the arcs in a fully connected graph with nodes representing potential
biomarker genes. The resulting graph made possible the use of the formulation of the TSP. The
optimal solution to this particular TSP is the tour among the genes of interest with the largest possible
correlation, or similarly, the most correlated cyclic path as shown in Figure 5. It must be recalled at
this point that there are a total of 28! ≈ 3.04 × 10 ways in which a cyclic path can be drawn among
the 28 genes.
The TSP formulation allows a wide range of analyses. In this case, the idea was to test the stability
of the TSP solutions. In order to do so, TSP solutions were obtained using increasing numbers of
potential biomarkers in the list of genes presented in Table 1 following the increasing order of the
efficient frontier in which these were found. Starting with five genes, each time five more genes were
introduced until the list was depleted on each case. Path segments that persisted across both databases
were identified. Furthermore, path segments that persisted along the entire study were deemed the
most stable. The results of this study were then matched against known biological pathways publicly
available in the Kyoto Encyclopedia of Genes and Genomes (KEGG) [49]. A python script was written
to make this process more efficient. This script is provided in Appendix B. Table 2 summarizes the
results for each progressive analysis that introduced five genes at a time. As shown in Table 2,
(LRPPRC with MTHFD2) and (RPN1 with COX17) are adjacent in the correlated cyclic path when

Microarrays 2015, 4 297
the optimal solution is obtained for 25 and 28 genes. In addition, gene S100A14 is adjacent to TSPO
when the optimal solution for 5, 15, 20, and 25 genes is found.
Figure 5. Highest Correlated Cyclic Path among the 28 genes identified in Stage 1.
Table 2. Adjacent genes in the solutions for the correlated cyclic path found adding five
genes at a time.
Number of Genes Adjacent Genes
5 (CRABP2 with PRSS2) and (S100A14 with TSPO) 10 (PIK3R1 with MAP4) and (GADD45GIP1 with ICOSLG) 15 (SSX1 with BUD31), (ICOSLG with SNTG1), and (S100A14 with TSPO) 20 (LRPPRC with C5orf22) and (S100A14 with TSPO)
25 (S100A14 with TSPO), (SSX1 with GRIA3), (LRPPRC with MTHFD2), (RAD21 with
BUD31), and (RPN1 with COX17) 28 (LRPPRC with MTHFD2) and (RPN1 with COX17)
A search for biological pathways in KEGG databases was conducted, however not every gene could
be linked to a pathway. When comparing the known biological pathways with the obtained optimal

Microarrays 2015, 4 298
solutions, for database GSE 7803 [9] and GSE 9750 [10], the only genes that appeared adjacent in the
correlated cyclic path for both were COX17 with RPN1 and the only KEGG pathway common to both
has the identifier 01100 that corresponds to the collection of Methabolic pathways. On the other hand,
for database GSE 7803 [9], medium correlation was observed between genes HNRPA3 with BUD31,
and both gene products are present in KEGG pathway 03040 that corresponds to the splisosome. For
database GSE 9750 [10], PLCE1 is adjacent to PIK3R1, both gene products share the following KEGG
pathways: 04012 that corresponds to the ErbB signaling pathway, 04015 Ras signaling pathway,
04015 Rap1 signaling pathway, 04066 HIF-1 signaling pathway, 04070 Phosphatidylinositol signaling
system, 04370 VEGF signaling pathway, 04650 Natural killer cell mediated cytotoxicity, 04660 T cell
receptor signaling pathway, 04664 Fc epsilon RI signaling pathway, 04666 Fc gamma R-mediated
phagocytosis, 04670 Leukocyte transendothelial migration, 04722 Neurotrophin signaling pathway,
04750 Inflammatory mediator regulation of TRP channels, 04919 Thyroid hormone signaling pathway,
05169 Epstein-Barr virus infection, 05200 Pathways in cancer, 05200 Pathways in cancer, 05214
Glioma, 05223 Non-small cell lung cancer, and the 05231 KEGG pathway that corresponds to Choline
metabolism in cancer.
Table 3. Selected genes localization.
Gene Location HIPK1 1p13.2
NUCKS1 1q32.1 SMG7 1q25.3
CRABP2 1q21.3 S100A14 1q21.1
HNRNPA3 2q31.2 LRPPRC 2p21 MTHFD2 2p13.1
SMC4 3q26.1 ATP2C 3q22.1 RPN1 3q21.3 MAP4 3p21.31 COX17 3q13.33 C5orf22 5p13.3 PIK3R1 5q13.1 BUD31 7q22.1 PRSS2 7q34 SNTG1 8q11.21 RAD21 8q24.11 SSX1 Xp11.23
GRIA3 Xq25 PFDN4 20q13.2 CASP1 11q22.3 PLCE1 10q23.33
ICOSLG 21q22.3 GADD45G 19p13.2 SMARCA2 9p22.3
TSPO 22q13.31
In cancer there are chromosomal physical changes that produce gains or losses of certain genes.
To explore if the position of the genes in the cyclic path could also provide information about these

Microarrays 2015, 4 299
chromosomal changes, the location of each gene was consider (this information was obtained
from [50]). This information is listed in Table 3. All chromosomes in Table 3 have been reported as
having changes in cervical cancer, in regions close to the ones where the selected genes belong. It is
interesting to note that some of the genes that are neighbors in the cyclic path are also neighbors in
their genetic localization.
HIPK1, NUCKS1, SMG7, and CRABP2 are all in chromosome 1, the first two genes of the
list are adjacent in the cyclic path and the others are scatter through the cycle. Reported changes in
chromosome 1 in cervical cancer include: gains in the 1p region [51–53], increment on the
1q32.1–32.2 genes expression [44], aneusomy of the chromosome [54] among others.
Three genes are in chromosome 2, HNRNPA3, LRPPRC and MTHFD2. There are several changes
in chromosome 2 related to cervical cancer, for example reduced expression of genes in 2p has been
reported [55], it has also been reported that deletions of the 2q33–q37 are common in cervical
carcinoma [56] as well as loss of heterozygosity at 2q35–q37.1 [57].
COX17, RNP1, MAP4, and SMC4 (separated by three genes from the group), and ATP2C
(adjacent to SMC4) are all in chromosome 3. Changes in chromosome 3 have been extensively
reported for cervical cancer. Gain of chromosome 3q has been reported in pre-cancer and cancer of the
cervix (these are some of the reports: [58–61]) while loss of 3p12-p14 has also been observed [62] and
loss of heterozygosity on chromosome 3p has been also reported in this cancer [55].
C5orf22 and PIK3R1 are both in chromosome 5. Chromosome 5 is known to have alterations in
cervical cancer [61,63–65]. BUD31 and PRSS2 belong to chromosomes 7, there are known changes of
this chromosome in cervical cancer [66–68]. SNTG1 and RAD21 are in chromosome 8, examples of
reported changes in this chromosome can be found in: [69–72]. Genes SSX1 and GRIA3 are both in X
chromosome. Examples of the association of changes in chromosome X in cervical cancer can be
found in [73–75]. Genes PFDN4, CASP1, PLCE1, ICOSLG, GADD45G, SMARCA2, and TSPO are
located in different chromosomes, and there are reports for changes in each one of these chromosomes
in cervix cancer, for examples the reader is refer to: [10,61,76–89].
The results suggest that the chromosomal gains and losses known for cervical cancer could include
bigger regions. It is clear that true experimental validation is critical to further support the results of the
proposed pipeline analysis at this point. It is also important, however, to notice its potential for
biological discovery. Every time that a biological pathway is discovered, it basically is a problem of
selecting a path by systematically choosing pairs of genes with scientific basis. If a mathematical point
of view is adopted, this practice implies that the solution is built heuristically as opposed to optimally.
This insight has important implications for the adoption of optimization methods in Medicine
and Biology.
4. Conclusions
This work proposes a pipeline analysis based on optimization to facilitate the discovery of genetic
signaling paths related to cancer and also could provide information about expanded chromosomal
regions that are compromised for cases to be studied. In this instance, the method was applied to cervix
cancer. The potential of the proposed method is significant if the detection of a biological pathway is
understood as a combinatorial problem similar to the Traveling Salesman Problem, for which an

Microarrays 2015, 4 300
optimal solution exists. If positively verified, this point of view could also imply that current biological
pathways might have room for improvement to fully capture the signal in microarray experiments, and
thus open the possibility of further discovery in the understanding—and fight—against cancer.
Acknowledgments
This work was made possible thanks to the National Institutes of Health (NIH) MARC Grant:
T36-GM-095335 Bioinformatics Programs at Minority Institutions. It was also partially supported by
BioSEI UPRM grant 330103080301and PRLSAMP.
Author Contributions
E. Lorenzo first investigated the use of the TSP as a proxy to signaling paths under the
mathematical advice of M. Cabrera-Ríos and the biolgocal advice of C. Isaza. She coded the KEGG
search routine under the supervision of A.J. Ropelewski. K. Camacho-Cáceres coded the matlab tool
for the first stage, while J.A. Rodríguez did it for the second stage. J. Rosas provided the mathematical
treatment of the TSP. M. Ortiz-Mojer, L. Pérez-Marty, J. Irizarry, and V. González supported the
generation of literature-based biological evidence presented in this work. M. Cabrera-Ríos and C. Isaza
codirect and coadvise the research group.
Appendix A
Stage 1 of the proposed analysis pipeline involves the use of Multiple Criteria Optimization (MCO).
MCO does not require the adjustment of parameters by the users to detect differentially expressed
genes, thus it preserves the objectivity and the consistent convergence of the analysis. As a
comparative example, a tool like the volcano plot (Figure A1), would require for the user to define
different cutoff values to select different genes, thereby biasing the analysis.
Figure A1. A volcano plot. Two cutoff values must be set by the user to decide upon the
significance of different genes: one for fold change (x-axis) and one for p-value (y-axis).

Microarrays 2015, 4 301
In addition to the evident result of choosing different sets of genes when the analyst picks different
sets of cutoff values, this decision also greatly affects the number of genes that are deemed to change
their expression significantly, as shown in Table A1.
Table A1. An example of how the number of genes deemed significant changes when
choosing different cutoff values for fold change and p-value.
p-value Fold change Differentially expressed
genes (number) Number of genes Overexpressed
Number of genes Underexpressed
10−2 2 934 645 289 10−2 8 29 23 6 10−2 24 2 1 1
10−7 2 649 516 133 10−7 8 27 22 5 10−7 24 2 1 1
10−12 2 130 121 9 10−12 8 12 11 1 10−12 24 2 1 1
Appendix B
A Python script was written to gather information from KEGG. This is provided in its three parts below. Part 1 #!/opt/python2.6/bin/python # Import Comma Separated Value Library ... import csv import sys import urllib2 # Open file to be read ifile = open('results.csv', "rb") # Create the reader object (in order to read from CSV file) reader = csv.reader(ifile) # Create file to be output ofile = open('details.csv', 'w') # Create writer in order to write to output file writer = csv.writer(ofile, delimiter=',', quotechar='"', quoting=csv.QUOTE_MINIMAL) # Function in charge of extracting each genes in the database file def detailPathwayExtractor(): for row in reader: if (len(row)==1): path=row[1] try: url_to_go_to = "http://rest.kegg.jp/get/" + path print url_to_go_to handle = urllib2.urlopen(url_to_go_to) #read contenent content = handle.read() for row_of_file in content.split("\n"):

Microarrays 2015, 4 302
if row_of_file.split() != []: print row_of_file.split() writer.writerow(row_of_file.split()) # Run the pathway extractor function except IOError: print "can't open file" detailPathwayExtractor() # Close both opened files ifile.close() ofile.close()
Part2 #!/opt/python2.6/bin/python # Import Comma Separated Value Library ... import csv import sys import urllib2 # Open file to be read ifile = open('test.csv', "rb") # Create the reader object (in order to read from CSV file) reader = csv.reader(ifile) # Create file to be output ofile = open('results.csv', 'w') # Create writer in order to write to output file writer = csv.writer(ofile, delimiter=',', quotechar='"', quoting=csv.QUOTE_MINIMAL) # Function in charge of extracting each genes in the database file def pathwayExtractor(): for row in reader: if (len(row)==4): HSA=row[3] try: url_to_go_to = "http://rest.kegg.jp/link/pathway/hsa:" + HSA print url_to_go_to handle = urllib2.urlopen(url_to_go_to) #read contenent content = handle.read() for row_of_file in content.split("\n"): if row_of_file.split() != []: print row_of_file.split() writer.writerow(row_of_file.split()) # Run the pathway extractor function except IOError: print "can't open file" pathwayExtractor() # Close both opened files ifile.close() ofile.close()

Microarrays 2015, 4 303
Part 3 #!/opt/python2.6/bin/python # Import Comma Separated Value Library import csv import sys import urllib2 # Open file to be read ifile = open('results.csv', "rb") # Create the reader object (in order to read from CSV file) reader = csv.reader(ifile) # Create file to be output ofile = open('details.csv', 'w') # Create writer in order to write to output file writer = csv.writer(ofile, delimiter=',', quotechar='"', quoting=csv.QUOTE_MINIMAL) # Function in charge of extracting each genes in the database file def detailPathwayExtractor(): for row in reader: if (len(row)==1): path=row[1] try: url_to_go_to = "http://rest.kegg.jp/get/" + path print url_to_go_to handle = urllib2.urlopen(url_to_go_to) #read contenent content = handle.read() for row_of_file in content.split("\n"): if row_of_file.split() != []: print row_of_file.split() writer.writerow(row_of_file.split()) # Run the pathway extractor function except IOError: print "can't open file" detailPathwayExtractor() # Close both opened files ifile.close() ofile.close()
Conflicts of Interest
The authors declare no conflict of interest.

Microarrays 2015, 4 304
References
1. Fierro, A.C.; Vandenbussche, F.; Engelen, K.; Van de Peer, Y.; Marchal, K. Meta analysis of
gene expression data within and across species. Curr. Genomics 2008, 9, 525–534.
2. Owzar, K.; Barry, W.T.; Jung, S.H. Statistical considerations for analysis of microarray
experiments. Clin. Transl. Sci. 2011, 4, 466–477.
3. Sánchez-Peña, M.L.; Isaza, C.E.; Pérez-Morales, J.; Rodríguez-Padilla, C.; Castro, J.M.; Cabrera-
Ríos, M. Identification of potential biomarkers from microarray experiments using multiple
criteria optimization. Cancer Medicine 2013, 2, 253–265.
4. Watts-Oquendo, E.; Sánchez-Peña, M.; Isaza, C.E.; Cabrera-Ríos, M. Potential colon cancer
biomarker search using more than two performance measures in a multiple criteria optimization
approach. P. R. Health Sci. J. 2012, 31, 59–63.
5. Charnes, A.; Cooper, W.W.; Lewin, A.Y.; Seiford, L.M. Data Envelopment Analysis: Theory,
Methodology and Applications; Kluwer Academic Publishers: Boston, MA, USA, 1993.
6. National Human Genome Research Institute. National Institute of Health. Available online:
http://www.genome.gov/27530687 (accessed on 10 February 2014).
7. Kumari, S.; Nie, J.; Chen, H.S.; Ma, H.; Stewart, R.; Li, X.; Lu, M.Z.; Taylor, W.M.; Wei, H.
Evaluation of gene association methods for coexpression network construction and biological
knowledge discovery. PLoS ONE 2012, 7, e50411.
8. Ahuja, R.K.; Magnanti, T.L.; Orlin, J.B. Network Flows: Theory, Algorithms, and Applications;
Prentice Hall: Upper Saddle River, NJ, USA, 1993.
9. Zhai, Y.; Kuick, R.; Nan, B.; Ota, I.; Weiss, S.J.; Trimble, C.L.; Fearon, E.R.; Cho, K.R. Gene
Expression Analysis of Preinvasive and Invasive Cervical Squamous Cell Carcinomas Identifies
HOXC10 as a Key Mediator of Invasion. Cancer Res. 2007, 67, 10163–10172.
10. Scotto, L.; Narayan, G.; Nandula, S.V.; Arias-Pulido, H.; Subramaniyam, S.; Schneider, A.;
Kaufmann, A.M.; Wright, J.D.; Pothuri, B.; Mansukhani, M.; et al. Identification of copy number
gain and overexpressed genes on chromosome arm 20q by an integrative genomic approach in
cervical cancer: Potential role in progression. Gene Chromosome. Canc. 2008, 47, 755–765.
11. Calmon, M.F.; Rodrigues, R.V.; Kaneto, C.M.; Moura, R.P.; Silva, S.D.; Mota, L.D.; Pinheiro,
D.G.; Torres, C.; de Carvalho, A.F.; Cury, P.M.; et al. Epigenetic silencing of CRABP2 and MX1
in head and neck tumors. Neoplasia 2009, 11, 1329–1339.
12. Geiger, T.; Madden, S.F.; Gallagher, W.M.; Cox, J.; Mann, M. Proteomic portrait of human breast
cancer progression identifies novel prognostic markers. Cancer Res. 2012, 72, 2428–2439.
13. Williams, S.J.; Gotley, D.C.; Antalis, T.M. Human trypsinogen in colorectal cancer. Int. J. Cancer
2001, 93, 67–73.
14. Rajkumar, T.; Vijayalakshmi, N.; Gopal, G.; Sabitha, K.; Shirley, S.; Raja, U.M.; Ramakrishnan, S.A.
Identification and validation of genes involved in gastric tumorigenesis. Cancer Cell Int. 2010,
10, 45.
15. Chen, H.; Yuan, Y.; Zhang, C.; Luo, A.; Ding, F.; Ma, J.; Yang, S.; Tian, Y.; Tong, T.; Zhan, Q.;
Liu, Z. Involvement of S100A14 Protein in Cell Invasion by Affecting Expression and Function
of Matrix Metalloproteinase (MMP)-2 via p53-dependent Transcriptional Regulation. J. Biol.
Chem. 2012, 287, 17109–17119.

Microarrays 2015, 4 305
16. Sapkota, D.; Bruland, O.; Costea, D.E.; Haugen, H.; Vasstrand, E.N.; Ibrahim, S.O. S100A14
regulates the invasive potential of oral squamous cell carcinoma derived cell-lines in vitro by
modulating expression of matrix metalloproteinases, MMP1 and MMP9. Eur. J. Cancer 2011, 47,
600–610.
17. Klubo-Gwiezdzinska, J.; Jensen, K.; Bauer, A.; Patel, A.; Costello, J.; Burman, K.; Wartofsky, L.;
Hardwick, M.J.; Vasko, V.V. The expression of translocator protein in human thyroid cancer and
its role in the response of thyroid cancer cells to oxidative stress. J. Endocrinol. 2012, 214, 207–216.
18. Mukherjee, S.; Das, S.K. Translocator protein (TSPO) in breast cancer. Curr. Mol. Med. 2012, 12,
443–457.
19. Cheung, L.W.; Hennessy, B.T.; Li, J.; Yu, S.; Myers, A.P.; Djordjevic, B.; Lu, Y.; Stemke-Hale,
K.; Dyer, M.D.; Zhang, F.; et al. High Frequency of PIK3R1 and PIK3R2 Mutations in
Endometrial Cancer Elucidates a Novel Mechanism for Regulation of PTEN Protein Stability.
Cancer Discov. 2011, 1, 170–185.
20. Nowakowska-Zajdel, E.; Mazurek, U.; Ziółko, E.; Niedworok, E.; Fatyga, E.; Kokot, T.; Muc-
Wierzgoń, M. Analysis of expression profile of gene encoding proteins of signal cascades
activated by insulin-like growth factors in colorectal cancer. Int. J. Immunopathol. Pharmacol.
2011, 24, 781–787.
21. Chen, X.; Wu, J.; Lu, H.; Huang, O.; Shen, K. Measuring β-tubulin III, Bcl-2, and ERCC1
improves pathological complete remission predictive accuracy in breast cancer. Cancer Sci. 2012,
103, 262–268.
22. Cucchiarelli, V.; Hiser, L.; Smith, H.; Frankfurter, A.; Spano, A.; Correia, J.J.; Lobert, S. Beta-
tubulin isotype classes II and V expression patterns in nonsmall cell lung carcinomas. Cell Motil.
Cytoskeleton 2008, 65, 675–685.
23. Arany, I.; Ember, I.A.; Tyring, S.K. All-trans-retinoic acid activates caspase-1 in a dose-
dependent manner in cervical squamous carcinoma cells. Anticancer Res. 2003, 23, 471–473.
24. Nakayama, K.; Nakayama, N.; Wang, T.L.; Shih, I.M. NAC-1 controls cell growth and survival
by repressing transcription of Gadd45GIP1, a candidate tumor suppressor. Cancer Res. 2007, 67,
8058–8064.
25. Smith, H.A.; Cronk, R.J.; Lang, J.M.; McNeel, D.G. Expression and immunotherapeutic targeting
of the SSX family of cancer-testis antigens in prostate cancer. Cancer Res. 2011, 71, 6785–6795.
26. Van Duin, M.; Broyl, A.; de Knegt, Y.; Goldschmidt, H.; Richardson, P.G.; Hop, W.C.; van der
Holt, B.; Joseph-Pietras, D.; Mulligan, G.; Neuwirth, R.; et al. Cancer testis antigens in newly
diagnosed and relapse multiple myeloma: Prognostic markers and potential targets for
immunotherapy. Haematologica 2011, 96, 1662–1669.
27. Fu, T.; He, Q.; Sharma, P. The ICOS/ICOSL pathway is required for optimal antitumor responses
mediated by anti-CTLA-4 therapy. Cancer Res. 2011, 71, 5445–5454.
28. Tjomsland, V.; Spångeus, A.; Sandström, P.; Borch, K.; Messmer, D.; Larsson, M. Semi mature
blood dendritic cells exist in patients with ductal pancreatic adenocarcinoma owing to
inflammatory factors released from the tumor. PLoS ONE 2010, 5, e13441.
29. Ripka, S.; Riedel, J.; Neesse, A.; Griesmann, H.; Buchholz, M.; Ellenrieder, V.; Moeller, F.;
Barth, P.; Gress, T.M.; Michl, P. Glutamate receptor GRIA3—Target of CUX1 and mediator of
tumor progression in pancreatic cancer. Neoplasia 2010, 12, 659–667.

Microarrays 2015, 4 306
30. Sun, A.; Tawfik, O.; Gayed, B.; Thrasher, J.B.; Hoestje, S.; Li, C.; Li, B. Aberrant expression of
SWI/SNF catalytic subunits BRG1/BRM is associated with tumor development and increased
invasiveness in prostate cancers. Prostate 2007, 67, 203–213.
31. Moloney, F.J.; Lyons, J.G.; Bock, V.L.; Huang, X.X.; Bugeja, M.J.; Halliday, G.M. Hotspot
mutation of Brahma in non-melanoma skin cancer. J. Invest. Dermatol. 2009, 129, 1012–1015.
32. Mougeot, J.L.; Bahrani-Mougeot, F.K.; Lockhart, P.B.; Brennan, M.T. Microarray analyses of
oral punch biopsies from acute myeloid leukemia (AML) patients treated with chemotherapy.
Oral Surg. Oral Med. Oral Pathol. Oral Radiol. Endod. 2011, 112, 446–452.
33. Aikawa, Y.; Nguyen, L.A.; Isono, K.; Takakura, N.; Tagata, Y.; Schmitz, M.L.; Koseki, H.;
Kitabayashi, I. Roles of HIPK1 and HIPK2 in AML1- and p300-dependent transcription,
hematopoiesis and blood vessel formation. EMBO J. 2006, 25, 3955–3965.
34. Tian, T.; Ikeda, J.I.; Wang, Y.; Mamat, S.; Luo, W.; Aozasa, K.; Morii, E. Role of leucine-rich
pentatricopeptide repeat motif-containing protein (LRPPRC) for anti-apoptosis and
tumourigenesis in cancers. Eur. J. Cancer 2012, 48, 2462-2473.
35. Ziółkowski, P.; Gamian, E.; Osiecka, B.; Zougman, A.; Wiśniewski, J.R. Immunohistochemical
and proteomic evaluation of nuclear ubiquitous casein and cyclin-dependent kinases substrate in
invasive ductal carcinoma of the breast. J. Biomed. Biotechnol. 2009, 2009, 919645.
36. Miyoshi, N.; Ishii, H.; Mimori, K.; Nishida, N.; Tokuoka, M.; Akita, H.; Sekimoto, M.; Doki, Y.;
Mori, M. Abnormal expression of PFDN4 in colorectal cancer: A novel marker for prognosis.
Ann. Surg. Oncol. 2010, 17, 3030–3036.
37. Boukakis, G.; Patrinou-Georgoula, M.; Lekarakou, M.; Valavanis, C.; Guialis, A. Deregulated
expression of hnRNP A/B proteins in human non-small cell lung cancer: Parallel assessment of
protein and mRNA levels in paired tumour/non-tumour tissues. BMC Cancer 2010, 10, 434.
38. Atienza, J.M.; Roth, R.B.; Rosette, C.; Smylie, K.J.; Kammerer, S.; Rehbock, J.; Ekblom, J.;
Denissenko, M.F. Suppression of RAD21 gene expression decreases cell growth and enhances
cytotoxicity of etoposide and bleomycin in human breast cancer cells. Mol. Cancer Ther. 2005, 4,
361–368.
39. Shimizu, S.; Suzukawa, K.; Kodera, T.; Nagasawa, T.; Abe, T.; Taniwaki, M.; Yagasaki, F.;
Tanaka, H.; Fujisawa, S.; Johansson, B.; et al. Identification of breakpoint cluster regions at
1p36.3 and 3q21 in hematologic malignancies with t(1;3)(p36;q21). Genes Chromosome. Canc.
2000, 27, 229–238.
40. Andrew, A.S.; Gui, J.; Sanderson, A.C.; Mason, R.A.; Morlock, E.V.; Schned, A.R.; Kelsey,
K.T.; Marsit, C.J.; Moore, J.H.; Karagas, M.R. Bladder cancer SNP panel predicts susceptibility
and survival. Hum. Genet. 2009, 125, 527–539.
41. Xu, X.; Qiao, M.; Zhang, Y.; Jiang, Y.; Wei, P.; Yao, J.; Gu, B.; Wang, Y.; Lu, J.; Wang, Z.; et al.
Quantitative proteomics study of breast cancer cell lines isolated from a single patient: Discovery
of TIMM17A as a marker for breast cancer. Proteomics 2010, 10, 1374–1390.
42. Suzuki, C.; Daigo, Y.; Kikuchi, T.; Katagiri, T.; Nakamura, Y. Identification of COX17 as a
therapeutic target for non-small cell lung cancer. Cancer Res. 2003, 63, 7038–7041.

Microarrays 2015, 4 307
43. Grice, D.M.; Vetter, I.; Faddy, H.M.; Kenny, P.A.; Roberts-Thomson, S.J.; Monteith, G.R. Golgi
calcium pump secretory pathway calcium ATPase 1 (SPCA1) is a key regulator of insulin-like
growth factor receptor (IGF1R) processing in the basal-like breast cancer cell line MDA-MB-231.
J. Biol. Chem. 2010, 285, 37458–37466.
44. Wilting, S.M.; de Wilde, J.; Meijer, C.J.; Berkhof, J.; Yi, Y.; van Wieringen, W.N.; Braakhuis,
B.J.; Meijer, G.A.; Ylstra, B.; Snijders, P.J.; et al. Integrated genomic and transcriptional profiling
identifies chromosomal loci with altered gene expression in cervical cancer. Genes Chromosomes
Cancer 2008, 47, 890–905.
45. Wang, M.; Zhang, R.; He, J.; Qiu, L.; Li, J.; Wang, Y.; Sun, M.; Yang, Y.; Wang, J.; Yang, J.;
et al. Potentially functional variants of PLCE1 identified by GWASs contribute to gastric
adenocarcinoma susceptibility in an eastern Chinese population. PLoS ONE 2012, 7, e31932.
46. Danielsen, S.A.; Cekaite, L.; Ågesen, T.H.; Sveen, A.; Nesbakken, A.; Thiis-Evensen, E.;
Skotheim, R.I.; Lind, G.E.; Lothe, R.A. Phospholipase C isozymes are deregulated in
colorectal cancer--insights gained from gene set enrichment analysis of the transcriptome.
PLoS ONE 2011, 6, e24419.
47. Chang, H.; Jeung, H.C.; Jung, J.J.; Kim, T.S.; Rha, S.Y.; Chung, H.C. Identification of genes
associated with chemosensitivity to SAHA/taxane combination treatment in taxane-resistant
breast cancer cells. Breast Cancer Res. Treat. 2011, 125, 55–63.
48. Kulawiec, M.; Safina, A.; Desouki, M.M.; Still, I.; Matsui, S.; Bakin, A.; Singh, K.K.
Tumorigenic transformation of human breast epithelial cells induced by mitochondrial DNA
depletion. Cancer Biol. Ther. 2008, 7, 1732–1743.
49. KEGG: Kyoto Encyclopedia of Genes and Genomes. Available online: http://www.genome.jp/kegg/
(accessed on 12 April 2015).
50. Rebhan, M.; Chalifa-Caspi, V.; Prilusky, J.; Lancet, D. GeneCards: A novel functional genomics
compendium with automated data mining and query reformulation support. Bioinformatics 1998,
14, 656–664.
51. Wang, J.; Tai, L.S.; Tzang, C.H.; Fong, W.F.; Guan, X.Y.; Yang, M. 1p31, 7q21 and 18q21
chromosomal aberrations and candidate genes in acquired vinblastine resistance of human
cervical carcinoma KB cells. Oncol. Rep. 2008, 19, 1155–1164.
52. Lee, M.; Nam, E.S.; Jung, S.H.; Kim, S.Y.; Lee, S.J.; Yoon, J.H.; Lee, N.W.; Jeon, S.; Choi, J.S.;
Cho, C.H.; et al. 1p36.22 region containing PGD gene is frequently gained in human cervical
cancer. J. Obstet. Gynaecol. Res. 2014, 40, 545–553.
53. Wilting, S.M.; Steenbergen, R.D.; Tijssen, M.; van Wieringen, W.N.; Helmerhorst, T.J.; van
Kemenade, F.J.; Bleeker, M.C.; van de Wiel, M.A.; Carvalho, B.; Meijer, G.A.; et al.
Chromosomal signatures of a subset of high-grade premalignant cervical lesions closely resemble
invasive carcinomas. Cancer Res. 2009, 69, 647–655.
54. Cortés-Gutiérrez, E.I.1.; Dávila-Rodríguez, M.I.; Muraira-Rodríguez, M.; Said-Fernández, S.;
Cerda-Flores, R.M. Association between the stages of cervical cancer and chromosome 1
aneusomy. Cancer Genet. Cytogenet. 2005, 159, 44–47.

Microarrays 2015, 4 308
55. Kozlowski, L.; Filipowski, T.; Rucinska, M.; Pepinski, W.; Janica, J.; Skawronska, M.;
Poznanski, J.; Wojtukiewicz, M.Z. Loss of heterozygosity on chromosomes 2p, 3p, 18q21.3 and
11p15.5 as a poor prognostic factor in stage II and III (FIGO) cervical cancer treated by
radiotherapy. Neoplasma 2006, 53, 440–443.
56. Rao, P.H.; Arias-Pulido, H.; Lu, X.Y.; Harris, C.P.; Vargas, H.; Zhang, F.F.; Narayan, G.;
Schneider, A.; Terry, M.B.; Murty, V.V. Chromosomal amplifications, 3q gain and deletions of
2q33-q37 are the frequent genetic changes in cervical carcinoma. BMC Cancer 2004, 4, 5.
57. Edelmann, J.; Richter, K.; Hänel, C.; Hering, S.; Horn, L.C. X chromosomal and autosomal loss
of heterozygosity and microsatellite instability in human cervical carcinoma. Int. J. Gynecol.
Cancer 2006, 16, 1248–1253.
58. Thomas, L.K.; Bermejo, J.L.; Vinokurova, S.; Jensen, K.; Bierkens, M.; Steenbergen, R.;
Bergmann, M.; von Knebel Doeberitz, M.; Reuschenbach, M. Chromosomal gains and losses in
human papillomavirus-associated neoplasia of the lower genital tract—A systematic review and
meta-analysis. Eur. J. Cancer 2014, 50, 85–98.
59. Wright, T.C.; Compagno, J.; Romano, P.; Grazioli, V.; Verma, Y.; Kershnar, E.; Tafas, T.;
Kilpatrick, M.W. Amplification of the 3q chromosomal region as a specific marker in cervical
cancer. Am. J. Obstet. Gynecol. 2015, doi:10.1016/j.ajog.2015.02.001.
60. Policht, F.A.; Song, M.; Sitailo, S.; O'Hare, A.; Ashfaq, R.; Muller, C.Y.; Morrison, L.E.; King,
W.; Sokolova, I.A. Analysis of genetic copy number changes in cervical disease progression.
BMC Cancer 2010, 10, 432.
61. Luhn, P.; Houldsworth, J.; Cahill, L.; Schiffman, M.; Castle, P.E.; Zuna, R.E.; Dunn, S.T.; Gold,
M.A.; Walker, J.; Wentzensen, N. Chromosomal gains measured in cytology samples from
women with abnormal cervical cancer screening results. Gynecol. Oncol. 2013, 130, 595–600.
62. Lando, M.; Wilting, S.M.; Snipstad, K.; Clancy, T.; Bierkens, M.; Aarnes, E.K.; Holden, M.;
Stokke, T.; Sundfør, K.; Holm, R.; et al. Identification of eight candidate target genes of the
recurrent 3p12-p14 loss in cervical cancer by integrative genomic profiling. J. Pathol. 2013, 230,
59–69.
63. Johnson, L.G.; Schwartz, S.M.; Malkki, M.; Du, Q.; Petersdorf, E.W.; Galloway, D.A.;
Madeleine, M.M. Risk of cervical cancer associated with allergies and polymorphisms in genes in
the chromosome 5 cytokine cluster. Cancer Epidemiol. Biomarkers Prev. 2011, 20, 199–207.
64. Scotto, L.; Narayan, G.; Nandula, S.V.; Subramaniyam, S.; Kaufmann, A.M.; Wright, J.D.;
Pothuri, B.; Mansukhani, M.; Schneider, A.; Arias-Pulido, H.; et al. Integrative genomics analysis
of chromosome 5p gain in cervical cancer reveals target over-expressed genes, including Drosha.
Mol. Cancer 2008, 7, 58.
65. Huang, F.Y.; Chiu, P.M.; Tam, K.F.; Kwok, Y.K.; Lau, E.T.; Tang, M.H.; Ng, T.Y.; Liu, V.W.;
Cheung, A.N.; Ngan, H.Y. Semi-quantitative fluorescent PCR analysis identifies PRKAA1 on
chromosome 5 as a potential candidate cancer gene of cervical cancer. Gynecol. Oncol. 2006, 103,
219–225.
66. Schrevel, M.; Gorter, A.; Kolkman-Uljee, S.M.; Trimbos, J.B.; Fleuren, G.J.; Jordanova, E.S.
Molecular mechanisms of epidermal growth factor receptor overexpression in patients with
cervical cancer. Mod. Pathol. 2011, 24, 720–728.
Microarrays 2015, 4 309
67. Thein, A.; Trková, M.; Fox, M.; Parrington, J. The application of comparative genomic
hybridization to previously karyotyped cervical cancer cell lines. Cancer Genet. Cytogenet. 2000,
116, 59–65.
68. Mian, C.; Bancher, D.; Kohlberger, P.; Kainz, C.; Haitel, A.; Czerwenka, K.; Stani, J.;
Breitenecker, G.; Wiener, H. Fluorescence in situ hybridization in cervical smears: Detection of
numerical aberrations of chromosomes 7, 3, and X and relationship to HPV infection. Gynecol.
Oncol. 1999, 75, 41–46.
69. Ferber, M.J.; Eilers, P.; Schuuring, E.; Fenton, J.A.; Fleuren, G.J.; Kenter, G.; Szuhai, K.; Smith,
D.I.; Raap, A.K.; Brink, A.A. Positioning of cervical carcinoma and Burkitt lymphoma
translocation breakpoints with respect to the human papillomavirus integration cluster in FRA8C
at 8q24.13. Cancer Genet. Cytogenet. 2004, 154, 1–9.
70. Sokolova, I.; Algeciras-Schimnich, A.; Song, M.; Sitailo, S.; Policht, F.; Kipp, B.R.; Voss, J.S.;
Halling, K.C.; Ruth, A.; King, W.; et al. Chromosomal biomarkers for detection of human
papillomavirus associated genomic instability in epithelial cells of cervical cytology specimens.
J. Mol. Diagn. 2007, 9, 604–611.
71. Bhattacharya, N.; Singh, R.K.; Mondal, S.; Roy, A.; Mondal, R.; Roychowdhury, S.; Panda, C.K.
Analysis of molecular alterations in chromosome 8 associated with the development of uterine
cervical carcinoma of Indian patients. Gynecol. Oncol. 2004, 95, 352–362.
72. Seng, T.J.; Low, J.S.; Li, H.; Cui, Y.; Goh, H.K.; Wong, M.L.; Srivastava, G.; Sidransky, D.;
Califano, J.; Steenbergen, R.D.; et al. The major 8p22 tumor suppressor DLC1 is frequently
silenced by methylation in both endemic and sporadic nasopharyngeal, esophageal, and cervical
carcinomas, and inhibits tumor cell colony formation. Oncogene 2007, 26, 934–944.
73. Dellas, A.; Torhorst, J.; Gaudenz, R.; Mihatsch, M.J.; Moch, H. DNA copy number changes in
cervical adenocarcinoma. Clin. Cancer Res. 2003, 9, 2985–2991.
74. Marzano, R.; Corrado, G.; Merola, R.; Sbiroli, C.; Guadagni, F.; Vizza, E.; Del Nonno, F.; Carosi,
M.; Galati, M.M.; Sperduti, I.; Cianciulli, A.M. Analysis of chromosomes 3, 7, X and the EGFR
gene in uterine cervical cancer progression. Eur. J. Cancer 2004, 40, 1624–1629.
75. Hopman, A.H.; Smedts, F.; Dignef, W.; Ummelen, M.; Sonke, G.; Mravunac, M.; Vooijs, G.P.;
Speel, E.J.; Ramaekers, F.C. Transition of high-grade cervical intraepithelial neoplasia to micro-
invasive carcinoma is characterized by integration of HPV 16/18 and numerical chromosome
abnormalities. J. Pathol. 2004, 202, 23–33.
76. Tabach, Y.; Kogan-Sakin, I.; Buganim, Y.; Solomon, H.; Goldfinger, N.; Hovland, R.; Ke, X.S.;
Oyan, A.M.; Kalland, K.H.; Rotter, V.; et al. Amplification of the 20q chromosomal arm occurs
early in tumorigenic transformation and may initiate cancer. PLoS One 2011, 6, e14632.
77. Lorenzetto, E.; Brenca, M.; Boeri, M.; Verri, C.; Piccinin, E.; Gasparini, P.; Facchinetti, F.; Rossi,
S.; Salvatore, G.; Massimino, M.; et al. YAP1 acts as oncogenic target of 11q22 amplification in
multiple cancer subtypes. Oncotarget 2014, 5, 2608–2621.
78. Kehrmann, A.; Truong, H.; Repenning, A.; Boger, R.; Klein-Hitpass, L.; Pascheberg, U.;
Beckmann, A.; Opalka, B.; Kleine-Lowinski, K. Complementation of non-tumorigenicity of
HPV18-positive cervical carcinoma cells involves differential mRNA expression of cellular genes
including potential tumor suppressor genes on chromosome 11q13. Cancer Genet. 2013, 206,
279–292.

Microarrays 2015, 4 310
79. Mazumder Indra, D.; Mitra, S.; Roy, A.; Mondal, R.K.; Basu, P.S.; Roychoudhury, S.;
Chakravarty, R.; Panda, C.K. Alterations of ATM and CADM1 in chromosomal 11q22.3–23.2
region are associated with the development of invasive cervical carcinoma. Hum. Genet. 2011,
130, 735–748.
80. Huang, K.F.; Lee, W.Y.; Huang, S.C.; Lin, Y.S.; Kang, C.Y.; Liou, C.P.; Tzeng, C.C.
Chromosomal gain of 3q and loss of 11q often associated with nodal metastasis in early stage
cervical squamous cell carcinoma. J. Formos. Med. Assoc. 2007, 106, 894–902.
81. Rizvi, M.M.; Alam, M.S.; Mehdi, S.J.; Ali, A.; Batra, S. Allelic loss of 10q23.3, the PTEN gene locus
in cervical carcinoma from Northern Indian population. Pathol. Oncol. Res. 2012, 18, 309–313.
82. Wang, S.; Li, Y.; Han, F.; Hu, J.; Yue, L.; Yu, Y.; Zhang, Y.; He, J.; Zheng, H.; Shi, S.; Fu, X.;
Wu, H. Identification and characterization of MARVELD1, a novel nuclear protein that is down-
regulated in multiple cancers and silenced by DNA methylation. Cancer Lett. 2009, 282, 77–86.
83. Poignée, M.; Backsch, C.; Beer, K.; Jansen, L.; Wagenbach, N.; Stanbridge, E.J.; Kirchmayr, R.;
Schneider, A.; Dürst, M. Evidence for a putative senescence gene locus within the chromosomal
region 10p14-p15. Cancer Res. 2001, 61, 7118–7121.
84. Amiel, A.; Kolodizner, T.; Fishman, A.; Gaber, E.; Klein, Z.; Beyth, Y.; Fejgin, M.D. Replication
pattern of the p53 and 21q22 loci in the premalignant and malignant stages of carcinoma of the
cervix. Cancer 1998, 83, 1966–1971.
85. Simpson, S.; Woodworth, C.D.; DiPaolo, J.A. Altered expression of Erg and Ets-2 transcription
factors is associated with genetic changes at 21q22.2–22.3 in immortal and cervical carcinoma
cell lines. Oncogene 1997, 14, 2149–2157.
86. Lennerz, J.K.; Perry, A.; Mills, J.C.; Huettner, P.C.; Pfeifer, J.D. Mucoepidermoid carcinoma of
the cervix: another tumor with the t(11;19)-associated CRTC1-MAML2 gene fusion. Am. J. Surg.
Pathol. 2009, 33, 835–843.
87. Miyai, K.; Furugen, Y.; Matsumoto, T.; Iwabuchi, K.; Hirose, S.; Kinoshita, K.; Fujii, H. Loss of
heterozygosity analysis in uterine cervical adenocarcinoma. Gynecol. Oncol. 2004, 94, 115–120.
88. Engelmark, M.T.; Ivansson, E.L.; Magnusson, J.J.; Gustavsson, I.M.; Wyöni, P.I.; Ingman, M.;
Magnusson, P.K.; Gyllensten, U.B. Polymorphisms in 9q32 and TSCOT are linked to cervical
cancer in affected sib-pairs with high mean age at diagnosis. Hum. Genet. 2008, 123, 437–443.
89. Jee, K.J.; Kim, Y.T.; Kim, K.R.; Aalto, Y.; Knuutila, S. Amplification at 9p in cervical carcinoma
by comparative genomic hybridization. Anal. Cell Pathol. 2001, 22, 159–163.
© 2015 by the authors; licensee MDPI, Basel, Switzerland. This article is an open access article
distributed under the terms and conditions of the Creative Commons Attribution license
(http://creativecommons.org/licenses/by/4.0/).


