Embed Size (px)
Citation preview

West Derwent Pipeline
Optimised Decision Making – Sandy MuirAugust 2007

Project Scope
• Primary Objectives
– Develop a strategic asset management plan for the West Derwentpipeline taking into account the pipeline condition and the risksassociated with the pipeline
– Create a project template which would be used to conduct similarcondition studies of all Hobart Water’s major underground assets in thefuture
Optimised Decision Making
Methodology
Optimised Decision Making
• Integrated methodology
– Involved site work through to analysis andstrategy development
– Involved a broad skill-set
• Involved multiple tools
– Site investigation and testing
– Operational knowledge
– GIS
– Risk Modelling
– ODM Modelling
• Used AM approach from the InternationalInfrastructure Management Manual andOptimised Decision Making Manual
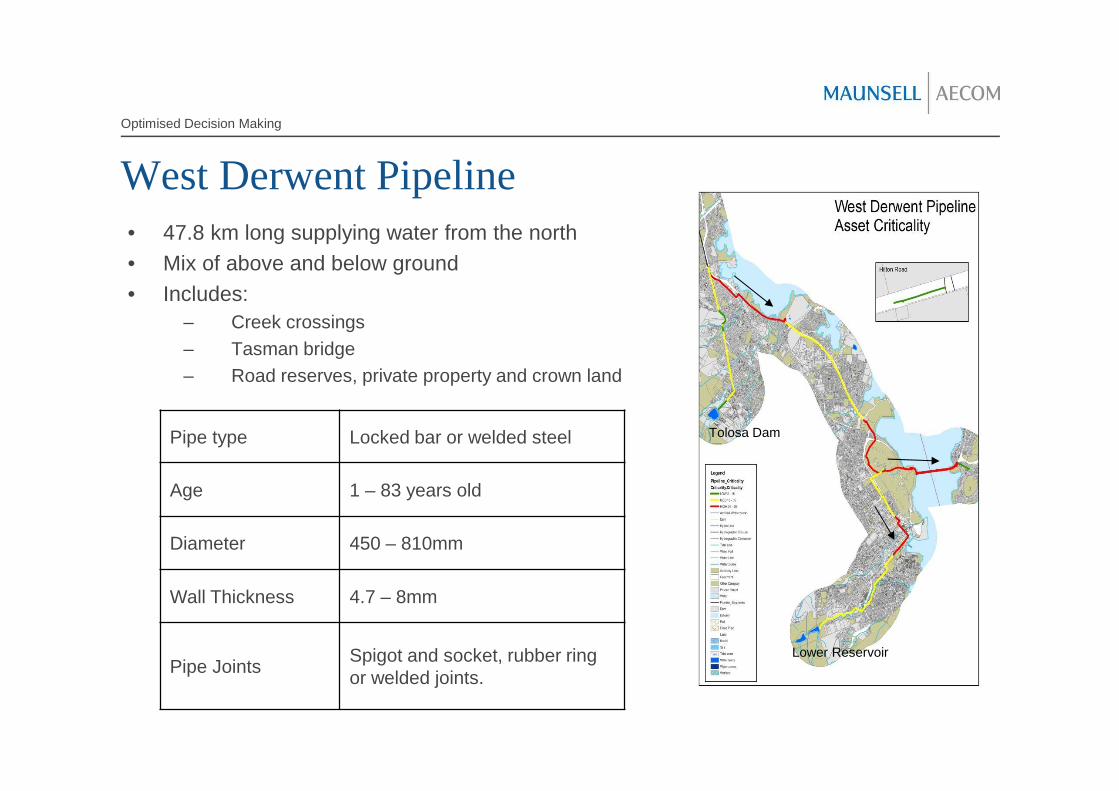
West Derwent Pipeline• 47.8 km long supplying water from the north
• Mix of above and below ground
• Includes:
– Creek crossings
– Tasman bridge
– Road reserves, private property and crown land
Optimised Decision Making
Pipe type Locked bar or welded steel
Age 1 – 83 years old
Diameter 450 – 810mm
Wall Thickness 4.7 – 8mm
Pipe JointsSpigot and socket, rubber ringor welded joints.
Lower Reservoir
Tolosa Dam
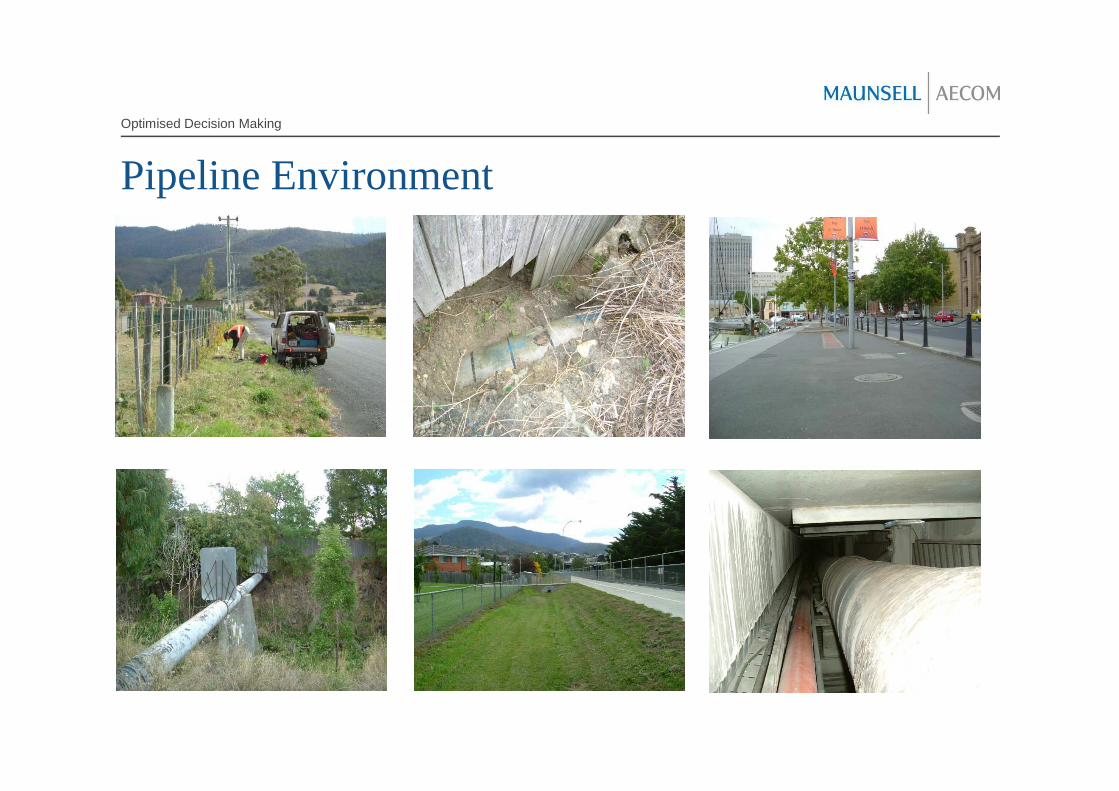
Pipeline Environment
Optimised Decision Making
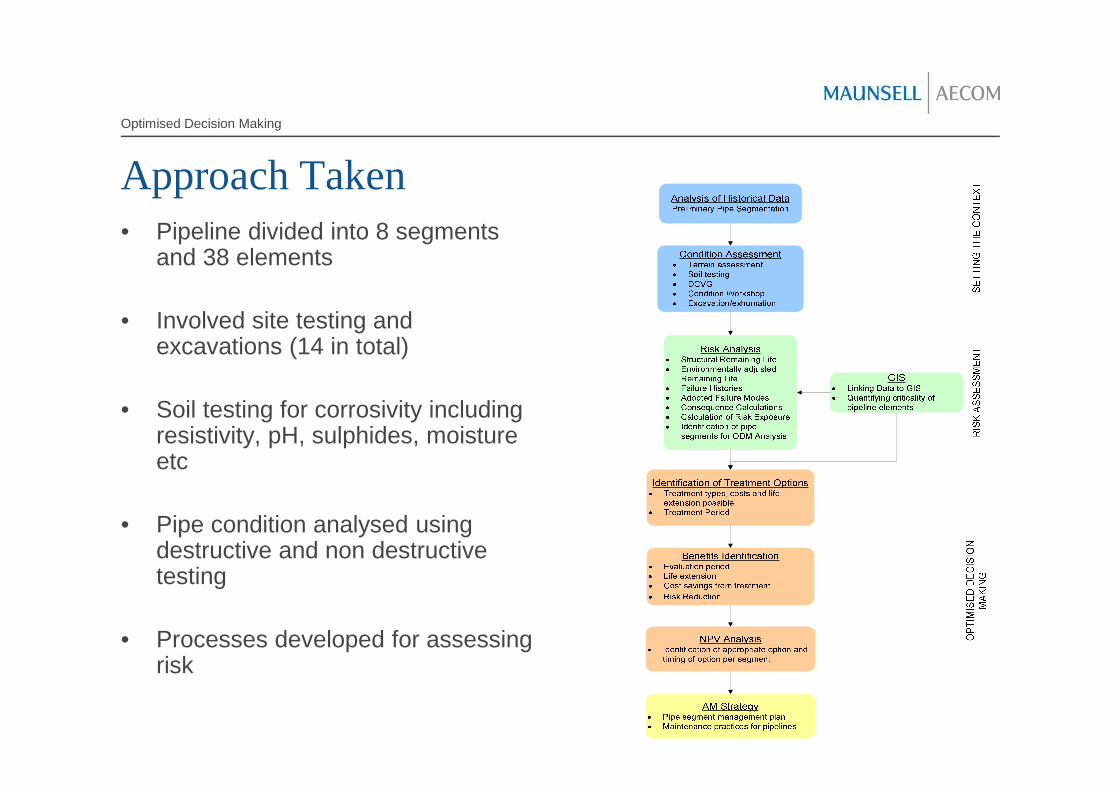
Approach Taken• Pipeline divided into 8 segments
and 38 elements
• Involved site testing andexcavations (14 in total)
• Soil testing for corrosivity includingresistivity, pH, sulphides, moistureetc
• Pipe condition analysed usingdestructive and non destructivetesting
• Processes developed for assessingrisk
Optimised Decision Making
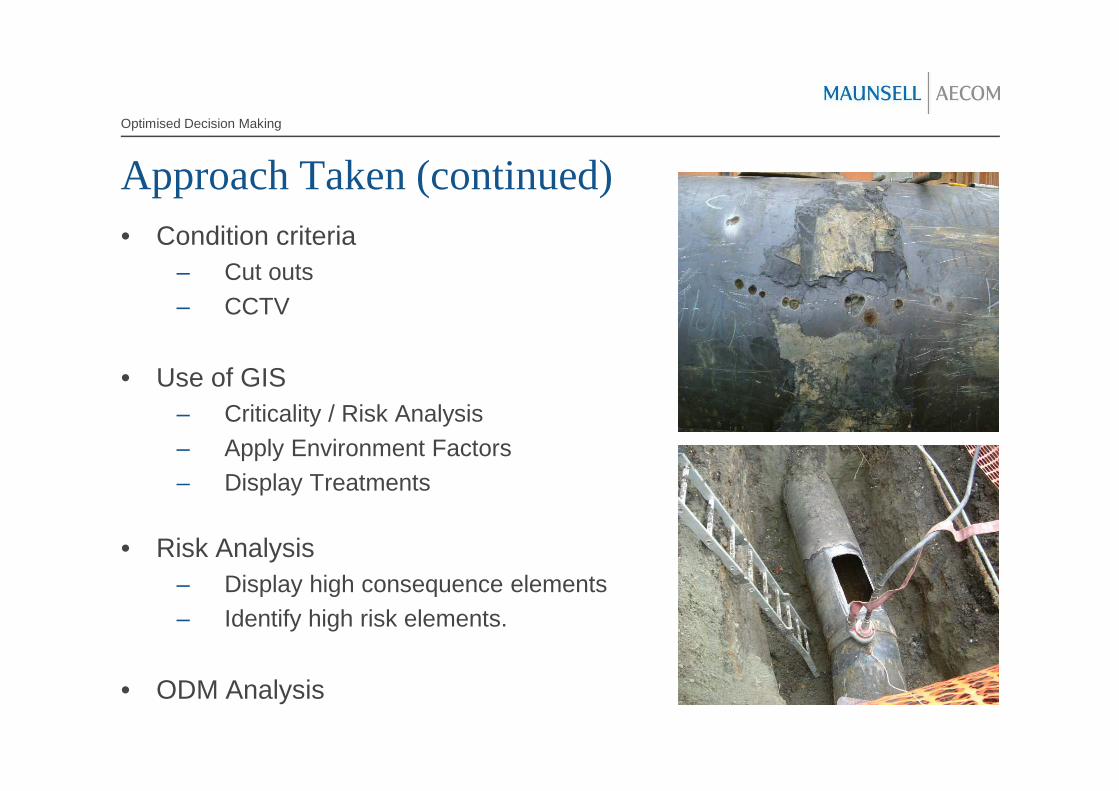
Approach Taken (continued)
Optimised Decision Making
• Condition criteria
– Cut outs
– CCTV
• Use of GIS
– Criticality / Risk Analysis
– Apply Environment Factors
– Display Treatments
• Risk Analysis
– Display high consequence elements
– Identify high risk elements.
• ODM Analysis

Pipeline Condition
Optimised Decision Making

The Analysis
Optimised Decision Making
• Risk cost model used incorporating– Direct repair cost
– Environmental impacts
– Public image
– Property damage
– Lost revenue
• ODM inputs– Pipe Segment
– Pipe Element Age of Asset (yrs) - life consumed
– Useful Life (yrs)
– Remaining Life adjusted by environmentalconditions
Aggressive soil
Ground conditions (wet or dry)
Pipe coating availability
– Replacement Cost ($)
– Treatment type, cost and life extension
– Risk exposure over time before & after treatment
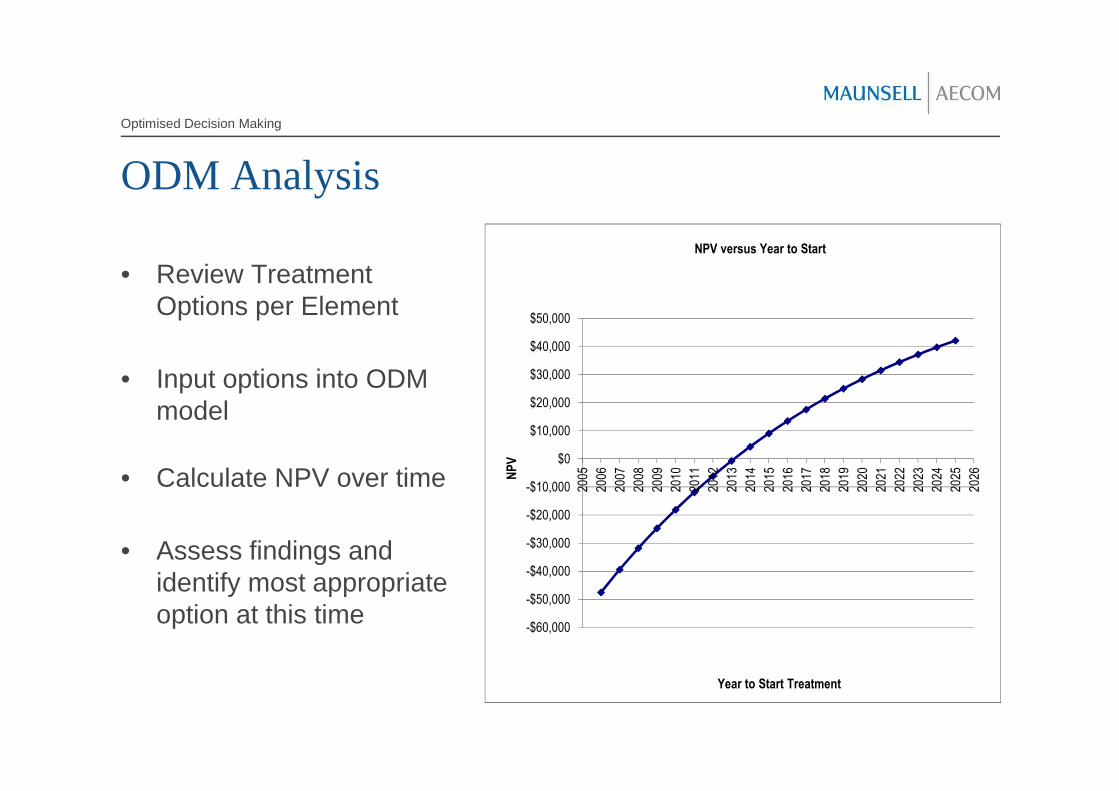
ODM Analysis
Optimised Decision Making
• Review TreatmentOptions per Element
• Input options into ODMmodel
• Calculate NPV over time
• Assess findings andidentify most appropriateoption at this time
-$60,000
-$50,000
-$40,000
-$30,000
-$20,000
-$10,000
$0
$10,000
$20,000
$30,000
$40,000
$50,000
2005
2006
2007
2008
2009
2010
2011
2012
2013
2014
2015
2016
2017
2018
2019
2020
2021
2022
2023
2024
2025
2026N
PV
Year to Start Treatment
NPV versus Year to Start

The Outcomes - Risk
Optimised Decision Making
Pipe Element Direct Repair
Cost
($)
Environ.
Impacts
($)
Public
Image
($)
Property
Damage
($)
Lost
Revenue
($)
Consequence
Cost
($)
Prob. of
Failure
Risk
Exposure
($)
Berridale Pits to Oak Hill 16,090 1,630 5,000 7,500 2,325 32,545 0.4 $13,018
Oak Hill 4,840 315 5,000 0 128 10,283 0.28 $2,879
Oak Hill Residential 4,840 1,315 5,000 0 128 11,283 0.28 $3,159
Oak Hill Residential to Islet Rivulet 4,840 315 5,000 0 128 10,283 0.28 $2,879
Islet Rivulet 4,840 630 5,000 0 9 10,479 0.48 $5,030
Islet Rivulet to Humphrey Rivulet 16,090 1,630 5,000 7,500 2,325 32,545 0.13 $4,231
Humphrey Rivulet 16,090 315 5,000 0 2,325 23,730 0.28 $6,644
Humphrey Rivulet to RecreationReserve 16,090 315 5,000 0 2,325 23,730 0.13 $3,085
Recreation Reserve to Tolosa Dam 16,090 3,150 10,000 7,500 2,325 39,065 0.13 $5,078
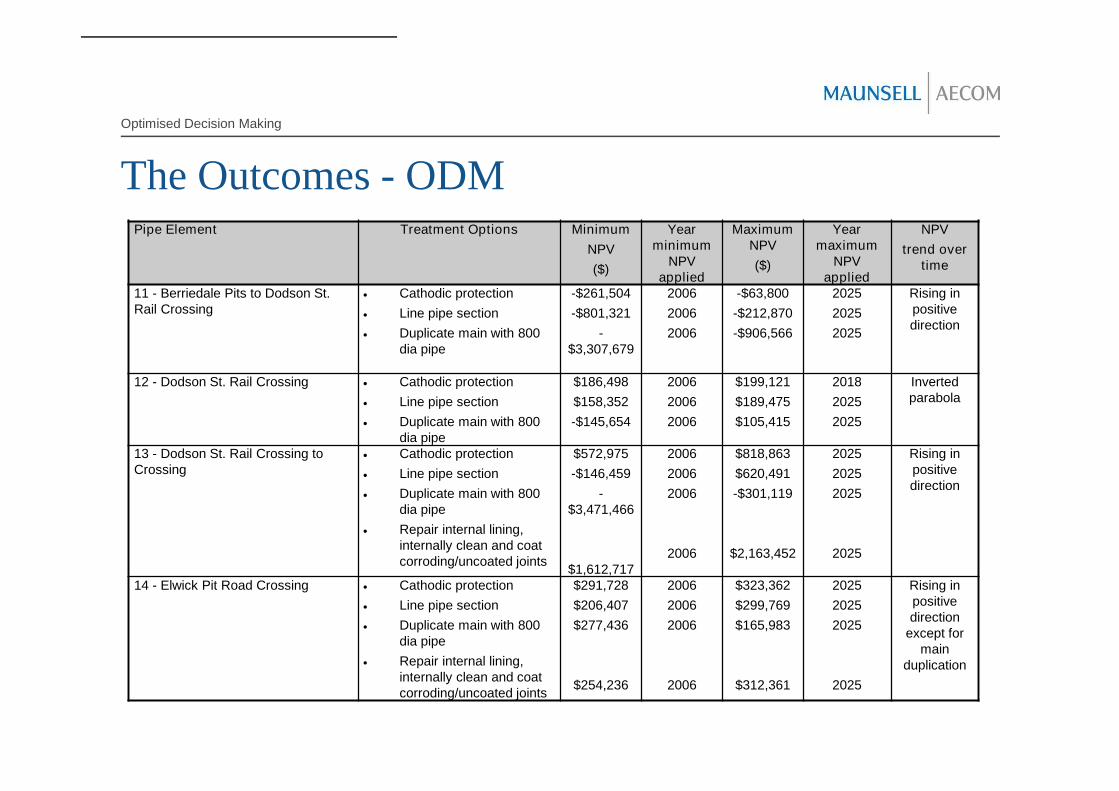
The Outcomes - ODM
Optimised Decision Making
Pipe Element Treatment Options Minimum
NPV
($)
Yearminimum
NPVapplied
MaximumNPV
($)
Yearmaximum
NPVapplied
NPV
trend overtime
11 - Berriedale Pits to Dodson St.Rail Crossing
Cathodic protection
Line pipe section
Duplicate main with 800dia pipe
-$261,504
-$801,321
-$3,307,679
2006
2006
2006
-$63,800
-$212,870
-$906,566
2025
2025
2025
Rising inpositivedirection
12 - Dodson St. Rail Crossing Cathodic protection
Line pipe section
Duplicate main with 800dia pipe
$186,498
$158,352
-$145,654
2006
2006
2006
$199,121
$189,475
$105,415
2018
2025
2025
Invertedparabola
13 - Dodson St. Rail Crossing toCrossing
Cathodic protection
Line pipe section
Duplicate main with 800dia pipe
Repair internal lining,internally clean and coatcorroding/uncoated joints
$572,975
-$146,459
-$3,471,466
$1,612,717
2006
2006
2006
2006
$818,863
$620,491
-$301,119
$2,163,452
2025
2025
2025
2025
Rising inpositivedirection
14 - Elwick Pit Road Crossing Cathodic protection
Line pipe section
Duplicate main with 800dia pipe
Repair internal lining,internally clean and coatcorroding/uncoated joints
$291,728
$206,407
$277,436
$254,236
2006
2006
2006
2006
$323,362
$299,769
$165,983
$312,361
2025
2025
2025
2025
Rising inpositivedirection
except formain
duplication

The Outcomes - Strategy
Optimised Decision Making
Pipe Element Treatment Option Year
Berridale Pits to Oak Hill Replace at end of life 2030
Berriedale Pits to Dodson St. Rail Crossing Monitor and repair if required Ongoing
Dodson St. Rail Crossing Sacrificial cathodic protection 2006
Dodson St. Rail Crossing to Crossing Cathodic protection 2006
Queens Domain to Domain Tanks Monitor and repair if required Ongoing
Domain Tanks to Botanical Gardens Road Crossing Cathodic protection 2007
Botanical Gardens Road Crossing Monitor and repair if required Ongoing
Botanical Gardens Road Crossing to Tasman BridgeRoad Crossing
Line or replace when necessary 2033
Tasman Bridge Road Crossing Line or replace when necessary 2024
Tasman Bridge Replace at end of life 2043

The Next Steps
Optimised Decision Making
• Apply recommended treatments in next 5 years
• Review strategy every 5 years to:– Update pipeline risk
– Re-analyse findings for segments in following 5 years e.g. Are the currentrecommendations still applicable?
• Implement data collection process to enhance the base supportingdata and assumptions
• Train Hobart Water personnel to undertake analysis

On Reflection• Representative test pits are needed to increase the level of confidence in the results.
In assessing test pit sites, factors that should be accommodated include:
– Surrounding environment e.g. proximity to water courses (salt and freshwater);
– Type of soil; and
– Soil moisture content.
• On-site work needs to be managed to reduce the risk of budget and time over-runs.This includes:
– Obtaining permits;
– Road closures;
– Bad weather;
– Shut-off time and notification of customers; and
– Locating 3rd party services.
• To improve confidence in the process there is a need to collect and retain failurehistories.
Optimised Decision Making
On Reflection (continued)• Need to recognise both qualitative and quantitative data in the initial activity to gather
sufficient data.
• Use of different skills and tools i.e. GIS, asset management, operations, contractorsrequire extensive co-ordination to manage the total process.
• When a break occurs along a main there is an opportunity to view an undergroundsection of pipe. The following types of testing may be applied:
– Pit gauge measurements;
– Steel thickness measurements;
– Soil resistivity; and
– Soil to pipe potential.
• It is not the end, it is the beginning. Established processes and data requirementsduring the project need to be retained for ongoing analysis.
Optimised Decision Making

Benefits to Hobart WaterThe project provided the following benefits to Hobart Water:
– Focussed on the needs of the pipeline;
– The GIS has been updated to incorporate soil parameters and inputs supporting theanalysis;
– The data required to update this analysis and support asset management practices isbeing gathered by staff;
– Risk has since been implemented in Hobart Water;
– The processes have since been applied across the rest of the infrastructure; and
– A long term strategy has since been developed for all Hobart Water’s assets.
Optimised Decision Making