Embed Size (px)
Citation preview

University of Massachusetts Amherst University of Massachusetts Amherst
ScholarWorks@UMass Amherst ScholarWorks@UMass Amherst
Open Access Dissertations
9-2009
Managing Audits to Manage Earnings: The Impact of Baiting Managing Audits to Manage Earnings: The Impact of Baiting
Tactics on an Auditor’s Ability to Uncover Earnings Management Tactics on an Auditor’s Ability to Uncover Earnings Management
Errors Errors
Benjamin Labrie Luippold University of Massachusetts Amherst
Follow this and additional works at: https://scholarworks.umass.edu/open_access_dissertations
Part of the Accounting Commons
Recommended Citation Recommended Citation Luippold, Benjamin Labrie, "Managing Audits to Manage Earnings: The Impact of Baiting Tactics on an Auditor’s Ability to Uncover Earnings Management Errors" (2009). Open Access Dissertations. 106. https://doi.org/10.7275/q1nr-2y92 https://scholarworks.umass.edu/open_access_dissertations/106
This Open Access Dissertation is brought to you for free and open access by ScholarWorks@UMass Amherst. It has been accepted for inclusion in Open Access Dissertations by an authorized administrator of ScholarWorks@UMass Amherst. For more information, please contact [email protected].
MANAGING AUDITS TO MANAGE EARNINGS:
THE IMPACT OF BAITING TACTICS ON AN AUDITOR’S ABILITY
TO UNCOVER EARNINGS MANAGEMENT ERRORS
A Dissertation Presented
by
BENJAMIN LABRIE LUIPPOLD
Submitted to the Graduate School of the University of Massachusetts Amherst in partial fulfillment
of the requirements for the degree of
DOCTOR OF PHILOSOPHY
September 2009
Isenberg School of Management

© Copyright by Benjamin Labrie Luippold 2009
All Rights Reserved
MANAGING AUDITS TO MANAGE EARNINGS:
THE IMPACT OF BAITING TACTICS ON AN AUDITOR’S ABILITY
TO UNCOVER EARNINGS MANAGEMENT ERRORS
A Dissertation Presented
by
BENJAMIN LABRIE LUIPPOLD
Approved as to style and content by: ___________________________________ Thomas Kida, Chair ___________________________________ James F. Smith, Member ___________________________________ M. David Piercey, Member ___________________________________ Andrew L. Cohen, Member
___________________________________ Ben S. Branch, Ph.D. Program Director Isenberg School of Management

DEDICATION
To Mom and Dad.

v
AKNOWLEDGEMENTS
I would like to thank my friend and advisor, Thomas Kida, for his guidance,
patience and support throughout the years. I can truly say that I have never learned so
much from one person as I did from Tom. All in all, Tom made this experience truly
invaluable for me, and he did so by providing an atmosphere that allowed us to laugh at
ourselves and each other. As I told him during one of the many times that I gave him a
ride home, if I had to do it all over again, I definitely would! Thanks for everything,
Tom.
In addition to Tom, three others were always eager to listen, provide insightful
advice and extend continuous patience. These individuals are my committee members:
Jim Smith, Dave Piercey and Andrew Cohen. In particular, I’m grateful to Jim for his
ability to drill down on issues and provide a different perspective and opinion, Dave for
his encyclopedic knowledge of the literature, and Andrew for his ability to provide a
more cognitive perspective to my research questions.
While I benefitted greatly from the support of the faculty, the support of my peers
helped me cope with the day-to-day pressures of the Ph.D. program. While I appreciate
all of them, I would like to mention four specifically. Tracey Riley was a constant
beacon of reassurance and I couldn’t imagine a better person to go through the program
with. James Wainberg and Steve Perreault have been great friends throughout the
program. Even though I would continually harass them by bouncing ideas off of them
and begging them to proof my work, they still continued to go to lunch with me regularly.
Finally, Steve Gill was a great resource and friend who “showed me the ropes” early on
in the program.

vi
In addition to my peers at UMass, I have also been fortunate to befriend Ph.D.
students at other institutions. In particular, Tamara Lambert, Chad Stefaniak, Jodi
Bellovary and the rest of the members of Team Awesome were always there to share in
my highs and lows over the last two years. I look forward to working with you all
throughout our careers.
In audit judgment and decision making research, more often than not, professional
auditors are needed to serve as participants in experiments. As such, I would like to
thank the following individuals for their help in providing participants: Gib Hammond,
Amy Selva, Jayne Burke, Maris Tombs, Erica Allen, Paul Kelliher, John Micalizzi, Phil
Lamoreaux, Matt Howe, Cathy West, Debbie Puchalski, Ron Mannino and Jason Janoff.
Without their help, I would probably still be at my desk, scratching my head, wondering
how I would get my data.
In addition to some of the previously mentioned individuals, I would also like to
extend a big thank you to Linda Kolbasovsky, Jeff Atwater, Jon Marston, Jennifer
Putnam and Marsha Keune for pretesting the research instrument.
On a more personal level, I would be remiss if I did not express my gratitude to
many of my friends who I have neglected while going through this program. In no
particular order, I would like to thank Sboyd, Bunky, Heidi, Andy, Reid, Josh, Gregger,
Schady, Simon, Joey and Taffy for all of their support and for not hating me in the wake
of my neglect over the years.
I also must extend a HUGE thank you to Franny Conlin. After my second year of
graduate school, I was fortunate enough to meet her, and at that moment, I knew she was
the one for me. From then on, her unwavering support, unconditional love and constant
vii
reassurance were the driving forces for my success. As a Ph.D. student herself, she was
one of the few individuals who could truly empathize with the stress that I faced.
Thanks babycakes; I love you! Now it’s my turn to return the favor.
Finally, I owe just as big of a thank you to my parents, Debbie and Bill Luippold,
and my sister, Jenna Luippold. Five years ago, they graciously welcomed me back into
their home. In addition to the laundry and meals, they were always there for me in any
and every capacity I needed. I know that sometimes I could be irritable, messy, and a
real PITA, and want you to know how much I appreciate you for putting up with me.
Thankfully, it’s over now, and I couldn’t have done it without you. I love you!

viii
ABSTRACT
MANAGING AUDITS TO MANAGE EARNINGS:
THE IMPACT OF BAITING TACTICS ON AN AUDITOR’S ABILITY
TO UNCOVER EARNINGS MANAGEMENT ERRORS
SEPTEMBER 2009
BENJAMIN LABRIE LUIPPOLD, B.S., BABSON COLLEGE
Ph.D., UNIVERSITY OF MASSACHUSETTS AMHERST
Directed by: Professor Thomas Kida
This study examines an aspect of earnings management that I refer to as audit
management. I define audit management as a client’s strategic use of techniques (e.g.,
baiting tactics) to prevent auditors from discovering earnings management during the
audit. Specifically, I examine whether two baiting tactics, diversionary statements and
distracting errors, affect an auditor’s ability to uncover an accounting error used to
manage earnings. Auditors performed analytical review on financial statements that
contained an earnings management error (i.e., an intentional error that results in the client
meeting an earnings target). I manipulated whether management provided a diversionary
statement that explicitly identified risk in other areas of the audit, and whether
management seeded easier, distracting errors into those other areas, both of which were
designed to lure the auditor away from the earnings management error. I found that when
auditors were intentionally directed to error free accounts they were unlikely to uncover
an earnings management error elsewhere in the financial statements. On the other hand,
auditors were most accurate in identifying earnings management when they were directed
to audit areas that contained distracting errors. These results suggest that managers can

ix
use certain baiting tactics to strategically manage the outcome of the audit, but that, in
some circumstances, baiting tactics may actually make auditors more likely to uncover
managed earnings.
x
TABLE OF CONTENTS
Page
AKNOWLEDGEMENTS................................................................................................ v
ABSTRACT ................................................................................................................ viii
LIST OF TABLES ...................................................................................................... xiii
LIST OF FIGURES ...................................................................................................... xiv
CHAPTER
1. INTRODUCTION .................................................................................................. 1
Earnings Management ................................................................................. 2
Audit Management ...................................................................................... 5
Analytical Review ........................................................................... 7
Distractions ................................................................................................. 8
Conservatism............................................................................................. 10
Overview of the Study ............................................................................... 11
Preview of the Results ................................................................... 12
2. LITERATURE REVIEW...................................................................................... 13
Earnings Management ............................................................................... 13
Pressures ........................................................................................ 14
Evidence ........................................................................................ 15
Summary ....................................................................................... 18
Audit Management .................................................................................... 18
Distractions ............................................................................................... 20
Legitimation ....................................................................................... 20
Attention ............................................................................................ 22
xi
Need for Closure ................................................................................ 24
Attitudes and Persuasion .................................................................... 26
Human Engineering ........................................................................... 27
Summary ............................................................................................ 29
Conservatism............................................................................................. 29
Summary ................................................................................................... 32
3. METHODOLOGY ............................................................................................... 33
Research Questions ................................................................................... 33
Method ...................................................................................................... 34
Participants ........................................................................................ 34
Overview of the Study ........................................................................ 35
Development of the Instrument .......................................................... 38
Pretests of the Instrument ................................................................... 47
Experimental Procedures .................................................................... 48
Variable and Manipulation Checks ..................................................... 53
4. DATA ANALYSIS.............................................................................................. 55
Audit Effectiveness ................................................................................... 55
Effect of Search and Ability Control Variables ................................... 60
Summary ............................................................................................ 62
Identification of the Earnings Management Error ...................................... 63
Sensitivity to the Number of Irrelevant Judgments ............................. 65
Summary ............................................................................................ 67
Information Search and Judgments ............................................................ 67
Comparison Between Auditors Who Identified the Earnings Management Error and Those Who Did Not ....................................... 68
xii
Examination of Auditors Who Did Not Identify the Earnings Management Error ............................................................................. 72
Examination of Auditors Who Identified the Earnings Management Error .................................................................................................. 73
Examination of the Point When the Earnings Management Error was Discovered .................................................................................. 74
Summary ............................................................................................ 75
Effect of Need for Closure ......................................................................... 77
Effect of Auditors’ Perception of Management and the Audit Process ....... 80
Auditor Skepticism............................................................................. 81
Summary of Analyses ............................................................................... 87
5. CONCLUSIONS .................................................................................................. 89
Limitations ................................................................................................ 91
Suggestions for Future Research ................................................................ 91
APPENDIX
RESEARCH INSTRUMENT ............................................................................... 94
BIBLIOGRAPHY ....................................................................................................... 143

xiii
LIST OF TABLES
Page
3.1 Client Background and Financial Information ....................................................... 39
3.2 Need for Closure Statements ................................................................................. 52
3.3 Supplementary Management Statements ............................................................... 53
4.1 The Effect of Baiting Tactics on Audit Effectiveness: ANOVA ........................... 59
4.2 The Effect of Baiting Tactics on Audit Effectiveness: Regression ........................ 62
4.3 The Effect of Baiting Tactics on the Identification of the Earnings Management Error ..................................................................................................................... 65
4.4 The Effect of Baiting Tactics on the Identification of the Earnings Management Error: Sensitivity to the Number of Irrelevant Judgments ..................................... 66
4.5 The Effect of Baiting Tactics on Information Search Variables and Number of Judgments ............................................................................................................ 69
4.6 The Effect of Baiting Tactics on Information Search and Number of Judgments: Breakdown Between Individuals Who Found the Earnings Management Error and Those Who Did Not .............................................................................................. 71
4.7 The Effect of Baiting Tactics on Information Search and Number of Judgments at the Point When the Earnings Management Error was Discovered ......................... 76
4.8 The Effect of Need for Closure on Audit Effectiveness, Information Search and Number of Judgments ........................................................................................... 79
4.9 The Effect of Supplementary Management Statements Agreement on Audit Effectiveness, Information Search and Number of Judgments ............................... 82
4.10 The Effect of Skepticism on Audit Effectiveness .................................................. 83
4.11 The Effect of Skepticism on the Identification of the Earnings Management Error: Sensitivity to the Number of Irrelevant Judgments ................................................ 86

xiv
LIST OF FIGURES
Page
3.1 Experimental Design ............................................................................................. 37
3.2 Timeline of Experimental Procedures ................................................................... 50
4.1 The Effect of Baiting Tactics on Audit Effectiveness ............................................ 58
4.2 The Effect of Baiting Tactics on the Identification of the Earnings Management Error ..................................................................................................................... 64

1
CHAPTER 1
INTRODUCTION
Earnings management has been a topic of great interest in both the popular press
and academic literature (e.g., Creswell 2002; Degeorge et al. 1999; Hayn 1995;
MacDonald 2002). In fact, the attempt to manipulate financial performance has become
so widespread that books have been written on earnings management strategies (e.g.,
Giroux 2003; McKee 2005). This study discusses an aspect of earnings management that
I refer to as audit management. I define audit management as a client’s strategic use of
techniques (e.g., baiting or distraction tactics) to prevent auditors from discovering
managed earnings during the audit. Evidence suggests that clients employ such
techniques within the audit to manipulate income (e.g., Barr 1998). The question
therefore arises: Are auditors able to uncover managed earnings when their clients
manage the audit?
This study investigates whether auditors are able to identify earnings management
errors (i.e., financial misstatements that the client intentionally uses to meet an earnings
target) when the client employs baiting (distraction) tactics in an attempt to manage the
audit.1 More specifically, I examine whether diversionary statements made by the client
(i.e., identifying areas of risk in the financial statements to lure the auditor away from the
earnings management error) affect an auditor’s ability to uncover an earnings
management error. I also examine whether seeding easily discovered errors into the
1 While auditing standards typically characterize unintentional misstatements as errors and intentional misstatements as fraud, I use the term error in its more generic sense to refer to any departure from accuracy.
2
financial statements affects an auditor’s ability to uncover a separate, more difficult-to-
detect, earnings management error.
Managers may be motivated to divert auditors to areas that contain, or do not
contain, distracting errors. For example, if managers divert auditors to ostensibly risky
areas that are error free, auditors may conclude that the client’s accounts are likely to be
accurate in other areas as well. Conversely, management may want to direct auditors to
areas that contain distracting errors because, if auditors spend more time and effort
finding errors in one area, they will have less time to search for an earnings management
error elsewhere in the financial statements. However, directing auditors to areas
containing errors could raise a red flag, resulting in greater overall audit effort. As a
result, I investigate the effect of management directing auditors to both error and error-
free accounts.
While certain psychological theories suggest that auditors will be less likely to
find an earnings management error when baiting tactics are employed (e.g., Kahneman
1973; Petty and Cacioppo 1986; Simons and Chabris 1999; Webster and Kruglanski
1994), auditors are also trained to practice professional skepticism and exhibit
conservatism in their judgments (Smith and Kida 1991), which suggests that auditors
may not be susceptible to audit management strategies.
Earnings Management
Earnings management refers to financial reporting practices designed to achieve
desired or favorable financial results (e.g., smoothing earnings, meeting earnings targets)
(Bouillon 2007; Jackson and Pitman 2001; McKee 2005; Millstein 2005). Management
faces several pressures, such as meeting analysts’ forecasts, which compel them to resort
3
to such practices (Duncan 2001). For instance, managers may seek to avoid a fate
similar to that of Proctor and Gamble, whose stock fell 30% in the first quarter of 2000
after it warned that it would not meet its forecasted earnings (Duncan 2001). Regardless
of their underlying incentives to engage in such practices, evidence suggests that these
short-term pressures can take priority over long-term economic growth. Both
experimental and survey research have found that executives would sacrifice economic
value to smooth earnings or hit an earnings target (Bhojraj and Libby 2005; Graham et al.
2005).
Archival research provides substantial evidence that earnings management occurs
(e.g., Burgstahler and Dichev 1997; Degeorge et al. 1999; Hayn 1995). In fact, several
studies have examined specific accrual accounts that clients use to manage earnings (e.g.,
Bernard and Skinner 1996; Dhaliwal et al. 2004; Marquardt and Wiedman 2004).
Furthermore, while McKee (2005) suggests that earnings management should only
involve legal accounting tactics (e.g., maintaining cookie jar reserves, using derivatives,
changing assumptions), a number of illegal earnings management practices have been
documented (e.g., Collins 2007; Earnings Management 2008; Henry 2004; Hilzenrath
2007; MacDonald 2002; Mavin 2007). More striking, however, is evidence suggesting
that managers sometimes resort to fraudulent measures to manage earnings (e.g., Beasley
et al. 1999; Farber 2005; Jones et al. 2008).
This notion is underscored by a survey conducted at a CFO Magazine sponsored
conference, which indicated that 78% of attending CFOs had faced pressures to manage
earnings upwards using GAAP approved changes, and about half had agreed to do so.
More surprisingly, 45% of the attending CFOs had been asked by senior executives to
4
misrepresent the company’s financial performance, and 38% complied (Barr 1998;
Earnings Management 2008; McKee 2005; Mills 2003).
The risk of detection should deter managers from illegally or fraudulently
misreporting earnings. However, anecdotal evidence suggests that such earnings
management strategies are often practiced because of the difficulty in distinguishing
between outright fraud and unintentional error. For example, Nortel Networks was
accused of engaging in fraudulent financial reporting, but was able to settle without an
admission of guilt, possibly due to the difficulty in proving fraudulent intent over
accidental errors (Kalawksy 2005; Mavin 2007; U.S. Securities and Exchange
Commission 2007). In addition, an internal investigation at Dell, Inc. revealed that
management had knowingly used accounting errors to help meet earnings targets (Collins
2007). These cases point to management’s willingness to use errors to manage earnings
and the difficulty in differentiating between fraud and unintentional accounting errors.
Since it is difficult for the auditor to distinguish intentional errors from simple
mistakes, management may readily explain such errors as unintentional mistakes
(Cabrera 2007; Mavin 2007). This plausible, alternative explanation can mitigate the
client’s perceived risk of engaging in illegal earnings management. In fact, it has been
suggested that managers believe they can outsmart auditors by using difficult to detect
earnings management tactics, and would probably engage in these types of practices
regardless of the risk of being caught (Duncan 2001; Merchant 1989). However, in order
for management to successfully report over-aggressive or fraudulent earnings, auditors
must fail to discover how and where income is being manipulated.
5
Audit Management
I define audit management as a client’s strategic use of techniques to prevent
auditors from identifying or recognizing managed earnings during the audit. Managing
the audit may include a variety of methods. For instance, managers may frame evidence
in certain ways to manipulate the level of perceived risk. They may provide the auditor
with incomplete or incorrect information to cover-up questionable accounting practices.
Or, they may use baiting tactics to distract the auditor from uncovering earnings
management, which is the primary focus of this study.
Two potential tactics are of particular interest: diversionary statements and
distracting errors. Diversionary statements refer to management identifying specific
areas of risk in the financial statements to lure the auditor away from the accounts used to
manage earnings. Distracting errors, on the other hand, involve the insertion of easily
detectable errors into specific areas of the financial statements, again in an attempt to
draw the auditor away from errors in other areas that the client is using to manage
earnings.2
Managers may divert auditors to areas where errors have been seeded, or where
there are no known errors. Managers may be motivated to direct auditors to seeded errors
for several reasons. First, given budget constraints, more time spent in one area of the
audit may result in less time being spent in other areas. Second, allowing auditors to find
errors may contribute to the auditors feeling satisfied that they “have done their job,”
2 Conversations with practitioners lead us to believe that this and similar tactics likely occur in practice. For example, a former manager of a technology company indicated that, when auditors found error corrections that would reduce earnings, he would direct them toward other error corrections that would increase earnings. Similarly, an audit partner indicated that managers may indeed see the audit as a diversionary game.
6
resulting in auditors feeling less compelled in their search to discover other errors. Third,
management may feel that pointing out areas that lead to error discovery may increase the
trust that auditors have in them, resulting in auditors performing less work in areas that
management suggests are problem free.
Conversely, managers may be motivated to direct auditors to areas into which no
errors have been seeded, since auditors may conclude that if the client’s accounts are
accurate in areas of higher misstatement risk, they are likely to be error free elsewhere in
the financial statements. As a result, I investigate the auditor's ability to uncover earnings
management errors in both of these potential scenarios. It should be noted that, while I
investigate error discovery in this paper, baiting tactics may be used to distract auditors
from different types of earnings management practices, including those that are illegal
and fraudulent, as well as any aggressive GAAP-approved method.
Audit management will be more successful when auditors shift their attention and
effort away from areas where manipulated reporting occurs. A recent archival study
provides evidence to support this notion. Caramanis and Lennox (2008) found that when
audit hours are low, abnormal accruals are more often larger and positive, suggesting that
companies are more likely to manage earnings. On a macro-level, this suggests that
audits receiving less attention will yield more opportunities for clients to manipulate
earnings. Following this logic, if an auditor’s attention is directed away from certain
parts of the audit by baiting tactics, managers may be able to manage earnings in the
areas receiving less attention.
7
Analytical Review
While clients may attempt to “manage” many different aspects of the audit, one
area that is of particular interest is analytical review. Koonce (1993) outlines analytical
review as a diagnostic, iterative process of identifying and explaining unexpected
fluctuations or errors. Analytical review is used to determine the extent of required
detailed testing in different audit areas, and sometimes, is the only audit procedure used
to test certain accrual based accounts (Ricchiute 2006). For example, unless specific
risks are identified that warrant detailed testing, compensation accruals are typically
audited using only some variant of analytical review (Ricchiute 2006).3 Thus, if such an
account contains errors that go undetected during analytical review, there may not be
subsequent procedures in the audit plan to detect them.
Several studies have examined various aspects of the cognitive processes involved
in analytical review procedures (e.g., Asare et al. 2000; Asare and Wright 2003; Bedard
and Biggs 1991a, 1991b; Bhattacharjee et al. 1999). A finding common to many of these
studies is that auditors sometimes perform poorly on analytical review. In fact, these
studies often reveal error detection rates below 50%. This finding is underscored by
reports from the Public Company Accounting Oversight Board (PCAOB), noting similar
deficiencies in auditors’ performance on these types of procedures.
To gather evidence on this issue, I examined nineteen PCAOB reports for the
period 2004 to 2007. These comprised of all reports, currently available, for five of the
major professional services firms: Deloitte & Touche, Ernst & Young, Grant Thorton,
3 In fact, when pretesting this study's experimental materials, a Big 4 audit manager commented on how an error in compensation would probably go undetected if not uncovered at this stage.

8
KPMG and PricewaterhouseCoopers. Of the nineteen reports reviewed, thirteen (68%)
identified analytical review procedures as a particular concern. The issues identified
included the inappropriate use of analytical review procedures in lieu of substantive tests
of details, failure to set explicit expectations and thresholds, failure to follow-up with
management regarding fluctuations, and failure to conduct subsequent testing when
exceptions were noted. Therefore, analytical review appears to be an area of the audit
that clients may exploit to manage earnings, specifically in those areas that incur little
follow-up detailed testing.
Given that managers may attempt to manage the audit, the question therefore
arises, can managers employ baiting tactics that allow them to effectively manage
earnings? Findings from several areas of research investigating distraction suggest that
audit management tactics may be effective (e.g., Festinger and Maccoby 1964; Petty et
al. 1976; Petty and Cacioppo 1986). On the other hand, audit practice and research
suggests that auditors display professional skepticism and exhibit conservatism (see
Smith and Kida 1991 for a review), which may serve to mitigate clients’ attempts to
manage the audit. That is, because auditors are trained to question evidence and focus on
negative information, they may naturally seek out instances of earnings management.
Distractions
Baiting tactics involve distraction techniques designed to direct an auditor’s
attention away from managed earnings. The diversion they provide attempts to inhibit
the auditor’s ability to uncover earnings management in other areas. As an analogy,
consider the diversions and misdirections that magicians use to distract an audience.
Smoke, noise, and flashes of light that are used to draw an audience’s attention towards
9
the diversion and away from the trick are key components to successful illusions
(Freudenburg and Alario 2007; Kuhn and Tatler 2005; Kuhn et al. 2007). When the
audience’s attention is drawn away from the “tell” of the trick, their ability to uncover the
trick’s secret is inhibited.
Several streams of research suggest that distractions inhibit performance. Studies
on persuasion have found that distractions make individuals more susceptible to agreeing
with the arguments of others, as they detrimentally affect comprehension (Baron et al.
1973; Festinger and Maccoby 1964; Petty et al. 1976; Watts and Holt 1979; Zimbardo et
al. 1970). Similarly, the Elaboration Likelihood Model (for attitude formation) indicates
that distractions make cognitive processing more difficult, resulting in more peripheral
(shallow) information processing (Petty and Cacioppo 1986; Street et al. 2001). Other
cognitive research suggests that distractions consume attention, and since attention is
limited, less is available to process important information (Kahneman 1973; Sagarin et al.
2003). For instance, in a classic study on inattentional blindness, participants viewed a
video of individuals passing around a basketball and were instructed to count the number
of passes (Simons and Chabris 1999). In the video, a person in a gorilla suit walked
through the group of individuals, stopped, beat his chest and exited. Notably, over half of
the participants never saw the gorilla, as they were too distracted by the task at hand.
Human engineering research on diagnostic reasoning, which examines how
operators uncover problems in various systems (e.g., manufacturing systems), has found
results consistent with these distraction effects. For example, in situations with multiple
system faults, research has found that individuals tend to focus on one problem at a time,
attending first to the easy problems. In addition, when more difficult faults are present,
10
they are less likely to be detected than the easier faults (Kerstholt et al. 1996; Moray and
Rotenberg 1989). Subsequent research involving multiple fault scenarios has found that
single faults (easier explanations) are more likely to be detected than multiple faults
(more difficult ones) (Patrick et al. 1999). While these studies do not specifically focus
on distractions, the results suggest that easier explanations may inhibit consideration of
more difficult explanations.
Distractions may also satisfy a need for closure. Kruglanski (1990) describes the
need for closure as “a desire for an answer on any given topic … as compared to
ambiguity.” Those with a higher need for closure often rely on less information when
making judgments and feel more confident with their decisions (Bailey et al. 2006;
Vermier and Van Kenhove 2005). In general, accountants, especially staff and senior
auditors (who are responsible for completing analytical review), have been found to have
a relatively high need for closure (Bailey et al. 2006; Webster and Kruglanski 1994). As
a result, distracting errors may deter auditors from uncovering harder-to-detect earnings
management errors. That is, the sense of closure from addressing the area impacted by
the baiting tactic may cause the auditor to feel that the procedures are complete and stop
their search for additional errors.
Conservatism
While the preceding theories suggest that the baiting tactics used by clients may
distract auditors from uncovering earnings management, evidence from audit research
and practice suggest otherwise. In their review of the heuristics and biases literature,
Smith and Kida (1991) reported that many of the biases found in psychological research
are often mitigated or modified when experienced auditors perform job related tasks. For
11
instance, Joyce and Biddle (1981) found no effect of anchoring and adjustment when
auditors assessed the changing strengths of internal controls. Smith and Kida (1991)
proposed that auditors employ the specialized heuristic of conservatism, which can
override the commonly found heuristics and biases present in psychological research.
This conservatism heuristic leads to an auditor’s tendency to focus on negative
information (especially with respect to the client reporting higher profits).
Professional skepticism contends that auditors should continually question
evidence that is gathered during the audit (Ricchiute 2006). This is especially true when
clients have incentives to manage earnings. Studies have shown that auditors are more
likely to book material audit differences when earnings targets are present (Anderson et
al. 2004; Ng 2007), which suggests that auditors will be more likely to question
management’s explanation when those managers have incentives to manage earnings.
Therefore, the use of baiting tactics to avoid the discovery of managed earnings may
signal a “red flag,” causing auditors to pay closer attention to the entire audit, and thereby
increase their likelihood of detecting more difficult earnings management errors.
Overview of the Study
In this study, auditors completed analytical review procedures on the financial
statements of a hypothetical client in order to determine if any errors were present. In all
conditions, an earnings management error (which reduced compensation expense and
accruals) was embedded into the financial statements and resulted in the client meeting
analysts’ forecasted earnings. In the diversionary statement condition, auditors were
informed of a personnel change in the department responsible for non-current assets.
This statement was designed to elevate the perceived misstatement risk in that area and

12
lure the auditor away from the earnings management error. In the distracting error
condition, two off-setting and easily discovered errors were inserted into non-current
assets. These distracting errors affected depreciation for property, plant and equipment
and goodwill amortization, and off-set so that they had no impact on earnings.
Preview of the Results
The results indicate that when management provided a diversionary statement
that led auditors to an area that was error free, auditors were unlikely to identify the
earnings management error elsewhere in the financial statements. Conversely, auditors
were most accurate in uncovering earnings management when they were directed to
accounts that contained distracting errors. Overall, these results suggest that diversionary
statements can distract auditors from finding earnings management. However, if auditors
are diverted to accounts that contain errors, it appears that the discovery of those errors
raises a red flag that heightens their sensitivity to errors in other areas of the audit.
13
CHAPTER 2
LITERATURE REVIEW
A company’s management has incentives to manage earnings, but financial audits
prevent over aggressive reporting. As such, management may employ strategies to
prevent the auditor from discovering managed earnings. One of these strategies, the use
of baiting tactics, involves distracting or misdirecting the auditor away from instances of
earnings management. There is ample research suggesting that distractions are effective
at inhibiting performance at various tasks (e.g., Freudenburg and Alario 2007; Kruglanski
and Webster 1996). At the same time, auditors practice professional skepticism, thereby
making them conservative in their judgments (Smith and Kida 1991), which suggests that
baiting tactics will not be effective.
In this chapter, I review studies providing evidence that companies manage
earnings to provide a foundation for their use of baiting tactics. I then provide a brief
review of audit management (i.e., a means of employing strategies to prevent the auditor
from discovering earnings management). Since baiting tactics involve distracting
auditors, I then identify several streams of literature suggesting that distractions will be
effective at inhibiting auditor performance. Finally, I provide a review on auditor
conservatism, which suggests that these tactics will not be effective at distracting
auditors.
Earnings Management
Earnings management is a pervasive topic in both accounting research literature
and the popular press. As Thomas McKee broadly states in his book, Earnings
Management: An Executive Perspective, earnings management involves “reasonable and
14
legal decision making and reporting intended to achieve stable and predictable financial
results” (2005, 1). While McKee outlines legal ways to manage earnings, the popular
press has documented many illegal ways managers will also try to smooth earnings. For
instance, in 2007, it was revealed that Dell was using intentional accounting errors and
irregularities to meet financial targets (Collins 2007). As another example, in 2003,
Nortel executives used excessive cookie-jar accounting techniques to show a profit that
resulted in employee bonuses (Kalawksy 2005). While these two examples are
anecdotal, experimental research has found evidence suggesting that managers will
engage in fraudulent activities when auditors are more trusting of their clients (e.g., King
2002).
Pressures
Without incentive, there is little reason to engage in earnings management.
Duncan (2001) describes twenty pressures that managers face which, independently or
collectively, may lead them to manage their earnings. He divides his list into three
categories: external pressures, company culture and personal factors. External factors
included pressures felt by the company from outside the organization generally relating to
the stock market and competitors. Company culture describes the company’s ‘tone at the
top’ and its overall strategic plan. Personal factors include reasons such as bonuses tied
to the company meeting certain performance targets.
These pressures may become so prevalent that the need to manage earnings can
trump the need for long term growth. In a survey of financial executives, Graham et al.
(2005) found that earnings is the most important financial metric to external constituents.
In fact, meeting earnings targets was so important to the executives that 78% of them
15
indicated that they would sacrifice long-term economic profit to meet an earnings
forecast. An experimental study found similar results. Bhojraj and Libby (2005)
conducted a study where individuals chose between two marketing campaigns; one that
resulted in a short-term income, and another that resulted in a long-term profit. They
manipulated stock market pressure and frequency of reporting. Their results suggested
that companies experienced managerial myopia when there was a stock issuance. That is,
companies chose the option of short-term income over a long term profit because there
was an earnings target that was important to meet.
Evidence
While these studies show that managers have incentive to manage earnings, there
is ample research suggesting that earnings are, in fact, managed. The first involves
examining a phenomenon known as the ‘break’ in the earnings distribution. In a fairly
normal distribution of earnings, evidence suggests there is a break just short of zero, and
a spike just after zero. This suggests that in conditions where earnings will fall just shy
of a given target, managers have an incentive to manage earnings upward just crossing
the zero threshold. Three studies, in particular, have attributed this break to managed
earnings. Hayn (1995) compared earnings per share (EPS) for the current year to the
previous year (t to t-1). While her paper focused on the information content of losses, she
found the break in the earnings distribution just before zero, indicating that firms are
hesitant to record negative earnings (compared to their previous year). In another study,
Burgstahler and Dichev (1997) found a similar break in the earnings distribution of
changes in annual net income scaled by market value. In addition, their research
suggested that cash flow from operations and changes in working capital are used to
16
achieve increases in earnings. Finally, Degeorge et al. (1999) found a similar relationship
with analyst forecast errors, suggesting that when companies are going to slightly miss
the forecast, they will manage earnings upwards to meet the target.
Other archival evidence examines specific accounts using various regression
models. For instance, Subramanyam (1996) provided evidence that discretionary
accruals are used to manage earnings (Bernard and Skinner 1996; Kasanen et al. 1996).
In addition, other research has suggested that companies may try reduce their third and
fourth quarter effective tax rates to drive earnings upwards (Dhaliwal et al. 2004).
Furthermore, while firms issuing equity prefer to manage earnings upward by
accelerating revenue recognition, other firms try to avoid reporting a loss by managing
special items (Marquardt and Wiedman 2004).
Although there is ample evidence of earnings management occurring, these
studies do not examine whether these attempts are legal methods or not. That is, research
investigating earnings management generally does not delineate between methods that
operate within or outside the rules of generally accepted accounting principles (GAAP).
While McKee (2005) suggests that earnings management should only involve legal
accounting tactics (e.g., maintaining cookie jar reserves, using derivatives, changing
assumptions), several cases of illegal earnings management practices have been
documented (e.g., Collins 2007; Henry 2004; Hilzenrath 2007; MacDonald 2002; Mavin
2007). For instance, Waste Management was sued for reporting fictitious increases in
income and earnings from continuing operations by hiding the fact that substantial
earnings were due to non-recurring items (Earnings Management 2008). In addition, a
1998 survey conducted at a CFO Magazine sponsored conference indicated that 78% of
17
attending CFOs had faced pressures to manage earnings upwards using GAAP approved
changes, and about half had agreed to do so. What is more striking is that 45% of the
attending CFOs had been asked by senior executives to misrepresent the company’s
financial performance, and 38% complied (Barr 1998; Earnings Management 2008;
McKee 2005; Mills 2003). Overall, these examples provide evidence that earnings are
managed by using illegal methods.
Research investigating fraud firms has found that one measure of discretionary
accruals has predictive power for fraudulent activities (Jones et al. 2008). Still other
research has examined characteristics and measures of fraudulent companies (Beasley et
al. 1999), and how corporate governance stems from fraud detection (Farber 2005).
What is interesting about these studies is that all of them included actual fraud firms as
part of their sample (ranging from 87 cases to 200), providing evidence that managers do,
in fact, engage in illegal reporting practices. It therefore appears that managers may use
aggressive, perhaps even illegal, measures to meet an earnings target.
Finally, research has investigated the ways in which auditors are able to detect
earnings management. Nelson, Elliot and Tarpley (2002) surveyed several audit partners
in a field based study, counting the attempts of managers to manage earnings and the
subsequent discovery by auditors. Overall, the most common occurrence of earnings
management was through expenses (and other losses) and revenues (and other gains). In
general, their results suggest that managers are more likely to manage earnings upwards
than downwards and indicates that managers may use many different accounts to manage
earnings. It should be noted that their study only reported those instances of earnings
18
management that had been discovered by auditors, and obviously omits all of the possible
cases where auditors failed to uncover the managed earnings.
Summary
Overall, earnings management is a heavily researched area in the accounting
literature. Research has documented the significant pressures faced by CFOs to manage
earnings, provided evidence that earnings management occurs and offered insight into the
types of accounts used to record improper entries. Furthermore, documented cases of
illegal earnings management suggest that earnings management may be a common tactic
employed by companies.
Audit Management
I define audit management as a client’s strategic use of techniques to prevent
auditors from identifying or recognizing managed earnings during the audit. To date,
this is a relatively unexplored area of research. While my study focuses on the effect of
baiting tactics, there have been a limited number of studies that have manipulated
management information, which could be viewed as another means to manage the audit.
These studies involved providing incomplete information and framing evidence.
For instance, in an analytical review task, Bedard and Biggs (1991a) manipulated
the representations provided by management as either complete, incomplete or no
representation. Auditors who received an incomplete representation had less than half
the audit quality than those receiving the complete representation (32% compared to
73%). Specifically, this suggests that if managers do not provide complete information,
auditor performance will suffer, providing opportunities to manage the audit.
19
In another study, Johnson et al. (1991) examined how auditors are affected by
evidence framing. In a verbal protocol field study, they provided six audit partners (three
novice partners and three experienced audit partners) with two cases of companies with
errors in their financial statements. In the first case, involving a company with a
fraudulent overstatement of income, the company was framed as a high-growth company,
which would explain the increase in income. The other case involved errors to
receivables without framing the information. The researchers found that two of the six
auditors, who had auditing experience in the same industry as the framed company, were
able to identify the correct representations to realize that the company was not a growth
company and that income was overstated. In the other case (with no framing), only the
more experienced partners were able to identify the error.
While studies on managing the audit are limited, a recent study suggests that it
can be effective. Caramanis and Lennox (2008) regressed accruals by audit hours on
firms in Greece. They found that when audit hours are lower, abnormal accruals are
often positive and larger. This provides evidence that companies are likely to manage
earnings upwards to meet or beat a zero earnings benchmark. In addition, the study
concluded that company size and tenure with the auditor also has an impact
management’s tendency to manage earnings. Overall, these three variables may provide
management with the opportunity to engage in audit management practices. That is, if
management can bait auditors to different areas of the audit, more audit hours would be
spent in those areas, and consequently, less would be spent in others areas where
management has managed earnings. As a result, audit management is a fruitful area for
future exploration.
20
Distractions
Baiting tactics involve the use of distractions. Distractions have been studied in
several streams of literature, including both psychology and sociology. A central finding
of the research across many areas exploring various theories is that distractions often
inhibit task performance. For instance, if an individual is talking on a cell phone while
driving, he/she is more likely to get into an accident than if all concentration was
dedicated towards driving. At the same time, an audience is more likely to learn the tell
of a magician’s trick if the magician does not distract them. In both cases, distractions
reduce individual performance. The following review describes various theories
involving distractions. First, I introduce how distraction affects legitimation. I then
describe how distractions affect performance in other areas of research, including
attention, need for closure, persuasion and human engineering.
Legitimation
In their sociological thesis, Freudenburg and Alario (2007) reviewed several
streams of literature examining legitimation (i.e., the process of concluding that
something is valid). They argue that preventing evidence from being questioned is a
means of achieving legitimation (i.e., it creates something that is only valid in
appearance). Specifically, they review how magicians effectively divert attention to
“make things disappear.” Their commentary does not stop at magicians, as it extends to
other contexts, such as politics.
Freudenberg and Alario (2007) further argue that this “dark” legitimation can
work in two ways. First, it can be effective by making problem evidence disappear from
view. So a magician’s trick will work (or appear real) if the tell is not visible. They do
21
this by using misdirection, or leading the audiences eyes away with gestures, rending the
tell of the trick invisible. Similarly, a debater will win an argument if the evidence that
refutes his/her position is not known.
However, a more efficient approach, they argue, is to get the audience to focus on
something else. That is, by enticing the audience to put their attention elsewhere,
questionable evidence is likely to be ignored. As part of their argument, Freudenberg and
Alario (2007) examine this phenomenon in the context of the mass media. They suggest
that the media is relatively ineffective at shaping public opinion; instead, its power and
influence stems from setting the agenda or determining what people think about (e.g.,
Iyengar and Kinder 1987). As such, changing the focus to a completely new topic (as the
media have the power to do) is an effective way for distractions to work. For instance,
when investigating a risky technology, experts may emphasize the risks of the
technology, prompting public fear (Mazur 1981). If other experts try to reframe the story
focusing on the safety features of the technology, their attempts to refute the argument
may be ineffective because the focus is still on risk. A better approach, the authors argue,
is to focus attention on another issue, such as the legitimacy of the refuting experts, or
distract the public with other information in a separate area (Freudenberg and Alario,
2007).
Overall, research and commentary on legitimacy provide examples of techniques
which make distractions effective. A distraction will be effective when the topic is
legitimized, either through making the dissenting evidence invisible or diverting attention
to other issues. In either case, the audience validates (or does not invalidate) the trick, the
argument or the story, as the distraction prevents them from accomplishing that.
22
Attention
Distractions are effective because they occupy attention, making it more difficult
to attend to other activities. Kahneman (1973) describes attention as mental effort needed
to process information. Cognitively, the amount of mental effort individuals have is
finite. Simply put, this capacity refers to a maximum level of mental effort that an
individual can devote at any particular time (Friedenberg and Silverman 2006; Reed
1996). Generally, individuals can divide their mental effort on various activities at will,
but they must work within their given capacity.4 This cognitive division can be thought
of as the amount of attention that each activity is receiving. Each task competes for the
finite amount of mental capacity that the individual possesses. Tasks that are more
demanding require more effort, or a larger slice of the attention available.
Decisions can fail when activities exceed mental capacity (Kahneman 1973).
This will occur if there are too many concurrent activities, or if any particular activity is
too difficult and requires too much of the available mental activity. In either case, the
sum of the activities exceeds the amount of available mental capacity, resulting in some
activities being ignored. As an example, Reed (1996) describes an air traffic controller
who is attending to seven planes. One of the planes is flying 200 feet below the top of a
major skyscraper. An alarm sounds and the air traffic controller quickly tells the pilot to
ascend. The reason the controller did not notice the plane’s altitude is because he/she
was attending to seven planes. As such, these activities exceeded his/her mental capacity,
and there was not enough available cognition to attend to all of the necessary cues (Reed
4 Attention is lowered when multiple tasks rely on the same processes. In general, two tasks that rely on different processes (e.g., a visual and a verbal task) can be performed at the same time (e.g., Reed, 1996).
23
1996). This example is consistent with other research suggesting that divided attention
slows reaction time and causes mistakes when competing tasks are present (Ninio and
Kahneman 1974).
Distractions essentially consume cognitive resources. That is, they use up the
amount of available processing, leaving less for other activities. This is evidenced by
classic studies on inattentional blindness. In one study, Neisser (1979) had participants
watch a video of students passing a basketball. One group was asked to simply watch the
tape, while others were asked to count the passes. During the video a woman with an
umbrella entered the picture. While all individuals who were simply instructed to watch
the video saw the woman, only 21% of those instructed to count the passes saw the
woman. Simons and Chabris (1999) replicated this study, changing the woman with the
umbrella to an individual wearing a gorilla suit. During the video, that person in the
gorilla suit walked through the group of individuals, beat his chest and exited.
Interestingly, over half of the participants never saw the gorilla.
Both of these studies demonstrate how distractions can affect our attention.
Given our finite amount of attention, the more focus we dedicate to a specific task, the
less we have available to devote to another task, making us essentially blind to them. Just
as in the previous studies (involving the person in the gorilla suit and the woman with the
umbrella), the individuals became so focused on the task of counting the basketball
passes that they were unaware that a strangely out of place gorilla was walking across the
scene. What makes this more striking is that in the video, the person in the gorilla suit
even gets in the way of the passes (i.e., the basketball disappears behind the person in the
24
gorilla suit) but most participants still failed to see him. As such, the distraction of the
task effectively prevented the participants from noticing something clearly obvious.
Need for Closure
Distractions can also satisfy a need for closure. Kruglanski (1990) describes the
need for closure as “a desire for an answer on any given topic … as compared to
ambiguity.” The researchers further argue that any answer (even a wrong one) will
suffice when closure is sought, because those with a higher need for closure often rely on
less information when making judgments and feel more confident in their decisions
(Bailey et al. 2006; Vermier and Van Kenhove 2005).
Distractions and other situational pressures induce a need for closure. For
instance, Kruglanski et al. (1993) examined how noise activated a need for closure. In
their study, students took part in a mock trial. The researchers manipulated whether or
not students were exposed to a noisy environment. They found evidence suggesting that
noisy environments activate a need for closure, as those in a noisy environment had more
need to come to an agreement with the task confederate. Other research has also found
that time pressure and other situational variables can induce a need for closure (e.g.,
Kruglanski and Webster 1991). Theses studies suggest that this is due to the strain these
external forces exert on cognitive capacity (Kruglanski and Webster 1996; Roets et al.
2008). That is, when less cognitive capacity is available, consistent with how distractions
use capacity, there is a greater need for cognitive closure.
While the need for closure may be activated by situational variables, individuals
may be naturally predisposed to this phenomenon. Such individuals prefer to feel a sense
of closure with given tasks. While assuming variability among the population, Webster
25
and Kruglanski (1994) examined individual differences and found that desire for
completion may be measured along five different dimensions: preference for order,
preference for predictability, decisiveness, discomfort with ambiguity and closed-
mindedness. For instance, those who do not like to enter into situations without knowing
what to expect (preference for predictability), and who believe they can arrive at the one
best solution to a problem very quickly (decisiveness), would be said to have higher need
for closure.
In general, accountants have been found to have a relatively high need for closure
(Bailey et al. 2006; Webster and Kruglanski 1994). This is especially true for staff and
senior accountants who are generally responsible for completing field work. Research
indicates that those with higher need for closure might be more attracted to majors that
appear more predictable (i.e., accounting). However, more experienced auditors (i.e.,
managers and partners) generally have a lower need for closure, because those with
higher need for closure realized that auditing is not as predictable as they may have liked
and left the industry (Bailey et al. 2006).
Overall, distractions can impair judgments by activating one’s need for closure.
Given that distractions use up cognitive capacity, one may seek to come to a faster
solution in the presence of them. Furthermore, research suggests that auditors
responsible for field-work (i.e., staff and seniors), on average, already possess a higher
need for closure, possibly making them even more susceptible to desiring completion of a
task in the presence of distractions (Bailey et al. 2006).
26
Attitudes and Persuasion
Research on distractions also exists in the literature on persuasion and attitude
formation. Specifically, distractions make individuals more susceptible to arguments. In
a classic study on persuasion, Festinger and Maccoby (1964) performed a series of three
studies on persuasion. All three experiments had subjects listen to an argument against
the existence of college fraternities, and manipulated whether or not a distraction was
present. The distraction involved subjects viewing a silent movie as they listened to the
argument. In their first study, there was no distraction effect found, possibly because the
university where the study was conducted had a weak fraternity system. Festinger and
Maccoby then replicated the study with fraternity students at a different university and
found that those receiving the distraction were more persuaded by the argument and less
likely to reject the speaker’s views. Finally, the researchers ran the study again at a third
university using both fraternity and non-fraternity students. They found that distractions
made the fraternity students more accepting of the speaker’s arguments rejecting
fraternities.
Subsequent research has further explored distractions and provided insights into
its effect on persuasion. A review by Baron et al.(1973) describes several studies that
explore the effects of distractions on persuasion. Overall, they conclude that distractions
clearly enhance the persuasive impact of arguments. As one example, Zimbardo et al.
(1970) examined the effect of distractions and found that they have an effect on
persuasion when the individual is trying to focus on the message (and not on the
distraction). That is, distractions make individuals more susceptible to persuasive

27
arguments. However, if individuals are focusing on the distraction, then an argument is
not as persuasive, because they do not hear the argument in the first place.
Expanding on this research, Petty and Cacioppo (1986) created the Elaboration
Likelihood Model for attitude formation. The model stipulates that attitudes can be
formed by way of two separate processes, or ‘routes:’ the central route or the peripheral
route. The central route involves careful thinking about and scrutinizing all details of the
message being processed. The peripheral route involves shallow processing and relies
more on environmental characteristics of the message. For instance, one may naturally
agree with the message because the source is reliable (regardless of what the message
says). The route used by the individual is determined by the motivation of the individual
and the cognitive ability he/she has available. Distractions foster peripheral route
processing, meaning that the message processing will be shallower in the presence of
distractions, making individuals more susceptible to being persuaded.
As evidenced by the studies previously described, distractions seem to inhibit
performance. They make individuals more susceptible to arguments of others, meaning
that individuals are less able to form their own opinion in the presence of distractions.
This appears to be due to the peripheral route of processing chosen when distractions are
present.
Human Engineering
A stream of research in human engineering involves diagnostic reasoning of how
operators uncover faults (i.e., problems) in various systems. This type of research often
involves human performance related to monitoring tasks (e.g., monitoring the reactor of a
nuclear power plant). These monitoring systems provide information for individuals to
28
determine whether the environment is running properly or not. While research in this area
has not specifically explored distractions, they have found effects that are consistent with
distractions.
For example, one study recorded eye movements of subjects attending to either
single or multiple faults (i.e., problems) while monitoring a thermal hydraulic system
(Moray and Rotenberg 1989). The results provide evidence of ‘cognitive lockup,’ as
individuals were only able to focus on one fault at a time, and too many faults exceeded
their available capacity.
Kerstholt et al. (1996) followed up on this study and manipulated the complexity
of problems in a ship control task. They also found evidence of cognitive lockup.
However, their results also suggested that individuals took longer to react to disturbances
when several were happening at once. Furthermore, disturbances detected later had a
higher probability of being ignored.
In another experiment, Patrick et al. (1999) conducted a field study examining the
effects of single and multiple faults in a manufacturing plant. They discovered that
multiple faults are more difficult to detect, because multiple events occurring
concurrently cause various symptoms. As a result, the multiple faults were determined to
be more difficult. The researchers discovered that individuals could not develop multiple
fault hypotheses to explain the symptoms.
Each of the preceding studies has found results consistent with distractions.
When multiple problems are present, each can be thought of as a distraction to the other.
That is, individuals have difficulty attending to all faults in a system, causing greater
likelihood that faults will go undetected. Furthermore, the easiest faults (i.e., most salient
29
problems) are detected first, suggesting that they effectively distract operators from the
more difficult ones. Finally, the effect of cognitive lockup appears to be similar with
how distractions affect performance. When distractions are present, individuals’
performance suffer because the processes exceed their cognitive capacity.
Summary
Overall, distractions affect one’s ability to perform at a given task. Magicians
take advantage of these to legitimize their tricks. Politicians also effectively use
distractions to steer arguments in an intended direction. Distractions appear to use up
existing capacity in the brain, leaving less cognition available for other activities. Not
only do distractions use up available attention, but they also perpetuate the need for
closure; they make individuals more likely to be persuaded by arguments of others,
thereby allowing their attitudes to be shaped, and they inhibit individuals from finding
problems with systems.
As a result, distractions may be an effective tool for management to use during an
audit. Hence, if managers can distract auditors, they may be able to effectively prevent
managed earnings from being detected.
Conservatism
In their review of the auditing literature, Smith and Kida (1991) discovered that
many of the heuristics and biases found in psychology are often modified or mitigated
when professional auditors complete audit tasks. The authors found an overall tendency,
across many audit tasks, for auditors to focus on negative information. As such, Smith
and Kida (1991) proposed that auditors employ the specialized heuristic of conservatism,
which can override the commonly found heuristics and biases present in psychological
30
research. This conservatism heuristic leads to an auditor’s tendency to focus on negative
information (especially with respect to the client reporting higher profits).
For instance, in one study, Joyce and Biddle (1981) found an effect of anchoring
and adjusting when auditors made fraud assessments. However, they found no effect of
this bias when experienced auditors assessed the changing strengths of internal controls.
While auditors do not often make fraud assessments in the manner that Joyce and Biddle
tested, they do often rate the strength of internal controls. As a result, auditors were
familiar with this task, and given that the controls weakened, auditors appropriately
increased the scope of testing instead of anchoring on the original control rating.
In another study, Kida (1984) assessed auditors’ likelihood to use confirmatory or
disconfirmatory decision strategies. In his experiment, auditors assessed whether a firm
would go bankrupt or remain viable (i.e., they were given one of the two options). In
order to make this assessment, he provided the auditors with twenty pieces of information
about the firm (ten positive and ten negative items), and had the auditors list the evidence
they used in their assessment. While there was not strong support for a confirmatory
strategy, in both cases there was a heavy bias towards the failure items.
The above studies highlight the effects of conservatism on auditor judgment.
That is, for professional auditors, the focus on negative information modifies the effects
of other heuristics and biases found in psychology. This overriding heuristic is still a
common focus in current literature. For instance, subsequent research has found that
accountability pressure heightens the effects of conservatism (i.e., makes auditors more
conservative) (DeZoort et al. 2006). Still other research has found differences in auditor
conservatism for small and large firms (Kim et al. 2003), and that auditor conservatism
31
impacts materiality levels (Patterson and Smith 2003). Overall though, auditor
conservatism should make an auditor more focused on negative information.
Auditor conservatism is likely supported by auditors’ tendency to adopt a mindset
of professional skepticism. Auditors receive training on professional skepticism, which
teaches them to continually question evidence that is gathered during the audit (Ricchiute
2006). This is especially true when clients have incentives to manage earnings. Studies
have shown that auditors are more likely to book material audit differences when
earnings targets are present (e.g., Anderson et al. 2004).
An experiment by Anderson et al. (2004) pointed auditors to a fluctuation in
revenues and gross margin and provided them with management’s explanation of the
fluctuation. Auditors were then asked to assess the likelihood that the financial
statements were misstated and how likely they would rely on the statements of the
controller. They manipulated both management’s explanation as quantified or non-
quantified, and management’s earnings management incentive as either high or low.
They found an effect of earnings management; when management had a high incentive to
manage earnings, auditors were less likely to believe the clients explanation and thought
the statements were in error.
In another study, Ng (2007) examined an auditor’s likelihood to book or waive an
audit decision given three materiality thresholds: positive earnings, beating prior year
earnings or beating analysts’ forecasts. In his first of two experiments, he used an
immaterial audit difference. While auditors were most likely to book a positive earnings
threshold, overall they were not very likely to book any audit difference. As such, he ran
a second experiment; however, this time he used a material audit difference. Again, he
32
found that auditors were most likely the book a positive earnings threshold. More
importantly, when the audit difference was material, auditors were always likely to book
the adjusting entry.
Overall, conservatism appears to cause auditors to focus on more negative (and
generally income decreasing) information. As a result, several biases found in
psychology are often modified in auditor judgments. When conducting audits,
conservatism should make auditors more skeptical of management, making them more
likely to question evidence and devote more attention to the underlying data. This, in a
sense, should make auditors more likely to identify managed earnings.
Summary
Overall, earnings management is a pervasive phenomenon that has been discussed
at length in the academic literature. Not only does archival research provide evidence
that it occurs (e.g., Burgstahler and Dichev 1997), but there is even survey research with
managers admitting that they practice it (Graham et al. 2005). Given that earnings
management should be detected (and possibly corrected) during the audit, the existence
of audit failures suggest that clients must be taking some strategic approach to prevent
auditors from discovering managed earnings (e.g., Bedard and Biggs 1991a).
Baiting tactics may be one approach that clients use to effectively “manage the
audit.” Baiting tactics involve distractions, and there is ample research suggesting that
distractions inhibit performance (e.g., Freudenburg and Alario 2007; Kruglanski and
Webster 1996). However, auditors are trained to practice professional skepticism, which
suggests that baiting tactics would be ineffective (Smith and Kida 1991).

33
CHAPTER 3
METHODOLOGY
The primary purpose of this study is to examine the impact of baiting tactics on an
auditor’s ability to discover an earnings management error (i.e., an error that the client
intentionally records in the financial statements to meet an earnings target). The
experiment concerned analytical review procedures, and had auditors navigate through
financial information to look for material fluctuations that might be the result of an error.
In all conditions, an earnings management error was seeded into the statements
that allowed the client to meet an earnings target. I manipulated the presence of two
baiting tactics. One tactic involved management alerting auditors to risk in a different
area of the financial statements (i.e., employed a diversionary statement). The other
baiting tactic involved the insertion of easy-to-detect, distracting errors in those other
areas of the financial statements.
Research Question
Both academic research and the popular press report that companies manage
earnings (e.g., Burgstahler and Dichev 1997; Cabrera 2007; Graham et al. 2005). It is the
responsibility of auditors to prevent management from using inappropriate or illegal
reporting practices. Despite the fact that auditors know that managers try to manage
earnings, there are still several documented occurrences (e.g., Collins 2007; Earnings
Management 2008; U.S. Securities and Exchange Commission 2007). One explanation
for why auditors sometimes fail to detect earnings management may be management’s
ability to “manage the audit,” or strategically attempt to prevent auditors from detecting
manipulated performance (e.g., Caramanis and Lennox 2008). Baiting tactics involve
34
distractions, and may be one way managers succeed in preventing auditors from
discovering earnings management. Competing theories and research raise questions
regarding how baiting tactics will affect an auditor’s ability to identify earnings
management practices. Psychological, sociological and human engineering research
indicate that distraction affects performance (e.g., Freudenburg and Alario 2007;
Kahneman 1973; Simons and Chabris 1999), which suggests that the inclusion of
diversionary statements and/or easy-to-detect, distracting errors will reduce the likelihood
of auditors uncovering a harder-to-detect earnings management error. Conversely, audit
research indicates that auditors exhibit a measure of conservatism and professional
skepticism, which reduces, and sometimes eliminates, several biases present in the
psychology literature (see Smith and Kida 1991 for a review). Therefore, exposure to a
baiting tactic could alarm auditors, which may heighten their awareness and cause them
to increase their level of scrutiny towards the data. Given these possible outcomes, I
present the following research question:
RQ1: Will diversionary statements and/or distracting
errors affect an auditor’s ability to uncover an earnings
management error?
Method
Participants
Seventy-six auditors took part in the experiment (64.5% of which were male and
35.5% were female). On average, participants were 28 years old and had four years of
audit experience.5 Approximately two-thirds (66%) of the participants were employed by
5 The original participant pool contained 77 auditors; however, one was removed due to software error.
35
Big 4 accounting firms, while 28% were employed by regional sized firms. Participants
held the following job titles: 61% percent were audit seniors, 22% were associates,6 10%
were managers or partners, and 7% were classified as other.7 The experience level of our
sample provides reasonable assurance that the individuals were both familiar with the
task at hand and possessed the requisite knowledge to effectively complete it.8
Overview of the Study
The experiment required that auditors complete analytical review procedures on
the financials statements of a hypothetical client. An error was embedded into the
statements which understated compensation expense and accruals by approximately
$450,000. Detection of this error was part of the main dependent variable. The
compensation expense error was divided evenly into administrative compensation
expense and sales compensation expense, understating both by approximately $225,000.
The accrual entry was divided evenly between current and non-current accrued
compensation.9 Background data, provided prior to beginning the analytical review,
revealed that the company beat analysts’ forecasted EPS by approximately $0.025 / share
(net income was about $8.45 million). If the compensation error was discovered, the
company would miss its earnings target.
6 An interview with five individuals with audit experience revealed that all had conducted analytical procedures when they were associates (four had done so in their first year, while one did during his second year). 7 The other participants had an average of 3.67 and a minimum of 1.33 years of audit experience. 8 Audit effectiveness (our main dependent variable which is further described in Chapter 4) did not significantly differ between audit levels (F=0.64, p=0.64). 9 The error was divided into different accounts so that it was more difficult to uncover. While compensation is often a current accrued liability, non-current accrued compensation can relate to post-retirement benefits, deferred incentive compensation, pension benefits, non-expiring vacation/sick time, etc.

36
The study employed a 2 x 2 experimental design (see Figure 3.1). The first
independent variable manipulated whether management provided a diversionary
statement. The diversionary statement involved management explicitly identifying risk
elsewhere in the financial statements in an attempt to lure the auditor away from managed
earnings. The accounts identified with risk were non-current assets. To effectively
manipulate an elevated misstatement risk, the client’s background information indicated
that the individual responsible for maintaining non-current assets (i.e., property, plant &
equipment, intangibles and other non-current assets) left the company about six months
ago. It also stated that her replacement transferred in from the manufacturing floor and
had very little accounting experience. Aside from that change, the auditors were told that
there was no other turnover with any of the accounting personnel responsible for
financial reporting. In the other conditions, no specific area of risk was identified.
The second independent variable was manipulated by seeding two off-setting,
easy-to-discover, distracting errors. These errors were strategically inserted into non-
current assets, the same area towards which the diversionary statement pointed.10 One
error concerned the company failing to record a portion of depreciation expense for
furniture and fixtures, resulting in an understatement of depreciation expense and
accumulated depreciation by approximately $450,000. The other error overstated
amortization expense, and hence understated the net value of goodwill by approximately
10 As previously noted (in Chapter 1), management may want to embed distracting errors into diversionary areas to reduce the amount of time the auditor spends on error investigation in other areas of the audit, or to increase the trust that the auditor has in the client. On the other hand, management may want to divert auditors to error-free accounts, on the thought that if the client's records are accurate in higher risk areas, they'll likely be accurate elsewhere.

37
Figure 3.1 Experimental Design
Diversionary Statement No Yes
Dis
trac
ting E
rrors
No
No
Audit Management
Diverted to Clean Area
Yes Distracting
Errors
Diverted to Distracting
Errors
_______________________
This Figure represents the 2x2 experimental design. All conditions contained an error to compensation that was used to meet analysts’ forecasts (earnings management error).
• In the “No Audit Management” cell, auditors conducted analytical review procedures without any baiting tactics present.
• In the “Distracting Errors” cell, auditors conducted analytical review procedures on financial statements that contained two, off-setting easy-to-detect errors in non-current assets.
• In the “Diverted to Clean Area” cell, management alerted auditors to risk in non-current assets, but these accounts did not contain any errors.
• In the “Diverted to Distracting Errors” cell, management alerted auditors to risk in non-current assets, which contained two, off-setting easy-to-detect errors.
$450,000. Since the two errors off-set, taken together, they had no effect on net income.
Absent the seeded errors, none of the accounts related to depreciation and amortization
reflected any material fluctuations from previous years.
These manipulations resulted in four conditions. In one condition, the auditors
completed the analytical review without the client trying to manage the audit (i.e., no
baiting tactics). Two other conditions each involved the use of one baiting tactic. In one
condition, auditors conducted an analytical review on financial statements that contained
distracting errors. In the other, auditors were alerted to risk in accounts that did not
actually contain any errors (i.e., they were led to a clean area). Finally, the last condition
38
manipulated both baiting tactics, so the auditors were alerted to risk in accounts that
contained distracting errors.
Development of the Instrument
The analytical review case included background information on the client and the
financial information necessary to complete the review procedures. In developing that
instrument, I sought to achieve a case that met the following goals:
• Consisted of a stable set of financial statements.
• Portrayed the client’s desire to meet an earnings target.
• Contained a difficult, but detectable error that assisted the client in
meeting an earnings target.
• Contained easier, off-setting errors as part of the distracting error
manipulation.
• Employed errors that did not require any specific industry expertise.
• Effectively elevated misstatement risk in another area of the financial
statements as part of the diversionary statement manipulation.
The background information provided information about the client, the industry,
the market and the audit (see Table 3.1). Participants learned that they would be
conducting an analytical review on Flexpack, a mid-sized manufacturing company that
produced cardboard boxes and container products. Client and industry data were derived
from Bhattacharjee et al. (1999) and IBISWorld (2008). The background information
also identified the analysts’ forecasted earnings and specifically indicated that Flexpack
had consistently met its forecasts and was very committed to continuing to meet this
benchmark. Additional information presented in the background materials revealed that
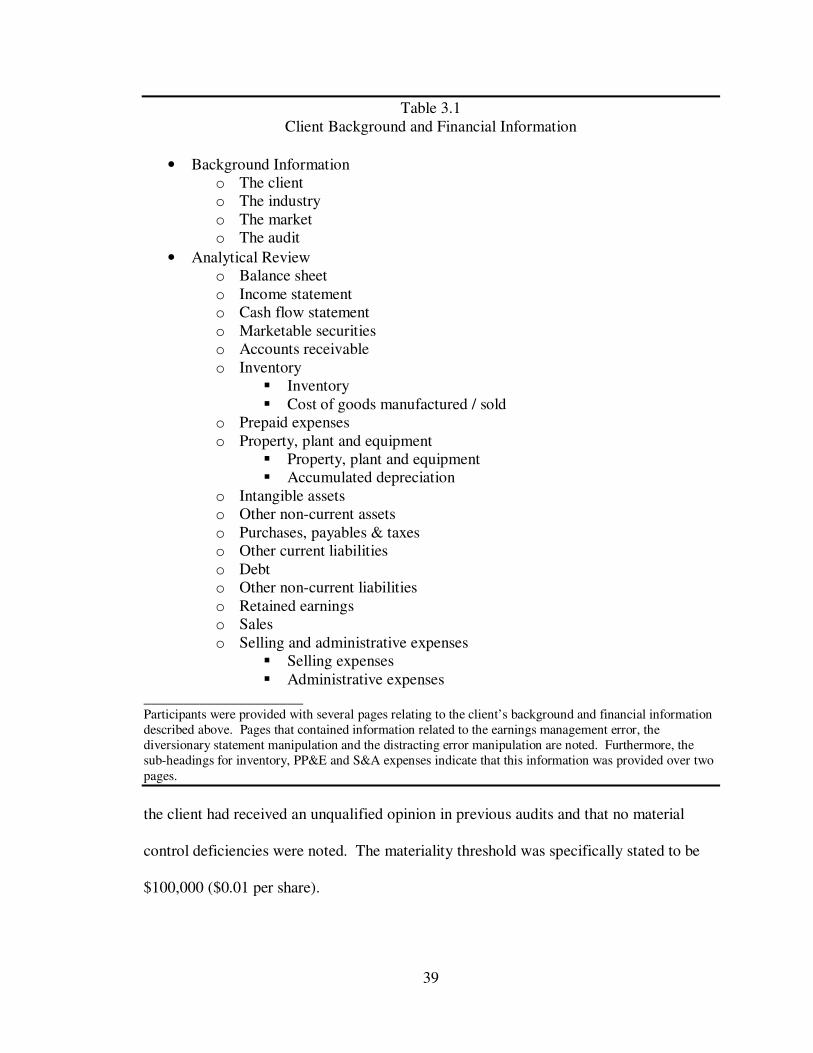
39
Table 3.1 Client Background and Financial Information
• Background Information o The client o The industry o The market o The audit
• Analytical Review o Balance sheet o Income statement o Cash flow statement o Marketable securities o Accounts receivable o Inventory
� Inventory � Cost of goods manufactured / sold
o Prepaid expenses o Property, plant and equipment
� Property, plant and equipment � Accumulated depreciation
o Intangible assets o Other non-current assets o Purchases, payables & taxes o Other current liabilities o Debt o Other non-current liabilities o Retained earnings o Sales o Selling and administrative expenses
� Selling expenses � Administrative expenses
____________________ Participants were provided with several pages relating to the client’s background and financial information described above. Pages that contained information related to the earnings management error, the diversionary statement manipulation and the distracting error manipulation are noted. Furthermore, the sub-headings for inventory, PP&E and S&A expenses indicate that this information was provided over two pages.
the client had received an unqualified opinion in previous audits and that no material
control deficiencies were noted. The materiality threshold was specifically stated to be
$100,000 ($0.01 per share).

40
The financial statements were created from several other accounting studies using
similar analytical review procedures, including Bhattacharjee et al. (1999), Cohen (1994),
Cohen and Kida (1989), Luippold and Kida (2008), and Moreno et al. (2007). The
statements were edited so that no single account differed significantly from the prior year
balance in order to present stable financial statements (i.e., no fluctuations were greater
than $100,000). In addition, the sales were reduced in the current year, so that the
forecasted earnings were missed (by approximately $0.025 per share).
An error to compensation was seeded into the financial statements amounting to
approximately $450,000. This error was evenly divided between sales compensation and
administrative compensation and off-set in current accrued compensation and non-current
accrued compensation (understating each account by approximately $225,000). This
error was chosen because compensation expense is common across all industries, and is
generally audited through analytical procedures, as detailed testing can be very taxing on
an audit budget. Furthermore, the error was divided into multiple accounts to make it
more difficult to detect (i.e., less salient), although still material in each individual
account.
The diversionary statement manipulation was embedded into the background
information. When the diversionary statement was present, the background information
included language stating that management had indicated that the person responsible for
maintaining non-current assets (i.e., property, plant & equipment, intangibles and other
non-current assets) left the company and the replacement had little accounting
experience. This statement was designed to elevate the risk of misstatement in those
areas of the financial statements.
41
Finally, the distracting errors were manipulated by seeding two easier-to-detect
errors into the financial statements. One involved the understatement of depreciation for
furniture and fixtures by approximately $450,000, thereby reducing administrative
depreciation expense and accumulated depreciation. The other involved inappropriately
amortizing goodwill by, again, approximately $450,000, which overstated administrative
amortization expense and understated the net value of goodwill. These errors offset so
they would have no impact on net income. For each error, the misstatement was always
in a single account (plus an off-setting entry) to make it appear more salient (i.e., easier to
detect). These accounts were chosen for two reasons. First, depreciation and
amortization are not industry specific, so no industry expertise is required. In fact, both
of these concepts are taught in introductory accounting classes, suggesting that
professional auditors should be able to easily interpret these accounts and identify the
errors. Second, they both fall within the same general area of the financial statements
(i.e., non-current assets), allowing the diversionary statement to appropriately interact.
After receiving the background information, auditors were exposed to a financial
information set for Flexpack that included the following information (refer to Table 3.1
for details outlining the background and financial information presented and to the
Appendix for the actual instrument):
1. Current year’s unaudited and two prior years’ audited balance sheet. The
statements were presented in both account balance and common-sized (i.e.,
percentages of total assets) formats. Compared to prior year, there were no
unexpected, material fluctuations. For all conditions, in the current year, both
other current liabilities and other non-current liabilities each dropped by 0.2%
42
total assets (from 9.0% to 8.8% and 4.8% to 4.6% respectively) or each by
approximately $225,000 from the inclusion of the earnings management error.
When the distracting errors were present, there was a significant fluctuation in
accumulated depreciation causing net Property, Plant and Equipment to increase
by 0.3% of total assets (from 29.0% to 29.3%) from previous years. In addition,
net-intangible assets decreased significantly more than what would have been
expected due to amortization (1.9% to 1.3%).
2. Current year’s unaudited and two prior years’ audited income statements. Similar
to the balance sheet, the statement was presented in both account balance and
common-sized (i.e., percentage of net sales) formats. Aside from the decrease in
sales for the current year (to reflect an incentive to manage earnings), the only
fluctuations from previous years were the decreases in selling and administrative
expenses which dropped 0.3% of net sales (or approximately $450,000) compared
to the previous year (20.5% compared to 20.8%). This resulted in net income
increasing by 0.1% of net sales.
3. Indirect cash flow statement. The statements detail changes in operating
activities, investing activities and financing activities in absolute deviations for
the current year unaudited to previous two years audited. There were significant
deviations in net income, “changes in payables/taxes and other current liabilities”
and “changes in other non-current liabilities” (approximately $200,000, $150,000
and $200,000 respectively). Furthermore, when the distracting errors were
present, the adjustment for depreciation was approximately $400,000 less than the
43
previous year and the “changes in intangible assets/other non-current assets” was
approximately $550,000.
4. Relevant analytical procedures for marketable securities. The information
consisted of marketable securities as an absolute balance, as a percentage of total
assets and as a percentage of current assets. In addition, details were provided
related to the breakdown of the specific marketable securities owned, reported in
both the cost bases and market value formats. There were no material fluctuations
in this data.
5. Relevant analytical procedures for marketable securities. This information
included the accounts receivable turnover and days net receivable outstanding
ratios. The allowance for doubtful accounts and bad debt expense were both
reported in absolute terms, as a percentage of net sales and as a percentage of net
receivables. Finally, an accounts receivable aging analysis was presented. There
were no material fluctuations in these data.
6. Relevant analytical procedures for inventory. The information was composed of
the working capital balance, the current ratio, the quick ratio, inventory turnover,
days inventory ratio, profit margin on sales, percent profit before taxes to total
assets, working capital to total assets, net sales to total assets, net sales to working
capital and net sales to selling and administrative expenses. In addition, there was
a breakdown of inventory by category, a schedule of cost of goods manufactured
and a schedule of cost of goods sold. Again, there were no material fluctuations
in these data.
44
7. Relevant analytical procedures for prepaid expenses. The information contained
the prepaid expenses as a raw balance, as a percentage of current assets and as a
percentage of total assets. In addition, there was a breakdown of the prepaid
expenses. There were no material fluctuations in these accounts.
8. Relevant analytical procedures for property, plant and equipment and
accumulated depreciation. The information included breakdowns of PP&E by
class, additions, disposals, accumulated depreciation and current period
depreciation. When the distracting errors were present, there was a significant
decrease in depreciation for furniture and fixtures (understated by approximately
$450,000).
9. Relevant analytical procedures for intangible assets. The information reported the
intangible assets raw balance and as a percentage of total assets. In addition, the
detailed schedule of intangibles assets, acquisitions, disposals and impairments
and the amortizations was provided. When the distracting errors were present,
goodwill was inappropriately amortized which overstated the amortization by
approximately $450,000.
10. Relevant analytical procedures for other non-current assets. The information
presented other non-current assets as a raw balance and as a percentage of total
assets. In addition, there was a breakdown of the other non-current assets. These
data did not contain any material fluctuations.
11. Relevant analytical procedures for purchases, payables and taxes. The
information consisted of the purchases of goods balances for the year as well as
for the months prior and subsequent to year-end. In addition, the purchases
45
returns and allowances were reported as a raw balance and as a percentage of net
sales. Accounts payable was also reported as a raw balance and as a percentage
of net sales, and the payables balances for the months prior and subsequent to
year-end were also provided. Finally, accrued tax liability was reported as a raw
balance and as a percentage of tax expense. There were no material fluctuations
in the data.
12. Relevant analytical review procedures for other current liabilities. The
background information reported other current liabilities as a raw balance, as a
percentage of current liabilities and as a percentage of total liabilities and equity.
There was also a breakdown of other current liabilities. Accrued employee
compensation was significantly less than the previous year (approximately
$225,000) due to the presence of the earnings management error.
13. Relevant analytical procedures for debt. The information contained balances for
long-term debt (raw balance, as a percentage to equity and to total assets), interest
expense (raw balance and as a percentage to total debt), short-term notes payable
and a breakdown of long-term debt. There were no material fluctuations in the
data.
14. Relevant analytical review procedures for other non-current liabilities. The
information included other current liabilities as a raw balance, as a percentage of
current liabilities and as a percentage of total liabilities and equity. In addition,
there was a breakdown of non-other current liabilities. Accrued employee
compensation was significantly less than the previous year (by approximately
$225,000) due to the presence of the earnings management error.
46
15. Relevant analytical procedures for retained earnings. For common stock, the
information set consisted of the shares outstanding, the par value, additional paid
in capital, initial public offering price and the current trading price. The
information also included dividends per share, dividends as a percentage of stock
price, earnings per share and market capitalization. Finally, a statement of
retained earnings was reported. There were no significant differences in any of
the information compared with the prior year.
16. Relevant analytical review procedures for sales. The following data was present:
sales by product, a sales mix, gross margin by product, sales for the months prior
and subsequent to year-end, sales returns and allowances for the year (as raw
balance and as a percentage of net sales) and the balances for the months prior
and subsequent to year-end. Aside from the decrease in sales for the current year
(to reflect an incentive to manage earnings), there were no significant differences
in any of the data.
17. Relevant analytical procedures for selling and administrative expenses. The data
were reported in absolute and common-sized (as a percentage of net sales)
formats. There were significant decreases in both sales and administrative
compensation expenses (each fluctuating approximately $225,000) from the
previous year. Also, when the distracting errors were present, administrative
depreciation expense was understated by approximately $450,000, while
amortization expense was overstated by the same amount.
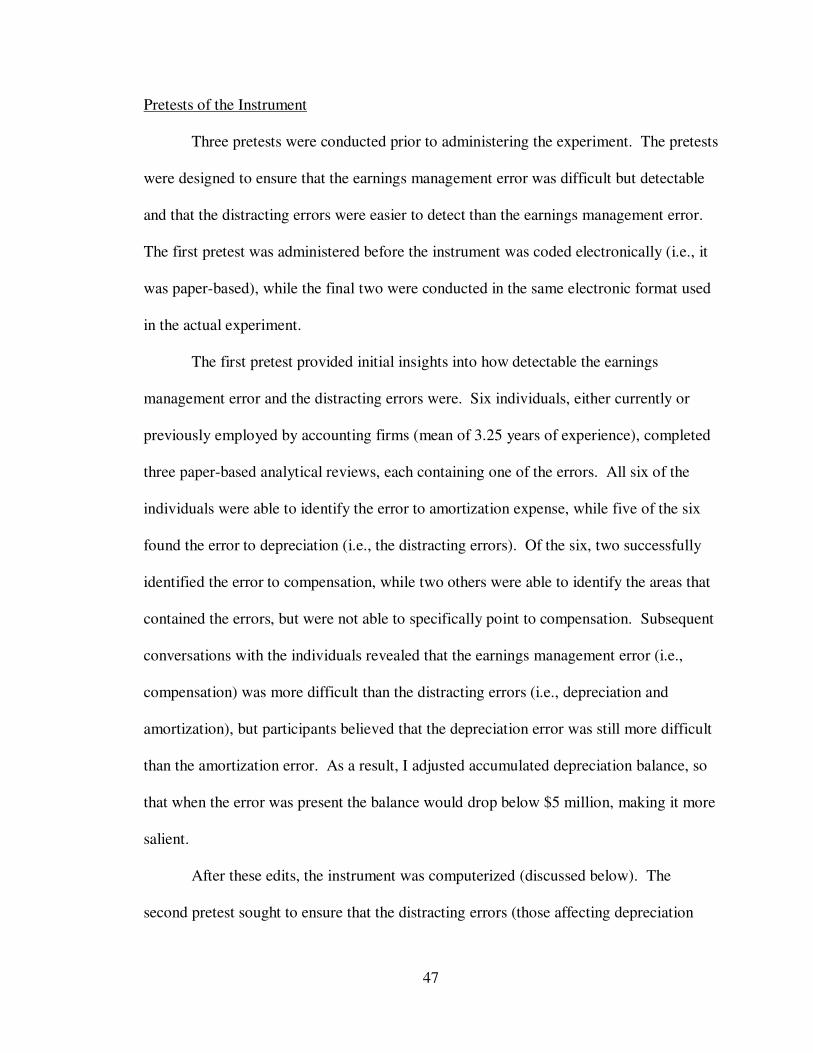
47
Pretests of the Instrument
Three pretests were conducted prior to administering the experiment. The pretests
were designed to ensure that the earnings management error was difficult but detectable
and that the distracting errors were easier to detect than the earnings management error.
The first pretest was administered before the instrument was coded electronically (i.e., it
was paper-based), while the final two were conducted in the same electronic format used
in the actual experiment.
The first pretest provided initial insights into how detectable the earnings
management error and the distracting errors were. Six individuals, either currently or
previously employed by accounting firms (mean of 3.25 years of experience), completed
three paper-based analytical reviews, each containing one of the errors. All six of the
individuals were able to identify the error to amortization expense, while five of the six
found the error to depreciation (i.e., the distracting errors). Of the six, two successfully
identified the error to compensation, while two others were able to identify the areas that
contained the errors, but were not able to specifically point to compensation. Subsequent
conversations with the individuals revealed that the earnings management error (i.e.,
compensation) was more difficult than the distracting errors (i.e., depreciation and
amortization), but participants believed that the depreciation error was still more difficult
than the amortization error. As a result, I adjusted accumulated depreciation balance, so
that when the error was present the balance would drop below $5 million, making it more
salient.
After these edits, the instrument was computerized (discussed below). The
second pretest sought to ensure that the distracting errors (those affecting depreciation
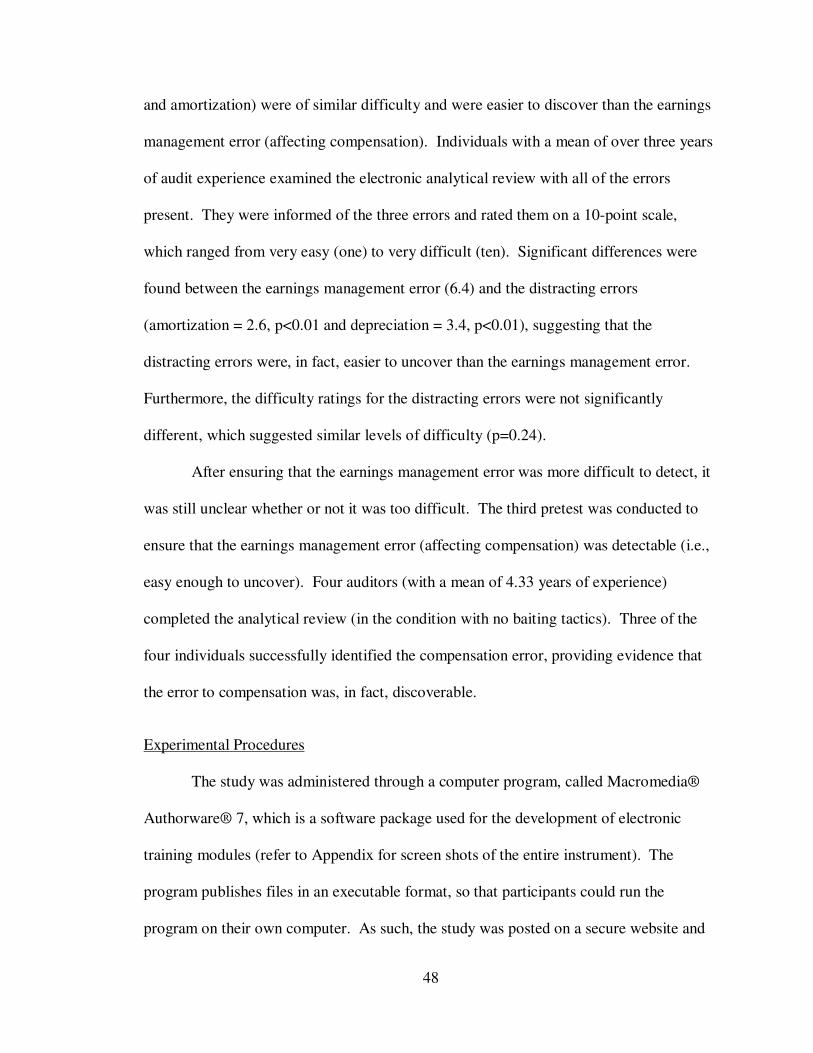
48
and amortization) were of similar difficulty and were easier to discover than the earnings
management error (affecting compensation). Individuals with a mean of over three years
of audit experience examined the electronic analytical review with all of the errors
present. They were informed of the three errors and rated them on a 10-point scale,
which ranged from very easy (one) to very difficult (ten). Significant differences were
found between the earnings management error (6.4) and the distracting errors
(amortization = 2.6, p<0.01 and depreciation = 3.4, p<0.01), suggesting that the
distracting errors were, in fact, easier to uncover than the earnings management error.
Furthermore, the difficulty ratings for the distracting errors were not significantly
different, which suggested similar levels of difficulty (p=0.24).
After ensuring that the earnings management error was more difficult to detect, it
was still unclear whether or not it was too difficult. The third pretest was conducted to
ensure that the earnings management error (affecting compensation) was detectable (i.e.,
easy enough to uncover). Four auditors (with a mean of 4.33 years of experience)
completed the analytical review (in the condition with no baiting tactics). Three of the
four individuals successfully identified the compensation error, providing evidence that
the error to compensation was, in fact, discoverable.
Experimental Procedures
The study was administered through a computer program, called Macromedia®
Authorware® 7, which is a software package used for the development of electronic
training modules (refer to Appendix for screen shots of the entire instrument). The
program publishes files in an executable format, so that participants could run the
program on their own computer. As such, the study was posted on a secure website and

49
could be downloaded by the auditors. After agreeing to participate, the auditors received
an email with the relevant information to access the program (see Figure 3.2 for the
timeline of the experiment). Upon starting the study, auditors entered a pin number to
grant them access and randomly assign them to a condition. They then entered their
name and navigated through a set of instructions and background information about the
company, its industry, its position in the market, and details about its audit history.
Participants were told that they were the senior-in-charge on an audit of a manufacturing
company. The company had consistently met analysts’ earnings forecasts, and analysts
had recently forecasted income to remain at $8.2 million (or $0.82 per share), which was
the same as the previous two years. In addition, the materiality threshold for the audit
was explicitly stated to be $100,000, which made material the fluctuations for all of the
accounts affected by the earnings management and distracting errors.
After reading the background and instructions, the auditors began the analytical
review. At this stage, participants were exposed to information from the client that
compared the unaudited financial balances of the current year to the audited balances of
the previous two years. Navigation buttons, along the left hand side of the screen,
allowed the participants to access the various pages of financial details that were
previously discussed. The navigation buttons were always present on the left side of the
screen during the analytical review so that participants could move freely to any piece of
information in any order they preferred.
A button on the bottom of each screen labeled “Record Judgment” brought the
auditors to a page where they could record any errors identified in a free response text
box. When they were satisfied with their error explanation, another button saved their
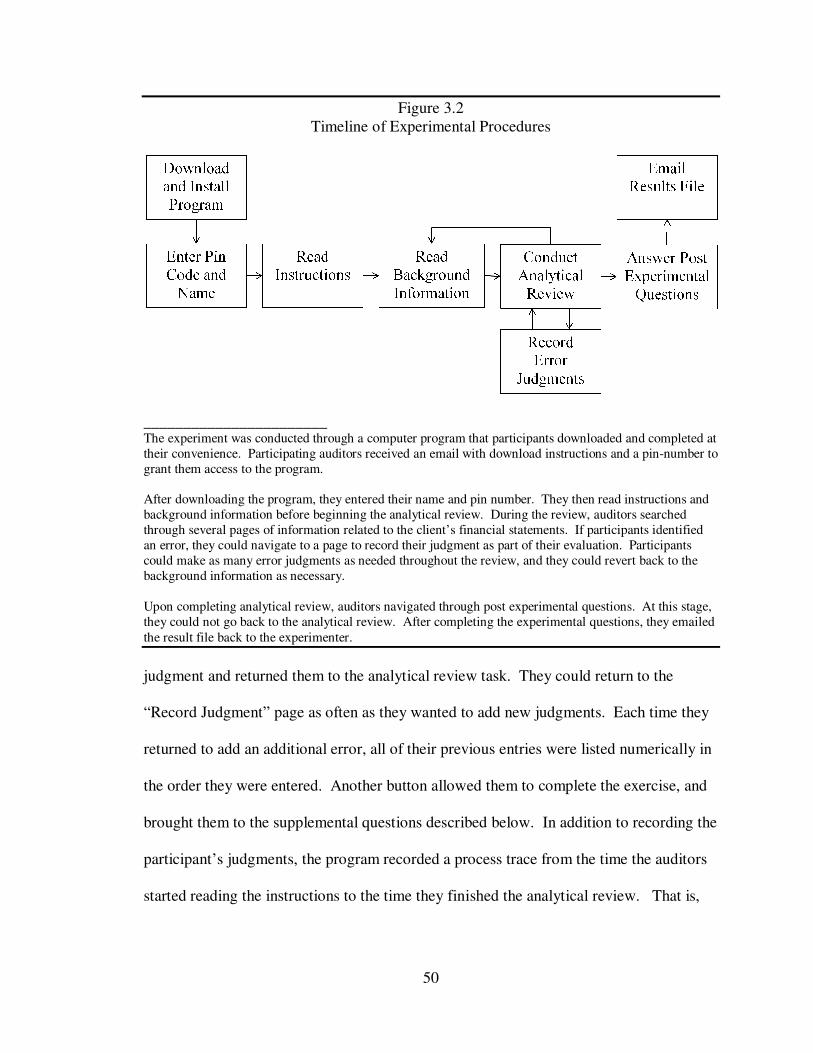
50
Figure 3.2 Timeline of Experimental Procedures
_______________________
The experiment was conducted through a computer program that participants downloaded and completed at their convenience. Participating auditors received an email with download instructions and a pin-number to grant them access to the program. After downloading the program, they entered their name and pin number. They then read instructions and background information before beginning the analytical review. During the review, auditors searched through several pages of information related to the client’s financial statements. If participants identified an error, they could navigate to a page to record their judgment as part of their evaluation. Participants could make as many error judgments as needed throughout the review, and they could revert back to the background information as necessary. Upon completing analytical review, auditors navigated through post experimental questions. At this stage, they could not go back to the analytical review. After completing the experimental questions, they emailed the result file back to the experimenter.
judgment and returned them to the analytical review task. They could return to the
“Record Judgment” page as often as they wanted to add new judgments. Each time they
returned to add an additional error, all of their previous entries were listed numerically in
the order they were entered. Another button allowed them to complete the exercise, and
brought them to the supplemental questions described below. In addition to recording the
participant’s judgments, the program recorded a process trace from the time the auditors
started reading the instructions to the time they finished the analytical review. That is,

51
the program recorded every page that the auditors viewed, the order in which they were
viewed, and the amount of time spent on each page.
After participants completed the analytical review, they were asked to respond to
a series of post-experimental questions. First, they received a manipulation check for the
diversionary statement which asked whether management identified any turnover in the
accounting department. They were then asked to indicate their agreement with several
statements using a six-point scale. The first fifteen statements (shown in Table 3.2) were
adapted from the forty-two item Need for Closure Scale outlined in Kruglanski et al.
(1993).11 These questions were provided to determine if individual need for closure
differences affected any of the results. To ensure that I received a valid need for closure
measure, I selected three questions from each need for closure dimension: order and
structure, discomfort with ambiguity, decisiveness of judgments, predictability of the
future, and closed-mindedness (Kruglanski et al. 1993). The remaining seven statements
(found in Table 3.3) related to the participants’ perceptions of management’s desire to
manage earnings, management’s likelihood to engage in audit management strategies,
and how they would respond to those strategies (i.e., related to auditor skepticism).
Finally, participants were asked to provide demographic (i.e., gender and age) and audit
work information (i.e., audit title, audit firm, and months of audit experience).
Participants emailed the results file back to me when they completed the study.
11 The need for closure scale was validated in Webster and Kruglanski (1994).
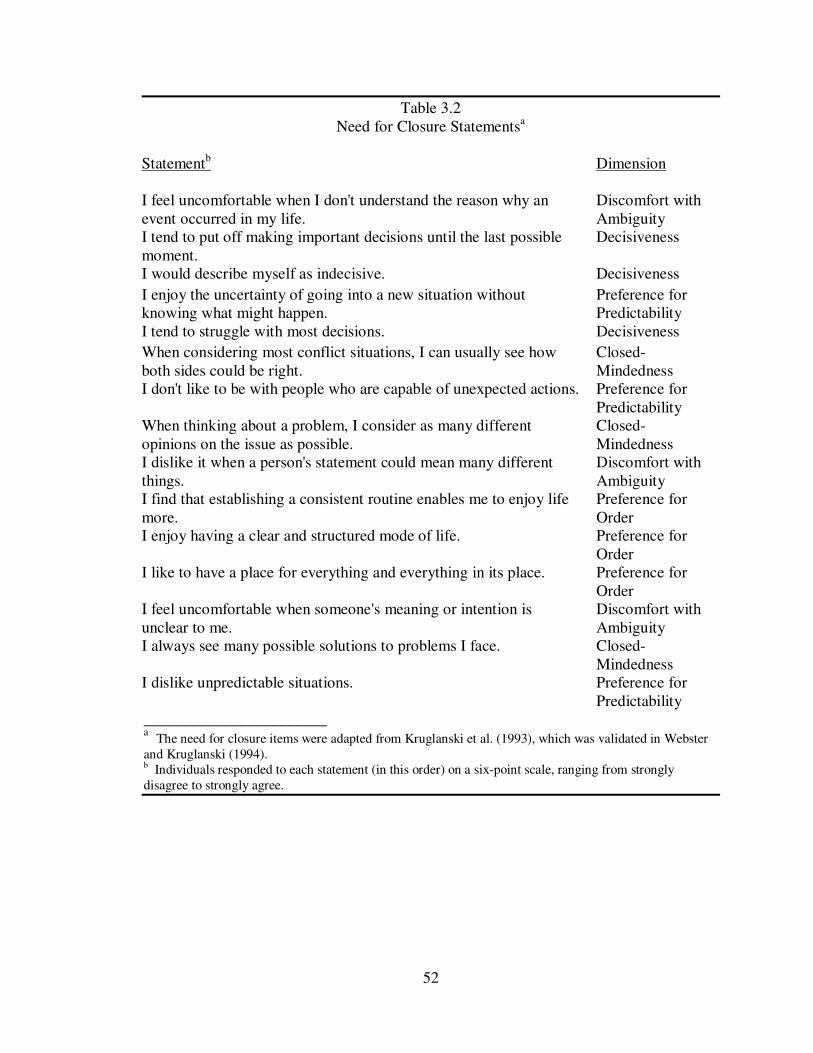
52
Table 3.2 Need for Closure Statementsa
Statementb Dimension
I feel uncomfortable when I don't understand the reason why an event occurred in my life.
Discomfort with Ambiguity
I tend to put off making important decisions until the last possible moment.
Decisiveness
I would describe myself as indecisive. Decisiveness
I enjoy the uncertainty of going into a new situation without knowing what might happen.
Preference for Predictability
I tend to struggle with most decisions. Decisiveness
When considering most conflict situations, I can usually see how both sides could be right.
Closed-Mindedness
I don't like to be with people who are capable of unexpected actions. Preference for Predictability
When thinking about a problem, I consider as many different opinions on the issue as possible.
Closed-Mindedness
I dislike it when a person's statement could mean many different things.
Discomfort with Ambiguity
I find that establishing a consistent routine enables me to enjoy life more.
Preference for Order
I enjoy having a clear and structured mode of life. Preference for Order
I like to have a place for everything and everything in its place. Preference for Order
I feel uncomfortable when someone's meaning or intention is unclear to me.
Discomfort with Ambiguity
I always see many possible solutions to problems I face. Closed-Mindedness
I dislike unpredictable situations. Preference for Predictability
_______________________ a The need for closure items were adapted from Kruglanski et al. (1993), which was validated in Webster and Kruglanski (1994). b Individuals responded to each statement (in this order) on a six-point scale, ranging from strongly disagree to strongly agree.

53
Table 3.3 Supplementary Management Statementsa
1. Managers try to manage earnings to meet earnings targets.
2. Managers are likely to commit fraud if left unmonitored.
3. Managers may try to hide an error in the financial statements to meet an earnings target.
4. Auditors prevent managers from committing fraud.
5. Managers try to distract auditors with easily detectable errors in hopes of hiding other errors.
6. When auditors begin to uncover relatively easy errors in financial statements, they usually increase the depth of their analysis with the expectation to find more errors.
7. If management identifies risky areas of the audit to you (the auditor), you would view management as more credible.
_________________
a Individuals responded to each statement (in this order) on a six-point scale, ranging from strongly disagree to strongly agree.
Variable and Manipulation Checks
After the experiment was conducted, several checks were examined to ensure that
the earnings management error was detectable, and that the manipulations were
successful. First, the overall detection rate of the earnings management error to
compensation was 32.9%, which is a similar detection rate to others studies that
employed difficult errors (e.g., Asare and Wright 2003; Bedard and Biggs 1991a, 1991b;
Bhattacharjee et al. 1999).
The overall detection rates for amortization and depreciation (i.e., distracting
errors) were 80.6% and 63.9% respectively. In addition, when a distracting error was
present, 83.3% of subjects found at least one of the distracting errors. These percentages
suggest that the distracting error manipulation successfully implanted easier errors into
the financial statements. In fact, when the distracting errors were present 92.9% of
auditors who found the earnings management error also found at least one of the

54
distracting errors, leaving only one participant that found the compensation error who did
not identify either distracting error.
In addition, a manipulation check of the diversionary statement sought to ensure
that the background information appropriately alerted auditors to risk in other areas. This
was done by asking the auditors whether or not management identified any turnover in
the accounting department, and if so, which accounts were affected. Overall, 91.7% of
all auditors passed the manipulation check (i.e., responded correctly whether or not the
diversionary statement was present), which provided evidence of a successful
manipulation.
In summary, all of the variable and manipulation checks were successful. The
earnings management error, as part of the dependent variable, was difficult yet
detectable. In addition, both distracting errors appeared to be easier to detect than the
earnings management error. Finally, the diversionary statement appropriately alerted
auditors to risk elsewhere in the financial statements.
55
CHAPTER 4
DATA ANALYSIS
This chapter presents an analysis of the data gathered. The independent variables
are the two baiting tactics employed by the client (a diversionary statement and
distracting errors). The main dependent variable is a measure of audit effectiveness. As
a supplementary dependent variable, I also examine the simple detection rate of the
earnings management error. I then provide several analyses of search related variables
(i.e., time and number of pages viewed), and number of judgments made, that may
impact one’s ability to detect the earnings management error. Finally, I examine the
effect of individual need for closure differences, and auditors’ perceptions of
management (i.e., auditor skepticism), and how these may modify an auditor’s ability to
identify earnings management.
Audit Effectiveness
Since the experiment involved a realistic analytical review task, which allowed
auditors to list as many potential errors as deemed necessary, participants could list many
areas they believed contained an error (i.e., take a shotgun approach). While identifying
a large number of accounts for investigation should, in theory, increase the likelihood of
detecting the true error, most audits involve finite time budgets within which auditors
must complete their work. As such, each additional account identified dilutes the amount
of resources the audit team can commit to locating the true earnings management error.
This could affect not only audit efficiency, but also effectiveness, because sufficient time
might not remain to adequately investigate the area containing the earnings management
error.
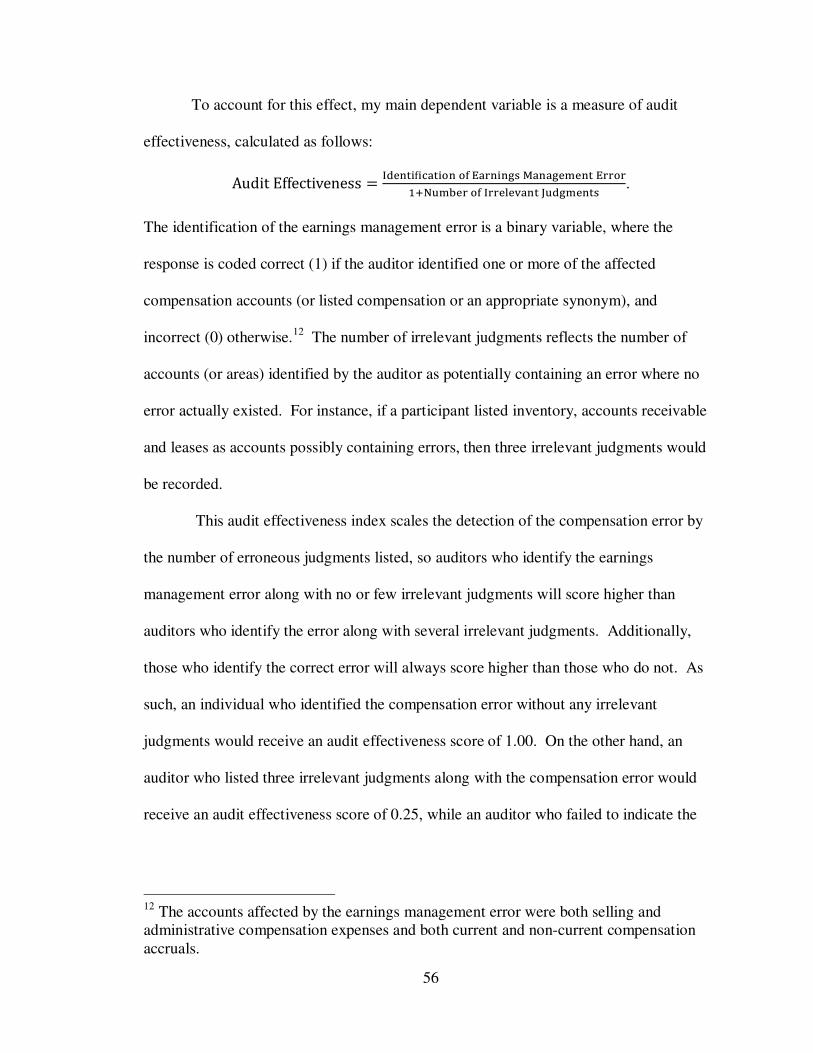
56
To account for this effect, my main dependent variable is a measure of audit
effectiveness, calculated as follows:
Audit Effectiveness =I�����f������� �� E������� M��������� E����
!N#�$�� �� I���%�&��� J#�������.
The identification of the earnings management error is a binary variable, where the
response is coded correct (1) if the auditor identified one or more of the affected
compensation accounts (or listed compensation or an appropriate synonym), and
incorrect (0) otherwise.12 The number of irrelevant judgments reflects the number of
accounts (or areas) identified by the auditor as potentially containing an error where no
error actually existed. For instance, if a participant listed inventory, accounts receivable
and leases as accounts possibly containing errors, then three irrelevant judgments would
be recorded.
This audit effectiveness index scales the detection of the compensation error by
the number of erroneous judgments listed, so auditors who identify the earnings
management error along with no or few irrelevant judgments will score higher than
auditors who identify the error along with several irrelevant judgments. Additionally,
those who identify the correct error will always score higher than those who do not. As
such, an individual who identified the compensation error without any irrelevant
judgments would receive an audit effectiveness score of 1.00. On the other hand, an
auditor who listed three irrelevant judgments along with the compensation error would
receive an audit effectiveness score of 0.25, while an auditor who failed to indicate the
12 The accounts affected by the earnings management error were both selling and administrative compensation expenses and both current and non-current compensation accruals.

57
compensation error would receive a score of 0.00, regardless of the number of irrelevant
judgments listed.
The results point to an interaction between diversionary statements and distracting
errors. As shown in Figure 4.1 and Table 4.1, the effect of a diversion depends on
whether the area that the auditor is directed to contains an error. More specifically,
auditors who were directed to accounts that were error free had an audit effectiveness
score of only 0.04, which is significantly lower than the score of 0.27 for auditors who
were led to risky accounts that contained distracting errors (two-tailed p=0.02).
Conversely, there were no differences in audit effectiveness between participants not
exposed to any baiting tactics and participants who received only the distracting errors
(0.17 versus 0.19 respectively, two-tailed p=0.81). This effect is underscored by the
results of the ANOVA found in Table 4.1, Panel B, indicating an interaction significant at
p=0.07.
As an additional analysis, I tested whether the audit effectiveness score in each
condition was statistically significant from zero. The scores in the no baiting tactic,
distracting errors only, and diversionary statement with distracting errors conditions were
all significantly different from zero (two-tailed p-values = 0.01, 0.02 and <0.01,
respectively). On the other hand, the diversionary statement without distracting errors
was not different from zero (two-tailed p=0.55). These findings indicate that when
auditors are diverted to areas that do not contain errors, they are not likely to uncover
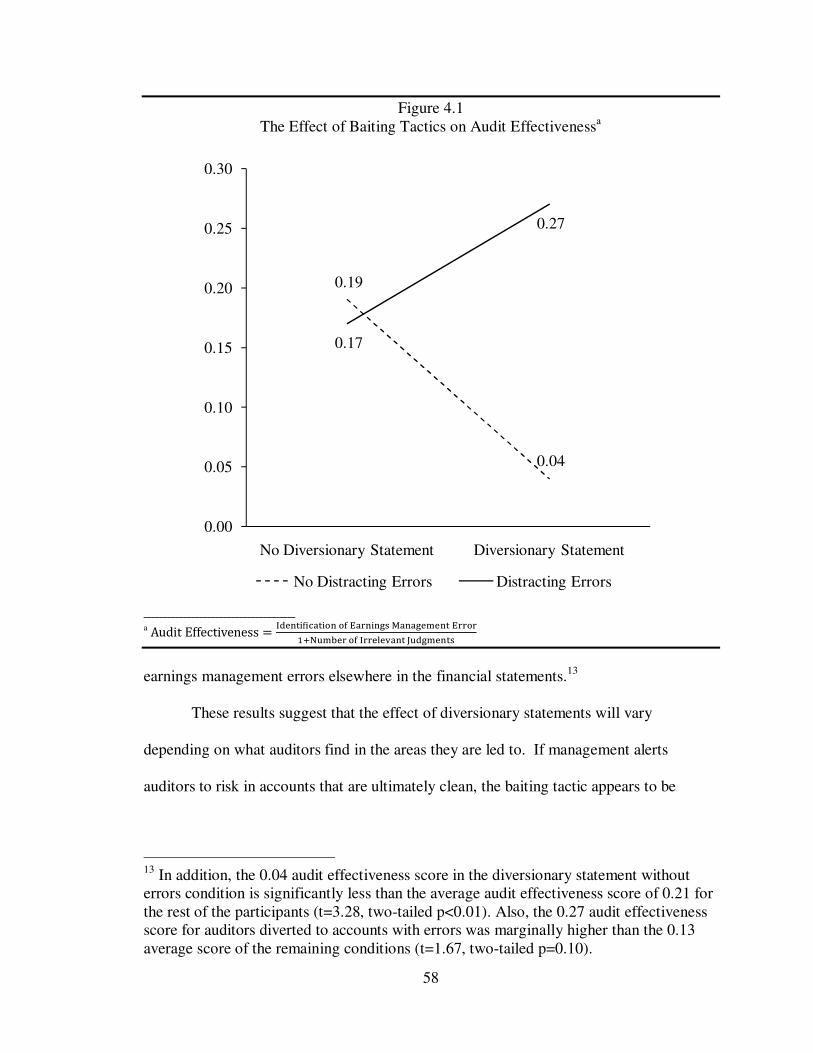
58
Figure 4.1 The Effect of Baiting Tactics on Audit Effectivenessa
___________________ a Audit Effectiveness =
I�����f������� �� E������� M��������� E����
!N#�$�� �� I���%�&��� J#�������
earnings management errors elsewhere in the financial statements.13
These results suggest that the effect of diversionary statements will vary
depending on what auditors find in the areas they are led to. If management alerts
auditors to risk in accounts that are ultimately clean, the baiting tactic appears to be
13 In addition, the 0.04 audit effectiveness score in the diversionary statement without errors condition is significantly less than the average audit effectiveness score of 0.21 for the rest of the participants (t=3.28, two-tailed p<0.01). Also, the 0.27 audit effectiveness score for auditors diverted to accounts with errors was marginally higher than the 0.13 average score of the remaining conditions (t=1.67, two-tailed p=0.10).
0.19
0.04
0.17
0.27
0.00
0.05
0.10
0.15
0.20
0.25
0.30
No Diversionary Statement Diversionary Statement
No Distracting Errors Distracting Errors
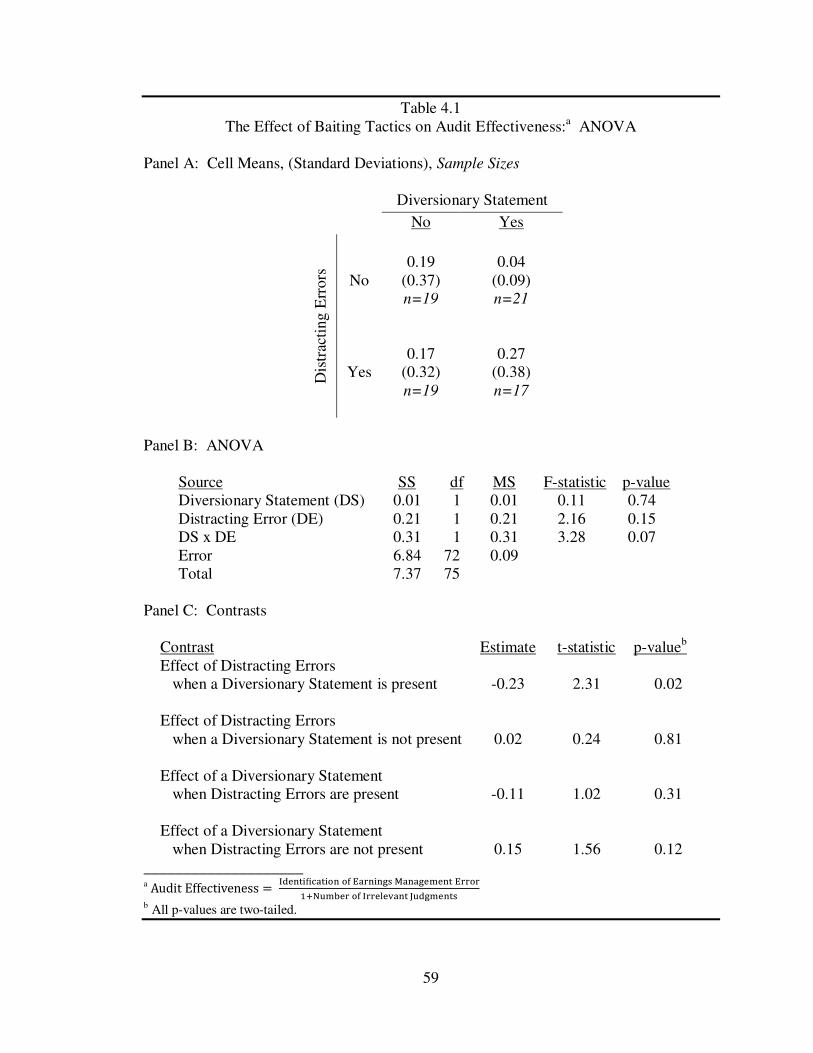
59
Table 4.1 The Effect of Baiting Tactics on Audit Effectiveness:a ANOVA
Panel A: Cell Means, (Standard Deviations), Sample Sizes
Diversionary Statement
No Yes
Dis
trac
ting
Err
ors
No
0.19 (0.37) n=19
0.04 (0.09) n=21
Yes
0.17 (0.32) n=19
0.27 (0.38) n=17
Panel B: ANOVA
Source SS df MS F-statistic p-value Diversionary Statement (DS) 0.01 1 0.01 0.11 0.74 Distracting Error (DE) 0.21 1 0.21 2.16 0.15 DS x DE 0.31 1 0.31 3.28 0.07 Error 6.84 72 0.09 Total 7.37 75
Panel C: Contrasts
Contrast Estimate t-statistic p-valueb Effect of Distracting Errors when a Diversionary Statement is present -0.23 2.31 0.02 Effect of Distracting Errors when a Diversionary Statement is not present 0.02 0.24 0.81 Effect of a Diversionary Statement when Distracting Errors are present -0.11 1.02 0.31 Effect of a Diversionary Statement when Distracting Errors are not present 0.15 1.56 0.12
____________________ a Audit Effectiveness =
I�����f������� �� E������� M��������� E����
!N#�$�� �� I���%�&��� J#�������
b All p-values are two-tailed.
60
effective at “diverting” the auditor away from managed earnings. That is, auditors are
less likely to uncover an earnings management error in other areas of the audit.
However, if management overtly leads auditors to an area containing errors, auditors
perform better at discovering managed earnings elsewhere in the financial statements.
Overall, the results suggest that diversions can distract auditors if they do not raise any
alarms. However, if auditors find errors in audit areas with already elevated
misstatement risk, they appear to more closely scrutinize the remaining financial
statement data, which ultimately causes the baiting tactic to backfire on management.
Effect of Search and Ability Control Variables
While the previous analysis shows the effects of baiting tactics, other variables
may potentially explain the result. A priori, there are two potential factors that may
affect how well auditors perform at identifying the earnings management error: the
breadth of the search and the ability of the participants.14 That is, those participants who
perform a more in-depth analysis and those with higher levels of audit ability should
perform best at this task.
To investigate this issue, I included variables representing the depth of the
information search and the ability level of the auditor in the model. Depth of information
search relates to the amount of time the auditor spent on the task and how many pages
he/she viewed. Specifically, those who spend more time on the task and those who view
more accounts (or repeatedly view accounts) should perform better at the task than those
who perform a less in-depth analysis. In addition, auditor ability can reasonably be
14 The breadth of the analysis could endogenously be affected by the baiting tactics, and will be subsequently analyzed. Ability of the auditor (as measured by experience and whether or not they worked at a Big 4 audit firm) should be controlled by random assignment.
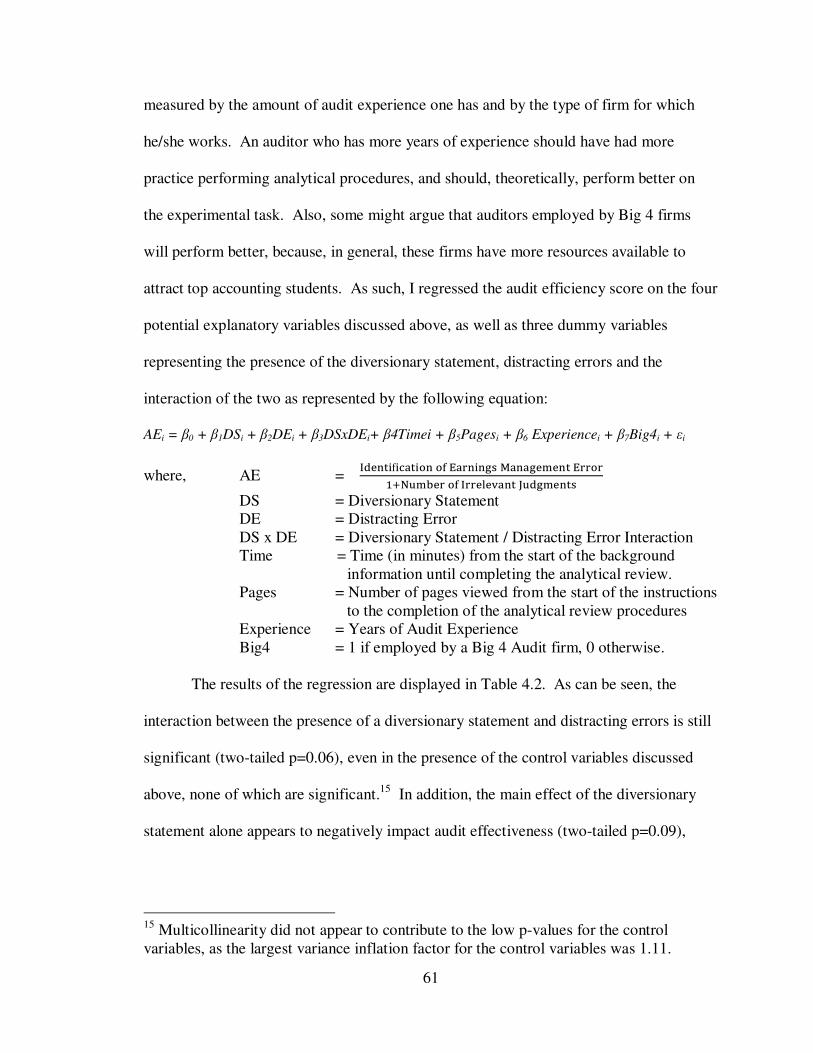
61
measured by the amount of audit experience one has and by the type of firm for which
he/she works. An auditor who has more years of experience should have had more
practice performing analytical procedures, and should, theoretically, perform better on
the experimental task. Also, some might argue that auditors employed by Big 4 firms
will perform better, because, in general, these firms have more resources available to
attract top accounting students. As such, I regressed the audit efficiency score on the four
potential explanatory variables discussed above, as well as three dummy variables
representing the presence of the diversionary statement, distracting errors and the
interaction of the two as represented by the following equation:
AEi = β0 + β1DSi + β2DEi + β3DSxDEi+ β4Timei + β5Pagesi + β6 Experiencei + β7Big4i + εi
where, AE = I�����f������� �� E������� M��������� E����
!N#�$�� �� I���%�&��� J#�������
DS = Diversionary Statement DE = Distracting Error DS x DE = Diversionary Statement / Distracting Error Interaction Time = Time (in minutes) from the start of the background
information until completing the analytical review. Pages = Number of pages viewed from the start of the instructions
to the completion of the analytical review procedures Experience = Years of Audit Experience Big4 = 1 if employed by a Big 4 Audit firm, 0 otherwise.
The results of the regression are displayed in Table 4.2. As can be seen, the
interaction between the presence of a diversionary statement and distracting errors is still
significant (two-tailed p=0.06), even in the presence of the control variables discussed
above, none of which are significant.15 In addition, the main effect of the diversionary
statement alone appears to negatively impact audit effectiveness (two-tailed p=0.09),
15 Multicollinearity did not appear to contribute to the low p-values for the control variables, as the largest variance inflation factor for the control variables was 1.11.
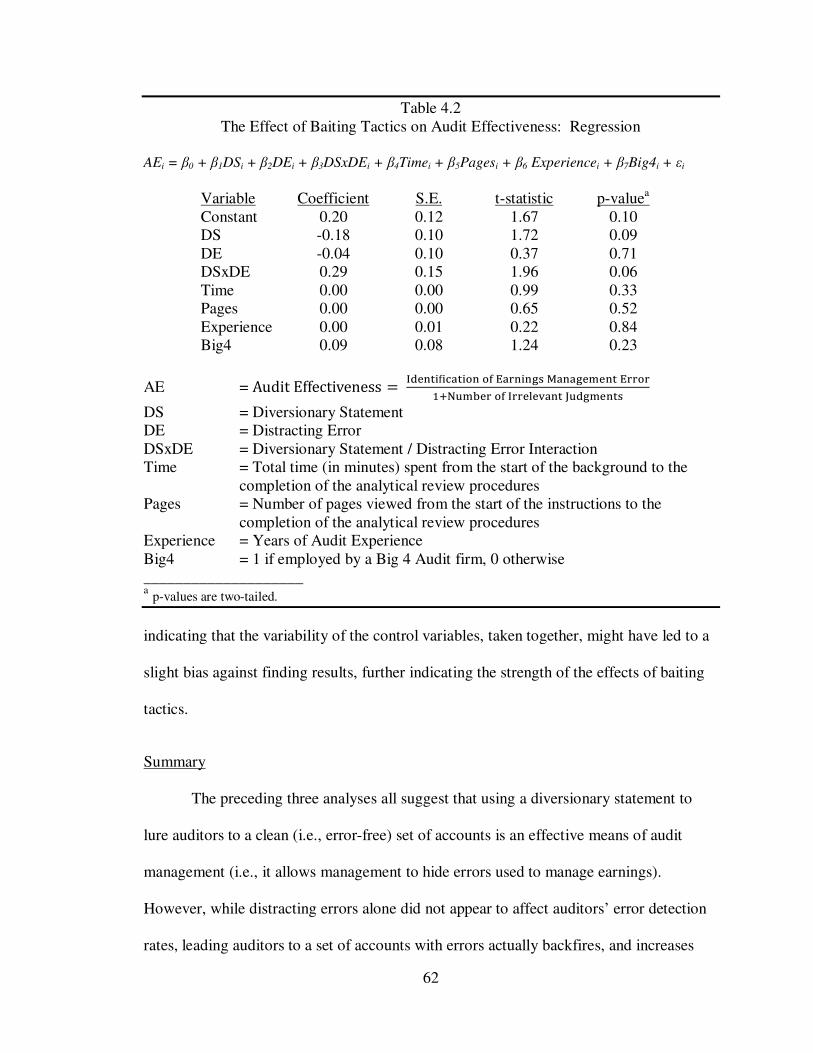
62
Table 4.2 The Effect of Baiting Tactics on Audit Effectiveness: Regression
AEi = β0 + β1DSi + β2DEi + β3DSxDEi + β4Timei + β5Pagesi + β6 Experiencei + β7Big4i + εi
Variable Coefficient S.E. t-statistic p-valuea
Constant 0.20 0.12 1.67 0.10 DS -0.18 0.10 1.72 0.09 DE -0.04 0.10 0.37 0.71 DSxDE 0.29 0.15 1.96 0.06 Time 0.00 0.00 0.99 0.33 Pages 0.00 0.00 0.65 0.52 Experience 0.00 0.01 0.22 0.84 Big4 0.09 0.08 1.24 0.23
AE = Audit Effectiveness = I�����f������� �� E������� M��������� E����
!N#�$�� �� I���%�&��� J#�������
DS = Diversionary Statement DE = Distracting Error DSxDE = Diversionary Statement / Distracting Error Interaction Time = Total time (in minutes) spent from the start of the background to the
completion of the analytical review procedures Pages = Number of pages viewed from the start of the instructions to the
completion of the analytical review procedures Experience = Years of Audit Experience Big4 = 1 if employed by a Big 4 Audit firm, 0 otherwise ____________________ a p-values are two-tailed.
indicating that the variability of the control variables, taken together, might have led to a
slight bias against finding results, further indicating the strength of the effects of baiting
tactics.
Summary
The preceding three analyses all suggest that using a diversionary statement to
lure auditors to a clean (i.e., error-free) set of accounts is an effective means of audit
management (i.e., it allows management to hide errors used to manage earnings).
However, while distracting errors alone did not appear to affect auditors’ error detection
rates, leading auditors to a set of accounts with errors actually backfires, and increases
63
their ability to detect managed earnings elsewhere in the financial statements. These
results remained significant even after controlling for several other potential explanatory
variables.
Identification of the Earnings Management Error
I next examined the auditors’ ability to simply detect the earnings management
error to further investigate the effectiveness of baiting tactics. Again, the earnings
management error was coded as correct if the auditor identified any of the affected
compensation accounts (or compensation or an appropriate synonym), and incorrect
otherwise. To limit the effect of auditors identifying the earnings management error as a
result of simply taking a shotgun style approach (i.e., by listing many accounts), I first
analyzed only the judgments of auditors who identified less than five irrelevant errors.
As can be seen in Figure 4.2 and Table 4.3, auditors who were diverted to clean (i.e.,
error-free) accounts again performed significantly worse than auditors who were led to
accounts that contained errors (6.7% compared to 43.8%, two-tailed p=0.02). Also as
before, auditors who received only distracting errors (with no diversionary statement)
performed similar to those receiving no baiting tactic (two-tailed p>0.99).16
All in all, these results point to the same interactive effect as found in the audit
effectiveness analysis and suggest that directing auditors to areas in which the accounts
16 In addition, auditors who were exposed to a diversionary statement which led them to an error-free account were significantly less likely to discover the earnings management error than the remainder of the sample (6.7% compared to 34.0%, χ2=4.31, two-tailed p=0.04), while auditors exposed to a diversionary statement which led them to an account containing errors performed marginally better than the remainder of the participants (43.8% compared to 22.4%, χ2=2.73, two-tailed p=0.10).
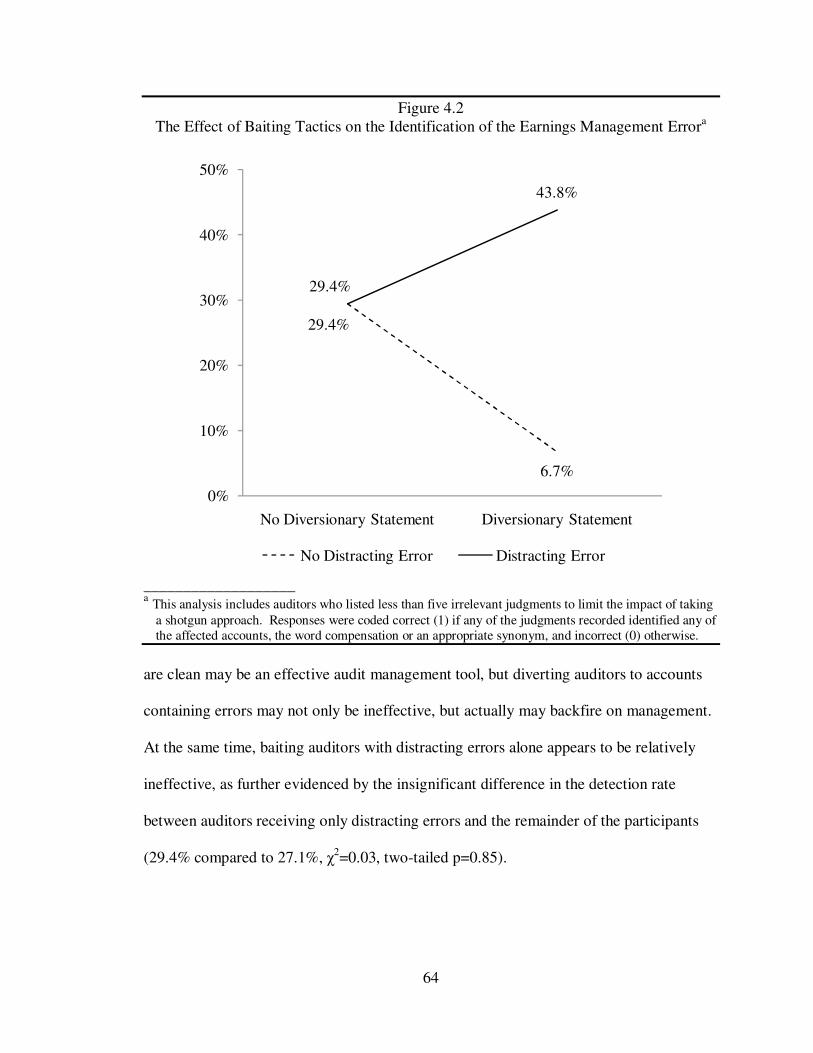
64
Figure 4.2 The Effect of Baiting Tactics on the Identification of the Earnings Management Errora
___________________ a This analysis includes auditors who listed less than five irrelevant judgments to limit the impact of taking
a shotgun approach. Responses were coded correct (1) if any of the judgments recorded identified any of the affected accounts, the word compensation or an appropriate synonym, and incorrect (0) otherwise.
are clean may be an effective audit management tool, but diverting auditors to accounts
containing errors may not only be ineffective, but actually may backfire on management.
At the same time, baiting auditors with distracting errors alone appears to be relatively
ineffective, as further evidenced by the insignificant difference in the detection rate
between auditors receiving only distracting errors and the remainder of the participants
(29.4% compared to 27.1%, χ2=0.03, two-tailed p=0.85).
29.4%
6.7%
29.4%
43.8%
0%
10%
20%
30%
40%
50%
No Diversionary Statement Diversionary Statement
No Distracting Error Distracting Error
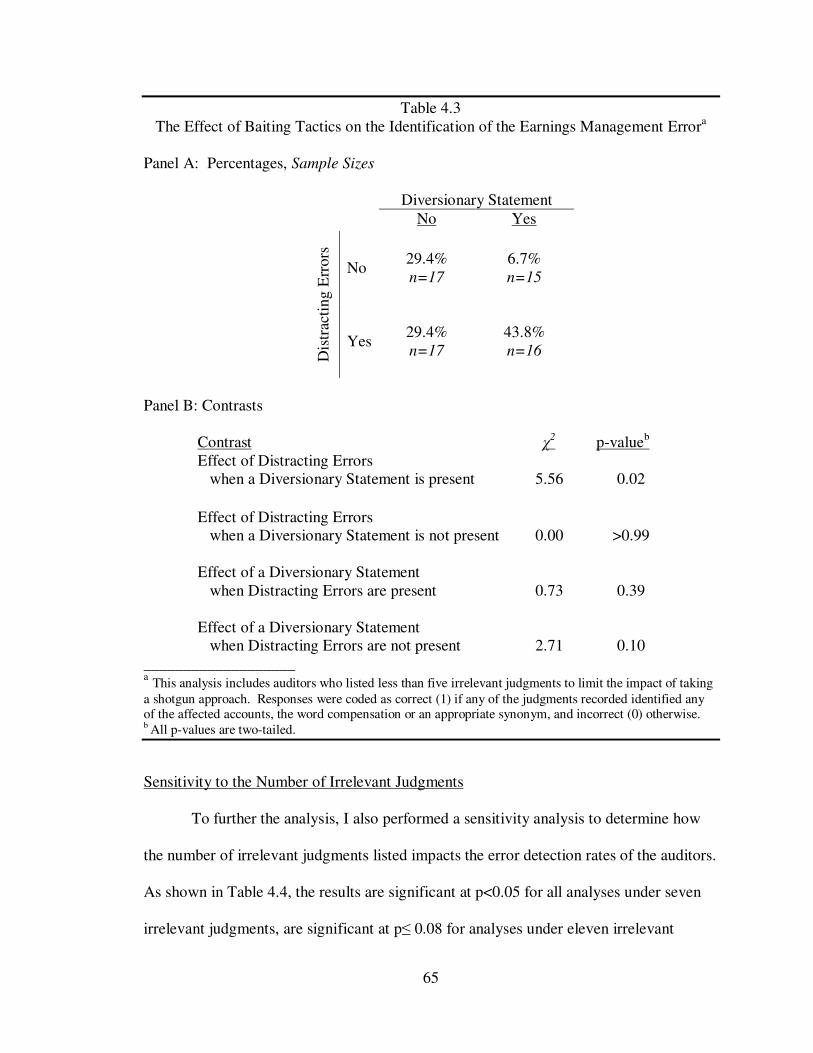
65
Table 4.3 The Effect of Baiting Tactics on the Identification of the Earnings Management Errora
Panel A: Percentages, Sample Sizes
Diversionary Statement
No Yes
Dis
trac
ting E
rrors
No
29.4% n=17
6.7% n=15
Yes
29.4% n=17
43.8% n=16
Panel B: Contrasts
Contrast χ2 p-valueb
Effect of Distracting Errors when a Diversionary Statement is present 5.56 0.02
Effect of Distracting Errors when a Diversionary Statement is not present 0.00 >0.99 Effect of a Diversionary Statement when Distracting Errors are present 0.73 0.39 Effect of a Diversionary Statement when Distracting Errors are not present 2.71 0.10
___________________ a This analysis includes auditors who listed less than five irrelevant judgments to limit the impact of taking
a shotgun approach. Responses were coded as correct (1) if any of the judgments recorded identified any of the affected accounts, the word compensation or an appropriate synonym, and incorrect (0) otherwise. b All p-values are two-tailed.
Sensitivity to the Number of Irrelevant Judgments
To further the analysis, I also performed a sensitivity analysis to determine how
the number of irrelevant judgments listed impacts the error detection rates of the auditors.
As shown in Table 4.4, the results are significant at p<0.05 for all analyses under seven
irrelevant judgments, are significant at p≤ 0.08 for analyses under eleven irrelevant
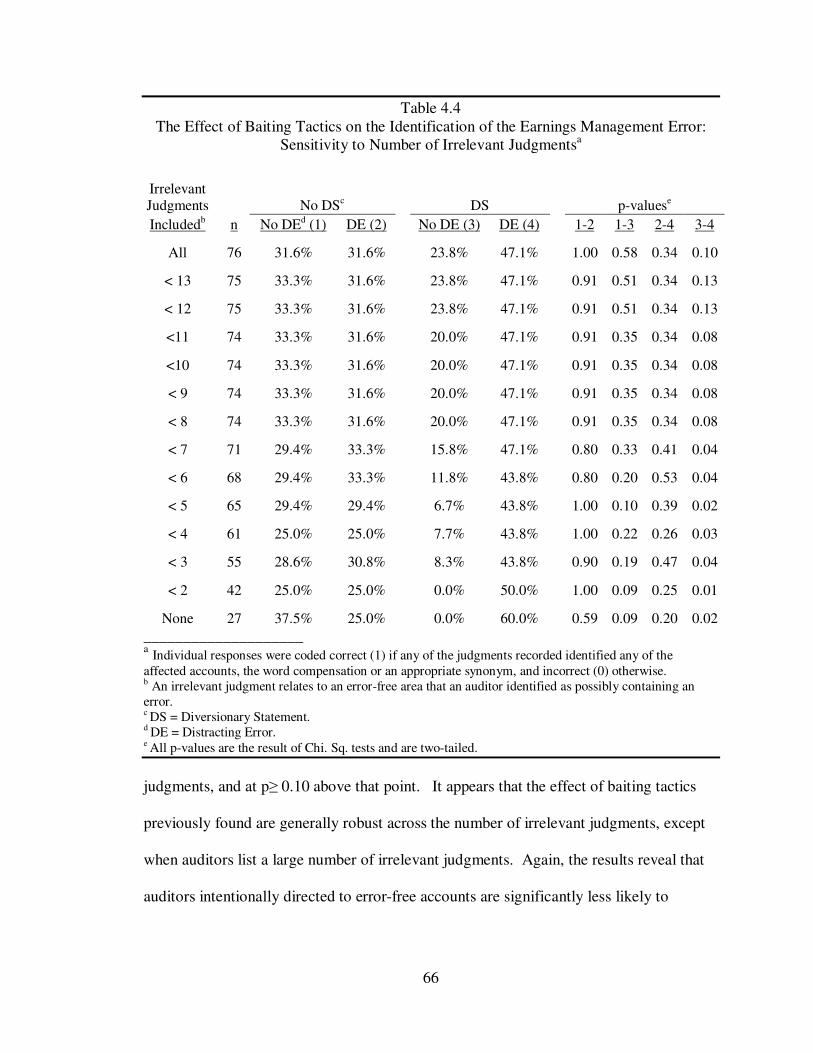
66
Table 4.4 The Effect of Baiting Tactics on the Identification of the Earnings Management Error:
Sensitivity to Number of Irrelevant Judgmentsa
Irrelevant Judgments No DSc
DS
p-valuese
Includedb n No DEd (1) DE (2) No DE (3) DE (4) 1-2 1-3 2-4 3-4
All 76 31.6% 31.6%
23.8% 47.1%
1.00 0.58 0.34 0.10
< 13 75 33.3% 31.6%
23.8% 47.1%
0.91 0.51 0.34 0.13
< 12 75 33.3% 31.6%
23.8% 47.1%
0.91 0.51 0.34 0.13
<11 74 33.3% 31.6%
20.0% 47.1%
0.91 0.35 0.34 0.08
<10 74 33.3% 31.6%
20.0% 47.1%
0.91 0.35 0.34 0.08
< 9 74 33.3% 31.6%
20.0% 47.1%
0.91 0.35 0.34 0.08
< 8 74 33.3% 31.6%
20.0% 47.1%
0.91 0.35 0.34 0.08
< 7 71 29.4% 33.3%
15.8% 47.1%
0.80 0.33 0.41 0.04
< 6 68 29.4% 33.3%
11.8% 43.8%
0.80 0.20 0.53 0.04
< 5 65 29.4% 29.4%
6.7% 43.8%
1.00 0.10 0.39 0.02
< 4 61 25.0% 25.0%
7.7% 43.8%
1.00 0.22 0.26 0.03
< 3 55 28.6% 30.8%
8.3% 43.8%
0.90 0.19 0.47 0.04
< 2 42 25.0% 25.0%
0.0% 50.0%
1.00 0.09 0.25 0.01
None 27 37.5% 25.0%
0.0% 60.0%
0.59 0.09 0.20 0.02 ____________________ a Individual responses were coded correct (1) if any of the judgments recorded identified any of the affected accounts, the word compensation or an appropriate synonym, and incorrect (0) otherwise. b An irrelevant judgment relates to an error-free area that an auditor identified as possibly containing an error. c DS = Diversionary Statement. d DE = Distracting Error. e All p-values are the result of Chi. Sq. tests and are two-tailed.
judgments, and at p≥ 0.10 above that point. It appears that the effect of baiting tactics
previously found are generally robust across the number of irrelevant judgments, except
when auditors list a large number of irrelevant judgments. Again, the results reveal that
auditors intentionally directed to error-free accounts are significantly less likely to
67
discover earnings management errors in the financial statements than auditors directed to
accounts that contain errors.
Summary
Overall, the analyses performed on the identification of the earnings management
error alone lead to the same conclusion as described earlier. That is, when auditors are
diverted to error-free accounts, they perform much worse at identifying earnings
management elsewhere in the financial statements. On the other hand, while seeding in
distracting errors alone does not appear to affect auditors, specifically leading auditors to
accounts with errors may actually backfire on management and cause auditors to perform
better at identifying managed earnings. The results appear to hold when a number of
irrelevant judgments were included in the analysis.
Information Search and Judgments
As previously discussed, differences in information search and judgment variables
may affect an auditor’s ability to identify the earnings management error. Since the task
allowed participants to determine their own search process and record as many judgments
as they wished, differences may arise between groups that could potentially explain the
results. That is, auditors who performed a deeper analysis of the data and who listed
more judgments should have had a higher likelihood of detecting the earnings
management error. Furthermore, search pattern differences may endogenously result
from the baiting tactics. Therefore, I examine the impact of two search variables, time
and number of pages viewed, as well as the number of judgments listed. Time represents
the total time taken (in minutes from the start of the background information until
finishing the analytical review), while number of pages viewed represents the number of
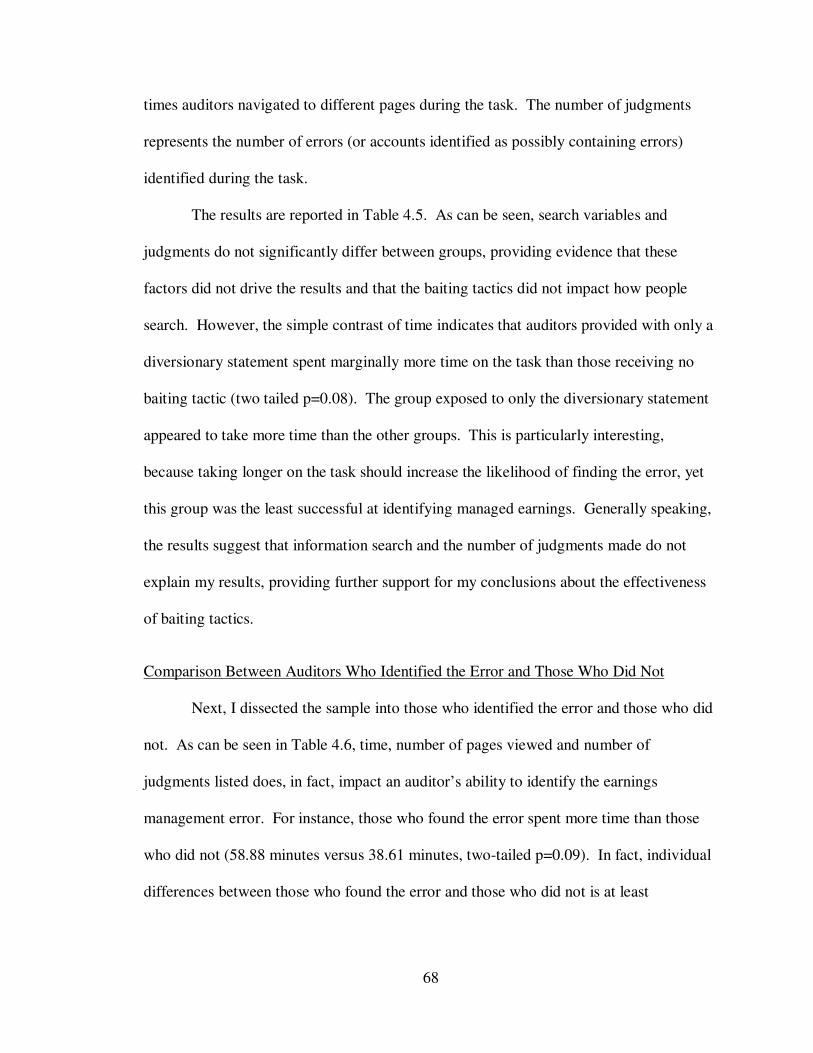
68
times auditors navigated to different pages during the task. The number of judgments
represents the number of errors (or accounts identified as possibly containing errors)
identified during the task.
The results are reported in Table 4.5. As can be seen, search variables and
judgments do not significantly differ between groups, providing evidence that these
factors did not drive the results and that the baiting tactics did not impact how people
search. However, the simple contrast of time indicates that auditors provided with only a
diversionary statement spent marginally more time on the task than those receiving no
baiting tactic (two tailed p=0.08). The group exposed to only the diversionary statement
appeared to take more time than the other groups. This is particularly interesting,
because taking longer on the task should increase the likelihood of finding the error, yet
this group was the least successful at identifying managed earnings. Generally speaking,
the results suggest that information search and the number of judgments made do not
explain my results, providing further support for my conclusions about the effectiveness
of baiting tactics.
Comparison Between Auditors Who Identified the Error and Those Who Did Not
Next, I dissected the sample into those who identified the error and those who did
not. As can be seen in Table 4.6, time, number of pages viewed and number of
judgments listed does, in fact, impact an auditor’s ability to identify the earnings
management error. For instance, those who found the error spent more time than those
who did not (58.88 minutes versus 38.61 minutes, two-tailed p=0.09). In fact, individual
differences between those who found the error and those who did not is at least
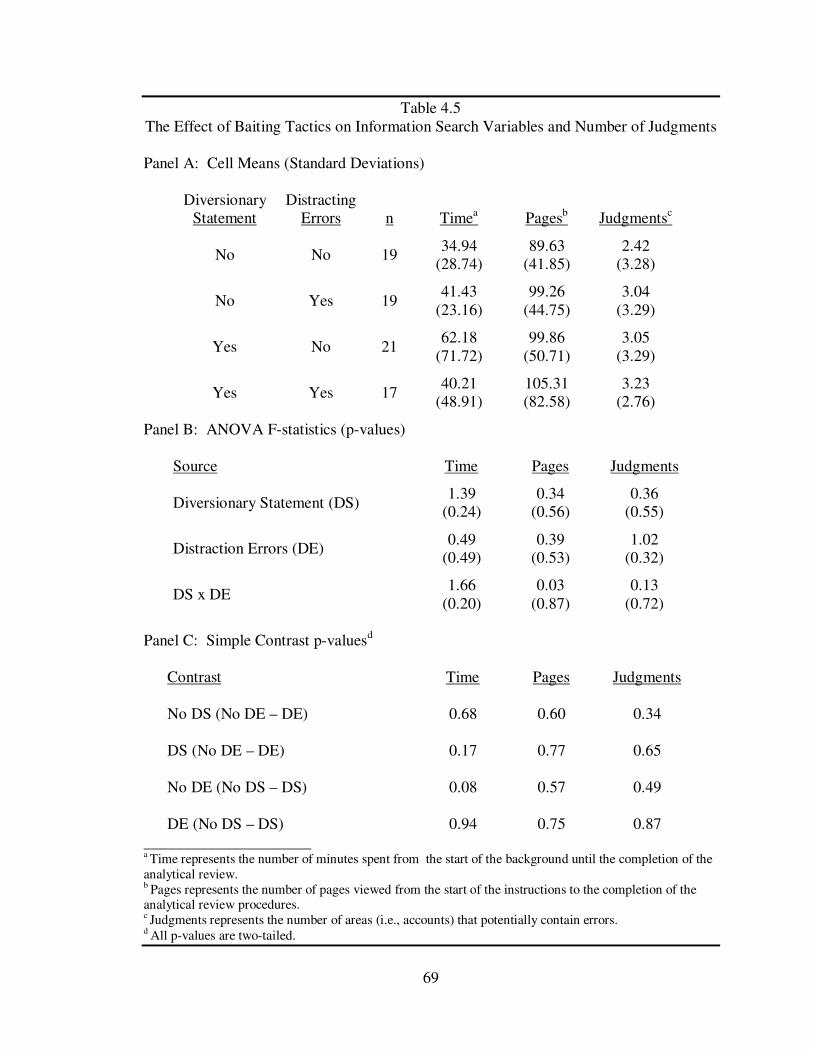
69
Table 4.5 The Effect of Baiting Tactics on Information Search Variables and Number of Judgments
Panel A: Cell Means (Standard Deviations)
Diversionary Statement
Distracting Errors
n Timea Pagesb Judgmentsc
No
No 19
34.94 (28.74)
89.63 (41.85)
2.42 (3.28)
No Yes 19 41.43
(23.16) 99.26
(44.75) 3.04
(3.29)
Yes
No 21 62.18
(71.72) 99.86
(50.71) 3.05
(3.29)
Yes Yes 17 40.21
(48.91) 105.31 (82.58)
3.23 (2.76)
Panel B: ANOVA F-statistics (p-values)
Source Time Pages Judgments Diversionary Statement (DS)
1.39 (0.24)
0.34 (0.56)
0.36 (0.55)
Distraction Errors (DE) 0.49
(0.49) 0.39
(0.53) 1.02
(0.32) DS x DE
1.66 (0.20)
0.03 (0.87)
0.13 (0.72)
Panel C: Simple Contrast p-valuesd
Contrast Time Pages Judgments No DS (No DE – DE)
0.68 0.60 0.34
DS (No DE – DE) 0.17 0.77 0.65 No DE (No DS – DS)
0.08 0.57 0.49
DE (No DS – DS) 0.94 0.75 0.87 _____________________
a Time represents the number of minutes spent from the start of the background until the completion of the analytical review. b Pages represents the number of pages viewed from the start of the instructions to the completion of the analytical review procedures. c Judgments represents the number of areas (i.e., accounts) that potentially contain errors. d All p-values are two-tailed.
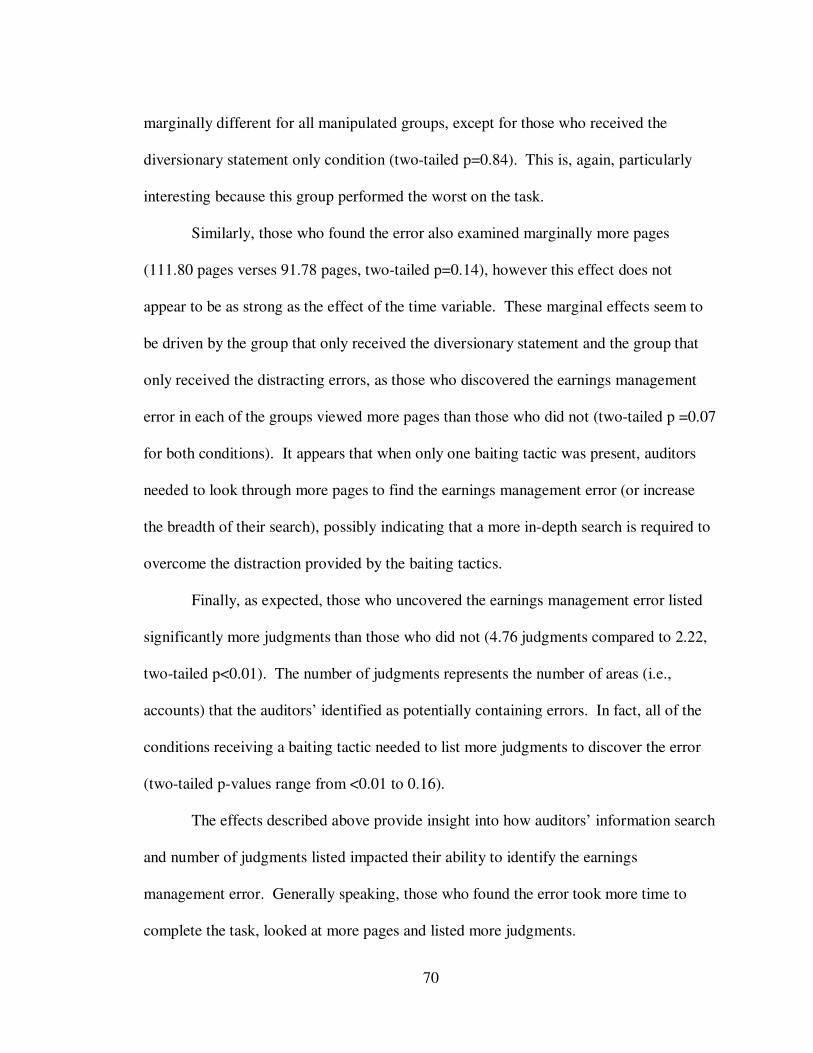
70
marginally different for all manipulated groups, except for those who received the
diversionary statement only condition (two-tailed p=0.84). This is, again, particularly
interesting because this group performed the worst on the task.
Similarly, those who found the error also examined marginally more pages
(111.80 pages verses 91.78 pages, two-tailed p=0.14), however this effect does not
appear to be as strong as the effect of the time variable. These marginal effects seem to
be driven by the group that only received the diversionary statement and the group that
only received the distracting errors, as those who discovered the earnings management
error in each of the groups viewed more pages than those who did not (two-tailed p =0.07
for both conditions). It appears that when only one baiting tactic was present, auditors
needed to look through more pages to find the earnings management error (or increase
the breadth of their search), possibly indicating that a more in-depth search is required to
overcome the distraction provided by the baiting tactics.
Finally, as expected, those who uncovered the earnings management error listed
significantly more judgments than those who did not (4.76 judgments compared to 2.22,
two-tailed p<0.01). The number of judgments represents the number of areas (i.e.,
accounts) that the auditors’ identified as potentially containing errors. In fact, all of the
conditions receiving a baiting tactic needed to list more judgments to discover the error
(two-tailed p-values range from <0.01 to 0.16).
The effects described above provide insight into how auditors’ information search
and number of judgments listed impacted their ability to identify the earnings
management error. Generally speaking, those who found the error took more time to
complete the task, looked at more pages and listed more judgments.
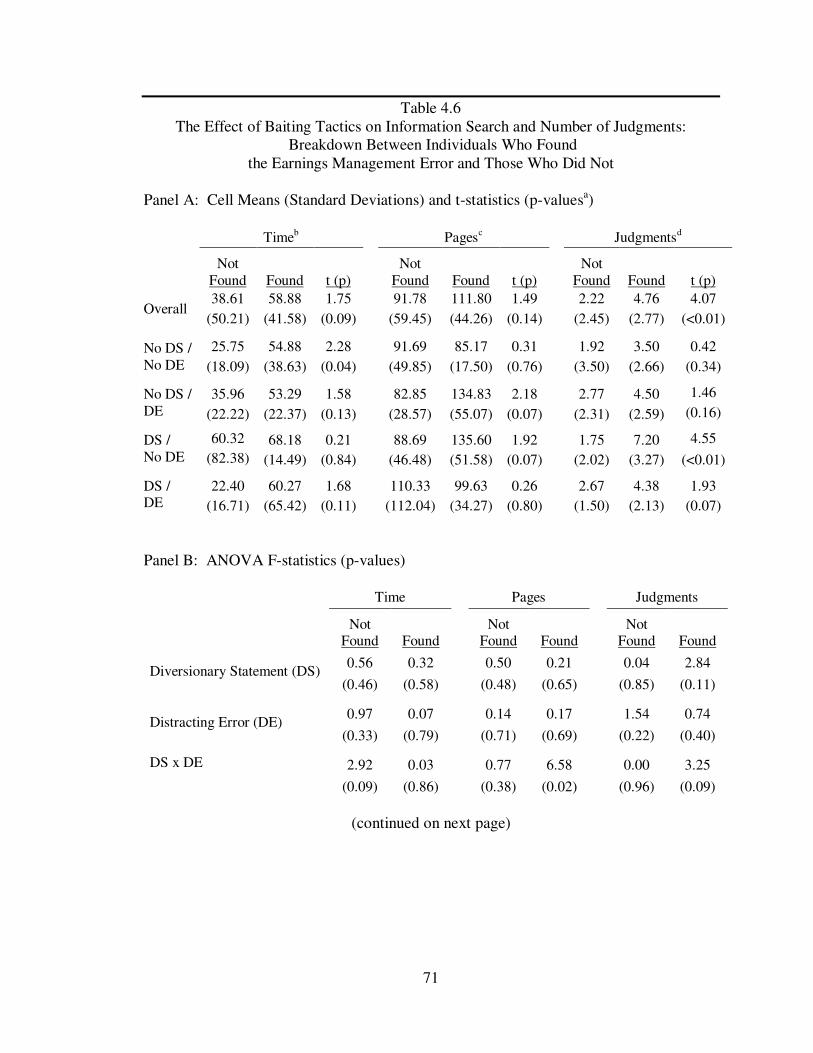
71
Table 4.6 The Effect of Baiting Tactics on Information Search and Number of Judgments:
Breakdown Between Individuals Who Found the Earnings Management Error and Those Who Did Not
Panel A: Cell Means (Standard Deviations) and t-statistics (p-valuesa)
Timeb Pagesc
Judgmentsd
Not Found Found t (p)
Not Found Found t (p)
Not Found Found t (p)
Overall 38.61 58.88 1.75
91.78 111.80 1.49
2.22 4.76 4.07
(50.21) (41.58) (0.09)
(59.45) (44.26) (0.14)
(2.45) (2.77) (<0.01)
No DS / No DE
25.75 54.88 2.28
91.69 85.17 0.31
1.92 3.50 0.42
(18.09) (38.63) (0.04)
(49.85) (17.50) (0.76)
(3.50) (2.66) (0.34)
No DS / DE
35.96 53.29 1.58 82.85 134.83 2.18 2.77 4.50 1.46
(22.22) (22.37) (0.13) (28.57) (55.07) (0.07) (2.31) (2.59) (0.16)
DS / No DE
60.32 68.18 0.21 88.69 135.60 1.92 1.75 7.20 4.55
(82.38) (14.49) (0.84) (46.48) (51.58) (0.07) (2.02) (3.27) (<0.01)
DS / DE
22.40 60.27 1.68 110.33 99.63 0.26 2.67 4.38 1.93
(16.71) (65.42) (0.11) (112.04) (34.27) (0.80) (1.50) (2.13) (0.07) Panel B: ANOVA F-statistics (p-values)
Time Pages
Judgments
Not Found Found
Not Found Found
Not Found Found
Diversionary Statement (DS) 0.56 0.32 0.50 0.21 0.04 2.84
(0.46) (0.58) (0.48) (0.65) (0.85) (0.11)
Distracting Error (DE)
0.97 0.07 0.14 0.17 1.54 0.74
(0.33) (0.79) (0.71) (0.69) (0.22) (0.40)
DS x DE 2.92 0.03 0.77 6.58 0.00 3.25
(0.09) (0.86) (0.38) (0.02) (0.96) (0.09)
(continued on next page)
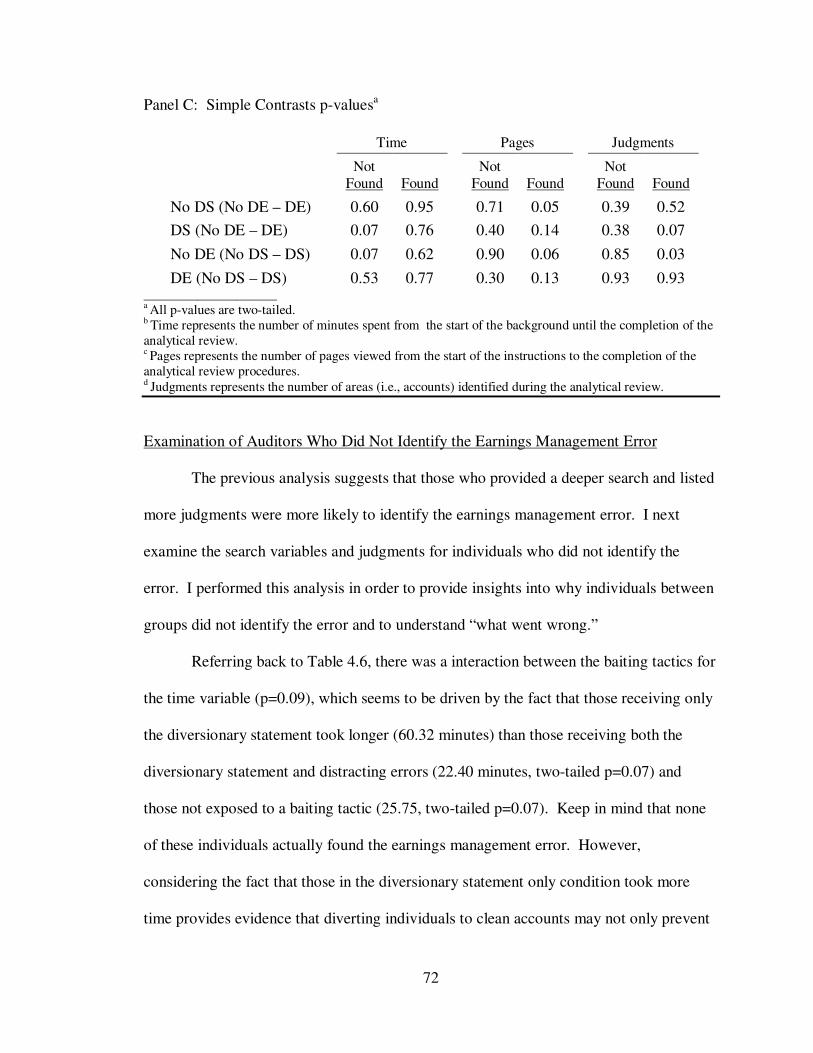
72
Panel C: Simple Contrasts p-valuesa
Time Pages
Judgments
Not Found Found
Not Found Found
Not Found Found
No DS (No DE – DE) 0.60 0.95 0.71 0.05 0.39 0.52
DS (No DE – DE) 0.07 0.76 0.40 0.14 0.38 0.07
No DE (No DS – DS) 0.07 0.62 0.90 0.06 0.85 0.03
DE (No DS – DS) 0.53 0.77 0.30 0.13 0.93 0.93 ____________________ a All p-values are two-tailed. b Time represents the number of minutes spent from the start of the background until the completion of the analytical review. c Pages represents the number of pages viewed from the start of the instructions to the completion of the analytical review procedures. d Judgments represents the number of areas (i.e., accounts) identified during the analytical review.
Examination of Auditors Who Did Not Identify the Earnings Management Error
The previous analysis suggests that those who provided a deeper search and listed
more judgments were more likely to identify the earnings management error. I next
examine the search variables and judgments for individuals who did not identify the
error. I performed this analysis in order to provide insights into why individuals between
groups did not identify the error and to understand “what went wrong.”
Referring back to Table 4.6, there was a interaction between the baiting tactics for
the time variable (p=0.09), which seems to be driven by the fact that those receiving only
the diversionary statement took longer (60.32 minutes) than those receiving both the
diversionary statement and distracting errors (22.40 minutes, two-tailed p=0.07) and
those not exposed to a baiting tactic (25.75, two-tailed p=0.07). Keep in mind that none
of these individuals actually found the earnings management error. However,
considering the fact that those in the diversionary statement only condition took more
time provides evidence that diverting individuals to clean accounts may not only prevent
73
them from identifying earnings management, but it also may cause them to search
aimlessly through the data or “spin their wheels.”
The other variables do not suggest any other differences in time, number of pages
viewed or number of judgments listed. Interestingly, there were no differences in number
of judgments listed between those receiving distracting errors and those who did not,
possibly suggesting that those without distracting errors listed more irrelevant judgments.
Overall through, this analysis indicates that there are no candid explanations as to why
individuals did not identify the error other than being affected by the baiting tactics (i.e.,
no particular group failure could be explained by an extremely limited search or too few
judgments listed).
Examination of Auditors Who Identified the Earnings Management Error
The next analysis I performed examined differences between search variables and
number of listed judgments for auditors who ultimately identified the earnings
management error. This analysis provides insights into differences in efficiencies for
individuals who found the correct error. As such, taking less time, searching through
fewer pages and listing fewer judgments would suggest more efficiency in finding the
error.
Referring again to Table 4.6, the most striking difference appears to be that those
receiving only a diversionary statement listed several more judgments (7.20) compared to
those diverted to the distracting errors (4.38, two-tailed p=0.07) and those not receiving a
baiting tactic (3.50, two-tailed p=0.03). Remember, those in the diversionary statement
only condition ultimately performed the worst. Hence, the few who did find the earnings
management error had to list six irrelevant judgments, indicating that future audit work
74
would need to be divided out to effectively test those areas. What is more, the
inefficiencies are magnified by the fact that those who were diverted to distracting errors
had over two more areas of concern to list when they identified the earnings management
error. This suggests the amount of extra work it took to actually discover the error when
only a diversionary statement was present.
While there were no differences in time, there was a significant interaction
between the baiting tactics for the number of pages viewed. Further analysis indicates
that those receiving a distracting error or a diversionary statement viewed more pages
than those diverted to the distracting errors and those not receiving a baiting tactic
(134.83 and 135.60 compared to 99.63 and 85.17 pages), providing further support for
the conclusion that intentionally leading auditors to error-free accounts increases audit
inefficiency. This also suggests that diverting auditors to a set of accounts with errors
may backfire on management, because not only do auditors in this condition perform
better at discovering the earnings management error, but they do so more efficiently (i.e.,
they completed the analytical review examining fewer pages). In addition, the analysis
suggests that while simply embedding distracting errors will not reduce an auditor’s
ability to uncover the earnings management error, it may add to the auditors’ search and
possibly cause inefficiencies within the audit.
Examination of the Point When the Earnings Management Error was Discovered
As a final analysis of search variables and judgments, I examined the point at
which the earnings management error was discovered. This analysis differs from the
previous analyses performed, which looked at the total time, the total number of pages
viewed and total number of judgments listed during the entire analytical review. In
75
contrast, this analysis examined the amount of time it took to find the error, the number
of pages viewed and how many irrelevant judgments were listed at the point when they
listed the earnings management error.
Overall, it took participants an average of 45.08 minutes to find the error after
viewing 74.16 pages. When the earnings management error was identified, on average, it
was after 3 other judgments were already identified (i.e., it was between the third and
fourth judgment listed) (see Table 4.7). As can be seen, there are really no significant
differences in time (minimum contrast two-tailed p=0.35) or number of pages (p=0.37).
There was a main effect of the diversionary statement (p=0.02) for judgments, indicating
that those receiving a diversionary statement listed more judgments before the earnings
management error was identified than those not receiving a diversionary statement.
Moreover, auditors receiving only distracting errors found the error marginally earlier
than those specifically diverted to the distracting errors (2.67 compared to 4.13, two-
tailed p=0.14). Overall, the results suggest that the presence of the diversionary statement
resulted in more judgments being listed before the earnings management error was
identified.
Summary
As expected, those who identified the error took longer to complete the task,
viewed more pages and listed more irrelevant judgments. However, those in the
diversionary statement condition who did not discover the earnings management error
took just as long to complete the task as those who did. It appears that the diversionary
statement group took marginally longer than the other groups, suggesting a possible
inefficiency in the audit. This is particularly interesting considering that this group
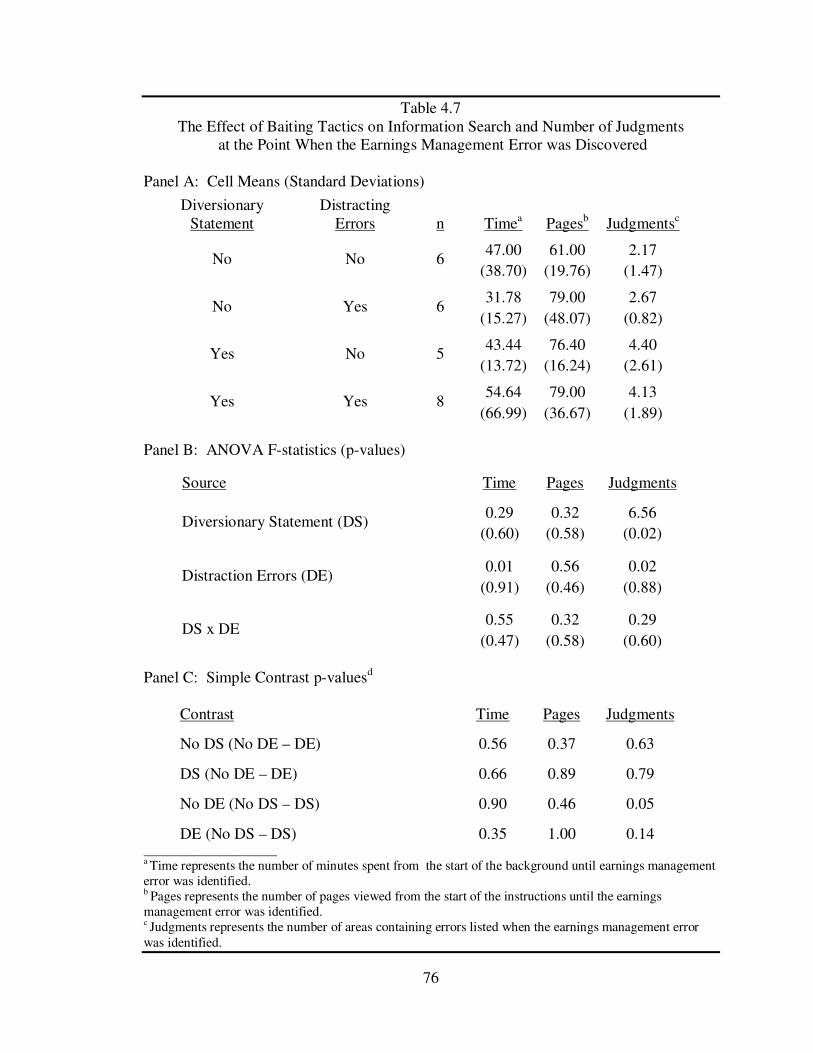
76
Table 4.7 The Effect of Baiting Tactics on Information Search and Number of Judgments
at the Point When the Earnings Management Error was Discovered
Panel A: Cell Means (Standard Deviations)
Diversionary Statement
Distracting Errors n Timea Pagesb Judgmentsc
No No 6 47.00 61.00 2.17
(38.70) (19.76) (1.47)
No Yes 6
31.78 79.00 2.67
(15.27) (48.07) (0.82)
Yes No 5
43.44 76.40 4.40
(13.72) (16.24) (2.61)
Yes Yes 8
54.64 79.00 4.13
(66.99) (36.67) (1.89)
Panel B: ANOVA F-statistics (p-values)
Source Time Pages Judgments
Diversionary Statement (DS) 0.29 0.32 6.56
(0.60) (0.58) (0.02)
Distraction Errors (DE) 0.01 0.56 0.02
(0.91) (0.46) (0.88)
DS x DE 0.55 0.32 0.29
(0.47) (0.58) (0.60)
Panel C: Simple Contrast p-valuesd
Contrast Time Pages Judgments
No DS (No DE – DE) 0.56 0.37 0.63
DS (No DE – DE) 0.66 0.89 0.79
No DE (No DS – DS) 0.90 0.46 0.05
DE (No DS – DS) 0.35 1.00 0.14 ____________________ a Time represents the number of minutes spent from the start of the background until earnings management error was identified. b Pages represents the number of pages viewed from the start of the instructions until the earnings management error was identified. c Judgments represents the number of areas containing errors listed when the earnings management error was identified.
77
performed the worst at the task. Furthermore, other inefficiencies appeared to result from
the inclusion of the diversionary statement, as those who found the error did so only by
listing several more judgments and searching more pages.
Effect of Need for Closure
Next, I explored whether other variables may have impacted the auditor’s
likelihood of discovering the earnings management error. The first of these, the need for
closure, essentially measures one’s desire to feel completion with a task. As such, those
with lower need for closure should carry out more in-depth analyses and perform better.
Webster and Kruglanski (1993; 1994) measured and validated this effect across five
dimensions: need for order, desire for predictability, decisiveness, discomfort with
ambiguity and closed mindedness. As mentioned in chapter three, I selected three
questions from each dimension of their 42 question Need for Closure scale. Each
question was measured on a six-point Likert scale ranging from strongly disagree (coded
as 1) to strongly agree (coded as 6). The three questions for each dimension were
averaged to create an overall dimension score and the five dimension scores were
averaged together to create an overall need for closure score. To promote variability
between high and low scores, I examined the frequency of each score to approximate the
data into thirds for each dimension and overall need for closure. From there, I compared
the high and low scoring groups (i.e., high need for closure dimension compared to low
need for closure dimension).
I compared the audit effectiveness score, the number of judgments made, the time
taken and the number of pages viewed between individuals who were scored as high and
low for each need for closure dimension and the overall need for closure. The results
78
appear in Table 4.8. As can be seen, the only variable that appears to have had an effect
is closed-mindedness. That is, those who were less closed minded had higher audit
effectiveness scores than those who more closed-minded (0.27 compared to 0.08, two-
tailed p=0.03). In addition, those who were less closed minded listed more judgments
(4.00 compared to 2.52, two-tailed p=0.05 and 57.08 minutes compared to 39.33, two-
tailed p=0.11).
Other than the findings explained above, the need for closure did not appear to
substantially affect an auditor’s ability to uncover the earnings management error. 17
Further analysis leads me to conjecture that the lack of significant differences may have
resulted from one of two possibilities. First, three questions for each dimension may not
have imparted enough variability to effectively drive separation between those scoring
high and low. The original scale consisted of 42 questions; generally the scores appear to
be normally distributed, meaning that many scored a moderate level of need for closure.
As such, more questions may have been necessary to really understand the differences
between these individuals.
Second, research has shown that auditors (especially staff and seniors) have a
higher need for closure (Bailey et al. 2006; Webster 1993; Webster and Kruglanski
1994). As such, given a midpoint score of 3.5 for each dimension, the sample of auditors
17 There were sporadic differences within other dimensions. Those with high need for order took more time (two-tailed p=0.05), those with high overall need for closure took marginally more time (two-tailed p=0.13), and those with high need for predictability viewed marginally more pages (p=0.14).
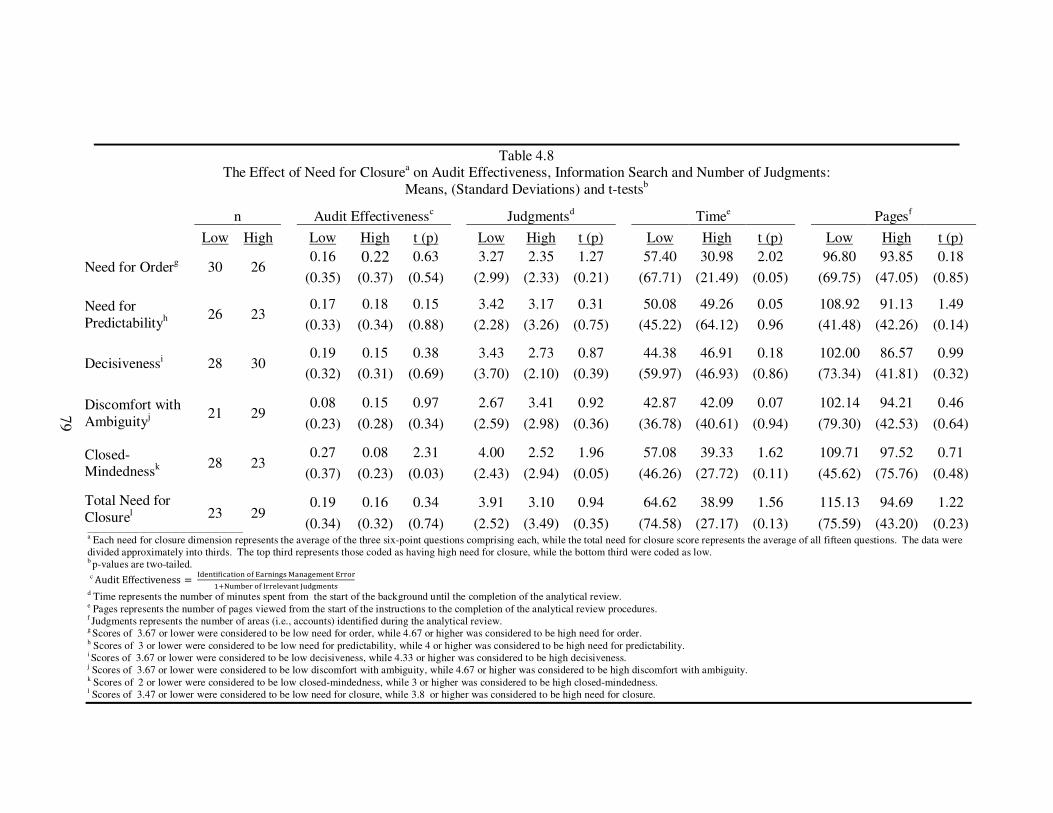
Table 4.8 The Effect of Need for Closurea on Audit Effectiveness, Information Search and Number of Judgments:
Means, (Standard Deviations) and t-testsb
n Audit Effectivenessc Judgmentsd
Timee Pagesf
Low High Low High t (p) Low High t (p) Low High t (p) Low High t (p)
Need for Orderg 30 26
0.16 0.22 0.63
3.27 2.35 1.27
57.40 30.98 2.02
96.80 93.85 0.18
(0.35) (0.37) (0.54)
(2.99) (2.33) (0.21)
(67.71) (21.49) (0.05)
(69.75) (47.05) (0.85)
Need for Predictabilityh 26 23
0.17 0.18 0.15
3.42 3.17 0.31
50.08 49.26 0.05
108.92 91.13 1.49
(0.33) (0.34) (0.88)
(2.28) (3.26) (0.75)
(45.22) (64.12) 0.96
(41.48) (42.26) (0.14)
Decisivenessi 28 30 0.19 0.15 0.38
3.43 2.73 0.87
44.38 46.91 0.18
102.00 86.57 0.99
(0.32) (0.31) (0.69)
(3.70) (2.10) (0.39)
(59.97) (46.93) (0.86)
(73.34) (41.81) (0.32)
Discomfort with Ambiguityj 21 29
0.08 0.15 0.97
2.67 3.41 0.92
42.87 42.09 0.07
102.14 94.21 0.46
(0.23) (0.28) (0.34)
(2.59) (2.98) (0.36)
(36.78) (40.61) (0.94)
(79.30) (42.53) (0.64)
Closed-Mindednessk 28 23
0.27 0.08 2.31
4.00 2.52 1.96
57.08 39.33 1.62
109.71 97.52 0.71
(0.37) (0.23) (0.03)
(2.43) (2.94) (0.05)
(46.26) (27.72) (0.11)
(45.62) (75.76) (0.48)
Total Need for Closurel 23 29
0.19 0.16 0.34
3.91 3.10 0.94
64.62 38.99 1.56
115.13 94.69 1.22
(0.34) (0.32) (0.74)
(2.52) (3.49) (0.35)
(74.58) (27.17) (0.13)
(75.59) (43.20) (0.23)
_______________________________________
a Each need for closure dimension represents the average of the three six-point questions comprising each, while the total need for closure score represents the average of all fifteen questions. The data were divided approximately into thirds. The top third represents those coded as having high need for closure, while the bottom third were coded as low. b p-values are two-tailed.
c Audit Effectiveness = I�����f������� �� E������� M��������� E����
!N#�$�� �� I���%�&��� J#�������
d Time represents the number of minutes spent from the start of the background until the completion of the analytical review. e Pages represents the number of pages viewed from the start of the instructions to the completion of the analytical review procedures. f Judgments represents the number of areas (i.e., accounts) identified during the analytical review. g Scores of 3.67 or lower were considered to be low need for order, while 4.67 or higher was considered to be high need for order. h Scores of 3 or lower were considered to be low need for predictability, while 4 or higher was considered to be high need for predictability. i Scores of 3.67 or lower were considered to be low decisiveness, while 4.33 or higher was considered to be high decisiveness. j Scores of 3.67 or lower were considered to be low discomfort with ambiguity, while 4.67 or higher was considered to be high discomfort with ambiguity. k Scores of 2 or lower were considered to be low closed-mindedness, while 3 or higher was considered to be high closed-mindedness. l Scores of 3.47 or lower were considered to be low need for closure, while 3.8 or higher was considered to be high need for closure.
79

80
had medians above the midpoints for three of the four dimensions where no differences
occurred (medians scores ranged from 3.33 to 4.33).18 In fact, closed-mindedness, which
was the only dimension that had an effect on audit effectiveness, had a median score of
2.33, well below the mid-point, indicating that, in general, these auditors were less
closed-minded. The median scores above the midpoint for the remaining four
dimensions and the overall need for closure are consistent with the research suggesting
that auditors have higher need for closure scores. This higher need for closure may
explain the low overall detection rate on this task, as well as those found in other studies
(e.g., Asare and Wright 2003; Bedard and Biggs 1991b; Bhattacharjee et al. 1999).
Effect of Auditors’ Perception of Management and the Audit Process
I next examined the effect of auditors’ perception of management and the audit
process, and whether or not their beliefs affect their ability to uncover managed earnings.
As mentioned in Chapter 3, after auditors completed the analytical review and need for
closure questions, they responded to seven statements that related to their belief of
managers willingness to manipulate earnings, commit fraud, deceive auditors, whether or
not the audit process mitigates fraud, and another regarding management’s credibility.19
Similar to the need for closure scale, auditors were asked to indicate their agreement with
these statements on six-point scales, each ranging from strongly disagree (1) to strongly
agree (6). Three of the points indicated disagree (strongly to slightly) and three points
indicated agree. As such, the data were coded so that individuals who answered one
through three were coded as “disagree” while those who responded four through six were
coded as “agree.”
18 Predictability had an average score just below the midpoint at 3.33. 19 For the list of questions, refer to Chapter 3 or the footnotes in Table 4.9.
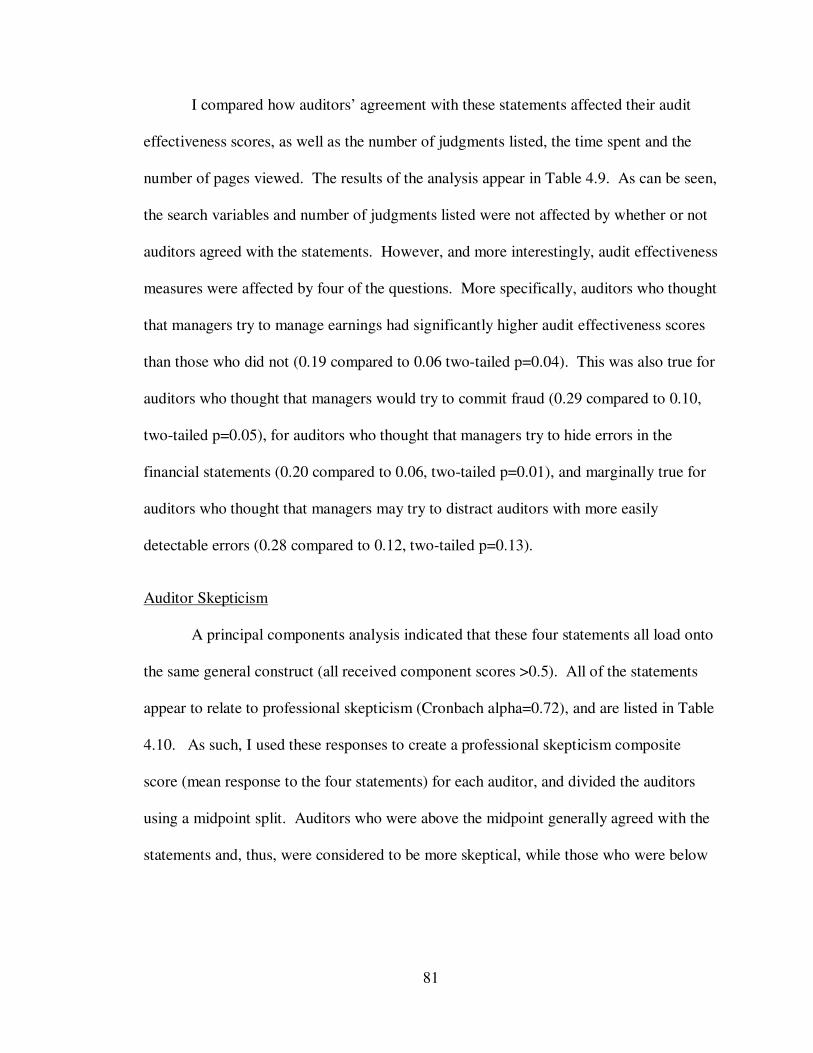
81
I compared how auditors’ agreement with these statements affected their audit
effectiveness scores, as well as the number of judgments listed, the time spent and the
number of pages viewed. The results of the analysis appear in Table 4.9. As can be seen,
the search variables and number of judgments listed were not affected by whether or not
auditors agreed with the statements. However, and more interestingly, audit effectiveness
measures were affected by four of the questions. More specifically, auditors who thought
that managers try to manage earnings had significantly higher audit effectiveness scores
than those who did not (0.19 compared to 0.06 two-tailed p=0.04). This was also true for
auditors who thought that managers would try to commit fraud (0.29 compared to 0.10,
two-tailed p=0.05), for auditors who thought that managers try to hide errors in the
financial statements (0.20 compared to 0.06, two-tailed p=0.01), and marginally true for
auditors who thought that managers may try to distract auditors with more easily
detectable errors (0.28 compared to 0.12, two-tailed p=0.13).
Auditor Skepticism
A principal components analysis indicated that these four statements all load onto
the same general construct (all received component scores >0.5). All of the statements
appear to relate to professional skepticism (Cronbach alpha=0.72), and are listed in Table
4.10. As such, I used these responses to create a professional skepticism composite
score (mean response to the four statements) for each auditor, and divided the auditors
using a midpoint split. Auditors who were above the midpoint generally agreed with the
statements and, thus, were considered to be more skeptical, while those who were below
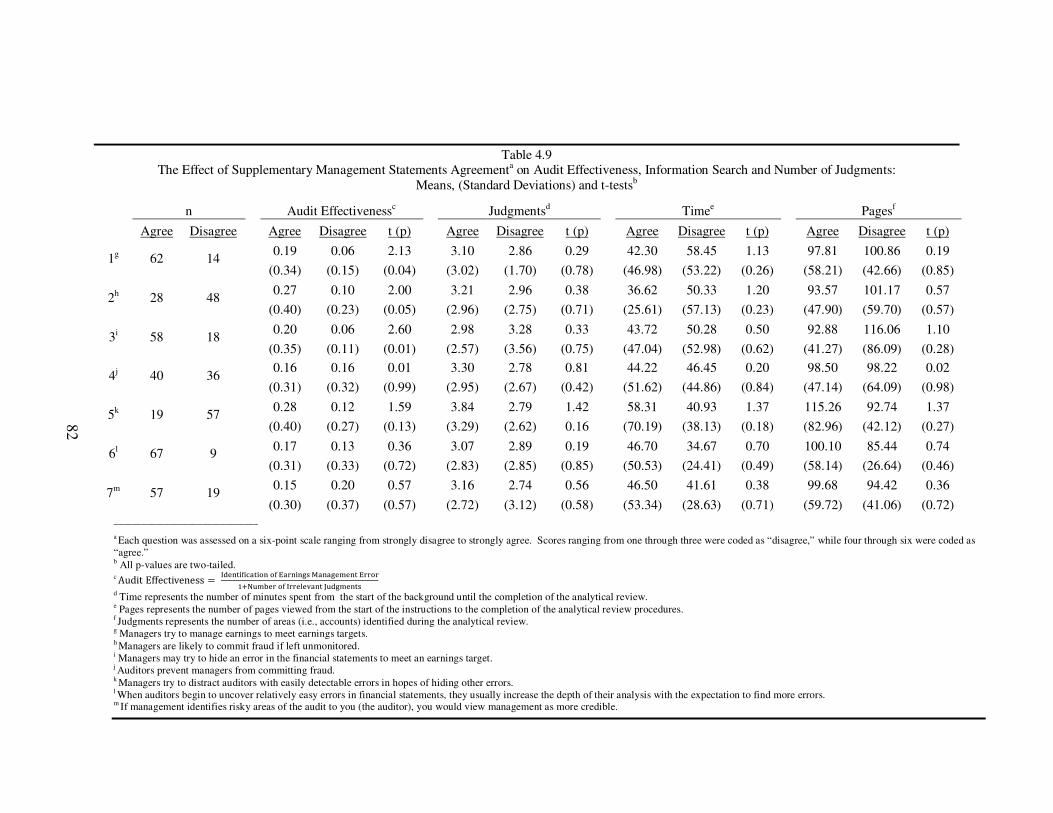
Table 4.9 The Effect of Supplementary Management Statements Agreementa on Audit Effectiveness, Information Search and Number of Judgments:
Means, (Standard Deviations) and t-testsb
n
Audit Effectivenessc
Judgmentsd
Timee
Pagesf
Agree Disagree
Agree Disagree t (p)
Agree Disagree t (p)
Agree Disagree t (p)
Agree Disagree t (p)
1g 62 14 0.19 0.06 2.13
3.10 2.86 0.29
42.30 58.45 1.13
97.81 100.86 0.19
(0.34) (0.15) (0.04)
(3.02) (1.70) (0.78)
(46.98) (53.22) (0.26)
(58.21) (42.66) (0.85)
2h 28 48 0.27 0.10 2.00
3.21 2.96 0.38
36.62 50.33 1.20
93.57 101.17 0.57
(0.40) (0.23) (0.05)
(2.96) (2.75) (0.71)
(25.61) (57.13) (0.23)
(47.90) (59.70) (0.57)
3i 58 18 0.20 0.06 2.60
2.98 3.28 0.33
43.72 50.28 0.50
92.88 116.06 1.10
(0.35) (0.11) (0.01)
(2.57) (3.56) (0.75)
(47.04) (52.98) (0.62)
(41.27) (86.09) (0.28)
4j 40 36 0.16 0.16 0.01
3.30 2.78 0.81
44.22 46.45 0.20
98.50 98.22 0.02
(0.31) (0.32) (0.99)
(2.95) (2.67) (0.42)
(51.62) (44.86) (0.84)
(47.14) (64.09) (0.98)
5k 19 57 0.28 0.12 1.59
3.84 2.79 1.42
58.31 40.93 1.37
115.26 92.74 1.37
(0.40) (0.27) (0.13)
(3.29) (2.62) 0.16
(70.19) (38.13) (0.18)
(82.96) (42.12) (0.27)
6l 67 9 0.17 0.13 0.36
3.07 2.89 0.19
46.70 34.67 0.70
100.10 85.44 0.74
(0.31) (0.33) (0.72)
(2.83) (2.85) (0.85)
(50.53) (24.41) (0.49)
(58.14) (26.64) (0.46)
7m 57 19 0.15 0.20 0.57
3.16 2.74 0.56
46.50 41.61 0.38
99.68 94.42 0.36
(0.30) (0.37) (0.57)
(2.72) (3.12) (0.58)
(53.34) (28.63) (0.71)
(59.72) (41.06) (0.72)
_______________________________
a Each question was assessed on a six-point scale ranging from strongly disagree to strongly agree. Scores ranging from one through three were coded as “disagree,” while four through six were coded as “agree.” b All p-values are two-tailed. c Audit Effectiveness =
I�����f������� �� E������� M��������� E����
!N#�$�� �� I���%�&��� J#�������
d Time represents the number of minutes spent from the start of the background until the completion of the analytical review. e Pages represents the number of pages viewed from the start of the instructions to the completion of the analytical review procedures. f Judgments represents the number of areas (i.e., accounts) identified during the analytical review. g Managers try to manage earnings to meet earnings targets. h Managers are likely to commit fraud if left unmonitored. i Managers may try to hide an error in the financial statements to meet an earnings target. j Auditors prevent managers from committing fraud. k Managers try to distract auditors with easily detectable errors in hopes of hiding other errors. l When auditors begin to uncover relatively easy errors in financial statements, they usually increase the depth of their analysis with the expectation to find more errors. m If management identifies risky areas of the audit to you (the auditor), you would view management as more credible.
82
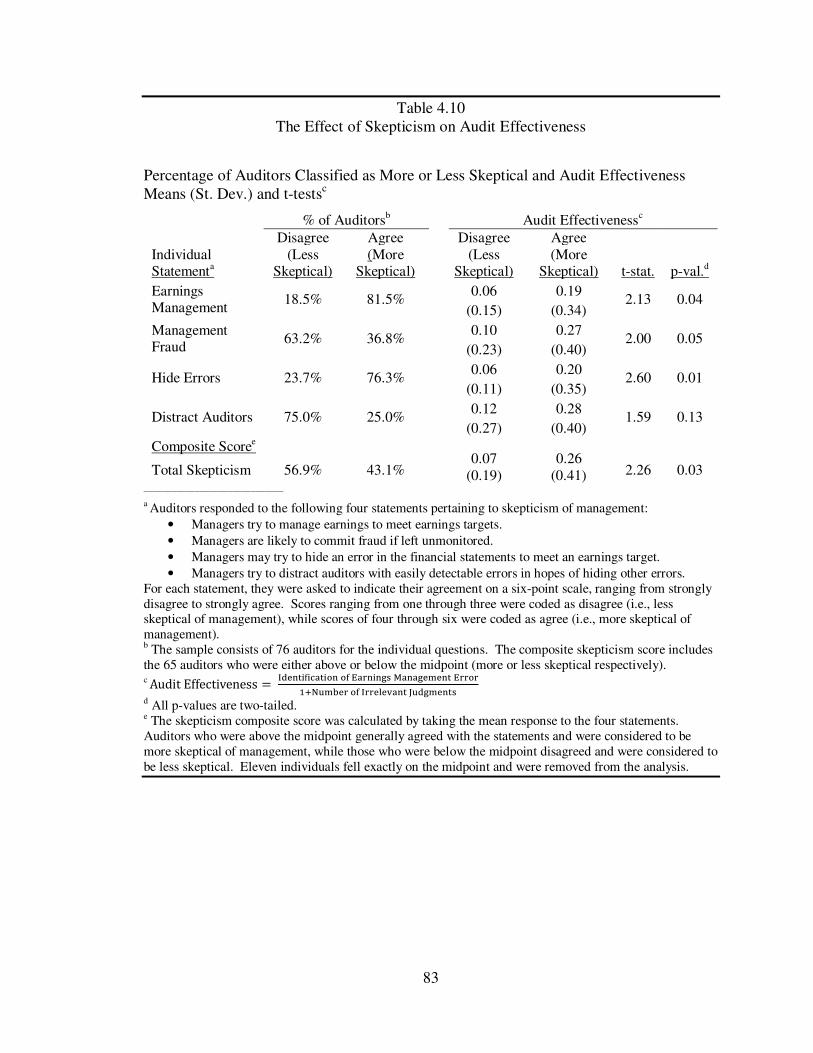
83
Table 4.10 The Effect of Skepticism on Audit Effectiveness
Percentage of Auditors Classified as More or Less Skeptical and Audit Effectiveness Means (St. Dev.) and t-testsc
% of Auditorsb Audit Effectivenessc
Individual Statementa
Disagree (Less
Skeptical)
Agree (More
Skeptical)
Disagree (Less
Skeptical)
Agree (More
Skeptical) t-stat. p-val.d
Earnings Management
18.5% 81.5% 0.06 0.19
2.13 0.04
(0.15) (0.34)
Management Fraud
63.2% 36.8% 0.10 0.27
2.00 0.05
(0.23) (0.40)
Hide Errors
23.7% 76.3% 0.06 0.20
2.60 0.01
(0.11) (0.35)
Distract Auditors
75.0% 25.0% 0.12 0.28
1.59 0.13
(0.27) (0.40)
Composite Scoree
0.07 0.26
Total Skepticism 56.9% 43.1% 2.26 0.03
(0.19) (0.41) ______________________________
a Auditors responded to the following four statements pertaining to skepticism of management:
• Managers try to manage earnings to meet earnings targets.
• Managers are likely to commit fraud if left unmonitored.
• Managers may try to hide an error in the financial statements to meet an earnings target.
• Managers try to distract auditors with easily detectable errors in hopes of hiding other errors. For each statement, they were asked to indicate their agreement on a six-point scale, ranging from strongly disagree to strongly agree. Scores ranging from one through three were coded as disagree (i.e., less skeptical of management), while scores of four through six were coded as agree (i.e., more skeptical of management). b The sample consists of 76 auditors for the individual questions. The composite skepticism score includes the 65 auditors who were either above or below the midpoint (more or less skeptical respectively). c Audit Effectiveness =
I�����f������� �� E������� M��������� E����
!N#�$�� �� I���%�&��� J#�������
d All p-values are two-tailed. e The skepticism composite score was calculated by taking the mean response to the four statements. Auditors who were above the midpoint generally agreed with the statements and were considered to be more skeptical of management, while those who were below the midpoint disagreed and were considered to be less skeptical. Eleven individuals fell exactly on the midpoint and were removed from the analysis.
84
the midpoint generally disagreed and were considered to be less skeptical.20
As can be seen, the majority of auditors agreed that managers try to manage
earnings and will hide errors to meet earnings targets (81.5% and 76.3% agreed,
respectively). On the other hand, most auditors disagreed that managers will commit
fraud and use errors to distract auditors (63.2% and 75.0% disagreed, respectively). It
appears that auditors are generally skeptical of management with respect to managing
earnings, but not to the point where they think managers would act in a fraudulent or
overtly deceitful manner.
The overall composite score indicates that 43.1% of auditors were on the skeptical
side of the scale, while 56.9% were considered less skeptical. While auditors are trained
to practice professional skepticism, there appears to be a difference in the degree of
skepticism held by auditors. The question therefore arises; Are auditors who are more
skeptical more likely to question management’s motives, dig further in to the data and
perform better at detecting managed earnings? The composite score in Table 4 indicates
that more skeptical auditors had greater audit effectiveness scores than those who were
not as skeptical (0.26 compared to 0.07, two-tailed p=0.03), providing evidence that
skeptical auditors are more likely to discover managed earnings.21 Auditors’ agreement
20 Sixty-five auditors were classified as either skeptical or not skeptical after dichotomizing the skepticism composite score. Eleven auditors scored exactly on the midpoint (3.5) and were removed from analyses employing this measure of skepticism. Those classified as more skeptical had an average composite score of 4.2, which was significantly different than the 2.9 score for those classified as less skeptical (two-tailed p<0.01). Furthermore, more skeptical auditors were more in agreement with each individual skepticism statement than less skeptical auditors (all two-tailed p-values<0.01). 21 When I added the skepticism score as a covariate to the audit efficiency score ANOVA, the covariate was significant at p=0.01, and the interaction between baiting
85
to each individual statement generally yielded similar results. Specifically, those who
agreed with the statements concerning earnings management, management fraud and
hiding errors had higher audit effectiveness than those who disagreed (two-tailed p-
values=0.04, 0.05 and 0.01 respectively).
Table 4.11 provides evidence on whether skepticism affects an auditor’s ability to
identify the earnings management error across the different number of irrelevant
judgments listed by the auditors (similar to Table 4.4). As can be seen, more skeptical
auditors performed significantly better than less skeptical auditors at identifying the
earnings management error across most levels of irrelevant judgments. In fact, the more
skeptical auditors were nearly twice as likely to identify the error as compared to less
skeptical auditors, and the significance level was p≤ 0.06 for all analyses that included
fewer than eleven irrelevant judgments. These data suggest a means to potentially
mitigate a client’s ability to hide earnings manage errors. Differences exist in the level of
skepticism reported across auditors, and more skeptical auditors are better at identifying
managed earnings. As a result, while auditors are trained to practice skepticism, there
seems to be an opportunity for enhanced training on professional skepticism, which
could, in turn, make them more effective at detecting managed earnings.
tactics was significant at p=0.086. Furthermore, there were no differences in level of skepticism between baiting tactic conditions (p=0.74).

86
Table 4.11 The Effect of Skepticism on the Identification of the Earnings Management Error:
Sensitivity to the Number of Irrelevant Judgmentsa
Irrelevant n Identified Error
Judgments Includedb
Less Skeptical
More Skeptical
Less Skeptical
More Skeptical χ
2 p-valuec
All 37 28
21.6% 39.3% 2.40 0.12
< 13 37 27
21.6% 40.7% 2.73 0.10
< 12 37 27
21.6% 40.7% 2.73 0.10
< 11 36 27
19.4% 40.7% 3.43 0.06
< 10 36 27
19.4% 40.7% 3.43 0.06
< 9 36 27
19.4% 40.7% 3.43 0.06
< 8 36 27
19.4% 40.7% 3.43 0.06
< 7 34 27
17.6% 40.7% 3.99 0.05
< 6 34 25 17.6% 40.0% 3.64 0.06
< 5 33 23 15.2% 39.1% 4.16 0.04
< 4 31 22 12.9% 36.4% 4.04 0.04
< 3 27 20 14.8% 40.0% 3.83 0.05
< 2 20 15
5.0% 40.0% 6.56 0.01
None 10 13
10.0% 46.2% 3.49 0.06 ____________________ a The composite measure of auditor skepticism was created by taking the mean response to the four management statements on skepticism (each was on a six-point scale). Auditors who were above the midpoint (3.5) were labeled as more skeptical, while auditors below the midpoint were labeled as less skeptical. Eleven individuals had composite skepticism scores at the midpoint and were removed from the analysis. Individual responses were coded correct (1) if any of the judgments identified the affected accounts, the word compensation or appropriate synonym, and incorrect (0) otherwise. b An irrelevant judgment relates to an error-free area that an auditor identified as possibly containing an error. c All p-values are two-tailed.
87
Summary of Analyses
In summary, diversionary statements and distracting errors appear to have an
interactive effect on an auditor’s ability to discover managed earnings in other areas of
the financial statement. Specifically, when auditors were alerted to risky accounts that
were ultimately error free, they were unlikely to identify the earnings management error.
However, when auditors were overtly led to accounts that contained errors,
management’s attempt to manage earnings actually backfired, as receiving this tactic
actually made auditors more likely to discover the earnings management error.22 I
created a measure of audit effectiveness to account for the number of irrelevant
judgments, which increases an auditor’s ability to discover the earnings management
error but does so with a cost of diluting the amount of time to follow-up across the
several irrelevant errors. Even still, when I looked at the identification of the earnings
management error, the results held in the presence of several irrelevant judgments.
The diversionary statement not only influenced the effectiveness of the audit, but
it also caused inefficiencies as well. That is, despite performing the worst, those in the
diversionary statement only group took more time, and those who found the earnings
management error had to look at more pages and list more judgments to effectively find
the earnings management error. Furthermore, when diversionary statements were
present, the earnings management error was discovered later relative to other judgments
listed.
22 It is possible that the results are caused by the simple presence of both baiting tactics and not the fact that the diversionary statement pointed to the distracting errors. As such, future research may wish to examine the effect of a diversionary statement that leads to one area when distracting errors are seeded in another.
88
Finally, while need for closure differences generally did not moderate this effect
(with the exception of those who were more open-minded), being more skeptical of
management did. That is, auditors who thought managers try to manage earnings, were
likely to commit fraud and attempt to deceive the auditor performed much better at
discovering the managed earnings than those who did not. This suggests that even
though auditors are trained to practice professional skepticism, audit firms have an
opportunity to further this education, which might make auditors conduct more effective
audits.
89
CHAPTER 5
CONCLUSIONS
This study examined the impact of baiting tactics on an auditor’s ability to
uncover earnings management errors. Professional auditors completed an analytical
review on the financial information of a client that contained an earnings management
error (i.e., an intentional error that resulted in the client meeting an earnings target). I
manipulated the presence of two baiting tactics: a diversionary statement (management
of the company alerting the auditor to risk in another area of the financial statements) and
distracting errors (seeding in off-setting, easy-to-detect errors in those other areas). In
doing so, I investigated whether management can influence the effectiveness of auditor
judgments and overall audit quality.
The results suggest that diverting auditors to a clean set of accounts (i.e., error-
free) significantly reduces the likelihood that they will identify an error elsewhere in the
financial statements. On the other hand, diverting an auditor’s attention to accounts that
contain errors may actually backfire on management and increase the likelihood that the
auditor will detect errors elsewhere in the statements. Finally, distracting errors without
diversionary statements appear to have no effect on the auditor’s error detection rate.
In general, certain baiting tactics seem to be effective, while others may backfire.
Specifically, if auditors are alerted of risk in accounts that turn out to be clean, they are
much less effective at uncovering managed earnings in other areas, indicating that this
tactic might be advantageous for clients to use. On the other hand, if auditors are alerted
to risk in accounts that actually contain errors, then auditors actually perform better at
identifying managed earnings, indicating that this tactic is not only ineffective, but it may
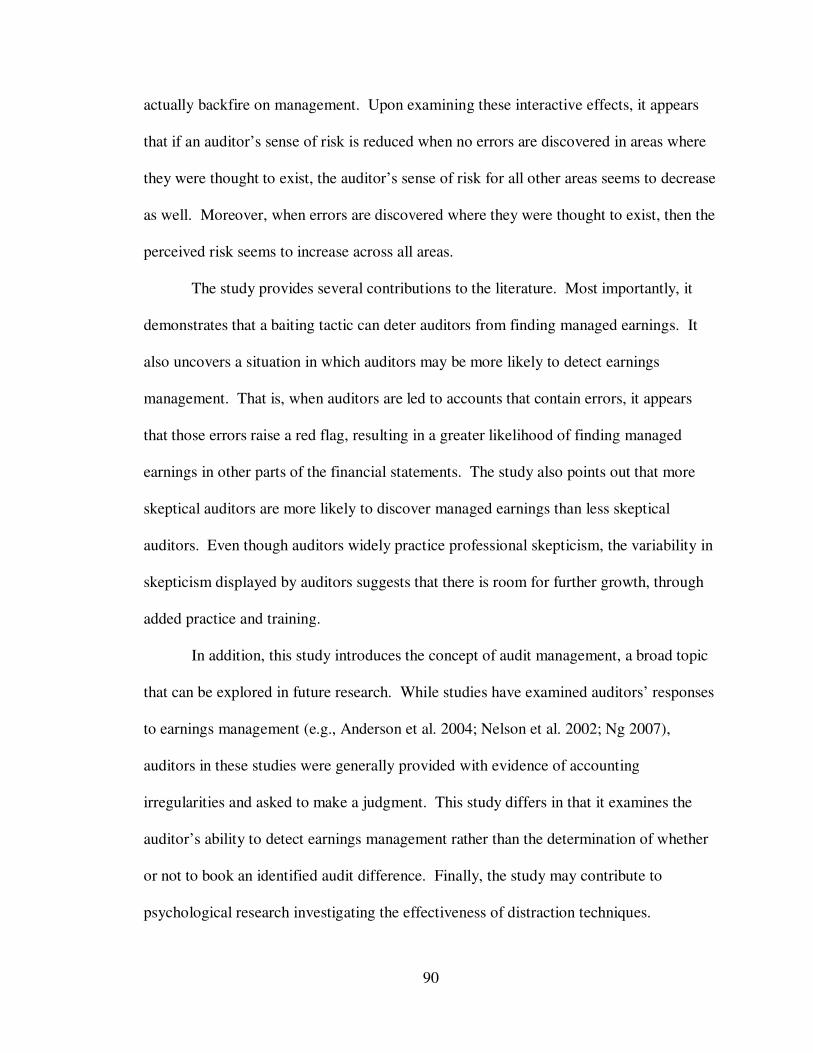
90
actually backfire on management. Upon examining these interactive effects, it appears
that if an auditor’s sense of risk is reduced when no errors are discovered in areas where
they were thought to exist, the auditor’s sense of risk for all other areas seems to decrease
as well. Moreover, when errors are discovered where they were thought to exist, then the
perceived risk seems to increase across all areas.
The study provides several contributions to the literature. Most importantly, it
demonstrates that a baiting tactic can deter auditors from finding managed earnings. It
also uncovers a situation in which auditors may be more likely to detect earnings
management. That is, when auditors are led to accounts that contain errors, it appears
that those errors raise a red flag, resulting in a greater likelihood of finding managed
earnings in other parts of the financial statements. The study also points out that more
skeptical auditors are more likely to discover managed earnings than less skeptical
auditors. Even though auditors widely practice professional skepticism, the variability in
skepticism displayed by auditors suggests that there is room for further growth, through
added practice and training.
In addition, this study introduces the concept of audit management, a broad topic
that can be explored in future research. While studies have examined auditors’ responses
to earnings management (e.g., Anderson et al. 2004; Nelson et al. 2002; Ng 2007),
auditors in these studies were generally provided with evidence of accounting
irregularities and asked to make a judgment. This study differs in that it examines the
auditor’s ability to detect earnings management rather than the determination of whether
or not to book an identified audit difference. Finally, the study may contribute to
psychological research investigating the effectiveness of distraction techniques.
91
Limitations
One potential limitation of this study is its task realism. As with all experimental
research, I held constant many important variables that auditors would experience in
practice. To compensate for this, I created an instrument of considerable depth to make
the task more realistic, while still manipulating only the two baiting tactics.
A second potential limitation is the method in which the study was administered.
Since I used professional auditors, it was necessary to have them complete the analytical
review on their own time. As a result, I was not able to create a laboratory-like setting
where all participants completed the study in a controlled environment. As such, even
though participants were instructed to complete this independently and in one sitting
(without interruption), I could not monitor their progress to ensure all of the guidelines
were followed. At the same time, had I conducted the experiment as part of a large group
(i.e., in a classroom), I would not have been able to use experienced auditors, which is
necessary for a task such as this.
A third potential limitation may be the timing of the experiment. The study was
conducted toward the end of 2008 and beginning of 2009, shortly after the failures of
several banks and at the beginning of what appears to be a lengthy economic recession.
As such, auditors may have had a heightened awareness of risk during this time and may
have reacted differently to information than they would have when the economy is stable.
Suggestions for Future Research
This study is exploratory in nature and leaves open several possible avenues for
future research. First, the interactive effects found are consistent with certain tactics
either abating or intensifying an auditor’s misstatement risk. As such, future research

92
may seek to further examine how an auditor’s assessed level of risk affects their ability to
discover managed earnings. In addition, an examination as to what specifically affects an
auditor’s risk assessments may be fruitful for audit literature.
Furthermore, the findings suggest that auditors may be more effective at overall
error detection when they are diverted to accounts containing actual errors. Exploring
deeper into the causes of this group’s heightened performance may result in a common
variable that make auditors more likely to discover managed earnings, thereby making
them more effective when examining financial statements. As such, future research can
examine other factors that influence the effectiveness of the baiting tactics investigated
here.
This study specifically employed a type of earnings management that resulted
from the client departing from GAAP (i.e., illegally manipulating income). I chose this
type of reporting to increase variability in detection of the managed earnings. However, I
argue that these tactics transcend various types of earnings management (both within and
outside the rules of GAAP). Future research may explore other methods of earnings
management, and whether or not baiting tactics will affect their detection.
Finally, this dissertation discussed a term called “audit management,” a
phenomenon that is relatively unexplored in the accounting literature. Future research
may examine other ways that clients try to prevent auditors from effectively discovering
managed earnings. Field studies could identify specific tactics that management uses,
and experimental research (like this study) could investigate their impact. In doing so,
both the academic and professional communities could benefit immensely from future
work in this area. By learning which tactics are effective, researchers can further

93
understand how professional auditors make decisions and, more specifically, how biases
found in psychology affect auditors. Professionals, on the other hand, could benefit by
learning about the gaps or inefficiencies in their judgments, which could then be
mitigated through additional training.
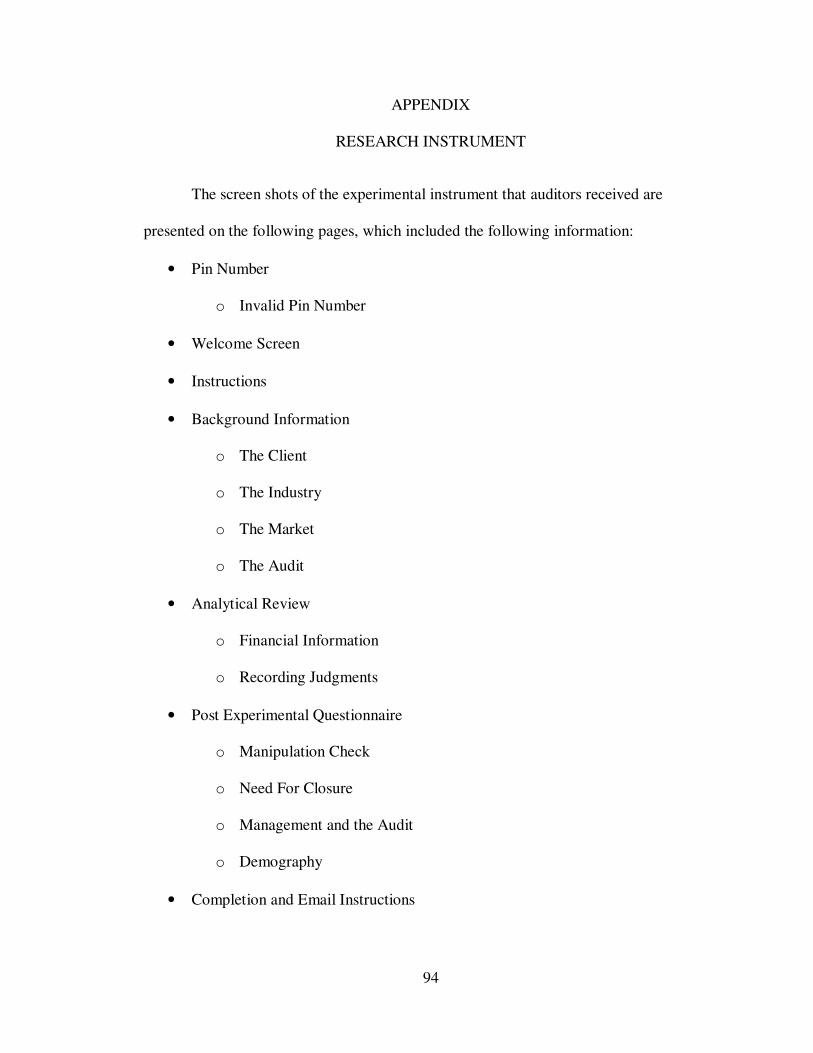
94
APPENDIX
RESEARCH INSTRUMENT
The screen shots of the experimental instrument that auditors received are
presented on the following pages, which included the following information:
• Pin Number
o Invalid Pin Number
• Welcome Screen
• Instructions
• Background Information
o The Client
o The Industry
o The Market
o The Audit
• Analytical Review
o Financial Information
o Recording Judgments
• Post Experimental Questionnaire
o Manipulation Check
o Need For Closure
o Management and the Audit
o Demography
• Completion and Email Instructions
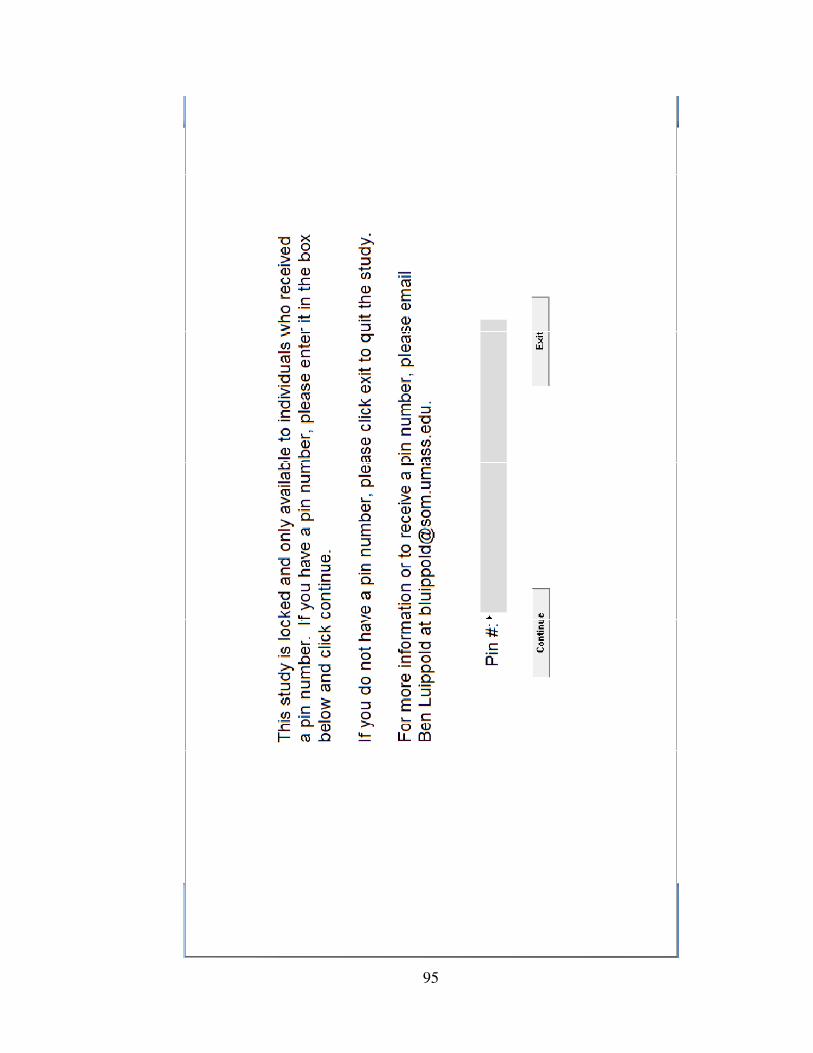
95

96
97
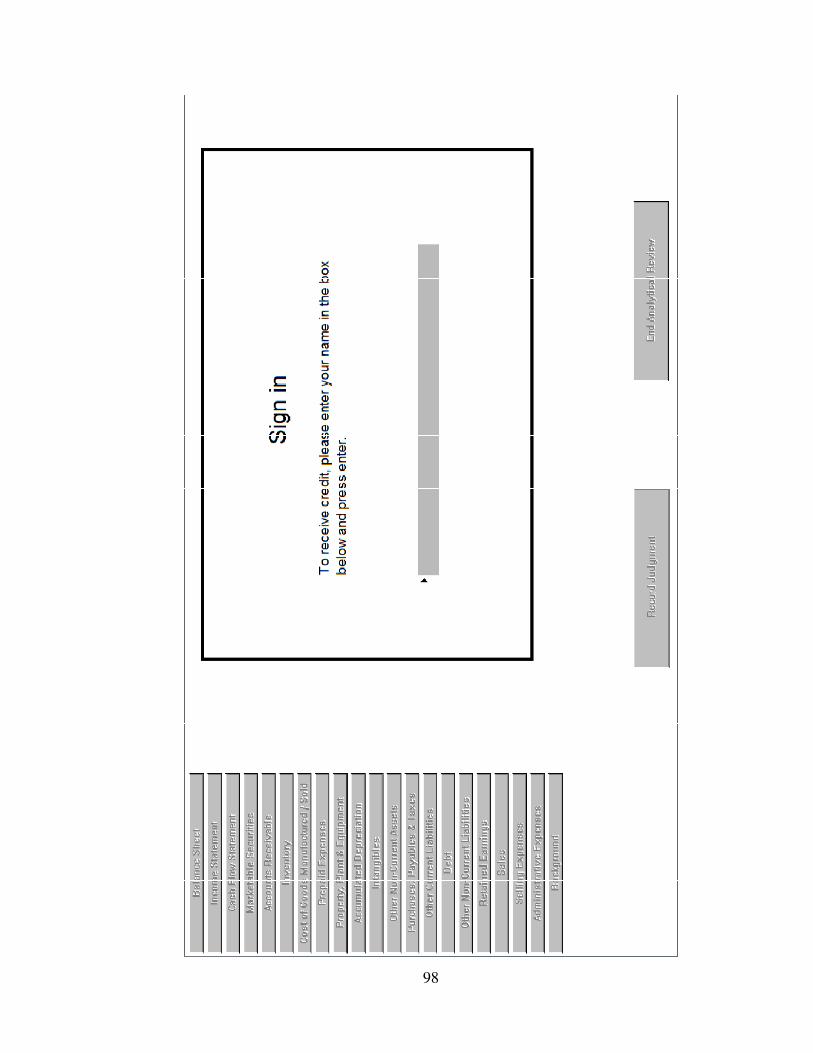
98
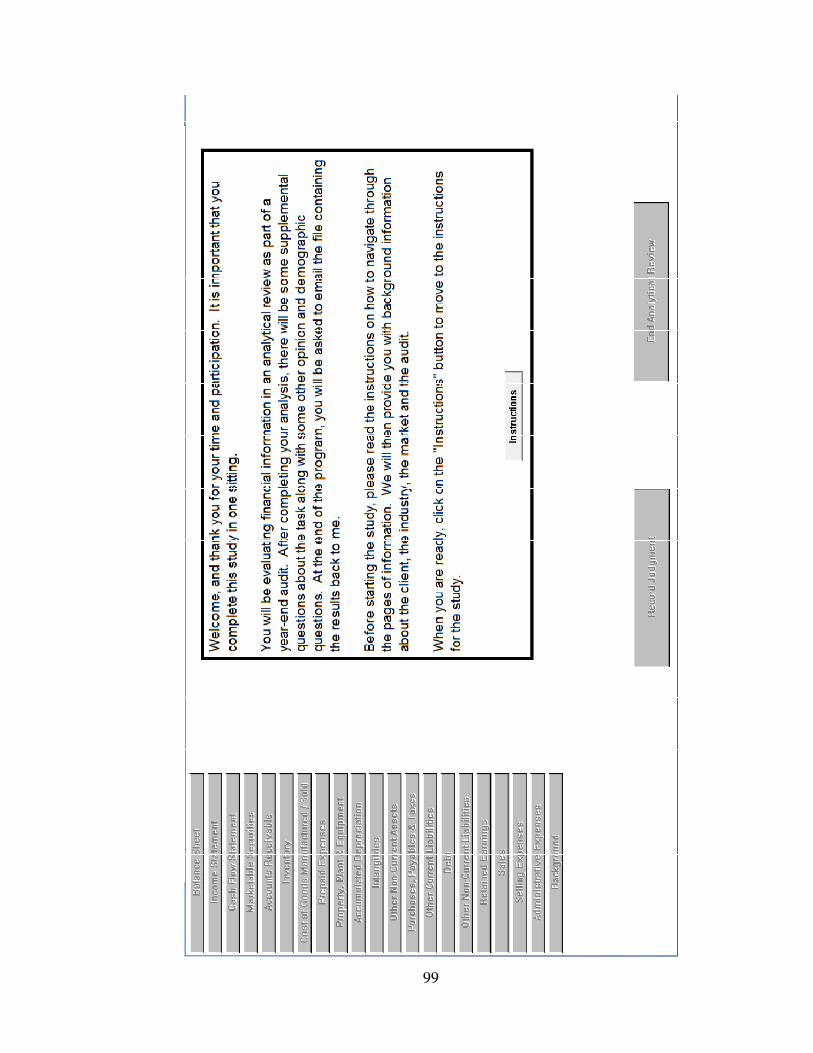
99
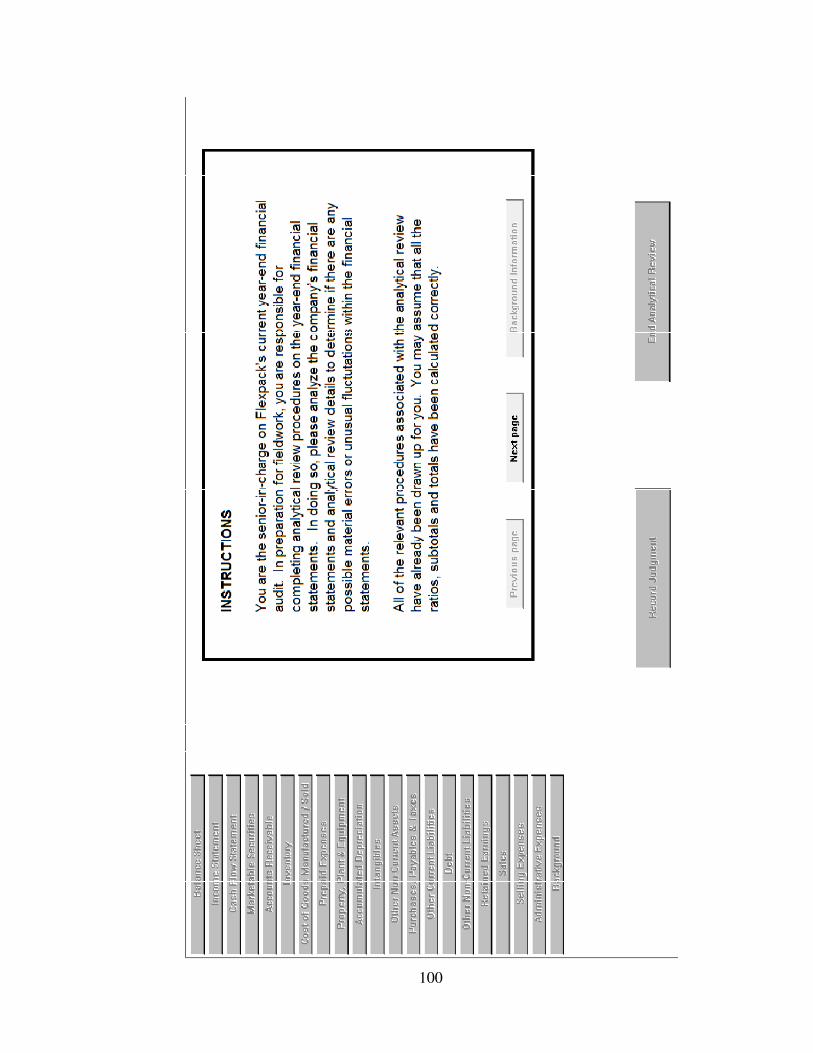
100
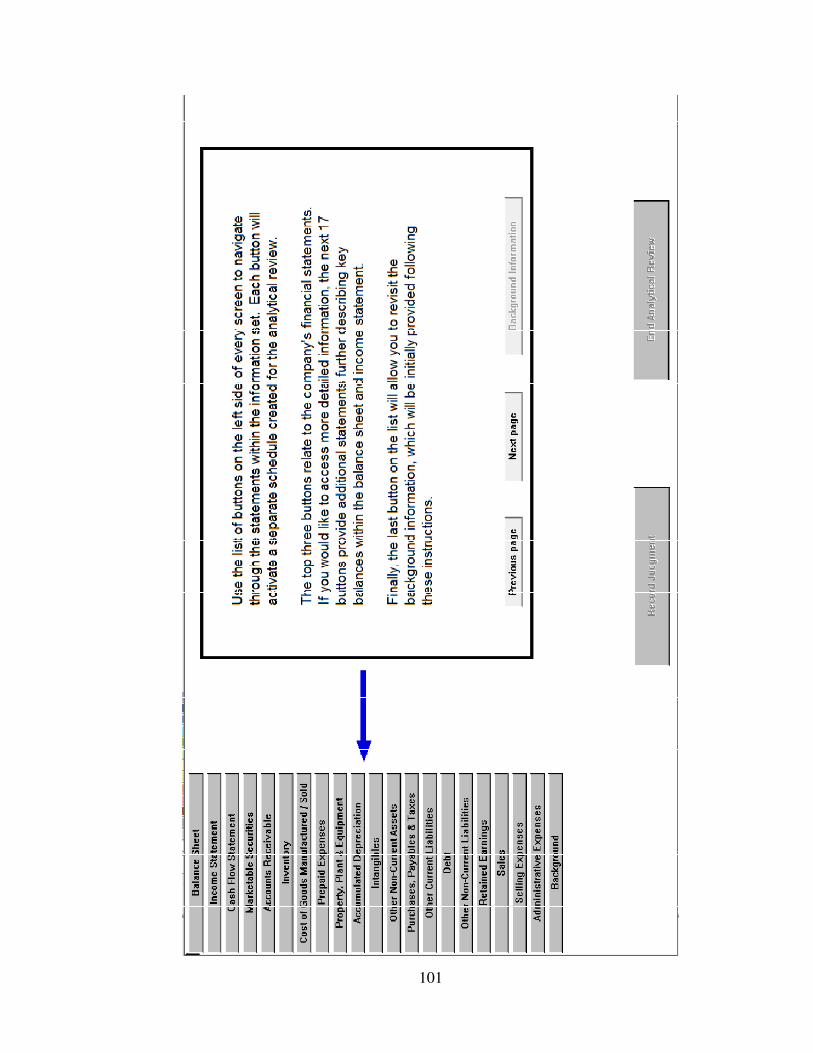
101
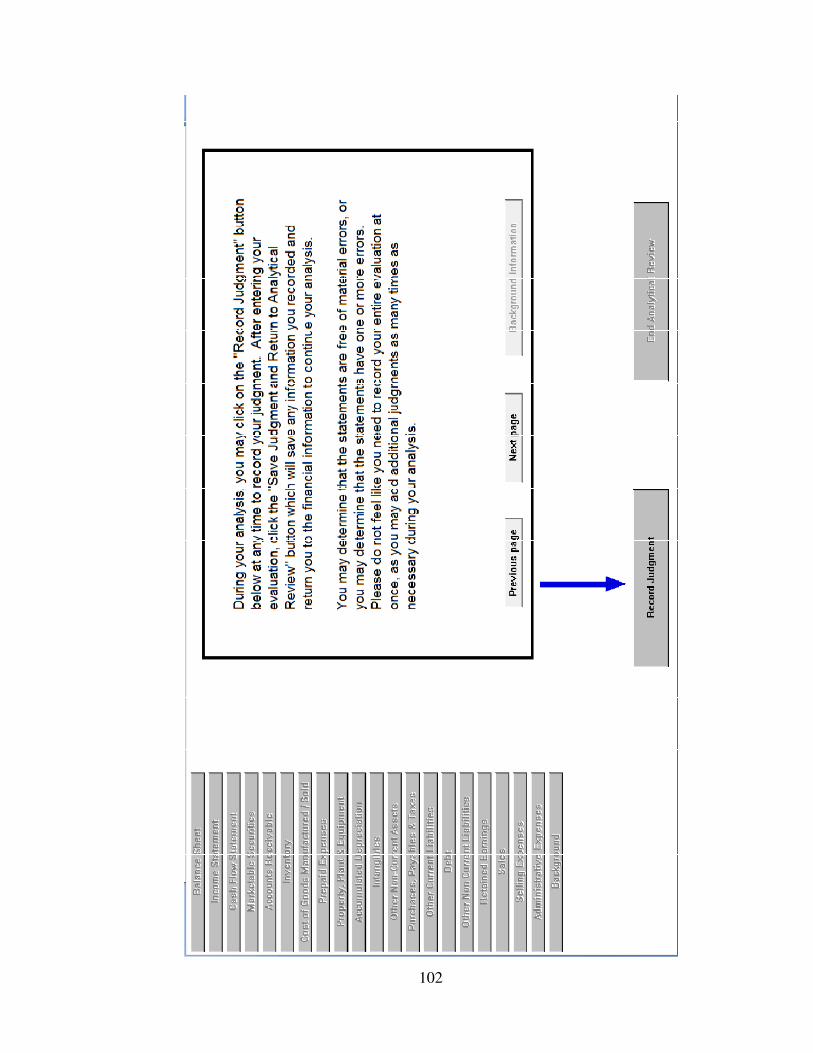
102
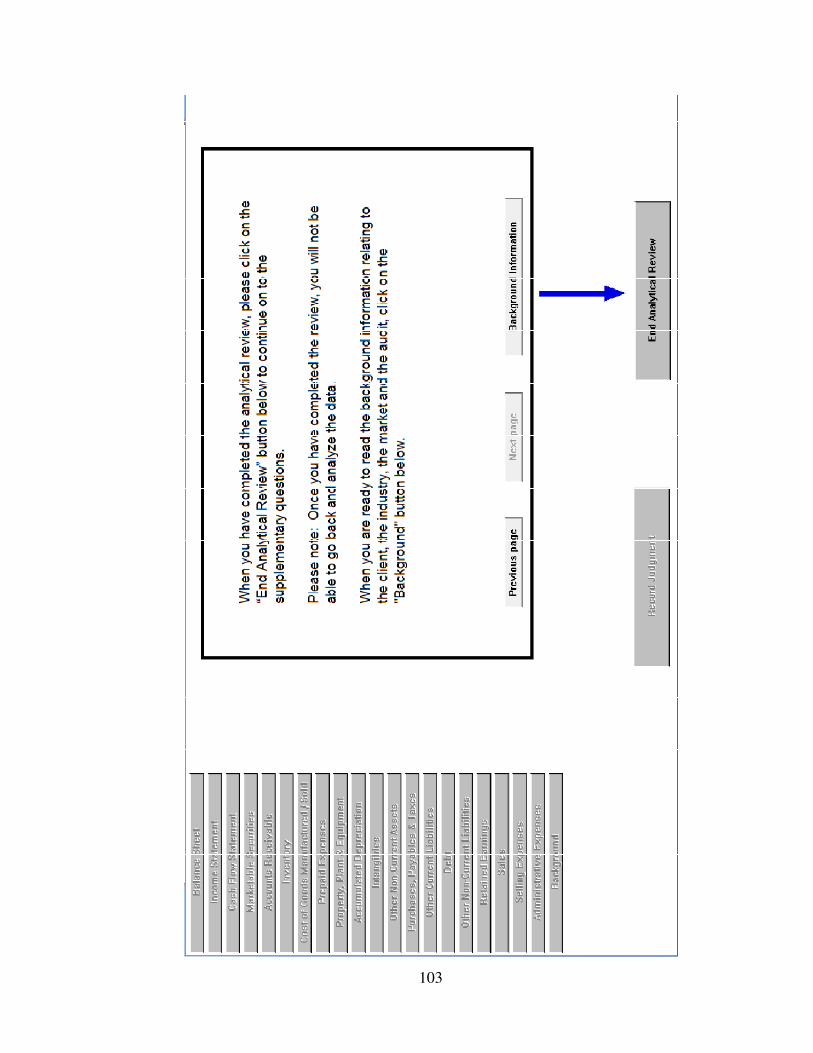
103
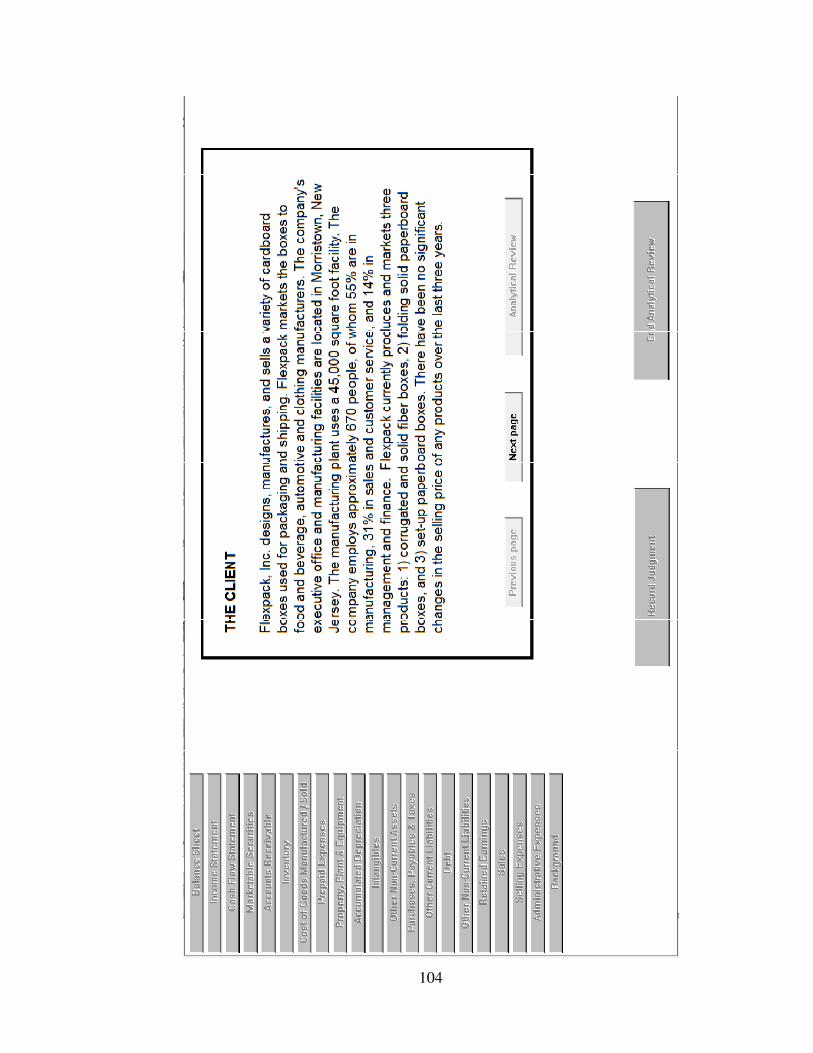
104
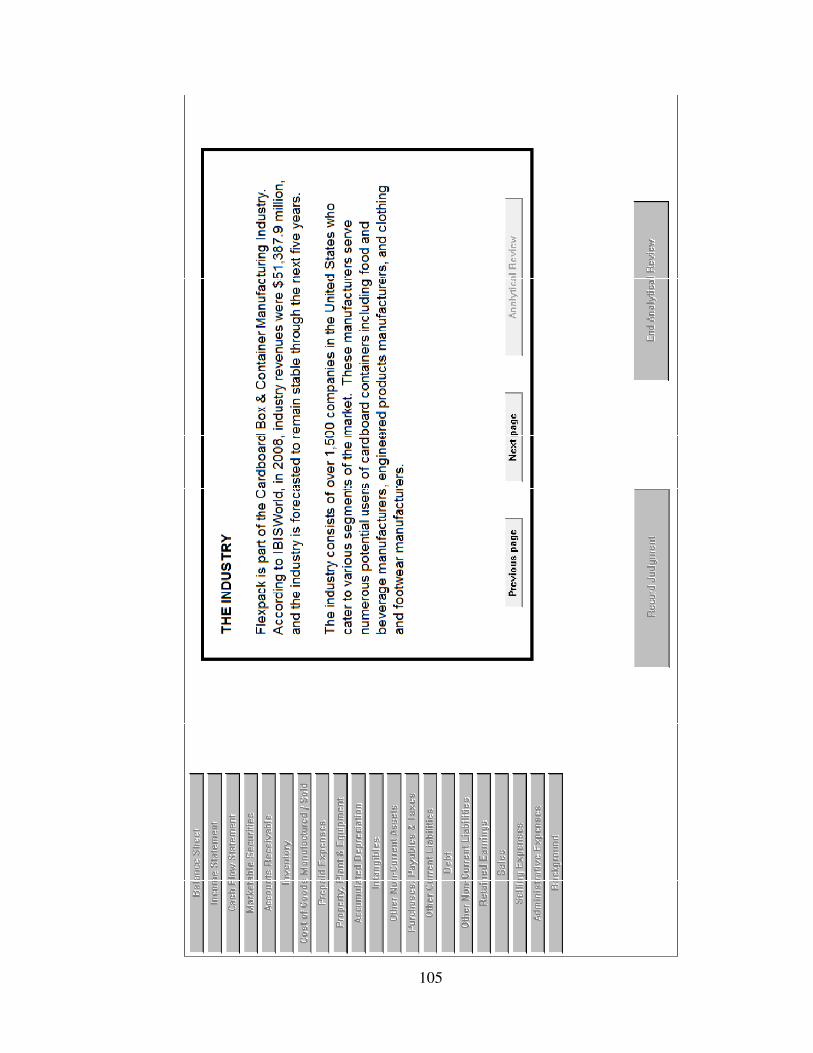
105
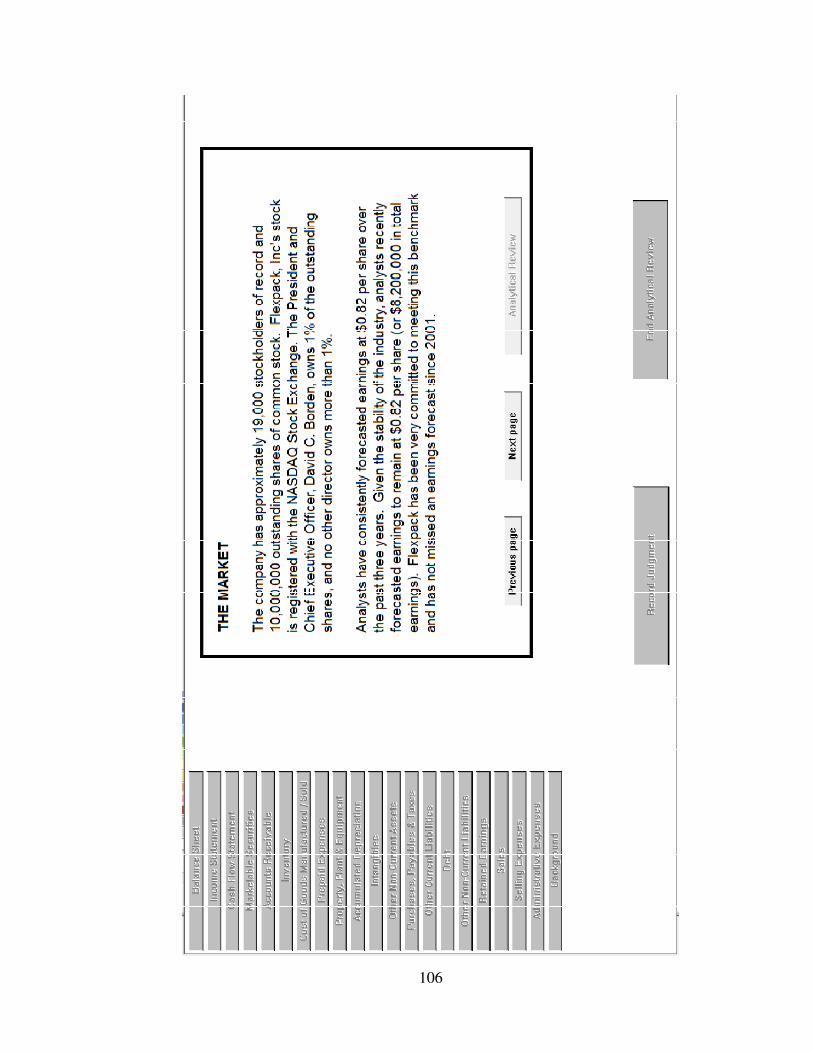
106

107
This paragraph is omitted in the No Diversionary Statement condition.
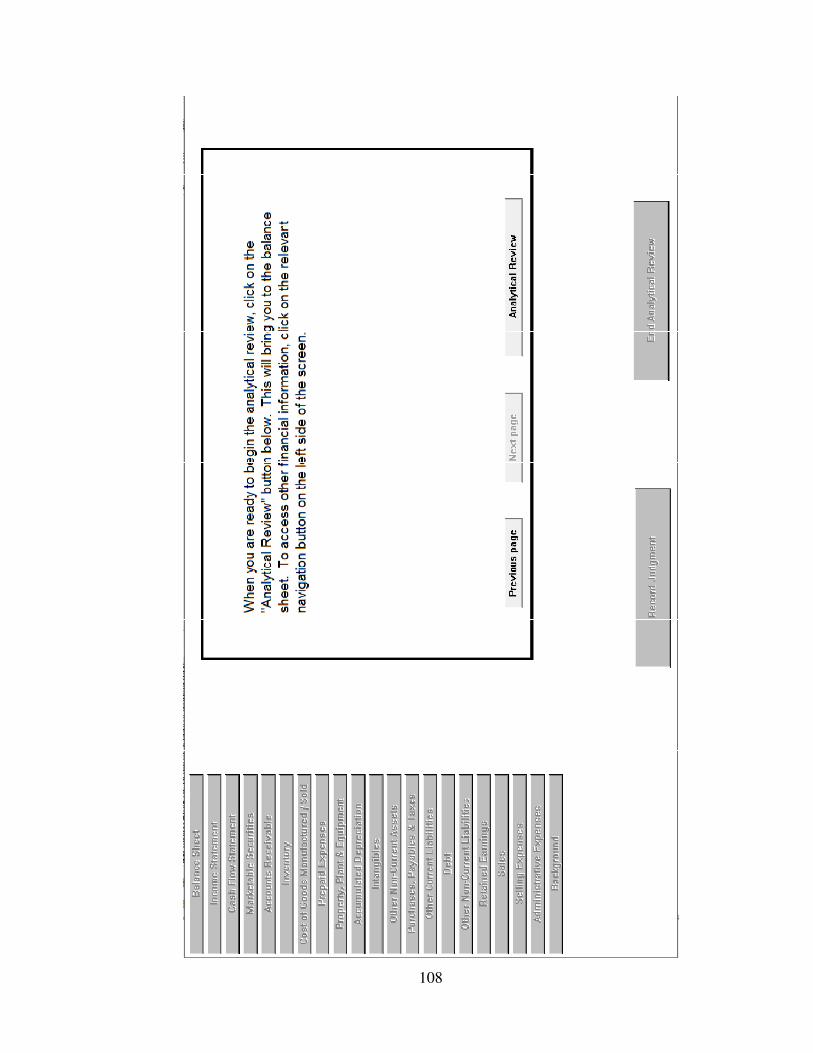
108
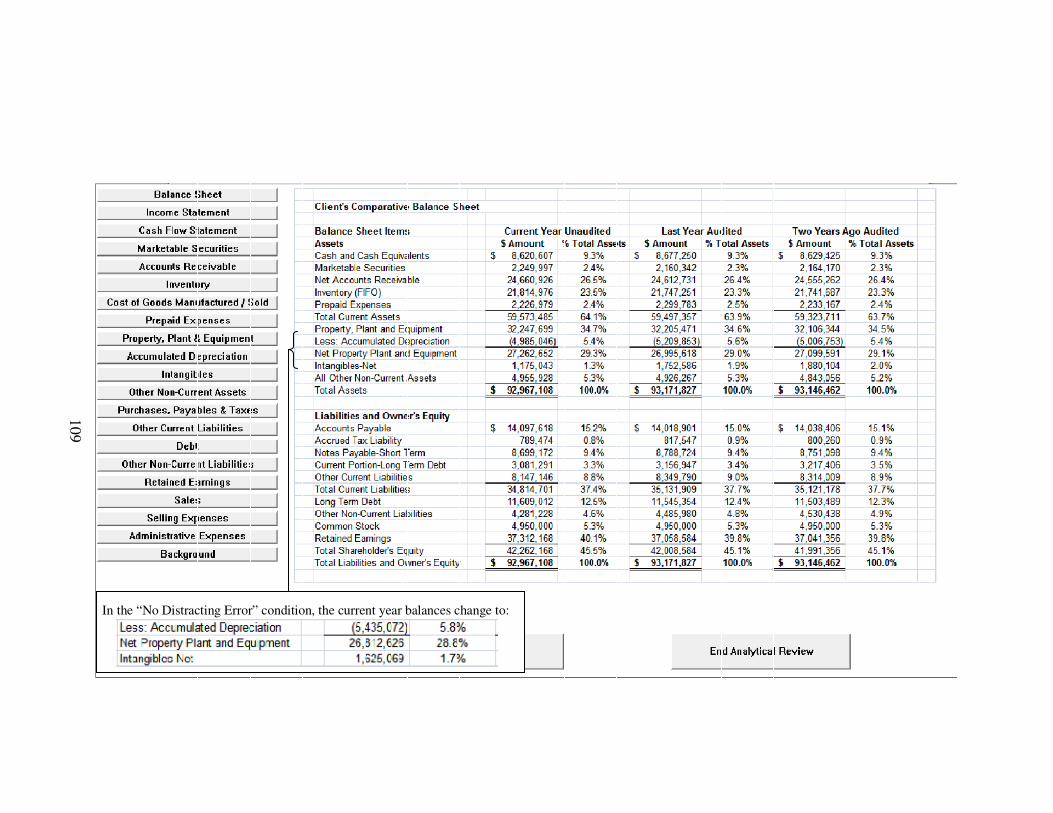
109
In the “No Distracting Error” condition, the current year balances change to:
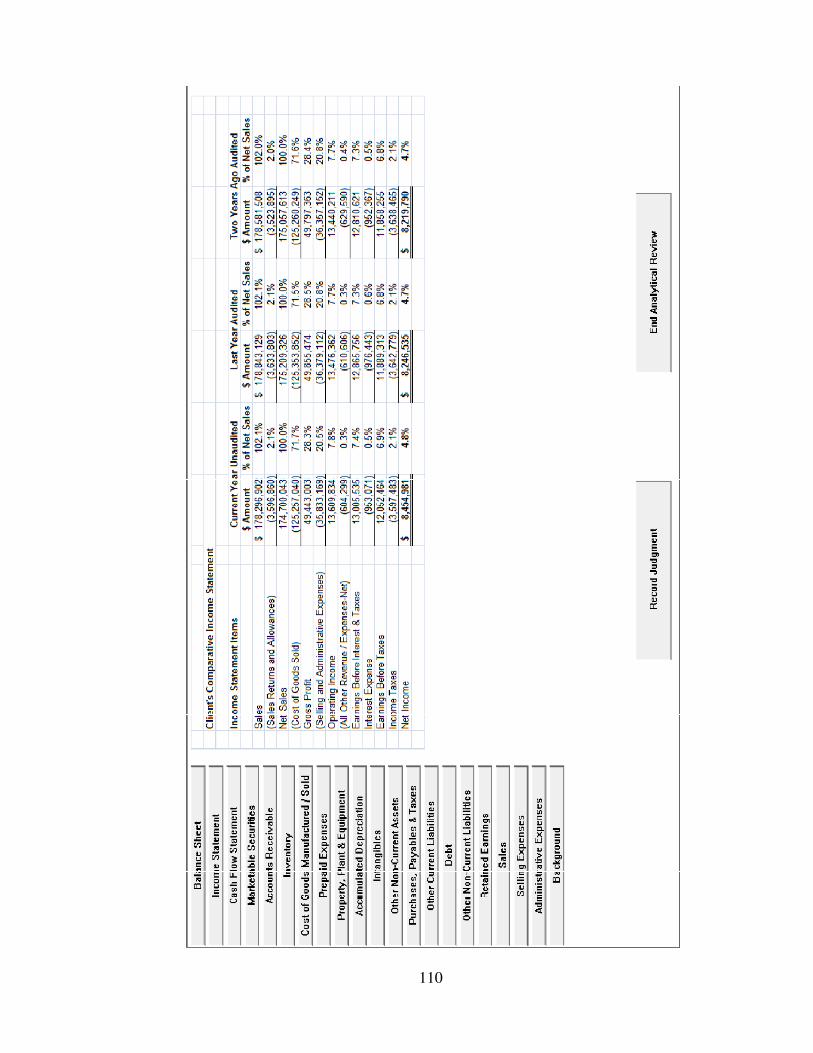
110
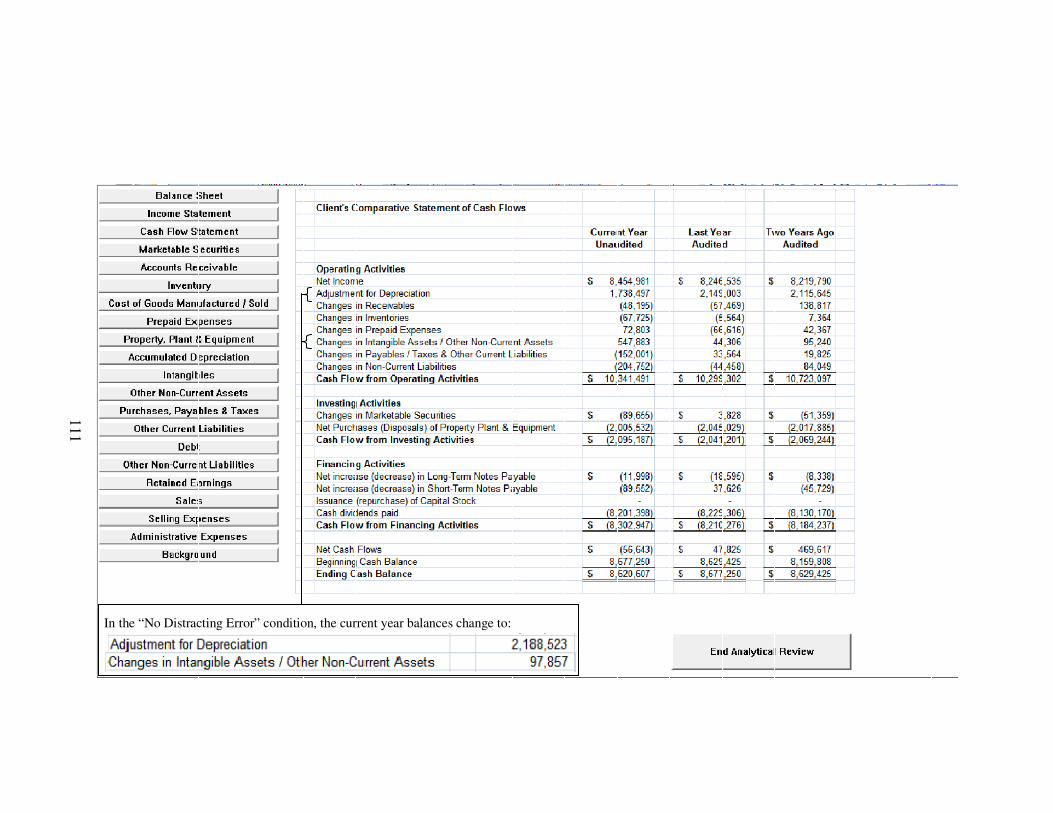
111
In the “No Distracting Error” condition, the current year balances change to:
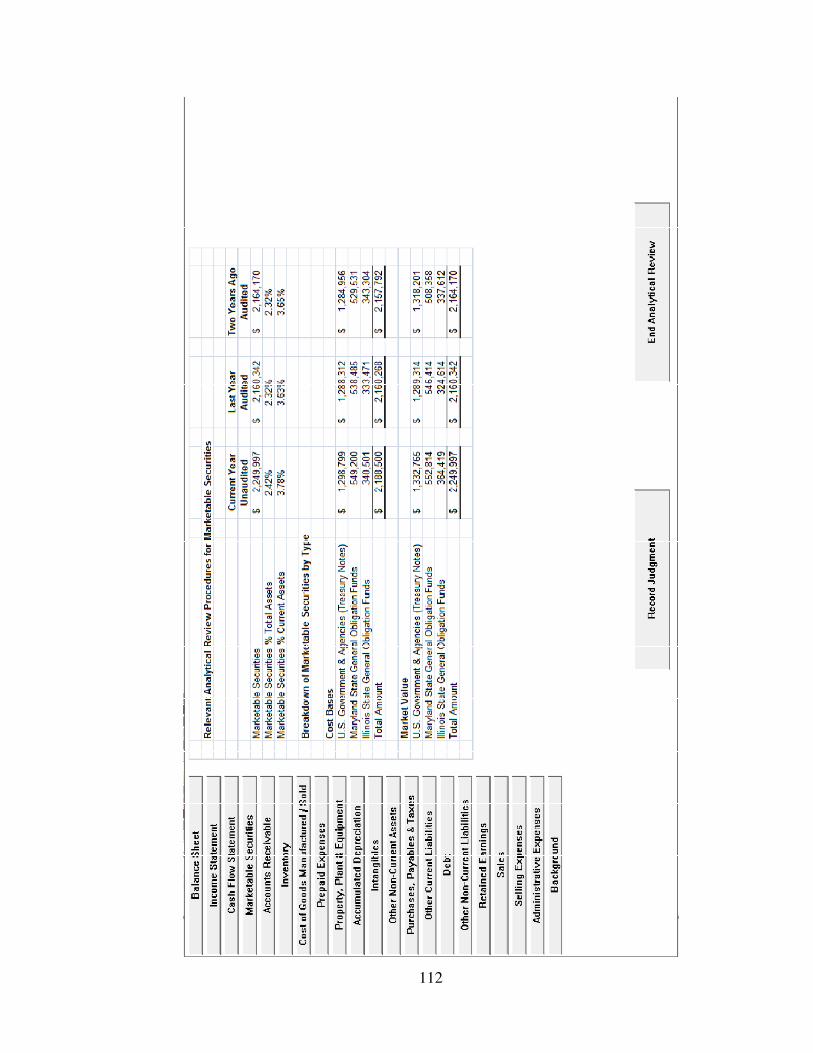
112
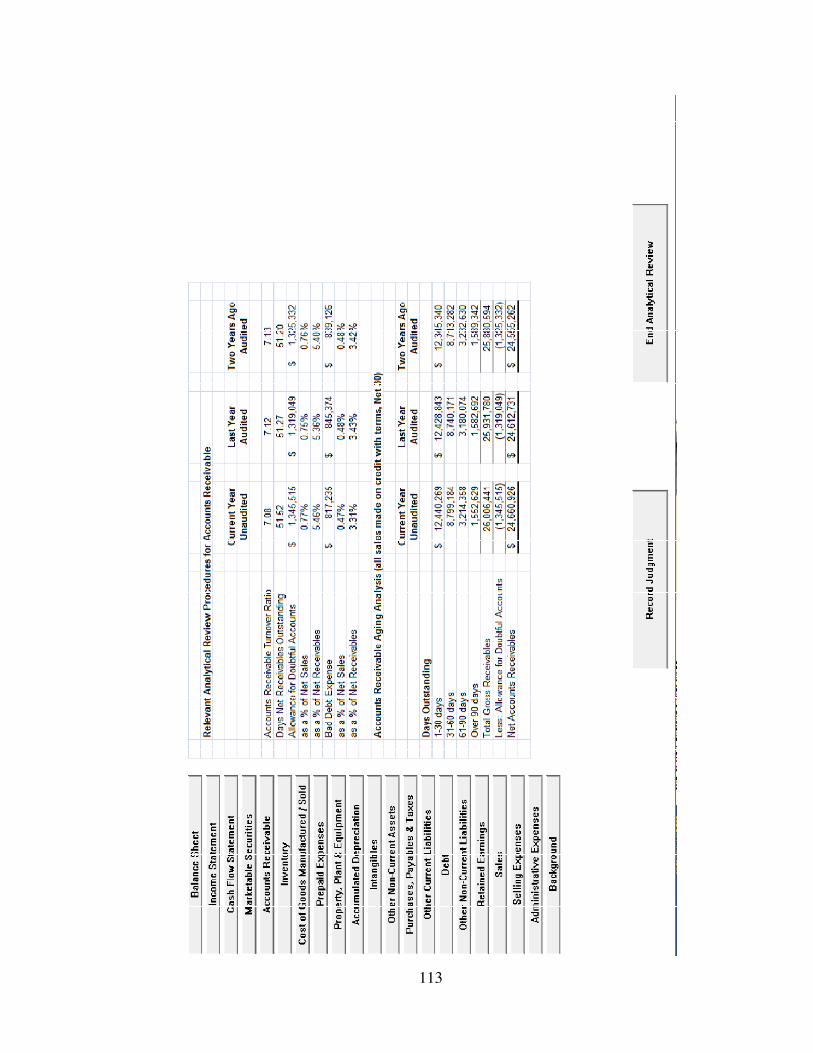
113
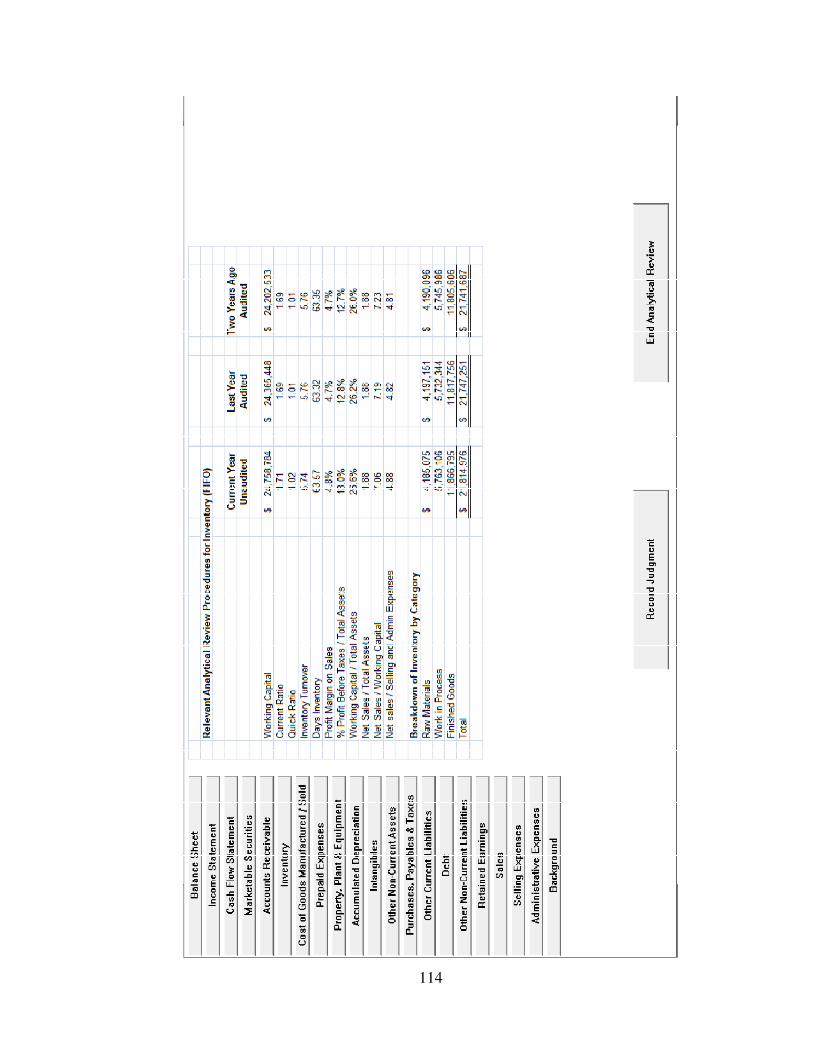
114
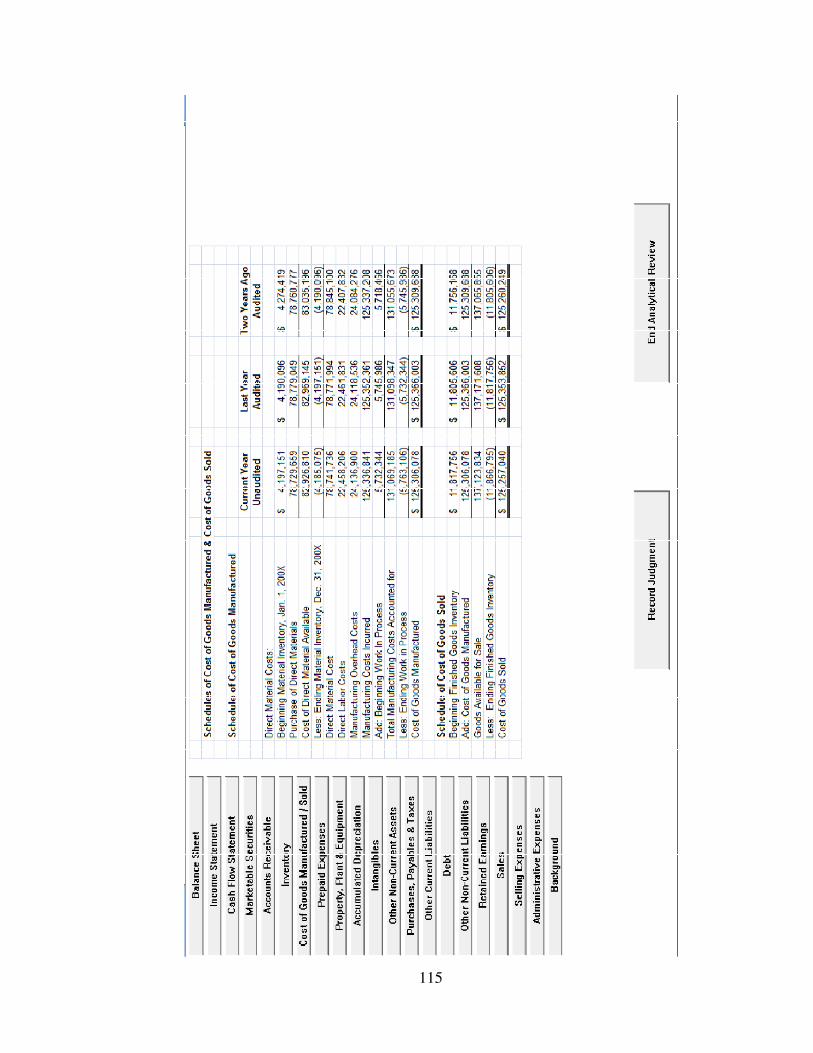
115
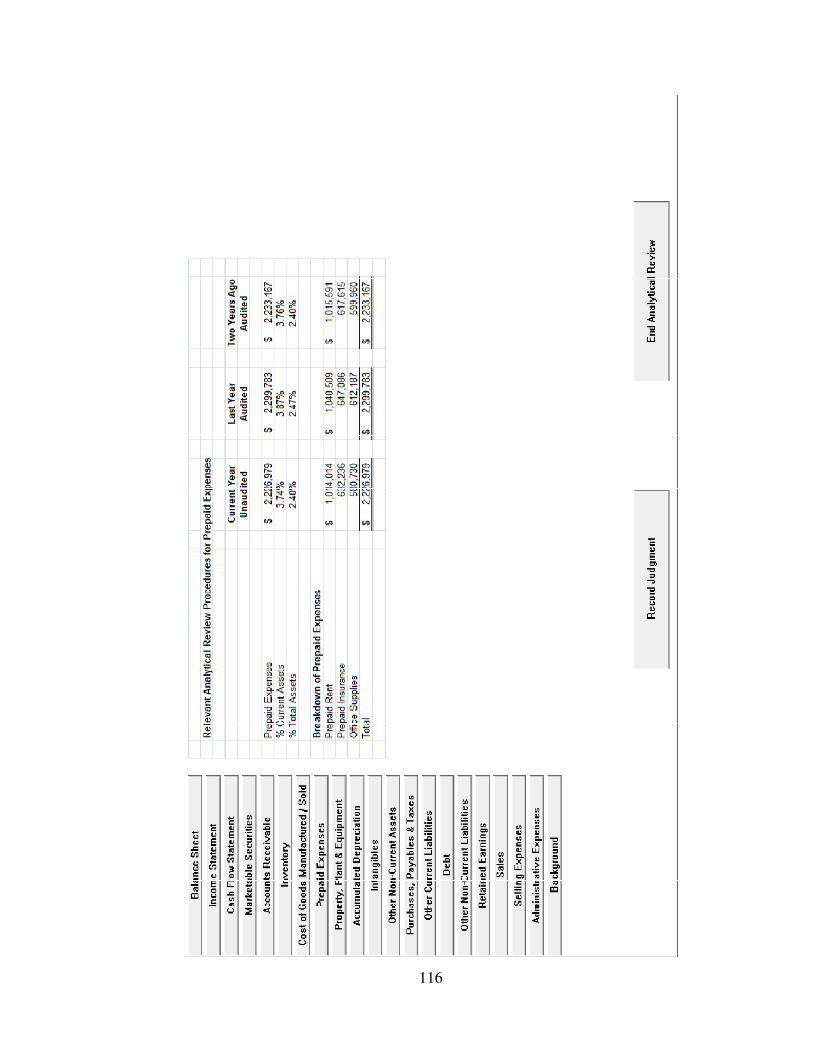
116
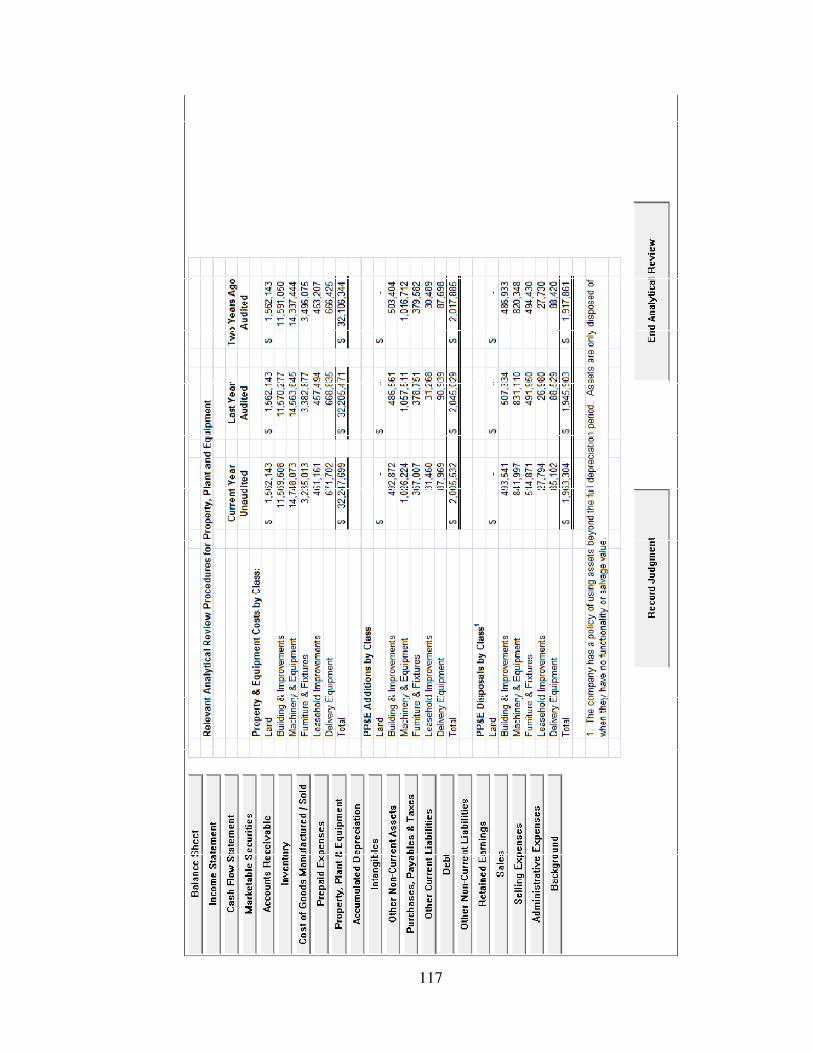
117
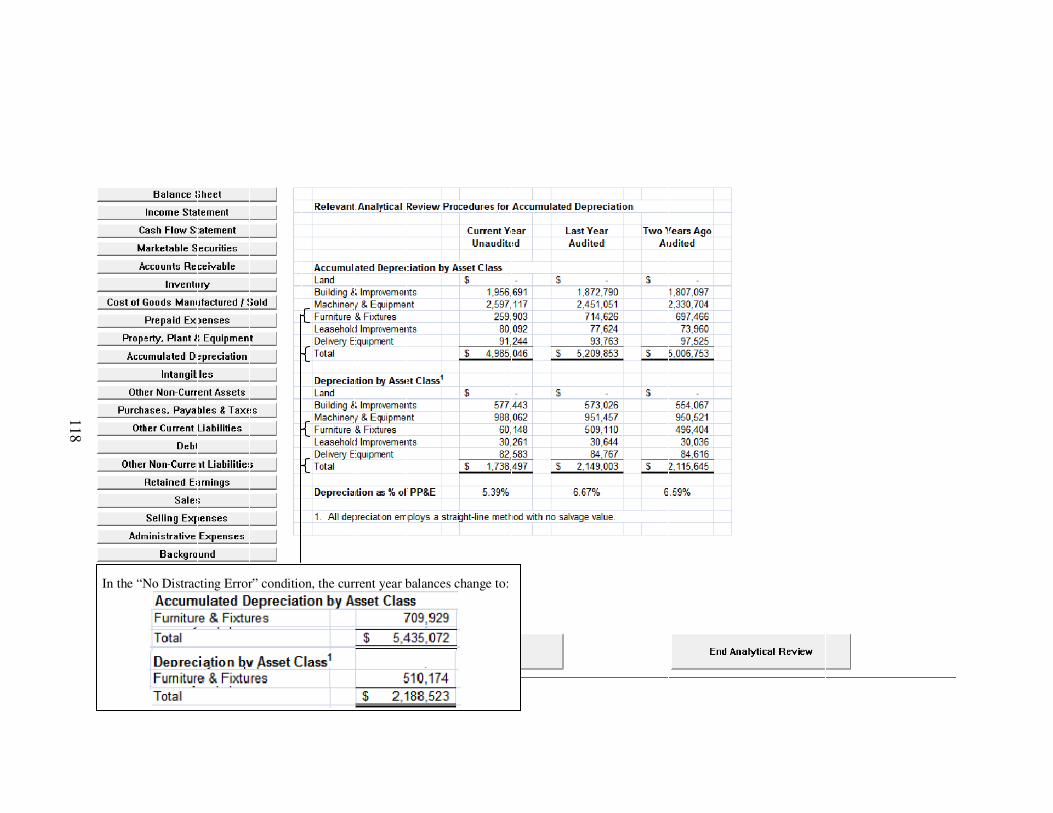
118
In the “No Distracting Error” condition, the current year balances change to:

119
In the “No Distracting Error” condition, the current year balances change to:
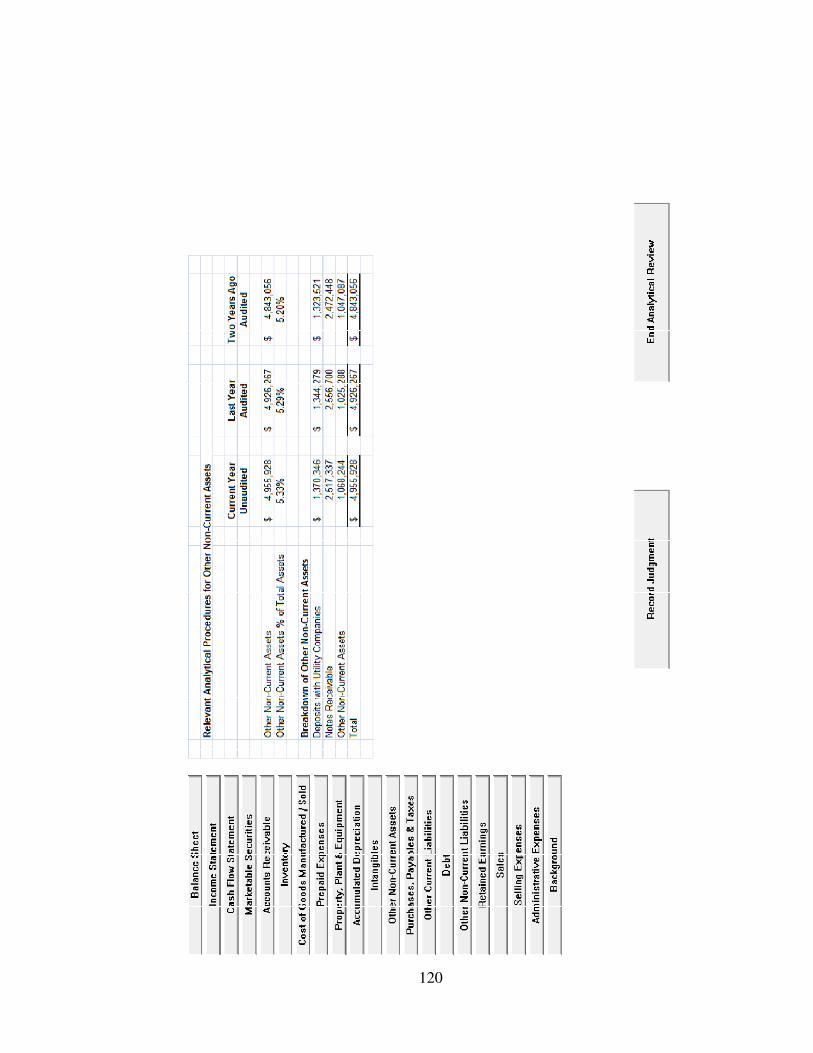
120
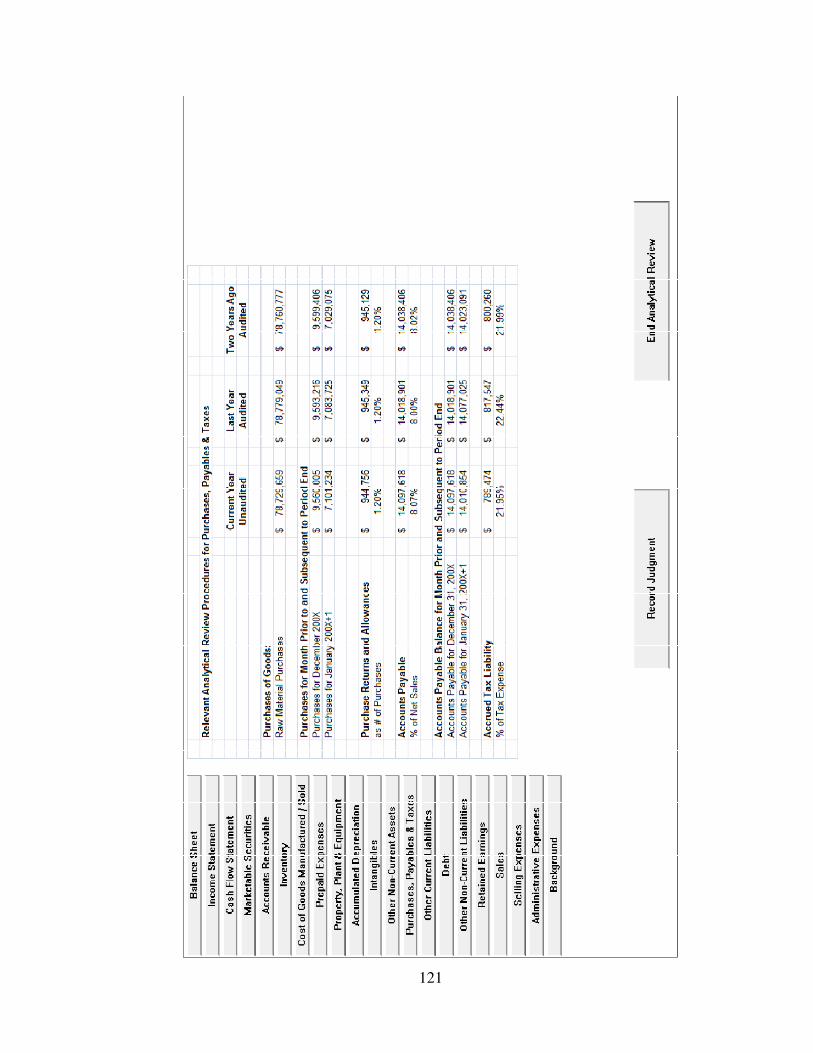
121
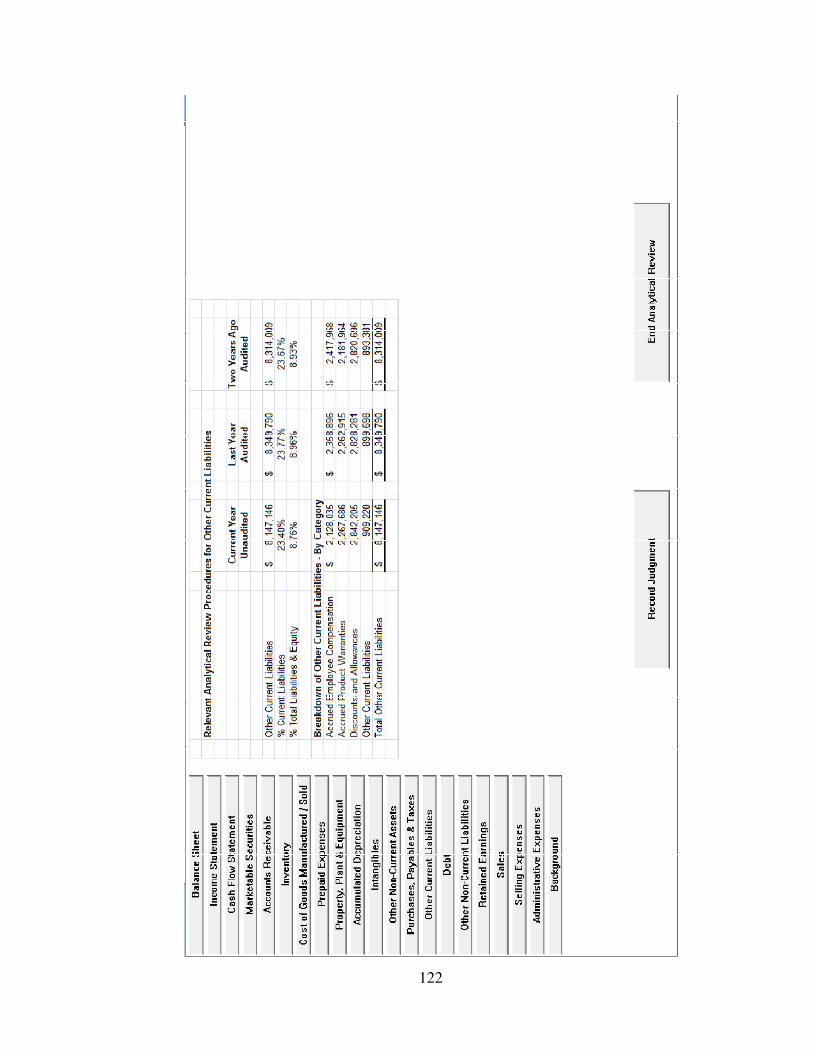
122
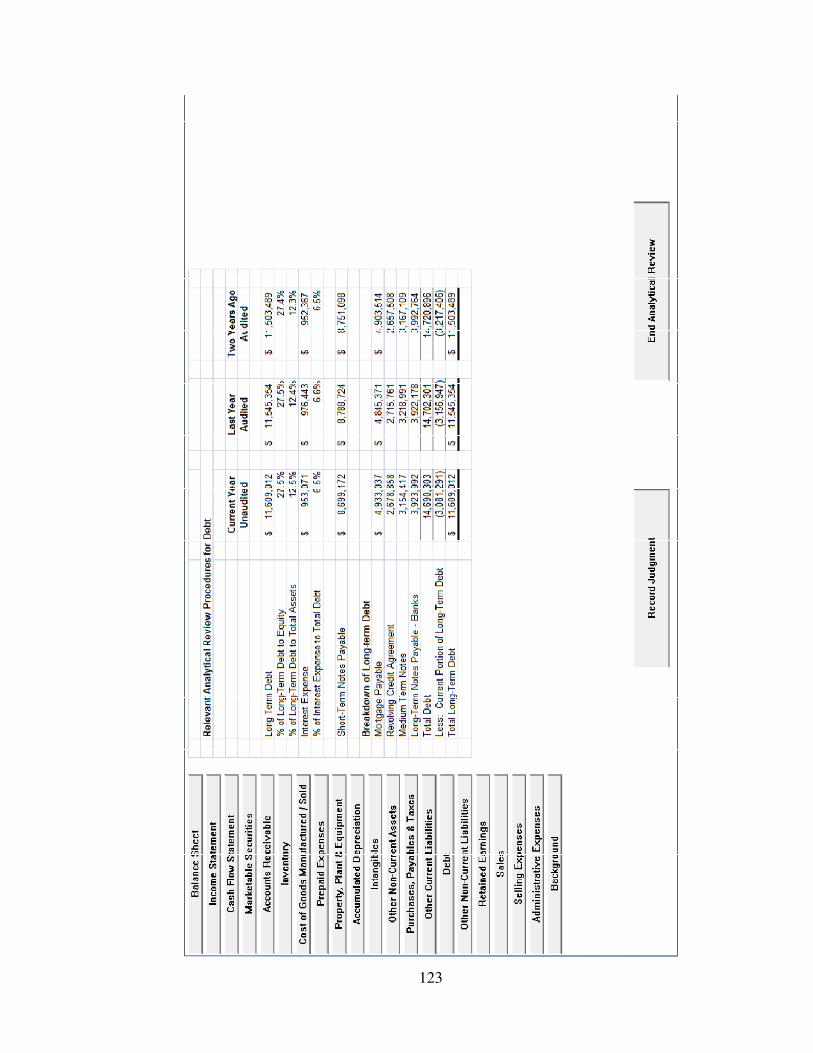
123
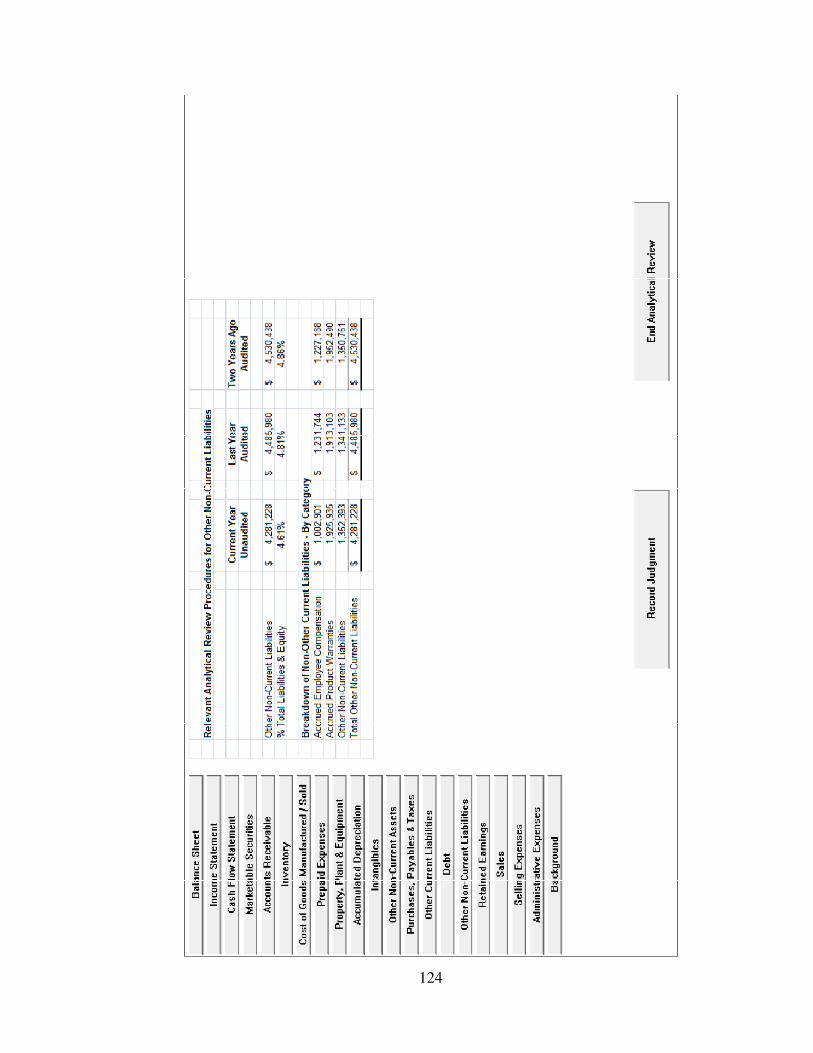
124
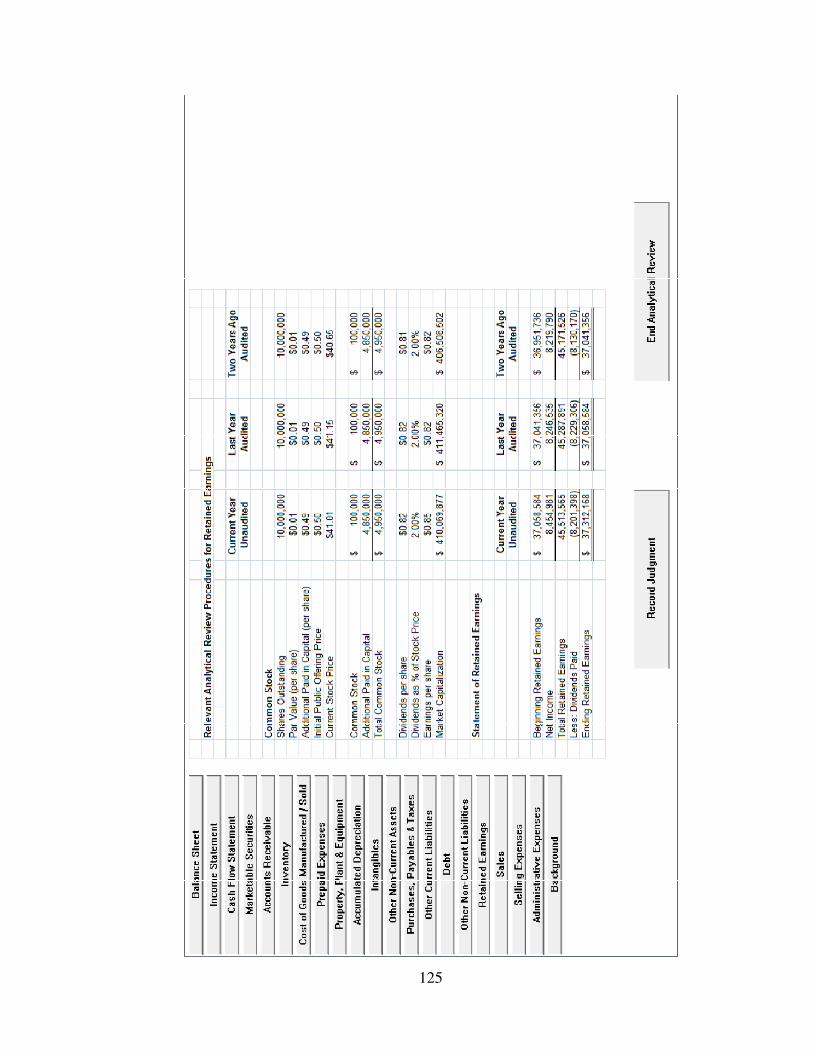
125
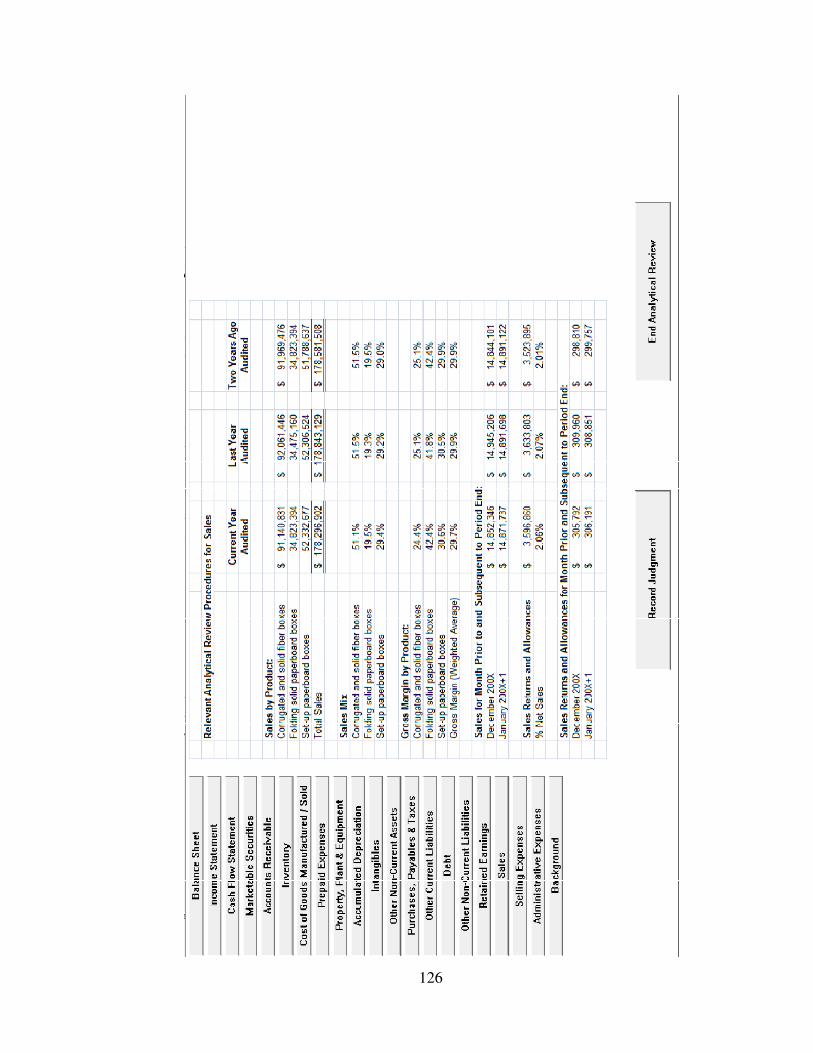
126
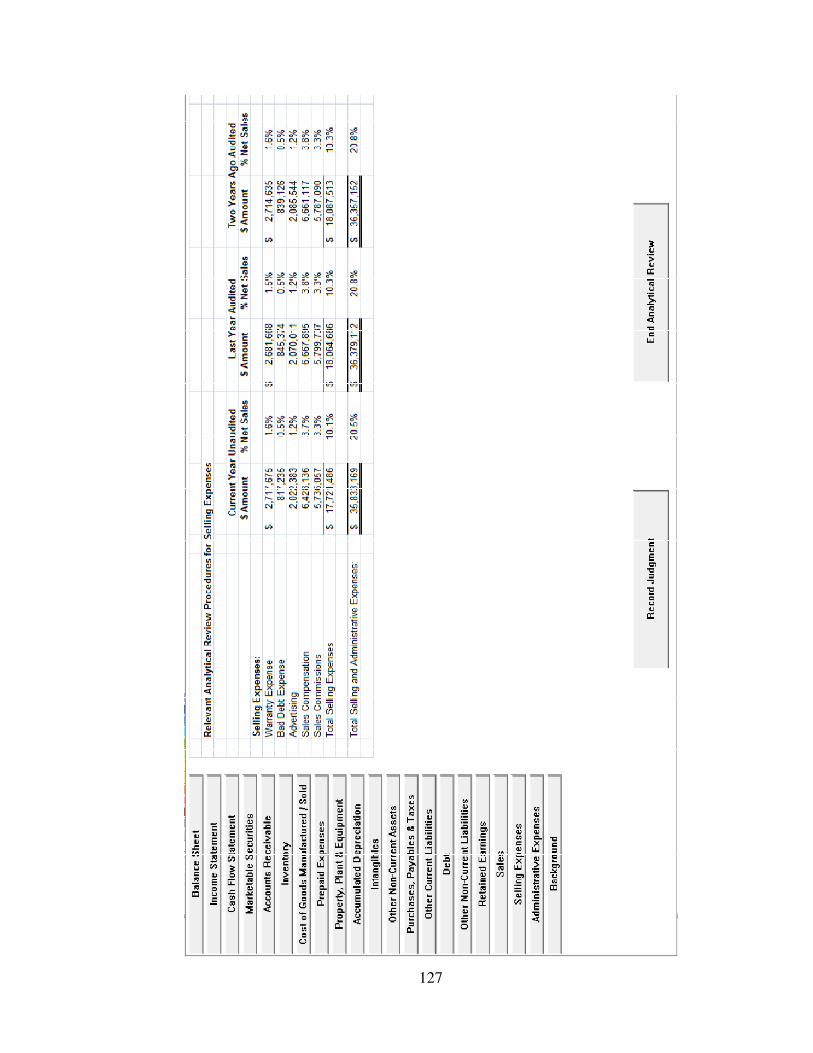
127
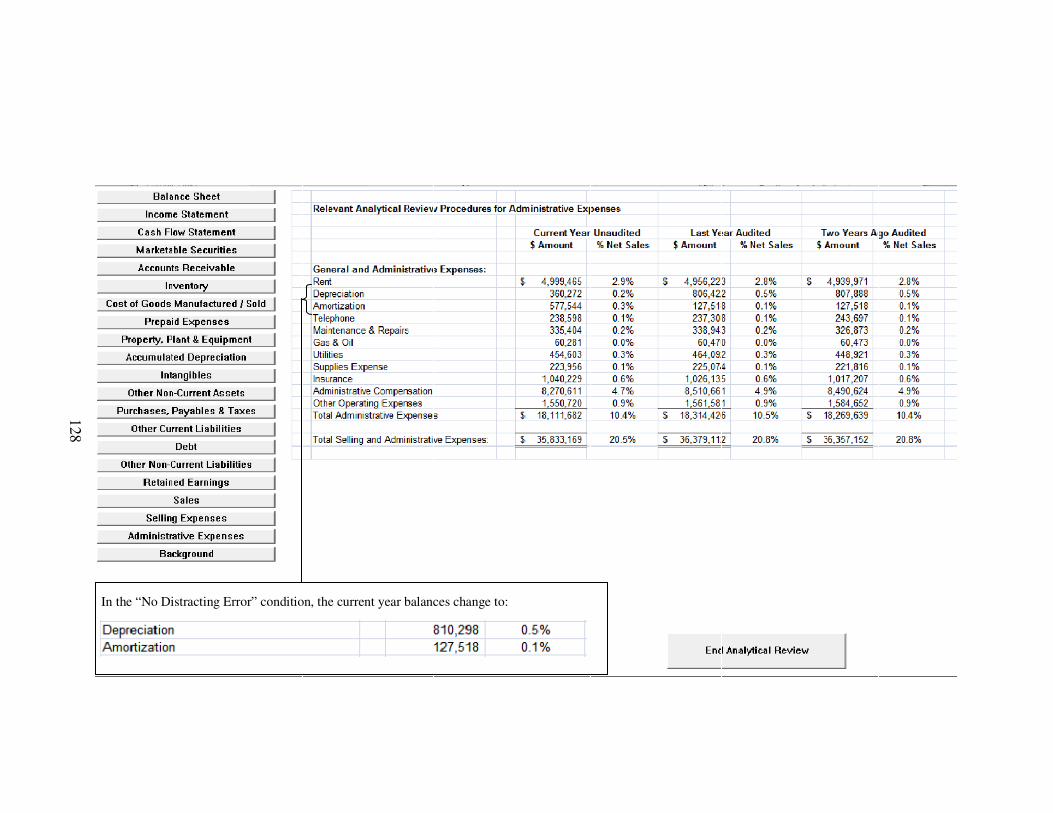
128
In the “No Distracting Error” condition, the current year balances change to:
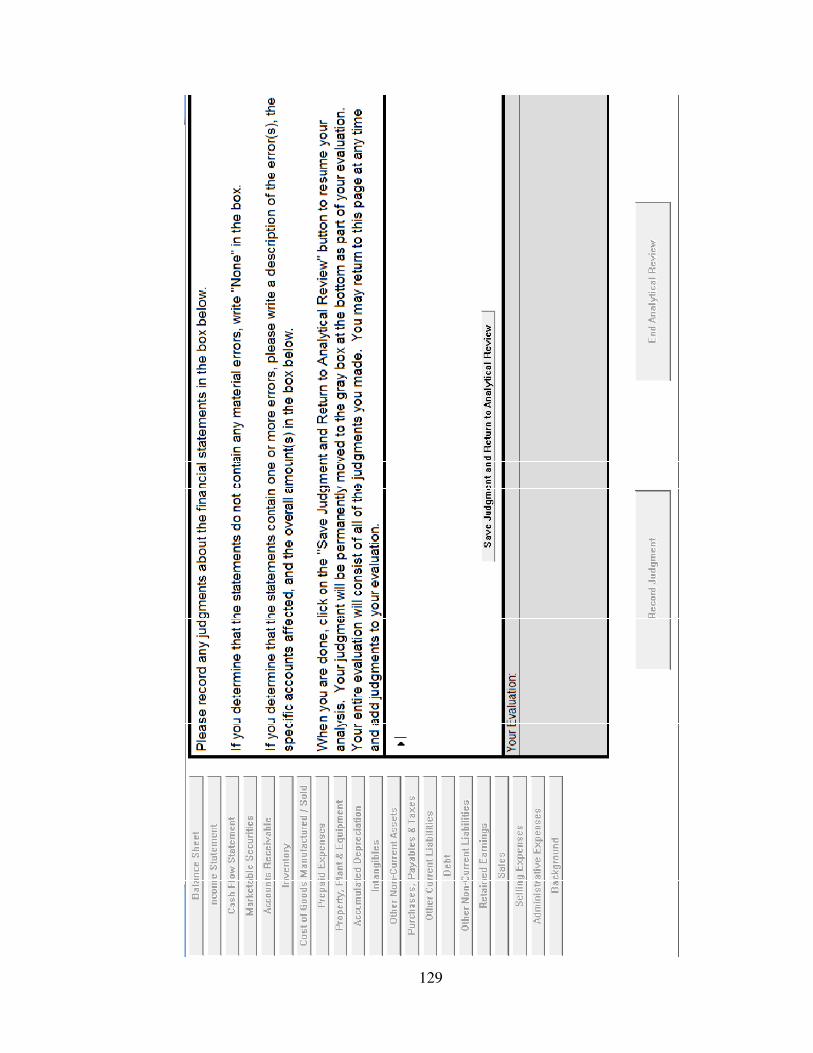
129
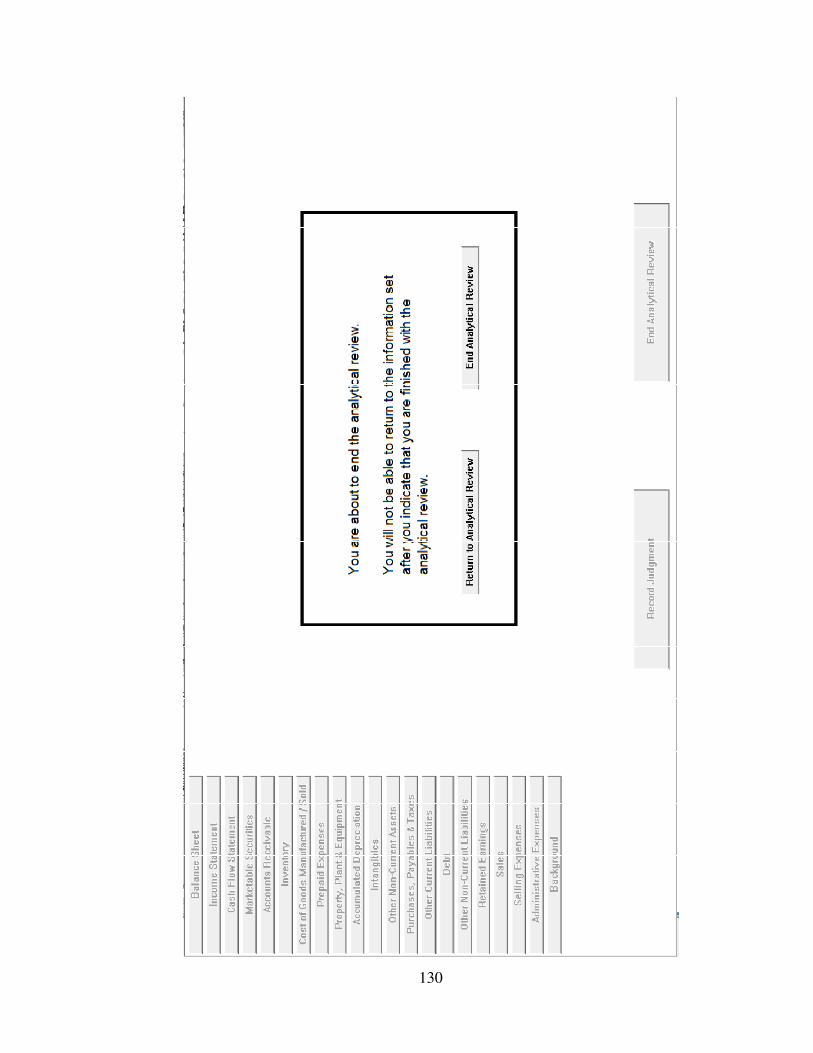
130
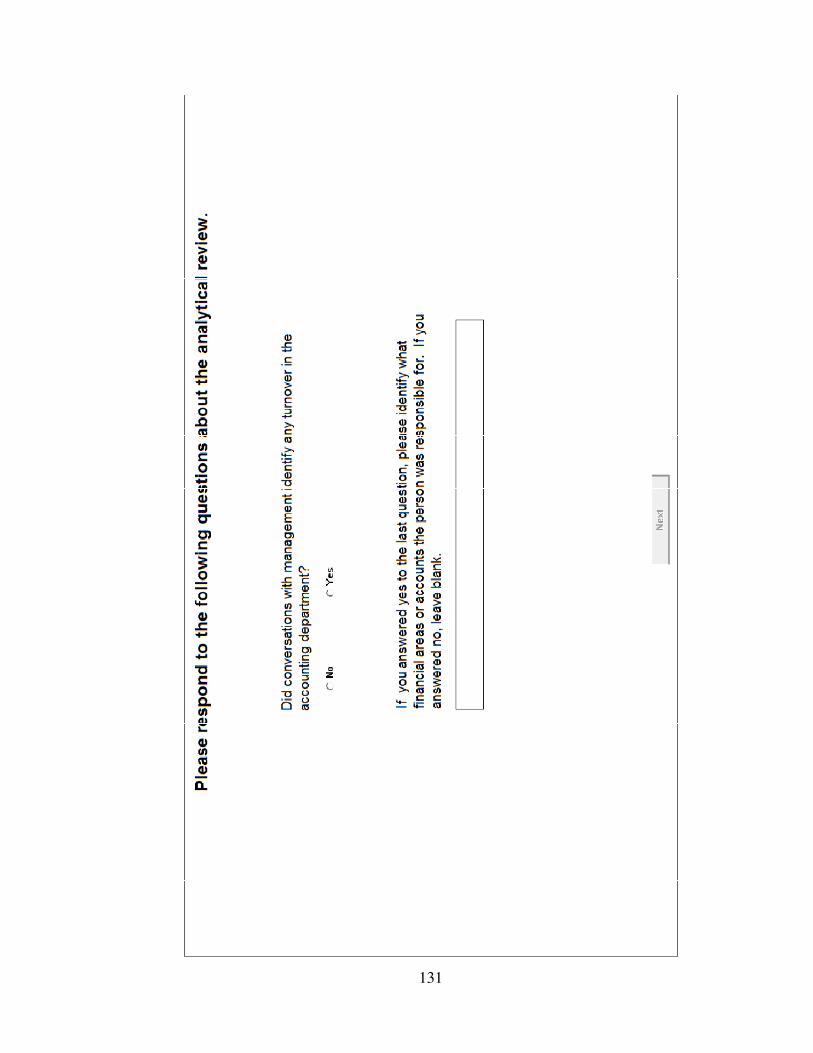
131
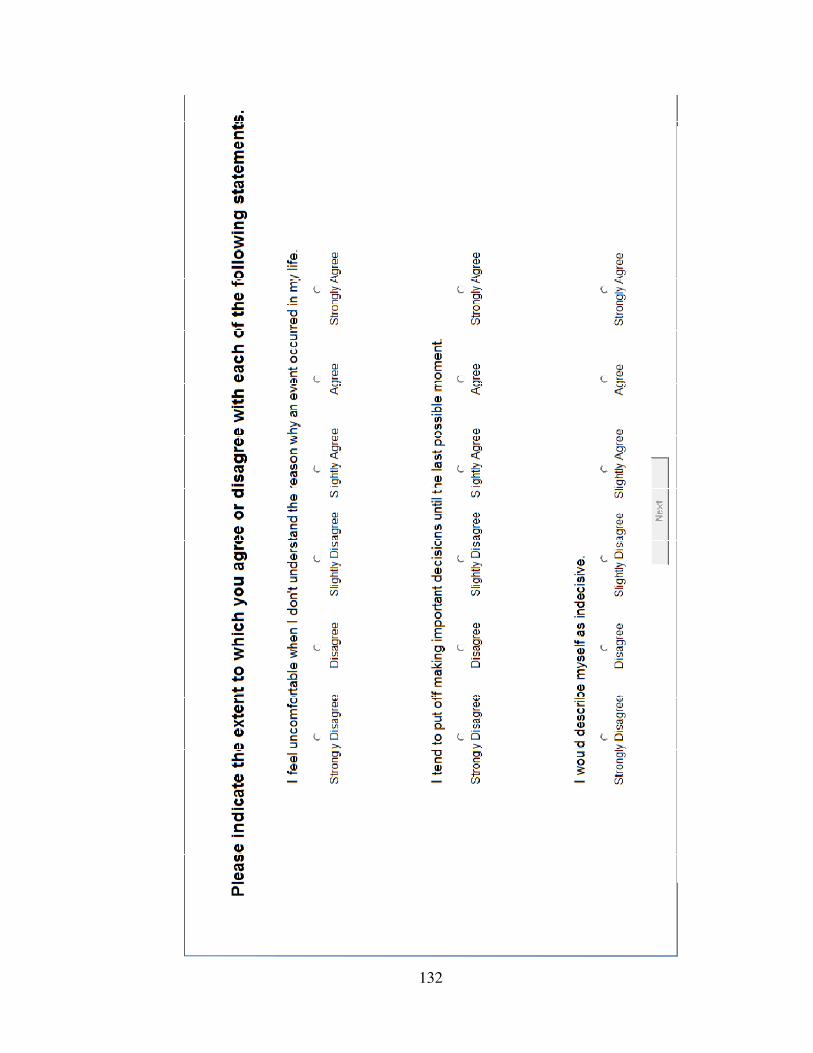
132

133
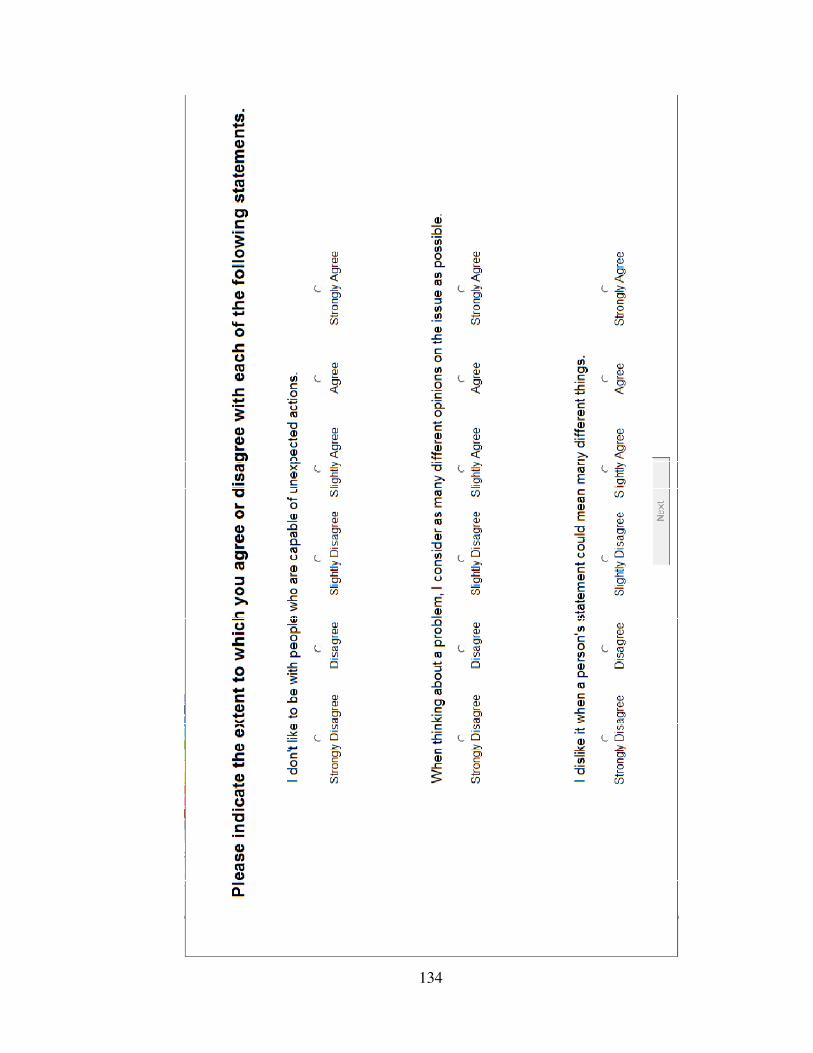
134

135
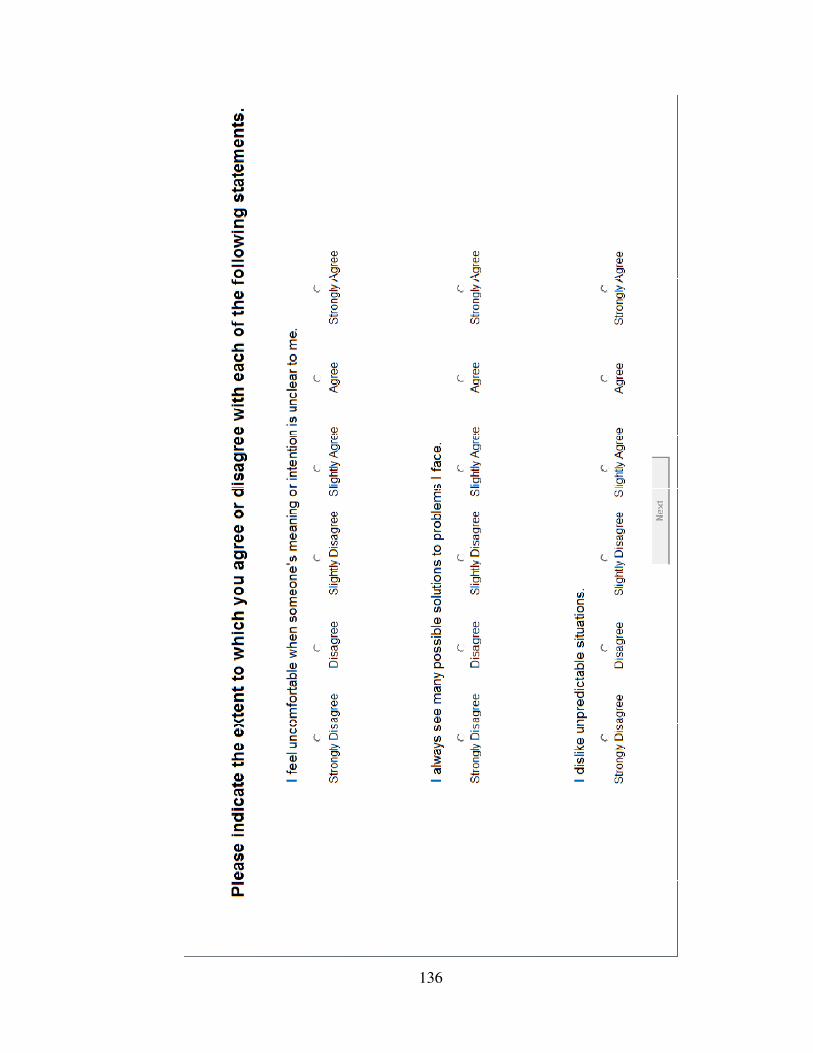
136
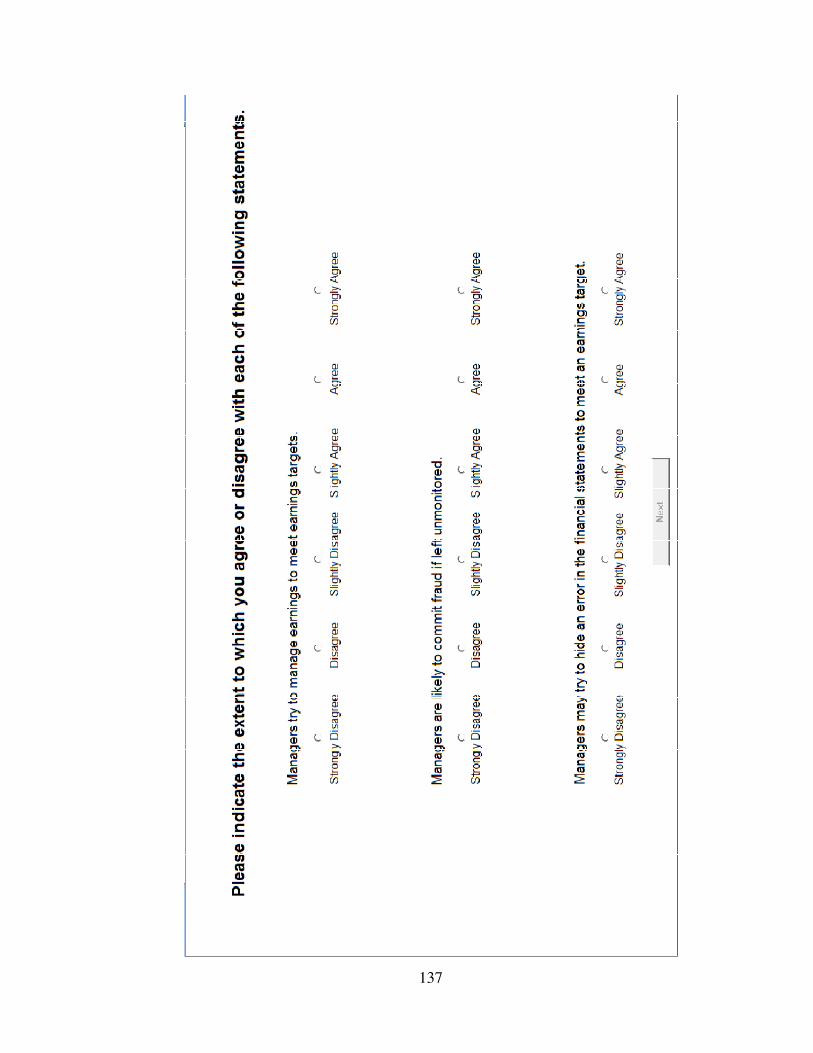
137

138
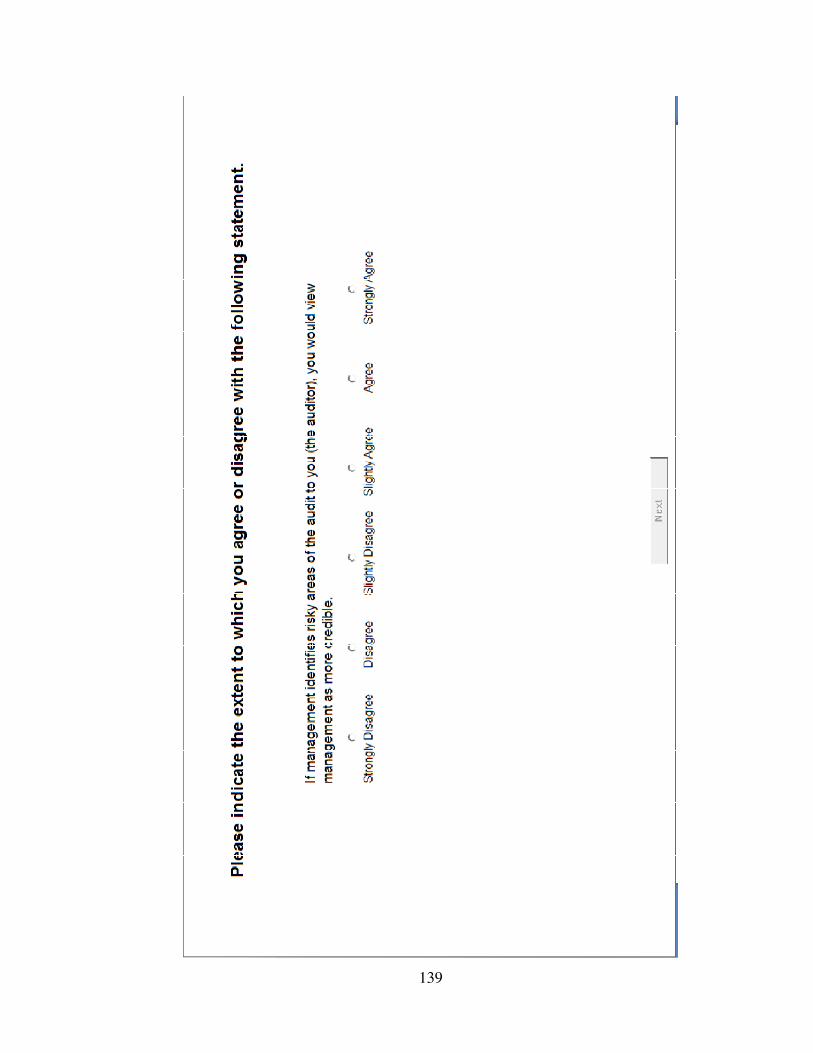
139

140
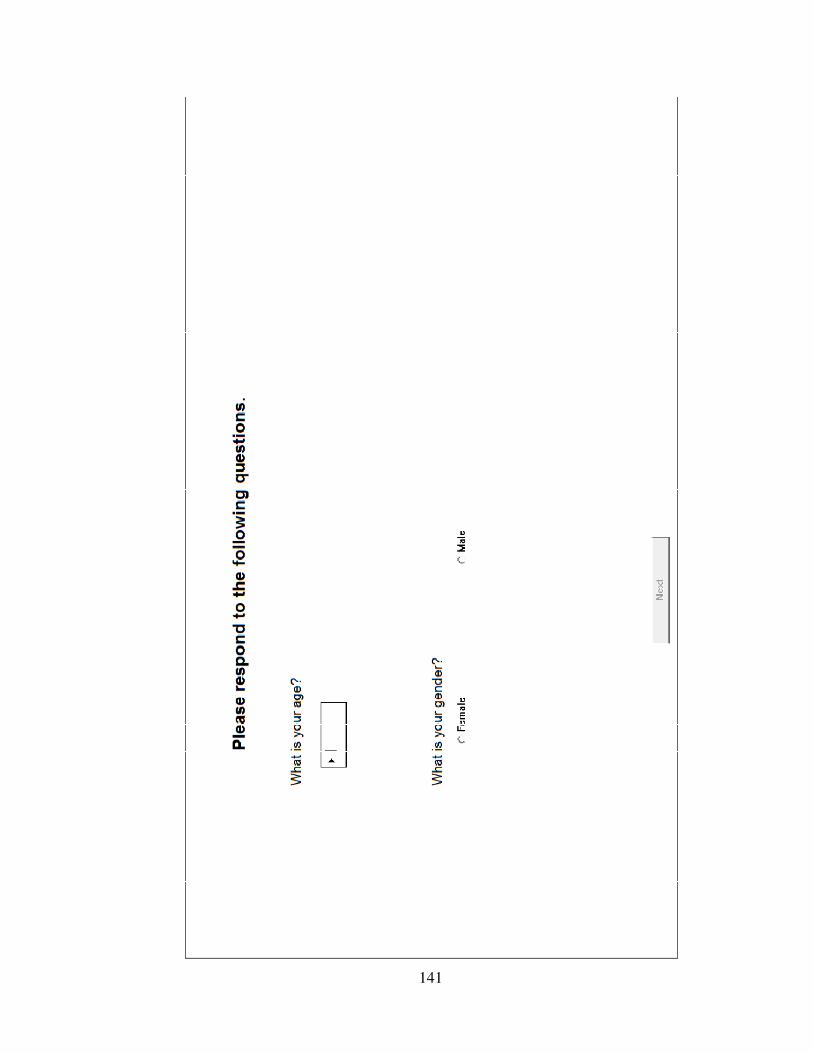
141

142

143
BIBLIOGRAPHY
Abdel-Khalik, A. R., and K. M. El-Sheeshai. 1980. Information choice and utilization in and experiment on default prediction. Journal of Accounting Research 18 (2):325-342.
Adobe. 2001. Macromedia Authorware 7.
American Institute of Certified Public Accountants (AICPA). 1999. Practice Alert 98-2.
Anderson, U., K. Kadous, and L. Koonce. 2004. The role of incentives to manage earnings and quantification in auditors' evaluations of management-provided information. Auditing: A Journal of Practice & Theory 23 (1):11-27.
Arya, A., J. C. Fellingham, B. Mittendorf, and D. A. Schroeder. 2004. Reconciling financial information at varied levels of aggregation. Contemporary Accounting
Research 21 (2):303-324.
Asare, S. K., G. M. Trompeter, and A. M. Wright. 2000. The effect of accountability and time budgets on auditors' testing strategies. Contemporary Accounting Research 17 (4):539-560.
Asare, S. K., and A. M. Wright. 2003. A note on the interdependence between hypothesis generation and information search in conducting analytical procedures. Contemporary Accounting Research 30 (2):235-251.
Bailey, C. D., C. M. Caily, and T. J. J. Phillips. 2006. A study of Kruglanski's need for closure construct and its implications for judgment and decision making in accounting and auditing: University of Memphis.
Bamber, E. M. 1983. Expert judgment in the audit team: A source reliability approach. Journal of Accounting Research 21 (2):396-412.
Barden, J., and R. E. Petty. 2008. The mere perception of elaboration creates attitude certainty: Exploring the thoughtfulness heuristic. Attitudes and Social Cognition 95 (3):489-509.
Baron, R. S., P. H. Baron, and N. Miller. 1973. The relation between distraction and persuasion. Psychological Bulletin 1973 (80):4.
Barr, S. 1998. Misreporting results: Recent accounting frauds may point to deeper problems. But it will take more than new accounting rules to solve them. CFO
Magazine, December 1.
Bazerman, M., K. Morgan, and G. Loewenstein. 1997. The impossibility of auditor independence. Sloan Management Review (Summer):89-94.

144
Beasley, M. S., J. V. Carcello, and D. R. Hermanson. 1999. Fraudulent financial reporting 1987-1997: Trends in US public companies. Directorship 25 (5).
Beaver, W. H., M. F. McNichols, and K. K. Nelson. 2007. An alternative interpretation of the discontinuity in earnings distributions. Review of Accounting Studies 12:525-556.
Bedard, J. C., and S. F. Biggs. 1991a. The effect of domain-specific experience on evaluation of management representations in analytical procedures. Auditing: A
Journal of Practice & Theory 10 (Supplement):77-90.
———. 1991b. Pattern recognition, hypotheses generation, and auditor performance in an analytical task. The Accounting Review 66 (3):622-642.
Bedard, J. C., and M. T. H. Chi. 1993. Expertise in auditing. Auditing: A Journal of
Practice & Theory 12 (Supplement):21-45.
Benson, V. 2008. A comparison of bilateral versus unilateral target and distractor presentation in the remote distractor paradigm. Experimental Psychology 55 (5):334-341.
Bernard, V. L., and D. J. Skinner. 1996. What motivates managers' choice of discretionary accruals? Journal of Accounting and Economics 22 (313-325).
Bhattacharjee, S., T. Kida, and D. M. Hanno. 1999. The impact of hypothesis set size on the time efficiency and accuracy of analytical review judgments. Journal of
Accounting Research 37 (1):83-100.
Bhojraj, S., and R. Libby. 2005. Capital market pressure, disclosure frequency-induced earnings / cash flow conflict, and managerial myopia. The Accounting Review 80 (1):1-20.
Blocher, E., and J. C. Cooper. 1988. A study of auditors' analytical review performance. Auditing: A Journal of Practice & Theory 7 (2):1-28.
Bonner, S. E. 2008. Judgment and Decision Making in Accounting Upper Saddle River, NJ: Pearson Prentice Hall.
Bouillon, M. L. 2007. Earnings management: An executive perspective (book review). Issues in Accounting Education 22 (1):126.
Braun, K. W. 1996. The disposition of audit-detected misstatements: An examination of aggregation effects: University of Connecticut.
Brown, C. E., M. E. Peecher, and I. Solomon. 1999. Auditors' hypothesis testing in diagnostic inference tasks. Journal of Accounting Research 37 (1):1-26.
145
Burgstahler, D., and I. Dichev. 1997. Earnings management to avoid earnings decreases and losses. Journal of Accounting and Economics 24:99-126.
Cabrera, A. A. 2007. The financial executive; fraud and error. Business World, May 15, S1/5.
Caramanis, C., and C. Lennox. 2008. Audit effort and earnings management. Journal of
Accounting and Economics 45:116-138.
Cofrin, K. M. W. 1999. The effect of need for closure on the diagnostic decision process of medical students: University of Utah.
Cohen, D. A., A. Dey, and T. Z. Lys. 2008. Real and accrual-based earnings management in the pre- and post-Sarbanes-Oxley periods. The Accounting Review 83 (3):757-787.
Cohen, J., and T. Kida. 1989. The impact of analytical review results, internal control reliability, and experience on auditors' use of analytical review. Journal of
Accounting Research 27 (2):263-276.
Cohen, J. R. 1994. Further evidence of auditors' asymmetric reactions to analytical review results. Advances in Accounting 12:167-185.
Collins, J. 2007. Dell's top management aware of accounting errors, inquiry reveals. Irish
Times, August 18, 17.
Creswell, J. 2002. Revenge of the bean counters: The SEC is cracking down on corporate crime with a record of number of probes. And it's just getting warmed up. Fortune, April 29, 22.
Degeorge, F., J. Patel, and R. Zeckhauser. 1999. Earnings management to exceed thresholds. Journal of Business 72 (1):1-33.
DeZoort, T., P. Harrison, and M. Taylor. 2006. Accountability and auditors materiality judgments: The effects of differential of pressure strength on conservatism, variability and effort. Accounting , Organizations and Society 31 (4/5):373.
Dhaliwal, D. S., C. A. Gleason, and L. F. Mills. 2004. Last-chance earnings management: Using the tax expense to meet analysts' forecasts. Contemporary Accounting
Research 21 (2):431-459.
Duncan, J. R. 2001. Twenty pressures to manage earnings. CPA Journal 71 (7):32-37.
Earnings Management. 2008. http://www.Romeassoc.Com/inv_lit/archives/earnings.htm.
Easterbrook, J. A. 1958. The effect of emotion on cue utilization and the organization of behavior. Psychological Review 66:183-201.
146
Farber, D. B. 2005. Restoring trust after fraud: Does corporate governance matter? The
Accounting Review 80 (2):539-561.
Fellingham, J. C., and D. P. Newman. 1985. Strategic considerations in auditing. The
Accounting Review 60 (4):634-650.
Festinger, L., and N. Maccoby. 1964. On resistance to persuasive communications. Journal of Abnormal and Social Psychology 68:359-366.
Fogarty, T. 2004. It's all about the money. Strategic Finance 85 (11):17-18.
Freudenburg, W. R., and M. Alario. 2007. Weapons of mass distraction: Magicianship, misdirection, and the dark side of legitimation. Sociological Forum 22 (2):146-173.
Friedenberg, J., and G. Silverman. 2006. Cognitive Science: An Introduction to the Study
of Mind. Thousand Oaks, CA: Sage.
Gibbins, M. 2002. Discussion of evidence from auditors about managers' and auditors' earnings management decisions. The Accounting Review 77 (Supplement):203-211.
Gigerenzer, G., and D. G. Goldstein. 1996. Reasoning the fast and frugal way: Models of bounded rationality. Psychological Review 103 (4):650-669.
Giroux, G. 2003. Detecting Earnings Management New York: Wiley.
Graham, J. R., C. R. Harvey, and S. Rajgopal. 2005. The economic implications of corporate financial reporting. Journal of Accounting and Economics 40:3-73.
Green, W. J., and K. T. Trotman. 2003. An examination of different performance outcomes in an analytical procedures task. Auditing: A Journal of Practice &
Theory 22 (2):219-235.
Harp, S., and R. E. Mayer. 1998. How seductive details do their damage: A theory of cognitive interest in science learning. Journal of Educational Psychology 90 (3):414-434.
Hayn, C. 1995. The information content of losses. Journal of Accounting and Economics 20:125-153.
Heaton, A. W., and A. W. Kruglanski. 1991. Person perception by introverts and extraverts under time pressure: Need for closure effects. Personality and Social
Psychology Bulletin 17 (161-165).
Heiman-Hoffman, V. B., D. V. Moser, and J. A. Joseph. 1995. The impact of an auditor's initial hypothesis on subsequent performance at identifying actual errors. Contemporary Accounting Research 11 (2):763-779.
147
Heiman, V. B. 1990. Auditors' assessments of the likelihood of error explanations in analytical review. The Accounting Review 65 (4):875-890.
Henry, D. 2004. Fuzzy numbers; despite the reforms, corporate profits can be as distorted and confusing as ever. Here's how the game is played. Business Week, October 4, 78.
Hilzenrath, D. 2007. Fannie Mae accused of deceiving KPMG, its former auditor. Washington Post, April 21, D01.
Holland, J. L. 1985. Making Vocational Choices: A Theory of Vocational Personalities
and Work Environments. Englewood Cliffs, NJ: Prentice Hall.
IBISWorld. 2008. Industry report: Cardboard & container manufacturing in the US: 32221.
Iyengar, S., and D. Kinder. 1987. News that Matters: Television and American Public
Opinion. Chicago: University Chicago Press.
Jackson, S. B., and M. K. Pitman. 2001. Auditors and earnings management. CPA
Journal 71 (7):38-44.
Jamal, K., P. E. Johnson, and R. G. Berryman. 1995. Detecting framing effects in financial statements. Contemporary Accounting Research 12 (1):85-105.
Johnson, P. E., K. Jamal, and R. G. Berryman. 1989. Audit judgment research. Accounting , Organizations and Society 14 (1/2):83-99.
———. 1991. Effects of framing on auditor decisions. Organizational Behavior and
Human Decision Processes 50:75-105.
Johnson, P. E., S. Grazioli, K. Jamal, and I. A. Zualkernan. 1992. Success and failure in expert reasoning. Organizational Behavior and Human Decision Processes 53:183-203.
Johnson, P. E., S. Grazioli, and K. Jamal. 1993. Fraud detection: Intentionality and deception in cognition. Accounting , Organizations and Society 18 (5):467-488.
Jones, K. L., G. V. Krishnan, and K. D. Melendrez. 2008. Do models of discretionary accruals detect actual cases of fraudulent and restated earnings? An empirical analysis. Contemporary Accounting Research 25 (2):499-531.
Joyce, E., and G. C. Biddle. 1981. Anchoring and adjustment in probabilistic inference in auditing. Journal of Accounting Research 19 (1):120-145.
Kahneman, D., W. S. Peavler, and L. Onuska. 1968. Effects of verbalization and incentive on the pupil response to mental activity. Canadian Journal of
Psychology 22:186-196.
148
Kahneman, D., and A. Tversky. 1972. Subjective probability: A judgment of representativeness. Cognitive Psychology 3 (3):430-454.
Kahneman, D. 1973. Attention and Effort. Englewood Cliffs, NJ: Prentice-Hall.
Kahneman, D., and A. Tversky. 1973. On the psychology of prediction. Psychological
Review 80 (4):237-251.
Kalawksy, K. 2005. Nortel reveals culture of deceit, manipulation: Independent review details incompetence and dysfunction behind restated results. National Post, January 12, FP1.
Kasanen, E., J. Kinnunen, and J. Niskanen. 1996. Dividend-based earnings management: Empirical evidence from Finland. Journal of Accounting and Economics 22 (1-3):283.
Kerstholt, J. H., P. O. Passenier, K. Houttuin, and H. Schuffel. 1996. The effect of a priori probability and complexity on decision making in a supervisory control task. Human Factors 38 (1):65-78.
Kida, T. 1984. The impact of hypothesis-testing strategies on auditors' use of judgment data. Journal of Accounting Research 22 (1):332-340.
Kim, J.-B., R. Chung, and M. Firth. 2003. Auditor conservatism, asymmetric monitoring, and earnings management. Contemporary Accounting Research 20 (2):323.
King, R. R. 2002. An experimental investigation of self-serving biases in an auditing trust game: The effect of group affiliation. The Accounting Review 77 (2):265-284.
Klayman, J., and Y.-W. n. Ha. 1987. Confirmation, disconfirmation, and information in hypothesis testing. Psychological Review 94 (2):211.
Koonce, L. 1993. A cognitive characterization of audit analytical review. Auditing: A
Journal of Practice & Theory 12 (Supplement):57-76.
Kruglanski, A. W. 1980. Lay epistemo-logic -- process and contents: Another look at attribution theory. Psychological Review 87 (1):70-87.
Kruglanski, A. W., and T. Freund. 1983. The freezing and un-freezing of lay-inferences: Effects on impressional primacy, ethnic stereotyping and numerical anchoring. Journal of Experimental Social Psychology 19:448-468.
Kruglanski, A. W. 1990. Motivations for judging and knowing: Implications for causal attribution. In The handbook for Motivation and Cognition: Foundations of
Social Behavior, edited by E. T. Higgins and R. M. Sorrentino. New York: The Guilford Press.
149
Kruglanski, A. W., and D. M. Webster. 1991. Group members' reactions to opinion deviates and conformists at varying degrees of proximity to decision deadline and of environmental noise. Journal of Personality and Social Psychology 61:212-225.
Kruglanski, A. W., D. M. Webster, and A. Klem. 1993. Motivated resistance and openness to persuasion in the presence or absence of prior information. Journal of
Personality and Social Psychology 65 (5):861-876.
Kruglanski, A. W., and D. M. Webster. 1996. Motivated closing of the mind: "Seizing" And "Freezing." Psychological Review 103 (2):263-286.
Kuhn, G., and B. W. Tatler. 2005. Magic and fixation: Now you don't see it, now you do. Perception 34:1155-1161.
Kuhn, G., B. W. Tatler, J. M. Findlay, and G. G. Cole. 2007. Misdirection in magic: Implications for the relationship between eye gaze and attention. Visual Cognition 16 (2/3):391-405.
Libby, R. 1985. Availability and the generation of hypotheses in analytical review. Journal of Accounting Research 23 (2):648-667.
Libby, R., and D. M. Frederick. 1990. Experience and the ability to explain audit findings. Journal of Accounting Research 28 (2):348-367.
Luippold, B. L., and T. Kida. 2008. The effect of initial information blur on the accuracy of analytical review judgments: University of Massachusetts at Amherst.
MacDonald, E. 2002. Accounting acrobatics: Growth companies are coming up with more than one way to stretch earnings. Forbes, December, 315-322.
Macmillan, N. A., and C. D. Creelman. 2005. Detection Theory: A User's Guide. 2nd ed. Mahwah, NJ: Lawrence Erlbaum Associates.
Marquardt, C. A., and C. I. Wiedman. 2004. How are earnings managed? An examination of special accruals. Contemporary Accounting Research 21 (2):461-491.
Mavin, D. 2007. Charges tough to prove: Nortel's auditors would be hard-pressed to uncover alleged misdeed, experts say. National Post's Financial Post & FP
Investing (Canada), March 13, FP1.
Mazur, A. 1981. The Dynamics of Technical Controversy. Washington, DC: Communications Press.
McKee, T. E. 2005. Earnings Management: An Executive Perspective. Mason, OH: Thomson Higher Education.
150
McMillan, J. J., and R. A. White. 1993. Auditors' belief revisions and evidence search: The effect of hypothesis frame, confirmation bias, and professional skepticism. The Accounting Review 68 (3):443-465.
Merchant, K. A. 1989. Rewarding Results: Motivating Profit Center Managers. Boston: Harvard Business School Press.
Mills, D. Q. 2003. Wheel, Deal and Steal: Deceptive Accounting, Deceitful CEOs and
Ineffective Reforms. Upper Saddle River, NJ: Prentice Hall.
Millstein, I. 2005. Part 2: When earnings management becomes cooking the books. The line between legitimate and inappropriate accounting techniques can be a blurry one, but the audit committee must endeavour to make a clear distinction. Financial Times, 2.
Moray, N., and I. Rotenberg. 1989. Fault management in process control: Eye movements in action. Ergonomics 32 (11):1319-1342.
Moreno, K. K., S. Bhattacharjee, and D. Brandon. 2007. The effectiveness of alternative training techniques on analytical procedures performance. Contemporary
Accounting Research 24 (3):983-1014.
Myers, J., and A. Well. 2003. Research Design and Statistical Analysis. 2nd ed. Mahwah, NJ: Lawrence Erlbaum and Associates.
Neisser, U. 1979. The control of information pickup in selective looking. In Perception
and its Development: A Tribute to Eleanor J. Gibson, edited by A. D. Pick. Hillsdale, NJ: Erlbaum.
Nelson, M. W., J. A. Elliot, and R. L. Tarplay. 2002. Evidence from auditors about managers' and auditors' earnings management decisions. The Accounting Review 77 (Supplement):175-202.
Nesdale, A. R. 1986. Distraction and the causal attribution process. Journal of Social
Psychology 126 (3):355-360.
Newman, D. P., E. R. Patterson, and J. R. Smith. 2005. The role of auditing in investor protection. The Accounting Review 80 (1):289-313.
Ng, T. B.-P. 2007. Auditors' decisions on audit differences that affect significant earnings thresholds. Auditing: A Journal of Practice & Theory 26 (1):71-89.
Ninio, A., and D. Kahneman. 1974. Reaction time in focused and in divided attention. Journal of Experimental Psychology 103 (3):394-399.
Patrick, J., A. Gregov, P. Halliday, J. Handley, and S. O'Reilly. 1999. Analysing operator's diagnostic reasoning during multiple events. Ergonomics 42 (3):493-515.

151
Patterson, E. R., and J. R. Smith. 2003. Materiality uncertainty and earnings management. The Accounting Review 78 (3):819-846.
Peterson, B. K., and B. Wong-On-Wing. 2000. An examination of the positive test strategy in auditors hypothesis testing. Behavioral Research in Accounting 12:257-278.
Petty, R. E., G. L. Wells, and T. C. Brock. 1976. Distraction can enhance or reduce yielding to propaganda: Through disruption versus effort justification. Journal of
Personality and Social Psychology 34 (5):874-884.
Petty, R. E., and J. T. Cacioppo. 1986. Communication and Persuasion: Central and
Peripheral Routes to Attitude Change. New York: Springer-Verlag.
Pohlman, R. A., and R. D. Hollinger. 1981. Information redundancy in sets of financial ratios. Journal of Business Finance & Accounting 8 (4):511-528.
Prashad, S. 2006. Why more firms are restating financial results. Toronto Star, March 16, D01.
Public Company Accounting Oversight Board (PCAOB). 2005a. Report on 2004 inspection of KPMG LLP (release no. 104-2005-088).
———. 2005b. Report on 2004 inspection of Ernst & Young LLP (release no. 104-2005-119).
———. 2005c. Report on 2004 inspection of Deloitte & Touche LLP (release no. 104-2005-089).
———. 2005d. Report on 2004 inspection of PricewaterhouseCoopers LLP (release no. 104-2005-120).
———. 2006a. Report on 2005 inspection of Deloitte & Touche LLP (release no. 104-2006-202).
———. 2006b. Report on 2005 inspection of PricewaterhouseCoopers LLP (release no. 104-2006-205).
———. 2006c. Report on 2005 inspection of Grant Thorton LLP (release no. 104-2006-203).
———. 2006d. Report on 2004 inspection of Grant Thorton LLP (release no. 104-2006-002).
———. 2007a. Report on 2005 inspection of Ernst & Young LLP (release no. 104-2007-001).
152
———. 2007b. Report on 2006 inspection of PricewaterhouseCoopers LLP (release no. 104-2007-129).
———. 2007c. Report on 2006 inspection of Grant Thorton LLP (release no. 104-2007-088).
———. 2007d. Report on 2005 inspection of KPMG LLP (release no. 104-2007-002).
———. 2007e. Report on 2006 inspection of Ernst & Young LLP (release no. 104-2007-064).
———. 2007f. Report on 2006 inspection of Deloitte & Touche LLP (release no. 104-2007-086).
———. 2007g. Report on 2006 inspection of KPMG LLP (release no. 104-2007-106).
———. 2008a. Report on 2007 inspection of PricewaterhouseCoopers LLP (release no. 104-2008-125).
———. 2008b. Report on 2007 inspection of Deloitte & Touche LLP (report no. 104-2008-070).
———. 2008c. Report on 2007 inspection of Ernst & Young LLP (report no. 104-2008-067).
———. 2008d. Report on 2007 inspection of Grant Thorton LLP (release no. 104-2008-046).
Reed, S. K. 1996. Cognition: Theories and Applications. 4th ed. Pacific Grove, CA: Brooks / Cole.
Ricchiute, D. N. 2006. Auditing. 8th ed. Mason, OH: Thomson.
Roets, A., A. Van Hiel, I. Cornelis, and B. Soetens. 2008. Determinants of task performance and invested effort: A need for closure by relative cognitive capacity interaction analysis. Personality and Social Psychology Bulletin 34 (6):779-792.
Sagarin, B. J., M. A. Brit, J. D. Heider, S. E. Wood, and J. E. Lynch. 2003. Bartering our attention: The distraction and persuasion effects of on-line advertisements. Cognitive Technology 8 (2):4-17.
Sanchez, M., C. Agoglia, and Hatfield. 2007. The effects of auditors' use of a reciprocity-based strategy on auditor-client negotiations. The Accounting Review 82 (1):264-283.
Simon, H. A. 1956. Rational choice and the structure of the environment. Psychological
Review 63:129-138.
153
———. 1982. Models of bounded rationality. Cambridge, MA: MIT.
———. 1990. Invariants of human behavior. Annual Review of Psychology 41:1-19.
———. 1992. Economics, bounded rationality, and the cognitive revolution. Aldershot Hants, England: Elgar.
Simons, D. J., and C. F. Chabris. 1999. Gorillas in our midst: Sustained inattentional blindness for dynamic events. Perception 28:1059-1074.
Sloan, L. R., R. E. Love, and T. M. Ostrom. 1974. Political heckling: Who really loses? Journal of Personality and Social Psychology 30 (4):518-525.
Smith, J. F., and T. Kida. 1991. Heuristics and biases: Expertise and task realism in auditing. Psychological Bulletin 109 (3):472-489.
Stalder, D. R. 2007. Need for closure, the big five, and public self-consciousness. Journal
of Social Psychology 147 (1):91-94.
Stelmach, L. B., and C. M. Herdman. 1991. Directed attention and perception of temporal order. Journal of Experimental Psychology: Human Perception and Performance 17 (2):539-550.
Street, M. D., S. D. Douglas, S. W. Geiger, and M. J. Martinko. 2001. The impact of cognitive expenditure on the ethical decision-making process: The cognitive elaboration model. Organizational Behavior and Human Decision Processes 86 (2):257-277.
Subramanyam, K. R. 1996. The pricing of discretionary accruals. Journal of Accounting
and Economics 22 (1-3):250.
Thayer, J. 2008. Determinants of shareholders' information search: Credibility versus confirmation: Emory University.
Tversky, A., and D. Kahneman. 1973. Availability: A heuristic for judgment frequency and probability. Cognitive Psychology 5 (2):207-232.
———. 1974. Judgment under uncertainty: Heuristics and biases. Science 185 (4157):1124-1131.
U.S. Securities and Exchange Commission. 2007. Litigation release no. 20333. SEC v. Nortel networks corporation and Nortel networks limited, civil action no. 07-cv-8851 (S.D.N.Y.).
University of Chicago. 1993. The Chicago Manual of Style: The essential guide for writers, editors and publishers. Chicago: University of Chicago Press.

154
University of Massachusetts Amherst. 2004. Guidelines for master's theses and doctoral dissertations.
Vermeir, I., and P. Van Kenhove. 2005. The influence of need for closure and perceived time pressure on search effort for price and promotional information in a grocery shopping context. Psychology & Marketing 22 (1):71-95.
Watts, W. A., and L. E. Holt. 1979. Persistence of opinion change induced under conditions of forewarning and distraction. Journal of Personality and Social
Psychology 37 (5):778-789.
Webster, D. M. 1993. Motivated augmentation and reduction of the over attribution bias. Journal of Personality and Social Psychology 65 (2):261-271.
Webster, D. M., and A. W. Kruglanski. 1994. Individual differences in need for cognitive closure. Journal of Personality and Social Psychology 67 (6):1049-1062.
Yerkes, R. M., and J. D. Dodson. 1908. The relation of strength of stimulus to rapidity of habit-formation. Journal of Comparative Neurology of Psychology 18:459-482.
Young, M. S., and N. A. Stanton. 2001a. Mental workload: Theory measurement and application. In International Encyclopedia of Ergonomics and Human Factors, edited by K. W. London: Taylor & Francis.
———. 2001b. Size matters: The role of attentional capacity in explaining the effects of mental underload in performance. In Engineering Psychology and Cognitive
Ergonomics: Volume 5. Aerospace and Transportation Systems, edited by D. Harris. Aldershot, UK: Ashgate.
———. 2002a. Attention and automation: New perspectives on mental underload and performance. Theoretical Issues in Ergonomics Science 3 (2):178-194.
———. 2002b. Malleable attentional resources theory: A new explanation for the effects of mental underload on performance. Human Factors 44 (3):365-375.
Zimbardo, P., M. Snyder, J. Thomas, A. Gold, and S. Gurwitz. 1970. Modifying the impact of persuasive communication with external distraction. Journal of
Personality and Social Psychology 16 (4):669-680.


