Embed Size (px)
Citation preview

Wright State University Wright State University
CORE Scholar CORE Scholar
International Symposium on Aviation Psychology - 2005
International Symposium on Aviation Psychology
2005
Study on the Integration of Human Performance and Accident Study on the Integration of Human Performance and Accident
Risk Assessment Models: Air-Midas & Topaz Risk Assessment Models: Air-Midas & Topaz
Kevin Corker
Follow this and additional works at: https://corescholar.libraries.wright.edu/isap_2005
Part of the Other Psychiatry and Psychology Commons
Repository Citation Repository Citation Corker, K. (2005). Study on the Integration of Human Performance and Accident Risk Assessment Models: Air-Midas & Topaz. 2005 International Symposium on Aviation Psychology, 147-152. https://corescholar.libraries.wright.edu/isap_2005/19
This Article is brought to you for free and open access by the International Symposium on Aviation Psychology at CORE Scholar. It has been accepted for inclusion in International Symposium on Aviation Psychology - 2005 by an authorized administrator of CORE Scholar. For more information, please contact [email protected].

STUDY ON THE INTEGRATION OF HUMAN PERFORMANCE AND ACCIDENT RISK ASSESSMENTMODELS: AIR-MIDAS & TOPAZ
Kevin CorkerSan Jose State University
Henk A.P. Blom & Sybert H. StroeveNational Aerospace Laboratory NLR
Amsterdam, The Netherlands
A computational model of human performance (Air Man-machine Integration Design and Analysis System, AirMIDAS) and an accident risk assessment methodology (Traffic Organization and Perturbation AnalyZer, TOPAZ)were integrated in order to learn about the similarities and differences of their models, to demonstrate the feasibilityof such integration, and the integration impact on accident risk assessment.
Introduction
In the analysis and design of advanced operations incomplex, dynamic, human-machine systems, accidentrisk assessment is a critical component of effectivesystem engineering. Probability Risk Assessment(PRA) techniques typically model such complexsystem by assigning conditional probabilities of thesuccess, or failure for system operations into faultand event trees (e.g. Kumamoto and Henley, 1996).Subsequently, an assessment of risk is undertaken byevaluating the combined effects of the conditionalprobabilities in these fault and event trees. The roleand contribution of the human operator has proven tobe a significant element to both accident risk(Hollnagel, 1993), and to system safety andeffectiveness (Dekker 2001).
The development of models that represent thecontribution of the human operator to risk has beenexplored for some 30 years (Swain & Guttman 1983).The function of the human operator was eitherassigned a probability of success or failure, as wouldbe provided for any system component, and the“integration” was the inclusion of those probabilities inthe overall system success failure assessment. Aserious limitation of fault and event tree based PRA isits inability to evaluate the effects of concurrent anddynamic behavior on accident risk. The remedy is toexploit stochastic dynamical modeling and MonteCarlo simulation of the concurrent and dynamicprocesses for accident risk assessment (e.g. Labeau etal., 2000) and to include explicit representation ofhuman performance in individual and on teams (e.g.,.Cacciabue, 1998 or Corker, 2000)
In order to apply this approach to air trafficmanagement, multiple human operators and theirinteractions with each other and with aircraft andground systems have to be modeled and simulated.Both with the human performance model Air-MIDAS (Corker, 2000) and with the accident risk
assessment methodology TOPAZ (Blom et al., 2001,2003; Stroeve et al., 2003), significant andcomplementary headway has been made. We reporthere on the integration of Air-MIDAS and TOPAZ inaviation safety assessment.
The objective of this integration is to combine thesignificant advances established in individual humanperformance representation and human performancefactors (human factors in general and humancognitive behavior in particular) through large-scalesimulations for accident risk assessment. As anobjective test for the success of this integration wehypothesize that this combination allows Air-MIDASto provide simulation results for individual humanoperators which improves the accident riskassessment.
The aviation community continues to be concernedwith accident risk and runway operations and severaltechnologies have been under development tomitigate this risk. Given the relevance of theseoperations to both safety risk and humanperformance, an integrated simulation of the baselineconditions for runway incursion avoidance wasundertaken by Air-MIDAS and TOPAZ simulationtoolset TAXIR for this operation.
Integration of human modeling approaches
Because of the complementary objectives andseparate developments of Air-MIDAS and TOPAZtheir human performance modeling approaches showsimilarities and differences. Their potentiallycomplimentary functions form the reason why thisintegration is so useful and challenging at the sametime. In the course of the integration study thecomplementary human performance modeling detailsof both approaches have become clear. A shortexplanation of this is given next, including anoverview in Table 1.
147

Table 1 Human performance modeling in Air-MIDAS and TOPAZ
Air-MIDAS TOPAZManagementmodes
Max-load orEven-load
None
Control Modes Matching withRasmussen’sSRK (Skill,Rule,Knowledge)
Matching withHollnagel’stactical andopportunisticcontrol modes
A
Switchingbetween modes
Fixed thresholds Thresholds withhysteresis
Task Scheduling Goal orientedsubtaskscheduling
Priority rules foraggregated tasks
Resources model Multiple: Visual,Auditory,Cognitive,Psychomotor
Aggregation onthe basis of time-criticaltasks/resourcescombinations
B
Memory model Procedural (withdecay)Declarative(with decay)Knowledge (nodecay)
Aggregated (nodecay)
C SA model SA of onehuman only
Multi Agent SAand interactions
D Human error Is result ofdetailedmodelling
Amalberti’serror recoverymodel is added
E Behaviour ofNon-humanentities
Nominal Nominal &Non-Nominal
F Specificationlanguage
Air-MIDASspecific, basedon LISP
DynamicallyColoured PetriNets (DCPN)
Integration of these approaches ensures that thesimulation scenario under examination is jointlyrepresented in the two modeling systems. This allowsidentification of values for specific parameters ofhuman performance in the TOPAZ simulation modelto be supplied by the Air MIDAS simulation. Theseparameter values are generated in Monte Carlo runsof the human performance model and subsequentlysupplied as input to improving TOPAZ simulations.In so far as the modeling paradigms allow similarrepresentation, this parameter exchange isstraightforward. For example, simulation of pilotreaction time to recognition of an incursion by thetaxiing aircraft is represented in both modelingprocesses, hence reaction time is a straight forwardparameter value to exchange.
Application context
The following operational concept for crossing of anactive runway is being considered. A simplifiedrepresentation of the runway configuration is used, asshown in Figure 1. It consists of one runway with acrossing at a length by3 from the runway startthreshold. The crossing has remotely controlledstopbars on both sides of the runway. The runway isbeing used for taking off aircraft. The traffic crossingover the runway accounts for traffic between apron(s)and a second runway. The involved human operatorsinclude the start-up controller, the ground controller,per runway a runway controller, the departurecontroller, and the pilots flying and pilots not flyingof taking-off aircraft and crossing aircraft.
Communication between controllers and aircraftcrews is via standard VHF R/T. Communicationbetween controllers is supported by telephone lines.Monitoring by the controllers can be by direct visualobservation and is supported by radar track plots.Monitoring by the aircraft crews is by visualobservation and is supported by the VHF R/T party-line effect.
In the runway crossing operation considered, thecontrol over the crossing aircraft is transferred fromthe ground controller to the controller of the runwayto be crossed. If the runway controller is aware thatits runway is not used for a take-off, the crew of anaircraft intending to cross is cleared to do so. Thepilot not flying of the crossing aircraft acknowledgesthe clearance and then the pilot flying initiates therunway crossing. As soon as the crossing aircraft hasvacated the runway, then the pilot not flying reportsthis to the controller of that runway. Next the controlover the aircraft is transferred from this runwaycontroller to either another runway controller or tothe ground controller.
148

Figure 1: Configuration of active runway crossingoperation considered. Aircraft i and j respectivelytake off from a position at the runway start and taxialong a taxiway leading to a runway crossing at agiven distance from the runway start.
Joint model for integrated simulations
The TOPAZ and Air-MIDAS simulation modelsconsider the following human agents: pilots flying forboth the taxi aircraft and the taking off aircraft, andthe runway controller. The most important elementsof these human and other entities are shortlydescribed below.
Initially, the pilot flying (PF) of the taking-off aircrafthas the situation awareness (SA) that take-off isallowed and initiates a take-off. During the take-offthe PF visually monitors the traffic situation on therunway. During a monitoring action the PF may notobserve the crossing aircraft, because of a limitedgaze angle or the distance with the crossing aircraftexceeds a viewing threshold, or occasional heads-down time for engine parameter sampling. Themonitoring process includes distance dependent errorcomponents. Furthermore, the PF monitors the VHFcommunication channel. The PF of the taking-offaircraft starts a collision avoiding braking action if(s)he observes the crossing aircraft within a criticaldistance of the runway centre-line or in reaction to a
controller clearance, and (s)he decides that brakingwill stop the aircraft in front of the crossing aircraft.
Initially, the PF of the taxiing aircraft has the SA thateither (s)he is taxiing on a regular taxiway, whichdoes not cross a runway or (s)he is taxiing on ataxiway approaching the runway crossing. In thelatter case the PF may have the SA that crossing isallowed. Both in the case that the PF has the SA that(s)he is taxiing on a regular taxiway and in the casethat the PF is aware that a runway crossing isallowed, the PF proceeds on the runway crossing.During taxiing the PF visually monitors the trafficsituation. The characteristics of the monitoringprocess depend on the SA of the PF concerning thenext airport waypoint (either runway crossing ortaxiway). After passage of the stopbar the PF mayreceive a hold clearance by the runway controller.There is a probability that the controller message isnot properly understood by the PF. In response to ahold clearance or an observed conflict the PF initiatesbraking of the aircraft, unless the cockpit of thecrossing aircraft is estimated to be already within acritical distance of the runway centre-line.
The runway controller visually monitors the trafficsituation on the runway. There is a probability thatduring monitoring an aircraft is not observed. Inresponse to an alert, the controller directly monitorsthe traffic situation and the TOPAZ controller modelupdates the SA. If the controller is aware that thecrossing aircraft has passed the stopbar then (s)hespecifies a hold clearance to both the crossing and thetaking-off aircraft.
Parameters jointly represented
As noted, the representations that the two simulationmodeling systems provide are in some ways similarand in others different. Upon examination of thesimilarities and differences of the models used for thesurface operation considered by Air MIDAS and bythe TOPZ-TAXIR toolset, a list of model parametersto be affected by the joint runs was identified. Theseparameters are grouped and provided as follows:• braking initiation times of pilots flying;• inter-monitoring time of pilot flying of
taxiing aircraft;• duration of visual observation of pilots
flying.
Braking initiation time of PF’s This parameter groupincludes the braking initiation times of pilots flyingof taking-off or taxiing aircraft in either tactical ofopportunistic mode, when they have become aware
149

of a conflict with the other aircraft. In an overview isprovided of the probability density functions (PDF’s)and related parameter values for Air-MIDAS and theoriginal and the modified TOPAZ-TAXIR. In allthree models equal PDF types and parameter valuesfor the braking initiation times are chosen for thepilots flying of the taking-off and taxiing aircraft,regardless of their cognitive control modes.
It was observed that in comparison to Air-MIDAS,the original TOPAZ-TAXIR has a smaller meanbraking initiation time, and a larger tail (probabilityof more than 5 s initiation time). In order to improveon these aspects, for the modified TOPAZ-TAXIRmodel the Rayleigh PDF has been selected. Theimprovements are:• its shape better fits to the Air-MIDAS data,• it supports positive values only,• has a more realistic tail than Gaussian PDFThe parameter value of the Rayleigh PDF has beenchosen such that its standard deviation equals thestandard deviation of the PDF chosen in Air-MIDAS.
Inter-monitoring time of PF of taxiing aircraft
It is assumed in TOPAZ-TAXIR that the inter-monitoring time of the pilot flying of the taxiingaircraft is independent from the cognitive controlmode of the pilot. In the original model this time wasrepresented by an exponential probability densityfunction. Simulations of Air-MIDAS resulted in adata-set of 536 inter-monitoring times of the taxiingpilot flying. These data were well represented by anexponential PDF. Therefore, in the modified modelthe inter-monitoring times of the taxiing PF are alsochosen from an exponential PDF with a mean equalto the estimated mean of the Air-MIDAS data.
Duration of visual observation of PF’s
This parameter group includes the visual observationtimes of pilots flying for the taking-off or taxiingaircraft in either tactical of opportunistic mode. ThePDF’s of these times in the original model areexponential PDF’s with a mean that is smaller in theopportunistic mode than in the tactical mode.Air-MIDAS simulations provided data on theduration of the tasks:• ‘Monitor Out The Window’ for the PF of the
taking-off aircraft, and• ‘Decide Action - Decide Take-off Spotted’
for the PF of the taxiing aircraft.These tasks were found to be in good agreement withthe visual observation tasks of the pilots flying of thetaking-off and taxiing aircraft, respectively. These
data were provided for the three control modes usedin Air-MIDAS.
Integration Impact on Collision Risk Model
In Table 2 the collision risk results of both versionsof TOPAZ-TAXIR are shown for three values of thedistance of the runway crossing with respect to therunway start threshold. It follows from these resultsthat the collision risks as evaluated by the modifiedmodel are smaller than those evaluated by theoriginal model and that the relative differences incollision risk tend to get larger for larger crossingdistances. In all cases, the difference between theresults is within a factor two.
Table 2: Collision risks evaluated by the originaland modified TOPAZ-TAXIR models for threecrossing distances.
Crossingdistance
OriginalCollision Risk(occurrence pertake-off)
ModifiedCollision Risk(occurrence pertake-off)
500 m 1.3 10-8 1.2 10-8
1000 m 1.1 10-8 7.1 10-9
2000 m 8.0 10-9 4.4 10-9
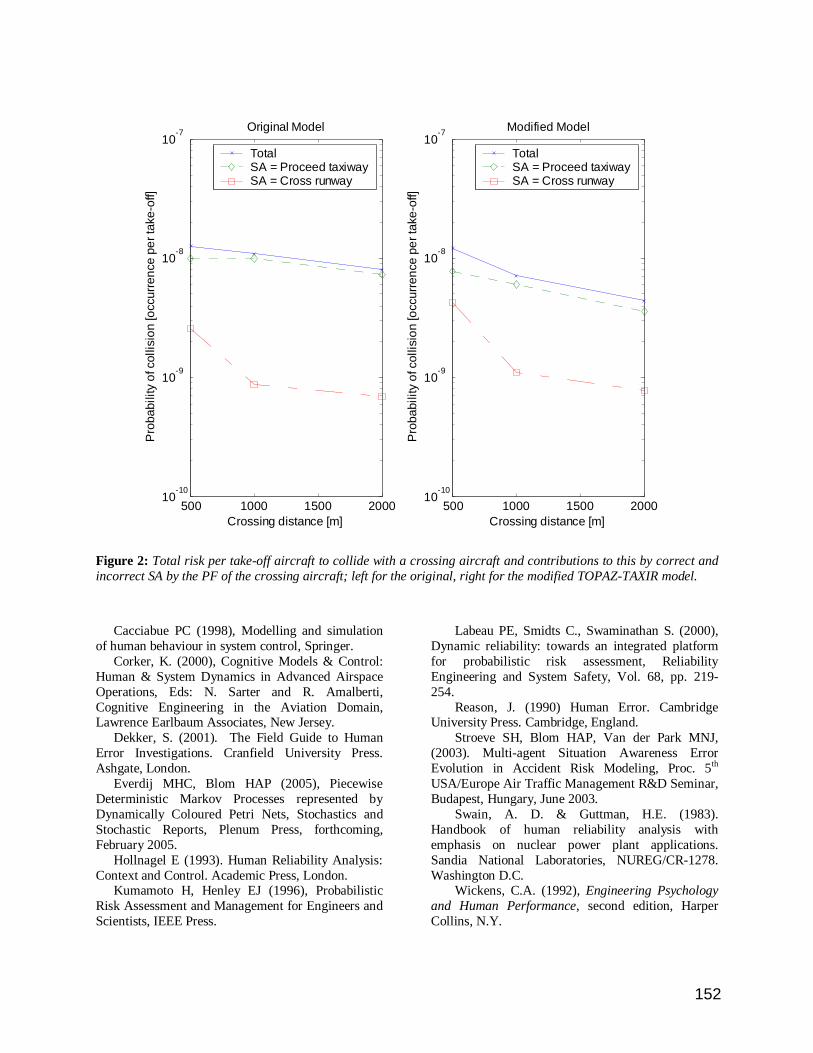
The collision risk value that result from the TOPAZ-TAXIR simulations is composed of risk contributionsfrom combinatorially many event sequences (Stroeveet al., 2003). In particular, the event sequence classesinclude the status of technical systems, such asalerting systems and communication systems, aircrafttypes, and human operator situation awareness. Sincethe adaptations of TOPAZ-TAXIR in the integrationprocess with Air-MIDAS all consider assumptionsregarding the behaviour of pilots flying, it isinteresting to compare the risk decomposition for apilot flying in the original and modified models. Inparticular, in Figure 2, collision risk results areshown for the situations that• the pilot flying of the taxiing aircraft believes
to be on a regular taxiway, or• The pilot flying of the taxiing aircraft
believes that runway crossing is allowed.
In the first case the pilot is lost, in the second casethe situation awareness corresponds well with theactual position of the aircraft. It can be observedin Figure 2 that in both the original and themodified model, the risk contribution for thesituation that the pilot is aware to be on a regulartaxiway exceeds the risk contribution for thesituation that the pilot is aware to be on a runwaycrossing. However, the difference between those
150

risk contributions is smaller in the modifiedmodel than in the original model.
On the one hand, the reduced difference in the riskcontributions between the model versions is due to anincrease in the risk contribution for the situation thatthe pilot flying is aware to be on a runway crossing inthe modified model. The model modifications thatmay effect this risk increase concern the brakinginitiation times by the pilots flying of both aircraft,and the duration of the visual observation tasks of thepilots flying of both aircraft.
For a further evaluation of the effects of thesemodifications a sensitivity analysis is required. As apreliminary finding, the risk increase is especiallydue to the increase in mean braking initiation timesand may be to a smaller extent due to the increase inmean visual observation time in the opportunisticmode.
On the other hand, the reduced difference in the riskcontributions between the model versions is due to adecrease in the risk contribution for the situation thatthe pilot flying is aware to be on a regular taxiway inthe modified model. The risk decrease in thissituation is effected by all model modifications. Thecombined effect of the changes in the brakinginitiation times and the visual observation times is arisk increase. The decrease in the mean inter-monitoring time of the pilot flying of the taxiingaircraft leads to a risk decrease because it causes thepilot to monitors for conflicting traffic more often.The combined effect turns out to decrease risk.
Conclusions
The results showed that the Air-MIDAS basedadaptation did lead up to a factor two reduction inassessed collision risk level. This result alonedemonstrates that it is feasible and useful to coupleAir-MIDAS and TOPAZ. More importantly thismeans that we have now running two humanperformance simulations for more or less the samesituation. This gave us the unique chance to makefurther comparisons between the two simulationapproaches.We examined the change in collision risk assessmentresultant from the integration of these two models. Inthe scenario examined, the actions of the flight crewand ATC are largely perceptual-motor response torunway incursion. The impact assessment reportedreflects the change in those characteristics. Morecomplex decision making or coordinated actionamong agents and safety augmentation technologieswould require full representation of the models of
those more complex interactions.In order to recognize the logical pattern in thesedifferences, one should be aware that both are aimedto assess quite different top-level metrics. Air-MIDAS top-level metric is the behavioral pattern ofhuman operators; while TOPAZ top-level metric iscollision risk. The implied focal attention in TOPAZis on performance, error making and errorpropagation among multiple agents versus memoryand task scheduling and performance in Air-MIDAS.For error mechanisms the error recovery model ofAmalberti & Wioland (1997) has been reported fortwo types of stress levels. This is reflected by the twocontrol modes of TOPAZ and avoids the need tomodel a lot of memory and task performancecharacteristics. In Air-MIDAS the adoption of theSkill Rule Knowledge (SRK) model of Rasmussenfor task performance leads to three control modes,and with this the need to model memory and taskscheduling and performance in detail. Thecomplementarity of TOPAZ and Air-MIDAS makesit so interesting to compare simulation resultsobtained by both approaches.
From a validation perspective both approaches havemuch in common: they produce results on basis ofcarrying out simulations with amathematical/computational model and by its verynature, a mathematical/computational model differsfrom reality. In order to validate amathematical/computational model in a systematicway, the following activities should be performed:• Identification of the differences between the
mathematical model and the reality, and• Assessment of the effect of these differences
on the value of the output metric(s).This validation process termed bias and uncertaintyassessment is scheduled to be undertaken for theintegrated simulations of Air-MIDAS and TOPAZ-TAXIR for the runway operation considered.
References
Amalberti R, Wioland L (1997), Human error inaviation, In: Aviation safety, pp. 91-108, H. Soekkha(Ed.), 1997.
Blom HAP, Bakker GJ Blanker PJG, Daams J,Everdij MHC, Klompstra MB (2001a). Accident riskassessment for advanced air traffic management, Eds:GL Donohue and AG Zellweger, Air transportationsystems engineering, AIAA, pp. 463-480.
Blom HAP, Stroeve SH, Everdij MHC, VanderPark MNJ (2003), Human cognition perfromancemodel to evaluate safe spacing in air traffic, HumanFactors in Aviation Safety, Ashgate, Vol. 3, pp59-82.
151
500 1000 1500 200010
-10
10-9
10-8
10-7
Crossing distance [m]
Pro
babi
lity
of c
ollis
ion
[occ
urre
nce
per t
ake-
off]
Original Model
TotalSA = Proceed taxiwaySA = Cross runway
500 1000 1500 200010
-10
10-9
10-8
10-7
Crossing distance [m]
Pro
babi
lity
of c
ollis
ion
[occ
urre
nce
per t
ake-
off]
Modified Model
TotalSA = Proceed taxiwaySA = Cross runway
Figure 2: Total risk per take-off aircraft to collide with a crossing aircraft and contributions to this by correct andincorrect SA by the PF of the crossing aircraft; left for the original, right for the modified TOPAZ-TAXIR model.
Cacciabue PC (1998), Modelling and simulationof human behaviour in system control, Springer.
Corker, K. (2000), Cognitive Models & Control:Human & System Dynamics in Advanced AirspaceOperations, Eds: N. Sarter and R. Amalberti,Cognitive Engineering in the Aviation Domain,Lawrence Earlbaum Associates, New Jersey.
Dekker, S. (2001). The Field Guide to HumanError Investigations. Cranfield University Press.Ashgate, London.
Everdij MHC, Blom HAP (2005), PiecewiseDeterministic Markov Processes represented byDynamically Coloured Petri Nets, Stochastics andStochastic Reports, Plenum Press, forthcoming,February 2005.
Hollnagel E (1993). Human Reliability Analysis:Context and Control. Academic Press, London.
Kumamoto H, Henley EJ (1996), ProbabilisticRisk Assessment and Management for Engineers andScientists, IEEE Press.
Labeau PE, Smidts C., Swaminathan S. (2000),Dynamic reliability: towards an integrated platformfor probabilistic risk assessment, ReliabilityEngineering and System Safety, Vol. 68, pp. 219-254.
Reason, J. (1990) Human Error. CambridgeUniversity Press. Cambridge, England.
Stroeve SH, Blom HAP, Van der Park MNJ,(2003). Multi-agent Situation Awareness ErrorEvolution in Accident Risk Modeling, Proc. 5th
USA/Europe Air Traffic Management R&D Seminar,Budapest, Hungary, June 2003.
Swain, A. D. & Guttman, H.E. (1983).Handbook of human reliability analysis withemphasis on nuclear power plant applications.Sandia National Laboratories, NUREG/CR-1278.Washington D.C.
Wickens, C.A. (1992), Engineering Psychologyand Human Performance, second edition, HarperCollins, N.Y.
152

AB INITIO TRAINING IN THE GLASS COCKPIT ERA:NEW TECHNOLOGY MEETS NEW PILOLTS
A Preliminary Descriptive Analysis
Paul A. Craig, John E. Bertrand, Wayne Dornan, Steve Gossett, Kimberly K. ThorsbyMiddle Tennessee State University
Murfreesboro, Tennessee
The Aerospace Department at Middle Tennessee State University and the NASA Langley Research Centerentered into a cooperative agreement in 2003. The project is named the SATS Aerospace Flight EducationResearch (SAFER) and is part of NASA’s Small Aircraft Transportation System (SATS) initiative. TheSATS project envisions a future flight environment that employs small aircraft to transport people andcargo from point to point using smaller, under utilized airports instead of major gridlocked airports. Theaircraft used in the SATS vision would take advantage of a range of emerging technologies including glasscockpits, new structures, and new engines. But with the understanding that the best aircraft and the bestsystems are still only as good as its operator, MTSU Aerospace set out to explore how pilot training mightbe different in the SATS environment. The SAFER project therefore takes beginner pilots and completestheir initial Visual Flight (VFR) and Instrument Flight (IFR) flight training in technically advanced aircraftto determine how best to educate the next generation of pilots in the next generation of aircraft.
Introduction
Once the use of “glass cockpit” technology wasreserved for airline and military flight crews.Today this technology can be purchased off-the-shelf from several general aviation aircraftmanufacturers. Placing a general aviation pilotdirectly into such a sophisticated cockpit hasmany worried. The General Aviation TechnicallyAdvanced Aircraft (TAA)– Safety Study (2003)has already identified several accidents attributedto the fact that the pilots were not familiar withthe technology available to them in their aircraft.Several studies are underway to aid pilots as theytransition from round-dial airplanes tocomputerized flight displays – but that is not theemphasis of the study at MTSU. The SAFERproject brings in potential pilots with little or noprevious experience and teaches them to fly fromthe beginning with TAA.
The Students
All the students of the SAFER project arecollege students majoring in Aerospace atMiddle Tennessee State University. To becomeeligible for the SAFER project students had tomeet two criteria. First, they must have alreadybeen accepted into the program’s flightlaboratory, which requires a 2.5 cumulativecollege GPA, or a 2.8 high school GPA forincoming freshman students. Second, thestudents must have had less than five flight hoursof experience with a flight instructor. Fifteenstudents formed the first cohort of SAFERstudents. The training began in September 2004
as the fall semester started. The second cohortbegan in January 2005 as the spring semesterstarted.
The Training Syllabus
The features of the Garmin G-1000 system makeit possible to blend the world of visual flight andthe world of instrument flight – but that is not thetraditional way that students are taught today.Students are taught visual flying first and pass aseries of tests to obtain the Private PilotCertificate. The Private Pilot then takes onadditional training and testing to becomeInstrument Rated and this allows the pilot to flyin and through the clouds. The Primary FlightDisplay of the G-1000 provides a representationof the horizon that is far advanced from basicattitude gyro indications. The system, in effect,turns a dark night into daylight, and clouds intoclear weather. The researchers wanted to takeadvantage of this capability and sought to teachthe new students both the visual and instrumentskills all at once.
Part of the cooperative agreement with NASAcalled for the SAFER project to work inconjunction with the FAA Industry TrainingStandards (FITS) initiative. The FITS group hadpreviously developed a generic flight trainingsyllabus that combined the training for bothPrivate Pilot and the Instrument Rating into one.The SAFER team took the generic FITScombination syllabus and rewrote it for specificuse at MTSU. In time, the syllabus was approvedby the FAA under Part 141 and added to
153

MTSU’s existing Air Agency Certificate. TheMTSU version of the FITS syllabus (2004)became the first combination Private andInstrument Course for Technically AdvancedAircraft ever approved by the FAA.
The syllabus was unique in two other importantways. First, the entire combination Private andInstrument course is scenario based.Traditionally, pilots are trained using a series ofmaneuvers that the student masters with drill andpractice. The SAFER syllabus still teaches basicskills, sometimes referred to as “stick andrudder” skills, but instead of drill and practice,the maneuver is incorporated into an overallscenario lesson. The very first lesson of theSAFER syllabus is a flight to another airport – amission, rather than a set of maneuvers. Thesecond unique feature of the SAFER syllabus isthat it has no minimum flight time requirements.Traditionally trained students must meet severalminimum flight time requirements to move fromone step to another and to receive FAA pilotcertification. It would be possible for a pilot tohave achieved an acceptable performance levelin a particular area of training, but still berequired to take additional training just to reachthe minimum flight time number. Students in theSAFER project are judged by performance onlynot flight time. When students complete eachlesson of the SAFER syllabus they arerecommended for testing regardless of howmany or how few flight hours they have accrued.
The FAA Exemption
A major problem for the SAFER students is thatthey are training in a time of transition. Thesyllabus that they use and the airplane that theyuse are all new, but the FAA testing is old.Today, the Code of Federal Regulations 14, Part61.65(a)(1) (2005) requires that an applicant forthe Instrument Rating, already be the holder ofthe Private Pilot Certificate. But the SAFERsyllabus bypasses the Private Pilot test whenstudents would otherwise be eligible to take it.Instead, the SAFER students remain as studentpilots until the day that they take thecombination test and become Private Pilots andInstrument Pilots all at once. So the SAFERsyllabus, is in fact, in violation of the FederalAviation Regulations. To remedy thisincongruency, the SAFER researchers petitionedthe FAA for relief from 61.65(a)(1) and onDecember 10, 2004, the FAA granted anexception to this rule for the SAFER project.
FAA exemption number 8456 (2004) allows theSAFER students to take a single practical test togain both Private Pilot and Instrument Pilotprivileges. The exemption came with a newPractical Test Standard (PTS) that is to be usedby a pilot examiner when administering thecombination test. The exemption has only beengranted to MTSU and the SAFER project andextends until December 1, 2006.
The exemption has not eliminated all “old versusnew” roadblocks to the training. The SAFERstudents still are required to take two knowledgetests that are administered via computer. The twotests contain questions that are not applicable totechnically advanced aircraft. The new PTS thatcame along with the exemption is better than twoseparate tests, but still requires many drill-and-practice type maneuvers that do not match wellwith the SAFER scenario based syllabus. Thisforces the SAFER students to step out of the roleof the scenario and occasionally revert back topure maneuver practice simply to meet therequirements of the test. Using the old form oftesting with the new form of training has becomea very real impediment to the students thatlengthens the time of training and pushesinstructors to “teach to the test” rather than“teach for the real world” as the SAFER projectintends to do.
The Methodology
The researchers of the SAFER project are in thepreliminary stages of the data collection. Theproject is on going and the final report offindings will come at the conclusion of theproject. The researcher are gathering data to helpanswer some of the basic research questions: Ifyou teach people to fly from the very beginningusing glass cockpits, are there any topics and/orskills that have been taught traditionally that arenow no longer necessary? Will glass cockpitscreate new challenges for beginners that have notbeen contemplated previously? Can pilots learnessential skills faster and more completely usingTAA? To help find some answers, theresearchers started a comparison between theSAFER students and the performance of paststudents that were taught in traditional ways.
The Airplanes
In 2003, the Aerospace Department was able topurchase 25 new airplanes for their professionalpilot degree program. Of these, eleven were
154

Diamond DA40s. As a part of the NASAcooperative agreement, five of the DA40s cameto MTSU with the Garmin G-1000 glass cockpitsystem installed. These five airplanes were takenout of the traditional flight training fleet and areused exclusively within the SAFER project.
Early Findings
The researchers first looked backward toevaluate traditional flight training from the firstflight until a person became an Instrument RatedPilot. The pilot training records of past studentsserved as archival data of traditional flighttraining. Nineteen past student training recordswere used in the study. Researchers took thetraining records of students who had taken boththeir Private Pilot and Instrument Pilot trainingall at MTSU and all used the traditional FAAapproved syllabus. The traditional syllabusadopted by MTSU and approved by the FAA isthe Jeppesen Private Pilot Syllabus (2002) andthe instrument portion of the JeppesenInstrument and Commercial Syllabus (2003).The two publications are commercially availableand widely used as an industry standardthroughout civilian flight training. Thetraditional path from first flights to InstrumentRated pilot goes first through the Private Pilotcurriculum and testing, then through a series ofvisual flights to other airports (cross country),and finally to the specific training that leads totesting for the Instrument Rating.
Bottlenecks
Using the archival data provided by the FAAtraining records, the researchers examined theprocess of traditional training. What wasdiscovered was a pattern of predictablebottlenecks throughout the training. Abottleneck, for this purpose, is defined as alesson or area of training that requires the studentto receive additional instruction, beyond thatwhich is prescribed in the FAA syllabus, to reachmastery of that lesson or area. These bottlenecksrepresent areas that are more difficult forstudents, in that it requires more training toachieve the completion standards. One of thebasic research questions is: Do the SAFERstudents experience the same bottlenecks in theirtraining as traditional students do? WouldSAFER students have less problems, or differentproblems than their counterparts who receivedthe type of training that is available nationwideto the general public and to other college
students? In order to answer this question theresearchers first identified the traditionalbottlenecks in the three phases of the training:Private Pilot, Cross Country, and Instrument.
00.5
11.5
22.5
33.5
44.5
P1 P4 P7P10 P13 P16 P19 P22 P25
Target Time
Average Time
Figure 1. Private Pilot Bottleneck. Flight Hoursversus Lesson Numbers.
Figure 1 illustrates the bottlenecks faced bytraditional students during their Private Pilottraining. The Target Time or recommendednumber of flight hours that should allow masteryin the topics and maneuvers contained in thelesson. The Target Time comes from theJeppesen Private Pilot syllabus. The AverageTime is the actual average hours it took for thetraditional students to achieve mastery. It is clearthat there are two predictable bottlenecks in thiscurriculum: Lessons 7 - 9, and Lessons 17 – 18.Lessons 7, 8, and 9 occur just prior to thestudents first solo flight. Lessons 17 and 18cover cross-country navigation planning.
0123456
XC30XC32
XC34XC36
XC38XC40
XC42XC44
Target Time
Average Time
Figure 2. Cross Country Bottlenecks. FlightHours versus Lesson Numbers.
Figure 2 illustrates the relationship between thetarget flight hours and the actual average timestudents needed in the cross-county phase. AsFigure 2 indicates, students have few bottlenecksin this part of the curriculum. In fact, fromLessons 36 – 42, the students are actually flying
155

less than prescribed. These lessons each require aflight to another airport with varying distances,but all greater than 50 nautical miles. Onepossible reason for the fact that average flighttime is less than prescribed time in Lessons 39through 42 is so students can make up for timeoverruns during the Private Pilot phase oftraining. If a student passes the Private Pilot testswith above average total flight time, this couldbe made up by undercutting the prescribed cross-country flight time.
0
1
2
3
4
5
6
7
IFR1 IFR4 IFR7 IFR10 IFR13 IFR16 IFR19 IFR22 IFR25 IFR28
Target Time
Average Time
Figure 3. Instrument Rating Bottleneck. FlightHours versus Lesson Numbers.
Figure 3 illustrates that last portion of the path tothe Instrument Rating – the actual instrumenttraining. Three bottlenecks are evident in theJeppesen syllabus for instrument lessons: Lesson12, Lessons 20 and 21, and Lesson 27. Lesson 12contains the skill of VOR tracking and radialintercepting as well as partial panel tracking.Lessons 20 and 21 contain the ILS instrumentapproach, including the partial panel ILS. Lesson27 is an instrument cross-country review flight.
Setbacks
Figures 1, 2, and 3 all illustrate the averagenumber of flight hours that was required bystudents to reach mastery on that lesson. Theresearchers also observed the number of“setbacks” that a student experienced. A setback,in this case, is the need for a student to repeat alesson that was previously flown. Among thearchival data retrieved from the traditionalstudent’s training records, 449 setbacks werediscovered. Of these, 77 setbacks took place justprior to the first solo flight – an area identified asa bottleneck in Figure 1. This number is 17.1%of all the setbacks experienced by traditionalstudents. Setbacks continued for the traditionalstudents throughout the remainder of thecurriculum: 37.6% of the setbacks occurred
during the Private Pilot and Cross Countryphases of training past the first solo, and 45.2%of the setbacks took place within the instrumentphase of the training. This tends to indicate thattraditional students run into difficult lessonsthroughout the entire curriculum in all phases ofPrivate, Cross Country and Instrument – there isnever a time when it becomes “easier” for them.First SAFER Student DataSince the SAFER syllabus does not haveminimum flight times for the course or for eachlesson, there is no target flight time number tocompare with actual flight time averages, as wasthe case with the traditional students’ data. Thismakes a direct comparison between Traditionaland SAFER student performance more difficult.Also, the Traditional students and the SAFERstudents do not come across the same topics inthe same order, so a lesson-by-lessoncomparison is also not direct. However, over thecourse of the SAFER syllabus, the same set ofmastery skills are required, so an evaluation ofstudent setbacks among the groups is possible.
The SAFER students within the first cohortexperienced a total of 97 setbacks. Again, asetback is a repeated lesson. Lessons from bothtraditional and SAFER syllabi require a masteryof the subject matter before the student moves onto the next lesson, so a repeated lesson indicatesthat the student had difficulty with the subjectmatter contained in the lesson. Of the 97setbacks, 59 took place among the SAFERstudents in the first nine, pre-solo lessons. Thisrepresents 60.8% of the total setbacks. Thetraditional students only had 17.1% of theirsetbacks occur during this portion of thecurriculum.
Traditional SAFER Pre Solo 77 of 449 17.1% 59 of 97 60.8% Pvt & X-C 169 of 449 37.6% 15 of 97 15.4% Instrument 203 of 449 45.2% 23 of 97 23.7%
Table 1. Setback Percentages
Table 1 presents the comparison of setbacksamong the two pilot groups. The traditionalstudents had far fewer setbacks in the early, pre-solo training, but their setbacks increase as theyprogress through the syllabus. The SAFERstudents had the greatest difficulty early on, buttheir setbacks diminished as they continuedthrough the SAFER syllabus.
156

Skills Comparison
The lessons in the traditional curriculumproduced student bottlenecks at Private Pilotlessons 7, 8, 9, and 17, and in the Instrumentsyllabus at lessons 12, 20, 21, 24, and 27. Theselessons each contain many maneuvers andprocedures embedded within each lesson, butthere is a main area of lesson emphasis in eachcase. A bottleneck is an area in which studentsexperience difficulty, so the main area of thatlesson’s emphasis would therefore be the sourceof that difficulty. Takeoff, landing, andemergency procedures present a significantchallenge to all beginning flight students –especially landings. Evidence of this fact isshown by the bottleneck present with traditionalstudents at lessons 7, 8, and 9, and by thedisproportionately large number of setbacks atLesson 9 for the SAFER students. This is thephase of flight where Traditional students outperformed the SAFER students – see Table 1where just prior to solo is where 60% of allSAFER setbacks took place and where only 17%of Traditional students setback took place.Beyond this phase of flight training however, theSAFER students reduced their number ofsetbacks precisely in areas where Traditionalstudent hit bottlenecks.
On Lesson 17, Traditional students hit abottleneck – see Figure 1. This area of emphasisis Cross Country Flight Planning. This lessonrequires the student to obtain and assess weatherinformation that is pertinent to a proposed visualflight. The student must plan a course of flightallowing for wind drift. The student mustcalculate time, speed, and fuel consumption forthe flight and become extremely familiar withaeronautical charts that depict the terrain featuresthat the flight will traverse. Many traditionalstudents experience a setback at this point,requiring repeat lessons and often multiplerepeated lessons. Among the Traditional studentsthere was 0.75 setbacks per student on Lesson17. In the SAFER syllabus, Lesson 11 is the firstlesson in which Cross Country Flight Planningbecomes the complete responsibility of thestudent. Note that SAFER students startconducting mission-oriented flights to otherairports from Lesson 1, so at this point they havealready been exposed to the elements of CrossCountry Planning. SAFER students experiencedvery few setbacks – an average of only 0.18setbacks per student on Lesson 11.
Holding patterns prove to be difficult forstudents when learning the basics of instrumentflying. Figure 3 indicates a gap between thetarget flight time and the actual flight timerequired to master Holding Patterns at Lessons14, 15, and 16. Traditional students had 1.06setbacks per student through these lessons.SAFER students also had difficulty with HoldingPatterns. SAFER Lessons 24 and 25 coverHolding Patterns and students on these twolessons had an average of 0.85 setbacks perstudent.
One of the two largest bottlenecks that faced theTraditional students in the Instrument phase oftraining took place at Lesson 20 – 22. Lessons20, 21 and 22 require the student to meetcompletion standards in the skills of InstrumentLanding System (ILS) approaches and PartialPanel Approaches. The ILS requires excellentfinesse of the airplane and Partial Panel workrequires excellent situational awareness. Elevenpercent of all Traditional student setbacksoccurred in these three lessons alone, producingan average of 3.2 setbacks per student. At Lesson22 of the SAFER syllabus, students have beentracking the ILS localizer for several lessons, butLesson 22 is where full ILS and Partial Panelapproaches are among the completion standards.SAFER students had no setbacks on Lesson 22.
The final test of an instrument pilot’s readiness isIFR Flight Planning. This requires the instrumentpilot to plan and assess the weather, and theweather minimums. The pilot must calculatespeed, time, and fuel consumption, but also planon a flight to an alternate airport if the weather isunsuitable at the intended destination. The pilotmust be able to file and later receive an IFRclearance and be able to expertly communicatewith air traffic controllers all through the flight.Traditional students had a setback at this lessonwith an average of 1.18 setbacks per student. Therecommended amount of flight time to completethis lesson is 2.0 flight hours. Traditionalstudents however took 5.8 hours, on average, tomeet the completion standards of the lesson. Inthe SAFER syllabus, the IFR Flight Planningreview lesson is number 26. No SAFER studentshad a setback on Lesson 26.
A comparison of average student setbacks acrossthe entire curriculum reveals that SAFERstudents have more setbacks in the pre-solophase than do the Traditional students. ButTraditional students continue to have setbacks in
157

rising numbers throughout, while SAFERstudents have a reduction in setbacks. Figure 4illustrates the average number of setbacks amongstudent for the Pre-solo lesson, the remainder ofthe Private and Cross Country training, and theInstrument Rating instruction.
02468
101214
Start Presolo Pvt X-C IFR
SAFER
Traditional
Figure 4. Setbacks per student. Traditionalstudents versus SAFER students.
Conclusions
The researchers understand that we are dealingwith small groups and that much more data mustbe taken before any claims can be made. But atthis point the SAFER students have a greaternumber of setbacks in the lesson just prior to thefirst solo flight than do traditional students. Theflight instructors that teach in the SAFER projectsay that the SAFER syllabus is very “front endloaded.” This means that SAFER students arebeing taught cross-country flight planning,navigation, and instrument flight principles allbefore the first solo. The evidence, includingFigure 4, seems to suggest that SAFER studentspay a penalty for this expanded curriculum at thevery start of the course. Traditional students arenot taught cross country planning, navigation,and instrument principles before solo, and spendtheir time practicing takeoffs and landings inanticipation of the first solo. This focusedattention on solo among traditional students maybe why they perform with fewer setbacks in thepre-solo phase. But it appears that the “penalty”the SAFER students pay in the early lessons, arerepaid later in the syllabus. The SAFER studentsseem to start reaping the rewards of theirexpanded curriculum after the first solo as theneed for repeat lessons drops off to an average ofonly 0.76 setbacks per student between solo andthe end of the SAFER stage 2 – which isapproximately the cross country stage forTraditional student. Traditional students at thispoint experience an average of 9.73 setbacks.The evidence indicates that the largest benefit ofthe SAFER project is toward the end when both
groups are preparing for the tests that cover theInstrument Rating. In that last phase of trainingthe Traditional students had an average of 11.73setbacks each, while the number of averagesetbacks among SAFER students was 1.76 each.
All the data presented here should be consideredpreliminary. The second SAFER cohort isunderway at the time of this writing and theresearchers will wait to see what additional datawill bring to the conclusions. It is important toemphasize here that one of the overriding interestof the SATS program is to see if pilots can betrained in technically advanced aircraft that willmeet or exceed the current training standards andto accomplish this in less time and with lessmoney. The early information shows that theSAFER students who have completed theprogram and passed the combination PrivatePilot and Instrument Rating test have done sowith an average of 88.66 flight hours. Thestudent who followed the traditional pathcompleted the Instrument Rating at an average of134.3 flight hours. The difference between theaverages is approximately 45 hours. Forty-hoursof flight instruction and airplane rental could costthe pilot approximately $6,000.
Although early in the project, the researchers areconfident that the use of “glass cockpit”technology together with scenario training hasgreat promise. Data from the remainder of theSAFER project will produce a list of “bestpractices” for flight instructors to use whenteaching in TAAs. Ultimately, the project shouldlead to improvements and alterations to howpilots are to be trained in an environment ofemerging technologies.
References
Code of Federal Regulations 14, Part61.65(a)(1). (2005). FITS Scenario Based Private/Instrument PilotCertification Course Syllabus. (2004).Murfreesboro, TN: MTSU Aerospace. Instrument Commercial Syllabus. (2003).Englewood, CO: Jeppesen Sanderson, Inc. Private Pilot Syllabus. (2002). Englewood,CO: Jeppesen Sanderson, Inc. Regulatory Docket Number FAA-2004-19151.Exemption Number 8456. (2004). FederalAviation Administration. General Aviation TAA Safety Study. (2003).Federal Aviation Administration.
158

COMPLEXITY MITIGATION THROUGH AIRSPACE STRUCTURE
M.L. Cummings, C.G. TsonisMassachusetts Institute of Technology
Cambridge, MA
D.C. CunhaInstituto Tecnológico de Aeronáutica
São José dos Campos, SP, Brazil
Cognitive complexity is a term that appears frequently in air traffic control research literature, yet there has not beena significant distinction between different components of complexity, such as environmental, organizational, anddisplay complexity, all which influence cognitive complexity. It is not well understood if and how these differentsources of complexity add to controller cognitive complexity and workload. In order to address this need forcomplexity decomposition and deconstruction, an experiment was conducted to explore whether or not differentcomponents of complexity could be effectively measured and compared. The goal of the experiment was to quantifywhether or not structure in airspace sector design, in combination with changes in the external airspace environment,added to or mitigated perceived complexity measured through performance. The results demonstrate that for arepresentative ATC task, the dynamic environment complexity source was a significant contributor to performance,causing lower performance scores. There was no apparent effect, either positive or negative, from increasingairspace structure represented through a display.
Introduction
Addressing the difference between environmentaland innate human complexity (often referred to ascognitive complexity), Herb Simon describes an ant’spath as it navigates across a beach. The anteventually reaches its destination, but because the antmust constantly adapt its course as a result ofobstacles, the path seems irregular, laborious, andinefficient. Simon points out that while the ant’s pathseems complex, the ant’s behavior is relativelysimple as compared to the complexity of theenvironment. Simon proposes the followinghypothesis as a result, “Human beings, viewed asbehaving systems, are quite simple. The apparentcomplexity of our behavior over time is largely areflection of the complexity of the environment inwhich we find ourselves (Simon, 1981, p. 53).”
This distinction between innate or cognitivecomplexity and environmental complexity isespecially relevant considering the considerableresearch conducted in air traffic controller cognitivecomplexity. Several studies have investigated airtraffic control (ATC) information complexity issues(see Hilburn, 2004; Majumdar & Ochieng, 2002) fora review). In this literature, several commoncomplexity factors have emerged to include trafficdensity, traffic mix, aircraft speeds, sector size, andtransitioning aircraft. These factors are asserted toaffect cognitive complexity. However, in light ofSimon’s ant parable, these factors really representenvironmental complexity factors that influencecognitive complexity. This is an important distinction
because as can be seen in Figure 1, there are severallevels of complexity that can affect an individual’scognitive complexity level.
Figure 1 illustrates the decomposition of“complexity” as it applies to human supervisorycontrol systems. Human supervisory control (HSC)occurs when a human operator intermittentlyinteracts with an automated system, receivingfeedback from and providing commands to acontrolled process or task environment (Sheridan,1992). In complex HSC systems, in general twolayers of interventions, organizational and displaydesign can exist to mitigate environmentalcomplexity, and thus reduce cognitive complexity.Organizational interventions include goals, policies,and procedures such as separation standards,checklists, airspace structure, etc. For example, manyairspace sectors are designed to promote predominant
Figure 1: Human Supervisory Control Complexity Chain
159

traffic flows. Thus the design and the associated rulesand procedures for control mitigate environmentalcomplexity caused by increasing numbers of planes.However, when airspace becomes obstructed andsaturated due to weather, congestion, etc., the need tofollow procedures and sector limitations can over-constrain a problem, thus increasing the perceivedcomplexity by the controller.
Displays are another example of intendedcomplexity mitigation which could inadvertentlyadd to complexity instead of reducing it. For airtraffic controllers and in general all HSC operators,displays are critical in representing the environmentso that a correct mental model can be formed andcorrect interactions can take place (Woods, 1991).In effect, to mitigate complexity, displays shouldreduce workload through transforming high-workload cognitive tasks such as mentalcomputations into lower workload tasks throughdirect perception, i.e. visually (Miller, 2000).However, in complex and dynamic HSC domainssuch as ATC, it is not always clear whether adecision support interface actually alleviates orcontributes to the problem of complexity.
Complexity and Structure
In addition to traffic density and related factors, it hasalso been hypothesized that the underlying airspacestructure is a critical complexity factor (Histon et al.,2002). In theory, airspace structure provides thebasis for mental abstractions which allows controllersto reduce complexity and maintain situationawareness. Histon et. al., (2002) propose that thesemental abstractions, known as structured-basedabstractions, can be generalized to standard flows(reminiscent of Pawlak’s (1996) “streams”),groupings, and critical points. Providing air trafficcontrollers with these interventions, either explicitlythrough design or implicitly through policy, shouldhelp controllers improve through mental models,reduce overall complexity, as well as reduceperceived workload.
In a study investigating judgment and complexity,Kirwan et al., (2001) determined that airspace sectordesign was only second to traffic volume, in terms ofcontributing to cognitive complexity. In terms of themodel in Figure 1, airspace sector design straddlesboth the organizational and display complexitycategories. Designed by humans to mitigateenvironmental complexity, airspace structure is anorganizational policy. However, airspace structurecontains significant visual components represented indisplays, thus it is an environmental complexity
intervention both from an organizational anddisplay perspective.
Including interventions in airspace sector design suchas critical points (points through which aircraft mustpass) and designated standard flows (such as jetways) can increase order and improve predictability,and thus lower cognitive complexity. However, it isalso possible that when uncertainty levels increase,usually as a function of dynamic environmentalfactors such as changes in weather and availableairspace, these same airspace structures couldactually add to complexity since a controller’s mentalmodel of the airspace design must be adapted to thenew conditions. Airspace structure and proceduresmitigate complexity in what are termed “nominal”situations, but when an “off-nominal” conditionoccurs, such as an emergency or unexpected weatherphenomena, the resultant increasing uncertaintycauses complexity to grow (Athenes, Averty,Puechmorel, Delahaye, & Collet, 2002).
While other research has attempted to quantify theindividual elements of complexity as a function oftraffic flow (Masalonis, Callaham, & Wanke, 2003),little attention has been directed towardsunderstanding the different sources of complexitysuch as depicted in Figure 1. In addition it is not clearif and how these different sources of complexity addto controller cognitive complexity. In order toaddress this need for complexity decomposition anddeconstruction, an experiment was conducted toexplore whether or not elements of complexity asdepicted in Figure 1 could be effectively measuredand compared.
Method
Apparatus, Participants, and ProcedureTo objectively investigate the impact ofenvironmental and structural complexity factors oncontroller performance, a human-in-the-loopsimulation test bed was programmed in MATLAB®
(Figures 2 & 3). Since the subject pool consistedprimarily of college students, it was necessary todevise a simplified and abstract task that addressedthe aforementioned complexity concerns, but stillrepresented fundamental elements of ATC. In asimplified en route task, subject controllers wereassigned a single sector, and were only required toprovide heading commands to aircraft, whilevelocities and altitudes were held constant.
Twenty egress areas were located in the periphery ofthe sector, and each incoming aircraft was assigned aspecific egress point. The primary goal was to direct
160

the aircraft (a/c) to the assigned egress, and when anaircraft exited correctly, a score was generated. Toprovide an incentive for flying through a pre-determined sequence of waypoints (representative ofa flight plan), subjects could collect additional pointsby directing their a/c through these waypoints. Thenumber of points that could be won at everywaypoint was displayed. To discourage controllersfrom directing aircraft through unnecessarywaypoints just to gain points, scores were penalizedbased on an aircraft’s total time of presence in theairspace sector beyond that expected for the optimalpre-determined path. A final component of theoverall score was the penalty for flying through a no-fly-zone. No-fly zones represented constrained ATCairspace such as thunderstorms, military operatingareas, and prohibited areas. Example waypoints,optimal paths for particular ingress and egress points,and no-fly zones are represented in Figure 2.Maximization of total score was the subjects’ goal,and their total score was displayed in real-time.
Figure 2: Interface with optimal paths shown
Training and testing were conducted using a Dellpersonal computer with a 21-inch color monitor, 16-bit high color resolution, and a 3.0GHz Pentium 4processor. During testing, all user responses wererecorded in separate files specific to each subject andscenario. A Visual Basic script was then written thatscored and compiled the data into a singlespreadsheet file for the subsequent statistical analysis.After signing required consent forms, subjectscompleted a tutorial that discussed the nature of theexperiment, explained the context and use of theinterface, and gave them the opportunity tounderstand the scoring mechanism. Subjectscompleted four practice scenarios that exposed them
to every combination of independent variables. Theythen began the randomly ordered four test sessions,which also lasted until all aircraft had exited theairspace (approximately 6-7 minutes).
Experimental Design
Two independent variables were investigated. Thefirst independent variable was the presence ofstructure, as displayed through the lines of maximumscore (named “displayed structure”). As can be seenin Figure 2, in certain scenarios subjects were givenstructure through the display of the optimum paths(those that maximized the score as a function ofwaypoints and time). In the counter condition,subjects were given the waypoints (along with thenumber of available points), but were not shown theoptimal path (Figure 3).
Figure 3: Interface with dynamic no-fly-zones
The second independent variable was the condition ofthe environment in terms of either static or dynamicno-fly-zones. In the dynamic condition, the no-fly-zones moved at rates of about two-fifths the aircraftvelocity (figure 3), and representing changes inconstrained airspace that often occur such as weatherfronts and special-use airspace. It is important to notethat the displayed lines were the optimum, but only incases where they were not obstructed. In the dynamiccondition, the dynamic no-fly zones cases wouldsometimes cover the paths, and thus the controllerhad to mentally regenerate new optimal paths. Themotivation was to investigate whether or not suchvisual structure in an airspace sector, in combinationwith changes in the external airspace environment,added to or mitigated perceived complexity measuredthrough performance.
161
A single dependent variable of total performancescore was used. As described previously, the scorewas a linear and weighted function of aircraft egresscorrectness, bonus waypoints with penalties for no-fly-zone violations, and total time transitioning insector. In the case of egress score, subjects receivedmaximum points by directing their a/c to exit near thecenter of the egress, but did not receive points forexiting through the wrong egress. The egress scoresdecreased linearly from the center to the markededges of the egress blocks. To maintain consistentscenario level of difficulty in order to minimize anylearning effect, the four experimental scenarios wereninety degree rotations of each other. The statisticalmodel used was a 2x2 fully crossed ANOVA and thefour scenarios were randomly presented to a total of20 subjects.
Results and Discussion
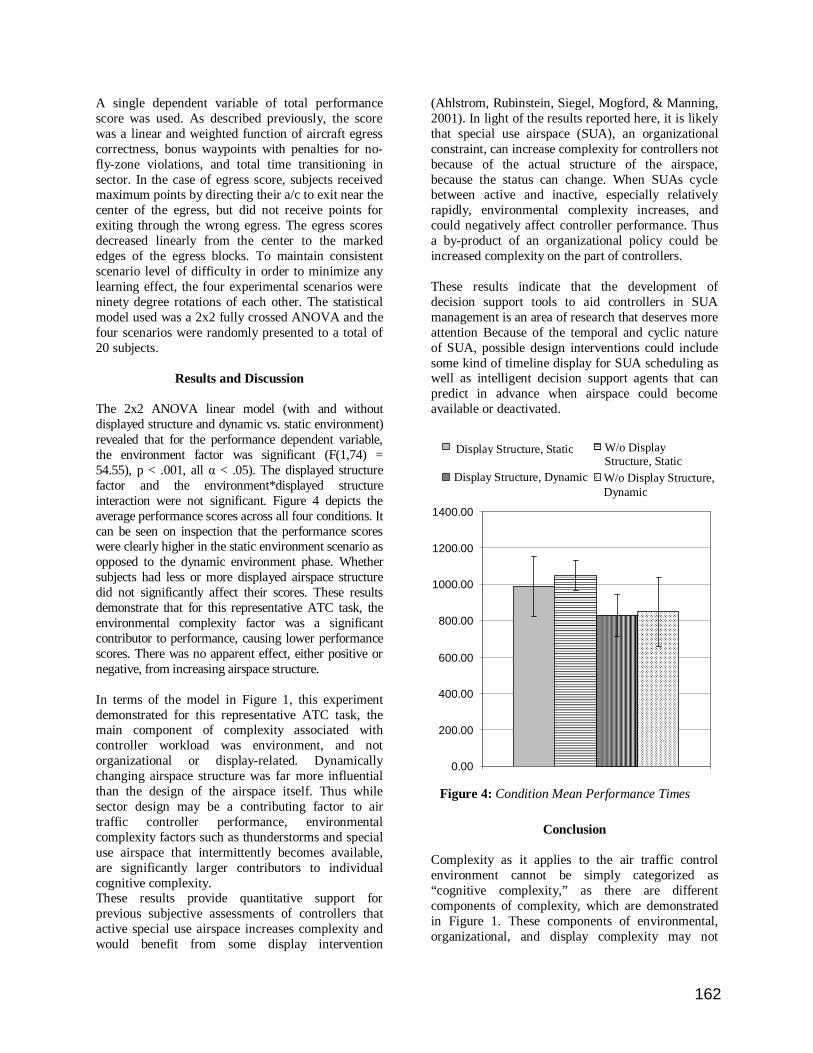
The 2x2 ANOVA linear model (with and withoutdisplayed structure and dynamic vs. static environment)revealed that for the performance dependent variable,the environment factor was significant (F(1,74) =54.55), p < .001, all < .05). The displayed structurefactor and the environment*displayed structureinteraction were not significant. Figure 4 depicts theaverage performance scores across all four conditions. Itcan be seen on inspection that the performance scoreswere clearly higher in the static environment scenario asopposed to the dynamic environment phase. Whethersubjects had less or more displayed airspace structuredid not significantly affect their scores. These resultsdemonstrate that for this representative ATC task, theenvironmental complexity factor was a significantcontributor to performance, causing lower performancescores. There was no apparent effect, either positive ornegative, from increasing airspace structure.
In terms of the model in Figure 1, this experimentdemonstrated for this representative ATC task, themain component of complexity associated withcontroller workload was environment, and notorganizational or display-related. Dynamicallychanging airspace structure was far more influentialthan the design of the airspace itself. Thus whilesector design may be a contributing factor to airtraffic controller performance, environmentalcomplexity factors such as thunderstorms and specialuse airspace that intermittently becomes available,are significantly larger contributors to individualcognitive complexity.These results provide quantitative support forprevious subjective assessments of controllers thatactive special use airspace increases complexity andwould benefit from some display intervention
(Ahlstrom, Rubinstein, Siegel, Mogford, & Manning,2001). In light of the results reported here, it is likelythat special use airspace (SUA), an organizationalconstraint, can increase complexity for controllers notbecause of the actual structure of the airspace,because the status can change. When SUAs cyclebetween active and inactive, especially relativelyrapidly, environmental complexity increases, andcould negatively affect controller performance. Thusa by-product of an organizational policy could beincreased complexity on the part of controllers.
These results indicate that the development ofdecision support tools to aid controllers in SUAmanagement is an area of research that deserves moreattention Because of the temporal and cyclic natureof SUA, possible design interventions could includesome kind of timeline display for SUA scheduling aswell as intelligent decision support agents that canpredict in advance when airspace could becomeavailable or deactivated.
Conclusion
Complexity as it applies to the air traffic controlenvironment cannot be simply categorized as“cognitive complexity,” as there are differentcomponents of complexity, which are demonstratedin Figure 1. These components of environmental,organizational, and display complexity may not
Experiment Results
0.00
200.00
400.00
600.00
800.00
1000.00
1200.00
1400.00
Structured/Static Unstructured/Static
Structured/Dynamic Unstructured/Dynamic
Display Structure, Static
Display Structure, Dynamic W/o Display Structure,Dynamic
Figure 4: Condition Mean Performance Times
W/o DisplayStructure, Static
162

contribute in a linear and consistent manner to eithercognitive complexity or performance. This studyattempted to decompose two sources of complexity,an environmental factor caused by changing airspace,and an organizational/display factor caused byairspace design. Results show that the environmentalcomplexity source of changing airspace was far moresignificant in influencing overall controllerperformance. These results support air trafficcontrollers’ subjective opinions that special useairspace is a source of complexity (Ahlstrom et al.,2001), and that more work is needed for betterdisplay representation.
Acknowledgements
This research was sponsored by the Civil AerospaceMedical Institute.
References
Ahlstrom, U., Rubinstein, J., Siegel, S., Mogford, R.H., & Manning, C. (2001). Display Concepts ForEn Route Air Traffic Control (DOT/FAA/CT-TN01/06). Washington DC: U.S. Department ofTransportation.
Athenes, S., Averty, P., Puechmorel, S., Delahaye,D., & Collet, C. (2002). ATC Complexity andController Workload: Trying to Bridge the Gap.Paper presented at the HCI-Aero.
Hilburn, B. (2004). Cognitive Complexity in AirTraffic Control - A Literature Review (EEC NoteNo. 04/04): Eurocontrol.
Histon, J. M., Hansman, R. J., Gottlieb, B.,Kleinwaks, H., Yenson, S., Delahaye, D., &Puechmorel, S. (2002). Structural Considerationsand Cognitive Complexity in Air Traffic Control.Paper presented at the 19th IEEE/AIAA DigitalAvionics Systems Conference, Irvine, CA.
Kirwan, B., Scaife, R., & Kennedy, R. (2001).Investigating complexity factors in UK AirTraffic Management. Human Factors andAerospace Safety, 1(2), 125-144.
Majumdar, A., & Ochieng, W. Y. (2002). The factorsaffecting air traffic controller workload: amultivariate analysis based upon simulationmodeling of controller workload. Paper presentedat the 81st Annual Meeting of the TransportationResearch Board, Washington DC.
Masalonis, A. J., Callaham, M. B., & Wanke, C. R.(2003). Dynamic Density and Complexity Metricsfor Realtime Traffic Flow Management. Paperpresented at the 5th Eurocontrol / FAA ATMR&D Seminar, Budapest, Hungary.
Miller, C. (2000). The Human Factor in Complexity.In T. Samad & J. Weyrauch (Eds.), Automation,
Control, and Complexity: An IntegratedApproach. New York: John Wiley.
Pawlak, W. S., Brinton, C. R., Crouch, K., &Lancaster, K. M. (1996). A framework for theevaluation of air traffic control complexity. Paperpresented at the AIAA Guidance Navigation andControl Conference., San Diego.
Sheridan, T. B. (1992). Telerobotics, automation, andhuman supervisory control. Cambridge, MA: MITPress.
Simon, H. (1996). The Sciences of the Artificial (3rded.). Cambridge: MIT Press.
Woods, D. D. (1991). The cognitive engineering ofproblem representations. In J. L. Alty (Ed.),Human-computer interaction and complexsystems. London: Taylor and Francis.
163