Embed Size (px)
Citation preview
insects
Article
Leaf Morphological and Biochemical Responses ofThree Potato (Solanum tuberosum L.) Cultivars toDrought Stress and Aphid (Myzus persicaeSulzer) Infestation
Peter Quandahor 1 , Chunyan Lin 1, Yuping Gou 1 , Jeffrey A. Coulter 2 andChangzhong Liu 1,*
1 College of Plant Protection, Gansu Agricultural University, Lanzhou, No. 1 Yingmen Village, AnningDistrict, Lanzhou 730070, China; [email protected] (P.Q.); [email protected] (C.L.);[email protected] (Y.G.)
2 Department of Agronomy and Plant Genetics, University of Minnesota, St. Paul, MN 55108, USA;[email protected]
* Correspondence: [email protected]; Tel.: +86-139-1917-9962
Received: 6 November 2019; Accepted: 2 December 2019; Published: 4 December 2019�����������������
Abstract: Drought stress on plants can cause cellular water deficits and influence the physiology ofhost plants, which alter the performance of insect pests. This study was conducted to determine theeffect of drought and aphid (Myzus persicae Sulzer) infestation on three potato (Solanum tuberosum L.)genotypes under greenhouse conditions. A factorial experiment involving three potato genotypes,two levels of drought, and two levels of aphid infestation was conducted. The potato genotypespossessed different levels of tolerance to drought and are described as tolerant (Qingshu 9), moderatelytolerant (Longshu 3), and sensitive (Atlantic). Sixty-day-old potato plants were infested with aphidnymphs and monitored for 20 d. There was a significant variety × drought × aphid interaction effecton the parameters measured. The genotype Atlantic, which is sensitive to drought, exhibited greatertolerance to aphid infestation under drought or no drought conditions than the other genotypes.This genotype also exhibited poor host acceptance and the aphid survival rate, colonization success,and average daily reproduction were low. Qingshu 9, which is tolerant to drought, was highlysusceptible to aphid infestation and exhibited high host acceptance and greater aphid survival rate,colonization success, and average daily reproduction compared to the other genotypes. This studydemonstrates that the biochemical and morphological traits that confer drought tolerance in potatodo not necessarily confer aphid tolerance.
Keywords: potato; drought stress; aphid infestation; hydrogen peroxide; antioxidant enzyme activities
1. Introduction
The green peach aphid, Myzus persicae Sulzer, which has special adaptation features, such as theability to adapt to the wide genetic variation of host plants, is an important crop pest that attacksmore than 400 plant species across the globe [1]. The performance of M. persicae on plants exposed todrought seems to vary among plant species [2]. In Arabidopsis thaliana, the populations of M. persicaeincreased when the plants were exposed to drought stress [3]. However, in Brassica oleracea (cabbage),conflicting results were reported, as aphid abundance increased under drought in one experiment [4]but decreased under a similar condition in another experiment [5].
Drought is one of the major challenges facing crop production and about 40% of the world’sagricultural land is found in arid or semi-arid regions [6]. Drought stress on plants can cause cellular
Insects 2019, 10, 435; doi:10.3390/insects10120435 www.mdpi.com/journal/insects
Insects 2019, 10, 435 2 of 17
water deficits, membrane injury, reduced enzyme activity and crop yield, and even plant death [7].By influencing the physiology of host plants, drought can alter the performance of insect pests.A number of studies have shown that increases in drought severity results in increasing populations ofinsect pests [8,9]. Plant morphological traits such as leaf shape, texture, and hairiness could influencethe development of pest populations [10]. Leaf hairs are reported to affect the leaf boundary layerand serve as suitable habitats for mites [11]. The presence of leaf hairs in cotton (Gossypium hirsutum)increased the population of Bemisia tabaci on the plants [11,12]. However, the population of jassids(Amrasca devastans) on cotton varieties with hairy leaves decreased as compared with those that hadsmooth leaves [13].
Drought stress can damage the photosynthetic apparatus and decrease leaf chlorophyll content [14],transpiration rate, water content, and leaf angle [15]. These changes also affect aphid performance onhost plants under drought stress [16]. Drought stress can cause carbon starvation, which subsequentlychanges host plant nutrition, palatability, and secondary metabolites that are capable of affecting aphidsurvival [15,17]. The purpose of stomata adaptation in response to water deficit is to enhance wateruse efficiency of the plant [18]. This occurs by altering stomata density and size [18]. The effect ofwater stress on stomata conductance depends on the severity and duration of the stress [19].
The initial signal events during defense responses in plants generally include the productionof reactive oxygen species (ROS), malondialdehyde (MDA), and proline (Pro) [20–23]. Antioxidantenzymes such as superoxide dismutase (SOD), peroxidase (POD), and catalase (CAT) play a substantialrole in defense reactions of host plants [22,23]. They can stimulate the transport of insect resistancesignals during the defense response and induce the production of related compounds and enzymesin a cascade of reactions after insect invasion [24]. Potato (Solanum tuberosum L.) is the fourth mostimportant food crop in the world after wheat (Triticum aestivum), rice (Oryza sativa), and maize(Zea mays) [25]. Potato production is increasing at a rate of 4.5 million tons per year, exceeding thatof rice and wheat [26]. It has been estimated that by the year 2020, more than two billion peoplein Asia, Africa, and Latin America will depend on these crops for food, feed, or income [27]. Thedemand for potato is increasing rapidly in developing countries, which now account for more thanhalf of the global harvest. Unfortunately, unfavorable weather conditions such as drought and thedevastating effects of insect pests such as aphids are causing greater losses in arable crops includingpotato [6,25,28,29]. In Africa, Asia, and Latin America, for instance, yields could decline by 20% to 40%in the future if no effective adaptation measures are taken [25,30,31].
The identification of drought-tolerant cultivars as well as cultivars that possess some resistance toinsect pests has become an important area of research [32,33]. Increasing aphid resistance and stresstolerance in potato has great potential to contribute to food and income security, mitigate poverty, andreduce farmers’ risk in vulnerable agricultural environments [29,33]. Several studies have reportedthe response of potato to drought stress [34–36], aphids to drought stress [37–39], and potato–aphidinteractions [40,41]. However, to our knowledge, no study has determined the response of potatocultivars which have different levels of drought tolerance to aphid attacks. This research was based onthe hypothesis that potato cultivars with different levels of tolerance to drought will respond differentlyto aphid attacks. The study was therefore conducted to determine the response of potato cultivarswith different levels of drought tolerance to aphid infestation under greenhouse conditions.
2. Materials and Methods
2.1. Growth Conditions and Planting Materials
The experiment was conducted in a greenhouse (day temperature 25–35 ◦C, night temperature18–22 ◦C, daytime relative humidity 45%–55%, light intensity 15,000–18,000 lux) at Gansu AgriculturalUniversity, Lanzhou, China, during the summer of 2019. Mini tubers of three potato genotypes wereobtained from Gansu Haofeng Seed Company Limited, Lanzhou, China for the experiment. Thethree potato genotypes used for the experiment were known to possess different levels of tolerance to
Insects 2019, 10, 435 3 of 17
drought. These were Qingshu 9 (tolerant), Longshu 3 (moderately tolerant), and Atlantic (sensitive).The tubers were sown in pots (12.5 cm diameter, 9.5 cm deep) filled with 2 kg of loamy soil. Each potwas supplied with one tuber and the soil was watered periodically to keep it moist. All pots werewatered uniformly until 40 d after sowing, when the drought treatment began. The pots were kept freeof weeds by regularly hand-picking the weeds that emerged.
2.2. Aphid Culture
Adult females of Myzus persicae, collected from the potato experimental farm of Gansu AgriculturalUniversity, Lanzhou, China, were reared in the laboratory on potato seedlings under a light:dark16:8 h photocycle at 19 ± 1 ◦C. The aphid culture was maintained for six months before it was used forthe experiment.
2.3. Experimental Design and Treatments
The experiment was a 3 × 2 × 2 factorial involving three potato genotypes, Qingshu 9 (QS9),Longshu 3 (L3), and Atlantic (DXY), two levels of drought stress (drought and no drought stress), andtwo levels of aphid infestation (aphid infestation and no aphid infestation). The treatments werearranged in a split–split plot design with three replications. The three genotypes were assigned to mainplots and each of these main plots was split into two for the drought and no drought treatments. Eachof these split-plots was further split into two for the aphid and no aphid treatments. In all, 216 potswere used for the experiment and each experimental unit consisted of six pots with one plant perpot. The plants under no drought treatment were watered adequately to maintain the soil moisture atfield capacity. Whereas in the drought-stressed plants the water content was allowed to withdrawprogressively for 20 d and then maintained with 30% of the field capacity throughout the experiment.To maintain the levels of water through time in each treatment, the pots were weighed every 5 d, andthe water volume for the corresponding field capacity was supplied. Soil moisture was also measureddaily with a Delta-T Theta Probe ML2 (Delta-T Devices, Cambridge, UK) to keep all pots’ consistency.
2.4. Determination of Aphid Performance
Six shoots of each genotype were infested with 20 nymph aphids, respectively, with the twodrought conditions (n = 20 in each treatment). Host acceptance was measured by counting the numberof aphid nymphs which remained on plants at 3 d after infestation. Aphid survival rate was measuredby counting the number of nymphs that remained and developed into adults to reproduce at 16 dafter infestation. The aphid survival rate (%) was calculated as the number of aphids that survivedto reproduce/total number of nymphs × 100. Colonization success was assessed by counting thenumber of adult aphids and the number of nymphs produced up to the 20th day after infestation. Thecolonization success was then estimated as the number of nymphs + ln (number of adults + 0.001),which gives a balanced weight to the number of nymphs and adults produced on a plant 20 d afterinfestation [42]. Average daily reproduction was determined as the number of nymphs divided by thenumber of days for the period of infestation.
2.5. Aphid Water Content
Aphid water content was determined as described by Guo et al. [43]. Adult aphids from eachplant were collected at 20 d after infestation and weighed immediately, dried at 60 ◦C for 24 h, and thenweighed again. Water content was determined by deducting the dry weight from the fresh weight ofeach aphid. Aphid water content (AWC) was calculated as:
AWC =FW−DW
DW× 100% (1)
Insects 2019, 10, 435 4 of 17
2.6. Leaf Relative Water Content (RWC)
The RWC of leaves was determined as described by Barrs and Weatherley [44]. The four youngest,fully expanded leaves were removed from six shoots of each genotype and the fresh weight (FW) wasdetermined immediately. The leaves were immersed in distilled water for 6 h, then removed, and theadhering water was blotted with tissue paper before weighing to obtain turgor weight (TW). The dryweight (DW) was measured after drying the leaves at 70 ◦C in an oven for 24 h. The relative watercontent (RWC) was calculated as follows:
RWC =FW−DWTW−DW
× 100% (2)
2.7. Relative Plant Biomass
The shoots of 16 plants per treatment were harvested at the end of the experiment to determinethe impact of drought and aphids on plant biomass. Plant material was oven-dried to constant weightat 80 ◦C for 72 h to determine the mean dry weight (DW) per plant. The relative plant biomass (RPB)was calculated as follows:
RPB =Shoot biomass under stress
Shoot biomass under no stress× 100% (3)
2.8. Chlorophyll Content, Net Photosynthesis, Transpiration Rate, and Leave Angle
Chlorophyll content, net photosynthesis, transpiration rate, and leave angle of six shoots ofeach genotype were measured on the fifth to tenth terminal of mature leaves from the base of theshoot at 30 d after infestation. Chlorophyll content (ChlSPAD value) was estimated using a portablechlorophyll meter (CCM-200, Opti-Sciences, Tyngsboro, MA, USA). Light-saturated net photosynthesiswas measured with a portable infrared gas analyzer (LI-6200, LI-COR, Lincoln, NE, USA). Transpirationrate was measured with a portable porometer (LI-1600, LI-COR, Lincoln, NE, USA). Leaf anglewas measured using an Accupar LP-80 ceptometer (Decagon Devices, NE Hopkins Court, Pullman,WA, USA).
2.9. Stomata and Leaf Hair Analysis
Three leaves from six shoots of each genotype were collected at 20 d after infestation, for stomataand leaf hair analysis. Scanning of the leaf to obtain digital images was done using a scanning electronmicroscope following a standard method [45]. Samples were fixed in 3% glutaraldehyde bufferedwith 0.1 M phosphate buffer at room temperature for 2 h. Samples were then washed with 0.1 Mphosphate buffer and dipped in 1% osmium tetroxide in 0.1 M phosphate buffer (pH 7.2) for 2 h atroom temperature in a light proof container. Samples were again washed in 0.1 M phosphate buffer(pH 7.2), dehydrated in classified ethanol solutions in water (30%, 50%, 70%, 80%, 90%, 96%, and 100%ethanol solution) for 5 to 15 min, and dried. This process involved the replacement of liquid in thecells with gas and creates a completely dry specimen with negligible or no cellular distortion. Thespecimens were mounted on an aluminum stub using double-sided sticky carbon tape. Gold coatingwas made using a gold sputter coater that coats the mounted specimens in gold before they go into theSEM. Samples were then analyzed directly in SEM using Smart SEM TM software (Carl Zeiss, EVO18,Welwyn Garden City, UK). Leaf hairiness was assessed by counting the number of trichomes on a15 mm2 square area per leaf. Stomata number was determined by counting the stomata within the15 mm2 square area.
Insects 2019, 10, 435 5 of 17
2.10. Determination of Proline (Pro) Content
Proline content in the leaf samples was determined after extraction at room temperature with 3%of 5-sulfosalicylic acid solution as described by Bates et al. [46] using a standard curve. Free prolinecontent was expressed as µmol g−1 FW of leaves [47].
2.11. Determination Hydrogen Peroxide (H2O2) Content
Hydrogen peroxide content was determined as described by Mostofa and Fujita [48]. Frozen leafsamples were homogenized and centrifuged, and the supernatant was collected and reacted with TiCl4and NH4OH. After the second centrifuge, the supernatant was discarded and the precipitate washedrecurrently with cold acetone until it turned colorless. The washed precipitate was dissolved in 20 mL2 M H2SO4, and the absorbance measured at 415 nm against a blank. Standard H2O2 was treated withTiCl4 and subjected to the similar process.
2.12. Determination of Malondialdehyde (MDA) Content
The content of MDA was measured as described by Liu et al. [49]. In brief, potato leave sampleswere homogenized in 5% (w/v) trichloroacetic acid and reacted with an equal volume of 0.67% (w/v)thiobarbituric acid in a water bath for 30 min. After cooling, the mixture was centrifuged and thesupernatant used to measure the absorbance at 532 nm and corrected for nonspecific turbidity bysubtracting the absorbance at 600 and 450 nm.
2.13. Determination of Antioxidant Enzyme Activities in Leaf Tissue
The SOD, CAT, and POD activities were determined using leaf tissues that were stored at −80 ◦C.Briefly, about 0.5 g of leaf tissues were ground in liquid nitrogen and then homogenized in 5 mL of0.1 M phosphate buffer (pH 7.5) containing 0.5 mM Ethylene Diamine Tetra-acetic Acid (EDTA). Thehomogenates were centrifuged at 12,000× g for 15 min at 4 ◦C, and the supernatant was aliquotedfor SOD (EC 1.15.1.1), CAT (EC 1.11.1.6), and POD (EC 1.11.1.7) activity assays. The supernatantswere then used in determining the enzymatic activities. The SOD activity was measured followinga standard procedure [50]. The POD activity was estimated at 470 nm as described by Chance andMaehly [51], while CAT activity was measured following the method of Nakano and Asada [52].
2.14. Statistical Analysis
Data were analyzed by the analysis of variance using SPSS statistics software (Version 19.0 forWindows, SPSS, Chicago, IL, USA). Treatment means were separated using Duncan’s multiple rangetest (p < 0.05). The results are presented as mean ± SD.
3. Results
3.1. Aphid Performance
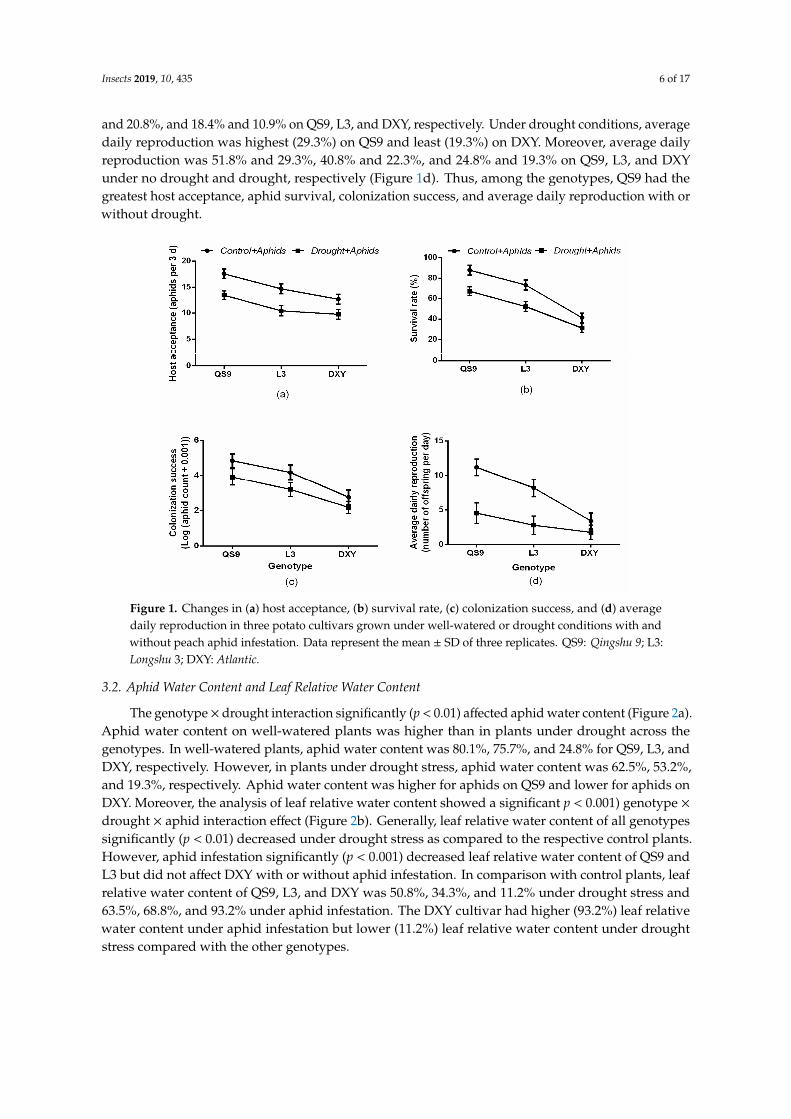
There was a significant (p < 0.01) genotype × drought interaction effect on aphid survival rate,colonization success, and average daily reproduction (Figure 1). However, host acceptance wasnot affected (p = 0.06) by the genotype × drought interaction. Generally, host acceptance, survival,colonization success, and average daily reproduction of aphids were higher on the drought-free plants.Aphid survival rate on plants under no drought (87.7%) and those under drought (67.2%) was higheston QS9 and least on DXY (41.3% and 31.2%, respectively) (Figure 1a–d). Although host acceptancewas not affected (p = 0.06) by the genotype × drought interaction, it was highest on QS9 under nodrought (87.7%) and under drought (67.2%) and least on DXY (63.3 and 48.8%, respectively) (Figure 1a).Colonization success of aphids on plants under no drought and on those exposed to drought washighest on QS9 (24.2 and 19.5%, respectively) and least on DXY plants (13.7 and 10.9%, respectively)(Figure 1c). Relative to all water treatments, colonization success increased by 24.2% and 19.5%, 72.8%
Insects 2019, 10, 435 6 of 17
and 20.8%, and 18.4% and 10.9% on QS9, L3, and DXY, respectively. Under drought conditions, averagedaily reproduction was highest (29.3%) on QS9 and least (19.3%) on DXY. Moreover, average dailyreproduction was 51.8% and 29.3%, 40.8% and 22.3%, and 24.8% and 19.3% on QS9, L3, and DXYunder no drought and drought, respectively (Figure 1d). Thus, among the genotypes, QS9 had thegreatest host acceptance, aphid survival, colonization success, and average daily reproduction with orwithout drought.
Insects 2019, 10, 435 6 of 17
Figure 1. Changes in (a) host acceptance, (b) survival rate, (c) colonization success, and (d) average daily reproduction in three potato cultivars grown under well-watered or drought conditions with and without peach aphid infestation. Data represent the mean ± SD of three replicates. QS9: Qingshu 9; L3: Longshu 3; DXY: Atlantic.
3.2. Aphid Water Content and Leaf Relative Water Content
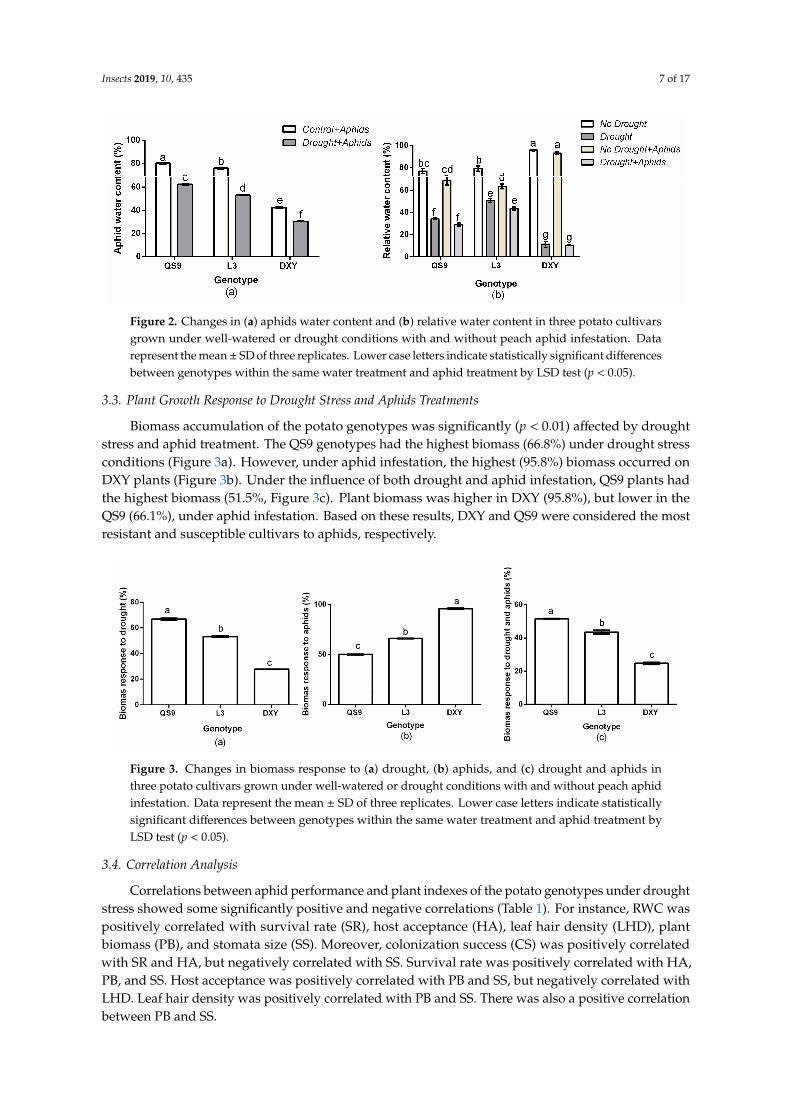
The genotype × drought interaction significantly (p < 0.01) affected aphid water content (Figure 2a). Aphid water content on well-watered plants was higher than in plants under drought across the genotypes. In well-watered plants, aphid water content was 80.1%, 75.7%, and 24.8% for QS9, L3, and DXY, respectively. However, in plants under drought stress, aphid water content was 62.5%, 53.2%, and 19.3%, respectively. Aphid water content was higher for aphids on QS9 and lower for aphids on DXY. Moreover, the analysis of leaf relative water content showed a significant pP < 0.001) genotype × drought × aphid interaction effect (Figure 2b). Generally, leaf relative water content of all genotypes significantly (p < 0.01) decreased under drought stress as compared to the respective control plants. However, aphid infestation significantly (p < 0.001) decreased leaf relative water content of QS9 and L3 but did not affect DXY with or without aphid infestation. In comparison with control plants, leaf relative water content of QS9, L3, and DXY was 50.8%, 34.3%, and 11.2% under drought stress and 63.5%, 68.8%, and 93.2% under aphid infestation. The DXY cultivar had higher (93.2%) leaf relative water content under aphid infestation but lower (11.2%) leaf relative water content under drought stress compared with the other genotypes.
Figure 1. Changes in (a) host acceptance, (b) survival rate, (c) colonization success, and (d) averagedaily reproduction in three potato cultivars grown under well-watered or drought conditions with andwithout peach aphid infestation. Data represent the mean ± SD of three replicates. QS9: Qingshu 9; L3:Longshu 3; DXY: Atlantic.
3.2. Aphid Water Content and Leaf Relative Water Content
The genotype× drought interaction significantly (p < 0.01) affected aphid water content (Figure 2a).Aphid water content on well-watered plants was higher than in plants under drought across thegenotypes. In well-watered plants, aphid water content was 80.1%, 75.7%, and 24.8% for QS9, L3, andDXY, respectively. However, in plants under drought stress, aphid water content was 62.5%, 53.2%,and 19.3%, respectively. Aphid water content was higher for aphids on QS9 and lower for aphids onDXY. Moreover, the analysis of leaf relative water content showed a significant p < 0.001) genotype ×drought × aphid interaction effect (Figure 2b). Generally, leaf relative water content of all genotypessignificantly (p < 0.01) decreased under drought stress as compared to the respective control plants.However, aphid infestation significantly (p < 0.001) decreased leaf relative water content of QS9 andL3 but did not affect DXY with or without aphid infestation. In comparison with control plants, leafrelative water content of QS9, L3, and DXY was 50.8%, 34.3%, and 11.2% under drought stress and63.5%, 68.8%, and 93.2% under aphid infestation. The DXY cultivar had higher (93.2%) leaf relativewater content under aphid infestation but lower (11.2%) leaf relative water content under droughtstress compared with the other genotypes.
Insects 2019, 10, 435 7 of 17Insects 2019, 10, 435 7 of 17
Figure 2. Changes in (a) aphids water content and (b) relative water content in three potato cultivars grown under well-watered or drought conditions with and without peach aphid infestation. Data represent the mean ± SD of three replicates. Lower case letters indicate statistically significant differences between genotypes within the same water treatment and aphid treatment by LSD test (p < 0.05).
3.3. Plant Growth Response to Drought Stress and Aphids Treatments
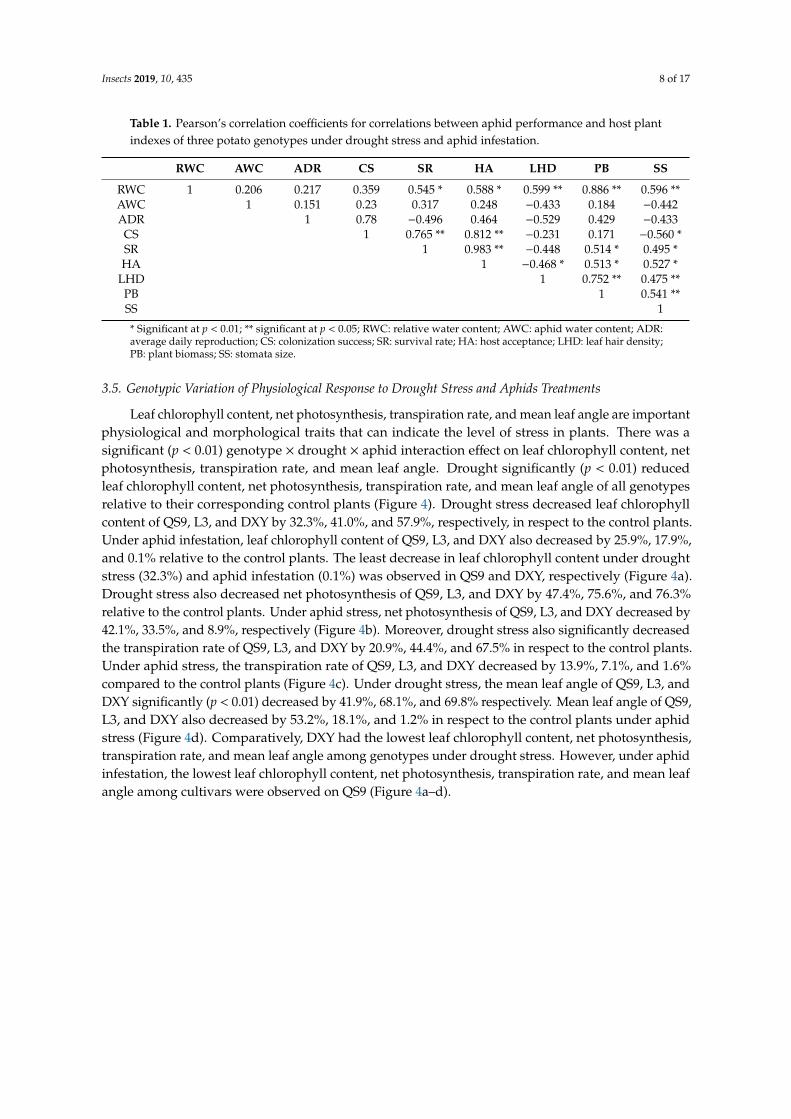
Biomass accumulation of the potato genotypes was significantly (p < 0.01) affected by drought stress and aphid treatment. The QS9 genotypes had the highest biomass (66.8%) under drought stress conditions (Figure 3a). However, under aphid infestation, the highest (95.8%) biomass occurred on DXY plants (Figure 3b). Under the influence of both drought and aphid infestation, QS9 plants had the highest biomass (51.5%, Figure 3c). Plant biomass was higher in DXY (95.8%), but lower in the QS9 (66.1%), under aphid infestation. Based on these results, DXY and QS9 were considered the most resistant and susceptible cultivars to aphids, respectively.
Figure 3. Changes in biomass response to (a) drought, (b) aphids, and (c) drought and aphids in three potato cultivars grown under well-watered or drought conditions with and without peach aphid infestation. Data represent the mean ± SD of three replicates. Lower case letters indicate statistically significant differences between genotypes within the same water treatment and aphid treatment by LSD test (p < 0.05).
3.4. Correlation Analysis
Correlations between aphid performance and plant indexes of the potato genotypes under drought stress showed some significantly positive and negative correlations (Table 1). For instance, RWC was positively correlated with survival rate (SR), host acceptance (HA), leaf hair density (LHD), plant biomass (PB), and stomata size (SS). Moreover, colonization success (CS) was positively correlated with SR and HA, but negatively correlated with SS. Survival rate was positively correlated with HA, PB, and SS. Host acceptance was positively correlated with PB and SS, but negatively correlated with LHD. Leaf hair density was positively correlated with PB and SS. There was also a positive correlation between PB and SS.
Figure 2. Changes in (a) aphids water content and (b) relative water content in three potato cultivarsgrown under well-watered or drought conditions with and without peach aphid infestation. Datarepresent the mean± SD of three replicates. Lower case letters indicate statistically significant differencesbetween genotypes within the same water treatment and aphid treatment by LSD test (p < 0.05).
3.3. Plant Growth Response to Drought Stress and Aphids Treatments
Biomass accumulation of the potato genotypes was significantly (p < 0.01) affected by droughtstress and aphid treatment. The QS9 genotypes had the highest biomass (66.8%) under drought stressconditions (Figure 3a). However, under aphid infestation, the highest (95.8%) biomass occurred onDXY plants (Figure 3b). Under the influence of both drought and aphid infestation, QS9 plants hadthe highest biomass (51.5%, Figure 3c). Plant biomass was higher in DXY (95.8%), but lower in theQS9 (66.1%), under aphid infestation. Based on these results, DXY and QS9 were considered the mostresistant and susceptible cultivars to aphids, respectively.
Insects 2019, 10, 435 7 of 17
Figure 2. Changes in (a) aphids water content and (b) relative water content in three potato cultivars grown under well-watered or drought conditions with and without peach aphid infestation. Data represent the mean ± SD of three replicates. Lower case letters indicate statistically significant differences between genotypes within the same water treatment and aphid treatment by LSD test (p < 0.05).
3.3. Plant Growth Response to Drought Stress and Aphids Treatments
Biomass accumulation of the potato genotypes was significantly (p < 0.01) affected by drought stress and aphid treatment. The QS9 genotypes had the highest biomass (66.8%) under drought stress conditions (Figure 3a). However, under aphid infestation, the highest (95.8%) biomass occurred on DXY plants (Figure 3b). Under the influence of both drought and aphid infestation, QS9 plants had the highest biomass (51.5%, Figure 3c). Plant biomass was higher in DXY (95.8%), but lower in the QS9 (66.1%), under aphid infestation. Based on these results, DXY and QS9 were considered the most resistant and susceptible cultivars to aphids, respectively.
Figure 3. Changes in biomass response to (a) drought, (b) aphids, and (c) drought and aphids in three potato cultivars grown under well-watered or drought conditions with and without peach aphid infestation. Data represent the mean ± SD of three replicates. Lower case letters indicate statistically significant differences between genotypes within the same water treatment and aphid treatment by LSD test (p < 0.05).
3.4. Correlation Analysis
Correlations between aphid performance and plant indexes of the potato genotypes under drought stress showed some significantly positive and negative correlations (Table 1). For instance, RWC was positively correlated with survival rate (SR), host acceptance (HA), leaf hair density (LHD), plant biomass (PB), and stomata size (SS). Moreover, colonization success (CS) was positively correlated with SR and HA, but negatively correlated with SS. Survival rate was positively correlated with HA, PB, and SS. Host acceptance was positively correlated with PB and SS, but negatively correlated with LHD. Leaf hair density was positively correlated with PB and SS. There was also a positive correlation between PB and SS.
Figure 3. Changes in biomass response to (a) drought, (b) aphids, and (c) drought and aphids inthree potato cultivars grown under well-watered or drought conditions with and without peach aphidinfestation. Data represent the mean ± SD of three replicates. Lower case letters indicate statisticallysignificant differences between genotypes within the same water treatment and aphid treatment byLSD test (p < 0.05).
3.4. Correlation Analysis
Correlations between aphid performance and plant indexes of the potato genotypes under droughtstress showed some significantly positive and negative correlations (Table 1). For instance, RWC waspositively correlated with survival rate (SR), host acceptance (HA), leaf hair density (LHD), plantbiomass (PB), and stomata size (SS). Moreover, colonization success (CS) was positively correlatedwith SR and HA, but negatively correlated with SS. Survival rate was positively correlated with HA,PB, and SS. Host acceptance was positively correlated with PB and SS, but negatively correlated withLHD. Leaf hair density was positively correlated with PB and SS. There was also a positive correlationbetween PB and SS.
Insects 2019, 10, 435 8 of 17
Table 1. Pearson’s correlation coefficients for correlations between aphid performance and host plantindexes of three potato genotypes under drought stress and aphid infestation.
RWC AWC ADR CS SR HA LHD PB SS
RWC 1 0.206 0.217 0.359 0.545 * 0.588 * 0.599 ** 0.886 ** 0.596 **AWC 1 0.151 0.23 0.317 0.248 −0.433 0.184 −0.442ADR 1 0.78 −0.496 0.464 −0.529 0.429 −0.433CS 1 0.765 ** 0.812 ** −0.231 0.171 −0.560 *SR 1 0.983 ** −0.448 0.514 * 0.495 *HA 1 −0.468 * 0.513 * 0.527 *
LHD 1 0.752 ** 0.475 **PB 1 0.541 **SS 1
* Significant at p < 0.01; ** significant at p < 0.05; RWC: relative water content; AWC: aphid water content; ADR:average daily reproduction; CS: colonization success; SR: survival rate; HA: host acceptance; LHD: leaf hair density;PB: plant biomass; SS: stomata size.
3.5. Genotypic Variation of Physiological Response to Drought Stress and Aphids Treatments
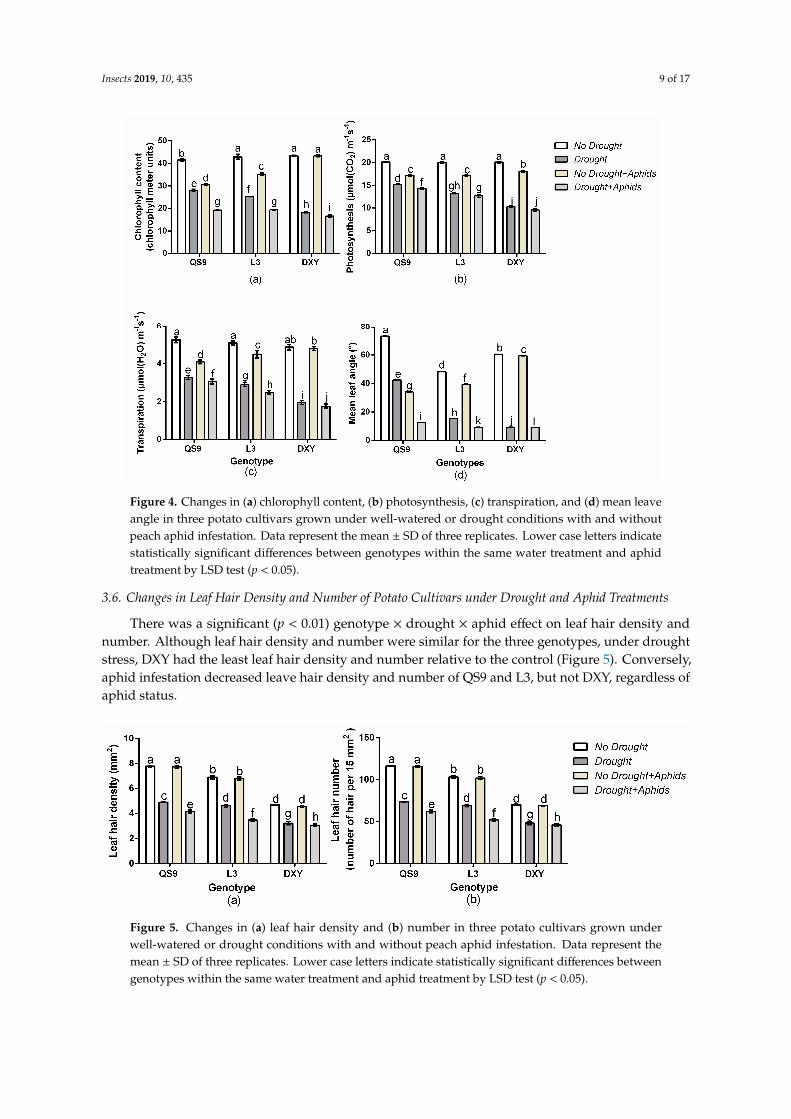
Leaf chlorophyll content, net photosynthesis, transpiration rate, and mean leaf angle are importantphysiological and morphological traits that can indicate the level of stress in plants. There was asignificant (p < 0.01) genotype × drought × aphid interaction effect on leaf chlorophyll content, netphotosynthesis, transpiration rate, and mean leaf angle. Drought significantly (p < 0.01) reducedleaf chlorophyll content, net photosynthesis, transpiration rate, and mean leaf angle of all genotypesrelative to their corresponding control plants (Figure 4). Drought stress decreased leaf chlorophyllcontent of QS9, L3, and DXY by 32.3%, 41.0%, and 57.9%, respectively, in respect to the control plants.Under aphid infestation, leaf chlorophyll content of QS9, L3, and DXY also decreased by 25.9%, 17.9%,and 0.1% relative to the control plants. The least decrease in leaf chlorophyll content under droughtstress (32.3%) and aphid infestation (0.1%) was observed in QS9 and DXY, respectively (Figure 4a).Drought stress also decreased net photosynthesis of QS9, L3, and DXY by 47.4%, 75.6%, and 76.3%relative to the control plants. Under aphid stress, net photosynthesis of QS9, L3, and DXY decreased by42.1%, 33.5%, and 8.9%, respectively (Figure 4b). Moreover, drought stress also significantly decreasedthe transpiration rate of QS9, L3, and DXY by 20.9%, 44.4%, and 67.5% in respect to the control plants.Under aphid stress, the transpiration rate of QS9, L3, and DXY decreased by 13.9%, 7.1%, and 1.6%compared to the control plants (Figure 4c). Under drought stress, the mean leaf angle of QS9, L3, andDXY significantly (p < 0.01) decreased by 41.9%, 68.1%, and 69.8% respectively. Mean leaf angle of QS9,L3, and DXY also decreased by 53.2%, 18.1%, and 1.2% in respect to the control plants under aphidstress (Figure 4d). Comparatively, DXY had the lowest leaf chlorophyll content, net photosynthesis,transpiration rate, and mean leaf angle among genotypes under drought stress. However, under aphidinfestation, the lowest leaf chlorophyll content, net photosynthesis, transpiration rate, and mean leafangle among cultivars were observed on QS9 (Figure 4a–d).
Insects 2019, 10, 435 9 of 17Insects 2019, 10, 435 9 of 17
Figure 4. Changes in (a) chlorophyll content, (b) photosynthesis, (c) transpiration, and (d) mean leave angle in three potato cultivars grown under well-watered or drought conditions with and without peach aphid infestation. Data represent the mean ± SD of three replicates. Lower case letters indicate statistically significant differences between genotypes within the same water treatment and aphid treatment by LSD test (p < 0.05).
3.6. Changes in Leaf Hair Density and Number of Potato Cultivars under Drought and Aphid Treatments
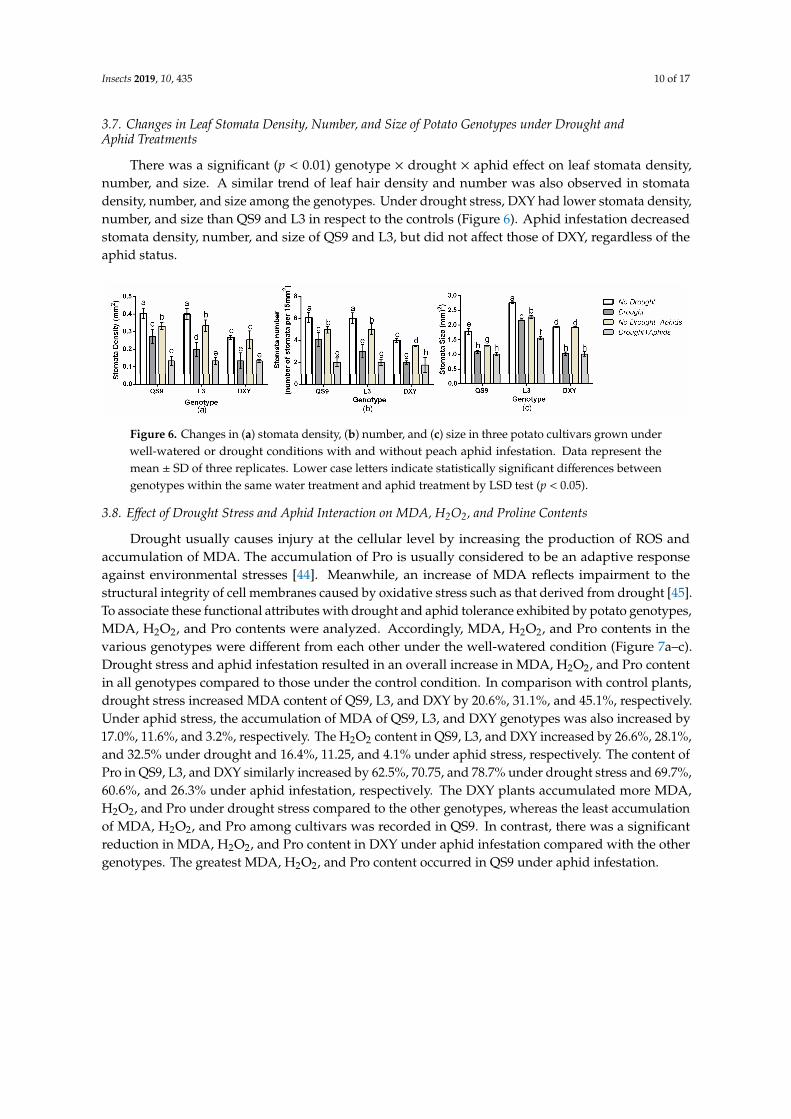
There was a significant (p < 0.01) genotype × drought × aphid effect on leaf hair density and number. Although leaf hair density and number were similar for the three genotypes, under drought stress, DXY had the least leaf hair density and number relative to the control (Figure 5). Conversely, aphid infestation decreased leave hair density and number of QS9 and L3, but not DXY, regardless of aphid status.
Figure 5. Changes in (a) leaf hair density and (b) number in three potato cultivars grown under well-watered or drought conditions with and without peach aphid infestation. Data represent the mean ± SD of three replicates. Lower case letters indicate statistically significant differences between genotypes within the same water treatment and aphid treatment by LSD test (p < 0.05).
Figure 4. Changes in (a) chlorophyll content, (b) photosynthesis, (c) transpiration, and (d) mean leaveangle in three potato cultivars grown under well-watered or drought conditions with and withoutpeach aphid infestation. Data represent the mean ± SD of three replicates. Lower case letters indicatestatistically significant differences between genotypes within the same water treatment and aphidtreatment by LSD test (p < 0.05).
3.6. Changes in Leaf Hair Density and Number of Potato Cultivars under Drought and Aphid Treatments
There was a significant (p < 0.01) genotype × drought × aphid effect on leaf hair density andnumber. Although leaf hair density and number were similar for the three genotypes, under droughtstress, DXY had the least leaf hair density and number relative to the control (Figure 5). Conversely,aphid infestation decreased leave hair density and number of QS9 and L3, but not DXY, regardless ofaphid status.
Insects 2019, 10, 435 9 of 17
Figure 4. Changes in (a) chlorophyll content, (b) photosynthesis, (c) transpiration, and (d) mean leave angle in three potato cultivars grown under well-watered or drought conditions with and without peach aphid infestation. Data represent the mean ± SD of three replicates. Lower case letters indicate statistically significant differences between genotypes within the same water treatment and aphid treatment by LSD test (p < 0.05).
3.6. Changes in Leaf Hair Density and Number of Potato Cultivars under Drought and Aphid Treatments
There was a significant (p < 0.01) genotype × drought × aphid effect on leaf hair density and number. Although leaf hair density and number were similar for the three genotypes, under drought stress, DXY had the least leaf hair density and number relative to the control (Figure 5). Conversely, aphid infestation decreased leave hair density and number of QS9 and L3, but not DXY, regardless of aphid status.
Figure 5. Changes in (a) leaf hair density and (b) number in three potato cultivars grown under well-watered or drought conditions with and without peach aphid infestation. Data represent the mean ± SD of three replicates. Lower case letters indicate statistically significant differences between genotypes within the same water treatment and aphid treatment by LSD test (p < 0.05).
Figure 5. Changes in (a) leaf hair density and (b) number in three potato cultivars grown underwell-watered or drought conditions with and without peach aphid infestation. Data represent themean ± SD of three replicates. Lower case letters indicate statistically significant differences betweengenotypes within the same water treatment and aphid treatment by LSD test (p < 0.05).
Insects 2019, 10, 435 10 of 17
3.7. Changes in Leaf Stomata Density, Number, and Size of Potato Genotypes under Drought andAphid Treatments
There was a significant (p < 0.01) genotype × drought × aphid effect on leaf stomata density,number, and size. A similar trend of leaf hair density and number was also observed in stomatadensity, number, and size among the genotypes. Under drought stress, DXY had lower stomata density,number, and size than QS9 and L3 in respect to the controls (Figure 6). Aphid infestation decreasedstomata density, number, and size of QS9 and L3, but did not affect those of DXY, regardless of theaphid status.
Insects 2019, 10, 435 10 of 17
3.7. Changes in Leaf Stomata Density, Number, and Size of Potato Genotypes under Drought and Aphid Treatments
There was a significant (p < 0.01) genotype × drought × aphid effect on leaf stomata density, number, and size. A similar trend of leaf hair density and number was also observed in stomata density, number, and size among the genotypes. Under drought stress, DXY had lower stomata density, number, and size than QS9 and L3 in respect to the controls (Figure 6). Aphid infestation decreased stomata density, number, and size of QS9 and L3, but did not affect those of DXY, regardless of the aphid status.
Figure 6. Changes in (a) stomata density, (b) number, and (c) size in three potato cultivars grown under well-watered or drought conditions with and without peach aphid infestation. Data represent the mean ± SD of three replicates. Lower case letters indicate statistically significant differences between genotypes within the same water treatment and aphid treatment by LSD test (p < 0.05).
3.8. Effect of Drought Stress and Aphid Interaction on MDA, H2O2, and Proline Contents
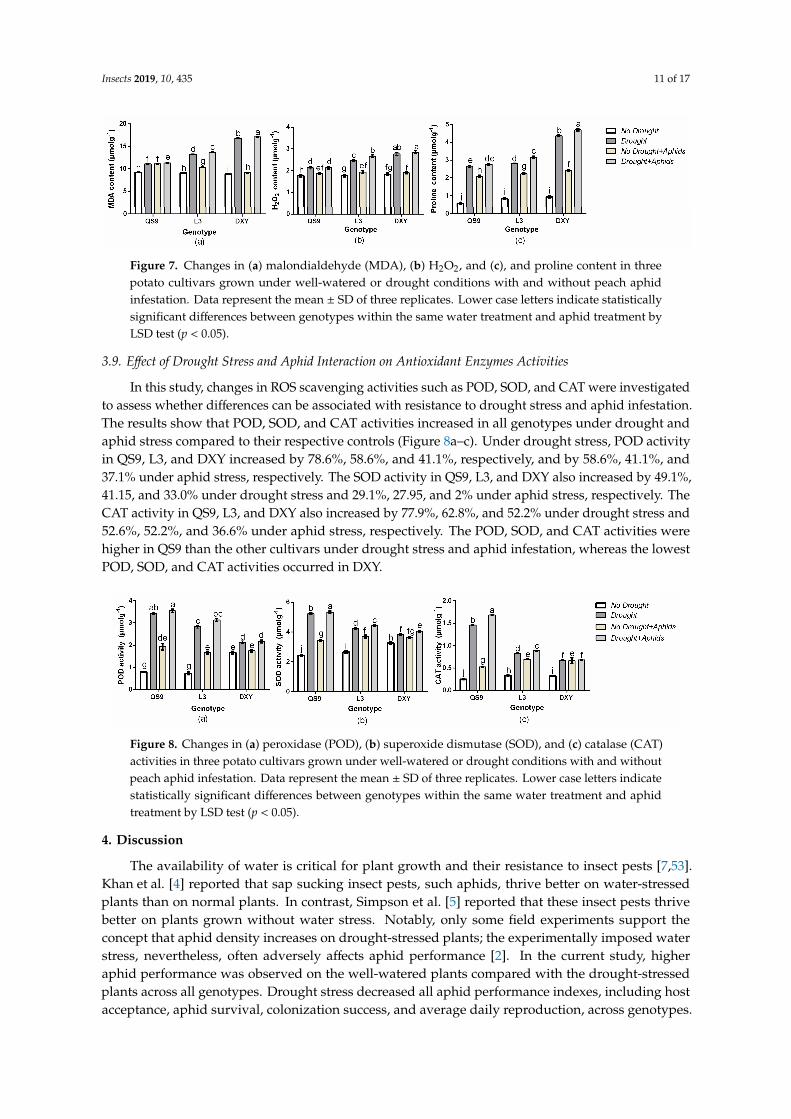
Drought usually causes injury at the cellular level by increasing the production of ROS and accumulation of MDA. The accumulation of Pro is usually considered to be an adaptive response against environmental stresses [44]. Meanwhile, an increase of MDA reflects impairment to the structural integrity of cell membranes caused by oxidative stress such as that derived from drought [45]. To associate these functional attributes with drought and aphid tolerance exhibited by potato genotypes, MDA, H2O2, and Pro contents were analyzed. Accordingly, MDA, H2O2, and Pro contents in the various genotypes were different from each other under the well-watered condition (Figure 7a–c). Drought stress and aphid infestation resulted in an overall increase in MDA, H2O2, and Pro content in all genotypes compared to those under the control condition. In comparison with control plants, drought stress increased MDA content of QS9, L3, and DXY by 20.6%, 31.1%, and 45.1%, respectively. Under aphid stress, the accumulation of MDA of QS9, L3, and DXY genotypes was also increased by 17.0%, 11.6%, and 3.2%, respectively. The H2O2 content in QS9, L3, and DXY increased by 26.6%, 28.1%, and 32.5% under drought and 16.4%, 11.25, and 4.1% under aphid stress, respectively. The content of Pro in QS9, L3, and DXY similarly increased by 62.5%, 70.75, and 78.7% under drought stress and 69.7%, 60.6%, and 26.3% under aphid infestation, respectively. The DXY plants accumulated more MDA, H2O2, and Pro under drought stress compared to the other genotypes, whereas the least accumulation of MDA, H2O2, and Pro among cultivars was recorded in QS9. In contrast, there was a significant reduction in MDA, H2O2, and Pro content in DXY under aphid infestation compared with the other genotypes. The greatest MDA, H2O2, and Pro content occurred in QS9 under aphid infestation.
Figure 6. Changes in (a) stomata density, (b) number, and (c) size in three potato cultivars grown underwell-watered or drought conditions with and without peach aphid infestation. Data represent themean ± SD of three replicates. Lower case letters indicate statistically significant differences betweengenotypes within the same water treatment and aphid treatment by LSD test (p < 0.05).
3.8. Effect of Drought Stress and Aphid Interaction on MDA, H2O2, and Proline Contents
Drought usually causes injury at the cellular level by increasing the production of ROS andaccumulation of MDA. The accumulation of Pro is usually considered to be an adaptive responseagainst environmental stresses [44]. Meanwhile, an increase of MDA reflects impairment to thestructural integrity of cell membranes caused by oxidative stress such as that derived from drought [45].To associate these functional attributes with drought and aphid tolerance exhibited by potato genotypes,MDA, H2O2, and Pro contents were analyzed. Accordingly, MDA, H2O2, and Pro contents in thevarious genotypes were different from each other under the well-watered condition (Figure 7a–c).Drought stress and aphid infestation resulted in an overall increase in MDA, H2O2, and Pro contentin all genotypes compared to those under the control condition. In comparison with control plants,drought stress increased MDA content of QS9, L3, and DXY by 20.6%, 31.1%, and 45.1%, respectively.Under aphid stress, the accumulation of MDA of QS9, L3, and DXY genotypes was also increased by17.0%, 11.6%, and 3.2%, respectively. The H2O2 content in QS9, L3, and DXY increased by 26.6%, 28.1%,and 32.5% under drought and 16.4%, 11.25, and 4.1% under aphid stress, respectively. The content ofPro in QS9, L3, and DXY similarly increased by 62.5%, 70.75, and 78.7% under drought stress and 69.7%,60.6%, and 26.3% under aphid infestation, respectively. The DXY plants accumulated more MDA,H2O2, and Pro under drought stress compared to the other genotypes, whereas the least accumulationof MDA, H2O2, and Pro among cultivars was recorded in QS9. In contrast, there was a significantreduction in MDA, H2O2, and Pro content in DXY under aphid infestation compared with the othergenotypes. The greatest MDA, H2O2, and Pro content occurred in QS9 under aphid infestation.
Insects 2019, 10, 435 11 of 17Insects 2019, 10, 435 11 of 17
Figure 7. Changes in (a) malondialdehyde (MDA), (b) H2O2, and (c), and proline content in three potato cultivars grown under well-watered or drought conditions with and without peach aphid infestation. Data represent the mean ± SD of three replicates. Lower case letters indicate statistically significant differences between genotypes within the same water treatment and aphid treatment by LSD test (p < 0.05).
3.9. Effect of Drought Stress and Aphid Interaction on Antioxidant Enzymes Activities
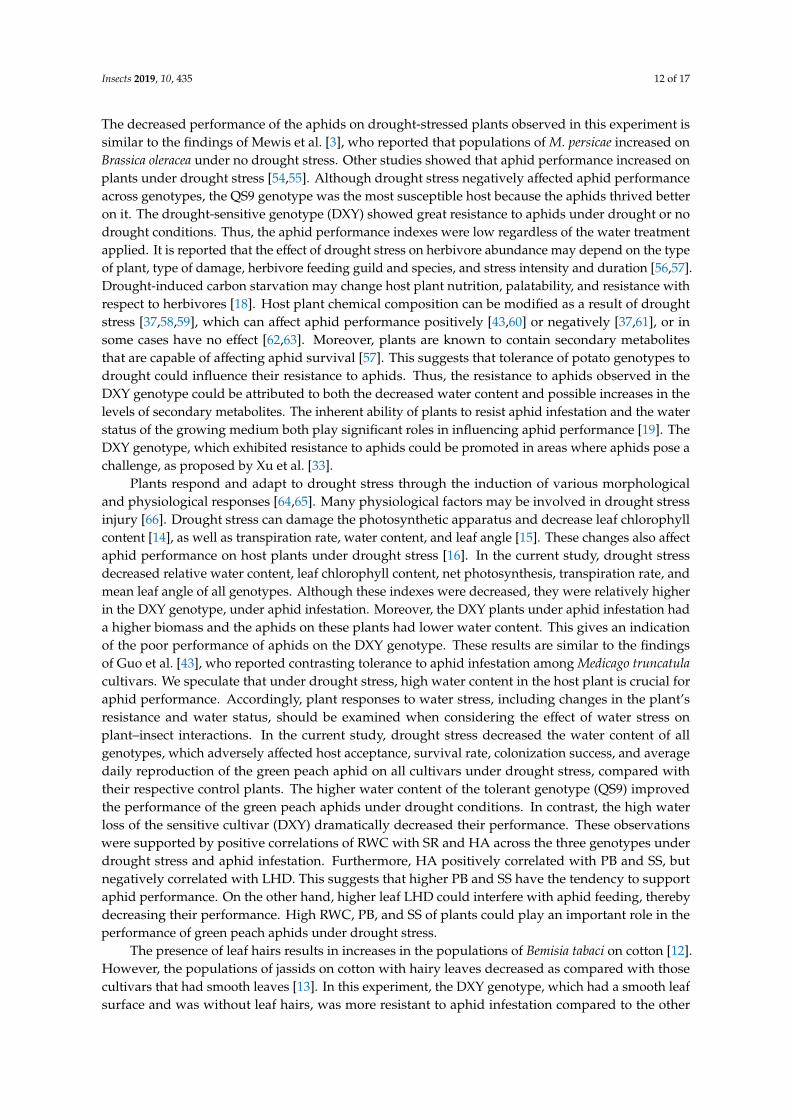
In this study, changes in ROS scavenging activities such as POD, SOD, and CAT were investigated to assess whether differences can be associated with resistance to drought stress and aphid infestation. The results show that POD, SOD, and CAT activities increased in all genotypes under drought and aphid stress compared to their respective controls (Figure 8a–c). Under drought stress, POD activity in QS9, L3, and DXY increased by 78.6%, 58.6%, and 41.1%, respectively, and by 58.6%, 41.1%, and 37.1% under aphid stress, respectively. The SOD activity in QS9, L3, and DXY also increased by 49.1%, 41.15, and 33.0% under drought stress and 29.1%, 27.95, and 2% under aphid stress, respectively. The CAT activity in QS9, L3, and DXY also increased by 77.9%, 62.8%, and 52.2% under drought stress and 52.6%, 52.2%, and 36.6% under aphid stress, respectively. The POD, SOD, and CAT activities were higher in QS9 than the other cultivars under drought stress and aphid infestation, whereas the lowest POD, SOD, and CAT activities occurred in DXY.
Figure 8. Changes in (a) peroxidase (POD), (b) superoxide dismutase (SOD), and (c) catalase (CAT) activities in three potato cultivars grown under well-watered or drought conditions with and without peach aphid infestation. Data represent the mean ± SD of three replicates. Lower case letters indicate statistically significant differences between genotypes within the same water treatment and aphid treatment by LSD test (p < 0.05).
4. Discussion
The availability of water is critical for plant growth and their resistance to insect pests [7,53]. Khan et al. [4] reported that sap sucking insect pests, such aphids, thrive better on water-stressed plants than on normal plants. In contrast, Simpson et al. [5] reported that these insect pests thrive better on plants grown without water stress. Notably, only some field experiments support the concept that aphid density increases on drought-stressed plants; the experimentally imposed water stress, nevertheless, often adversely affects aphid performance [2]. In the current study, higher aphid performance was observed on the well-watered plants compared with the drought-stressed plants across all genotypes. Drought stress decreased all aphid performance indexes, including host acceptance, aphid survival, colonization success, and average daily reproduction, across genotypes. The decreased performance of the aphids on drought-stressed plants observed in this experiment is
Figure 7. Changes in (a) malondialdehyde (MDA), (b) H2O2, and (c), and proline content in threepotato cultivars grown under well-watered or drought conditions with and without peach aphidinfestation. Data represent the mean ± SD of three replicates. Lower case letters indicate statisticallysignificant differences between genotypes within the same water treatment and aphid treatment byLSD test (p < 0.05).
3.9. Effect of Drought Stress and Aphid Interaction on Antioxidant Enzymes Activities
In this study, changes in ROS scavenging activities such as POD, SOD, and CAT were investigatedto assess whether differences can be associated with resistance to drought stress and aphid infestation.The results show that POD, SOD, and CAT activities increased in all genotypes under drought andaphid stress compared to their respective controls (Figure 8a–c). Under drought stress, POD activityin QS9, L3, and DXY increased by 78.6%, 58.6%, and 41.1%, respectively, and by 58.6%, 41.1%, and37.1% under aphid stress, respectively. The SOD activity in QS9, L3, and DXY also increased by 49.1%,41.15, and 33.0% under drought stress and 29.1%, 27.95, and 2% under aphid stress, respectively. TheCAT activity in QS9, L3, and DXY also increased by 77.9%, 62.8%, and 52.2% under drought stress and52.6%, 52.2%, and 36.6% under aphid stress, respectively. The POD, SOD, and CAT activities werehigher in QS9 than the other cultivars under drought stress and aphid infestation, whereas the lowestPOD, SOD, and CAT activities occurred in DXY.
Insects 2019, 10, 435 11 of 17
Figure 7. Changes in (a) malondialdehyde (MDA), (b) H2O2, and (c), and proline content in three potato cultivars grown under well-watered or drought conditions with and without peach aphid infestation. Data represent the mean ± SD of three replicates. Lower case letters indicate statistically significant differences between genotypes within the same water treatment and aphid treatment by LSD test (p < 0.05).
3.9. Effect of Drought Stress and Aphid Interaction on Antioxidant Enzymes Activities
In this study, changes in ROS scavenging activities such as POD, SOD, and CAT were investigated to assess whether differences can be associated with resistance to drought stress and aphid infestation. The results show that POD, SOD, and CAT activities increased in all genotypes under drought and aphid stress compared to their respective controls (Figure 8a–c). Under drought stress, POD activity in QS9, L3, and DXY increased by 78.6%, 58.6%, and 41.1%, respectively, and by 58.6%, 41.1%, and 37.1% under aphid stress, respectively. The SOD activity in QS9, L3, and DXY also increased by 49.1%, 41.15, and 33.0% under drought stress and 29.1%, 27.95, and 2% under aphid stress, respectively. The CAT activity in QS9, L3, and DXY also increased by 77.9%, 62.8%, and 52.2% under drought stress and 52.6%, 52.2%, and 36.6% under aphid stress, respectively. The POD, SOD, and CAT activities were higher in QS9 than the other cultivars under drought stress and aphid infestation, whereas the lowest POD, SOD, and CAT activities occurred in DXY.
Figure 8. Changes in (a) peroxidase (POD), (b) superoxide dismutase (SOD), and (c) catalase (CAT) activities in three potato cultivars grown under well-watered or drought conditions with and without peach aphid infestation. Data represent the mean ± SD of three replicates. Lower case letters indicate statistically significant differences between genotypes within the same water treatment and aphid treatment by LSD test (p < 0.05).
4. Discussion
The availability of water is critical for plant growth and their resistance to insect pests [7,53]. Khan et al. [4] reported that sap sucking insect pests, such aphids, thrive better on water-stressed plants than on normal plants. In contrast, Simpson et al. [5] reported that these insect pests thrive better on plants grown without water stress. Notably, only some field experiments support the concept that aphid density increases on drought-stressed plants; the experimentally imposed water stress, nevertheless, often adversely affects aphid performance [2]. In the current study, higher aphid performance was observed on the well-watered plants compared with the drought-stressed plants across all genotypes. Drought stress decreased all aphid performance indexes, including host acceptance, aphid survival, colonization success, and average daily reproduction, across genotypes. The decreased performance of the aphids on drought-stressed plants observed in this experiment is
Figure 8. Changes in (a) peroxidase (POD), (b) superoxide dismutase (SOD), and (c) catalase (CAT)activities in three potato cultivars grown under well-watered or drought conditions with and withoutpeach aphid infestation. Data represent the mean ± SD of three replicates. Lower case letters indicatestatistically significant differences between genotypes within the same water treatment and aphidtreatment by LSD test (p < 0.05).
4. Discussion
The availability of water is critical for plant growth and their resistance to insect pests [7,53].Khan et al. [4] reported that sap sucking insect pests, such aphids, thrive better on water-stressedplants than on normal plants. In contrast, Simpson et al. [5] reported that these insect pests thrivebetter on plants grown without water stress. Notably, only some field experiments support theconcept that aphid density increases on drought-stressed plants; the experimentally imposed waterstress, nevertheless, often adversely affects aphid performance [2]. In the current study, higheraphid performance was observed on the well-watered plants compared with the drought-stressedplants across all genotypes. Drought stress decreased all aphid performance indexes, including hostacceptance, aphid survival, colonization success, and average daily reproduction, across genotypes.
Insects 2019, 10, 435 12 of 17
The decreased performance of the aphids on drought-stressed plants observed in this experiment issimilar to the findings of Mewis et al. [3], who reported that populations of M. persicae increased onBrassica oleracea under no drought stress. Other studies showed that aphid performance increased onplants under drought stress [54,55]. Although drought stress negatively affected aphid performanceacross genotypes, the QS9 genotype was the most susceptible host because the aphids thrived betteron it. The drought-sensitive genotype (DXY) showed great resistance to aphids under drought or nodrought conditions. Thus, the aphid performance indexes were low regardless of the water treatmentapplied. It is reported that the effect of drought stress on herbivore abundance may depend on the typeof plant, type of damage, herbivore feeding guild and species, and stress intensity and duration [56,57].Drought-induced carbon starvation may change host plant nutrition, palatability, and resistance withrespect to herbivores [18]. Host plant chemical composition can be modified as a result of droughtstress [37,58,59], which can affect aphid performance positively [43,60] or negatively [37,61], or insome cases have no effect [62,63]. Moreover, plants are known to contain secondary metabolitesthat are capable of affecting aphid survival [57]. This suggests that tolerance of potato genotypes todrought could influence their resistance to aphids. Thus, the resistance to aphids observed in theDXY genotype could be attributed to both the decreased water content and possible increases in thelevels of secondary metabolites. The inherent ability of plants to resist aphid infestation and the waterstatus of the growing medium both play significant roles in influencing aphid performance [19]. TheDXY genotype, which exhibited resistance to aphids could be promoted in areas where aphids pose achallenge, as proposed by Xu et al. [33].
Plants respond and adapt to drought stress through the induction of various morphologicaland physiological responses [64,65]. Many physiological factors may be involved in drought stressinjury [66]. Drought stress can damage the photosynthetic apparatus and decrease leaf chlorophyllcontent [14], as well as transpiration rate, water content, and leaf angle [15]. These changes also affectaphid performance on host plants under drought stress [16]. In the current study, drought stressdecreased relative water content, leaf chlorophyll content, net photosynthesis, transpiration rate, andmean leaf angle of all genotypes. Although these indexes were decreased, they were relatively higherin the DXY genotype, under aphid infestation. Moreover, the DXY plants under aphid infestation hada higher biomass and the aphids on these plants had lower water content. This gives an indicationof the poor performance of aphids on the DXY genotype. These results are similar to the findingsof Guo et al. [43], who reported contrasting tolerance to aphid infestation among Medicago truncatulacultivars. We speculate that under drought stress, high water content in the host plant is crucial foraphid performance. Accordingly, plant responses to water stress, including changes in the plant’sresistance and water status, should be examined when considering the effect of water stress onplant–insect interactions. In the current study, drought stress decreased the water content of allgenotypes, which adversely affected host acceptance, survival rate, colonization success, and averagedaily reproduction of the green peach aphid on all cultivars under drought stress, compared withtheir respective control plants. The higher water content of the tolerant genotype (QS9) improvedthe performance of the green peach aphids under drought conditions. In contrast, the high waterloss of the sensitive cultivar (DXY) dramatically decreased their performance. These observationswere supported by positive correlations of RWC with SR and HA across the three genotypes underdrought stress and aphid infestation. Furthermore, HA positively correlated with PB and SS, butnegatively correlated with LHD. This suggests that higher PB and SS have the tendency to supportaphid performance. On the other hand, higher leaf LHD could interfere with aphid feeding, therebydecreasing their performance. High RWC, PB, and SS of plants could play an important role in theperformance of green peach aphids under drought stress.
The presence of leaf hairs results in increases in the populations of Bemisia tabaci on cotton [12].However, the populations of jassids on cotton with hairy leaves decreased as compared with thosecultivars that had smooth leaves [13]. In this experiment, the DXY genotype, which had a smooth leafsurface and was without leaf hairs, was more resistant to aphid infestation compared to the other
Insects 2019, 10, 435 13 of 17
genotypes. This genotype had the least number of aphids that survived on it. Leaves with smooth,hairless surfaces may be more prone to having the boundary layer disrupted by wind currents thanhairy leaves, thereby making them less suitable for the development of pests [11,67]. This might havecontributed to the aphid tolerance of the DXY plants. Casson and Gray [68] reported that short-termresponses to unfavorable conditions cause plants to alter their stomata aperture, but when suchconditions persist, the stomata density or size may be affected. The results of our experiment show thatdrought stress and aphid infestation decreased stomata density, number, and size of all cultivars. TheDXY plants had the least stomata density, number, and size compared with the other genotypes whenexposed to drought stress. This gives an indication of their poor tolerance to drought stress. Undermoderate stress stomata number increases, but it decreases under severe water stress [19]. Droughtstress also has an effect on stomata size, with smaller stomata being observed in plants under droughtstress [18]. In this study, aphid infestation decreased stomata density, number, and size in QS9 and L3plants, but did not affect them in DXY plants, suggesting that the DXY genotype is more resistant toaphids than the other genotypes.
The early signal events during defense responses in plants usually include the production ofhigher contents of ROS, MDA, and Pro [20,22]. Our results show that drought stress and aphidinfestation increased H2O2, MDA, and Pro contents in all genotypes compared to the respective controlplants. However, the increase in H2O2 and MDA contents was least in QS9 under drought stress andin DXY under aphid stress. The contents of H2O2 and MDA in DXY plants under aphid stress did notdiffer significantly from those without aphids, probably because of its tolerance to aphids. The increasein Pro content observed in all cultivars under drought stress did not improve aphid performance,probably because Pro acted as a mediator of osmotic adjustment and might have acted in this caseas a stress-related signal more than as a nutrition substrate for aphids [69]. The drought-sensitivegenotype, DXY, which exhibited tolerance to aphids, accumulated a higher amount of Pro compared tothe other genotypes.
To avoid or alleviate cell damage caused by ROS, plants stimulate their antioxidant enzyme system,and these protective enzymes are closely related to plant stress resistance. The SOD activity providesthe first line of defense against membrane lipid peroxidation induced by ROS [24]. In our study, SOD,CAT, and POD activities of all genotypes increased under drought stress and aphid infestation, butthe rate of increase varied among genotypes. The activities of POD, SOD, and CAT were highest inQS9 plants under drought stress and aphid infestation, while the least POD, SOD, and CAT activityoccurred in DXY plants. The activity of antioxidant enzymes in plants is believed to be an indication oftheir level of tolerance to stress [24,70]. Although QS9 plants were more tolerant to drought stresscompared to the other genotypes, they exhibited greater susceptibility to the aphids with high hostacceptance as well as greater survival rate, colonization success, and average daily reproduction of theaphids. These results show that SOD and CAT activities play important roles in the tolerance of QS9plants to drought, but this does not protect the plants against aphid stress. The POD, SOD, and CATactivities under aphid stress were lower in DXY plants, even though they exhibited greater tolerance toaphids with or without drought stress. This was demonstrated by greater biomass accumulation inthe DXY plants. In addition, host acceptance, survival rate, colonization success, and average dailyreproduction of aphids on this genotype were low. This was probably because the DXY genotypecontains compounds that reduce feeding by the peach aphid. Thus, the results of our experimentsuggest that the mechanism of tolerance to drought in potato plants differs from the mechanism thatmay confer aphid tolerance.
5. Conclusions
The results of this study show that the drought-sensitive genotype, DXY, exhibited greatertolerance to peach aphids under drought or no drought conditions. This was demonstrated by pooraphid performance and higher biomass accumulation of this genotype. However, the drought-tolerantgenotype, QS9, was highly susceptible to the peach aphid. This was shown by the high aphid
Insects 2019, 10, 435 14 of 17
performance and low biomass accumulation. Furthermore, the extreme water loss of the sensitivegenotype, DXY, dramatically decreased the performance of the green peach aphid under drought stress.The drought-tolerant genotype exhibited high water content on which the green peach aphid is able toabsorb from the xylem sap, thereby improving the performance of the green peach aphid. Resistance ofthe DXY genotype to the peach aphid may also be due to the presence of toxic compounds in the plants,since it exhibited poor host acceptance. Thus, the DXY genotype can be utilized to increase potato yieldin areas where peach aphids are a major constraint. This study demonstrates that the biochemical andmorphological traits that confer drought tolerance in potato do not necessarily confer aphid tolerance.Further studies to ascertain the presence and levels of compounds that could inhibit feeding by peachaphids could advance our knowledge on the response of these genotypes to peach aphids.
Author Contributions: Conceptualization, P.Q.; data curation, C.L. and Y.G.; formal analysis, P.Q.; methodology,P.Q.; supervision, C.L.; writing-original draft, P.Q.; writing-review and editing, J.A.C.
Funding: This article was fully funded by The National Key Research and Development Program ofChina (2018YFD0200805).
Acknowledgments: We thank Jing-Jiang Zhou of Rothamsted Research, UK, who critically read the manuscriptand gave valuable suggestions which contributed to the quality of this article. We are also grateful to Jiang-PingBai and Mohammed Mujitaba Dawuda for their contribution to this publication.
Conflicts of Interest: The authors declare no conflict of interest. The funders had no role in the design of thestudy; in the collection, analyses, or interpretation of data; in the writing of the manuscript; or in the decision topublish the results.
References
1. Silva, A.X.; Jander, G.; Samaniego, H.; Ramsey, J.S.; Figueroa, C.C. Insecticide resistance mechanisms in thegreen peach aphid Myzus persicae (Hemiptera: Aphididae) I: A transcriptomic survey. PLoS ONE 2012, 7, 1–2.[CrossRef] [PubMed]
2. Huberty, A.; Denno, R. Plant water stress and its consequences for herbivorous insects: A new synthesis.Ecology 2004, 85, 1383–1398. [CrossRef]
3. Mewis, I.; Khan, M.A.; Glawischnig, E.; Schreiner, M.; Ulrichs, C. Water stress and aphid feeding differentiallyinfluence metabolite composition in Arabidopsis thaliana (L.). PLoS ONE 2012, 7, 4–7. [CrossRef] [PubMed]
4. Khan, M.A.; Ulrichs, C.; Mewis, I. Influence of water stress on the glucosinolate profile of Brassica oleraceavar. italica and the performance of Brevicoryne brassicae and Myzus persicae. Entomol. Exp. Appl. 2010, 137,229–236. [CrossRef]
5. Simpson, K.L.S.; Jackson, G.E.; Grace, J. The response of aphids to plant water stress—The case of Myzuspersicae and Brassica oleracea var. capitata. Entomol. Exp. Appl. 2012, 142, 191–202. [CrossRef]
6. Ehsanpour, A.A.; Razavizadeh, R. Effect of UV-C on drought tolerance of alfalfa (Medicago sativa) callus. Am.J. Biochem. Biotechnol. 2005, 1, 107–110. [CrossRef]
7. Su, Z.; Ma, X.; Guo, H.; Sukiran, N.L.; Guo, B.; Assmann, S.M.; Ma, H. Flower development under droughtstress: Morphological and transcriptomic analyses reveal acute responses and long-term acclimation inArabidopsis. Plant Cell 2013, 25, 3785–3807. [CrossRef]
8. Turtola, S.; Rousi, M.; Pusenius, J.; Yamaji, K.; Heiska, S.; Tirkkonen, V.; Meier, B.; Julkunen-Tiitto, R.Clone-specific responses in leaf phenolics of willows exposed to enhanced UVB radiation and drought stress.Glob. Chang. Biol. 2005, 11, 1655–1663. [CrossRef]
9. Mody, K.; Eichenberger, D.; Dorn, S. Stress magnitude matters: Different intensities of pulsed water stressproduce non-monotonic resistance responses of host plants to insect herbivores. Ecol. Entomol. 2009, 34,133–143. [CrossRef]
10. Reddall, A.; Sadras, V.O.; Wilson, L.J.; Gregg, P.C. Physiological responses of cotton to two-spotted spidermite damage. Crop Sci. 2004, 44, 835–846. [CrossRef]
11. Willmer, P. Microclimatic effects on insects at the plant surface. In Insects and the Plant Surface; Juniper, B.E.,Southwood, T.R.E., Eds.; Edward Arnold: London, UK, 1986; Volume 16, pp. 65–80.
Insects 2019, 10, 435 15 of 17
12. Chu, C.-C.; Natwick, E.T.; Henneberry, T.J. Bemisia tabaci (Homoptera: Aleyrodidae) Biotype B Colonizationon Okra- and Normal-Leaf Upland Cotton Strains and Cultivars. J. Econ. Entomol. 2002, 95, 733–738.[CrossRef] [PubMed]
13. Bhat, M.G.; Joshi, A.B.; Singh, M. Hairiness in relation to resistance to jassid (Amrasca devastans Distant) andother insect pests and quality characters in cotton (Gossypium spp.)—A review. Agric. Rev. 1982, 3, 1–8.
14. Fu, J.; Huang, B. Involvement of antioxidants and lipid peroxidation in the adaptation of two cool-seasongrasses to localized drought stress. Environ. Exp. Bot. 2001, 45, 105–114. [CrossRef]
15. Flexas, J.; Medrano, H. Drought inhibition of photosynthesis in C3 plants: Stomatal and non-stomatallimitations revisited. Ann. Bot. 2002, 89, 183–189. [CrossRef] [PubMed]
16. Sun, Y.; Guo, H.; Yuan, L.; Wei, J.; Zhang, W.; Ge, F. Plant stomatal closure improves aphid feeding underelevated CO2. Glob. Chang. Biol. 2015, 21, 2739–2748. [CrossRef] [PubMed]
17. McDowell, N.G. Mechanisms linking drought, hydraulics, carbon metabolism, and vegetation mortality.Plant Physiol. 2011, 155, 1051–1059. [CrossRef]
18. Wang, Y.; Chen, X.; Xiang, C.B. Stomatal density and bio-water saving. J. Integr. Plant Biol. 2007, 49, 1435–1444.[CrossRef]
19. Xu, Z.; Zhou, G. Responses of leaf stomatal density to water status and its relationship with photosynthesisin a grass. J. Exp. Bot. 2008, 59, 3317–3325. [CrossRef]
20. Maffei, M.E.; Mithofer, A.; Arimura, G.; Uchtenhagen, H.; Bossi, S.; Bertea, C.M.; Cucuzza, L.S.; Novero, M.;Volpe, V.; Quadro, S.; et al. Effects of feeding Spodoptera littoralis on lima bean leaves. III. Membranedepolarization and involvement of hydrogen peroxide. Plant Physiol. 2006, 140, 1022–1035. [CrossRef]
21. Howe, G.A.; Jander, G. Plant immunity to insect herbivores. Annu. Rev. Plant Biol. 2008, 59, 41–66. [CrossRef]22. Wu, J.; Baldwin, I.T. New insights into plant responses to the attack from insect herbivores. Annu. Rev. Genet.
2010, 44, 1–24. [CrossRef] [PubMed]23. Roy, P.; Dhandapani, R. Plant defence proteins during aphid infestation. Int. J. Appl. Biol. Pharm. Tech. 2011,
2, 52–57.24. Mao, H.; Yang, Y.H.; Guo, C.X.; Zhang, Q.W.; Liu, X.X. Changes in defensive enzyme expression in cotton
leaves activity and defensive enzyme gene after feeding by Apolygus lucorum. Chin. J. Appl. Entomol. 2012,49, 652–659.
25. FAO. Food and Agricultural Organization of the United Nations Database; FAO: Rome, Italy, 2011.26. Visser, R.G.F.; Bachem, C.W.B.; de Boer, J.M.; Bryan, G.J.; Chakrabati, S.K.; Feingold, S.; Gromadka, R.; van
Ham, R.C.H.J.; Huang, S.; Jacobs, J.M.E.; et al. Sequencing the potato genome: Outline and first results tocome from the elucidation of the sequence of the world’s third most important food crop. Am. J. Potato Res.2009, 86, 417–429. [CrossRef]
27. Watkinson, J.I.; Hendricks, L.; Sioson, A.A.; Heat, L.S.; Bohnert, H.J.; Grene, R. Tuber development phenotypesin adapted and acclimated, drought-stressed Solanum tuberosum ssp. andigena have distinct expressionprofiles of genes associated with carbon metabolism. Plant Physiol. Biochem. 2008, 46, 34–45. [CrossRef][PubMed]
28. Lesk, C.; Rowhani, P.; Ramankutty, N. Influence of extreme weather disasters on global crop production.Nature 2016, 529, 84–87. [CrossRef]
29. Gao, Y.; Xu, J.; Liu, N.; Zhou, Q.; Ding, X.; Zhan, J.; Cheng, X.; Huang, J.; Lu, Y.; Yang, Y. Current status andmanagement strategies for potato insect pests and diseases in China. Plant Prot. 2019, 45, 106–111. [CrossRef]
30. Rosenzweig, C.J.; Elliott, D.; Deryng, A.C.; Ruane, C.; Müller, A.; Arneth, J.; Jones, W. Assessing agriculturalrisks of climate change in the 21st century in a global gridded crop model intercomparison. Proc. Natl. Acad.Sci. USA 2014, 111, 3268–3273. [CrossRef]
31. Daryanto, S.; Wang, L.; Jacinthe, P.A. Global synthesis of drought effects on food legume production. PLoSONE 2015, 10, 12–14. [CrossRef]
32. Jaganathan, D.; Thudi, M.; Kale, S.; Azam, S.; Roorkiwal, M.; Gaur, P.M.; Kishor, P.B.; Nguyen, H.; Sutton, T.;Varshney, R.K. Genotyping-by-sequencing based intra-specific genetic map refines a ‘QTL-hotspot’ regionfor drought tolerance in chickpea. Mol. Genet. Genom. 2015, 290, 559–571. [CrossRef]
33. Xu, J.; Zhu, J.; Yang, Y.; Tang, H.; Lu, H.; Fan, M.; Shi, Y.; Dong, D.; Wang, G.; Wang, W.; et al. Status ofmajor diseases and insect pests of potato and pesticides usage in China. Sci. Agric. Sin. 2019, 2, 2800–2808.[CrossRef]
Insects 2019, 10, 435 16 of 17
34. Deblonde, P.M.K.; Ledent, J.F. Effects of moderate drought conditions on green leaf number, stem height, leaflength and tuber yield of potato cultivars. Eur. J. Agron. 2001, 14, 31–41. [CrossRef]
35. Lahlou, O.; Ledent, J.F. Root mass and depth, stolons and roots formed on stolons in four cultivars of potatounder water stress. Eur. J. Agron. 2005, 22, 159–173. [CrossRef]
36. Alva, A.K.; Moore, A.D.; Collins, H.P. Impact of deficit irrigation on tuber yield and quality of potato cultivars.J. Crop Improv. 2012, 26, 211–227. [CrossRef]
37. Hale, B.K.; Bale, J.S.; Pritchard, J.; Masters, G.J. Effects of host plant drought stress on the performance ofthe bird cherry-oat aphid, Rhopalosiphum padi (L.): A mechanistic analysis. Ecol. Entomol. 2003, 28, 666–677.[CrossRef]
38. Agele, S.O.; Ofuya, T.I.; James, P.O. Effects of watering regimes on aphid infestation and performance ofselected varieties of cowpea (Vigna unguiculata L. Walp) in a humid rainforest zone of Nigeria. Crop Prot.2006, 25, 73–78. [CrossRef]
39. Gould, N.; Thorpe, M.R.; Minchin, P.E.H.; Pritchard, J.; White, P.J. Solute is imported to elongating root cellsof barley as a pressure driven-flow of solution. Funct. Plant Biol. 2004, 31, 391–397. [CrossRef]
40. Barry, A.; Berry, R.E.; Tamaki, G. Host preference of the green peach aphid, Myzus persicae (Hemiptera:Aphididae). Environ. Entomol. 1982, 11, 824–827.
41. Hoy, C.W.; Boiteau, G.; Alyokhin, A.; Dively, G.; Alvarez, J.M. Managing insects and mites. In Potato HealthManagement, 2nd ed.; Johnson, D.A., Ed.; Plant Health Management Series; American PhytopathologicalSociety: St Paul, MN, USA, 2008; pp. 133–147.
42. Thomas, S.; Dogimont, C.; Boissot, N. Association between Aphis gossypii genotype and phenotype on melonaccessions. Arthrop. Plant Interact. 2012, 6, 93–101. [CrossRef]
43. Guo, H.; Sun, Y.; Peng, X.; Wang, Q.; Harris, M.; Ge, F. Up-regulation of abscisic acid signaling pathwayfacilitates aphid xylem absorption and osmoregulation under droughtstress. J. Exp. Bot. 2016, 67, 681–693.[CrossRef]
44. Barrs, H.D.; Weatherley, P.E. A re-examination of the relative turgidity technique for estimating water deficitsin leaves. Aust. J. Biol. Sci. 1962, 15, 413–428. [CrossRef]
45. Talbot, M.J.; White, R.G. Cell surface and cell outline imaging in plant tissues using the backscattered electrondetector in a variable pressure scanning electron microscope. Plant Methods 2013, 9, 36–40. [CrossRef][PubMed]
46. Bates, L.S.; Waldren, R.P.; Teare, I.D. Rapid determination of free proline for water-stress studies. Plant Soil1973, 39, 205–207. [CrossRef]
47. Irigoyen, J.J.; Emerich, D.W.; Sanchez-Diaz, M. Water stress induced changes in concentrations of proline andtotalsoluble sugars in nodulated alfalfa (Medicago sativa) plants. Physiol. Plant 1992, 84, 55–60. [CrossRef]
48. Mostofa, M.G.; Fujita, M. Salicylic acid alleviates copper toxicity in rice (Oryza sativa L.) seedlings byup-regulating antioxidative and glyoxalase systems. Ecotoxicology 2013, 22, 959–973. [CrossRef]
49. Liu, J.; Li, J.; Su, X.; Xia, Z. Grafting improves drought tolerance by regulating antioxidant enzyme activitiesand stressresponsive gene expression in tobacco. Environ. Exp. Bot. 2014, 107, 173–179. [CrossRef]
50. Giannopolitis, C.N.; Ries, S.K. Superoxide dismutase in higher plants. Plant Physiol. 1977, 59, 309–314.[CrossRef]
51. Chance, B.; Maehly, A.C. Assay of catalase and peroxidases. Methods Enzymol. 1955, 2, 764–775.52. Nakano, Y.; Asada, K. Hydrogen peroxide is scavenged by ascorbate-specific peroxidase in spinach
chloroplasts. Plant Cell Physiol. 1981, 22, 867–880.53. Koricheva, J.; Larsson, S. Insect performance on experimentally stressed woody plants: A meta-analysis.
Annu. Rev. Entomol. 1998, 43, 195–216. [CrossRef]54. Staley, J.T.; Mortimer, S.R.; Masters, G.J.; Morecroft, M.D.; Brown, V.K.; Taylor, M.E. Drought stress
differentially affects leaf mining species. Ecol. Entomol. 2006, 31, 460–469. [CrossRef]55. Stone, A.C.; Gehring, C.A.; Whitham, T.G. Drought negatively affects communities on a foundation tree:
Growth rings predict diversity. Oecologia 2010, 164, 751–761. [CrossRef] [PubMed]56. Cornelissen, T.; Fernandes, G.W.; Vasconcellos-Neto, J. Size does matter: Variation in herbivory between and
within plants and the plant vigor hypothesis. Oikos 2008, 117, 1121–1130. [CrossRef]57. White, T.C.R. Plant vigour versus plant stress: A false dichotomy. Oikos 2009, 118, 807–808. [CrossRef]58. Karley, A.J.; Douglas, A.E.; Parker, W.E. Amino acid composition and nutritional quality of potato leaf
phloem sap for aphids. J. Exp. Bot. 2002, 205, 3009–3018.
Insects 2019, 10, 435 17 of 17
59. Bale, J.S.; Ponder, K.L.; Pritchard, J. Coping with Stress. In Aphids as Crop Pests; Van Emden, H.F.,Harrington, R., Eds.; CAB International: Wallingford, UK, 2007; Volume 287, p. 309.
60. Wearing, C.H. Responses of Myzus persicae and Brevicoryne brassicae to leaf age and water stress in Brusselssprouts grown in pots. Entomol. Exp. Appl. 1972, 15, 61–80. [CrossRef]
61. Johnson, S.N.; Staley, J.T.; Mcleod, F.A.L.; Hartley, S.E. Plant-mediated effects of soil invertebrates andsummer drought on above-ground multitrophic interactions. J. Ecol. 2011, 99, 57–65. [CrossRef]
62. Bethke, J.A.; Redak, R.A.; Schuch, U.K. Melon aphid performance on chrysanthemum as mediated by cultivar,and differential levels of fertilization and irrigation. Entomol. Exp. Appl. 1998, 88, 41–47. [CrossRef]
63. King, C.; Jacob, H.S.; Berlandier, F. The influence of water deficiency on the relationship between canola(Brassica napus L.), and two aphid species (Hemiptera: Aphididae), Lipaphis erysimi (Kaltenbach) andBrevicoryne brassicae (L.). Aust. J. Agric. Res. 2006, 57, 439–445. [CrossRef]
64. Wang, Z.L.; Huang, B.R. Physiological recovery of Kentucky bluegrass from simultaneous drought and heatstress. Crop Sci. 2004, 44, 1729–1736. [CrossRef]
65. Jiang, M.; Zhang, J. Water stress-induced abscisic acid accumulation triggers the increased generation ofreactive oxygen species and up-regulates the activities of antioxidant enzymes in maize leaves. J. Exp. Bot.2002, 53, 2401–2410. [CrossRef] [PubMed]
66. Ying, Y.Q.; Song, L.L.; Jacobs, D.F.; Mei, L.; Liu, P.; Jin, S.H. Physiological response to drought stress inCamptotheca acuminata seedlings from two provenances. Front. Plant Sci. 2015, 6, 361. [CrossRef] [PubMed]
67. Burrage, S.W. The micro-climate at the leaf surface. In Biology of Leaf Surface Organisms; Preece, T.F.,Dickinson, C.H., Eds.; Academic Press: London, UK, 1971; pp. 91–101.
68. Casson, S.A.; Gray, J.E. Influence of environmental factors on stomatal development. New Phytol. 2008, 178,9–23. [CrossRef] [PubMed]
69. Szabados, L.; Savouré, A. Proline: A multifunctional amino acid. Trends Plant Sci. 2010, 15, 89–97. [CrossRef]70. Ünyayar, S.; ÇEKIÇ, F.Ö. Changes in antioxidative enzymes of young and mature leaves of tomato seedlings
under drought stress. Turk. J. Biol. 2005, 29, 211–216.
© 2019 by the authors. Licensee MDPI, Basel, Switzerland. This article is an open accessarticle distributed under the terms and conditions of the Creative Commons Attribution(CC BY) license (http://creativecommons.org/licenses/by/4.0/).