Embed Size (px)
Citation preview
biomolecules
Article
Rheopectic Behavior for Aqueous Solutions ofMegamolecular Polysaccharide Sacran
Fitri Adila Amat Yusof 1,†, Miho Yamaki 1,†, Mika Kawai 1,†, Maiko K. Okajima 2,Tatsuo Kaneko 2,† and Tetsu Mitsumata 1,*,†
1 Graduate School of Science and Technology, Niigata University, Niigata 950-2181, Japan;[email protected] (F.A.A.Y.); [email protected] (M.Y.); [email protected] (M.K.)
2 Graduate School of Advanced Science and Technology, JAIST, Nomi 923-1292, Japan;[email protected] (M.K.O.); [email protected] (T.K.)
* Correspondence: [email protected]; Tel.: +81-(0)25-262-6884† ALCA, Japan Science and Technology Agency, Tokyo 102-0076, Japan.
Received: 2 December 2019; Accepted: 15 January 2020; Published: 17 January 2020�����������������
Abstract: The rheopectic behavior of sacran aqueous solutions, a natural giant molecularpolysaccharide with a molecular weight of 1.6 × 10⁷ g/mol, was investigated. When a low shear wasapplied to 1.0 wt.% sacran solution, the shear viscosity increased from 7.2 to 34 Pa·s. The increment inthe viscosity was enhanced as the shear rate decreased. The shear viscosity was independent of thetime at a shear rate of 0.8 s−1; simultaneously, thixotropic behavior was observed at shear rates higherthan 1.0 s−1. A crossover was observed at 0.15 wt.% for the concentration dependence of both theviscosity increase and zeta potential, which was the vicinity of the helix transition concentration orgelation concentration. It was clear that the molecular mechanism for the rheopexy was different atlower and higher regions of the crossover concentration.
Keywords: polysaccharide; polyelectrolyte; viscosity; rheopexy; thixotropy; negative thixotropy
1. Introduction
Sacran is a supergiant cyanobacterial polysaccharide extracted from the jelly extracellular matrixof a river plant named Aphanothece sacrum [1], which has been mass cultivated in Japan for a long time.Sacran is known for its extremely high absolute molecular weight of 1.–2.2 × 10⁷ g/mol [2,3], with achain length more than 30 µm [4]. The saccharide chain contains carboxylate groups (17 mol%) andsulfate groups (12 mol%) relative to the sugar residues [2]. That is, the aqueous solution of sacran is apolyelectrolyte. Due to the electric charges on the chain, sacran changes its conformation dependingon the sacran concentration, e.g., helix transition concentration, where the sacran chain change fromrandom coil to double helix occurs at 0.09 wt.% and gelation concentration, where sacran showed atransition from liquid to weak gel at 0.25 wt.%.
Sacran shows various unique phenomena such as high swelling [2,4,5] and anisotropic swellingbehaviors [4], liquid crystalline (LC) behavior [6,7], ion adsorption behavior [8–10], and anisotropicdiffusion behavior in highly ordered sacran films [3,11–14]. The retention capacity for uncross-linkedsacran exceeds higher than 6000 mL/g for pure water and 2700 mL/g for NaCl aqueous solution [2].Similar high swelling behaviors were found for cross-linked sacran hydrogels, e.g., 6100 mL/g for purewater and 530 mL/g for 0.9 wt.% for saline solution [2]. These high-swelling behaviors might originatefrom the large mesh consisting of extremely long chains of sacran or macroscopic LC domains withmillimeter to several centimeter scales in which sacran chains are aligned by self-organization [6]. Forion adsorption, sacran shows a feature that the adsorption ratio for sacran against trivalent neodymiumions (Nd3+) is twice that for sodium alginate [9]. The efficient adsorption for lanthanoid ions was
Biomolecules 2020, 10, 155; doi:10.3390/biom10010155 www.mdpi.com/journal/biomolecules
Biomolecules 2020, 10, 155 2 of 11
developed to a hydrogel consisting of sacran and polyvinyl alcohol (PVA) [10]. Interestingly, sacran gelscross-linked by trivalent metal ions demonstrate photo shrinkage behavior by irradiating ultravioletlight [8]. There are some interesting reports describing the bio-inspired texture for dried sacran filmsobtained by evaporating water from their aqueous solution [11–14]. Thus, sacran demonstrates variousunique phenomena originating from the feature of super megamolecules. Anomalous property canalso be seen in the rheological properties of sacran; that is, the viscosity increased over time when asteady shear with low shear rates was applied.
Many reports describe the phenomenon of negative thixotropy or rheopexy, which is the increase ofviscosity with time under a fixed-shear rate. Our understanding about these phenomena is the negativethixotropy is a phenomenon where the absolute value of viscosity decreased after switching from ahigh shear rate to a low shear one. Meanwhile, the rheopexy is a phenomenon that the absolute valueof viscosity increases after the switching. With both negative thixotropy and rheopexy, the viscosityincreases over time. A typical example of the negative thixotropy is found in a paper for ferric oxidereported by Kanai et al. [15]. There are many reports dealing with “negative thixotropy”. For example,polyacrylamide [16–19] and poly(methyl methacrylate) [20] demonstrate negative thixotropy at a shearrate of 10−3 s−1. A potato starch paste exhibits the negative thixotropy at a relatively high shear rate(50, 300 s−1) and high temperature (80–121 ◦C) [21,22]. The aqueous solution of polymers containinginorganic particles demonstrates the negative thixotropy depending on the rest time between thepre-shear and viscosity measurements [23] or the value of pH [24,25]. On the other hand, a paper forhighly concentrated emulsion by Zhao et al. is a typical example of rheopexy [26]. There are somereports dealing with “rheopexy,” e.g., polyacrylamide with high molecular weight [27]. A tomato juicecontaining 1% soy protein demonstrates a rheopectic behavior at shear rates lower than 250 s−1 due toan enhanced aggregation between pectins and soy protein [28]. A synovial fluid and bovine serumalbumin (BSA) solution demonstrates rheopectic behavior at shear rates below 10−1 s−1 due to proteinaggregation [29]. These papers tell us that rheological behavior is complex and many factors affect thisphenomenon, e.g., associations or aggregation of macromolecules by their deformation and orientationdue to the shear. However, the origin is not yet well understood.
In this study, we investigated the rheopectic behavior for sacran aqueous solutions at various shearrates and various sacran concentrations. The sacran concentration dependence of the zeta potentialwas also studied. We discuss here the relationship between the viscosity increase and physicochemicalproperties such as dielectric property or chain conformation. The influence of the macroscopic LCdomain on the rheopectic behavior is also discussed.
2. Experimental Procedures
2.1. Sacran Extraction and Solution Preparation
Sugar chains were extracted from Aphanothece sacrum via a previously reported method [1,2]explained as follows. The Aphanothece sacrum samples were freeze–thawed and washed in pure water,followed by lyophilization. The samples were washed three times using a large amount of ethanolwith shaking (120 rpm) overnight, and then collected by filtration using gauze. The ethanol-washedsamples were put into 0.1 M NaOH aq. at 100 ◦C and agitated at constant temperature for 4 h toyield the transparent solution. The solution was dialyzed with pure water for more than 72 h usingthe regenerated cellulose membrane (molecular weight cut-off (MWCO): 14,000) until the pH valuedecreased to 8.0–9.0 and then filtrated. Then, the filtrate was concentrated by a rotary evaporatorto create a highly viscous solution. The viscous solution was slowly poured into 100% isopropanol(1000 mL) to precipitate a white fibrous material. The fibers were dissolved in hot water again,concentrated, and reprecipitated. These operations were repeated three times in total. The fibrousprecipitates in isopropanol were collected and dried using a vacuum oven. The dried sacran wascompletely dissolved in pure water at 100 ◦C and cooled at room temperature to obtain a sacran aqueous
Biomolecules 2020, 10, 155 3 of 11
solution of 1 wt.%. It was diluted to prepare a sacran solution with various concentrations. Solutionsstored in the refrigerator longer than 24 h were heated again before taking the rheological measurements.
2.2. Rheological Measurements
2.2.1. Steady-Shear Viscosity Measurement
Viscoelastic measurements were carried out using a rheometer (MCR 301, Anton Paar) with astainless cone plate, which had a diameter of 50 mm (CP50, Anton Paar). The minimum torque thatcan be detected by the rheometer is 0.1 µN·m. The temperature was controlled at 25.0 ± 0.1 ◦C usinga Peltier plate during the viscoelastic measurement. Steady-shear flow viscosity experiments wereperformed at a range of shear rate from 0.001 to 10 s−1. A pre-shear with a shear rate of 100 s−1
was applied for 10 s then let rest for 180 s before the measurement in order to reset the structureof self-organized LC domains. The measurement was performed for 900 s until an equilibrium ofapparent viscosity was achieved.
2.2.2. Dynamic Viscoelastic Measurement
Dynamic viscoelastic measurements were also carried out using the same rheometer with ashear of 0.01 at 0.1 Hz. The strain dependence of the storage modulus revealed that the 1% sacranaqueous solution showed the linear viscoelastic regime up to a strain of 0.2. The temperature wascontrolled at 25.0 ± 0.1 ◦C. Storage modulus was also measured in this experiment at three points:before shear (before steady shear was applied), immediately after the shear (at 900 s), and the end ofthe measurement (at 1726 s). The frequency sweep test of dynamic modulus for 1 wt% sacran aqueoussolution revealed that the storage modulus G’ was higher than the loss modulus G” in a frequencyrange of 0.01–10 Hz.
2.3. Zeta Potential Measurement
The zeta potential was measured by a micro-electrophoresis zeta potential analyzer (Model 502,Japan Rufuto Co., Ltd.) at room temperature (20–23 ◦C). An aqueous sacran solution with 5 mL waspoured into a cell with an electrode distance of 4.88 cm, and an electric voltage of 20 V was appliedto the electrodes. Image analysis was carried out using software (Move-tr/2D, Library Co. Ltd.) toanalyze the movement of polysaccharides. The zeta potential was calculated from ζ = ηµ/ε0εr, wherethe η, µ, ε0, and εr are viscosity, mobility, dielectric constant of solution, and dielectric constant ofvacuum, respectively.
2.4. Observation of LC Domains
A 1 mm thick silicon sheet with a hole of ϕ25 mm was placed on a glass plate, and the aqueoussolution of 1 wt.% sacran was poured in the hole and sandwiched by a glass plate. Two polarized filmswere arranged so as to be a condition of crossed nicols, and the polarized image was recorded by adigital camera.
3. Results and Discussion
3.1. Rheopectic Behavior
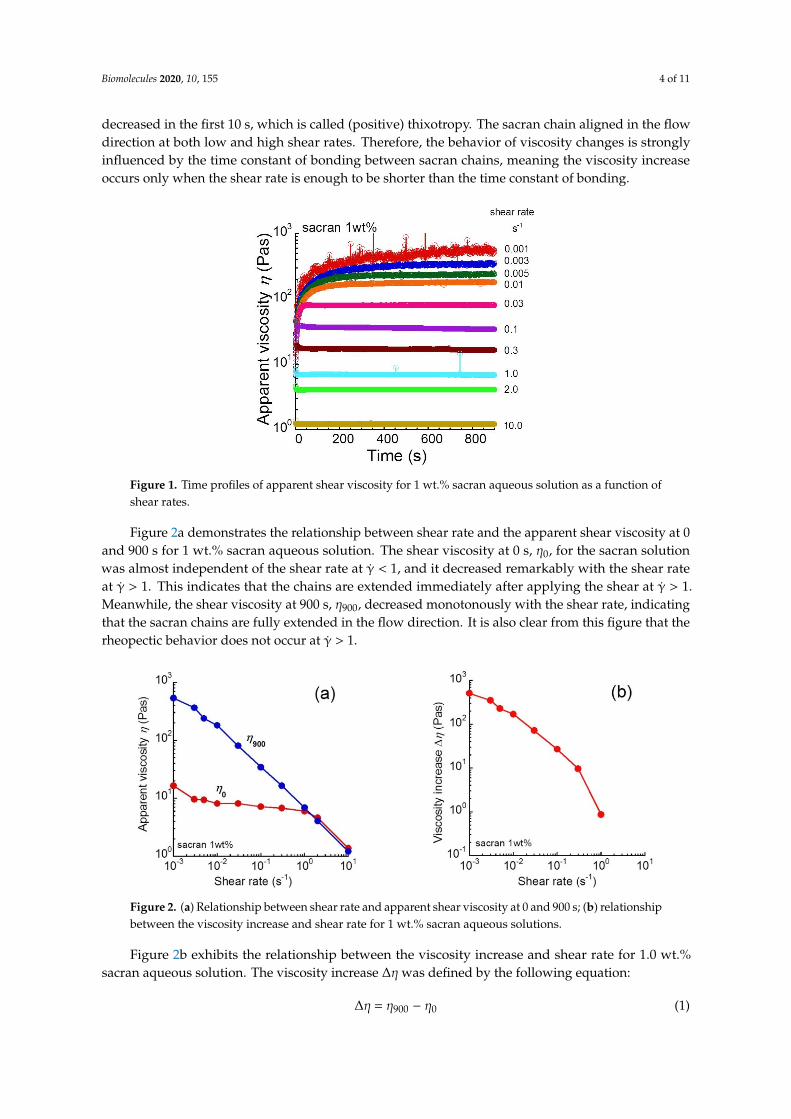
Figure 1 shows the time profiles of apparent shear viscosity for 1 wt.% sacran aqueous solution asa function of shear rates. A phenomenon called rheopexy was observed at low shear rates, where theshear viscosity increased with an elapse of time, and it became constant within 900 s. Similar behaviorwas reported in, e.g., polyacrylamide [27], with the increase in the viscosity of ~6 Pa·s. However,the viscosity increase for the sacran solution was extremely huge. The increment in the viscosity wasenhanced as the shear rate decreased. The shear viscosity was found to be independent of the timeat a shear rate of 0.8 s−1. Meanwhile, at shear rates higher than 1.0 s−1, the shear viscosity rapidly
Biomolecules 2020, 10, 155 4 of 11
decreased in the first 10 s, which is called (positive) thixotropy. The sacran chain aligned in the flowdirection at both low and high shear rates. Therefore, the behavior of viscosity changes is stronglyinfluenced by the time constant of bonding between sacran chains, meaning the viscosity increaseoccurs only when the shear rate is enough to be shorter than the time constant of bonding.Biomolecules 2020, 10, 155 4 of 11
Figure 1. Time profiles of apparent shear viscosity for 1 wt.% sacran aqueous solution as a function of shear rates.
Figure 2a demonstrates the relationship between shear rate and the apparent shear viscosity at 0 and 900 s for 1 wt.% sacran aqueous solution. The shear viscosity at 0 s, η0, for the sacran solution was almost independent of the shear rate at γ̇ < 1, and it decreased remarkably with the shear rate at γ̇ > 1. This indicates that the chains are extended immediately after applying the shear at γ̇ > 1. Meanwhile, the shear viscosity at 900 s, η900, decreased monotonously with the shear rate, indicating that the sacran chains are fully extended in the flow direction. It is also clear from this figure that the rheopectic behavior does not occur at γ̇ > 1.
Figure 2b exhibits the relationship between the viscosity increase and shear rate for 1.0 wt.% sacran aqueous solution. The viscosity increase ∆η was defined by the following equation:
∆η = η900 − η0 (1)
where η0 and η900 are the shear viscosity at 0 and 900 s, respectively. The viscosity increase for sacran solutions decreased significantly with the shear rates.
Figure 2. (a) Relationship between shear rate and apparent shear viscosity at 0 and 900 s; (b) relationship between the viscosity increase and shear rate for 1 wt.% sacran aqueous solutions.
Figure 3 indicates the time profiles of apparent shear viscosity at a shear rate of 0.01 s−1 for sacran aqueous solutions with various sacran concentrations. Similar to Figure 1, the shear viscosity increased with an elapse of time, and it became constant within 900 s. The increment in the viscosity
Figure 1. Time profiles of apparent shear viscosity for 1 wt.% sacran aqueous solution as a function ofshear rates.
Figure 2a demonstrates the relationship between shear rate and the apparent shear viscosity at 0and 900 s for 1 wt.% sacran aqueous solution. The shear viscosity at 0 s, η0, for the sacran solutionwas almost independent of the shear rate at γ̇ < 1, and it decreased remarkably with the shear rateat γ̇ > 1. This indicates that the chains are extended immediately after applying the shear at γ̇ > 1.Meanwhile, the shear viscosity at 900 s, η900, decreased monotonously with the shear rate, indicatingthat the sacran chains are fully extended in the flow direction. It is also clear from this figure that therheopectic behavior does not occur at γ̇ > 1.
Biomolecules 2020, 10, 155 4 of 11
Figure 1. Time profiles of apparent shear viscosity for 1 wt.% sacran aqueous solution as a function of shear rates.
Figure 2a demonstrates the relationship between shear rate and the apparent shear viscosity at 0 and 900 s for 1 wt.% sacran aqueous solution. The shear viscosity at 0 s, η0, for the sacran solution was almost independent of the shear rate at γ̇ < 1, and it decreased remarkably with the shear rate at γ̇ > 1. This indicates that the chains are extended immediately after applying the shear at γ̇ > 1. Meanwhile, the shear viscosity at 900 s, η900, decreased monotonously with the shear rate, indicating that the sacran chains are fully extended in the flow direction. It is also clear from this figure that the rheopectic behavior does not occur at γ̇ > 1.
Figure 2b exhibits the relationship between the viscosity increase and shear rate for 1.0 wt.% sacran aqueous solution. The viscosity increase ∆η was defined by the following equation:
∆η = η900 − η0 (1)
where η0 and η900 are the shear viscosity at 0 and 900 s, respectively. The viscosity increase for sacran solutions decreased significantly with the shear rates.
Figure 2. (a) Relationship between shear rate and apparent shear viscosity at 0 and 900 s; (b) relationship between the viscosity increase and shear rate for 1 wt.% sacran aqueous solutions.
Figure 3 indicates the time profiles of apparent shear viscosity at a shear rate of 0.01 s−1 for sacran aqueous solutions with various sacran concentrations. Similar to Figure 1, the shear viscosity increased with an elapse of time, and it became constant within 900 s. The increment in the viscosity
Figure 2. (a) Relationship between shear rate and apparent shear viscosity at 0 and 900 s; (b) relationshipbetween the viscosity increase and shear rate for 1 wt.% sacran aqueous solutions.
Figure 2b exhibits the relationship between the viscosity increase and shear rate for 1.0 wt.%sacran aqueous solution. The viscosity increase ∆ηwas defined by the following equation:
∆η = η900 − η0 (1)
Biomolecules 2020, 10, 155 5 of 11
where η0 and η900 are the shear viscosity at 0 and 900 s, respectively. The viscosity increase for sacransolutions decreased significantly with the shear rates.
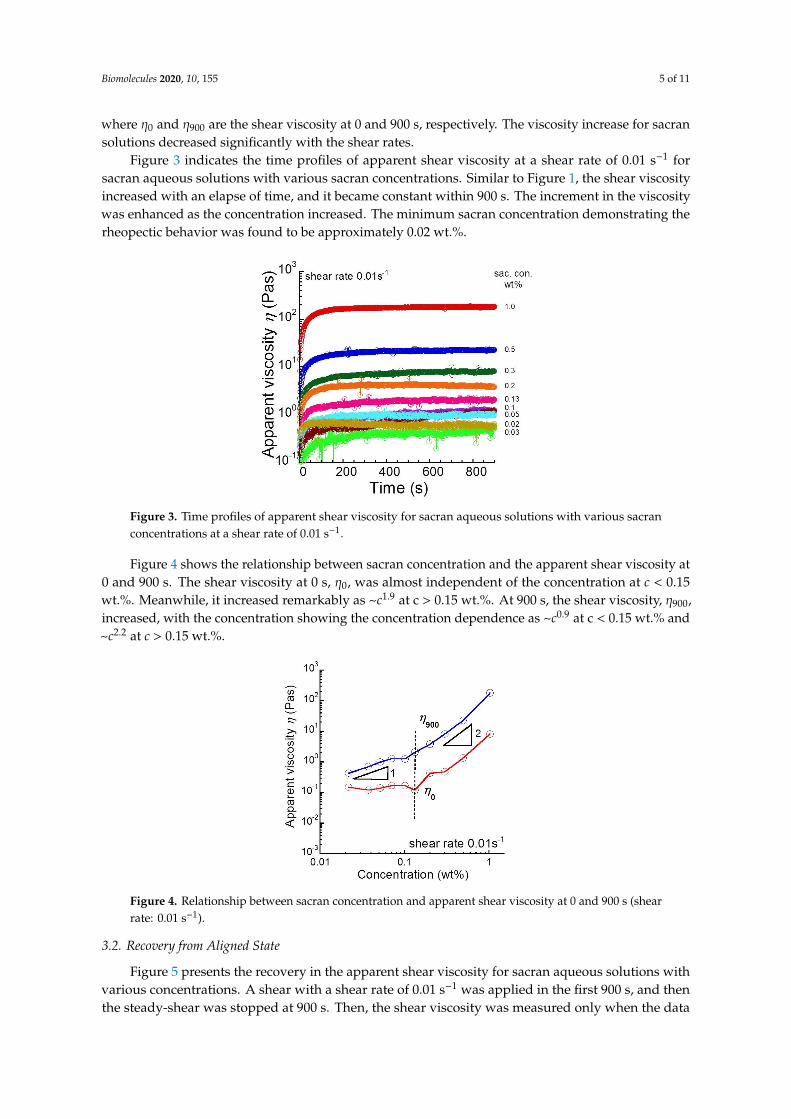
Figure 3 indicates the time profiles of apparent shear viscosity at a shear rate of 0.01 s−1 forsacran aqueous solutions with various sacran concentrations. Similar to Figure 1, the shear viscosityincreased with an elapse of time, and it became constant within 900 s. The increment in the viscositywas enhanced as the concentration increased. The minimum sacran concentration demonstrating therheopectic behavior was found to be approximately 0.02 wt.%.
Biomolecules 2020, 10, 155 5 of 11
was enhanced as the concentration increased. The minimum sacran concentration demonstrating the rheopectic behavior was found to be approximately 0.02 wt.%.
Figure 3. Time profiles of apparent shear viscosity for sacran aqueous solutions with various sacran concentrations at a shear rate of 0.01 s−1.
Figure 4 shows the relationship between sacran concentration and the apparent shear viscosity at 0 and 900 s. The shear viscosity at 0 s, η0, was almost independent of the concentration at c < 0.15 wt.%. Meanwhile, it increased remarkably as ~c1.9 at c > 0.15 wt.%. At 900 s, the shear viscosity, η900, increased, with the concentration showing the concentration dependence as ~c0.9 at c < 0.15 wt.% and ~c2.2 at c > 0.15 wt.%.
Figure 4. Relationship between sacran concentration and apparent shear viscosity at 0 and 900 s (shear rate: 0.01 s−1).
3.2. Recovery from Aligned State
Figure 5 presents the recovery in the apparent shear viscosity for sacran aqueous solutions with various concentrations. A shear with a shear rate of 0.01 s−1 was applied in the first 900 s, and then the steady-shear was stopped at 900 s. Then, the shear viscosity was measured only when the data were acquired by applying the steady-shear for 5 s. As noted in Figure 3, the shear viscosity increased with an elapse of time and it became constant within 900 s. After stopping the shear at 900 s, the shear viscosity decreased with time, almost recovering to a value that was slightly higher than the initial value. This strongly suggests that the aligned state is not thermodynamically stable, and the bonding energy between sacran chains is not strong compared to the thermal energy kBT. The inset of Figure 5 indicates a polarized photo for 1 wt.% sacran aqueous solution taken under the cross nicol using two sheets of polarized films. There was no white region observed for the solution indicating the
Figure 3. Time profiles of apparent shear viscosity for sacran aqueous solutions with various sacranconcentrations at a shear rate of 0.01 s−1.
Figure 4 shows the relationship between sacran concentration and the apparent shear viscosity at0 and 900 s. The shear viscosity at 0 s, η0, was almost independent of the concentration at c < 0.15wt.%. Meanwhile, it increased remarkably as ~c1.9 at c > 0.15 wt.%. At 900 s, the shear viscosity, η900,increased, with the concentration showing the concentration dependence as ~c0.9 at c < 0.15 wt.% and~c2.2 at c > 0.15 wt.%.
Biomolecules 2020, 10, 155 5 of 11
was enhanced as the concentration increased. The minimum sacran concentration demonstrating the rheopectic behavior was found to be approximately 0.02 wt.%.
Figure 3. Time profiles of apparent shear viscosity for sacran aqueous solutions with various sacran concentrations at a shear rate of 0.01 s−1.
Figure 4 shows the relationship between sacran concentration and the apparent shear viscosity at 0 and 900 s. The shear viscosity at 0 s, η0, was almost independent of the concentration at c < 0.15 wt.%. Meanwhile, it increased remarkably as ~c1.9 at c > 0.15 wt.%. At 900 s, the shear viscosity, η900, increased, with the concentration showing the concentration dependence as ~c0.9 at c < 0.15 wt.% and ~c2.2 at c > 0.15 wt.%.
Figure 4. Relationship between sacran concentration and apparent shear viscosity at 0 and 900 s (shear rate: 0.01 s−1).
3.2. Recovery from Aligned State
Figure 5 presents the recovery in the apparent shear viscosity for sacran aqueous solutions with various concentrations. A shear with a shear rate of 0.01 s−1 was applied in the first 900 s, and then the steady-shear was stopped at 900 s. Then, the shear viscosity was measured only when the data were acquired by applying the steady-shear for 5 s. As noted in Figure 3, the shear viscosity increased with an elapse of time and it became constant within 900 s. After stopping the shear at 900 s, the shear viscosity decreased with time, almost recovering to a value that was slightly higher than the initial value. This strongly suggests that the aligned state is not thermodynamically stable, and the bonding energy between sacran chains is not strong compared to the thermal energy kBT. The inset of Figure 5 indicates a polarized photo for 1 wt.% sacran aqueous solution taken under the cross nicol using two sheets of polarized films. There was no white region observed for the solution indicating the
Figure 4. Relationship between sacran concentration and apparent shear viscosity at 0 and 900 s (shearrate: 0.01 s−1).
3.2. Recovery from Aligned State
Figure 5 presents the recovery in the apparent shear viscosity for sacran aqueous solutions withvarious concentrations. A shear with a shear rate of 0.01 s−1 was applied in the first 900 s, and thenthe steady-shear was stopped at 900 s. Then, the shear viscosity was measured only when the data
Biomolecules 2020, 10, 155 6 of 11
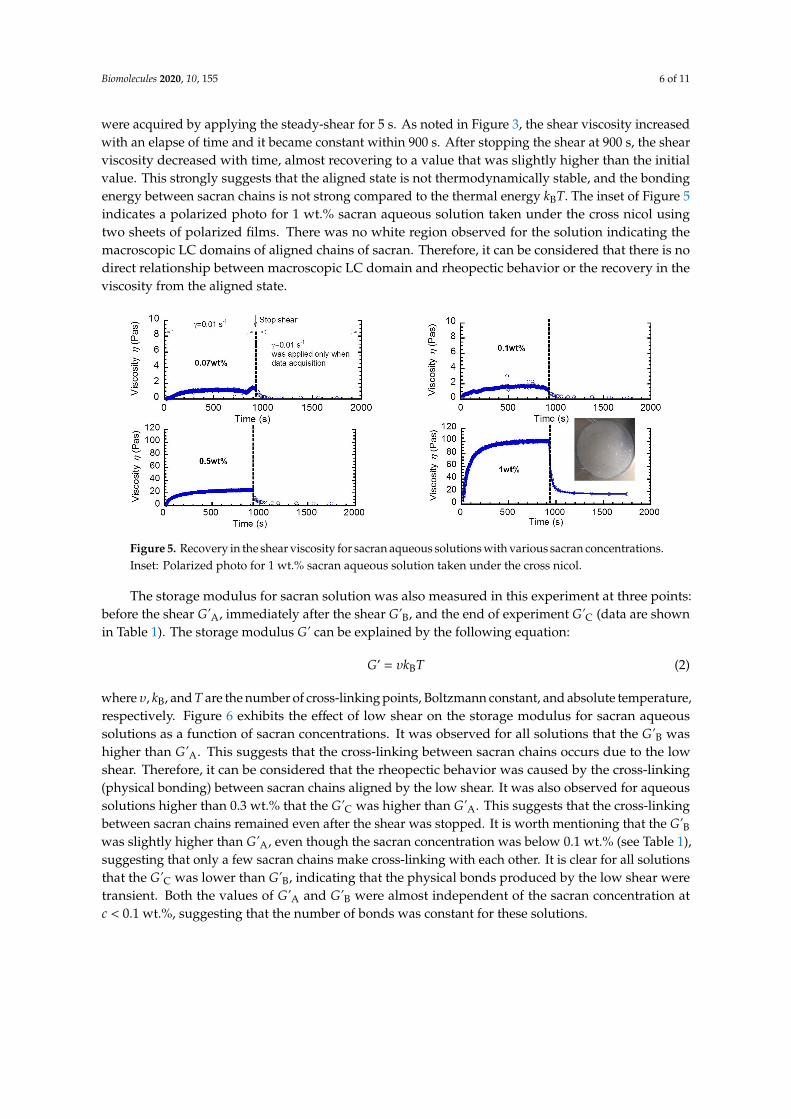
were acquired by applying the steady-shear for 5 s. As noted in Figure 3, the shear viscosity increasedwith an elapse of time and it became constant within 900 s. After stopping the shear at 900 s, the shearviscosity decreased with time, almost recovering to a value that was slightly higher than the initialvalue. This strongly suggests that the aligned state is not thermodynamically stable, and the bondingenergy between sacran chains is not strong compared to the thermal energy kBT. The inset of Figure 5indicates a polarized photo for 1 wt.% sacran aqueous solution taken under the cross nicol usingtwo sheets of polarized films. There was no white region observed for the solution indicating themacroscopic LC domains of aligned chains of sacran. Therefore, it can be considered that there is nodirect relationship between macroscopic LC domain and rheopectic behavior or the recovery in theviscosity from the aligned state.
Biomolecules 2020, 10, 155 6 of 11
macroscopic LC domains of aligned chains of sacran. Therefore, it can be considered that there is no direct relationship between macroscopic LC domain and rheopectic behavior or the recovery in the viscosity from the aligned state.
Figure 5. Recovery in the shear viscosity for sacran aqueous solutions with various sacran concentrations. Inset: Polarized photo for 1 wt.% sacran aqueous solution taken under the cross nicol.
The storage modulus for sacran solution was also measured in this experiment at three points: before the shear G’A, immediately after the shear G’B, and the end of experiment G’C (data are shown in Table 1). The storage modulus G’ can be explained by the following equation:
G’ = υkBT (2)
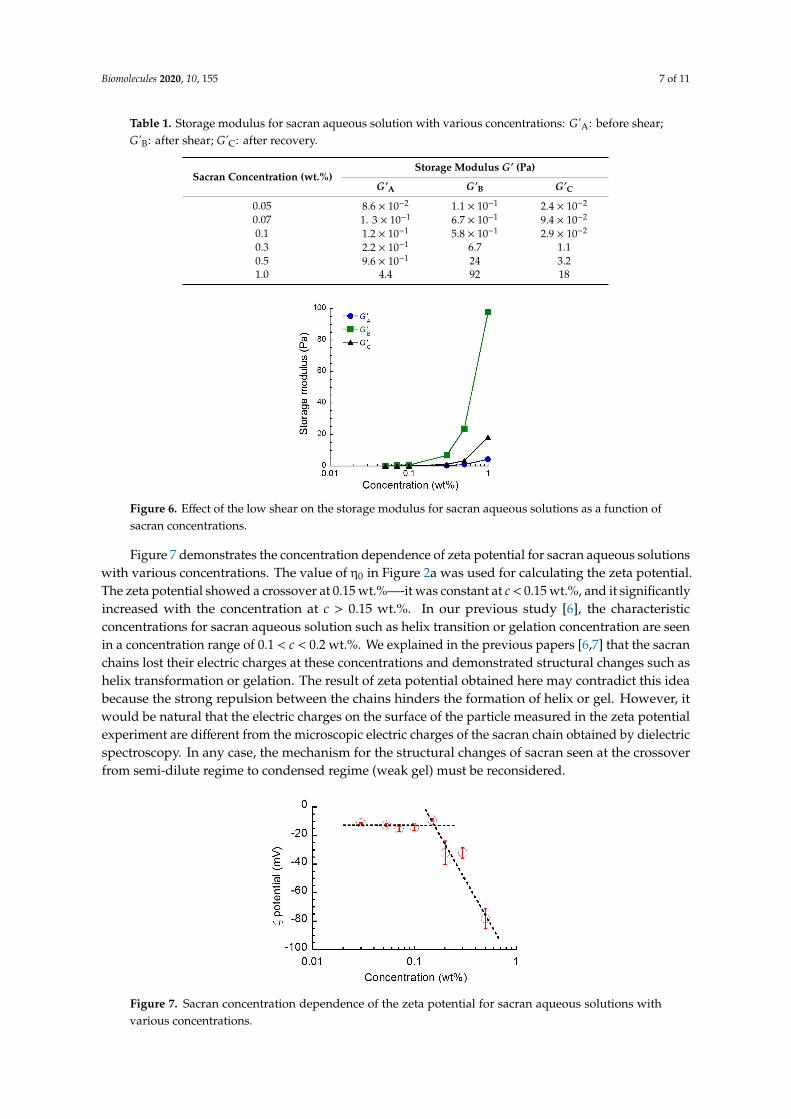
where υ, kB, and T are the number of cross-linking points, Boltzmann constant, and absolute temperature, respectively. Figure 6 exhibits the effect of low shear on the storage modulus for sacran aqueous solutions as a function of sacran concentrations. It was observed for all solutions that the G’B was higher than G’A. This suggests that the cross-linking between sacran chains occurs due to the low shear. Therefore, it can be considered that the rheopectic behavior was caused by the cross-linking (physical bonding) between sacran chains aligned by the low shear. It was also observed for aqueous solutions higher than 0.3 wt.% that the G’C was higher than G’A. This suggests that the cross-linking between sacran chains remained even after the shear was stopped. It is worth mentioning that the G’B was slightly higher than G’A, even though the sacran concentration was below 0.1 wt.% (see Table 1), suggesting that only a few sacran chains make cross-linking with each other. It is clear for all solutions that the G’C was lower than G’B, indicating that the physical bonds produced by the low shear were transient. Both the values of G’A and G’B were almost independent of the sacran concentration at c < 0.1 wt.%, suggesting that the number of bonds was constant for these solutions.
Table 1. Storage modulus for sacran aqueous solution with various concentrations: G’A: before shear; G’B: after shear; G’C: after recovery.
Sacran Concentration (wt.%) Storage Modulus G’ (Pa) G’A G’B G’C
0.05 8.6 × 10⁻² 1.1 × 10⁻¹ 2.4 × 10⁻² 0.07 1. 3 × 10⁻¹ 6.7 × 10⁻¹ 9.4 × 10⁻² 0.1 1.2 × 10⁻¹ 5.8 × 10⁻¹ 2.9 × 10⁻² 0.3 2.2 × 10⁻¹ 6.7 1.1 0.5 9.6 × 10⁻¹ 24 3.2 1.0 4.4 92 18
Figure 5. Recovery in the shear viscosity for sacran aqueous solutions with various sacran concentrations.Inset: Polarized photo for 1 wt.% sacran aqueous solution taken under the cross nicol.
The storage modulus for sacran solution was also measured in this experiment at three points:before the shear G’A, immediately after the shear G’B, and the end of experiment G’C (data are shownin Table 1). The storage modulus G’ can be explained by the following equation:
G’ = υkBT (2)
where υ, kB, and T are the number of cross-linking points, Boltzmann constant, and absolute temperature,respectively. Figure 6 exhibits the effect of low shear on the storage modulus for sacran aqueoussolutions as a function of sacran concentrations. It was observed for all solutions that the G’B washigher than G’A. This suggests that the cross-linking between sacran chains occurs due to the lowshear. Therefore, it can be considered that the rheopectic behavior was caused by the cross-linking(physical bonding) between sacran chains aligned by the low shear. It was also observed for aqueoussolutions higher than 0.3 wt.% that the G’C was higher than G’A. This suggests that the cross-linkingbetween sacran chains remained even after the shear was stopped. It is worth mentioning that the G’Bwas slightly higher than G’A, even though the sacran concentration was below 0.1 wt.% (see Table 1),suggesting that only a few sacran chains make cross-linking with each other. It is clear for all solutionsthat the G’C was lower than G’B, indicating that the physical bonds produced by the low shear weretransient. Both the values of G’A and G’B were almost independent of the sacran concentration atc < 0.1 wt.%, suggesting that the number of bonds was constant for these solutions.
Biomolecules 2020, 10, 155 7 of 11
Table 1. Storage modulus for sacran aqueous solution with various concentrations: G’A: before shear;G’B: after shear; G’C: after recovery.
Sacran Concentration (wt.%)Storage Modulus G’ (Pa)
G’A G’B G’C
0.05 8.6 × 10⁻² 1.1 × 10⁻¹ 2.4 × 10⁻²
0.07 1. 3 × 10⁻¹ 6.7 × 10⁻¹ 9.4 × 10⁻²
0.1 1.2 × 10⁻¹ 5.8 × 10⁻¹ 2.9 × 10⁻²
0.3 2.2 × 10⁻¹ 6.7 1.10.5 9.6 × 10⁻¹ 24 3.21.0 4.4 92 18Biomolecules 2020, 10, 155 7 of 11
Figure 6. Effect of the low shear on the storage modulus for sacran aqueous solutions as a function of sacran concentrations.
Figure 7 demonstrates the concentration dependence of zeta potential for sacran aqueous solutions with various concentrations. The value of η0 in Figure 2a was used for calculating the zeta potential. The zeta potential showed a crossover at 0.15 wt.%––it was constant at c < 0.15 wt.%, and it significantly increased with the concentration at c > 0.15 wt.%. In our previous study [6], the characteristic concentrations for sacran aqueous solution such as helix transition or gelation concentration are seen in a concentration range of 0.1 < c < 0.2 wt.%. We explained in the previous papers [6,7] that the sacran chains lost their electric charges at these concentrations and demonstrated structural changes such as helix transformation or gelation. The result of zeta potential obtained here may contradict this idea because the strong repulsion between the chains hinders the formation of helix or gel. However, it would be natural that the electric charges on the surface of the particle measured in the zeta potential experiment are different from the microscopic electric charges of the sacran chain obtained by dielectric spectroscopy. In any case, the mechanism for the structural changes of sacran seen at the crossover from semi-dilute regime to condensed regime (weak gel) must be reconsidered.
Figure 7. Sacran concentration dependence of the zeta potential for sacran aqueous solutions with various concentrations.
Figure 8 represents the relationship between the viscosity increase and sacran concentrations for sacran aqueous solutions. The viscosity increase for sacran solutions ∆η was calculated from Equation (1). The increase in the viscosity increased with the concentration as ~c1.0 at c < 0.15 wt.% and as ~c2.2 at c > 0.15 wt.%. The crossover concentration of the viscosity increase was 0.15 wt.%, which equals the helix transition concentration seen in the zeta potential. This indicates there should be two
Figure 6. Effect of the low shear on the storage modulus for sacran aqueous solutions as a function ofsacran concentrations.
Figure 7 demonstrates the concentration dependence of zeta potential for sacran aqueous solutionswith various concentrations. The value of η0 in Figure 2a was used for calculating the zeta potential.The zeta potential showed a crossover at 0.15 wt.%—-it was constant at c < 0.15 wt.%, and it significantlyincreased with the concentration at c > 0.15 wt.%. In our previous study [6], the characteristicconcentrations for sacran aqueous solution such as helix transition or gelation concentration are seenin a concentration range of 0.1 < c < 0.2 wt.%. We explained in the previous papers [6,7] that the sacranchains lost their electric charges at these concentrations and demonstrated structural changes such ashelix transformation or gelation. The result of zeta potential obtained here may contradict this ideabecause the strong repulsion between the chains hinders the formation of helix or gel. However, itwould be natural that the electric charges on the surface of the particle measured in the zeta potentialexperiment are different from the microscopic electric charges of the sacran chain obtained by dielectricspectroscopy. In any case, the mechanism for the structural changes of sacran seen at the crossoverfrom semi-dilute regime to condensed regime (weak gel) must be reconsidered.
Biomolecules 2020, 10, 155 7 of 11
Figure 6. Effect of the low shear on the storage modulus for sacran aqueous solutions as a function of sacran concentrations.
Figure 7 demonstrates the concentration dependence of zeta potential for sacran aqueous solutions with various concentrations. The value of η0 in Figure 2a was used for calculating the zeta potential. The zeta potential showed a crossover at 0.15 wt.%––it was constant at c < 0.15 wt.%, and it significantly increased with the concentration at c > 0.15 wt.%. In our previous study [6], the characteristic concentrations for sacran aqueous solution such as helix transition or gelation concentration are seen in a concentration range of 0.1 < c < 0.2 wt.%. We explained in the previous papers [6,7] that the sacran chains lost their electric charges at these concentrations and demonstrated structural changes such as helix transformation or gelation. The result of zeta potential obtained here may contradict this idea because the strong repulsion between the chains hinders the formation of helix or gel. However, it would be natural that the electric charges on the surface of the particle measured in the zeta potential experiment are different from the microscopic electric charges of the sacran chain obtained by dielectric spectroscopy. In any case, the mechanism for the structural changes of sacran seen at the crossover from semi-dilute regime to condensed regime (weak gel) must be reconsidered.
Figure 7. Sacran concentration dependence of the zeta potential for sacran aqueous solutions with various concentrations.
Figure 8 represents the relationship between the viscosity increase and sacran concentrations for sacran aqueous solutions. The viscosity increase for sacran solutions ∆η was calculated from Equation (1). The increase in the viscosity increased with the concentration as ~c1.0 at c < 0.15 wt.% and as ~c2.2 at c > 0.15 wt.%. The crossover concentration of the viscosity increase was 0.15 wt.%, which equals the helix transition concentration seen in the zeta potential. This indicates there should be two
Figure 7. Sacran concentration dependence of the zeta potential for sacran aqueous solutions withvarious concentrations.
Biomolecules 2020, 10, 155 8 of 11
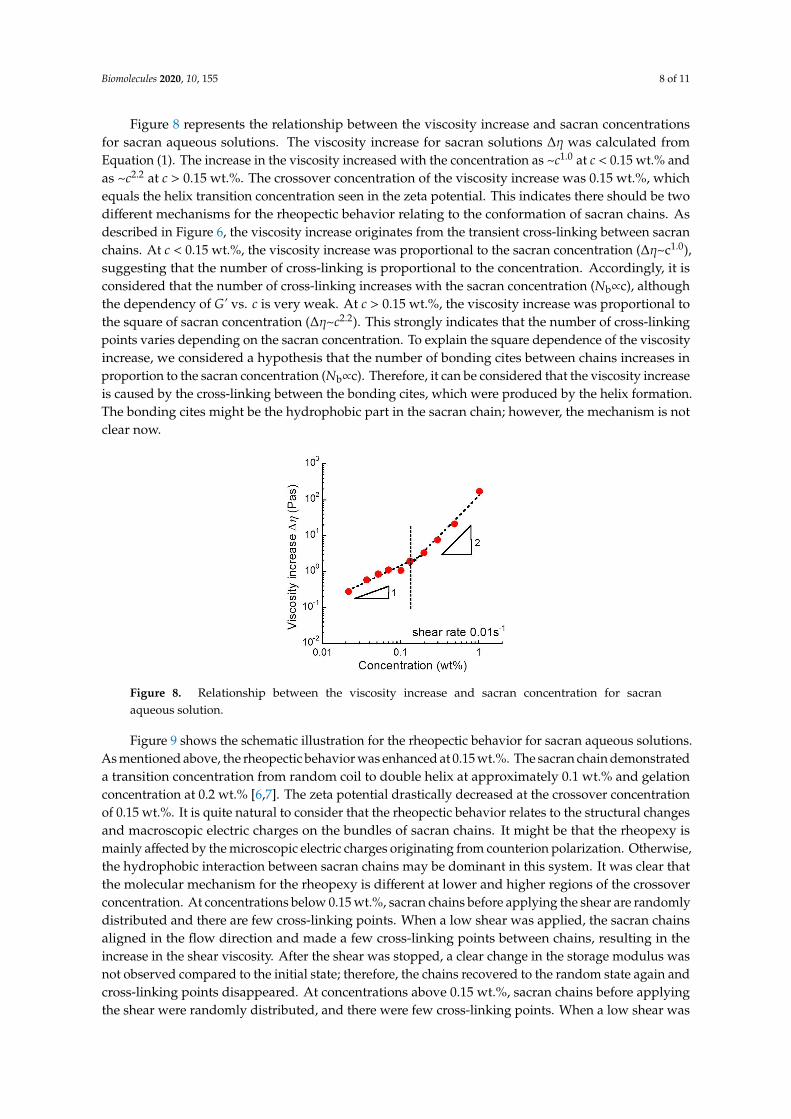
Figure 8 represents the relationship between the viscosity increase and sacran concentrationsfor sacran aqueous solutions. The viscosity increase for sacran solutions ∆η was calculated fromEquation (1). The increase in the viscosity increased with the concentration as ~c1.0 at c < 0.15 wt.% andas ~c2.2 at c > 0.15 wt.%. The crossover concentration of the viscosity increase was 0.15 wt.%, whichequals the helix transition concentration seen in the zeta potential. This indicates there should be twodifferent mechanisms for the rheopectic behavior relating to the conformation of sacran chains. Asdescribed in Figure 6, the viscosity increase originates from the transient cross-linking between sacranchains. At c < 0.15 wt.%, the viscosity increase was proportional to the sacran concentration (∆η~c1.0),suggesting that the number of cross-linking is proportional to the concentration. Accordingly, it isconsidered that the number of cross-linking increases with the sacran concentration (Nb∝c), althoughthe dependency of G’ vs. c is very weak. At c > 0.15 wt.%, the viscosity increase was proportional tothe square of sacran concentration (∆η~c2.2). This strongly indicates that the number of cross-linkingpoints varies depending on the sacran concentration. To explain the square dependence of the viscosityincrease, we considered a hypothesis that the number of bonding cites between chains increases inproportion to the sacran concentration (Nb∝c). Therefore, it can be considered that the viscosity increaseis caused by the cross-linking between the bonding cites, which were produced by the helix formation.The bonding cites might be the hydrophobic part in the sacran chain; however, the mechanism is notclear now.
Biomolecules 2020, 10, 155 8 of 11
different mechanisms for the rheopectic behavior relating to the conformation of sacran chains. As described in Figure 6, the viscosity increase originates from the transient cross-linking between sacran chains. At c < 0.15 wt.%, the viscosity increase was proportional to the sacran concentration (∆η~c1.0), suggesting that the number of cross-linking is proportional to the concentration. Accordingly, it is considered that the number of cross-linking increases with the sacran concentration (Nb∝c), although the dependency of G’ vs. c is very weak. At c > 0.15 wt.%, the viscosity increase was proportional to the square of sacran concentration (∆η~c2.2). This strongly indicates that the number of cross-linking points varies depending on the sacran concentration. To explain the square dependence of the viscosity increase, we considered a hypothesis that the number of bonding cites between chains increases in proportion to the sacran concentration (Nb∝c). Therefore, it can be considered that the viscosity increase is caused by the cross-linking between the bonding cites, which were produced by the helix formation. The bonding cites might be the hydrophobic part in the sacran chain; however, the mechanism is not clear now.
Figure 8. Relationship between the viscosity increase and sacran concentration for sacran aqueous solution.
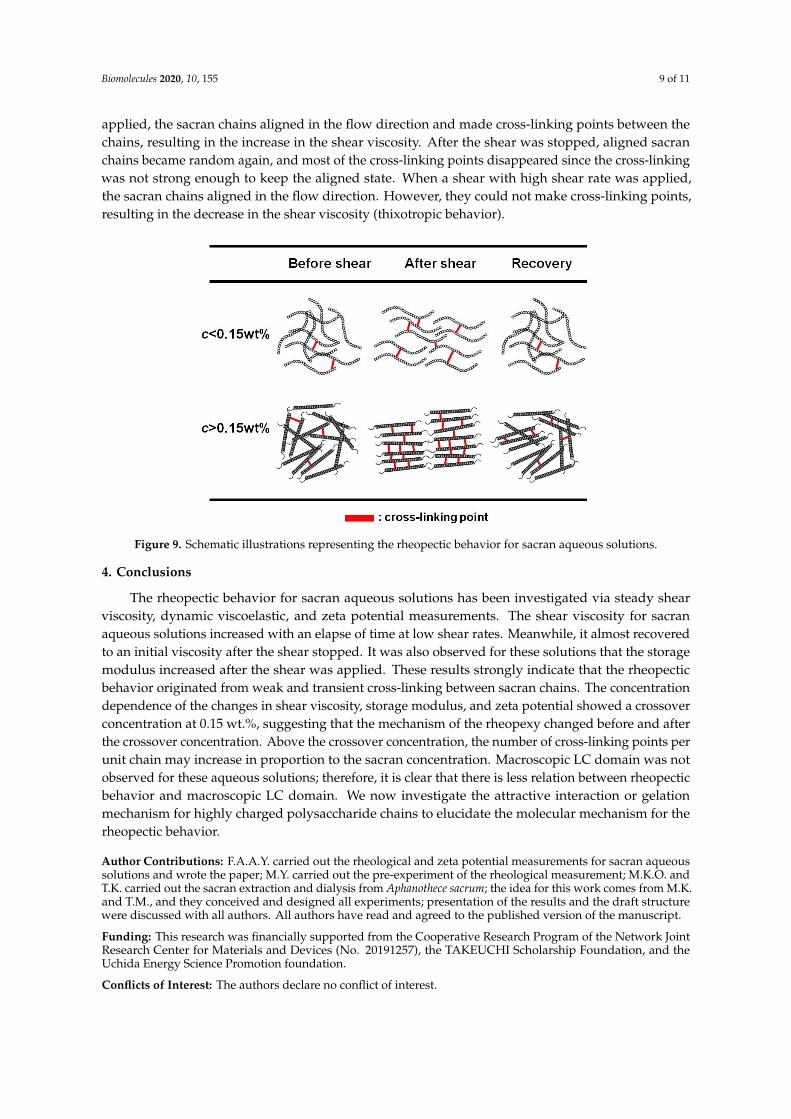
Figure 9 shows the schematic illustration for the rheopectic behavior for sacran aqueous solutions. As mentioned above, the rheopectic behavior was enhanced at 0.15 wt.%. The sacran chain demonstrated a transition concentration from random coil to double helix at approximately 0.1 wt.% and gelation concentration at 0.2 wt.% [6,7]. The zeta potential drastically decreased at the crossover concentration of 0.15 wt.%. It is quite natural to consider that the rheopectic behavior relates to the structural changes and macroscopic electric charges on the bundles of sacran chains. It might be that the rheopexy is mainly affected by the microscopic electric charges originating from counterion polarization. Otherwise, the hydrophobic interaction between sacran chains may be dominant in this system. It was clear that the molecular mechanism for the rheopexy is different at lower and higher regions of the crossover concentration. At concentrations below 0.15 wt.%, sacran chains before applying the shear are randomly distributed and there are few cross-linking points. When a low shear was applied, the sacran chains aligned in the flow direction and made a few cross-linking points between chains, resulting in the increase in the shear viscosity. After the shear was stopped, a clear change in the storage modulus was not observed compared to the initial state; therefore, the chains recovered to the random state again and cross-linking points disappeared. At concentrations above 0.15 wt.%, sacran chains before applying the shear were randomly distributed, and there were few cross-linking points. When a low shear was applied, the sacran chains aligned in the flow direction and made cross-linking points between the chains, resulting in the increase in the shear viscosity. After the shear was stopped, aligned sacran chains became random again, and most of the cross-linking points disappeared since the cross-linking was not strong enough to keep the aligned state. When a shear with high shear rate was applied, the sacran chains aligned in the flow direction. However, they could not make cross-linking points, resulting in the decrease in the shear viscosity (thixotropic behavior).
Figure 8. Relationship between the viscosity increase and sacran concentration for sacranaqueous solution.
Figure 9 shows the schematic illustration for the rheopectic behavior for sacran aqueous solutions.As mentioned above, the rheopectic behavior was enhanced at 0.15 wt.%. The sacran chain demonstrateda transition concentration from random coil to double helix at approximately 0.1 wt.% and gelationconcentration at 0.2 wt.% [6,7]. The zeta potential drastically decreased at the crossover concentrationof 0.15 wt.%. It is quite natural to consider that the rheopectic behavior relates to the structural changesand macroscopic electric charges on the bundles of sacran chains. It might be that the rheopexy ismainly affected by the microscopic electric charges originating from counterion polarization. Otherwise,the hydrophobic interaction between sacran chains may be dominant in this system. It was clear thatthe molecular mechanism for the rheopexy is different at lower and higher regions of the crossoverconcentration. At concentrations below 0.15 wt.%, sacran chains before applying the shear are randomlydistributed and there are few cross-linking points. When a low shear was applied, the sacran chainsaligned in the flow direction and made a few cross-linking points between chains, resulting in theincrease in the shear viscosity. After the shear was stopped, a clear change in the storage modulus wasnot observed compared to the initial state; therefore, the chains recovered to the random state again andcross-linking points disappeared. At concentrations above 0.15 wt.%, sacran chains before applyingthe shear were randomly distributed, and there were few cross-linking points. When a low shear was
Biomolecules 2020, 10, 155 9 of 11
applied, the sacran chains aligned in the flow direction and made cross-linking points between thechains, resulting in the increase in the shear viscosity. After the shear was stopped, aligned sacranchains became random again, and most of the cross-linking points disappeared since the cross-linkingwas not strong enough to keep the aligned state. When a shear with high shear rate was applied,the sacran chains aligned in the flow direction. However, they could not make cross-linking points,resulting in the decrease in the shear viscosity (thixotropic behavior).Biomolecules 2020, 10, 155 9 of 11
Figure 9. Schematic illustrations representing the rheopectic behavior for sacran aqueous solutions.
4. Conclusions
The rheopectic behavior for sacran aqueous solutions has been investigated via steady shear viscosity, dynamic viscoelastic, and zeta potential measurements. The shear viscosity for sacran aqueous solutions increased with an elapse of time at low shear rates. Meanwhile, it almost recovered to an initial viscosity after the shear stopped. It was also observed for these solutions that the storage modulus increased after the shear was applied. These results strongly indicate that the rheopectic behavior originated from weak and transient cross-linking between sacran chains. The concentration dependence of the changes in shear viscosity, storage modulus, and zeta potential showed a crossover concentration at 0.15 wt.%, suggesting that the mechanism of the rheopexy changed before and after the crossover concentration. Above the crossover concentration, the number of cross-linking points per unit chain may increase in proportion to the sacran concentration. Macroscopic LC domain was not observed for these aqueous solutions; therefore, it is clear that there is less relation between rheopectic behavior and macroscopic LC domain. We now investigate the attractive interaction or gelation mechanism for highly charged polysaccharide chains to elucidate the molecular mechanism for the rheopectic behavior.
Author Contributions: F.A.A.Y. carried out the rheological and zeta potential measurements for sacran aqueous solutions and wrote the paper; M.Y. carried out the pre-experiment of the rheological measurement; M.K.O. and T.K. carried out the sacran extraction and dialysis from Aphanothece sacrum; the idea for this work comes from M.K. and T.M., and they conceived and designed all experiments; presentation of the results and the draft structure were discussed with all authors. All authors have read and agreed to the published version of the manuscript.
Funding: This research was financially supported from the Cooperative Research Program of the Network Joint Research Center for Materials and Devices (No. 20191257), the TAKEUCHI Scholarship Foundation, and the Uchida Energy Science Promotion foundation.
Conflicts of Interest: The authors declare no conflict of interest.
References.
1. Okajima, M.K.; Ono, M.; Kabata, K.; Kaneko, T. Extraction of novel sulfated polysaccharides from Aphanothece sacrum (Sur.) Okada, and its spectroscopic characterization. Pure Appl. Chem. 2007, 79, 2039–2046.
Figure 9. Schematic illustrations representing the rheopectic behavior for sacran aqueous solutions.
4. Conclusions
The rheopectic behavior for sacran aqueous solutions has been investigated via steady shearviscosity, dynamic viscoelastic, and zeta potential measurements. The shear viscosity for sacranaqueous solutions increased with an elapse of time at low shear rates. Meanwhile, it almost recoveredto an initial viscosity after the shear stopped. It was also observed for these solutions that the storagemodulus increased after the shear was applied. These results strongly indicate that the rheopecticbehavior originated from weak and transient cross-linking between sacran chains. The concentrationdependence of the changes in shear viscosity, storage modulus, and zeta potential showed a crossoverconcentration at 0.15 wt.%, suggesting that the mechanism of the rheopexy changed before and afterthe crossover concentration. Above the crossover concentration, the number of cross-linking points perunit chain may increase in proportion to the sacran concentration. Macroscopic LC domain was notobserved for these aqueous solutions; therefore, it is clear that there is less relation between rheopecticbehavior and macroscopic LC domain. We now investigate the attractive interaction or gelationmechanism for highly charged polysaccharide chains to elucidate the molecular mechanism for therheopectic behavior.
Author Contributions: F.A.A.Y. carried out the rheological and zeta potential measurements for sacran aqueoussolutions and wrote the paper; M.Y. carried out the pre-experiment of the rheological measurement; M.K.O. andT.K. carried out the sacran extraction and dialysis from Aphanothece sacrum; the idea for this work comes from M.K.and T.M., and they conceived and designed all experiments; presentation of the results and the draft structurewere discussed with all authors. All authors have read and agreed to the published version of the manuscript.
Funding: This research was financially supported from the Cooperative Research Program of the Network JointResearch Center for Materials and Devices (No. 20191257), the TAKEUCHI Scholarship Foundation, and theUchida Energy Science Promotion foundation.
Conflicts of Interest: The authors declare no conflict of interest.
Biomolecules 2020, 10, 155 10 of 11
References
1. Okajima, M.K.; Ono, M.; Kabata, K.; Kaneko, T. Extraction of novel sulfated polysaccharides from Aphanothecesacrum (Sur.) Okada, and its spectroscopic characterization. Pure Appl. Chem. 2007, 79, 2039–2046. [CrossRef]
2. Okajima, M.K.; Bamba, T.; Kaneko, Y.; Hirata, K.; Fukusaki, E.; Kajiyama, S.; Kaneko, T. Supergiant ampholyticsugar chains with imbalanced charge ratio form saline ultra-absorbent hydrogels. Macromolecules 2008, 41,4061–4064. [CrossRef]
3. Okeyoshi, K.; Shinhama, T.; Budpud, K.; Joshi, G.; Okajima, M.K.; Kaneko, T. Micelle-mediated self-assemblyof microfibers bridging millimeter-scale gap to form three-dimensional-ordered polysaccharide membranes.Langmuir 2018, 34, 13965–13970. [CrossRef] [PubMed]
4. Okajima, M.K.; Mishima, R.; Amornwachirabodee, K.; Mitsumata, T.; Okeyoshi, K.; Kaneko, T. Anisotropicswelling in hydrogels formed by cooperatively aligned megamolecules. RSC Adv. 2015, 5, 86723–86729.[CrossRef]
5. Ito, W.; Yamaki, M.; Kawai, M.; Mitumata, T.; Okajima, M.K.; Kaneko, T. Extraordinary swelling of hydrogelsphysically crosslinked by megamolecular chain sacran. Chem. Lett. 2016, 45, 339–340. [CrossRef]
6. Okajima, M.K.; Kaneko, D.; Mitsumata, T.; Kaneko, T.; Watanabe, J. Cyanobacteria that producemegamolecules with efficient self-orientations. Macromolecules 2009, 42, 3057–3062. [CrossRef]
7. Mitsumata, T.; Miura, T.; Takahashi, N.; Kawai, M.; Okajima, M.K.; Kaneko, T. Ionic state and chainconformation for aqueous solutions of supergiant cyanobacterial polysaccharide. Phys. Rev. E 2013, 87,042607. [CrossRef]
8. Okajima, M.K.; Nguyen, Q.T.; Tateyama, S.; Masuyama, H.; Tanaka, T.; Mitsumata, T.; Kaneko, T.Photoshrinkage in polysaccharide gels with trivalent metal ions. Biomacromolecules 2012, 13, 4158–4163.[CrossRef]
9. Okajima, M.K.; Higashi, T.; Asakawa, R.; Mitsumata, T.; Kaneko, D.; Kaneko, T.; Ogawa, T.; Kurata, H.;Isoda, S. Gelation behavior by the lanthanoid adsorption of the cyanobacterial extracellular polysaccharide.Biomacromolecules 2010, 11, 3172–3177. [CrossRef]
10. Okajima, M.K.; Nakamura, M.; Mitsumata, T.; Kaneko, T. Cyanobacterial polysaccharide gels with efficientrare-earth metal sorption. Biomacromolecules 2010, 11, 1773–1778. [CrossRef]
11. Joshi, G.; Okeyoshi, K.; Okajima, M.K.; Kaneko, T. Directional control of diffusion and swelling inmegamolecular polysaccharide hydrogels. Soft Matter 2016, 12, 5515–5518. [CrossRef] [PubMed]
12. Okeyoshi, K.; Joshi, G.; Rawat, S.; Sornkamnerd, S.; Amornwachirabodee, K.; Okajima, M.K.; Ito, M.;Kobayashi, S.; Higashimine, K.; Oshima, Y.; et al. Drying-induced self-similar assembly of megamolecularpolysaccharides through nano and submicron layering. Langmuir 2017, 33, 4954–4959. [CrossRef] [PubMed]
13. Okeyoshi, K.; Joshi, G.; Okajima, M.K.; Kaneko, T. Formation of polysaccharide membranes by splitting ofevaporative air-LC interface. Adv. Mater. Interfaces 2018, 5, 1701219. [CrossRef]
14. Joshi, G.; Okeyoshi, K.; Mitsumata, T.; Kaneko, T. Micro-deposition control of polysaccharides on evaporativeair-LC interface to design quickly swelling hydrogels. J. Colloid Interface Sci. 2019, 546, 184–191. [CrossRef][PubMed]
15. Kanai, H.; Amari, T. Negative thixotropy in ferric-oxide suspensions. Rheol. Acta 1995, 34, 303–310. [CrossRef]16. Quadrat, O.; Bradna, P.; Dupuis, D.; Wolff, C. Negative thixotropy of solutions of partially hydrolyzed
polyacrylamide. 1. The influence of shear rate on time changes of flow characteristics. Colloid Polym. Sci.1992, 270, 1057–1059. [CrossRef]
17. Buitenhuis, J.; Springer, J. Negative thixotropy of polymer solutions. 2. A systematic study of thetime-dependent viscosity of partially hydrolyzed polyacrylamide. Colloid Polym. Sci. 2003, 281, 260–266.[CrossRef]
18. Bradna, P.; Quadrat, O.; Dupuis, D. The influence of salt concentration on negative thixotropy in solutions ofpartially hydrolyzed polyacrylamide. Colloid Polym. Sci. 1995, 273, 421–425. [CrossRef]
19. Bradna, P.; Quadrat, O.; Dupuis, D. Negative thixotropy of solutions of partially hydrolyzed polyacrylamide.2. The influence of glycerol content and degree of ionization. Colloid Polym. Sci. 1995, 273, 642–647.[CrossRef]
20. Bradna, P.; Quadrat, O. Criteria of negative thixotropy of poly(methyl methacrylate) solutions as a functionof temperature and of the thermodynamic quality and viscosity of the solvent. Colloid Polym. Sci. 1984, 262,189–196. [CrossRef]
Biomolecules 2020, 10, 155 11 of 11
21. Sikora, M.; Adamczyk, G.; Krystyjan, M.; Dobosz, A.; Tomasik, P.; Berski, W.; Lukasiewicz, M.;Izak, P. Thixotropic properties of normal potato starch depending on the degree of the granules pasting.Carbohydr. Polym. 2015, 121, 254–264. [CrossRef] [PubMed]
22. Krystyjan, M.; Sikora, M.; Adamczyk, G.; Dobosz, A.; Tomasik, P.; Berski, W.; Lukasiewicz, M.;Izak, P. Thixotropic properties of waxy potato starch depending on the degree of the granules pasting.Carbohydr. Polym. 2016, 141, 126–134. [CrossRef] [PubMed]
23. Li, S.P.; Hou, W.G.; Xiao, J.C.; Hu, J.F.; Li, D.Q. Influence of measuring conditions on the thixotropy ofhydrotalcite-like/montmorillonite suspension. Colloids Surf. A 2003, 224, 149–156. [CrossRef]
24. Dai, X.N.; Hou, W.G.; Duan, H.D.; Ni, P. Thixotropy of Mg–Al-layered double hydroxides/kaolinite dispersion.Colloids Surf. A 2007, 295, 139–145. [CrossRef]
25. Li, Y.; Hou, W.-G.; Zhu, W.-Q. Thixotropic properties of aqueous suspensions containing cationic starch andaluminum magnesium hydrotalcite-like compound. J. Colloid Interface Sci. 2007, 313, 305–314. [CrossRef][PubMed]
26. Zhao, H.R.; Zhang, K.M. The structure recovery capacity of highly concentrated emulsions under shear flowvia studying their rheopexy. J. Dispersion Sci. Technol. 2018, 39, 970–976. [CrossRef]
27. Al-Hashmi, A.R.; Luckham, P.F.; Grattoni, C.A. Flow-induced-microgel adsorption of high-molecular weightpolyacrylamides. J. Pet. Sci. Eng. 2013, 112, 1–6. [CrossRef]
28. Tiziani, S.; Vodovotz, Y. Rheological effects of soy protein addition to tomato juice. Food Hydrocolloids 2005,19, 45–52. [CrossRef]
29. Oates, K.M.N.; Krause, W.E.; Jones, R.L.; Colby, R.H. Rheopexy of synovial fluid and protein aggregation.J. R. Soc. Interface 2005, 3, 167–174. [CrossRef]
© 2020 by the authors. Licensee MDPI, Basel, Switzerland. This article is an open accessarticle distributed under the terms and conditions of the Creative Commons Attribution(CC BY) license (http://creativecommons.org/licenses/by/4.0/).