Embed Size (px)
Citation preview

GeneticEpidemiologyRESEARCH ARTICLE
Accounting for Population Stratification in DNAMethylation Studies
Richard T. Barfield,1 Lynn M. Almli,2 Varun Kilaru,2 Alicia K. Smith,2 Kristina B. Mercer,2 Richard Duncan,3 Torsten Klengel,4
Divya Mehta,4 Elisabeth B. Binder,2,4 Michael P. Epstein,3 Kerry J. Ressler,2 and Karen N. Conneely3∗
1Department of Biostatistics, Harvard University, Boston, Massachusetts, United States of America; 2Department of Psychiatry and BehavioralScience, Emory University School of Medicine, Atlanta, Georgia, United States of America; 3Department of Human Genetics, Emory UniversitySchool of Medicine, Atlanta, Georgia, United States of America; 4Max-Planck Institute of Psychiatry, Munich, Germany
Received 17 September 2013; Revised 16 November 2013; accepted revised manuscript 21 December 2013.Published online 29 January 2014 in Wiley Online Library (wileyonlinelibrary.com). DOI 10.1002/gepi.21789
ABSTRACT: DNA methylation is an important epigenetic mechanism that has been linked to complex diseases and is ofgreat interest to researchers as a potential link between genome, environment, and disease. As the scale of DNA methylationassociation studies approaches that of genome-wide association studies, issues such as population stratification will need tobe addressed. It is well-documented that failure to adjust for population stratification can lead to false positives in geneticassociation studies, but population stratification is often unaccounted for in DNA methylation studies. Here, we proposeseveral approaches to correct for population stratification using principal components (PCs) from different subsets of genome-wide methylation data. We first illustrate the potential for confounding due to population stratification by demonstratingwidespread associations between DNA methylation and race in 388 individuals (365 African American and 23 Caucasian).We subsequently evaluate the performance of our PC-based approaches and other methods in adjusting for confounding dueto population stratification. Our simulations show that (1) all of the methods considered are effective at removing inflationdue to population stratification, and (2) maximum power can be obtained with single-nucleotide polymorphism (SNP)-basedPCs, followed by methylation-based PCs, which outperform both surrogate variable analysis and genomic control. Amongour different approaches to computing methylation-based PCs, we find that PCs based on CpG sites chosen for their potentialto proxy nearby SNPs can provide a powerful and computationally efficient approach to adjust for population stratification inDNA methylation studies when genome-wide SNP data are unavailable.Genet Epidemiol 38:231–241, 2014. C© 2014 Wiley Periodicals, Inc.
KEY WORDS: DNA methylation; population stratification; principal components; association studies
Introduction
DNA methylation is an epigenetic mechanism that typicallyinvolves the addition of a methyl group to a cytosine base pair(bp) followed by a guanine (cytosine-phosphate-guanine, orCpG site). Advances in technology and rapidly decreasingcosts of data generation have led to an increased focus onlarge-scale studies of DNA methylation in human subjects.Through these studies, altered DNA methylation has beenlinked to diseases such as cancer, autism, and lupus in ad-dition to environmental stressors such as smoking and age[Alisch et al., 2012; Breitling et al., 2011; Christensen et al.,2009; Cicek et al., 2013; Coit et al., 2013; Numata et al., 2012;Rakyan et al., 2010; Selamat et al., 2012; Sun et al., 2013;Teschendorff et al., 2010; Wong et al., 2013].
Recently, several DNA methylation studies have identifiedCpG sites where methylation levels differed by race or eth-nicity [Adkins et al., 2011; Heyn et al., 2013; Kwabi-Addoet al., 2010; Liu et al., 2010; Nielsen et al., 2010; Terry et al.,
Supporting Information is available in the online issue at wileyonlinelibrary.com.∗Correspondence to: Karen N. Conneely, Department of Human Genet-
ics, Emory University School of Medicine Atlanta, Georgia 30322, USA. E-mail:
2008]. These differences could arise from epigenetic inheri-tance [Pembrey et al., 2006; Richards, 2008] or population-specific environmental factors, but most are likely due tothe presence of (1) between-population differences in single-nucleotide polymorphism (SNP) allele frequencies [Cavalli-Sforza and Edwards, 1967; Cavalli-Sforza et al., 1994; Priceet al., 2006; The International HapMap 3 Consortium et al.,2010] and (2) allele-specific DNA methylation or methylationquantitative trait loci (mQTLs) [Bell et al., 2011; Boks et al.,2009; Heijmans et al., 2007; Kerkel et al., 2008; Schalkwyket al., 2010; Zhang et al., 2010]. Regardless of the mechanismsbehind the observed differences in DNA methylation acrosspopulations, there are no established methods to accountfor population stratification in methylation studies. Popula-tion stratification is a well-known confounder in genome-wide association studies (GWAS) [Cavalli-Sforza and Ed-wards, 1967; Cavalli-Sforza et al., 1994; Price et al., 2006;The International HapMap 3 Consortium et al., 2010], andis likely to present a similar problem in DNA methylationstudies. Methods to account for population stratification inGWAS include the use of genomic control (GC) to correctinflated test statistics [Bacanu et al., 2000; Devlin and Roeder,1999; Devlin et al., 2001a] and inclusion of the top principal
C© 2014 WILEY PERIODICALS, INC.

components (PCs) of genome-wide genotype data as covari-ates in association tests to serve as proxies for individual an-cestry [Price et al., 2006]. These methods may be extended toaddress population stratification in DNA methylation stud-ies, though the lack of available GWAS data presents a com-plication in many studies. PCs computed from methylationdata present one possible solution to this problem, though theefficacy of these approaches has not been explored. In particu-lar, the use of methylation-based PCs may present additionalcomplications, since in contrast with genetic variation, ge-nomic patterns of DNA methylation are known to vary withmany factors beyond ancestry, including technical factors, age[Alisch et al., 2012; Christensen et al., 2009; Numata et al.,2012; Rakyan et al., 2010; Teschendorff et al., 2010], and cellu-lar composition [Houseman et al., 2012; Reinius et al., 2012].In this manuscript, we develop several methylation-based PCapproaches and assess their ability to account for populationstratification in DNA methylation studies when GWAS datamay not be available.
Methods
For this study, we sought to (1) assess the potentialfor confounding due to population stratification in DNAmethylation analyses and (2) compare the ability of differ-ent approaches to account for population stratification. Wefirst examined the potential for confounding in a typicalmethylation dataset by testing >469K autosomal CpG sitesfor association with self-reported race among 388 individ-uals self-identifying as African American or Caucasian. Wenext assessed the ability of approaches based on PCs fromgenomic methylation or SNP data to adjust for populationstratification based on the reduction in the number of CpGsites significantly associated with race after these PCs wereincluded as covariates in the analysis. For each approach, wethen performed simulations to obtain estimates of type I errorand power with or without population stratification. Finally,we examined our ability to replicate published results in ourdata using each of these approaches to adjust for populationstratification.
Data
The data used in this study were collected as part of alarger study investigating the roles of genetic and environ-mental factors in predicting response to stressful life events[Gillespie et al., 2009]. Individuals were recruited from thewaiting rooms of a public hospital in Atlanta, Georgia, andthose providing informed consent participated in a verbalinterview and provided salivary and/or blood samples. Allprocedures in this study were approved by the InstitutionalReview Boards of Emory University School of Medicine andGrady Memorial Hospital.
To assess DNA methylation, we extracted DNA from wholeblood at the Max Planck Institute in Munich using the GentraPuregene Kit (Qiagen, Valencia, CA, USA). Genomic DNAwas then bisulfite converted using the Zymo EZ-96 DNAMethylation Kit (Zymo Research, Orange, CA, USA). We
assessed DNA methylation for 393 individuals at >480,000CpG sites using Illumina HumanMethylation450 BeadChiparrays, with hybridization and processing performed accord-ing to the instructions of the manufacturer. For each CpGsite and individual, we collected two data points: M (the to-tal methylated signal) and U (the total unmethylated signal).We set to missing data points with (1) a detection P-valuegreater than 0.001 or (2) a combined signal less than 25%of the total median signal and less than both the medianunmethylated and median methylated signal. We removedindividual samples from analysis if they had (1) a mean totalsignal less than half of the median of the overall mean signalor 2,000 arbitrary units or (2) a missingness rate above 5%.Similarly, we removed from analysis CpG sites with a miss-ingness rate above 10%. We then quantile normalized thesignal data to remove systematic differences across individu-als in overall signal distribution (Supplementary Methods).Using the normalized signals, we then computed β-values foreach individual at each CpG site as the total methylated signaldivided by the total signal:
β =M
U + M.
For genotyping, we extracted DNA either from saliva (Or-agene DNA, DNA Genotek, Kanata, Ontario, Canada) orwhole blood at Emory University. We used Illumina Omni-Quad 1M and Omni-Express arrays with 200 ng (blood) or400 ng (saliva) of DNA to genotype 639,053 SNPs for thesame 393 individuals at the Max Planck Institute. We calledgenotypes using Illumina’s GenomeStudio software and usedPLINK [Purcell et al., 2007] to perform quality control anal-yses, removing individuals with >2% missing data and SNPswith less than a 99% call rate or minor allele frequency (MAF)< 5%. We also identified and removed related individuals byusing PLINK to estimate the proportion of identity by de-scent (IBD) for each pair of individuals [Purcell et al., 2007].Among pairs of individuals with IBD proportion >0.1 (indi-cating cousins or a closer relation), we removed the individualin each pair with the higher rate of missing genotype data.After quality control, 589,375 autosomal SNPs, 469,142 auto-somal CpG sites, and 393 individuals were eligible for furtheranalyses.
Principal Component Analysis (PCA)
PCA of Genome-Wide SNP Data
Prior to PCA, we used PLINK [Purcell et al., 2007] toprune the data in windows of 50 bps, removing one SNPfrom each pair of SNPs with r2 > 0.05. A total of 54,616SNPs remained after pruning. We next standardized the allelecounts as suggested in Patterson et al. [2006], such that if Cis a matrix of allele counts, with each row representing anindividual, the matrix of standardized allele counts is
M =C – columnmeans(C)√
p (1 – p ),
where
p =columnmeans(C)
2.
232 Genetic Epidemiology, Vol. 38, No. 3, 231–241, 2014

We then calculated the PCs of M. To adjust for populationstratification, we considered two sets of PCs: the set that weresignificant according to a Tracey-Widom test [Patterson et al.,2006] (PCGWAS_TW) and the top 10 PCs of M (PCGWAS).
PCA of Genome-Wide DNA Methylation Data
When adjusting for population stratification in GWAS,it is common to work with a roughly independent set ofSNPs that have been pruned to remove highly correlatedSNPs, as described above. We took a similar approach for themethylation data, although to account for differences in thecorrelation structure of methylation data compared to SNPdata, we performed more extensive correlation-based prun-ing than typically used for SNPs (Supplementary Methods).As potential corrections for population stratification, we con-sidered the top 10 PCs based on: the complete unpruned data(PCunpruned), data pruned to keep only CpG sites with r2 <
0.25 (PCr2<0.25), or data pruned to keep only CpG sites withr2 < 0.1 (PCr2<0.1).
In addition to the correlation-based pruning, we also de-vised a method of location-based pruning to take advan-tage of information on the proximity of SNP variants tothe methylation probes by incorporating data on geneticvariation from the 1000 Genomes Project [1000 GenomesProject Consortium, 2010]. For each CpG site, we identi-fied the closest genetic variant with MAF > 0.01 in the 1000Genomes Project, based on all samples in the updated Phase Irelease. We then created seven pruned datasets that includedonly CpG sites within a certain distance (0, 1, 2, 5, 10, 50,or 100 bp) of a genetic variant (lists of CpG sites availableat http://genetics.emory.edu/conneely). The purpose of thislocation-based pruning was to focus on CpG sites that mayproxy for SNP genotypes in situations where SNP data maynot be available. We hypothesized that the PCs from theseCpG sites could pick up on population differences in allelefrequency of the genetic variants and thus may provide anappropriate adjustment for population stratification whengenome-wide SNP data are not available. Thus, we testedan additional seven sets of the top 10 PCs based on CpGsites located: directly on a genetic variant (PC0bp), within one(PC1bp), two (PC2bp), five (PC5bp), 10 (PC10bp), 50 (PC50bp),or 100 bps (PC100bp) of a genetic variant.
Assessing the Potential for Population Stratification inMethylation Data
To assess the potential for population stratification in ourmethylation data, we tested for associations between methy-lation and self-reported race in all individuals who self-reported as African American (N = 365) or Caucasian (N = 23)in our data. We used the R package CpGassoc [Barfieldet al., 2012] to perform a genome-wide methylation asso-ciation study to identify CpG sites that associated signifi-cantly with race. Analyzing each CpG site separately, we per-formed a multivariate linear regression that modeled eitherthe β-values or M-values (the logit-transformed β-values log
(β/(1 – β)) described by [Du et al., 2010]) on an indicator forself-reported race (African American vs. Caucasian) and in-cluded covariates for sex, age, chip, and row on chip to adjustfor age- and sex-dependent methylation along with potentialtechnical effects of chip and location on chip. To assess sig-nificance while accounting for multiple testing, we used theBenjamini-Hochberg false discovery rate (FDR) procedureand the Holm method (a step down Bonferroni procedure)[Benjamini and Hochberg, 1995; Holm, 1979].
We next assessed the effectiveness of each set of PCs de-scribed above as proxies for self-reported race in our data,since the goal of PC-based adjustment for population strat-ification is to construct covariates that proxy for ancestry.For each set of PCs, we re-ran our CpGassoc analysis in-cluding the top PCs (generally the top 10 PCs, except withPCGWAS_TW) as covariates in the model. When working withM-values, we computed PCs based on M-values instead ofthe untransformed β-values. To assess the potential of eachset of PCs as proxies for ancestry, we considered the numberof CpG sites significantly associated with race before and afteradjustment. For comparison, we also applied the method ofGC to adjust the test statistics by an estimated inflation fac-tor statistics [Bacanu et al., 2000; Devlin and Roeder, 1999;Devlin et al., 2001a]. To estimate the GC inflation factor, wefirst computed tmed, the median t-statistic from the unad-justed model. Since the squared t-statistics are approximatelydistributed as λχ2
1 [Devlin et al., 2001b], where λ representsan unknown inflation factor, we computed the GC inflationfactor as λG C = t2
med/.4549, where 0.4549 is the median of theχ2
1 distribution. We then divided each of the test statistics by√λG C before calculating P-values.
Simulations
To assess rates of type I error and power for the proposedadjustments, we performed a series of simulations. Becauseof the difficulty of simulating realistic genome-wide methyla-tion and SNP data, we based our simulations on the genome-wide genotypes and epigenotypes of randomly drawn subsetsof individuals from the data described above. In each simula-tion, we randomly sampled 100 of the 365 African Americanindividuals and included all 23 Caucasian individuals; thisstrategy was used because of the scarcity of Caucasian in-dividuals in our data. For each sample of 123 individuals,we then simulated either a continuous or dichotomous vari-able that had a different mean for Caucasians and AfricanAmericans.
To estimate type I error rates for the continuous case, wesimulated a variable Yi so that for individual i,
Yi = α + γ × I (Caucasian) + εi,
where α is a constant term, εi ∼ N(0, 1), and I(Caucasian) isan indicator variable that is 1 for Caucasian and 0 for AfricanAmerican individuals. We performed two sets of 5,000 sim-ulations each: one where γ = 0 (no population stratification)and one where γ > 0 (population stratification is present). Totest the ability of each method to control experiment-wide
Genetic Epidemiology, Vol. 38, No. 3, 231–241, 2014 233

type I error at the appropriate level (0.05), we used CpGassocto perform a genome-wide analysis for association betweenmethylation and the simulated continuous variable in eachsimulated dataset. CpGassoc fits a linear model for each CpGsite that models either the β- or M-value as a linear functionof covariates. Our covariates included the simulated continu-ous variable as well as age, sex, chip, and location on chip. Ineach simulation, we next attempted to adjust for populationstratification using each of the methods described above, aswell as GC [Bacanu et al., 2000; Devlin and Roeder, 1999;Devlin et al., 2001a] and Leek and Storey’s surrogate variableanalysis (SVA) method [Leek et al., 2012; Leek and Storey,2007, 2008]. To avoid excessive computational burden, eachset of PCs was computed for the entire sample of individ-uals in the simulation study (N = 388) prior to performingsimulations, rather than computing a separate set for eachsimulation. To perform SVA, we used the SVA R package toestimate the surrogate variables via iteratively re-weightedSVA [Buja, 1992; Leek and Storey, 2007, 2008] and to selectthe number of surrogate variables to include in the analysisvia permutation testing [Buja, 1992]. As with the PCs, wethen included the surrogate variables as additional covari-ates in the model. SVA typically failed for a small number ofsimulations; for T1E simulations we assumed for the sake ofcomparison that those unsuccessful runs would not have re-turned false positives, while for power simulations we simplycomputed power based on the successful simulations. Theresulting estimate of type I error in each set of simulationswas the proportion of simulations with one or more Holm-significant CpG sites.
To estimate power, we simulated the continuous variablesuch that its mean depended on both race and the methylationof a specific CpG site. The variable was simulated accordingto a linear model where
Yi = α + δ × βi + γ × I (Caucasian) + εi,
where α is a constant term, δ > 0 is a constant slope term,εi ∼ N(0, 1), and βi represents the β-value or M-value at thechosen CpG site for individual i. Here, we performed two setsof 1,000 simulations each: one where γ = 0 (no populationstratification) and one where γ > 0 (population stratificationis present). We then used CpGassoc to test each CpG sitefor association as described above. Estimated power for eachset of simulations was then the proportion of simulationsthat correctly identified the chosen CpG site as Bonferroni-significant.
For the binary case, we performed similar simulations us-ing a logit model. For each individual, we simulated the prob-ability of disease pi such that
log
(p i
1 – p i
)= α + δ × βi + γ × I (Caucasian),
and simulated disease status as a Bernoulli(pi) random vari-able. To estimate type I error rates, we created 5,000 simulateddatasets where disease status was simulated with δ = 0 andeither γ = 0 (no population stratification present) or γ > 0(population stratification present). We then used CpGassoc
to test each CpG site for association by fitting linear regres-sions that modeled β-values as a linear function of diseasestatus as well as age, sex, chip, and location on chip, and triedadjusting for population stratification via all of the methodsdescribed above. As above, we estimated type I error in eachset of simulations as the proportion of simulations with oneor more Holm-significant CpG sites. To estimate power, weperformed 1,000 simulations where δ > 0, and proceeded inthe same way as above.
Replication of Previously Published Results
To compare the above methods in a real-world setting, weattempted to replicate two sets of previously published results:the top eight CpG sites from a study of methylation and age[Teschendorff et al., 2010] and a CpG site that has shownstrong association with smoking in several studies [Breitlinget al., 2011, 2012; Shenker et al., 2013; Sun et al., 2013; Wanet al., 2012].
We first analyzed eight CpG sites that we selected by takingthe five CpG sites most significantly associated with age ineach of Supplementary Tables S3 and S5 in Teschendorffet al. [2010]. For these analyses, we used our original dataplus five additional individuals who were not included inthe simulations because they did not self-report as AfricanAmerican or Caucasian (four reported as mixed race andone as “other”), raising our sample size to 393. We thenrecalculated all the PCs. We used CpGassoc to model β-valuesas a linear function of age, with covariates for sex, chip, andlocation on chip. We then refit the model including one of thesets of PCs described above as additional covariates, or usedGC or SVA [Leek et al., 2012; Leek and Storey, 2007]. As a goldstandard, we also ran the model including self-reported racefor comparison (coded as categorical based on self-reportedrace).
We next analyzed CpG site cg19859270, which has demon-strated strong association with smoking across several stud-ies [Breitling et al., 2011, 2012; Shenker et al., 2013; Sunet al., 2013; Wan et al., 2012], including a previous analysisin a subset of our data (239 African American subjects withuseable smoking data) as a replication sample in Sun et al.[2013]. Here, we modeled β-values as a function of the totalcurrent KMSK (Kreek-McHugh-Schluger-Kellogg; [Kellogget al., 2003]) score with the usual covariates for age, sex,chip, and location (row) on chip. We then refit the modelseveral times including each set of PCs as covariates. Ouranalysis included 255 individuals for whom KMSK was avail-able, including 239 self-identifying as African American, 13as Caucasian, two as mixed, and one as “other.”
For these analyses and others, we also performed secondaryanalyses adjusting for estimated cell-type proportions. Weestimated the proportions of six cell types (monocytes, gran-ulocytes, CD8+ T-cells, CD4+ T-cells, NK cells, and B cells)for each individual from their genome-wide methylation sig-natures, using the method of Houseman et al. [2012] to in-fer proportions based on an external reference sample ofcell-specific methylation profiles [Reinius et al., 2012]. We
234 Genetic Epidemiology, Vol. 38, No. 3, 231–241, 2014

Table 1. Total number of sites associated with race, before and after correction for population stratification
Correction Number of markers Number of FDR- Number of Holm-method used used to compute PCs significant CpG sites significant CpG sites λGC
No correction – 12,827 912 2.09GC – 578 90 1PCGWAS 54,610 13 3 1PCGWAS_TW 54,610 19 4 1PCunpruned 469,142 1 1 1.08PCr2<0.25 225,440 0 0 1.06PCr2<0.1 121,855 0 0 1.11PC0bp 7,326 0 0 1.16PC1bp 17,105 1 1 1.18PC2bp 20,336 1 1 1.18PC5bp 31,178 1 1 1.12PC10bp 48,998 1 1 1.10PC50bp 174,510 1 1 1.02PC100bp 271,877 1 1 1.05
then performed secondary analyses where we included theseestimated cell-type proportions as additional covariates inour replication studies of age and smoking. For all regres-sions, we standardized the cell-type proportions to sum toexactly 1 for each individual, and then included five of thesix proportions as covariates in our regression. We also usedthese estimated proportions to investigate the ability of thetop 10 methylation-based PCs to pick up on cell-type hetero-geneity (Supplementary Table S2).
Results
Our dataset included 365 African American and 23 Cau-casian individuals, according to self-report. The mean agewas 41.5 (range 18–77), with 279 females and 109 males. Forthe preliminary tests of genome-wide association betweenmethylation β- or M-values and self-reported race, we ana-lyzed 469,142 autosomal CpG sites. Nine hundred and twelvesites were associated with race according to the conservativeHolm method of adjustment for multiple testing, and 12,827sites were associated at FDR < 0.05 (first row of Table 1),suggesting that population stratification is a potential con-founder in DNA methylation studies as well as in GWAS.
We next performed similar analyses that included eachset of PCs as additional covariates to adjust for popula-tion stratification, and observed a substantial reduction inthe number of sites that significantly associated with race(Table 1). Although 90 sites remained associated with raceafter GC adjustment, inclusion of PCs from GWAS or methy-lation data generally resulted in 0 or 1 Holm-significantsites. PCs based on genome-wide SNP data (PCGWAS andPCGWAS_TW) were the most successful at removing inflation(λGC = 1) but several sites remained significantly associ-ated with race after these corrections. In contrast, slight ge-nomic inflation remained after adjustment via methylation-based PCs (1.02 < λGC < 1.18), but fewer FDR-significantsites remained. When we performed the analysis using M-values instead of β-values (Supplementary Table S1), we ob-served a similar pattern except that the GWAS-based PCs ap-peared to fully correct for population stratification, and the
methylation-based PCs (now computed based on M-values)performed somewhat worse in terms of genomic inflationand numbers of FDR-significant sites.
Table 1 suggests that both GWAS- and methylation-basedPCs successfully proxied for self-reported race, including setsbased only on DNA methylation data. It is well establishedthat population structure can generally be represented withthe top PCs from GWAS data, but no such pattern has beenestablished for DNA methylation data. In our data, we ob-serve that in contrast to GWAS-based PCs (Fig. 1A), the firstmethylation-based PC generally does not represent varia-tion due to population structure, suggesting that variation inmethylation data may be less influenced by population struc-ture and more influenced by other factors. This is unsurpris-ing considering that DNA methylation may be influencedby technical factors, individual age, or cell-type composi-tion of individual samples. For example, when examiningthe first 10 components from most sets of methylation-basedPCs, we found top PCs to be significantly associated notonly with race, but with age, chip, row on chip, and cell-type proportions estimated via the method of Housemanet al. [2012] (Supplementary Table S2). Figure 1 shows thatin our data self-reported race associates with the first PC ofPCGWAS (Fig. 1A) but with the second and third PCs of PC0bp
(Fig. 1B) and the fourth and sixth PCs of PC50bp (Fig. 1C).The difference between Figure 1B and 1C is consistent withthe idea that PCs based only on CpG sites harboring anSNP (PC0bp) may provide the best proxy for SNP-based PCswhen genome-wide SNP data are unavailable. Supplemen-tary Table S2 demonstrates a similar pattern for the othermethylation-based PCs, in which race correlates with higherorder PCs when PCs are computed for CpG sites within ≤10bp of SNPs.
To estimate type I error rates for the different approaches,we performed 5,000 simulations as described in Methods,and fit the model using each of the proposed adjustments.To provide a “gold standard” for our comparisons, we alsofit the model adjusting for self-reported race as a covariate.Results are presented in the first two columns of Table 2 (β-values modeled as a function of a continuous phenotype),Supplementary Table S3 (M-values modeled as a function of
Genetic Epidemiology, Vol. 38, No. 3, 231–241, 2014 235
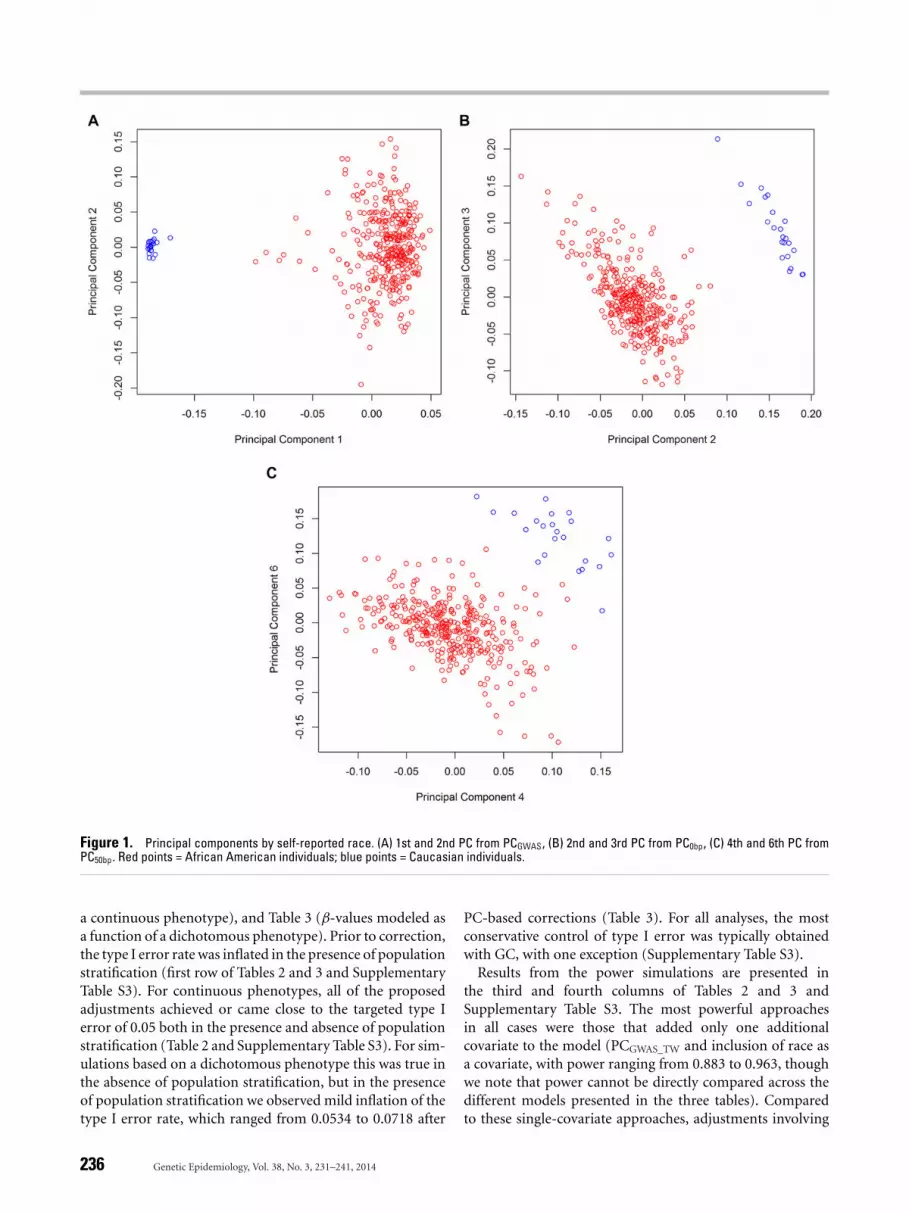
Figure 1. Principal components by self-reported race. (A) 1st and 2nd PC from PCGWAS, (B) 2nd and 3rd PC from PC0bp, (C) 4th and 6th PC fromPC50bp. Red points = African American individuals; blue points = Caucasian individuals.
a continuous phenotype), and Table 3 (β-values modeled asa function of a dichotomous phenotype). Prior to correction,the type I error rate was inflated in the presence of populationstratification (first row of Tables 2 and 3 and SupplementaryTable S3). For continuous phenotypes, all of the proposedadjustments achieved or came close to the targeted type Ierror of 0.05 both in the presence and absence of populationstratification (Table 2 and Supplementary Table S3). For sim-ulations based on a dichotomous phenotype this was true inthe absence of population stratification, but in the presenceof population stratification we observed mild inflation of thetype I error rate, which ranged from 0.0534 to 0.0718 after
PC-based corrections (Table 3). For all analyses, the mostconservative control of type I error was typically obtainedwith GC, with one exception (Supplementary Table S3).
Results from the power simulations are presented inthe third and fourth columns of Tables 2 and 3 andSupplementary Table S3. The most powerful approachesin all cases were those that added only one additionalcovariate to the model (PCGWAS_TW and inclusion of race asa covariate, with power ranging from 0.883 to 0.963, thoughwe note that power cannot be directly compared across thedifferent models presented in the three tables). Comparedto these single-covariate approaches, adjustments involving
236 Genetic Epidemiology, Vol. 38, No. 3, 231–241, 2014

Table 2. Type I error rate and power for analysis of a continuous trait, by method of correction for population stratification
Rate of type I error Power
Correction No population Stratification No population Stratificationmethod stratification present stratification present
No correction 0.0364 0.2690 0.964 —Race included as covariate 0.0344 0.0344 0.963 0.963GC 0.0116 0 0.908 0.662PCGWAS 0.0348 0.0326 0.879 0.871PCGWAS_TW 0.0340 0.0322 0.962 0.951PCunpruned 0.0466 0.0478 0.885 0.860PCr2<0.25 0.0464 0.0514 0.888 0.861PCr2<0.1 0.0448 0.0500 0.893 0.857PC0bp 0.0418 0.0412 0.832 0.828PC1bp 0.0380 0.0374 0.880 0.858PC2bp 0.0390 0.0376 0.887 0.852PC5bp 0.0382 0.0436 0.888 0.856PC10bp 0.0404 0.0430 0.893 0.860PC50bp 0.0496 0.0462 0.894 0.869PC100bp 0.0464 0.0450 0.884 0.860SVA 0.0460 0.0506 0.881 0.839
Table 3. Type I error rate and power for analysis of a dichotomous trait, by method of correction for population stratification
Rate of type I error Power
Correction No population Stratification No population Stratificationmethod stratification present stratification present
No correction 0.0304 0.1354 0.948 —Race included as covariate 0.0290 0.0692 0.945 0.885GC 0.0084 0.0488 0.903 0.801PCGWAS 0.0304 0.0534 0.869 0.794PCGWAS_TW 0.0290 0.0712 0.946 0.883PCunpruned 0.0402 0.0694 0.880 0.802PCr2<0.25 0.0370 0.0704 0.885 0.807PCr2<0.1 0.0356 0.0676 0.885 0.800PC0bp 0.0398 0.0650 0.840 0.749PC1bp 0.0392 0.0678 0.871 0.789PC2bp 0.0398 0.0708 0.874 0.792PC5bp 0.0410 0.0708 0.875 0.795PC10bp 0.0392 0.0718 0.880 0.797PC50bp 0.0390 0.0700 0.884 0.804PC100bp 0.0382 0.0718 0.883 0.806SVA 0.0358 0.0794 0.790 0.689
the inclusion of 10 PCs showed somewhat lower power thatranged from 0.832 to 0.894 when no population stratificationwas present, and from 0.749 to 0.871 in the presence ofpopulation stratification. Among the adjustments based on10 PCs, the correlation-based pruning approaches that ledto the largest reduction in race-associated sites in Table 1(PCunpruned, PCr2<0.25, and PCr2<0.1) were among the mostpowerful methylation-based approaches when populationstratification was present, but some of the location-basedpruning approaches performed as well or better. Interest-ingly, PCs based on CpG sites within ≤10 bp of SNPs wereamong the less powerful approaches, which is surprisinggiven the associations with race demonstrated by these setsof PCs (Supplementary Table S2). We generally observedslightly lower power for SVA than for the PC-based methods.Finally, the GC method performed well when there was nopopulation stratification, but in the presence of stratificationit performed the worst of all methods considered forcontinuous traits, with 0.662 power to detect an associationin Table 2 and power of 0.656 in Supplementary Table S3.
We next attempted to replicate the top eight methylation-age associations reported by Teschendorff et al. [2010].Figure 2 shows that for all eight CpG sites, we successfullyreplicated the association with age in our data. Interest-ingly, correction with PCs based on larger sets of CpG sites(PCr2<0.25, PCr2<0.1, PCunpruned, PC50bp, PC100bp) led to theleast significant results in the replicated age-association re-sults (Fig. 2). This may be due to the greater association ofthese PCs with age (Supplementary Table S2). While geno-type data are static, DNA methylation is dynamic and it isthus likely that its PCs may vary with dynamic traits suchas age, as demonstrated in Supplementary Table S2. In con-trast, adjustment via PCs based on genetic variants (PCGWAS,PCGWAS_TW) or proxies for genetic variants within ≤10 bp(PC0bp, . . . , PC10bp) led to stronger age-methylation asso-ciations, which makes sense given that genetic variation isindependent of age and those sets of PCs are less associatedwith age than the other sets of methylation-based PCs (Sup-plementary Table S2). SVA also led to stronger associations,which makes sense given its goal to account for unmeasured
Genetic Epidemiology, Vol. 38, No. 3, 231–241, 2014 237

Figure 2. Replication of aging results. Replication of the top eight CpG sites associated with aging [Teschendorff et al., 2010], using 16 differentapproaches to adjust for population stratification.
factors that are independent of the variable of interest [Leeket al., 2012; Leek and Storey, 2007]. Finally, GC appeared toperform poorly in this context, likely because the large in-flation factor (λGC = 3.07) was in part due to a widespreadgenomic pattern of association between age and methylation.Notably, the inflation factor remained large even after cor-recting for population stratification with GWAS-based PCs(λGC = 3.13), suggesting that the observed inflation was in-deed due to factors other than population stratification, andthat GC may not be an appropriate correction in this case.
Because cell-type heterogeneity is a potential confounderbetween methylation and age, we refit the above models in-cluding covariates for estimated cell-type proportions, asdescribed in Methods. Supplementary Figure S1 comparesthe –log10 P-values for cell-type-corrected analyses vs. un-adjusted analyses, and Supplementary Figure S2 summarizesthe associations with age after cell-type adjustment. Notably,for all eight CpG sites, the associations with age becomemore significant upon adjustment for cell type for the mod-els not adjusted for population stratification (no correction)or those adjusted via GWAS or inclusion of race as a covari-ate. For the models adjusted for population stratification withmethylation-based PCs, the pattern is less consistent, and itis important to note that here we have introduced a largeamount of collinearity to the model through the inclusion ofboth estimated cell-type proportions and the top 10 methy-lation PCs. Supplementary Table S2 demonstrates extremelyhigh correlation between estimated cell-type proportions andthe top methylation-based PCs; thus, by including the top 10PCs in the model, we are already adjusting for cell type tosome extent. In Supplementary Figure S1, adjustment forpopulation stratification via SVA or PCs based on CpG siteswithin ≤10 bp of an SNP typically yields cell-type-unadjusted
P-values that are similar to the cell-type-adjusted P-values forthe “no correction” or GWAS-based approaches, suggestingthat these approaches may do the best job of accounting forcellular heterogeneity as well as population stratification.
We next attempted to replicate a previously reported as-sociation between methylation and smoking [Breitling et al.,2011, 2012; Shenker et al., 2013; Sun et al., 2013; Wan et al.,2012]. This result has already been replicated in the AfricanAmericans in our dataset with available smoking data (N =
239; [Sun et al., 2013]), but as a proof-of-principle we re-performed the analysis including individuals self-reportingas Caucasian, mixed race, and other (N = 255). Comparingto the replication results from Sun et al. [2013] (Fig. 3, dot-ted line), we observe stronger associations between smokingand cg19859270 regardless of which method is used to ad-just for population stratification. This may result partiallyfrom the slight increase in sample size, but notably there wasnot much increase in significance when no correction forpopulation stratification was performed (leftmost point onFig. 3). Upon adjustment for cell-type proportions, resultswere similar for the methods based on GWAS PCs, inclusionof race as a covariate, or no correction, but less significantwhen methylation-based PCs were included; as above, this isconsistent with high collinearity between estimated cell-typeproportions and methylation-based PCs.
In contrast to the age replication, in the methylation-smoking analysis, all of the methylation-based PC methodsled to more significant associations than the GWAS-based PCmethods (Fig. 3). Adjustment for population stratificationvia PCr2<0.1 led to the most significant association betweencg19859270 and smoking (P = 5.3 × 10⁻¹⁴), followed by thePC methods using correlation-based pruning. The differencebetween Figures 2 and 3 is consistent with the idea that unlike
238 Genetic Epidemiology, Vol. 38, No. 3, 231–241, 2014
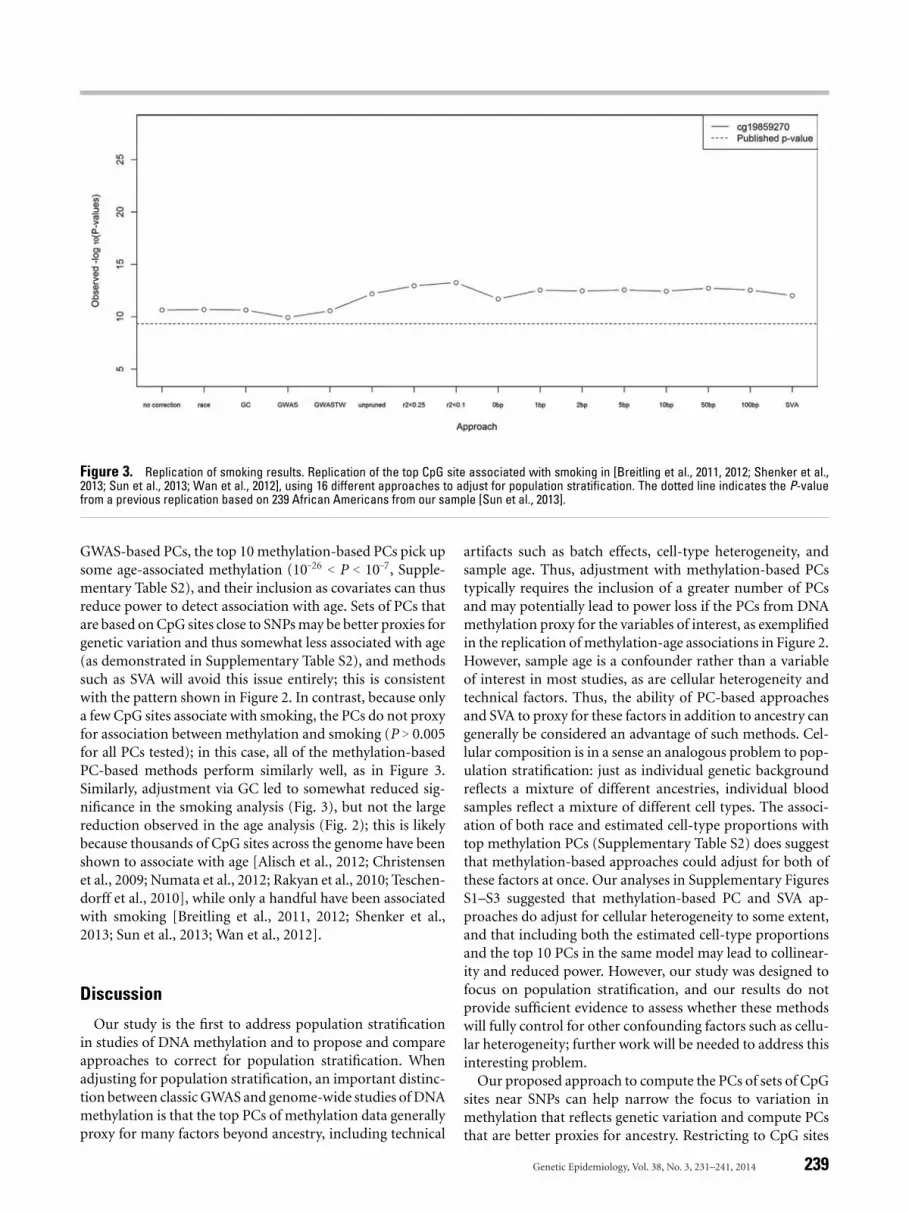
Figure 3. Replication of smoking results. Replication of the top CpG site associated with smoking in [Breitling et al., 2011, 2012; Shenker et al.,2013; Sun et al., 2013; Wan et al., 2012], using 16 different approaches to adjust for population stratification. The dotted line indicates the P-valuefrom a previous replication based on 239 African Americans from our sample [Sun et al., 2013].
GWAS-based PCs, the top 10 methylation-based PCs pick upsome age-associated methylation (10–26 < P < 10–7, Supple-mentary Table S2), and their inclusion as covariates can thusreduce power to detect association with age. Sets of PCs thatare based on CpG sites close to SNPs may be better proxies forgenetic variation and thus somewhat less associated with age(as demonstrated in Supplementary Table S2), and methodssuch as SVA will avoid this issue entirely; this is consistentwith the pattern shown in Figure 2. In contrast, because onlya few CpG sites associate with smoking, the PCs do not proxyfor association between methylation and smoking (P > 0.005for all PCs tested); in this case, all of the methylation-basedPC-based methods perform similarly well, as in Figure 3.Similarly, adjustment via GC led to somewhat reduced sig-nificance in the smoking analysis (Fig. 3), but not the largereduction observed in the age analysis (Fig. 2); this is likelybecause thousands of CpG sites across the genome have beenshown to associate with age [Alisch et al., 2012; Christensenet al., 2009; Numata et al., 2012; Rakyan et al., 2010; Teschen-dorff et al., 2010], while only a handful have been associatedwith smoking [Breitling et al., 2011, 2012; Shenker et al.,2013; Sun et al., 2013; Wan et al., 2012].
Discussion
Our study is the first to address population stratificationin studies of DNA methylation and to propose and compareapproaches to correct for population stratification. Whenadjusting for population stratification, an important distinc-tion between classic GWAS and genome-wide studies of DNAmethylation is that the top PCs of methylation data generallyproxy for many factors beyond ancestry, including technical
artifacts such as batch effects, cell-type heterogeneity, andsample age. Thus, adjustment with methylation-based PCstypically requires the inclusion of a greater number of PCsand may potentially lead to power loss if the PCs from DNAmethylation proxy for the variables of interest, as exemplifiedin the replication of methylation-age associations in Figure 2.However, sample age is a confounder rather than a variableof interest in most studies, as are cellular heterogeneity andtechnical factors. Thus, the ability of PC-based approachesand SVA to proxy for these factors in addition to ancestry cangenerally be considered an advantage of such methods. Cel-lular composition is in a sense an analogous problem to pop-ulation stratification: just as individual genetic backgroundreflects a mixture of different ancestries, individual bloodsamples reflect a mixture of different cell types. The associ-ation of both race and estimated cell-type proportions withtop methylation PCs (Supplementary Table S2) does suggestthat methylation-based approaches could adjust for both ofthese factors at once. Our analyses in Supplementary FiguresS1–S3 suggested that methylation-based PC and SVA ap-proaches do adjust for cellular heterogeneity to some extent,and that including both the estimated cell-type proportionsand the top 10 PCs in the same model may lead to collinear-ity and reduced power. However, our study was designed tofocus on population stratification, and our results do notprovide sufficient evidence to assess whether these methodswill fully control for other confounding factors such as cellu-lar heterogeneity; further work will be needed to address thisinteresting problem.
Our proposed approach to compute the PCs of sets of CpGsites near SNPs can help narrow the focus to variation inmethylation that reflects genetic variation and compute PCsthat are better proxies for ancestry. Restricting to CpG sites
Genetic Epidemiology, Vol. 38, No. 3, 231–241, 2014 239

within 0–50 bp of genetic variants will enrich for CpG sitesthat may proxy for genetic variation due to the possibilityof an SNP influencing probe binding specificity, rather thanthose that proxy for genetic variation due to the influenceof mQTLs. Given intertissue differences in methylation pat-terns [e.g., Byun et al., 2009], and emerging evidence thatmQTLs and eQTLs are in part tissue specific [Nica et al.,2011; Smith et al., 2013], computation of PCs based on setsof CpG sites within 50 bp of SNPs may provide an adjust-ment strategy that is robust regardless of what tissue type isstudied. Another advantage of this approach is its computa-tional simplicity compared to pruning based on correlation.To facilitate the use of this approach by other groups, we havemade available our lists of CpG sites from the Illumina 450Kthat are located within 0–100 bp of 1000 Genomes Projectvariants with MAF > 0.01, along with R code to computethe PCs (http://genetics.emory.edu/conneely). Variations ofthis approach such as focusing on CpG sites near ancestry-informative markers could also be useful, although thisapproach would require knowledge about the underlyingpopulations potentially driving stratification as well as prei-dentified set of thousands of ancestry-informative markers.
In conclusion, we have proposed and made available a sim-ple approach to adjust for population stratification in studiesof DNA methylation that does not require the collection ofSNP genotype data. Potential limitations of our study in-cluded the focus on two self-reported race categories and thesmall number of Caucasians in our data, and future studiesshould seek to generalize these results in larger samples fromother populations. However, even with this limited dataset wehave demonstrated the potential of population stratificationto inflate type I error rates in DNA methylation associationstudies. Our simulations show that our approach appropri-ately removes this inflation while remaining nearly as pow-erful as using the top PCs from genome-wide SNP data, thusproviding an effective way to adjust for population stratifi-cation in DNA methylation studies when genome-wide SNPdata are unavailable.
Acknowledgments
This work was primarily supported by National Institutes of MentalHealth (MH071537 and MH096764). Epigenotyping was supported in partby the Max-Planck Society, and we thank Anne Loschner for excellent tech-nical assistance. Salary support was provided by MH085806 (for A.K.S.) andHG007508 (for M.P.E. and R.D.). Simulations were performed on Emory’shigh-powered computing cluster, which is supported by the National Centerfor Advancing Translational Sciences of the National Institutes of Health un-der Award UL1TR000454. We would also like to thank the participants whomade this work possible, as well as the staff of the Grady Trauma Project.Finally, we thank two anonymous reviewers whose comments have led tosubstantial improvements in our manuscript.
References
1000 Genomes Project Consortium, Abecasis GR, Altshuler D, Auton A, Brooks LD,Durbin RM, Gibbs RA, Hurles ME, McVean GA. 2010. A map of human genomevariation from population-scale sequencing. Nature 467(7319):1061–1073.
Adkins RM, Krushkal J, Tylavsky FA, Thomas F. 2011. Racial differences in gene-specificDNA methylation levels are present at birth. Birth Defects Res A Clin Mol Teratol91(8):728–736.
Alisch RS, Barwick BG, Chopra P, Myrick LK, Satten GA, Conneely KN, Warren ST.2012. Age-associated DNA methylation in pediatric populations. Genome Res.22(4):623–632.
Bacanu SA, Devlin B, Roeder K. 2000. The power of genomic control. Am J Hum Genet66(6):1933–1944.
Barfield RT, Kilaru V, Smith AK, Conneely KN. 2012. CpGassoc: an R function foranalysis of DNA methylation microarray data. Bioinformatics 28(9):1280–1281.
Bell JT, Pai AA, Pickrell JK, Gaffney DJ, Pique-Regi R, Degner JF, Gilad Y, PritchardJK. 2011. DNA methylation patterns associate with genetic and gene expressionvariation in HapMap cell lines. Genome Biol 12(1):R10.
Benjamini Y, Hochberg Y. 1995. Controlling the false discovery rate: a practical andpowerful approach to multiple testing. J R Stat Soc. Series B 57(1):289–300.
Boks MP, Derks EM, Weisenberger DJ, Strengman E, Janson E, Sommer IE, Kahn RS,Ophoff RA. 2009. The relationship of DNA methylation with age, gender andgenotype in twins and healthy controls. PLoS One 4(8):e6767.
Breitling LP, Salzmann K, Rothenbacher D, Burwinkel B, Brenner H. 2012. Smoking,F2RL3 methylation, and prognosis in stable coronary heart disease. Eur Heart J33(22):2841–2848.
Breitling LP, Yang R, Korn B, Burwinkel B, Brenner H. 2011. Tobacco-smoking-relateddifferential DNA methylation: 27K discovery and replication. Am J Human Genet88(4):450–457.
Buja A. 1992. Remarks on parallel analysis. Multivar Behav Res 27:509–540.Byun HM, Siegmund KD, Pan F, Weisenberger DJ, Kanel G, Laird PW, Yang AS.
2009. Epigenetic profiling of somatic tissues from human autopsy specimensidentifies tissue- and individual-specific DNA methylation patterns. Human MolGenet 18(24):4808–4817.
Cavalli-Sforza LL, Edwards AW. 1967. Phylogenetic analysis. Models and estimationprocedures. Am J Hum Genet 19(3 Pt 1):233–257.
Cavalli-Sforza LL, Menozzi P, Piazza A. 1994. The History and Geography of HumanGenes. Princeton University Press: Princeton, NJ.
Christensen BC, Houseman EA, Marsit CJ, Zheng S, Wrensch MR, Wiemels JL, NelsonHH, Karagas MR, Padbury JF, Bueno R and others. 2009. Aging and environmentalexposures alter tissue-specific DNA methylation dependent upon CpG islandcontext. PLoS Genet 5(8):e1000602.
Cicek MS, Koestler DC, Fridley BL, Kalli KR, Armasu SM, Larson MC, Wang C, WinhamSJ, Vierkant RA, Rider DN and others. 2013. Epigenome-wide ovarian canceranalysis identifies a methylation profile differentiating clear-cell histology withepigenetic silencing of the HERG K+ channel. Human Mol. Genet 22(15):3038–3047.
Coit P, Jeffries M, Altorok N, Dozmorov MG, Koelsch KA, Wren JD, Merrill JT, McCuneWJ, Sawalha AH. 2013. Genome-wide DNA methylation study suggests epigeneticaccessibility and transcriptional poising of interferon-regulated genes in naiveCD4+ T cells from lupus patients. J Autoimmun 43:78–84.
Devlin B, Roeder K. 1999. Genomic control for association studies. Biometrics55(4):997–1004.
Devlin B, Roeder K, Bacanu SA. 2001a. Unbiased methods for population-based asso-ciation studies. Genet Epidemiol 21(4):273–284.
Devlin B, Roeder K, Wasserman L. 2001b. Genomic control, a new approach to genetic-based association studies. Theor. Popul Biol 60(3):155–166.
Du P, Zhang X, Huang CC, Jafari N, Kibbe WA, Hou L, Lin SM. 2010. Comparison ofBeta-value and M-value methods for quantifying methylation levels by microarrayanalysis. BMC Bioinformatics 11:587.
Gillespie CF, Bradley B, Mercer K, Smith AK, Conneely K, Gapen M, Weiss T, SchwartzAC, Cubells JF, Ressler KJ. 2009. Trauma exposure and stress-related disorders ininner city primary care patients. Gen Hosp Psychiatry 31(6):505–514.
Heijmans BT, Kremer D, Tobi EW, Boomsma DI, Slagboom PE. 2007. Heritable ratherthan age-related environmental and stochastic factors dominate variation in DNAmethylation of the human IGF2/H19 locus. Hum Mol Genet 16(5):547–554.
Heyn H, Moran S, Hernando-Herraez I, Sayols S, Gomez A, Sandoval J, Monk D, HataK, Marques-Bonet T, Wang L and others. 2013. DNA methylation contributes tonatural human variation. Genome Res 23:1363–1372.
Holm S. 1979. A simple sequentially rejective multiple test procedure. Scand J Stat6(2):65–70.
Houseman EA, Accomando WP, Koestler DC, Christensen BC, Marsit CJ, Nelson HH,Wiencke JK, Kelsey KT. 2012. DNA methylation arrays as surrogate measures ofcell mixture distribution. BMC Bioinformatics 13:86.
Kellogg SH, McHugh PF, Bell K, Schluger JH, Schluger RP, LaForge KS, Ho A, KreekMJ. 2003. The Kreek–McHugh–Schluger–Kellogg scale: a new, rapid method forquantifying substance abuse and its possible applications. Drug Alcohol Depend69:137–150.
Kerkel K, Spadola A, Yuan E, Kosek J, Jiang L, Hod E, Li K, Murty VV, Schupf N,Vilain E and others. 2008. Genomic surveys by methylation-sensitive SNP analysisidentify sequence-dependent allele-specific DNA methylation. Nat Genet 40(7):904–908.
Kwabi-Addo B, Wang S, Chung W, Jelinek J, Patierno SR, Wang BD, Andrawis R, LeeNH, Apprey V, Issa JP and others. 2010. Identification of differentially methylated
240 Genetic Epidemiology, Vol. 38, No. 3, 231–241, 2014

genes in normal prostate tissues from African American and Caucasian men. ClinCancer Res 16(14):3539–3547.
Leek JT, Johnson WE, Parker HS, Jaffe AE, Storey JD. 2012. The sva package for remov-ing batch effects and other unwanted variation in high-throughput experiments.Bioinformatics 28(6):882–883.
Leek JT, Storey JD. 2007. Capturing heterogeneity in gene expression studies by surro-gate variable analysis. PLoS Genet 3(9):1724–1735.
Leek JT, Storey JD. 2008. A general framework for multiple testing dependence. ProcNatl. Acad Sci USA 105(48):18718–18723.
Liu J, Hutchison K, Perrone-Bizzozero N, Morgan M, Sui J, Calhoun V. 2010. Identi-fication of genetic and epigenetic marks involved in population structure. PLoSOne 5(10):e13209.
Nica AC, Parts L, Glass D, Nisbet J, Barrett A, Sekowska M, Travers M, Potter S, Grund-berg E, Small K and others. 2011. The architecture of gene regulatory variationacross multiple human tissues: the MuTHER study. PLoS Genet 7(2):e1002003.
Nielsen DA, Hamon S, Yuferov V, Jackson C, Ho A, Ott J, Kreek MJ. 2010. Ethnicdiversity of DNA methylation in the OPRM1 promoter region in lymphocytes ofheroin addicts. Hum Genet 127(6):639–649.
Numata S, Ye T, Hyde TM, Guitart-Navarro X, Tao R, Wininger M, Colantuoni C,Weinberger DR, Kleinman JE, Lipska BK. 2012. DNA methylation signaturesin development and aging of the human prefrontal cortex. Am J Human Genet90(2):260–272.
Patterson N, Price AL, Reich D. 2006. Population structure and eigenanalysis. PLoSGenet 2(12):e190.
Pembrey ME, Bygren LO, Kaati G, Edvinsson S, Northstone K, Sjostrom M, Golding J.2006. Sex-specific, male-line transgenerational responses in humans. Eur J HumGenet 14(2):159–166.
Price AL, Patterson NJ, Plenge RM, Weinblatt ME, Shadick NA, Reich D. 2006. Principalcomponents analysis corrects for stratification in genome-wide association studies.Nat Genet 38(8):904–909.
Purcell S, Neale B, Todd-Brown K, Thomas L, Ferreira MA, Bender D, Maller J, SklarP, de Bakker PI, Daly MJ and others. 2007. PLINK: a tool set for whole-genomeassociation and population-based linkage analyses. Am J Hum Genet 81(3):559–575.
Rakyan VK, Down TA, Maslau S, Andrew T, Yang TP, Beyan H, Whittaker P, Mc-Cann OT, Finer S, Valdes AM and others. 2010. Human aging-associated DNAhypermethylation occurs preferentially at bivalent chromatin domains. GenomeRes 20(4):434–439.
Reinius LE, Acevedo N, Joerink M, Pershagen G, Dahlen SE, Greco D, Soderhall C,Scheynius A, Kere J. 2012. Differential DNA methylation in purified human bloodcells: implications for cell lineage and studies on disease susceptibility. PLoS One7(7):e41361.
Richards EJ. 2008. Population epigenetics. Curr Opin Genet Dev 18(2):221–226.Schalkwyk LC, Meaburn EL, Smith R, Dempster EL, Jeffries AR, Davies MN, Plomin R,
Mill J. 2010. Allelic skewing of DNA methylation is widespread across the genome.Am J Hum Genet 86(2):196–212.
Selamat SA, Chung BS, Girard L, Zhang W, Zhang Y, Campan M, Siegmund KD,Koss MN, Hagen JA, Lam WL and others. 2012. Genome-scale analysis of DNAmethylation in lung adenocarcinoma and integration with mRNA expression.Genome Res 22(7):1197–1211.
Shenker NS, Polidoro S, van Veldhoven K, Sacerdote C, Ricceri F, Birrell MA, BelvisiMG, Brown R, Vineis P, Flanagan JM. 2013. Epigenome-wide association study inthe European Prospective Investigation into Cancer and Nutrition (EPIC-Turin)identifies novel genetic loci associated with smoking. Human Mol Genet 22(5):843–851.
Smith AK, Almli LM, Mercer KB, Ressler KJ, Tylavsky FA, Conneely KN. 2013. Methy-lation quantitative trait loci (meQTLs) are consistently detected across ancestry,developmental stage, and tissue type. Submitted manuscript.
Sun YV, Smith AK, Conneely KN, Chang Q, Li W, Lazarus A, Smith JA, Almli LM,Binder EB, Klengel T and others. 2013. Epigenomic association analysis identi-fies smoking-related DNA methylation sites in African Americans. Human Genet132(9):1027–1037.
Terry MB, Ferris JS, Pilsner R, Flom JD, Tehranifar P, Santella RM, Gamble MV, SusserE. 2008. Genomic DNA methylation among women in a multiethnic New YorkCity birth cohort. Cancer Epidemiol Biomarkers Prev 17(9):2306–2310.
Teschendorff AE, Menon U, Gentry-Maharaj A, Ramus SJ, Weisenberger DJ, Shen H,Campan M, Noushmehr H, Bell CG, Maxwell AP and others. 2010. Age-dependentDNA methylation of genes that are suppressed in stem cells is a hallmark of cancer.Genome Res 20(4):440–446.
The International HapMap 3 Consortium, Altshuler DM, Gibbs RA, Peltonen L, Der-mitzakis E, Schaffner SF, Yu F, Bonnen PE, de Bakker PI, Deloukas P and others.2010. Integrating common and rare genetic variation in diverse human popula-tions. Nature 467(7311):52–58.
Wan ES, Qiu W, Baccarelli A, Carey VJ, Bacherman H, Rennard SI, Agusti A, AndersonW, Lomas DA, Demeo DL. 2012. Cigarette smoking behaviors and time since quit-ting are associated with differential DNA methylation across the human genome.Human Mol Genet 21(13):3073–3082.
Wong CC, Meaburn EL, Ronald A, Price TS, Jeffries AR, Schalkwyk LC, Plomin R, Mill J.2013. Methylomic analysis of monozygotic twins discordant for autism spectrumdisorder and related behavioural traits. Mol Psychiatry doi:10.1038/mp.2013.41.
Zhang D, Cheng L, Badner JA, Chen C, Chen Q, Luo W, Craig DW, Red-man M, Gershon ES, Liu C. 2010. Genetic control of individual differ-ences in gene-specific methylation in human brain. Am J Hum Genet 86(3):411–419.
Genetic Epidemiology, Vol. 38, No. 3, 231–241, 2014 241