PROJECT REPORT
on
A STUDY ON WORKING CAPITAL MANAGEMENT
BY
SAGAR P L
1NZ18MBA72
Submitted to
DEPARTMENT OF MANAGEMENT STUDIES
NEW HORIZON COLLEGE OF ENGINEERING,
OUTER RING ROAD, MARATHALLI,
BENGALURU
In partial fulfilment of the requirements for the award of the degree of
MASTER OF BUSINESS ADMINISTRATION
Under the guidance of
SANTOSH KUMAR S
PROFESSOR
2018 - 2020

CERTIFICATE
This is to certify that SAGAR P L bearing USN 1NZ18MBA72, is a bonafide student of Master of Business Administration course of the Institute BATCH 18, autonomous program, affiliated to Visvesvaraya Technological University, Belgaum. Project report on A STUDY ON WORKING CAPITAL MANAGEMENT is prepared by him under the guidance of SANTOSH KUMAR S, in partial fulfillment of requirements for the award of the degree of Master of Business Administration of Visvesvaraya Technological University, Belgaum Karnataka. Signature of Internal Guide Signature of HOD Principal
Name of the Examiners with affiliation Signature with date 1. External Examiner 2. Internal Examiner


4
DECLARATION
I, SAGAR P L, hereby declare that the project report on “A STUDY ON WORKING CAPITAL
MANAGEMENT” with reference to “EXIDE INDUSTRIES LIMITED” prepared by me under
the guidance of SANTOSH KUMAR S, faculty of M.B.A Department, New Horizon College
of Engineering.
I also declare that this project report is towards the partial fulfilment of the university
regulations for the award of the degree of Master of Business Administration by Visvesvaraya
Technological University, Belgaum.
I have undergone an industry project for a period of Twelve weeks. I further declare that this
report is based on the original study undertaken by me and has not been submitted for the award
of a degree/diploma from any other University / Institution.
Signature of Student
Place:
Date:

5
ACKNOWLEDGEMENT
The successful completion of the project would not have been possible without
the guidance and support of many people. I express my sincere gratitude to S H
KHAN, MANAGER-PLANT HR, EXIDE INDUSTRIES LIMITED,
BENGALURU, for allowing to do my project at EXIDE INDUSTRIES
LIMITED.
I thank the staff of EXIDE INDUSTRIES LIMITED, Bengaluru for their support
and guidance and helping me in completion of the report.
I am thankful to my internal guide SANTOSH KUMAR S, for his constant
support and inspiration throughout the project and invaluable suggestions,
guidance and also for providing valuable information.
Finally, I express my gratitude towards my parents and family for their
continuous support during the study.
SAGAR P L
1NZ18MBA72

6
TABLE OF CONTENTS
SL. NUMBER CONTENTS PAGE NUMBERS
1 Theoretical Background Of The Study 07
2 Industry Profile &Company Profile 17
3 Research and Methodology 45
4 Analysis And Interpretation Of Financial
Statements And Reports 48
5 Learning Experience- Findings, Suggestions And
Conclusion 86
6 Bibliography 89

7
CHAPTER 1
THEORETICAL BACKGROUND OF THE STUDY
WORKING CAPITAL MANAGEMENT
Working capital management is the process of identifying the financial strengths and weakness of the firm. It is done by establishing relationships between the items of financial statements viz., balance sheet and profit and loss account. Working capital management can be undertaken by management of the firm, viz., owners, creditors, investors and others.
Objectives of the working capital management
Analysis of financial statements may be made for a particular purpose in view:
1. To find out the financial stability and soundness of the business enterprise.
2. To assess and evaluate the earning capacity of the business
3. To estimate and evaluate the fixed assets, stock etc., of the concern.
4. To estimate and determine the possibilities of future growth of business.
5. To assess and evaluate the firm’s capacity and ability to repay short and long term loans.
Parties interested in working capital management:
The users of working capital management can be divided into two broad groups.
Internal users:
1. Financial executives
2. Top management
External users:
1. Investors
2. Creditor.
3. Workers
4. Customers
8
5. Government
6. Public
7. Researchers
Significance of working capital management
Working capital management serves the following purpose:
To know the operational efficiency of the business: The working capital management enables the management to find out the overall efficiency of the firm. This will enable the management to locate the weak Spots of the business and take necessary remedial action.
Help filling measuring the solvency of the firm: The working capital management helps the decision makers in taking appropriate decisions for strengthening the short-term as well as long-term solvency of the firm.
Comparison of past and present results: Financial statements of the previous years can be compared and the trend regarding various expenses, purchases, sales, gross profit and net profit can be ascertained.
Helps in measuring the profitability: Financial statements show the gross profit, & net profit.
Inter‐firm comparison: The working capital management makes it easy to make interfere comparison. This comparison can also be made for various time periods.
Bankruptcy and Failure: Financial statement analysis is significant tool in predicting the bankruptcy and the failure of the business enterprise. Financial statement analysis accomplishes this through the evaluation of the solvency position.
Helps in forecasting: The working capital management will help in assessing future development by making forecasts and preparing budgets.

9
METHODS OF ANALYSIS:
A financial analyst can adopt the following tools for analysis of the financial statements. These are also termed as methods of working capital management.
A. Comparative statement analysis
B. Common-size statement analysis
C. Trend analysis
D. Funds flow analysis
E. Ratio analysis
NATURE OF RATIO ANALYSIS
Ratio Analysis is a powerful tool of working capital management. A ratio is defined as "the indicated quotient of mathematical expression" and as "the relationship between two or more things". A ratio is used as benchmark for evaluating the financial position and performance of the firm. The relationship between two accounting figures, expressed mathematically, is known as a financial ratio.
Ratio helps to summarizes large quantities of financial data and to make qualitative judgment about the firm's financial performance. The persons interested in the analysis of financial statements can be grouped under three head owners (or) investors who are desired primarily a basis for estimating earning capacity. Creditors who are concerned primarily with Liquidity and ability to pay interest and redeem loan within a specified period. Management is interested in evolving analytical tools that will measure costs, efficiency, liquidity and profitability with a view to make intelligent decisions.
STANDARDS OF COMPARISON
The ratio analysis involves comparison for a useful interpretation of the financial statements. A single ratio in itself does not indicate favourable or unfavourable condition. It should be compared with some standard. Standards of comparison are:
1. Past Ratios
2. Competitor’s Ratios
3. Industry Ratios.
4. Projected Ratios
Past Ratio: Ratios calculated from the past financial statements of the same firm.

10
Competitor's Ratio: Ratios of some selected firms, especially the most progressive and successful competitor at the same point in time.
Industry Ratios: Ratios of the industry to which the firm belongs.
Projected Ratios: Ratios developed using the projected financial statements of the same firm.
TIME SERIES ANALYSIS
The easiest way to evaluate the performance of a firm is to compare its present ratios with past ratios. When financial ratios over a period of time are compared, it is known as the time series analysis or trend analysis.
It gives an indication of the direction of change and reflects whether the firm's financial performance has improved, deteriorated or remind constant over time.
CROSS SECTIONAL ANALYSIS
Another way to comparison is to compare ratios of one firm with some selected firms in the industry at the same point in time. This kind of comparison is known as the cross-sectional analysis. It is more useful to compare the firm's ratios with ratios of a few carefully selected competitors, who have similar operations.
INDUSTRY ANALYSIS
To determine the financial conditions and performance of a firm. Its ratio may be compared with average ratios of the industry of which the firm is a member. This type of analysis is known as industry analysis and also it helps to ascertain the financial standing and capability of the firm & other firms in the industry. Industry ratios are important standards in view of the fact that each industry has its characteristics which influence the financial and operating relationships.
TYPES OF RATIOS
Management is interested in evaluating every aspect of firm's performance. In view of the requirement of the various users of ratios, we may classify them into following four important categories:
1. Liquidity Ratio
2. Leverage Ratio
3. Activity Ratio
4. Profitability Ratio

11
Liquidity Ratio
It is essential for a firm to be able to meet its obligations as they become due. Liquidity Ratios help in establishing a relationship between cast and other current assets to current obligations to provide a quick measure of liquidity. A firm should ensure that it does not suffer from lack of liquidity and also that it does not have excess liquidity. A very high degree of liquidity is also bad, idle assets earn nothing.
The firm's funds will be unnecessarily tied up in current assets. Therefore it is necessary to strike a proper balance between high liquidity. Liquidity ratios can be divided into three types:
• Current Ratio
• Quick Ratio
• Cash Ratio
Current Ratio
Current ratio is an acceptable measure of firm’s short-term solvency Current assets includes cash within a year, such as marketable securities, debtors and inventors. Prepaid expenses are also included in current assets as they represent the payments that will not made by the firm in future. All obligations maturing within a year are included in current liabilities. These include creditors, bills payable, accrued expenses, short-term bank loan, income-tax liability in the current year. The current ratio is a measure of the firm's short term solvency. It indicated the availability of current assets in rupees for every one rupee of current liability.
Quick Ratio
Quick Ratio establishes a relationship between quick or liquid assets and current liabilities. An asset is liquid if it can be converted into cash immediately or reasonably soon without a loss of value. Cash is the most liquid asset, other assets that are considered to be relatively liquid asset and included in quick assets are debtors and bills receivables and marketable securities (temporary quoted investments).
Quick ratio is a more penetrating test of liquidity than the current ratio, yet it should be used cautiously. A company with a high value of quick ratio can suffer from the shortage of funds if it has slow- paying, doubtful and long duration outstanding debtors. A low quick ratio may really be prospering and paying its current obligation in time.
Cash Ratio
Cash is the most liquid asset; a financial analyst may examine Cash Ratio and its equivalent current liabilities. Cash and Bank balances and short-term marketable securities are the most liquid assets of a firm, financial analyst stays look at cash ratio. Indeed, one can argue that it is overly stringent. Lack of immediate cash may not matter if the firm stretch its payments or borrow money at short notice.

12
LEVERAGE RATIOS
Financial leverage refers to the use of debt finance while debt capital is a cheaper source of finance: it is also a riskier source of finance. It helps in assessing the risk arising from the use of debt capital. Two types of ratios are commonly used to analyze financial leverage.
1. Structural Ratios
2. Coverage ratios
Structural Ratios are based on the proportions of debt and equity in the financial structure of firm. Coverage Ratios shows the relationship between Debt Servicing, Commitments and the sources for meeting these burdens. The short-term creditors like bankers and suppliers of raw material are more concerned with the firm's current debt-paying ability. These ratios indicated mix of funds provided by owners and lenders. There should be an appropriate mix of Debt and owner's equity in financing the firm's assets. The process of magnifying the shareholder's return through the use of Debt is called "financial leverage" or "financial gearing" or "trading on equity". Leverage Ratios are calculated to measure the financial risk and the firm's ability of using Debt to share holder's advantage. Leverage Ratios can be divided into five types.
• Debt equity ratio.
• Debt ratio.
• Interest coverage ratio Proprietary ratio.
• Capital gearing ratio
Debt equity ratio
It indicates the relationship describing the lenders contribution for each rupee of the owner's contribution is called debt-equity ratio. Debt equity ratio is directly computed by dividing total debt by net worth. Lower the debt-equity ratio, higher the degree of protection. A debt-equity ratio of 2:1 is considered ideal.
The debt consists of all short term as well as long-term and equity consists of net worth plus preference capital plus Deferred Tax Liability.
Debt ratio
Several debt ratios may used to analyze the long-term solvency of a firm. The firm may be interested in knowing the proportion of the interest-bearing debt in the capital structure. It may, therefore, compute debt ratio by dividing total total-debt by capital employed on net assets. Total debt will include short and long-term borrowings from financial institutions, debentures/bonds, deferred payment arrangements for buying equipments, bank borrowings, public deposits and any other interest-bearing loan. Capital employed will include total debt net worth.

13
Interest Coverage Ratio
The interest coverage ratio or the time interest earned is used to test the firms’ debt servicing capacity. The interest coverage ratio is computed by dividing earnings before interest and taxes by interest charges. The interest coverage ratio shows the number of times the interest charges are covered by funds that are ordinarily available for their payment. We can calculate the interest average ratio as earnings before depreciation, interest and taxes divided by interest.
Proprietary ratio
The total shareholder's fund is compared with the total tangible assets of the company. This ratio indicates the general financial strength of concern. It is a test of the soundness of financial structure of the concern. The ratio is of great significance to creditors since it enables them to find out the proportion of share holders funds in the total investment of business.
Capital gearing ratio:
This ratio makes an analysis of capital structure of firm. The ratio shows relationship between equity share capital and the fixed cost bearing i.e., preference share capital and debentures.
ACTIVITY RATIOS
Turnover ratios also referred to as activity ratios or asset management ratios, measure how efficiently the assets are employed by a firm. These ratios are based on the relationship between the level of activity, represented by sales or cost of goods sold and levels of various assets. The improvement turnover ratios are inventory turnover, average collection period, receivable turn over, fixed assets turnover and total assets turnover. Activity ratios are employed to evaluate the efficiency with which the firm manages and utilize its assets. These ratios are also called turnover ratios because they indicate the speed with which assets
are being converted or turned over into sales. Activity ratios thus involve a relationship between sales and assets.
A proper balance between sales and assets generally reflects that asset utilization.
• Activity ratios are divided into four types:
• Total capital turnover ratio
• Working capital turnover ratio
• Fixed assets turnover ratio
• Stock turnover ratio

14
Total capital turnover ratio:
This ratio expresses relationship between the amounts invested in this assets and the resulting in terms of sales. This is calculated by dividing the net sales by total sales. The higher ratio means better utilization and vice-versa.
Some analysts like to compute the total assets turnover in addition to or instead of net assets turnover. This ratio shows the firm's ability in generating sales from all financial resources committed to total assets.
Working capital turnover ratio:
This ratio measures the relationship between working capital and sales.
The ratio shows the number of times the working capital results in sales. Working capital as usual is the excess of current assets over current liabilities. The following formula is used to measure the ratio:
Fixed asset turnover ratio:
The firm may which to know its efficiency of utilizing fixed assets and current assets separately. The use of depreciated value of fixed assets in computing the fixed assets turnover may render comparison of firm's performance over period or with other firms.
The ratio is supposed to measure the efficiency with which fixed assets employed a high ratio indicates a high degree of efficiency in asset utilization and a low ratio reflects inefficient use of assets. However, in interpreting this ratio, one caution should be borne in mind, when the fixed assets of firm are old and substantially depreciated the fixed assets turnover ratio tends to be high because the denominator of ratio is very low.
Stock turnover ratio
Stock turnover ratio indicates the efficiency of firm in producing and selling its product. It is calculated by dividing the cost of goods sold by the average stock. It measures how fast the inventory is moving through the firm and generating sales. The stock turnover ratio reflects the efficiency of inventory management. The higher the ratio, the more efficient the management of inventories and vice versa .However, this may not always be true. A high inventory turnover may be caused by a low level of inventory which may result if frequent stock outs and loss of sales and customer goodwill.
PROFITABILITY RATIOS
A company should earn profits to survive and grow over a long period of time. Profits are essential but it would be wrong to assume that every action initiated by management of a company should be aimed at maximizing profits. Profit is the difference between revenues and expenses over a period .Profit is the ultimate 'output' of a company and it will have no future if it fails to make sufficient profits. The financial manager should continuously evaluate the efficiency of company in terms of profits. The profitability ratios are calculated to measure the operating efficiency of company. Creditors want to get interest and repayment

15
of principal regularly. Owners want to get a required rate of return on their investment. Generally, two major types of profitability ratios are calculated:
•Profitability in relation to sales
•Profitability in relation to investment
Profitability Ratio can be divided into six types:
• Gross profit ratio
• Operating profit ratio
• Net profit ratio
• Return on investment
• Earns per share
• Operating expenses ratio
Gross profit ratio
First profitability ratio in relation to sales is the gross profit margin the gross profit margin reflects. The efficiency with which management produces each unit of product. This ratio indicates the average spread between the cost of goods sold and the sales revenue. A high gross profit margin is a sign of good management. A gross margin ratio may increase due to any of following factors: higher sales prices cost of goods sold remaining constant, lower cost of goods sold, sales prices remaining constant. A low gross profit margin may reflect higher cost of goods sold due to firm's inability to purchase raw materials at favourable terms, inefficient utilization of plant and machinery resulting in higher cost of production or due to fall in prices in market. This ratio shows the margin left after meeting manufacturing costs. It measures the efficiency of production as well as pricing. To analyse the factors underlying the variation in gross profit margin, the proportion of various elements of cost (Labour, materials and manufacturing overheads) to sale may studied in detail.
Operating profit ratio
This ratio expresses the relationship between operating profit and sales. It is worked out by dividing operating profit by net sales. With the help of this ratio, one can judge the managerial efficiency which may not be reflected in the net profit ratio.
Net profit ratio
Net profit is obtained when operating expenses, interest and taxes are subtracted from the gross profit. Net profit margin ratio established a relationship between n

16
et profit and sales and indicates management’s efficiency in manufacturing, administering and selling products. This ratio also indicates the firm's capacity to withstand adverse economic conditions. A firm with a high net margin ratio would be in an advantageous position to survive in the face of falling
Selling prices, rising costs of production or declining demand for product
This ratio shows the earning left for share holders as a percentage of net sales. It measures overall efficiency of production, administration, selling, financing. Pricing and tax management. Jointly considered, the gross and net profit margin ratios provide a valuable understanding of the cost and profit structure of the firm and enable the analyst to identify the sources of business efficiency / inefficiency.
Return on investment:
This is one of the most important profitability ratios. It indicates the relation of net profit with capital employed in business. Net profit for calculating return of investment will mean the net profit before interest, tax, and dividend. Capital employed means long term funds.
Earnings per share
This ratio is computed by earning available to equity share holders by the total amount of equity share outstanding. It reveals the amount of period earnings after taxes which occur to each equity share. This ratio is an important index because it indicates whether the wealth of each share holder on a per share basis as changed over the period.
Operating expenses ratio
It explains the changes in the profit margin ratio. A higher operating expenses ratio is unfavourable since it will leave a small amount of operating income to meet interest, dividends. Operating expenses ratio is a yardstick of operating efficiency, but it should be used cautiously. It is affected by a number of factors such as external uncontrollable factors, internal factors. This ratio is computed by dividing operating expenses by sales. Operating expenses equal cost of goods sold plus selling expenses and general administrative expenses by sales.
17
CHAPTER 2
INDUSTRY PROFILE AND COMPANY PROFILE
MANUGACTURING INDUSTRY OVERVIEW
Manufacturing industry refers to those industries which involve in the manufacturing and processing of items and indulge in either creation of new commodities or in value addition. The manufacturing industry accounts for a significant share of the industrial sector in developed countries. The final products can either serves as a finished good for sale to customers or as intermediate goods used in the production process.
EVOLUTION OF MANUFACTURING INDUSTRY
Manufacturing industries came into being with the occurrence of technological and socio-economic transformations in the Western countries in the 18th-19th century. This was widely known as industrial revolution. It began in Britain and replaced the labour intensive textile production with mechanization and use of fuels.
Working of manufacturing industry:
Manufacturing industries are the chief wealth producing sectors of an economy. These industries use various technologies and methods widely known as manufacturing process management. Manufacturing industries are broadly categorized into engineering industries, construction industries, electronics industries, chemical industries, energy industries, textile industries, food and beverage industries, metalworking industries, plastic industries, transport and telecommunication industries.
Manufacturing industries are important for an economy as they employ a huge share of the labour force and produce materials required by sectors of strategic importance such as national infrastructure and defence. However, not all manufacturing industries are beneficial to the nation as some of them generate negative externalities with huge social costs. The cost of letting such industries flourish may even exceed the benefits generated by them.
ANALYSIS OF MANUFACTURING INDUSTRY
It suggests that the manufacturing industry has served as the pivotal factor in the economic development of a country. The same applies for the United States Of America, whose economy has been growing rapidly owing to the successful manufacturing industry. Manufacturing industry analysis also indicates that the manufacturing industry provides employment to many thereby contributing to the gross domestic product and per capita income of the country. Approximately 75% of the engineers as well as the scientists get employed in the manufacturing industry as recorded by a manufacturing industry analysis.
18
The Census bureau categorizes a particular manufactured product depending on the primary goods produced by the manufacturing industry.
Statistical data showing the impact of the manufacturing industry on economy:
In the year 1992, the expenditure incurred on the research and development by the manufacturing establishments was USD$91.2 billion in the United States of America. Out of this Non Governmental manufacturing establishments registered 79.4% of USD$91.2 billion
18% of GDP or gross domestic product in the year 1993 was due to revenues generated by the manufacturing industry, established according to reports of manufacturing industry analysis.
46.4 was the result obtained in order to find out the number of workers employed in every establishment. This figure was registered in the year 1992.
15% of shipments in the manufacturing segment were due to the material industry.
Capital stock has registered a steady rise for all the sectors of the manufacturing industry since 1982.
Employment opportunity in the manufacturing industry has declined comparatively. Manufacturing industry analysis also suggests that in some countries like China, technological knowhow has to be developed. Despite the fact that China is ranked fourth in the manufacturing productivity, due to technological lacunae, it is not being able to compete in the world market. Also needed are professionals well versed in the technological knowhow.
BATTERY MANUFACTURING INDUSTRY PROFILE
The Indian storage batteries market is approximately estimated at US$ 500 million with the automotive batteries segment 60 to 70 percent of the overall market value. In terms of volumes, the overall consumption of the automotive batteries could be around 6.3 million units with the 40 QE segment comprising around 1.2 to 1.3 million units per annum, Various batteries (clockwise from bottom left): two 9-volt, two AA, one D, a handheld ham radio battery, a cordless phone battery, a camcorder battery, one C, and three AAA.
There are two types of batteries, primary (disposable) and secondary (rechargeable), both of which convert chemical energy to electrical energy. Primary batteries can only be used once because they use up their chemicals in an irreversible reaction. Secondary batteries can be recharged because the chemical reactions they use are reversible; they are recharged by running a charging current through the battery, but in the opposite direction of the discharge current. Secondary, also called rechargeable batteries can be charged and discharged many times before wearing out. After weaning out some of the batteries can be recycled.

19
ABOUT BATTERY
A battery is perhaps the only gift of science where electric is stored by means of elector chemical potentials guided by electro comical reaction. Chemical reaction initiated by electricity. Which take place with the means of electron exchange between the reactions, as and when required the stored energy can be counted back to electro chemical reaction. In certain cases the electrical chemical reactions guiding the energy transformation is not reversible. Such batteries are called ordinary cells. Where the electro chemical reaction guiding energy transformation is reversible hence they can be reused through only after outing a required amount of electric energy once it gets exhausted. These batteries are called secondary batteries.
BATTERY HISTORY
A battery, which is actually an electric cell, is a device that produces electricity from a chemical reaction. Strictly speaking, a battery consists of two or more cells connected in series or parallel, but the term is generally used for a single cell. A cell consists of a negative electrode; an electrolyte, which conducts ions; a separator, also an ion conductor; and a positive electrode.
TIMELINE OF BATTERY HISTORY
1748 - Benjamin Franklin first coined the term "battery" to describe an array of charged glass plates.
1780 to 1786 - Luigi Galvani demonstrated what we now understand to be the electrical basis of nerve impulses and provided the cornerstone of research for later inventors like Volta.
1800 - Alessandro Volta invented the voltaic pile and discovered the first practical method of generating electricity. Constructed of alternating discs of zinc and copper with pieces of cardboard soiled in between the metals, the voltaic pile produced electrical current. The metallic conducting; - arc was used to carry the electricity over a greater distance. Alessandro Volta's voltaic pile was the first "wet cell battery" that produced a reliable, steady current of electricity.
1836 - Englishman, John F. Daniel invented the Daniel Cell that used two electrolytes: copper sulfate and zinc sulfate. The Daniel Cell was somewhat safer and less corrosive then the Volta cell.
1839 - William Robert Grove developed the first fuel cell, which produced electrical by combining hydrogen and oxygen.
20
1839 to 1842 - Inventors created improvements to batteries that used liquid electrodes to produce electricity. Bunsen (1842) and Grove (1839) invented the most successful.
1859 - French inventor, Gaston Planet developed the first practical storage lead-acid battery that could be recharged (secondary battery). This type of battery is
1899 - Wald mar Jenner invented the first nickel-cadmium rechargeable battery.
1901 - Thomas Alva Edison invented the alkaline storage battery. Thomas Edison's alkaline cell had iron as the anode material (-) and nickelic oxide as the cathode material (+).
1949 - Lew Urry developed the small alkaline battery in 1949. The inventor was working for the Eveready Battery Co. at their research laboratory in Parma, Ohio. Alkaline batteries last five to eight times as long as zinc-carbon cells, their predecessors.
1964 - Duracell was incorporated.
COMPANY PROFILE
INTRODUCTION
Incorporated in January 1947.
EXIDE is Asia’s largest exporter of batteries.
A veteran with 52 years of experience.
It has seven manufacturing units in India and five units apart from India.
It has corporate alumni of chloride group PLC, UK.
It provides 4.2 million SLI automotive batteries and 3 million industrial batteries with 300Ah capacity.
The types of batteries manufactured by EXIDE are:
Automotive Batteries
Industrial Batteries
Submarine batteries
The two main manufacturing units of EXIDE which are present in all its manufacturing plants are:
Automotive
VRLA (industrial)
It has products which has capacity ranging from 2.5Ah to 10,000Ah and more.

21
EXIDE also acquired the industrial/ manufacturing units of standard batteries ltd located at Taloja & kanchurmarg (Maharashtra), Guindy (Tamil Nadu), and plant at Ahmednagar (Maharashtra) from Cosepa Fiscal industries ltd as a going concern.
The manufacturing plants of EXIDE in India are:
Shamnagar (West Bengal)
Chinchwad (Pune)
Haldia (West Bengal)
Hosur (Tamil Nadu)
Talia (Maharashtra)
Ahmednagar (Maharashtra)
Bawal (Haryana)
The company’s Submarine batteries is mainly manufactured in the Pune manufacturing plant
It is the first company to design battery powered electrical boat and maintenance free batteries, traction batteries for wheel chairs and flat plate batteries for automated guided vehicles.
EXIDE today is a Rs 3606 cores power storage company.

22
HISTORY:
1916- Chloride Electric Storage Co. (CESCO) UK sets up trading operations in India as an import house.
1946- First factory set up in Shamnagar, West Bengal.
1947- Incorporated as Associated Battery Makers (Eastern) Limited on 31 January 1947 under the Companies Act.
1947- Incorporated Chloride International Limited (previously Exide Products Limited)
2000- Acquisition of 100% stake in Chloride Batteries S E Asia Pvt Ltd., Singapore and 49% stake in Associated Battery Manufacturers (Ceylon) Limited, Sri Lanka.
2003- Commissioned plant at Bawal, Haryana
2003- New joint venture in UK, ESPEX, with 51% holding.
2004- Associated Battery Manufacturers (Ceylon) Limited, Sri Lanka became a subsidiary consequent to acquiring further 12.50% Equity holding.
2005- Investment in 50% shareholding of ING VYSYA Life Insurance Company Limited
2007- Caldyne Automatics Ltd becomes 100% subsidiary consequent to acquiring the balance 49% shareholding.
2007- Investment with 26% shareholding in CEIL Motive Power Pty Ltd. A Joint Venture in Australia.
2007- Acquired 100% stake in Tandon Metals Ltd.
2008- Acquired 51% stake in Lead Age Alloys India Ltd.
2009- Divestment of shareholding in CEIL Motive Power Pty Ltd.
2012- Acquisition of Inverter manufacturing facility at Roorkee, Uttarakhand
2012- Technical Collaboration with East Penn Manufacturing Co., USA
2012- Acquisition of second Inverter manufacturing facility at Haridwar, Uttarakhand.
2012- Acquisition of balance 49% shares in ESPEX Batteries Limited, UK.
2013- Acquisition of remaining 26% shares of ING VYSYA Life Insurance Company adding a total of 100% stake.
2014- ING VYSYA renamed as “EXIDE LIFE INSURANCE COMPANY LTD.

23
PRESENT STATUS
Largest manufacturers and exporter of batteries in Asia.
Developed vast range of batteries through research and developments and has number of patents to its name
Manufacturing specific batteries for specific applications that tough the daily lives of millions of people and costumers of India
Thus justifies the slogan “India moves on EXIDE”
WHY EXIDE INDIA?
1) CLAIM LEADERSHIP
EXIDE is a dominant player in the industrial battery segment. The company exports batteries which have captured niches in south East Asian and European markets.
2) GLOBAL QUALITY
Developed and produced accordingly to international standards and ISO9001, 14001 and ISO/ TS- 16949.
Longer warranty time.
Lower total cost of ownership.
24
3) MANUFACTURING STRENGTH
The only company with multi locational manufacturing units spread across country and equipped with words largest and most advanced machineries.
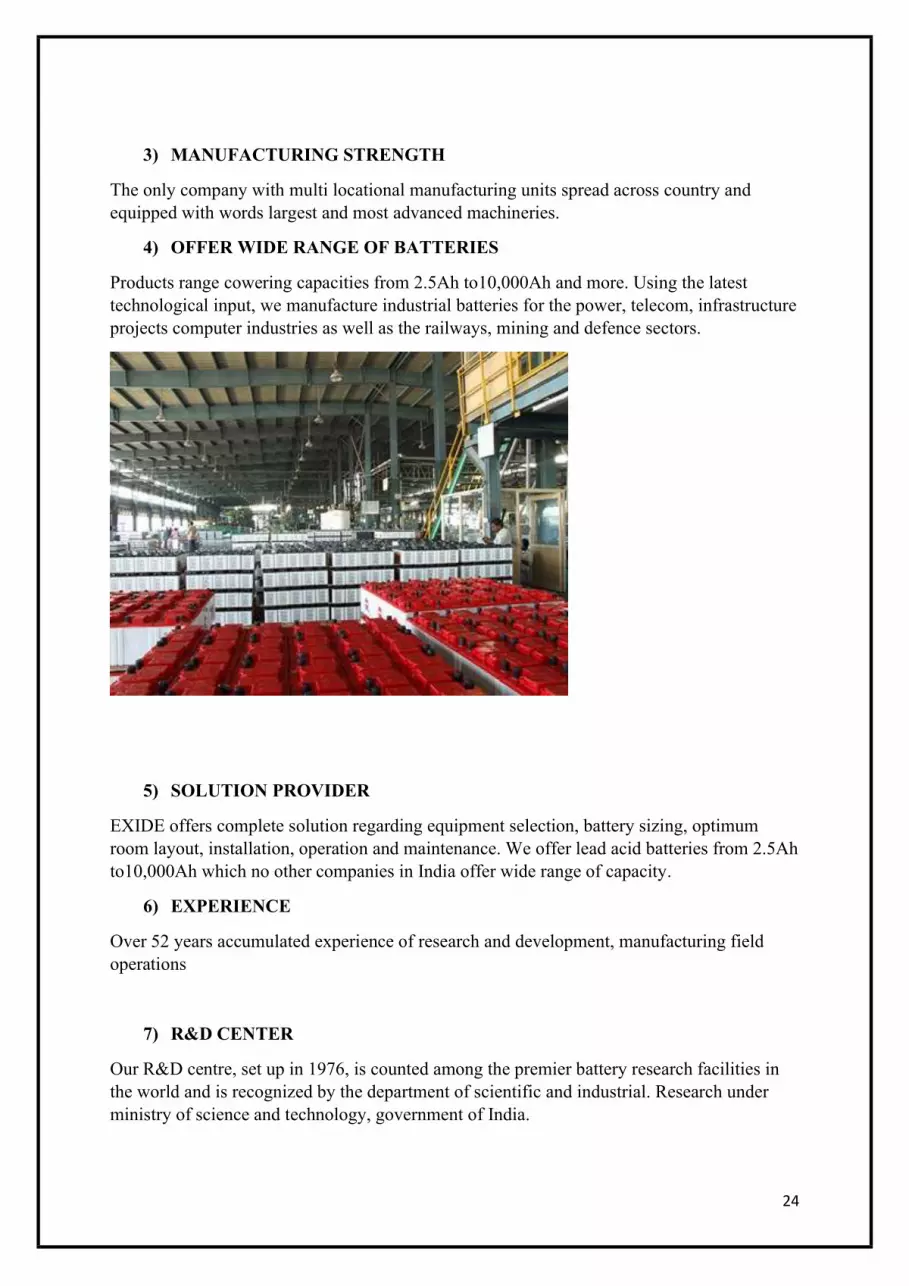
4) OFFER WIDE RANGE OF BATTERIES
Products range cowering capacities from 2.5Ah to10,000Ah and more. Using the latest technological input, we manufacture industrial batteries for the power, telecom, infrastructure projects computer industries as well as the railways, mining and defence sectors.
5) SOLUTION PROVIDER
EXIDE offers complete solution regarding equipment selection, battery sizing, optimum room layout, installation, operation and maintenance. We offer lead acid batteries from 2.5Ah to10,000Ah which no other companies in India offer wide range of capacity.
6) EXPERIENCE
Over 52 years accumulated experience of research and development, manufacturing field operations
7) R&D CENTER
Our R&D centre, set up in 1976, is counted among the premier battery research facilities in the world and is recognized by the department of scientific and industrial. Research under ministry of science and technology, government of India.

25
8) SAFETY CONSCIOUS
Underwriters laboratories Inc. USA certifications for the products and available on request.
MANUFACTURING PLANTS OF EXIDE
MANUFACTURING PLANTS
STATE ESTABLISHED YEAR
Shamnagar
Chinchwad
Haldia
Hosur
West Bengal
Pune
West Bengal
Tamil Nadu
1946
1969
1981
1997

26
Taloja
Ahmednagar
Bawal
Maharashtra
Maharashtra
Haryana
1998
1998
2003
EXECUTIVE COMMITTEE
Mr. G. Chatterjee
Mr. A. K. Mukherjee
Mr. Nadeem Kazim
Mr. Subir Chakraborty
Mr. Arun Mittal
Mr. Jitendra Kumar
Mr. Achim Luelsdorf
Mr. Arnab Saha
BOARD OF DIRECTORS
Mr. R. G. Kapadia, Chairman & Independent Director
Mr. R. B. Raheja ,Vice-Chairman & Non-Executive Director
Mr. P. K. Kataky, Managing Director & Chief Executive Officer (till April 30, 2016)
Mr. G. Chatterjee, Managing Director & Chief Executive Officer (w.e.f May 01, 2016)
Mr. A. K. Mukherjee, Director- Finance & Chief Financial Officer
Mr. Nadeem Kazim, Director-HR & Personnel
Mr. Subir Chakraborty, Director-Automotive
Mr. Arun Mittal, Director-Industrial (i.e. May 01, 2016)
Mr. Vijay Aggarwal, Independent Director
Ms. Mona N. Desai, Independent Director
Mr. Sudhir Chand, Independent Director
Mr. Bharat D. Shah, Independent Director
Mr. Nawshir H. Mirza, Independent Director

27
FACTORY PROFILE
Fourth factory
Established in 20th may, 1996
It manufactures two type of batteries
Automotive batteries
Industrial batteries (VRLA)
Manufacturing and operation started on June 1997
Floor space: 50,000 sq.
Industrial plant
VRLA plant inauguration- April 1997
VRLA commercial production- June 1997
ISO 9001 certification- October 1998
UL certification- December 2000
Automotive plant
Auto project commenced- October 1997
Auto plant inauguration- July 1998
Auto new plant project started- February 2000
New plant inauguration- December 2000

28
NATURE OF BUSINESS CARRIED
Exide HOSUR plant is the fourth factory for Exide industry with a turnover of 6900 crores in the year 2015-16. It is found in 1997.It has total land area of 74.5 of which 42% is green zone. HOSUR Exide plant is the more productive unit. It has been the two productive plants like Auto and VRLA type batteries.
Auto plant batteries are used for car, truck, and tractor.
VRLA plant batteries are used for railways, ship.
Automotive Batteries
In the domestic market, the Company sells its products under EXIDE, SF, SONIC and Standard Furukawa Brands. ‘EXIDE’ and ‘SF” are its flagship brands. In the international market the products are sold mainly under DYNEX, INDEX & SONIC brands. The Company supplies batteries to almost all the car and two-wheeler manufacturers in the country.
The Company has a market share of 72% in case of Automotive OEM and 70% in case of Organized Retail. The Company also manufactures submarine batteries
Industrial Batteries
The Company designs and manufacture its industrial batteries in a wide range from 2.5 Ah to 20,600 Ah in conventional flooded and Valve Regulated Lead Acid (VRLA) design. In domestic market, the Company sell its products mainly under EXIDE, INDEX, SF, CEIL & POWER SAFE brands and in the international markets mainly under CEIL, CHLORIDE and INDEX brands. Lead acid and Nickel-Cadmium batteries.
Submarine Batteries
The Company also manufactures high-end submarine batteries (Type 1, 2 & 3). The Company manufactures two to three submarine batteries a year to meet the country’s defence requirements. The Company is one of the five companies in the World which has the capability to make submarine batteries for both Russian and German types. With the government’s permission, in recent years, the Company has exported to Algeria
EXIDE HOSUR- DREAM
To become a formidable global enterprise through manufacturing excellence.
FOCUS OF EXIDE- HOSUR
Quality

29
Productivity
Cost
Delivery
Safety and cleaner environment
Highly motivated team
Fast response (before and after sales)
Long lasting term costumer relationship
VISION
Providing credible value addition to customers, employees and shareholders while simultaneously being recognized by society as a responsible corporate citizen. In addition, achieving operational excellence while addressing and taking steps towards environmental protection.
MISSION
Strive to carefully balance the interest of all stakeholders; to fulfil aspirations of the employees and to passionately pursue excellence without deviating from our core values.
CORE VALUES
Customer Orientation
Personal Integrity and Commitment
Teamwork and Mutual Support
Employee Development and Involvement
Striving for Excellence
Management by Processes and Facts
Responsible Corporate Citizenship
OBJECTIVES AND GOALS OF THE COMPANY
To modernize , upgrade and improve facilities or higher production and productivity
To achieve better Quality in Products.
To Strengthen the Marketing Organization to effectively Compete in National and international markets.

30
AWARDS/ CERTIFICATES AND RECOGNITION
Exide wins CFO of the year award in automotive and auto-ancillary category from CNBC-TV18
Frost & Sullivan Sustainability 4.0 Awards - 2016
WORK FLOW MODEL

31
PRODUCTION DEPARTMENT PRINCIPLE
“TO ACHIEVE ZERO DEFECTS”
In production area they are using many process to produce a battery, some process are grid casting, small parts casting, assembling the parts, acid filling, heat sealing, pole bearing, air leakage testing & charging and testing.
BRIEF OUTLINE OF THE PROCESS OF MANUFACTURE OF VALUE REGULATED LEAD ACID BATTERIES AND the basic raw material for manufacturing a lead acid battery &AUTOMOTIVE BATTERIES.

32
Automotive battery (a captive rechargeable source of energy) is lead. The essential steps for manufacture are as follows.
QUALITY POLICY OF THE COMPANY
The aim of the company is to always provide satisfaction to customers.
The company will develop design, produce and market products and services that cater continuously to the needs and expectation of customer and succeed in gaining/retaining a competitive edge.
A quality system meeting international standards will be implemented and maintained.
T P M POLICY
The members of Exide Industrial Limited in our pursuit of excellence and customer satisfaction are committed to achieve optimum utilization of all available resources by implementation of total productive maintenance
AIM OF ORGANIZATION
1. Improve the overall equipment efficiency by eliminating all losses.
Strive for zero break downs, zero defects and zero accidents.
2. Train, involve and empower people.
3. Create a safe and clean working environment.

33
ENVIRONMENT POLICY
We, the member of Exide Industries Limited., in the pursuit of core value of responsible corporate citizenship are committed to the issues addressed in the policy at all our locations during the marketing, design, manufacture sales and after sales support of lead – acid batteries.
It is the policy of the company to:
1. Minimize the adverse impact of our activities, products and service by implementing an environmental management system.
2. Prevent pollution through waste minimization at source, recovery / treatment of emission and releases conservation of energy, recycling & optimum use of resources.
3. Continuously improve our environmental performance through setting and reviewing and associate objectives and targets and periodic evaluation.
PRODUCTS AND SERVICE PROFILE
1. Automotive batteries For cars, Jeeps and commercial vehicles,
Passenger cars, two wheelers to tractors,
2. Heavy duty batteries For trucks and tractors
3. Light weight batteries For wireless transmission batteries
4. Transaction batteries For material handling equipment
5. Train lighting cells For railway coaches
6. Stationary batteries For telecommunications, telephone, Emergency lighting

34
Lead acid storage for automobile, motorcycle, genets, trawlers, VLRA, industrial stand by, motive power, submarines (2.5 Ah to 12600 Ah)
SPECIAL FEATURES
Maintenance free
Easy handling easy installation
Ready to use
Long service life
Excellent charge retention and recovery ability
High reliability
PRODUCT PROFILE
Types of batteries produced in VRLA plant
SL.NO Type Voltage Ampere hour
Customer Car type
1 4AH/6V 6V 4Ah BPL Lantern
2 4AH/6VR 6V 4Ah BPL Lantern
3 5AH/12V 12V 4.5Ah APC UPS
4 4.5H/12V 12V 7Ah APC UPS
5 7AH 12V 7Ah APC UPS
6 9AHR 12V 9Ah APC UPS
7 9AHR 12V 10Ah APC UPS
8 10AH 12V 10Ah APC UPS
9 10AHR 12V 10Ah APC UPS
7. Submarine batteries
For defence Requirements Company Manufacturers, two or three submarine batteries a year, for new generation Submarine to the Indian navy

35
10 12AH 12V 12Ah APC UPS
11 12AHR 12V 12Ah APC UPS
Type of Batteries products in Auto plant
SL.NO Type voltage Ampere hour Customer
1 38B20L(MF) 12.40V 35 MARKET
2 38B20R(MF) 12.40V 35 MARKET
3 55B24L(MF) 12.40V 45 HYUNDAI
4 55B24R(MF) 12.40V 45 MARUTHI
5 95D31L(MF) 12.40V 80 HM LANCER
6 95D31R(MF) 12.40V 80 HM LANCER
7 MF50Z 12.40V 60 MARKET
8 MF70Z 12.40V 75 ASHOKA LYLAND
9 MF75T 12.40V 75 MARKET
10 MF88T 12.40V 88 MARKET
36
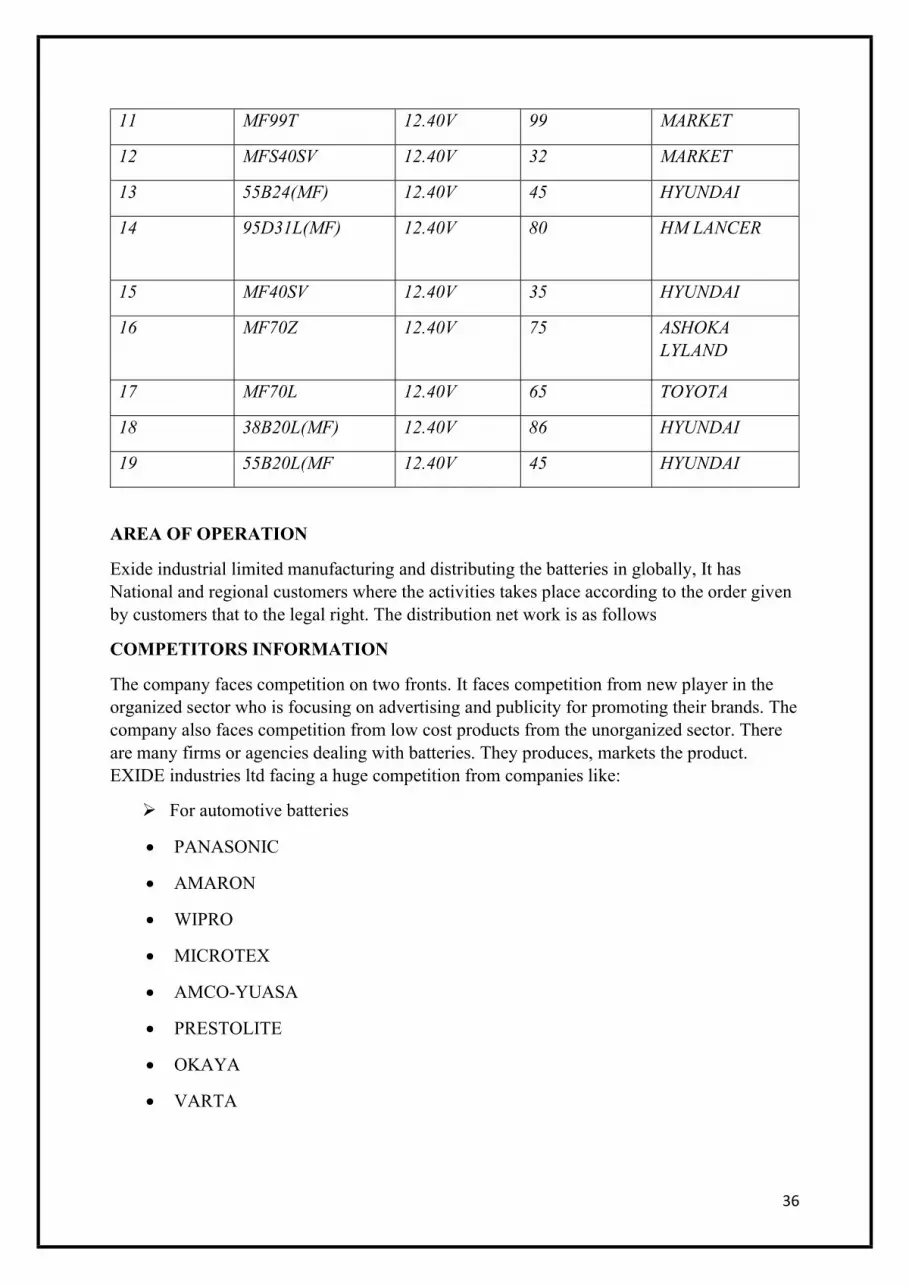
11 MF99T 12.40V 99 MARKET
12 MFS40SV 12.40V 32 MARKET
13 55B24(MF) 12.40V 45 HYUNDAI
14 95D31L(MF) 12.40V 80 HM LANCER
15 MF40SV 12.40V 35 HYUNDAI
16 MF70Z 12.40V 75 ASHOKA LYLAND
17 MF70L 12.40V 65 TOYOTA
18 38B20L(MF) 12.40V 86 HYUNDAI
19 55B20L(MF 12.40V 45 HYUNDAI
AREA OF OPERATION
Exide industrial limited manufacturing and distributing the batteries in globally, It has National and regional customers where the activities takes place according to the order given by customers that to the legal right. The distribution net work is as follows
COMPETITORS INFORMATION
The company faces competition on two fronts. It faces competition from new player in the organized sector who is focusing on advertising and publicity for promoting their brands. The company also faces competition from low cost products from the unorganized sector. There are many firms or agencies dealing with batteries. They produces, markets the product. EXIDE industries ltd facing a huge competition from companies like:
For automotive batteries
PANASONIC
AMARON
WIPRO
MICROTEX
AMCO-YUASA
PRESTOLITE
OKAYA
VARTA
37
For industrial batteries
AMRAJA
HBL
STAR
NED ENERGY SYSTEM
KIRL OSKAR
PANASONIC
BB-CHINA
ROCKET-KOREA
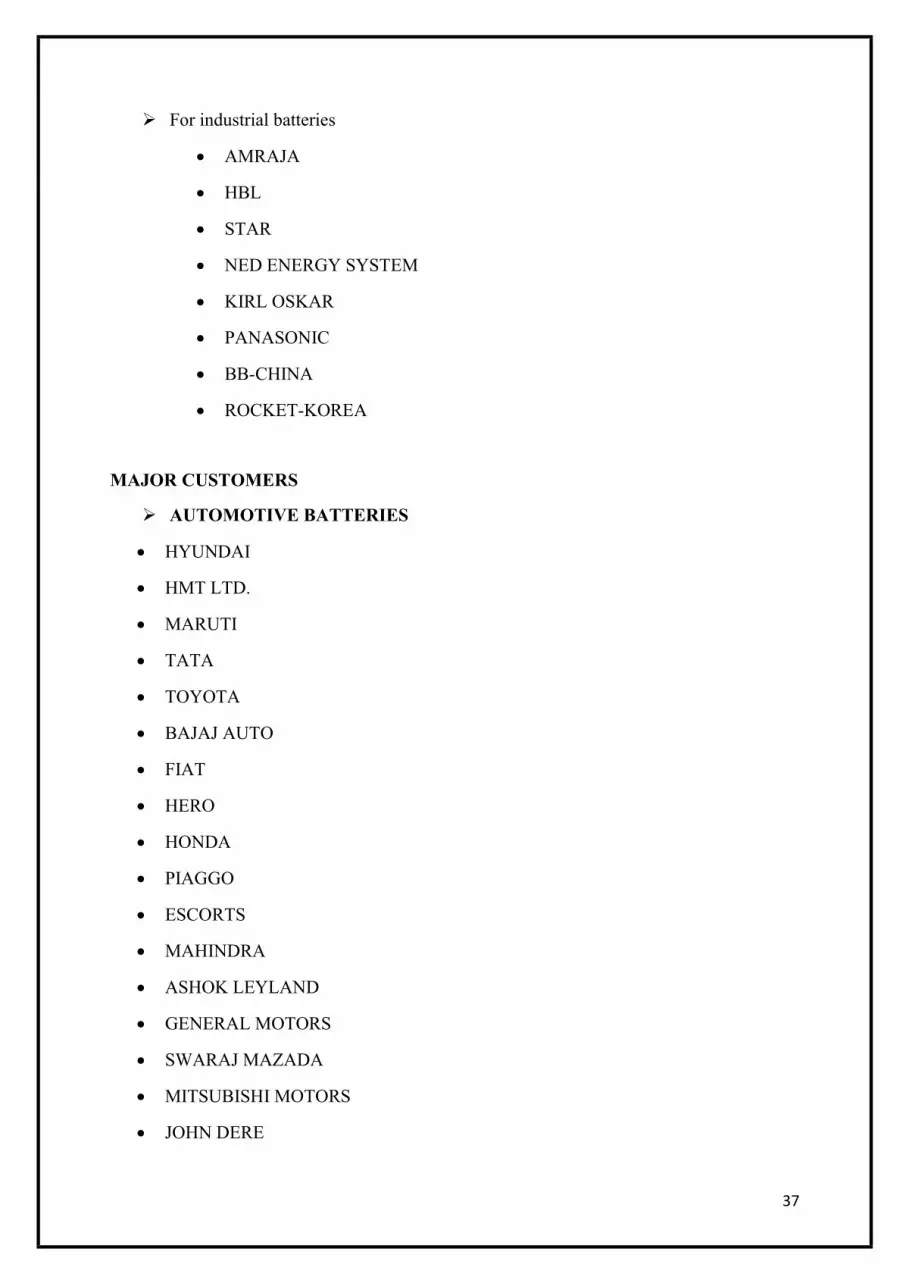
MAJOR CUSTOMERS
AUTOMOTIVE BATTERIES
HYUNDAI
HMT LTD.
MARUTI
TATA
TOYOTA
BAJAJ AUTO
FIAT
HERO
HONDA
PIAGGO
ESCORTS
MAHINDRA
ASHOK LEYLAND
GENERAL MOTORS
SWARAJ MAZADA
MITSUBISHI MOTORS
JOHN DERE
38
EICHER
MNC’S
INDUSTRIAL BATTERIES
MOTOROLA
ERICSSON
EMERSON
SIEMENS
DUBAS
BHEL
BSNL
VSNL
BEL
NTPC
GAIL
ABB
GODREJ
KPCL
INDIAL RAILWAYS
LUCENT TECHNOLOGY
TVS ELECTRONICS
BRANDS OF EXIDE
CHLORIDE
INDEX
DYNEX
Standard Furukawa(sf sonic)
JUPITER
CONREX
CHAMPION
LITTLE CHAMP

39
BOSS
INFRASTRECTURAL FACILITIES
The Exide has eight manufacturing plants producing world class products. Exide factories are located strategically around the country to provide logistic support for its production of over five million batteries per annum.
A technology tie up with Shin Kobe the makers of world class Hitachi VRLA batteries has given Exide the technological edge in maintenance free catteries. Other strategic technology agreement with Furukawa, Japan and Oldham, U, K. has given Exide competitive edge in proving the most reliable solutions for packaged power.
Environmental policy
Safety measures facilities
Medical facilities
Effluents training
Transportation facilities
Canteen facilities
FUTURE GROWTH AND PROSPECTUS
To further expand the business to other regions of Karnataka, Tamil Nadu and Andhra Pradesh.
To set up a sophisticated research and development so that the company may have its own new styles and designs of products that suits the modern fast moving life style.
Objectives and Goals of Company
To modernize , upgrade and improve facilities or higher production and productivity
To achieve better Quality in Products.
To Strengthen the Marketing Organization to effectively Compete in National and international markets.
To get ISO certifications
To maintain and developed highly motivated human Resources to achieve Professional competence and ensure career development of its work force.
To maintain Market Shares in Industry.
ORGANIZATIONAL STRUCTURE

40
SYSTEM
Procedure and process such as information system manufacturing process of budgeting and control process.
Systematic doing day to day work.
All the information catching on SAP.
Production and planning improvement.
EXECUTIVE CHAIRMAN
M D & CEO
DIRECTOR (INDUSTRIAL)
CHIEF OPERATING MANAGER
PRODUCTION
AUTOMOTIVE
PRODUCTION
INDUSTRIAL
PERSONNEL
ACCOUNTS
MATERIAL
CUSTOMER SUPPORT
SERVICE
HEAD
PRODUCTION
AUTOMOTIVE
HEAD
PRODUCTION
INDUSTRIAL
HEAD
ACCOUNTS
HEAD
MATERIAL
HEAD CUSTOMER
SUPPORT SERVICE
HEAD
PERSONNEL
ASSISTANT
MANAGER
MANAGER
ASSISTANT
MANAGER
ASSISTANT
MANAGER
ASSITTMANAGE
R
ASSISTANT
MANAGER
ASSISTANT
MANAGER
MANAGER

41
Accounting procedure:
Maintenance of record as per the accounting standards is maintained.
Ensuring correct & proper material accounting in & out of the factory.
Pay roll accounting.
Creditors bill passing &all payments.
Stock transfer &direct sales invoicing.
Product costing.
Budgeting & budgetary controls.
Fixed assets accounting.
STYLE
Democratic style of industry.
Management style is vertical style.
Democratic style
Here leadership style is democratic because all the heads of departments will have meeting daily so all takes decision. So it is called as democratic style and suggestion committee takes suggestions
Management style
TOP
LEVEL
MIDDLE LEVEL
MANAGEMENT
LOWER LEVEL
MANAGEMENT

42
STAFF
The people in the enterprise and their socialization into the organization.
Roles & Responsibilities of Employees
It is the responsibility of every employee’s to perform work in safe manner.
Suggestion for improvement.
Suggestion for poke – yoke techniques.
Short & separate hazardous wastes.
SHARED VALUE
Fundamental axioms that organization believes in and people respect and work towards. Core values also set the tone of the organization culture the core value of our organization are given bellows:
Customer orientation.
Personal integrity and commitment.
Team work and mutual support.
People development and involvement.
Striving for excellence.
Management by processes and facts.
SKILLS
Technical skill requirement: ITI, Diploma, Mechanical engineers
Nontechnical skill requirement: MBA at top management, BBM & B.com at operational level
CSR ACTIVITIES OF EXIDE
eradicating hunger, poverty and malnutrition, (promoting health care including preventive health care) and sanitation including contribution to the Swach Bharat Kosh set-up by the Central Government for the promotion of sanitation and making available safe drinking water
Castes, the Scheduled Tribes, other backward classes, minorities and women
Contribution or funds provided to technology incubators located within academic institutions which are approved by the Central Government
Rural development projects

43
Any other projects or activities as may be approved by the Central Government pursuant to section 135 of the Companies Act, 2013, from time to time
SWOT ANALYSIS
S-Strengths:
EXIDE is a super brand
It has wide distribution network
Appropriate infrastructure for condition of training
Partnership with various technical & management institution for providing a continuous supply of fresh graduate
Streamlined system of recruitment
Providing the necessary welfare facilities for the employees in the comfort zone & increasing the retention level of the employees
IR/LR relation very conductive for the smooth functioning of the unit
W-Weakness:
Difficult to change to an alternative line production with the existing machinery
High employee turnover
Lack of clarity and transparency in upward/down ward communication.
Evaluation of effectiveness of training programmers being imparted.
No clear job description for various levels resulting in dual reporting relationships.
Performance appraisal system: its approach, effectiveness acceptability.
Effectiveness of organization health study.

44
O-Opportunities:
Opportunity to expand globally
To have in-house online dilution plant for sulphuric acid. This will not only reduce the cost of acid procurement but also will help us to consume the recovered acidic water from plate washing thereby achieving reduction in effluent generation.
To convert the accumulated calcium sulphate solid sludge to useful products in construction industry with the help of IISc Bangalore.
Further reduction in tank formation by increasing the jar formation of VRLA batteries.
To start using rain water in process after necessary treatment. At present we are this only for the green belt development. Storage caexidity of rain water reservoir is 30000KL.
To extend green belt in additional to hectares.
T-Threats:
Fast changing consumer’s tastes & preferences
Liberalization policy of the government of India
Fast changing market conditions
High costs price in view of overheads
Importing components at the low cost from china
Increasing competition (Nationality & Globally)
Unfavourable duty structure
Slow growth rate in profits expected.

45
CHAPTER 3
RESEARCH AND METHODOLOGY
NEED OF THE STUDY
The study enables us to have access to various facts of the organization. It helps in understanding the needs for the importance and advantage of materials in the organization, the study also helps to exposure our minds to the integrated materials management the various procedures, methods and technique adopted by the organization.
The study provides knowledge about how the theoretical aspects are put in the organization.
OBJECTIVES OF STUDY
To analyze the profitability position of the company.
To assess the return on investment.
To analyze the asset turnover ratio.
To determine the solvency position of company.
LIMITATIONS
• The study was limited to only FIVE years Financial Data.

46
•The study is purely based on secondary data which were taken primarily from Published annual reports of EXIDE INDUSTRIES LTD.
•The ratio is calculated from past financial statements and these are not indicators of future.
•The study is based on only on the past records.
• Non availability of required data to analysis the performance.
•The short span of the time provided also one of limitations.
Research Methodology:
Research is designed as a systematic, gathering recording and analysis of data about problem relating to any particular field.
It determines strength reliability and accuracy of the project.
Research Design:
Research design pertains to the great research approach or strategy adopted for a particular project. A research project has to be conducted making sure that the data is collected adequately and economically.
The study used Descriptive research design for the purpose of getting an insight over the issue. It is to provide an accurate picture of some aspects of market environment. Descriptive research is used when the objective is to provide systematic description that is as factual and accurate as possible.
Method of data collection:
Secondary data - Through the internet and published data.
In view of the objects of the study listed above an exploratory research design has been adopted. Exploratory research is one which is largely interprets and already available information and it lays particular emphasis on analysis and interpretation of the existing and available information.
•To know the financial status of the company.

47
•To know the credit worthiness of the company.
•To offer suggestions based on research finding.

48
CHAPTER 4
DATA ANALYSIS AND INTERPRETATION
Schedule of changes in working capital:
As the study is confined to working capital management more attention is given towards preparation of schedule of changes in working capital. Schedule of changes in working capital is a statement prepared with the help of current account balances appearing in Balance sheet of two dates increase or decrease in the values of current accounts is noted and its effect on working capital is ascertained.
STATEMENT OF CHANGES IN WORKING CAPITAL OF 2015-16&2016-17
PARTICULARS 2015-16
2016-17 STATEMENT OF CHANGES IN WORKING CAPITAL
INCREASE DECREASE
A. CURRENT ASSETS
Current investment
inventories
trade receivables
cash and cash equivalents
short term loans and advances
other current assets
649.07
1160.71
426.05
62.79
131.33
0.21
324.68
1407.39
591.81
220.51
63.17
782.61
324.39
346.68
165.76
157.72
68.16
782.4
TOTAL CURRENT ASSETS (A)
2430.16 3390.17 1352.56 392.55

49
B. CURRENT LIABILITIES
Short term borrowings
Trade payables
Other current liabilities
Short term provisions
24.52
689.82
244.75
115.82
48.61
995.39
593.04
183.24
24.09
305.57
348.29
67.42
TOTAL CURRENT LIABILITIES (B)
1074.91 1820.28 745.37
NET WORKING CAPITAL (A-B)
1355.25 1569.89 607.19 392.55
NET INCREASE IN WORKING CAPITAL
214.64 214.64
TOTAL 1569.89 1569.89 607.19 607.19
STATEMENT OF CHANGES IN WORKING CAPITAL OF 2017-18&2018-19
PARTICULARS 2016-17
2017-18 STATEMENT OF CHANGES IN WORKING CAPITAL
INCREASE DECREASE
A. CURRENT ASSETS
Current investment
inventories
trade receivables
cash and cash equivalents
short term loans and advances
other current assets
324.68
1407.39
591.81
220.51
63.17
782.61
609.52
1302.86
658.42
286.82
76.13
595.69
284.84
104.53
66.61
66.31
12.96
186.92

50
TOTAL CURRENT ASSETS (A)
3390.17 3529.44 430.72 291.45
B. CURRENT LIABILITIES
Short term borrowings
Trade payables
Other current liabilities
Short term provisions
48.61
995.39
593.04
183.24
10.51
1120.86
352.91
199.12
38.1
125.47
240.13
15.88
TOTAL CURRENT LIABILITIES (B)
1820.28 1683.4 141.35 278.28
NET WORKING CAPITAL (A-B)
1569.89 1846.04 289.37 13.22
NET INCREASE IN WORKING CAPITAL
276.15 276.15
TOTAL 1846.04 1846.04 289.37 289.37

51
STATEMENT OF CHANGES IN WORKING CAPITAL OF 2017-18& 2018-19
PARTICULARS 2017-18
2018-19
STATEMENT OF CHANGES IN WORKING CAPITAL
INCREASE DECREASE
A. CURRENT ASSETS
Current investment
inventories
trade receivables
cash and cash equivalents
short term loans and advances
other current assets
609.52
1302.86
658.42
286.82
76.13
595.69
478.90
1646.36
690.15
207.47
100.68
596.83
130.62
343.5
31.73
79.35
24.55
1.14
TOTAL CURRENT ASSETS (A)
3429.44 3720.39 400.92 209.97
B. CURRENT LIABILITIES
Short term borrowings
Trade payables
Other current liabilities
Short term provisions
10.51
1120.86
352.91
199.12
51.36
1045.63
365.07
257.03
40.85
75.23
12.16
57.91
TOTAL CURRENT LIABILITIES (B)
1683.4 1719.09 110.92 75.23
NET WORKING CAPITAL (A-B)
1846.04 2001.3 290 134.74
155.26 155.26
TOTAL 2001.3 2001.3 290 290

52
STATEMENT OF CHANGES IN WORKING CAPITAL OF 2018-19&2019-20
PARTICULARS 2018-19
2019-20
STATEMENT OF CHANGES IN WORKING CAPITAL
INCREASE DECREASE
A. CURRENT ASSETS
Current investment
inventories
trade receivables
cash and cash equivalents
short term loans and advances
other current assets
478.90
1646.36
690.15
207.47
100.68
596.83
1254.69
1245.88
722.16
293.99
132.57
527.97
775.79
400.48
32.01
86.52
31.89
68.86
TOTAL CURRENT ASSETS (A)
3720.39 4177.26 926.21 469.34
B. CURRENT LIABILITIES
Short term borrowings
Trade payables
Other current liabilities
Short term provisions
51.36
1045.63
365.07
257.03
108.80
1132.14
501.94
285.47
57.44
86.51
136.87
28.44
TOTAL CURRENT LIABILITIES (B)
1719.09 2028.35 309.26
NET WORKING CAPITAL (A-B)
2001.3 2148.91 616.95 469.34
NET INCREASE IN WORKIN CAPITAL
147.61 147.61
TOTAL 2148.91 616.95 616.95

53
CONSOLADATED BALANCE SHEET OF EXIDE COMPANY
Apr 19-Mar 20
Apr 18-
Mar 19
Apr 17-
Mar 18
Apr16-
Mar 17
Apr 15-
Mar 16
EQUITIES AND LIABILITIES
SHAREHOLDER'S FUNDS
Equity Share Capital
85.00 85.00 85.00 85.00 85.00
Total Share Capital
85.00 85.00 85.00 85.00 85.00
Revaluation Reserves
50.40 36.61 38.68 40.37 42.22
Reserves and Surplus
4,194.99 3,719.43 3,335.98 2,954.32 2,560.13
Total Reserves and Surplus
4,245.39 3,756.04 3,374.66 2,994.69 2,602.35
Total Shareholders Funds
4,330.39 3,841.04 3,459.66 3,079.69 2,687.35
Minority Interest
14.61 12.78 11.68 11.16 12.50
Policy Holders Funds
8,634.83 8,040.89 7,149.73 6,257.44 0.00
NON-CURRENT LIABILITIES
Long Term Borrowings
1.90 2.62 4.30 2.38 2.58

54
Deferred Tax Liabilities [Net]
130.51 131.47 111.78 103.66 87.02
Other Long Term Liabilities
143.87 104.62 46.41 7.36 4.39
Long Term Provisions
41.50 34.84 26.92 26.74 57.08
Total Non-Current Liabilities
317.78 273.55 189.41 140.14 151.07
CURRENT LIABILITIES
Short Term Borrowings
108.80 51.36 10.51 48.61 24.52
Trade Payables
1,132.14 1,045.63 1,120.86 995.39 689.82
Other Current Liabilities
501.94 365.07 352.91 593.04 244.75
Short Term Provisions
285.47 257.03 199.12 183.24 115.82
Total Current Liabilities
2,028.35 1,719.09 1,683.40 1,820.28 1,074.91
Total Capital And Liabilities
15,325.96 13,887.35 12,493.88 11,308.71 3,925.83
ASSETS
NON-CURRENT ASSETS
Tangible Assets
1,382.61 1,175.96 1,079.75 1,075.76 1,045.55
Intangible Assets
27.07 23.37 24.47 19.62 11.98

55
Capital Work-In-Progress
192.46 114.57 62.72 60.77 27.39
Fixed Assets 1,602.14 1,313.90 1,166.94 1,156.15 1,084.92
Non-Current Investments
6,992.36 5,869.18 4,794.30 3,696.64 344.38
Deferred Tax Assets [Net]
0.00 0.00 0.00 0.00 0.15
Long Term Loans And Advances
128.76 199.05 131.68 105.59 18.41
Other Non-Current Assets
1,843.54 2,202.93 2,289.62 2,378.26 1.10
Total Non-Current Assets
11,148.70 10,166.96 8,964.44 7,918.54 1,495.67
CURRENT ASSETS
Current Investments
1,254.69 478.90 609.52 324.68 649.07
Inventories 1,245.88 1,646.36 1,302.86 1,407.39 1,160.71
Trade Receivables
722.16 690.15 658.42 591.81 426.05
Cash And Cash Equivalents
293.99 207.47 286.82 220.51 62.79
Short Term Loans And Advances
132.57 100.68 76.13 63.17 131.33
Other Current Assets
527.97 596.83 595.69 782.61 0.21
Total Current Assets
4,177.26 3,720.39 3,529.44 3,390.17 2,430.16

56
Total Assets 15,325.96 13,887.35 12,493.88 11,308.71 3,925.83
OTHER ADDITIONAL INFORMATION
CONTINGENT LIABILITIES, COMMITMENTS
Contingent Liabilities
732.44 407.70 470.73 443.35 280.95
BONUS DETAILS
Bonus Equity Share Capital
54.15 54.15 54.15 54.15 54.15
NON-CURRENT INVESTMENTS
Non-Current Investments Quoted Market Value
7,037.20 6,063.85 4,604.58 3,742.88 17.99
Non-Current Investments Unquoted Book Value
176.72 85.81 8.21 8.72 318.16
CURRENT INVESTMENTS
Current Investments Quoted Market Value
322.19 332.59 229.91 140.43 100.00
Current Investments Unquoted Book Value
932.84 148.56 379.33 184.26 549.07

57
CONSOLADATED PROFIT AND LOSS A/C OF EXIDE COMPANY
Apr 19-
Mar 20
Apr 18-
Mar 19
Apr 17-
Mar 18
Apr16-
Mar 17
Apr 15
Mar 16
Revenue From Operations [Gross]
9,986.42 9,946.12 8,859.71 7,154.71 5,882.31
Less: Excise/Service Tax/Other Levies
920.83 786.11 793.38 793.58 563.64
Revenue From Operations [Net]
9,065.59 9,160.01 8,066.33 6,361.13 5,318.67
Other Operating Revenues 413.85 374.94 242.52 4.76 0.00
Total Operating Revenues 9,479.44 9,534.95 8,308.85 6,365.89 5,318.67
Other Income 135.09 95.15 70.80 56.05 41.46
Total Revenue 9,614.53 9,630.10 8,379.65 6,421.94 5,360.13
EXPENSES
Cost Of Materials Consumed
4,121.90 4,827.48 3,917.17 4,208.69 3,467.88
Purchase Of Stock-In Trade 66.83 113.14 100.37 74.03 49.85

58
Changes In Inventories Of FG,WIP And Stock-In Trade
240.11 -289.02 -11.69 -200.30 -56.89
Employee Benefit Expenses 851.10 760.93 682.12 403.17 330.38
Finance Costs 1.65 3.21 7.61 9.06 14.91
Depreciation And Amortization Expenses
179.96 155.32 140.40 122.00 108.37
Other Expenses 3,144.39 3,185.51 2,756.96 1,028.16 783.00
Total Expenses 8,605.94 8,756.57 7,592.94 5,644.81 4,697.50
Profit/Loss Before Exceptional, Extraordinary Items And Tax
1,008.59 873.53 786.71 777.13 662.63
Profit/Loss Before Tax 1,008.59 873.53 786.71 777.13 662.63
Tax Expenses-Continued Operations
Current Tax 293.27 235.83 232.94 220.61 182.04
Less: MAT Credit Entitlement
0.00 0.53 0.00 0.00 0.00
Deferred Tax -1.10 21.90 7.61 16.52 15.90
Total Tax Expenses 292.17 257.20 240.55 237.13 197.94
Profit/Loss After Tax And Before Extraordinary Items
716.42 616.33 546.16 540.00 464.69
Profit/Loss From Continuing Operations
716.42 616.33 546.16 540.00 464.69
Profit/Loss For The Period
716.42 616.33 546.16 540.00 464.69
Minority Interest -2.72 -1.78 -1.50 -1.87 -3.05
Share Of Profit/Loss Of Associates
0.00 0.00 0.00 11.22 -15.58
Consolidated Profit/Loss After MI And Associates
713.70 614.55 544.66 549.35 446.06

59
OTHER ADDITIONAL INFORMATION
EARNINGS PER SHARE
Basic EPS (Rs.) 8.00 7.00 6.00 6.00 5.00
Diluted EPS (Rs.) 8.00 7.00 6.00 6.00 5.00
DIVIDEND AND DIVIDEND PERCENTAGE
Equity Share Dividend 204.00 187.00 153.00 136.00 127.50
Tax On Dividend 41.01 33.74 25.77 22.45 20.67
Liquidity Ratio
It measures the ability of the firm to meet its short-term obligations that is capacity of the firm to pay its current liabilities as and when they fall due. Thus these ratios reflect the short-term financial solvency of a firm. A firm should ensure that it does not suffer from lack of liquidity. The failure to meet obligations on due time may result in bad credit image, loss of creditors confidence, and even in legal proceedings against the firm on the other hand very high degree of liquidity is also not desirable since it would imply that funds are idle and earn nothing. So therefore it is necessary to strike a proper balance between liquidity and lack of liquidity.
1. CURRENT RATIO:
The current ratio is a liquidity ratio that measures a company's ability to pay short-term and long-term obligations. To gauge this ability, the current ratio considers the current total assets of a company (both liquid and illiquid) relative to that company's current total liabilities.
FORMULA:
𝐶𝑈𝑅𝑅𝐸𝑁𝑇𝑅𝐴𝑇𝐼𝑂 =𝐶𝑈𝑅𝑅𝐸𝑁𝑇𝐴𝑆S𝐸𝑇𝑆
𝐶𝑈𝑅𝑅𝐸𝑁𝑇𝐿𝐼𝐴𝐵𝐼𝐿𝐼𝑇𝐼𝐸𝑆

60
TABLE-1
YEAR CURRENT ASSETS(RS)
CURRENT LIABILITIES(RS)
CURRENT RATIO
2015-16
2430.16 1074.91 2.26
2016-17
3390.17 1820.28 1.86
2017-18
3529.44 1683.40 2.10
2018-19
3720.39 1719.09 2.16
2019-20
4177.26 2028.35 2.06
GRAPH-1:
0
0.5
1
1.5
2
2.5
3
3.5
4
4.5
5
2015-162016-17 2017-18 2018-19 2019-20
CURRENT RATIO
CURRENT RATIO

61
ANALYSIS:
The current ratio in the year 2018-19 is 2.26, in the year 2016-17 is 1.86, in the year 2017-18 is 2.10, in the year 2015-16 is 2.16 and in the year 2016-17 is 2.06.
INTERPRETATION:
From the analysis done in the previous step, it is interpreted that the current ratio has decreased in2016-17 compared to 2012-13, again increased in the year 2017-18 , again increased in 2018-19 and again decreased in the year 2016-17.
2. QUICK / LIQUID RATIO:
The quick ratio is a measure of how well a company can meet its short-term financial liabilities, also known as the acid-test ratio. It is used to supplement the information given by the current ratio.
FORMULA:
𝑄𝑈𝐼𝐶𝐾𝑅𝐴𝑇𝐼𝑂 =𝑄𝑈𝐼𝐶𝐾 (𝑂𝑅) 𝐿𝐼𝑄𝑈𝐼𝐷𝐴𝑆𝑆𝐸𝑇𝑆
𝐶𝑈𝑅𝑅𝐸𝑁𝑇𝐿𝐼𝐴𝐵𝐼𝐿𝐼𝑇𝐼𝐸𝑆
TABLE-2:
YEAR LIQUID ASSETS
CURRENT LIABILITIES
QUICK ASSETS
2015-16 488.84 1074.91 0.45
2016-17 812.32 1820.28 0.44
2017-18 945.24 1683.40 0.56
2018-19 897.62 1719.09 0.52
2019-20 1016.15 2028.35 0.50

62
GRAPH 2
ANALYSIS:
The quick ratio in the year2012-13 is 0.45, in the year2019-20 is 0.44, in the year 2018-19 is 0.56, in the year 2019-20 is 0.52 and in the year 2018-19 is 0.50.
INTERPRETATION:
From the analysis done In the previous step, it is interpreted that the quick ratio has decreased in the year 2019-20 compare to year 2012-13, again increased in the year 2018-19, again decreased in the year 2019-20 and again decreased in the year 2018-19.
3. WORKING CAPITAL TURNOVER RATIO:
The working capital turnover ratio is also referred to as net sales to working capital. It indicates a company's effectiveness in using its working capital. The working capital turnover ratio is calculated as follows: net annual sales divided by the average amount of working capital during the same 12 month period.
0
0.1
0.2
0.3
0.4
0.5
0.6
2015-16 2016-17 2017-18 2018-19 2019-20
QUICK ASSETS
quick assets

63
FORMULA:
𝑊𝑂𝑅𝐾𝐼𝑁𝐺𝐶𝐴𝑃𝐼𝑇𝐴𝐿𝑇𝑈𝑅𝑁𝑂𝑉𝐸𝑅𝑅𝐴𝑇𝐼𝑂 =𝑁𝐸𝑇𝑆𝐴𝐿𝐸𝑆
𝑁𝐸𝑇𝑊𝑂𝑅𝐾𝐼𝑁𝐺𝐶𝐴𝑃𝐼𝑇𝐴𝐿
TABLE-3:
YEAR NET SALES
NET WORKING CAPITAL
WORKING CAPITAL TURNOVER RATIO
2015-16 5318.67 1355.21 3.92
2016-17 6365.89 1569.89 4.05
2017-18 8308.85 1846.04 4.50
2018-19 9534.95 2001.30 4.76
2019-20 9479.44 2148.91 4.41
GRAPH-3:
0
0.5
1
1.5
2
2.5
3
3.5
4
4.5
5
2015-16 2016-17 2017-18 2018-19 2019-20
WORKING CAPITAL TURN OVER RATIO
WORKING CAPITALTURN OVER RATIO

64
ANALYSIS:
In the year 2012-13 working capital turnover ratio is 3.92, in the year 2019-20 is 4.05, in the year 2018-19 is 4.50, in the year 2019-20 is 4.76 and in the year 2018-19 is 4.41.
INTERPRETATION:
From the analysis done In the previous step, it is interpreted that the working capital turnover ratio has increased in the year 2019-20 compare to year 2012-13, again increased in the year 2018-19, again increased in the year 2019-20 and again decreased in the year 2018-19.
4. CURRENT ASSET TURNOVER RATIO:
The asset turnover ratio is an efficiency ratio that measures a company's ability to generate sales from its assets by comparing net sales with average total assets. In other words, this ratio shows how efficiently a company can use its assets to generate sales.
FORMULA:
𝐶𝑈𝑅𝑅𝐸𝑁𝑇𝐴𝑆𝑆𝐸𝑇𝑇𝑈𝑅𝑁𝑂𝑉𝐸𝑅𝑅𝐴𝑇𝐼𝑂 =𝑁𝐸𝑇𝑆𝐴𝐿𝐸𝑆
𝐶𝑈𝑅𝑅𝐸𝑁𝑇𝐴𝑆𝑆𝐸𝑇𝑆

65
TABLE-4
YEAR NET SALES
CURRENT ASSETS
CURRENT ASSETS TURNOVER RATIO
2015-16 5318.67 2430.16 2.19
2016-17 6365.89 3390.17 1.88
2017-18 8308.85 3529.44 2.35
2018-19 9534.95 3720.39 2.56
2019-20 9479.44 4177.26 2.27
GRAPH-4:
0
0.5
1
1.5
2
2.5
3
2015-16 2016-17 2017-18 2018-19 2019-20
CURRENT ASSET TURNOVER RATIO
CURRENT ASSETTURNOVER RATIO

66
ANALYSIS:
In the year 2012-13 current asset turnover ratio is 2.19, in the year 2017-18 is 1.88, in the year 2018-19 is 2.35, in the year 2017-18 is 2.56 and in the year 2018-19 is 2.27.
INTERPRETATION:
From the analysis done in the previous step, it is interpreted that the current asset turnover ratio has decreased in the year 2017-18 compare to year 2012-13, again increased in the year 2018-19, again increased in the year 2017-18 and again decreased in the year 2018-19.
5. STOCK TURNOVER RATIO/ INVENTORY TURNOVER RATIO:
The inventory turnover ratio is an efficiency ratio that shows how effectively inventory is managed by comparing cost of goods sold with average inventory for a period. This measures how many times average inventory is "turned" or sold during a period.
FORMULA:
𝑆𝑇𝑂𝐶𝐾𝑇𝑈𝑅𝑁𝑂𝑉𝐸𝑅𝑅𝐴𝑇𝐼𝑂 =𝐶𝑂𝑆𝑇𝑂𝐹𝐺𝑂𝑂𝐷𝑆𝑆𝑂𝐿𝐷 (𝑁𝐸𝑇 𝑆𝐴𝐿𝐸𝑆)
𝐴𝑉𝐸𝑅𝐴𝐺𝐸𝑆𝑇𝑂𝐶𝐾(𝐼𝑁𝑉𝐸𝑁𝑇𝑂𝑅𝑌)
TABLE-5
YEAR NET SALES AVERAGE STOCK
STOCK TURN OVER RATIO
2015-16
5318.67 1160.71 4.58

67
2016-17
6365.89 1407.39 4.52
2017-18
8308.85 1302.86 6.38
2018-19
9534.95 1646.36 5.79
2019-20
9479.44 1245.88 7.61
GRAPH-5
ANALYSIS:
In the year 2012-13 stock turnover ratio is 4.58, in the year 2015-16 is 4.52, in the year 2019-20 is 6.38, in the year 2015-16 is 5.79 and in the year 2018-19 is 7.61.
0
1
2
3
4
5
6
7
8
2015-16 2016-17 2017-18 2018-19 2019-20
STOCK TURN OVER RATIO
STOCK TURN OVERRATIO

68
INTERPRETATION:
From the analysis done in the previous step, it is interpreted that the stock turnover ratio has decreased in the year 2015-16 compare to year 2012-13, again increased in the year 2019-20, again decreased in the year 2015-16 and again increased in the year 2018-19.
6. NET PROFIT RATIO:
The net profit percentage is the ratio of after-tax profits to net sales. It reveals the remaining profit after all costs of production, administration, and financing have been deducted from sales, and income taxes recognized.
FORMULA:
𝑁𝐸𝑇𝑃𝑅𝑂𝐹𝐼𝑇𝑅𝐴𝑇𝐼𝑂 = 𝑁𝐸𝑇𝑃𝑅𝑂𝐹𝐼𝑇𝐴𝐹𝑇𝐸𝑅𝑇𝐴𝑋
𝑁𝐸𝑇𝑆𝐴𝐿𝐸𝑆
TABLE-6
YEAR NET PROFIT AFTER TAX
NET SALES
NET PROFIT RATIO
2015-16
464.69 5318.67 0.09
2018-19
540 6365.89 0.08
2017-18
546.16 8308.85 0.07
2018-19
616.33 9534.95 0.06
2019-20
713.42 9479.44 0.08

69
GRAPH-6:
ANALYSIS:
In the year 2012-13 net profit ratio is 0.09, in the year 2017-18 is 0.08, in the year 2016-17 is 0.07, in the year 2017-18 is 0.06 and in the year 2018-19 is 0.08.
INTERPRETATION:
From the analysis done In the previous step, it is interpreted that the net profit ratio has decreased in the year 2017-18 compare to year 2012-13, again decreased in the year 2016-17, again decreased in the year 2017-18 and again increased in the year 2018-19.
7. INVENTORY TO CURRENT ASSET RATIO:
This ratio is calculated by dividing the total of inventory by the amount of current assets.
0
0.02
0.04
0.06
0.08
0.1
2015-16 2016-17 2017-18 2018-19 2019-20
NET PROFIT RATIO
NET PROFITRATIO
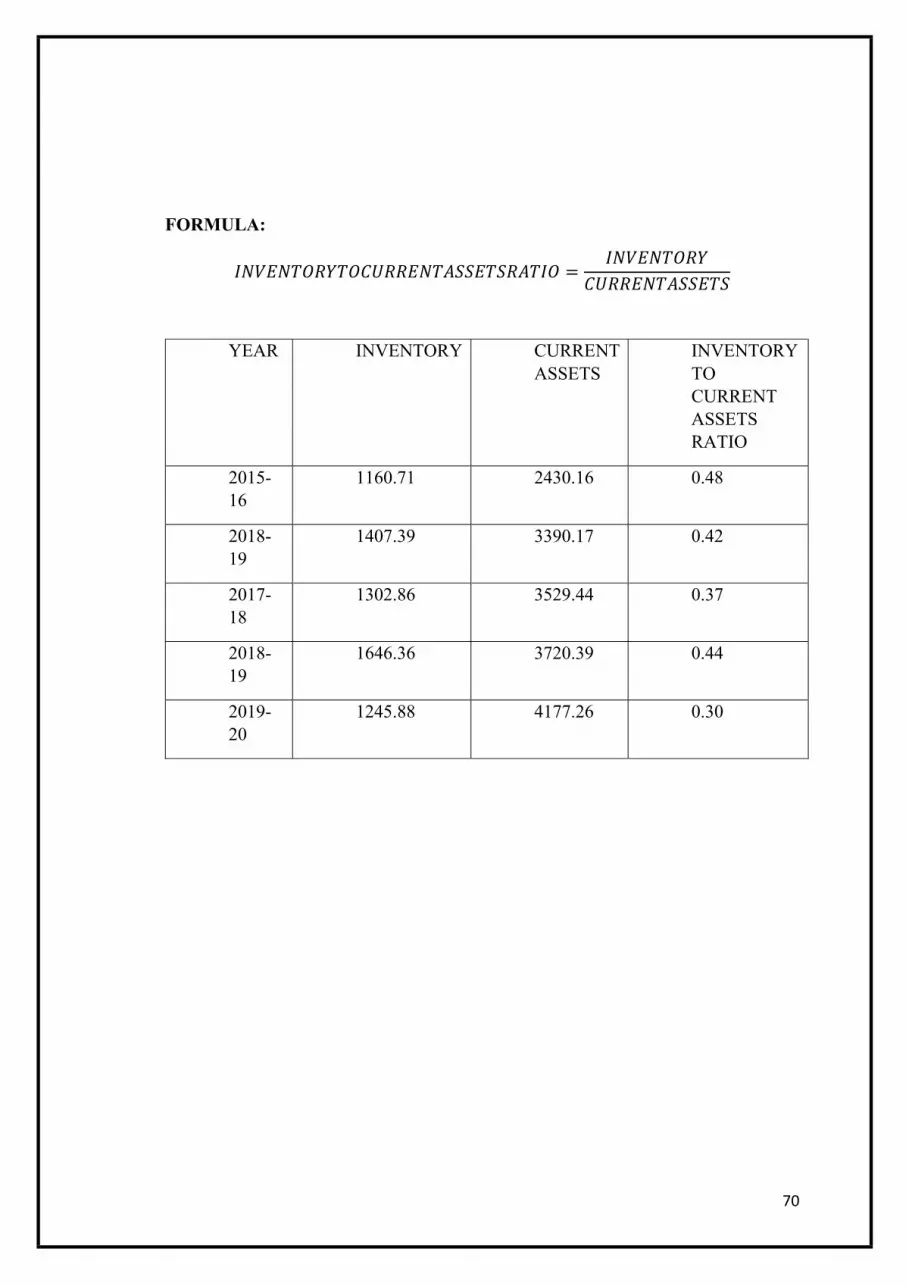
70
FORMULA:
𝐼𝑁𝑉𝐸𝑁𝑇𝑂𝑅𝑌𝑇𝑂𝐶𝑈𝑅𝑅𝐸𝑁𝑇𝐴𝑆𝑆𝐸𝑇𝑆𝑅𝐴𝑇𝐼𝑂 =𝐼𝑁𝑉𝐸𝑁𝑇𝑂𝑅𝑌
𝐶𝑈𝑅𝑅𝐸𝑁𝑇𝐴𝑆𝑆𝐸𝑇𝑆
YEAR INVENTORY CURRENT ASSETS
INVENTORY TO CURRENT ASSETS RATIO
2015-16
1160.71 2430.16 0.48
2018-19
1407.39 3390.17 0.42
2017-18
1302.86 3529.44 0.37
2018-19
1646.36 3720.39 0.44
2019-20
1245.88 4177.26 0.30

71
GRAPH-7:
ANALYSIS:
In the year 2012-13 net profit ratio is 0.09, in the year 2017-18 is 0.08, in the year 2016-17 is 0.07, in the year 2017-18 is 0.06 and in the year 2018-19 is 0.08.
INTERPRETATION:
From the analysis done In the previous step, it is interpreted that the net profit ratio has decreased in the year 2017-18 compare to year 2012-13, again decreased in the year 2016-17, again decreased in the year 2017-18 and again increased in the year 2018-19.
0
0.1
0.2
0.3
0.4
0.5
0.6
2015-16 2016-17 2017-18 2018-19
INVENTORY TO CURRENT ASSETS RATIO
INVENTORY TOCURRENT ASSETSRATIO

72
8. RATIO OF CURRENT ASSETS TO SHARE HOLDERS FUNDS:
This ratio is calculated by dividing the total of current assets by the amount of share holders’ funds.
FORMULA:
𝑅𝐴𝑇𝐼𝑂𝑂𝐹𝐶𝑈𝑅𝑅𝐸𝑁𝑇𝐴𝑆𝑆𝐸𝑇𝑆𝑇𝑂𝑆𝐻𝐴𝑅𝐸𝐻𝑂𝐿𝐷𝐸𝑅𝑆𝐹𝑈𝑁𝐷𝑆
=𝐶𝑈𝑅𝑅𝐸𝑁𝑇 A𝑆𝑆𝐸𝑇𝑆
𝑆𝐻𝐴𝑅𝐸𝐻𝑂𝐿𝐷𝐸𝑅𝐹𝑈𝑁𝐷𝑆× 100
YEAR CURRENT ASSETS
SHARE HOLDER’S FUND
RATIO OF CURRENT ASSETS TO SHAREHOLDER’S FUND
2015-16 2430.16 3057.32 79.49
2018-19 3390.17 3423.59 99.02
2017-18 3529.44 3731.46 94.59
2018-19 3720.39 4054.58 91.76
2019-20 4177.26 4434.07 94.21
GRAPH-8:
0
20
40
60
80
100
120
2016-17 2017-18 2018-19 2019-20 2016-17
RATIO OF CURRENT ASSETS TO SHAREHOLDER’S FUND
RATIO OF CURRENT ASSETS TO SHAREHOLDER’S FUND

73
ANALYSIS:
In the year 2012-13 ratio of current assets to shareholder’s fund is 79.49, in the year 2015-16 is 99.02, in the year 2016-17 is 94.59, in the year 2015-16is 91.76 and in the year 2018-19 is 94.21.
INTERPRETATION:
From the analysis done In the previous step, it is interpreted that the ratio of current assets to shareholder’s fund has increased in the year 2015-16 compare to year 2012-13, again decreased in the year 2016-17, again decreased in the year 2015-16 and again increased in the year 2018-19.
9. NET WORKING CAPITAL TO CURRENT LIABILITIES RATIO:
This ratio is calculated by dividing the total of net working capital by the amount of current liabilities.
FORMULA:
𝑁𝐸𝑇𝑊𝑂𝑅𝐾𝐼𝑁𝐺𝐶𝐴𝑃𝐼𝑇𝐴𝐿𝑇𝑂𝐶𝑈𝑅𝑅𝐸𝑁𝑇𝐿𝐼𝐴𝐵𝐼𝐿𝐼𝑇𝑌𝑅𝐴𝑇𝐼𝑂
=𝑁𝐸𝑇𝑊𝑂𝑅𝐾𝐼𝑁𝐺𝐶𝐴𝑃𝐼𝑇𝐴𝐿
𝐶𝑈𝑅𝑅𝐸𝑁𝑇𝐿𝐼𝐴𝐵𝐼𝐿𝐼𝑇𝐼𝐸𝑆
YEAR NET WORKING CAPITAL
CURRENT LIABILITIES
NET WORKING CAPITAL TO CURRENT LIABILITIES RATIO
2015-16
1355.21 1074.91 1.26
2018-19
1569.89 1820.28 0.86
2017-18
1846.04 1683.40 1.10
2018-19
2001.30 1719.09 1.16
2019-20
2148.91 2028.35 1.06

74
GRAPH-9:
ANALYSIS:
In the year 2012-13 working capital to current liabilities ratio is 1.26, in the year 2015-16 is 0.86, in the year 2019-20 is 1.10, in the year 2015-16 is 1.16 and in the year 2018-19 is 0.06.
INTERPRETATION:
From the analysis done In the previous step, it is interpreted that the net working capital to current liabilities ratio has decreased in the year 2015-16 compare to year 2012-13, again increased in the year 2019-20, again increased in the year 2015-16 and again decreased in the year 2018-19.
10. INVENTORY TO WORKING CAPITAL RATIO:
Inventory to working capital ratio, defined as a method to show what portion of a company's inventories is financed from its available cash, is essential to businesses which hold inventory and survive on cash supplies. In general, the lower the ratio, the higher the liquidity of a company
0
0.2
0.4
0.6
0.8
1
1.2
1.4
2015-16 2016-17 2017-18 2018-19 2019-20
NET WORKING CAPITAL TO CURRENT LIABILITIES RATIO
NET WORKINGCAPITAL TOCURRENTLIABILITIES RATIO
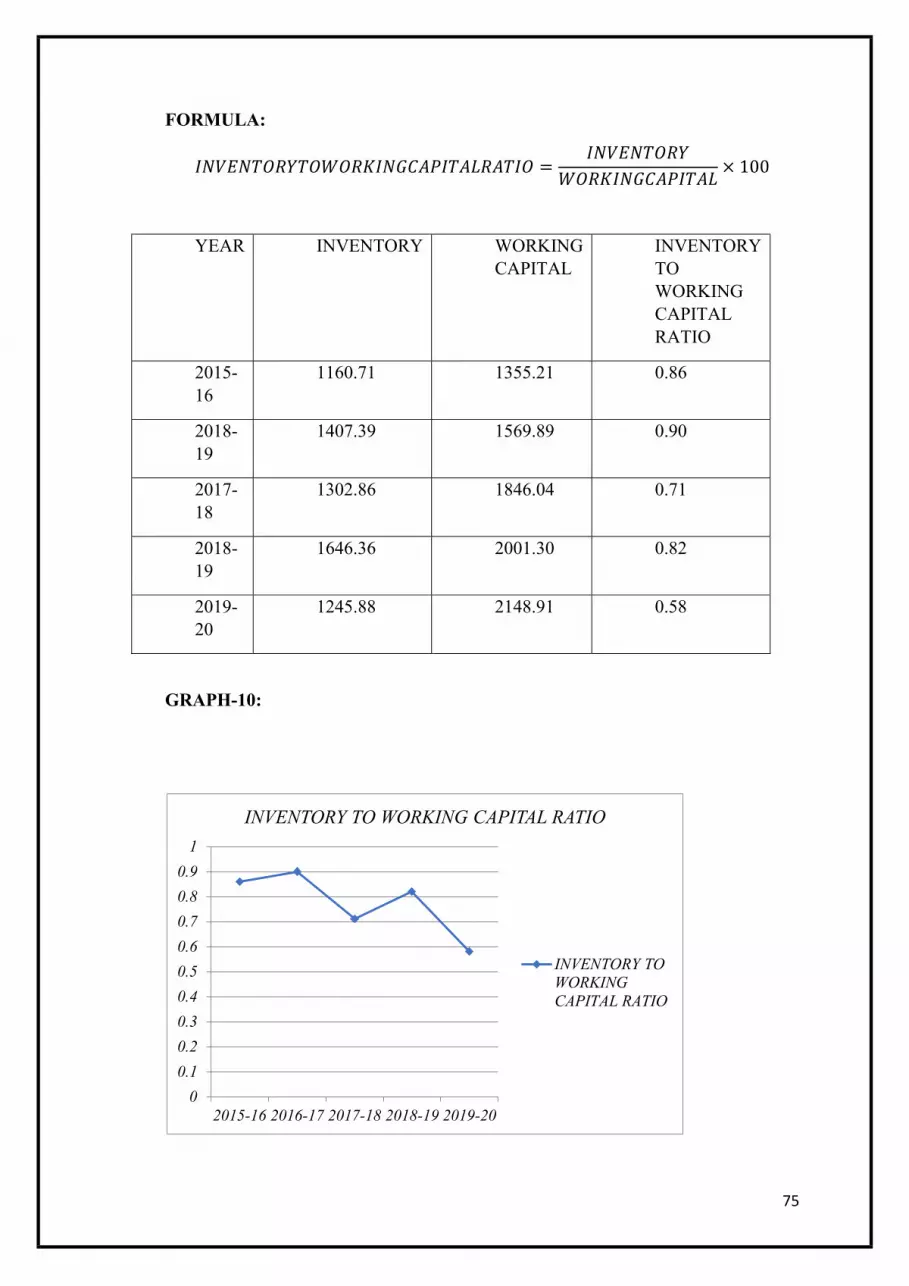
75
FORMULA:
𝐼𝑁𝑉𝐸𝑁𝑇𝑂𝑅𝑌𝑇𝑂𝑊𝑂𝑅𝐾𝐼𝑁𝐺𝐶𝐴𝑃𝐼𝑇𝐴𝐿𝑅𝐴𝑇𝐼𝑂 =𝐼𝑁𝑉𝐸𝑁𝑇𝑂𝑅𝑌
𝑊𝑂𝑅𝐾𝐼𝑁𝐺𝐶𝐴𝑃𝐼𝑇𝐴𝐿× 100
YEAR INVENTORY
WORKING CAPITAL
INVENTORY TO WORKING CAPITAL RATIO
2015-16
1160.71 1355.21 0.86
2018-19
1407.39 1569.89 0.90
2017-18
1302.86 1846.04 0.71
2018-19
1646.36 2001.30 0.82
2019-20
1245.88 2148.91 0.58
GRAPH-10:
0
0.1
0.2
0.3
0.4
0.5
0.6
0.7
0.8
0.9
1
2015-16 2016-17 2017-18 2018-19 2019-20
INVENTORY TO WORKING CAPITAL RATIO
INVENTORY TOWORKINGCAPITAL RATIO

76
ANALYSIS:
In the year 2012-13 inventory to working capital ratio is 0.86, in the year 2019-20 is 0.90, in the year 2016-17 is 0.71, in the year 2019-20 is 0.82 and in the year 2015-17 is 0.58.
INTERPRETATION:
From the analysis done In the previous step, it is interpreted that the inventory to working capital ratio has decreased in the year 2019-20 compare to year 2012-13, again increased in the year 2016-17, again increased in the year 2019-20 and again decreased in the year 2018-19.
11. EQUITY RATIO/ PROPRIETORY RATIO:
The Equity Ratio is a good indicator of the level of leverage used by a company. The Equity Ratio measures the proportion of the total assets that are financed by stockholders, as opposed to creditors.
𝐸𝑄𝑈𝐼𝑇𝑌𝑅𝐴𝑇𝐼𝑂 =𝑆𝐻𝐴𝑅𝐸𝐻𝑂𝐿𝐷𝐸𝑅 𝑆𝐹𝑈𝑁𝐷
𝑇𝑂𝑇𝐴𝐿𝐴𝑆𝑆𝐸𝑇𝑆× 100
YEAR SHARE HOLDER’S FUND
TOTAL ASSETS
EQUITY RATIO
2015-16
3057.32 4094.37 74.67
2018-19
3423.59 4548.35 75.27
2017-18
3731.46 4956.62 75.28
2018-19
4054.58 5402.62 75.05
2019-20
4434.07 6128.70 72.35
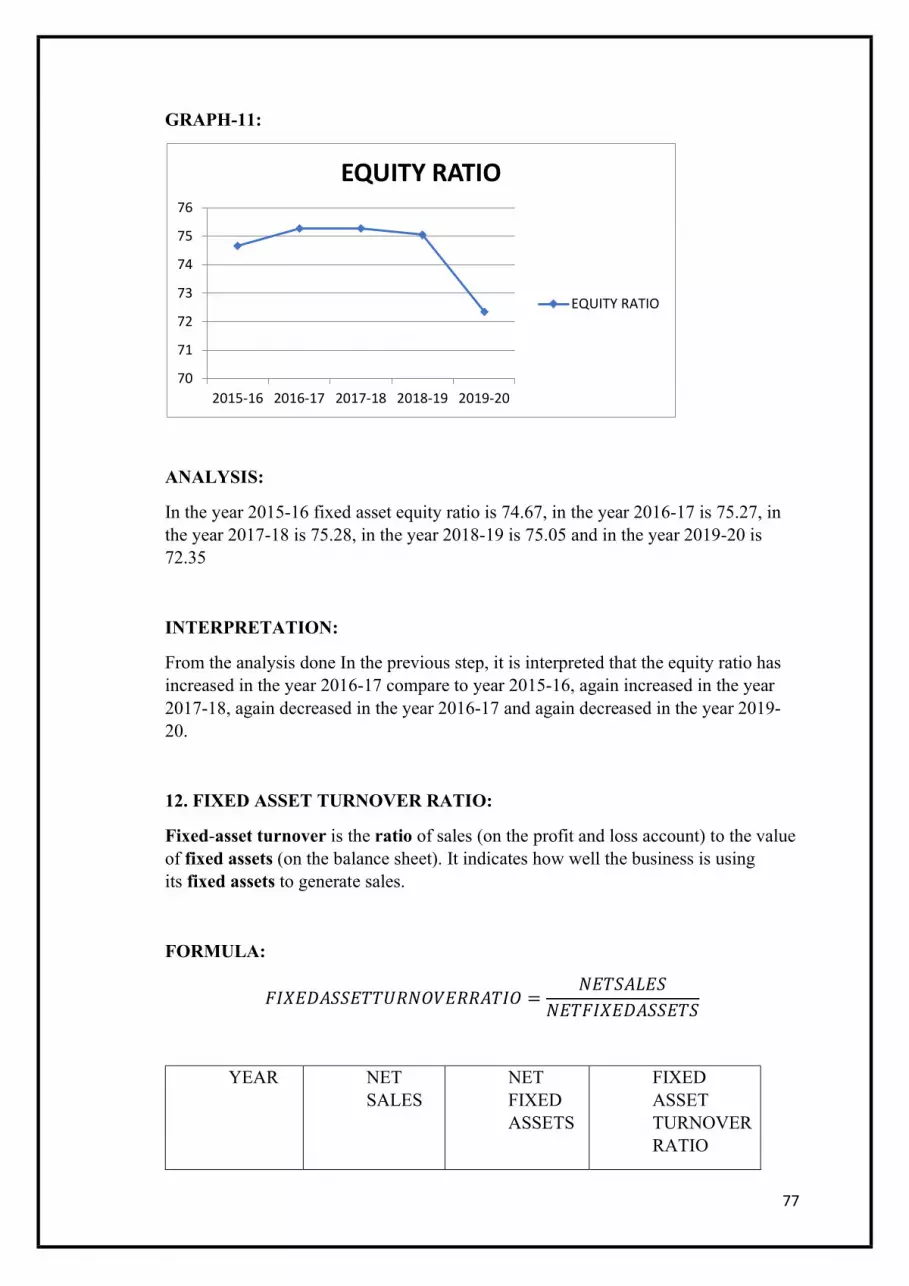
77
GRAPH-11:
ANALYSIS:
In the year 2015-16 fixed asset equity ratio is 74.67, in the year 2016-17 is 75.27, in the year 2017-18 is 75.28, in the year 2018-19 is 75.05 and in the year 2019-20 is 72.35
INTERPRETATION:
From the analysis done In the previous step, it is interpreted that the equity ratio has increased in the year 2016-17 compare to year 2015-16, again increased in the year 2017-18, again decreased in the year 2016-17 and again decreased in the year 2019-20.
12. FIXED ASSET TURNOVER RATIO:
Fixed-asset turnover is the ratio of sales (on the profit and loss account) to the value of fixed assets (on the balance sheet). It indicates how well the business is using its fixed assets to generate sales.
FORMULA:
𝐹𝐼𝑋𝐸𝐷𝐴𝑆𝑆𝐸𝑇𝑇𝑈𝑅𝑁𝑂𝑉𝐸𝑅𝑅𝐴𝑇𝐼𝑂 =𝑁𝐸𝑇𝑆𝐴𝐿𝐸𝑆
𝑁𝐸𝑇𝐹𝐼𝑋𝐸𝐷𝐴𝑆𝑆𝐸𝑇𝑆
YEAR NET SALES
NET FIXED ASSETS
FIXED ASSET TURNOVER RATIO
70
71
72
73
74
75
76
2015-16 2016-17 2017-18 2018-19 2019-20
EQUITY RATIO
EQUITY RATIO

78
2015-16 5318.67 993.19 5.36
2018-19 6365.89 1053.18 6.04
2017-18 8308.85 1049 7.92
2018-19 9534.95 1190.33 8.01
2019-20 9479.44 1448.79 6.54
GRAPH 12:
ANALYSIS:
In the year 2015-16 fixed asset turnover ratio is 5.36, in the year 2016-17 is 6.04, in the year 2017-18 is7.92, in the year 2018-19 is 8.01 and in the year 2019-20 is 6.54.
INTERPRETATION:
From the analysis done In the previous step, it is interpreted that the fixed asset turnover ratio has increased in the year 2016-17 compare to year 2015-16, again increased in the year 2017-18, again increased in the year 2018-19 and again decreased in the year 2019-20.
0123456789
2015-16 2016-17 2017-18 2018-19 2019-20
FIXED ASSET TURNOVER RATIO
FIXED ASSETTURNOVERRATIO
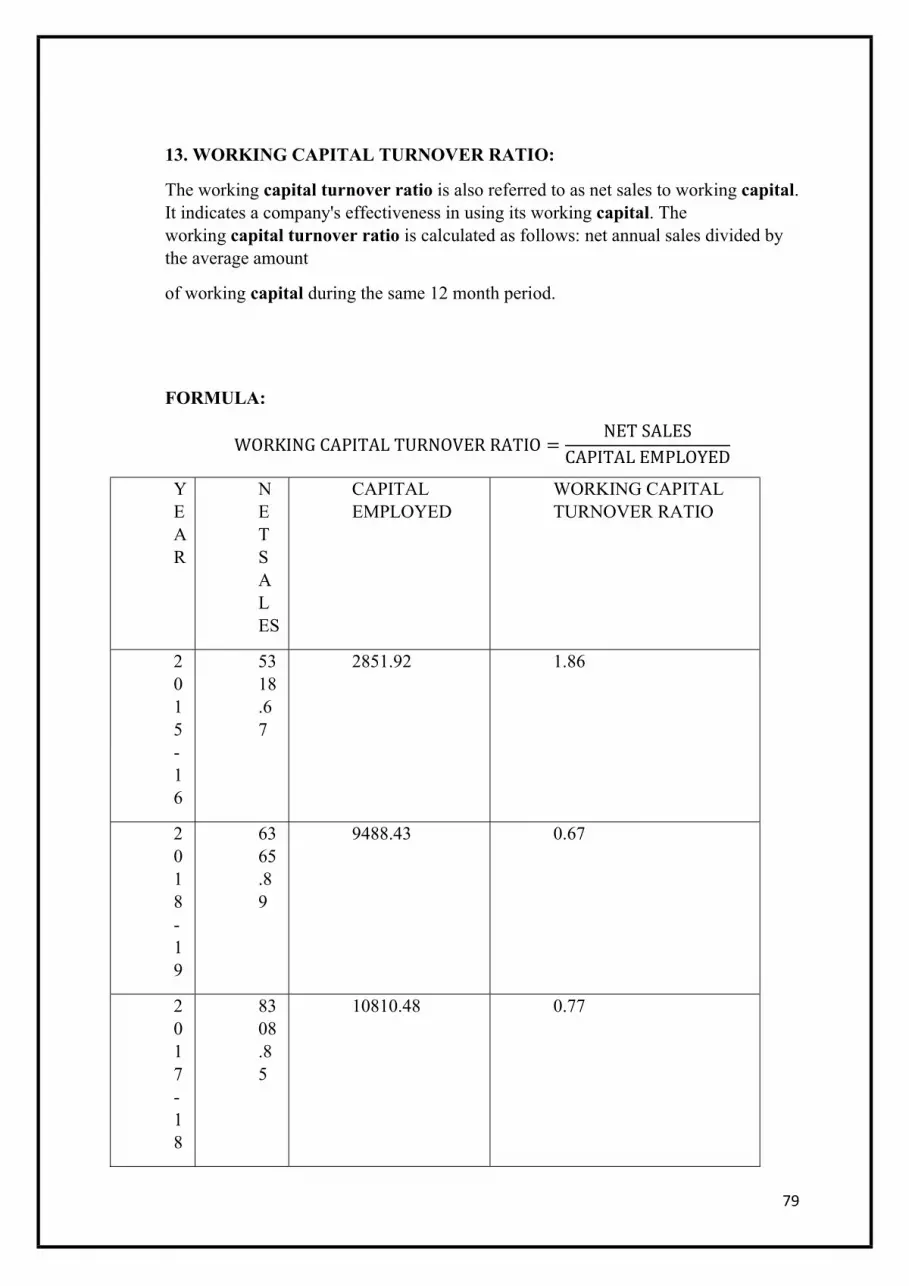
79
13. WORKING CAPITAL TURNOVER RATIO:
The working capital turnover ratio is also referred to as net sales to working capital. It indicates a company's effectiveness in using its working capital. The working capital turnover ratio is calculated as follows: net annual sales divided by the average amount
of working capital during the same 12 month period.
FORMULA:
WORKING CAPITAL TURNOVER RATIO =NET SALES
CAPITAL EMPLOYED
YEAR
NET SALES
CAPITAL EMPLOYED
WORKING CAPITAL TURNOVER RATIO
2015-16
5318.67
2851.92 1.86
2018-19
6365.89
9488.43 0.67
2017-18
8308.85
10810.48 0.77

80
2018-19
9534.95
12168.26 0.78
201-20
9479.44
13297.61 0.71
GRAPH-13:
ANALYSIS:
In the year 2015-16 working capital turnover ratio is 1.86, in the year 2016-17 is 0.67, in the year 2017-18 is 0.77, in the year 2018-19 is 0.78 and in the year 2019-20 is 0.71.
0
0.2
0.4
0.6
0.8
1
1.2
1.4
1.6
1.8
2
2015-16 2016-17 2017-18 2018-19 2019-20
WORKING CAPITAL TURNOVER RATIO
WORKING CAPITALTURNOVER RATIO

81
INTERPRETATION:
From the analysis done In the previous step, it is interpreted that the working capital turnover ratio has decreased in the year 2016-17 compare to year 2015-16, again increased in the year 2017-18, again increased in the year 2018-19 and again decreased in the year 2019-20.
14. FIXED ASSET RATIO:
The ratio establishes the relationship between fixed assets and net worth. It can be calculated as follows.
FORMULA:
FIXED ASSET RATIO =FIXED ASSETS
NET WORTH
YEAR FIXED ASSETS
NET WORTH
FIXED ASSET RATIO
2015-16 993.19 2687.35 0.37
2018-19 1053.18 3079.69 0.34
2017-18 1049 3459.66 0.30
2018-19 1190.33 3841.09 0.31
2019-20 1448.79 4330.39 0.33

82
GRAPH-14:
ANALYSIS:
In the year 2015-16 fixed asset ratio is 0.37, in the year 2016-17 is 0.34, in the year 2017-18 is 0.30, in the year 2018-19 is 0.31 and in the year 2019-20 is 0.33
INTERPRETATION:
From the analysis done In the previous step, it is interpreted that the fixed asset ratio has decreased in the year 2016-17 compare to year 2015-16, again decreased in the year 2017-18, again increased in the year 2018-19 and again increased in the year 2019-20.
15. RETURN ON CAPITAL EMPLOYED (ROCE):
Return on capital employed (ROCE) is a financial ratio that measures a company's profitability and the efficiency with which its capital is employed. ROCE is calculated as follows.
FORMULA:
ROCE =PROFIT BEFORE INTREST AND TAXES
CAPITAL EMPLOYED× 100
0
0.05
0.1
0.15
0.2
0.25
0.3
0.35
0.4
2015-16 2016-17 2017-18 2018-19 2019-20
FIXED ASSET RATIO
FIXED ASSET RATIO

83
YEAR PROFIT BEFORE INTREST AND TAXES
CAPITAL EMPLOYED
ROCE
2015-16
662.69 3198.20 20.72
2018-19
777.13 3548.97 21.90
2017-18
786.71 3862.67 20.37
2018-19
873.53 4213.51 20.73
2019-20
1008.59 4598.43
21.93
GRAPH-15:
ANALYSIS:
In the year 2015-16 return on capital employed ratio is 20.72, in the year 2016-17 is 21.9, in the year 2017-18 is 20.37, in the year 2018-19 is 20.73 and in the year 2019-20 is 21.93.
INTERPRETATION:
From the analysis done In the previous step, it is interpreted that the return on capital employed ratio has increased in the year 2016-17 compare to year 2015-16, again decreased in the year 2017-18, again increased in the year 2018-19 and again increased in the year 2019-20.
19.520
20.521
21.522
22.5
2015-16 2016-17 2017-18 2018-19 2019-20
ROCE
ROCE
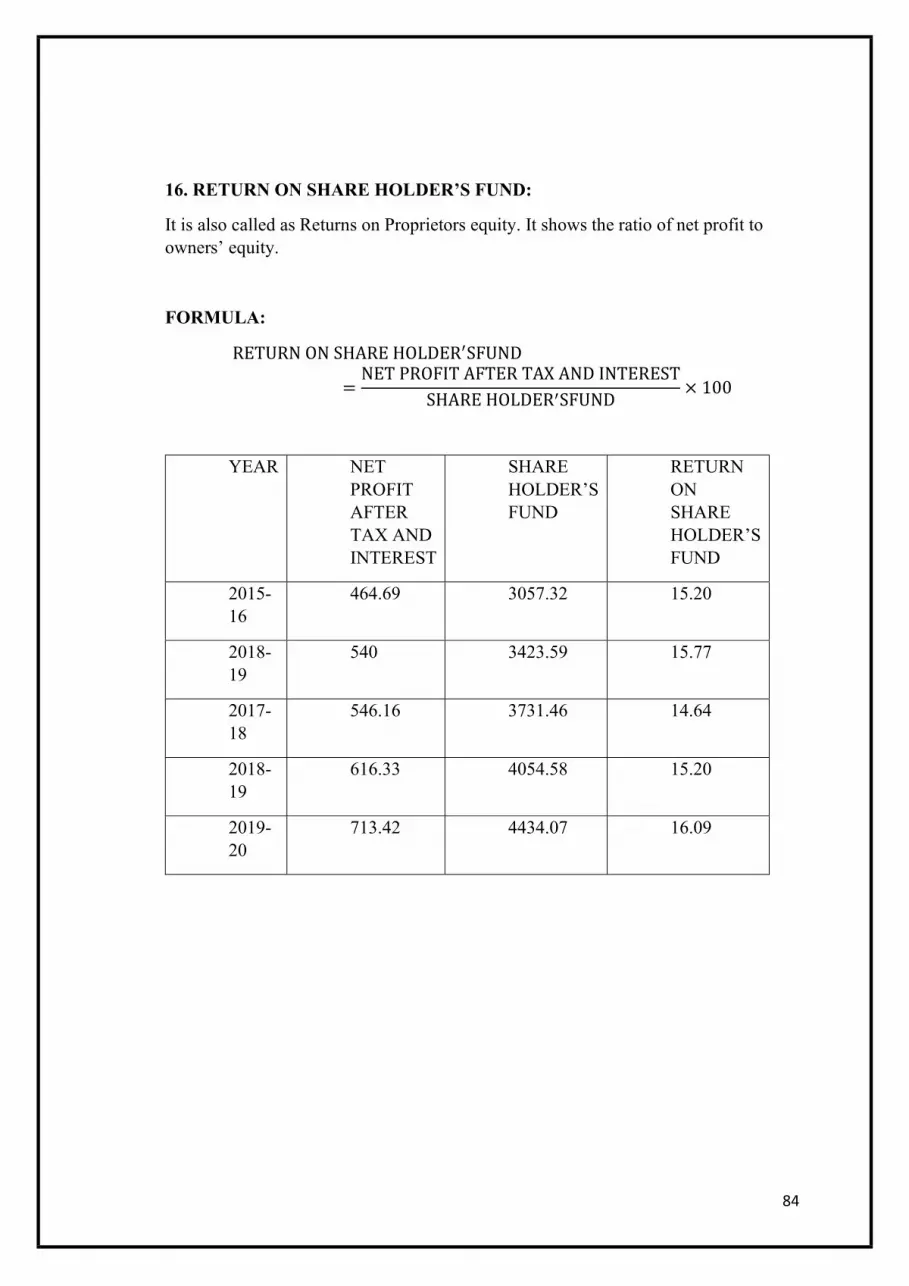
84
16. RETURN ON SHARE HOLDER’S FUND:
It is also called as Returns on Proprietors equity. It shows the ratio of net profit to owners’ equity.
FORMULA:
RETURN ON SHARE HOLDER SFUND
=NET PROFIT AFTER TAX AND INTEREST
SHARE HOLDER SFUND× 100
YEAR NET PROFIT AFTER TAX AND INTEREST
SHARE HOLDER’S FUND
RETURN ON SHARE HOLDER’S FUND
2015-16
464.69 3057.32 15.20
2018-19
540 3423.59 15.77
2017-18
546.16 3731.46 14.64
2018-19
616.33 4054.58 15.20
2019-20
713.42 4434.07 16.09

85
GRAPH-16:
ANALYSIS:
In the year 2015-16 return on shareholder’s fund ratio is 15.2, in the year 2016-17 is 15.77, in the year 2017-18 is 14.64, in the year 2018-19 is 15.2 and in the year 2019-20 is 16.09
INTERPETATION:
From the analysis done In the previous step, it is interpreted that the return on shareholder’s fund ratio has increased in the year 2016-17 compare to year 2015-16, again decreased in the year 2017-15, again increased in the year 2018-19 and again increased in the year 2019-20.
13.5
14
14.5
15
15.5
16
16.5
2015-16 2016-17 2017-18 2018-19 2019-20
RETURN ON SHARE HOLDER’S FUND
RETURN ON SHARE HOLDER’S FUND

86
CHAPTER 5
SUMMARY OF FINDINGS, SUGGESTION AND CONCLUSION
FINDINGS
1. .The current ratio in the year 2018-19 is 2.26, in the year 2018-19 is 1.86, in the year 2017-18 is 2.10, in the year 2018-19 is 2.16 and in the year 2018-19 is 2.06.
2. The quick ratio in the year2018-19 is 0.45, in the year2018-19 is 0.44, in the year 2017-18 is 0.56, in the year 2018-19 is 0.52 and in the year 2018-19 is 0.50.
3. In the year 2018-19 working capital turnover ratio is 3.92, in the year 2018-19 is 4.05, in the year 2017-18 is 4.50, in the year 2018-19 is 4.76 and in the year 2018-19
is 4.41.
4. In the year 2018-19 current asset turnover ratio is 2.19, in the year 2018-19 is 1.88, in the year 2017-18 is 2.35, in the year 2018-19 is 2.56 and in the year 2018-19 is 2.27.
5. In the year 2018-19 stock turnover ratio is 4.58, in the year 2018-19 is 4.52, in the year 2017-18 is 6.38, in the year 2018-19 is 5.79 and in the year 2018-19 is 7.61.
6. In the year 2018-19 net profit ratio is 0.09, in the year 2018-19 is 0.08, in the year 2017-18 is 0.07, in the year 2018-19 is 0.06 and in the year 2018-19 is 0.08
7. In the year 2018-19 inventory to current asset ratio is 0.48, in the year 2018-19 is 0.42, in the year 2017-18 is 0.37, in the year 2018-19 is 0.44 and in the year 2018-19 is 0.30.
8. In the year 2018-19 ratio of current assets to shareholder’s fund is 79.49, in the year 2018-19 is 99.02, in the year 2017-18 is 94.59, in the year 2018-19 is 91.76 and in the year 2018-19 is 94.21.
9. In the year 2012-13working capital to current liabilities ratio is 1.26, in the year 2018-19 is 0.86, in the year 2017-18 is 1.10, in the year 2018-19 is 1.16 and in the year 2018-19 is 0.06.
10. In the year 2018-19 inventory to working capital ratio is 0.86, in the year 2018-19 is 0.90, in the year 2017-18 is 0.71, in the year 2018-19 is 0.82 and in the year 2018-19 is 0.58.
11. In the year 2018-19 fixed asset equity ratio is 74.67, in the year 2018-19 is 75.27, in the year 2017-18 is 75.28, in the year 2018-19 is 75.05 and in the year 2018-19 is 72.35
12. In the year 2018-19 fixed asset turnover ratio is 5.36, in the year 2018-19 is 6.04, in the year 2017-18 is7.92, in the year 2018-19 is 8.01 and in the year 2018-19 is 6.54.
13. In the year 2018-19 working capital turnover ratio is 1.86, in the year 2018-19 is 0.67, in the year 2017-18 is 0.77, in the year 2018-19 is 0.78 and in the year 2018-19 is 0.71.
87
14. In the year 2018-19 fixed asset ratio is 0.37, in the year 2018-19 is 0.34, in the year 2017-18 is 0.30, in the year 2018-19 is 0.31 and in the year 2018-19 is 0.33
15. In the year 2018-19 return on capital employed ratio is 20.72, in the year 2018-19 is 21.9, in the year 2017-18 is 20.37, in the year 2018-19 is 20.73 and in the year 2018-19 is 21.93.
16. In the year 2018-19 return on shareholder’s fund ratio is 15.2, in the year 2018-19 is 15.77, in the year 2017-18 is 14.64, in the year 2018-19 is 15.2 and in the year 2018-19 is 16.09
SUGGESTIONS AND CONCLUSION
Suggestions and Conclusion Data analysis and interpretation discussed in Chapter III and IV bring out interesting results related to the impact of IFRS on Selected companies. There were positive and negative differences, some greater, some lesser, impact of IFRS on selected companies. 341 The particular IFRS polices have substantial significances not just with regard to monetary record preparers as well as people but in addition complete financial reporting institutional infrastructure along with the a higher level human resources harmonization across the globe. The need in the direction of conformity throughout worldwide business results through the globalization associated with small business plus the requirement of a typical pair of business specifications in order to facilitate worldwide business as well as expense. However, you'll find troubles associated with the transition by in your area acknowledged basic business routines in order to IFRS. These transition troubles are while underneath:
1. Through the change to help IFRS, organizations deal with extreme stress with means, in particular if you experience a moment in which 2 cancelling programs are needed, and the elevated disclosure specifications and information desires frequently overwhelm your existing accounting information method. Also, your scope in the influence on programs is frequently underestimated. So, a new prepared tactic is essential before usage of IFRS.
2. Increase within expense initially caused by two exposure of reporting requirement, how the entity may well should match until whole convergence is usually achieved. This can be amortized in addition to borne simply by the corporate. 3. The enterprise will need to incur further charge pertaining to changing their particular facts technology methods and techniques help the idea in order to collate info required for getting together with the revolutionary disclosures and reporting prerequisites. This specific needs to be designed and paid for
88
4. Differences between IGAAP and also IFRS may perhaps result organization decision/financial performance of the enterprise. That result has to be assessed and also phase-wise setup might be taken on.
5. Deficiency of auditors together with IFRS know-how means the auditing charges is going to be increased; therefore more research-based training must connect this gap. 342
6. Confined pool connected with educated useful resource along with persons getting skilled information on IFRS, is usually attended to throughout the usage connected with IFRS training inside interpersonal scientific discipline similar things as well as exercises via graduation, post-graduation as well as specialized courses.
7. In the event IFRS really needs to be consistently realized along with persistently used simply by most stakeholders for instance, employees, auditors, regulators along with levy authorities, after that this really needs to be achieved as a result of training.
8. Modifications are needed to different regulating requirements within the Businesses Behave.
9. It is necessary to understand that the changeover in order to IFRS is a lot more than a technological business accounting exercising. IFRS in addition have taxes, internal reporting in addition to system implications. This change will be serious, especially when noticed in your bigger wording of latest fiscal reporting atmosphere, which include a great ever-intensifying motion to sensible value accounting.
10. This India nationwide rules, guidelines as well as expectations ought to be changed/altered to experience the required purpose regarding convergence together with IFRS. This is it being performed by means of ICAI. This adoption regarding IFRS will increase comparability regarding combined company accounts and also degrees of transparency for many companies, as an example, through expanded portion disclosures, exposure unfunded pension check responsibilities and also the recognition regarding derivatives in harmony bedding with reasonable worth. It is therefore to become comprehended that, the actual rendering regarding IFRS isn't only concerning diverse standard as well as policies, it's the adoption of the totally diverse system regarding performance way of measuring as well as transmission with the promotes.

89
BIBLIOGRAPHY
www.exideindustries.com
www.exideindustriedltd.com
www.exideindustries.com>about>subsidiaries
https://en.m.wikipedia.org>wiki>ExideIndustried
Exide Company library
http://www.exidecare.com
www.indiamart.com/Exide_Battery
www.exideindustries.com<about>about
www.exideindustries.com>investors>financialresults
www.exideindustries.com>investors>financialreleases
http://economictimes.indiatimes.com/exide-industries-ltd/quarterly/companyid-13895.cms
http://m.moneycontrol.com/exideindustries/EI/financials/consolidated-balance-sheet

90
Recommended