Master in Urban Studies and Territorial Management
Master in Environmental Engineering Strategic Environmental Assessment
2015-2016
Pathways for sustainability
Prof. Doutora Maria do Rosário Partidário
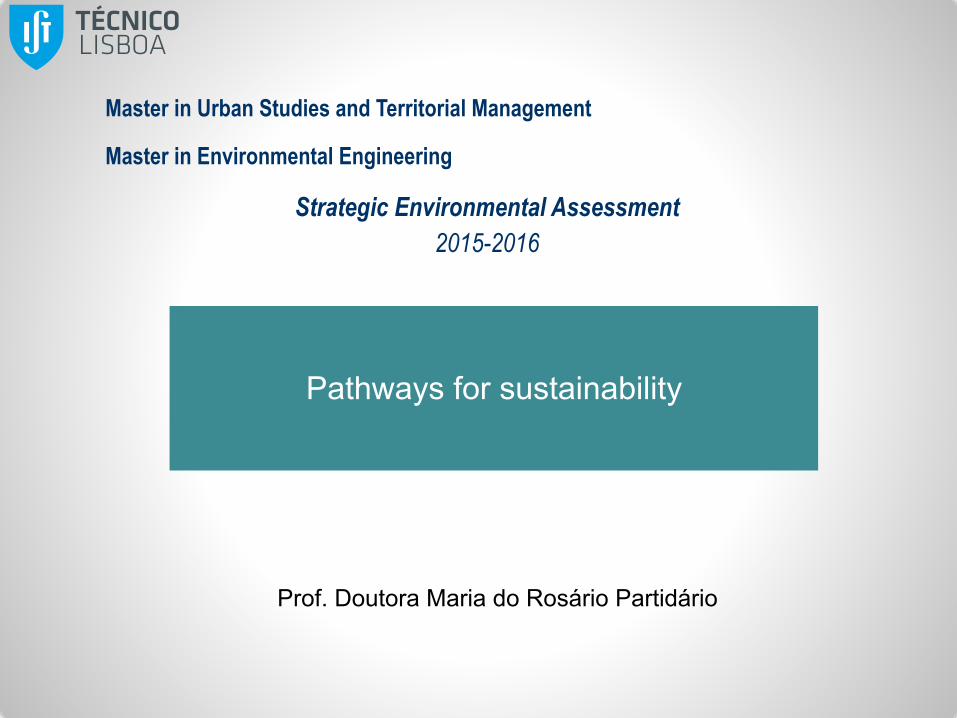
Decision problem Object of assessment Problem framework Governance framework Strategic Reference framework Assessment framework - Critical decision factors,
assessment criteria, indicators
Follow-up: monitoring, control, evaluation
Stage 1 Stage 2
Context and strategic focus Pathways for sustainability and Guidelines
Engagement, process links Continuous Stage
Trend analysis Strategic options Assessment of opportunities and risks Guidelines
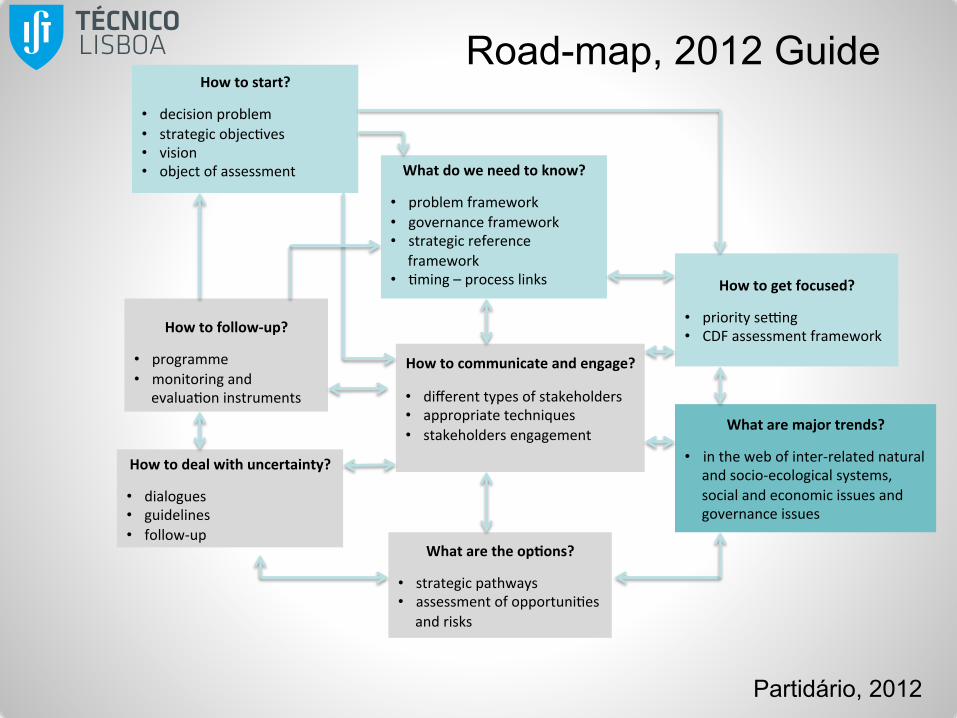
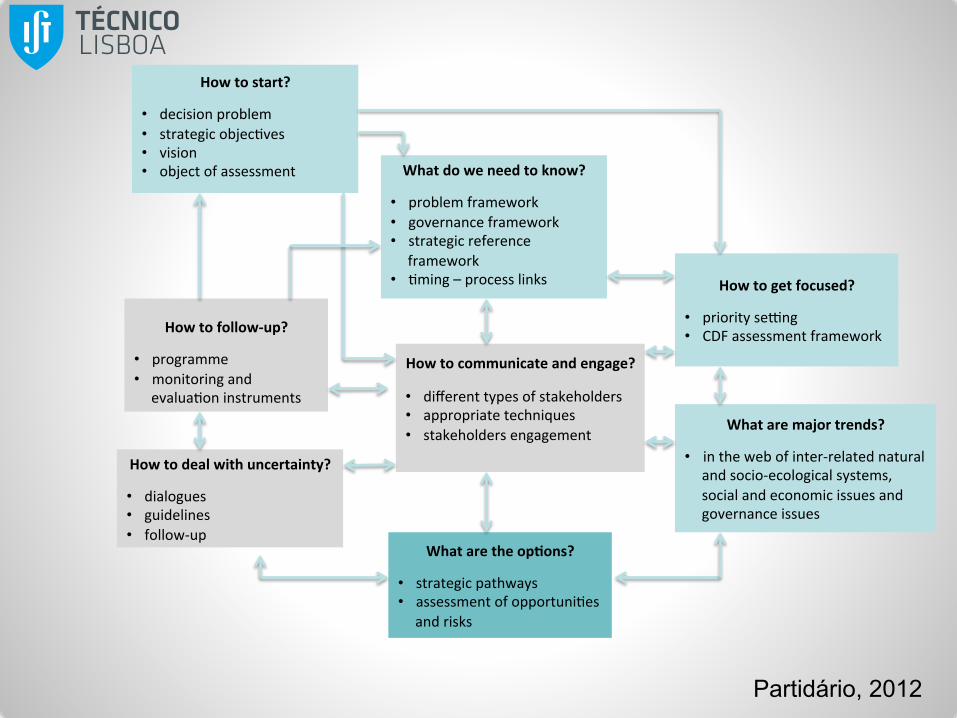
What are major trends?
• in the web of inter-‐related natural and socio-‐ecological systems, social and economic issues and governance issues
How to start?
• decision problem • strategic objec:ves • vision • object of assessment
What do we need to know?
• problem framework • governance framework • strategic reference
framework • :ming – process links
How to get focused?
• priority se=ng • CDF assessment framework
How to communicate and engage?
• different types of stakeholders • appropriate techniques • stakeholders engagement
What are the op8ons?
• strategic pathways • assessment of opportuni:es
and risks
How to deal with uncertainty?
• dialogues • guidelines • follow-‐up
How to follow-‐up?
• programme • monitoring and
evalua:on instruments
Road-map, 2012 Guide
Partidário, 2012
Trend Analysis
Trend Analysis
• The collection of facts, over a period of time, to spot a pattern, or trend, in relation to a given theme / situation.
• Trend analysis need to consider the driving forces that may eventually change current trends.
• In trend analysis we observe patterns of change and relate to driving forces.
Partidário, 2012
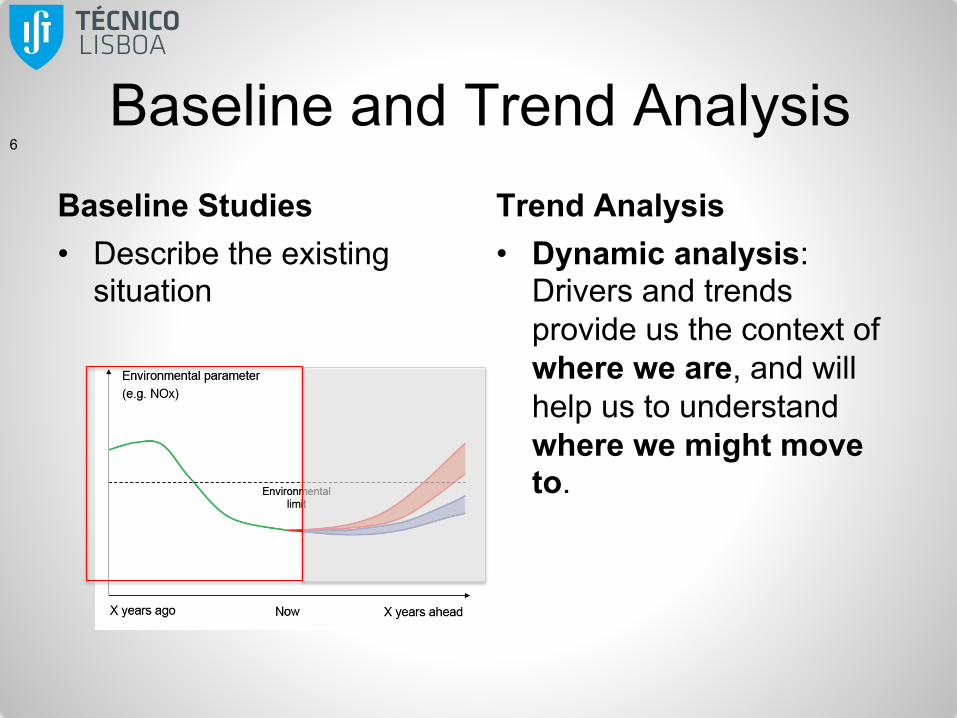
Baseline and Trend Analysis
• Describe the existing situation
• Dynamic analysis: Drivers and trends provide us the context of where we are, and will help us to understand where we might move to.
6
Baseline Studies Trend Analysis
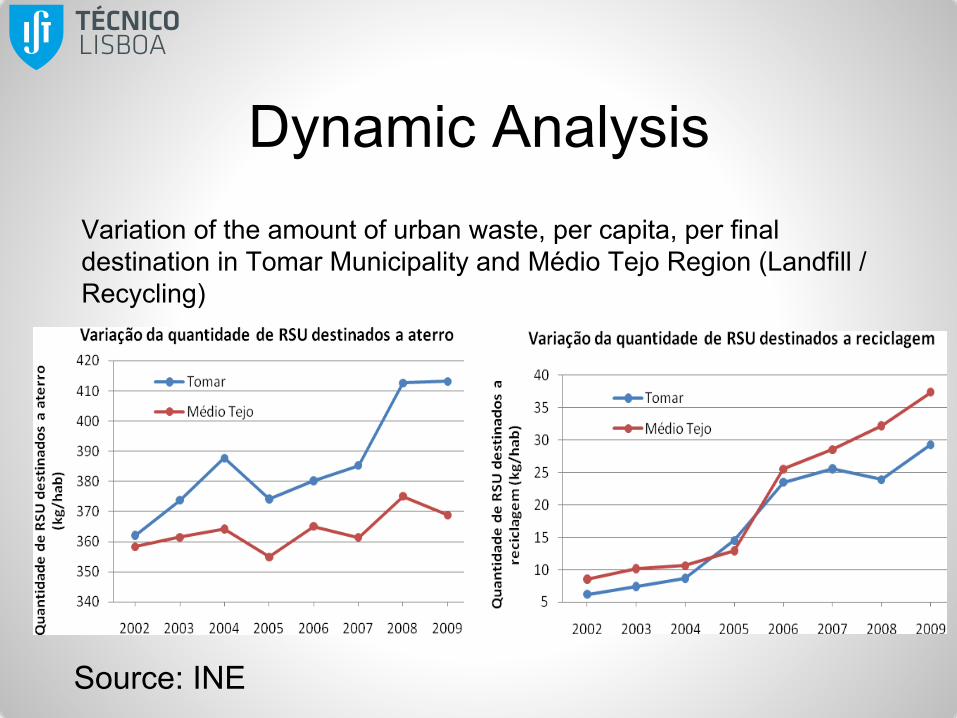
Dynamic Analysis Variation of the amount of urban waste, per capita, per final destination in Tomar Municipality and Médio Tejo Region (Landfill / Recycling)
Source: INE
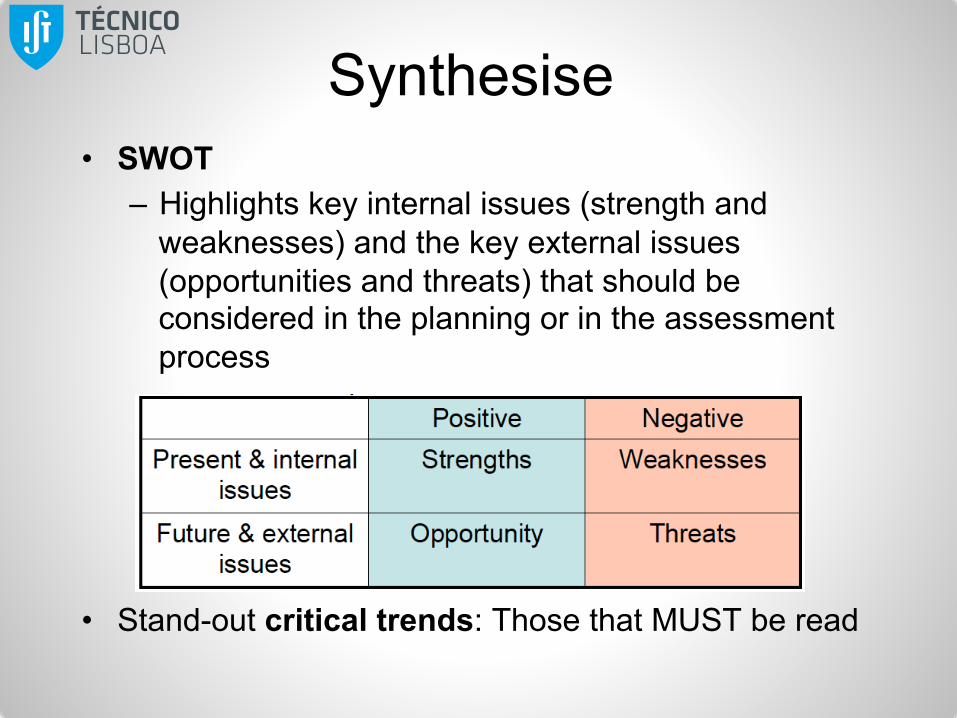
Synthesise • SWOT
– Highlights key internal issues (strength and weaknesses) and the key external issues (opportunities and threats) that should be considered in the planning or in the assessment process
• Stand-out critical trends: Those that MUST be read
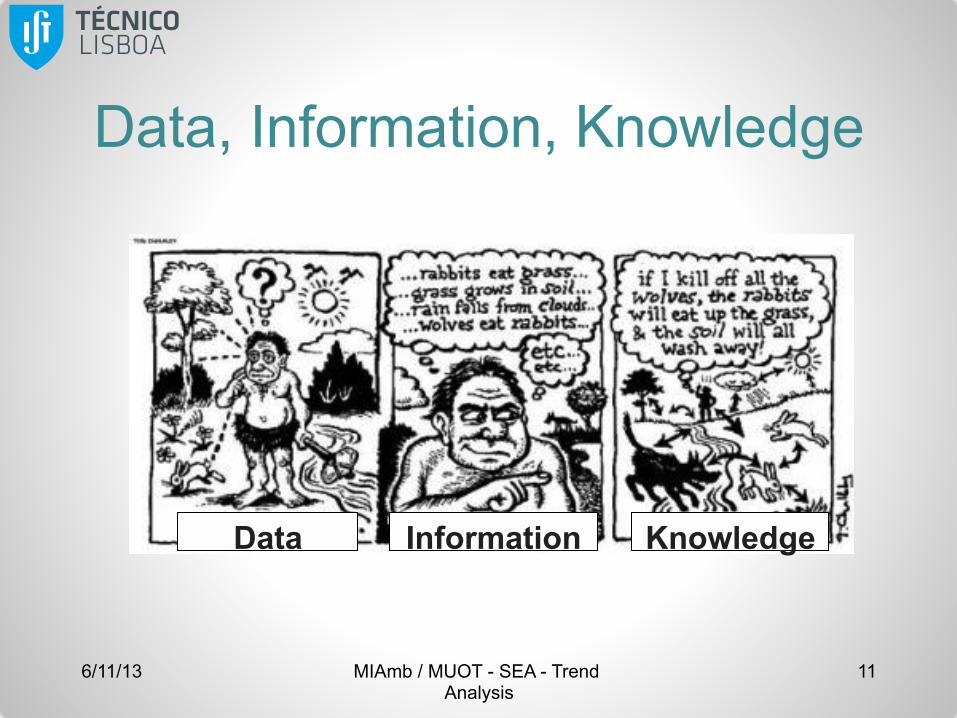
Data, Information and Knowledge
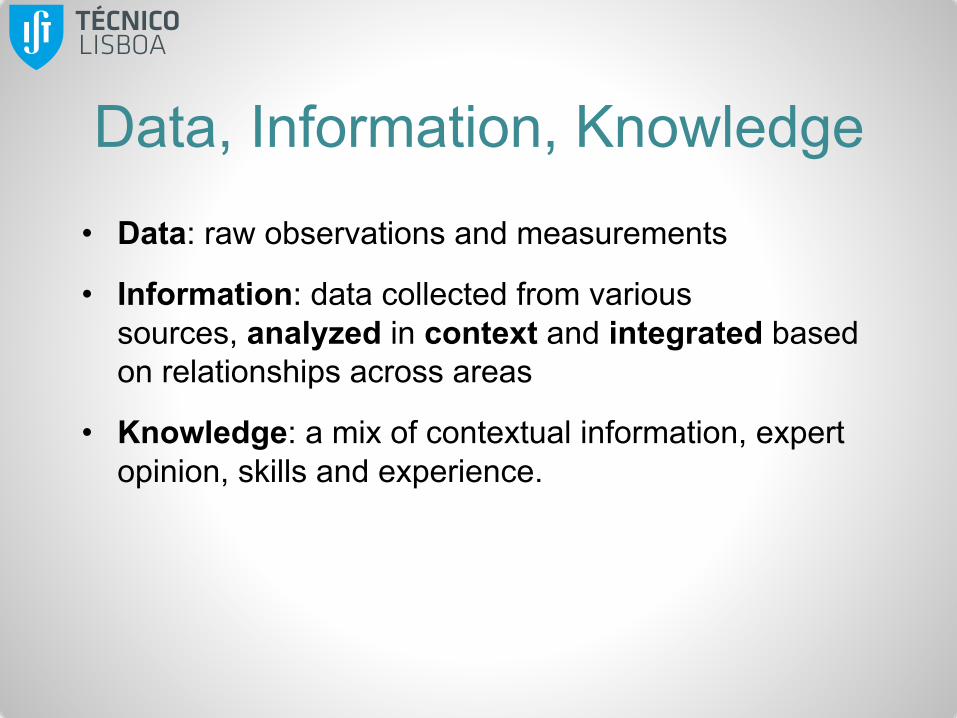
Data, Information, Knowledge • Data: raw observations and measurements
• Information: data collected from various sources, analyzed in context and integrated based on relationships across areas
• Knowledge: a mix of contextual information, expert opinion, skills and experience.
Data, Information, Knowledge
6/11/13 MIAmb / MUOT - SEA - Trend Analysis
11
Data Information Knowledge
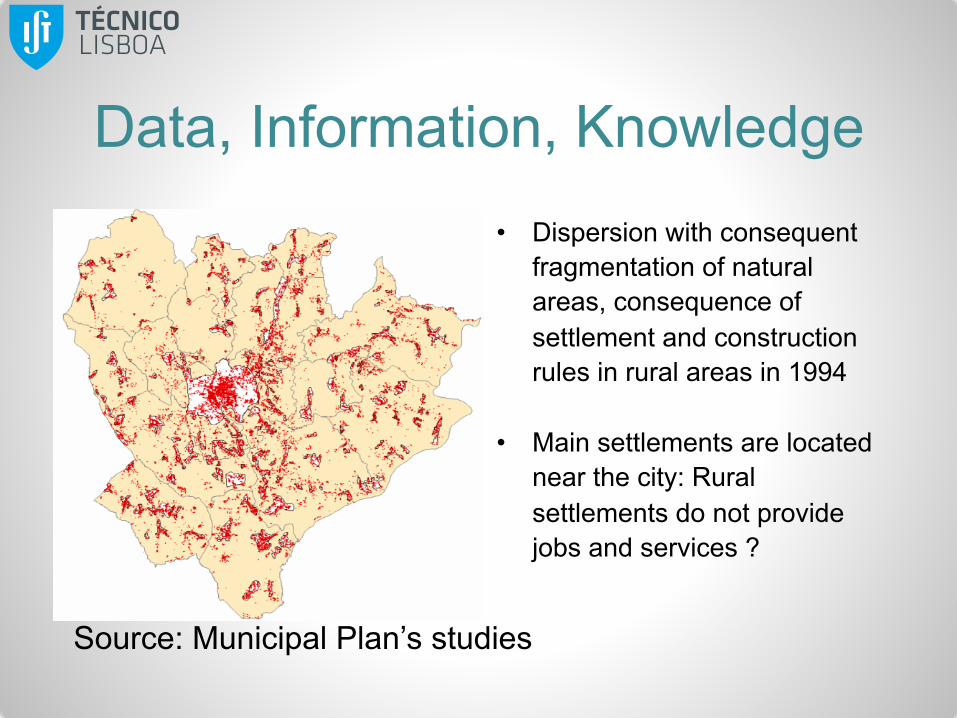
Data, Information, Knowledge Building’s distribution in Tomar
• Dispersion with consequent fragmentation of natural areas, consequence of settlement and construction rules in rural areas in 1994
• Main settlements are located near the city: Rural settlements do not provide jobs and services ?
Source: Municipal Plan’s studies
Qualitative & Quantitative Indicators
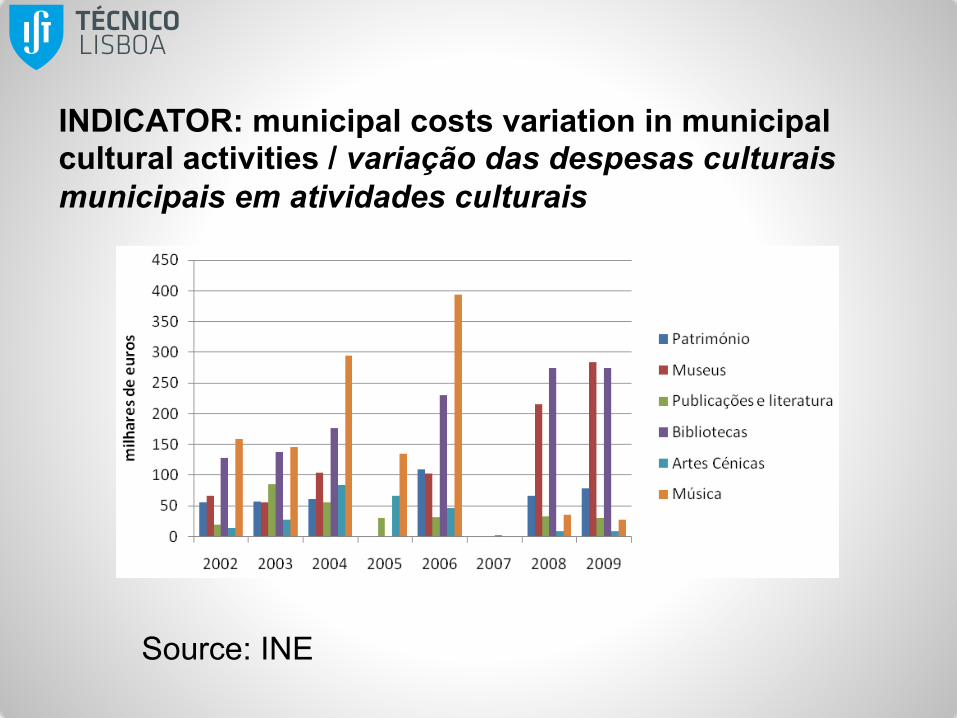
INDICATOR: municipal costs variation in municipal cultural activities / variação das despesas culturais municipais em atividades culturais
Source: INE
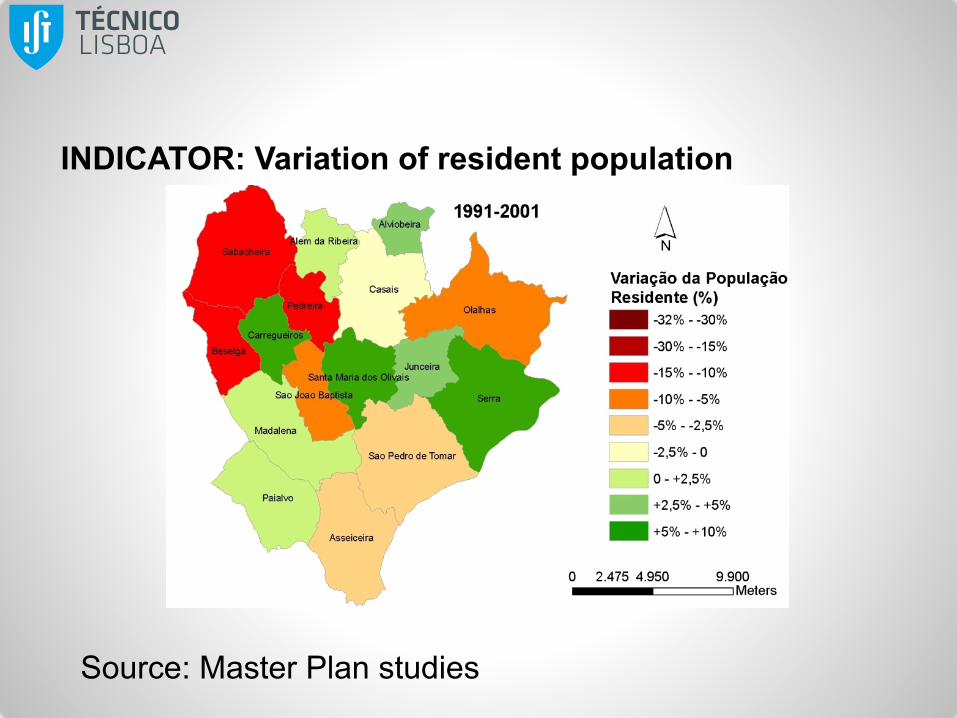
INDICATOR: Variation of resident population
Source: Master Plan studies
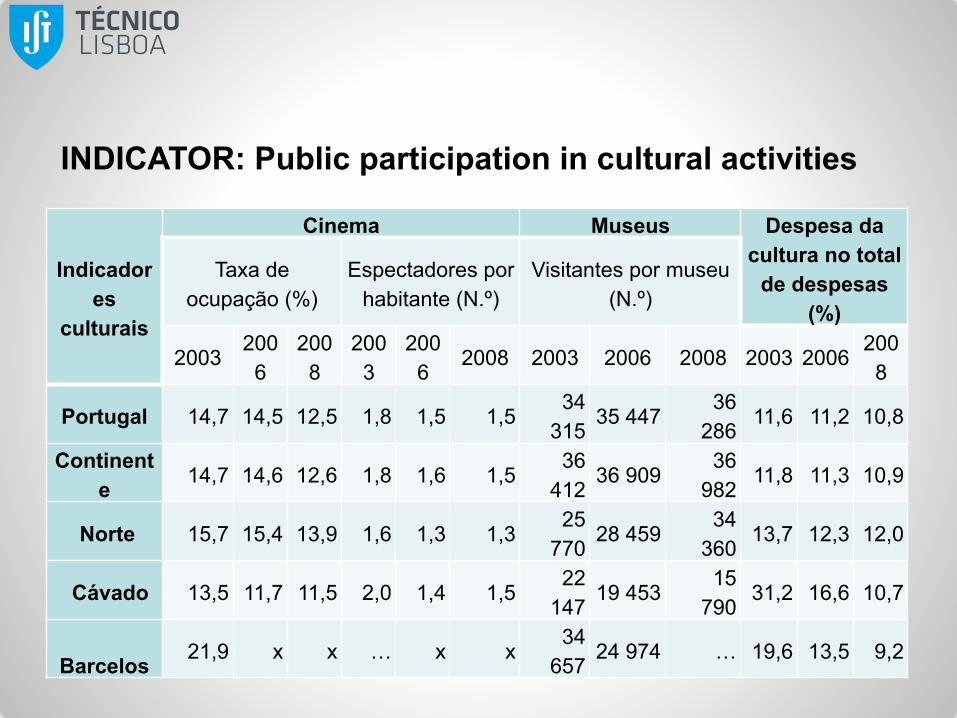
INDICATOR: Public participation in cultural activities
Source: INE, Anuário EstaHs:co -‐ Norte 2003, 2006, 2008
Indicadores
culturais
Cinema Museus Despesa da cultura no total
de despesas (%)
Taxa de ocupação (%)
Espectadores por habitante (N.º)
Visitantes por museu (N.º)
2003 200
6 200
8 200
3 200
6 2008 2003 2006 2008 2003 2006
2008
Portugal 14,7 14,5 12,5 1,8 1,5 1,5 34
315 35 447
36 286
11,6 11,2 10,8
Continente 14,7 14,6 12,6 1,8 1,6 1,5
36 412
36 909 36
982 11,8 11,3 10,9
Norte 15,7 15,4 13,9 1,6 1,3 1,3 25
770 28 459
34 360
13,7 12,3 12,0
Cávado 13,5 11,7 11,5 2,0 1,4 1,5 22
147 19 453
15 790
31,2 16,6 10,7
Barcelos 21,9 x x … x x
34 657
24 974 … 19,6 13,5 9,2
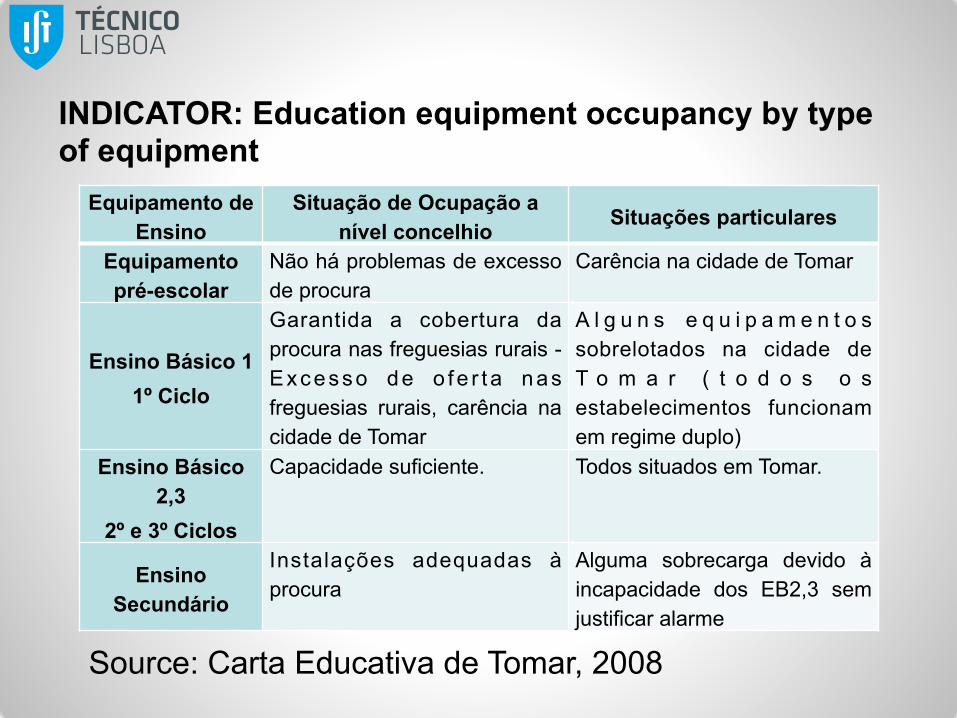
INDICATOR: Education equipment occupancy by type of equipment
Source: Carta Educativa de Tomar, 2008
Equipamento de Ensino
Situação de Ocupação a nível concelhio Situações particulares
Equipamento pré-escolar
Não há problemas de excesso de procura
Carência na cidade de Tomar
Ensino Básico 1 1º Ciclo
Garantida a cobertura da procura nas freguesias rurais - Excesso de o fe r t a nas freguesias rurais, carência na cidade de Tomar
A l g u n s e q u i p a m e n t o s sobrelotados na cidade de T o m a r ( t o d o s o s estabelecimentos funcionam em regime duplo)
Ensino Básico 2,3
2º e 3º Ciclos
Capacidade suficiente. Todos situados em Tomar.
Ensino Secundário
Instalações adequadas à procura
Alguma sobrecarga devido à incapacidade dos EB2,3 sem justificar alarme
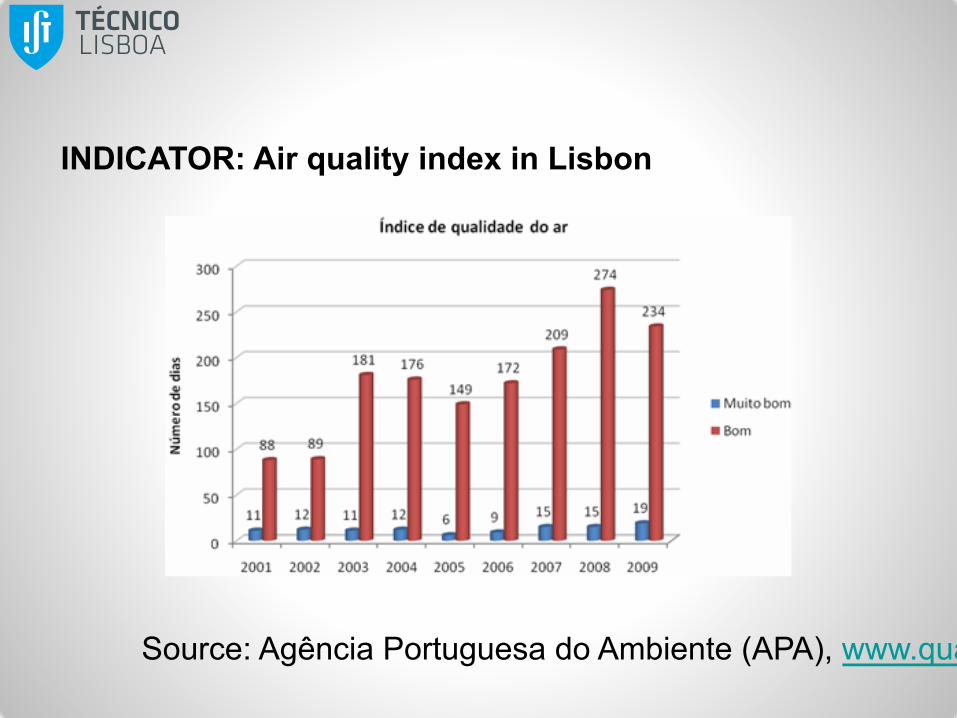
INDICATOR: Air quality index in Lisbon
Source: Agência Portuguesa do Ambiente (APA), www.qualar.org
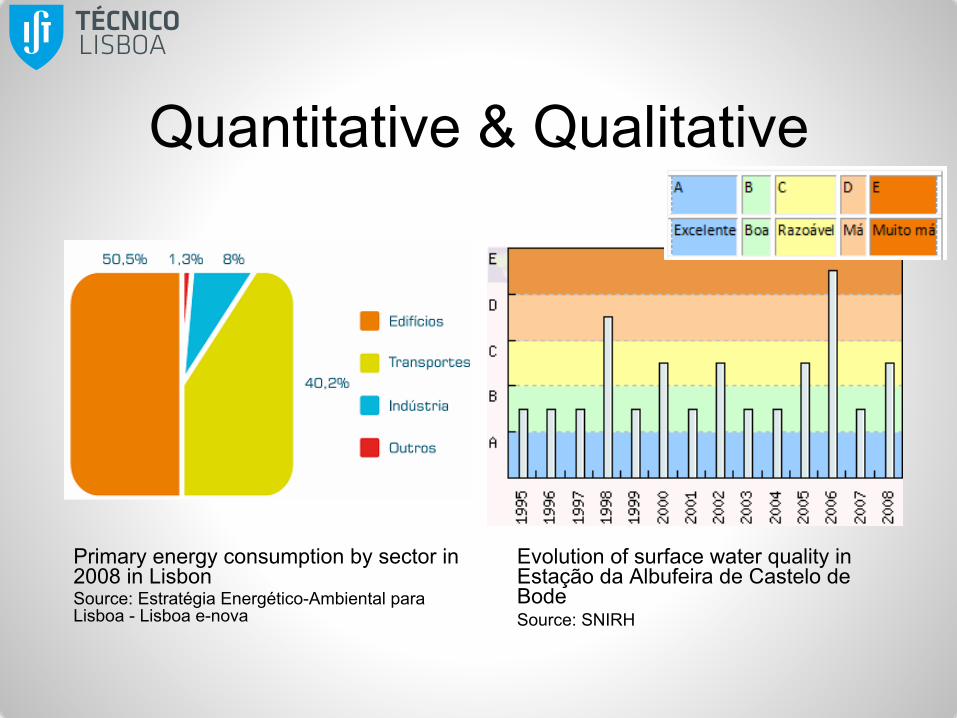
Quantitative & Qualitative
Primary energy consumption by sector in 2008 in Lisbon Source: Estratégia Energético-Ambiental para Lisboa - Lisboa e-nova
Evolution of surface water quality in Estação da Albufeira de Castelo de Bode Source: SNIRH
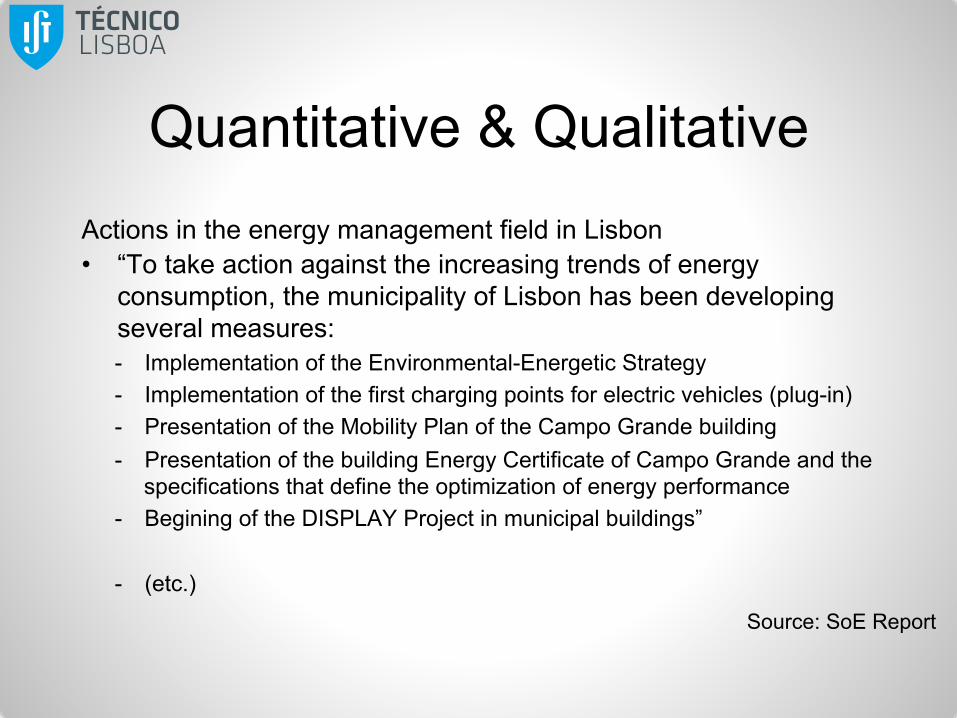
Quantitative & Qualitative Actions in the energy management field in Lisbon • “To take action against the increasing trends of energy
consumption, the municipality of Lisbon has been developing several measures: - Implementation of the Environmental-Energetic Strategy - Implementation of the first charging points for electric vehicles (plug-in) - Presentation of the Mobility Plan of the Campo Grande building - Presentation of the building Energy Certificate of Campo Grande and the
specifications that define the optimization of energy performance - Begining of the DISPLAY Project in municipal buildings”
- (etc.)
Source: SoE Report
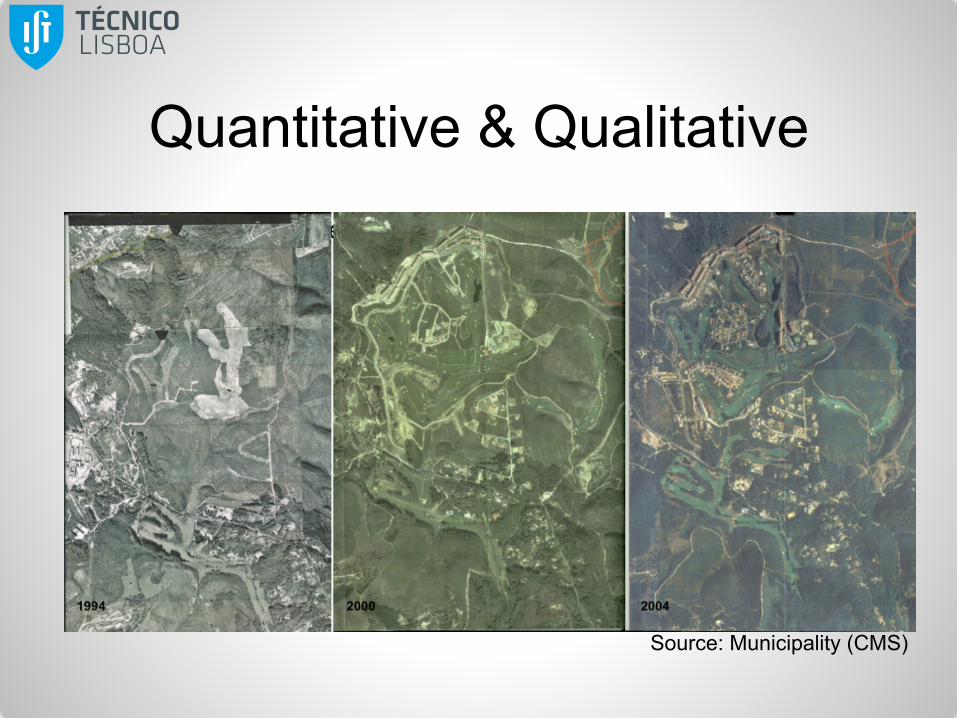
Quantitative & Qualitative Occupied area by forest production and construction in Serra da Carregueira
Source: Municipality (CMS)
The need for Context
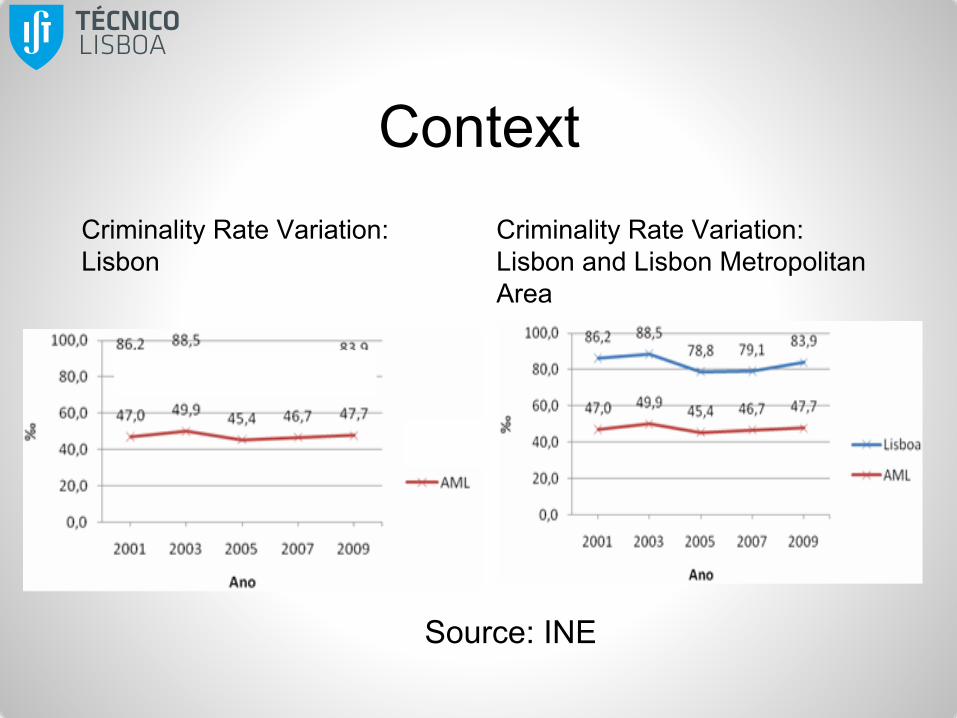
Context Criminality Rate Variation: Lisbon
Criminality Rate Variation: Lisbon and Lisbon Metropolitan Area
Source: INE
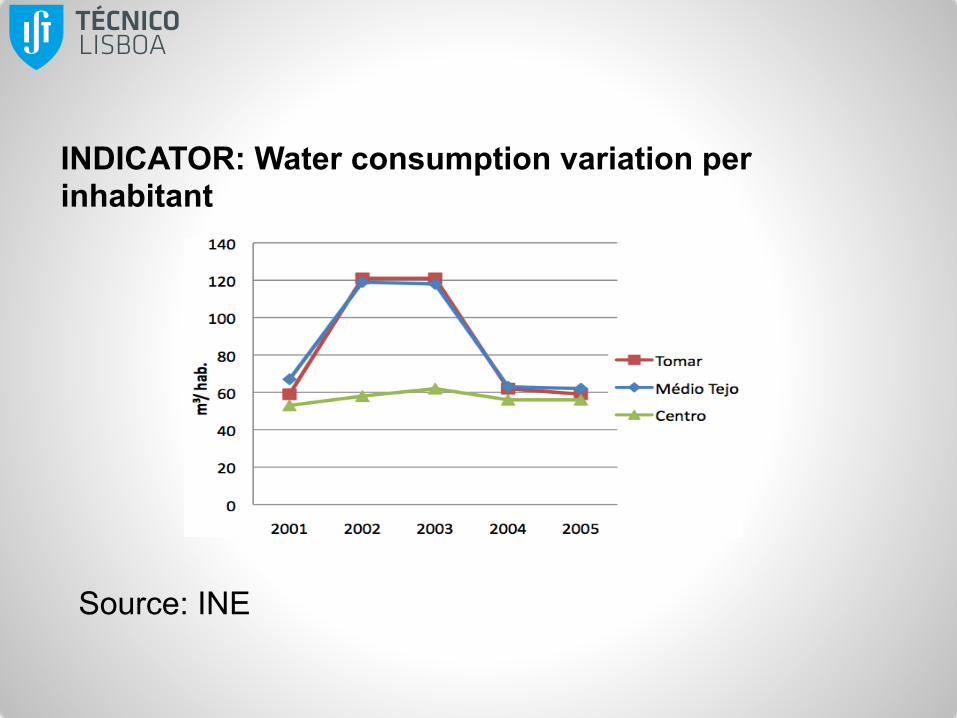
INDICATOR: Water consumption variation per inhabitant
Source: INE
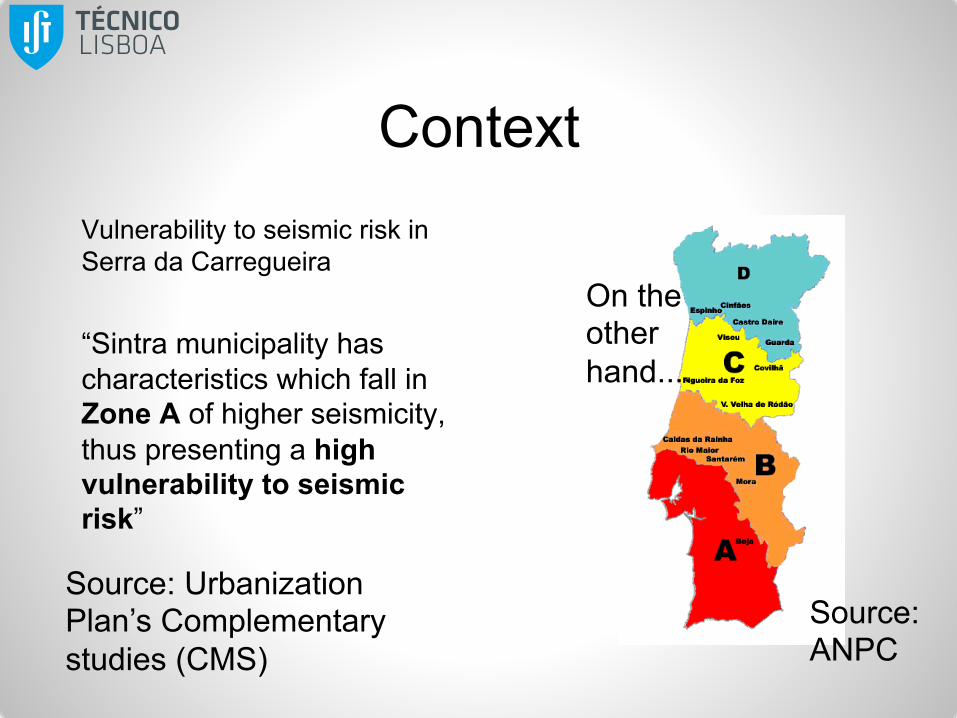
Context Vulnerability to seismic risk in Serra da Carregueira “Sintra municipality has characteristics which fall in Zone A of higher seismicity, thus presenting a high vulnerability to seismic risk”
Source: Urbanization Plan’s Complementary studies (CMS)
On the other hand....
Source: ANPC
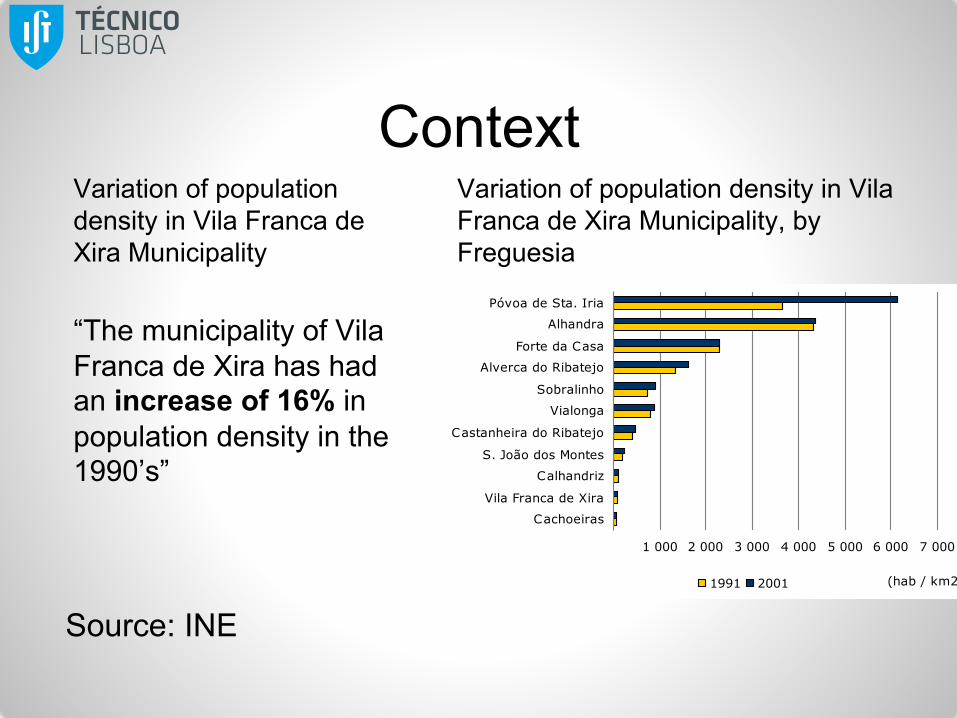
Context Variation of population density in Vila Franca de Xira Municipality “The municipality of Vila Franca de Xira has had an increase of 16% in population density in the 1990’s”
Variation of population density in Vila Franca de Xira Municipality, by Freguesia
1 000 2 000 3 000 4 000 5 000 6 000 7 000
Cachoeiras
Vila Franca de Xira
Calhandriz
S. João dos Montes
Castanheira do Ribatejo
Vialonga
Sobralinho
Alverca do Ribatejo
Forte da Casa
Alhandra
Póvoa de Sta. Iria
(hab / km2)1991 2001
Source: INE
Dealing with Excess Data
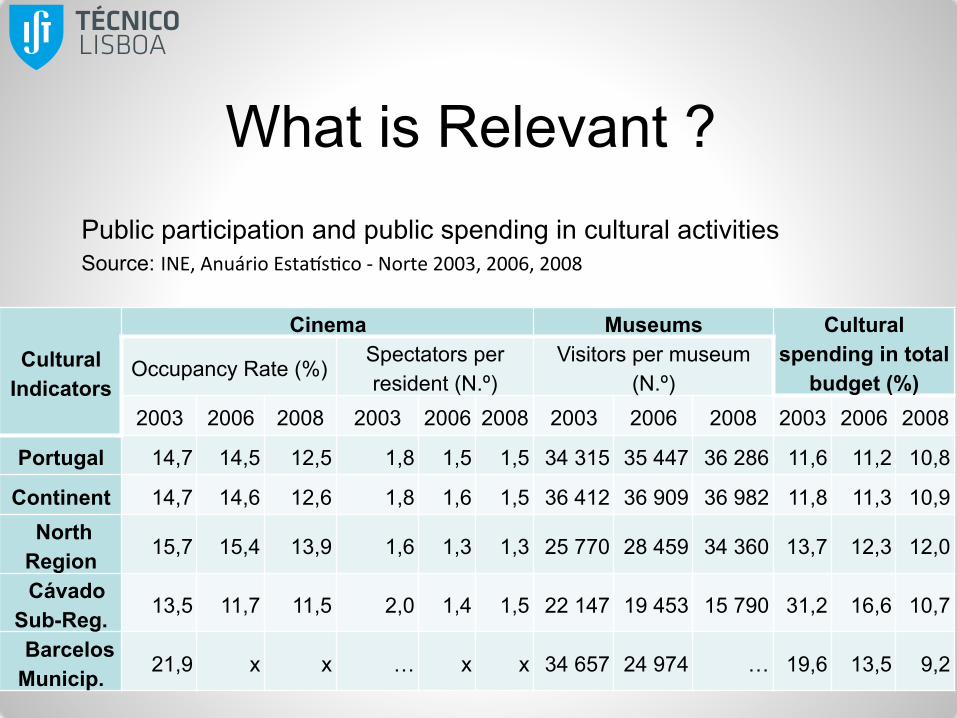
What is Relevant ? Public participation and public spending in cultural activities Source: INE, Anuário EstaHs:co -‐ Norte 2003, 2006, 2008
Cultural Indicators
Cinema Museums Cultural spending in total
budget (%) Occupancy Rate (%) Spectators per resident (N.º)
Visitors per museum (N.º)
2003 2006 2008 2003 2006 2008 2003 2006 2008 2003 2006 2008
Portugal 14,7 14,5 12,5 1,8 1,5 1,5 34 315 35 447 36 286 11,6 11,2 10,8
Continent 14,7 14,6 12,6 1,8 1,6 1,5 36 412 36 909 36 982 11,8 11,3 10,9 North Region 15,7 15,4 13,9 1,6 1,3 1,3 25 770 28 459 34 360 13,7 12,3 12,0
Cávado Sub-Reg. 13,5 11,7 11,5 2,0 1,4 1,5 22 147 19 453 15 790 31,2 16,6 10,7
Barcelos Municip. 21,9 x x … x x 34 657 24 974 … 19,6 13,5 9,2
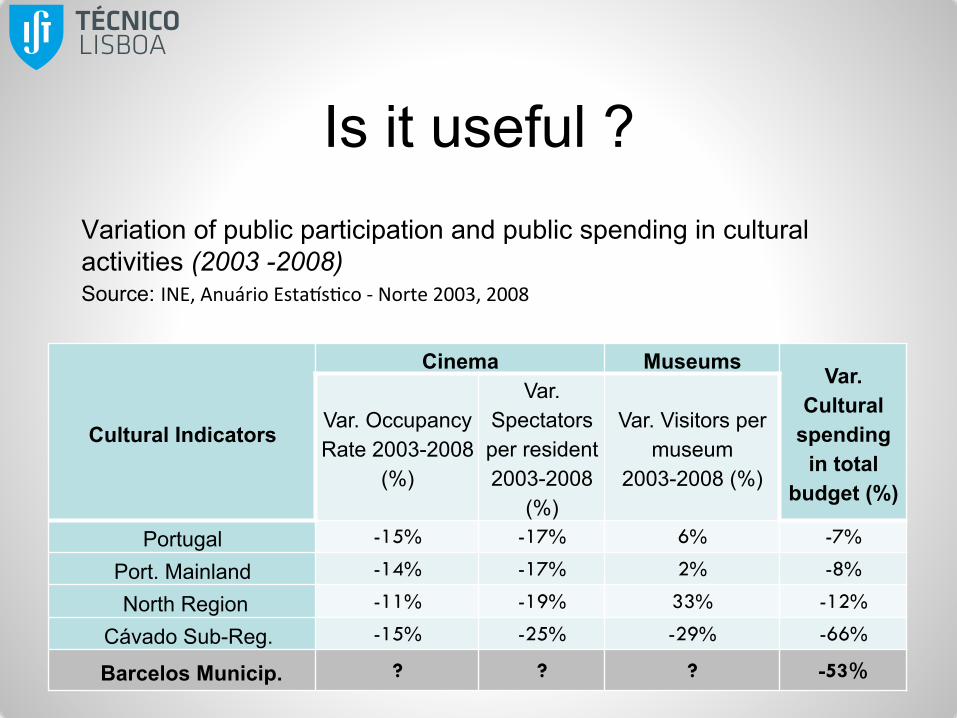
Is it useful ? Variation of public participation and public spending in cultural activities (2003 -2008) Source: INE, Anuário EstaHs:co -‐ Norte 2003, 2008
Cultural Indicators
Cinema Museums Var. Cultural
spending in total
budget (%)
Var. Occupancy Rate 2003-2008
(%)
Var. Spectators per resident 2003-2008
(%)
Var. Visitors per museum
2003-2008 (%)
Portugal -15% -17% 6% -7%
Port. Mainland -14% -17% 2% -8%
North Region -11% -19% 33% -12%
Cávado Sub-Reg. -15% -25% -29% -66%
Barcelos Municip. ? ? ? -53%
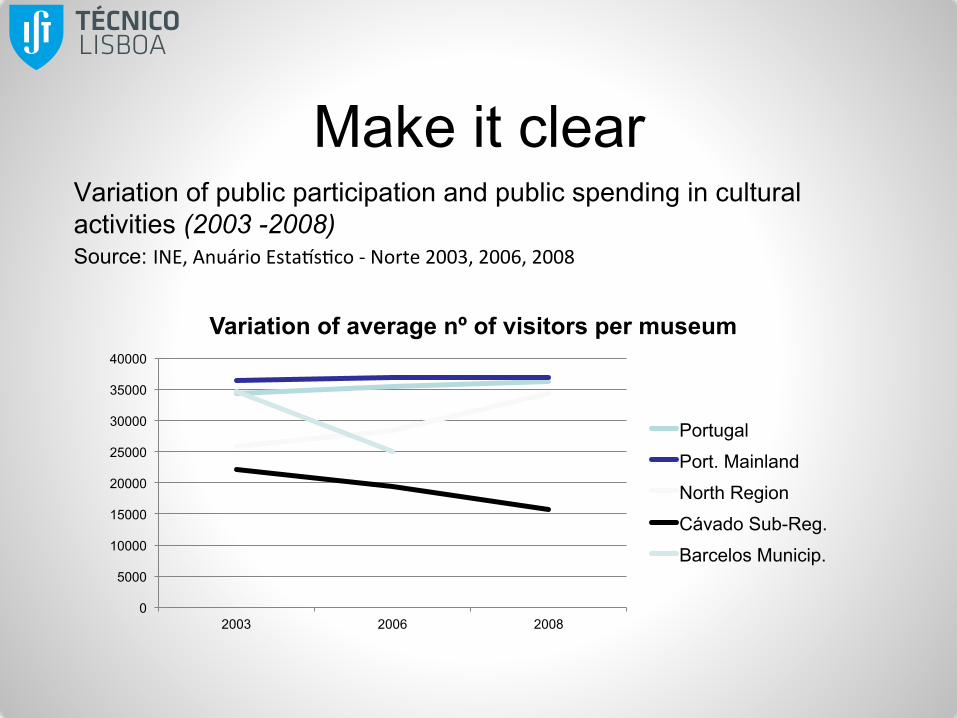
Make it clear Variation of public participation and public spending in cultural activities (2003 -2008) Source: INE, Anuário EstaHs:co -‐ Norte 2003, 2006, 2008
0
5000
10000
15000
20000
25000
30000
35000
40000
2003 2006 2008
Variation of average nº of visitors per museum
Portugal
Port. Mainland
North Region
Cávado Sub-Reg.
Barcelos Municip.
Integrating data
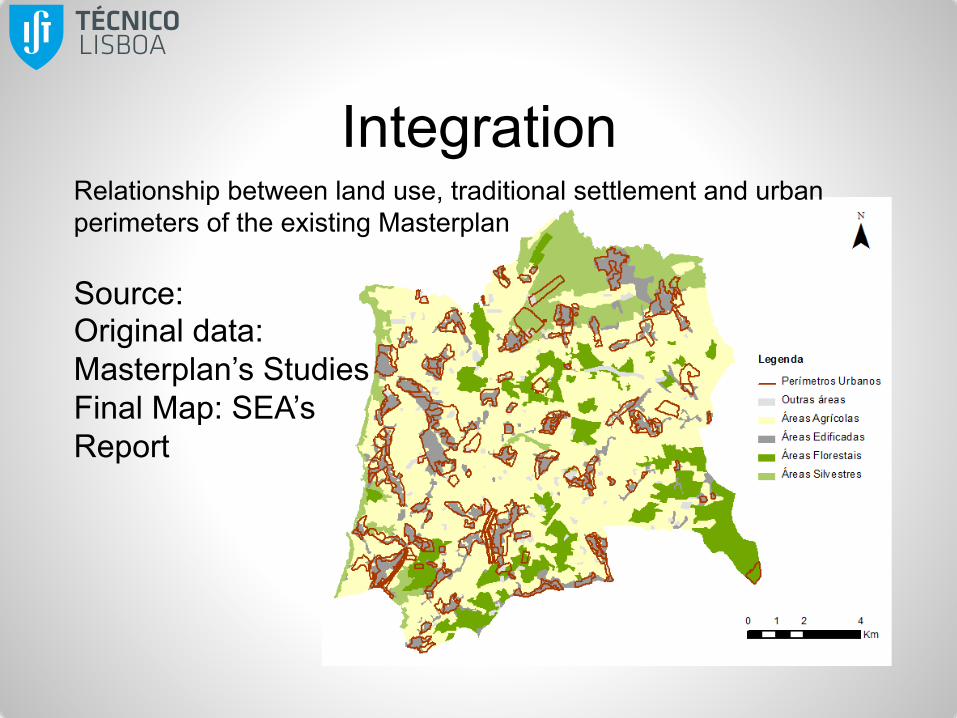
Integration Relationship between land use, traditional settlement and urban perimeters of the existing Masterplan
Source: Original data: Masterplan’s Studies Final Map: SEA’s Report
Possible Sources and Key Words
Sources (examples) • Plan’s studies: Recognized source. No use in
duplicating the effort • INE • Agenda 21, SoE Reports • Local studies from recognized source (sectoral
studies, etc) • Agência Portuguesa do Ambiente (APA),
www.qualar.org • Sistema Nacional de Informação de Recursos
Hídricos (SNIRH) http://snirh.pt • ...
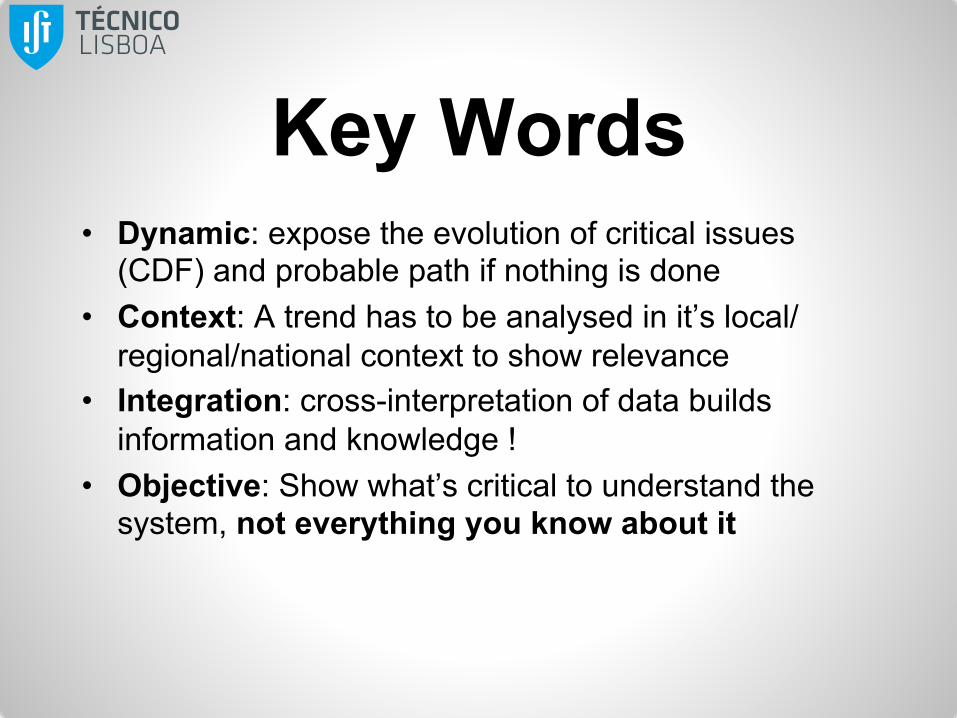
Key Words • Dynamic: expose the evolution of critical issues
(CDF) and probable path if nothing is done • Context: A trend has to be analysed in it’s local/
regional/national context to show relevance • Integration: cross-interpretation of data builds
information and knowledge ! • Objective: Show what’s critical to understand the
system, not everything you know about it
What are major trends?
• in the web of inter-‐related natural and socio-‐ecological systems, social and economic issues and governance issues
How to start?
• decision problem • strategic objec:ves • vision • object of assessment
What do we need to know?
• problem framework • governance framework • strategic reference
framework • :ming – process links
How to get focused?
• priority se=ng • CDF assessment framework
How to communicate and engage?
• different types of stakeholders • appropriate techniques • stakeholders engagement
What are the op8ons?
• strategic pathways • assessment of opportuni:es
and risks
How to deal with uncertainty?
• dialogues • guidelines • follow-‐up
How to follow-‐up?
• programme • monitoring and
evalua:on instruments
Partidário, 2012
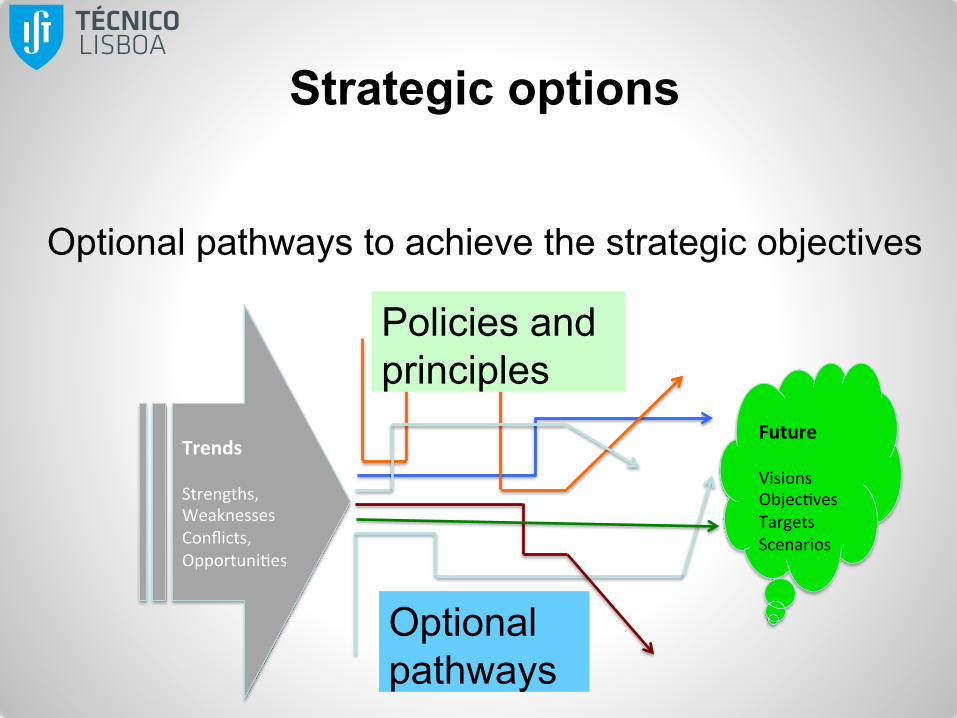
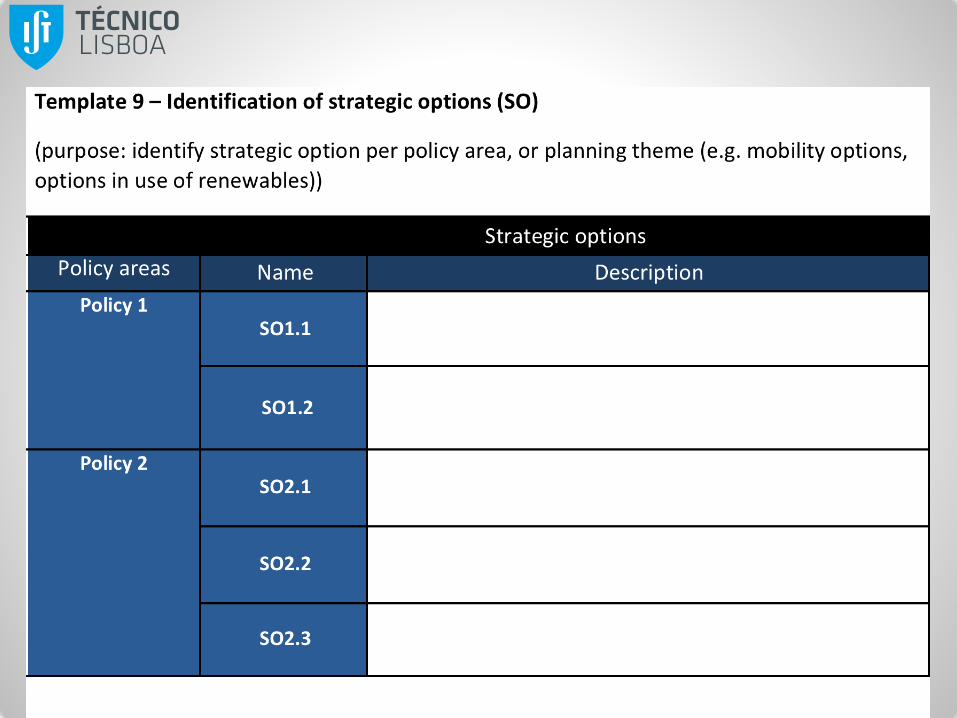
Strategic options
Optional pathways to achieve the strategic objectives
Future Visions Objec:ves Targets Scenarios
Optional pathways
Trends Strengths, Weaknesses Conflicts, Opportuni:es
Policies and principles
"
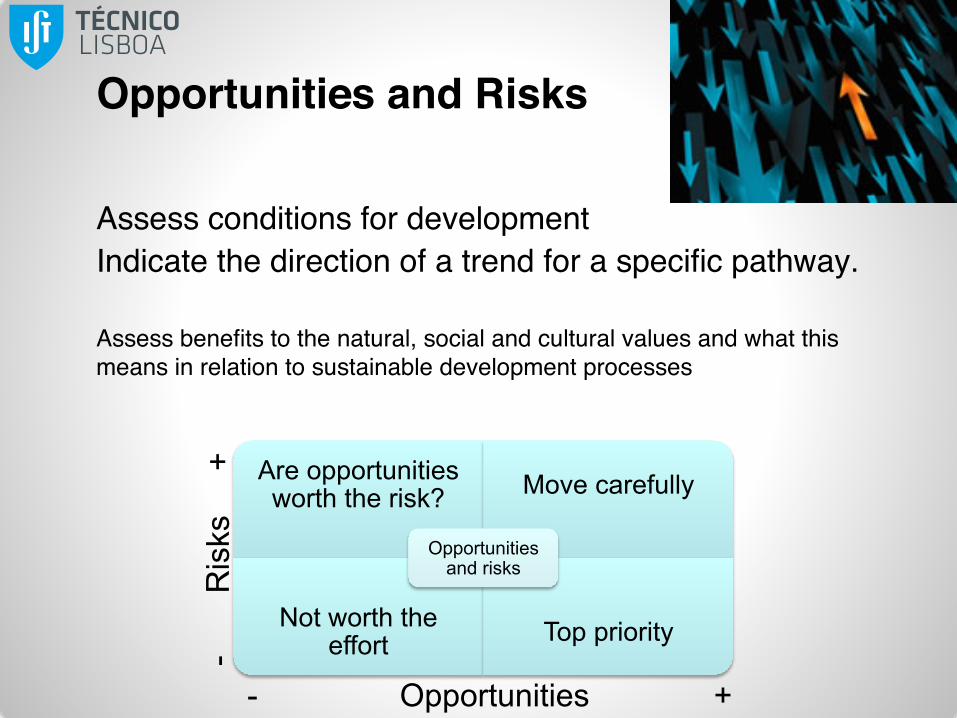
Opportunities and Risks" ""Assess conditions for development "Indicate the direction of a trend for a specific pathway. "
""Assess benefits to the natural, social and cultural values and what this means in relation to sustainable development processes""
Are opportunities worth the risk? Move carefully
Not worth the effort Top priority
Opportunities and risks
-
Ris
ks
+
- Opportunities +
SRF
Key Principles IZCM Demonstration Programme)
Strategic priorities
CFD
Assessment criteria
Assessment of the ENGIZC
risks and opportunities
ENGIZC
Thematic Options
Naturalization
Artificialization
Socio-ecological Systems
Institutional options
Fragmented competences
Centralized competences
Articulated competences
Governance Options
Strengthening the role of the State and of public policies
Mainly private investment
Public-private cooperation
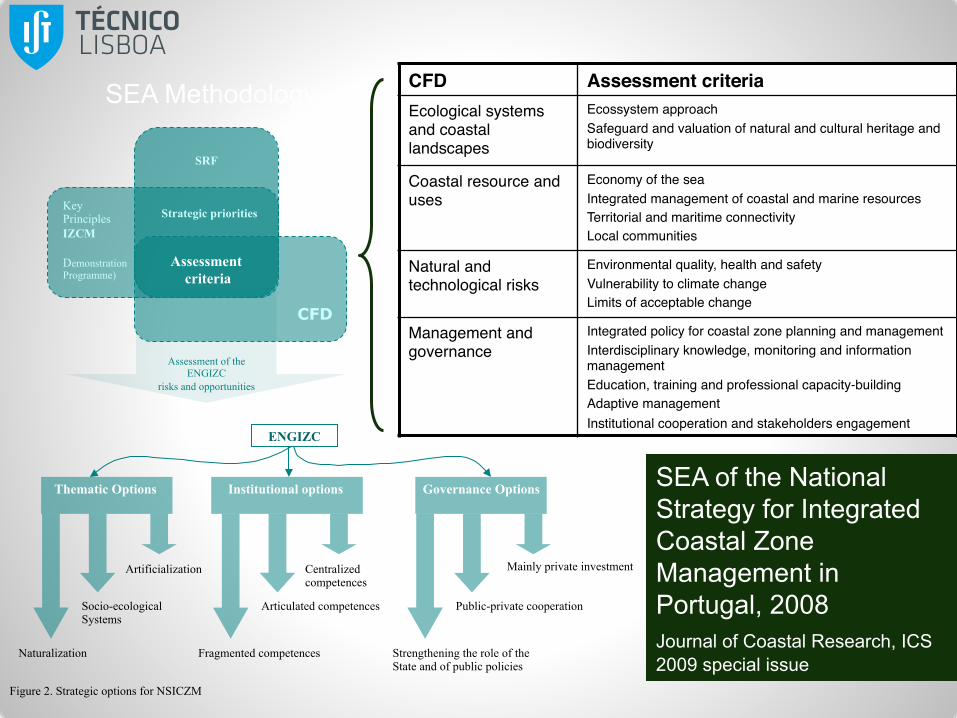
Figure 2. Strategic options for NSICZM
CFD! Assessment criteria!Ecological systems and coastal landscapes"
Ecossystem approach"Safeguard and valuation of natural and cultural heritage and biodiversity"
Coastal resource and uses"
Economy of the sea"Integrated management of coastal and marine resources"Territorial and maritime connectivity"Local communities"
Natural and technological risks"
Environmental quality, health and safety"Vulnerability to climate change"Limits of acceptable change"
Management and governance"
Integrated policy for coastal zone planning and management"Interdisciplinary knowledge, monitoring and information management"Education, training and professional capacity-building"Adaptive management"Institutional cooperation and stakeholders engagement
SEA Methodology
SEA of the National Strategy for Integrated Coastal Zone Management in Portugal, 2008 Journal of Coastal Research, ICS 2009 special issue
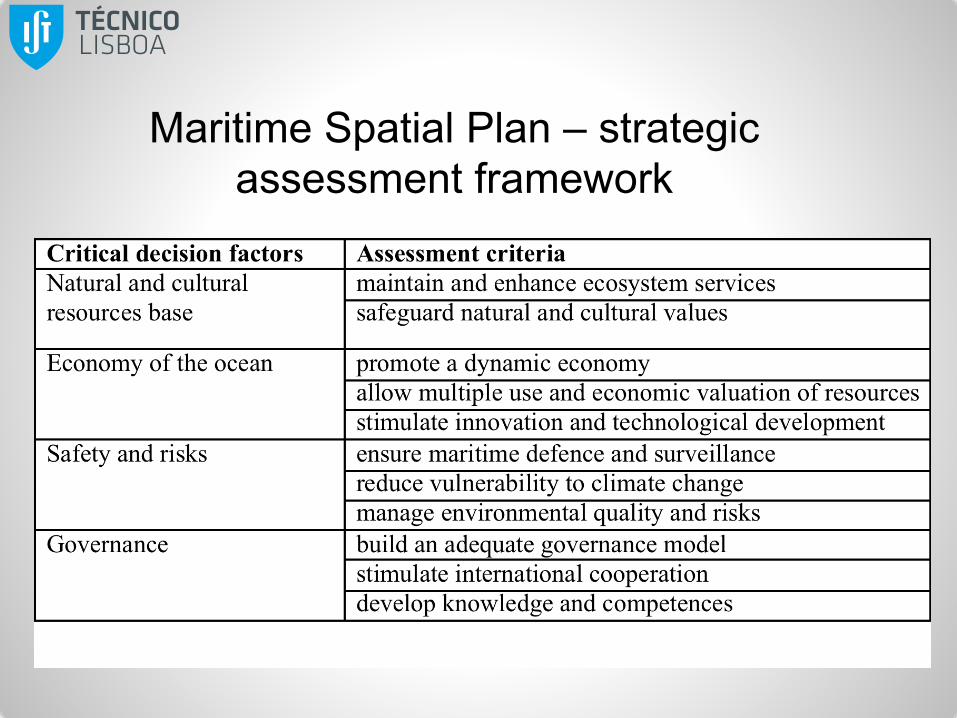
Maritime Spatial Plan – strategic assessment framework
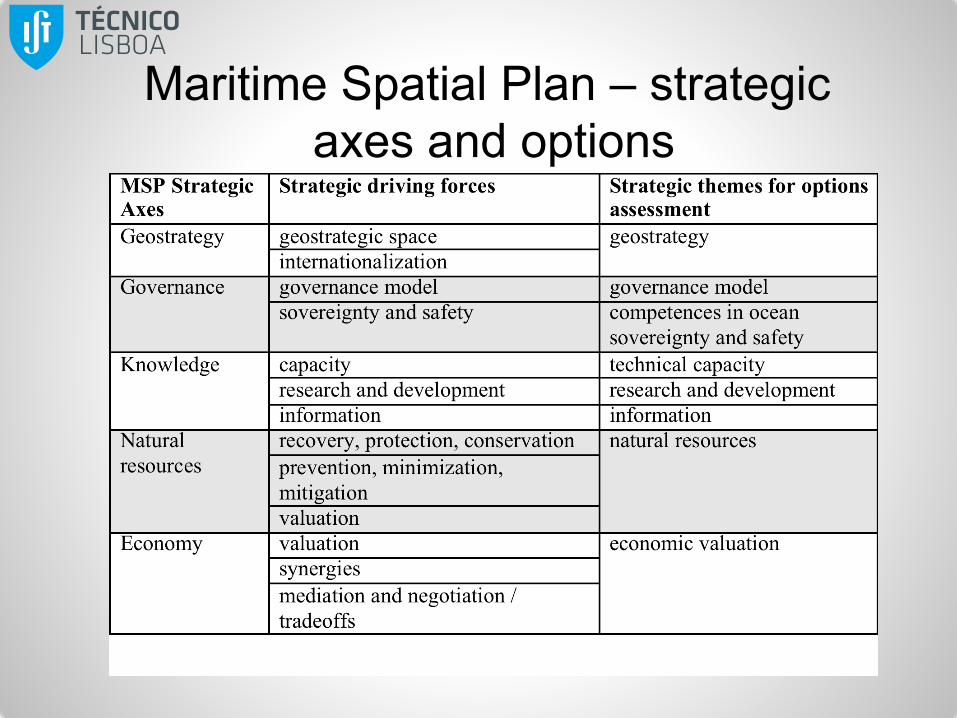
Maritime Spatial Plan – strategic axes and options
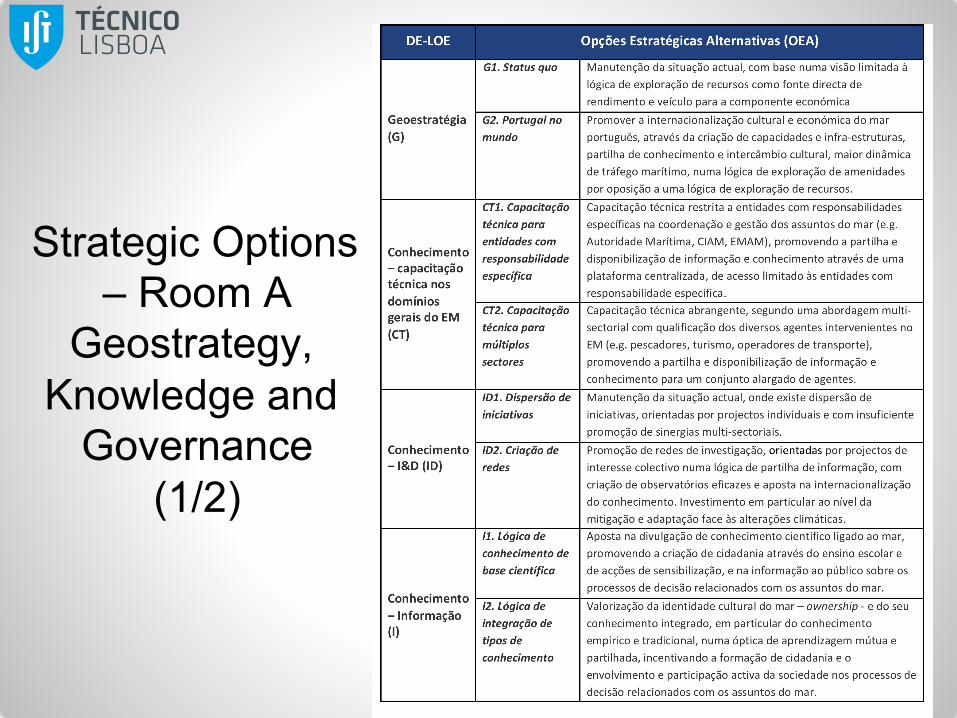
Strategic Options – Room A
Geostrategy, Knowledge and
Governance (1/2)
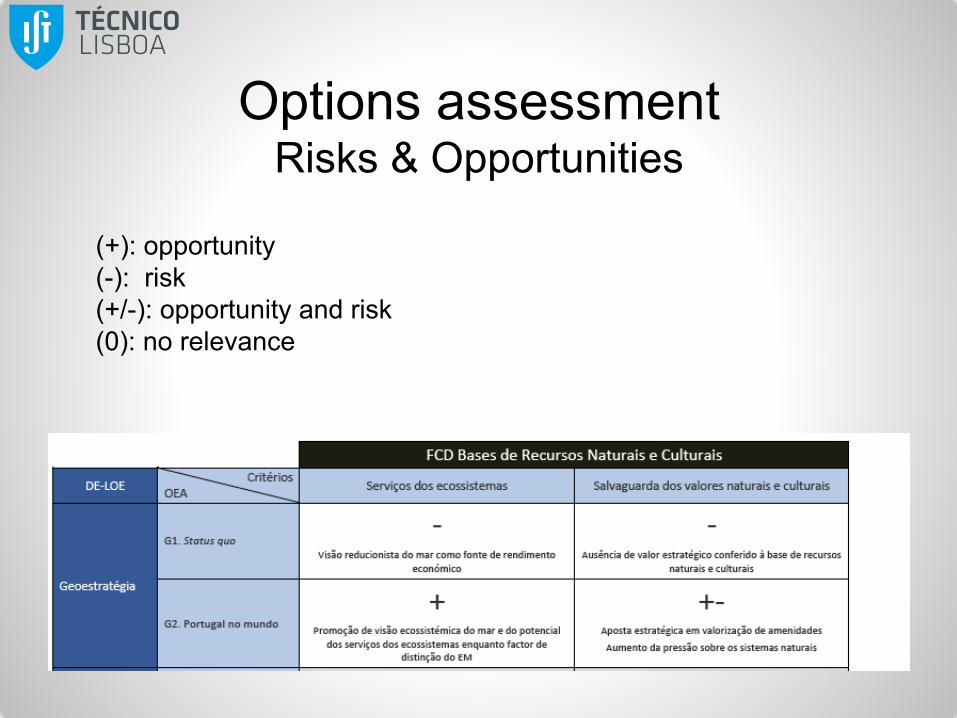
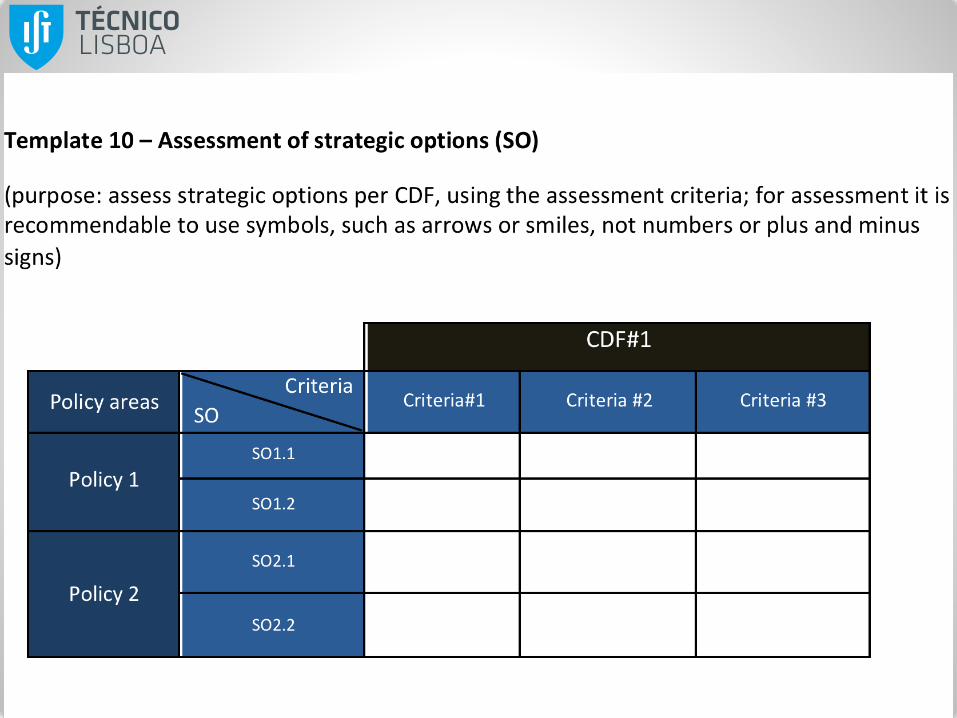
Options assessment Risks & Opportunities
(+): opportunity (-): risk (+/-): opportunity and risk (0): no relevance
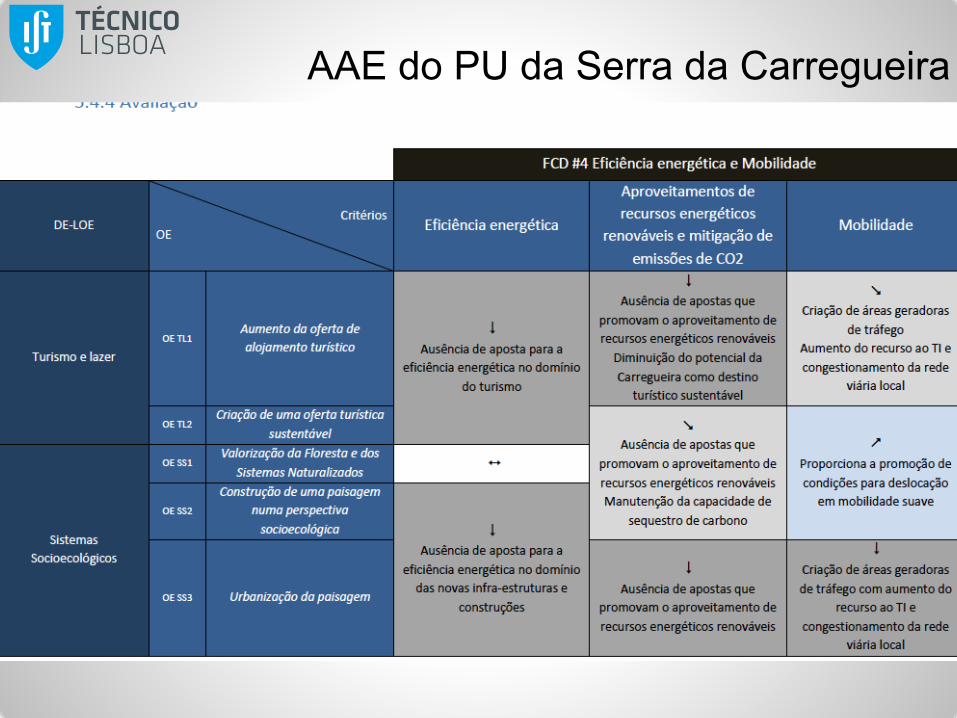
AAE do PU da Serra da Carregueira
Recommended