Embed Size (px)
Citation preview
August 13, 2019
2Q2019 Results Briefing
WILMAR INTERNATIONAL LIMITED
1
IMPORTANT NOTICE
Information in this presentation may contain projections and forward looking statements thatreflect the Company’s current views with respect to future events and financialperformance. These views are based on current assumptions which are subject to variousrisks and which may change over time. No assurance can be given that future events willoccur, that projections will be achieved, or that the Company’s assumptions arecorrect. Actual results may differ materially from those projected.
This presentation does not constitute or form part of any opinion on any advice to sell, or anysolicitation of any offer to purchase or subscribe for, any shares nor shall it or any part of it northe fact of its presentation form the basis of, or be relied upon in connection with, any contractor investment decision.
2
Agenda
1 2Q2019 Financial Performance – Key Takeaways
2 Business Outlook
3 Appendix

2Q2019 Financial Performance – Key Takeaways
4
2Q19 (US$m)vs 2Q18(1)
1H19 (US$m)vs 1H18(1)
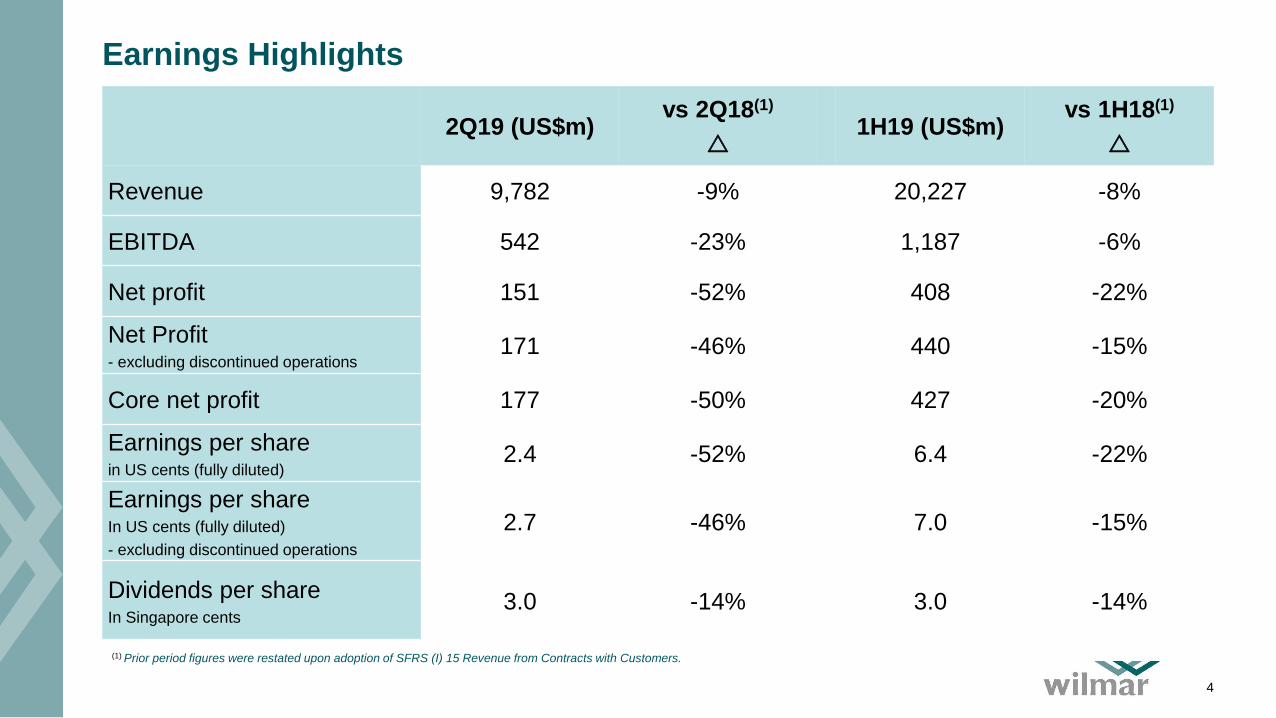
Revenue 9,782 -9% 20,227 -8%
EBITDA 542 -23% 1,187 -6%
Net profit 151 -52% 408 -22%
Net Profit- excluding discontinued operations
171 -46% 440 -15%
Core net profit 177 -50% 427 -20%
Earnings per share in US cents (fully diluted)
2.4 -52% 6.4 -22%
Earnings per shareIn US cents (fully diluted)
- excluding discontinued operations
2.7 -46% 7.0 -15%
Dividends per shareIn Singapore cents
3.0 -14% 3.0 -14%
Earnings Highlights
(1) Prior period figures were restated upon adoption of SFRS (I) 15 Revenue from Contracts with Customers.
5
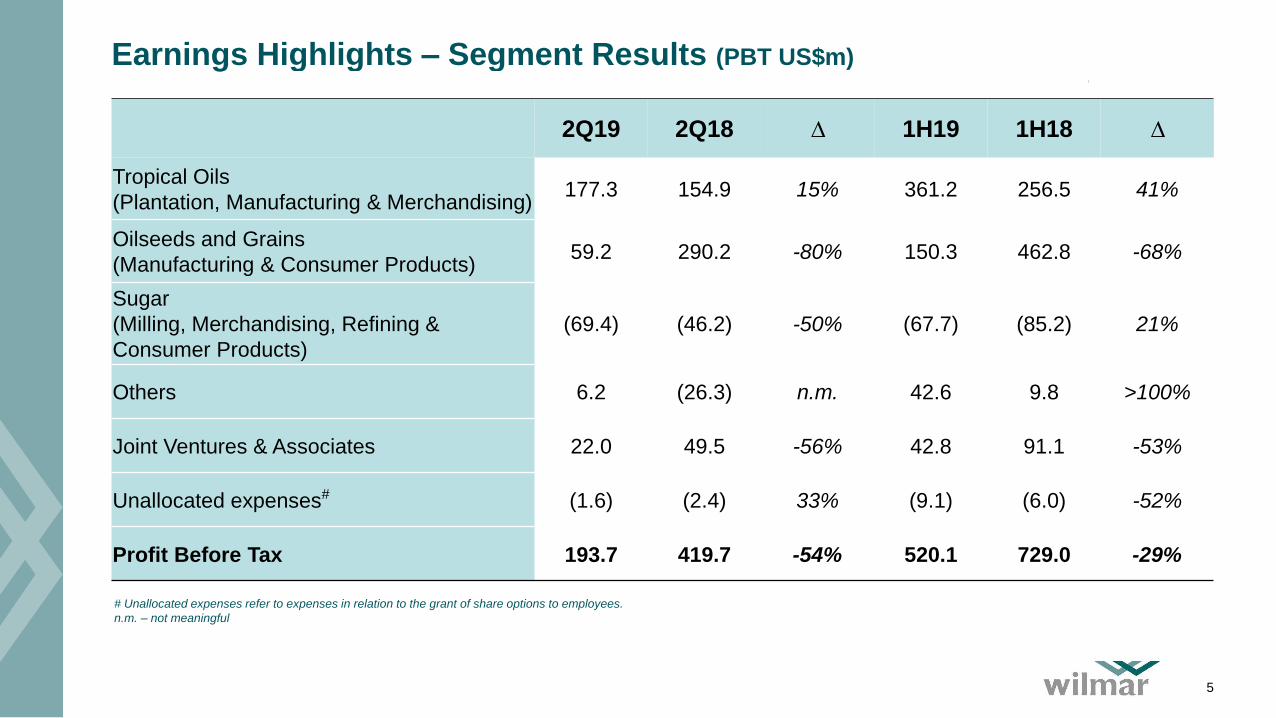
2Q19 2Q18 ∆ 1H19 1H18 ∆
Tropical Oils
(Plantation, Manufacturing & Merchandising)177.3 154.9 15% 361.2 256.5 41%
Oilseeds and Grains
(Manufacturing & Consumer Products)59.2 290.2 -80% 150.3 462.8 -68%
Sugar
(Milling, Merchandising, Refining &
Consumer Products)
(69.4) (46.2) -50% (67.7) (85.2) 21%
Others 6.2 (26.3) n.m. 42.6 9.8 >100%
Joint Ventures & Associates 22.0 49.5 -56% 42.8 91.1 -53%
Unallocated expenses# (1.6) (2.4) 33% (9.1) (6.0) -52%
Profit Before Tax 193.7 419.7 -54% 520.1 729.0 -29%
Earnings Highlights – Segment Results (PBT US$m)
# Unallocated expenses refer to expenses in relation to the grant of share options to employees.
n.m. – not meaningful
Cash Flow Highlights
6
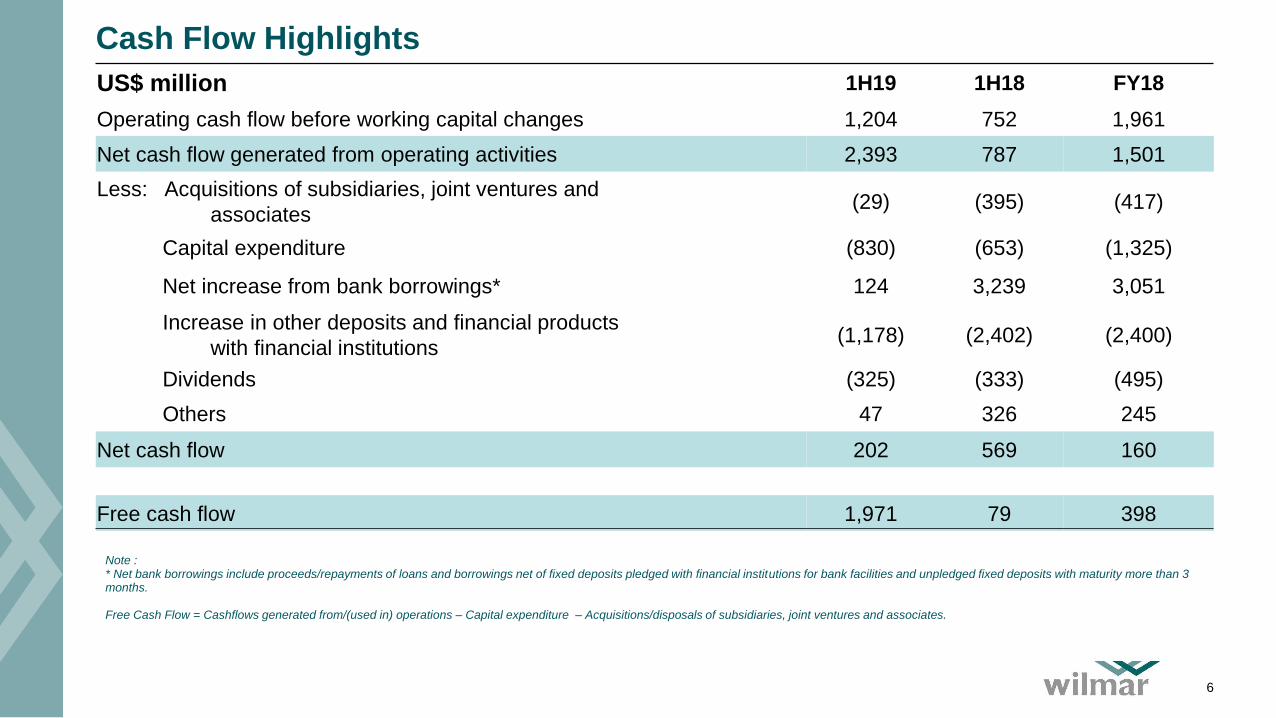
US$ million 1H19 1H18 FY18
Operating cash flow before working capital changes 1,204 752 1,961
Net cash flow generated from operating activities 2,393 787 1,501
Less: Acquisitions of subsidiaries, joint ventures and
associates(29) (395) (417)
Capital expenditure (830) (653) (1,325)
Net increase from bank borrowings* 124 3,239 3,051
Increase in other deposits and financial products
with financial institutions(1,178) (2,402) (2,400)
Dividends (325) (333) (495)
Others 47 326 245
Net cash flow 202 569 160
Free cash flow 1,971 79 398
Note : * Net bank borrowings include proceeds/repayments of loans and borrowings net of fixed deposits pledged with financial institutions for bank facilities and unpledged fixed deposits with maturity more than 3 months.
Free Cash Flow = Cashflows generated from/(used in) operations – Capital expenditure – Acquisitions/disposals of subsidiaries, joint ventures and associates.
Gearing
7
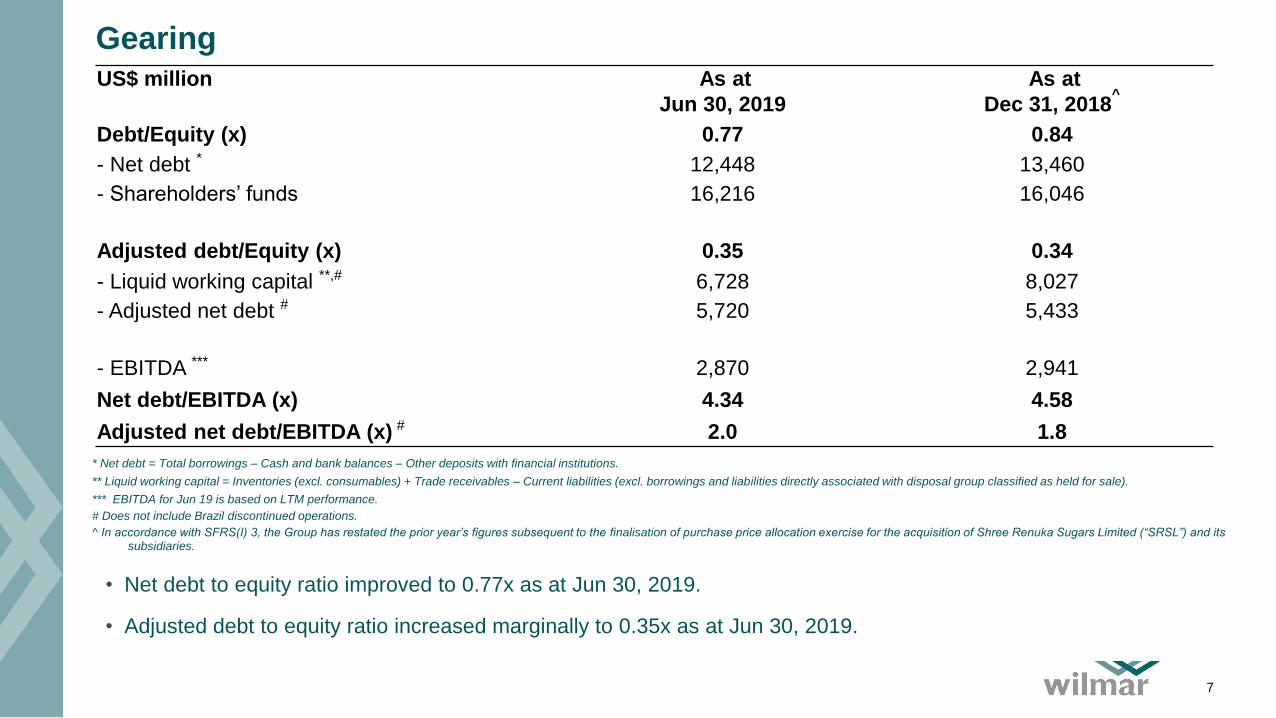
US$ million As at
Jun 30, 2019
As at
Dec 31, 2018^
Debt/Equity (x) 0.77 0.84
- Net debt * 12,448 13,460
- Shareholders’ funds 16,216 16,046
Adjusted debt/Equity (x) 0.35 0.34
- Liquid working capital **,# 6,728 8,027
- Adjusted net debt # 5,720 5,433
- EBITDA *** 2,870 2,941
Net debt/EBITDA (x) 4.34 4.58
Adjusted net debt/EBITDA (x) # 2.0 1.8
• Net debt to equity ratio improved to 0.77x as at Jun 30, 2019.
• Adjusted debt to equity ratio increased marginally to 0.35x as at Jun 30, 2019.
* Net debt = Total borrowings – Cash and bank balances – Other deposits with financial institutions.
** Liquid working capital = Inventories (excl. consumables) + Trade receivables – Current liabilities (excl. borrowings and liabilities directly associated with disposal group classified as held for sale).
*** EBITDA for Jun 19 is based on LTM performance.
# Does not include Brazil discontinued operations.
^ In accordance with SFRS(I) 3, the Group has restated the prior year’s figures subsequent to the finalisation of purchase price allocation exercise for the acquisition of Shree Renuka Sugars Limited (“SRSL”) and its subsidiaries.
Business Outlook
• Over the years, the Group has invested significant capital, mainly in Asia and Africa, and we have often been
questioned by analysts on the rationale for these investments as there has been no significant increase in profits
thus far. The Group has always been bullish on the huge potential of approximately 4.5 billion people in the Asian
and African countries in which we operate and where our products are often the leading brands. We believe that
food is the biggest industry in these countries, and with some of the world’s fastest economic and population
growth, the future demand for food will be much larger than in the developed countries in the West. Most of our
capital expenditure in these countries was spent on building agri processing plants, building brands and
distribution networks. We believe we have built very competitive business models for the agri businesses in these
countries. We chose to build greenfield when it makes sense as they are usually lower costs versus acquisitions
and the plants are much better quality and more efficient. However, gestation periods for these investments are
longer as greenfield projects take typically longer time to build and developing brands and distribution networks
also take time.
• We are seeing increasing sales and profitability from these investments and those established earlier; as
examples, India and Vietnam, which are now making good profits. The increase in profit contributions in recent
years from Consumer Products and some of the new businesses like Oleochemicals, Rice and Flour, help
dampen the volatility of earnings, especially as compared with pure Plantation companies. Our strategy has
always been to make our Group earnings more stable and less vulnerable to fluctuations in commodity prices.
8
Business Outlook (continued)
• We have submitted our application to list our China operations on the Shenzhen Stock Exchange. With the
disclosure of our China operations in the Prospectus, there is now a better understanding and appreciation of the
Group’s China operations. In China, the Group has more than 300 plants in 62 locations with many top brands
and a vast marketing and distribution network. We believe such an operation is not easily replicated and will cost
significantly more to build today. We have built similar operations in many countries including Indonesia, India,
Vietnam and in many African countries. We strongly believe that these operations, when fully mature, will enjoy
similar good returns in the future.
• The African swine fever’s impact on China soybean meal demand is likely to take several years to eradicate,
although the lower China hog production will be offset partially by strong growth in the poultry sector. We are
fortunate to be in the agri processing business as the slowing economy, due partly to the US-China trade conflict,
has not impacted Chinese domestic consumption of food. In fact, the demand for better quality food products in
China continues to grow. The stricter control on plant and food safety and the environment also helps our plants in
China perform better. Thus, we are not overly concerned about the current external environment and will continue
to expand our operations in our core businesses as we believe the future for food demand is in Asia and Africa.
• Barring any unforeseen circumstances, we expect the margins of our crushing business and other segments to
perform better in the remaining half of the year.
9

Appendix
Business Segment results: Tropical Oils (Plantation, Manufacturing and Merchandising)
11
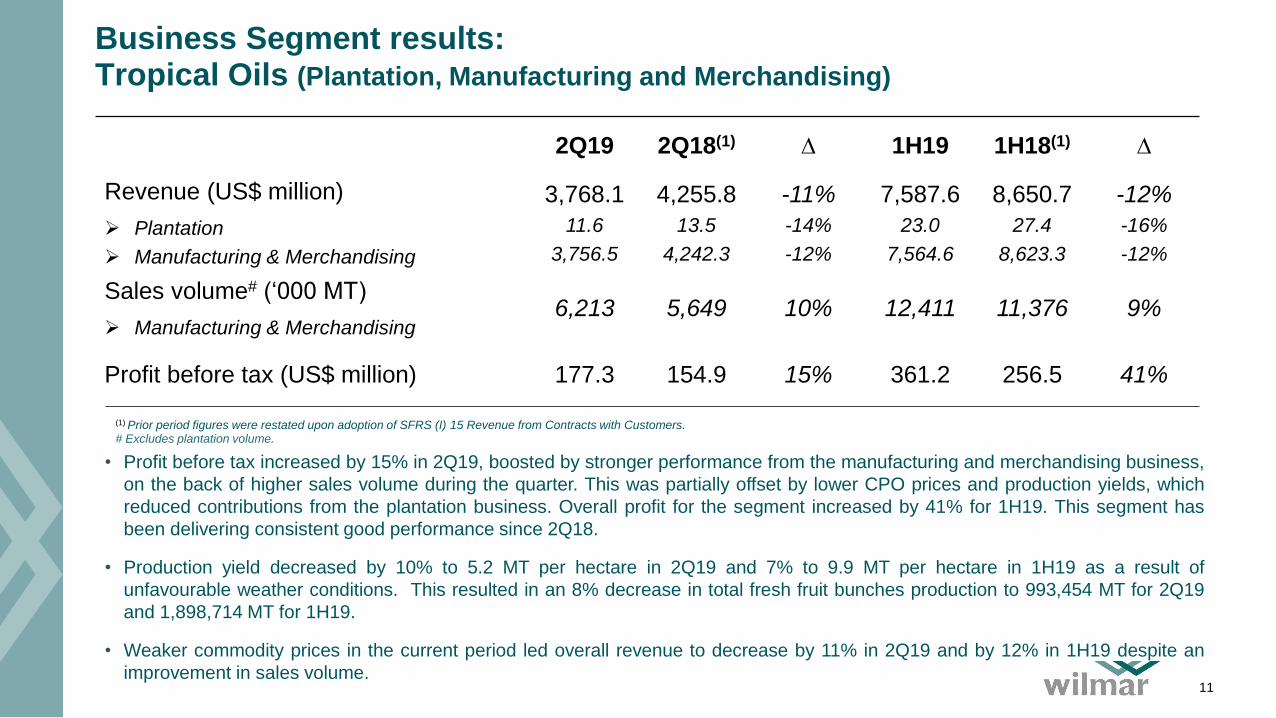
• Profit before tax increased by 15% in 2Q19, boosted by stronger performance from the manufacturing and merchandising business,
on the back of higher sales volume during the quarter. This was partially offset by lower CPO prices and production yields, which
reduced contributions from the plantation business. Overall profit for the segment increased by 41% for 1H19. This segment has
been delivering consistent good performance since 2Q18.
• Production yield decreased by 10% to 5.2 MT per hectare in 2Q19 and 7% to 9.9 MT per hectare in 1H19 as a result of
unfavourable weather conditions. This resulted in an 8% decrease in total fresh fruit bunches production to 993,454 MT for 2Q19
and 1,898,714 MT for 1H19.
• Weaker commodity prices in the current period led overall revenue to decrease by 11% in 2Q19 and by 12% in 1H19 despite an
improvement in sales volume.
2Q19 2Q18(1) ∆ 1H19 1H18(1) ∆
Revenue (US$ million)
➢ Plantation
➢ Manufacturing & Merchandising
3,768.1
11.6
3,756.5
4,255.8
13.5
4,242.3
-11%
-14%
-12%
7,587.6
23.0
7,564.6
8,650.7
27.4
8,623.3
-12%
-16%
-12%
Sales volume# (‘000 MT)
➢ Manufacturing & Merchandising6,213 5,649 10% 12,411 11,376 9%
Profit before tax (US$ million) 177.3 154.9 15% 361.2 256.5 41%
(1) Prior period figures were restated upon adoption of SFRS (I) 15 Revenue from Contracts with Customers.# Excludes plantation volume.
Business Segment results: Tropical Oils (Plantation, Manufacturing and Merchandising)
12
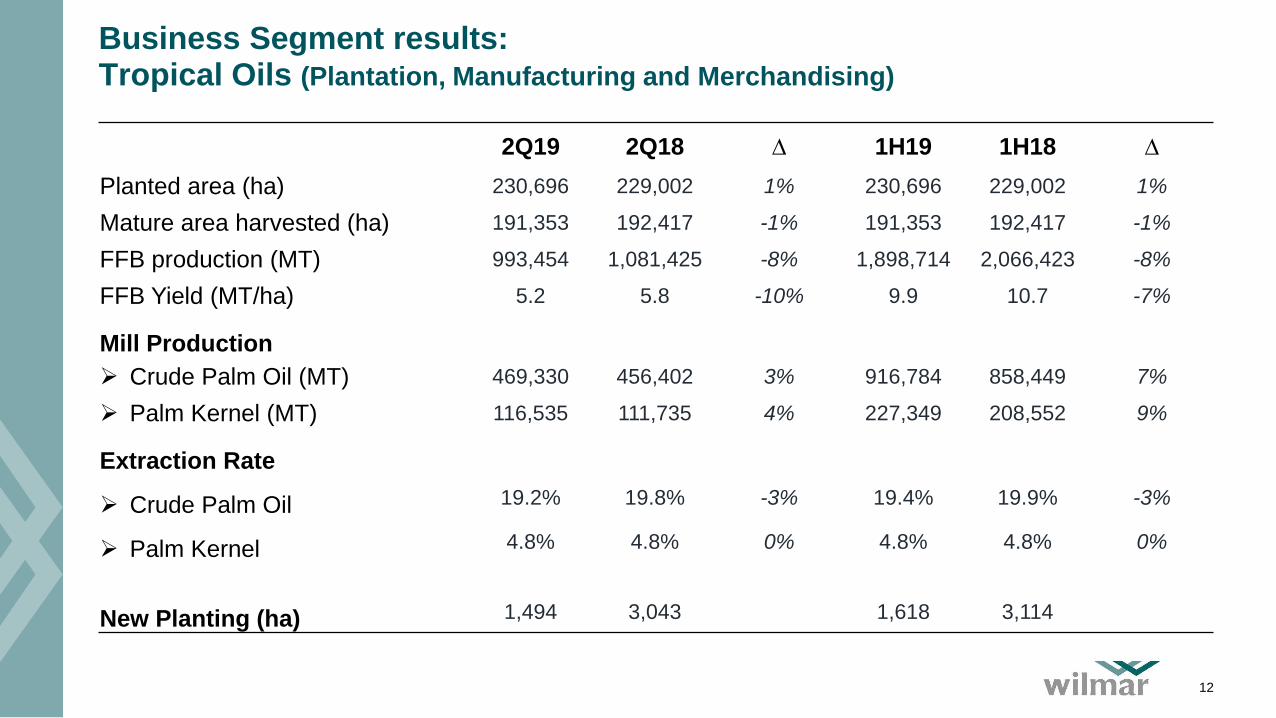
2Q19 2Q18 ∆ 1H19 1H18 ∆
Planted area (ha) 230,696 229,002 1% 230,696 229,002 1%
Mature area harvested (ha) 191,353 192,417 -1% 191,353 192,417 -1%
FFB production (MT) 993,454 1,081,425 -8% 1,898,714 2,066,423 -8%
FFB Yield (MT/ha) 5.2 5.8 -10% 9.9 10.7 -7%
Mill Production
➢ Crude Palm Oil (MT) 469,330 456,402 3% 916,784 858,449 7%
➢ Palm Kernel (MT) 116,535 111,735 4% 227,349 208,552 9%
Extraction Rate
➢ Crude Palm Oil 19.2% 19.8% -3% 19.4% 19.9% -3%
➢ Palm Kernel 4.8% 4.8% 0% 4.8% 4.8% 0%
New Planting (ha) 1,494 3,043 1,618 3,114
Plantation Age Profile
13
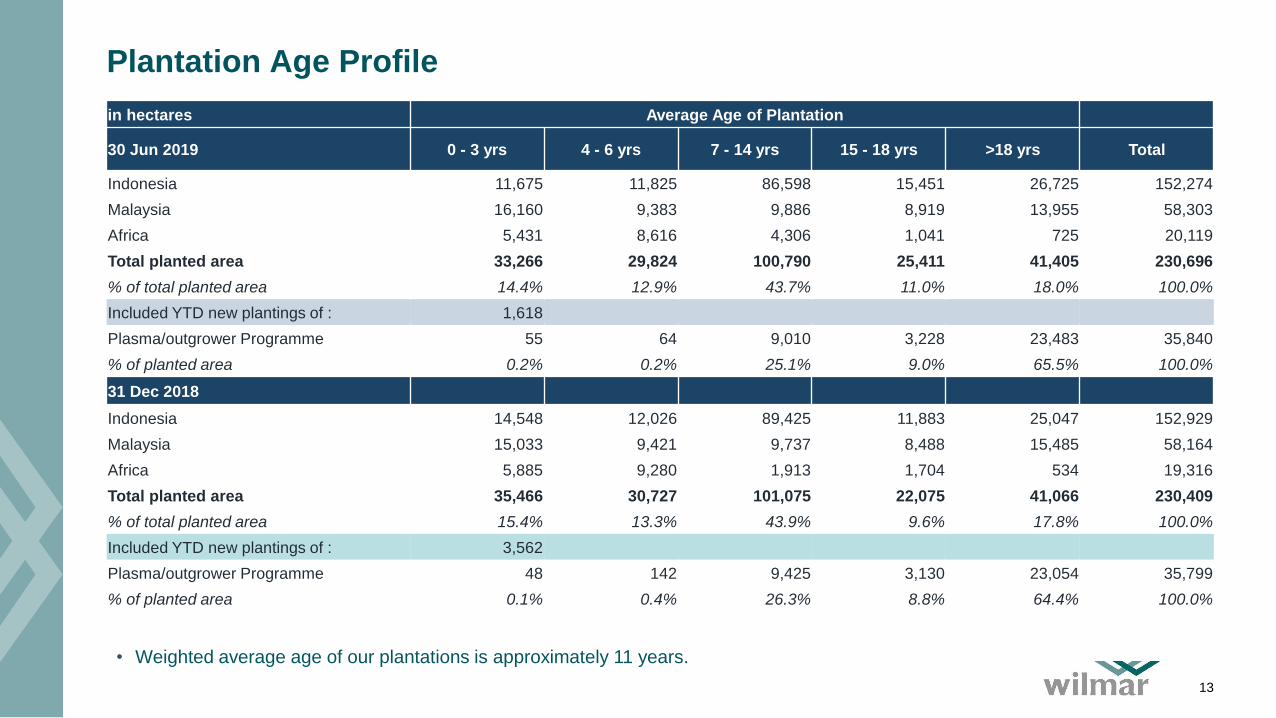
• Weighted average age of our plantations is approximately 11 years.
in hectares Average Age of Plantation
30 Jun 2019 0 - 3 yrs 4 - 6 yrs 7 - 14 yrs 15 - 18 yrs >18 yrs Total
Indonesia 11,675 11,825 86,598 15,451 26,725 152,274
Malaysia 16,160 9,383 9,886 8,919 13,955 58,303
Africa 5,431 8,616 4,306 1,041 725 20,119
Total planted area 33,266 29,824 100,790 25,411 41,405 230,696
% of total planted area 14.4% 12.9% 43.7% 11.0% 18.0% 100.0%
Included YTD new plantings of : 1,618
Plasma/outgrower Programme 55 64 9,010 3,228 23,483 35,840
% of planted area 0.2% 0.2% 25.1% 9.0% 65.5% 100.0%
31 Dec 2018
Indonesia 14,548 12,026 89,425 11,883 25,047 152,929
Malaysia 15,033 9,421 9,737 8,488 15,485 58,164
Africa 5,885 9,280 1,913 1,704 534 19,316
Total planted area 35,466 30,727 101,075 22,075 41,066 230,409
% of total planted area 15.4% 13.3% 43.9% 9.6% 17.8% 100.0%
Included YTD new plantings of : 3,562
Plasma/outgrower Programme 48 142 9,425 3,130 23,054 35,799
% of planted area 0.1% 0.4% 26.3% 8.8% 64.4% 100.0%
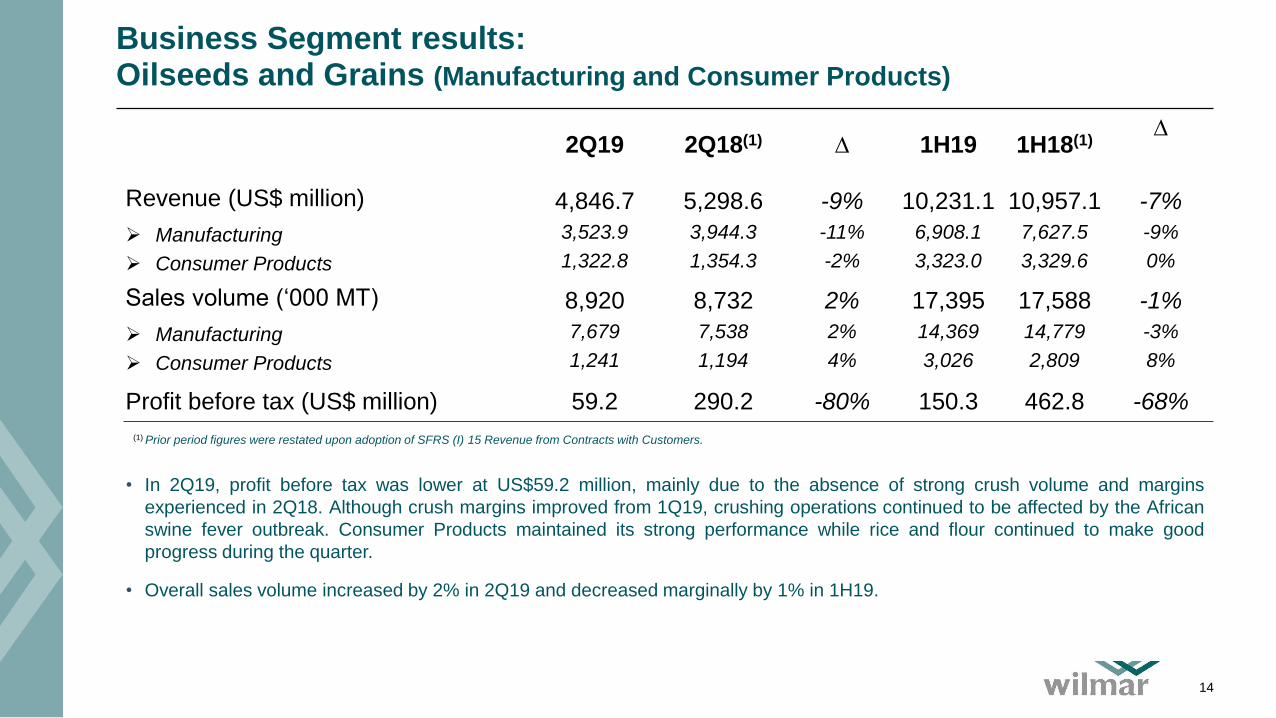
Business Segment results: Oilseeds and Grains (Manufacturing and Consumer Products)
14
2Q19 2Q18(1) ∆ 1H19 1H18(1)∆
Revenue (US$ million)
➢ Manufacturing
➢ Consumer Products
4,846.7
3,523.9
1,322.8
5,298.6
3,944.3
1,354.3
-9%
-11%
-2%
10,231.1
6,908.1
3,323.0
10,957.1
7,627.5
3,329.6
-7%
-9%
0%
Sales volume (‘000 MT)
➢ Manufacturing
➢ Consumer Products
8,920
7,679
1,241
8,732
7,538
1,194
2%
2%
4%
17,395
14,369
3,026
17,588
14,779
2,809
-1%
-3%
8%
Profit before tax (US$ million) 59.2 290.2 -80% 150.3 462.8 -68%
• In 2Q19, profit before tax was lower at US$59.2 million, mainly due to the absence of strong crush volume and margins
experienced in 2Q18. Although crush margins improved from 1Q19, crushing operations continued to be affected by the African
swine fever outbreak. Consumer Products maintained its strong performance while rice and flour continued to make good
progress during the quarter.
• Overall sales volume increased by 2% in 2Q19 and decreased marginally by 1% in 1H19.
(1) Prior period figures were restated upon adoption of SFRS (I) 15 Revenue from Contracts with Customers.
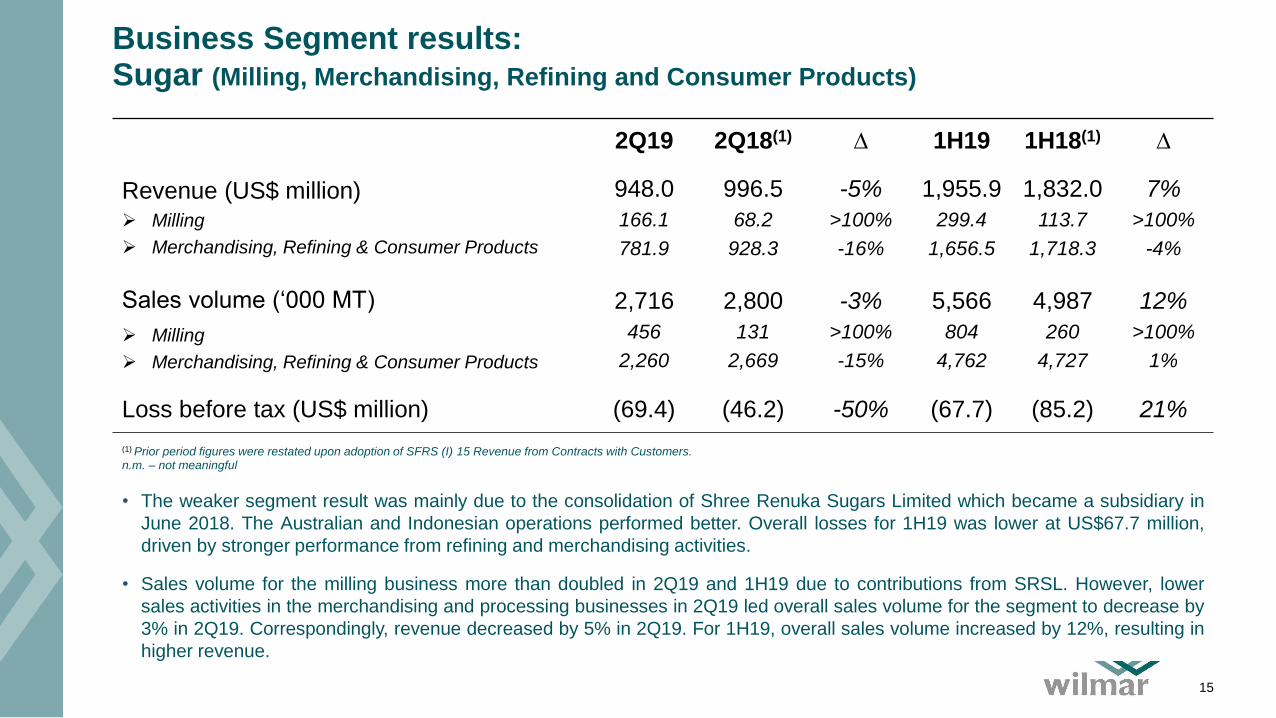
Business Segment results: Sugar (Milling, Merchandising, Refining and Consumer Products)
2Q19 2Q18(1) ∆ 1H19 1H18(1) ∆
Revenue (US$ million)➢ Milling
➢ Merchandising, Refining & Consumer Products
948.0
166.1
781.9
996.5
68.2
928.3
-5%
>100%
-16%
1,955.9
299.4
1,656.5
1,832.0
113.7
1,718.3
7%
>100%
-4%
Sales volume (‘000 MT)
➢ Milling
➢ Merchandising, Refining & Consumer Products
2,716
456
2,260
2,800
131
2,669
-3%
>100%
-15%
5,566
804
4,762
4,987
260
4,727
12%
>100%
1%
Loss before tax (US$ million) (69.4) (46.2) -50% (67.7) (85.2) 21%
• The weaker segment result was mainly due to the consolidation of Shree Renuka Sugars Limited which became a subsidiary in
June 2018. The Australian and Indonesian operations performed better. Overall losses for 1H19 was lower at US$67.7 million,
driven by stronger performance from refining and merchandising activities.
• Sales volume for the milling business more than doubled in 2Q19 and 1H19 due to contributions from SRSL. However, lower
sales activities in the merchandising and processing businesses in 2Q19 led overall sales volume for the segment to decrease by
3% in 2Q19. Correspondingly, revenue decreased by 5% in 2Q19. For 1H19, overall sales volume increased by 12%, resulting in
higher revenue.
(1) Prior period figures were restated upon adoption of SFRS (I) 15 Revenue from Contracts with Customers.n.m. – not meaningful
15
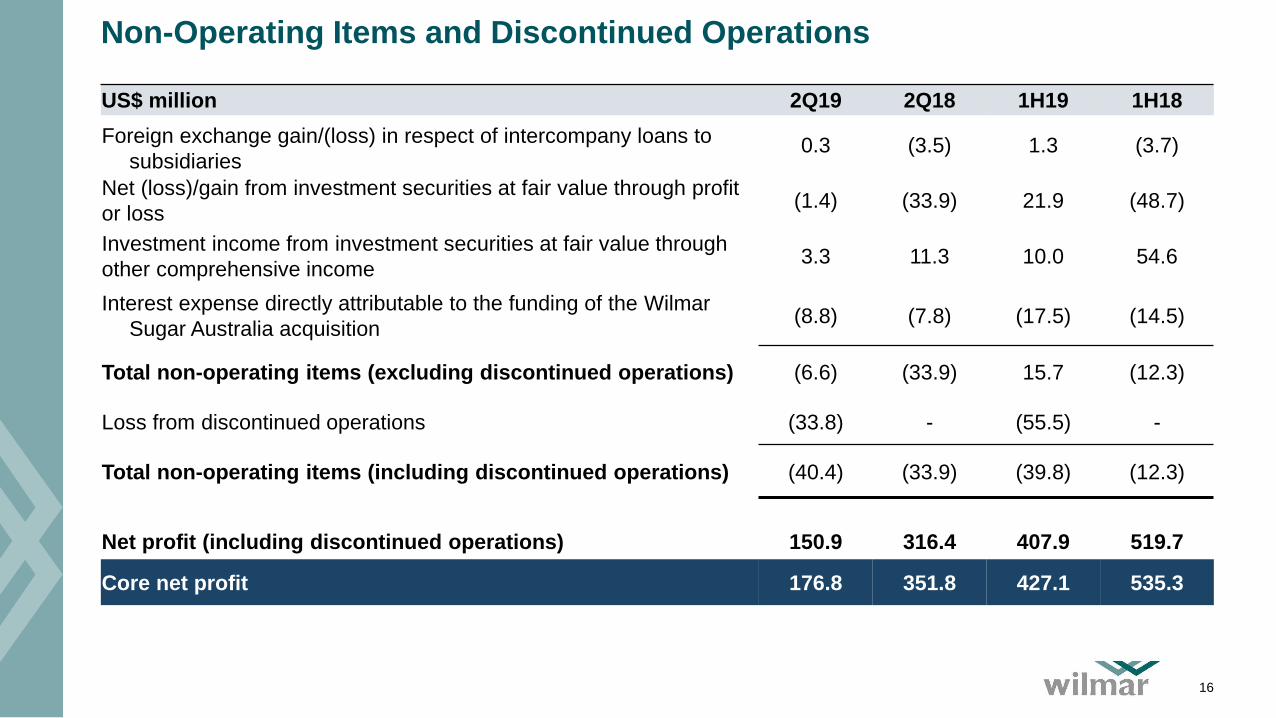
Non-Operating Items and Discontinued Operations
16
US$ million 2Q19 2Q18 1H19 1H18
Foreign exchange gain/(loss) in respect of intercompany loans to
subsidiaries0.3 (3.5) 1.3 (3.7)
Net (loss)/gain from investment securities at fair value through profit
or loss(1.4) (33.9) 21.9 (48.7)
Investment income from investment securities at fair value through
other comprehensive income3.3 11.3 10.0 54.6
Interest expense directly attributable to the funding of the Wilmar
Sugar Australia acquisition(8.8) (7.8) (17.5) (14.5)
Total non-operating items (excluding discontinued operations) (6.6) (33.9) 15.7 (12.3)
Loss from discontinued operations (33.8) - (55.5) -
Total non-operating items (including discontinued operations) (40.4) (33.9) (39.8) (12.3)
Net profit (including discontinued operations) 150.9 316.4 407.9 519.7
Core net profit 176.8 351.8 427.1 535.3
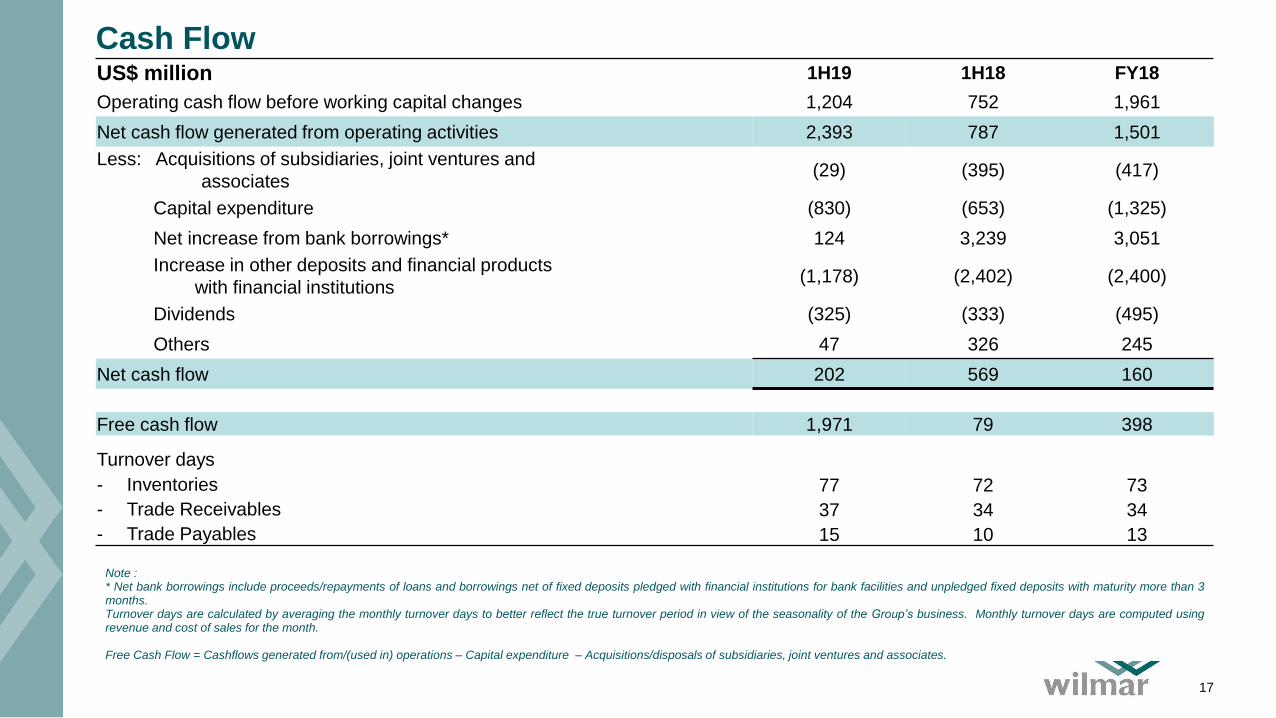
Cash Flow
17
US$ million 1H19 1H18 FY18
Operating cash flow before working capital changes 1,204 752 1,961
Net cash flow generated from operating activities 2,393 787 1,501
Less: Acquisitions of subsidiaries, joint ventures and
associates(29) (395) (417)
Capital expenditure (830) (653) (1,325)
Net increase from bank borrowings* 124 3,239 3,051
Increase in other deposits and financial products
with financial institutions(1,178) (2,402) (2,400)
Dividends (325) (333) (495)
Others 47 326 245
Net cash flow 202 569 160
Free cash flow 1,971 79 398
Turnover days
- Inventories 77 72 73
- Trade Receivables 37 34 34
- Trade Payables 15 10 13
Note :* Net bank borrowings include proceeds/repayments of loans and borrowings net of fixed deposits pledged with financial institutions for bank facilities and unpledged fixed deposits with maturity more than 3months.Turnover days are calculated by averaging the monthly turnover days to better reflect the true turnover period in view of the seasonality of the Group’s business. Monthly turnover days are computed usingrevenue and cost of sales for the month.
Free Cash Flow = Cashflows generated from/(used in) operations – Capital expenditure – Acquisitions/disposals of subsidiaries, joint ventures and associates.
Cash Flow – Cont.
18
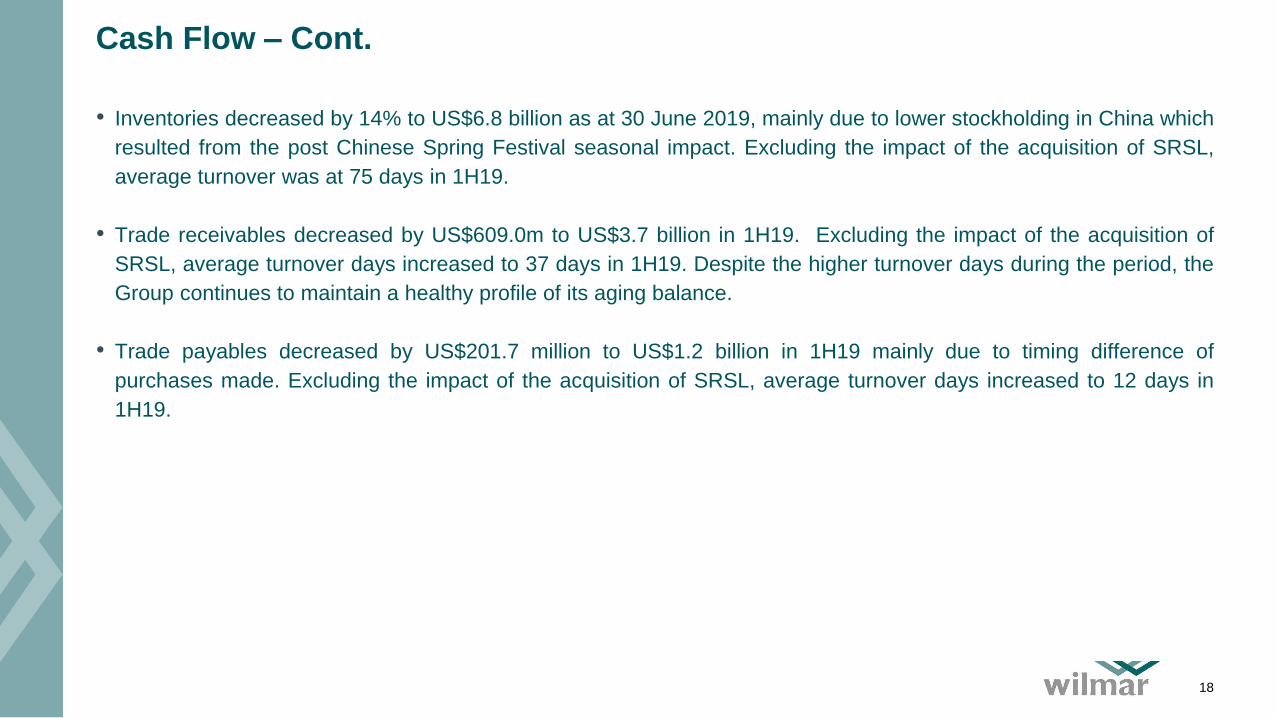
• Inventories decreased by 14% to US$6.8 billion as at 30 June 2019, mainly due to lower stockholding in China which
resulted from the post Chinese Spring Festival seasonal impact. Excluding the impact of the acquisition of SRSL,
average turnover was at 75 days in 1H19.
• Trade receivables decreased by US$609.0m to US$3.7 billion in 1H19. Excluding the impact of the acquisition of
SRSL, average turnover days increased to 37 days in 1H19. Despite the higher turnover days during the period, the
Group continues to maintain a healthy profile of its aging balance.
• Trade payables decreased by US$201.7 million to US$1.2 billion in 1H19 mainly due to timing difference of
purchases made. Excluding the impact of the acquisition of SRSL, average turnover days increased to 12 days in
1H19.
Funding and Liquidity
19
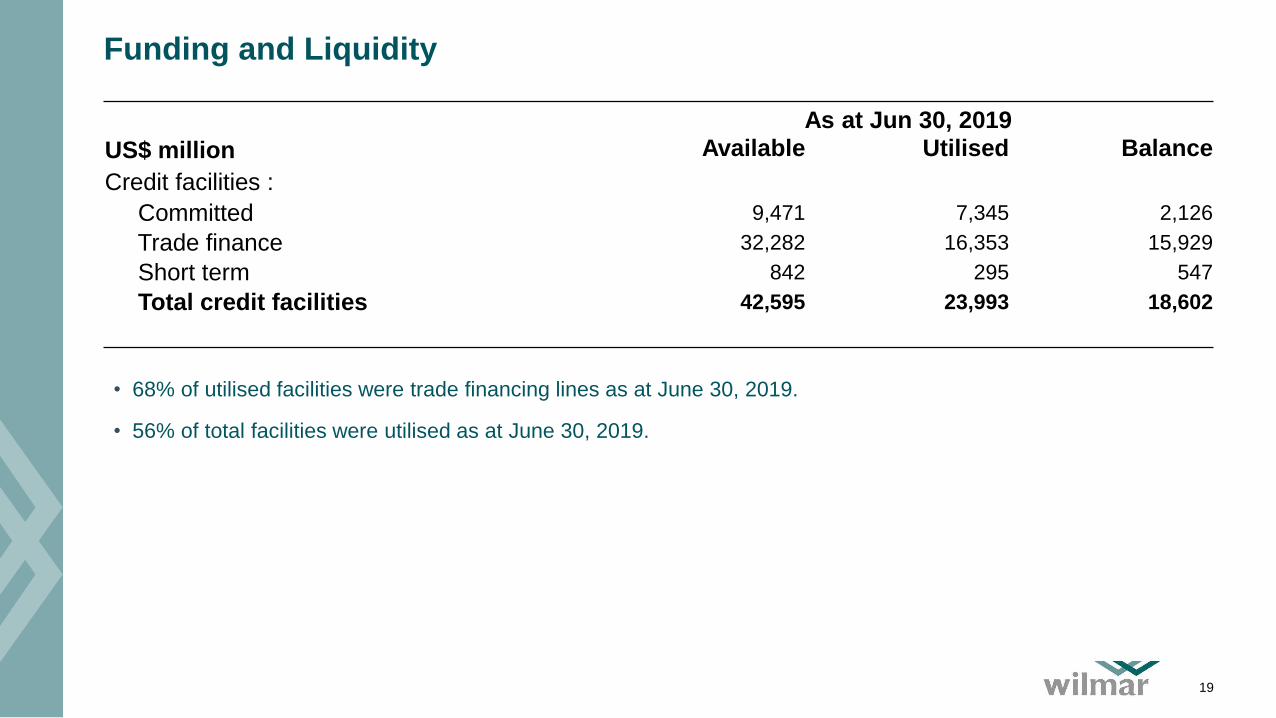
As at Jun 30, 2019
US$ million Available Utilised Balance
Credit facilities :
Committed 9,471 7,345 2,126
Trade finance 32,282 16,353 15,929
Short term 842 295 547
Total credit facilities 42,595 23,993 18,602
• 68% of utilised facilities were trade financing lines as at June 30, 2019.
• 56% of total facilities were utilised as at June 30, 2019.
Key Indicators
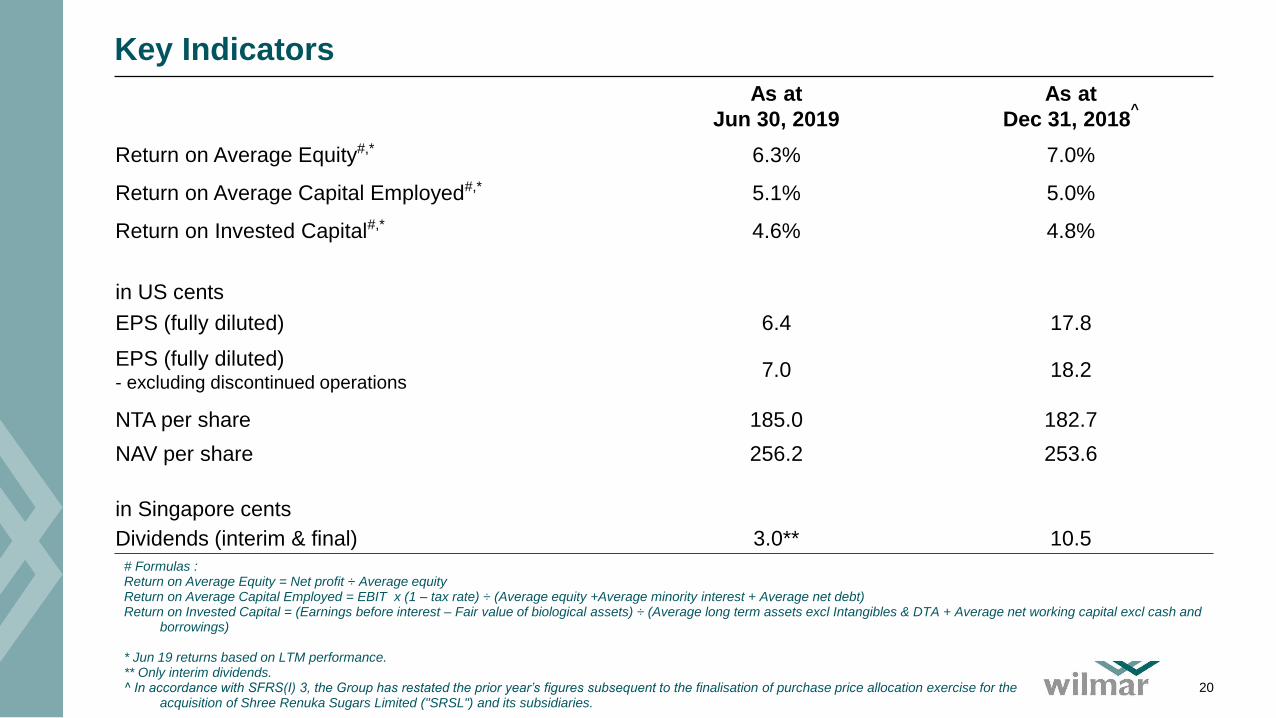
As at
Jun 30, 2019
As at
Dec 31, 2018^
Return on Average Equity#,* 6.3% 7.0%
Return on Average Capital Employed#,* 5.1% 5.0%
Return on Invested Capital#,* 4.6% 4.8%
in US cents
EPS (fully diluted) 6.4 17.8
EPS (fully diluted)- excluding discontinued operations
7.0 18.2
NTA per share 185.0 182.7
NAV per share 256.2 253.6
in Singapore cents
Dividends (interim & final) 3.0** 10.5
# Formulas : Return on Average Equity = Net profit ÷ Average equityReturn on Average Capital Employed = EBIT x (1 – tax rate) ÷ (Average equity +Average minority interest + Average net debt)Return on Invested Capital = (Earnings before interest – Fair value of biological assets) ÷ (Average long term assets excl Intangibles & DTA + Average net working capital excl cash and
borrowings)
* Jun 19 returns based on LTM performance.** Only interim dividends.^ In accordance with SFRS(I) 3, the Group has restated the prior year’s figures subsequent to the finalisation of purchase price allocation exercise for the
acquisition of Shree Renuka Sugars Limited ("SRSL") and its subsidiaries.20