Embed Size (px)
Citation preview
HOLT
Clarity is Confidence Market Commentary
Wealth Creation Principles The Measure of Quality February 2016
Bryant Matthews Director, HOLT [email protected]
1-312-345-6187 David A. Holland HOLT Senior Advisor [email protected]
Richard Curry, PhD HOLT Investment Strategy [email protected]
we would like to give special thanks to Greg Williamson for his invaluable assistance in the development of this report.
Key Points: Quality, though a simple idea, is a difficult concept to pin down because it has many facets.
Published measures of Quality vary in their interpretation, and lack reliabilty and precision over longer investment horizons.
HOLT’s Quality categories are based on an empirical detection method with proven reliability. We show that they have high positive predictive values.
Quality Elite stocks, HOLT’s premier Quality category, have displayed impressive risk-adjusted returns, lower maximum drawdown, and reduced turnover due to the durability of their economic returns. We introduce HOLT Super eCAPs in this report.
This paper investigates the following key questions that pertain to Quality investing:
• Is there a reliable measure of Quality? • How can we test the reliability of a Quality metric? • How well do popular measures of Quality perform in ex ante detection? • How well do portfolios of high Quality companies perform?
Introduction
Over the past 15 years, Quality investors have enjoyed strong relative performance. For instance, the S&P 500 Quality Rankings Index outperformed the broader S&P 500 by more than 5% per annum from April 2000 through March 2010 with higher risk-adjusted returns.1
The Quality anomaly is not recent. Frazzini and Asness show there has been an on-going phenomenon that dates at least as far back as the 1950s.2 Fama and French have recently introduced profitability into a five-factor asset pricing model.3 The case for investing in Quality is well-established and practitioners such as Warren Buffett have demonstrated its relevance and rewards.4
What remains incomplete is a standard definition of Quality. Descriptions range from companies with high return on equity relative to peers, low accruals, conservative debt ratios, or firms that, “all else equal, someone would be willing to pay a premium for.”5 These differences in Quality have been treated a bit like the various colors of a horse: interesting, but it’s still just a horse. We suggest that this is a mistake that leads to ambiguous interpretation and inhibits deeper insight about Quality type.
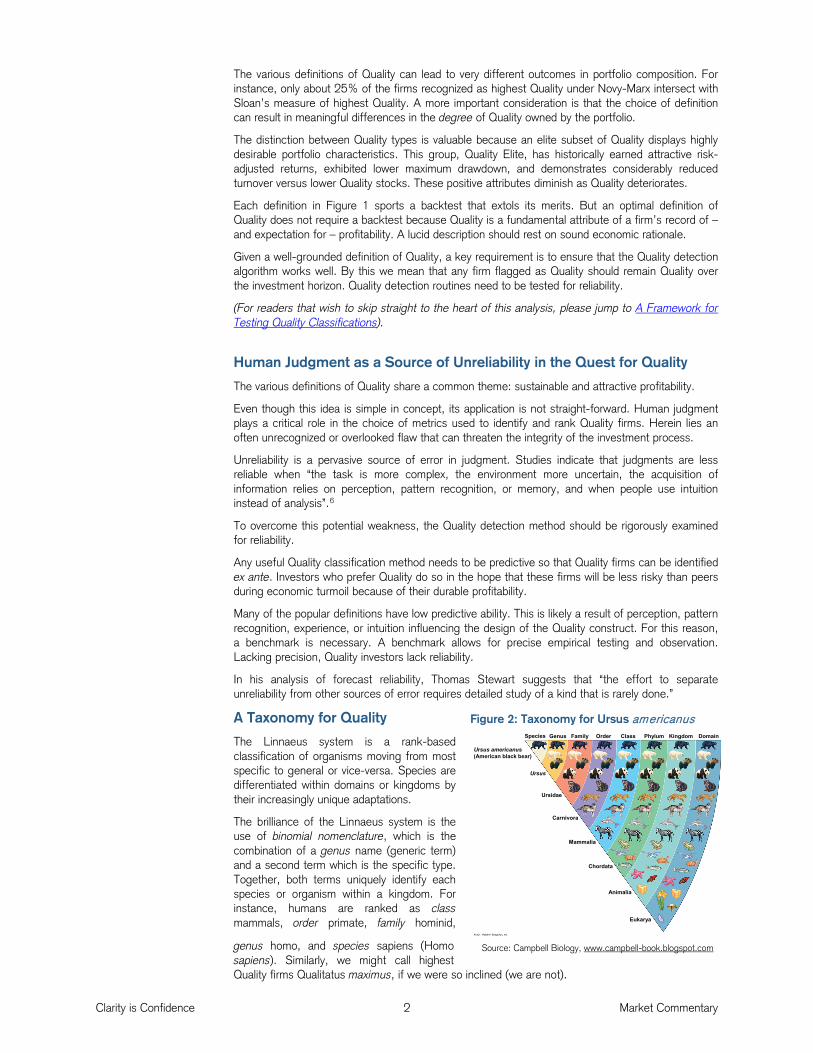
Figure 1: Some popular definitions of Quality
Clarity is Confidence 2 Market Commentary
The various definitions of Quality can lead to very different outcomes in portfolio composition. For instance, only about 25% of the firms recognized as highest Quality under Novy-Marx intersect with Sloan’s measure of highest Quality. A more important consideration is that the choice of definition can result in meaningful differences in the degree of Quality owned by the portfolio.
The distinction between Quality types is valuable because an elite subset of Quality displays highly desirable portfolio characteristics. This group, Quality Elite, has historically earned attractive risk-adjusted returns, exhibited lower maximum drawdown, and demonstrates considerably reduced turnover versus lower Quality stocks. These positive attributes diminish as Quality deteriorates.
Each definition in Figure 1 sports a backtest that extols its merits. But an optimal definition of Quality does not require a backtest because Quality is a fundamental attribute of a firm’s record of – and expectation for – profitability. A lucid description should rest on sound economic rationale.
Given a well-grounded definition of Quality, a key requirement is to ensure that the Quality detection algorithm works well. By this we mean that any firm flagged as Quality should remain Quality over the investment horizon. Quality detection routines need to be tested for reliability.
(For readers that wish to skip straight to the heart of this analysis, please jump to A Framework for Testing Quality Classifications).
Human Judgment as a Source of Unreliability in the Quest for Quality
The various definitions of Quality share a common theme: sustainable and attractive profitability.
Even though this idea is simple in concept, its application is not straight-forward. Human judgment plays a critical role in the choice of metrics used to identify and rank Quality firms. Herein lies an often unrecognized or overlooked flaw that can threaten the integrity of the investment process.
Unreliability is a pervasive source of error in judgment. Studies indicate that judgments are less reliable when “the task is more complex, the environment more uncertain, the acquisition of information relies on perception, pattern recognition, or memory, and when people use intuition instead of analysis”.6
To overcome this potential weakness, the Quality detection method should be rigorously examined for reliability.
Any useful Quality classification method needs to be predictive so that Quality firms can be identified ex ante. Investors who prefer Quality do so in the hope that these firms will be less risky than peers during economic turmoil because of their durable profitability.
Many of the popular definitions have low predictive ability. This is likely a result of perception, pattern recognition, experience, or intuition influencing the design of the Quality construct. For this reason, a benchmark is necessary. A benchmark allows for precise empirical testing and observation. Lacking precision, Quality investors lack reliability.
In his analysis of forecast reliability, Thomas Stewart suggests that “the effort to separate unreliability from other sources of error requires detailed study of a kind that is rarely done.”
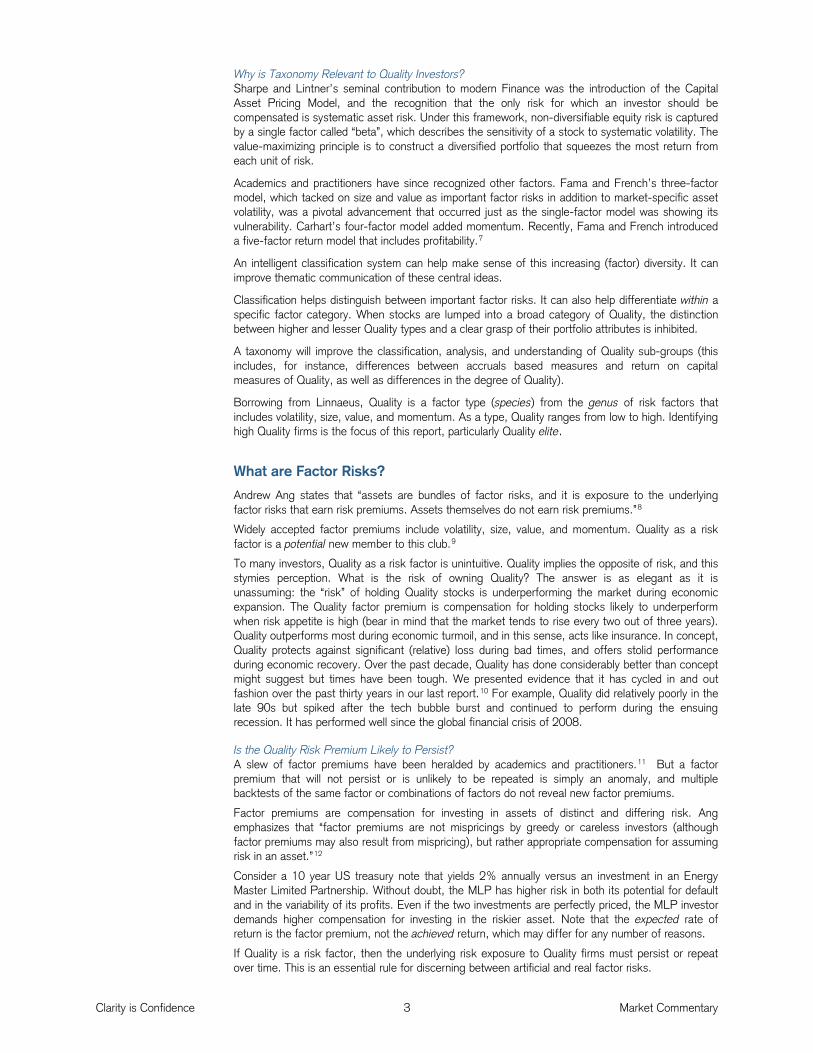
A Taxonomy for Quality
The Linnaeus system is a rank-based classification of organisms moving from most specific to general or vice-versa. Species are differentiated within domains or kingdoms by their increasingly unique adaptations.
The brilliance of the Linnaeus system is the use of binomial nomenclature, which is the combination of a genus name (generic term) and a second term which is the specific type. Together, both terms uniquely identify each species or organism within a kingdom. For instance, humans are ranked as class mammals, order primate, family hominid,
genus homo, and species sapiens (Homo sapiens). Similarly, we might call highest Quality firms Qualitatus maximus, if we were so inclined (we are not).
Source: Campbell Biology, www.campbell-book.blogspot.com
Species
Ursus
Ursidae
Carnivora
Mammalia
Ursus americanus(American black bear)
Chordata
Animalia
Eukarya
Genus Family Order Class Phylum Kingdom Domain
Figure 2: Taxonomy for Ursus americanus
Clarity is Confidence 3 Market Commentary
Why is Taxonomy Relevant to Quality Investors? Sharpe and Lintner’s seminal contribution to modern Finance was the introduction of the Capital Asset Pricing Model, and the recognition that the only risk for which an investor should be compensated is systematic asset risk. Under this framework, non-diversifiable equity risk is captured by a single factor called “beta”, which describes the sensitivity of a stock to systematic volatility. The value-maximizing principle is to construct a diversified portfolio that squeezes the most return from each unit of risk.
Academics and practitioners have since recognized other factors. Fama and French’s three-factor model, which tacked on size and value as important factor risks in addition to market-specific asset volatility, was a pivotal advancement that occurred just as the single-factor model was showing its vulnerability. Carhart’s four-factor model added momentum. Recently, Fama and French introduced a five-factor return model that includes profitability.7
An intelligent classification system can help make sense of this increasing (factor) diversity. It can improve thematic communication of these central ideas.
Classification helps distinguish between important factor risks. It can also help differentiate within a specific factor category. When stocks are lumped into a broad category of Quality, the distinction between higher and lesser Quality types and a clear grasp of their portfolio attributes is inhibited.
A taxonomy will improve the classification, analysis, and understanding of Quality sub-groups (this includes, for instance, differences between accruals based measures and return on capital measures of Quality, as well as differences in the degree of Quality).
Borrowing from Linnaeus, Quality is a factor type (species) from the genus of risk factors that includes volatility, size, value, and momentum. As a type, Quality ranges from low to high. Identifying high Quality firms is the focus of this report, particularly Quality elite.
What are Factor Risks?
Andrew Ang states that “assets are bundles of factor risks, and it is exposure to the underlying factor risks that earn risk premiums. Assets themselves do not earn risk premiums.”8
Widely accepted factor premiums include volatility, size, value, and momentum. Quality as a risk factor is a potential new member to this club.9
To many investors, Quality as a risk factor is unintuitive. Quality implies the opposite of risk, and this stymies perception. What is the risk of owning Quality? The answer is as elegant as it is unassuming: the “risk” of holding Quality stocks is underperforming the market during economic expansion. The Quality factor premium is compensation for holding stocks likely to underperform when risk appetite is high (bear in mind that the market tends to rise every two out of three years). Quality outperforms most during economic turmoil, and in this sense, acts like insurance. In concept, Quality protects against significant (relative) loss during bad times, and offers stolid performance during economic recovery. Over the past decade, Quality has done considerably better than concept might suggest but times have been tough. We presented evidence that it has cycled in and out fashion over the past thirty years in our last report.10 For example, Quality did relatively poorly in the late 90s but spiked after the tech bubble burst and continued to perform during the ensuing recession. It has performed well since the global financial crisis of 2008.
Is the Quality Risk Premium Likely to Persist? A slew of factor premiums have been heralded by academics and practitioners.11 But a factor premium that will not persist or is unlikely to be repeated is simply an anomaly, and multiple backtests of the same factor or combinations of factors do not reveal new factor premiums.
Factor premiums are compensation for investing in assets of distinct and differing risk. Ang emphasizes that “factor premiums are not mispricings by greedy or careless investors (although factor premiums may also result from mispricing), but rather appropriate compensation for assuming risk in an asset.”12
Consider a 10 year US treasury note that yields 2% annually versus an investment in an Energy Master Limited Partnership. Without doubt, the MLP has higher risk in both its potential for default and in the variability of its profits. Even if the two investments are perfectly priced, the MLP investor demands higher compensation for investing in the riskier asset. Note that the expected rate of return is the factor premium, not the achieved return, which may differ for any number of reasons.
If Quality is a risk factor, then the underlying risk exposure to Quality firms must persist or repeat over time. This is an essential rule for discerning between artificial and real factor risks.
Clarity is Confidence 4 Market Commentary
The Range of Quality
The NBA: from superstars to super duds Sports is a useful metaphor when considering the range of Quality. Every sports team and its loyal fans yearn for a franchise athlete, a quality player who elevates the team to a higher dimension. Franchise players are a rare breed, the crème de la crème.
For teams with superstar athletes, wins and losses can be viewed through a hyper-critical lens. Why can’t the rest of the team play like the superstar? How can the other players be so bad?!
When focusing solely on the superstar, as avid fans tend to do, it’s easy to overlook the fact that the entire team, from worst player to best, is an assembly of the extraordinary. When it comes to talent, even the worst professional athlete is in every sense “high quality”.
Consider that only 3.3% of high school basketball players go on to play NCAA (National College Athletic Association) basketball. College athletes are the best of all high school athletes. From this top-notch troupe, only 1.2% will play in the NBA (National Basketball Association). That translates into 0.04% of high school athletes making it to the NBA. Professional basketball players are by-and-large three to four standard deviation ‘quality outliers’.
But, anyone who has ever been a fan of the NBA will know that one-third to nearly one-half of most NBA players spend the bulk of their time warming the bench during live games and serve as practice materiel for the top 5 players on the team. That’s because there is a noticeable drop in skills as one moves down the bench and into reserve players. An old coaches’ saying comes to mind: “You carry 12, you play 8 or 9, you win with 5”, highlighting the risk of playing your bench. This relationship is true of most sports.
If quality is defined as athletic skill, then even amongst the very best athletes – the pros – there is a spectrum of quality. Michael Jordan was unsurpassed in his day amongst all NBA players; many regard him as the best basketball player ever. He made other teams’ starters look like amateurs, dazzling and baffling them alike. Most importantly, he did it year-after-year, leading the Chicago Bulls to six NBA championship titles.
Franchise players are particularly rare and valuable. The transfer prices for the world’s best soccer players provides further evidence from the most popular sport on earth.
In the corporate arena, Quality also has range, just like the players on an NBA team. Highest Quality stocks are the franchise players in the portfolio. Not the Jeremy Lin, Jimmy Glass, Buster Douglas, or “Super Joe” Charboneau one-hit wonder types.13 Quality stocks are those that deliver year-in, year-out MVP-like operating performance. They are equipped with capable management teams that make smart, value-additive business decisions. Quality firms may or may not be priced cheaply, but they are safe havens during economic turmoil. They may not rise like a rocket during a bull market, but they do rise, and when tough times hit, they fall more like a feather when other stocks drop like a rock.
Consider that the US Internal Revenue Service received over 31 million non-farm payroll submissions in 2014. That’s a lot of businesses seeking a profit. Of this total, less than 0.01%, or 4200, were exchange-traded firms. These 4200 are the professionals, so to speak, the best of the best. The Quality designation could widely be applied to all of these firms, but the truly extraordinary businesses number less than 200 companies in the USA, and less than 500 globally. These firms are the Quality Elite.
Quality Elite firms offer superior exposure to the Quality risk factor. Can these firms be identified with confidence a priori?
Clarity is Confidence 5 Market Commentary
A Framework for Testing Quality Classifications
The key to any useful classification is that it is accurate, precise, and reliable.
Consider a simple model that seeks to identify cats from a collection of cats and dogs. There are 4 possible outcomes:
• We correctly identified a cat as a cat. This is a true positive (TP). • We incorrectly identified a dog as a cat. This is a false positive (FP). • We incorrectly identified a cat as a dog. This is a false negative (FN). • We correctly identified a dog as not being a cat. This is a true negative (TN).
A measure that is particularly relevant for Quality investors is what statisticians call “precision”. Using our cats and dogs analogy, a precise model is one that is particularly skilled in selecting cats from a relevant sample. It may overlook some cats (perhaps they look like dogs), but the cats that it selects really are cats.
In the portfolio setting, for our purpose, precision is reliability. Once we have selected cats from the population, we will not know if they turn into dogs except over the passage of time. Reliability is the extent to which an experiment, test, or measuring procedure yields the same results on repeated trials.14 A reliable model is accurate and precise over time or repeated trials.
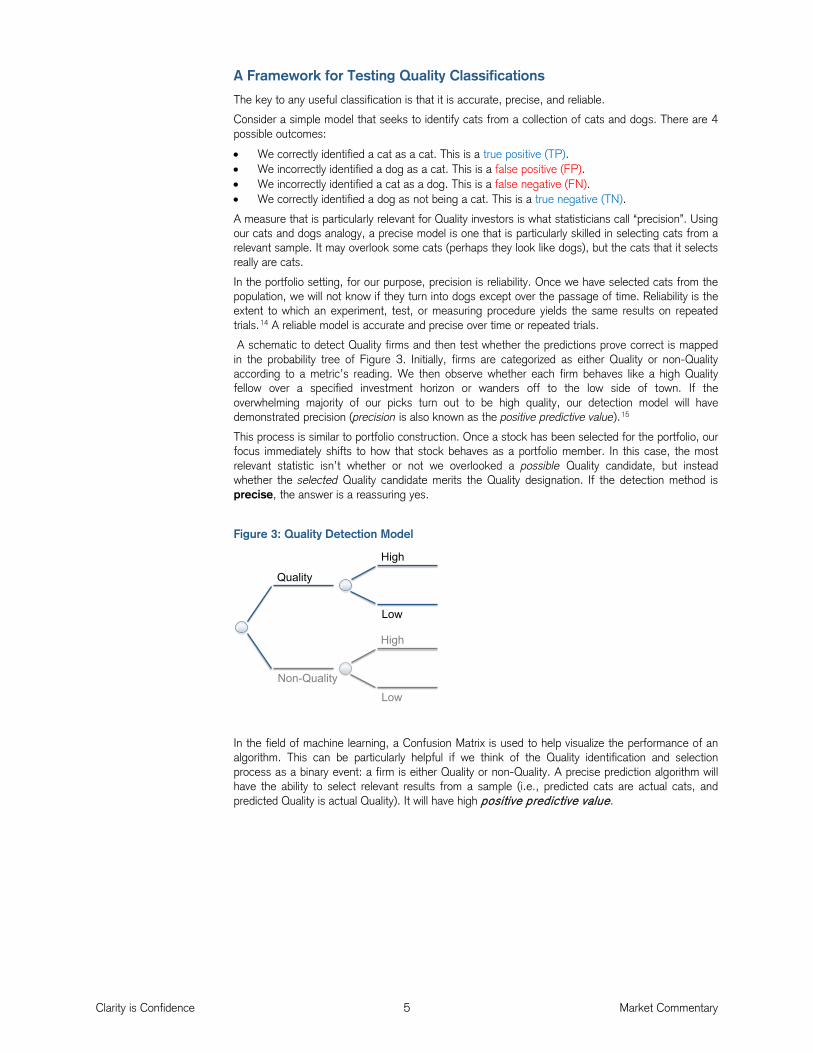
A schematic to detect Quality firms and then test whether the predictions prove correct is mapped in the probability tree of Figure 3. Initially, firms are categorized as either Quality or non-Quality according to a metric’s reading. We then observe whether each firm behaves like a high Quality fellow over a specified investment horizon or wanders off to the low side of town. If the overwhelming majority of our picks turn out to be high quality, our detection model will have demonstrated precision (precision is also known as the positive predictive value).15
This process is similar to portfolio construction. Once a stock has been selected for the portfolio, our focus immediately shifts to how that stock behaves as a portfolio member. In this case, the most relevant statistic isn’t whether or not we overlooked a possible Quality candidate, but instead whether the selected Quality candidate merits the Quality designation. If the detection method is precise, the answer is a reassuring yes.
Figure 3: Quality Detection Model
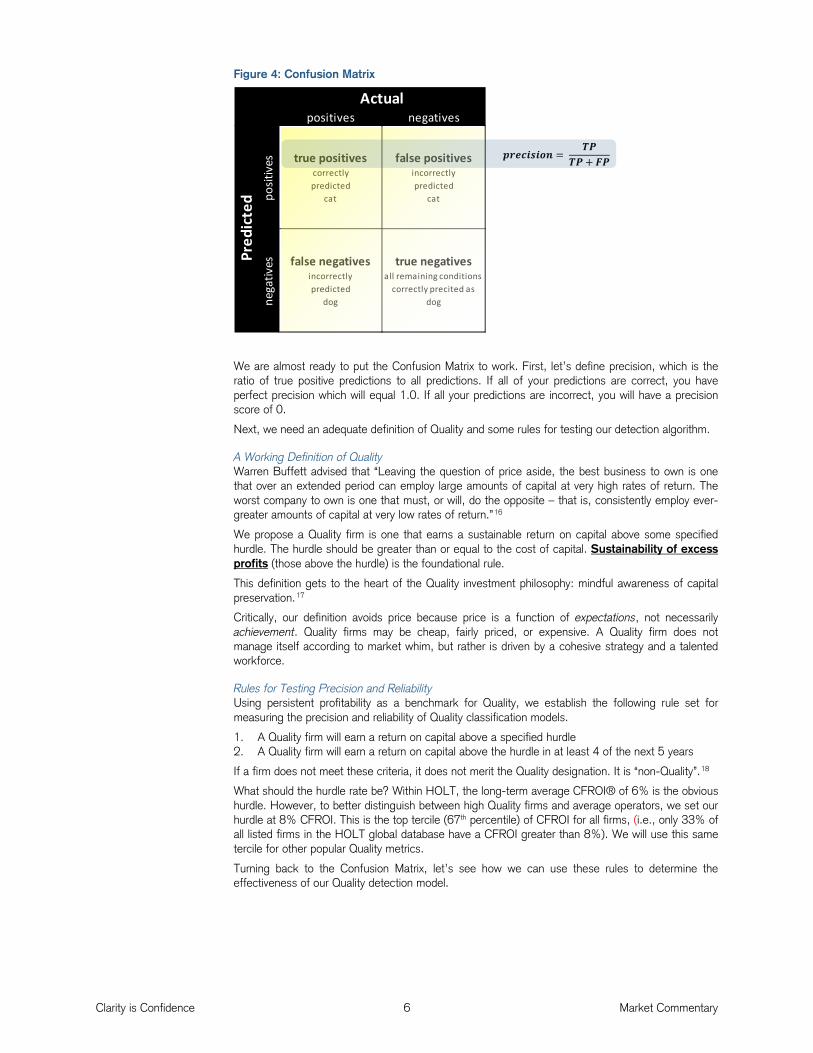
In the field of machine learning, a Confusion Matrix is used to help visualize the performance of an algorithm. This can be particularly helpful if we think of the Quality identification and selection process as a binary event: a firm is either Quality or non-Quality. A precise prediction algorithm will have the ability to select relevant results from a sample (i.e., predicted cats are actual cats, and predicted Quality is actual Quality). It will have high positive predictive value.
Quality
Non-Quality
High
Low
High
Low
Clarity is Confidence 6 Market Commentary
Figure 4: Confusion Matrix
We are almost ready to put the Confusion Matrix to work. First, let’s define precision, which is the ratio of true positive predictions to all predictions. If all of your predictions are correct, you have perfect precision which will equal 1.0. If all your predictions are incorrect, you will have a precision score of 0.
Next, we need an adequate definition of Quality and some rules for testing our detection algorithm.
A Working Definition of Quality Warren Buffett advised that “Leaving the question of price aside, the best business to own is one that over an extended period can employ large amounts of capital at very high rates of return. The worst company to own is one that must, or will, do the opposite – that is, consistently employ ever-greater amounts of capital at very low rates of return.”16
We propose a Quality firm is one that earns a sustainable return on capital above some specified hurdle. The hurdle should be greater than or equal to the cost of capital. Sustainability of excess profits (those above the hurdle) is the foundational rule.
This definition gets to the heart of the Quality investment philosophy: mindful awareness of capital preservation.17
Critically, our definition avoids price because price is a function of expectations, not necessarily achievement. Quality firms may be cheap, fairly priced, or expensive. A Quality firm does not manage itself according to market whim, but rather is driven by a cohesive strategy and a talented workforce.
Rules for Testing Precision and Reliability Using persistent profitability as a benchmark for Quality, we establish the following rule set for measuring the precision and reliability of Quality classification models.
1. A Quality firm will earn a return on capital above a specified hurdle 2. A Quality firm will earn a return on capital above the hurdle in at least 4 of the next 5 years
If a firm does not meet these criteria, it does not merit the Quality designation. It is “non-Quality”.18
What should the hurdle rate be? Within HOLT, the long-term average CFROI® of 6% is the obvious hurdle. However, to better distinguish between high Quality firms and average operators, we set our hurdle at 8% CFROI. This is the top tercile (67th percentile) of CFROI for all firms, (i.e., only 33% of all listed firms in the HOLT global database have a CFROI greater than 8%). We will use this same tercile for other popular Quality metrics.
Turning back to the Confusion Matrix, let’s see how we can use these rules to determine the effectiveness of our Quality detection model.
false negativesincorrectly predicted
dog
true negativesall remaining conditions
correctly precited as dog
Actualpositives negatives
Pred
icte
d posit
ives true positives
correctly predicted
cat
false positivesincorrectly predicted
cat
nega
tives
𝒑𝒑𝒑𝒑𝒑𝒑𝒑𝒑𝒑 = 𝑻𝑻
𝑻𝑻+ 𝑭𝑻
Clarity is Confidence 7 Market Commentary
Figure 5: Confusion Matrix using ROE
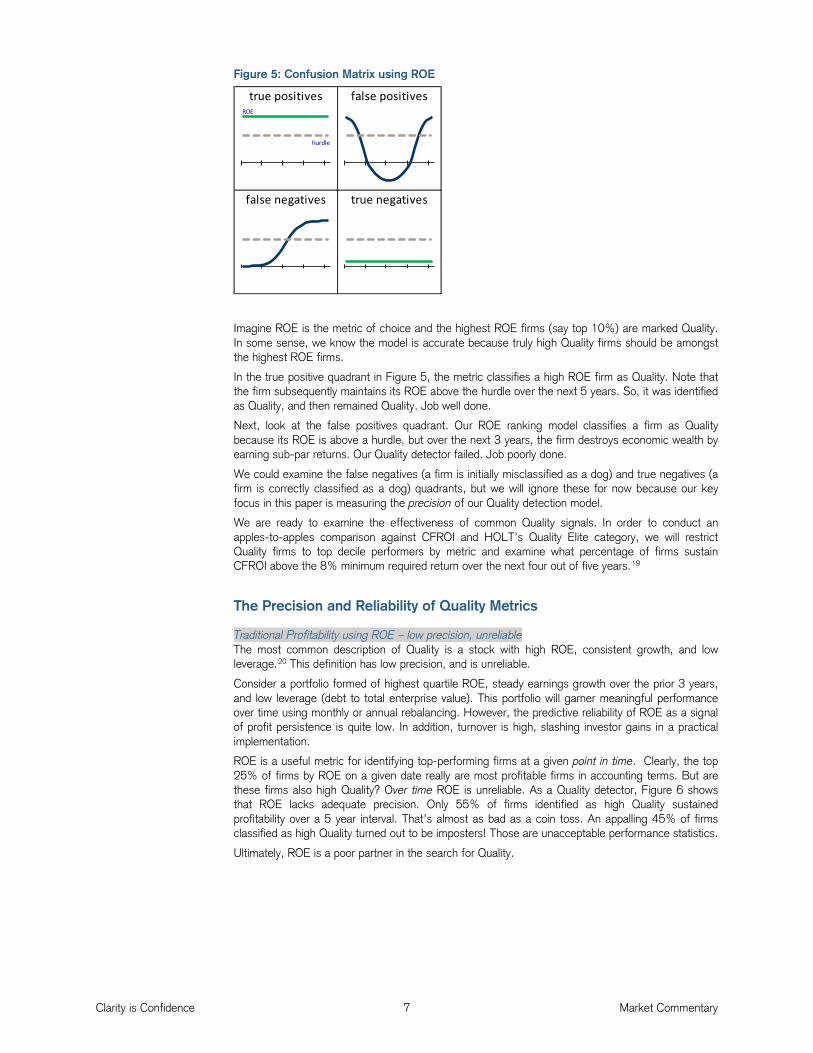
Imagine ROE is the metric of choice and the highest ROE firms (say top 10%) are marked Quality. In some sense, we know the model is accurate because truly high Quality firms should be amongst the highest ROE firms.
In the true positive quadrant in Figure 5, the metric classifies a high ROE firm as Quality. Note that the firm subsequently maintains its ROE above the hurdle over the next 5 years. So, it was identified as Quality, and then remained Quality. Job well done.
Next, look at the false positives quadrant. Our ROE ranking model classifies a firm as Quality because its ROE is above a hurdle, but over the next 3 years, the firm destroys economic wealth by earning sub-par returns. Our Quality detector failed. Job poorly done.
We could examine the false negatives (a firm is initially misclassified as a dog) and true negatives (a firm is correctly classified as a dog) quadrants, but we will ignore these for now because our key focus in this paper is measuring the precision of our Quality detection model.
We are ready to examine the effectiveness of common Quality signals. In order to conduct an apples-to-apples comparison against CFROI and HOLT’s Quality Elite category, we will restrict Quality firms to top decile performers by metric and examine what percentage of firms sustain CFROI above the 8% minimum required return over the next four out of five years.19
The Precision and Reliability of Quality Metrics
Traditional Profitability using ROE – low precision, unreliable The most common description of Quality is a stock with high ROE, consistent growth, and low leverage.20 This definition has low precision, and is unreliable.
Consider a portfolio formed of highest quartile ROE, steady earnings growth over the prior 3 years, and low leverage (debt to total enterprise value). This portfolio will garner meaningful performance over time using monthly or annual rebalancing. However, the predictive reliability of ROE as a signal of profit persistence is quite low. In addition, turnover is high, slashing investor gains in a practical implementation.
ROE is a useful metric for identifying top-performing firms at a given point in time. Clearly, the top 25% of firms by ROE on a given date really are most profitable firms in accounting terms. But are these firms also high Quality? Over time ROE is unreliable. As a Quality detector, Figure 6 shows that ROE lacks adequate precision. Only 55% of firms identified as high Quality sustained profitability over a 5 year interval. That’s almost as bad as a coin toss. An appalling 45% of firms classified as high Quality turned out to be imposters! Those are unacceptable performance statistics.
Ultimately, ROE is a poor partner in the search for Quality.
false negatives true negatives
true positives false positivesROE
hurdle
Clarity is Confidence 8 Market Commentary
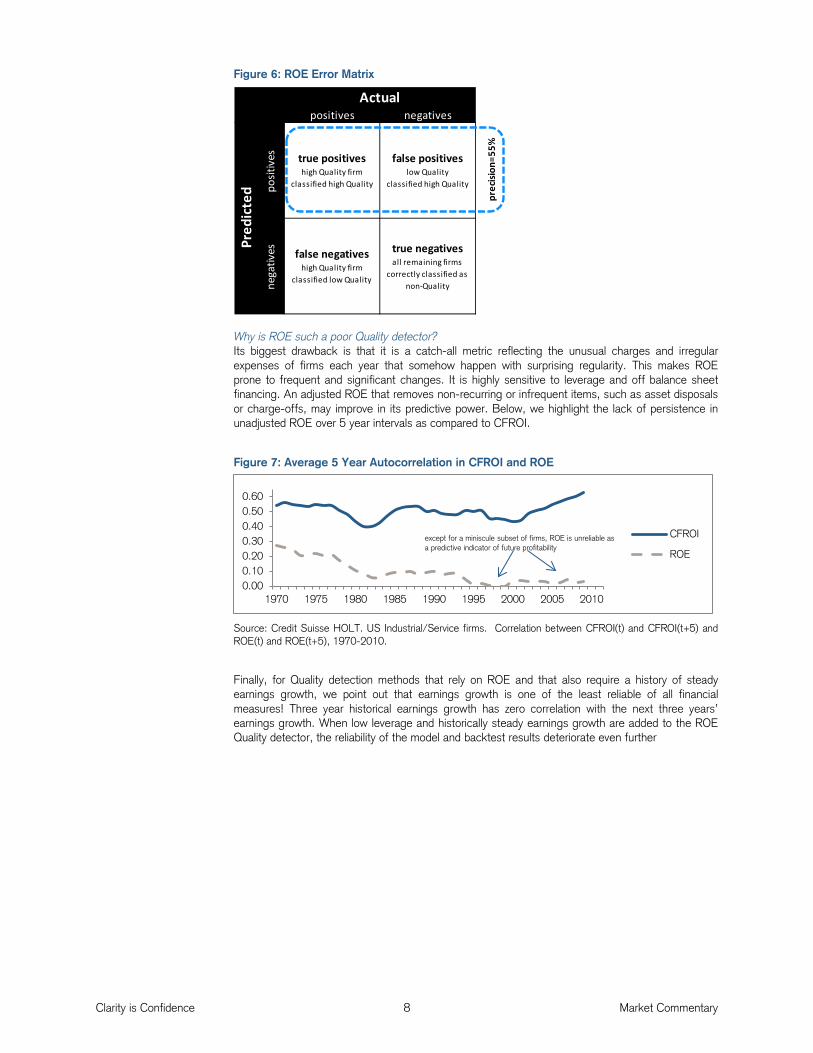
Figure 6: ROE Error Matrix
Why is ROE such a poor Quality detector? Its biggest drawback is that it is a catch-all metric reflecting the unusual charges and irregular expenses of firms each year that somehow happen with surprising regularity. This makes ROE prone to frequent and significant changes. It is highly sensitive to leverage and off balance sheet financing. An adjusted ROE that removes non-recurring or infrequent items, such as asset disposals or charge-offs, may improve in its predictive power. Below, we highlight the lack of persistence in unadjusted ROE over 5 year intervals as compared to CFROI.
Figure 7: Average 5 Year Autocorrelation in CFROI and ROE
Source: Credit Suisse HOLT. US Industrial/Service firms. Correlation between CFROI(t) and CFROI(t+5) and ROE(t) and ROE(t+5), 1970-2010.
Finally, for Quality detection methods that rely on ROE and that also require a history of steady earnings growth, we point out that earnings growth is one of the least reliable of all financial measures! Three year historical earnings growth has zero correlation with the next three years’ earnings growth. When low leverage and historically steady earnings growth are added to the ROE Quality detector, the reliability of the model and backtest results deteriorate even further
Acc=74% Actualpositives negatives
Pred
icte
d posit
ives true positives
high Quality firm classified high Quality
false positiveslow Quality
classified high Quality
nega
tives false negatives
high Quality firm classified low Quality
true negativesall remaining firms
correctly classified as non-Quality
prec
ision
=55%
0.000.100.200.300.400.500.60
1970 1975 1980 1985 1990 1995 2000 2005 2010
CFROI
ROE
except for a miniscule subset of firms, ROE is unreliable as a predictive indicator of future profitability
Clarity is Confidence 9 Market Commentary
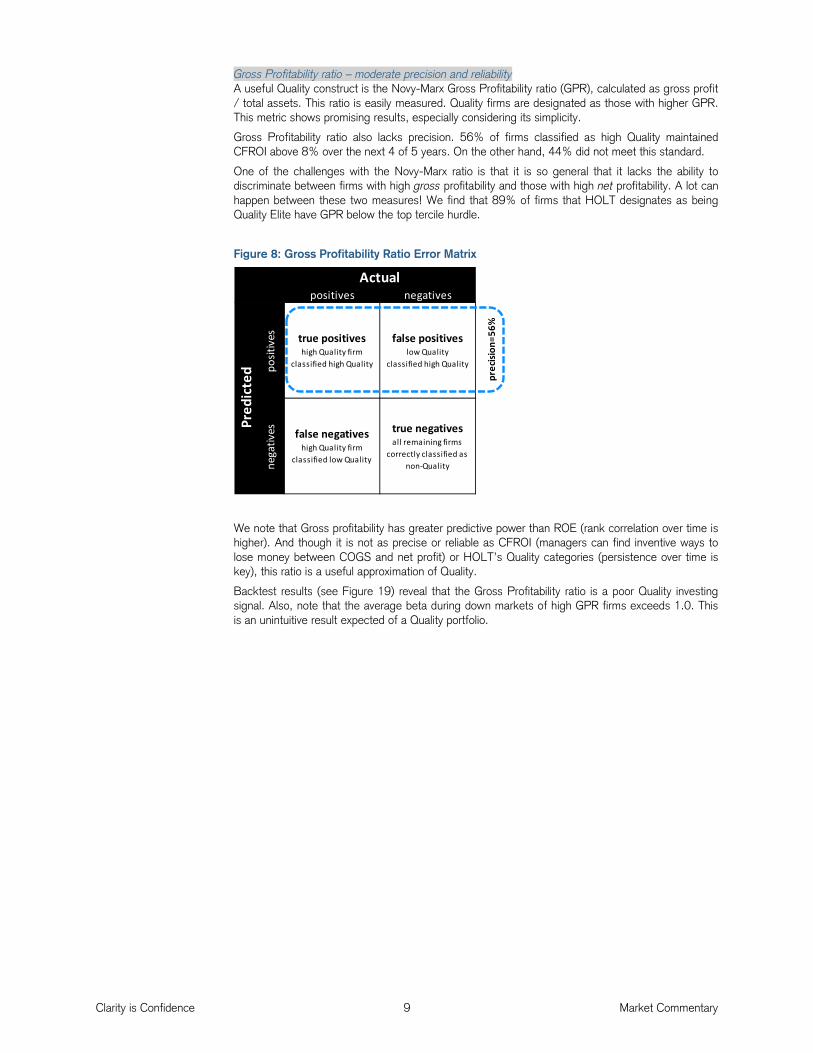
Gross Profitability ratio – moderate precision and reliability A useful Quality construct is the Novy-Marx Gross Profitability ratio (GPR), calculated as gross profit / total assets. This ratio is easily measured. Quality firms are designated as those with higher GPR. This metric shows promising results, especially considering its simplicity.
Gross Profitability ratio also lacks precision. 56% of firms classified as high Quality maintained CFROI above 8% over the next 4 of 5 years. On the other hand, 44% did not meet this standard.
One of the challenges with the Novy-Marx ratio is that it is so general that it lacks the ability to discriminate between firms with high gross profitability and those with high net profitability. A lot can happen between these two measures! We find that 89% of firms that HOLT designates as being Quality Elite have GPR below the top tercile hurdle.
Figure 8: Gross Profitability Ratio Error Matrix
We note that Gross profitability has greater predictive power than ROE (rank correlation over time is higher). And though it is not as precise or reliable as CFROI (managers can find inventive ways to lose money between COGS and net profit) or HOLT’s Quality categories (persistence over time is key), this ratio is a useful approximation of Quality.
Backtest results (see Figure 19) reveal that the Gross Profitability ratio is a poor Quality investing signal. Also, note that the average beta during down markets of high GPR firms exceeds 1.0. This is an unintuitive result expected of a Quality portfolio.
Acc=75%
prec
ision
=56%
nega
tives false negatives
high Quality firm classified low Quality
true negativesall remaining firms
correctly classified as non-Quality
Actualpositives negatives
Pred
icte
d posit
ives true positives
high Quality firm classified high Quality
false positiveslow Quality
classified high Quality
Clarity is Confidence 10 Market Commentary
Accrual-based Quality Signals – reliable but imprecise Another popular definition of Quality focuses on companies that exhibit low accruals. In a nutshell, accruals are adjustments for revenues earned or expenses incurred but not yet recorded. Accrual accounting recognizes the economic event at the time of its occurrence regardless of when the cash transaction occurs (matching principle).
Let’s define key terms as follows:
Accruals = earnings – cash from operations (CFO) – cash from investing (CFI)
NOA = net operating assets = non-financial assets – non-financial liabilities
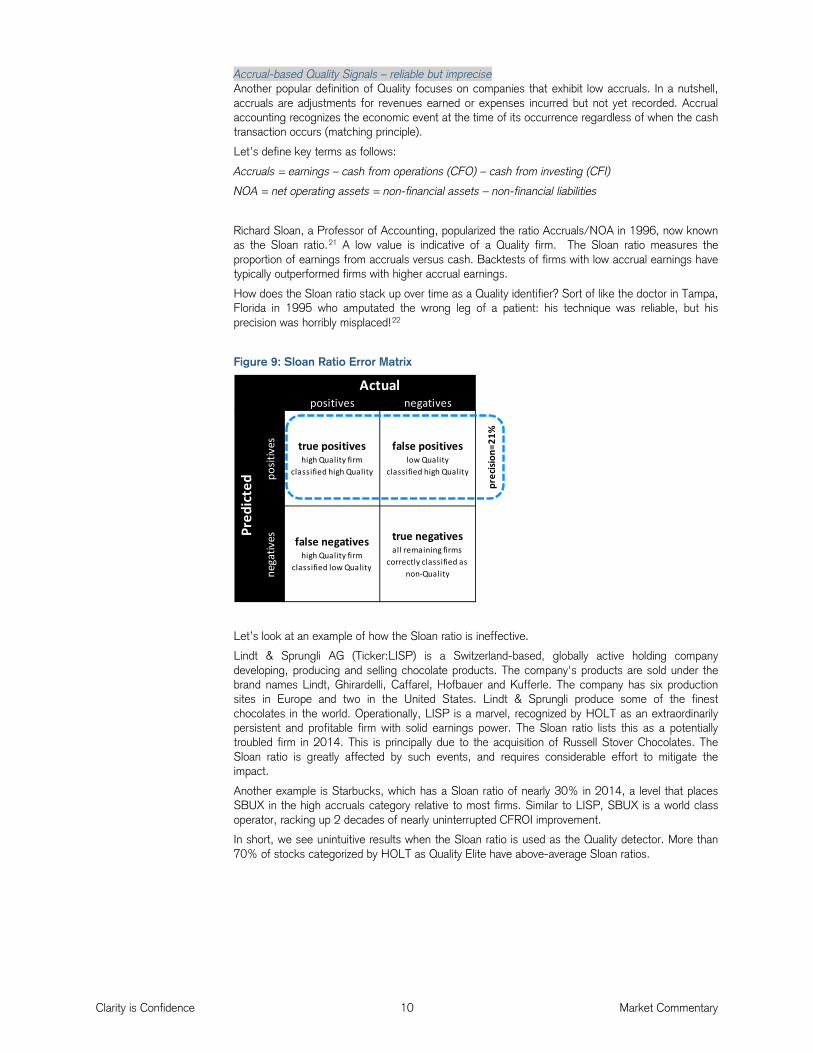
Richard Sloan, a Professor of Accounting, popularized the ratio Accruals/NOA in 1996, now known as the Sloan ratio.21 A low value is indicative of a Quality firm. The Sloan ratio measures the proportion of earnings from accruals versus cash. Backtests of firms with low accrual earnings have typically outperformed firms with higher accrual earnings.
How does the Sloan ratio stack up over time as a Quality identifier? Sort of like the doctor in Tampa, Florida in 1995 who amputated the wrong leg of a patient: his technique was reliable, but his precision was horribly misplaced!22
Figure 9: Sloan Ratio Error Matrix
Let’s look at an example of how the Sloan ratio is ineffective.
Lindt & Sprungli AG (Ticker:LISP) is a Switzerland-based, globally active holding company developing, producing and selling chocolate products. The company's products are sold under the brand names Lindt, Ghirardelli, Caffarel, Hofbauer and Kufferle. The company has six production sites in Europe and two in the United States. Lindt & Sprungli produce some of the finest chocolates in the world. Operationally, LISP is a marvel, recognized by HOLT as an extraordinarily persistent and profitable firm with solid earnings power. The Sloan ratio lists this as a potentially troubled firm in 2014. This is principally due to the acquisition of Russell Stover Chocolates. The Sloan ratio is greatly affected by such events, and requires considerable effort to mitigate the impact.
Another example is Starbucks, which has a Sloan ratio of nearly 30% in 2014, a level that places SBUX in the high accruals category relative to most firms. Similar to LISP, SBUX is a world class operator, racking up 2 decades of nearly uninterrupted CFROI improvement.
In short, we see unintuitive results when the Sloan ratio is used as the Quality detector. More than 70% of stocks categorized by HOLT as Quality Elite have above-average Sloan ratios.
Acc=71% Actualpositives negatives
Pred
icte
d posit
ives true positives
high Quality firm classified high Quality
false positiveslow Quality
classified high Quality
prec
ision
=21%
nega
tives false negatives
high Quality firm classified low Quality
true negativesall remaining firms
correctly classified as non-Quality
Clarity is Confidence 11 Market Commentary
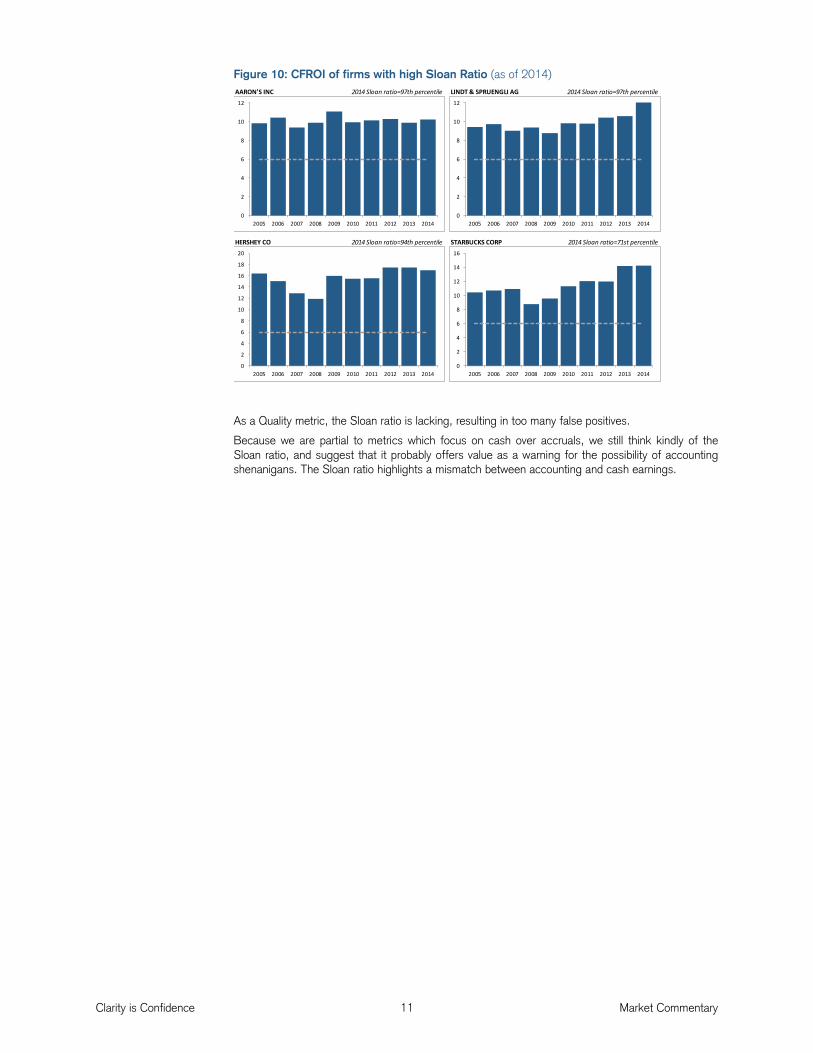
Figure 10: CFROI of firms with high Sloan Ratio (as of 2014)
As a Quality metric, the Sloan ratio is lacking, resulting in too many false positives.
Because we are partial to metrics which focus on cash over accruals, we still think kindly of the Sloan ratio, and suggest that it probably offers value as a warning for the possibility of accounting shenanigans. The Sloan ratio highlights a mismatch between accounting and cash earnings.
AARON'S INC 2014 Sloan ratio=97th percentile LINDT & SPRUENGLI AG 2014 Sloan ratio=97th percentile
HERSHEY CO 2014 Sloan ratio=94th percentile STARBUCKS CORP 2014 Sloan ratio=71st percentile
0
2
4
6
8
10
12
2005 2006 2007 2008 2009 2010 2011 2012 2013 2014
0
2
4
6
8
10
12
14
16
18
20
2005 2006 2007 2008 2009 2010 2011 2012 2013 2014
0
2
4
6
8
10
12
2005 2006 2007 2008 2009 2010 2011 2012 2013 2014
0
2
4
6
8
10
12
14
16
2005 2006 2007 2008 2009 2010 2011 2012 2013 2014
Clarity is Confidence 12 Market Commentary
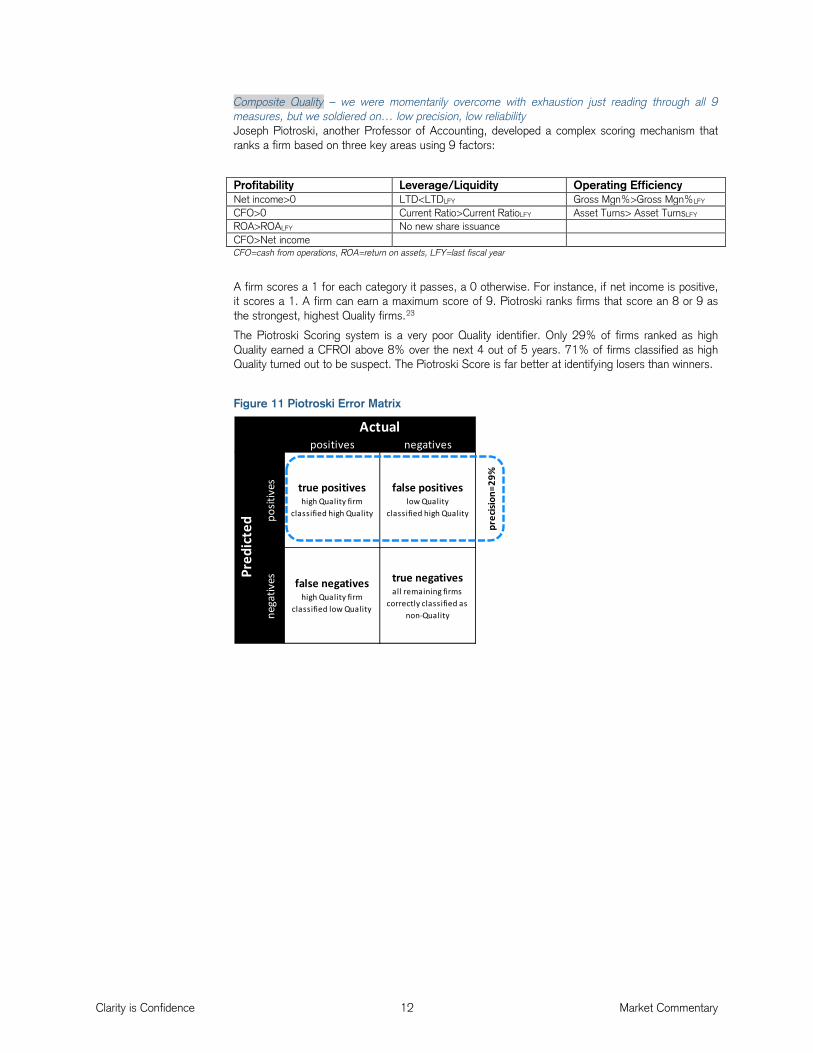
Composite Quality – we were momentarily overcome with exhaustion just reading through all 9 measures, but we soldiered on… low precision, low reliability Joseph Piotroski, another Professor of Accounting, developed a complex scoring mechanism that ranks a firm based on three key areas using 9 factors:
Profitability Leverage/Liquidity Operating Efficiency Net income>0 LTD<LTDLFY Gross Mgn%>Gross Mgn%LFY CFO>0 Current Ratio>Current RatioLFY Asset Turns> Asset TurnsLFY ROA>ROALFY No new share issuance CFO>Net income CFO=cash from operations, ROA=return on assets, LFY=last fiscal year
A firm scores a 1 for each category it passes, a 0 otherwise. For instance, if net income is positive, it scores a 1. A firm can earn a maximum score of 9. Piotroski ranks firms that score an 8 or 9 as the strongest, highest Quality firms.23
The Piotroski Scoring system is a very poor Quality identifier. Only 29% of firms ranked as high Quality earned a CFROI above 8% over the next 4 out of 5 years. 71% of firms classified as high Quality turned out to be suspect. The Piotroski Score is far better at identifying losers than winners.
Figure 11 Piotroski Error Matrix
Acc=66%
Pred
icte
d posit
ives true positives
high Quality firm classified high Quality
false positiveslow Quality
classified high Quality
prec
ision
=29%
nega
tives false negatives
high Quality firm classified low Quality
true negativesall remaining firms
correctly classified as non-Quality
Actualpositives negatives
Clarity is Confidence 13 Market Commentary
HOLT’s Quality Categories
HOLT identifies three types of high Quality:
• Wonderful Companies • eCAPs • Super-eCAPs
Wonderful Companies
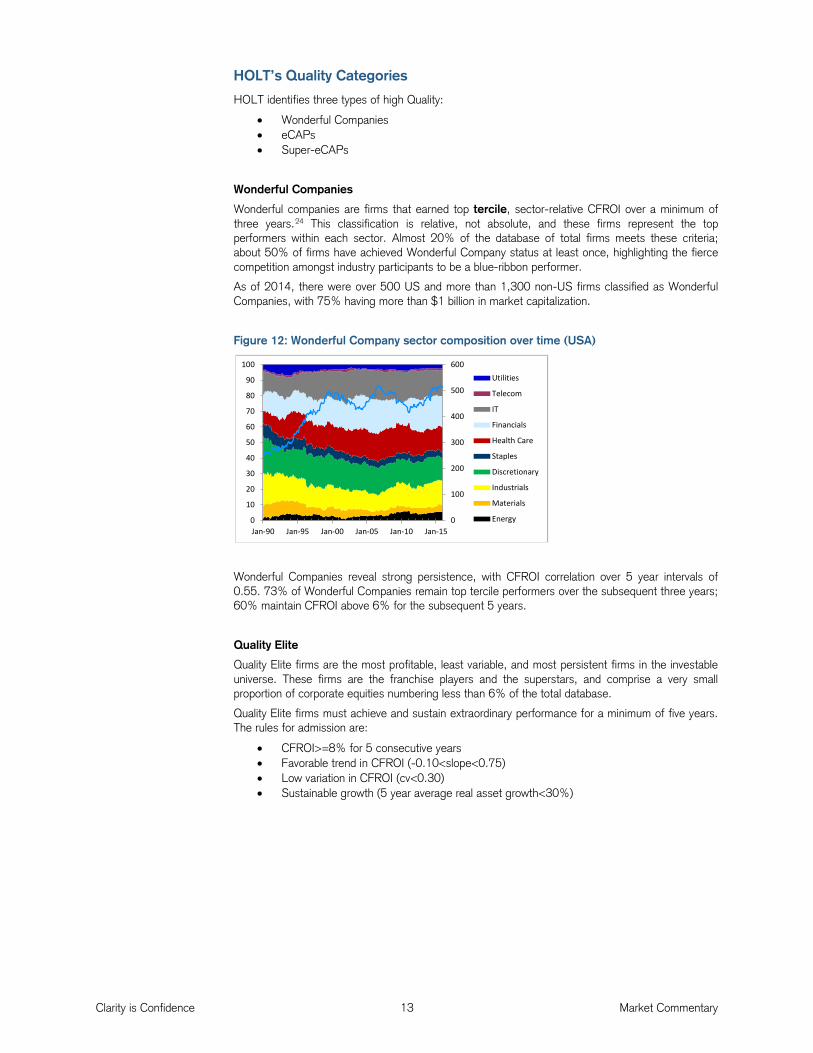
Wonderful companies are firms that earned top tercile, sector-relative CFROI over a minimum of three years.24 This classification is relative, not absolute, and these firms represent the top performers within each sector. Almost 20% of the database of total firms meets these criteria; about 50% of firms have achieved Wonderful Company status at least once, highlighting the fierce competition amongst industry participants to be a blue-ribbon performer.
As of 2014, there were over 500 US and more than 1,300 non-US firms classified as Wonderful Companies, with 75% having more than $1 billion in market capitalization.
Figure 12: Wonderful Company sector composition over time (USA)
Wonderful Companies reveal strong persistence, with CFROI correlation over 5 year intervals of 0.55. 73% of Wonderful Companies remain top tercile performers over the subsequent three years; 60% maintain CFROI above 6% for the subsequent 5 years.
Quality Elite
Quality Elite firms are the most profitable, least variable, and most persistent firms in the investable universe. These firms are the franchise players and the superstars, and comprise a very small proportion of corporate equities numbering less than 6% of the total database.
Quality Elite firms must achieve and sustain extraordinary performance for a minimum of five years. The rules for admission are:
• CFROI>=8% for 5 consecutive years • Favorable trend in CFROI (-0.10<slope<0.75) • Low variation in CFROI (cv<0.30) • Sustainable growth (5 year average real asset growth<30%)
0
100
200
300
400
500
600
0
10
20
30
40
50
60
70
80
90
100
Jan-90 Jan-95 Jan-00 Jan-05 Jan-10 Jan-15
Utilities
Telecom
IT
Financials
Health Care
Staples
Discretionary
Industrials
Materials
Energy
Clarity is Confidence 14 Market Commentary
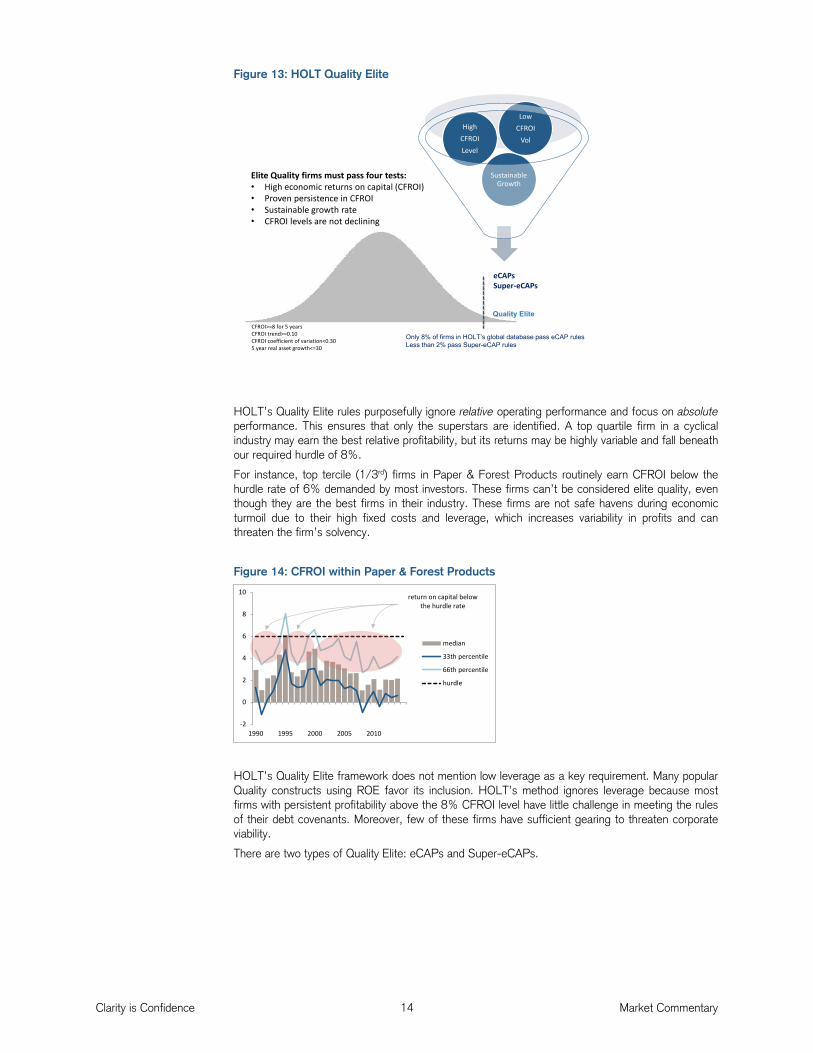
Figure 13: HOLT Quality Elite
HOLT’s Quality Elite rules purposefully ignore relative operating performance and focus on absolute performance. This ensures that only the superstars are identified. A top quartile firm in a cyclical industry may earn the best relative profitability, but its returns may be highly variable and fall beneath our required hurdle of 8%.
For instance, top tercile (1/3rd) firms in Paper & Forest Products routinely earn CFROI below the hurdle rate of 6% demanded by most investors. These firms can’t be considered elite quality, even though they are the best firms in their industry. These firms are not safe havens during economic turmoil due to their high fixed costs and leverage, which increases variability in profits and can threaten the firm’s solvency.
Figure 14: CFROI within Paper & Forest Products
HOLT’s Quality Elite framework does not mention low leverage as a key requirement. Many popular Quality constructs using ROE favor its inclusion. HOLT’s method ignores leverage because most firms with persistent profitability above the 8% CFROI level have little challenge in meeting the rules of their debt covenants. Moreover, few of these firms have sufficient gearing to threaten corporate viability.
There are two types of Quality Elite: eCAPs and Super-eCAPs.
Sustainable Growth
HighCFROI Level
Low CFROI
Vol
Elite Quality firms must pass four tests:• High economic returns on capital (CFROI)• Proven persistence in CFROI• Sustainable growth rate• CFROI levels are not declining
eCAPsSuper-eCAPs
Quality EliteCFROI>=8 for 5 yearsCFROI trend>=0.10CFROI coefficient of variation<0.305 year real asset growth<=30
Only 8% of firms in HOLT’s global database pass eCAP rulesLess than 2% pass Super-eCAP rules
-2
0
2
4
6
8
10
1990 1995 2000 2005 2010
median
33th percentile
66th percentile
hurdle
return on capital below the hurdle rate
Clarity is Confidence 15 Market Commentary
Empirical Competitive Advantage Period (eCAPs)
eCAPs must pass all the Quality Elite rules described above.
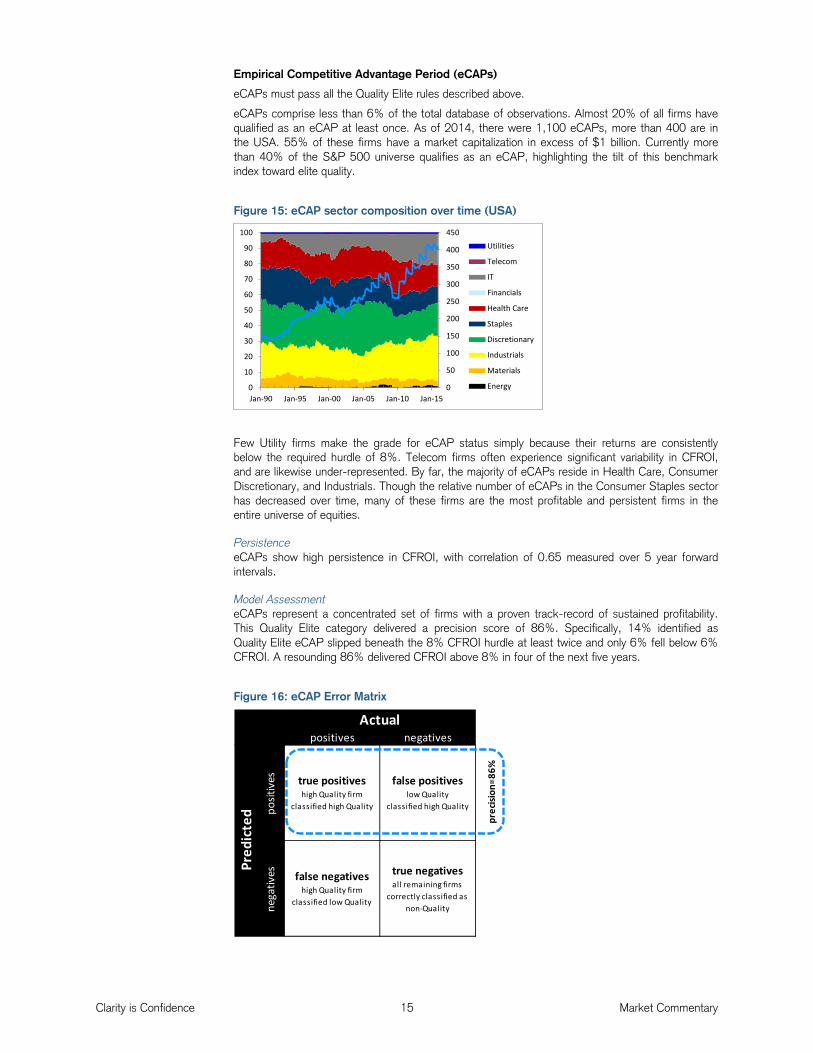
eCAPs comprise less than 6% of the total database of observations. Almost 20% of all firms have qualified as an eCAP at least once. As of 2014, there were 1,100 eCAPs, more than 400 are in the USA. 55% of these firms have a market capitalization in excess of $1 billion. Currently more than 40% of the S&P 500 universe qualifies as an eCAP, highlighting the tilt of this benchmark index toward elite quality.
Figure 15: eCAP sector composition over time (USA)
Few Utility firms make the grade for eCAP status simply because their returns are consistently below the required hurdle of 8%. Telecom firms often experience significant variability in CFROI, and are likewise under-represented. By far, the majority of eCAPs reside in Health Care, Consumer Discretionary, and Industrials. Though the relative number of eCAPs in the Consumer Staples sector has decreased over time, many of these firms are the most profitable and persistent firms in the entire universe of equities.
Persistence eCAPs show high persistence in CFROI, with correlation of 0.65 measured over 5 year forward intervals.
Model Assessment eCAPs represent a concentrated set of firms with a proven track-record of sustained profitability. This Quality Elite category delivered a precision score of 86%. Specifically, 14% identified as Quality Elite eCAP slipped beneath the 8% CFROI hurdle at least twice and only 6% fell below 6% CFROI. A resounding 86% delivered CFROI above 8% in four of the next five years.
Figure 16: eCAP Error Matrix
0
50
100
150
200
250
300
350
400
450
0
10
20
30
40
50
60
70
80
90
100
Jan-90 Jan-95 Jan-00 Jan-05 Jan-10 Jan-15
Utilities
Telecom
IT
Financials
Health Care
Staples
Discretionary
Industrials
Materials
Energy
Acc=77% Actualpositives negatives
Pred
icte
d posit
ives true positives
high Quality firm classified high Quality
false positiveslow Quality
classified high Quality
prec
ision
=86%
nega
tives false negatives
high Quality firm classified low Quality
true negativesall remaining firms
correctly classified as non-Quality
Clarity is Confidence 16 Market Commentary
Super-eCAPs
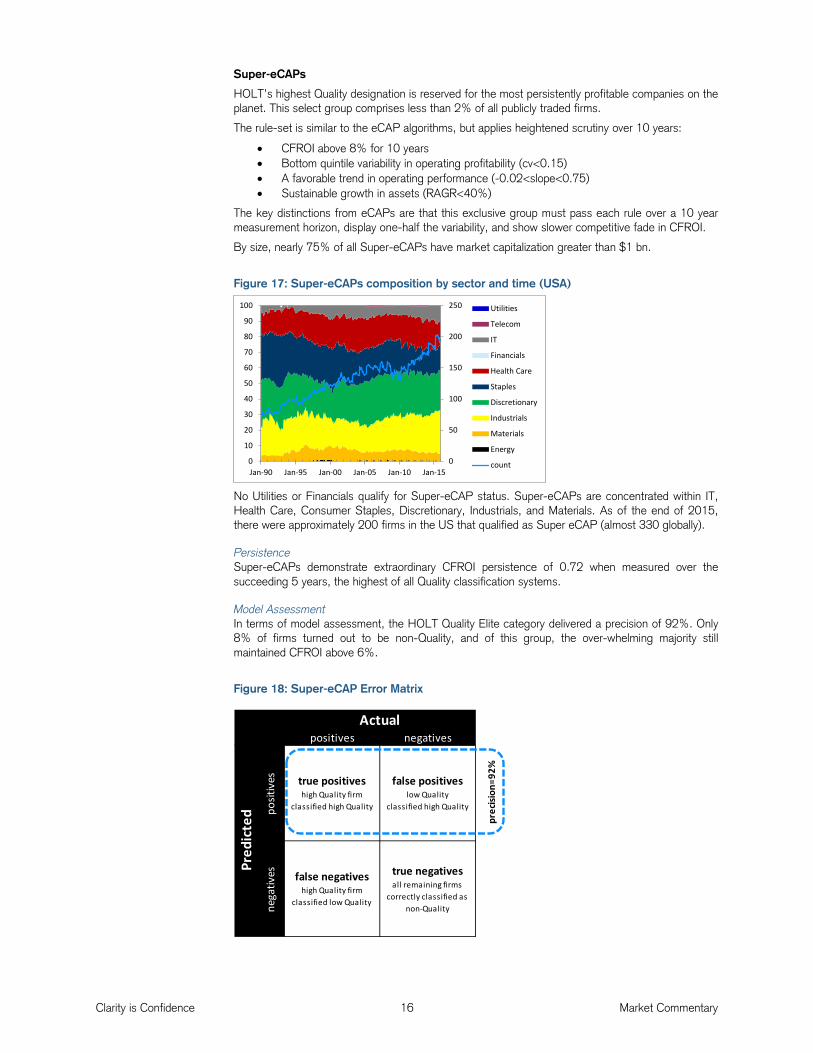
HOLT’s highest Quality designation is reserved for the most persistently profitable companies on the planet. This select group comprises less than 2% of all publicly traded firms.
The rule-set is similar to the eCAP algorithms, but applies heightened scrutiny over 10 years:
• CFROI above 8% for 10 years • Bottom quintile variability in operating profitability (cv<0.15) • A favorable trend in operating performance (-0.02<slope<0.75) • Sustainable growth in assets (RAGR<40%)
The key distinctions from eCAPs are that this exclusive group must pass each rule over a 10 year measurement horizon, display one-half the variability, and show slower competitive fade in CFROI.
By size, nearly 75% of all Super-eCAPs have market capitalization greater than $1 bn.
Figure 17: Super-eCAPs composition by sector and time (USA)
No Utilities or Financials qualify for Super-eCAP status. Super-eCAPs are concentrated within IT, Health Care, Consumer Staples, Discretionary, Industrials, and Materials. As of the end of 2015, there were approximately 200 firms in the US that qualified as Super eCAP (almost 330 globally).
Persistence Super-eCAPs demonstrate extraordinary CFROI persistence of 0.72 when measured over the succeeding 5 years, the highest of all Quality classification systems.
Model Assessment In terms of model assessment, the HOLT Quality Elite category delivered a precision of 92%. Only 8% of firms turned out to be non-Quality, and of this group, the over-whelming majority still maintained CFROI above 6%.
Figure 18: Super-eCAP Error Matrix
0
50
100
150
200
250
0
10
20
30
40
50
60
70
80
90
100
Jan-90 Jan-95 Jan-00 Jan-05 Jan-10 Jan-15
Utilities
Telecom
IT
Financials
Health Care
Staples
Discretionary
Industrials
Materials
Energy
count
Acc=75%
nega
tives false negatives
high Quality firm classified low Quality
true negativesall remaining firms
correctly classified as non-Quality
Actualpositives negatives
posit
ives true positives
high Quality firm classified high Quality
false positiveslow Quality
classified high Quality
prec
ision
=92%
Pred
icte
d
Clarity is Confidence 17 Market Commentary
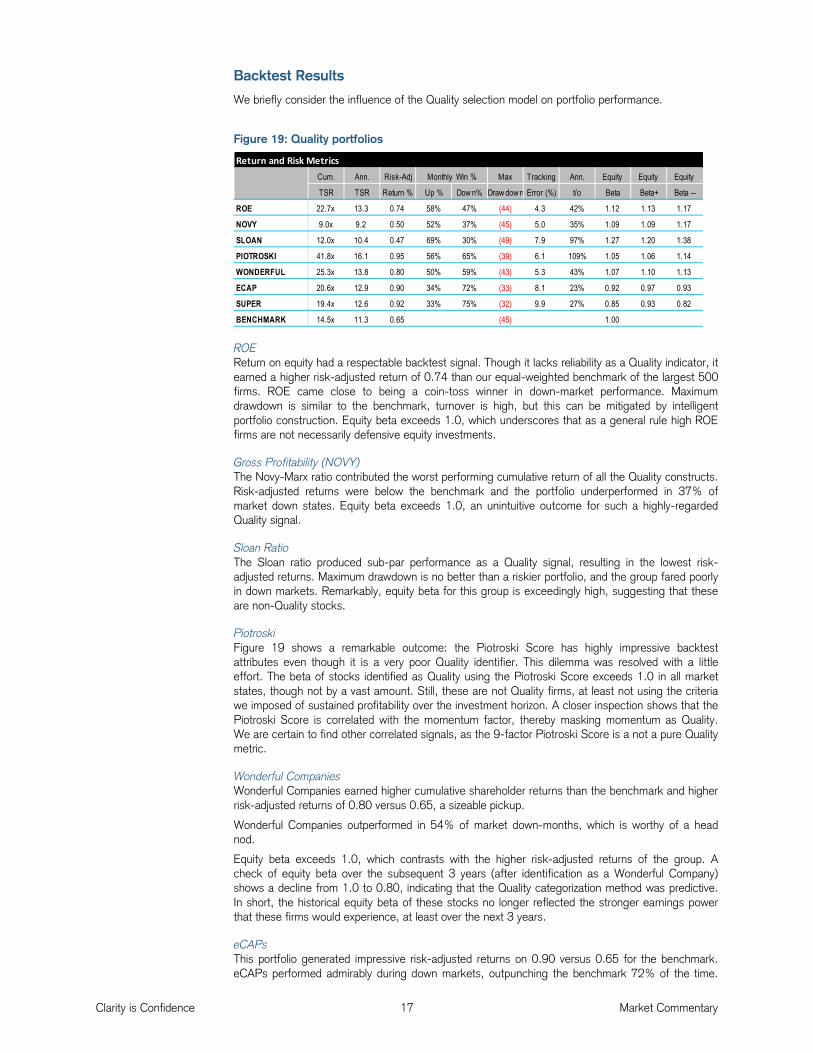
Backtest Results
We briefly consider the influence of the Quality selection model on portfolio performance.
Figure 19: Quality portfolios
ROE Return on equity had a respectable backtest signal. Though it lacks reliability as a Quality indicator, it earned a higher risk-adjusted return of 0.74 than our equal-weighted benchmark of the largest 500 firms. ROE came close to being a coin-toss winner in down-market performance. Maximum drawdown is similar to the benchmark, turnover is high, but this can be mitigated by intelligent portfolio construction. Equity beta exceeds 1.0, which underscores that as a general rule high ROE firms are not necessarily defensive equity investments.
Gross Profitability (NOVY) The Novy-Marx ratio contributed the worst performing cumulative return of all the Quality constructs. Risk-adjusted returns were below the benchmark and the portfolio underperformed in 37% of market down states. Equity beta exceeds 1.0, an unintuitive outcome for such a highly-regarded Quality signal.
Sloan Ratio The Sloan ratio produced sub-par performance as a Quality signal, resulting in the lowest risk-adjusted returns. Maximum drawdown is no better than a riskier portfolio, and the group fared poorly in down markets. Remarkably, equity beta for this group is exceedingly high, suggesting that these are non-Quality stocks.
Piotroski Figure 19 shows a remarkable outcome: the Piotroski Score has highly impressive backtest attributes even though it is a very poor Quality identifier. This dilemma was resolved with a little effort. The beta of stocks identified as Quality using the Piotroski Score exceeds 1.0 in all market states, though not by a vast amount. Still, these are not Quality firms, at least not using the criteria we imposed of sustained profitability over the investment horizon. A closer inspection shows that the Piotroski Score is correlated with the momentum factor, thereby masking momentum as Quality. We are certain to find other correlated signals, as the 9-factor Piotroski Score is a not a pure Quality metric.
Wonderful Companies Wonderful Companies earned higher cumulative shareholder returns than the benchmark and higher risk-adjusted returns of 0.80 versus 0.65, a sizeable pickup.
Wonderful Companies outperformed in 54% of market down-months, which is worthy of a head nod.
Equity beta exceeds 1.0, which contrasts with the higher risk-adjusted returns of the group. A check of equity beta over the subsequent 3 years (after identification as a Wonderful Company) shows a decline from 1.0 to 0.80, indicating that the Quality categorization method was predictive. In short, the historical equity beta of these stocks no longer reflected the stronger earnings power that these firms would experience, at least over the next 3 years.
eCAPs This portfolio generated impressive risk-adjusted returns on 0.90 versus 0.65 for the benchmark. eCAPs performed admirably during down markets, outpunching the benchmark 72% of the time.
Return and Risk MetricsCum. Ann. Risk-Adj Max Tracking Ann. Equity Equity Equity
TSR TSR Return % Up % Dow n% Draw dow n Error (%) t/o Beta Beta+ Beta --
ROE 22.7x 13.3 0.74 58% 47% (44) 4.3 42% 1.12 1.13 1.17
NOVY 9.0x 9.2 0.50 52% 37% (45) 5.0 35% 1.09 1.09 1.17
SLOAN 12.0x 10.4 0.47 69% 30% (49) 7.9 97% 1.27 1.20 1.38
PIOTROSKI 41.8x 16.1 0.95 56% 65% (39) 6.1 109% 1.05 1.06 1.14
WONDERFUL 25.3x 13.8 0.80 50% 59% (43) 5.3 43% 1.07 1.10 1.13
ECAP 20.6x 12.9 0.90 34% 72% (33) 8.1 23% 0.92 0.97 0.93
SUPER 19.4x 12.6 0.92 33% 75% (32) 9.9 27% 0.85 0.93 0.82
BENCHMARK 14.5x 11.3 0.65 (45) 1.00
Monthly Win %
Clarity is Confidence 18 Market Commentary
The high tracking error and low information ratio are indicative of non-conformance; this portfolio is not meant to mimic the broader index. Annual turnover was very low at 23%. Equity beta was 0.92 on average.
Super eCAPs Super-eCAPs earned lower cumulative shareholder returns than the benchmark, but the highest risk-adjusted returns of the all Quality constructs at 0.92. Super-eCAPs outclassed the benchmark in a whopping 75% of market down-months, delivering high marks as a safe-haven vehicle. Equity beta of 0.85 was the lowest of all portfolios, underscoring the truly defensive nature of these stocks. Though the lower asset volatility risk of these firms was anticipated by beta, it was perhaps not fully appreciated by investors, which further explains its benchmark outperformance. Annualized turnover was pleasantly low at 27%, negligibly higher than eCAPs, but bear in mind that the Super-eCAP portfolio is more concentrated than eCAPs.
Summary
A useful Quality metric should be predictive. It should precisely identify – today – high Quality firms. It should demonstrate reliability in that firms tagged as Quality at the beginning of the investment selection process remain Quality over the investment horizon.
A test of predictive precision and reliability does not require a backtest. A simple confusion matrix can be used to visualize the performance of the classification algorithms.
Popular measures such as ROE, Novy-Marx’s gross profitability ratio, the Sloan ratio, and the Piotroski Score, all lack reliability as predictive indicators of Quality. The Novy-Marx ratio is the best Quality indicator of this group. We are not suggesting that these metrics should not be used, only that they lack robustness as predictors of Quality.
CFROI demonstrates much higher correlation over succeeding years. CFROI is an excellent Quality indicator. When used in a systematic fashion, as employed in the eCAP and Super-eCAP algorithms, it results in high precision. All of HOLT’s Quality categories demonstrate reliability as Quality indicators for investment horizons up to five years, a period that exceeds the horizon of most professional long-only managers.
Human judgment can result in a pervasive source of error in the quest for Quality. This error can be successfully attenuated through careful attention and design of the Quality signal, whether your preference is ROE, ROIC, or CFROI. HOLT’s Quality categories are readily available for all HOLT clients.
Finally, we reiterate that price is irrelevant in the Quality construct because in this context, Quality is a statement about the operational character and management skill of the business (the persistence of earnings).
Clarity is Confidence 19 Market Commentary
ENDNOTES
1 source: http://www.nasdaq.com/article/high-and-lowquality-stocks-beat-the-sp-500-cm252735 2 Asness, Clifford S. and Frazzini, Andrea and Pedersen, Lasse Heje, Quality Minus Junk (June 19, 2014). Available at SSRN: http://ssrn.com/abstract=2312432 or http://dx.doi.org/10.2139/ssrn.2312432 3 Fama, Eugene F. and French, Kenneth R., A Five-Factor Asset Pricing Model (September 2014). Fama-Miller Working Paper. Available at SSRN: http://ssrn.com/abstract=2287202 or http://dx.doi.org/10.2139/ssrn.2287202 4 According to Warren Buffett in 1979, “The primary test of managerial economic performance is the achievement of a high earnings rate on equity capital employed (without undue leverage, accounting gimmickry, etc.) and not the achievement of consistent gains in earnings per share. In our view, many businesses would be better understood by their shareholder owners, as well as the general public, if managements and financial analysts modified the primary emphasis they place upon earnings per share, and upon yearly changes in that figure.” 5 Asness, Clifford S. and Frazzini, Andrea and Pedersen, Lasse Heje, Quality Minus Junk (June 19, 2014). Available at SSRN: http://ssrn.com/abstract=2312432 or http://dx.doi.org/10.2139/ssrn.2312432 6 Thomas R Stewart. Improving Reliability of Judgmental Forecasts (2001). Principles of Forecasting Volume 30 of the series International Series in Operations Research & Management Science pp 81-106 7 Fama, Eugene F. and French, Kenneth R., A Five-Factor Asset Pricing Model (September 2014). Fama-Miller Working Paper. Available at SSRN: http://ssrn.com/abstract=2287202 or http://dx.doi.org/10.2139/ssrn.2287202 8 Ang, Andrew, Factor Investing (June 10, 2013). Columbia Business School Research Paper No. 13-42. Available at SSRN: http://ssrn.com/abstract=2277397 or http://dx.doi.org/10.2139/ssrn.2277397 Also, see his book, which is excellent: Asset Management: A Systematic Approach to Factor Investing. Oxford University Press. 2014 9 RAFI denies that Quality is a risk factor. While we remain open to such discussion, their arguments against Quality are predicated on poor definitions that lack reliability. More importantly, the determination of Quality as a risk factor should rest more on economic rationale than on a backtest. A backtest can support or contradict an assertion, but it never proves anything. Click here for link to article. 10 Bryant Matthews and David Holland. Wonderful Companies and the Quality Edge. Credit Suisse. September 2015. 11 Campbell R. Harvey, Yan Liu, Heqing Zhu. …and the cross-section of returns…working paper, SSRN February 3, 2015 12 Ang. 13 Sports on-hit wonders:
• Jeremy Lin rose to fame in February 2012. He scored 25 points, five rebounds, and seven assists, in a 99-92 Knicks victory over the New Jersey Nets on Feb 4. He then led a brief winning streak for the New York Knicks up until the All-Star break. He injured his knee in March 2012, and thereafter faded into obscurity again.
• Jimmy Glass was a soccer goalie remembered most for stepping from the goalie box and scoring a last minute goal May 8, 1999 against Plymouth to win the game, and helping Carlisle United preserve their Football League status.
• Buster Douglas knocked Mike Tyson out February 11, 1990 in Tokyo. At the time, Tyson was considered the best boxer in the world. The fight is regarded by some as the biggest upset in the history of heavyweight championship fights. Douglas’ boxing career immediately languished afterwards.
• Joe Charboneau captured the attention of baseball fans in 1980, with his off-field antics (he could open a beer bottle with his eye-socket!) and on-field prowess. He won American League rookie of the year, playing 131 games, with a .289 batting average, 23 home runs and 87 RBI. He flamed out in 1981 after injuring his back, and never recovered. He holds the record for the fewest career games played in the Major Leagues by a Rookie of the Year, and is a poster child for the oft-cited sophomore jinx. Darn, Joe, why, why’d you let me down?!
14 Reliability. Merriam-Webster.com Retrieved June 9, 2014, from www.merriam-webster.com/dictionary/reliability 15 The positive predictive value (precision) is a conditional probability of the inferential form, and equals p(a company is quality | the quality metric indicates quality). Its complement is the false discovery rate which equals p(a company is non-quality | the quality metric indicates quality), or simply one minus PPV. 16 Warren Buffett, Letter to Shareholders, 1992 Berkshire Hathaway Annual Report. 17 Graham recognized two types of investors, distinguished not by their risk-taking, but rather by the “intelligent effort” they are “willing and able to bring to bear on the task”: defensive versus enterprising. Defensive investors were advised to focus on large, liquid, best-of-breed firms so as to ensure capital preservation. Enterprising investors were advised to search for attractively priced opportunities as dictated by intelligent analysis. Maria Crawford’s discussion in AAII Journal is enlightening. Link: https://www.aaii.com/journal/article/value-investing-a-look-at-the-benjamin-graham-approach 18 Non-Quality firms are simply those that do not pass the Quality rule set. A binary classification simplifies test results and their interpretation. 19 eCAPs comprise about 8% of all firms in the HOLT database, and Super-eCAPs comprise less than 2% of all firms. So as not to be overly punitive against non-HOLT methodologies, we select the top decile performers from each metric and judge their sustained economic returns over the subsequent 5 year horizon. 20 Asness, Clifford S. and Frazzini, Andrea and Pedersen, Lasse Heje. 21 Sloan, Richard G., Do Stock Prices Fully Reflect Information in Accruals and Cash Flows About Future Earnings?. THE ACCOUNTING REVIEW, Vol 71, No 3, Spring 1996. Available at SSRN: http://ssrn.com/abstract=2598 22 See http://articles.latimes.com/1995-04-14/news/mn-54645_1_american-hospital 23 Piotroski, Joseph D., Value Investing: The Use of Historical Financial Statement Information to Separate Winners from Losers. As published in Journal of Accounting Research, Vol 38, Supplement, 2000. Available at SSRN: http://ssrn.com/abstract=249455 24 Firms are ranked by MSCI GIC level 2 classification (Industry Group)
Clarity is Confidence 20 Market Commentary
Global Market Commentary Disclaimer References to Credit Suisse include all of the subsidiaries and affiliates of Credit Suisse AG operating under its investment banking division. For more information on our structure, please follow the attached link: https://www.credit-suisse.com/us/en/about-us/our-company.html This material has been prepared by individual traders or sales personnel of Credit Suisse and not by Credit Suisse's research department. The information contained in this document has been provided as general market commentary only and does not constitute any form of regulated financial advice, legal, tax or other regulated financial service. It is intended only to provide observations and views of these traders or sales personnel, which may be different from, or inconsistent with, the observations and views of Credit Suisse research department analysts, other Credit Suisse traders or sales personnel, or the proprietary positions of Credit Suisse. Observations and views expressed herein may be changed by the trader or sales personnel at any time without notice. Credit Suisse accepts no liability for losses arising from the use of this material. This material does not purport to contain all of the information that an interested party may desire and, in fact, provides only a limited view of a particular market. It is not investment research, or a research recommendation for regulatory purposes, as it does not constitute substantive research or analysis. The information provided is not intended to provide a sufficient basis on which to make an investment decision and is not a personal recommendation or investment advice. While it has been obtained from or based upon sources believed by the trader or sales personnel to be reliable, each of the trader or sales personnel and Credit Suisse does not represent or warrant its accuracy or completeness and is not responsible for losses or damages arising from the use of this material. This material is provided for informational purposes and does not constitute an invitation or offer to subscribe for or purchase any of the products or services mentioned. It is directed exclusively at Credit Suisse's market professional and institutional investor clients (e.g. QIBs) as defined by the rules of the relevant regulatory authority, and must not be forwarded or shared with retail customers or the public. It is not intended for private customers and such persons should not rely on this material. Moreover, any investment or service to which this material may relate will not be made available by Credit Suisse to such private customers. This material may have previously been communicated to the Credit Suisse trading desk or other Credit Suisse clients. You should assume that the trading desk makes markets and/or currently maintains positions in any of the securities mentioned above. Credit Suisse may, from time to time, participate or invest in transactions with issuers of securities that participate in the markets referred to herein, perform services for or solicit business from such issuers, and/or have a position or effect transactions in the securities or derivatives thereof. Information provided on any trades executed with Credit Suisse will not constitute an official confirmation of the trade details, and all preliminary trade report information is subject to our formal written confirmation. FOR IMPORTANT DISCLOSURES on companies covered in Credit Suisse Investment Banking Division research reports, please see www.credit-suisse.com/researchdisclosures. To obtain a copy of the most recent Credit Suisse research on any company mentioned please contact your sales representative or go to http://www.credit-suisse.com/researchandanalytics. Past performance should not be taken as an indication or guarantee of future performance, and no representation or warranty, expressed or implied is made regarding future performance. Backtested, hypothetical or simulated performance results have inherent limitations. Simulated results are achieved by the retroactive application of a backtested model itself designed with the benefit of hindsight. The backtesting of performance differs from the actual account performance because the investment strategy may be adjusted at any time, for any reason and can continue to be changed until desired or better performance results are achieved. Alternative modeling techniques or assumptions might produce significantly different results and prove to be more appropriate. Past hypothetical backtest results are neither an indicator nor a guarantee of future returns. Actual results will vary from the analysis. Investment principal on securities can be eroded depending on sale price or market price. In addition, there are securities on which investment principal may be eroded due to changes in redemption amounts. Care is required when investing in such instruments. HOLT Disclaimer The HOLT methodology does not assign ratings or a target price to a security. It is an analytical tool that involves use of a set of proprietary quantitative algorithms and warranted value calculations, collectively called the HOLT valuation model, that are consistently applied to all the companies included in its database. Third-party data (including consensus earnings estimates) are systematically translated into a number of default variables and incorporated into the algorithms available in the HOLT valuation model. The source financial statement, pricing, and earnings data provided by outside data vendors are subject to quality control and may also be adjusted to more closely measure the underlying economics of firm performance. These adjustments provide consistency when analyzing a single company across time, or analyzing multiple companies across industries or national borders. The default scenario that is produced by the HOLT valuation model establishes a warranted price for a security, and as the third-party data are updated, the warranted price may also change. The default variables may also be adjusted to produce alternative warranted prices, any of which could occur. The warranted price is an algorithmic output applied systematically across all companies based on historical levels and volatility of returns. Additional information about the HOLT methodology is available on request CFROI, CFROE, HOLT, HOLT Lens, HOLTfolio, HOLTSelect, HS60, ValueSearch, Signal Flag, Forecaster, “Clarity is Confidence” and “Powered by HOLT” are trademarks or registered trademarks of Credit Suisse Group AG or its affiliates in the United States and other countries. HOLT is a corporate performance and valuation advisory service of Credit Suisse. © 2016 Credit Suisse Group AG and its subsidiaries and affiliates. All rights reserved. For region specific disclosures, including information about applicable registrations and certain regulatory disclosures, please follow the links below: Americas: https://www.credit-suisse.com/legal/en/ib/market_commentary.jsp Europe: https://www.credit-suisse.com/legal/en/ib/europe.jsp (Credit Suisse Securities (Europe) Limited is authorised by the Prudential Regulation Authority and regulated by the Financial Conduct Authority and the Prudential Regulation Authority in the United Kingdom) Asia: https://www.credit-suisse.com/legal/en/ib/market_commentary_disclaimer_asia.jsp General investors in Japan should open the following link and read it: https://www.credit-suisse.com/jp/investment_banking/ja/disclaimer/