Embed Size (px)
DESCRIPTION
Motial oswal study
Citation preview
TM
TM
C M Y K
© Motilal Oswal Securities Ltd., 81-82, Bajaj Bhawan, Nariman Point, Mumbai 400 021 Tel: +91 22 281 2500 Fax: 281 6161
Raamdeo Agrawal +91 22 207 1379; [email protected] Kantak +91 22 2071379; [email protected]
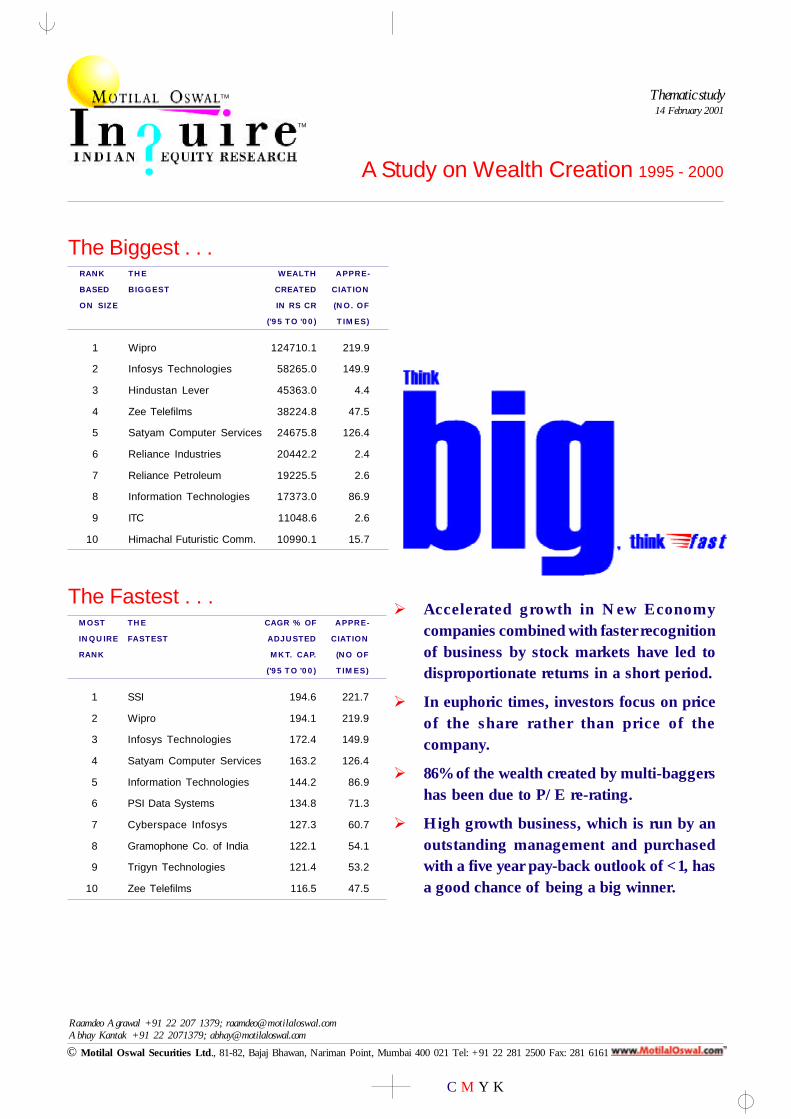
Ø Accelerated growth in New Economycompanies combined with faster recognitionof business by stock markets have led todisproportionate returns in a short period.
Ø In euphoric times, investors focus on priceof the share rather than price of thecompany.
Ø 86% of the wealth created by multi-baggershas been due to P/E re-rating.
Ø High growth business, which is run by anoutstanding management and purchasedwith a five year pay-back outlook of <1, hasa good chance of being a big winner.
Thematic studySECTOR: ENGI14 February 2001
A Study on Wealth Creation 1995 - 2000
RANK THE WEALTH APPRE-BASED BIGGEST CREATED CIATIONON SIZE IN RS CR (NO. OF
('95 TO '00) TIMES)
1 Wipro 124710.1 219.9
2 Infosys Technologies 58265.0 149.9
3 Hindustan Lever 45363.0 4.4
4 Zee Telefilms 38224.8 47.5
5 Satyam Computer Services 24675.8 126.4
6 Reliance Industries 20442.2 2.4
7 Reliance Petroleum 19225.5 2.6
8 Information Technologies 17373.0 86.9
9 ITC 11048.6 2.6
10 Himachal Futuristic Comm. 10990.1 15.7
The Biggest . . .
MOST THE CAGR % OF APPRE-INQUIRE FASTEST ADJUSTED CIATIONRANK MKT. CAP. (NO OF
('95 TO '00) TIMES)
1 SSI 194.6 221.7
2 Wipro 194.1 219.9
3 Infosys Technologies 172.4 149.9
4 Satyam Computer Services 163.2 126.4
5 Information Technologies 144.2 86.9
6 PSI Data Systems 134.8 71.3
7 Cyberspace Infosys 127.3 60.7
8 Gramophone Co. of India 122.1 54.1
9 Trigyn Technologies 121.4 53.2
10 Zee Telefilms 116.5 47.5
The Fastest . . .
2
C M Y K
Wealth Creation Study
February 2001
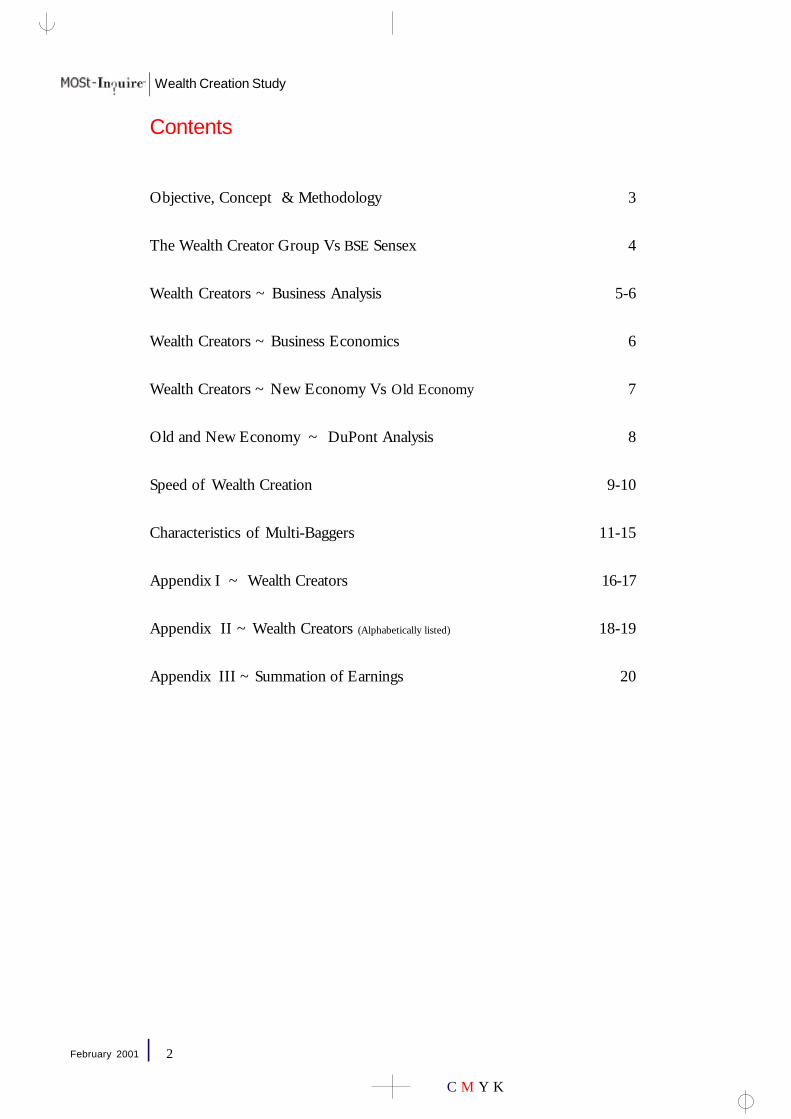
Contents
Objective, Concept & Methodology 3
The Wealth Creator Group Vs BSE Sensex 4
Wealth Creators ~ Business Analysis 5-6
Wealth Creators ~ Business Economics 6
Wealth Creators ~ New Economy Vs Old Economy 7
Old and New Economy ~ DuPont Analysis 8
Speed of Wealth Creation 9-10
Characteristics of Multi-Baggers 11-15
Appendix I ~ Wealth Creators 16-17
Appendix II ~ Wealth Creators (Alphabetically listed) 18-19
Appendix III ~ Summation of Earnings 20
3
C M Y K
Wealth Creation Study
February 2001
Objective, Concept & Methodology
Objective
In the period from 1995 to 2000, market capitalisation for the top 100 Wealth Creatorshas increased by Rs5.15 lakh crores while the entire market capitalisation increased byRs3.41 lakh crores. The period of 1995-2000 has thus seen dramatic wealth creation inone segment of the market and equally dramatic destruction in rest of the market. Thisis mainly due to the spectacular performance of 10 companies, which have grown at aCAGR of 100%+ over the same period. SSI, Wipro, Infosys and Satyam have grownover 125 times. We undertook to study the characteristics of these multi-baggers so thatwe are better prepared to capitalise on such opportunities in future.
As Phil Fisher rightly says, “It seems logical that even before thinking of buying any common stocks,the first step is to see how money has been most successfully made in the past”. On another occasion,he says that “stock market is filled with individuals who know the price of everything but the value ofnothing”.
Wealth Creation studies are attempts to study the past as a guide to the future and gaininsights into the valuation of such successful opportunities.
Concept
Wealth Creation is the process by which a company enhances the market value ofcapital entrusted to it by its shareholders. It is a basic measure of success for anycommercial venture. Wealth Creation is achieved by rational actions of a company in asustained manner.
Methodology
For the purpose of our study*, we have identified the top 100 Wealth Creators for theperiod 1995-2000 in the Indian stock market. These companies have the distinction ofhaving added at least Rs100cr to their market capitalisation over this period, after adjustingfor dilution. We have termed the group the MOSt-Inquire 100 Wealth Creators. Theranks have been accorded on the basis of Speed of Wealth Creation i.e., compoundedgrowth in Wealth Created over the period of study.
* The database used for this study is that of Capitaline Olé and Trends.
4
C M Y K
Wealth Creation Study
February 2001
The Wealth Creator Group Vs BSE Sensex
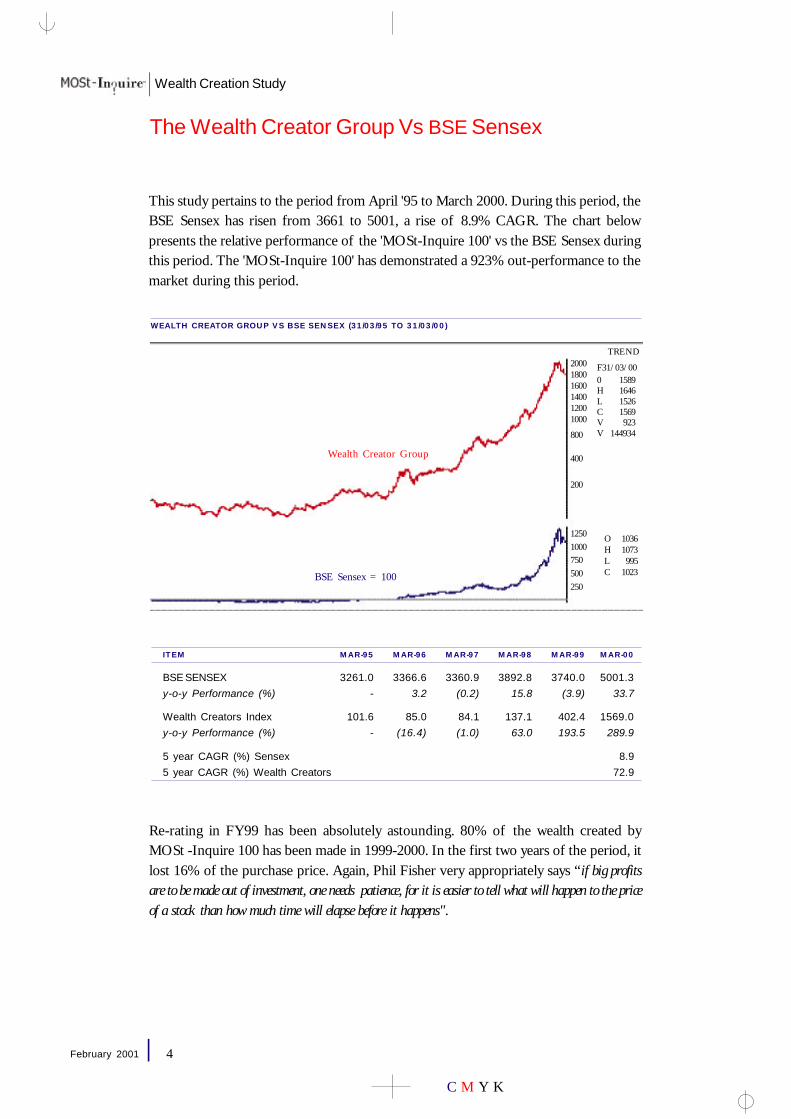
This study pertains to the period from April '95 to March 2000. During this period, theBSE Sensex has risen from 3661 to 5001, a rise of 8.9% CAGR. The chart belowpresents the relative performance of the 'MOSt-Inquire 100' vs the BSE Sensex duringthis period. The 'MOSt-Inquire 100' has demonstrated a 923% out-performance to themarket during this period.
ITEM MAR-95 MAR-96 MAR-97 MAR-98 MAR-99 MAR-00
BSE SENSEX 3261.0 3366.6 3360.9 3892.8 3740.0 5001.3y-o-y Performance (%) - 3.2 (0.2) 15.8 (3.9) 33.7
Wealth Creators Index 101.6 85.0 84.1 137.1 402.4 1569.0y-o-y Performance (%) - (16.4) (1.0) 63.0 193.5 289.9
5 year CAGR (%) Sensex 8.95 year CAGR (%) Wealth Creators 72.9
Re-rating in FY99 has been absolutely astounding. 80% of the wealth created byMOSt -Inquire 100 has been made in 1999-2000. In the first two years of the period, itlost 16% of the purchase price. Again, Phil Fisher very appropriately says “if big profitsare to be made out of investment, one needs patience, for it is easier to tell what will happen to the priceof a stock than how much time will elapse before it happens".
WEALTH CREATOR GROUP VS BSE SENSEX (31/03/95 TO 31/03/00)
TREND
F31/03/000 1589H 1646L 1526C 1569V 923V 144934
200018001600140012001000
800
400
200
12501000750500250
O 1036H 1073L 995C 1023BSE Sensex = 100
Wealth Creator Group
5
C M Y K
Wealth Creation Study
February 2001
Wealth Creators ~ Business Analysis
I Nature of Business
The 1995-2000 Study on Wealth Creation suggests that emergence of infotech companies asthe fastest Wealth Creators is further reinforced. The number of infotech companies amongthe ten fastest wealth creators in 1995-2000 is eight as compared to just three in 1993-1998.Media firms have bagged the remaining two slots.
Apart from infotech companies, the markets seem to reward other superior businessesthat continue to create wealth for shareholders. Pharma and FMCG constitute 29% ofthe group.
II Business Activity
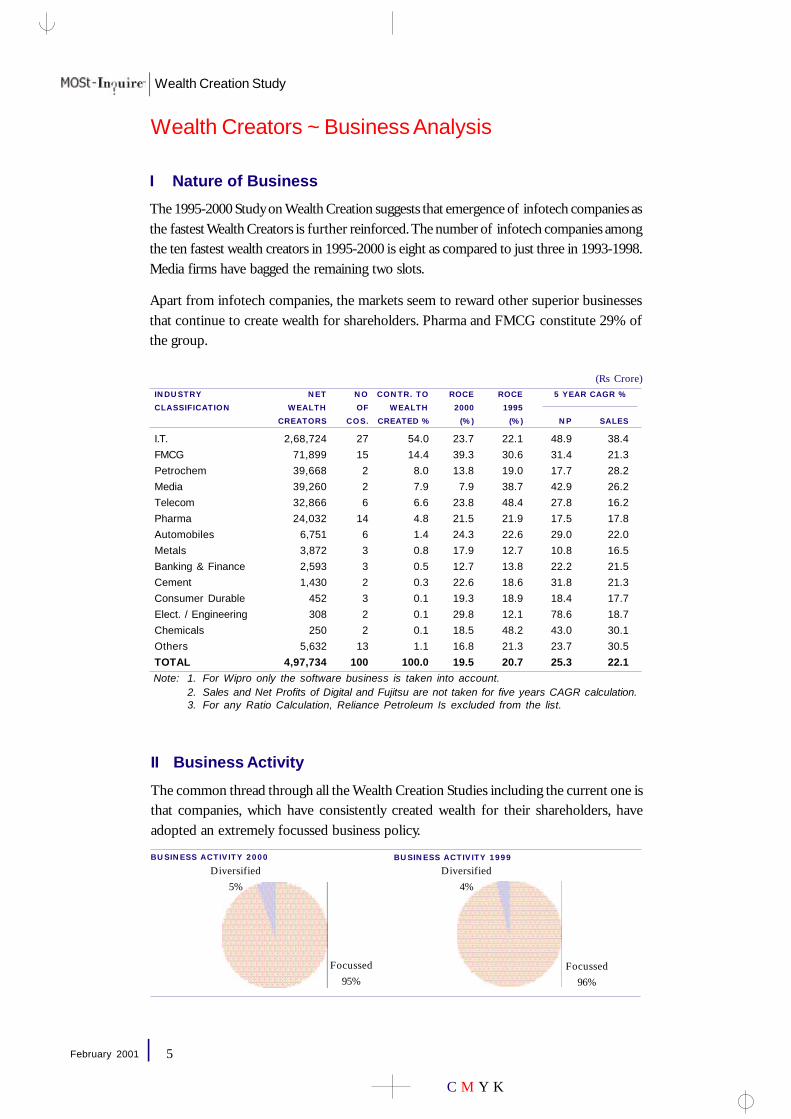
The common thread through all the Wealth Creation Studies including the current one isthat companies, which have consistently created wealth for their shareholders, haveadopted an extremely focussed business policy.
BUSINESS ACTIVITY 2000 BUSINESS ACTIVITY 1999
INDUSTRY NET NO CONTR. TO ROCE ROCE 5 YEAR CAGR %CLASSIFICATION WEALTH OF WEALTH 2000 1995
CREATORS COS. CREATED % (%) (%) NP SALES
I.T. 2,68,724 27 54.0 23.7 22.1 48.9 38.4FMCG 71,899 15 14.4 39.3 30.6 31.4 21.3Petrochem 39,668 2 8.0 13.8 19.0 17.7 28.2Media 39,260 2 7.9 7.9 38.7 42.9 26.2Telecom 32,866 6 6.6 23.8 48.4 27.8 16.2Pharma 24,032 14 4.8 21.5 21.9 17.5 17.8Automobiles 6,751 6 1.4 24.3 22.6 29.0 22.0Metals 3,872 3 0.8 17.9 12.7 10.8 16.5Banking & Finance 2,593 3 0.5 12.7 13.8 22.2 21.5Cement 1,430 2 0.3 22.6 18.6 31.8 21.3Consumer Durable 452 3 0.1 19.3 18.9 18.4 17.7Elect. / Engineering 308 2 0.1 29.8 12.1 78.6 18.7Chemicals 250 2 0.1 18.5 48.2 43.0 30.1Others 5,632 13 1.1 16.8 21.3 23.7 30.5TOTAL 4,97,734 100 100.0 19.5 20.7 25.3 22.1Note: 1. For Wipro only the software business is taken into account.
2. Sales and Net Profits of Digital and Fujitsu are not taken for five years CAGR calculation.3. For any Ratio Calculation, Reliance Petroleum Is excluded from the list.
Focussed95%
Focussed96%
Diversified5%
Diversified4%
(Rs Crore)
6
C M Y K
Wealth Creation Study
February 2001
Wealth Creators ~ Business Analysis (Contd.)
III Product Attribute
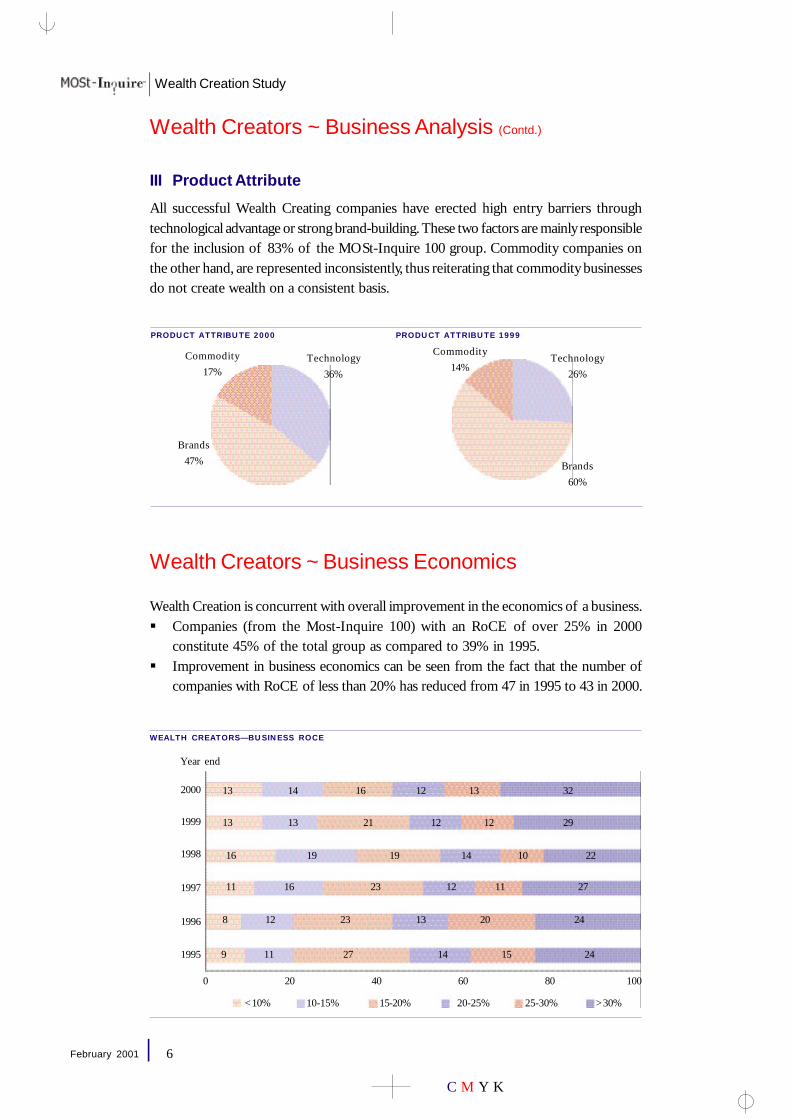
All successful Wealth Creating companies have erected high entry barriers throughtechnological advantage or strong brand-building. These two factors are mainly responsiblefor the inclusion of 83% of the MOSt-Inquire 100 group. Commodity companies onthe other hand, are represented inconsistently, thus reiterating that commodity businessesdo not create wealth on a consistent basis.
PRODUCT ATTRIBUTE 2000 PRODUCT ATTRIBUTE 1999
Wealth Creators ~ Business Economics
Wealth Creation is concurrent with overall improvement in the economics of a business.§ Companies (from the Most-Inquire 100) with an RoCE of over 25% in 2000
constitute 45% of the total group as compared to 39% in 1995.§ Improvement in business economics can be seen from the fact that the number of
companies with RoCE of less than 20% has reduced from 47 in 1995 to 43 in 2000.
WEALTH CREATORS—BUSINESS ROCE
Brands47%
Technology36%
2000
1999
1998
1997
1996
1995
13 14 16 12 13 32
13 13 21 12 12 29
16 19 19 14 10 22
11 16 23 12 11 27
8 12 23 13 20 24
9 11 27 14 15 24
<10% 10-15% 15-20% 20-25% 25-30% >30%
Year end
0 20 40 60 80 100
Commodity17%
Technology26%
Brands60%
Commodity14%
7
C M Y K
Wealth Creation Study
February 2001
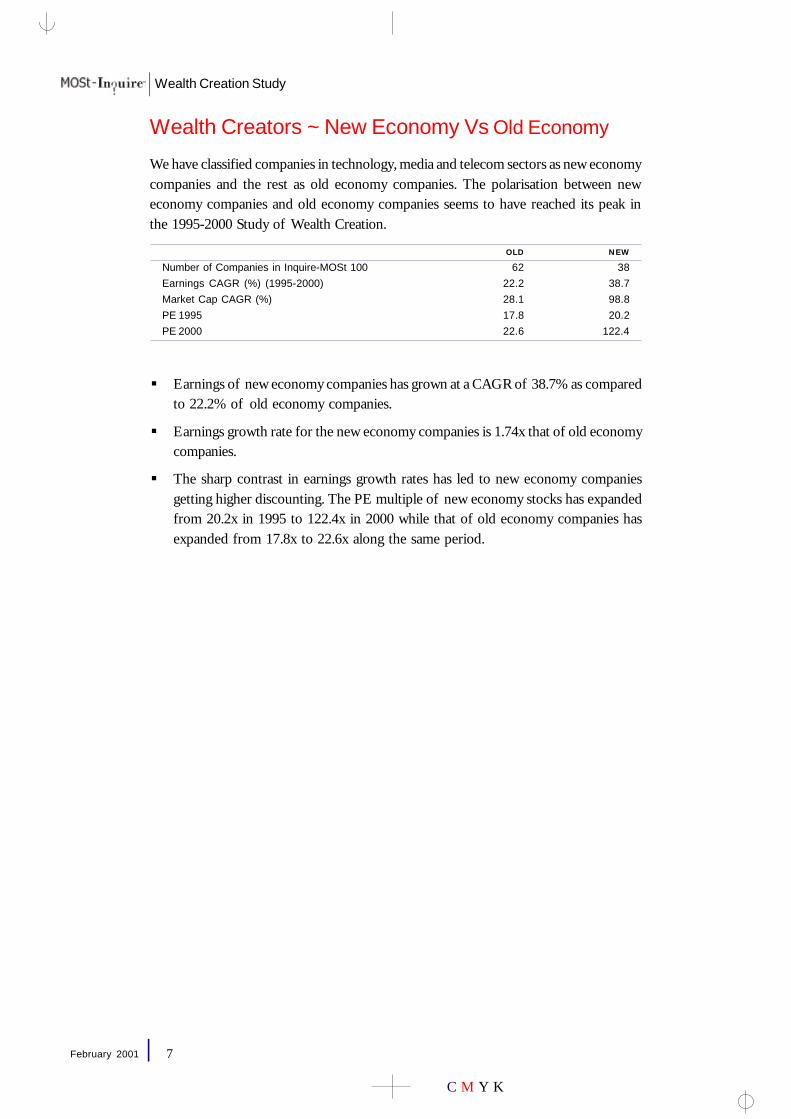
Wealth Creators ~ New Economy Vs Old Economy
OLD NEWNumber of Companies in Inquire-MOSt 100 62 38Earnings CAGR (%) (1995-2000) 22.2 38.7Market Cap CAGR (%) 28.1 98.8PE 1995 17.8 20.2PE 2000 22.6 122.4
§ Earnings of new economy companies has grown at a CAGR of 38.7% as comparedto 22.2% of old economy companies.
§ Earnings growth rate for the new economy companies is 1.74x that of old economycompanies.
§ The sharp contrast in earnings growth rates has led to new economy companiesgetting higher discounting. The PE multiple of new economy stocks has expandedfrom 20.2x in 1995 to 122.4x in 2000 while that of old economy companies hasexpanded from 17.8x to 22.6x along the same period.
We have classified companies in technology, media and telecom sectors as new economycompanies and the rest as old economy companies. The polarisation between neweconomy companies and old economy companies seems to have reached its peak inthe 1995-2000 Study of Wealth Creation.
8
C M Y K
Wealth Creation Study
February 2001
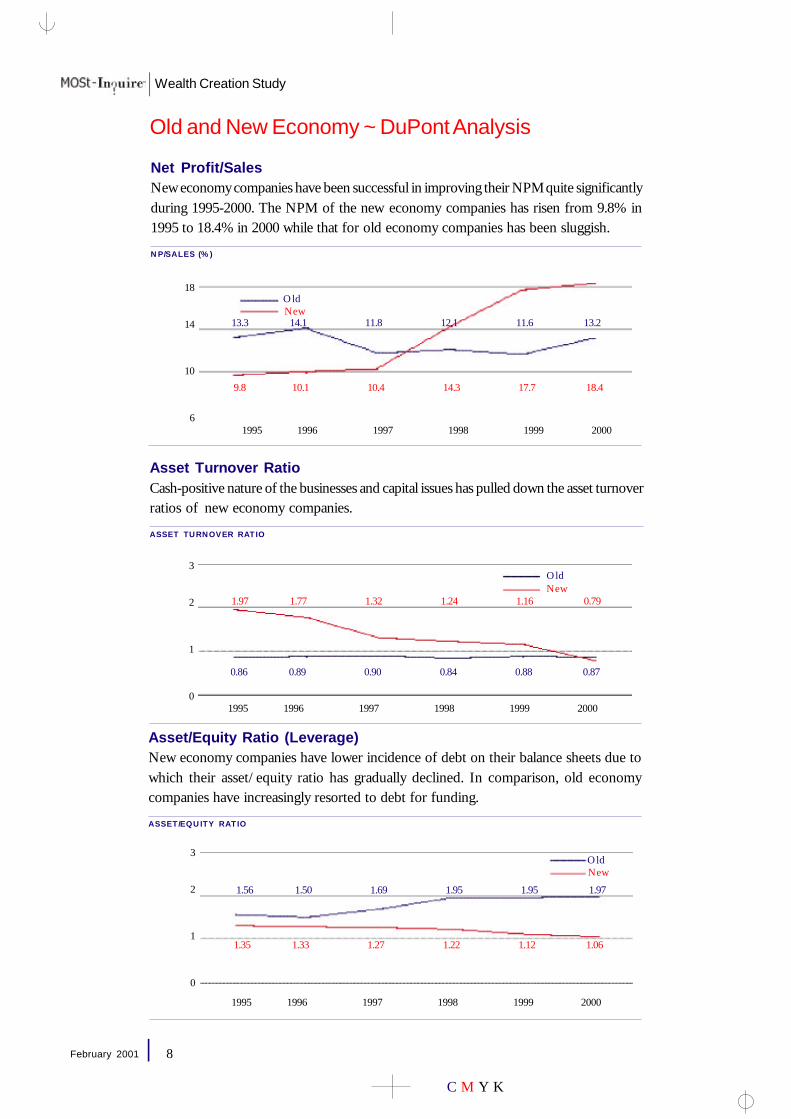
Asset Turnover RatioCash-positive nature of the businesses and capital issues has pulled down the asset turnoverratios of new economy companies.
ASSET TURNOVER RATIO
Old and New Economy ~ DuPont Analysis
Net Profit/SalesNew economy companies have been successful in improving their NPM quite significantlyduring 1995-2000. The NPM of the new economy companies has risen from 9.8% in1995 to 18.4% in 2000 while that for old economy companies has been sluggish.
NP/SALES (%)
Asset/Equity Ratio (Leverage)New economy companies have lower incidence of debt on their balance sheets due towhich their asset/equity ratio has gradually declined. In comparison, old economycompanies have increasingly resorted to debt for funding.
ASSET/EQUITY RATIO
1995 1996 1997 1998 1999 2000
3
2
1
0
OldNew
1.35 1.33 1.27 1.22 1.12 1.06
1.56 1.50 1.69 1.95 1.95 1.97
3
2
1
0
OldNew
1995 1996 1997 1998 1999 2000
0.86 0.89 0.90 0.84 0.88 0.87
1.97 1.77 1.32 1.24 1.16 0.79
18
14
10
6
OldNew
1995 1996 1997 1998 1999 2000
9.8 10.1 10.4 14.3 17.7 18.4
13.3 14.1 11.8 12.1 11.6 13.2
9
C M Y K
Wealth Creation Study
February 2001
Speed of Wealth Creation
PERFORMANCE OF 1991-96 1992-97 1993-98 1994-99 1995-00TOP 10 WEALTH CREATORS
Fastest Wealth Creators 82.8 42.4 62.7 94.4 139.5 (Top 10) 5 year Mcap. CAGR (%)Fastest Wealth Creators 45.0 50.7 72.0 73.6 69.0(Top 10) 5 year Earnings CAGR (%)
Does it mean that we have come to an age of very rapid Wealth Creation process in thestock market? If so, why? We think that there may be some amount of 'bubble' factor,but we are sure that the following things are taking place:
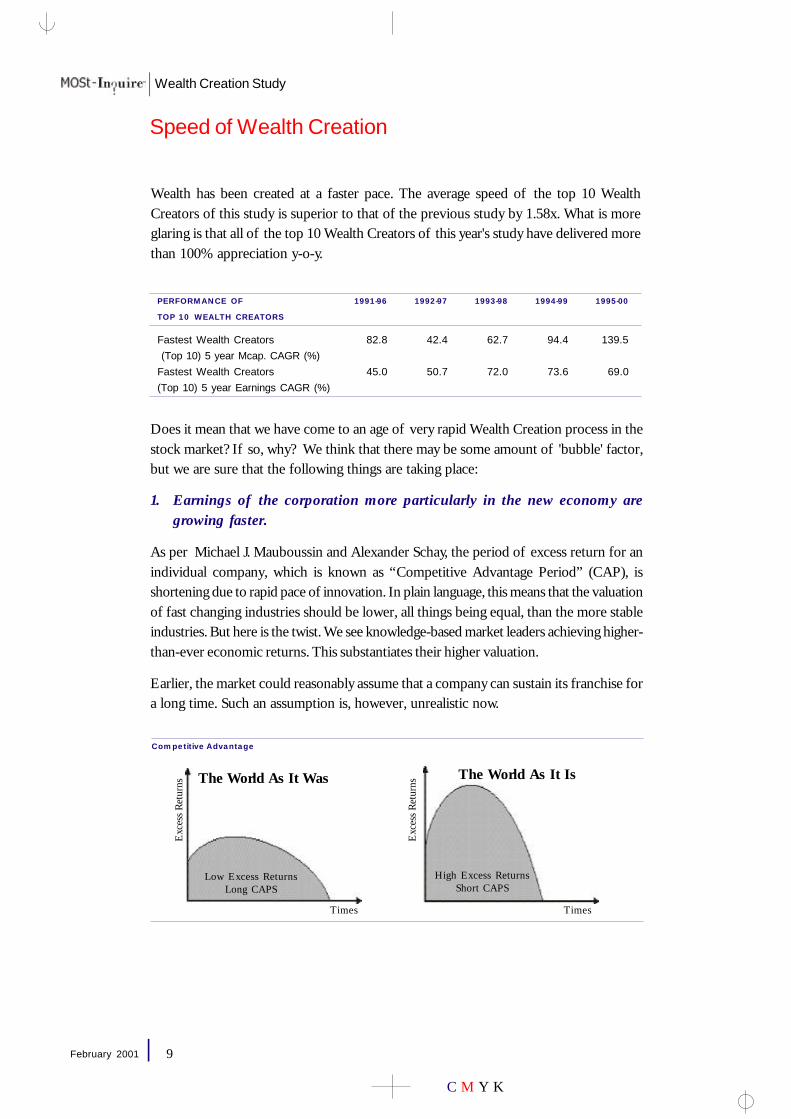
1. Earnings of the corporation more particularly in the new economy aregrowing faster.
As per Michael J. Mauboussin and Alexander Schay, the period of excess return for anindividual company, which is known as “Competitive Advantage Period” (CAP), isshortening due to rapid pace of innovation. In plain language, this means that the valuationof fast changing industries should be lower, all things being equal, than the more stableindustries. But here is the twist. We see knowledge-based market leaders achieving higher-than-ever economic returns. This substantiates their higher valuation.
Earlier, the market could reasonably assume that a company can sustain its franchise fora long time. Such an assumption is, however, unrealistic now.
Wealth has been created at a faster pace. The average speed of the top 10 WealthCreators of this study is superior to that of the previous study by 1.58x. What is moreglaring is that all of the top 10 Wealth Creators of this year's study have delivered morethan 100% appreciation y-o-y.
Low Excess ReturnsLong CAPS
High Excess ReturnsShort CAPS
The World As It Was The World As It Is
Times Times
Exc
ess R
etur
ns
Competitive Advantage
Exc
ess R
etur
ns
10
C M Y K
Wealth Creation Study
February 2001
Speed of Wealth Creation
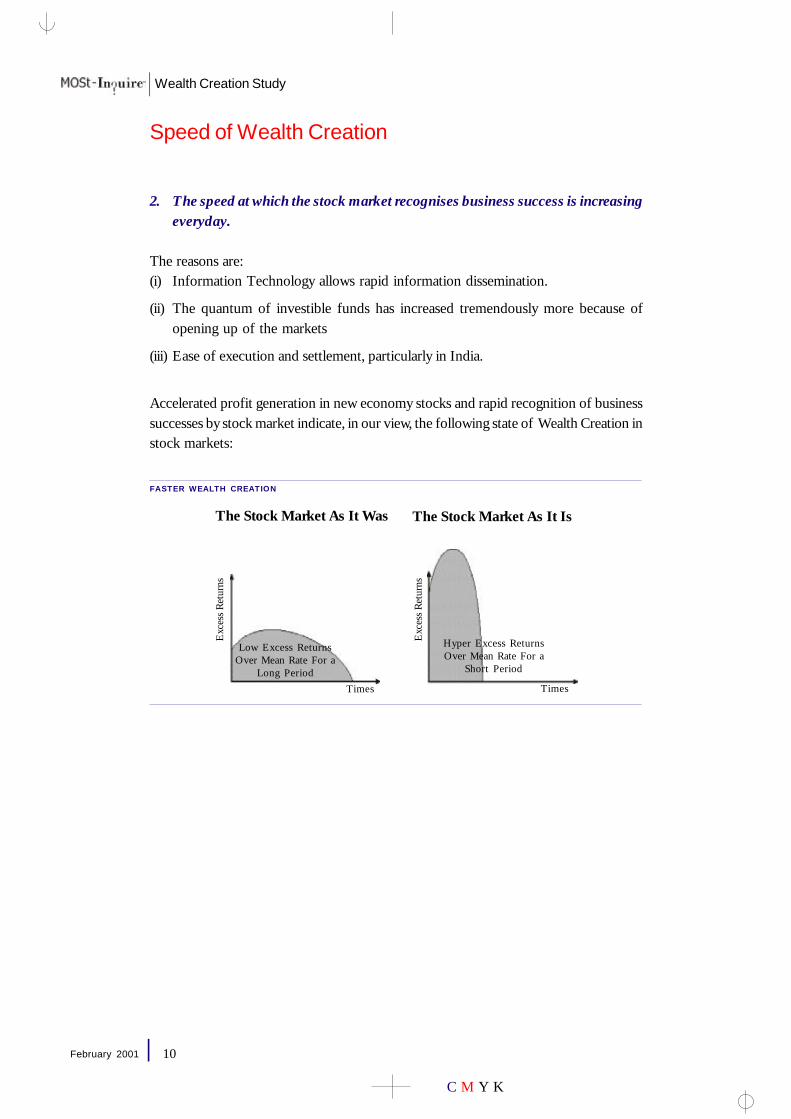
2. The speed at which the stock market recognises business success is increasingeveryday.
The reasons are:(i) Information Technology allows rapid information dissemination.
(ii) The quantum of investible funds has increased tremendously more because ofopening up of the markets
(iii) Ease of execution and settlement, particularly in India.
Accelerated profit generation in new economy stocks and rapid recognition of businesssuccesses by stock market indicate, in our view, the following state of Wealth Creation instock markets:
The Stock Market As It Was
Times
FASTER WEALTH CREATION
The Stock Market As It Is
Times
Low Excess ReturnsOver Mean Rate For a
Long Period
Hyper Excess ReturnsOver Mean Rate For a
Short Period
Exc
ess R
etur
ns
Exc
ess R
etur
ns
11
C M Y K
Wealth Creation Study
February 2001
Keeping the above fundamental trends in mind, we decided to explore the characteristicsof 10 multi-baggers in detail. In our opinion, multi-baggers are those companies whichhave created wealth at a CAGR of 100%+ during the period from 1995 to 2000. Whatare those characteristics?
It has to be a growth story
§ Total wealth created by 100 companies is Rs4,97,734cr.§ About 80% (Rs3,97,120cr) of Wealth Creation is by companies with a CAGR of
25%+ in the period from 1995 to 2000.§ Top 10 companies, which have appreciated by over 100% every year, have achieved
earnings growth ranging from 43% to 180% every year and the only exception isGramophone Company of India.
§ Average rate of profit growth of top 10 companies has been 62.8%(Median: 69%).
Business has to have strong tail-wind
§ Favourable external environment should continue for a long period of time. BasicallyCompetitive Advantage Period (CAP) should continue for a long period.
§ Sales growth of top 10 multi-baggers has been 36.4% during 1995-2000(Median: 44.7%).
Size of the business opportunity has to be very big
§ All the top 10 companies are pertaining to software and media.§ The market size of the software services industry is estimated at upwards of $300b.
It is growing at 10-15% every year. India’s exports are just about $6b and thecompetitive advantage of Indian companies is probably the highest in the world.
§ Media business is also witnessing rapid growth all over the world and the opportunity,though not quantified, is supposed to be very big.
§ These external opportunities are over and above huge domestic potential.
Global market orientation
§ Most of the money has been made by companies that have exported their products.Export revenue Vs domestic revenue of top 10 companies is 61:39.
§ All of the top 24 Wealth Creators belong to the software services sector. Theirexports:domestic ratio is 55:45. This, apparently, is the first prize of globalisationfor India.
Characteristics of Multi-Baggers
12
C M Y K
Wealth Creation Study
February 2001
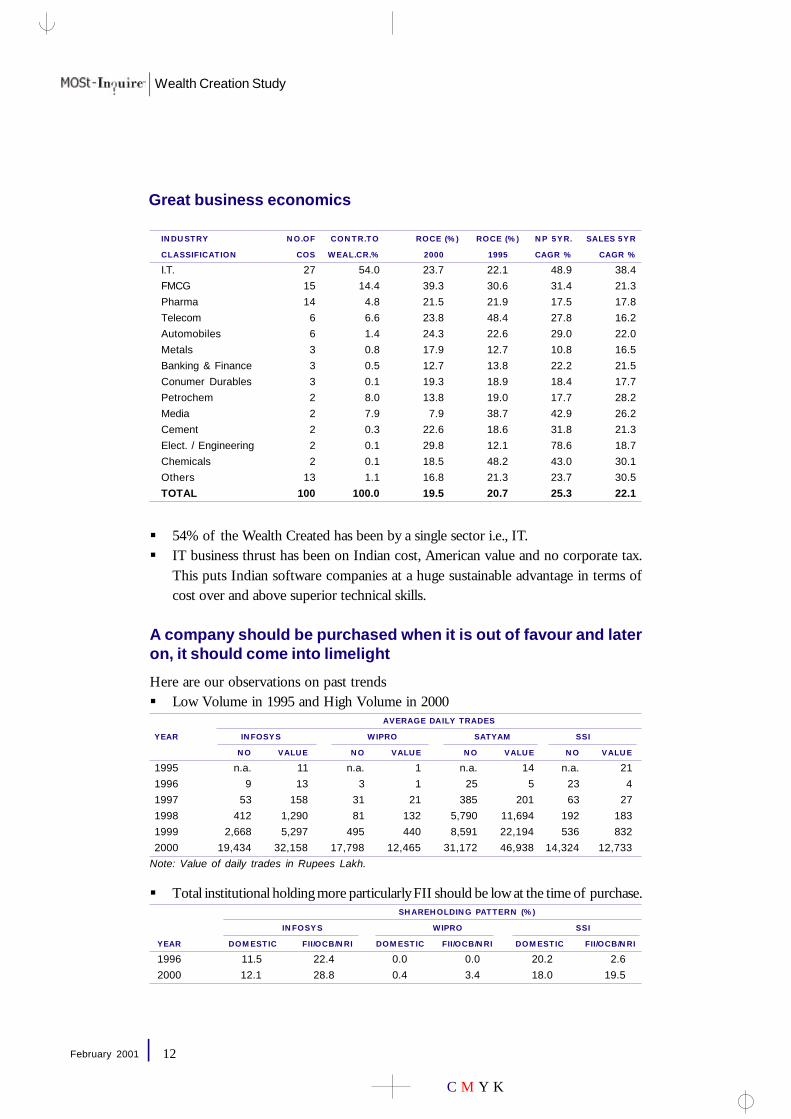
§ 54% of the Wealth Created has been by a single sector i.e., IT.§ IT business thrust has been on Indian cost, American value and no corporate tax.
This puts Indian software companies at a huge sustainable advantage in terms ofcost over and above superior technical skills.
A company should be purchased when it is out of favour and lateron, it should come into limelight
Here are our observations on past trends§ Low Volume in 1995 and High Volume in 2000
AVERAGE DAILY TRADESYEAR INFOSYS WIPRO SATYAM SSI
NO VALUE NO VALUE NO VALUE NO VALUE1995 n.a. 11 n.a. 1 n.a. 14 n.a. 211996 9 13 3 1 25 5 23 41997 53 158 31 21 385 201 63 271998 412 1,290 81 132 5,790 11,694 192 1831999 2,668 5,297 495 440 8,591 22,194 536 8322000 19,434 32,158 17,798 12,465 31,172 46,938 14,324 12,733
Note: Value of daily trades in Rupees Lakh.
§ Total institutional holding more particularly FII should be low at the time of purchase.SHAREHOLDING PATTERN (%)
INFOSYS WIPRO SSIYEAR DOMESTIC FII/OCB/NRI DOMESTIC FII/OCB/NRI DOMESTIC FII/OCB/NRI1996 11.5 22.4 0.0 0.0 20.2 2.62000 12.1 28.8 0.4 3.4 18.0 19.5
Great business economics
INDUSTRY NO.OF CONTR.TO ROCE (%) ROCE (%) NP 5YR. SALES 5YRCLASSIFICATION COS WEAL.CR.% 2000 1995 CAGR % CAGR %I.T. 27 54.0 23.7 22.1 48.9 38.4FMCG 15 14.4 39.3 30.6 31.4 21.3Pharma 14 4.8 21.5 21.9 17.5 17.8Telecom 6 6.6 23.8 48.4 27.8 16.2Automobiles 6 1.4 24.3 22.6 29.0 22.0Metals 3 0.8 17.9 12.7 10.8 16.5Banking & Finance 3 0.5 12.7 13.8 22.2 21.5Conumer Durables 3 0.1 19.3 18.9 18.4 17.7Petrochem 2 8.0 13.8 19.0 17.7 28.2Media 2 7.9 7.9 38.7 42.9 26.2Cement 2 0.3 22.6 18.6 31.8 21.3Elect. / Engineering 2 0.1 29.8 12.1 78.6 18.7Chemicals 2 0.1 18.5 48.2 43.0 30.1Others 13 1.1 16.8 21.3 23.7 30.5TOTAL 100 100.0 19.5 20.7 25.3 22.1

13
C M Y K
Wealth Creation Study
February 2001
Value of the company at the time of purchase should be relativelysmaller than the size of the opportunity
§ If the return on the stock has to be anywhere near 100% every year, the base valuehas to be modest. Otherwise it will become a mathematical impossibility for astock cannot keep growing at such a pace for a long time.
Company M.Cap as % of M.Cap as % of % of WealthName Total Mcap.00 Total Mcap.95 Created
SSI 0.7 0.0 1.0Wipro 15.7 0.2 25.1Infosys Technologies 7.3 0.1 11.7Satyam Computer Services 3.1 0.0 5.0Information Technologies 2.2 0.0 3.5PSI Data Systems 0.1 0.0 0.2Cyberspace Infosys 0.1 0.0 0.1Gramophone Company of India 0.2 0.0 0.2Trigyn Technologies 0.2 0.0 0.3Zee Telefilms 5.2 0.1 7.7
Top 10 as a % of Total M.Cap. 34.7 0.5 54.7
§ Most multi-baggers were priced between Rs10cr and Rs1,146cr with a mean valueof Rs233cr.
§ In the globalised scenario, big companies upto Rs1,000cr can also aspire to bemulti-baggers.
§ Focus should be on 'price of companies' rather than on 'price of shares'.
UNADJUSTED PRICES (RS) % UNADJUSTED MARKET CAP. (RS CR) %31/03/00 31/03/99 VAR. 31/03/00 31/03/99 VAR.
Wipro 5,493 4,023 36.5 1,25,876 18,439 582.7Zee Telefilms 1,022 987 3.6 41,749 1,842 2,166.2
Outstanding management
§ Depth of management is necessary to sustain the competitive edge.§ Management should have a long-range profit outlook.§ It has to have unquestionable integrity to get better visibility of earnings and
better valuation.§ It is the quality of management that decides the success or failure of a business
opportunity.§ The valuations accorded to Wipro and Infosys are clear cases in point.
14
C M Y K
Wealth Creation Study
February 2001
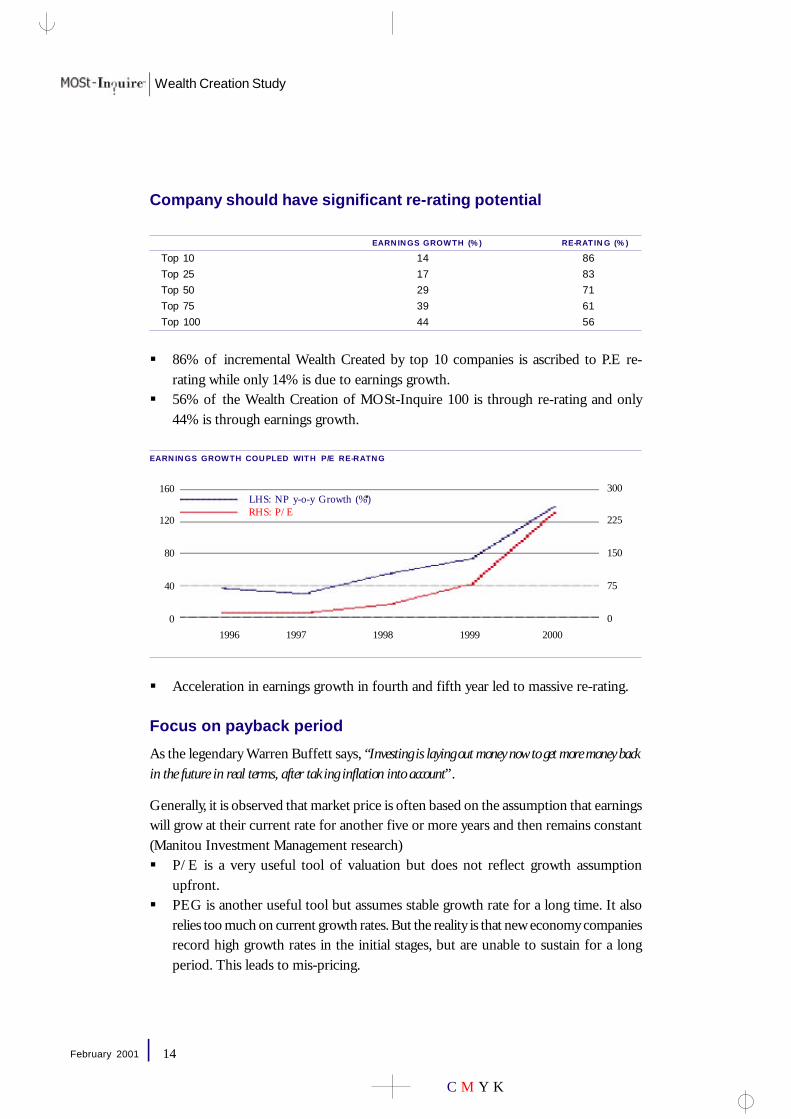
Company should have significant re-rating potential
EARNINGS GROWTH (%) RE-RATING (%)Top 10 14 86Top 25 17 83Top 50 29 71Top 75 39 61Top 100 44 56
§ 86% of incremental Wealth Created by top 10 companies is ascribed to P.E re-rating while only 14% is due to earnings growth.
§ 56% of the Wealth Creation of MOSt-Inquire 100 is through re-rating and only44% is through earnings growth.
EARNINGS GROWTH COUPLED WITH P/E RE-RATNG
§ Acceleration in earnings growth in fourth and fifth year led to massive re-rating.
Focus on payback period
As the legendary Warren Buffett says, “Investing is laying out money now to get more money backin the future in real terms, after taking inflation into account”.
Generally, it is observed that market price is often based on the assumption that earningswill grow at their current rate for another five or more years and then remains constant(Manitou Investment Management research)§ P/E is a very useful tool of valuation but does not reflect growth assumption
upfront.§ PEG is another useful tool but assumes stable growth rate for a long time. It also
relies too much on current growth rates. But the reality is that new economy companiesrecord high growth rates in the initial stages, but are unable to sustain for a longperiod. This leads to mis-pricing.
1996 1997 1998 1999 2000
RHS: P/ELHS: NP y-o-y Growth (%)
300
225
150
75
0
160
120
80
40
0

15
C M Y K
Wealth Creation Study
February 2001
Keeping the above shortcomings and market wisdom in mind, we decided to examinethe concept of “pay-back ratio” or “purchase price recovery in five years”. We definedpayback ratio as the result of market capitalisation in the year 1995 divided by the sumof profits for the years from 1996 to 2000. Here are our findings:
PAYBACK RATIO NO OF RATE OF RETURN (%) MULTI-BAGGERS*COS MEAN HIGHEST LOWEST
<=1 21 73.1 194.6 12.7 61 >=2 31 37.4 144.2 9.7 12>=3 16 36.9 194.1 11.6 2>3 28 34.7 134.8 9.3 1Others 4 - - - 0All Companies 100 43.9 194.6 9.3 10Note: * = Rate of return greater than or equal to 100% compounded annually in 1995-2000
§ Maximum number of multi-baggers— 6 out of 10— were found amongst the 21companies, which had a pay-back period of less than 1. SSI had the distinction ofoffering the lowest pay-back period of 0.2 and the highest appreciation rate of194.6% compounded for five years, giving an astounding 221.7 times appreciationto its shareholders, who purchased the shares on April 1, 1995.
§ Wipro not only created wealth at the pace of 194.1%, which is just a notch belowSSI, but also created Rs1,24,710, which is almost 25% of all the wealth created byall the companies during the period 1995-2000.
§ The mean rate of returns for these 21 companies is 73.1%.§ Companies with less than one time pay-back and the market cap of Rs100cr in the
year 2000 have created wealth at 43.9%.
Hence, for finding a multi-bagger, we must examine the likely payback ratio ofthe purchase price.
How will one find companies, that have pay-back ratio of less thanone?
§ If one focusses on a few good companies and the characteristics of their businessesand managements, it is not difficult to approximate their cash flow for the nextfive years.
§ Phil Fisher says, “inspite of many spectacular investment opportunities that existed 25-50 yearsago, there will probably be even more such opportunities available today.”
Getting to the next opportunity of finding the multi-baggers, or finding the successfullong-term growth stock, is dependent on a foundation of what Warren Buffett says ...
“Never count on making a good sale. Have the purchase price be soattractive, that even a mediocre sale gives good results".
16
C M Y K
Wealth Creation Study
February 2001
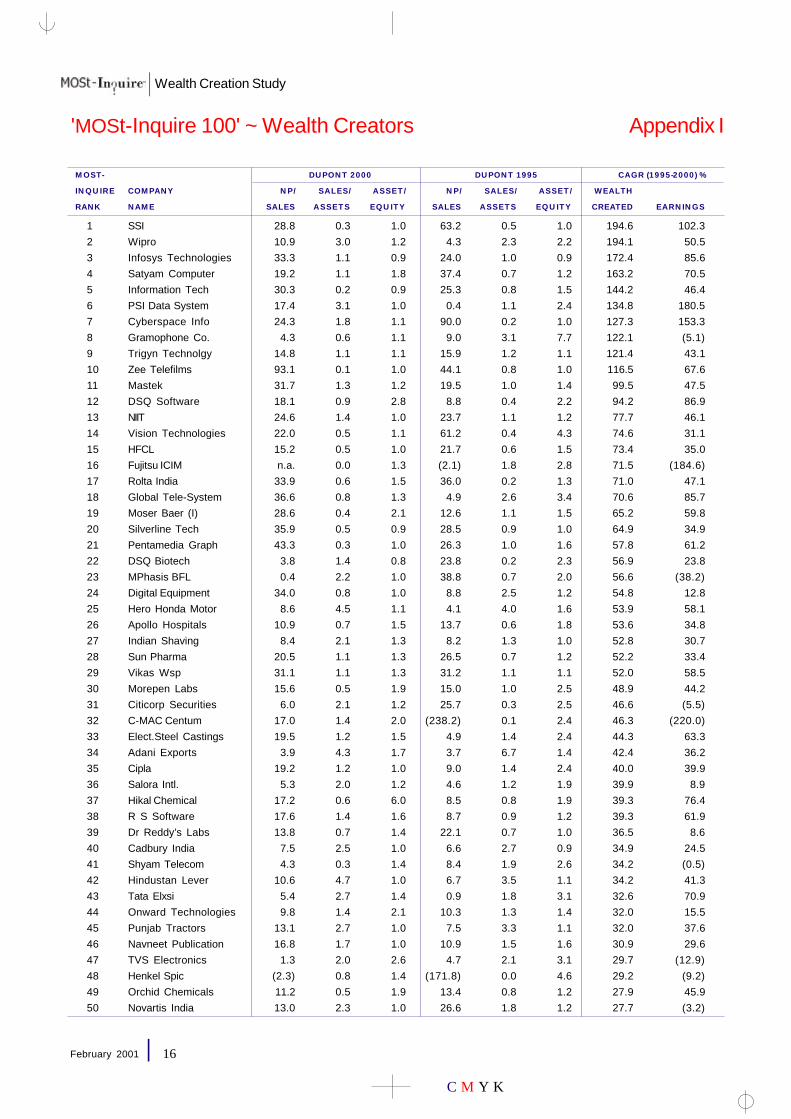
Appendix I'MOSt-Inquire 100' ~ Wealth Creators
MOST- DUPONT 2000 DUPONT 1995 CAGR (1995-2000) %INQUIRE COMPANY NP/ SALES/ ASSET/ NP/ SALES/ ASSET/ WEALTHRANK NAME SALES ASSETS EQUITY SALES ASSETS EQUITY CREATED EARNINGS
1 SSI 28.8 0.3 1.0 63.2 0.5 1.0 194.6 102.32 Wipro 10.9 3.0 1.2 4.3 2.3 2.2 194.1 50.53 Infosys Technologies 33.3 1.1 0.9 24.0 1.0 0.9 172.4 85.64 Satyam Computer 19.2 1.1 1.8 37.4 0.7 1.2 163.2 70.55 Information Tech 30.3 0.2 0.9 25.3 0.8 1.5 144.2 46.46 PSI Data System 17.4 3.1 1.0 0.4 1.1 2.4 134.8 180.57 Cyberspace Info 24.3 1.8 1.1 90.0 0.2 1.0 127.3 153.38 Gramophone Co. 4.3 0.6 1.1 9.0 3.1 7.7 122.1 (5.1)9 Trigyn Technolgy 14.8 1.1 1.1 15.9 1.2 1.1 121.4 43.110 Zee Telefilms 93.1 0.1 1.0 44.1 0.8 1.0 116.5 67.611 Mastek 31.7 1.3 1.2 19.5 1.0 1.4 99.5 47.512 DSQ Software 18.1 0.9 2.8 8.8 0.4 2.2 94.2 86.913 NIIT 24.6 1.4 1.0 23.7 1.1 1.2 77.7 46.114 Vision Technologies 22.0 0.5 1.1 61.2 0.4 4.3 74.6 31.115 HFCL 15.2 0.5 1.0 21.7 0.6 1.5 73.4 35.016 Fujitsu ICIM n.a. 0.0 1.3 (2.1) 1.8 2.8 71.5 (184.6)17 Rolta India 33.9 0.6 1.5 36.0 0.2 1.3 71.0 47.118 Global Tele-System 36.6 0.8 1.3 4.9 2.6 3.4 70.6 85.719 Moser Baer (I) 28.6 0.4 2.1 12.6 1.1 1.5 65.2 59.820 Silverline Tech 35.9 0.5 0.9 28.5 0.9 1.0 64.9 34.921 Pentamedia Graph 43.3 0.3 1.0 26.3 1.0 1.6 57.8 61.222 DSQ Biotech 3.8 1.4 0.8 23.8 0.2 2.3 56.9 23.823 MPhasis BFL 0.4 2.2 1.0 38.8 0.7 2.0 56.6 (38.2)24 Digital Equipment 34.0 0.8 1.0 8.8 2.5 1.2 54.8 12.825 Hero Honda Motor 8.6 4.5 1.1 4.1 4.0 1.6 53.9 58.126 Apollo Hospitals 10.9 0.7 1.5 13.7 0.6 1.8 53.6 34.827 Indian Shaving 8.4 2.1 1.3 8.2 1.3 1.0 52.8 30.728 Sun Pharma 20.5 1.1 1.3 26.5 0.7 1.2 52.2 33.429 Vikas Wsp 31.1 1.1 1.3 31.2 1.1 1.1 52.0 58.530 Morepen Labs 15.6 0.5 1.9 15.0 1.0 2.5 48.9 44.231 Citicorp Securities 6.0 2.1 1.2 25.7 0.3 2.5 46.6 (5.5)32 C-MAC Centum 17.0 1.4 2.0 (238.2) 0.1 2.4 46.3 (220.0)33 Elect.Steel Castings 19.5 1.2 1.5 4.9 1.4 2.4 44.3 63.334 Adani Exports 3.9 4.3 1.7 3.7 6.7 1.4 42.4 36.235 Cipla 19.2 1.2 1.0 9.0 1.4 2.4 40.0 39.936 Salora Intl. 5.3 2.0 1.2 4.6 1.2 1.9 39.9 8.937 Hikal Chemical 17.2 0.6 6.0 8.5 0.8 1.9 39.3 76.438 R S Software 17.6 1.4 1.6 8.7 0.9 1.2 39.3 61.939 Dr Reddy’s Labs 13.8 0.7 1.4 22.1 0.7 1.0 36.5 8.640 Cadbury India 7.5 2.5 1.0 6.6 2.7 0.9 34.9 24.541 Shyam Telecom 4.3 0.3 1.4 8.4 1.9 2.6 34.2 (0.5)42 Hindustan Lever 10.6 4.7 1.0 6.7 3.5 1.1 34.2 41.343 Tata Elxsi 5.4 2.7 1.4 0.9 1.8 3.1 32.6 70.944 Onward Technologies 9.8 1.4 2.1 10.3 1.3 1.4 32.0 15.545 Punjab Tractors 13.1 2.7 1.0 7.5 3.3 1.1 32.0 37.646 Navneet Publication 16.8 1.7 1.0 10.9 1.5 1.6 30.9 29.647 TVS Electronics 1.3 2.0 2.6 4.7 2.1 3.1 29.7 (12.9)48 Henkel Spic (2.3) 0.8 1.4 (171.8) 0.0 4.6 29.2 (9.2)49 Orchid Chemicals 11.2 0.5 1.9 13.4 0.8 1.2 27.9 45.950 Novartis India 13.0 2.3 1.0 26.6 1.8 1.2 27.7 (3.2)

17
C M Y K
Wealth Creation Study
February 2001
Appendix I'MOSt-Inquire 100' ~ Wealth Creators (Contd.)
MOST- DUPONT 2000 DUPONT 1995 CAGR (1995-2000) %INQUIRE COMPANY NP/ SALES/ ASSET/ NP/ SALES/ ASSET/ WEALTHRANK NAME SALES ASSETS EQUITY SALES ASSETS EQUITY CREATED EARNINGS
51 Britannia Industries 4.5 3.9 1.6 3.7 3.8 1.6 26.7 22.652 Swaraj Engines 13.6 2.8 1.2 10.9 3.1 1.4 26.6 35.353 Pidilite Industries 12.3 1.4 1.6 6.6 1.2 2.5 25.8 30.754 Vakrangee Soft. 45.0 0.9 1.1 48.1 0.1 0.9 25.7 134.955 HCL Infosystems 6.9 2.8 1.4 7.0 2.9 1.4 25.5 12.456 Crisil 38.0 0.7 0.8 44.6 0.8 0.7 25.2 18.157 United Breweries 4.1 0.4 3.9 9.6 0.7 1.8 25.0 (9.5)58 Dabur India 7.8 1.7 1.9 6.2 1.4 2.1 23.1 26.659 McDowell & Co 3.3 2.0 1.4 2.9 1.3 1.7 22.4 13.760 Krone Communication 13.2 2.1 1.2 14.7 1.3 1.3 22.3 19.361 Guj.Gas Company 15.8 1.1 2.3 21.3 1.2 1.7 21.9 19.762 Rhone-Poulenc 16.0 2.1 1.1 1.8 1.0 5.8 21.6 78.363 Nirma 16.1 0.9 2.0 12.4 2.1 1.1 21.2 41.364 Pfizer 10.5 2.8 1.0 3.9 2.1 2.0 21.0 30.865 Videsh Sanchar 12.1 1.2 0.9 8.4 3.7 1.0 21.0 23.066 ITC 20.6 1.2 1.2 11.0 1.5 2.1 20.9 24.867 Reliance Petroleum n.a. 0.0 0.7 n.a. 0.0 0.1 20.8 n.a.68 Sundaram Clayton 9.8 1.3 1.2 9.7 1.3 1.2 20.7 13.369 Sandesh 11.5 1.2 1.2 9.5 1.0 1.8 20.3 19.670 Reliance Industries 17.9 0.5 2.3 27.5 0.5 1.0 19.2 17.771 Birla 3M 0.7 2.1 1.6 5.1 1.3 1.2 19.1 (12.8)72 Jagsonpal Pharma 9.2 1.6 1.9 6.4 1.8 3.7 18.4 32.073 Sri Vishnu Cement (6.2) 1.6 7.6 5.1 1.3 (4.8) 17.9 (207.0)74 German Remedies 16.5 1.7 1.0 9.5 1.8 1.5 17.8 27.875 Ranbaxy Labs 12.8 0.9 1.2 16.5 0.6 1.6 17.4 12.376 Natl.Aluminium 25.7 0.7 0.9 22.6 0.4 1.8 17.3 11.377 Monsanto Chemicals 11.6 2.3 1.0 9.1 6.0 1.0 16.9 25.378 Tata Honeywell 7.4 2.5 1.8 2.8 1.9 3.6 15.9 40.979 Hind.Inks 13.0 1.0 1.6 19.6 0.9 3.2 15.4 26.680 Glaxo (India) 8.7 2.4 1.0 3.3 2.6 1.3 15.4 32.381 Kodak India 4.5 2.4 1.1 11.4 4.0 1.3 15.2 3.382 Blue Dart Express 6.0 1.3 1.7 9.8 1.7 1.0 14.1 7.783 Essel Packaging 17.7 0.8 1.2 24.3 0.5 1.9 14.1 19.584 Sterlite Industries 5.1 0.7 2.3 18.6 0.7 1.2 14.0 (1.8)85 HDFC 20.0 0.1 7.2 18.8 0.1 6.1 13.8 22.486 Burr Brown India 2.4 3.7 0.7 95.9 0.2 0.7 13.6 1.387 Mahindra & Mahindra 7.5 1.3 1.4 6.9 1.6 1.5 13.5 17.688 Berger Paints 5.4 2.2 1.6 3.9 2.7 2.0 13.5 28.189 Smith.B.Consumer 16.0 2.4 0.8 11.2 2.7 1.2 12.8 29.190 P & G Hygiene 17.8 2.2 1.0 5.8 1.8 1.1 12.7 39.991 Exide Industries 6.4 1.0 2.8 4.5 1.2 2.6 12.7 37.092 Tata Infomedia 10.6 1.0 1.0 11.9 1.0 1.1 12.6 17.993 Smith.B.Pharma 8.3 1.9 1.0 9.0 2.4 1.0 12.2 10.494 MIRC Electronics 6.3 1.9 2.0 7.2 1.9 1.6 11.9 17.195 Atcom Technologies 12.0 1.0 1.5 22.8 0.8 1.5 11.6 13.496 Tata Telecom (3.1) 1.4 2.8 8.0 1.0 1.4 10.1 (199.0)97 Guj. Ambuja Cement 38.3 0.4 1.8 27.2 0.5 1.6 10.0 33.698 Usha Beltron 6.1 0.6 2.6 19.5 0.7 1.2 9.7 9.499 Nicholas Piramal 10.8 0.9 1.3 19.9 0.5 1.4 9.3 11.8
100 Nestle India 6.7 3.7 1.4 6.0 2.7 1.1 9.3 19.5
18
C M Y K
Wealth Creation Study
February 2001
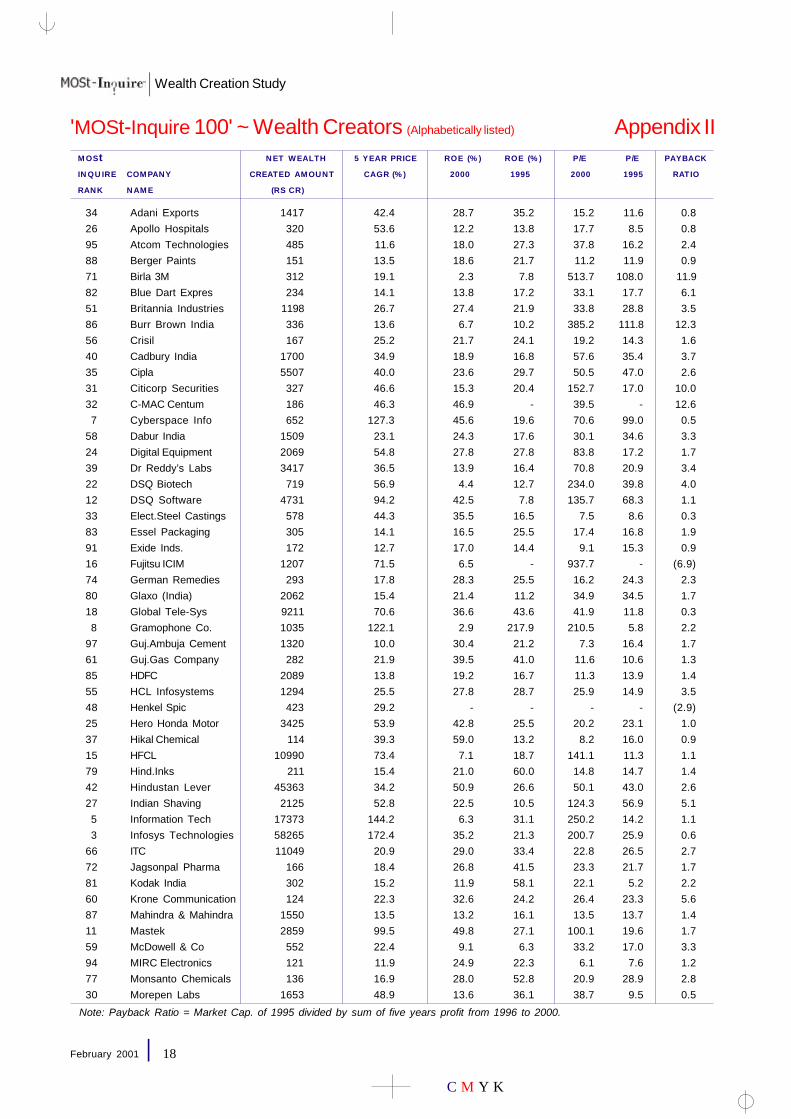
Appendix II'MOSt-Inquire 100' ~ Wealth Creators (Alphabetically listed)
MOSt NET WEALTH 5 YEAR PRICE ROE (%) ROE (%) P/E P/E PAYBACKINQUIRE COMPANY CREATED AMOUNT CAGR (%) 2000 1995 2000 1995 RATIORANK NAME (RS CR)
34 Adani Exports 1417 42.4 28.7 35.2 15.2 11.6 0.826 Apollo Hospitals 320 53.6 12.2 13.8 17.7 8.5 0.895 Atcom Technologies 485 11.6 18.0 27.3 37.8 16.2 2.488 Berger Paints 151 13.5 18.6 21.7 11.2 11.9 0.971 Birla 3M 312 19.1 2.3 7.8 513.7 108.0 11.982 Blue Dart Expres 234 14.1 13.8 17.2 33.1 17.7 6.151 Britannia Industries 1198 26.7 27.4 21.9 33.8 28.8 3.586 Burr Brown India 336 13.6 6.7 10.2 385.2 111.8 12.356 Crisil 167 25.2 21.7 24.1 19.2 14.3 1.640 Cadbury India 1700 34.9 18.9 16.8 57.6 35.4 3.735 Cipla 5507 40.0 23.6 29.7 50.5 47.0 2.631 Citicorp Securities 327 46.6 15.3 20.4 152.7 17.0 10.032 C-MAC Centum 186 46.3 46.9 - 39.5 - 12.67 Cyberspace Info 652 127.3 45.6 19.6 70.6 99.0 0.5
58 Dabur India 1509 23.1 24.3 17.6 30.1 34.6 3.324 Digital Equipment 2069 54.8 27.8 27.8 83.8 17.2 1.739 Dr Reddy’s Labs 3417 36.5 13.9 16.4 70.8 20.9 3.422 DSQ Biotech 719 56.9 4.4 12.7 234.0 39.8 4.012 DSQ Software 4731 94.2 42.5 7.8 135.7 68.3 1.133 Elect.Steel Castings 578 44.3 35.5 16.5 7.5 8.6 0.383 Essel Packaging 305 14.1 16.5 25.5 17.4 16.8 1.991 Exide Inds. 172 12.7 17.0 14.4 9.1 15.3 0.916 Fujitsu ICIM 1207 71.5 6.5 - 937.7 - (6.9)74 German Remedies 293 17.8 28.3 25.5 16.2 24.3 2.380 Glaxo (India) 2062 15.4 21.4 11.2 34.9 34.5 1.718 Global Tele-Sys 9211 70.6 36.6 43.6 41.9 11.8 0.38 Gramophone Co. 1035 122.1 2.9 217.9 210.5 5.8 2.2
97 Guj.Ambuja Cement 1320 10.0 30.4 21.2 7.3 16.4 1.761 Guj.Gas Company 282 21.9 39.5 41.0 11.6 10.6 1.385 HDFC 2089 13.8 19.2 16.7 11.3 13.9 1.455 HCL Infosystems 1294 25.5 27.8 28.7 25.9 14.9 3.548 Henkel Spic 423 29.2 - - - - (2.9)25 Hero Honda Motor 3425 53.9 42.8 25.5 20.2 23.1 1.037 Hikal Chemical 114 39.3 59.0 13.2 8.2 16.0 0.915 HFCL 10990 73.4 7.1 18.7 141.1 11.3 1.179 Hind.Inks 211 15.4 21.0 60.0 14.8 14.7 1.442 Hindustan Lever 45363 34.2 50.9 26.6 50.1 43.0 2.627 Indian Shaving 2125 52.8 22.5 10.5 124.3 56.9 5.15 Information Tech 17373 144.2 6.3 31.1 250.2 14.2 1.13 Infosys Technologies 58265 172.4 35.2 21.3 200.7 25.9 0.6
66 ITC 11049 20.9 29.0 33.4 22.8 26.5 2.772 Jagsonpal Pharma 166 18.4 26.8 41.5 23.3 21.7 1.781 Kodak India 302 15.2 11.9 58.1 22.1 5.2 2.260 Krone Communication 124 22.3 32.6 24.2 26.4 23.3 5.687 Mahindra & Mahindra 1550 13.5 13.2 16.1 13.5 13.7 1.411 Mastek 2859 99.5 49.8 27.1 100.1 19.6 1.759 McDowell & Co 552 22.4 9.1 6.3 33.2 17.0 3.394 MIRC Electronics 121 11.9 24.9 22.3 6.1 7.6 1.277 Monsanto Chemicals 136 16.9 28.0 52.8 20.9 28.9 2.830 Morepen Labs 1653 48.9 13.6 36.1 38.7 9.5 0.5
Note: Payback Ratio = Market Cap. of 1995 divided by sum of five years profit from 1996 to 2000.
19
C M Y K
Wealth Creation Study
February 2001
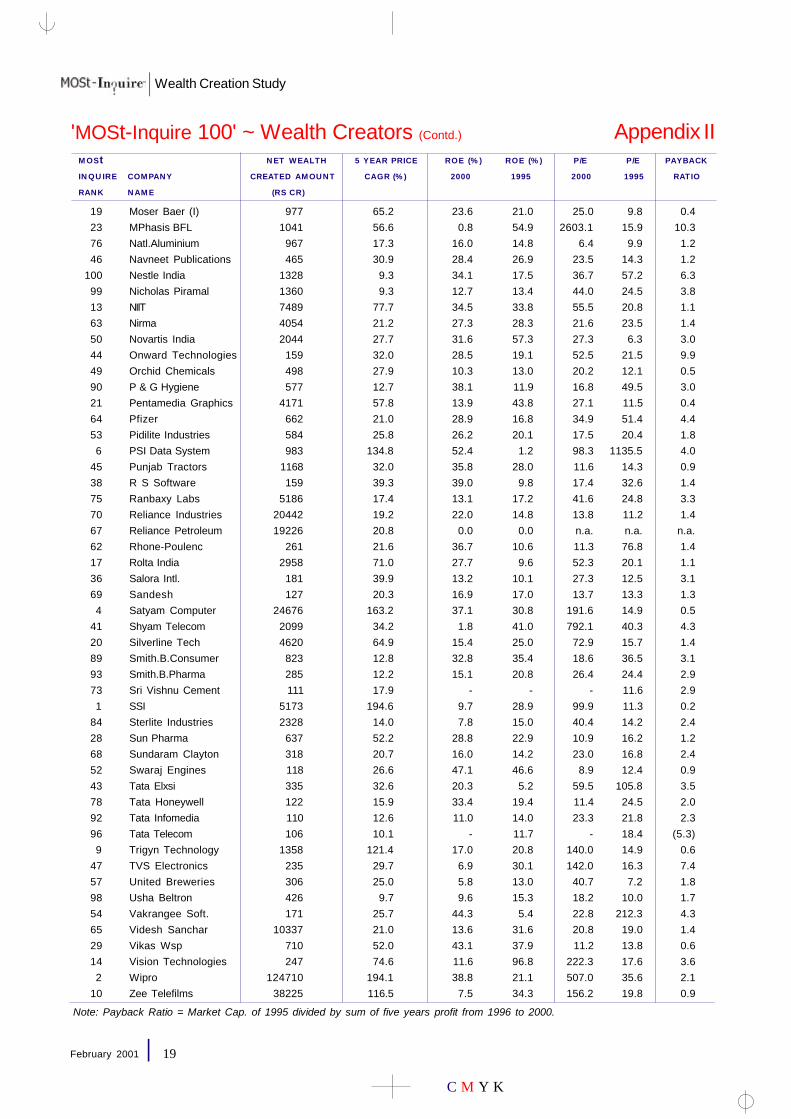
Appendix II'MOSt-Inquire 100' ~ Wealth Creators (Contd.)
MOSt NET WEALTH 5 YEAR PRICE ROE (%) ROE (%) P/E P/E PAYBACKINQUIRE COMPANY CREATED AMOUNT CAGR (%) 2000 1995 2000 1995 RATIORANK NAME (RS CR)
19 Moser Baer (I) 977 65.2 23.6 21.0 25.0 9.8 0.423 MPhasis BFL 1041 56.6 0.8 54.9 2603.1 15.9 10.376 Natl.Aluminium 967 17.3 16.0 14.8 6.4 9.9 1.246 Navneet Publications 465 30.9 28.4 26.9 23.5 14.3 1.2
100 Nestle India 1328 9.3 34.1 17.5 36.7 57.2 6.399 Nicholas Piramal 1360 9.3 12.7 13.4 44.0 24.5 3.813 NIIT 7489 77.7 34.5 33.8 55.5 20.8 1.163 Nirma 4054 21.2 27.3 28.3 21.6 23.5 1.450 Novartis India 2044 27.7 31.6 57.3 27.3 6.3 3.044 Onward Technologies 159 32.0 28.5 19.1 52.5 21.5 9.949 Orchid Chemicals 498 27.9 10.3 13.0 20.2 12.1 0.590 P & G Hygiene 577 12.7 38.1 11.9 16.8 49.5 3.021 Pentamedia Graphics 4171 57.8 13.9 43.8 27.1 11.5 0.464 Pfizer 662 21.0 28.9 16.8 34.9 51.4 4.453 Pidilite Industries 584 25.8 26.2 20.1 17.5 20.4 1.86 PSI Data System 983 134.8 52.4 1.2 98.3 1135.5 4.0
45 Punjab Tractors 1168 32.0 35.8 28.0 11.6 14.3 0.938 R S Software 159 39.3 39.0 9.8 17.4 32.6 1.475 Ranbaxy Labs 5186 17.4 13.1 17.2 41.6 24.8 3.370 Reliance Industries 20442 19.2 22.0 14.8 13.8 11.2 1.467 Reliance Petroleum 19226 20.8 0.0 0.0 n.a. n.a. n.a.62 Rhone-Poulenc 261 21.6 36.7 10.6 11.3 76.8 1.417 Rolta India 2958 71.0 27.7 9.6 52.3 20.1 1.136 Salora Intl. 181 39.9 13.2 10.1 27.3 12.5 3.169 Sandesh 127 20.3 16.9 17.0 13.7 13.3 1.34 Satyam Computer 24676 163.2 37.1 30.8 191.6 14.9 0.5
41 Shyam Telecom 2099 34.2 1.8 41.0 792.1 40.3 4.320 Silverline Tech 4620 64.9 15.4 25.0 72.9 15.7 1.489 Smith.B.Consumer 823 12.8 32.8 35.4 18.6 36.5 3.193 Smith.B.Pharma 285 12.2 15.1 20.8 26.4 24.4 2.973 Sri Vishnu Cement 111 17.9 - - - 11.6 2.91 SSI 5173 194.6 9.7 28.9 99.9 11.3 0.2
84 Sterlite Industries 2328 14.0 7.8 15.0 40.4 14.2 2.428 Sun Pharma 637 52.2 28.8 22.9 10.9 16.2 1.268 Sundaram Clayton 318 20.7 16.0 14.2 23.0 16.8 2.452 Swaraj Engines 118 26.6 47.1 46.6 8.9 12.4 0.943 Tata Elxsi 335 32.6 20.3 5.2 59.5 105.8 3.578 Tata Honeywell 122 15.9 33.4 19.4 11.4 24.5 2.092 Tata Infomedia 110 12.6 11.0 14.0 23.3 21.8 2.396 Tata Telecom 106 10.1 - 11.7 - 18.4 (5.3)9 Trigyn Technology 1358 121.4 17.0 20.8 140.0 14.9 0.6
47 TVS Electronics 235 29.7 6.9 30.1 142.0 16.3 7.457 United Breweries 306 25.0 5.8 13.0 40.7 7.2 1.898 Usha Beltron 426 9.7 9.6 15.3 18.2 10.0 1.754 Vakrangee Soft. 171 25.7 44.3 5.4 22.8 212.3 4.365 Videsh Sanchar 10337 21.0 13.6 31.6 20.8 19.0 1.429 Vikas Wsp 710 52.0 43.1 37.9 11.2 13.8 0.614 Vision Technologies 247 74.6 11.6 96.8 222.3 17.6 3.62 Wipro 124710 194.1 38.8 21.1 507.0 35.6 2.1
10 Zee Telefilms 38225 116.5 7.5 34.3 156.2 19.8 0.9
Note: Payback Ratio = Market Cap. of 1995 divided by sum of five years profit from 1996 to 2000.
20
C M Y K
Wealth Creation Study
February 2001
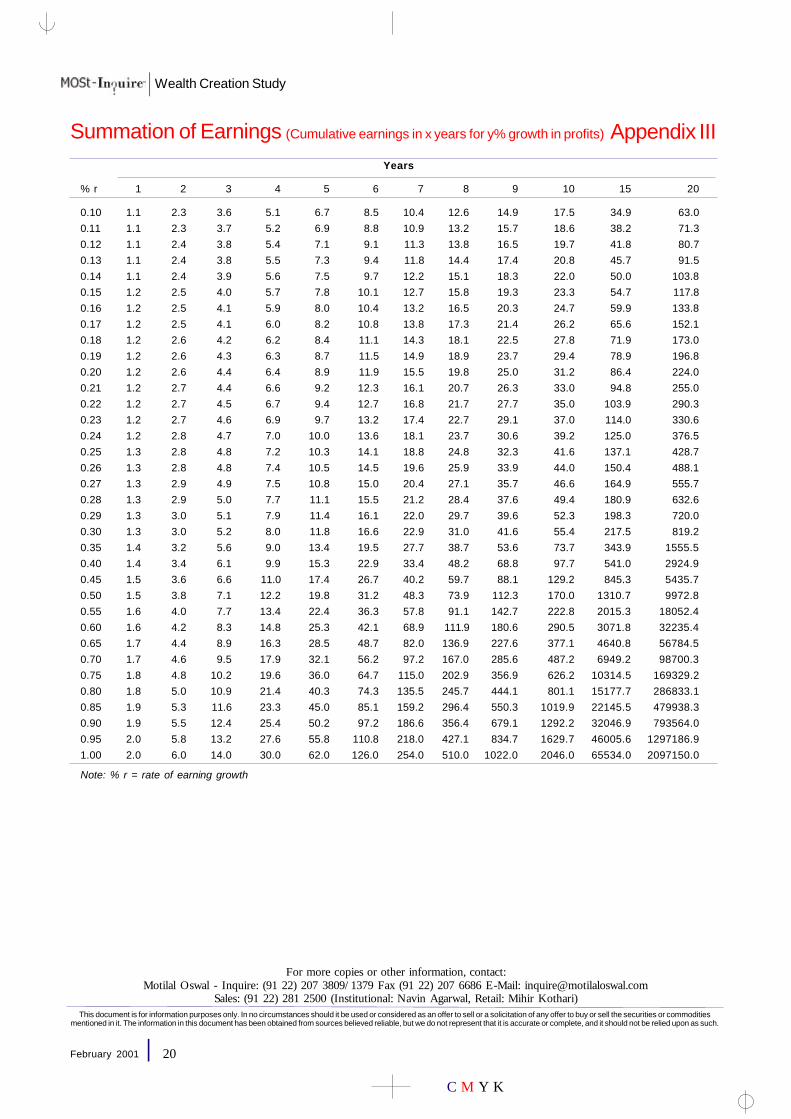
Years
% r 1 2 3 4 5 6 7 8 9 10 15 20
0.10 1.1 2.3 3.6 5.1 6.7 8.5 10.4 12.6 14.9 17.5 34.9 63.00.11 1.1 2.3 3.7 5.2 6.9 8.8 10.9 13.2 15.7 18.6 38.2 71.30.12 1.1 2.4 3.8 5.4 7.1 9.1 11.3 13.8 16.5 19.7 41.8 80.70.13 1.1 2.4 3.8 5.5 7.3 9.4 11.8 14.4 17.4 20.8 45.7 91.50.14 1.1 2.4 3.9 5.6 7.5 9.7 12.2 15.1 18.3 22.0 50.0 103.80.15 1.2 2.5 4.0 5.7 7.8 10.1 12.7 15.8 19.3 23.3 54.7 117.80.16 1.2 2.5 4.1 5.9 8.0 10.4 13.2 16.5 20.3 24.7 59.9 133.80.17 1.2 2.5 4.1 6.0 8.2 10.8 13.8 17.3 21.4 26.2 65.6 152.10.18 1.2 2.6 4.2 6.2 8.4 11.1 14.3 18.1 22.5 27.8 71.9 173.00.19 1.2 2.6 4.3 6.3 8.7 11.5 14.9 18.9 23.7 29.4 78.9 196.80.20 1.2 2.6 4.4 6.4 8.9 11.9 15.5 19.8 25.0 31.2 86.4 224.00.21 1.2 2.7 4.4 6.6 9.2 12.3 16.1 20.7 26.3 33.0 94.8 255.00.22 1.2 2.7 4.5 6.7 9.4 12.7 16.8 21.7 27.7 35.0 103.9 290.30.23 1.2 2.7 4.6 6.9 9.7 13.2 17.4 22.7 29.1 37.0 114.0 330.60.24 1.2 2.8 4.7 7.0 10.0 13.6 18.1 23.7 30.6 39.2 125.0 376.50.25 1.3 2.8 4.8 7.2 10.3 14.1 18.8 24.8 32.3 41.6 137.1 428.70.26 1.3 2.8 4.8 7.4 10.5 14.5 19.6 25.9 33.9 44.0 150.4 488.10.27 1.3 2.9 4.9 7.5 10.8 15.0 20.4 27.1 35.7 46.6 164.9 555.70.28 1.3 2.9 5.0 7.7 11.1 15.5 21.2 28.4 37.6 49.4 180.9 632.60.29 1.3 3.0 5.1 7.9 11.4 16.1 22.0 29.7 39.6 52.3 198.3 720.00.30 1.3 3.0 5.2 8.0 11.8 16.6 22.9 31.0 41.6 55.4 217.5 819.20.35 1.4 3.2 5.6 9.0 13.4 19.5 27.7 38.7 53.6 73.7 343.9 1555.50.40 1.4 3.4 6.1 9.9 15.3 22.9 33.4 48.2 68.8 97.7 541.0 2924.90.45 1.5 3.6 6.6 11.0 17.4 26.7 40.2 59.7 88.1 129.2 845.3 5435.70.50 1.5 3.8 7.1 12.2 19.8 31.2 48.3 73.9 112.3 170.0 1310.7 9972.80.55 1.6 4.0 7.7 13.4 22.4 36.3 57.8 91.1 142.7 222.8 2015.3 18052.40.60 1.6 4.2 8.3 14.8 25.3 42.1 68.9 111.9 180.6 290.5 3071.8 32235.40.65 1.7 4.4 8.9 16.3 28.5 48.7 82.0 136.9 227.6 377.1 4640.8 56784.50.70 1.7 4.6 9.5 17.9 32.1 56.2 97.2 167.0 285.6 487.2 6949.2 98700.30.75 1.8 4.8 10.2 19.6 36.0 64.7 115.0 202.9 356.9 626.2 10314.5 169329.20.80 1.8 5.0 10.9 21.4 40.3 74.3 135.5 245.7 444.1 801.1 15177.7 286833.10.85 1.9 5.3 11.6 23.3 45.0 85.1 159.2 296.4 550.3 1019.9 22145.5 479938.30.90 1.9 5.5 12.4 25.4 50.2 97.2 186.6 356.4 679.1 1292.2 32046.9 793564.00.95 2.0 5.8 13.2 27.6 55.8 110.8 218.0 427.1 834.7 1629.7 46005.6 1297186.91.00 2.0 6.0 14.0 30.0 62.0 126.0 254.0 510.0 1022.0 2046.0 65534.0 2097150.0
Note: % r = rate of earning growth
Summation of Earnings (Cumulative earnings in x years for y% growth in profits) Appendix III
For more copies or other information, contact:Motilal Oswal - Inquire: (91 22) 207 3809/1379 Fax (91 22) 207 6686 E-Mail: [email protected]
Sales: (91 22) 281 2500 (Institutional: Navin Agarwal, Retail: Mihir Kothari)This document is for information purposes only. In no circumstances should it be used or considered as an offer to sell or a solicitation of any offer to buy or sell the securities or commodities
mentioned in it. The information in this document has been obtained from sources believed reliable, but we do not represent that it is accurate or complete, and it should not be relied upon as such.