Embed Size (px)
Citation preview

Large Wealth Creation in Mergers and Acquisitions
This draft: November 2012
First draft: May 2011
ABSTRACT
We examine completed M&A deals with large bidder shareholder dollar wealth gains at announcement. Our results show that large-gain acquisitions are (i) typically “bolt-on” deals that are small relative to the acquirer’s size; (ii) transaction-specific events (not firm- or CEO-specific events); (iii) enhanced by synergies from a strategic fit in the supply chain; and; (iv) executed by bidders with high valuation multiples. Many of these findings, which differ from those in the existing literature, provide important insight into the factors associated with considerable wealth creation for acquirer shareholders in M&A deals.

1
1. Introduction
One of the most important, but least understood, issues in the mergers and acquisitions
(M&A) literature is what deal characteristics lead to large wealth creation for acquirer
shareholders. The academic M&A literature paints a relatively bleak picture for acquirer
shareholders: from the zero-to-negative average abnormal announcement returns associated
with acquisitions of public targets noted in Jensen and Ruback (1983) and Andrade, Mitchell,
and Stafford (2001) (amongst others with updated data) to the “wealth destruction on a
massive scale” documented in Moeller, Schlingemann, and Stulz (2005).
The overall conclusion from this stream of the literature would seem to be that acquisition
activity destroys an enormous amount of acquirer shareholder wealth. This impression is
exacerbated by the fact that the popular narrative about M&A deals is replete with gross-
missteps, such as the Time-Warner/AOL and Vivendi/Universal deals, but misses dramatic
accounts of acquisitions that create substantial wealth for acquirer shareholders.
In this paper we focus on what we call “large gain” M&A deals: that is, M&A deals in
which the acquirer’s announcement abnormal dollar returns are greater than $500 million in
real terms (2010 dollars). In terms of a benchmark, $500 million is approximately 22% of the
market capitalization of the median S&P 1500 firm in 2010. The deals we examine, therefore,
generate a non-trivial amount of wealth for shareholders of the acquirer.
In contrast to much of the extant M&A literature, we use dollar (instead of percent)
abnormal returns as our measure of wealth creation for acquirer shareholders returns. In
essence, the dollar abnormal return is an estimate (at announcement) of the net present value
(NPV) of the acquisition to the acquiring firm (assuming that the deal was not anticipated).

2
Percent returns can be problematic to interpret because acquiring firms are very large, and so
even “small” (perhaps statistically undetectable) returns to those firms can imply large dollar
wealth changes (NPVs) for acquiring firm stockholders. While there is relatively scant use of
dollar abnormal returns as value metrics in the existing M&A literature (at least compared to
percent abnormal returns; see, for example, Bates et al, 2006; or Moeller et al, 2004), the
problems associated with interpreting small percentage returns to large acquiring firms, and
the attractiveness of dollar abnormal returns as estimates of the NPV of acquisitions, have led
to renewed recent interest in this measure (see, for example, Ahern, 2012). For our purposes,
we focus on dollar returns because the point of this study is to examine large wealth creation
and dollar abnormal returns directly measure the actual monetary wealth gains (or losses) for
acquiring firm shareholders as a group (Malatesta, 1983).1
One of our strongest findings is that the targets in large gain M&A deals are small relative
to the acquirer, compared to both targets in large loss deals and targets in deals in which
acquirer shareholder wealth changes are more modest. We also find that acquirers in large
gain M&A deals are large (in terms of equity market capitalization) compared to acquirers in
large loss deals. This result adds important new evidence to the conclusion in Moeller, et al.
(2004) that “… small firms are good acquirers and large firms are not,” (p.202) and strongly
suggests that the relative size of the target to the acquirer is more important for acquirer
shareholder value creation. Shareholders, even those of large acquirers, appear to fare much
1 One potential concern with dollar abnormal returns for the acquirer is that such measures may be contaminated by extraneous information that is not related to the deal we are associating the return with. Mindful of this concern, we estimate all our results excluding any deals announced contemporaneously with potentially confounding events. This robustness test does not alter our qualitative conclusions.

3
better when the managers of their firms attempt to digest relatively small (“bolt-on”)
acquisitions versus attempting mergers of equals or transformational M&A deals.
Our analyses also show that acquirers in large gain deals have the highest Tobin’s Q’s (on
average or at the median) of acquirers in any category of transactions we examine, and
acquirer gains appear to be increasing in the acquirer’s valuation multiple. Relatedly, Moeller,
et al. (2005), find that large loss deals are by acquirers with high Tobin’s Q. They interpret
this as suggesting that acquirer overvaluation leads to poor acquisition choices. Therefore, our
results together with those in Moeller, et al. (2005) suggest that acquirers with high valuation
multiples conduct acquisitions that create more extreme wealth changes for their shareholders,
not necessarily more extremely good or bad.
Despite the large acquirer shareholder gains in large gain M&A deals, we find that target
shareholders appear to fare no worse, and potentially better, in these transactions relative to
deals that produce large losses (or more modest wealth changes) for acquirer shareholders.
This result challenges the notion that acquirer shareholders are better off in large gain deals
because acquirer managers negotiate a bigger “piece of the pie” for their shareholders. In fact,
we show that premiums and target abnormal announcement returns are significantly higher in
large gain deals in multivariate tests controlling for other known determinants of target
premiums. This suggests that deals that are particularly valuable for acquirer shareholders are
the by-product of high synergies. The economics of meaningful combinations of assets (the
size of the pie) seems more important to value creation for bidder shareholders than hard
bargaining over the distribution of those rents.

4
Inter- (as opposed to intra-) industry M&A deals are no more likely to involve large gains
for acquirer shareholders versus large losses. We also do not detect differences in the
distribution of large gain and large loss M&A deals across industries. That is, large gain deals
are just as likely as large loss deals to occur in the business equipment, manufacturing,
energy, financial, and retail sectors. Therefore, broad industry categorizations (and whether a
deal is between firms in different “industries”) seem unable to provide evidence of higher or
lower deal synergies.
Nonetheless, we do find one marker for important deal synergies: large gain deals are
substantially more likely to exhibit a supply dependence relation between the parties to the
transaction than are other deals. We define supply-dependence as an industry link that occurs
when the greatest amount of inputs to the acquirer’s industry is supplied by the target industry
and/or when the target’s industry supplies the greatest amount of its outputs to the acquirer’s
industry (i.e., the acquirer is potentially dependent on the target for supply). Our finding that
large gain deals exhibit supply dependence is therefore consistent with the notion that
synergies are especially important for value creation for acquirer shareholders, and that
synergies are more likely to be realized when an acquisition takes advantage of the supply
chain.
Our multivariate tests yield an additional finding with broad implications for the M&A
literature. Results from quantile regressions suggest that extreme outcomes (large gains or
large losses) may drive some of the results we are familiar with in the existing M&A
literature. This possibility suggests that either the effect of many variables on acquirer
stockholder wealth during mergers is probably best described by non-linear models or that

5
some of what we know about value creation (and destruction) during mergers is indeed driven
by the tails of the distribution (as we focus on here).
In event time, large gain M&A deals appear to be a firm-specific aberration, in the sense
that the acquisitions that large gain acquirers make both before and after (their large gain deal)
generate negative abnormal returns for shareholders. This suggests that there is not some
firm-specific (or CEO-specific) characteristic that leads systematically to acquisition
decisions that are well received by the market: on the contrary, good acquisitions appear to be
transaction-specific occurrences.
Other results indicate that large gain deals are just as likely as large loss deals to occur in
merger waves. However, the best large gain deals and the worst large loss deals are observed
during merger waves. This suggests that merger waves have important implications for
acquirer shareholder wealth creation: in-wave M&A deals are especially likely to result in
extreme outcomes for acquirer shareholders, but it is not clear ex-ante whether in-wave
transactions are good or bad.
Furthermore, the proportion of large gain M&A deals observed in periods of market
dislocation (e.g., 2002 and 2008) is approximately the same as the fraction of large loss M&A
deals in those years. Value-creating M&A deals occur even in periods of economic and stock
market weakness. Consequently, the cyclicality in the number of good M&A deals per year
appears to be driven by M&A market volume rather than by an inherent difficulty for
acquirers to detect attractive acquisitions in recessions. While some of these results confirm
the findings in previous studies, others illuminate certain to-date unknown traits of value-
increasing acquisitions. For example, while there is similar cyclicality in the time-series

6
distribution of both large gain and large loss deals, large gain M&A deals are just as
concentrated in the bull market of the late 1990s as large loss deals are. This suggests that
M&A activity in the late 1990s / early 2000s may not have been as bad for acquirer
shareholders as documented in Moeller, et al. (2005).
Our study of large gain deals, selected from a sample of more than 8,000 acquisitions
between 1995 and 2010, expands the M&A literature in several ways. First, the transactions
we examine occur during periods of both economic expansion and contraction, inside and
outside of merger waves, and in the presence or absence of stock-market bubbles. As a result,
we are able to assess (and document) whether (and how) these economic patterns affect the
gains to acquiring firms.
Second, we contrast the characteristics of the deals that generate meaningful gains for
acquirer shareholders with the characteristics of deals that generate losses of similar
magnitude and with transactions in which the abnormal dollar returns for the acquiring firm
are modest. Therefore, our sample provides a fertile testing ground for examining value
creation for acquirer shareholders. This is an important issue because the existing M&A
literature is relatively silent on the factors that make for good (as opposed to bad) deals.2 In
fact, while it is tempting to infer that the conditions necessary for an acquisition to be
favorably received by the market are just the opposite of those in bad deals, our results reveal
2 For studies describing conditions that appear to make M&A deals worse for acquiring-firm shareholders, see Travlos (1987), Bradley, Desai, and Kim (1988), Chang (1998), Harford (1999), Fuller, Netter, and Stegemoller (2002), Moeller, Schlingemann, and Stulz (2004), Dong, Hirshleifer, Richardson, and Teoh (2006), and Malmendier and Tate (2008), amongst others. While most studies in the extant literature highlight negative returns for acquirer shareholders, Bayazitova, Kahl, and Valkanov (2010) and Netter, Stegemoller, and Wintoki (2011) argue that the majority of M&A deals are associated with small (+0.25% to +1%), but positive, announcement returns for acquirers at the median. In particular, Bayazitova, et al. (2010) find that all but the largest deals create a small amount of value for acquirer stockholders.
7
that this is not necessarily the case: the absence of conditions associated with negative
abnormal announcement returns does not automatically imply positive abnormal
announcement returns for acquirers.
Third, our analysis of large gain deals complements the description of large loss
transactions in Moeller, et al. (2005). In that paper, the authors provide descriptive context for
104 deals that result in abnormal dollar losses for acquirer shareholders in excess of $1 billion
(and that mostly occur between 1998 and 2001, a period that roughly corresponds to the
internet-Nasdaq bubble). Recently, Ahern (2012) argues that in a substantial fraction of M&A
deals the acquirer actually gains more than the target does at announcement. Our study, which
uses an experimental design similar to that in Moeller, et al. (2005) (and like that paper also
uses dollar abnormal returns to measure value creation/destruction), helps complete this
literature by identifying a set of characteristics (and conditions) that are associated with deals
that generate non-trivial gains for shareholders in acquiring firms.
The paper proceeds as follows. Section 2 describes our dataset. Section 3 presents our
main univariate results, while Section 4 discusses the multivariate tests. Section 5 concludes.
2. Data and Descriptive Statistics
We analyze a sample of mergers and acquisitions drawn from the Securities Data
Corporation’s (SDC) M&A database from the 1995 to 2010 period. Our sample includes
completed transactions in which deal value is at least $1 million. The acquirer in the deals we
study must be a publicly traded U.S. company with stock market data available from the
Center for Research in Security Prices (CRSP) database. Targets in our sample include private

8
firms, public firms, and subsidiaries. The sample excludes spinoffs, recapitalizations,
exchange offers, repurchases, self-tenders, acquisitions of remaining interest, transactions for
which deal value is not disclosed, leveraged buyouts, privatizations, rumored deals, acquirers
seeking an unspecified target, or targets seeking an unspecified buyer. The final sample
contains 8,166 completed transactions.
Table 1 reports the number of deals and the total consideration spent on acquisitions for
each year in our sample. The transactions we analyze occur during periods of both economic
expansion and contraction. The annual number of completed offers increases substantially
during the 1997 to 2000 period, which coincides with times of economic expansion.
Conversely, the number of completed bids declines during the 2002-2003 and 2009-2010
periods of economic contraction. Rhodes-Kropf and Viswanathan (2004) and Shleifer and
Vishny (2003) argue that stock market health drives merger activity, and the temporal
distribution of our sample appears consistent with this argument. The aggregate transaction
value we report is the total value of consideration paid by the acquirer, excluding fees and
expenses. Overall, our sample accounts for over 6 trillion (2010 dollars) of transaction value
during the period we study.
Malatesta (1983) argues that, for acquirer shareholders, the appropriate measure of the
acquisition wealth effect is the cumulative abnormal dollar return they experience.
Accordingly, for each deal we compute the abnormal dollar return by multiplying the
acquirer’s market capitalization on event day -2 (i.e., two trading days prior to the acquisition
announcement) by the deal’s cumulative abnormal announcement return (CAR) from day -1
until day +1. In an efficient market, abnormal returns at announcement should capture the

9
market’s collective expectations about wealth creation (or destruction) resulting from an
event, in this case an acquisition.3 However, some studies in the M&A literature examine
long-run returns to acquirers, in part to determine whether the market systematically
underestimates the value that acquirers can extract from acquisitions (potentially because of
difficult-to-estimate long-run synergies). The evidence about long-run acquirer returns in that
stream of the literature is generally equally as bleak for acquirer shareholders as is the short-
run return evidence discussed in the introduction (see, for example, Rau and Vermaelen,
1998).
To estimate CARs, we rely on the standard event study methodology computing market
model abnormal returns using the CRSP value weighted index (see Dodd and Warner, 1983).
We sum the acquirers’ abnormal dollar returns for all acquisitions each year and report the
results in Table 1. Also reported are the annual average CARs for the acquirers in our sample.
During the period we examine, acquirers in our sample exhibit a total aggregate abnormal
dollar loss of over $721 billion (2010 dollars).
According to Bradley, Desai, and Kim (1988), the total synergy gains from an acquisition
can be defined as the change in the combined wealth of stockholders of the acquiring and
target firms. Following their method, we estimate the impact of acquisitions on the combined
value of both parties to the transaction. This analysis includes the 2,619 deals in which the
target is also a publicly traded firm with stock market data available in CRSP. 3 According to theories of market efficiency, the increase in the market capitalization of the acquiring company around the announcement date reflects the market’s unbiased and rational prediction about the wealth gain for acquirer shareholders from the completed acquisition as long as the probability of completion is sufficiently high. Since we study M&A deals that are ex-post completed, and since over 80% of deals in large samples are completed (see, for example, Officer, 2003, or Officer, 2004), the announcement wealth gain should be a good proxy for overall wealth creation for acquirer shareholders from an acquisition.

10
For each acquisition of a publicly traded target in our sample, we estimate the target’s
abnormal dollar announcement return by multiplying its market capitalization on day -2 by
the CAR for the target over the (-1,+1) period. We then add the abnormal dollar returns for
the acquirer and target (adjusted for the percentage of target shares held by the acquirer two
days prior to the announcement of the deal) to obtain the abnormal dollar return synergy for
the transaction. Annual summary statistics for this measure are reported in Table 1. The table
also provides the annual average CAR over the (-1,+1) event window for the market-value-
weighted portfolio of the target and the acquirer. The total aggregate abnormal dollar
synergies over our sample period amount to a loss of about $168 billion: in aggregate, and
when measured in dollar terms, deals in our sample do not create synergistic value.4 This is
consistent with the findings in Moeller, et al. (2005), although Harford, Jenter, and Li (2011)
report positive average dollar synergy gains per transaction in their sample of 3,540 deals over
the 1984 to 2006 period.
In Table 2 we document the time-series distribution of large gain (Panel A) and large loss
(Panel B) M&A deals. Large gain deals are those for which the acquirer dollar abnormal
return (defined in Table 1) is greater than (or equal to) $500 million (2010 dollars), and large
loss deals are those for which the acquirer dollar abnormal return is less than or equal to -$500
million (2010 dollars). We have 451 large gain deals by 237 distinct acquirers (average of 1.9
large gain deals per acquirer) and 545 large loss deals by 285 distinct acquirers (average of
1.9 large loss deals per acquirer) in our sample.
4 The aggregate abnormal dollar return synergy cannot be compared to the aggregate abnormal dollar return for the acquiring firm in Table 1 because the latter measure includes the dollar returns associated with acquisitions of private companies and subsidiaries (for which we cannot measure synergy gains).
11
We are sensitive to the possibility that changes (gains or losses) in market capitalization in
excess of $500 million (in absolute value) for the acquirers in our sample occur because other
important events are contemporaneous to the merger announcement. If this is the case, we
could be incorrectly attributing the full change in market capitalization to the acquisition
event. To alleviate these concerns, we search the Lexis/Nexis, Factiva, Wall Street Journal
index, and company press releases around the merger announcement date. Specifically, we
search for other announcements related to major corporate events affecting our large gain and
large loss acquirers. These events include the approval of patents, earnings or dividend
announcements, restatements, guidance, lawsuits, settlements, gaining or losing a major
contract, executive resignations or appointments, or transactions in which an executive (or
major investor/blockholder) buys or sells stock or is allocated stock options. Overall, we find
239 (out of 996) large gain/loss acquisitions announced around potentially confounding
events. All of the results discussed in the remainder of this paper continue to hold when we
exclude these transactions from the analyses.
As can be seen in Panel A of Table 2, large gain deals are relatively evenly distributed
over the sample period, with concentrations in 1999 – 2000 (the only years containing more
than 10% of the total number of large gain deals). Apart from 1999 – 2000, the percentage of
deals each year that are classified as large gain deals is fairly even, indicating that large gain
deals occur with relatively constant frequency throughout our sample years (even during the
recessionary year of 2008, where 6.5% of all deals are classified as large gain deals). By
construction, large gain deals produce substantial dollar gains for acquirer shareholders

12
(abnormal dollar returns) and have positive announcement CARs. The synergy gains
(combined acquirer and target dollar and/or percent returns) are also substantially positive.
Looking at Panel B of Table 2, we see similar time trends as in Panel A, with relatively
constant frequency of large loss deals throughout our sample period and concentrations in the
late 1990s / early 2000s. Specifically, more than 25% of all transactions are classified as large
loss deals in 2000 and 2001, which is the trend highlighted in Moeller, et al. (2005). Unlike
Moeller, et al. (2005), however, we observe a rather stable distribution of large loss deals
throughout the remainder of our sample period (although their sample period (1980 – 2001)
does not overlap much with ours).5 Large loss deals, by construction, destroy substantial
amounts of wealth for acquirer shareholders, and also exhibit negative synergies.
Comparing the two panels in Table 2, two striking facts stand out. First, the targets in
large gain deals are dramatically smaller than those in large loss deals are. Specifically, while
there are only about 83% as many large gain deals as there are large loss deals, the total
aggregate transaction value (2010 dollars) for large gain deals is just 34% ($830,422 million /
$2,431,150 million) of that for large loss deals. Transaction value is the market value of the
target plus the premium paid by the acquirer, so the low relative size of transactions in large
gain deals could come from small targets, low premiums, or both. This finding that large loss
deals involve extremely high transaction values is consistent with the results in Moeller, et al.
(2005).
5 In addition, differences between our results and those in Moeller, et al. (2005) might partly be due to the fact that Moeller, et al. (2005) code large loss deals as those with a loss of acquirer market value of $1 billion (2001 dollars) or more, whereas we use a cutoff of $500 million (2010 dollars).

13
Second, while there are more large loss deals than large gain deals in the sample (545 vs.
451), the concentration of large gain deals in the late 1990s / early 2000s is remarkably
similar to the concentration of large loss deals in the same period. Specifically, over 50% of
large gain and large loss deals occur in the 1998 – 2001 period. This similarity in the time
series distribution of large gain and large loss deals indicates that this period in acquisition
history (1998 – 2001) is unusual not just because of the large losses incurred by acquirer
shareholders during that time (Moeller, et al., 2005) but because of the extreme nature of
acquirer shareholder outcomes (gains and losses).
In Panel A of Table 3 we examine the industry distribution of the 451 large gain and 545
large loss deals. About 79% of both types of deals are between acquirers and targets in the
same Fama-French 12-industry grouping, with the remainder being inter-industry (potentially
vertical, likely diversifying). Some industries have concentrations of deals that generate
extreme outcomes for the acquirer shareholders. For example, there is a greater frequency of
large gain and loss deals in the Business Equipment, Money (financial services) and, Health
industries. In contrast, the incidence of these deals is lower, for example, in the Durables and
the Utilities sectors.
The p-values in the last column of the panel indicate, however, that this industry
concentration is not significantly different between large loss and large gain deals. The
distribution of all other deals in the sample (with more modest wealth changes for acquirer
shareholders; not tabulated in Panel A) indicates that the concentration of large gain/loss deals
in the Business Equipment and Money (financial services) industries is statistically unusual
relative to the remainder of the sample. For example, while around 42 – 45% of large

14
gain/loss deals are in the Business Equipment industry, only around 25 – 28% of other deals
are. This indicates that deals in these industries (basically technology and banking) are more
likely to generate extreme outcomes for acquirer shareholders (gains or losses).
Panel B of Table 3 reports the distribution of large loss and large gain deals by acquirers
with more than five of either type of deal in our sample. Using this taxonomy, the most
frequent large gain and large loss acquirer is Cisco Systems, with 25 large loss deals
(producing dollar losses for the firm’s shareholders of $341 billion (2010 dollars)) and 36
large gain deals (responsible for dollar gains for the firm’s shareholders of $335 billion (2010
dollars)). Lucent Technologies, Johnson & Johnson, and IBM also appear prominently on
both sides of Panel B in Table 3, indicating a prevalence of deals with extreme wealth effects.
On the other hand, firms such as Motorola, EMC, and Pfizer have predominantly large loss
deals, while Abbott Laboratories and Sun Microsystems seem to complete deals that are
mostly accretive to stockholder wealth. Overall, about 30% of large gain and large loss deals
are completed by acquirers with more than five of either type of transaction in our sample.6
3. Univariate results
3.1. Are large gain Deals an Acquirer- (or Acquirer-CEO) Specific Occurrence?
One important consideration for large gain (and large loss) deals is whether the attributes that
produce extreme outcomes for acquirer shareholders are deal- or acquirer-specific, especially
since many bidders are frequent acquirers. In other words, are there firm-specific attributes
6 Employing acquirer fixed effects in the regressions we report later in the paper does not significantly affect our qualitative conclusions.

15
(potentially including aspects of governance or executive compensation) that make some
acquirers particularly good or particularly bad on average? Panel B of Table 3 suggests that
this is possible, as some firms (and firms in some industries) seem to systematically be
involved in acquisitions that have one type of outcome or the other. On the other hand, firms
like Cisco Systems and Lucent Technologies are serial acquirers with frequent extreme
outcomes of both types. Therefore, it is an empirical issue whether acquisition “success” or
“failure” is a firm-specific characteristic in our sample on average.
To address this issue, Panel C of Table 3 examines the acquirer announcement wealth
effects associated with deals by any of the 237 distinct acquirers in our sample with at least
one large gain deal. Other deals by large gain acquirers are tracked in event time, relative to
the completion of each acquirer’s first large-gain deal (and the first large gain deal by any
acquirer is excluded). The rows in the table represent years relative to the first large gain deal
completion date. For example, in the year after the first large gain deal completion ([0, +1])
80 of the 237 acquirers with large gain deals complete a total of 120 additional transactions.
As can be seen in the Average CAR column, other deals by acquirers with at least one large
gain deal have average acquirer announcement returns with negative point estimates in all
rows, and most are statistically significantly different from zero. There are no periods of
(event) time represented in Panel C of Table 3 where the average acquirer announcement
CAR is significantly positive. Excluding their first (and, in some cases, only) large gain deals,
acquirers with at least one large gain deal experience negative (or zero) announcement returns
associated with their other acquisitions.

16
In untabulated analysis, we replicate Panel C of Table 3 using the acquirer CEO as the
unit of observation. In other words, while it appears from Panel C that large gain deals are not
acquirer-specific occurrences, this may mask the fact that many acquirers have multiple CEOs
during our sample period and large gain deals may be driven by some attribute of the CEO
(rather than the firm). Our analysis at the CEO level, however, produces nearly identical
results: excluding their first large gain deal, CEOs experience poor returns, on average, with
acquisitions both before and after the large gain event. We also reproduce the analysis using
the merger advisor (investment bank) as the unit of observation. The results of these tests are
similar to those described above: the evidence does not indicate that certain advisors are more
or less likely to be systematically associated with transactions that generate substantial gains
for the acquiring firms.
In summary, it does not appear that “good” acquirer announcement returns are acquirer-,
merger-advisor-, or acquirer-CEO-specific effects, because in that case other acquisitions by
large gain acquirers (or their merger advisors or CEOs) would exhibit superior returns.7 Large
gain deals mostly appear to be firm-, merger-advisor-, and CEO-specific aberrations, in that
deals both before and after are greeted less-than-enthusiastically by the market.
3.2. Are Large Gain Deals Related to Acquirer or Deal Characteristics?
In Table 4 we document deal (Panel A), acquirer (Panel B), and target (Panel C)
characteristics for large gain (column 1), large loss (column 2), and other deals (column 3).
7 Except in the unlikely event that the first large gain deal by an acquirer allows the market to completely anticipate all other deals by that acquirer. This is especially unlikely because our evidence on serial acquirers illustrates that their first large gain deal is not usually their first deal announcement in our sample.
17
The first striking observation in Panel A is how large transaction values are for large loss
deals, relative to the other two categories. This confirms our observation from the aggregate
transaction values in Table 2, and is consistent with Moeller, et al. (2005). At the median,
large loss deals involve targets with transaction values of just over $1 billion (all values are in
2010 dollars), versus large gain deals with median transaction value of $444 million and other
deals with median transaction value of $67 million. Large gain deals involve very small
transaction values relative to the acquirer’s assets or market value of equity the year before
the acquisition is announced (deal value / assets and deal value / equity). This occurs largely
because the acquirers in large gain deals are bigger than those in the other deals category and
about the same size as acquirers in large loss deals (first two rows of Panel B).
The size metrics reported in Table 4 imply that, at least on average and relative to other
deal types, large gain deals are small acquisitions by large acquirers: what practitioners would
likely refer to as “bolt-on” acquisitions. What makes this finding especially compelling is that
these deals with large acquirer gains are for small targets: this is very different from the
sample of deals with large acquirer losses in Moeller, et al. (2005) (and column (2) of Table
4) where large changes in acquirer market capitalization are associated with extremely large
targets. Moeller, et al. (2005) note that it is “not surprising” that large loss deals have high
average transaction value relative to other deals (p.771). This implies that it is surprising that
in this paper we find substantial valuation effects for acquirers in large-gain deals stemming
from smaller transactions.
Overall, according to Table 4, large firms can make “very good” acquisitions. This is
noteworthy because it complements the conclusion in Moeller, et al. (2004) that large firms

18
make “bad” acquisitions. Our sample of large gain deals consists of very large acquirers, and
large gain acquirers are just as large (in terms of assets and market capitalization) as large loss
acquirers. Specifically, large gain acquirers have a median market value of equity of $24.5
billion, slightly above the median for large loss acquirers ($23 billion). Despite the fact that
both tails of the acquirer-gain distribution should be weighted towards very large bidders, at
least relative to deals in the middle of the distribution (because the tails are defined using
dollar returns), we still find the largest bidders amongst large gain acquirers.
Examining the valuation multiples for large gain acquirers also provides perspective on
the results in Moeller, et al. (2005). In that paper, the authors stress that deals in their sample
of large loss deals are by acquirers with especially high Tobin’s Q (see, for example, Table 3
in Moeller, et al., 2005, and the text on p.760), implying that acquirer overvaluation somehow
leads to poor acquisition choices. In Panel B of Table 4 we show that the highest mean and
median Tobin’s Q is for acquirers in the large gain category of deals, significantly higher than
the mean or median valuation multiple for large loss acquirers or acquirers in deals with
modest acquirer shareholder returns. In our sample, therefore, it appears that acquirer
overvaluation, as proxied by Q, is not a good predictor of the gains or losses from
acquisitions.
The remaining deal and acquirer characteristics in Table 4 also provide some insight into
the differences between transactions that result in large gains for acquirer shareholders and
those that result in large losses. Specifically, large gain deals are significantly less likely to
involve mostly stock consideration paid to the target than large loss deals are. This is likely to
be a function of the relative size of the target to the acquirer in these two categories of deals,

19
but is consistent with the results in Loughran and Vijh (1997). They suggest that bidders that
pay for the target mostly with their own stock appear more likely to destroy shareholder
value. Note that large gain acquirers are less likely to use stock as the method of payment
relative to acquirers in large loss deals even though large gain acquirers have higher valuation
multiples (Tobin’s Q).
Large gain M&A deals are less likely to involve a target-payable termination fee and
involve slightly larger toeholds than do large loss transactions, again likely functions of the
relative size of the target to the acquirer in the two categories. Consistent with much of the
existing M&A literature, acquirers in deals that produce large gains for shareholders are more
likely to target private companies than are acquirers in large loss deals.
Importantly, the premiums paid by acquirers in large gain deals appear to be
approximately the same as the premiums paid by acquirers in all the other deals in our
sample: there are no significant differences in means or medians for the Premium variable in
Table 4. The target’s cumulative abnormal announcement return (Target CAR [-1,+1] in
Panel A), another potential measure of premiums paid to target shareholders, is actually
significantly higher in large gain deals relative to large loss deals and other deals. Therefore,
the gains derived by acquirers in large gain deals do not appear to be driven by harder
bargaining on the part of acquirer managers (which presumably would result in lower
premiums). Instead, higher synergies appear to lead to greater value creation for both acquirer
and target shareholders.
Acquirers in large gain deals in our sample do not appear to be significantly different from
acquirers in large loss deals in some of the accounting metrics tabulated in Table 4 (free cash

20
flow and leverage, for example), but they are slightly more investment (capex and R&D)
intensive. At the median, large gain acquirers are also more profitable, and have higher pre-
deal annual stock returns, than acquirers in large loss deals (consistent with their richer
valuation multiples).
For a subsample of deals with available governance (RiskMetrics) and CEO compensation
(Execucomp) data, we note some patterns in the data. CEOs of large gain and large loss
acquirers seem to have pay packages that provide sharper incentives (significantly greater pay
for performance and a higher fraction of options in their total compensation) than CEOs of
acquirers in deals that generate more modest wealth changes. This last result could potentially
explain the extreme nature of the acquisition outcome (higher volatility) in transactions
undertaken by these CEOs.
CEOs of acquirers in large gain deals exhibit the lowest G-index (Gompers, Ishii, and
Metrick, 2003) of acquirers in any deal category; this suggests that managers at firms that
seem to make acquisition decisions that are particularly well received by the market are less
entrenched. On the other hand, the boards of large gain acquirers seem to be just as busy
(Fich and Shivdasani, 2006) as those of large loss acquirers. Likewise, large gain and large
loss acquirers appear equally likely to have blockholders as important monitors of
management. These last two findings challenge the idea of effective governance leading to
productive and profitable acquisition decisions, but reaffirm the notion that large gain deals
are aberrations. Since corporate governance and compensation policies change very slowly in
general, if effective governance and well-designed compensation schemes were to be credited

21
with leading to “good” acquisition decisions then we would expect to see more “good” deals
by large gain acquirers (and Table 3, Panel C suggests that this is not the case).
3.3. Synergies Driven by Supply Chain Linkages and Large Gain M&A Deals
Because Table 4 suggests that synergies (as opposed to lower premiums paid to target
shareholders) are relevant for value creation in large gain deals, in Table 5 we turn to an
important source of synergies in acquisitions: the relation between the acquiring and target
firms. We know from Table 3, Panel A that close to 80% of large gain deals are between
acquirers and targets whose primary SIC codes fall in the same Fama-French 12 industry
groupings: however, this does not give us much detail about the nature of the relation between
the two firms. Even within the same broad industry grouping, firms could be competitors (i.e.,
horizontal acquisitions) or related in the supply chain (i.e., vertical acquisitions). To get a
better sense of the likely relation between the acquiring and target firms, we use the 1992
benchmark input-output (IO) matrices produced by the U.S. Bureau of Economic Analysis
(BEA) to classify the relations (supplier, customer) between the approximately 500 unique
industries covered by the survey.8
We define supply dependence as an industry link where the greatest amount of inputs to
the acquirer’s industry (4-digit SIC code) is supplied by the target industry and/or when the
target’s industry supplies the greatest amount of its outputs to the acquirer’s industry. 8 We choose to use one BEA survey to define industry supply chain relations because of the importance of cementing the definitions both of industries and of the relations between them during our sample period, as opposed to allowing the definitions to change every 5 years during our sample period with new BEA surveys. We use the 1992 survey because it immediately pre-dates our sample period (which starts in 1995). The risk of this choice is that noise in the definitions (if they have inherently changed during our sample period) may reduce statistical power.

22
Similarly, demand dependence occurs when the greatest amount of outputs by the acquirer’s
industry is demanded by the target’s industry, and/or when the target’s industry demands the
greatest amount of its inputs from the acquirer’s industry. As these concepts are measured at
the industry level, they do not (necessarily) reflect existing trading relations between firms in
the industries. However, industry-level dependencies are relevant because we are interested in
measuring potential (not just existing) trading relations between the parties to a merger, which
may be a source of synergies.
The results in Table 5 demonstrate that large gain deals are significantly more likely than
any other type of transaction to have a supply dependence relation between industries that the
parties to the acquisition belong to. In other words, large gain deals are more likely to involve
merging parties where the target’s industry is an important supplier to the acquirer’s industry.
Specifically, over 10% of large gain deals display supply dependence, versus 7.2% of large
loss deals and less than 5.9% of all other deals. This suggests that the synergies that appear to
be particularly important for value creation in M&A deals are at least partially derived from
supply chain relations. In particular, transactions with supply dependence between the
acquirer and target appear most likely to create substantial value for acquirer shareholders.
3.4. Large Gain M&A Deals and Merger Waves
Given that merger waves have received increasing attention in the M&A literature recently
(e.g., Harford, 2005; Rhodes-Kropf and Viswanathan, 2004; and Rhodes-Kropf, Robinson,
and Viswanathan, 2005), in Table 6 we examine the incidence of large gain and large loss
deals in merger waves. As background for our analysis, the extant literature has contradictory

23
findings about acquirer value creation from M&A deals consummated inside merger waves.
Harford (2005) finds conflicting evidence about long-run returns for acquirers from in-wave
acquisitions, but his operating performance results show that mergers inside waves produce
no worse, and by some measures better, post-merger acquirer operating performance.
Conversely, Duchin and Schmidt (2011) report that in-wave acquirers suffer lower long-run
abnormal returns and post-merger operating performance. Given these contradictory findings,
it is useful to document how our large gain and large loss deals are distributed in merger
waves. We define merger waves as in Harford (2005).
In Panel A of Table 6 we find that large gain deals are equally as likely as large loss deals
to occur in merger waves. Specifically, about half (one third) of large gain deals take place in
the late 1990s merger wave (2000s). This incidence is statistically indistinguishable to that of
large loss deals that occur in-wave (in either decade). Nevertheless, considering each of the
waves in Panel A of Table 6 separately, it appears that deals with extreme shareholder
outcomes (large gain or large loss) are significantly more likely to occur in merger waves
relative to other deals with more modest shareholder outcomes. This potentially reconciles the
contradictory findings in earlier studies: merger waves seem likely to produce large gains and
losses for acquirer shareholders, but it is difficult to ascertain which effect dominates.
Panel B of Table 6 presents the change in the mean and median market capitalization
accruing to the bidders in large gain and large loss transactions around deal announcement (-
2,+1). As in Panel A, we sort observations according to the time period of their occurrence:
1995-1999 or 2000-2010. We then split the changes in market capitalization by whether the
transaction occurs during a merger wave in any of these periods. This split reveals that in-

24
wave M&A deals generate larger changes in the wealth of acquirer shareholders. For instance,
in-wave large-gain deals that occur during the 2000-2010 period result in an average change
in market capitalization of the acquirer of over $5.5 billion (in 2010 dollars). In contrast, the
average change in market capitalization for large-gain deals that happen outside industry
waves (but during the same time period) is significantly lower at about $2 billion (2010
dollars). We observe a similar pattern for large-loss deals. That is, in-wave large loss deals
destroy significantly more value than large loss deals occurring outside the wave. Together,
these results indicate that in-wave M&A deals are more likely to trigger dramatic outcomes
for acquirer shareholders. Effectively, the results in Panels A and B of Table 6 imply higher
volatility of merger outcomes for acquirer shareholders in merger waves, which is consistent
with the description in Harford (2005) of merger waves driven by economic, regulatory, and
technological shocks (that produce big winners and big losers). Nevertheless, it is not clear
whether in-wave deals are unambiguously beneficial for acquirer shareholder wealth creation
because large-gain deals are just as likely as large-loss deals to occur during waves.
4. Multivariate Analyses
Because of the univariate nature of the foregoing tests and due to the complex interactions
between key variables, our study proceeds with a set of multivariate analyses. We begin by
examining the probability that a firm executes a large gain acquisition and contrast the
findings with those of the determinants of the probability of doing a large loss deal. Next, we
estimate both truncated and quantile regressions explaining the change in market
capitalization at announcement for acquirers in our sample. We also study the premiums paid
25
for publicly traded targets in the transactions we consider. These tests are aimed at assessing
whether certain characteristics help us distinguish the factors that drive large gain and large
loss merger deals.
4.1. Probability of Executing Large Gain/Loss Acquisitions
In Table 7, we estimate six logit models of the determinants of large gain and large loss deals.
In models (1) and (2), the dependent variable is an indicator set to one if the acquisition
generates gains of at least $500 million (2010 dollars; i.e., large gain deals) and zero
otherwise. In models (3) – (4), the dependent variable takes the value of one for transactions
that create losses of at least $500 million (2010 dollars; i.e., large loss deals). In models (5) –
(6) the dependent variable indicator is set to one for deals that generate gains or losses of at
least $500 million (2010 dollars). We note that in models (1), (3), and (5) we analyze our
entire sample of 8,166 completed acquisitions that occur between 1995 and 2010 (of which
451 observations are coded as large gain transactions and 545 are classified as large loss
deals). In regressions (2), (4) and (6) the sample reduces to 2,619 observations due to the
inclusion of the relative size (assets) variable in those tests, and this variable is only available
for firms listed in Compustat.
As discussed in Table 2, acquisition activity appears to be more (less) pronounced in
periods of increased (decreased) general economic activity. In addition, Table 3 shows that
some of the acquirer firms we study execute multiple acquisitions (serial acquirers). Because
of these issues, Table 7 reports robust standard errors clustered by both bidder and year to

26
address the possible firm and time dependence in the residuals (following the methodology
described in Petersen, 2009).
Using the marginal effects derived from model (3) in Table 7, the probability of executing
a large loss acquisition increases by 1.5 percentage points with a one standard deviation
increase in deal value, all else equal. This result is consistent with Moeller, et al. (2005). In
contrast (and in line with our univariate analyses), according to model (1) the probability of a
large gain deal decreases with deal value. Based on these findings, it would seem logical to
deduce that the conditions required for an acquisition to generate large gains (e.g., small
targets) are probably just the opposite of those needed to create large losses (e.g., large
targets). However, other results in Table 7 indicate that this is not necessarily the case. That
is, some characteristics found to increase the probability of large loss transactions are also
found to increase the probability of large gain deals.
For instance, based on the coefficients in model (1), the likelihood of executing a large
gain acquisition increases by about 1.75 percentage points with a one standard deviation
increase in the acquirer’s Tobin’s Q. The coefficient on acquirer Tobin’s Q is also
significantly positive in models (3) and (4). This implies that high valuation multiples for
bidders increase the probability of an extreme outcome for acquirer shareholders and that
Tobin’s Q is, therefore, not a particularly good predictor of the losses (or gains) from
acquisitions.9 This inference is validated by the results in models (5) and (6): Q is positively
9 Our evidence, therefore, contrasts with that in Moeller, et al., 2005 which leads those authors to state (p.760): “The evidence is therefore consistent with the hypothesis… that high valuations increase managerial discretion, making it possible for managers to make poor acquisitions when they have run out of good ones.”

27
associated with the incidence of deals that result in extreme outcomes for bidder shareholders
(large gain or large loss deals).
We come to a similar conclusion about the effect of acquirer size: the probability of an
acquisition with an extreme outcome for acquirer shareholders (gains and losses) increases in
the size of the bidder. This effect on large gain deals is noteworthy given the conclusions in
Moeller, et al. (2004) that “… small firms are good acquirers and large firms are not” (p.202).
We also find some evidence that market anticipation of future deals accentuates the
announcement effect for serial acquirers, as the number of prior deals by the acquirer is
positively related to the probability of observing both a large gain and a large loss deal (see
also Fuller, Netter, and Stegemoller, 2002).
Consistent with our univariate tests, transactions are 2.75 percentage points more likely
(using the coefficient in model (1)) to result in large gains for acquirer shareholders when
there is supply dependence between the acquirer’s industry and the target’s industry. This
finding suggests that an important channel for value creation along the supply chain is an
acquisition in which the acquirer’s industry depends on the target’s industry for critical inputs
to the production process. Interestingly, unlike a supply dependence relationship (which is
only related to large wealth creation for the acquirers), the effect of demand dependencies
among the deal participants (target is potentially an important customer of the acquirer) is
associated with an increase in the probability of both large gain and large loss deals. Buying a
potential supplier, rather than a customer, appears to be more reliably associated with
synergies and corresponding wealth gains for acquirer shareholders.

28
The results in models (3) and (4) of Table 7 (the determinants of large loss deals) are
consistent with the existing literature. As in Moeller, et al. (2005) and Moeller, et al. (2004),
the probability of a large loss acquisition decreases in transactions structured as all cash or in
those involving a private target. In contrast, the probability of a large loss acquisition
increases in deal value, bidder’s size, and the acquirer’s Tobin’s Q. The effect of these
variables is economically meaningful. For example, using the coefficients in model (3), a one
standard deviation increase in Tobin’s Q is associated with a 1.7 percentage point increase in
the likelihood of a large loss acquisition. As noted above, however, there is a similar effect of
acquirer size and Tobin’s Q on the probability of observing a large gain deal. Importantly, this
implies that these variables (size and valuation multiples) are not nearly as pervasive in
explaining losses to acquirer shareholders as suggested by prior work (e.g., Moeller, et al.,
2005; Moeller, et al., 2004).
In regressions (2) and (4) of Table 7 we analyze the subsample of 2,619 deals in which
both the target and the acquirer are publicly traded companies and we have complete data for
all other variables. This subsample enables us to examine whether the relative size of the
parties to an acquisition affects the likelihood of executing a large gain or large loss deal. The
coefficient estimate on the relative size variable is positive and statistically significant in the
large gain test in model (2). This result, which concurs with our univariate findings, indicates
that so-called “bolt on” acquisitions (of smaller targets by larger acquirers) are indeed
considerably more lucrative for acquirer shareholders.
29
4.2. Change in the Acquirers’ Market Capitalization
We next turn our attention to the actual change in market capitalization for acquirer firms in
the large gain and large loss deals we study. The extreme nature of these transactions implies
that we are analyzing the tails of our sample of 8,166 deals. Therefore, to obtain more robust
results we employ two different econometric methods: truncated regression models (to
separately analyze deals in each of the tails and those bounded by the tails) and quantile
regressions (in order to assess the effect of the tails on the overall distribution).
4.2.1. Truncated Regressions
In Table 8, we estimate two regressions of the dollar change in market capitalization accruing
to the acquirers in our sample during the -2 to +1 interval around the deal announcement date.
In these regressions, we separately examine the change in market capitalization for acquirers
in large gain and large loss deals, respectively. As noted earlier, we label large gain (loss)
deals as those with gains (losses) of at least $500 million (2010 dollars). As a result, the
limited dependent variables (changes in market capitalization) could lead to biased and
inconsistent estimates when using ordinary least squares (OLS). In particular, the dependent
variable in the regression for large gain deals is limited to a minimum gain of +$500 million.
Similarly, the dependent variable in the regression for large loss deals is limited to a
maximum of -$500 million. Newey (2001) and Amemiya (1973), among others, show that
truncated regression techniques circumvent the econometric issues that arise when
observations with values in the dependent variable below or above certain thresholds are
excluded from the analysis. The tests reported in Table 8 are, therefore, truncated regressions.

30
The results in Table 8 suggest, as noted earlier, that some characteristics are associated
with extreme wealth creation/destruction (i.e., higher volatility) for acquirer shareholders,
rather than having directional predictions. For example, the size of the bidder, the acquirer’s
Tobin’s Q, and whether the transaction occurs during a merger wave are statistically
significantly related both to larger gains and to larger losses. These results are consistent with
the conclusions in Harford (2005): M&A waves generate big winners and big losers. The
same is true for acquisitions by large and high-Q acquirers: they tend to conduct acquisitions
that result in extreme value outcomes for their shareholders.
Aside from the acquirer’s size and Tobin’s Q, other characteristics are also related to
bigger gains and losses. For instance, acquirer shareholder gains appear to be significantly
more positive (and losses significantly more negative) when borrowing costs are high, when
the transaction exhibits a supply dependence relation, and when the deal involves a private
target. In contrast, other variables in Table 8 appear to matter for only one type of transaction
(large gain or large loss, but not both). For example, large gain deals with a demand
dependence relation exhibit superior performance. Within large loss transactions, the number
of previous deals by the acquirer makes for more acute losses. This last result suggests that
later deals in acquisition programs are less accretive for shareholders of serial acquirers,
potentially because later deals are anticipated (Cai, Song, and Walkling, 2011).
4.2.2. Quantile Regressions
Linear regression techniques, based on minimizing sums of squared residuals, produce
estimates that approximate the conditional mean of the response variable given certain values

31
of the predictor variables. In contrast, quantile regression methods estimate the conditional
median (or other quantiles) of the response variable. Therefore, quantile regression methods
provide a more comprehensive statistical analysis of the conditional distribution of the
response variable and the stochastic association among random variables. This analysis is
rather important when the tails of the distribution are of particular interest, as is the case
here.10
To evaluate the effect of deals occurring in the tails of our sample, we run three median
regressions of the change in the market capitalization of the bidder firm during the -2 to +1
interval around the acquisition announcement date. These tests, which appear in Table 9, use
control variables similar to those in our truncated regressions. The first column in Table 9
reports the median regression for the entire sample of 8,166 deals. Regressions (2) and (3)
exclude large gain and large loss deals, respectively, from the sample.
According to the point estimates in the first column of Table 9 (using the full sample),
certain bidder attributes and transaction-specific characteristics appear to significantly
influence the gains to acquiring firms. Specifically, contrary to much of the existing literature,
we find evidence that acquirer gains around acquisition announcements are increasing in
acquirer size. Consistent with the literature on the relation between cash payment by the
acquirer and positive outcomes for acquirer shareholders (e.g., Travlos, 1987), we find higher
acquisition gains in deals in which the consideration is paid for in cash.
10 For a general introduction of quantile regression methods, see Koenker and Hallock (2001) and Koenker (2005).

32
Both of these results, however, appear to be driven by large gain deals since the
coefficients for the acquirer size and the cash (0,1) indicator in column (3) (which excludes
large loss deals) are positive and significant. Likewise, for the entire sample, merger gains
appear to be inversely related to the size of the deal and to the number of prior deals by the
acquirer. These results seem to be driven by the effect of transactions that generate large
losses because the coefficient for both variables is negative and significant in column (2) (the
regression that excludes large gain deals).
In earlier tests we show that the acquirer’s Tobin’s Q is associated with larger gains and
lower losses. The coefficient estimates in columns (2) and (3) of Table 9 generate similar
inferences. Nonetheless, we note that the Tobin’s Q coefficient in model (1) is not statistically
significant. This lack of significance for Q when the whole sample is used in column (1)
suggests that the significant and negative effect of Tobin’s Q we estimate in column (2) is
“cancelled out ” by the significant and positive effect of Q we estimate in column (3). Overall,
the estimates from our quantile regression analyses support our earlier univariate and
truncated regression results, and the conjecture that some well-known results about value
creation (and destruction) during acquisitions, such as the effect of acquirer Q and target
listing status on shareholder returns, obtain due to the influence of the tails of the distribution.
4.3. Target Premiums
It is possible that some acquirers earn large gains because they capture rents from the targets
they purchase. Following this logic, a similar argument could be made for acquirers in large
loss deals: their losses arise because they overpay for the targets. These conjectures lead us to

33
empirically test whether the gains (and losses) for the bidders we study are associated with the
premiums offered for the targets. In Table 10, we run a set of six regressions of the premium
paid for the publicly traded target firms in our sample. Models (1) and (4) use the four-week
premium reported in SDC as the dependent variable whereas models (2) and (5) use the
target’s CAR [-1,+1]. In models (3) and (6) the dependent variable is the CAR accruing to the
target firm over the [-63, +126] window, which we calculate following Schwert (2000).11 The
independent variable of interest in models (1) – (3) is an indicator set to one if the deal is
classified as a large gain acquisition. Similarly, in models (4) – (6) the main explanatory
variable is an indicator for large loss deals.
The results in models (1) – (3) show that target premiums are 7.6 to 15.2 percentage
points higher in acquisitions that also produce large gains for acquirer shareholders. These
results are inconsistent with the conjecture that large gains arise because bidders in those
deals get away with paying lower premiums. Instead, the results suggest that higher synergies
lead to greater value creation for both acquirer and target shareholders. Put differently,
achieving a mix of assets that increases the scale of the returns to both bidder and target
shareholders in an M&A transaction appears more relevant to value creation for acquirer
shareholders than negotiating (or bargaining) over the allocation of those rents.
We note that the coefficient on the indicator variable for large loss deals is statistically
significant in model (4). Although, this finding suggests that large losses for acquirer
shareholders could be driven by overpayment for the target, the coefficient estimates for the
large loss indicator in models (5) and (6) do not support this conjecture. Nonetheless, it is
11 For transactions that close before day 126, we estimate the target’s return up to the day before closing.

34
plausible that acquirers in large loss transactions buy overvalued targets (for which a larger
premium would not be justified: even with a “normal” premium the market may judge that the
acquirer is overpaying relative to the “true” worth of the target) or purchase targets that
decrease the returns to scale in the combined entity (as in Fu, Lin, and Officer, 2012).
We note that other researchers estimate premium regressions similar to ours and that some
estimates for the control variables in Table 10 are consistent with the existing M&A literature.
For example, we find that lower Q targets get higher premiums (Servaes, 1991), as do smaller
targets (Bargeron, Schlingemann, Stulz, and Zutter, 2008), targets in tender offers (Huang and
Walkling, 1987), and targets that are hostile towards the acquirer (Schwert, 2000).
5. Conclusion
Numerous empirical studies in financial economics document that acquisitions are, at best, the
source of modest gains for acquiring-firm shareholders (see, for example, Netter, et al., 2011),
and, at worst, the source of massive destruction of bidder-shareholder wealth (Moeller, et al.,
2005). One casual implication from this literature is that large value creating M&A deals are
extremely rare. However, in our sample of 8,166 completed M&A transactions by publicly
traded bidders during 1995-2010, large gain M&A deals are not rare: they are almost as
frequent as deals that are responsible for large losses for acquirer shareholders.
Another conclusion that emerges from the existing literature is that large-sized bidders or
those with high valuation multiples (Tobin’s Q) are more likely to complete M&A deals that
destroy vast acquirer shareholder wealth. Nonetheless, we show that large-sized or high-Q
acquirers are just as likely to execute large wealth creating M&A deals. In fact, our results

35
lead us to conclude that the relative size of the target to the acquirer (and not just the size of
the acquirer) is one of the key drivers of large value creation for acquirer shareholders. Large
gain deals appear to be best described as small (“bolt on”) acquisitions.
A common theme in many M&A studies is that extracting rents from target shareholders
(through lower premiums) is sure to maximize the gains to acquirer shareholders.
Nonetheless, we find that premiums paid to target shareholders are not lower (and likely
higher) in large gain deals relative to the other deal categories we consider. Therefore,
achieving a mix of assets that increases the returns to scale for both parties (especially where
there is a supply dependence link between them) is more likely to maximize acquirer
shareholder wealth than is capturing rents from the target shareholders.
Overall, M&A deals that create large gains for the acquirer shareholders appear to be
transaction-specific events (not firm- or CEO-specific events), typically small (“bolt on”)
deals relative to the size of acquirer, enhanced by synergies from a strategic fit in the supply
chain (in the form of a supply dependence relationship), and completed by high-Q bidders.
Our study raises several questions and directions for future research. While we show that
supply dependence is relevant for value creation in M&A deals, our research leaves open the
question of whether such dependence is more important in generating synergies in some
industries than in others, and the effect of merger waves on industry dynamics. In addition,
some of our tests indicate that many characteristics known to explain acquirer wealth changes
during acquisitions (such as acquirer size, deal value, cash payment, and acquirer Tobin’s Q)
appear to be very sensitive to effect of the tails of the distribution. This finding suggests that
extreme outcomes (large gains or large losses) play a non-trivial role driving many well-

36
known results in the existing M&A literature. Therefore, the robustness of many long-
standing findings in the M&A literature should be reassessed accounting for the effect of
M&A deals with extreme outcomes. We leave exploration of these issues to future research.

37
References
Ahern, K., 2012. Bargaining power and industry dependence in mergers. Journal of Financial Economics 103: 530-550.
Amemiya, T., 1973. Regression analysis when the dependent variable is truncated normal. Econometrica 40: 997-1016.
Andrade, G., Mitchell, M., Stafford, E., 2001. New evidence and perspectives on mergers. Journal of Economic Perspectives 15: 103-120.
Bargeron, L., Schlingemann, F., Stulz, R., Zutter, C., 2008. Why do private acquirers pay so little compared to public acquirers? Journal of Financial Economics 89: 375-390.
Bates, T., Lemmon, M., Linck, J., 2006. Shareholder wealth effects and bid negotiation in freeze-out deals: Are minority shareholders left out in the cold? Journal of Financial Economics 81: 681-708.
Bayazitova, D., Kahl, M., Valkanov, R., 2010. Which mergers destroy value? Only mega-mergers. Working paper, University of North Carolina at Chapel Hill.
Bradley, M., Desai, A., Kim, E., 1988. Synergistic gains from corporate acquisitions and their division between the stockholders of target and acquiring firms. Journal of Financial Economics 21: 3-40.
Cai, J., Song, M., Walkling, R., 2011. Anticipation, acquisitions and bidder returns: industry shocks and the transfer of information across rivals. Review of Financial Studies: forthcoming.
Chang, S., 1998. Takeovers of privately held targets, methods of payment, and bidder returns. Journal of Finance 53: 773-784.
Dodd, P., Warner, J., 1983. On corporate governance: A study of proxy contests. Journal of Financial Economics 11: 401-438.
Dong, M., Hirshleifer, D., Richardson, S., Teoh, S., 2006. Does investor misevaluation drive the takeover market? Journal of Finance 61: 725-762.
Duchin, R., Schmidt, B., 2011. Riding the merger wave. Journal of Financial Economics: forthcoming.
Fich, E., Shivdasani, A., 2006. Are busy boards effective monitors? Journal of Finance 61: 689‐724.

38
Fu, F., Lin, L., Officer, M., 2012. Acquisitions driven by stock overvaluation: are they good deals? Journal of Financial Economics, forthcoming.
Fuller, K., Netter, J., Stegemoller, M., 2002. What do returns to acquiring firms tell us? Evidence from firms that make many acquisitions. Journal of Finance 57: 1763-1793.
Gompers, P., Ishii, J., Metrick, A., 2003. Corporate governance and equity prices. Quarterly Journal of Economics 118: 107-155.
Harford, J., 1999. Corporate cash reserves and acquisitions. Journal of Finance 54: 1969-1997.
Harford, J., 2005. What drives merger waves? Journal of Financial Economics 77: 529-560.
Harford, J., Jenter, D., Li, K., 2011. Institutional cross-holdings and their effect on acquisition decisions. Journal of Financial Economics 99: 27-39.
Huang, Y., Walkling, R., 1987. Target abnormal returns associated with acquisition announcements: payment, acquisition form, and managerial resistance. Journal of Financial Economics 19: 329–349.
Jensen, M., Ruback, R., 1983. The market for corporate control. Journal of Financial Economics 11: 5-50.
Koenker, R. 2005. Quantile regression, Econometric Society Monograph Series, Cambridge University Press.
Koenker, R., Hallock, K. 2001. Quantile regression. Journal of Economic Perspectives 15: 143-156.
Loughran, T., Vijh, A., 1997. Do long-term shareholders benefit from corporate acquisitions? Journal of Finance 52: 1765-1790.
Malatesta, P., 1983. The wealth effect of merger activity and the objective functions of merging firms. Journal of Financial Economics 11: 155-182.
Malmendier, U., Tate, G., 2008. Who makes acquisitions? CEO overconfidence and the market’s reaction. Journal of Financial Economics 89: 20-43.
Masulis, R., Wang, C., Xie, F., 2007. Corporate governance and acquirer returns. Journal of Finance 62: 1851-1889.

39
Moeller, S., Schlingemann, F., Stulz, R., 2004. Firm size and the gains from acquisitions. Journal of Financial Economics 73: 201-228.
Moeller, S., Schlingemann, F., Stulz, R., 2005. Wealth destruction on a massive scale? A study of acquiring-firm returns in the recent merger wave. Journal of Finance 60: 757-782.
Netter, J., Stegemoller, M., Wintoki, M., 2011. Implications of data screens on merger and acquisition analysis: A large sample study of mergers and acquisitions from 1992-2009. Review of Financial Studies 24: 2316-2357.
Newey, W.K., 2001. Conditional moment restrictions in censored and truncated regression models. Econometric Theory 17: 863-888.
Petersen, M., 2009. Estimating standard errors in finance panel datasets: comparing approaches. Review of Financial Studies 22: 435–480.
Officer, M., 2003. Termination fees in mergers and acquisitions. Journal of Financial Economics 69: 431-467.
Officer, M., 2004. Collars and renegotiation in mergers and acquisitions. Journal of Finance 59: 2719-2743.
Rau, P., Vermaelen, T., 1998. Glamour, value and the post-acquisition performance of acquiring firms. Journal of Financial Economics 49: 223-253.
Rhodes-Kropf, M., Viswanathan, S., 2004. Market valuation and merger waves. Journal of Finance 59: 2685-2718.
Rhodes-Kropf, M., Robinson, D., Viswanathan, S., 2005. Valuation waves and merger activity: The empirical evidence. Journal of Financial Economics 77: 561-603.
Schwert, G., 2000. Hostility in takeovers: In the eye of the beholder? Journal of Finance 55: 2599-2640.
Servaes, H., 1991. Tobin’s Q and the gains from takeovers. Journal of Finance 46: 409-419.
Shleifer, A., Vishny, R., 2003. Stock market driven acquisitions. Journal of Financial Economics 70: 295-489.
Travlos, N., 1987. Corporate takeover bids, methods of payment, and bidding firms’ stock returns. Journal of Finance 42: 943-963.

Table 1: Completed Acquisition Sample Sorted by Announcement Year This table presents our sample of mergers and acquisitions which we draw from the Securities Data Corporation’s (SDC) Mergers and Acquisitions database for the 1995 to 2010 period. The sample includes completed acquisitions in which the deal value is at least $1 million. The bidder company in the deals we study must be a publicly traded US company with stock market data available from the Center for Research in Security Prices (CRSP) database. Targets in our sample include private firms, public firms, or subsidiaries. The sample excludes spinoffs, recapitalizations, exchange offers, repurchases, self-tenders, privatizations, acquisitions of remaining interest, transactions for which deal value is not disclosed, leveraged buyouts, privatizations, rumored deals, acquirers seeking an unspecified target, or targets seeking an unspecified buyer. The Bidder columns present aggregate transaction values, abnormal dollar returns, and bidder announcement returns sorted by announcement year. Aggregate Transaction Value (in 2010 millions of dollars) is the total value of consideration paid by the acquirer, excluding fees and expenses. We estimate a bidder’s abnormal dollar return (in 2010 millions of dollars) by multiplying its market capitalization on day -2 by the acquisition announcement or cumulative abnormal return (CAR) from day -1 until day +1. To estimate CARs, we use the standard event study methodology computing market model abnormal returns using the CRSP value weighted index (see Dodd and Warner, 1983). We aggregate the bidders’ abnormal dollar returns across all acquisitions each year. The Synergy columns present dollar returns and announcement returns for acquisitions with stock price data available for target firms from CRSP sorted by announcement year. For each publicly traded target in our sample, we determine the abnormal dollar return (in 2010 millions of dollars) by multiplying its market capitalization in day -2 by the CAR meeting that firm from day -1 until day +1. We then add this product to the abnormal dollar return we compute for its respective acquirer (adjusted for the percentage of target shares held by the acquirer 2 days prior to the announcement of the deal) to obtain the abnormal dollar return synergy for the transaction. The last column of the table reports the annual average CAR over the (-1,+1) event window for the value-weighted portfolio of the target and the bidder.
Year
Bidder Synergy
N
Aggregate Transaction
Value ($ mil)
Aggregate Abnormal
Dollar Return($ mil)
Abnormal Dollar Return
per transaction
($ mil)
Average CAR[-1,+1]
N
Aggregate Abnormal
Dollar Return ($ mil)
Abnormal Dollar Return
per transaction
($ mil)
Average Abnormal
Return
1995 578 200,691 3,501 6 0.0032 163 14,693 90 0.01441 1996 628 211,695 6,083 10 0.0075 190 24,546 129 0.02549 1997 726 278,309 -26,244 -36 0.0072 253 -1,165 -5 0.01218 1998 781 566,233 -23,405 -30 -0.0009 272 -5,310 -20 0.00882 1999 710 812,256 66,030 93 0.0066 285 15,195 53 0.01369 2000 771 870,481 -417,884 -542 -0.0145 243 -185,762 -764 0.00015 2001 454 359,372 -59,762 -132 -0.0096 188 -12,337 -66 0.00540 2002 353 208,412 -17,237 -49 -0.0020 110 -26,614 -242 0.02049 2003 426 238,802 -53,496 -126 0.0007 144 -20,933 -145 0.00299 2004 460 413,334 -31,212 -68 0.0013 133 8,020 60 0.00878 2005 492 527,973 -44,648 -91 -0.0064 126 12,678 101 0.01096 2006 471 454,968 -9,460 -20 0.0023 139 6,364 46 0.02057 2007 446 358,515 -22,772 -51 0.0028 128 11,634 91 0.02395 2008 339 271,971 -27,733 -82 -0.0032 91 10,828 119 0.02387 2009 248 340,079 -29,283 -118 0.0135 75 -8,975 -120 0.02396 2010 283 219,355 -33,540 -119 0.0058 79 -10,974 -139 0.03414 Total 8,166 6,332,446 -721,063 2,619 -168,113

Table 2: Annual Performance of Large Gain and Large Loss Deals This table shows the annual performance of large gain deals (Panel A) and large loss deals (Panel B). These transactions are drawn from the sample of successful mergers and acquisitions from 1995 to 2010 described in Table 1. We define large gain (loss) deals as acquisitions in which the bidder experiences an increase (decrease) in its market capitalization of at least $500 million (in 2010 dollars) upon deal announcement [from day -2 to day +1]. The Bidder columns present aggregate transaction values, abnormal dollar returns, and bidder announcement returns sorted by announcement year. The Synergy columns present dollar returns and announcement returns for acquisitions with stock price data available for target firms from CRSP sorted by announcement year. Aggregate transaction value, aggregate abnormal dollar return and average cumulative abnormal returns (CARs) for bidder and synergy are defined in Table I. N is the number of observations.
Year
Bidder Synergy
N
% of total deals
each year
% of total large gain deals
(panel A) or large loss deals
(panel B)
Aggregate Transaction
Value ($ mil)
Aggregate Abnormal
Dollar Return($ mil)
Abnormal Dollar Return per transaction
($ mil)
Average CAR[-1,+1]
N
Aggregate Abnormal
Dollar Return($ mil)
Abnormal Dollar Return per transaction
($ mil)
Average Abnormal
Return
Panel A: Large gain deals
1995 10 1.73 2.22 45,344 11,397 1,140 0.0590 4 11,862 2,965 0.05678 1996 20 3.18 4.43 43,529 26,568 1,328 0.0520 13 25,461 1,959 0.06714 1997 17 2.34 3.77 34,428 15,813 930 0.0353 10 12,435 1,243 0.03370 1998 42 5.38 9.31 72,041 69,256 1,649 0.0677 20 31,860 1,593 0.07559 1999 84 11.83 18.63 101,264 372,644 4,436 0.0928 38 172,516 4,540 0.06936 2000 87 11.28 19.29 61,354 334,498 3,845 0.0989 26 52,845 2,032 0.06604 2001 28 6.17 6.21 40,420 63,836 2,280 0.0502 16 49,749 3,109 0.06091 2002 17 4.82 3.77 14,163 63,873 3,757 0.0572 7 9,898 1,414 0.04205 2003 14 3.29 3.10 13,041 31,666 2,262 0.0356 5 12,724 2,545 0.04688 2004 19 4.13 4.21 103,388 26,782 1,410 0.0681 5 12,129 2,426 0.09580 2005 20 4.07 4.43 53,526 32,700 1,635 0.0335 14 32,819 2,344 0.02978 2006 18 3.82 3.99 59,673 29,895 1,661 0.0418 11 21,287 1,935 0.04241 2007 17 3.81 3.77 27,724 34,832 2,049 0.0464 8 21,564 2,696 0.06768 2008 22 6.49 4.88 49,546 39,663 1,803 0.0496 12 30,075 2,506 0.04698 2009 15 6.05 3.33 92,438 27,431 1,829 0.0525 6 20,584 3,431 0.04966 2010 21 7.42 4.66 18,543 18,878 899 0.0464 7 10,049 1,436 0.04446 Total 451 830,422 1,199,732 202 527,855

Year
Bidder Synergy
N
% of total deals
each year
% of total large gain deals
(panel A) or large loss deals
(panel B)
Aggregate Transaction
Value ($ mil)
Aggregate Abnormal
Dollar Return($ mil)
Abnormal Dollar Return per transaction
($ mil)
Average CAR[-1,+1]
N
Aggregate Abnormal
Dollar Return($ mil)
Abnormal Dollar Return per transaction
($ mil)
Average Abnormal
Return
Panel B: Large loss deals
1995 6 1.04 1.10 19,328 -7,104 -1,184 -0.0421 5 -2,918 -584 -0.01993 1996 10 1.59 1.83 8,683 -16,387 -1,639 -0.0565 7 -11,194 -1,599 -0.05317 1997 19 2.62 3.49 38,396 -36,997 -1,947 -0.0893 14 -22,191 -1,585 -0.07719 1998 47 6.02 8.62 241,876 -86,648 -1,844 -0.0839 32 -48,094 -1,503 -0.05383 1999 68 9.58 12.48 445,735 -294,517 -4,331 -0.0859 46 -169,628 -3,688 -0.05988 2000 125 16.21 22.94 407,023 -723,549 -5,788 -0.1387 59 -242,434 -4,109 -0.09957 2001 50 11.01 9.17 169,777 -118,455 -2,369 -0.0917 30 -65,490 -2,183 -0.06397 2002 16 4.53 2.94 98,115 -81,474 -5,092 -0.0879 9 -44,125 -4,903 -0.04336 2003 22 5.16 4.04 114,173 -78,976 -3,590 -0.0768 15 -34,649 -2,310 -0.05292 2004 24 5.22 4.40 56,891 -49,695 -2,071 -0.0545 13 -12,160 -935 -0.03858 2005 29 5.89 5.32 243,779 -75,059 -2,588 -0.0420 22 -29,470 -1,340 -0.01923 2006 22 4.67 4.04 116,760 -35,609 -1,619 -0.0541 19 -23,790 -1,252 -0.02928 2007 29 6.50 5.32 112,308 -50,834 -1,753 -0.0488 19 -27,232 -1,433 -0.02205 2008 30 8.85 5.50 77,124 -63,297 -2,110 -0.0726 12 -21,530 -1,794 -0.02874 2009 23 9.27 4.22 183,749 -59,102 -2,570 -0.0503 17 -32,725 -1,925 -0.03086 2010 25 8.83 4.59 97,433 -52,996 -2,120 -0.0509 13 -26,941 -2,072 -0.02983 Total 545 2,431,150 -1,830,700 332 -814,572

Table 3: Characteristics of Large Gain and Large Loss Deals This table provides information on the large gain and large loss deals drawn from the completed sample of mergers and acquisitions from 1995 to 2010 described in Table 1. We define large gain (loss) deals as acquisitions in which the bidder experiences an increase (decrease) in its market capitalization of at least $500 million (in 2010 dollars) upon deal announcement [from day -2 to day +1]. Panel A presents the industrial distribution for both bidders and target firms in large gain and large loss deals. We use the Fama-French 12 industries for the classification provided in Panel A. In Panel B, we provide the number of large gain and large loss deals executed by serial bidders in our sample. We define serial bidders as those with at least 5 large loss or 5 large gain deals during the sample period. Panel C shows the acquisition activity of bidders in large gain deals before and after that firm’s first large gain deal. For these bidders, Panel C provides dollar returns and average cumulative abnormal returns (CARs) (defined as in Table I) for deals in different event windows (years). These intervals include various windows that range from 6 years before the first large gain deal to 6 years after. N is the number of acquisitions during each interval. The intervals that contain year “0” do not include the first large loss deal by any acquirer. ***, **, or * signifies that the average is statistically significantly different from zero at the 1%, 5%, or 10% level, respectively (using a two-sided t-test).

Panel A: Industry distribution
Large loss deals Large gain deals p-value for difference in proportions of bidder industry
Bidder industry Target industry Bidder industry Target industry
Business Equipment 233 42.8% 237 43.5% 203 45.0% 207 45.9% (0.7476)
Chemicals 9 1.7% 8 1.5% 6 1.3% 4 0.9% (0.8514)
Durables 3 0.6% 4 0.7% 4 0.9% 3 0.7% (0.7782)
Energy 25 4.6% 26 4.8% 15 3.3% 13 2.9% (0.6473)
Health 55 10.1% 56 10.3% 57 12.6% 54 12.0% (0.5704)
Manufacturing 25 4.6% 31 5.7% 29 6.4% 29 6.4% (0.5679)
Money 82 15.0% 80 14.7% 51 11.3% 44 9.8% (0.4346)
Non-Durables 13 2.4% 17 3.1% 5 1.1% 7 1.6% (0.4908)
Shops 13 2.4% 12 2.2% 19 4.2% 22 4.9% (0.4694)
Telecom 39 7.2% 32 5.9% 33 7.3% 23 5.1% (0.9649)
Utilities 6 1.1% 5 0.9% 6 1.3% 6 1.3% (0.8823)
Other 42 7.7% 37 6.8% 23 5.1% 39 8.6% (0.4515)
Total 545 100% 545 100% 451 100% 451 100%
Percent of intra-industry deals: 79.27% 78.94%

Panel B: Frequent/serial acquirers Large loss deals Large gain deals
Name Industry N Name Industry N
Cisco Systems Inc Business Equipment 25 Cisco Systems Inc Business Equipment 36 Hewlett Packard Co Business Equipment 13 Broadcom Corp Business Equipment 10 Johnson & Johnson Health 11 IBM Business Equipment 9 IBM Business Equipment 9 Johnson & Johnson Health 9 Lucent Technologies Inc Telecom 8 AT&T Corp Telecom 7 Medtronic Inc Health 8 Lucent Technologies Inc Telecom 7 Broadcom Corp Business Equipment 7 Medtronic Inc Health 7 eBay Inc Other 7 Abbott Laboratories Health 6 Motorola Inc Business Equipment 7 Sun Microsystems Inc Business Equipment 6 Oracle Corp Business Equipment 7 United Technologies Corp Manufacturing 6 Pfizer Inc Health 7 ADC Telecommunications Inc Business Equipment 5 Wells Fargo & Co Money 7 eBay Inc Other 5 EMC Corp Business Equipment 6 Hewlett Packard Co Business Equipment 5 BB&T Corp Money 5 Microsoft Corp Business Equipment 5 Berkshire Hathaway Inc Money 5 Nortel Networks Corp Business Equipment 5 Cardinal Health Inc Shops 5 Oracle Corp Business Equipment 5 Sprint Nextel Corp Telecom 5 Wells Fargo & Co Money 5 AT&T Corp Telecom 5 Sprint/Sprint Nextel Telecom 5 Wachovia Corp Money 5 Corning Manufacturing 5 Total 152 Total 148 % of total 33.70% % of total 27.16%

Panel C: Acquisitions before and after large gain deals
Years Number of
Transactions Number of
Firms
Mean Number of Transactions per
Firm
Average CAR[-1,+1]
Aggregate Abnormal Dollar
Return ($mil)
Aggregate Abnormal Dollar
Return per Transaction ($mil)
[-6,-3] 55 38 1.4 -0.0132** -32,950 -599 [-3,-2] 38 34 1.1 -0.0085 -42,042 -1,106 [-2,-1] 68 51 1.3 -0.0214** -19,723 -290 [-1,0] 79 64 1.2 -0.0244*** -81,031 -1,026 [0,+1] 120 80 1.5 -0.0245** -108,893 -907 [+1,+2] 150 78 1.9 -0.0114 11,013 73 [+2,+3] 87 59 1.5 -0.0078* 5,153 59 [+3,+6] 201 91 2.2 -0.0078** -124,594 -620

Table 4: Aquirer and Deal Characteristics: Large Gain, Large Loss, and Other Deals This table reports deal (Panel A) and bidder (Panel B) characteristics for our sample of successful mergers and acquisitions that occur during the 1995 to 2010 period described in Table 1. For each characteristic, we provide mean and median values as well as the number of observations (N) sorted by whether the deal is classified as large gain, large loss, or other deal, respectively. We define large gain (loss) deals as acquisitions in which the bidder experiences an increase (decrease) in its market capitalization of at least $500 million (in 2010 dollars) upon deal announcement [from day -2 to day +1]. Transactions in which the acquirer exhibits moderate wealth changes upon deal announcement are classified as “other deals.” All dollar values in the table (Deal value, Assets, and Market capitalization) are in 2010 millions of dollars.
Variables in Panel A which are mostly derived from data provided the Securities Data Corporation (SDC) include deal value (the total value of consideration paid by the acquirer, excluding fees and expenses), deal value normalized by the bidder’s book value of assets and by the bidder’s book value of equity, and days to complete (which counts the number of days between the announcement and effective dates). Mostly cash is an indicator variable equal to 1 if the deal involves at least 50% payment by cash (0 otherwise). Mostly stock is an indicator variable equal to 1 if the deal involves at least 50% payment by stock (0 otherwise). Tender is an indicator variable set to 1 if the deal is a tender offer (0 otherwise). Hostile is an indicator variable set to 1 if the deal is characterized by SDC as hostile (0 otherwise). Same industry is an indicator variable with a value of 1 if both the bidder and target firm are in the same Fama-French 12 industrial group using SIC codes from SDC (0 otherwise). Hitech bidder is an indicator with a value of 1 for bidders in high tech firms as defined by SDC (0 otherwise). Target termination fee is an indicator variable equal to 1 if the deal includes a target-payable termination fee (0 otherwise). Toehold is the ownership of target common stock by the acquirer before the deal is announced (in percent). Private target is an indicator variable set to 1 if the deal is an acquisition of a privately held target firm (0 otherwise). No. of competing bidders is the number of bidders competing for the same deal as reported by SDC. No. of prior deals by acquirer is the total number of acquisition deals made by the acquirer reported in the SDC database prior to the current acquisition. Premium is the ratio of the offer price to the target’s trading price 4 weeks prior to the announcement date (from SDC). Other variables in Panel A are defined as follows. Acquirer assets/target assets is the ratio of acquirer total assets to target total assets (using Compustat data). The last four rows in Panel A report cumulative abnormal return (CAR; using CRSP data) for acquirers, targets, and synergies. To estimate CARs, we use the standard event study methodology for computing market model abnormal returns using the CRSP value weighted index (see Dodd and Warner, 1983). The numbers in square brackets represent the cumulation window, in event days relative to the merger announcement date. The synergy CAR is the market reaction accruing to the value-weighted portfolio of the target and the bidder.
The acquirer characteristics in Panel B are measured for the (fiscal) year preceding the acquisition announcement and are mostly derived from data provided by Compustat. Variables include assets, market capitalization, Herfindahl index, Tobin’s Q (defined as the book value of assets minus the book value of equity plus the market value of equity, divided by the book value of assets), free cash flow scaled by assets (FCF/assets), capital expenditures to total assets (Capex/assets), expenditures on research and development scaled by assets (R&D/assets), industry-adjusted net income divided by assets (ROA; industries defined using the Fama-French 12 industrial groups), industry-adjusted net income scaled by shareholders’ equity (ROE), annual stock return, and industry adjusted annual stock return (both the latter calculated by compounding monthly stock returns; industry adjustment using the Fama-French 12 industrial groups). Herfindahl index is computed as the sum of squared market shares of all firm in the industry (as in Masulis, Wang, and Xie, 2007), using Compustat data. C&I loan spread is the spread (over the intended federal funds rate) for commercial and industrial loans greater than $1m (see http://www.federalreserve.gov/releases/e2/e2chart.htm) in the quarter preceding deal announcement, adjusted for the time-series median of the spread. Leverage is measured in both book value and market value terms. CEO-Chairman is an indicator variable with a value of 1 if CEO is also chairman. Pay for performance is measured as the increase of CEO wealth per dollar increase in equity compensation. Option/total compensation (Cash/total compensation) is the fraction of

equity (cash) pay given to the CEO relative to his/her total compensation. New CEO is an indicator variable set to 1 if the CEO is appointed in the year before deal announcement. Abnormal log cash (total) comp. is the residual in the regression of CEO cash (total) compensation. CEO holding is calculated as the number of shares held by the CEO divided by the total shares outstanding of the firm. Inst holding is the fraction of the total shares outstanding held by institutions. Gindex is the Gompers, Ishii, and Metrick (2003) governance index. Percent busy is the proportion of outside directors that hold three or more directorships in publicly traded firms. Independent board is an indicator variable with a value of 1 if at least 50% of the board consists of independent directors. Blockholder is an indicator variable set to 1 if the firm has at least one blockholder who holds at least 5% of its stock. CEO directorship is the number of directorships held by the CEO in other public firms. CEO before is an indicator variable set to 1 if the CEO of the bidder was the CEO of a different public firm before becoming the CEO in the bidder firm.
Panel C presents target characteristics measured for the (fiscal) year preceding the acquisition announcement. Variables include total assets, leverage, Tobin’s Q, annual stock returns, and industry-adjusted ROA (all defined similarly as for acquirers).
All other variables are defined in previous tables. For each variable, p-values indicate statistical differences in the mean and median values among the subsamples of large gain, large loss, and other deals.
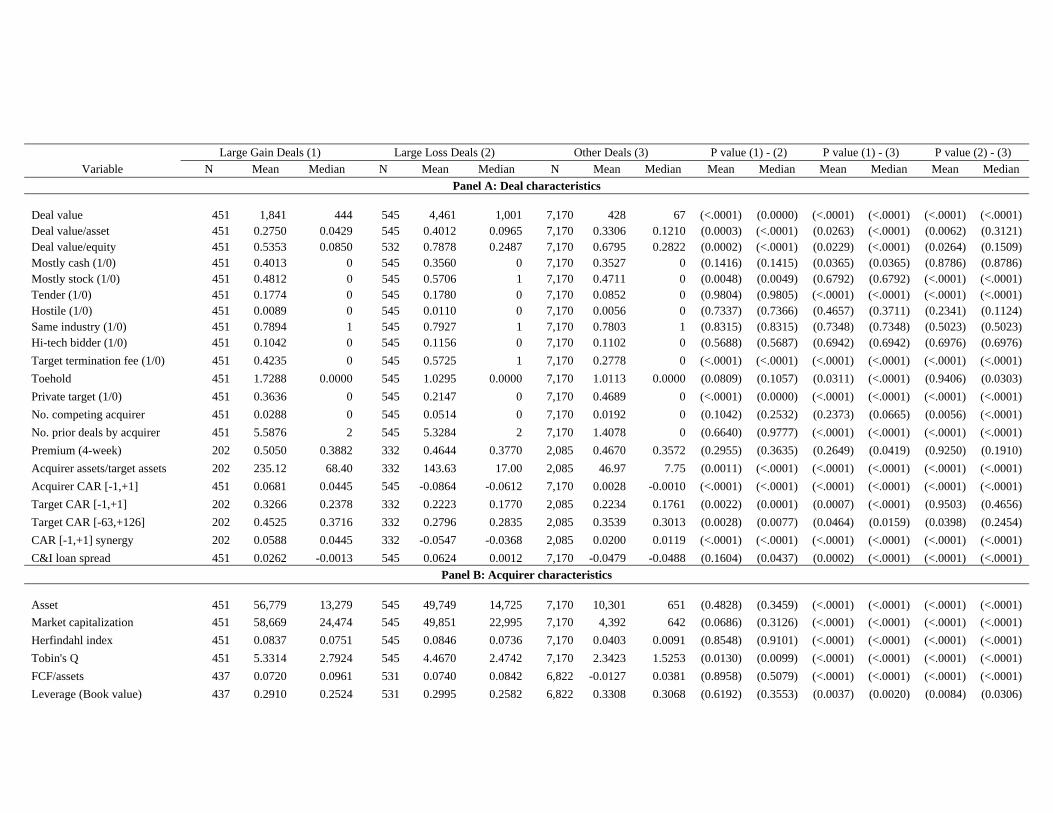
Large Gain Deals (1) Large Loss Deals (2) Other Deals (3) P value (1) - (2) P value (1) - (3) P value (2) - (3)
Variable N Mean Median N Mean Median N Mean Median Mean Median Mean Median Mean Median
Panel A: Deal characteristics
Deal value 451
1,841 444 545
4,461 1,001 7,170 428 67 (<.0001) (0.0000) (<.0001) (<.0001) (<.0001) (<.0001) Deal value/asset 451 0.2750 0.0429 545 0.4012 0.0965 7,170 0.3306 0.1210 (0.0003) (<.0001) (0.0263) (<.0001) (0.0062) (0.3121) Deal value/equity 451 0.5353 0.0850 532 0.7878 0.2487 7,170 0.6795 0.2822 (0.0002) (<.0001) (0.0229) (<.0001) (0.0264) (0.1509) Mostly cash (1/0) 451 0.4013 0 545 0.3560 0 7,170 0.3527 0 (0.1416) (0.1415) (0.0365) (0.0365) (0.8786) (0.8786) Mostly stock (1/0) 451 0.4812 0 545 0.5706 1 7,170 0.4711 0 (0.0048) (0.0049) (0.6792) (0.6792) (<.0001) (<.0001) Tender (1/0) 451 0.1774 0 545 0.1780 0 7,170 0.0852 0 (0.9804) (0.9805) (<.0001) (<.0001) (<.0001) (<.0001) Hostile (1/0) 451 0.0089 0 545 0.0110 0 7,170 0.0056 0 (0.7337) (0.7366) (0.4657) (0.3711) (0.2341) (0.1124) Same industry (1/0) 451 0.7894 1 545 0.7927 1 7,170 0.7803 1 (0.8315) (0.8315) (0.7348) (0.7348) (0.5023) (0.5023) Hi-tech bidder (1/0) 451 0.1042 0 545 0.1156 0 7,170 0.1102 0 (0.5688) (0.5687) (0.6942) (0.6942) (0.6976) (0.6976)
Target termination fee (1/0) 451 0.4235 0 545 0.5725 1 7,170 0.2778 0 (<.0001) (<.0001) (<.0001) (<.0001) (<.0001) (<.0001)
Toehold 451 1.7288 0.0000 545 1.0295 0.0000 7,170 1.0113 0.0000 (0.0809) (0.1057) (0.0311) (<.0001) (0.9406) (0.0303)
Private target (1/0) 451 0.3636 0 545 0.2147 0 7,170 0.4689 0 (<.0001) (0.0000) (<.0001) (<.0001) (<.0001) (<.0001)
No. competing acquirer 451 0.0288 0 545 0.0514 0 7,170 0.0192 0 (0.1042) (0.2532) (0.2373) (0.0665) (0.0056) (<.0001)
No. prior deals by acquirer 451 5.5876 2 545 5.3284 2 7,170 1.4078 0 (0.6640) (0.9777) (<.0001) (<.0001) (<.0001) (<.0001)
Premium (4-week) 202 0.5050 0.3882 332 0.4644 0.3770 2,085 0.4670 0.3572 (0.2955) (0.3635) (0.2649) (0.0419) (0.9250) (0.1910)
Acquirer assets/target assets 202 235.12 68.40 332 143.63 17.00 2,085 46.97 7.75 (0.0011) (<.0001) (<.0001) (<.0001) (<.0001) (<.0001)
Acquirer CAR [-1,+1] 451 0.0681 0.0445 545 -0.0864 -0.0612 7,170 0.0028 -0.0010 (<.0001) (<.0001) (<.0001) (<.0001) (<.0001) (<.0001)
Target CAR [-1,+1] 202 0.3266 0.2378 332 0.2223 0.1770 2,085 0.2234 0.1761 (0.0022) (0.0001) (0.0007) (<.0001) (0.9503) (0.4656)
Target CAR [-63,+126] 202 0.4525 0.3716 332 0.2796 0.2835 2,085 0.3539 0.3013 (0.0028) (0.0077) (0.0464) (0.0159) (0.0398) (0.2454)
CAR [-1,+1] synergy 202 0.0588 0.0445 332 -0.0547 -0.0368 2,085 0.0200 0.0119 (<.0001) (<.0001) (<.0001) (<.0001) (<.0001) (<.0001)
C&I loan spread 451 0.0262 -0.0013 545 0.0624 0.0012 7,170 -0.0479 -0.0488 (0.1604) (0.0437) (0.0002) (<.0001) (<.0001) (<.0001)
Panel B: Acquirer characteristics
Asset 451
56,779 13,279 545
49,749 14,725 7,170
10,301 651 (0.4828) (0.3459) (<.0001) (<.0001) (<.0001) (<.0001)
Market capitalization 451 58,669 24,474 545 49,851 22,995 7,170 4,392 642 (0.0686) (0.3126) (<.0001) (<.0001) (<.0001) (<.0001)
Herfindahl index 451 0.0837 0.0751 545 0.0846 0.0736 7,170 0.0403 0.0091 (0.8548) (0.9101) (<.0001) (<.0001) (<.0001) (<.0001)
Tobin's Q 451 5.3314 2.7924 545 4.4670 2.4742 7,170 2.3423 1.5253 (0.0130) (0.0099) (<.0001) (<.0001) (<.0001) (<.0001)
FCF/assets 437 0.0720 0.0961 531 0.0740 0.0842 6,822 -0.0127 0.0381 (0.8958) (0.5079) (<.0001) (<.0001) (<.0001) (<.0001)
Leverage (Book value) 437 0.2910 0.2524 531 0.2995 0.2582 6,822 0.3308 0.3068 (0.6192) (0.3553) (0.0037) (0.0020) (0.0084) (0.0306)

Leverage (Market value) 437 0.1336 0.0639 531 0.1443 0.0702 6,822 0.2139 0.1500 (0.3817) (0.1472) (<.0001) (<.0001) (<.0001) (<.0001)
Capex/assets 403 0.0557 0.0446 486 0.0502 0.0398 6,421 0.0440 0.0257 (0.0863) (0.0661) (<.0001) (<.0001) (0.0048) (<.0001)
R&D/assets 403 0.0686 0.0573 486 0.0579 0.0372 6,421 0.0396 0.0000 (0.0173) (0.0038) (<.0001) (<.0001) (<.0001) (<.0001)
Industry adjusted ROA 451 0.1783 0.1266 545 0.1542 0.1154 7,170 0.0644 0.0264 (0.0781) (0.0681) (<.0001) (<.0001) (<.0001) (<.0001)
Industry adjusted ROE 451 0.1727 0.1728 545 0.1576 0.1464 7,170 0.0447 0.0425 (0.4590) (0.1517) (<.0001) (<.0001) (<.0001) (<.0001)
Annual stock return 451 0.5456 0.3991 545 0.4610 0.3002 7,170 0.2818 0.1770 (0.0414) (0.0401) (<.0001) (<.0001) (<.0001) (<.0001)
Ind. Adj. annual stock return 451 0.4959 0.3366 545 0.4227 0.2445 7,170 0.2272 0.1098 (0.0616) (0.0318) (<.0001) (<.0001) (<.0001) (<.0001)
Pay for performance (log) 364 7.4465 7.0841 449 7.2581 7.0872 2,572 5.6740 5.6526 (0.1277) (0.3166) (<.0001) (<.0001) <.0001 (<.0001)
Option/total compensation 364 0.6115 0.6772 449 0.5800 0.6583 2,572 0.4283 0.4530 (0.1934) (0.2278) (<.0001) (<.0001) (<.0001) (<.0001)
Cash/total compensation 364 0.2990 0.2158 449 0.3003 0.2255 2,572 0.4584 0.4073 (0.9450) (0.7292) (<.0001) (<.0001) (<.0001) (<.0001)
CEO age 364 53.74 54.00 449 54.64 55.00 2,572 54.44 54.00 (0.0651) (0.0909) (0.0937) (0.1251) (0.5712) (0.5723)
CEO tenure 364 7.15 5.00 449 7.72 5.00 2,572 8.09 6.00 (0.2404) (0.3205) (0.0162) (0.0050) (0.3075) (0.0892) Abnormal cash compensation (log) 364 -0.1210 0.0803 449 -0.0849 0.0855 2,572 0.0250 0.0284 (0.7119) (0.8541) (0.0592) (0.6664) (0.0835) (0.3463) Abnormal equity compensation (log) 364 -0.0119 0.7026 449 -0.0474 0.7214 2,572 0.1596 0.9747 (0.8698) (0.7788) (0.2993) (0.0110) (0.1654) (0.0023) Abnormal total compensation (log) 364 0.0984 0.1719 449 0.0964 0.1824 2,572 0.0415 0.0357 (0.9819) (0.7822) (0.4234) (0.0013) (0.3274) (0.0015)
CEO holdings 364 0.0254 0.0008 449 0.0163 0.0009 2,572 0.0215 0.0036 (0.1467) (0.9430) (0.5009) (<.0001) (0.0670) (<.0001)
Institutional holdings 364 0.5361 0.5758 449 0.5577 0.5961 2,572 0.4105 0.3807 (0.1686) (0.1574) (<.0001) (<.0001) (<.0001) (<.0001)
Gindex 364 7.9790 8.0000 449 8.6102 9.0000 2,572 9.3410 9.0000 (0.0276) (0.0179) (<.0001) (<.0001) (0.0006) (<.0001)
Percent busy 364 0.4340 0.4444 449 0.4194 0.4286 2,572 0.2443 0.2000 (0.4593) (0.3623) (<.0001) (<.0001) (<.0001) (<.0001)
Blockholder (1/0) 364 0.5477 1.0000 449 0.5608 1.0000 2,572 0.5941 1.0000 (0.6974) (0.6973) (0.0679) (0.0679) (0.1506) (0.1506)
Panel C: Target characteristics
Assets 202 3177 265 332 7281 519 2,085 1335 128 (0.0843) (<.0001) (0.0925) (<.0001) (0.0065) (<.0001)
Leverage (Book value) 184 0.3219 0.2532 303 0.3049 0.2213 1,874 0.3509 0.3285 (0.5543) (0.7204) (0.2019) (0.0567) (0.0118) (0.0024)
Leverage (Market value) 184 0.1836 0.0967 303 0.1904 0.0930 1,876 0.2724 0.2107 (0.7498) (0.9725) (<.0001) (<.0001) (<.0001) (<.0001)
Tobin's Q 184 2.7306 1.8103 303 3.1188 1.9139 1,873 1.7427 1.2077 (0.2333) (0.6877) (<.0001) (<.0001) (<.0001) (<.0001)
Annual stock returns 184 0.2701 0.0929 303 0.3863 0.0697 1,891 0.1348 0.0456 (0.3144) (0.9046) (0.0684) (0.1956) (0.0066) (0.1140)
Industry adjusted ROA 184 0.0191 0.0247 303 0.0244 0.0306 1,747 0.0022 0.0012 (0.7677) (0.7616) (0.2517) (0.0071) (0.0596) (<.0001)
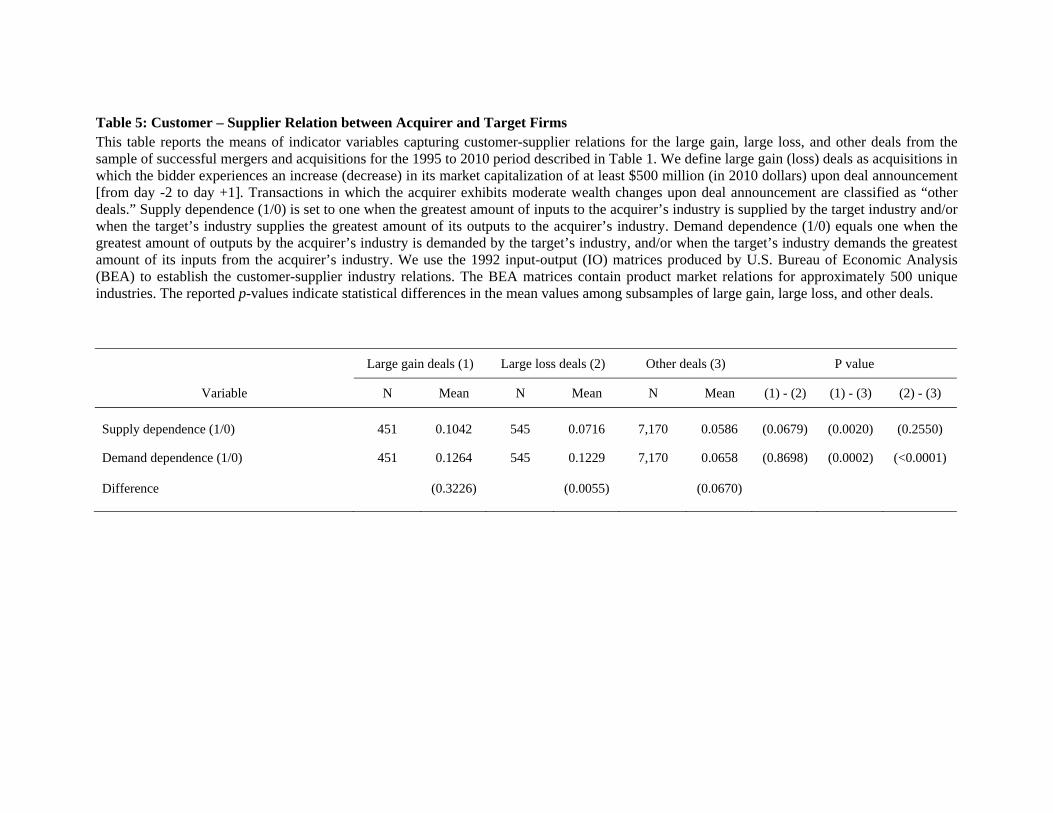
Table 5: Customer – Supplier Relation between Acquirer and Target Firms This table reports the means of indicator variables capturing customer-supplier relations for the large gain, large loss, and other deals from the sample of successful mergers and acquisitions for the 1995 to 2010 period described in Table 1. We define large gain (loss) deals as acquisitions in which the bidder experiences an increase (decrease) in its market capitalization of at least $500 million (in 2010 dollars) upon deal announcement [from day -2 to day +1]. Transactions in which the acquirer exhibits moderate wealth changes upon deal announcement are classified as “other deals.” Supply dependence (1/0) is set to one when the greatest amount of inputs to the acquirer’s industry is supplied by the target industry and/or when the target’s industry supplies the greatest amount of its outputs to the acquirer’s industry. Demand dependence (1/0) equals one when the greatest amount of outputs by the acquirer’s industry is demanded by the target’s industry, and/or when the target’s industry demands the greatest amount of its inputs from the acquirer’s industry. We use the 1992 input-output (IO) matrices produced by U.S. Bureau of Economic Analysis (BEA) to establish the customer-supplier industry relations. The BEA matrices contain product market relations for approximately 500 unique industries. The reported p-values indicate statistical differences in the mean values among subsamples of large gain, large loss, and other deals.
Large gain deals (1) Large loss deals (2) Other deals (3) P value
Variable N Mean N Mean N Mean (1) - (2) (1) - (3) (2) - (3)
Supply dependence (1/0) 451 0.1042 545 0.0716 7,170 0.0586 (0.0679) (0.0020) (0.2550)
Demand dependence (1/0) 451 0.1264 545 0.1229 7,170 0.0658 (0.8698) (0.0002) (<0.0001) Difference (0.3226) (0.0055) (0.0670)

Table 6: Analysis of Merger Waves This table reports the incidence of deals during merger waves (Panel A) and the change in market capitalization (in 2010 dollars) of deals announced inside and outside waves (Panel B) for our sample of completed mergers and acquisitions during the 1995 to 2010 period described in Table 1. We define large gain (loss) deals as acquisitions in which the bidder experiences an increase (decrease) in its market capitalization of at least $500 million (in 2008 dollars) upon deal announcement [from day -2 to day +1]. Transactions in which the acquirer exhibits moderate wealth changes upon deal announcement are classified as “other deals.” We define merger waves as in Harford (2005). In wave is an indicator variable equal to 1 if the transaction occurs during an industry merger wave (0 otherwise). The change in the bidders’ market capitalization upon deal announcement is estimated from day -2 to day +1. The p-values in Panel A indicate statistical differences in the mean values among the subsamples of large gain, large loss, and other deals. The p-values in Panel B indicate statistical differences in the mean and median values for large gain (loss) deals that occur inside or outside merger waves.
Panel A: Descriptive statistics for In wave (1/0)
Deals happen during merger waves (1/0)
Large Gain Deals (1) Large Loss Deals (2) Other Deals (3) p-value
N Mean N Mean N Mean (1) - (2) (1) - (3) (2) - (3)
Period 1995-1999 173 0.4971 150 0.5333 3,100 0.3758 (0.5174) (0.0014) (0.0001)Period 2000-2010 278 0.3129 395 0.3367 4,070 0.1791 (0.5183) (<0.0001) (<0.0001)
Total 451 545 7,170
Panel B: Change of market capitalization ($m) over three days around announcement (-2,+1)
Inside merger waves (1) Outside Merger waves (2) p-value (1) - (2)
N Mean Median N Mean Median Mean Median Large Gain Deals Period 1995-1999 86 5,113.10 1,457.58 87 1,475.17 1,014.72 (<0.0001) (0.0009)Period 2000-2010 87 5,510.62 1,781.16 191 1,957.99 1,192.07 (0.0006) (0.0083)Total 173 278 Large Loss Deals Period 1995-1999 80 -3,278.11 -1,111.87 70 -1,884.01 -1,006.20 (0.0218) (0.2406)Period 2000-2010 133 -4,958.13 -1,470.10 262 -2,345.01 -1,265.87 (0.0049) (0.0296)Total 213 332

Table 7: Logistics Regressions - Probability of Large Gain and Large Loss Deals This table shows the results from logistic regressions explaining the probability that a deal is classified as large gain, large loss, or other deal, respectively. In columns (1) and (2), the dependent variable equals one for deals that are classified as large gain deals and equals zero for all other deals in our sample. In columns (3) and (4), the dependent variable equals one for deals that are classified as large loss deals and equals zero for all other deals in our sample. In columns (5) and (6), the dependent variable equals one for deals that are classified as large gain deals or large loss deals, and equals zero for all other deals in our sample. Acquirer’s size is the natural logarithm of assets. Cash payment (1/0) is set to one when the transaction is structured as an all cash deal. All other variables are defined in prior tables. Robust standard errors are clustered by firm and year. We present p-values for two-sided tests of significance (from zero) below the coefficient estimates.
Large Gain Deals = 1, Large Loss Deals and
Other Deals= 0
Large Loss Deals = 1, Large Gain Deals and
Other Deals = 0
Large Gain Deals = 1 or Large Loss Deals = 1,
Other Deals = 0 (1) (2) (3) (4) (5) (6)
Intercept -4.44201 -4.16820 -3.82965 -4.10083 -4.66605 -5.02705 (<.0001) (<.0001) (<.0001) (<.0001) (<.0001) (<.0001)
Deal value -0.00001 0.00000 0.00004 0.00004 0.00004 0.00004 (0.0872) (0.6180) (<.0001) (<.0001) (0.0020) (0.0050)
Acquirer size 0.28721 0.25592 0.23497 0.26248 0.34417 0.36888 (<.0001) (<.0001) (<.0001) (<.0001) (<.0001) (<.0001)
Private target (1/0) 0.12059 -0.34122 -0.17041 (0.1220) (<.0001) (0.0270)
Acquirer asset/target asset 0.00213 0.00014 0.00154 (<.0001) (0.7610) (0.0010)
No. of competing acquirers -0.05496 -0.03952 (0.0946) 0.09457 (0.0542) 0.05733 (0.7000) (0.7700) (0.4360) (0.4770) (0.6610) (0.6690)
No. of prior deals by acquirer 0.01318 0.01463 0.01936 0.01317 0.03138 0.02632 (<.0001) (0.0280) (<.0001) (0.0580) (<.0001) (0.0270)
Herfindahl index (acquirer) 1.93478 1.46382 2.14870 1.61033 2.96175 2.28103 (<.0001) (0.0040) (<.0001) (<.0001) (<.0001) (<.0001)
Acquirer Tobin's Q 0.04261 0.03570 0.03765 0.12279 0.08977 0.21225 (0.0060) (0.0250) (<.0001) (<.0001) (0.0150) (<.0001)
Acquirer annual stock return 0.10489 0.11052 0.11689 -0.05887 0.12064 -0.06717 (<.0001) (<.0001) (<.0001) (0.2800) (0.0100) (0.0690)
Cash payment (1/0) -0.06138 -0.11485 -0.09451 -0.22677 -0.09963 -0.28626 (0.4330) (0.1670) (0.2190) (0.0030) (0.0520) (<.0001)
C&I loan spread -0.09751 -0.18681 0.28608 0.20062 0.06892 0.00849 (0.6220) (0.2520) (0.1590) (0.2960) (0.7540) (0.9640)
In wave (1/0) 0.18351 -0.12781 0.32080 0.24003 0.30021 0.12115 (0.2980) (0.3790) (0.0420) (0.1210) (0.1210) (0.4760)
Hostile (1/0) 0.00049 0.10587 -0.15415 -0.16316 -0.15335 -0.07909 (0.9990) (0.7020) (0.5440) (0.5140) (0.5110) (0.7490)
Tender (1/0) 0.25017 0.18856 0.16977 0.16511 0.26106 0.23937 (0.0440) (0.1560) (0.0810) (0.0990) (0.0020) (0.0150)
Supply dependence (1/0) 0.32215 0.35727 0.07145 0.09571 0.27987 0.26160 (<.0001) (0.0050) (0.5430) (0.4540) (0.0010) (0.0180)
Demand dependence (1/0) 0.27773 0.23349 0.24602 0.35288 0.36732 0.43403 (0.0160) (0.0080) (0.0060) (0.0030) (0.0030) (<.0001)
Total number of observations 8,166 2,619 8,166 2,619 8,166 2,619 Pseudo R-sq 0.1351 0.1353 0.1562 0.1936 0.3011 0.3405 P-value Chi-sq <.0001 <.0001 <.0001 <.0001 <.0001 <.0001

Table 8: Truncated Regressions - Predicted Change in Acquiring-Firm Shareholder Wealth This table presents the results from truncated regressions where the dependent variable is the change in market capitalization ($ mil) accruing to the acquiring firm during [-2,+1] window (as in Table VII). All variables are defined in prior tables. Heteroskedasticity robust p-values for two-sided tests of significance (from zero) are presented below the coefficients.
Sample of Large Gain Deals Sample of Large Loss Deals
Intercept -948753.0000 707061.0000 (<.0001) (<.0001)
Deal value 1.3435 -1.0079 (0.5991) (<.0001)
Acquirer size 75205.0000 -58195.0000 (<.0001) (<.0001)
Private target (1/0) 25867.0000 -25324.0000 (<.0001) (0.0003)
No. of competing acquirers -38100.0000 -989.9727 (<.0001) (0.8401)
No. of prior deals by acquirer -82.9151 -1330.9488 (0.8061) (<.0001)
Herfindahl index (acquirer) -14935.0000 -124632.0000 (<.0001) (<.0001)
Acquirer Tobin's Q 5158.3611 -2553.3950 (<.0001) (<.0001)
Acquirer annual stock return 14113.0000 -11335.0000 (0.0003) (<.0001)
Cash payment (1/0) -42504.0000 24062.0000 (<.0001) (<.0001)
C&I loan spread 103560.0000 -64622.0000 (<.0001) (<.0001)
In wave (1/0) 94178.0000 -52674.0000 (<.0001) (<.0001)
Hostile (1/0) -44810.0000 58420.0000 (<.0001) (<.0001)
Tender (1/0) 38653.0000 8739.8360 (<.0001) (0.0366)
Supply dependence (1/0) 10170.0000 -23115.0000 (<.0001) (<.0001)
Demand dependence (1/0) 40852.0000 -6237.5878 (<.0001) (0.3167)
Number of observations 451 545
Year and industry fixed effects Yes Yes
P-value Chi-sq <.0001 <.0001

Table 9: Quantile Regressions – Predicted Change in Acquiring Firm Shareholder Wealth This table reports median regressions of the change in market capitalization of acquiring firms during the [-2,+1] window relative to the announcement of the deal. All variables are defined in prior tables. Reported below the coefficient estimates are p-values for two-sided tests of significance (from zero).
Dependent Variable: Change in market cap ($ mil) of acquiring firm during [-2,+1] window
Whole sample
Sample without large gain
deals
Sample without large loss
deals
(1) (2) (3)
Intercept 20.4216 30.6621 13.1693
(0.3680) (0.0420) (0.4310)
Deal value -0.0572 -0.0867 0.0003
(0.0010) (<0.0001) (0.8360)
Acquirer size 2.1511 0.9227 1.2159
(0.0170) (0.2600) (<0.0001)
Private target (1/0) 0.3513 -0.1357 2.8074
(0.7490) (0.9330) (<0.0001)
No. of competing acquirers 0.2820 4.5686 -1.9466
(0.9720) (0.6240) (0.7660)
No. of prior deals by acquirer -1.4125 -4.6021 1.3613
(0.0680) (<0.0001) (0.1090)
Acquirer Herfindahl index 12.3540 6.1923 43.5909
(0.4670) (0.7320) (0.0750)
Acquirer Tobins' Q 0.3552 -3.9297 4.3520
(0.6600) (<0.0001) (0.0010)
Acquirer annual stock return 0.5543 1.1446 -0.2109
(0.1640) (0.1730) (0.7190)
Cash payment (1/0) 1.9125 0.9193 4.6487
(0.0520) (0.3990) (<0.0001)
C&I loan spread 2.5283 1.1555 6.2698
(0.6670) (0.8770) (0.2510)
In wave (1/0) -0.8364 -1.7367 -0.7443
(0.2390) (0.1790) (0.5040)
Hostile (1/0) 1.4278 10.0759 -12.4889
(0.9570) (0.5370) (0.3370)
Tender (1/0) 4.4268 5.7045 1.1705
(0.2050) (0.0750) (0.6270)
Supply dependence (1/0) -1.4585 -1.6669 0.2065
(0.4260) (0.4570) (0.9160)
Demand dependence (1/0) 2.2303 2.4199 5.0842
(0.2860) (0.0960) (0.0100)
Number of observations 8166 7715 7621
Pseudo R2 0.0109 0.0426 0.0031
Year and industry fixed effects Yes Yes Yes

Table 10: Analysis of Target Premiums This table reports the results from year and industry fixed-effects regressions where the dependent variable is the 4-week premium from SDC in columns (1) and (4), Target CAR [-1,+1] in columns (2) and (5), and Target CAR [-63,+126] in columns (3) and (6).Target size is the natural logarithm of assets. All other variables are defined in prior tables. Heteroskedaticity robust p-values for two-sided tests of significance from zero are in parentheses.
(1) (2) (3) (4) (5) (6)
Intercept 0.6519 0.3674 1.4757 0.6511 0.3569 1.4478
(0.0010) (0.0000) (0.0350) (0.0010) (0.0000) (0.0350)
Large Gain Deal (1/0) 0.0759 0.0941 0.1518
(0.0210) (0.0020) (0.0020)
Large Loss Deal (1/0) 0.0433 0.0268 -0.0062
(0.0740) (0.2130) (0.8650)
Cash payment (1/0) -0.0076 0.0287 0.0042 -0.0032 0.0343 0.0131
(0.7240) (0.0890) (0.8900) (0.8810) (0.0450) (0.6660)
Tender (1/0) 0.0528 0.0744 0.0783 0.0531 0.0751 0.0801
(0.0440) (<.0001) (0.0220) (0.0430) (<.0001) (0.0190)
Hostile (1/0) 0.1656 0.0948 0.0242 0.1659 0.0946 0.0212
(0.0080) (0.0250) (0.7400) (0.0060) (0.0240) (0.7540)
Toehold 0.0034 -0.0013 -0.0027 0.0034 -0.0013 -0.0026
(0.3170) (0.2530) (0.4380) (0.3110) (0.2600) (0.4400)
Same industry (1/0) 0.0638 0.0352 0.1074 0.0626 0.0338 0.1049
(0.0050) (0.0240) (0.0010) (0.0060) (0.0310) (0.0010) Target termination fee (1/0) -0.0045 0.0029 0.0221 -0.0049 0.0033 0.0238
(0.8300) (0.8560) (0.4840) (0.8140) (0.8360) (0.4530)
Target size -0.0454 -0.0236 -0.0166 -0.0468 -0.0238 -0.0135
(<.0001) (<.0001) (0.0600) (<.0001) (<.0001) (0.1400)
Target Tobin's Q -0.0871 -0.0727 -0.1929 -0.0888 -0.0709 -0.1828
(<.0001) (<.0001) (<.0001) (<.0001) (<.0001) (<.0001) Target annual stock return 0.0023 -0.0120 -0.1747 0.0021 -0.0121 -0.1750
(0.8000) (0.0230) (<.0001) (0.8080) (0.0190) (<.0001)
Target leverage 0.0252 -0.0355 -0.0691 0.0302 -0.0310 -0.0664
(0.5010) (0.1390) (0.2400) (0.4190) (0.1940) (0.2550)
Target ROA 0.0000 0.0001 -0.0002 -0.0001 0.0000 -0.0003
(0.9390) (0.8540) (0.7640) (0.8580) (0.9430) (0.7270)
Number of observations 2155 2155 2155 2155 2155 2155
Adj R2 0.1244 0.1392 0.2076 0.1231 0.1327 0.2031
Industry fixed effects Yes Yes Yes Yes Yes Yes
P-value of F test <.0001 <.0001 <.0001 <.0001 <.0001 <.0001