Embed Size (px)
DESCRIPTION
indian stock market wealth creation study 2011
Citation preview
Raamdeo Agrawal ([email protected]) / Shrinath Mithanthaya ([email protected])
We thank Mr Dhruv Mehta ([email protected]), Investment Consultant, for his invaluable contribution to this report.
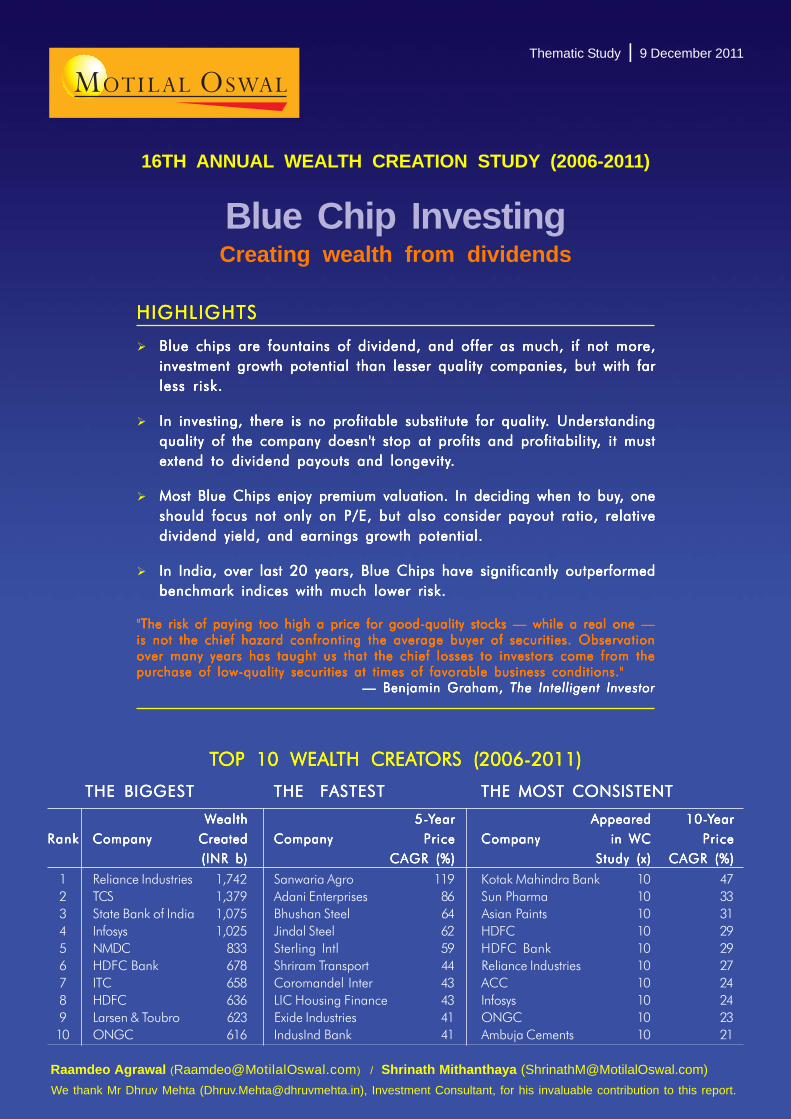
THE BIGGESTTHE BIGGESTTHE BIGGESTTHE BIGGESTTHE BIGGEST THE FASTESTTHE FASTESTTHE FASTESTTHE FASTESTTHE FASTEST THE MOST CONSISTENTTHE MOST CONSISTENTTHE MOST CONSISTENTTHE MOST CONSISTENTTHE MOST CONSISTENT
WWWWWealthealthealthealthealth 5-5-5-5-5-YYYYYearearearearear AppearedAppearedAppearedAppearedAppeared 10-10-10-10-10-YYYYYearearearearear
RankRankRankRankRank CompanyCompanyCompanyCompanyCompany CreatedCreatedCreatedCreatedCreated CompanyCompanyCompanyCompanyCompany PricePricePricePricePrice CompanyCompanyCompanyCompanyCompany in WCin WCin WCin WCin WC PricePricePricePricePrice
(INR b)(INR b)(INR b)(INR b)(INR b) CAGR (%)CAGR (%)CAGR (%)CAGR (%)CAGR (%) Study (x)Study (x)Study (x)Study (x)Study (x) CAGR (%)CAGR (%)CAGR (%)CAGR (%)CAGR (%)
1 Reliance Industries 1,742 Sanwaria Agro 119 Kotak Mahindra Bank 10 472 TCS 1,379 Adani Enterprises 86 Sun Pharma 10 333 State Bank of India 1,075 Bhushan Steel 64 Asian Paints 10 314 Infosys 1,025 Jindal Steel 62 HDFC 10 295 NMDC 833 Sterling Intl 59 HDFC Bank 10 296 HDFC Bank 678 Shriram Transport 44 Reliance Industries 10 277 ITC 658 Coromandel Inter 43 ACC 10 248 HDFC 636 LIC Housing Finance 43 Infosys 10 249 Larsen & Toubro 623 Exide Industries 41 ONGC 10 2310 ONGC 616 IndusInd Bank 41 Ambuja Cements 10 21
TTTTTOP 10 WEALOP 10 WEALOP 10 WEALOP 10 WEALOP 10 WEALTH CREATH CREATH CREATH CREATH CREATTTTTORS (2006-2011)ORS (2006-2011)ORS (2006-2011)ORS (2006-2011)ORS (2006-2011)
Thematic Study | 9 December 2011
Creating wealth from dividends
16TH ANNUAL WEALTH CREATION STUDY (2006-2011)
HIGHLIGHTSHIGHLIGHTSHIGHLIGHTSHIGHLIGHTSHIGHLIGHTS
Blue chips are fountains of dividend, and offer as much, if not more,Blue chips are fountains of dividend, and offer as much, if not more,Blue chips are fountains of dividend, and offer as much, if not more,Blue chips are fountains of dividend, and offer as much, if not more,Blue chips are fountains of dividend, and offer as much, if not more,investment growth potential than lesser quality companies, but with farinvestment growth potential than lesser quality companies, but with farinvestment growth potential than lesser quality companies, but with farinvestment growth potential than lesser quality companies, but with farinvestment growth potential than lesser quality companies, but with farless risk.less risk.less risk.less risk.less risk.
In investingIn investingIn investingIn investingIn investing, there is no profitable substitute for quality, there is no profitable substitute for quality, there is no profitable substitute for quality, there is no profitable substitute for quality, there is no profitable substitute for quality. Understanding. Understanding. Understanding. Understanding. Understandingquality of the company doesn't stop at profits and profitabilityquality of the company doesn't stop at profits and profitabilityquality of the company doesn't stop at profits and profitabilityquality of the company doesn't stop at profits and profitabilityquality of the company doesn't stop at profits and profitability, it must, it must, it must, it must, it mustextend to dividend payouts and longevityextend to dividend payouts and longevityextend to dividend payouts and longevityextend to dividend payouts and longevityextend to dividend payouts and longevity.....
Most Blue Chips enjoy premium valuation. In deciding when to buyMost Blue Chips enjoy premium valuation. In deciding when to buyMost Blue Chips enjoy premium valuation. In deciding when to buyMost Blue Chips enjoy premium valuation. In deciding when to buyMost Blue Chips enjoy premium valuation. In deciding when to buy, one, one, one, one, oneshould focus not only on P/E, but also consider payout ratio, relativeshould focus not only on P/E, but also consider payout ratio, relativeshould focus not only on P/E, but also consider payout ratio, relativeshould focus not only on P/E, but also consider payout ratio, relativeshould focus not only on P/E, but also consider payout ratio, relativedividend yield, and earnings growth potential.dividend yield, and earnings growth potential.dividend yield, and earnings growth potential.dividend yield, and earnings growth potential.dividend yield, and earnings growth potential.
In India, over last 20 years, Blue Chips have significantly outperformedIn India, over last 20 years, Blue Chips have significantly outperformedIn India, over last 20 years, Blue Chips have significantly outperformedIn India, over last 20 years, Blue Chips have significantly outperformedIn India, over last 20 years, Blue Chips have significantly outperformedbenchmark indices with much lower risk.benchmark indices with much lower risk.benchmark indices with much lower risk.benchmark indices with much lower risk.benchmark indices with much lower risk.
Blue Chip Investing
"The risk of paying too high a price for good-quality stocks — while a real one —"The risk of paying too high a price for good-quality stocks — while a real one —"The risk of paying too high a price for good-quality stocks — while a real one —"The risk of paying too high a price for good-quality stocks — while a real one —"The risk of paying too high a price for good-quality stocks — while a real one —is not the chief hazard confronting the average buyer of securities. Observationis not the chief hazard confronting the average buyer of securities. Observationis not the chief hazard confronting the average buyer of securities. Observationis not the chief hazard confronting the average buyer of securities. Observationis not the chief hazard confronting the average buyer of securities. Observationover many years has taught us that the chief losses to investors come from theover many years has taught us that the chief losses to investors come from theover many years has taught us that the chief losses to investors come from theover many years has taught us that the chief losses to investors come from theover many years has taught us that the chief losses to investors come from thepurchase of low-quality securities at times of favorable business conditions."purchase of low-quality securities at times of favorable business conditions."purchase of low-quality securities at times of favorable business conditions."purchase of low-quality securities at times of favorable business conditions."purchase of low-quality securities at times of favorable business conditions."
— Benjamin Graham, — Benjamin Graham, — Benjamin Graham, — Benjamin Graham, — Benjamin Graham, The Intelligent InvestorThe Intelligent InvestorThe Intelligent InvestorThe Intelligent InvestorThe Intelligent Investor
29 December 2011
Wealth Creation Study 2006-2011
Contents
Objective, Concept and Methodology ........................................................................ 1
Wealth Creation Study 2006-2011: Findings ......................................................... 2-15
Theme 2012: Blue Chip Investing ....................................................................... 16-37
Market Outlook .................................................................................................... 38-40
Appendix I: MOSL 100 – Biggest Wealth Creators .......................................... 41-42
Appendix II: MOSL 100 – Fastest Wealth Creators ......................................... 43-44
Appendix III: MOSL 100 – Wealth Creators (alphabetical) .............................. 45-46
Abbreviations and Terms used in this report
ABBREVIATION / TERM DESCRIPTION
2006, 2011, etc Reference to years for India are financial year ending March, unless otherwise stated
Avg Average
CAGR Compound Annual Growth Rate; All CAGR calculations are for 2005 to 2010unless otherwise stated
L to P / P to L Loss to Profit / Profit to Loss. In such cases, calculation of PAT CAGR is not possible
Price CAGR In the case of aggregates, Price CAGR refers to Market Cap CAGR
INR b Indian Rupees in billion
WC Wealth Creation / Wealth Created
Wealth Created Increase in Market Capitalization over the last 5 years, duly adjusted for corporateevents such as fresh equity issuance, mergers, demergers, share buybacks, etc.
19 December 2011
Wealth Creation Study 2006-2011 Findings
Wealth Creation Study 2006-2011
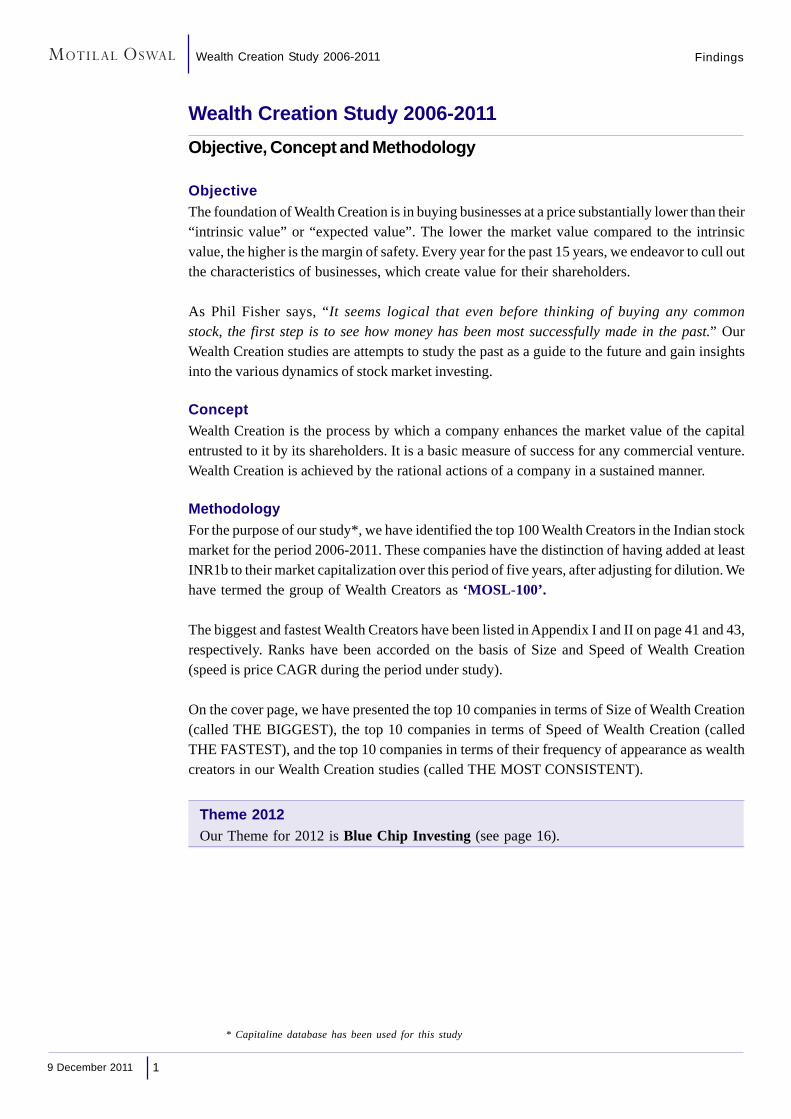
Objective, Concept and Methodology
Objective
The foundation of Wealth Creation is in buying businesses at a price substantially lower than their“intrinsic value” or “expected value”. The lower the market value compared to the intrinsicvalue, the higher is the margin of safety. Every year for the past 15 years, we endeavor to cull outthe characteristics of businesses, which create value for their shareholders.
As Phil Fisher says, “It seems logical that even before thinking of buying any commonstock, the first step is to see how money has been most successfully made in the past.” OurWealth Creation studies are attempts to study the past as a guide to the future and gain insightsinto the various dynamics of stock market investing.
Concept
Wealth Creation is the process by which a company enhances the market value of the capitalentrusted to it by its shareholders. It is a basic measure of success for any commercial venture.Wealth Creation is achieved by the rational actions of a company in a sustained manner.
Methodology
For the purpose of our study*, we have identified the top 100 Wealth Creators in the Indian stockmarket for the period 2006-2011. These companies have the distinction of having added at leastINR1b to their market capitalization over this period of five years, after adjusting for dilution. Wehave termed the group of Wealth Creators as ‘MOSL-100’.
The biggest and fastest Wealth Creators have been listed in Appendix I and II on page 41 and 43,respectively. Ranks have been accorded on the basis of Size and Speed of Wealth Creation(speed is price CAGR during the period under study).
On the cover page, we have presented the top 10 companies in terms of Size of Wealth Creation(called THE BIGGEST), the top 10 companies in terms of Speed of Wealth Creation (calledTHE FASTEST), and the top 10 companies in terms of their frequency of appearance as wealthcreators in our Wealth Creation studies (called THE MOST CONSISTENT).
Theme 2012
Our Theme for 2012 is Blue Chip Investing (see page 16).
* Capitaline database has been used for this study
29 December 2011
Wealth Creation Study 2006-2011 Findings
Wealth Creation
2006-2011
The 16TH Annual Study
Findings
39 December 2011
Wealth Creation Study 2006-2011 Findings
The Biggest Wealth Creators
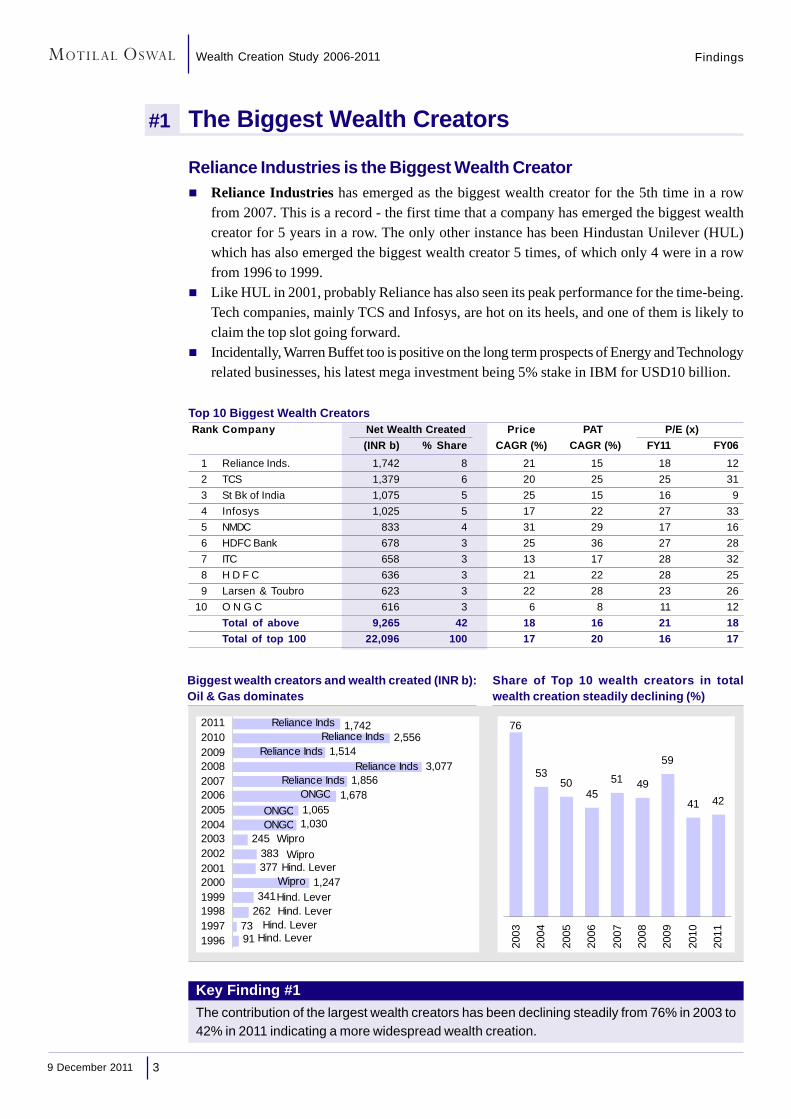
Reliance Industries is the Biggest Wealth Creator Reliance Industries has emerged as the biggest wealth creator for the 5th time in a row
from 2007. This is a record - the first time that a company has emerged the biggest wealthcreator for 5 years in a row. The only other instance has been Hindustan Unilever (HUL)which has also emerged the biggest wealth creator 5 times, of which only 4 were in a rowfrom 1996 to 1999.
Like HUL in 2001, probably Reliance has also seen its peak performance for the time-being.Tech companies, mainly TCS and Infosys, are hot on its heels, and one of them is likely toclaim the top slot going forward.
Incidentally, Warren Buffet too is positive on the long term prospects of Energy and Technologyrelated businesses, his latest mega investment being 5% stake in IBM for USD10 billion.
Top 10 Biggest Wealth Creators Rank Company Net Wealth Created Price PAT P/E (x)
(INR b) % Share CAGR (%) CAGR (%) FY11 FY06
1 Reliance Inds. 1,742 8 21 15 18 12
2 TCS 1,379 6 20 25 25 31
3 St Bk of India 1,075 5 25 15 16 9
4 Infosys 1,025 5 17 22 27 33
5 NMDC 833 4 31 29 17 16
6 HDFC Bank 678 3 25 36 27 28
7 ITC 658 3 13 17 28 32
8 H D F C 636 3 21 22 28 25
9 Larsen & Toubro 623 3 22 28 23 26
10 O N G C 616 3 6 8 11 12
Total of above 9,265 42 18 16 21 18
Total of top 100 22,096 100 17 20 16 17
Biggest wealth creators and wealth created (INR b):Oil & Gas dominates
Share of Top 10 wealth creators in totalwealth creation steadily declining (%)
73262341
1,247377383
2451,0301,065
1,6781,856
3,0771,514
2,5561,742
911996199719981999200020012002200320042005200620072008200920102011
Reliance Inds
Reliance Inds
Reliance Inds
ONGC
ONGCONGC
Wipro
WiproHind. Lever
Wipro
Hind. LeverHind. Lever
Hind. LeverHind. Lever
Reliance Inds
Reliance Inds 76
5350
4551 49
59
41 42
2003
2004
2005
2006
2007
2008
2009
2010
2011
#1
Key Finding #1
The contribution of the largest wealth creators has been declining steadily from 76% in 2003 to42% in 2011 indicating a more widespread wealth creation.
49 December 2011
Wealth Creation Study 2006-2011 Findings
The Fastest Wealth Creators
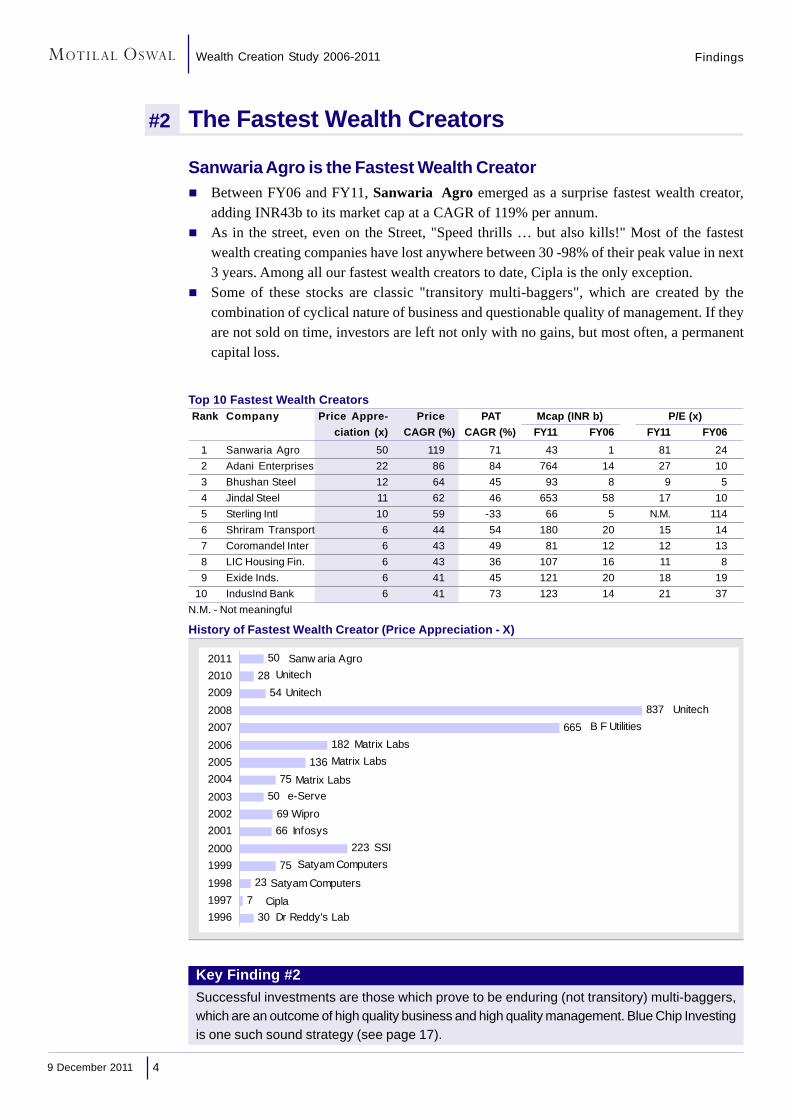
Sanwaria Agro is the Fastest Wealth Creator Between FY06 and FY11, Sanwaria Agro emerged as a surprise fastest wealth creator,
adding INR43b to its market cap at a CAGR of 119% per annum. As in the street, even on the Street, "Speed thrills … but also kills!" Most of the fastest
wealth creating companies have lost anywhere between 30 -98% of their peak value in next3 years. Among all our fastest wealth creators to date, Cipla is the only exception.
Some of these stocks are classic "transitory multi-baggers", which are created by thecombination of cyclical nature of business and questionable quality of management. If theyare not sold on time, investors are left not only with no gains, but most often, a permanentcapital loss.
Top 10 Fastest Wealth Creators Rank Company Price Appre- Price PAT Mcap (INR b) P/E (x)
ciation (x) CAGR (%) CAGR (%) FY11 FY06 FY11 FY06
1 Sanwaria Agro 50 119 71 43 1 81 24
2 Adani Enterprises 22 86 84 764 14 27 10
3 Bhushan Steel 12 64 45 93 8 9 5
4 Jindal Steel 11 62 46 653 58 17 10
5 Sterling Intl 10 59 -33 66 5 N.M. 114
6 Shriram Transport 6 44 54 180 20 15 14
7 Coromandel Inter 6 43 49 81 12 12 13
8 LIC Housing Fin. 6 43 36 107 16 11 8
9 Exide Inds. 6 41 45 121 20 18 19
10 IndusInd Bank 6 41 73 123 14 21 37
N.M. - Not meaningful
History of Fastest Wealth Creator (Price Appreciation - X)
30
7
23
75
223
66
69
50
75
136
182
665
837
54
28
50
1996
1997
1998
1999
2000
2001
2002
2003
2004
2005
2006
2007
2008
2009
2010
2011
Unitech
Unitech
Unitech
B F Utilities
Matrix Labs
Matrix Labs
Matrix Labs
e-Serve
Wipro
Infosys
SSI
Satyam Computers
Satyam Computers
Cipla
Dr Reddy's Lab
Sanw aria Agro
Key Finding #2
Successful investments are those which prove to be enduring (not transitory) multi-baggers,
which are an outcome of high quality business and high quality management. Blue Chip Investing
is one such sound strategy (see page 17).
#2
59 December 2011
Wealth Creation Study 2006-2011 Findings
Most Consistent Wealth Creators
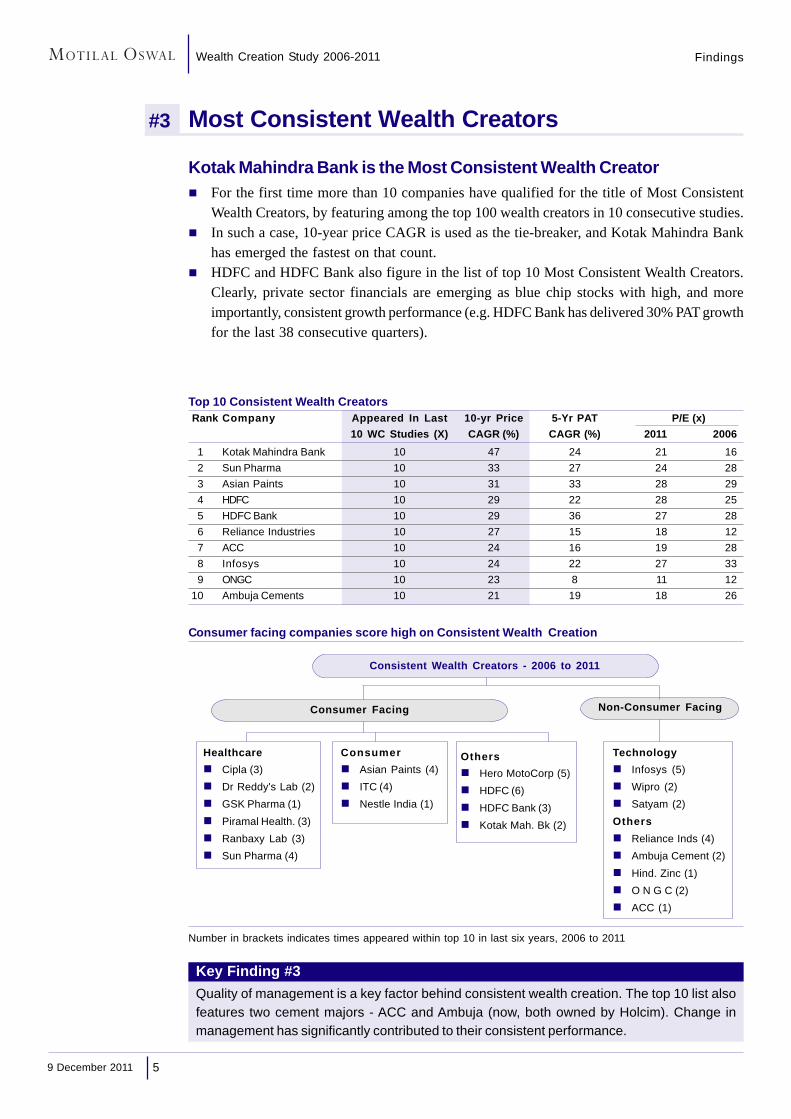
Kotak Mahindra Bank is the Most Consistent Wealth Creator For the first time more than 10 companies have qualified for the title of Most Consistent
Wealth Creators, by featuring among the top 100 wealth creators in 10 consecutive studies. In such a case, 10-year price CAGR is used as the tie-breaker, and Kotak Mahindra Bank
has emerged the fastest on that count. HDFC and HDFC Bank also figure in the list of top 10 Most Consistent Wealth Creators.
Clearly, private sector financials are emerging as blue chip stocks with high, and moreimportantly, consistent growth performance (e.g. HDFC Bank has delivered 30% PAT growthfor the last 38 consecutive quarters).
#3
Key Finding #3
Quality of management is a key factor behind consistent wealth creation. The top 10 list also
features two cement majors - ACC and Ambuja (now, both owned by Holcim). Change inmanagement has significantly contributed to their consistent performance.
Top 10 Consistent Wealth Creators Rank Company Appeared In Last 10-yr Price 5-Yr PAT P/E (x)
10 WC Studies (X) CAGR (%) CAGR (%) 2011 2006
1 Kotak Mahindra Bank 10 47 24 21 16
2 Sun Pharma 10 33 27 24 28
3 Asian Paints 10 31 33 28 29
4 HDFC 10 29 22 28 25
5 HDFC Bank 10 29 36 27 28
6 Reliance Industries 10 27 15 18 12
7 ACC 10 24 16 19 28
8 Infosys 10 24 22 27 33
9 ONGC 10 23 8 11 12
10 Ambuja Cements 10 21 19 18 26
Consumer facing companies score high on Consistent Wealth Creation
Others
Hero MotoCorp (5)
HDFC (6)
HDFC Bank (3)
Kotak Mah. Bk (2)
Healthcare
Cipla (3)
Dr Reddy's Lab (2)
GSK Pharma (1)
Piramal Health. (3)
Ranbaxy Lab (3)
Sun Pharma (4)
Consumer
Asian Paints (4)
ITC (4)
Nestle India (1)
Technology
Infosys (5)
Wipro (2)
Satyam (2)
Others
Reliance Inds (4)
Ambuja Cement (2)
Hind. Zinc (1)
O N G C (2)
ACC (1)
Consistent Wealth Creators - 2006 to 2011
Non-Consumer FacingConsumer Facing
Number in brackets indicates times appeared within top 10 in last six years, 2006 to 2011
69 December 2011
Wealth Creation Study 2006-2011 Findings
Wealth Creators (Wealthex) v/s BSE Sensex
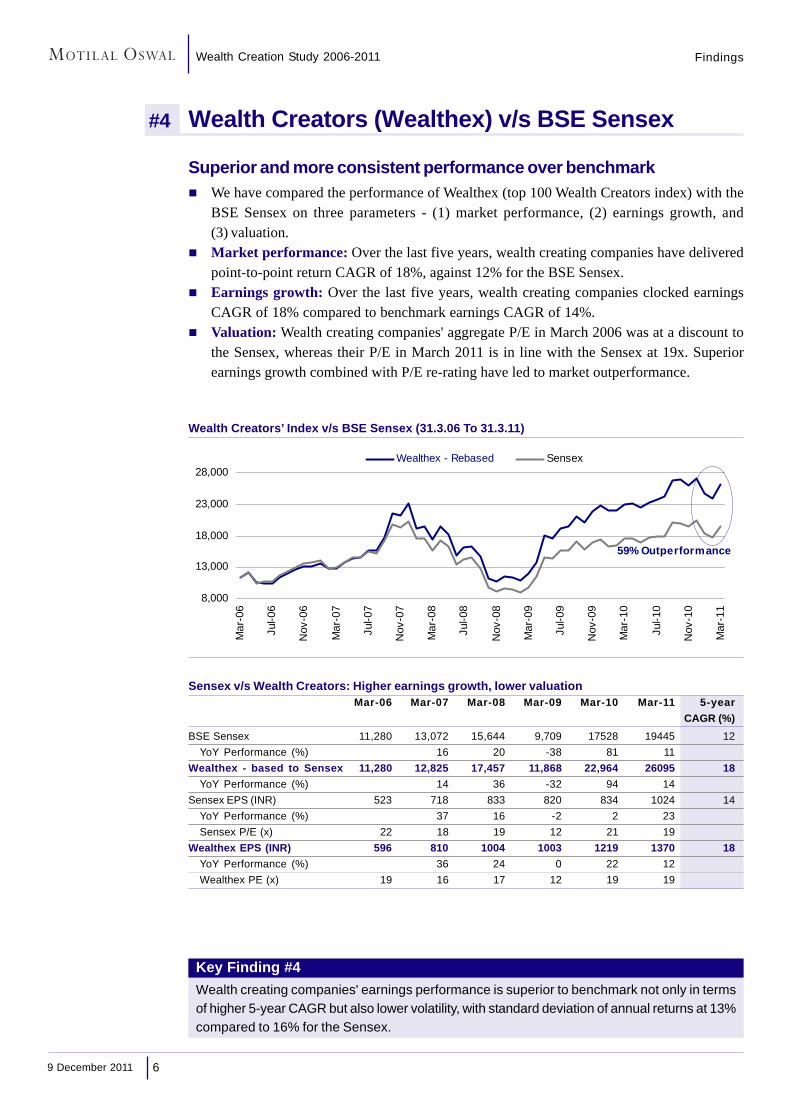
Superior and more consistent performance over benchmark We have compared the performance of Wealthex (top 100 Wealth Creators index) with the
BSE Sensex on three parameters - (1) market performance, (2) earnings growth, and(3) valuation.
Market performance: Over the last five years, wealth creating companies have deliveredpoint-to-point return CAGR of 18%, against 12% for the BSE Sensex.
Earnings growth: Over the last five years, wealth creating companies clocked earningsCAGR of 18% compared to benchmark earnings CAGR of 14%.
Valuation: Wealth creating companies' aggregate P/E in March 2006 was at a discount tothe Sensex, whereas their P/E in March 2011 is in line with the Sensex at 19x. Superiorearnings growth combined with P/E re-rating have led to market outperformance.
#4
Key Finding #4
Wealth creating companies' earnings performance is superior to benchmark not only in terms
of higher 5-year CAGR but also lower volatility, with standard deviation of annual returns at 13%
compared to 16% for the Sensex.
Wealth Creators’ Index v/s BSE Sensex (31.3.06 To 31.3.11)
8,000
13,000
18,000
23,000
28,000
Mar
-06
Jul-0
6
Nov
-06
Mar
-07
Jul-0
7
Nov
-07
Mar
-08
Jul-0
8
Nov
-08
Mar
-09
Jul-0
9
Nov
-09
Mar
-10
Jul-1
0
Nov
-10
Mar
-11
Wealthex - Rebased Sensex
59% Outperformance
Sensex v/s Wealth Creators: Higher earnings growth, lower valuationMar-06 Mar-07 Mar-08 Mar-09 Mar-10 Mar-11 5-year
CAGR (%)
BSE Sensex 11,280 13,072 15,644 9,709 17528 19445 12
YoY Performance (%) 16 20 -38 81 11
Wealthex - based to Sensex 11,280 12,825 17,457 11,868 22,964 26095 18
YoY Performance (%) 14 36 -32 94 14
Sensex EPS (INR) 523 718 833 820 834 1024 14
YoY Performance (%) 37 16 -2 2 23
Sensex P/E (x) 22 18 19 12 21 19
Wealthex EPS (INR) 596 810 1004 1003 1219 1370 18
YoY Performance (%) 36 24 0 22 12
Wealthex PE (x) 19 16 17 12 19 19
79 December 2011
Wealth Creation Study 2006-2011 Findings
Wealth Creation Classification by Industry
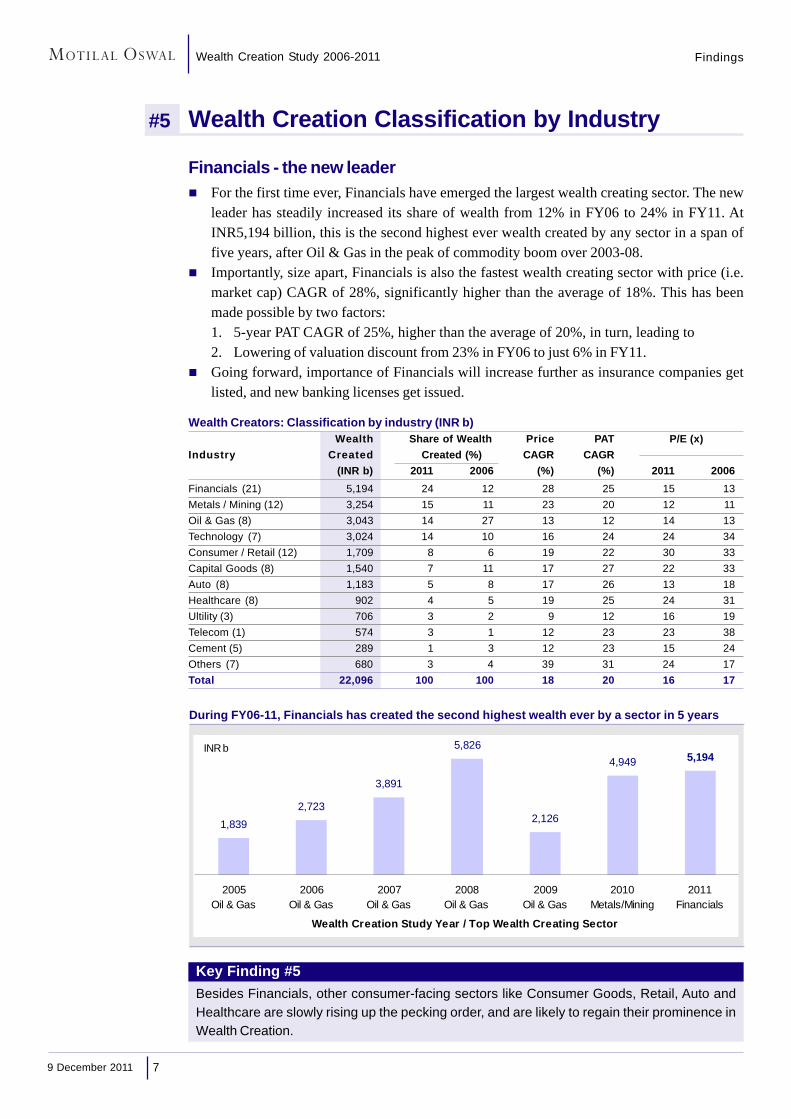
Financials - the new leader For the first time ever, Financials have emerged the largest wealth creating sector. The new
leader has steadily increased its share of wealth from 12% in FY06 to 24% in FY11. AtINR5,194 billion, this is the second highest ever wealth created by any sector in a span offive years, after Oil & Gas in the peak of commodity boom over 2003-08.
Importantly, size apart, Financials is also the fastest wealth creating sector with price (i.e.market cap) CAGR of 28%, significantly higher than the average of 18%. This has beenmade possible by two factors:1. 5-year PAT CAGR of 25%, higher than the average of 20%, in turn, leading to2. Lowering of valuation discount from 23% in FY06 to just 6% in FY11.
Going forward, importance of Financials will increase further as insurance companies getlisted, and new banking licenses get issued.
#5
Key Finding #5
Besides Financials, other consumer-facing sectors like Consumer Goods, Retail, Auto and
Healthcare are slowly rising up the pecking order, and are likely to regain their prominence inWealth Creation.
Wealth Creators: Classification by industry (INR b)Wealth Share of Wealth Price PAT P/E (x)
Industry Created Created (%) CAGR CAGR
(INR b) 2011 2006 (%) (%) 2011 2006
Financials (21) 5,194 24 12 28 25 15 13
Metals / Mining (12) 3,254 15 11 23 20 12 11
Oil & Gas (8) 3,043 14 27 13 12 14 13
Technology (7) 3,024 14 10 16 24 24 34
Consumer / Retail (12) 1,709 8 6 19 22 30 33
Capital Goods (8) 1,540 7 11 17 27 22 33
Auto (8) 1,183 5 8 17 26 13 18
Healthcare (8) 902 4 5 19 25 24 31
Ultility (3) 706 3 2 9 12 16 19
Telecom (1) 574 3 1 12 23 23 38
Cement (5) 289 1 3 12 23 15 24
Others (7) 680 3 4 39 31 24 17
Total 22,096 100 100 18 20 16 17
During FY06-11, Financials has created the second highest wealth ever by a sector in 5 years
4,949
2,126
5,826
3,891
2,723
1,839
5,194
2011Financials
2010Metals/Mining
2009Oil & Gas
2008Oil & Gas
2007Oil & Gas
2006Oil & Gas
2005Oil & Gas
Wealth Creation Study Year / Top Wealth Creating Sector
INR b
89 December 2011
Wealth Creation Study 2006-2011 Findings
Wealth Creators by ownership: PSU v/s Private
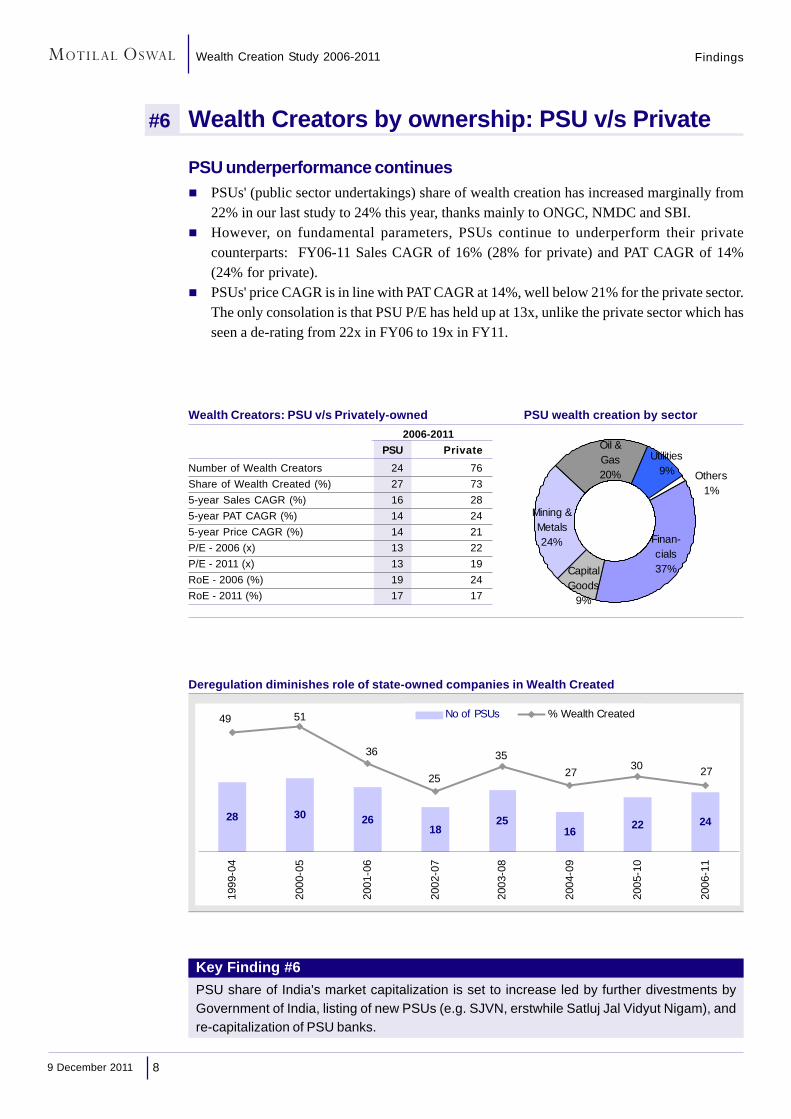
PSU underperformance continues PSUs' (public sector undertakings) share of wealth creation has increased marginally from
22% in our last study to 24% this year, thanks mainly to ONGC, NMDC and SBI. However, on fundamental parameters, PSUs continue to underperform their private
counterparts: FY06-11 Sales CAGR of 16% (28% for private) and PAT CAGR of 14%(24% for private).
PSUs' price CAGR is in line with PAT CAGR at 14%, well below 21% for the private sector.The only consolation is that PSU P/E has held up at 13x, unlike the private sector which hasseen a de-rating from 22x in FY06 to 19x in FY11.
#6
Key Finding #6
PSU share of India's market capitalization is set to increase led by further divestments by
Government of India, listing of new PSUs (e.g. SJVN, erstwhile Satluj Jal Vidyut Nigam), and
re-capitalization of PSU banks.
Wealth Creators: PSU v/s Privately-owned PSU wealth creation by sector
2006-2011
PSU Private
Number of Wealth Creators 24 76
Share of Wealth Created (%) 27 73
5-year Sales CAGR (%) 16 28
5-year PAT CAGR (%) 14 24
5-year Price CAGR (%) 14 21
P/E - 2006 (x) 13 22
P/E - 2011 (x) 13 19
RoE - 2006 (%) 19 24
RoE - 2011 (%) 17 17
Mining & Metals24%
Capital Goods
9%
Finan-cials37%
Others1%
Utilities9%
Oil & Gas20%
Deregulation diminishes role of state-owned companies in Wealth Created
2818
2516
24222630
49 51
36
25
35
27 2730
1999
-04
2000
-05
2001
-06
2002
-07
2003
-08
2004
-09
2005
-10
2006
-11
No of PSUs % Wealth Created
99 December 2011
Wealth Creation Study 2006-2011 Findings
Wealth Creators by Age Group and Market Cap
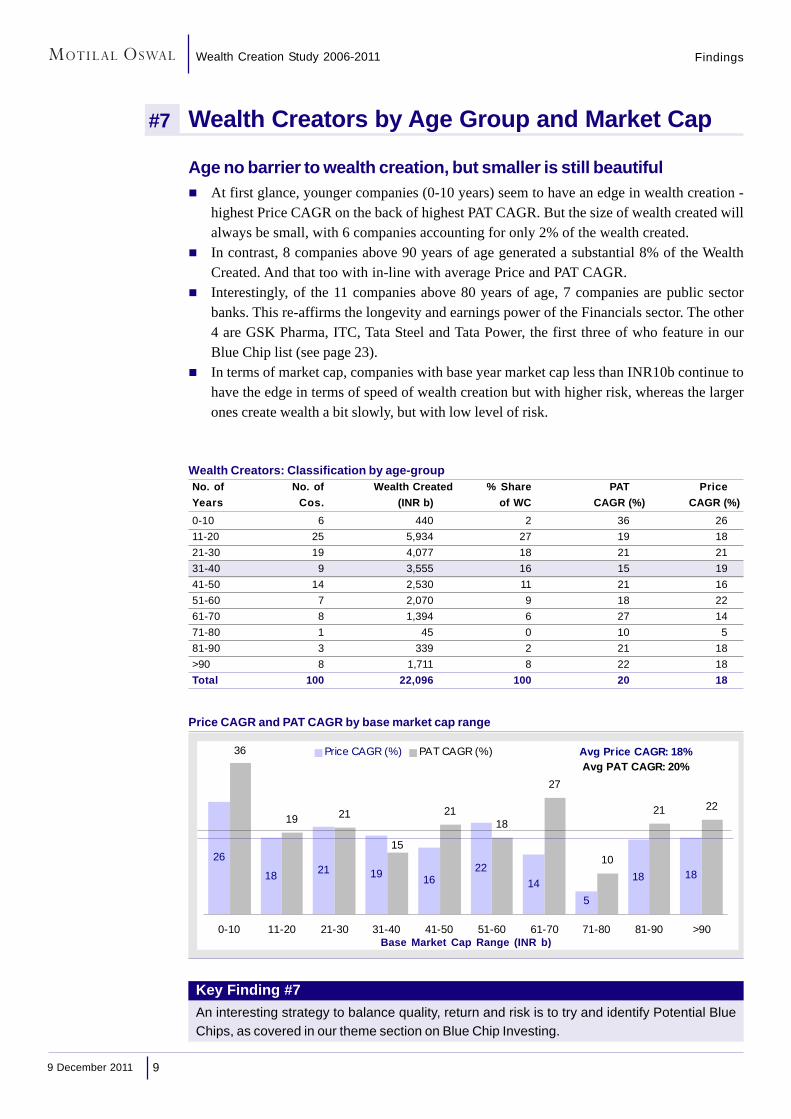
Age no barrier to wealth creation, but smaller is still beautiful At first glance, younger companies (0-10 years) seem to have an edge in wealth creation -
highest Price CAGR on the back of highest PAT CAGR. But the size of wealth created willalways be small, with 6 companies accounting for only 2% of the wealth created.
In contrast, 8 companies above 90 years of age generated a substantial 8% of the WealthCreated. And that too with in-line with average Price and PAT CAGR.
Interestingly, of the 11 companies above 80 years of age, 7 companies are public sectorbanks. This re-affirms the longevity and earnings power of the Financials sector. The other4 are GSK Pharma, ITC, Tata Steel and Tata Power, the first three of who feature in ourBlue Chip list (see page 23).
In terms of market cap, companies with base year market cap less than INR10b continue tohave the edge in terms of speed of wealth creation but with higher risk, whereas the largerones create wealth a bit slowly, but with low level of risk.
#7
Key Finding #7
An interesting strategy to balance quality, return and risk is to try and identify Potential Blue
Chips, as covered in our theme section on Blue Chip Investing.
Wealth Creators: Classification by age-groupNo. of No. of Wealth Created % Share PAT Price
Years Cos. (INR b) of WC CAGR (%) CAGR (%)
0-10 6 440 2 36 26
11-20 25 5,934 27 19 18
21-30 19 4,077 18 21 21
31-40 9 3,555 16 15 19
41-50 14 2,530 11 21 16
51-60 7 2,070 9 18 22
61-70 8 1,394 6 27 14
71-80 1 45 0 10 5
81-90 3 339 2 21 18
>90 8 1,711 8 22 18
Total 100 22,096 100 20 18
Price CAGR and PAT CAGR by base market cap range
26
19 1622
14
5
18
36
19 21 2118
27
10
21 22
182118
15
0-10 11-20 21-30 31-40 41-50 51-60 61-70 71-80 81-90 >90
Price CAGR (%) PAT CAGR (%) Avg Price CAGR: 18%Avg PAT CAGR: 20%
Base Market Cap Range (INR b)
109 December 2011
Wealth Creation Study 2006-2011 Findings
Wealth Creators by Sales and Earnings Growth
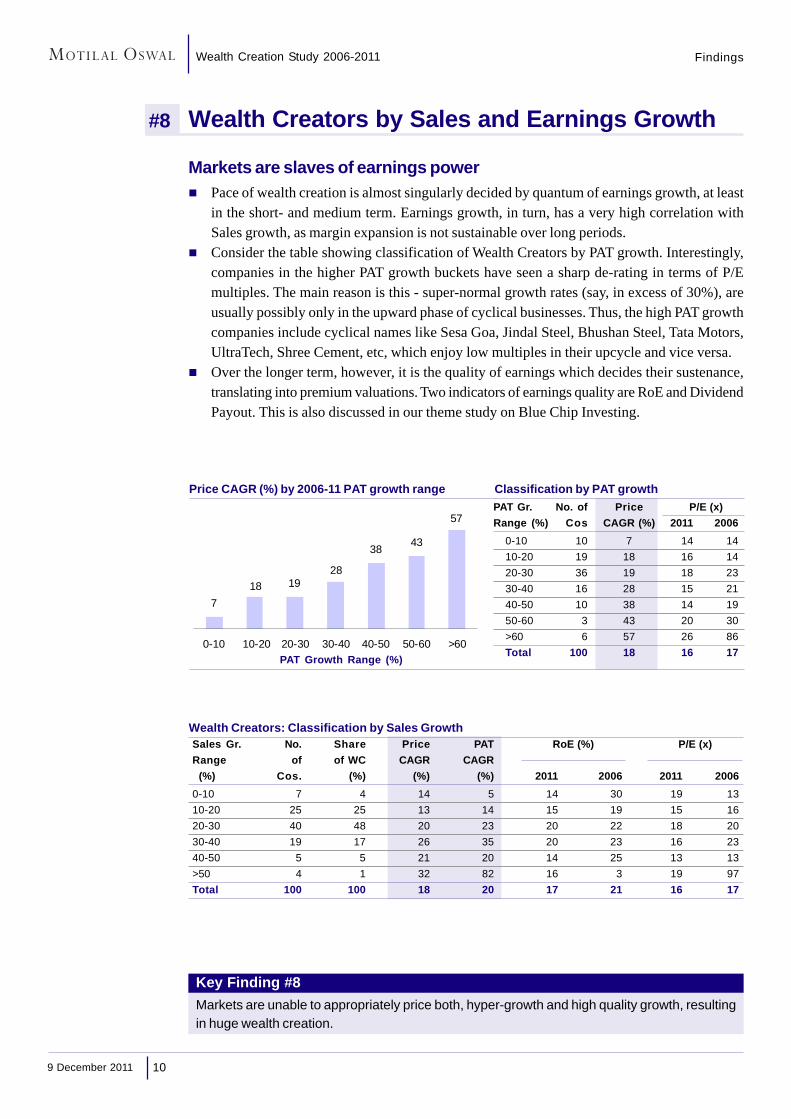
Markets are slaves of earnings power Pace of wealth creation is almost singularly decided by quantum of earnings growth, at least
in the short- and medium term. Earnings growth, in turn, has a very high correlation withSales growth, as margin expansion is not sustainable over long periods.
Consider the table showing classification of Wealth Creators by PAT growth. Interestingly,companies in the higher PAT growth buckets have seen a sharp de-rating in terms of P/Emultiples. The main reason is this - super-normal growth rates (say, in excess of 30%), areusually possibly only in the upward phase of cyclical businesses. Thus, the high PAT growthcompanies include cyclical names like Sesa Goa, Jindal Steel, Bhushan Steel, Tata Motors,UltraTech, Shree Cement, etc, which enjoy low multiples in their upcycle and vice versa.
Over the longer term, however, it is the quality of earnings which decides their sustenance,translating into premium valuations. Two indicators of earnings quality are RoE and DividendPayout. This is also discussed in our theme study on Blue Chip Investing.
#8
Key Finding #8
Markets are unable to appropriately price both, hyper-growth and high quality growth, resultingin huge wealth creation.
Wealth Creators: Classification by Sales GrowthSales Gr. No. Share Price PAT RoE (%) P/E (x)
Range of of WC CAGR CAGR
(%) Cos. (%) (%) (%) 2011 2006 2011 2006
0-10 7 4 14 5 14 30 19 13
10-20 25 25 13 14 15 19 15 16
20-30 40 48 20 23 20 22 18 20
30-40 19 17 26 35 20 23 16 23
40-50 5 5 21 20 14 25 13 13
>50 4 1 32 82 16 3 19 97
Total 100 100 18 20 17 21 16 17
Price CAGR (%) by 2006-11 PAT growth range Classification by PAT growth
PAT Gr. No. of Price P/E (x)
Range (%) Cos CAGR (%) 2011 2006
0-10 10 7 14 14
10-20 19 18 16 14
20-30 36 19 18 23
30-40 16 28 15 21
40-50 10 38 14 19
50-60 3 43 20 30
>60 6 57 26 86
Total 100 18 16 17
7
19
3843
57
28
18
0-10 10-20 20-30 30-40 40-50 50-60 >60
PAT Growth Range (%)
119 December 2011
Wealth Creation Study 2006-2011 Findings
Wealth Creators Classification By RoE
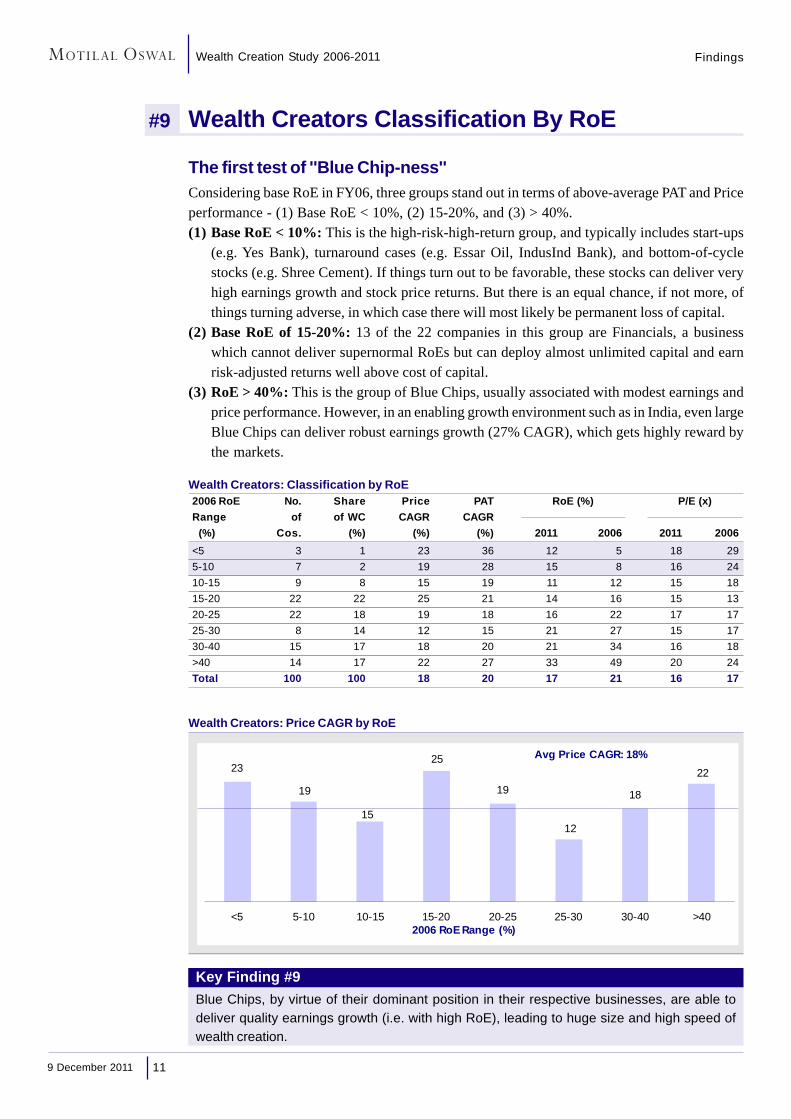
The first test of ''Blue Chip-ness''Considering base RoE in FY06, three groups stand out in terms of above-average PAT and Priceperformance - (1) Base RoE < 10%, (2) 15-20%, and (3) > 40%.(1) Base RoE < 10%: This is the high-risk-high-return group, and typically includes start-ups
(e.g. Yes Bank), turnaround cases (e.g. Essar Oil, IndusInd Bank), and bottom-of-cyclestocks (e.g. Shree Cement). If things turn out to be favorable, these stocks can deliver veryhigh earnings growth and stock price returns. But there is an equal chance, if not more, ofthings turning adverse, in which case there will most likely be permanent loss of capital.
(2) Base RoE of 15-20%: 13 of the 22 companies in this group are Financials, a businesswhich cannot deliver supernormal RoEs but can deploy almost unlimited capital and earnrisk-adjusted returns well above cost of capital.
(3) RoE > 40%: This is the group of Blue Chips, usually associated with modest earnings andprice performance. However, in an enabling growth environment such as in India, even largeBlue Chips can deliver robust earnings growth (27% CAGR), which gets highly reward bythe markets.
#9
Key Finding #9
Blue Chips, by virtue of their dominant position in their respective businesses, are able to
deliver quality earnings growth (i.e. with high RoE), leading to huge size and high speed of
wealth creation.
Wealth Creators: Classification by RoE2006 RoE No. Share Price PAT RoE (%) P/E (x)
Range of of WC CAGR CAGR
(%) Cos. (%) (%) (%) 2011 2006 2011 2006
<5 3 1 23 36 12 5 18 29
5-10 7 2 19 28 15 8 16 24
10-15 9 8 15 19 11 12 15 18
15-20 22 22 25 21 14 16 15 13
20-25 22 18 19 18 16 22 17 17
25-30 8 14 12 15 21 27 15 17
30-40 15 17 18 20 21 34 16 18
>40 14 17 22 27 33 49 20 24
Total 100 100 18 20 17 21 16 17
Wealth Creators: Price CAGR by RoE
23
19 18
15
22
12
25
19
<5 5-10 10-15 15-20 20-25 25-30 30-40 >40
Avg Price CAGR: 18%
2006 RoE Range (%)
129 December 2011
Wealth Creation Study 2006-2011 Findings
Wealth Creators by Valuation Parameters
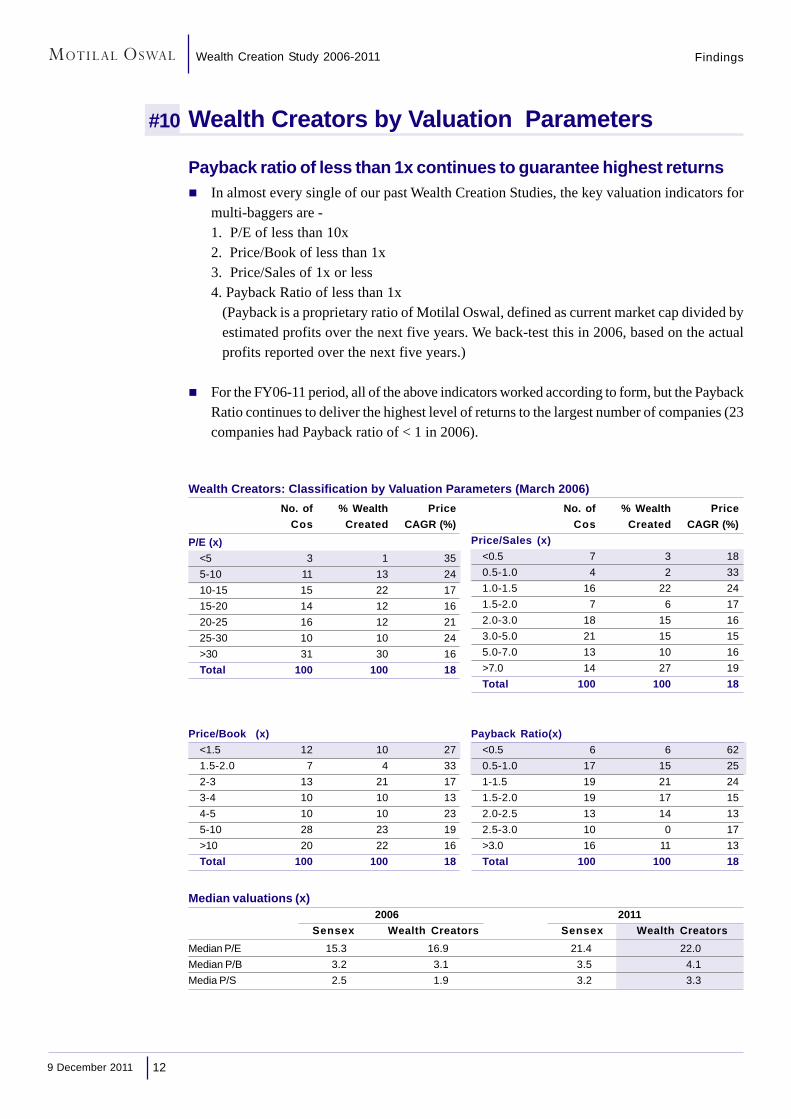
Payback ratio of less than 1x continues to guarantee highest returns In almost every single of our past Wealth Creation Studies, the key valuation indicators for
multi-baggers are -1. P/E of less than 10x2. Price/Book of less than 1x3. Price/Sales of 1x or less4. Payback Ratio of less than 1x
(Payback is a proprietary ratio of Motilal Oswal, defined as current market cap divided byestimated profits over the next five years. We back-test this in 2006, based on the actualprofits reported over the next five years.)
For the FY06-11 period, all of the above indicators worked according to form, but the PaybackRatio continues to deliver the highest level of returns to the largest number of companies (23companies had Payback ratio of < 1 in 2006).
#10
No. of % Wealth Price
Cos Created CAGR (%)
P/E (x)
<5 3 1 35
5-10 11 13 24
10-15 15 22 17
15-20 14 12 16
20-25 16 12 21
25-30 10 10 24
>30 31 30 16
Total 100 100 18
Price/Book (x)
<1.5 12 10 27
1.5-2.0 7 4 33
2-3 13 21 17
3-4 10 10 13
4-5 10 10 23
5-10 28 23 19
>10 20 22 16
Total 100 100 18
No. of % Wealth Price
Cos Created CAGR (%)
Price/Sales (x)
<0.5 7 3 18
0.5-1.0 4 2 33
1.0-1.5 16 22 24
1.5-2.0 7 6 17
2.0-3.0 18 15 16
3.0-5.0 21 15 15
5.0-7.0 13 10 16
>7.0 14 27 19
Total 100 100 18
Payback Ratio(x)
<0.5 6 6 62
0.5-1.0 17 15 25
1-1.5 19 21 24
1.5-2.0 19 17 15
2.0-2.5 13 14 13
2.5-3.0 10 0 17
>3.0 16 11 13
Total 100 100 18
Wealth Creators: Classification by Valuation Parameters (March 2006)
Median valuations (x) 2006 2011
Sensex Wealth Creators Sensex Wealth Creators
Median P/E 15.3 16.9 21.4 22.0
Median P/B 3.2 3.1 3.5 4.1
Media P/S 2.5 1.9 3.2 3.3
139 December 2011
Wealth Creation Study 2006-2011 Findings
Wealth Destroyers
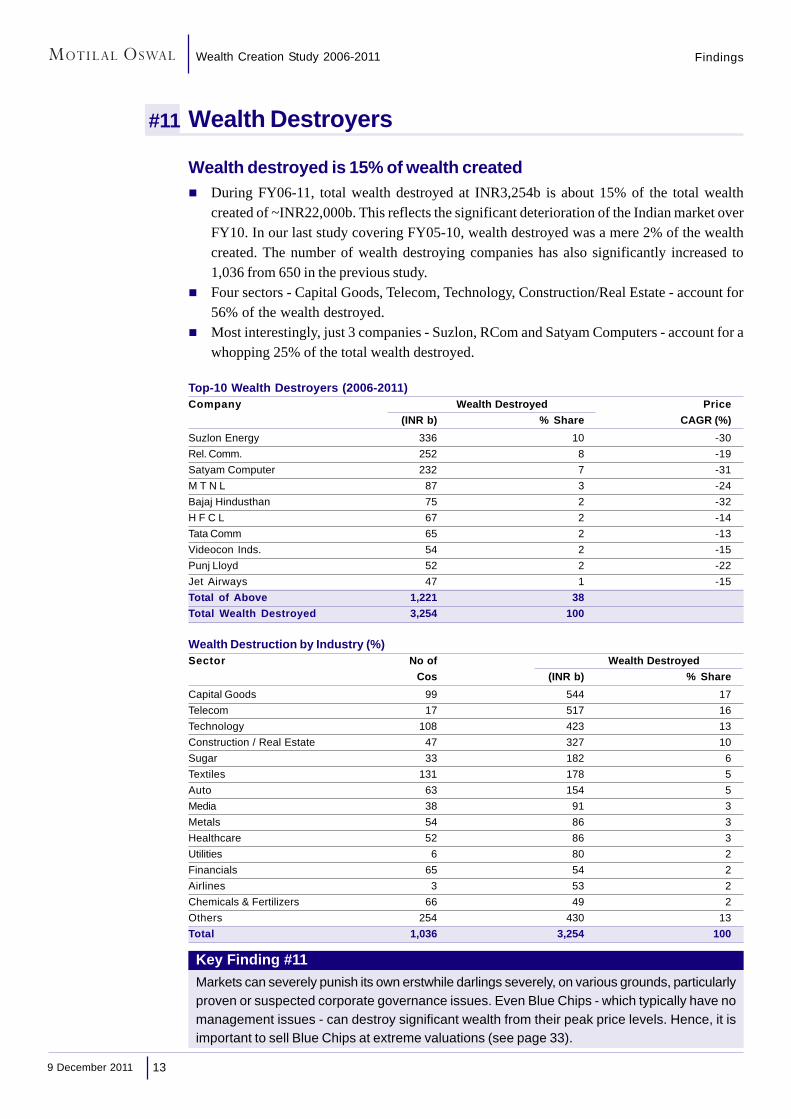
Wealth destroyed is 15% of wealth created During FY06-11, total wealth destroyed at INR3,254b is about 15% of the total wealth
created of ~INR22,000b. This reflects the significant deterioration of the Indian market overFY10. In our last study covering FY05-10, wealth destroyed was a mere 2% of the wealthcreated. The number of wealth destroying companies has also significantly increased to1,036 from 650 in the previous study.
Four sectors - Capital Goods, Telecom, Technology, Construction/Real Estate - account for56% of the wealth destroyed.
Most interestingly, just 3 companies - Suzlon, RCom and Satyam Computers - account for awhopping 25% of the total wealth destroyed.
#11
Key Finding #11
Markets can severely punish its own erstwhile darlings severely, on various grounds, particularly
proven or suspected corporate governance issues. Even Blue Chips - which typically have no
management issues - can destroy significant wealth from their peak price levels. Hence, it isimportant to sell Blue Chips at extreme valuations (see page 33).
Top-10 Wealth Destroyers (2006-2011)Company Wealth Destroyed Price
(INR b) % Share CAGR (%)
Suzlon Energy 336 10 -30
Rel. Comm. 252 8 -19
Satyam Computer 232 7 -31
M T N L 87 3 -24
Bajaj Hindusthan 75 2 -32
H F C L 67 2 -14
Tata Comm 65 2 -13
Videocon Inds. 54 2 -15
Punj Lloyd 52 2 -22
Jet Airways 47 1 -15
Total of Above 1,221 38
Total Wealth Destroyed 3,254 100
Wealth Destruction by Industry (%)Sector No of Wealth Destroyed
Cos (INR b) % Share
Capital Goods 99 544 17
Telecom 17 517 16
Technology 108 423 13
Construction / Real Estate 47 327 10
Sugar 33 182 6
Textiles 131 178 5
Auto 63 154 5
Media 38 91 3
Metals 54 86 3
Healthcare 52 86 3
Utilities 6 80 2
Financials 65 54 2
Airlines 3 53 2
Chemicals & Fertilizers 66 49 2
Others 254 430 13
Total 1,036 3,254 100
149 December 2011
Wealth Creation Study 2006-2011 Findings
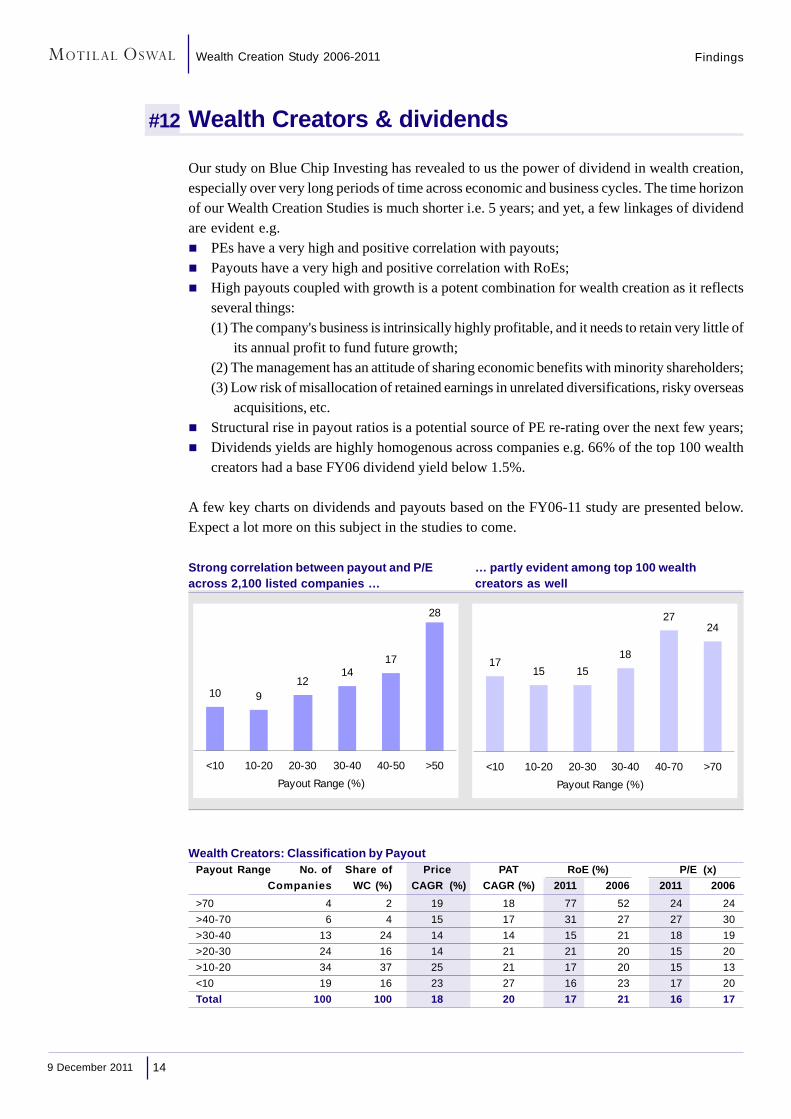
Wealth Creators & dividends
Our study on Blue Chip Investing has revealed to us the power of dividend in wealth creation,especially over very long periods of time across economic and business cycles. The time horizonof our Wealth Creation Studies is much shorter i.e. 5 years; and yet, a few linkages of dividendare evident e.g. PEs have a very high and positive correlation with payouts; Payouts have a very high and positive correlation with RoEs; High payouts coupled with growth is a potent combination for wealth creation as it reflects
several things:(1) The company's business is intrinsically highly profitable, and it needs to retain very little of
its annual profit to fund future growth;(2) The management has an attitude of sharing economic benefits with minority shareholders;(3) Low risk of misallocation of retained earnings in unrelated diversifications, risky overseas
acquisitions, etc. Structural rise in payout ratios is a potential source of PE re-rating over the next few years; Dividends yields are highly homogenous across companies e.g. 66% of the top 100 wealth
creators had a base FY06 dividend yield below 1.5%.
A few key charts on dividends and payouts based on the FY06-11 study are presented below.Expect a lot more on this subject in the studies to come.
#12
Wealth Creators: Classification by PayoutPayout Range No. of Share of Price PAT RoE (%) P/E (x)
Companies WC (%) CAGR (%) CAGR (%) 2011 2006 2011 2006
>70 4 2 19 18 77 52 24 24
>40-70 6 4 15 17 31 27 27 30
>30-40 13 24 14 14 15 21 18 19
>20-30 24 16 14 21 21 20 15 20
>10-20 34 37 25 21 17 20 15 13
<10 19 16 23 27 16 23 17 20
Total 100 100 18 20 17 21 16 17
10 912
1417
28
<10 10-20 20-30 30-40 40-50 >50
Payout Range (%)
1715 15
18
2724
<10 10-20 20-30 30-40 40-70 >70
Payout Range (%)
Strong correlation between payout and P/E … partly evident among top 100 wealthacross 2,100 listed companies … creators as well
159 December 2011
Wealth Creation Study 2006-2011 Findings
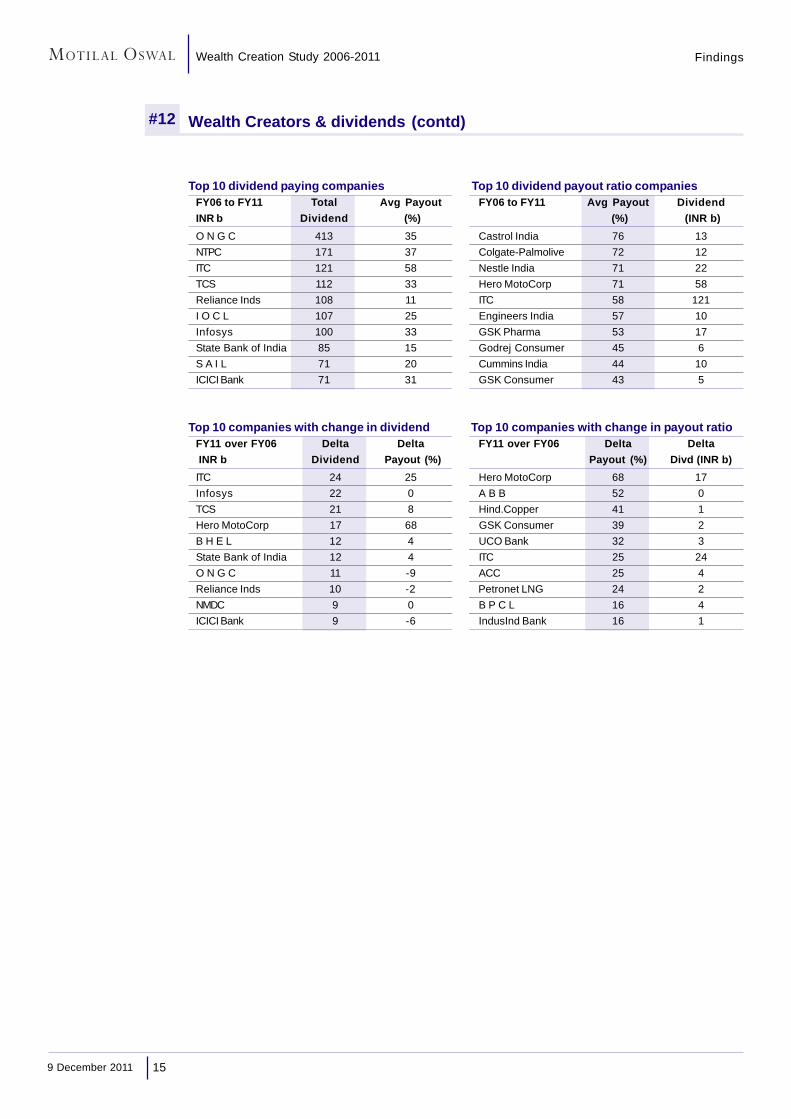
#12 Wealth Creators & dividends (contd)
Top 10 dividend paying companies Top 10 dividend payout ratio companiesFY06 to FY11 Total Avg Payout FY06 to FY11 Avg Payout Dividend
INR b Dividend (%) (%) (INR b)
O N G C 413 35 Castrol India 76 13
NTPC 171 37 Colgate-Palmolive 72 12
ITC 121 58 Nestle India 71 22
TCS 112 33 Hero MotoCorp 71 58
Reliance Inds 108 11 ITC 58 121
I O C L 107 25 Engineers India 57 10
Infosys 100 33 GSK Pharma 53 17
State Bank of India 85 15 Godrej Consumer 45 6
S A I L 71 20 Cummins India 44 10
ICICI Bank 71 31 GSK Consumer 43 5
Top 10 companies with change in dividend Top 10 companies with change in payout ratioFY11 over FY06 Delta Delta FY11 over FY06 Delta Delta
INR b Dividend Payout (%) Payout (%) Divd (INR b)
ITC 24 25 Hero MotoCorp 68 17
Infosys 22 0 A B B 52 0
TCS 21 8 Hind.Copper 41 1
Hero MotoCorp 17 68 GSK Consumer 39 2
B H E L 12 4 UCO Bank 32 3
State Bank of India 12 4 ITC 25 24
O N G C 11 -9 ACC 25 4
Reliance Inds 10 -2 Petronet LNG 24 2
NMDC 9 0 B P C L 16 4
ICICI Bank 9 -6 IndusInd Bank 16 1
169 December 2011
Wealth Creation Study 2006-2011 Theme 2012
Wealth Creation
2006-2011
The 16TH Annual Study
Theme 2012
Theme 2012
179 December 2011
Wealth Creation Study 2006-2011 Theme 2012
Blue Chip Investing
Creating wealth from dividends
A stock is worth only what you can get out of it. Even so spoke the old farmer to his son:
A cow for her milk,A hen for her eggs,And a stock, by heck,For her dividends.
— John Burr Williams in his book, The Theory Of Investment Value
1. Introduction: Back to basics
When in doubt, get back to basics. Thus, in the current, highly uncertain investment climate, itmay be useful to get back to the basics of investment, including its very definition. As far backas 1934, Benjamin Graham and David Dodd wrote in their classic text book, Security Analysis,"An investment operation is one which, upon thorough analysis, promises safety of principaland an adequate return. Operations not meeting these requirements are speculative."
In 1938, John Burr Williams wrote in The Theory Of Investment Value, "If he does buy stocks,and buy as an investor, he holds for income; if as a speculator, for profit … Wise investmentrequires that only such issues as are selling far below their true worth should be bought; then, aslarge income payments are received in subsequent years … a handsome return on the principalcan be enjoyed."
Currently, there are several styles of investing which prevail - Value Investing, Growth Investing,Momentum Investing, Common-sense Investing, Distress Investing, even UU Investing (Unknown& Unknowable, Wealth Creation Study 2010). However, going strictly by the perspective ofGraham & Dodd and Burr Williams, more often than not, it is only Blue Chip Investing which istruly an "investment operation", and only Blue Chips qualify to be called "wise investments".
2. What is Blue Chip Investing?
Simply put, Blue Chip Investing involves buying and selling Blue Chips (i.e. high qualitystocks) at the right price. The term "Blue Chip" comes from poker where the highest andmost valued denomination chips are colored blue. Thus, "Blue Chip stocks" is a common termused for highly priced stocks, which typically tend to enjoy premium valuations due to their highquality. They are also sometimes referred to as bellwether stocks.
Blue Chips are described variously (see box on page 18), because the parameters for a blue chipare relatively subjective. Like beauty, "Blue Chip-ness" lies in the eyes of the beholder. Thus,an appropriate phrase relevant for a Blue Chip may well be, "I can't explain it but Iknow it when I see it."
189 December 2011
Wealth Creation Study 2006-2011 Theme 2012
At best, professional investors agree upon a few features common across most Blue Chips - High priced stocks, both in terms of premium valuation and also absolute ticket price
(unlike penny stocks) Frontline stocks, many of which tend to be constituents of the leading benchmark stock
market indices Large-sized companies in terms of revenue and market capitalization, usually whose
products or services offered are well known to the public at large, and not just to the investmentcommunity
A long record of strong financial performance, resulting in uninterrupted dividend paymentsacross business cycles
Widely tracked and researched stocks, with a significant holding of institutional investors Ease of entry and exit due to large floating stock and huge traded volumes.
Blue Chips are … "… stocks of well-established and financially sound companies that have demonstrated its
ability to pay dividends in both good and bad times."
"… stocks of companies that are thought to be safe, in excellent financial shape and firmly
entrenched as leaders in their field, generally paying high dividends, and favorably regarded
by investors."
"… the crème de la crème of the stock market - solid, dependable stocks that will deliver
good returns year after year to investors."
3. Why Blue Chip Investing
Geraldine Weiss, in her book, The Dividend Connection, says, "good quality companies withstrong dividend histories offer as much, if not more, investment growth potential thanpoor quality companies; and they do so with far less risk." Key words here succinctlycapture why Blue Chip Investing is an excellent strategy to create wealth in the stock markets -
3.1. "Good quality companies"
The essence of Blue Chip Investing is to invest only in high quality companies. This alone playsa huge role in ensuring "safety of principal", as suggested by Graham & Dodd. Or as WarrenBuffett famously puts it, "Rule No.1: Never lose money. Rule No.2: Never forget Rule No.1."These two rules can effectively be practiced by investing only in high quality companies. Giventheir strong business and financial track record, the risk of permanent capital loss is virtuallyzero. Worst case, investors may suffer quotational loss, if they happen to buy into Blue Chipswhen they are grossly overvalued.
3.2. "Strong dividend histories"
If good quality companies are the root of Blue Chip Investing, strong dividends are the fruit. BlueChips manage highly profitable businesses, and in most cases, have attained critical mass ofscale. Thus, they generate enough resources not only to fund their own growth, but also distributesurpluses by way of generous dividends. Over time, Blue Chips prove to be fountains of dividendacross economic and stock market cycles, which in turn, ensures "handsome return on the principal",to recollect Burr Williams' words.
199 December 2011
Wealth Creation Study 2006-2011 Theme 2012
3.3. "As much, if not more, investment growth potential than poor qualitycompanies"
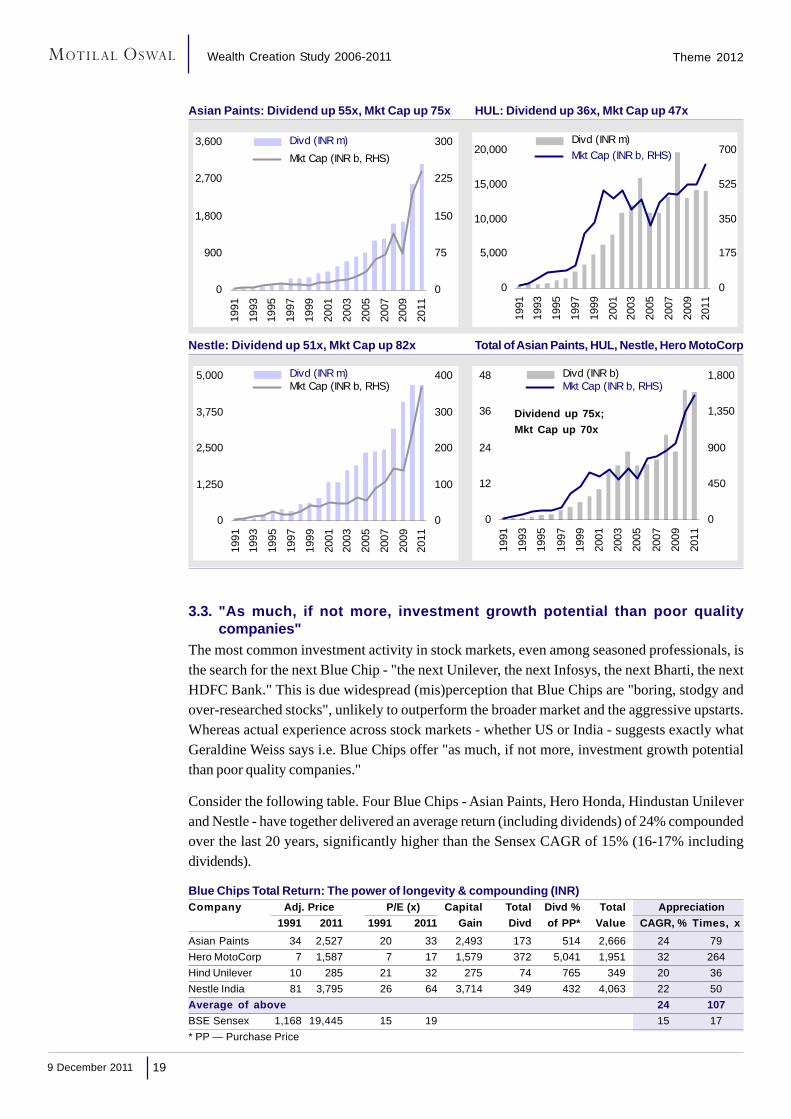
The most common investment activity in stock markets, even among seasoned professionals, isthe search for the next Blue Chip - "the next Unilever, the next Infosys, the next Bharti, the nextHDFC Bank." This is due widespread (mis)perception that Blue Chips are "boring, stodgy andover-researched stocks", unlikely to outperform the broader market and the aggressive upstarts.Whereas actual experience across stock markets - whether US or India - suggests exactly whatGeraldine Weiss says i.e. Blue Chips offer "as much, if not more, investment growth potentialthan poor quality companies."
Consider the following table. Four Blue Chips - Asian Paints, Hero Honda, Hindustan Unileverand Nestle - have together delivered an average return (including dividends) of 24% compoundedover the last 20 years, significantly higher than the Sensex CAGR of 15% (16-17% includingdividends).
Blue Chips Total Return: The power of longevity & compounding (INR)Company Adj. Price P/E (x) Capital Total Divd % Total Appreciation
1991 2011 1991 2011 Gain Divd of PP* Value CAGR, % Times, x
Asian Paints 34 2,527 20 33 2,493 173 514 2,666 24 79
Hero MotoCorp 7 1,587 7 17 1,579 372 5,041 1,951 32 264
Hind Unilever 10 285 21 32 275 74 765 349 20 36
Nestle India 81 3,795 26 64 3,714 349 432 4,063 22 50
Average of above 24 107
BSE Sensex 1,168 19,445 15 19 15 17
* PP — Purchase Price
Asian Paints: Dividend up 55x, Mkt Cap up 75x HUL: Dividend up 36x, Mkt Cap up 47x
Nestle: Dividend up 51x, Mkt Cap up 82x Total of Asian Paints, HUL, Nestle, Hero MotoCorp
0
900
1,800
2,700
3,600
1991
1993
1995
1997
1999
2001
2003
2005
2007
2009
2011
0
75
150
225
300 Divd (INR m)
Mkt Cap (INR b, RHS)
0
5,000
10,000
15,000
20,000
1991
1993
1995
1997
1999
2001
2003
2005
2007
2009
2011
0
175
350
525
700 Divd (INR m)
Mkt Cap (INR b, RHS)
0
1,250
2,500
3,750
5,000
1991
1993
1995
1997
1999
2001
2003
2005
2007
2009
2011
0
100
200
300
400 Divd (INR m) Mkt Cap (INR b, RHS)
0
12
24
36
48
1991
1993
1995
1997
1999
2001
2003
2005
2007
2009
2011
0
450
900
1,350
1,800 Divd (INR b) Mkt Cap (INR b, RHS)
Dividend up 75x;
Mkt Cap up 70x
209 December 2011
Wealth Creation Study 2006-2011 Theme 2012
4. The Process of Blue Chip Investing
There are two key steps in the process of Blue Chip Investing: (1) Understanding quality, and (2)Recognizing value.
4.1. Understanding quality
Quality is a subjective concept. But in the case of a company, its quality gets objectively reflectedin its performance at three levels -1. Business performance: Large business opportunity, strong competitive position with distinctly
differentiated offerings or low cost relative to peers, excellent track record of R&D andlaunch of new products & services, and high quality management in terms of competence,character, stakeholder consciousness.
2. Financial performance: Long-term track record of healthy sales and profit growth,uninterrupted and rising dividend payouts, robust return on capital, low debt-equity, and prudentcapital allocation.
3. Stock performance: Rewarding total return to investors (dividend + capital appreciation)over a long period, high institutional holding and interest in the stock, inclusion in benchmarkindices, etc.
Of the above quality-reflecting criteria, some objective ones can be effectively used as an initialscreen to identify Blue Chips (see Section 5, page 22).
4.2. Recognizing value
Precisely because Blue Chips demonstrate sustained high quality of business and financialperformance, they enjoy a significant valuation premium over stocks of lower quality. Hence,one cannot buy Blue Chips at any price and still hope for significant total return. In most cases,
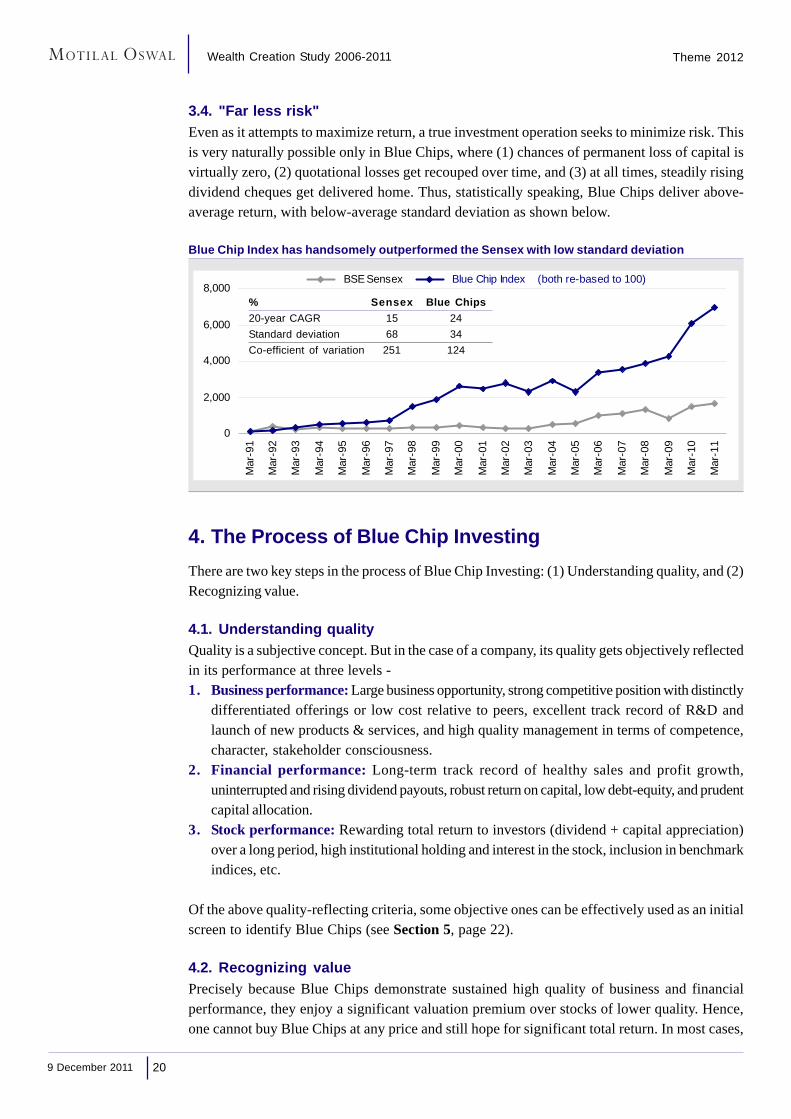
3.4. "Far less risk"
Even as it attempts to maximize return, a true investment operation seeks to minimize risk. Thisis very naturally possible only in Blue Chips, where (1) chances of permanent loss of capital isvirtually zero, (2) quotational losses get recouped over time, and (3) at all times, steadily risingdividend cheques get delivered home. Thus, statistically speaking, Blue Chips deliver above-average return, with below-average standard deviation as shown below.
Blue Chip Index has handsomely outperformed the Sensex with low standard deviation
0
2,000
4,000
6,000
8,000
Mar
-91
Mar
-92
Mar
-93
Mar
-94
Mar
-95
Mar
-96
Mar
-97
Mar
-98
Mar
-99
Mar
-00
Mar
-01
Mar
-02
Mar
-03
Mar
-04
Mar
-05
Mar
-06
Mar
-07
Mar
-08
Mar
-09
Mar
-10
Mar
-11
BSE Sensex Blue Chip Index (both re-based to 100)
% Sensex Blue Chips
20-year CAGR 15 24
Standard deviation 68 34
Co-efficient of variation 251 124
219 December 2011
Wealth Creation Study 2006-2011 Theme 2012
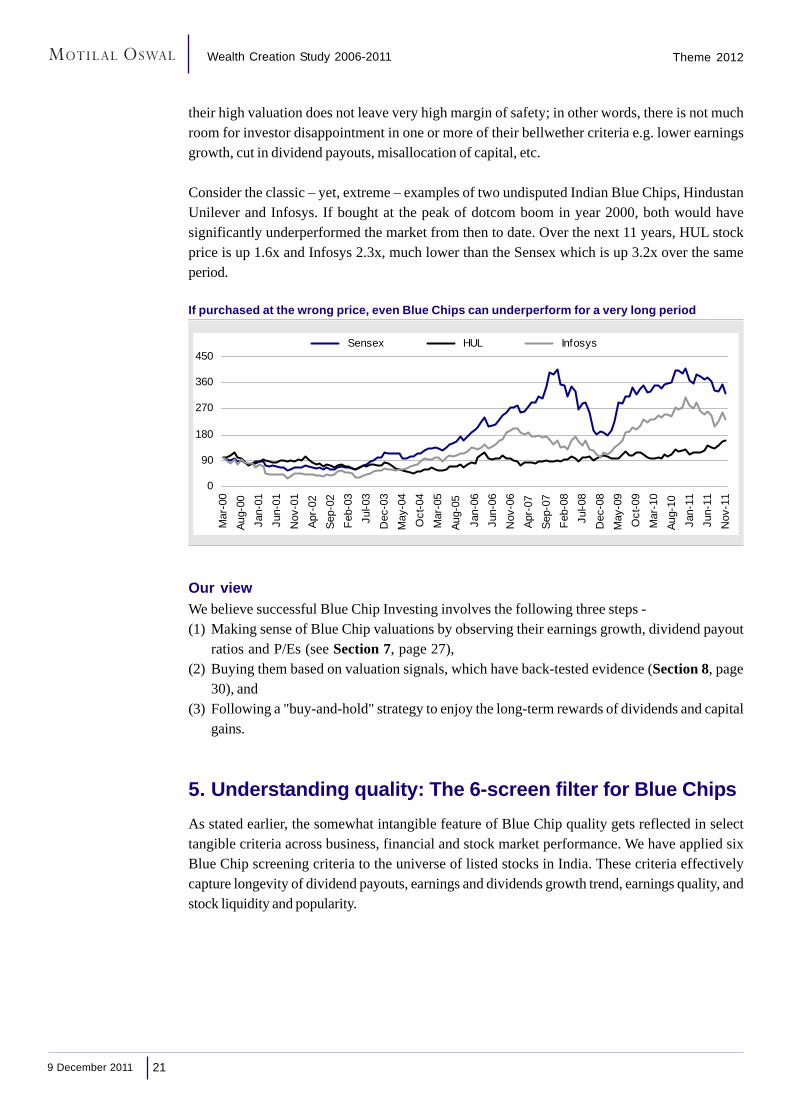
their high valuation does not leave very high margin of safety; in other words, there is not muchroom for investor disappointment in one or more of their bellwether criteria e.g. lower earningsgrowth, cut in dividend payouts, misallocation of capital, etc.
Consider the classic – yet, extreme – examples of two undisputed Indian Blue Chips, HindustanUnilever and Infosys. If bought at the peak of dotcom boom in year 2000, both would havesignificantly underperformed the market from then to date. Over the next 11 years, HUL stockprice is up 1.6x and Infosys 2.3x, much lower than the Sensex which is up 3.2x over the sameperiod.
If purchased at the wrong price, even Blue Chips can underperform for a very long period
Our view
We believe successful Blue Chip Investing involves the following three steps -(1) Making sense of Blue Chip valuations by observing their earnings growth, dividend payout
ratios and P/Es (see Section 7, page 27),(2) Buying them based on valuation signals, which have back-tested evidence (Section 8, page
30), and(3) Following a "buy-and-hold" strategy to enjoy the long-term rewards of dividends and capital
gains.
5. Understanding quality: The 6-screen filter for Blue Chips
As stated earlier, the somewhat intangible feature of Blue Chip quality gets reflected in selecttangible criteria across business, financial and stock market performance. We have applied sixBlue Chip screening criteria to the universe of listed stocks in India. These criteria effectivelycapture longevity of dividend payouts, earnings and dividends growth trend, earnings quality, andstock liquidity and popularity.
0
90
180
270
360
450
Mar
-00
Aug
-00
Jan-
01
Jun-
01
Nov
-01
Apr
-02
Sep
-02
Feb
-03
Jul-0
3
Dec
-03
May
-04
Oct
-04
Mar
-05
Aug
-05
Jan-
06
Jun-
06
Nov
-06
Apr
-07
Sep
-07
Feb
-08
Jul-0
8
Dec
-08
May
-09
Oct
-09
Mar
-10
Aug
-10
Jan-
11
Jun-
11
Nov
-11
Sensex HUL Infosys
229 December 2011
Wealth Creation Study 2006-2011 Theme 2012
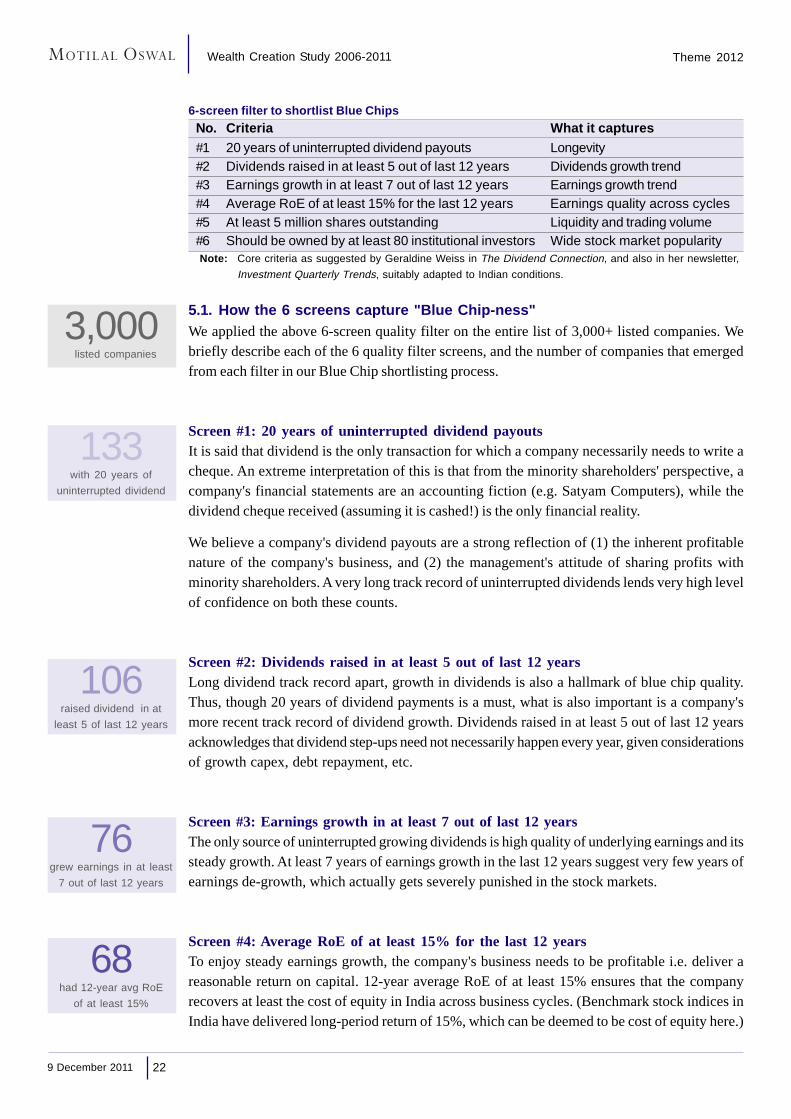
6-screen filter to shortlist Blue Chips
No. Criteria What it captures
#1 20 years of uninterrupted dividend payouts Longevity
#2 Dividends raised in at least 5 out of last 12 years Dividends growth trend#3 Earnings growth in at least 7 out of last 12 years Earnings growth trend
#4 Average RoE of at least 15% for the last 12 years Earnings quality across cycles
#5 At least 5 million shares outstanding Liquidity and trading volume#6 Should be owned by at least 80 institutional investors Wide stock market popularityNote: Core criteria as suggested by Geraldine Weiss in The Dividend Connection, and also in her newsletter,
Investment Quarterly Trends, suitably adapted to Indian conditions.
5.1. How the 6 screens capture "Blue Chip-ness"
We applied the above 6-screen quality filter on the entire list of 3,000+ listed companies. Webriefly describe each of the 6 quality filter screens, and the number of companies that emergedfrom each filter in our Blue Chip shortlisting process.
Screen #1: 20 years of uninterrupted dividend payoutsIt is said that dividend is the only transaction for which a company necessarily needs to write acheque. An extreme interpretation of this is that from the minority shareholders' perspective, acompany's financial statements are an accounting fiction (e.g. Satyam Computers), while thedividend cheque received (assuming it is cashed!) is the only financial reality.
We believe a company's dividend payouts are a strong reflection of (1) the inherent profitablenature of the company's business, and (2) the management's attitude of sharing profits withminority shareholders. A very long track record of uninterrupted dividends lends very high levelof confidence on both these counts.
Screen #2: Dividends raised in at least 5 out of last 12 yearsLong dividend track record apart, growth in dividends is also a hallmark of blue chip quality.Thus, though 20 years of dividend payments is a must, what is also important is a company'smore recent track record of dividend growth. Dividends raised in at least 5 out of last 12 yearsacknowledges that dividend step-ups need not necessarily happen every year, given considerationsof growth capex, debt repayment, etc.
Screen #3: Earnings growth in at least 7 out of last 12 yearsThe only source of uninterrupted growing dividends is high quality of underlying earnings and itssteady growth. At least 7 years of earnings growth in the last 12 years suggest very few years ofearnings de-growth, which actually gets severely punished in the stock markets.
Screen #4: Average RoE of at least 15% for the last 12 yearsTo enjoy steady earnings growth, the company's business needs to be profitable i.e. deliver areasonable return on capital. 12-year average RoE of at least 15% ensures that the companyrecovers at least the cost of equity in India across business cycles. (Benchmark stock indices inIndia have delivered long-period return of 15%, which can be deemed to be cost of equity here.)
3,000listed companies
133with 20 years of
uninterrupted dividend
106raised dividend in at
least 5 of last 12 years
76grew earnings in at least
7 out of last 12 years
68had 12-year avg RoE
of at least 15%
239 December 2011
Wealth Creation Study 2006-2011 Theme 2012
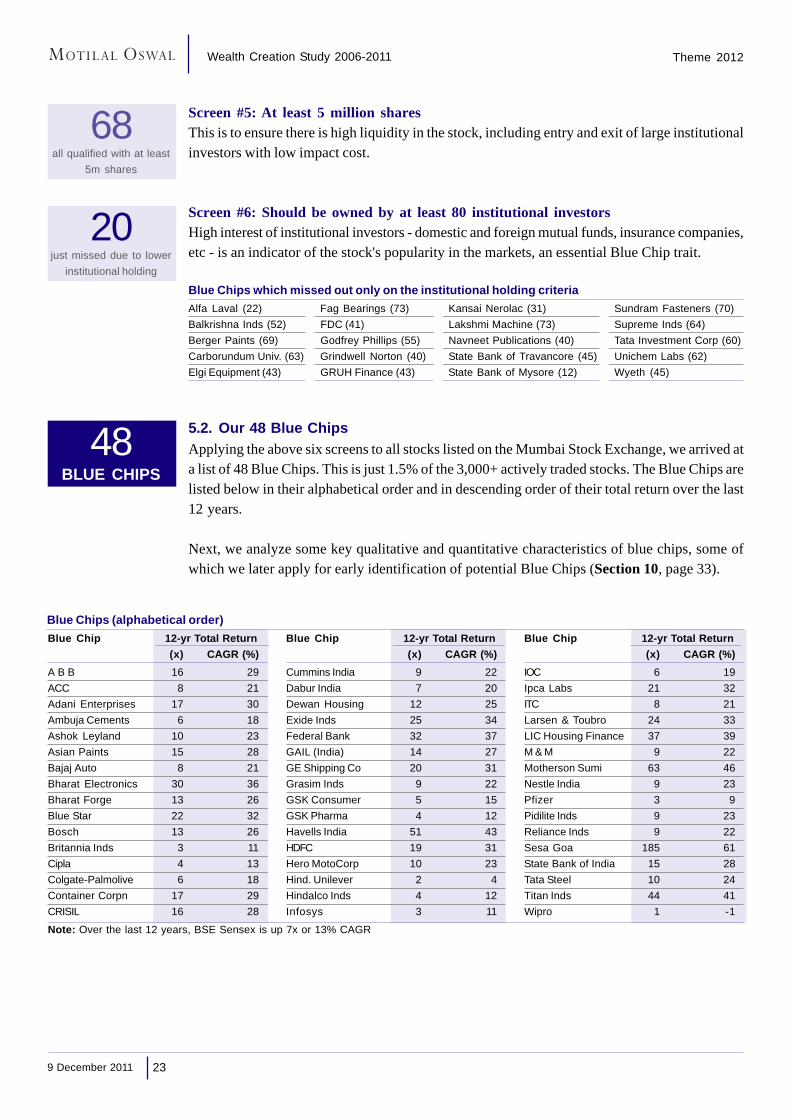
Screen #5: At least 5 million sharesThis is to ensure there is high liquidity in the stock, including entry and exit of large institutionalinvestors with low impact cost.
Screen #6: Should be owned by at least 80 institutional investorsHigh interest of institutional investors - domestic and foreign mutual funds, insurance companies,etc - is an indicator of the stock's popularity in the markets, an essential Blue Chip trait.
Blue Chips which missed out only on the institutional holding criteria
Alfa Laval (22) Fag Bearings (73) Kansai Nerolac (31) Sundram Fasteners (70)
Balkrishna Inds (52) FDC (41) Lakshmi Machine (73) Supreme Inds (64)
Berger Paints (69) Godfrey Phillips (55) Navneet Publications (40) Tata Investment Corp (60)
Carborundum Univ. (63) Grindwell Norton (40) State Bank of Travancore (45) Unichem Labs (62)
Elgi Equipment (43) GRUH Finance (43) State Bank of Mysore (12) Wyeth (45)
5.2. Our 48 Blue Chips
Applying the above six screens to all stocks listed on the Mumbai Stock Exchange, we arrived ata list of 48 Blue Chips. This is just 1.5% of the 3,000+ actively traded stocks. The Blue Chips arelisted below in their alphabetical order and in descending order of their total return over the last12 years.
Next, we analyze some key qualitative and quantitative characteristics of blue chips, some ofwhich we later apply for early identification of potential Blue Chips (Section 10, page 33).
68all qualified with at least
5m shares
48BLUE CHIPS
Blue Chips (alphabetical order)
Blue Chip 12-yr Total Return
(x) CAGR (%)
A B B 16 29
ACC 8 21
Adani Enterprises 17 30
Ambuja Cements 6 18
Ashok Leyland 10 23
Asian Paints 15 28
Bajaj Auto 8 21
Bharat Electronics 30 36
Bharat Forge 13 26
Blue Star 22 32
Bosch 13 26
Britannia Inds 3 11
Cipla 4 13
Colgate-Palmolive 6 18
Container Corpn 17 29
CRISIL 16 28
Blue Chip 12-yr Total Return
(x) CAGR (%)
Cummins India 9 22
Dabur India 7 20
Dewan Housing 12 25
Exide Inds 25 34
Federal Bank 32 37
GAIL (India) 14 27
GE Shipping Co 20 31
Grasim Inds 9 22
GSK Consumer 5 15
GSK Pharma 4 12
Havells India 51 43
HDFC 19 31
Hero MotoCorp 10 23
Hind. Unilever 2 4
Hindalco Inds 4 12
Infosys 3 11
Blue Chip 12-yr Total Return
(x) CAGR (%)
IOC 6 19
Ipca Labs 21 32
ITC 8 21
Larsen & Toubro 24 33
LIC Housing Finance 37 39
M & M 9 22
Motherson Sumi 63 46
Nestle India 9 23
Pfizer 3 9
Pidilite Inds 9 23
Reliance Inds 9 22
Sesa Goa 185 61
State Bank of India 15 28
Tata Steel 10 24
Titan Inds 44 41
Wipro 1 -1
Note: Over the last 12 years, BSE Sensex is up 7x or 13% CAGR
20just missed due to lower
institutional holding
249 December 2011
Wealth Creation Study 2006-2011 Theme 2012
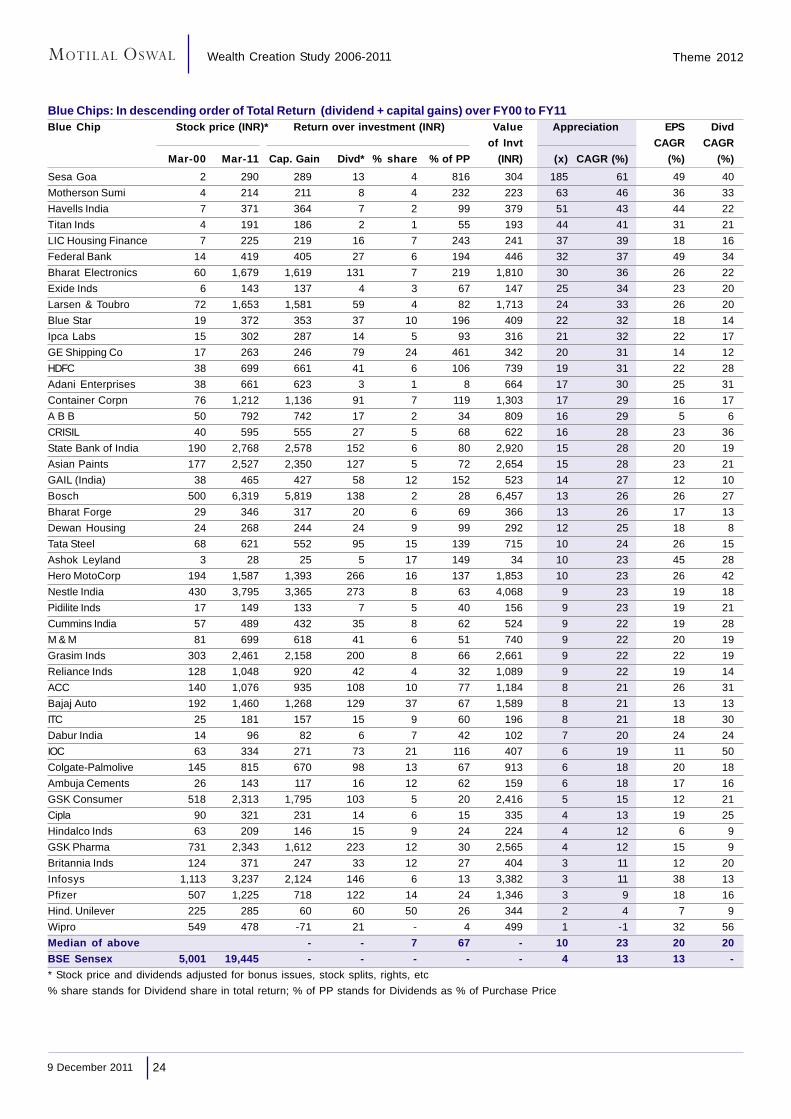
Blue Chips: In descending order of Total Return (dividend + capital gains) over FY00 to FY11Blue Chip Stock price (INR)* Return over investment (INR) Value Appreciation EPS Divd
of Invt CAGR CAGR
Mar-00 Mar-11 Cap. Gain Divd* % share % of PP (INR) (x) CAGR (%) (%) (%)
Sesa Goa 2 290 289 13 4 816 304 185 61 49 40
Motherson Sumi 4 214 211 8 4 232 223 63 46 36 33
Havells India 7 371 364 7 2 99 379 51 43 44 22
Titan Inds 4 191 186 2 1 55 193 44 41 31 21
LIC Housing Finance 7 225 219 16 7 243 241 37 39 18 16
Federal Bank 14 419 405 27 6 194 446 32 37 49 34
Bharat Electronics 60 1,679 1,619 131 7 219 1,810 30 36 26 22
Exide Inds 6 143 137 4 3 67 147 25 34 23 20
Larsen & Toubro 72 1,653 1,581 59 4 82 1,713 24 33 26 20
Blue Star 19 372 353 37 10 196 409 22 32 18 14
Ipca Labs 15 302 287 14 5 93 316 21 32 22 17
GE Shipping Co 17 263 246 79 24 461 342 20 31 14 12
HDFC 38 699 661 41 6 106 739 19 31 22 28
Adani Enterprises 38 661 623 3 1 8 664 17 30 25 31
Container Corpn 76 1,212 1,136 91 7 119 1,303 17 29 16 17
A B B 50 792 742 17 2 34 809 16 29 5 6
CRISIL 40 595 555 27 5 68 622 16 28 23 36
State Bank of India 190 2,768 2,578 152 6 80 2,920 15 28 20 19
Asian Paints 177 2,527 2,350 127 5 72 2,654 15 28 23 21
GAIL (India) 38 465 427 58 12 152 523 14 27 12 10
Bosch 500 6,319 5,819 138 2 28 6,457 13 26 26 27
Bharat Forge 29 346 317 20 6 69 366 13 26 17 13
Dewan Housing 24 268 244 24 9 99 292 12 25 18 8
Tata Steel 68 621 552 95 15 139 715 10 24 26 15
Ashok Leyland 3 28 25 5 17 149 34 10 23 45 28
Hero MotoCorp 194 1,587 1,393 266 16 137 1,853 10 23 26 42
Nestle India 430 3,795 3,365 273 8 63 4,068 9 23 19 18
Pidilite Inds 17 149 133 7 5 40 156 9 23 19 21
Cummins India 57 489 432 35 8 62 524 9 22 19 28
M & M 81 699 618 41 6 51 740 9 22 20 19
Grasim Inds 303 2,461 2,158 200 8 66 2,661 9 22 22 19
Reliance Inds 128 1,048 920 42 4 32 1,089 9 22 19 14
ACC 140 1,076 935 108 10 77 1,184 8 21 26 31
Bajaj Auto 192 1,460 1,268 129 37 67 1,589 8 21 13 13
ITC 25 181 157 15 9 60 196 8 21 18 30
Dabur India 14 96 82 6 7 42 102 7 20 24 24
IOC 63 334 271 73 21 116 407 6 19 11 50
Colgate-Palmolive 145 815 670 98 13 67 913 6 18 20 18
Ambuja Cements 26 143 117 16 12 62 159 6 18 17 16
GSK Consumer 518 2,313 1,795 103 5 20 2,416 5 15 12 21
Cipla 90 321 231 14 6 15 335 4 13 19 25
Hindalco Inds 63 209 146 15 9 24 224 4 12 6 9
GSK Pharma 731 2,343 1,612 223 12 30 2,565 4 12 15 9
Britannia Inds 124 371 247 33 12 27 404 3 11 12 20
Infosys 1,113 3,237 2,124 146 6 13 3,382 3 11 38 13
Pfizer 507 1,225 718 122 14 24 1,346 3 9 18 16
Hind. Unilever 225 285 60 60 50 26 344 2 4 7 9
Wipro 549 478 -71 21 - 4 499 1 -1 32 56
Median of above - - 7 67 - 10 23 20 20
BSE Sensex 5,001 19,445 - - - - - 4 13 13 -
* Stock price and dividends adjusted for bonus issues, stock splits, rights, etc
% share stands for Dividend share in total return; % of PP stands for Dividends as % of Purchase Price
259 December 2011
Wealth Creation Study 2006-2011 Theme 2012
6. Characteristics of Blue Chips
The 6-screen filter used for shortlisting Blue Chips is heavily weighted towards earnings anddividends growth and quality. However, most of the companies which the filter threw up alsoconfirmed several other qualitative and quantitative traits of high quality stocks.
6.1. Business performance traits of Blue Chips
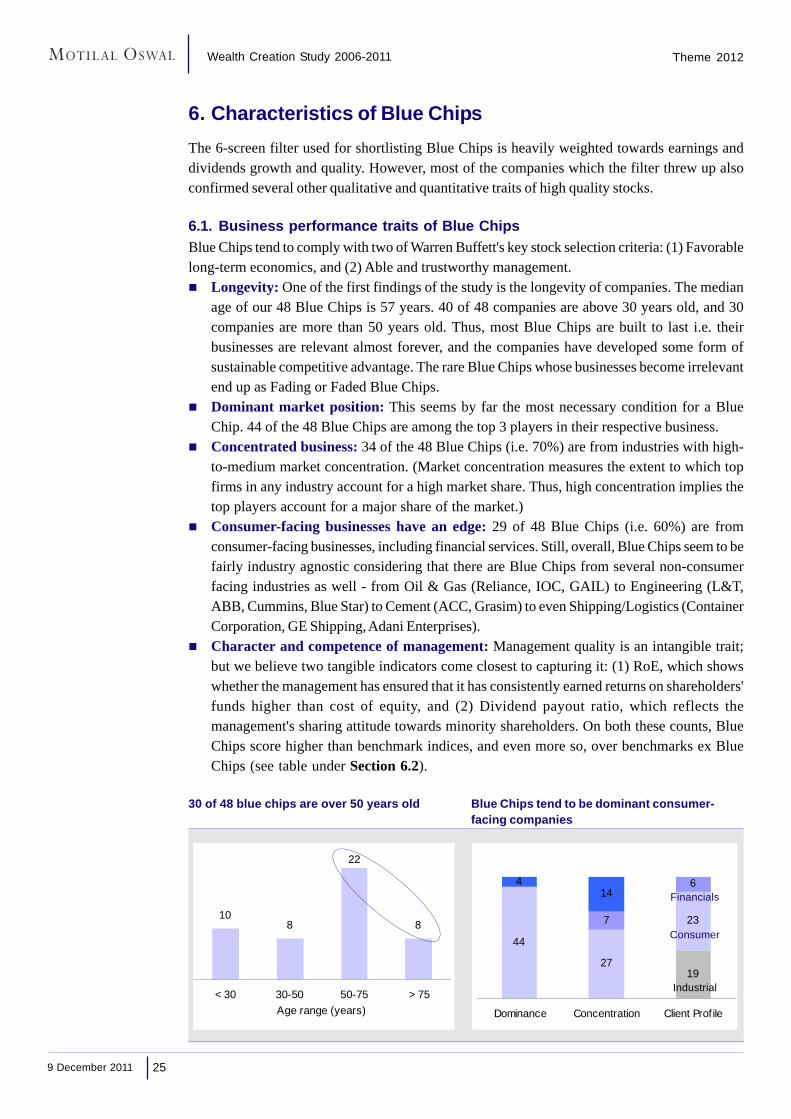
Blue Chips tend to comply with two of Warren Buffett's key stock selection criteria: (1) Favorablelong-term economics, and (2) Able and trustworthy management. Longevity: One of the first findings of the study is the longevity of companies. The median
age of our 48 Blue Chips is 57 years. 40 of 48 companies are above 30 years old, and 30companies are more than 50 years old. Thus, most Blue Chips are built to last i.e. theirbusinesses are relevant almost forever, and the companies have developed some form ofsustainable competitive advantage. The rare Blue Chips whose businesses become irrelevantend up as Fading or Faded Blue Chips.
Dominant market position: This seems by far the most necessary condition for a BlueChip. 44 of the 48 Blue Chips are among the top 3 players in their respective business.
Concentrated business: 34 of the 48 Blue Chips (i.e. 70%) are from industries with high-to-medium market concentration. (Market concentration measures the extent to which topfirms in any industry account for a high market share. Thus, high concentration implies thetop players account for a major share of the market.)
Consumer-facing businesses have an edge: 29 of 48 Blue Chips (i.e. 60%) are fromconsumer-facing businesses, including financial services. Still, overall, Blue Chips seem to befairly industry agnostic considering that there are Blue Chips from several non-consumerfacing industries as well - from Oil & Gas (Reliance, IOC, GAIL) to Engineering (L&T,ABB, Cummins, Blue Star) to Cement (ACC, Grasim) to even Shipping/Logistics (ContainerCorporation, GE Shipping, Adani Enterprises).
Character and competence of management: Management quality is an intangible trait;but we believe two tangible indicators come closest to capturing it: (1) RoE, which showswhether the management has ensured that it has consistently earned returns on shareholders'funds higher than cost of equity, and (2) Dividend payout ratio, which reflects themanagement's sharing attitude towards minority shareholders. On both these counts, BlueChips score higher than benchmark indices, and even more so, over benchmarks ex BlueChips (see table under Section 6.2).
30 of 48 blue chips are over 50 years old Blue Chips tend to be dominant consumer-facing companies
108 8
22
< 30 30-50 50-75 > 75
Age range (years)
44
2719
7 23
414
6
Dominance Concentration Client Profile
Industrial
Consumer
Financials
269 December 2011
Wealth Creation Study 2006-2011 Theme 2012
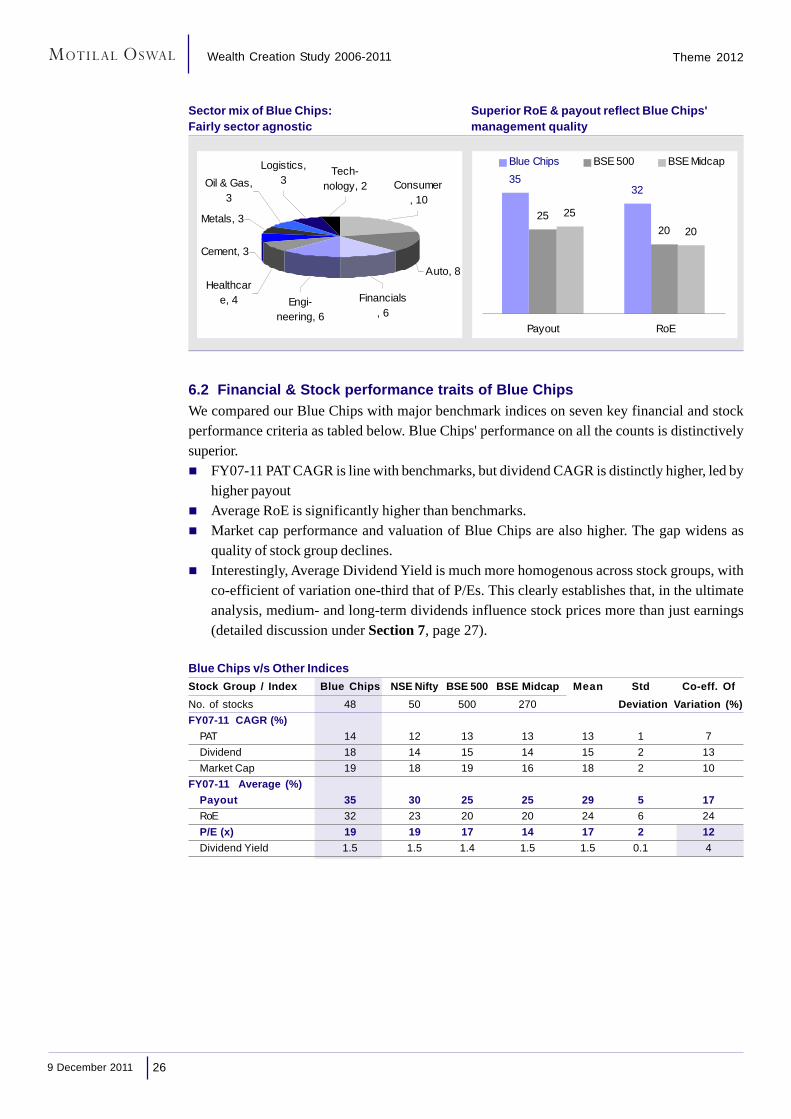
Sector mix of Blue Chips: Superior RoE & payout reflect Blue Chips'Fairly sector agnostic management quality
6.2 Financial & Stock performance traits of Blue Chips
We compared our Blue Chips with major benchmark indices on seven key financial and stockperformance criteria as tabled below. Blue Chips' performance on all the counts is distinctivelysuperior. FY07-11 PAT CAGR is line with benchmarks, but dividend CAGR is distinctly higher, led by
higher payout Average RoE is significantly higher than benchmarks. Market cap performance and valuation of Blue Chips are also higher. The gap widens as
quality of stock group declines. Interestingly, Average Dividend Yield is much more homogenous across stock groups, with
co-efficient of variation one-third that of P/Es. This clearly establishes that, in the ultimateanalysis, medium- and long-term dividends influence stock prices more than just earnings(detailed discussion under Section 7, page 27).
Blue Chips v/s Other Indices
Stock Group / Index Blue Chips NSE Nifty BSE 500 BSE Midcap Mean Std Co-eff. Of
No. of stocks 48 50 500 270 Deviation Variation (%)
FY07-11 CAGR (%)
PAT 14 12 13 13 13 1 7
Dividend 18 14 15 14 15 2 13
Market Cap 19 18 19 16 18 2 10
FY07-11 Average (%)
Payout 35 30 25 25 29 5 17
RoE 32 23 20 20 24 6 24
P/E (x) 19 19 17 14 17 2 12
Dividend Yield 1.5 1.5 1.4 1.5 1.5 0.1 4
Metals, 3
Tech-nology, 2
Logistics, 3Oil & Gas,
3
Cement, 3
Healthcare, 4 Engi-
neering, 6
Financials , 6
Auto, 8
Consumer, 10
3532
2520
25
20
Payout RoE
Blue Chips BSE 500 BSE Midcap
279 December 2011
Wealth Creation Study 2006-2011 Theme 2012
7. Valuation dilemma: Why are Blue Chips always expensive?
A common refrain of many investment practitioners is this - "Identifying a Blue Chip is relativelysimple. The tough part is deciding when to buy, because they always are so expensive." Thisconcern has been heightened given several cases of underperformance by Blue Chips evenwhen held for a very long period (e.g. HUL and Infosys discussed earlier).
We believe the approach to resolving this quality-valuation dilemma is two-pronged -1. Understanding the connection between payout and P/E; and2. Using the right valuation signals to judiciously buy into Blue Chips (see Section 8, page 30).
7.1. The connection between payout and P/E
Here again, we go back to the very basics of valuation for any asset, not just stocks –The intrinsic value of an asset is the present value of its lifetime cash flows.
For a long-term buy-and-hold investor, the real cash flow from a stock is dividend income over itslifetime. The value in this can be derived using the dividend discount model (DDM, also calledGordon Growth Model, propagated by one M J Gordon in 1959 -
where P = Price of the stock; D = Next expected dividend;
g = Dividend growth rate to perpetuity; k = Required rate of return (technically, Cost of equity)
P and D are absolute in INR; k and g are expressed in decimals (i.e. 10% growth = 0.1)
For the academically and mathematically inclined, the
derivation of Gordon model is presented on page 37
P =D
(k-g)
P =D
(k-g)
P/E =Payout
(k-g)P/E =
(D/E)
(k-g)
A small mathematical operation to the DDM is highly insightful -
Dividing both sides by E (earnings), we get -
i.e ................................................................................. (1)
In (1), if k-g = 0.01 (i.e. 1%), PE = Payout (i.e. Payout in decimals x 100) .............. (2)
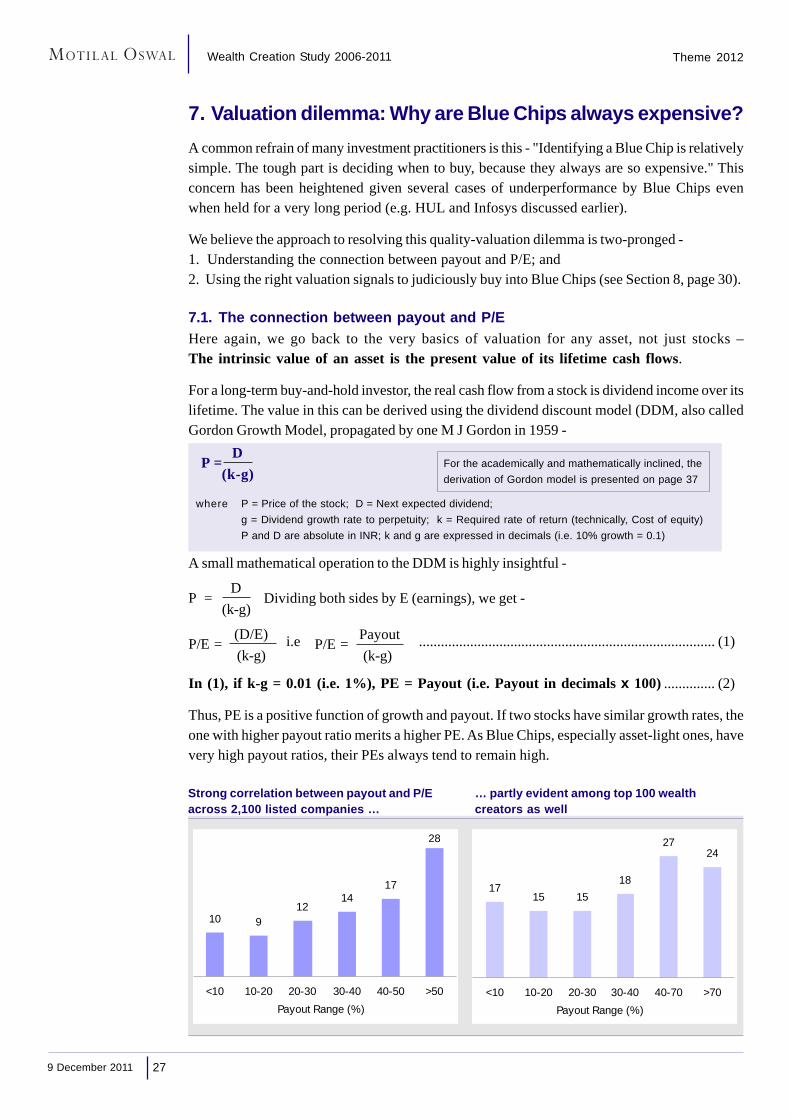
Thus, PE is a positive function of growth and payout. If two stocks have similar growth rates, theone with higher payout ratio merits a higher PE. As Blue Chips, especially asset-light ones, havevery high payout ratios, their PEs always tend to remain high.
10 912
1417
28
<10 10-20 20-30 30-40 40-50 >50
Payout Range (%)
1715 15
18
2724
<10 10-20 20-30 30-40 40-70 >70
Payout Range (%)
Strong correlation between payout and P/E … partly evident among top 100 wealthacross 2,100 listed companies … creators as well
289 December 2011
Wealth Creation Study 2006-2011 Theme 2012
The Dividend-Yield angle: The reason high payout companies enjoy high PEs is because ofthe dividend yield angle, which can be analyzed as follows -
i.e. .................................................................. (3)
Thus, if the PE for a high payout company drops (i.e. lower denominator equation (3) above),Dividend Yield becomes very attractive. Consider a company with a payout of 80% (such asHindustan Unilever) i.e. if EPS is INR100, Dividend Per Share is INR80. Now, if the P/E wereto be 15x (i.e. stock price of INR1,500), the Dividend Yield works out to an attractive 5.3% (80÷ 1,500), compared to the typical yield range of 1-3%.
Thus, even assuming the upper end of the yield band, for an 80% payout company, 27 (i.e. 80 ÷3) virtually becomes the floor P/E.
Again using (1), we get ............................................................................. (4)
Combining (3) and (4), we have k-g = Dividend Yield or k = g + Dividend Yield ………… (5)Thus, return is a positive function of growth and dividend yield.
The RoE angle: Finally, there is the RoE angle. It is wide acknowledged that companies withhigh RoE's merit high PE's, but the mathematical link is relatively less known -Price/Book Value (or MCap/NW) = MCap/PAT (i.e. PE) x PAT/NW (i.e. RoE) ……….. (6)Thus, if two stocks have similar earnings growth, the one with higher RoE should merit a higherPE multiple, else it becomes more attractive on a Price/Book basis.
Based on (1) to (6), the inferences are - Price and PE are positive functions of growth, dividend payout, and RoE. If Required rate of return (k) is less than or more or less equal to Expected actual rate of
return (growth + yield), the stock can be bought at prevailing price levels. If Required rate of return is meaningfully more than expected rate of return, then the P/E
or price paid will need to be much lower than that prevailing.
7.2. Case studies: How payouts influence P/Es
We studied 3 cases to examine our hypothesis that higher payouts typically mean higher P/Es.The case studies were done both across sectors and within sectors as follows -#1 - Infosys v/s Asian Paints and Hindustan Unilever#2 - ACC v/s Birla Corporation (both from Cement sector)#3 - HDFC v/s Shriram Transport Finance (both Non-Banking Financials)
The hypothesis holds true in all the three cases.
7.2.1 Case Study #1: Infosys v/s Asian Paints and HULWe compared the last five years' payout ratios and P/Es of Infosys with Asian Paints andHindustan Unilever to test the hypothesis that higher payouts typically mean higher P/Es. AsianPaints' average payout is 39% v/s 31% for Infosys, and average P/E is 26x v/s 22x for Infosys.However, here, it may be argued that Asian Paints' higher PAT CAGR of 31% v/s 15% forInfosys is the main reason for P/E differential.
k-g =Payout
PE
P/ED/P =
D/EDividend Yield =
Payout
P/E
299 December 2011
Wealth Creation Study 2006-2011 Theme 2012
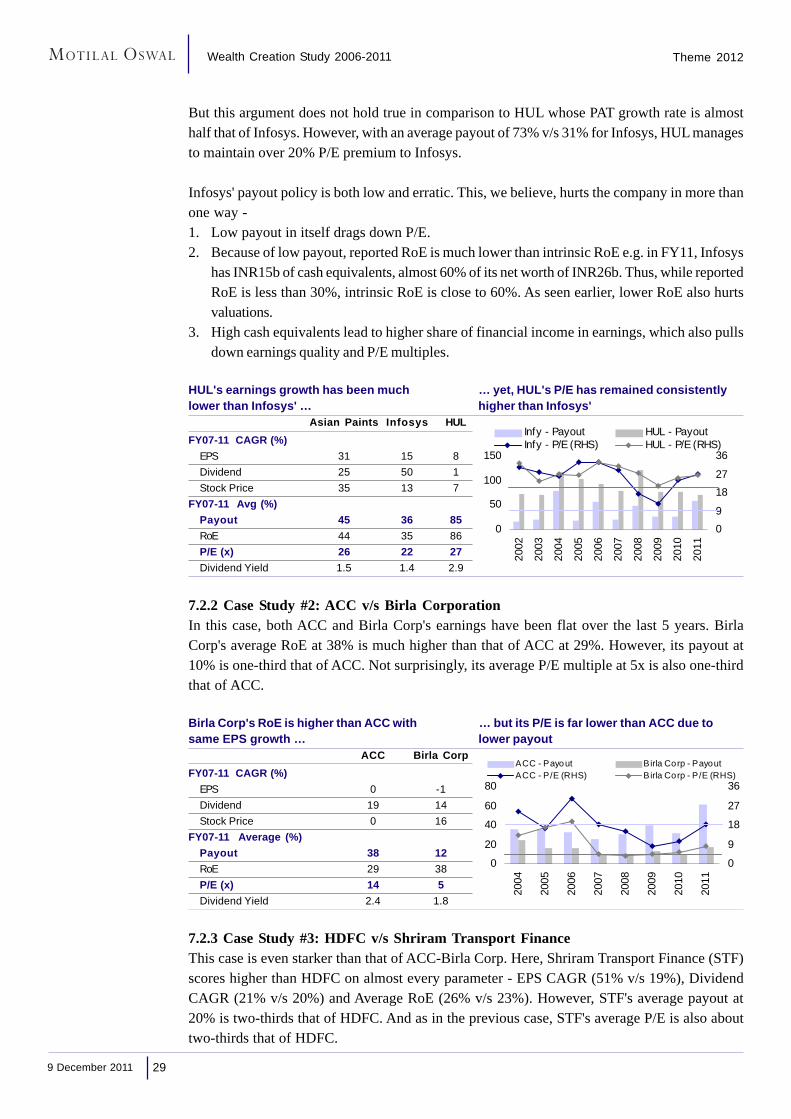
But this argument does not hold true in comparison to HUL whose PAT growth rate is almosthalf that of Infosys. However, with an average payout of 73% v/s 31% for Infosys, HUL managesto maintain over 20% P/E premium to Infosys.
Infosys' payout policy is both low and erratic. This, we believe, hurts the company in more thanone way -1. Low payout in itself drags down P/E.2. Because of low payout, reported RoE is much lower than intrinsic RoE e.g. in FY11, Infosys
has INR15b of cash equivalents, almost 60% of its net worth of INR26b. Thus, while reportedRoE is less than 30%, intrinsic RoE is close to 60%. As seen earlier, lower RoE also hurtsvaluations.
3. High cash equivalents lead to higher share of financial income in earnings, which also pullsdown earnings quality and P/E multiples.
HUL's earnings growth has been much … yet, HUL's P/E has remained consistentlylower than Infosys' … higher than Infosys'
Asian Paints Infosys HUL
FY07-11 CAGR (%)
EPS 31 15 8
Dividend 25 50 1
Stock Price 35 13 7
FY07-11 Avg (%)
Payout 45 36 85
RoE 44 35 86
P/E (x) 26 22 27
Dividend Yield 1.5 1.4 2.9
7.2.2 Case Study #2: ACC v/s Birla CorporationIn this case, both ACC and Birla Corp's earnings have been flat over the last 5 years. BirlaCorp's average RoE at 38% is much higher than that of ACC at 29%. However, its payout at10% is one-third that of ACC. Not surprisingly, its average P/E multiple at 5x is also one-thirdthat of ACC.
Birla Corp's RoE is higher than ACC with … but its P/E is far lower than ACC due tosame EPS growth … lower payout
ACC Birla Corp
FY07-11 CAGR (%)
EPS 0 -1
Dividend 19 14
Stock Price 0 16
FY07-11 Average (%)
Payout 38 12
RoE 29 38
P/E (x) 14 5
Dividend Yield 2.4 1.8
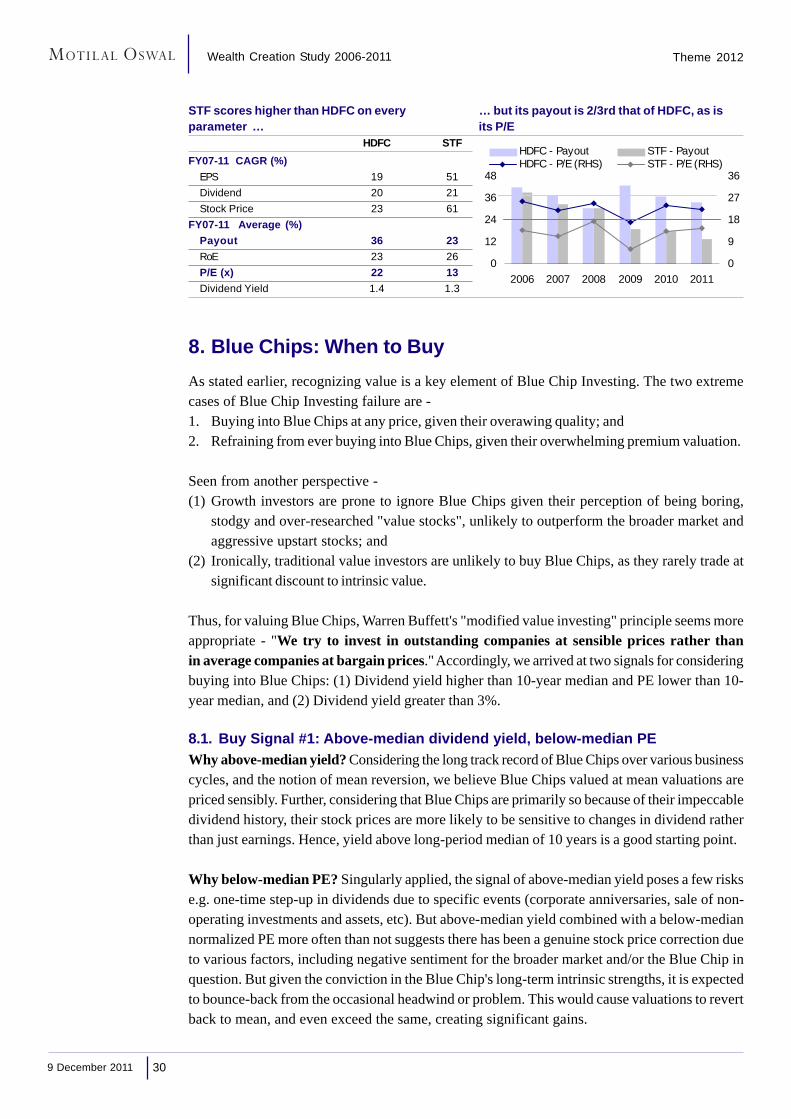
7.2.3 Case Study #3: HDFC v/s Shriram Transport FinanceThis case is even starker than that of ACC-Birla Corp. Here, Shriram Transport Finance (STF)scores higher than HDFC on almost every parameter - EPS CAGR (51% v/s 19%), DividendCAGR (21% v/s 20%) and Average RoE (26% v/s 23%). However, STF's average payout at20% is two-thirds that of HDFC. And as in the previous case, STF's average P/E is also abouttwo-thirds that of HDFC.
0
50
100
150
2002
2003
2004
2005
2006
2007
2008
2009
2010
2011
0
9
18
27
36
Infy - Payout HUL - PayoutInfy - P/E (RHS) HUL - P/E (RHS)
0
20
40
60
80
2004
2005
2006
2007
2008
2009
2010
2011
0
9
18
27
36
ACC - Payout Birla Corp - PayoutACC - P/E (RHS) Birla Corp - P/E (RHS)
309 December 2011
Wealth Creation Study 2006-2011 Theme 2012
STF scores higher than HDFC on every … but its payout is 2/3rd that of HDFC, as isparameter … its P/E
HDFC STF
FY07-11 CAGR (%)
EPS 19 51
Dividend 20 21
Stock Price 23 61
FY07-11 Average (%)
Payout 36 23
RoE 23 26
P/E (x) 22 13
Dividend Yield 1.4 1.3
8. Blue Chips: When to Buy
As stated earlier, recognizing value is a key element of Blue Chip Investing. The two extremecases of Blue Chip Investing failure are -1. Buying into Blue Chips at any price, given their overawing quality; and2. Refraining from ever buying into Blue Chips, given their overwhelming premium valuation.
Seen from another perspective -(1) Growth investors are prone to ignore Blue Chips given their perception of being boring,
stodgy and over-researched "value stocks", unlikely to outperform the broader market andaggressive upstart stocks; and
(2) Ironically, traditional value investors are unlikely to buy Blue Chips, as they rarely trade atsignificant discount to intrinsic value.
Thus, for valuing Blue Chips, Warren Buffett's "modified value investing" principle seems moreappropriate - "We try to invest in outstanding companies at sensible prices rather thanin average companies at bargain prices." Accordingly, we arrived at two signals for consideringbuying into Blue Chips: (1) Dividend yield higher than 10-year median and PE lower than 10-year median, and (2) Dividend yield greater than 3%.
8.1. Buy Signal #1: Above-median dividend yield, below-median PE
Why above-median yield? Considering the long track record of Blue Chips over various businesscycles, and the notion of mean reversion, we believe Blue Chips valued at mean valuations arepriced sensibly. Further, considering that Blue Chips are primarily so because of their impeccabledividend history, their stock prices are more likely to be sensitive to changes in dividend ratherthan just earnings. Hence, yield above long-period median of 10 years is a good starting point.
Why below-median PE? Singularly applied, the signal of above-median yield poses a few riskse.g. one-time step-up in dividends due to specific events (corporate anniversaries, sale of non-operating investments and assets, etc). But above-median yield combined with a below-mediannormalized PE more often than not suggests there has been a genuine stock price correction dueto various factors, including negative sentiment for the broader market and/or the Blue Chip inquestion. But given the conviction in the Blue Chip's long-term intrinsic strengths, it is expectedto bounce-back from the occasional headwind or problem. This would cause valuations to revertback to mean, and even exceed the same, creating significant gains.
0
12
24
36
48
2006 2007 2008 2009 2010 2011
0
9
18
27
36
HDFC - Payout STF - PayoutHDFC - P/E (RHS) STF - P/E (RHS)
319 December 2011
Wealth Creation Study 2006-2011 Theme 2012
8.2. Buy Signal #2: Dividend yield greater than 3%
As observed earlier, dividend yields in India across stock groups have hovered around 1.5%.Hence, if a Blue Chip stock offers a dividend yield of over 3%, it implies there has been a sharpcorrection in prices and/or step-up in dividend, and hence a Buy signal.
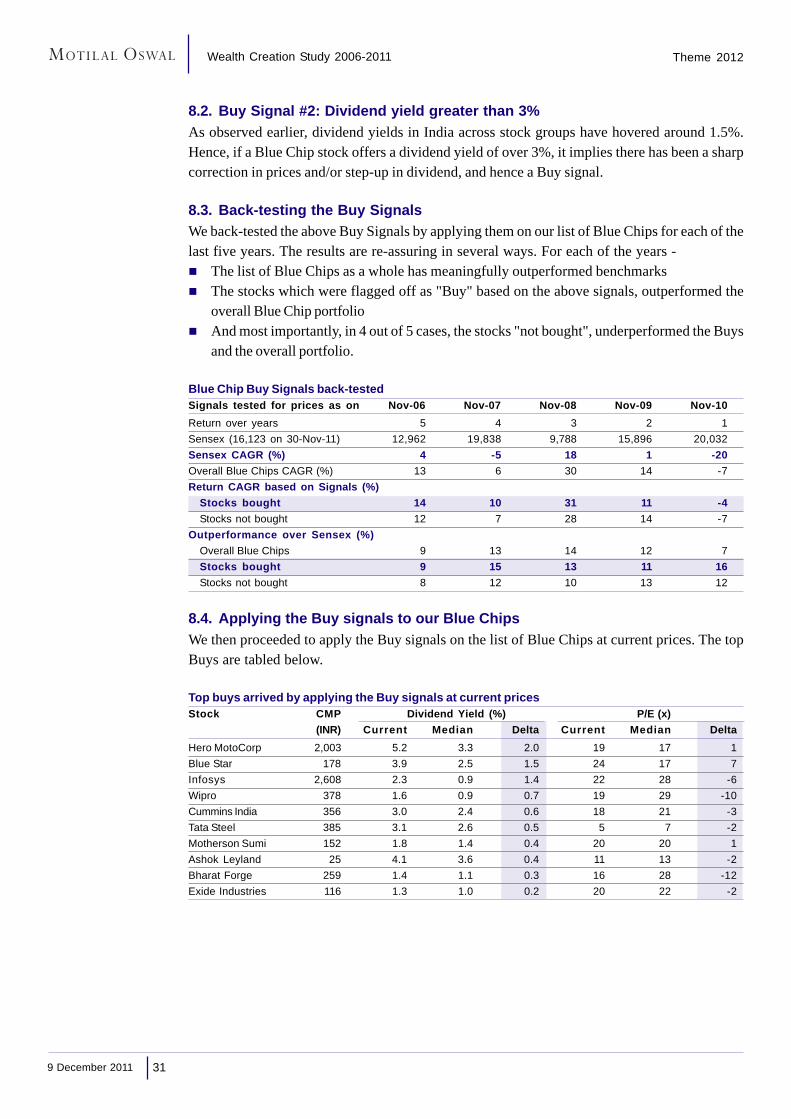
8.3. Back-testing the Buy Signals
We back-tested the above Buy Signals by applying them on our list of Blue Chips for each of thelast five years. The results are re-assuring in several ways. For each of the years - The list of Blue Chips as a whole has meaningfully outperformed benchmarks The stocks which were flagged off as "Buy" based on the above signals, outperformed the
overall Blue Chip portfolio And most importantly, in 4 out of 5 cases, the stocks "not bought", underperformed the Buys
and the overall portfolio.
Blue Chip Buy Signals back-testedSignals tested for prices as on Nov-06 Nov-07 Nov-08 Nov-09 Nov-10
Return over years 5 4 3 2 1
Sensex (16,123 on 30-Nov-11) 12,962 19,838 9,788 15,896 20,032
Sensex CAGR (%) 4 -5 18 1 -20
Overall Blue Chips CAGR (%) 13 6 30 14 -7
Return CAGR based on Signals (%)
Stocks bought 14 10 31 11 -4
Stocks not bought 12 7 28 14 -7
Outperformance over Sensex (%)
Overall Blue Chips 9 13 14 12 7
Stocks bought 9 15 13 11 16
Stocks not bought 8 12 10 13 12
8.4. Applying the Buy signals to our Blue Chips
We then proceeded to apply the Buy signals on the list of Blue Chips at current prices. The topBuys are tabled below.
Top buys arrived by applying the Buy signals at current pricesStock CMP Dividend Yield (%) P/E (x)
(INR) Current Median Delta Current Median Delta
Hero MotoCorp 2,003 5.2 3.3 2.0 19 17 1
Blue Star 178 3.9 2.5 1.5 24 17 7
Infosys 2,608 2.3 0.9 1.4 22 28 -6
Wipro 378 1.6 0.9 0.7 19 29 -10
Cummins India 356 3.0 2.4 0.6 18 21 -3
Tata Steel 385 3.1 2.6 0.5 5 7 -2
Motherson Sumi 152 1.8 1.4 0.4 20 20 1
Ashok Leyland 25 4.1 3.6 0.4 11 13 -2
Bharat Forge 259 1.4 1.1 0.3 16 28 -12
Exide Industries 116 1.3 1.0 0.2 20 22 -2
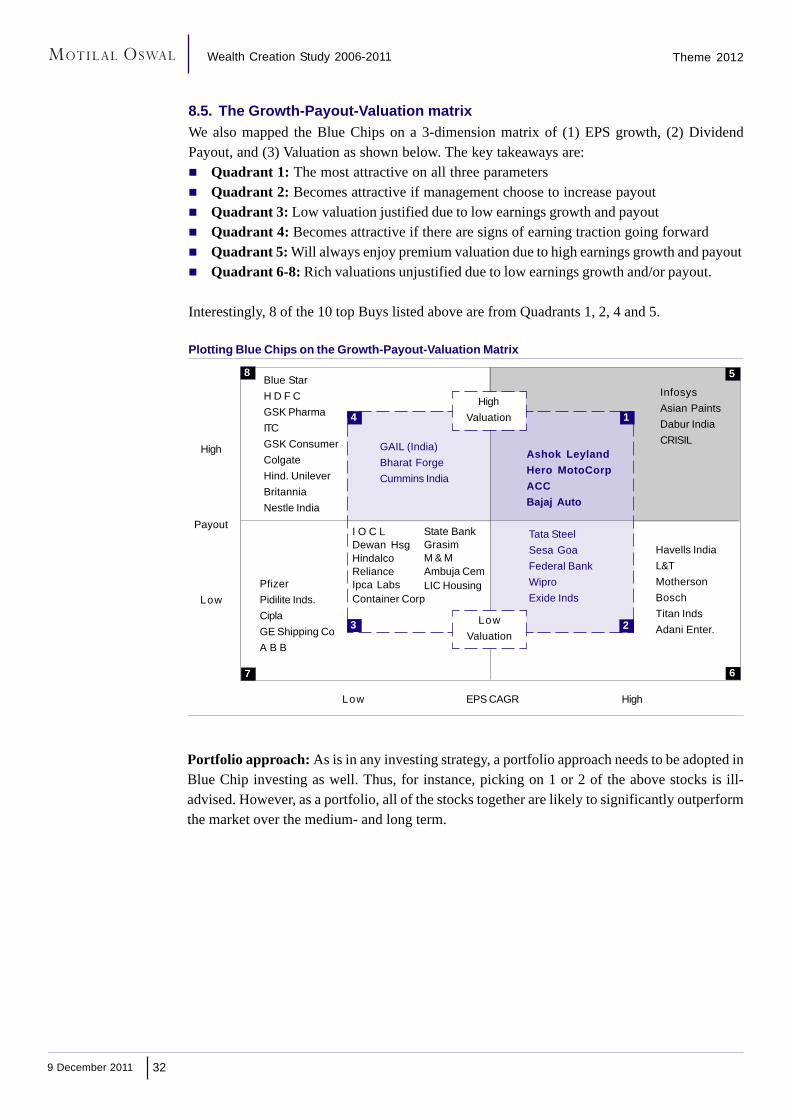
329 December 2011
Wealth Creation Study 2006-2011 Theme 2012
8.5. The Growth-Payout-Valuation matrix
We also mapped the Blue Chips on a 3-dimension matrix of (1) EPS growth, (2) DividendPayout, and (3) Valuation as shown below. The key takeaways are: Quadrant 1: The most attractive on all three parameters Quadrant 2: Becomes attractive if management choose to increase payout Quadrant 3: Low valuation justified due to low earnings growth and payout Quadrant 4: Becomes attractive if there are signs of earning traction going forward Quadrant 5: Will always enjoy premium valuation due to high earnings growth and payout Quadrant 6-8: Rich valuations unjustified due to low earnings growth and/or payout.
Interestingly, 8 of the 10 top Buys listed above are from Quadrants 1, 2, 4 and 5.
Plotting Blue Chips on the Growth-Payout-Valuation Matrix
Portfolio approach: As is in any investing strategy, a portfolio approach needs to be adopted inBlue Chip investing as well. Thus, for instance, picking on 1 or 2 of the above stocks is ill-advised. However, as a portfolio, all of the stocks together are likely to significantly outperformthe market over the medium- and long term.
Low
Payout
High
Infosys
Asian Paints
Dabur India
CRISIL
Havells India
L&T
Motherson
Bosch
Titan Inds
Adani Enter.
Blue Star
H D F C
GSK Pharma
ITC
GSK Consumer
Colgate
Hind. Unilever
Britannia
Nestle India
Pfizer
Pidilite Inds.
Cipla
GE Shipping Co
A B B
Ashok Leyland
Hero MotoCorp
ACC
Bajaj Auto
Tata Steel
Sesa Goa
Federal Bank
Wipro
Exide Inds
GAIL (India)
Bharat Forge
Cummins India
I O C LDewan HsgHindalcoRelianceIpca LabsContainer Corp
State BankGrasimM & MAmbuja CemLIC Housing
High
Valuation
Low
Valuation
EPS CAGRLow High
1
8
7
5
6
4
23
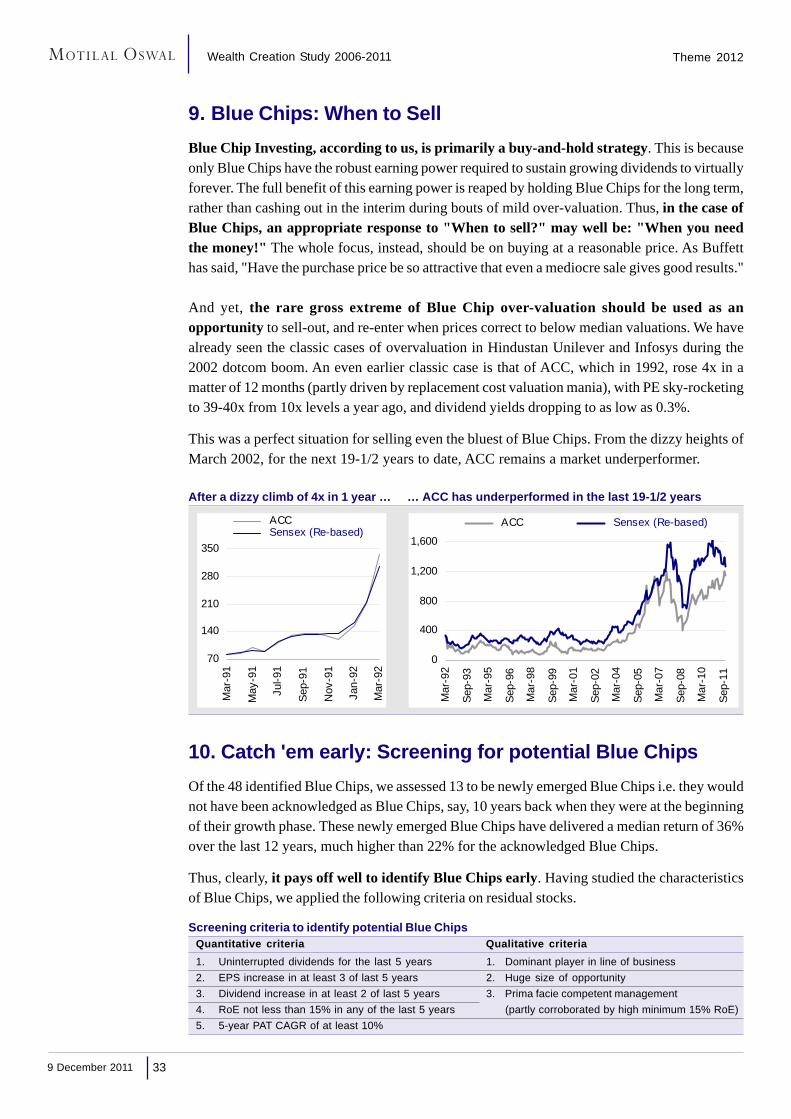
339 December 2011
Wealth Creation Study 2006-2011 Theme 2012
9. Blue Chips: When to Sell
Blue Chip Investing, according to us, is primarily a buy-and-hold strategy. This is becauseonly Blue Chips have the robust earning power required to sustain growing dividends to virtuallyforever. The full benefit of this earning power is reaped by holding Blue Chips for the long term,rather than cashing out in the interim during bouts of mild over-valuation. Thus, in the case ofBlue Chips, an appropriate response to "When to sell?" may well be: "When you needthe money!" The whole focus, instead, should be on buying at a reasonable price. As Buffetthas said, "Have the purchase price be so attractive that even a mediocre sale gives good results."
And yet, the rare gross extreme of Blue Chip over-valuation should be used as anopportunity to sell-out, and re-enter when prices correct to below median valuations. We havealready seen the classic cases of overvaluation in Hindustan Unilever and Infosys during the2002 dotcom boom. An even earlier classic case is that of ACC, which in 1992, rose 4x in amatter of 12 months (partly driven by replacement cost valuation mania), with PE sky-rocketingto 39-40x from 10x levels a year ago, and dividend yields dropping to as low as 0.3%.
This was a perfect situation for selling even the bluest of Blue Chips. From the dizzy heights ofMarch 2002, for the next 19-1/2 years to date, ACC remains a market underperformer.
After a dizzy climb of 4x in 1 year … … ACC has underperformed in the last 19-1/2 years
10. Catch 'em early: Screening for potential Blue Chips
Of the 48 identified Blue Chips, we assessed 13 to be newly emerged Blue Chips i.e. they wouldnot have been acknowledged as Blue Chips, say, 10 years back when they were at the beginningof their growth phase. These newly emerged Blue Chips have delivered a median return of 36%over the last 12 years, much higher than 22% for the acknowledged Blue Chips.
Thus, clearly, it pays off well to identify Blue Chips early. Having studied the characteristicsof Blue Chips, we applied the following criteria on residual stocks.
Screening criteria to identify potential Blue ChipsQuantitative criteria Qualitative criteria
1. Uninterrupted dividends for the last 5 years 1. Dominant player in line of business
2. EPS increase in at least 3 of last 5 years 2. Huge size of opportunity
3. Dividend increase in at least 2 of last 5 years 3. Prima facie competent management
4. RoE not less than 15% in any of the last 5 years (partly corroborated by high minimum 15% RoE)
5. 5-year PAT CAGR of at least 10%
70
140
210
280
350
Mar
-91
May
-91
Jul-9
1
Sep
-91
Nov
-91
Jan-
92
Mar
-92
ACC Sensex (Re-based)
0
400
800
1,200
1,600
Mar
-92
Sep
-93
Mar
-95
Sep
-96
Mar
-98
Sep
-99
Mar
-01
Sep
-02
Mar
-04
Sep
-05
Mar
-07
Sep
-08
Mar
-10
Sep
-11
ACC Sensex (Re-based)
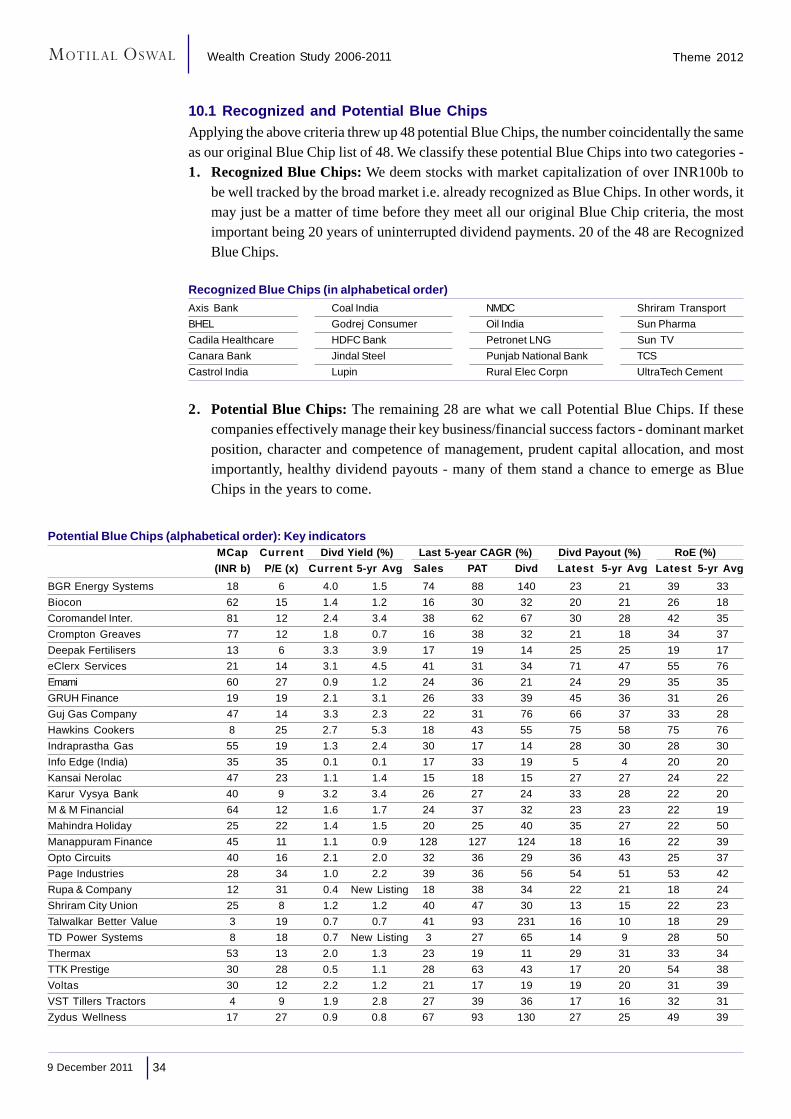
349 December 2011
Wealth Creation Study 2006-2011 Theme 2012
10.1 Recognized and Potential Blue Chips
Applying the above criteria threw up 48 potential Blue Chips, the number coincidentally the sameas our original Blue Chip list of 48. We classify these potential Blue Chips into two categories -1. Recognized Blue Chips: We deem stocks with market capitalization of over INR100b to
be well tracked by the broad market i.e. already recognized as Blue Chips. In other words, itmay just be a matter of time before they meet all our original Blue Chip criteria, the mostimportant being 20 years of uninterrupted dividend payments. 20 of the 48 are RecognizedBlue Chips.
Recognized Blue Chips (in alphabetical order)
Axis Bank Coal India NMDC Shriram Transport
BHEL Godrej Consumer Oil India Sun Pharma
Cadila Healthcare HDFC Bank Petronet LNG Sun TV
Canara Bank Jindal Steel Punjab National Bank TCS
Castrol India Lupin Rural Elec Corpn UltraTech Cement
2. Potential Blue Chips: The remaining 28 are what we call Potential Blue Chips. If thesecompanies effectively manage their key business/financial success factors - dominant marketposition, character and competence of management, prudent capital allocation, and mostimportantly, healthy dividend payouts - many of them stand a chance to emerge as BlueChips in the years to come.
Potential Blue Chips (alphabetical order): Key indicatorsMCap Current Divd Yield (%) Last 5-year CAGR (%) Divd Payout (%) RoE (%)
(INR b) P/E (x) Current 5-yr Avg Sales PAT Divd Latest 5-yr Avg Latest 5-yr Avg
BGR Energy Systems 18 6 4.0 1.5 74 88 140 23 21 39 33
Biocon 62 15 1.4 1.2 16 30 32 20 21 26 18
Coromandel Inter. 81 12 2.4 3.4 38 62 67 30 28 42 35
Crompton Greaves 77 12 1.8 0.7 16 38 32 21 18 34 37
Deepak Fertilisers 13 6 3.3 3.9 17 19 14 25 25 19 17
eClerx Services 21 14 3.1 4.5 41 31 34 71 47 55 76
Emami 60 27 0.9 1.2 24 36 21 24 29 35 35
GRUH Finance 19 19 2.1 3.1 26 33 39 45 36 31 26
Guj Gas Company 47 14 3.3 2.3 22 31 76 66 37 33 28
Hawkins Cookers 8 25 2.7 5.3 18 43 55 75 58 75 76
Indraprastha Gas 55 19 1.3 2.4 30 17 14 28 30 28 30
Info Edge (India) 35 35 0.1 0.1 17 33 19 5 4 20 20
Kansai Nerolac 47 23 1.1 1.4 15 18 15 27 27 24 22
Karur Vysya Bank 40 9 3.2 3.4 26 27 24 33 28 22 20
M & M Financial 64 12 1.6 1.7 24 37 32 23 23 22 19
Mahindra Holiday 25 22 1.4 1.5 20 25 40 35 27 22 50
Manappuram Finance 45 11 1.1 0.9 128 127 124 18 16 22 39
Opto Circuits 40 16 2.1 2.0 32 36 29 36 43 25 37
Page Industries 28 34 1.0 2.2 39 36 56 54 51 53 42
Rupa & Company 12 31 0.4 New Listing 18 38 34 22 21 18 24
Shriram City Union 25 8 1.2 1.2 40 47 30 13 15 22 23
Talwalkar Better Value 3 19 0.7 0.7 41 93 231 16 10 18 29
TD Power Systems 8 18 0.7 New Listing 3 27 65 14 9 28 50
Thermax 53 13 2.0 1.3 23 19 11 29 31 33 34
TTK Prestige 30 28 0.5 1.1 28 63 43 17 20 54 38
Voltas 30 12 2.2 1.2 21 17 19 19 20 31 39
VST Tillers Tractors 4 9 1.9 2.8 27 39 36 17 16 32 31
Zydus Wellness 17 27 0.9 0.8 67 93 130 27 25 49 39
359 December 2011
Wealth Creation Study 2006-2011 Theme 2012
11. Conclusions
Financials have emerged as the largest wealth creating sector for the first time ever. Goingforward, expect the sector to maintain its top slot led by existing and new private banks, andeventual listing of insurance companies.
Very fast growth in stock prices creates transitory multi-baggers. In most cases, what followsis prolonged and painful price and/or time correction.
Blue chips are fountains of dividend, and offer as much, if not more, investment growthpotential than lesser quality companies, but with far less risk.
In investing, there is no profitable substitute for quality. Understanding quality of the companydoesn't stop at profits and profitability, it must extend to dividend payouts and longevity.
Most Blue Chips enjoy premium valuation. In deciding when to buy, one should focus notonly on P/E, but also consider payout ratio, relative dividend yield, and earnings growthpotential.
In India, over last 20 years, Blue Chips have significantly outperformed benchmark indiceswith much lower risk.
"The risk of paying too high a price for good-quality stocks — while a real one — is not the chief
hazard confronting the average buyer of securities. Observation over many years has taught us
that the chief losses to investors come from the purchase of low-quality securities at times of
favorable business conditions."
— Benjamin Graham, The Intelligent Investor
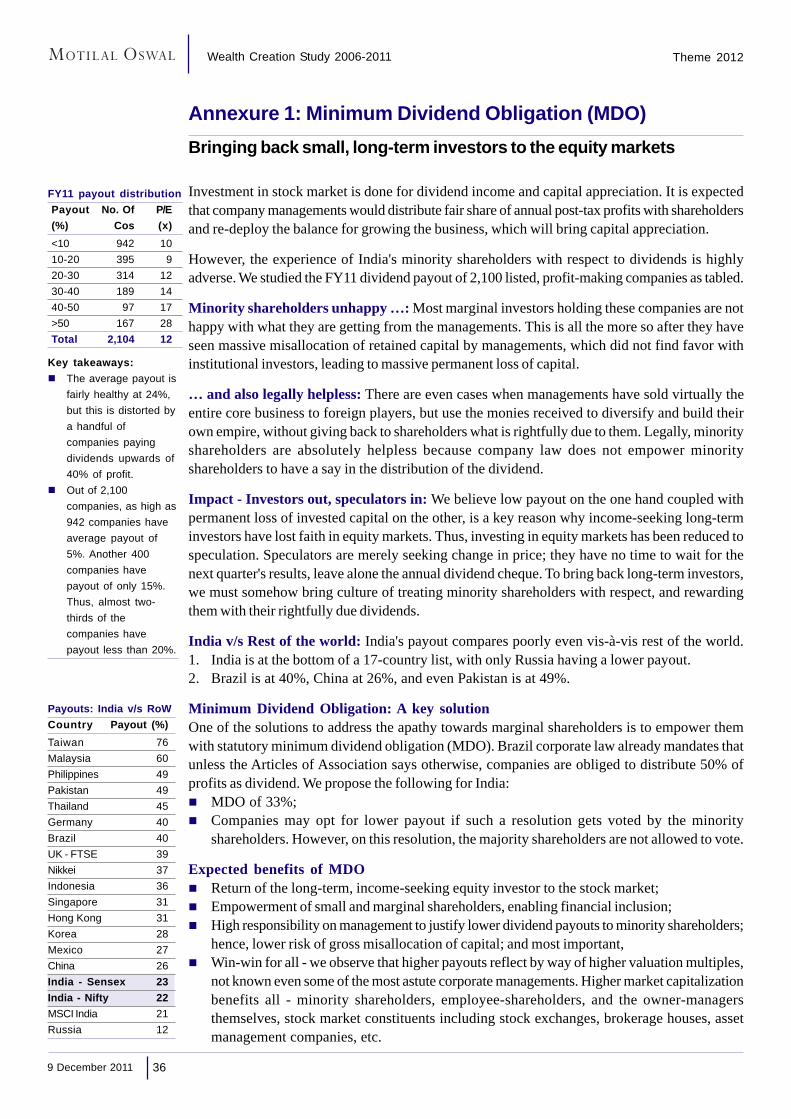
369 December 2011
Wealth Creation Study 2006-2011 Theme 2012
Annexure 1: Minimum Dividend Obligation (MDO)
Bringing back small, long-term investors to the equity markets
Investment in stock market is done for dividend income and capital appreciation. It is expectedthat company managements would distribute fair share of annual post-tax profits with shareholdersand re-deploy the balance for growing the business, which will bring capital appreciation.
However, the experience of India's minority shareholders with respect to dividends is highlyadverse. We studied the FY11 dividend payout of 2,100 listed, profit-making companies as tabled.
Minority shareholders unhappy …: Most marginal investors holding these companies are nothappy with what they are getting from the managements. This is all the more so after they haveseen massive misallocation of retained capital by managements, which did not find favor withinstitutional investors, leading to massive permanent loss of capital.
… and also legally helpless: There are even cases when managements have sold virtually theentire core business to foreign players, but use the monies received to diversify and build theirown empire, without giving back to shareholders what is rightfully due to them. Legally, minorityshareholders are absolutely helpless because company law does not empower minorityshareholders to have a say in the distribution of the dividend.
Impact - Investors out, speculators in: We believe low payout on the one hand coupled withpermanent loss of invested capital on the other, is a key reason why income-seeking long-terminvestors have lost faith in equity markets. Thus, investing in equity markets has been reduced tospeculation. Speculators are merely seeking change in price; they have no time to wait for thenext quarter's results, leave alone the annual dividend cheque. To bring back long-term investors,we must somehow bring culture of treating minority shareholders with respect, and rewardingthem with their rightfully due dividends.
India v/s Rest of the world: India's payout compares poorly even vis-à-vis rest of the world.1. India is at the bottom of a 17-country list, with only Russia having a lower payout.2. Brazil is at 40%, China at 26%, and even Pakistan is at 49%.
Minimum Dividend Obligation: A key solutionOne of the solutions to address the apathy towards marginal shareholders is to empower themwith statutory minimum dividend obligation (MDO). Brazil corporate law already mandates thatunless the Articles of Association says otherwise, companies are obliged to distribute 50% ofprofits as dividend. We propose the following for India: MDO of 33%; Companies may opt for lower payout if such a resolution gets voted by the minority
shareholders. However, on this resolution, the majority shareholders are not allowed to vote.
Expected benefits of MDO Return of the long-term, income-seeking equity investor to the stock market; Empowerment of small and marginal shareholders, enabling financial inclusion; High responsibility on management to justify lower dividend payouts to minority shareholders;
hence, lower risk of gross misallocation of capital; and most important, Win-win for all - we observe that higher payouts reflect by way of higher valuation multiples,
not known even some of the most astute corporate managements. Higher market capitalizationbenefits all - minority shareholders, employee-shareholders, and the owner-managersthemselves, stock market constituents including stock exchanges, brokerage houses, assetmanagement companies, etc.
FY11 payout distribution
Payout No. Of P/E
(%) Cos (x)
<10 942 10
10-20 395 9
20-30 314 12
30-40 189 14
40-50 97 17
>50 167 28
Total 2,104 12
Payouts: India v/s RoW
Country Payout (%)
Taiwan 76
Malaysia 60
Philippines 49
Pakistan 49
Thailand 45
Germany 40
Brazil 40
UK - FTSE 39
Nikkei 37
Indonesia 36
Singapore 31
Hong Kong 31
Korea 28
Mexico 27
China 26
India - Sensex 23
India - Nifty 22
MSCI India 21
Russia 12
Key takeaways:
The average payout is
fairly healthy at 24%,
but this is distorted by
a handful of
companies paying
dividends upwards of
40% of profit.
Out of 2,100
companies, as high as
942 companies have
average payout of
5%. Another 400
companies have
payout of only 15%.
Thus, almost two-
thirds of the
companies have
payout less than 20%.
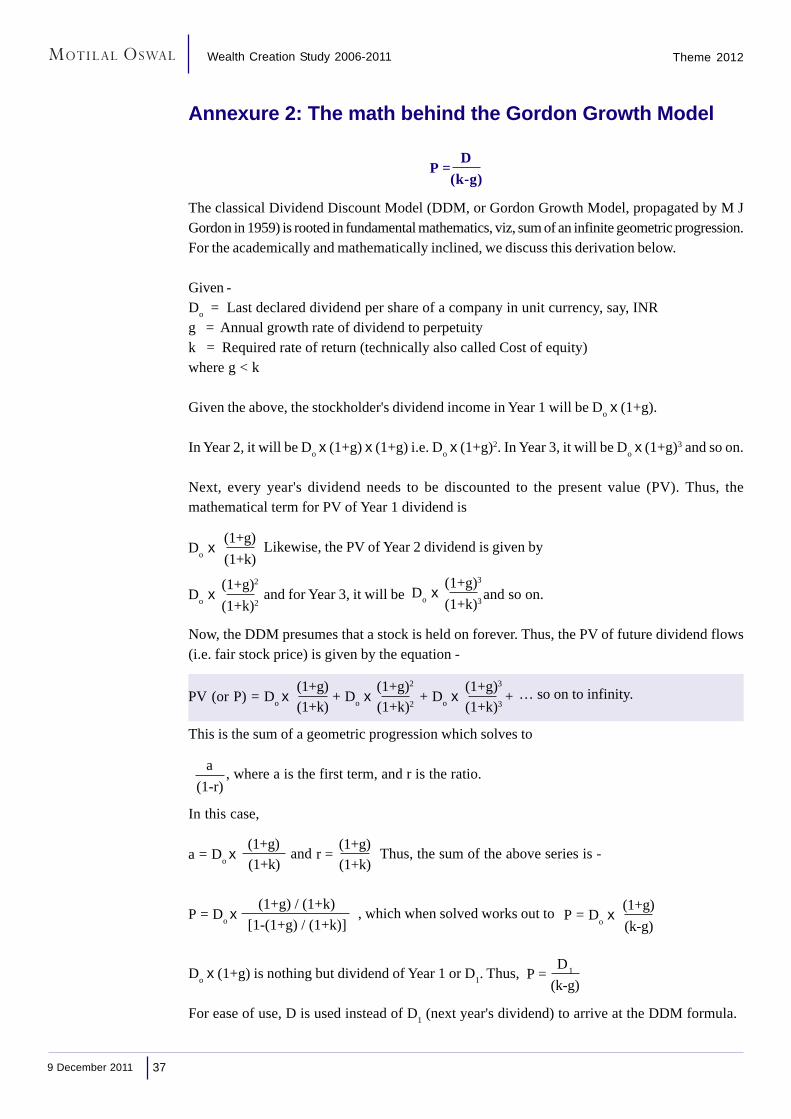
379 December 2011
Wealth Creation Study 2006-2011 Theme 2012
Annexure 2: The math behind the Gordon Growth Model
The classical Dividend Discount Model (DDM, or Gordon Growth Model, propagated by M JGordon in 1959) is rooted in fundamental mathematics, viz, sum of an infinite geometric progression.For the academically and mathematically inclined, we discuss this derivation below.
Given -D
o = Last declared dividend per share of a company in unit currency, say, INR
g = Annual growth rate of dividend to perpetuityk = Required rate of return (technically also called Cost of equity)where g < k
Given the above, the stockholder's dividend income in Year 1 will be Do x (1+g).
In Year 2, it will be Do x (1+g) x (1+g) i.e. D
o x (1+g)2. In Year 3, it will be D
o x (1+g)3 and so on.
Next, every year's dividend needs to be discounted to the present value (PV). Thus, themathematical term for PV of Year 1 dividend is
Likewise, the PV of Year 2 dividend is given by
and for Year 3, it will be and so on.
Now, the DDM presumes that a stock is held on forever. Thus, the PV of future dividend flows(i.e. fair stock price) is given by the equation -
… so on to infinity.
This is the sum of a geometric progression which solves to
, where a is the first term, and r is the ratio.
In this case,
and Thus, the sum of the above series is -
, which when solved works out to
Do x (1+g) is nothing but dividend of Year 1 or D
1. Thus,
For ease of use, D is used instead of D1 (next year's dividend) to arrive at the DDM formula.
P =D
(k-g)
Do x
(1+g)
(1+k)
Do x
(1+g)2
(1+k)2D
o x
(1+g)3
(1+k)3
PV (or P) = Do x
(1+g)
(1+k)+ D
o x
(1+g)2
(1+k)2+ D
o x
(1+g)3
(1+k)3+
a
(1-r)
a = Do x
(1+g)
(1+k)r =
(1+g)
(1+k)
P = Do x
(1+g) / (1+k)
[1-(1+g) / (1+k)]P = D
o x
(1+g)
(k-g)
P =D
1
(k-g)
389 December 2011
Wealth Creation Study 2006-2011
Wealth Creation
2006-2011
The 16TH Annual Study
Market Outlook
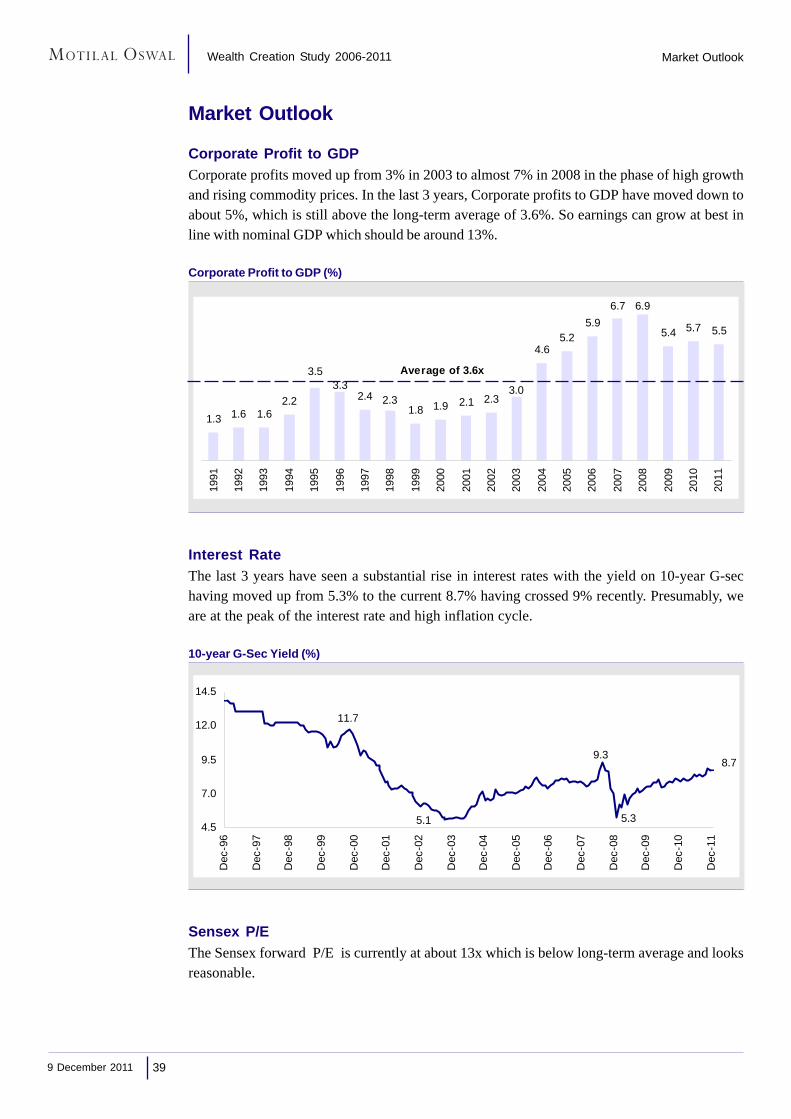
399 December 2011
Wealth Creation Study 2006-2011 Market Outlook
Market Outlook
Corporate Profit to GDP
Corporate profits moved up from 3% in 2003 to almost 7% in 2008 in the phase of high growthand rising commodity prices. In the last 3 years, Corporate profits to GDP have moved down toabout 5%, which is still above the long-term average of 3.6%. So earnings can grow at best inline with nominal GDP which should be around 13%.
Corporate Profit to GDP (%)
Interest Rate
The last 3 years have seen a substantial rise in interest rates with the yield on 10-year G-sechaving moved up from 5.3% to the current 8.7% having crossed 9% recently. Presumably, weare at the peak of the interest rate and high inflation cycle.
10-year G-Sec Yield (%)
1.3 1.6 1.62.2 2.4
1.8 1.9 2.1 2.3
4.65.2
5.9
6.7 6.9
5.4 5.7 5.5
2.33.03.3
3.5
1991
1992
1993
1994
1995
1996
1997
1998
1999
2000
2001
2002
2003
2004
2005
2006
2007
2008
2009
2010
2011
Average of 3.6x
Sensex P/E
The Sensex forward P/E is currently at about 13x which is below long-term average and looksreasonable.
8.7
5.3
9.3
5.1
11.7
4.5
7.0
9.5
12.0
14.5
Dec
-96
Dec
-97
Dec
-98
Dec
-99
Dec
-00
Dec
-01
Dec
-02
Dec
-03
Dec
-04
Dec
-05
Dec
-06
Dec
-07
Dec
-08
Dec
-09
Dec
-10
Dec
-11
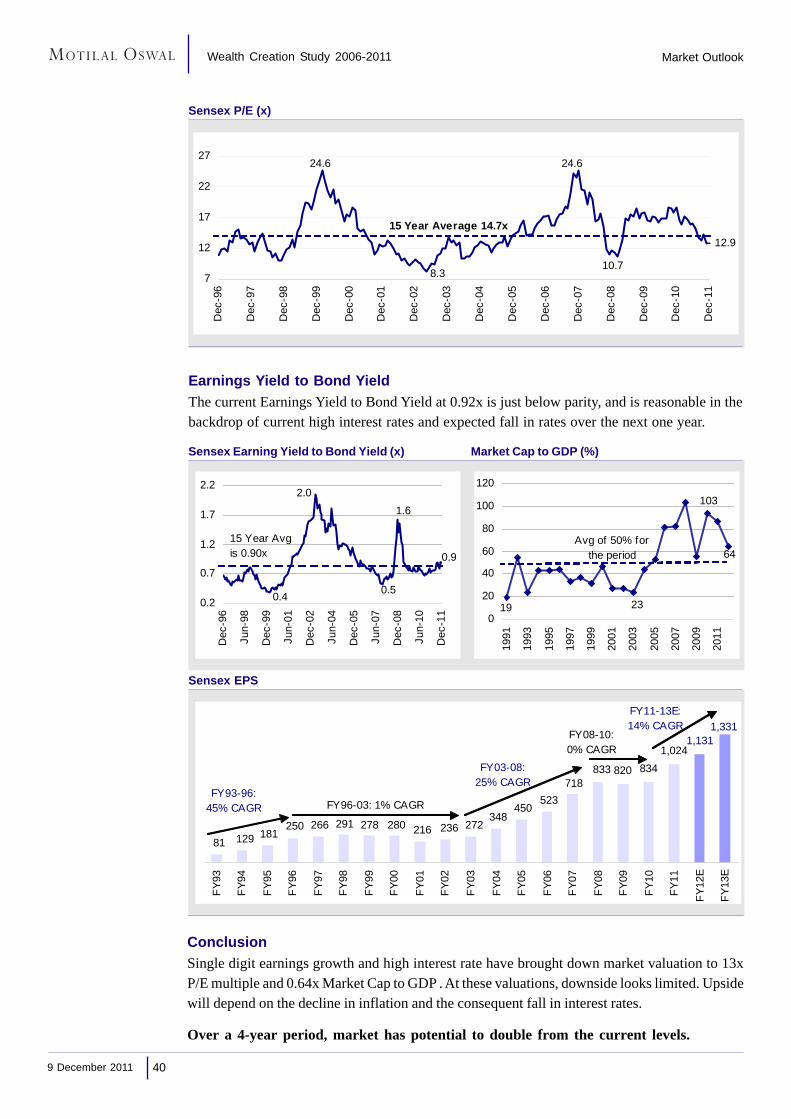
409 December 2011
Wealth Creation Study 2006-2011 Market Outlook
Sensex P/E (x)
12.9
10.7
24.6
8.3
24.6
7
12
17
22
27
Dec
-96
Dec
-97
Dec
-98
Dec
-99
Dec
-00
Dec
-01
Dec
-02
Dec
-03
Dec
-04
Dec
-05
Dec
-06
Dec
-07
Dec
-08
Dec
-09
Dec
-10
Dec
-11
15 Year Average 14.7x
Earnings Yield to Bond Yield
The current Earnings Yield to Bond Yield at 0.92x is just below parity, and is reasonable in thebackdrop of current high interest rates and expected fall in rates over the next one year.
Sensex Earning Yield to Bond Yield (x) Market Cap to GDP (%)
0.9
1.6
0.5
2.0
0.40.2
0.7
1.2
1.7
2.2
Dec
-96
Jun-
98
Dec
-99
Jun-
01
Dec
-02
Jun-
04
Dec
-05
Jun-
07
Dec
-08
Jun-
10
Dec
-11
15 Year Avg is 0.90x
19 23
103
64
0
20
40
60
80
100
120
1991
1993
1995
1997
1999
2001
2003
2005
2007
2009
2011
Avg of 50% for the period
Sensex EPS
Conclusion
Single digit earnings growth and high interest rate have brought down market valuation to 13xP/E multiple and 0.64x Market Cap to GDP . At these valuations, downside looks limited. Upsidewill depend on the decline in inflation and the consequent fall in interest rates.
Over a 4-year period, market has potential to double from the current levels.
820 834
1,0241,131
1,331
833718
523450
348272236216280278291266250
18112981
FY
93
FY
94
FY
95
FY
96
FY
97
FY
98
FY
99
FY
00
FY
01
FY
02
FY
03
FY
04
FY
05
FY
06
FY
07
FY
08
FY
09
FY
10
FY
11
FY
12E
FY
13E
FY93-96: 45% CAGR FY96-03: 1% CAGR
FY03-08: 25% CAGR
FY08-10:0% CAGR
FY11-13E: 14% CAGR
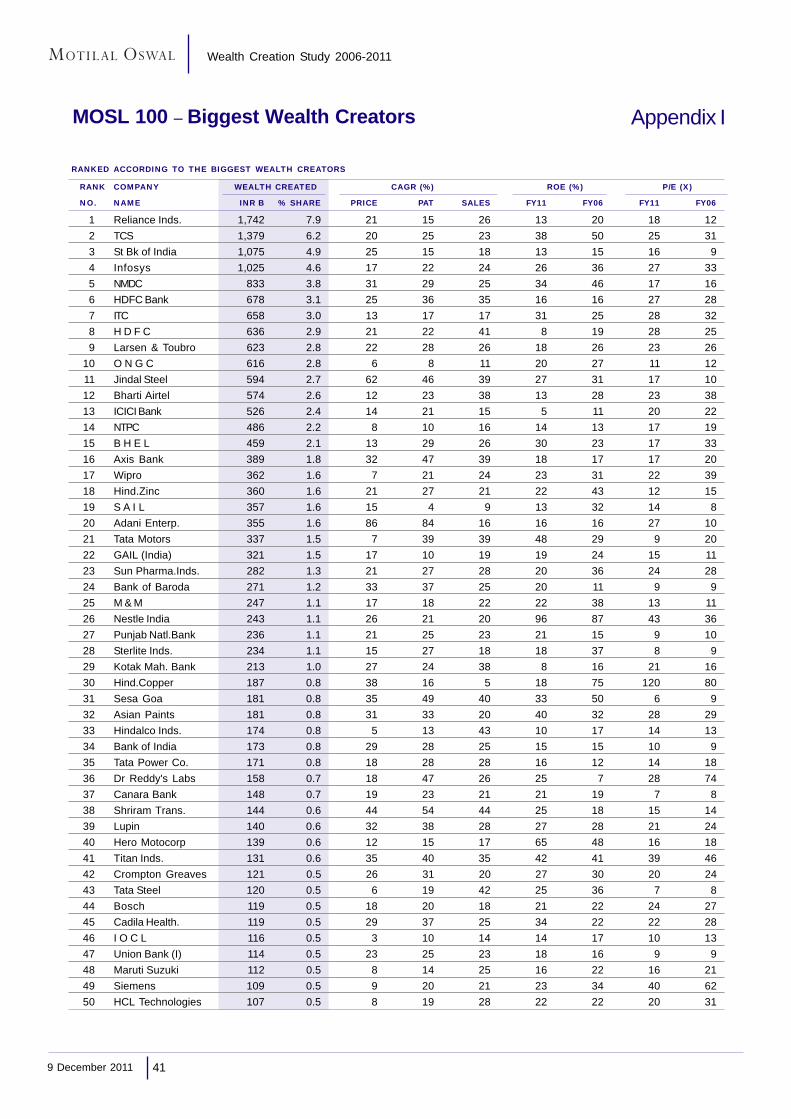
419 December 2011
Wealth Creation Study 2006-2011
Appendix IMOSL 100 – Biggest Wealth Creators
RANK COMPANY WEALTH CREATED CAGR (%) ROE (%) P/E (X)
NO. NAME INR B % SHARE PRICE PAT SALES FY11 FY06 FY11 FY06
1 Reliance Inds. 1,742 7.9 21 15 26 13 20 18 12
2 TCS 1,379 6.2 20 25 23 38 50 25 31
3 St Bk of India 1,075 4.9 25 15 18 13 15 16 9
4 Infosys 1,025 4.6 17 22 24 26 36 27 33
5 NMDC 833 3.8 31 29 25 34 46 17 16
6 HDFC Bank 678 3.1 25 36 35 16 16 27 28
7 ITC 658 3.0 13 17 17 31 25 28 32
8 H D F C 636 2.9 21 22 41 8 19 28 25
9 Larsen & Toubro 623 2.8 22 28 26 18 26 23 26
10 O N G C 616 2.8 6 8 11 20 27 11 12
11 Jindal Steel 594 2.7 62 46 39 27 31 17 10
12 Bharti Airtel 574 2.6 12 23 38 13 28 23 38
13 ICICI Bank 526 2.4 14 21 15 5 11 20 22
14 NTPC 486 2.2 8 10 16 14 13 17 19
15 B H E L 459 2.1 13 29 26 30 23 17 33
16 Axis Bank 389 1.8 32 47 39 18 17 17 20
17 Wipro 362 1.6 7 21 24 23 31 22 39
18 Hind.Zinc 360 1.6 21 27 21 22 43 12 15
19 S A I L 357 1.6 15 4 9 13 32 14 8
20 Adani Enterp. 355 1.6 86 84 16 16 16 27 10
21 Tata Motors 337 1.5 7 39 39 48 29 9 20
22 GAIL (India) 321 1.5 17 10 19 19 24 15 11
23 Sun Pharma.Inds. 282 1.3 21 27 28 20 36 24 28
24 Bank of Baroda 271 1.2 33 37 25 20 11 9 9
25 M & M 247 1.1 17 18 22 22 38 13 11
26 Nestle India 243 1.1 26 21 20 96 87 43 36
27 Punjab Natl.Bank 236 1.1 21 25 23 21 15 9 10
28 Sterlite Inds. 234 1.1 15 27 18 18 37 8 9
29 Kotak Mah. Bank 213 1.0 27 24 38 8 16 21 16
30 Hind.Copper 187 0.8 38 16 5 18 75 120 80
31 Sesa Goa 181 0.8 35 49 40 33 50 6 9
32 Asian Paints 181 0.8 31 33 20 40 32 28 29
33 Hindalco Inds. 174 0.8 5 13 43 10 17 14 13
34 Bank of India 173 0.8 29 28 25 15 15 10 9
35 Tata Power Co. 171 0.8 18 28 28 16 12 14 18
36 Dr Reddy's Labs 158 0.7 18 47 26 25 7 28 74
37 Canara Bank 148 0.7 19 23 21 21 19 7 8
38 Shriram Trans. 144 0.6 44 54 44 25 18 15 14
39 Lupin 140 0.6 32 38 28 27 28 21 24
40 Hero Motocorp 139 0.6 12 15 17 65 48 16 18
41 Titan Inds. 131 0.6 35 40 35 42 41 39 46
42 Crompton Greaves 121 0.5 26 31 20 27 30 20 24
43 Tata Steel 120 0.5 6 19 42 25 36 7 8
44 Bosch 119 0.5 18 20 18 21 22 24 27
45 Cadila Health. 119 0.5 29 37 25 34 22 22 28
46 I O C L 116 0.5 3 10 14 14 17 10 13
47 Union Bank (I) 114 0.5 23 25 23 18 16 9 9
48 Maruti Suzuki 112 0.5 8 14 25 16 22 16 21
49 Siemens 109 0.5 9 20 21 23 34 40 62
50 HCL Technologies 107 0.5 8 19 28 22 22 20 31
RANKED ACCORDING TO THE BIGGEST WEALTH CREATORS
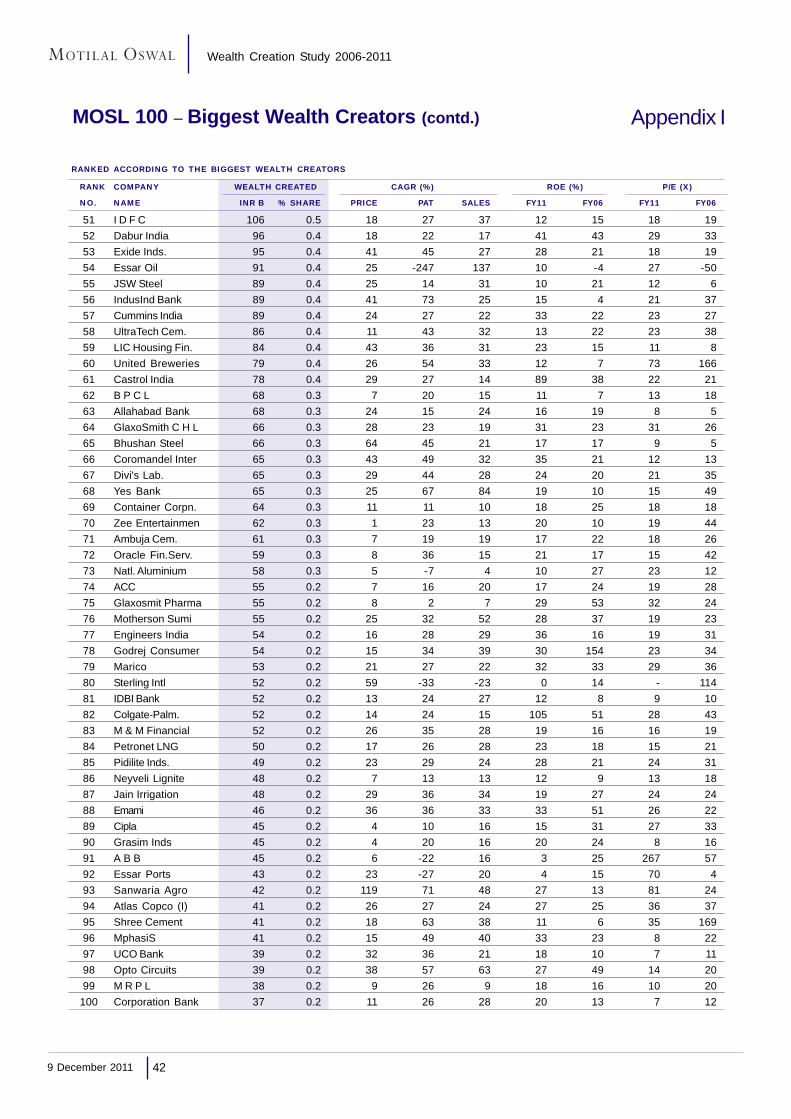
429 December 2011
Wealth Creation Study 2006-2011
Appendix IMOSL 100 – Biggest Wealth Creators (contd.)
RANK COMPANY WEALTH CREATED CAGR (%) ROE (%) P/E (X)
NO. NAME INR B % SHARE PRICE PAT SALES FY11 FY06 FY11 FY06
51 I D F C 106 0.5 18 27 37 12 15 18 19
52 Dabur India 96 0.4 18 22 17 41 43 29 33
53 Exide Inds. 95 0.4 41 45 27 28 21 18 19
54 Essar Oil 91 0.4 25 -247 137 10 -4 27 -50
55 JSW Steel 89 0.4 25 14 31 10 21 12 6
56 IndusInd Bank 89 0.4 41 73 25 15 4 21 37
57 Cummins India 89 0.4 24 27 22 33 22 23 27
58 UltraTech Cem. 86 0.4 11 43 32 13 22 23 38
59 LIC Housing Fin. 84 0.4 43 36 31 23 15 11 8
60 United Breweries 79 0.4 26 54 33 12 7 73 166
61 Castrol India 78 0.4 29 27 14 89 38 22 21
62 B P C L 68 0.3 7 20 15 11 7 13 18
63 Allahabad Bank 68 0.3 24 15 24 16 19 8 5
64 GlaxoSmith C H L 66 0.3 28 23 19 31 23 31 26
65 Bhushan Steel 66 0.3 64 45 21 17 17 9 5
66 Coromandel Inter 65 0.3 43 49 32 35 21 12 13
67 Divi's Lab. 65 0.3 29 44 28 24 20 21 35
68 Yes Bank 65 0.3 25 67 84 19 10 15 49
69 Container Corpn. 64 0.3 11 11 10 18 25 18 18
70 Zee Entertainmen 62 0.3 1 23 13 20 10 19 44
71 Ambuja Cem. 61 0.3 7 19 19 17 22 18 26
72 Oracle Fin.Serv. 59 0.3 8 36 15 21 17 15 42
73 Natl. Aluminium 58 0.3 5 -7 4 10 27 23 12
74 ACC 55 0.2 7 16 20 17 24 19 28
75 Glaxosmit Pharma 55 0.2 8 2 7 29 53 32 24
76 Motherson Sumi 55 0.2 25 32 52 28 37 19 23
77 Engineers India 54 0.2 16 28 29 36 16 19 31
78 Godrej Consumer 54 0.2 15 34 39 30 154 23 34
79 Marico 53 0.2 21 27 22 32 33 29 36
80 Sterling Intl 52 0.2 59 -33 -23 0 14 - 114
81 IDBI Bank 52 0.2 13 24 27 12 8 9 10
82 Colgate-Palm. 52 0.2 14 24 15 105 51 28 43
83 M & M Financial 52 0.2 26 35 28 19 16 16 19
84 Petronet LNG 50 0.2 17 26 28 23 18 15 21
85 Pidilite Inds. 49 0.2 23 29 24 28 21 24 31
86 Neyveli Lignite 48 0.2 7 13 13 12 9 13 18
87 Jain Irrigation 48 0.2 29 36 34 19 27 24 24
88 Emami 46 0.2 36 36 33 33 51 26 22
89 Cipla 45 0.2 4 10 16 15 31 27 33
90 Grasim Inds 45 0.2 4 20 16 20 24 8 16
91 A B B 45 0.2 6 -22 16 3 25 267 57
92 Essar Ports 43 0.2 23 -27 20 4 15 70 4
93 Sanwaria Agro 42 0.2 119 71 48 27 13 81 24
94 Atlas Copco (I) 41 0.2 26 27 24 27 25 36 37
95 Shree Cement 41 0.2 18 63 38 11 6 35 169
96 MphasiS 41 0.2 15 49 40 33 23 8 22
97 UCO Bank 39 0.2 32 36 21 18 10 7 11
98 Opto Circuits 39 0.2 38 57 63 27 49 14 20
99 M R P L 38 0.2 9 26 9 18 16 10 20
100 Corporation Bank 37 0.2 11 26 28 20 13 7 12
RANKED ACCORDING TO THE BIGGEST WEALTH CREATORS
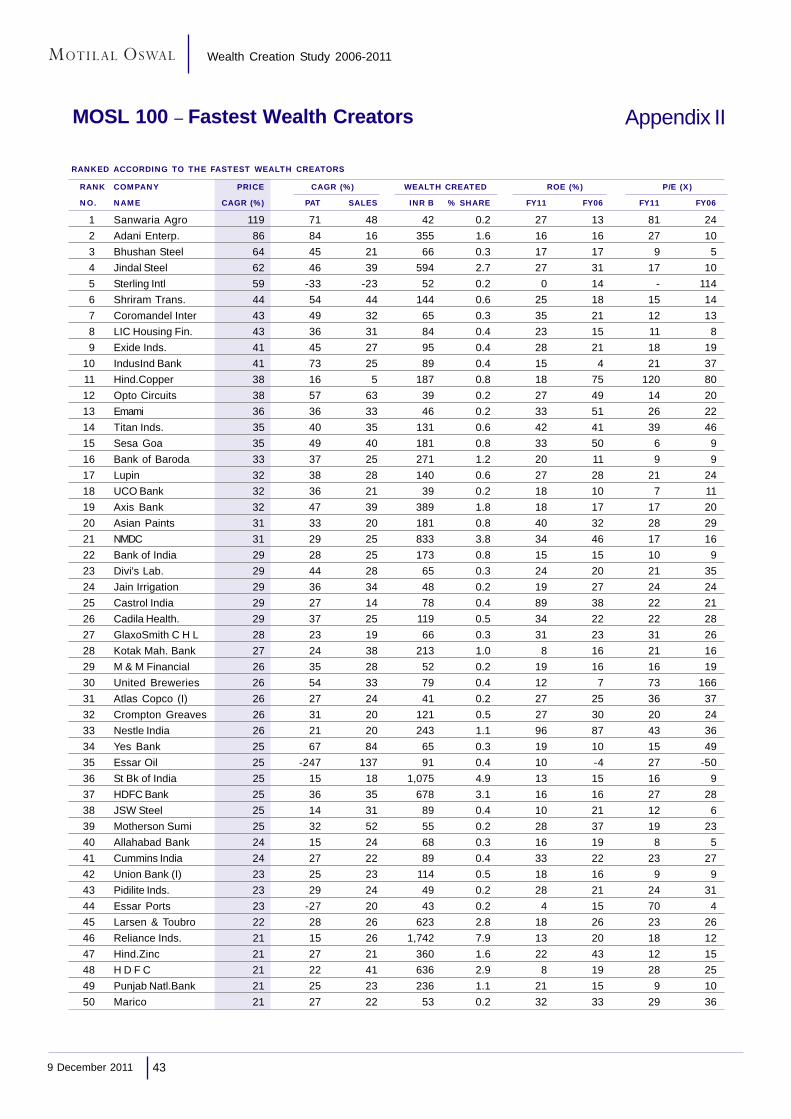
439 December 2011
Wealth Creation Study 2006-2011
Appendix IIMOSL 100 – Fastest Wealth Creators
RANK COMPANY PRICE CAGR (%) WEALTH CREATED ROE (%) P/E (X)
NO. NAME CAGR (%) PAT SALES INR B % SHARE FY11 FY06 FY11 FY06
1 Sanwaria Agro 119 71 48 42 0.2 27 13 81 24
2 Adani Enterp. 86 84 16 355 1.6 16 16 27 10
3 Bhushan Steel 64 45 21 66 0.3 17 17 9 5
4 Jindal Steel 62 46 39 594 2.7 27 31 17 10
5 Sterling Intl 59 -33 -23 52 0.2 0 14 - 114
6 Shriram Trans. 44 54 44 144 0.6 25 18 15 14
7 Coromandel Inter 43 49 32 65 0.3 35 21 12 13
8 LIC Housing Fin. 43 36 31 84 0.4 23 15 11 8
9 Exide Inds. 41 45 27 95 0.4 28 21 18 19
10 IndusInd Bank 41 73 25 89 0.4 15 4 21 37
11 Hind.Copper 38 16 5 187 0.8 18 75 120 80
12 Opto Circuits 38 57 63 39 0.2 27 49 14 20
13 Emami 36 36 33 46 0.2 33 51 26 22
14 Titan Inds. 35 40 35 131 0.6 42 41 39 46
15 Sesa Goa 35 49 40 181 0.8 33 50 6 9
16 Bank of Baroda 33 37 25 271 1.2 20 11 9 9
17 Lupin 32 38 28 140 0.6 27 28 21 24
18 UCO Bank 32 36 21 39 0.2 18 10 7 11
19 Axis Bank 32 47 39 389 1.8 18 17 17 20
20 Asian Paints 31 33 20 181 0.8 40 32 28 29
21 NMDC 31 29 25 833 3.8 34 46 17 16
22 Bank of India 29 28 25 173 0.8 15 15 10 9
23 Divi's Lab. 29 44 28 65 0.3 24 20 21 35
24 Jain Irrigation 29 36 34 48 0.2 19 27 24 24
25 Castrol India 29 27 14 78 0.4 89 38 22 21
26 Cadila Health. 29 37 25 119 0.5 34 22 22 28
27 GlaxoSmith C H L 28 23 19 66 0.3 31 23 31 26
28 Kotak Mah. Bank 27 24 38 213 1.0 8 16 21 16
29 M & M Financial 26 35 28 52 0.2 19 16 16 19
30 United Breweries 26 54 33 79 0.4 12 7 73 166
31 Atlas Copco (I) 26 27 24 41 0.2 27 25 36 37
32 Crompton Greaves 26 31 20 121 0.5 27 30 20 24
33 Nestle India 26 21 20 243 1.1 96 87 43 36
34 Yes Bank 25 67 84 65 0.3 19 10 15 49
35 Essar Oil 25 -247 137 91 0.4 10 -4 27 -50
36 St Bk of India 25 15 18 1,075 4.9 13 15 16 9
37 HDFC Bank 25 36 35 678 3.1 16 16 27 28
38 JSW Steel 25 14 31 89 0.4 10 21 12 6
39 Motherson Sumi 25 32 52 55 0.2 28 37 19 23
40 Allahabad Bank 24 15 24 68 0.3 16 19 8 5
41 Cummins India 24 27 22 89 0.4 33 22 23 27
42 Union Bank (I) 23 25 23 114 0.5 18 16 9 9
43 Pidilite Inds. 23 29 24 49 0.2 28 21 24 31
44 Essar Ports 23 -27 20 43 0.2 4 15 70 4
45 Larsen & Toubro 22 28 26 623 2.8 18 26 23 26
46 Reliance Inds. 21 15 26 1,742 7.9 13 20 18 12
47 Hind.Zinc 21 27 21 360 1.6 22 43 12 15
48 H D F C 21 22 41 636 2.9 8 19 28 25
49 Punjab Natl.Bank 21 25 23 236 1.1 21 15 9 10
50 Marico 21 27 22 53 0.2 32 33 29 36
RANKED ACCORDING TO THE FASTEST WEALTH CREATORS
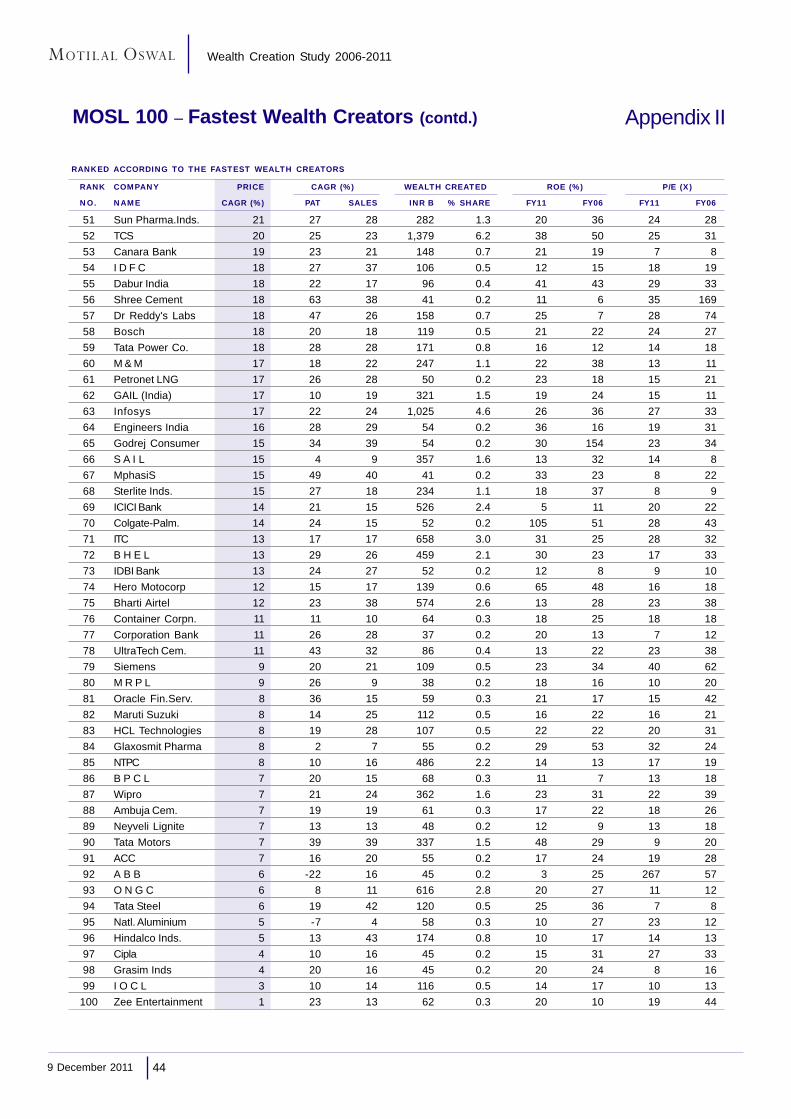
449 December 2011
Wealth Creation Study 2006-2011
Appendix IIMOSL 100 – Fastest Wealth Creators (contd.)
RANK COMPANY PRICE CAGR (%) WEALTH CREATED ROE (%) P/E (X)
NO. NAME CAGR (%) PAT SALES INR B % SHARE FY11 FY06 FY11 FY06
51 Sun Pharma.Inds. 21 27 28 282 1.3 20 36 24 28
52 TCS 20 25 23 1,379 6.2 38 50 25 31
53 Canara Bank 19 23 21 148 0.7 21 19 7 8
54 I D F C 18 27 37 106 0.5 12 15 18 19
55 Dabur India 18 22 17 96 0.4 41 43 29 33
56 Shree Cement 18 63 38 41 0.2 11 6 35 169
57 Dr Reddy's Labs 18 47 26 158 0.7 25 7 28 74
58 Bosch 18 20 18 119 0.5 21 22 24 27
59 Tata Power Co. 18 28 28 171 0.8 16 12 14 18
60 M & M 17 18 22 247 1.1 22 38 13 11
61 Petronet LNG 17 26 28 50 0.2 23 18 15 21
62 GAIL (India) 17 10 19 321 1.5 19 24 15 11
63 Infosys 17 22 24 1,025 4.6 26 36 27 33
64 Engineers India 16 28 29 54 0.2 36 16 19 31
65 Godrej Consumer 15 34 39 54 0.2 30 154 23 34
66 S A I L 15 4 9 357 1.6 13 32 14 8
67 MphasiS 15 49 40 41 0.2 33 23 8 22
68 Sterlite Inds. 15 27 18 234 1.1 18 37 8 9
69 ICICI Bank 14 21 15 526 2.4 5 11 20 22
70 Colgate-Palm. 14 24 15 52 0.2 105 51 28 43
71 ITC 13 17 17 658 3.0 31 25 28 32
72 B H E L 13 29 26 459 2.1 30 23 17 33
73 IDBI Bank 13 24 27 52 0.2 12 8 9 10
74 Hero Motocorp 12 15 17 139 0.6 65 48 16 18
75 Bharti Airtel 12 23 38 574 2.6 13 28 23 38
76 Container Corpn. 11 11 10 64 0.3 18 25 18 18
77 Corporation Bank 11 26 28 37 0.2 20 13 7 12
78 UltraTech Cem. 11 43 32 86 0.4 13 22 23 38
79 Siemens 9 20 21 109 0.5 23 34 40 62
80 M R P L 9 26 9 38 0.2 18 16 10 20
81 Oracle Fin.Serv. 8 36 15 59 0.3 21 17 15 42
82 Maruti Suzuki 8 14 25 112 0.5 16 22 16 21
83 HCL Technologies 8 19 28 107 0.5 22 22 20 31
84 Glaxosmit Pharma 8 2 7 55 0.2 29 53 32 24
85 NTPC 8 10 16 486 2.2 14 13 17 19
86 B P C L 7 20 15 68 0.3 11 7 13 18
87 Wipro 7 21 24 362 1.6 23 31 22 39
88 Ambuja Cem. 7 19 19 61 0.3 17 22 18 26
89 Neyveli Lignite 7 13 13 48 0.2 12 9 13 18
90 Tata Motors 7 39 39 337 1.5 48 29 9 20
91 ACC 7 16 20 55 0.2 17 24 19 28
92 A B B 6 -22 16 45 0.2 3 25 267 57
93 O N G C 6 8 11 616 2.8 20 27 11 12
94 Tata Steel 6 19 42 120 0.5 25 36 7 8
95 Natl. Aluminium 5 -7 4 58 0.3 10 27 23 12
96 Hindalco Inds. 5 13 43 174 0.8 10 17 14 13
97 Cipla 4 10 16 45 0.2 15 31 27 33
98 Grasim Inds 4 20 16 45 0.2 20 24 8 16
99 I O C L 3 10 14 116 0.5 14 17 10 13
100 Zee Entertainment 1 23 13 62 0.3 20 10 19 44
RANKED ACCORDING TO THE FASTEST WEALTH CREATORS
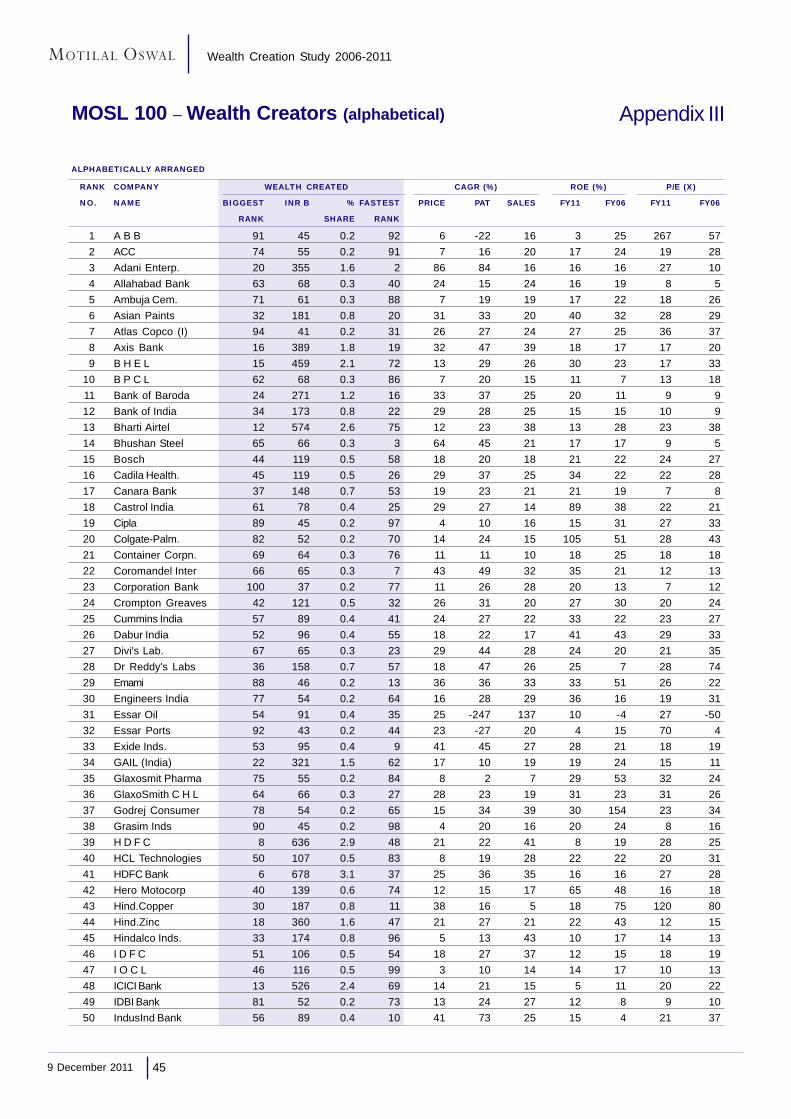
459 December 2011
Wealth Creation Study 2006-2011
Appendix IIIMOSL 100 – Wealth Creators (alphabetical)
RANK COMPANY WEALTH CREATED CAGR (%) ROE (%) P/E (X)
NO. NAME BIGGEST INR B % FASTEST PRICE PAT SALES FY11 FY06 FY11 FY06
RANK SHARE RANK
1 A B B 91 45 0.2 92 6 -22 16 3 25 267 57
2 ACC 74 55 0.2 91 7 16 20 17 24 19 28
3 Adani Enterp. 20 355 1.6 2 86 84 16 16 16 27 10
4 Allahabad Bank 63 68 0.3 40 24 15 24 16 19 8 5
5 Ambuja Cem. 71 61 0.3 88 7 19 19 17 22 18 26
6 Asian Paints 32 181 0.8 20 31 33 20 40 32 28 29
7 Atlas Copco (I) 94 41 0.2 31 26 27 24 27 25 36 37
8 Axis Bank 16 389 1.8 19 32 47 39 18 17 17 20
9 B H E L 15 459 2.1 72 13 29 26 30 23 17 33
10 B P C L 62 68 0.3 86 7 20 15 11 7 13 18
11 Bank of Baroda 24 271 1.2 16 33 37 25 20 11 9 9
12 Bank of India 34 173 0.8 22 29 28 25 15 15 10 9
13 Bharti Airtel 12 574 2.6 75 12 23 38 13 28 23 38
14 Bhushan Steel 65 66 0.3 3 64 45 21 17 17 9 5
15 Bosch 44 119 0.5 58 18 20 18 21 22 24 27
16 Cadila Health. 45 119 0.5 26 29 37 25 34 22 22 28
17 Canara Bank 37 148 0.7 53 19 23 21 21 19 7 8
18 Castrol India 61 78 0.4 25 29 27 14 89 38 22 21
19 Cipla 89 45 0.2 97 4 10 16 15 31 27 33
20 Colgate-Palm. 82 52 0.2 70 14 24 15 105 51 28 43
21 Container Corpn. 69 64 0.3 76 11 11 10 18 25 18 18
22 Coromandel Inter 66 65 0.3 7 43 49 32 35 21 12 13
23 Corporation Bank 100 37 0.2 77 11 26 28 20 13 7 12
24 Crompton Greaves 42 121 0.5 32 26 31 20 27 30 20 24
25 Cummins India 57 89 0.4 41 24 27 22 33 22 23 27
26 Dabur India 52 96 0.4 55 18 22 17 41 43 29 33
27 Divi's Lab. 67 65 0.3 23 29 44 28 24 20 21 35
28 Dr Reddy's Labs 36 158 0.7 57 18 47 26 25 7 28 74
29 Emami 88 46 0.2 13 36 36 33 33 51 26 22
30 Engineers India 77 54 0.2 64 16 28 29 36 16 19 31
31 Essar Oil 54 91 0.4 35 25 -247 137 10 -4 27 -50
32 Essar Ports 92 43 0.2 44 23 -27 20 4 15 70 4
33 Exide Inds. 53 95 0.4 9 41 45 27 28 21 18 19
34 GAIL (India) 22 321 1.5 62 17 10 19 19 24 15 11
35 Glaxosmit Pharma 75 55 0.2 84 8 2 7 29 53 32 24
36 GlaxoSmith C H L 64 66 0.3 27 28 23 19 31 23 31 26
37 Godrej Consumer 78 54 0.2 65 15 34 39 30 154 23 34
38 Grasim Inds 90 45 0.2 98 4 20 16 20 24 8 16
39 H D F C 8 636 2.9 48 21 22 41 8 19 28 25
40 HCL Technologies 50 107 0.5 83 8 19 28 22 22 20 31
41 HDFC Bank 6 678 3.1 37 25 36 35 16 16 27 28
42 Hero Motocorp 40 139 0.6 74 12 15 17 65 48 16 18
43 Hind.Copper 30 187 0.8 11 38 16 5 18 75 120 80
44 Hind.Zinc 18 360 1.6 47 21 27 21 22 43 12 15
45 Hindalco Inds. 33 174 0.8 96 5 13 43 10 17 14 13
46 I D F C 51 106 0.5 54 18 27 37 12 15 18 19
47 I O C L 46 116 0.5 99 3 10 14 14 17 10 13
48 ICICI Bank 13 526 2.4 69 14 21 15 5 11 20 22
49 IDBI Bank 81 52 0.2 73 13 24 27 12 8 9 10
50 IndusInd Bank 56 89 0.4 10 41 73 25 15 4 21 37
ALPHABETICALLY ARRANGED
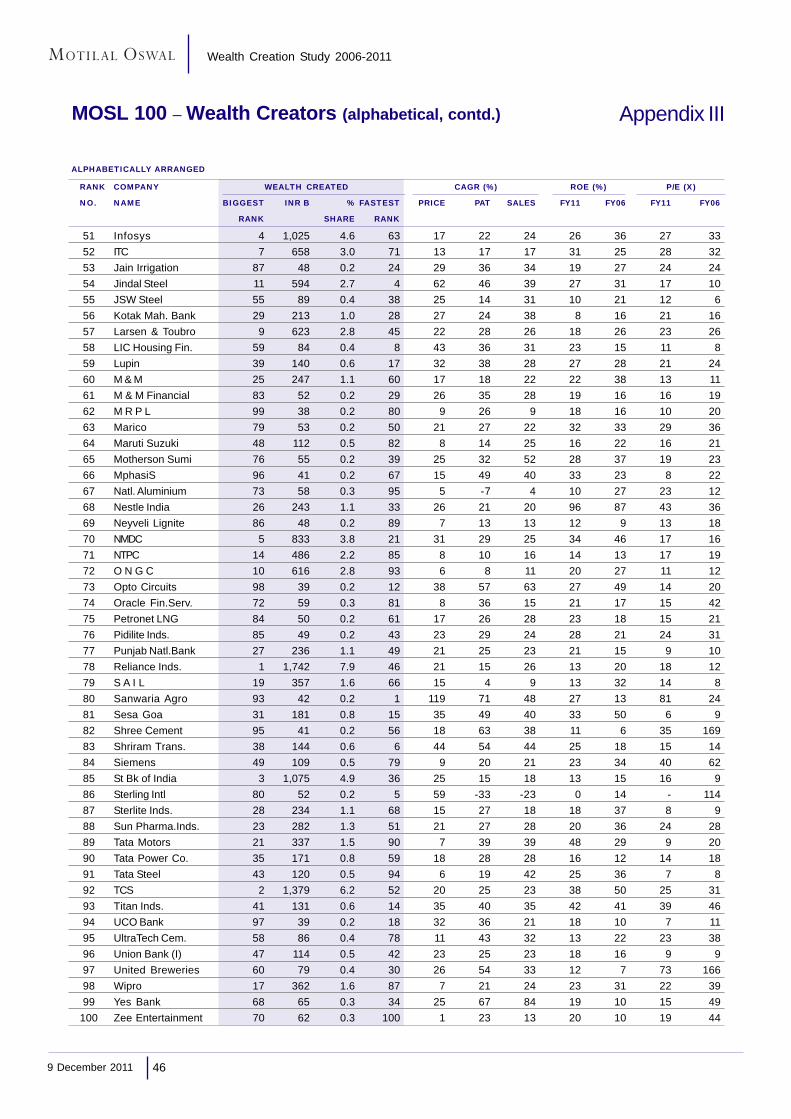
469 December 2011
Wealth Creation Study 2006-2011
Appendix IIIMOSL 100 – Wealth Creators (alphabetical, contd.)
RANK COMPANY WEALTH CREATED CAGR (%) ROE (%) P/E (X)
NO. NAME BIGGEST INR B % FASTEST PRICE PAT SALES FY11 FY06 FY11 FY06
RANK SHARE RANK
51 Infosys 4 1,025 4.6 63 17 22 24 26 36 27 33
52 ITC 7 658 3.0 71 13 17 17 31 25 28 32
53 Jain Irrigation 87 48 0.2 24 29 36 34 19 27 24 24
54 Jindal Steel 11 594 2.7 4 62 46 39 27 31 17 10
55 JSW Steel 55 89 0.4 38 25 14 31 10 21 12 6
56 Kotak Mah. Bank 29 213 1.0 28 27 24 38 8 16 21 16
57 Larsen & Toubro 9 623 2.8 45 22 28 26 18 26 23 26
58 LIC Housing Fin. 59 84 0.4 8 43 36 31 23 15 11 8
59 Lupin 39 140 0.6 17 32 38 28 27 28 21 24
60 M & M 25 247 1.1 60 17 18 22 22 38 13 11
61 M & M Financial 83 52 0.2 29 26 35 28 19 16 16 19
62 M R P L 99 38 0.2 80 9 26 9 18 16 10 20
63 Marico 79 53 0.2 50 21 27 22 32 33 29 36
64 Maruti Suzuki 48 112 0.5 82 8 14 25 16 22 16 21
65 Motherson Sumi 76 55 0.2 39 25 32 52 28 37 19 23
66 MphasiS 96 41 0.2 67 15 49 40 33 23 8 22
67 Natl. Aluminium 73 58 0.3 95 5 -7 4 10 27 23 12
68 Nestle India 26 243 1.1 33 26 21 20 96 87 43 36
69 Neyveli Lignite 86 48 0.2 89 7 13 13 12 9 13 18
70 NMDC 5 833 3.8 21 31 29 25 34 46 17 16
71 NTPC 14 486 2.2 85 8 10 16 14 13 17 19
72 O N G C 10 616 2.8 93 6 8 11 20 27 11 12
73 Opto Circuits 98 39 0.2 12 38 57 63 27 49 14 20
74 Oracle Fin.Serv. 72 59 0.3 81 8 36 15 21 17 15 42
75 Petronet LNG 84 50 0.2 61 17 26 28 23 18 15 21
76 Pidilite Inds. 85 49 0.2 43 23 29 24 28 21 24 31
77 Punjab Natl.Bank 27 236 1.1 49 21 25 23 21 15 9 10
78 Reliance Inds. 1 1,742 7.9 46 21 15 26 13 20 18 12
79 S A I L 19 357 1.6 66 15 4 9 13 32 14 8
80 Sanwaria Agro 93 42 0.2 1 119 71 48 27 13 81 24
81 Sesa Goa 31 181 0.8 15 35 49 40 33 50 6 9
82 Shree Cement 95 41 0.2 56 18 63 38 11 6 35 169
83 Shriram Trans. 38 144 0.6 6 44 54 44 25 18 15 14
84 Siemens 49 109 0.5 79 9 20 21 23 34 40 62
85 St Bk of India 3 1,075 4.9 36 25 15 18 13 15 16 9
86 Sterling Intl 80 52 0.2 5 59 -33 -23 0 14 - 114
87 Sterlite Inds. 28 234 1.1 68 15 27 18 18 37 8 9
88 Sun Pharma.Inds. 23 282 1.3 51 21 27 28 20 36 24 28
89 Tata Motors 21 337 1.5 90 7 39 39 48 29 9 20
90 Tata Power Co. 35 171 0.8 59 18 28 28 16 12 14 18
91 Tata Steel 43 120 0.5 94 6 19 42 25 36 7 8
92 TCS 2 1,379 6.2 52 20 25 23 38 50 25 31
93 Titan Inds. 41 131 0.6 14 35 40 35 42 41 39 46
94 UCO Bank 97 39 0.2 18 32 36 21 18 10 7 11
95 UltraTech Cem. 58 86 0.4 78 11 43 32 13 22 23 38
96 Union Bank (I) 47 114 0.5 42 23 25 23 18 16 9 9
97 United Breweries 60 79 0.4 30 26 54 33 12 7 73 166
98 Wipro 17 362 1.6 87 7 21 24 23 31 22 39
99 Yes Bank 68 65 0.3 34 25 67 84 19 10 15 49
100 Zee Entertainment 70 62 0.3 100 1 23 13 20 10 19 44
ALPHABETICALLY ARRANGED
DisclosuresThis report is for personal information of the authorized recipient and does not construe to be any investment, legal or taxation advice to you. This research report does not constitute an offer, invitation or inducementto invest in securities or other investments and Motilal Oswal Securities Limited (hereinafter referred as MOSt) is not soliciting any action based upon it. This report is not for public distribution and has beenfurnished to you solely for your information and should not be reproduced or redistributed to any other person in any form.
Unauthorized disclosure, use, dissemination or copying (either whole or partial) of this information, is prohibited. The person accessing this information specifically agrees to exempt MOSt or any of its affiliatesor employees from, any and all responsibility/liability arising from such misuse and agrees not to hold MOSt or any of its affiliates or employees responsible for any such misuse and further agrees to hold MOStor any of its affiliates or employees free and harmless from all losses, costs, damages, expenses that may be suffered by the person accessing this information due to any errors and delays.
The information contained herein is based on publicly available data or other sources believed to be reliable. While we would endeavour to update the information herein on reasonable basis, MOSt and/or itsaffiliates are under no obligation to update the information. Also there may be regulatory, compliance, or other reasons that may prevent MOSt and/or its affiliates from doing so. MOSt or any of its affiliates oremployees shall not be in any way responsible and liable for any loss or damage that may arise to any person from any inadvertent error in the information contained in this report . MOSt or any of its affiliatesor employees do not provide, at any time, any express or implied warranty of any kind, regarding any matter pertaining to this report, including without limitation the implied warranties of merchantability, fitnessfor a particular purpose, and non-infringement. The recipients of this report should rely on their own investigations.
This report is intended for distribution to institutional investors. Recipients who are not institutional investors should seek advice of their independent financial advisor prior to taking any investment decisionbased on this report or for any necessary explanation of its contents.
MOSt and/or its affiliates and/or employees may have interests/positions, financial or otherwise in the securities mentioned in this report. To enhance transparency, MOSt has incorporated a Disclosure of InterestStatement in this document. This should, however, not be treated as endorsement of the views expressed in the report.
Disclosure of Interest Statement Companies where there is interest1. Analyst ownership of the stock None2. Group/Directors ownership of the stock Bharti Airtel, Birla Corporation, Cairn India, Coal India,GSK Pharma, Honda MotoCorp, IDFC, IOC, Marico,
Nestle India, Oriental Bank, South Indian Bank, State Bank, Tata Steel3. Broking relationship with company covered State Bank of India4. Investment Banking relationship with company covered None
Analyst CertificationThe views expressed in this research report accurately reflect the personal views of the analyst(s) about the subject securities or issues, and no part of the compensation of the research analyst(s) was, is, orwill be directly or indirectly related to the specific recommendations and views expressed by research analyst(s) in this report. The research analysts, strategists, or research associates principally responsiblefor preparation of MOSt research receive compensation based upon various factors, including quality of research, investor client feedback, stock picking, competitive factors and firm revenues.
Regional Disclosures (outside India)This report is not directed or intended for distribution to or use by any person or entity resident in a state, country or any jurisdiction, where such distribution, publication, availability or use would be contrary tolaw, regulation or which would subject MOSt & its group companies to registration or licensing requirements within such jurisdictions.
For U.K.This report is intended for distribution only to persons having professional experience in matters relating to investments as described in Article 19 of the Financial Services and Markets Act 2000 (FinancialPromotion) Order 2005 (referred to as "investment professionals"). This document must not be acted on or relied on by persons who are not investment professionals. Any investment or investment activity towhich this document relates is only available to investment professionals and will be engaged in only with such persons.
For U.S.MOSt is not a registered broker-dealer in the United States (U.S.) and, therefore, is not subject to U.S. rules. In reliance on the exemption from registration provided by Rule 15a-6 of the U.S. Securities ExchangeAct of 1934, as amended (the "Exchange Act") and interpretations thereof by the U.S. Securities and Exchange Commission ("SEC") in order to conduct business with Institutional Investors based in the U.S.,Motilal Oswal has entered into a chaperoning agreement with a U.S. registered broker-dealer, Marco Polo Securities Inc. ("Marco Polo").
This report is intended for distribution only to "Major Institutional Investors" as defined by Rule 15a-6(b)(4) of the Exchange Act and interpretations thereof by SEC (henceforth referred to as "major institutionalinvestors"). This document must not be acted on or relied on by persons who are not major institutional investors. Any investment or investment activity to which this document relates is only available to majorinstitutional investors and will be engaged in only with major institutional investors.
The Research Analysts contributing to the report may not be registered /qualified as research analyst with FINRA. Such research analyst may not be associated persons of the U.S. registered broker-dealer, MarcoPolo and therefore, may not be subject to NASD rule 2711 and NYSE Rule 472 restrictions on communication with a subject company, public appearances and trading securities held by a research analyst account.
Motilal Oswal Securities Ltd3rd Floor, Hoechst House, Nariman Point, Mumbai 400 021
Phone: (91-22) 39825500 Fax: (91-22) 22885038. E-mail: [email protected]

Motilal Oswal Sector Gallery

Motilal Oswal India Strategy Gallery
Motilal Oswal Wealth Creation Gallery