Embed Size (px)
DESCRIPTION
AG-Metal Zenica - tretman otpadnih voda: - Tehnologija tretmana otpadnih voda, O tretmanu otpadnih voda više na www.ag-metal.ba AG-Metal Zenica - wastewater treatment: - Waste water treatment technology, The treatment of wastewater more on www.ag-metal.ba
Citation preview

Biomonitoring, Monitoring, Sampling, and Testing
In January, we take our nets to a no-name stream in thefoothills of the Blue Ridge Mountains of Virginia to do aspecial kind of macroinvertebrate monitoring — lookingfor “winter stoneflies.” Winter stoneflies have an unusuallife cycle. Soon after hatching in early spring, the larvaebury themselves in the streambed. They spend the summerlying dormant in the mud, thereby avoiding problems likeoverheated streams, low oxygen concentrations, fluctuat-ing flows, and heavy predation. In later November, theyemerge, grow quickly for a couple of months, and thenlay their eggs in January.
January monitoring of winter stoneflies helps in interpret-ing the results of spring and fall macroinvertebrate sur-veys. In spring and fall, a thorough benthic survey isconducted, based on Protocol II of the USEPA’s RapidBioassessment Protocols for Use in Streams and Rivers.Some sites on various rural streams have poor diversityand sensitive families. Is the lack of macroinvertebratediversity because of specific warm-weather conditions,high water temperature, low oxygen, or fluctuating flows,or is some toxic contamination present? In the Januaryscreening, if winter stoneflies are plentiful, seasonal con-ditions were probably to blame for the earlier results; ifwinter stoneflies are absent, the site probably suffers fromtoxic contamination (based on our rural location, probablyemanating from non-point sources) that is present year-round.
Though different genera of winter stoneflies are found inour region (southwestern Virginia), Allocapnia is soughtbecause it is present even in the smallest streams.1
14.1 WHAT IS BIOMONITORING?
The life in, and physical characteristics of, a stream eco-system provide insight into the historical and current statusof its quality. The assessment of a water body ecosystembased on organisms living in it is called biomonitoring.The assessment of the system based on its physical char-acteristics is called a habitat assessment. Biomonitoringand habitat assessments are tools used by stream ecologiststo assess the water quality of a stream.
Biological monitoring involves the use or the obser-vation of organisms to assess environmental condition.Biological observation is more representative as it revealscumulative effects as opposed to chemical observation,which is representative only at the actual time of sampling.
The presence of benthic macroinvertebrates is monitored;as mentioned, these are the larger organisms, such asaquatic insects, insect larvae, and crustaceans, that live inthe bottom portions of a waterway for part their life cycle.Routine surveys of macroinvertebrates of lakes, wetlands,rivers, and streams are done in order to measure the bio-health, or biodiversity, of the resource surveyed. They areideal for use in biomonitoring, as they are ubiquitous,relatively sedentary, and long-lived. They provide a cross-section of the situation, as some species are extremelysensitive to pollution, while others are more tolerant. How-ever, like toxicity testing, biomonitoring does not tell youwhy animals are present or absent.
As mentioned, benthic macroinvertebrates are excel-lent indicators of stream conditions. This is the case forseveral reasons:
1. Biological communities reflect overall ecolog-ical integrity (i.e., chemical, physical, and bio-logical integrity). Therefore, biosurvey resultsdirectly assess the status of a waterbody relativeto the primary goal of the Clean Water Act(CWA).
2. Biological communities integrate the effects ofdifferent stressors, providing a broad measureof their aggregate impact.
3. Because they are ubiquitous, communities inte-grate the stressors over time and provide anecological measure of fluctuating environmentalconditions.
4. Routine monitoring of biological communitiescan be relatively inexpensive because they areeasy to collect and identify.
5. The status of biological communities is ofdirect interest to the public as a measure of aparticular environment.
6. Where criteria for specific ambient impacts donot exist (e.g., nonpoint-sources that degradehabitats), biological communities may be theonly practical means of evaluation.2
Benthic macroinvertebrates have an advantage overother monitoring methods. They act as continuous moni-tors of the water they live in. Unlike chemical monitoring,which provides information about water quality at the timeof measurement (a snapshot), biological monitoring can
14
© 2003 by CRC Press LLC

382
Handbook of Water and Wastewater Treatment Plant Operations
provide information about past or episodic pollution (acontinuous videotape). This concept is analogous to min-ers who took canaries into deep mines with them to testfor air quality. If the canary died, the miners knew the airwas bad and they had to leave the mine. Biomonitoring awater body ecosystem uses the same theoretical approach.Aquatic macroinvertebrates are subject to pollutants in thewater body. Consequently, the health of the organismsreflects the quality of the water they live in. If the pollutionlevels reach a critical concentration, certain organisms willmigrate away, fail to reproduce, or die, eventually leadingto the disappearance of those species at the polluted site.Normally, these organisms will return if conditionsimprove in the system.3
When are biomonitoring surveys conducted? Biomon-itoring (and the related term, bioassessment) surveys areconducted before and after an anticipated impact to deter-mine the effect of the activity on the water body habitat.Surveys are also performed periodically to monitor waterbody habitats and watch for unanticipated impacts.Finally, biomonitoring surveys are designed to referenceconditions or to set biocriteria (serve as monitoring thresh-olds to signal future impacts, regulatory actions, etc.) fordetermining that an impact has occurred.4
Note: The primary justification for bioassessment andmonitoring is that degradation of water bodyhabitats affects the biota using those habitats.Therefore, the living organisms provide themost direct means of assessing real environ-mental impacts.
14.1.1 BIOTIC INDICES (STREAMS)
Certain common aquatic organisms, by indicating theextent of oxygenation of a stream, may be regarded asindicators of the intensity of pollution from organic waste.The responses of aquatic organisms in waterways to largequantities of organic wastes are well documented. Theyoccur in a predictable cyclical manner. For example,upstream from the discharge point, a stream can supporta wide variety of algae, fish, and other organisms. How-ever, in the section of the water body where oxygen levelsare low (below 5 ppm), only a few types of worms survive.As stream flow courses downstream, oxygen levelsrecover, and those species that can tolerate low rates ofoxygen (such as gar, catfish, and carp) begin to appear. Ina stream, eventually, at some further point downstream, aclean water zone reestablishes itself and a more diverseand desirable community of organisms returns.
During this characteristic pattern of alternating levelsof dissolved oxygen (DO) (in response to the dumping oflarge amounts of biodegradable organic material), astream goes through a cycle called an oxygen sag curve.Its state can be determined using the biotic index as anindicator of oxygen content.
The biotic index is a systematic survey of macroin-vertebrates organisms. Macroinvertebrates can be verydescriptive of the overall water quality of a waterway, butthey cannot pinpoint specific chemical parameters.Because the diversity of species in a stream is often a goodindicator of the presence of pollution, the biotic index canbe used to correlate with stream quality. Observation oftypes of species present or missing is used as an indicatorof stream pollution. The biotic index, used in the deter-mination of the types, species, and numbers of biologicalorganisms present in a stream, is commonly used as anauxiliary to biochemical oxygen demand (BOD) determi-nation in determining stream pollution.
The biotic index is based on two principles:
1. A large dumping of organic waste into a streamtends to restrict the variety of organisms at acertain point in the stream.
2. As the degree of pollution in a stream increases,key organisms tend to disappear in a predictableorder. The disappearance of particular organismstends to indicate the water quality of the stream.
There are several different forms of the biotic index.In Great Britain, for example, the Trent Biotic Index, theChandler score, the Biological Monitoring Working Party(BMWP) score, and the Lincoln Quality Index are widelyused. Most of the forms use a biotic index that rangesfrom 0 to 10. The most polluted stream, which containsthe smallest variety of organisms, is at the lowest end ofthe scale (0); the clean streams are at the highest end (10).A stream with a biotic index of greater than 5 will supportgame fish; on the other hand, a stream with a biotic indexof less than 4 will not support game fish.
As mentioned, because they are easy to sample, macro-invertebrates have predominated in biological monitoring.In addition, macroinvertebrates can be easily identifiedusing identification keys that are portable and easily usedin field settings. Present knowledge of macroinvertebratetolerances and response to stream pollution is well docu-mented. In the U.S., for example, the EnvironmentalProtection Agency (EPA) has required states to incorpo-rate a narrative biological criteria into its water qualitystandards by 1993. The National Park Service (NPS) hascollected macroinvertebrate samples from Americanstreams since 1984. Through their sampling effort, NPShas been able to derive quantitative biological standards.5
Macroinvertebrates are a diverse group. They demon-strate tolerances that vary between species. Discretedifferences tend to show up, containing both tolerant andsensitive indicators.
The biotic index provides a valuable measure of pol-lution. This is especially the case for species that are verysensitive to lack of oxygen. An example of an organismthat is commonly used in biological monitoring is the
© 2003 by CRC Press LLC

Biomonitoring, Monitoring, Sampling, and Testing
383
stonefly. Stonefly larvae live underwater and survive bestin well-aerated, unpolluted waters with clean gravel bot-toms. When stream water quality deteriorates due toorganic pollution, stonefly larvae cannot survive. The deg-radation of stonefly larvae has an exponential effect uponother insects and fish that feed off the larvae; when thestonefly larvae disappears, so do many insects and fish.6
Table 14.1 shows a modified version of the BMWPbiotic index. Considering that the BMWP biotic indexindicates ideal stream conditions, it takes into account thatthe sensitivities of different macroinvertebrate species arerepresented by diverse populations and are excellent indi-cators of pollution. These aquatic macroinvertebrates areorganisms that are large enough to be seen by the unaidedeye. Moreover, most aquatic macroinvertebrates specieslive for at least a year, and they are sensitive to streamwater quality both on a short-term and long-term basis.For example, mayflies, stoneflies, and caddisflies areaquatic macroinvertebrates that are considered clean-water organisms. They are generally the first to disappearfrom a stream if water quality declines and are given ahigh score. On the other hand, tubificid worms (which aretolerant to pollution) are given a low score.
In Table 14.1, a score of 1 to 10 is given for each familypresent. A site score is calculated by adding the individualfamily scores. The site score or total score is then dividedby the number of families recorded to derive the averagescore per taxon (ASPT). High ASPT scores result due tosuch taxa as stoneflies, mayflies, and caddisflies beingpresent in the stream. A low ASPT score is obtained fromstreams that are heavily polluted and dominated by tubifi-cid worms and other pollution-tolerant organisms.
From Table 14.1, it can be seen that those organismshaving high scores, especially mayflies and stoneflies, arethe most sensitive. Other organisms, such as dragonfliesand caddisflies, are very sensitive to any pollution (deoxy-
14.1.1.1 Benthic Macroinvertebrate Biotic Index
The benthic macroinvertebrate biotic index employs theuse of certain benthic macroinvertebrates to determine(gauge) the water quality (relative health) of a water body(stream or river).
In this discussion, benthic macroinvertebrates are clas-sified into three groups based on their sensitivity to pollution.The number of taxa in each of these groups is tallied andassigned a score. The scores are then summed to yield ascore that can be used as an estimate of the quality of thewater body life.
14.1.1.1.1 Metrics within the Benthic Macroinvertebrates
The three groups based on the sensitivity to pollutionare described as follows:
Group One — Indicators of poor water qualityGroup Two — Indicators of moderate water qualityGroup Three — Indicators of good water quality
A sample index of macroinvertebrates, concerning thesubject of sensitivity to pollution, is listed in Table 14.2.
In summary, it can be said that unpolluted streamsnormally support a wide variety of macroinvertebrates andother aquatic organisms with relatively few of any onekind. Any significant change in the normal populationusually indicates pollution.
14.2 BIOLOGICAL SAMPLING (STREAMS)
A few years ago, we were preparing to perform benthicmacroinvertebrate sampling protocols in a wadable sec-tion in one of the countless reaches of the YellowstoneRiver, WY. It was autumn, windy, and cold. Before westepped into the slow-moving frigid waters, we stood fora moment at the bank and took in the surroundings.
TABLE 14.1BMWP Score System
Families Common-Name Examples Score
Heptageniidae Mayflies 10Leuctridae StonefliesAeshnidae Dragonflies 8Polycentropidae Caddisflies 7Hydrometridae Water StriderGyrinidae Whirligig beetle 5Chironomidae Mosquitoes 2Oligochaeta Worms 1
Note: Modified for illustrative purposes.
Source: Spellman, F.R., Spellman’s Standard Handbookfor Wastewater Operators, Vol. 1, Technomic Publ., Lan-caster, PA, 1999.)
TABLE 14.2Sample Index of Macroinvertebrates
Group One (Sensitive)
Group Two (Somewhat Sensitive)
Group Three (Tolerant)
Stonefly larva Alderfly larva Aquatic wormCaddisfly larva Damselfly larva Midgefly larvaWater penny larva Cranefly larva Blackfly larvaRiffle beetle adult Beetle adult LeechMayfly larva Dragonfly larva SnailsGilled snail Sowbugs
Source: Spellman, F.R., Spellman’s Standard Handbook forWastewater Operators, Vol. 1, Technomic Publ., Lancaster, PA,1999.)
© 2003 by CRC Press LLC
384
Handbook of Water and Wastewater Treatment Plant Operations
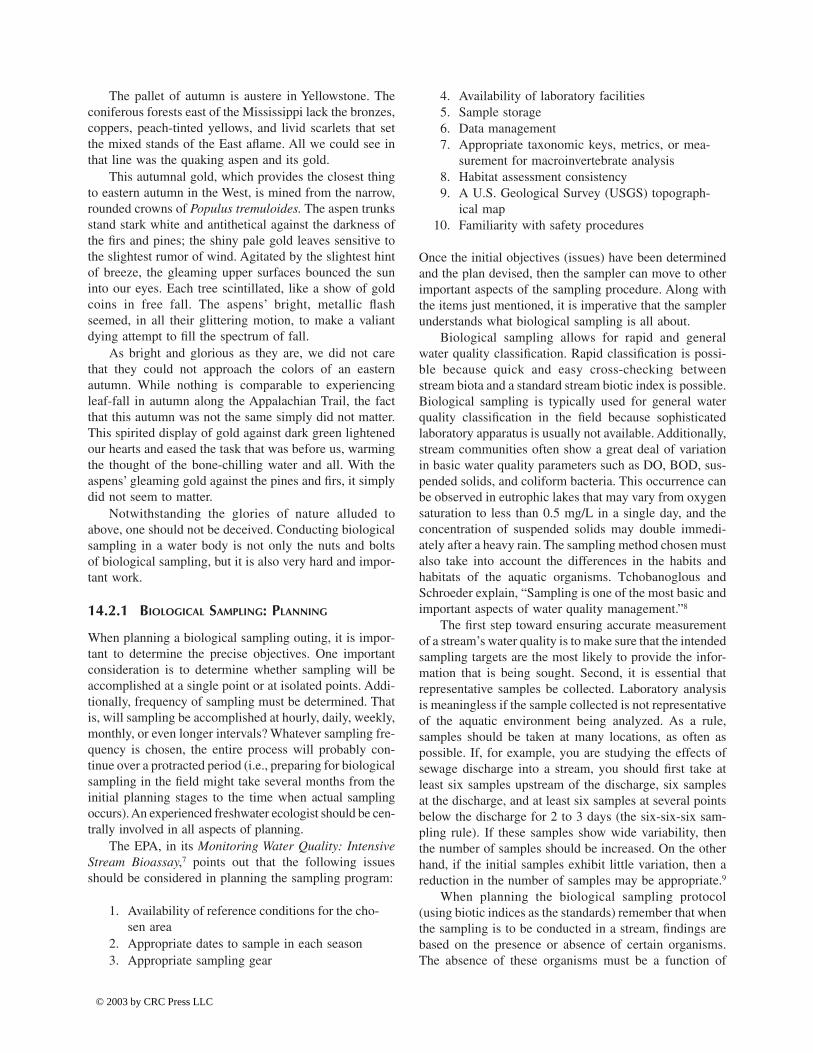
The pallet of autumn is austere in Yellowstone. Theconiferous forests east of the Mississippi lack the bronzes,coppers, peach-tinted yellows, and livid scarlets that setthe mixed stands of the East aflame. All we could see inthat line was the quaking aspen and its gold.
This autumnal gold, which provides the closest thingto eastern autumn in the West, is mined from the narrow,rounded crowns of Populus tremuloides. The aspen trunksstand stark white and antithetical against the darkness ofthe firs and pines; the shiny pale gold leaves sensitive tothe slightest rumor of wind. Agitated by the slightest hintof breeze, the gleaming upper surfaces bounced the suninto our eyes. Each tree scintillated, like a show of goldcoins in free fall. The aspens’ bright, metallic flashseemed, in all their glittering motion, to make a valiantdying attempt to fill the spectrum of fall.
As bright and glorious as they are, we did not carethat they could not approach the colors of an easternautumn. While nothing is comparable to experiencingleaf-fall in autumn along the Appalachian Trail, the factthat this autumn was not the same simply did not matter.This spirited display of gold against dark green lightenedour hearts and eased the task that was before us, warmingthe thought of the bone-chilling water and all. With theaspens’ gleaming gold against the pines and firs, it simplydid not seem to matter.
Notwithstanding the glories of nature alluded toabove, one should not be deceived. Conducting biologicalsampling in a water body is not only the nuts and boltsof biological sampling, but it is also very hard and impor-tant work.
14.2.1 BIOLOGICAL SAMPLING: PLANNING
When planning a biological sampling outing, it is impor-tant to determine the precise objectives. One importantconsideration is to determine whether sampling will beaccomplished at a single point or at isolated points. Addi-tionally, frequency of sampling must be determined. Thatis, will sampling be accomplished at hourly, daily, weekly,monthly, or even longer intervals? Whatever sampling fre-quency is chosen, the entire process will probably con-tinue over a protracted period (i.e., preparing for biologicalsampling in the field might take several months from theinitial planning stages to the time when actual samplingoccurs). An experienced freshwater ecologist should be cen-trally involved in all aspects of planning.
The EPA, in its Monitoring Water Quality: IntensiveStream Bioassay,7 points out that the following issuesshould be considered in planning the sampling program:
1. Availability of reference conditions for the cho-sen area
2. Appropriate dates to sample in each season3. Appropriate sampling gear
4. Availability of laboratory facilities5. Sample storage6. Data management7. Appropriate taxonomic keys, metrics, or mea-
surement for macroinvertebrate analysis8. Habitat assessment consistency9. A U.S. Geological Survey (USGS) topograph-
ical map10. Familiarity with safety procedures
Once the initial objectives (issues) have been determinedand the plan devised, then the sampler can move to otherimportant aspects of the sampling procedure. Along withthe items just mentioned, it is imperative that the samplerunderstands what biological sampling is all about.
Biological sampling allows for rapid and generalwater quality classification. Rapid classification is possi-ble because quick and easy cross-checking betweenstream biota and a standard stream biotic index is possible.Biological sampling is typically used for general waterquality classification in the field because sophisticatedlaboratory apparatus is usually not available. Additionally,stream communities often show a great deal of variationin basic water quality parameters such as DO, BOD, sus-pended solids, and coliform bacteria. This occurrence canbe observed in eutrophic lakes that may vary from oxygensaturation to less than 0.5 mg/L in a single day, and theconcentration of suspended solids may double immedi-ately after a heavy rain. The sampling method chosen mustalso take into account the differences in the habits andhabitats of the aquatic organisms. Tchobanoglous andSchroeder explain, “Sampling is one of the most basic andimportant aspects of water quality management.”8
The first step toward ensuring accurate measurementof a stream’s water quality is to make sure that the intendedsampling targets are the most likely to provide the infor-mation that is being sought. Second, it is essential thatrepresentative samples be collected. Laboratory analysisis meaningless if the sample collected is not representativeof the aquatic environment being analyzed. As a rule,samples should be taken at many locations, as often aspossible. If, for example, you are studying the effects ofsewage discharge into a stream, you should first take atleast six samples upstream of the discharge, six samplesat the discharge, and at least six samples at several pointsbelow the discharge for 2 to 3 days (the six-six-six sam-pling rule). If these samples show wide variability, thenthe number of samples should be increased. On the otherhand, if the initial samples exhibit little variation, then areduction in the number of samples may be appropriate.9
When planning the biological sampling protocol(using biotic indices as the standards) remember that whenthe sampling is to be conducted in a stream, findings arebased on the presence or absence of certain organisms.The absence of these organisms must be a function of
© 2003 by CRC Press LLC

Biomonitoring, Monitoring, Sampling, and Testing
385
pollution and not of some other ecological problem. Thepreferred (favored in this text) aquatic group for biologicalmonitoring in stream is the macroinvertebrates, which areusually retained by 30 mesh sieves (pond nets).
14.2.2 SAMPLING STATIONS
After determining the number of samples to be taken,sampling stations (locations) must be determined. Severalfactors determine where the sampling stations should beset up. These factors include: stream habitat types, theposition of the wastewater effluent outfalls, stream charac-teristics, stream developments (dams, bridges, navigationlocks, and other man-made structures), the self-purifica-tion characteristics of the stream, and the nature of theobjectives of the study.10
The stream habitat types used in this discussion arethose that are macroinvertebrate assemblage in streamecosystems. Some combination of these habitats would besampled in a multihabitat approach to benthic sampling:11
1. Cobble (hard substrate) — Cobble is prevalentin the riffles (and runs), which are a commonfeature throughout most mountain and pied-mont streams. In many high-gradient streams,this habitat type will be dominant. However,riffles are not a common feature of most coastalor other low-gradient streams. Sample shallowareas with coarse substrates (mixed gravel, cob-ble or larger) by holding the bottom of the dipnet against the substrate and dislodging organ-isms by kicking (this is where the designatedkicker, a sampling partner, comes in handy) thesubstrate for 0.5 m upstream of the net.
2. Snags — Snags and other woody debris thathave been submerged for a relatively longperiod (not recent deadfall) provide excellentcolonization habitat. Sample submerged woodydebris by jabbing in medium-sized snag mate-rial (sticks and branches). The snag habitat maybe kicked first to help to dislodge organisms,but only after placing the net downstream ofthe snag. Accumulated woody material in poolareas is considered snag habitat. Large logsshould be avoided because they are generallydifficult to sample adequately.
3. Vegetated banks — When lower banks are sub-merged and have roots and emergent plantsassociated with them, they are sampled in afashion similar to snags. Submerged areas ofundercut banks are good habitats to sample.Sample banks with protruding roots and plantsby jabbing into the habitat. Bank habitat can bekicked first to help dislodge organisms, but onlyafter placing the net downstream.
4. Submerged macrophytes — Submerged macro-phytes are seasonal in their occurrence and maynot be a common feature of many streams, par-ticularly those that are high gradient. Sampleaquatic plants that are rooted on the bottom ofthe stream in deep water by drawing the netthrough the vegetation from the bottom to thesurface of the water (maximum of 0.5 m eachjab). In shallow water, sample by bumping orjabbing the net along the bottom in the rootedarea, avoiding sediments where possible.
5. Sand (and other fine sediment) — Usually theleast productive macroinvertebrate habitat instreams, this habitat may be the most prevalentin some streams. Sample banks of unvegetatedor soft soil by bumping the net along the surfaceof the substrate rather than dragging the netthrough soft substrate; this reduces the amountof debris in the sample.
It is usually impossible to go out and count each andevery macroinvertebrate present in a waterway. Thiswould be comparable to counting different sizes of grainsof sand on the beach. Thus, in a biological sampling pro-gram (i.e., based on our experience), the most commonsampling methods are the transect and the grid. Transectsampling involves taking samples along a straight lineeither at uniform or at random intervals (see Figure 14.1).The transect involves the cross section of a lake or streamor the longitudinal section of a river or stream. Thetransect sampling method allows for a more completeanalysis by including variations in habitat.
In grid sampling, an imaginary grid system is placedover the study area. The grids may be numbered, andrandom numbers are generated to determine which gridsshould be sampled (see Figure 14.2). This type of samplingmethod allows for quantitative analysis because the gridsare all of a certain size. For example, to sample a streamfor benthic macroinvertebrates, grids that are 0.25 m2 maybe used. The weight or number of benthic macroinverte-brates per square meter can then be determined.
Random sampling requires that each possible sam-pling location have an equal chance of being selected.Numbering all sampling locations, and then using a com-puter, calculator, or a random numbers table to collect aseries of random numbers can accomplish this. An illus-tration of how to put the random numbers to work isprovided in the following example. Given a pond that has300 grid units, find 8 random sampling locations usingthe following sequence of random numbers taken from astandard random numbers table: 101, 209, 007, 018, 099,100, 017, 069, 096, 033, 041, 011. The first eight numbersof the sequence could be selected and only grids wouldbe sampled to obtain a random sample.
© 2003 by CRC Press LLC

386
Handbook of Water and Wastewater Treatment Plant Operations
14.2.3 SAMPLE COLLECTION
(Note: The following procedures are suggested by EPA inVolunteer Stream Monitoring: A Methods Manual, Wash-ington, D.C., Aug. 18, 2000, pp. 1–35.)
After establishing the sampling methodology and thesampling locations, the frequency of sampling must bedetermined. The more samples collected, the more reliablethe data will be. A frequency of once a week or once amonth will be adequate for most aquatic studies. Usually,the sampling period covers an entire year so that yearly
variations may be included. The details of sample collec-tion will depend on the type of problem that is beingsolved and will vary with each study. When a sample iscollected, it must be carefully identified with the followinginformation:
1. Location — Name of water body and place ofstudy and longitude and latitude.
2. Date and time.3. Site — Point of sampling (sampling location).4. Name of collector.
FIGURE 14.1 Transect sampling. (From Spellman, F.R., Spellman’s Standard Handbook for Wastewater Operators, Vol. 1, Tech-nomic Publ., Lancaster, PA, 1999.)
FIGURE 14.2 Grid sampling. (From Spellman, F.R., Spellman’s Standard Handbook for Wastewater Operators, Vol. 1, TechnomicPubl., Lancaster, PA, 1999.)
Stream or river
Cross-sectional transects
Longitudinal transect
Cross-sectional transects
Lake or reservoir
1 2 3 4
5 6 7 8 9
10 11 12 13 14 15 16
17 18 19 20 21 22 23 24 25
26 27 28 29 30 31 32 33 34 35 36 37
38 39 40 41 42 43 44 45 46 47 48 49
50 51 52 53 54 55 56 57 58 59 60
61 62 63 64 65 66 67 68 69 70 71 72
73 74 75 76 77 78 79 80 81 82 83 84
85 86 87 88 89 90 91 92 93 94 95 96
97 98 99 100 101 102 103 104 105 106 107
108 109 110 111 112 113 114 115 116 117 118
119 120 121 122 123 124 125 126 127 128 129
130 131 132 133 134 135 136 137 138 139 140 141
142 143 144 145 146 147 148 149 150 151 152
153 154 155 156 157 158 159 160 161 162
163 164 165 166 167 168 169 170 171 172
173 174 175 176 177 178 179 180 181 182
183 184 185 186 187 188 189 190 191 192
193 194 195 196 197 198 199
200 201 202 203
1 2 3
4 5 6
7 8 9
10 11 12
Stream orriver
Lake or reservoir
© 2003 by CRC Press LLC

Biomonitoring, Monitoring, Sampling, and Testing
387
5. Weather — Temperature, precipitation, humid-ity, wind, etc.
6. Miscellaneous — Any other important informa-tion (e.g., observations).
7. Field notebook — On each sampling day, noteson field conditions should be written. For exam-ple, miscellaneous notes and weather conditionscan be entered. Additionally, notes that describethe condition of the water are also helpful (color,turbidity, odor, algae, etc.). All unusual findingsand condition should also be entered.
14.2.3.1 Macroinvertebrate Sampling Equipment
In addition to the appropriate and applicable samplingequipment described in Section 14.2.5, assemble the fol-lowing equipment.
1. Jars (two, at least quart size), plastic, wide-mouth with tight cap (one should be empty andthe other filled about 2/3 with 70% ethyl alcohol)
2. Hand lens, magnifying glass, or field microscope3. Fine-point forceps.4. Heavy-duty rubber gloves5. Plastic sugar scoop or ice-cream scoop6. Kink net (rocky-bottom stream) or dip net
(muddy-bottom stream)7. Buckets (two; see Figure 14.3)8. String or twine (50 yards) and tape measure9. Stakes (four)
10. Orange (a stick, an apple, or a fish float may alsobe used in place of an orange) to measure velocity
11. Reference maps indicating general informationpertinent to the sampling area, including thesurrounding roadways, as well as a hand-drawnstation map
12. Station ID tags13. Spray water bottle14. Pencils (at least 2)
14.2.3.2 Macroinvertebrate Sampling: Rocky-Bottom Streams
Rocky-bottom streams are defined as those with bottomsmade up of gravel, cobbles, and boulders in any combina-tion. They usually have definite riffle areas. As mentioned,riffle areas are fairly well oxygenated and, therefore, areprime habitats for benthic macroinvertebrates. In thesestreams, we use the rocky-bottom sampling methoddescribed below.
14.2.3.2.1 Rocky-Bottom Sampling MethodThe following method of macroinvertebrate sampling isused in streams that have riffles and gravel or cobblesubstrates. Three samples are to be collected at each site,
and a composite sample is obtained (i.e., one large totalsample).
Step 1 — A site should have already been locatedon a map, with its latitude and longitude indicated.
1. Samples will be taken in 3 different spotswithin a 100-yd stream site. These spots maybe three separate riffles; one large riffle withdifferent current velocities; or, if no rifflesare present, three run areas with gravel orcobble substrate. Combinations are also pos-sible (e.g., site has only one small riffle andseveral run areas). Mark off the 100-ydstream site. If possible, it should begin atleast 50 yd upstream of any man-made mod-ification of the channel, such as a bridge,dam, or pipeline crossing. Avoid walking inthe stream because this might dislodge macro-invertebrates and disturb later samplingresults.
2. Sketch the 100-yd sampling area. Indicatethe location of the three sampling spots onthe sketch. Mark the most downstream siteas Site 1, the middle site as Site 2, and theupstream site as Site3.
Step 2 — Get into place.1. Always approach sampling locations from the
downstream end and sample the site furthestdownstream first (Site 1). This prevents bias-ing of the second and third collections withdislodged sediment of macroinvertebrates.Always use a clean kick-seine, relatively freeof mud and debris from previous uses. Filla bucket about one-third full with streamwater, and fill your spray bottle.
FIGURE 14.3 Sieve bucket. Most professional biological moni-toring programs employ sieve buckets as holding containers forcomposited samples. These buckets have a mesh bottom thatallows water to drain out while the organisms and debris remain.This material can then be easily transferred to the alcohol-filledjars. However, sieve buckets can be expensive. Many volunteerprograms employ alternative equipment, such as the two regularbuckets described in this section. Regardless of the equipment, theprocess for compositing and transferring the sample is basicallythe same. The decision is one of cost and convenience. (FromSpellman, F.R., Spellman’s Standard Handbook for WastewaterOperators, Vol. 1, Technomic Publ., Lancaster, PA, 1999.)
© 2003 by CRC Press LLC

388
Handbook of Water and Wastewater Treatment Plant Operations
2. Select a 3 ¥ 3-ft riffle area for sampling atSite 1. One member of the team, the netholder, should position the net at the down-stream end of this sampling area. Hold the nethandles at a 45-degree angle to the water’ssurface. Be sure that the bottom of the net fitstightly against the streambed so that no mac-roinvertebrates escape under the net. You mayuse rocks from the sampling area to anchorthe net against the stream bottom. Do notallow any water to flow over the net.
Step 3 — Dislodge the macroinvertebrates.1. Pick up any large rocks in the 3 ¥ 3-ft sam-
pling area and rub them thoroughly over thepartially filled bucket so that any macroinver-tebrates clinging to the rocks will be dislodgedinto the bucket. Then place each cleaned rockoutside of the sampling area. After samplingis completed, rocks can be returned to thestretch of stream they came from.
2. The member of the team designated as thekicker should thoroughly stir up the samplingareas with their feet, starting at the upstreamedge of the 3 ¥ 3-ft sampling area and work-ing downstream, moving toward the net. Alldislodged organisms will be carried by thestream flow into the net. Be sure to disturbthe first few inches of stream sediment todislodge burrowing organisms. As a guide,disturb the sampling area for about 3 min, oruntil the area is thoroughly worked over.
3. Any large rocks used to anchor the netshould be thoroughly rubbed into the bucketas above.
Step 4 — Remove the net.1. Remove the net without allowing any of the
organisms it contains to wash away. While thenet holder grabs the top of the net handles, thekicker grabs the bottom of the net handles andthe net’s bottom edge. Remove the net fromthe stream with a forward scooping motion.
2. Roll the kick net into a cylinder shape andplace it vertically in the partially filledbucket. Pour or spray water down the net toflush its contents into the bucket. If neces-sary, pick debris and organisms from the netby hand. Release any caught fish, amphibi-ans, or reptiles back into the stream.
Step 5 — Collect the second and third samples.1. Once all of the organisms have been
removed from the net, repeat the steps aboveat Sites 2 and 3. Put the samples from allthree sites into the same bucket. Combiningthe debris and organisms from all three sitesinto the same bucket is called compositing.
Note: If your bucket is nearly full of water after youhave washed the net clean, let the debris andorganisms settle to the bottom. Cup the net overthe bucket and pour the water through the netinto a second bucket. Inspect the water in thesecond bucket to be sure there are no organisms.
Step 6 — Preserve the sample.
1. After collecting and compositing all threesamples, it is time to preserve the sample.All team members should leave the streamand return to a relatively flat section of thestream bank with their equipment. The nextstep will be to remove large pieces of debris(leaves, twigs, and rocks) from the sample.Carefully remove the debris one piece at atime. While holding the material over thebucket, use the forceps, spray bottle, andyour hands to pick, rub, and rinse the leaves,twigs, and rocks to remove any attachedorganisms. Use a magnifying lens and forcepsto find and remove small organisms clingingto the debris. When satisfied that the materialis clean, discard it back into the stream.
2. The water will have to be drained beforetransferring material to the jar. This processwill require two team members. Place thekick net over the second bucket, which hasnot yet been used and should be completelyempty. One team member should push thecenter of the net into bucket #2, creating asmall indentation or depression. Hold thesides of the net closely over the mouth ofthe bucket. The second person can now care-fully pour the remaining contents of bucket#1 onto a small area of the net to drain thewater and concentrate the organisms. Usecare when pouring so that organisms are notlost over the side of the net (see Figure 14.4).
Use the spray bottle, forceps, sugar scoop,and gloved hands to remove all materialfrom bucket #1 onto the net. When you are
FIGURE 14.4 Pouring sample water through the net. (FromSpellman, F.R., Spellman’s Standard Handbook for WastewaterOperators, Vol. 1, Technomic Publ., Lancaster, PA, 1999.)
© 2003 by CRC Press LLC

Biomonitoring, Monitoring, Sampling, and Testing
389
satisfied that bucket #1 is empty, use yourhands and the sugar scoop to transfer thematerial from the net into the empty jar.
Bucket #2 captures the water and anyorganisms that might have fallen through thenetting during pouring. As a final check,repeat the process above, but this time, pourbucket #2 over the net, into bucket #1. Trans-fer any organisms on the net into the jar.
3. Fill the jar (so that all material is submerged)with the alcohol from the second jar. Put thelid tightly back onto the jar, and gently turnthe jar upside down two or three times todistribute the alcohol and remove air bubbles.
4. Complete the sampling station ID tag. Besure to use a pencil, since a pen’s ink willrun in the alcohol. The tag includes yourstation number, the stream, and location(e.g., upstream from a road crossing), date,time, and the names of the members of thecollecting team. Place the ID tag into thesample container, written side facing out, sothat identification can be seen clearly.
14.2.3.2.2 Rocky-Bottom Habitat AssessmentThe habitat assessment (including measuring generalcharacteristics and local land use) for a rocky-bottomstream is conducted in a 100-yd section of stream thatincludes the riffles from which organisms were collected.
Step 1 — Delineate the habitat assessment bound-aries.
1. Begin by identifying the most downstreamriffle that was sampled for macroinverte-brates. Using tape measure or twine, markoff a 100-yd section extending 25 yd belowthe downstream riffle and about 75 ydupstream.
2. Complete the identifying information of thefield data sheet for the habitat assessmentsite. On the stream sketch, be as detailed aspossible, and be sure to note which riffleswere sampled.
Step 2 — Describe the general characteristics andlocal land use on the field sheet.
1. For safety reasons as well as to protect thestream habitat, it is best to estimate the fol-lowing characteristics rather than actuallywade into the stream to measure them:A. Water appearance can be a physical indi-
cator of water pollution:1. Clear — Colorless, transparent2. Milky — Cloudy-white or gray, not
transparent; might be natural or due topollution
3. Foamy — might be natural or due topollution, generally detergents ornutrients (foam that is several incheshigh and does not brush apart easily isgenerally due to pollution)
4. Turbid — Cloudy brown due to sus-pended silt or organic material
5. Dark brown — might indicate thatacids are being released into thestream due to decaying plants
6. Oily sheen — Multicolored reflectionmight indicate oil floating in the stream,although some sheens are natural
7. Orange — Might indicate acid drainage8. Green — Might indicate that excess
nutrients are being released into thestream
B. Water odor can be a physical indicator ofwater pollution:1. None or natural smell2. Sewage — Might indicate the release
of human waste material3. Chlorine — Might indicate that a
sewage treatment plant is over-chlori-nating its effluent
4. Fishy — Might indicate the presenceof excessive algal growth or dead fish
5. Rotten eggs — Might indicate sewagepollution (the presence of a naturalgas)
C. Water temperature can be particularlyimportant for determining whether thestream is suitable as habitat for some spe-cies of fish and macroinvertebrates thathave distinct temperature requirements.Temperature also has a direct effect onthe amount of DO available to aquaticorganisms. Measure temperature by sub-merging a thermometer for at least 2 minin a typical stream run. Repeat once andaverage the results.
D. The width of the stream channel can bedetermined by estimating the width of thestreambed that is covered by water frombank to bank. If it varies widely along thestream, estimate an average width.
E. Local land use refers to the part of thewatershed within 1/4 mi upstream of andadjacent to the site. Note which land usesare present, as well as which ones seemto be having a negative impact on thestream. Base observations on what can beseen, what was passed on the way to thestream, and, if possible, what is noticedwhen leaving the stream.
© 2003 by CRC Press LLC

390
Handbook of Water and Wastewater Treatment Plant Operations
Step 3 — Conduct the habitat assessment.
1. The following information describes theparameters that will be evaluated for rocky-bottom habitats. Use these definitions whencompleting the habitat assessment field datasheet. The first two parameters should beassessed directly at the riffles or runs thatwere used for the macroinvertebrate sam-pling. The last 8 parameters should beassessed in the entire 100-yd section of thestream.
A. Attachment sites for macroinvertebratesare essentially the amount of living spaceor hard substrates (rocks, snags) availablefor adequate insects and snails. Manyinsects begin their life underwater instreams and need to attach themselves torocks, logs, branches, or other submergedsubstrates. The greater the variety andnumber of available living spaces orattachment sites, the greater the varietyof insects in the stream. Optimally, cobbleshould predominate, and boulders andgravel should be common. The availabilityof suitable living spaces for macroinver-tebrates decreases as cobble becomes lessabundant and boulders, gravel, or bedrockbecome more prevalent.
B. Embeddedness refers to the extent towhich rocks (gravel, cobble, and boul-ders) are surrounded by, covered with, orsunken into the silt, sand, or mud of thestream bottom. Generally, as rocksbecome embedded, fewer living spacesare available to macroinvertebrates andfish for shelter, spawning, and egg incu-bation.
Note: To estimate the percent of embeddedness,observe the amount of silt or finer sedimentsoverlaying and surrounding the rocks. If kick-ing does not dislodge the rocks or cobbles, theymight be greatly embedded.
C. Shelter for fish includes the relative quan-tity and variety of natural structures instream, such as fallen trees, logs, andbranches; cobble and large rock; andundercut banks that are available to fishfor hiding, sleeping, or feeding. A widevariety of submerged structures in thestream provide fish with many livingspaces; the more living spaces in astream, the more types of fish the streamcan support.
D. Channel alteration is a measure of large-scale changes in the shape of the streamchannel. Many streams in urban and agri-cultural areas have been straightened,deepened (e.g., dredged), or diverted intoconcrete channels, often for flood controlpurposes. Such streams have far fewer nat-ural habitats for fish, macroinvertebrates,and plants than do naturally meanderingstreams. Channel alteration is presentwhen the stream runs through a concretechannel, when artificial embankments,riprap, and other forms of artificial bankstabilization or structures are present;when the stream is very straight for sig-nificant distances; when dams, bridges,and flow-altering structures, such as com-bined sewer overflow, are present; whenthe stream is of uniform depth due todredging; and when other such changeshave occurred. Signs that indicate theoccurrence of dredging include straight-ened, deepened, and otherwise uniformstream channels, as well as the removalof streamside vegetation to providedredging equipment access to the stream.
E. Sediment deposition is a measure of theamount of sediment that has been depos-ited in the stream channel and the changesto the stream bottom that have occurred asa result of the deposition. High levels ofsediment deposition create an unstable andcontinually changing environment that isunsuitable for many aquatic organisms.
Sediments are naturally deposited inareas where the stream flow is reduced,such as in pools and bends, or where flowis obstructed. These deposits can lead tothe formation of islands, shoals, or pointbars (sediments that build up in thestream, usually at the beginning of ameander) or can result in the completefilling of pools. To determine whetherthese sediment deposits are new, look forvegetation growing on them. New sedi-ments will not yet have been colonizedby vegetation.
F. Stream velocity and depth combinationsare important to the maintenance ofhealthy aquatic communities. Fast waterincreases the amount of DO in the water,keeps pools from being filled with sedi-ment; and helps food items like leaves,twigs, and algae move more quicklythrough the aquatic system. Slow water
© 2003 by CRC Press LLC
Biomonitoring, Monitoring, Sampling, and Testing
391
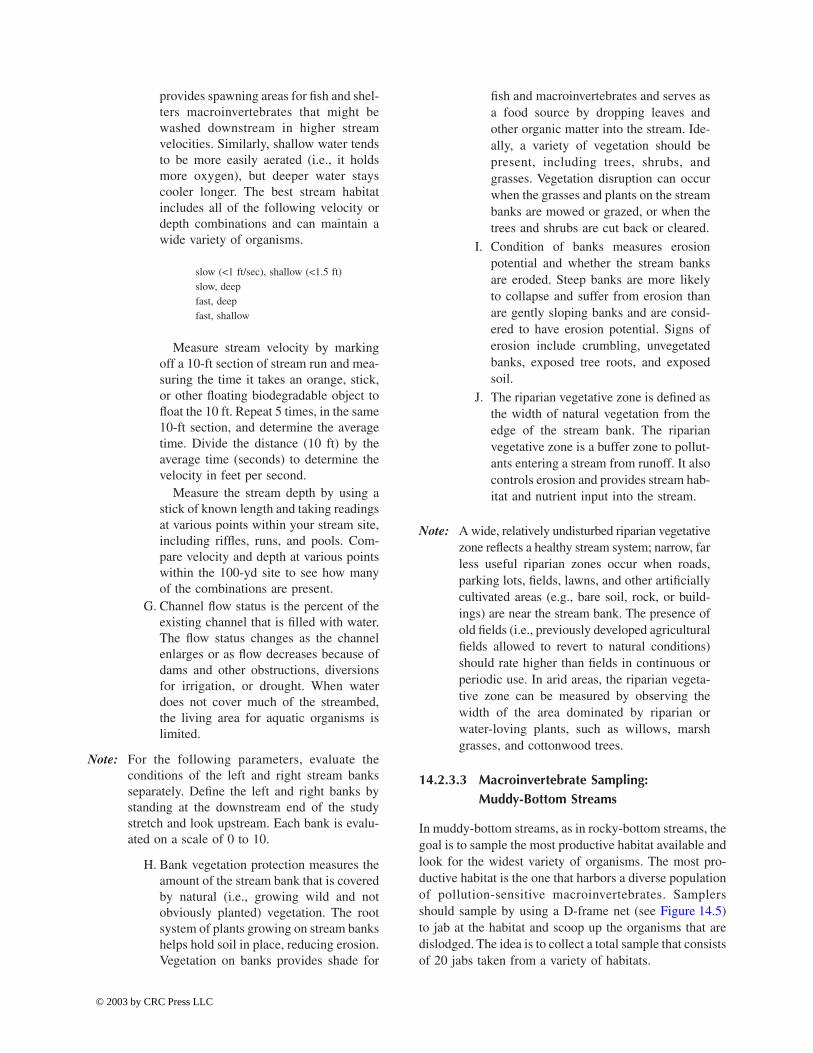
provides spawning areas for fish and shel-ters macroinvertebrates that might bewashed downstream in higher streamvelocities. Similarly, shallow water tendsto be more easily aerated (i.e., it holdsmore oxygen), but deeper water stayscooler longer. The best stream habitatincludes all of the following velocity ordepth combinations and can maintain awide variety of organisms.
Measure stream velocity by markingoff a 10-ft section of stream run and mea-suring the time it takes an orange, stick,or other floating biodegradable object tofloat the 10 ft. Repeat 5 times, in the same10-ft section, and determine the averagetime. Divide the distance (10 ft) by theaverage time (seconds) to determine thevelocity in feet per second.
Measure the stream depth by using astick of known length and taking readingsat various points within your stream site,including riffles, runs, and pools. Com-pare velocity and depth at various pointswithin the 100-yd site to see how manyof the combinations are present.
G. Channel flow status is the percent of theexisting channel that is filled with water.The flow status changes as the channelenlarges or as flow decreases because ofdams and other obstructions, diversionsfor irrigation, or drought. When waterdoes not cover much of the streambed,the living area for aquatic organisms islimited.
Note: For the following parameters, evaluate theconditions of the left and right stream banksseparately. Define the left and right banks bystanding at the downstream end of the studystretch and look upstream. Each bank is evalu-ated on a scale of 0 to 10.
H. Bank vegetation protection measures theamount of the stream bank that is coveredby natural (i.e., growing wild and notobviously planted) vegetation. The rootsystem of plants growing on stream bankshelps hold soil in place, reducing erosion.Vegetation on banks provides shade for
fish and macroinvertebrates and serves asa food source by dropping leaves andother organic matter into the stream. Ide-ally, a variety of vegetation should bepresent, including trees, shrubs, andgrasses. Vegetation disruption can occurwhen the grasses and plants on the streambanks are mowed or grazed, or when thetrees and shrubs are cut back or cleared.
I. Condition of banks measures erosionpotential and whether the stream banksare eroded. Steep banks are more likelyto collapse and suffer from erosion thanare gently sloping banks and are consid-ered to have erosion potential. Signs oferosion include crumbling, unvegetatedbanks, exposed tree roots, and exposedsoil.
J. The riparian vegetative zone is defined asthe width of natural vegetation from theedge of the stream bank. The riparianvegetative zone is a buffer zone to pollut-ants entering a stream from runoff. It alsocontrols erosion and provides stream hab-itat and nutrient input into the stream.
Note: A wide, relatively undisturbed riparian vegetativezone reflects a healthy stream system; narrow, farless useful riparian zones occur when roads,parking lots, fields, lawns, and other artificiallycultivated areas (e.g., bare soil, rock, or build-ings) are near the stream bank. The presence ofold fields (i.e., previously developed agriculturalfields allowed to revert to natural conditions)should rate higher than fields in continuous orperiodic use. In arid areas, the riparian vegeta-tive zone can be measured by observing thewidth of the area dominated by riparian orwater-loving plants, such as willows, marshgrasses, and cottonwood trees.
14.2.3.3 Macroinvertebrate Sampling: Muddy-Bottom Streams
In muddy-bottom streams, as in rocky-bottom streams, thegoal is to sample the most productive habitat available andlook for the widest variety of organisms. The most pro-ductive habitat is the one that harbors a diverse populationof pollution-sensitive macroinvertebrates. Samplersshould sample by using a D-frame net (see Figure 14.5)to jab at the habitat and scoop up the organisms that aredislodged. The idea is to collect a total sample that consistsof 20 jabs taken from a variety of habitats.
slow (<1 ft/sec), shallow (<1.5 ft)slow, deepfast, deepfast, shallow
© 2003 by CRC Press LLC

392
Handbook of Water and Wastewater Treatment Plant Operations
14.2.3.3.1 Muddy-Bottom Sampling Method
Use the following method of macroinvertebrate samplingin streams that have muddy-bottom substrates.
Step 1 — Determine which habitats are present.1. Muddy-bottom streams usually have four hab-
itats: vegetated banks margins; snags and logs;aquatic vegetation beds and decaying organicmatter; and silt, sand, or gravel substrate. It isgenerally best to concentrate samplingefforts on the most productive habitat avail-able, but sample other principal habitats ifthey are present. This ensures that as wide avariety of organisms as possible are secured.Not all habitats are present in all streams orpresent in significant amounts. If the samplingareas have not been preselected, determinewhich of the following habitats are present.
Note: Avoid standing in the stream while making hab-itat determinations.
A. Vegetated bank margins consist of over-hanging bank vegetation and submergedroot mats attached to banks. The bankmargins may also contain submerged,decomposing leaf packs trapped in rootwads or lining the streambanks. This isgenerally a highly productive habitat in amuddy stream, and it is often the mostabundant type of habitat.
B. Snags and logs consist of submergedwood, primarily dead trees, logs, branches,roots, cypress knees, and leaf packs
lodged between rocks or logs. This is alsoa very productive muddy-bottom streamhabitat.
C. Aquatic vegetation beds and decayingorganic matter consist of beds of sub-merged, green or leafy plants that areattached to the stream bottom. This hab-itat can be as productive as vegetatedbank margins and snags and logs.
D. Silt, sand, or gravel substrate includessandy, silty, or muddy stream bottoms;rocks along the stream bottom; and wettedgravel bars. This habitat may also containalgae-covered rocks (Aufwuchs). This isthe least productive of the four muddy-bottom stream habitats, and it is alwayspresent in one form or another (e.g., silt,sand, mud, or gravel might predominate).
Step 2 — Determine how many times to jab in eachhabitat type.
1. The sampler’s goal is to jab 20 times. TheD-frame net (see Figure 14.5) is 1 ft wide,and a jab should be approximately 1 ft inlength. Thus, 20 jabs equal 20 ft2 of com-bined habitat.A. If all 4 habitats are present in plentiful
amounts, jab the vegetated banks 10 times.Divide the remaining 10 jabs amount theremaining 3 habitats.
B. If three habitats are present in plentifulamounts, and one is absent, jab the silt,or sand, or gravel substrate, the least pro-ductive habitat, five times. Divide theremaining 15 jabs between the other 2more productive habitats.
C. If only two habitats are preset in plentifulamounts, the silt, sand, or gravel substratewill most likely be one of those habitats.Jab the silt, sand, or gravel substrate 5 timesand the more productive habitat 15 times.
D. If some habitats are plentiful and othersare sparse, sample the sparse habitats tothe extent possible, even if you can takeonly one or two jabs. Take the remainingjabs from the plentiful habitats. This rulealso applies if you cannot reach a habitatbecause of unsafe stream conditions. Jab20 times.
Note: Because the sampler might need to make aneducated guess to decide how many jabs to takein each habitat type, it is critical that each sam-pler note, on the field data sheet, how many jabswere taken in each habitat. This information canbe used to help characterize the findings.
FIGURE 14.5 D-frame aquatic net. (From Spellman, F.R.,Spellman’s Standard Handbook for Wastewater Operators, Vol.1, Technomic Publ., Lancaster, PA, 1999.)
© 2003 by CRC Press LLC

Biomonitoring, Monitoring, Sampling, and Testing
393
Step 3 — Get into place.1. Outside and downstream of the first sampling
location (first habitat), rinse the dip net andcheck to make sure it does not contain anymacroinvertebrates or debris from the lasttime it was used. Fill a bucket approximatelyone-third with clean stream water. Also, fillthe spray bottle with clean stream water. Thisbottle will be used to wash the net betweenjabs and after sampling is completed.
Note: This method of sampling requires only one per-son to disturb the stream habitats. While oneperson is sampling, a second person shouldstand outside the sampling area, holding thebucket and spray bottle. After every few jabs,the sampler should hand the net to the secondperson, who then can rinse the net’s contentsinto the bucket.
Step 4 — Dislodge the macroinvertebrates.1. Approach the first sample site from down-
stream, and sample while walking upstream.Sample in the four habitat types as follows:A. Sample vegetated bank margins by jab-
bing vigorously with an upward motion,brushing the net against vegetation androots along the bank. The entire jabmotion should occur underwater.
B. To sample snags and logs, hold the netwith one hand under the section of sub-merged wood being sampled. With theother hand (which should be gloved), rubabout 1 ft2 of area on the snag or log.Scoop organisms, bark, twigs, or otherorganic matter dislodged into the net.Each combination of log rubbing and netscooping is one jab.
C. To sample aquatic vegetation beds, jabvigorously with an upward motionagainst or through the plant bed. Theentire jab motion should occur underwater.
D. To sample a silt, sand, or gravel substrate,place the net with one edge against thestream bottom and push it forward abouta foot (in an upstream direction) to dis-lodge the first few inches of silt, sand,gravel, or rocks. To avoid gathering a netfull of mud, periodically sweep the meshbottom of the net back and forth in thewater, making sure that waters do not runover the top of the net. This will allowfine silt to rinse out of the net. When20 jabs have been completed, rinse thenet thoroughly in the bucket. If necessary,
pick any clinging organisms from the netby hand and put them in the bucket.
Step 5 — Preserve the sample.1. Look through the material in the bucket, and
immediately return any fish, amphibians, orreptiles to the stream. Carefully removelarge pieces of debris (leaves, twigs, androcks) from the sample. While holding thematerial over the bucket, use the forceps,spray bottle, and your hands to pick, rub,and rinse the leaves, twigs, and rocks toremove any attached organisms. Use themagnifying lens and forceps to find andremove small organisms clinging to thedebris. When satisfied that the material isclean, discard it back into the stream.
2. Drain the water before transferring materialto the jar. This process will require two peo-ple. One person should place the net into thesecond bucket, like a sieve (this bucket,which has not yet been used, should becompletely empty), and hold it securely. Thesecond person can now carefully pour theremaining contents of bucket #1 onto thecenter of the net to drain the water and con-centrate the organisms.
Use care when pouring so that organismsare not lost over the side of the net. Use thespray bottle, forceps, sugar scoop, andgloved hands to remove all the material frombucket #1 onto the net. When satisfied thatbucket #1 is empty, use your hands and thesugar scoop to transfer all the material fromthe net into the empty jar. The contents ofthe net can also be emptied directly into thejar by turning the net inside out into the jar.
Bucket #2 captures the water and anyorganisms that might have fallen through thenetting. As a final check, repeat the processabove, but this time, pour bucket #2 over thenet, into bucket #1. Transfer any organismson the net into the jar.
3. Fill the jar (so that all material is submerged)with alcohol. Put the lid tightly back ontothe jar, and gently turn the jar upside downtwo or three times to distribute the alcoholand remove air bubbles.
4. Complete the sampling station ID tag (seeFigure 14.6). Be sure to use a pencil, sincea pen’s ink will run in the alcohol. The tagincludes your station number, the stream,and location (e.g., upstream from a roadcrossing), date, time, and the names of themembers of the collecting crew. Place theID tag into the sample container, written side
© 2003 by CRC Press LLC

394
Handbook of Water and Wastewater Treatment Plant Operations
facing out, so that identification can be seenclearly.
Note: To prevent samples from being mixed up, sam-plers should place the ID tag inside the samplejar.
14.2.3.3.2 Muddy-Bottom Stream Habitat Assessment
The muddy-bottom stream habitat assessment (whichincludes measuring general characteristics and local landuse) is conducted in a 100-yard section of the stream thatincludes the habitat areas from which organisms werecollected.
Note: As previously mentioned, when using a fielddata sheet (habitat assessment field data sheet),assume that the sampling team is using eitherthe standard forms provided by the EPA, USGS,state water control authorities, or generic formsput together by the sampling team. The sourceof the form and exact type of form are not impor-tant. Some type of data recording field sheetshould be employed to record pertinent data.
Step 1 — Delineate the habitat assessment bound-aries.
1. Begin by identifying the most downstreampoint that was sampled for macroinverte-brates. Using your tape measure or twine,mark off a 100-yd section extending 25 ydbelow the downstream sampling point andabout 75 yd upstream.
2. Complete the identifying information on thefield data sheet for the habitat assessmentsite. On the stream sketch, be as detailed as
possible, and be sure to note which habitatswere sampled.
Step 2 — Record general characteristics and localland use on the data field sheet.
1. For safety reasons, as well as to protect thestream habitat, it is best to estimate thesecharacteristics rather than actually wade intothe stream to measure them. For instructionson completing these sections of the field datasheet, see the rocky-bottom habitat assess-ment instructions.
Step 3 — Conduct the habitat assessment.1. The following information describes the
parameters to be evaluated for muddy-bottom habitats. Use these definitions whencompleting the habitat assessment field datasheet.A. Shelter for fish and attachment sites for
macroinvertebrates are essentially theamount of living space and shelter (rocks,snags, and undercut banks) available forfish, insects, and snails. Many insectsattach themselves to rocks, logs, branches,or other submerged substrates. Fish canhide or feed in these areas. The greater thevariety and number of available sheltersites or attachment sites, the greater thevariety of fish and insects in the stream.
Note: Many of the attachment sites result from debrisfalling into the stream from the surroundingvegetation. When debris first falls into thewater, it is termed new fall, and it has not yetbeen broken down by microbes (conditioned)for macroinvertebrate colonization. Leaf mate-rial or debris that is conditioned is called old
FIGURE 14.6 Station ID tag. (From Spellman, F.R., Spellman’s Standard Handbook for Wastewater Operators, Vol. 1, TechnomicPubl., Lancaster, PA, 1999.)
Station ID Tag
Station # ________________________________________________________
Stream ________________________________________________________
Location ________________________________________________________
Date/Time _______________________________________________________
Team Members: __________________________________________________
________________________________________________________________
________________________________________________________________
© 2003 by CRC Press LLC

Biomonitoring, Monitoring, Sampling, and Testing
395
fall. Leaves that have been in the stream forsome time lose their color, turn brown or dullyellow, become soft and supple with age, andmight be slimy to the touch. Woody debrisbecomes blackened or dark in color; smoothbark becomes coarse and partially disinte-grated, creating holes and crevices. It might alsobe slimy to the touch.
B. Poor substrate characterization evaluatesthe type and condition of bottom sub-strates found in pools. Pools with firmersediment types (e.g., gravel, sand) androoted aquatic plants support a widervariety of organisms than do pools withsubstrates dominated by mud or bedrockand no plants. In addition, a pool with oneuniform substrate type will support farfewer types of organisms than will a poolwith a wide variety of substrate types.
C. Pool variability rates the overall mixtureof pool types found in the stream accord-ing to size and depth. The four basic typesof pools are large-shallow, large-deep,small-shallow, and small-deep. A streamwith many pool types will support a widevariety of aquatic species. Rivers withlow sinuosity (few bends) and monoto-nous pool characteristics do not have suf-ficient quantities and types of habitats tosupport a diver’s aquatic community.
D. Channel alteration (see Section 14.2.3.2.2,Rocky-Bottom Habitat Assessment, Step 3,1-D).
E. Sediment deposition (see Section14.2.3.2.2, Rocky-Bottom HabitatAssessment, Step 3, 1-E).
F. Channel sinuosity evaluates the sinuosityor meandering of the stream. Streams thatmeander provide a variety of habitats(such as pools and runs) and streamvelocities and reduce the energy fromcurrent surges during storm events.Straight stream segments are character-ized by even stream depth and unvaryingvelocity, and they are prone to flooding.To evaluate this parameter, imagine howmuch longer the stream would be if itwere straightened.
G. Channel flow status (see Section 14.2.3.2.2,Rocky-Bottom Habitat Assessment, Step 3,1-G).
H. Bank vegetative protection (see Section14.2.3.2.2, Rocky-Bottom Habitat Assess-ment, Step 3, 1-H).
I. Condition of banks (see Section 14.2.3.2.2,Rocky-Bottom Habitat Assessment, Step 3,1-I).
J. The riparian vegetative zone width (seeSection 14.2.3.2.2, Rocky-Bottom Habi-tat Assessment, Step 3, 1-J).
Note: Whenever stream sampling is to be conducted,it is a good idea to have a reference collectionon hand. A reference collection is a sample oflocally found macroinvertebrates that have beenidentified, labeled, and preserved in alcohol.The program advisor, along with a professionalbiologist/entomologist, should assemble thereference collection, properly identify all sam-ples, preserve them in vials, and label them.This collection may then be used as a trainingtool and, in the field, as an aid in macroinver-tebrate identification.
14.2.4 POSTSAMPLING ROUTINE
After completing the stream characterization and habitatassessment, make sure that all of the field data sheets havebeen completed properly and that the information is leg-ible. Be sure to include the site’s identifying name andthe sampling date on each sheet. This information willfunction as a quality control element.
Before leaving the stream location, make sure that allsampling equipment or devices have been collected andrinsed properly. Double-check to see that sample jars aretightly closed and properly identified. All samples, fieldsheets, and equipment should be returned to the teamleader at this point. Keep a copy of the field data sheetsfor comparison with future monitoring trips and for per-sonal records.
The next step is to prepare for macroinvertebrate lab-oratory work. This step includes all the work needed toset up a laboratory for processing samples into subsamplesand identifying macroinvertebrates to the family level. Aprofessional biologist, entomologist, or freshwater ecologistor the professional advisor should supervise the identifi-cation procedure. (Note: The actual laboratory proceduresafter the sampling and collecting phase are beyond thescope of this text.)
14.2.4.1 Sampling Devices
In addition to the sampling equipment mentioned previ-ously, it may be desirable to employ, depending on streamconditions, the use of other sampling devices. Additionalsampling devices commonly used and discussed in thefollowing sections include DO and temperature monitors,sampling nets (including the D-frame aquatic net), sedi-ment samplers (dredges), plankton samplers, and Secchidisks.
© 2003 by CRC Press LLC

396
Handbook of Water and Wastewater Treatment Plant Operations
14.2.4.1.1 Dissolved Oxygen and Temperature Monitor
(Note: The methods described in this section are approvedby the EPA. Coverage that is more detailed is available inStandard Methods for the Examination of Water andWastewater, 20th ed., American Public Health Associa-tion, Washington, D.C., 1998, pp. 4–129.)
As mentioned, the DO content of a stream sample canprovide the investigator with vital information, as DOcontent reflects the stream’s ability to maintain aquaticlife.
14.2.4.1.2 The Winkler DO with Azide Modification Method
The Winkler DO with azide modification method is com-monly used to measure DO content. The Winkler Methodis best suited for clean waters. It can be used in the fieldbut is better suited for laboratory work where better accu-racy may be achieved. The Winkler method adds a divalentmanganese solution followed by a strong alkali to a300 mL BOD bottle of stream water sample. Any DOrapidly oxidizes an equivalent amount of divalent manga-nese to basic hydroxides of higher balance states. Whenthe solution is acidified in the presence of iodide, oxidizedmanganese again reverts to the divalent state; iodine,which is equivalent to the original DO content of thesample, is liberated. The amount of iodine is then deter-mined by titration with a standard, usually thiosulfate,solution.
Fortunately for the field biologist, this is the age ofminiaturized electronic circuit components and devices; itis not too difficult to obtain portable electronic measuringdevices for DO and temperature that are of quality con-struction and have better than moderate accuracy. Thesemodern electronic devices are usually suitable for labora-tory and field use. The device may be subjected to severeabuse in the field. Therefore, the instrument must be dura-ble, accurate, and easy to sue. Several quality DO monitorsare available commercially.
When using a DO monitor, it is important to calibrate(standardize) the meter prior to use. Calibration proce-dures can be found in Standard Methods (latest edition)or in the manufacturer’s instructions for the meter to be
used. Determining the air temperature, the DO at satura-tion for that temperature, and then adjusting the meter sothat it reads the saturation value usually accomplish metercalibration. After calibration, the monitor is ready for use.As mentioned, all recorded measurements, includingwater temperatures and DO readings, should be enteredin a field notebook.
14.2.4.1.3 Sampling Nets
A variety of sampling nets are available for use in thefield. The two-person seine net shown in Figure 14.7 is20 ¥ 4 ft deep with 1/8 in. mesh and is utilized to collecta variety of organisms. Two people, each holding one endand then walking upstream, use it. Small organisms areeasily collected by this method.
Dip nets are used to collect organisms in shallowstreams. The Surber sampler (collects macroinvertebratesstirred up from the bottom; see Figure 14.8) can be usedto obtain a quantitative sample (number of organ-isms/square feet). It is designed for sampling riffle areasin steams and rivers up to a depth of about 450 mm (18 in.).It consists of two folding stainless steel frames set at rightangles to each other. The frame is placed on the bottom,with the net extending downstream. Using a hand or arake, all sediment enclosed by the frame is dislodged. Allorganisms are caught in the net and transferred to anothervessel for counting.
FIGURE 14.7 Two-person seine net. (From Spellman, F.R.,Spellman’s Standard Handbook for Wastewater Operators, Vol.1, Technomic Publ., Lancaster, PA, 1999.)
Cork floaters
Lead sinkers
FIGURE 14.8 Surber sampler. (From Spellman, F.R., Spellman’s Standard Handbook for Wastewater Operators, Vol. 1, TechnomicPubl., Lancaster, PA, 1999.)
© 2003 by CRC Press LLC

Biomonitoring, Monitoring, Sampling, and Testing 397
The D-frame aquatic dip net (see Figure 14.5) is idealfor sweeping over vegetation or for use in shallow streams.
14.2.4.1.4 Sediment Samplers (Dredges)
A sediment sampler or dredge is designed to obtain asample of the bottom material in a slow-moving streamand the organisms in it. The simple homemade dredgeshown in Figure 14.9 works well in water too deep tosample effectively with handheld tools. The homemadedredge is fashioned from a #3 coffee can and a smallercan (see Figure 14.9) with a tight fitting plastic lid (peanutcans work well).
In using the homemade dredge, first invert it under waterso the can fills with water and no air is trapped. Then lowerthe dredge as quickly as possible with the down line. Theidea is to bury the open end of the coffee can in the bottom.Quickly pull the up line to bring the can to the surface witha minimum loss of material. Dump the contents into a sieveor observation pan to sort. It works best in bottoms com-posed of sediment, mud, sand, and small gravel.
By using the bottom sampling dredge, a number ofdifferent analyses can be made. Because the bottomsediments represent a good area in which to find macroin-vertebrates and benthic algae, the communities of organ-isms living on or in the bottom can be easily studied quan-titatively and qualitatively. A chemical analysis of thebottom sediment can be conducted to determine what chem-icals are available to organisms living in the bottom habitat.
14.2.4.1.5 Plankton Sampler
(Note: More detailed information on plankton samplingcan be found in Plankton Sampling, Robert V. Annis Water
Resource Institute, Grand Valley state University, 2000,pp. 1–3.)
Plankton (meaning to drift) are distributed through thestream and, in particular, in pool areas. They are found atall depths and are comprised of plant (phytoplankton) andanimal (zooplankton) forms. Plankton show a distributionpattern that can be associated with the time of day andseasons.
There are three fundamental sizes of plankton: nan-noplankton, microplankton, and macroplankton. Thesmallest are nannoplankton and range in size from 5 to60 mm (one-millionth of a meter). Because of their smallsize, most nannoplankton will pass through the pores ofa standard sampling net. Special fine mesh nets can beused to capture the larger nannoplankton.
Most planktonic organisms fall into the microplanktonor net plankton category. The sizes range from the largestnannoplankton to about 2 mm (thousandths of a meter).Nets of various sizes and shapes are used to collectmicroplankton. The nets collect the organism by filteringwater through fine meshed cloth. The plankton nets on thevessels are used to collect microplankton.
The third group of plankton, as associated with size,is called macroplankton. They are visible to the naked eye.The largest can be several meters long.
The plankton net or sampler (see Figure 14.10) is adevice that makes it possible to collect phytoplankton and
FIGURE 14.9 Homemade dredge. (From Spellman, F.R.,Spellman’s Standard Handbook for Wastewater Operators, Vol.1, Technomic Publ., Lancaster, PA, 1999.)
Up line Down line
FIGURE 14.10 Plankton net. (From Spellman, F.R., Spell-man’s Standard Handbook for Wastewater Operators, Vol. 1,Technomic Publ., Lancaster, PA, 1999.)
© 2003 by CRC Press LLC

398 Handbook of Water and Wastewater Treatment Plant Operations
zooplankton samples. For quantitative comparisons of dif-ferent samples, some nets have a flowmeter used to deter-mine the amount of water passing through the collecting net.
The plankton net or sampler provides a means ofobtaining samples of plankton from various depths so thatdistribution patterns can be studied. Considering the depthof the water column that is sampled can make quantitativedeterminations. The net can be towed to sample planktonat a single depth (horizontal tow) or lowered into the waterto sample the water column (vertical tow). Another pos-sibility is oblique tows where the net is lowered to apredetermined depth and raised at a constant rate as thevessel moves forward.
After towing and removal from the stream, the sidesof the net are rinsed to dislodge the collected plankton. Ifa quantitative sample is desired, a certain quantity of wateris collected. If the plankton density is low, then the samplemay be concentrated using a low-speed centrifuge or someother filtering device. A definite volume of the sample isstudied under the compound microscope for counting andidentifying plankton.
14.2.4.1.6 Secchi Disk
For determining water turbidity or degree of visibility in astream, a Secchi disk is often used (Figure 14.11). The Sec-chi disk originated with Father Pietro Secchi, an astrophys-icist and scientific advisor to the Pope, who was requestedto measure transparency in the Mediterranean Sea by thehead of the Papal Navy. Secchi used some white disks tomeasure the clarity of water in the Mediterranean in April1865. Various sizes of disks have been used since that time,but the most frequently used disk is an 8-in. diameter metaldisk painted in alternate black and white quadrants.
The disk shown in Figure 14.11 is 20 cm in diameter;it is lowered into the stream using the calibrated line. Touse the Secchi disk properly, it should be lowered into thestream water until it is no longer visible. At the pointwhere it is no longer visible, a measurement of the depth
is taken. This depth is called the Secchi disk transparencylight extinction coefficient. The best results are usuallyobtained after early morning and before late afternoon.
14.2.4.1.7 Miscellaneous Sampling Equipment
Several other sampling tools or devices are available foruse in sampling a stream. For example, consider the standardsand-mud sieve. Generally made of heavy-duty galvanized1/8≤ mesh screen supported by a water-sealed 24 ¥ 15 ¥3 in. wood frame, this device is useful for collecting burrow-ing organisms found in soft bottom sediments. Moreover,no stream sampling kit would be complete without a col-lecting tray, collecting jars of assorted sizes, heavy-dutyplastic bags, small pipets, large two-ounce pipets, finemesh straining net, and black china marking pencil. Inaddition, depending upon the quantity of material to besampled, it is prudent to include several 3- and 5-gal col-lection buckets in the stream sampling field kit.
14.2.5 THE BOTTOM LINE ON BIOLOGICAL SAMPLING
This discussion has stressed the practice of biological mon-itoring, employing the use of biotic indices as key measur-ing tools. We emphasized biotic indices not only for theirsimplicity of use, but also for the relative accuracy theyprovide, although their development and use can sometimesbe derailed. The failure of a monitoring protocol to assessenvironmental condition accurately or to protect runningwaters usually stems from conceptual, sampling, or analyt-ical pitfalls. Biotic indices can be combined with other toolsfor measuring the condition of ecological systems in waysthat enhance or hinder their effectiveness. The point is, likeany other tool, they can be misused. However, the fact thatbiotic indices can be, and are, misused does not mean thatthe indices’ approach itself is useless.
To ensure that the biotic indices approach is not use-less, it is important for the practicing freshwater ecologistand water sampler to remember a few key guidelines:
1. Sampling everything is not the goal. As Botkinet al. note, biological systems are complex andunstable in space and time, and samplers oftenfeel compelled to study all components of thisvariation. Complex sampling programs prolif-erate. However, every study need not exploreeverything. Freshwater samplers and monitorsshould avoid the temptation to sample all theunique habitats and phenomena that makefreshwater monitoring so interesting. Concen-tration should be placed on the central compo-nents of a clearly defined research agenda (asampling or monitoring protocol) — detecting
FIGURE 14.11 Secchi disk. (From Spellman, F.R., Spellman’sStandard Handbook for Wastewater Operators, Vol. 1, Tech-nomic Publ., Lancaster, PA, 1999.)
© 2003 by CRC Press LLC

Biomonitoring, Monitoring, Sampling, and Testing 399
and measuring the influences of human activi-ties on the water body’s ecological system.12
2. In regard to the influence of human activities onthe water body’s ecological system, we must seeprotecting biological conditions as a centralresponsibility of water resource management.One thing is certain. Until biological monitoringis seen as essential to track attainment of thatgoal and biological criteria as enforceable stan-dards mandated by the CWA, life in the nation’sfreshwater systems will continue to decline.
Biomonitoring is only one of several tools available tothe water practitioner. No matter the tool employed, allresults depend upon proper biomonitoring techniques. Bio-logical monitoring must be designed to obtain accurateresults – present approaches need to be strengthened. Inaddition, “the way it has always been done” must be reex-amined, and efforts must be undertaken to do what worksto keep freshwater systems alive. We can afford nothing less.
14.3 WATER QUALITY MONITORING (DRINKING WATER)
When we speak of water quality monitoring, we refer tomonitoring practice based on three criteria:
1. To ensure to the extent possible that the wateris not a danger to public health
2. To ensure that the water provided at the tap isas aesthetically pleasing as possible
3. To ensure compliance with applicable regulations
To meet these goals, all public systems must monitor waterquality to some extent. The degree of monitoringemployed is dependent on local needs and requirementsand the type of water system; small water systems usinggood-quality water from deep wells may only need toprovide occasional monitoring, but systems using surfacewater sources must test water quality frequently.13
Drinking water must be monitored to provide adequatecontrol of the entire water drawing, treatment, or convey-ance system. Adequate control is defined as monitoringemployed to assess the present level of water quality, soaction can be taken to maintain the required level (what-ever that might be).
We define water quality monitoring as the samplingand analysis of water constituents and conditions. Whenwe monitor, we collect data. As a monitoring program isdeveloped, deciding the reasons for collecting the infor-mation is important. The reasons are defined by establish-ing a set of objectives that includes a description of whowill collect the information.
It may come as a surprise to know that today themajority of people collecting data are not water and waste-
water operators; many are volunteers. These volunteershave a stake in their local stream, lake, or other water body,and in many cases they are proving they can successfullycarry out a water quality-monitoring program.
14.3.1 IS THE WATER GOOD OR BAD?
(Note: Much of the information presented in the followingsections is based on EPA’s 2.841B97003 Volunteer StreamMonitoring: A Methods Manual, 1997, and on personalexperience.)
To answer the question, “Is the water good or bad?,”we must consider two factors. First, we return to the basicprinciples of water quality monitoring — sampling andanalyzing water constituents and conditions. These con-stituents include:
1. Introduced pollutants, such as pesticides, met-als, and oil
2. Constituents found naturally in water that cannevertheless be affected by human sources,such as DO, bacteria, and nutrients
The magnitude of their effects is influenced by proper-ties such as pH and temperature. For example, temperatureinfluences the quantity of dissolved oxygen that water isable to contain, and pH affects the toxicity of ammonia.
The second factor to be considered is that the onlyvalid way to answer this question is to conduct a test thatmust be compared to some form of water quality stan-dards. If simply assigning a good and bad value to eachtest factor were possible, the meters and measuringdevices in water quality test kits would be much easier tomake. Instead of fine graduations, they could simply havea good and a bad zone.
Water quality — the difference between good and badwater — must be interpreted according to the intended useof the water. For example, the perfect balance of water chem-istry that assures a sparkling clear, sanitary swimming poolwould not be acceptable as drinking water and would be adeadly environment for many biota. Consider Table 14.3.
In another example, widely different levels of fecalcoliform bacteria are considered acceptable, depending onthe intended use of the water.
TABLE 14.3Total Residual Chlorine (mg/L)
0.06. Toxic to striped bass larvae0.31 Toxic to white perch larvae0.5–1.0 Typical drinking water residual1.0–3.0 Recommended for swimming pools
Source: Spellman, F.R., Spellman’s StandardHandbook for Wastewater Operators, Vol. 1,Technomic Publ., Lancaster, PA, 1999.)
© 2003 by CRC Press LLC

400 Handbook of Water and Wastewater Treatment Plant Operations
State and local water quality practitioners as well asvolunteers have been monitoring water quality conditionsfor many years. In fact, until the past decade or so (untilbiological monitoring protocols were developed and beganto take hold), water quality monitoring was generally con-sidered the primary way of identifying water pollutionproblems. Today, professional water quality practitionersand volunteer program coordinators alike are movingtoward approaches that combine chemical, physical, andbiological monitoring methods to achieve the best pictureof water quality conditions.
Water quality monitoring can be used for manypurposes:
1. To identify whether waters are meeting desig-nated uses — All states have established specificcriteria (limits on pollutants) identifying whatconcentrations of chemical pollutants are allow-able in their waters. When chemical pollutantsexceed maximum or minimum allowable con-centrations, waters may no longer be able tosupport the beneficial uses, such as fishing,swimming, and drinking, for which they havebeen designated (see Table 14.4). Designated orintended uses and the specific criteria that protectthem (along with antidegredation statementsthat say waters should not be allowed to dete-riorate below existing or anticipated uses)together form water quality standards. Statewater quality professionals assess water qualityby comparing the concentrations of chemicalpollutants found in streams to the criteria in thestate’s standards, and judge whether streams aremeeting their designated uses
Water quality monitoring, however, might beinadequate for determining whether aquatic lifeneeds are being met in a stream. While someconstituents (such as dissolved oxygen and tem-perature) are important to maintaining healthyfish and aquatic insect populations, other fac-tors (such as the physical structure of the stream
and the condition of the habitat) play an equalor greater role. Biological monitoring methodsare generally better suited to determine whetheraquatic life is supported.
2. To identify specific pollutants and sources ofpollution — Water quality monitoring helpslink sources of pollution to water body qualityproblems because it identifies specific problempollutants. Since certain activities tend to gen-erate certain pollutants (bacteria and nutrientsare more likely to come from an animal feedlotthan an automotive repair shop), a tentative linkto what would warrant further investigation ormonitoring can be formed.
3. To determine trends — Chemical constituentsthat are properly monitored (i.e., using consis-tent time of day and on a regular basis usingconsistent methods) can be analyzed for trendsover time.
4. To screen for impairment — Finding excessivelevels of one or more chemical constituents canserve as an early warning screen for potentialpollution problems.
14.3.2 STATE WATER QUALITY STANDARDS PROGRAMS
Each state has a program to set standards for the protectionof each body of water within its boundaries. Standards foreach body of water are developed that:
1. Depend on the water’s designated use
2. Are based on EPA national water quality crite-ria and other scientific research into the effectsof specific pollutants on different types ofaquatic life and on human health
3. May include limits based on the biologicaldiversity of the body of water (the presence offood and prey species)
State water quality standards set limits on pollutantsand establish water quality levels that must be maintainedfor each type of water body based on its designated use.
Resources for this type of information include:
1. EPA Water Quality Criteria Program
2. U.S. Fish and Wildlife Service Habitat Suitabil-ity Index Models (for specific species of localinterest)
Monitoring test results can be plotted against thesestandards to provide a focused, relevant, required assess-ment of water quality.
TABLE 14.4Fecal Coliform Bacteria per 100 mL of Water
Desirable Permissible Type of Water Use
0 0 Potable and well water (for drinking)<200 <1000 Primary contact water (for swimming)
<1000 <5000 Secondary contact water (boating and fishing)
Source: Spellman, F.R., Spellman’s Standard Handbook for Waste-water Operators, Vol. 1, Technomic Publ., Lancaster, PA, 1999.)
© 2003 by CRC Press LLC

Biomonitoring, Monitoring, Sampling, and Testing 401
14.3.3 DESIGNING A WATER QUALITY MONITORING PROGRAM
The first step in designing a water quality-monitoring pro-gram is to determine the purpose for the monitoring. Thisaids in selection of the parameters to monitor. This deci-sion should be based on factors that include:
1. Types of water quality problems and pollutionsources that will likely be encountered (seeTable 14.5)
2. Cost of available monitoring equipment3. Precision and accuracy of available monitoring
equipment4. Capabilities of monitors
(Note: We discuss the parameters most commonlymonitored by drinking water practitioners in streams (i.e.,we assume, for illustration and discussion purposes, thatour water source is a surface water stream) in detail inthis section. They include DO, BOD, temperature, pH,turbidity, total orthophosphate, nitrates, total solids, con-ductivity, total alkalinity, fecal bacteria, apparent color,odor, and hardness. When monitoring water suppliesunder the Safe Drinking Water Act or the National Pol-lutant Discharge Elimination System [NPDES], utilitiesmust follow test procedures approved by the USEPA forthese purposes. Additional testing requirements underthese and other federal programs are published as amend-ments in the Federal Register.)
Except when monitoring discharges for specificcompliance purposes, a large number of approximate mea-
surements can provide more useful information than oneor two accurate analyses. Because water quality and chem-istry continually change, making periodic, representativemeasurements and observations that indicate the range ofwater quality is necessary, rather than testing the qualityat any single moment. The more complex a water system,the more time required to observe, understand, and drawconclusions regarding the cause and effect of changes inthe particular system.
14.3.4 GENERAL PREPARATION AND SAMPLING CONSIDERATIONS
(Note: The sections that follow detail specific equipmentconsiderations and analytical procedures for each of themost common water quality parameters.)
Sampling devices should be corrosion resistant, easilycleaned, and capable of collecting desired samples safelyand in accordance with test requirements. Whenever pos-sible, assign a sampling device to each sampling point.Sampling equipment must be cleaned on a regular sched-ule to avoid contamination.
Note: Some tests require special equipment to ensurethe sample is representative. DO and fecal bac-teria sampling require special equipment and/orprocedures to prevent collection of nonrepre-sentative samples.
Reused sample containers and glassware must becleaned and rinsed before the first sampling run and aftereach run by following Method A or Method B describedbelow. The most suitable method depends on the param-eter being measured.
14.3.4.1 Method A: General Preparation of Sampling Containers
Use the following method when preparing all sample con-tainers and glassware for monitoring conductivity, totalsolids, turbidity, pH, and total alkalinity. Wearing latexgloves:
1. Wash each sample bottle or piece of glasswarewith a brush and phosphate-free detergent.
2. Rinse three times with cold tap water.
3. Rinse three times with distilled or deionizedwater.
14.3.4.2 Method B: Acid Wash Procedures
Use this method when preparing all sample containers andglassware for monitoring nitrates and phosphorus. Wear-ing latex gloves:
TABLE 14.5Water Quality Problems and Pollution Sources
Source Common Associated Chemical Pollutants
Cropland Turbidity, phosphorus, nitrates, temperature, total solids
Forestry harvest Turbidity, temperature, total solidsGrazing land Fecal bacteria, turbidity, phosphorusIndustrial discharge Temperature, conductivity, total solids, toxics, pHMining pH, alkalinity, total dissolved solidsSeptic systems Fecal bacteria, (i.e., Escherichia coli, enterococcus),
nitrates, DO and BOD, conductivity, temperature.Sewage treatment DO and BOD, turbidity, conductivity, phosphorus,
nitrates, fecal bacteria, temperature, total solids, pHConstruction Turbidity, temperature, DO and BOD, total solids,
toxicsUrban runoff Turbidity, phosphorus, nitrates, temperature,
conductivity, DO and BOD
Source: Spellman, F.R., Spellman’s Standard Handbook for WastewaterOperators, Vol. 1, Technomic Publ., Lancaster, PA, 1999.)
© 2003 by CRC Press LLC

402
Handbook of Water and Wastewater Treatment Plant Operations
1. Wash each sample bottle or piece of glasswarewith a brush and phosphate-free detergent.
2. Rinse three times with cold tap water.3. Rinse with 10% hydrochloric acid.4. Rinse three times with deionized water.
14.3.5 SAMPLE TYPES
Two types of samples are commonly used for water qualitymonitoring: grab samples and composite samples. Thetype of sample used depends on the specific test, thereason the sample is being collected, and the applicableregulatory requirements.
Grab samples are taken all at once, at a specific timeand place. They are representative only of the conditionsat the time of collection.
Grab samples must be used to determine pH, totalresidual chlorine (TRC), DO, and fecal coliform concen-trations. Grab samples may also be used for any test,which does not specifically prohibit their use.
Note: Before collecting samples for any test proce-dure, it is best to review the sampling require-ments of the test.
Composite samples consist of a series of individualgrab samples collected over a specified period in propor-tion to flow. The individual grab samples are mixedtogether in proportion to the flow rate at the time thesample was collected to form the composite sample. Thistype of sample is taken to determine average conditionsin a large volume of water whose properties vary signifi-cantly over the course of a day.
14.3.6 COLLECTING SAMPLES FROM A STREAM
In general, sample away from the streambank in the maincurrent. Never sample stagnant water. The outside curveof the stream is often a good place to sample because themain current tends to hug this bank. In shallow stretches,carefully wade into the center current to collect the sample.
A boat is required for deep sites. Try to maneuver theboat into the center of the main current to collect the watersample.
When collecting a water sample for analysis in thefield or at the lab, follow the steps below.
14.3.6.1 Whirl-pak® Bags
To collect water samples using Whirl-pak bags, use thefollowing procedures:
1. Label the bag with the site number, date, andtime.
2. Tear off the top of the bag along the perforationabove the wire tab just before sampling. Avoid
touching the inside of the bag. If you acciden-tally touch the inside of the bag, use anotherone.
3. Wading — Try to disturb as little bottom sedi-ment as possible. In any case, be careful not tocollect water that contains bottom sediment.Stand facing upstream. Collect the water sam-ples in front of you.
Boat — Carefully reach over the side and col-lect the water sample on the upstream side ofthe boat.
4. Hold the two white pull-tabs in each hand andlower the bag into the water on your upstreamside with the opening facing upstream. Openthe bag midway between the surface and thebottom by pulling the white pull-tabs. The bagshould begin to fill with water. You may needto “scoop” water into the bag by drawing itthrough the water upstream and away from you.Fill the bag no more than 3/4 full!
5. Lift the bag out of the water. Pour out excesswater. Pull on the wire tabs to close the bag.Continue holding the wire tabs and flip the bagover at least four to five times quickly to sealthe bag. Do not try to squeeze the air out of thetop of the bag. Fold the ends of the bag, beingcareful not to puncture the bag. Twist themtogether, forming a loop.
6. Fill in the bag number or site number on theappropriate field data sheet. This is important.It is the only way the lab specialist will knowwhich bag goes with which site.
7. If samples are to be analyzed in a lab, place thesample in the cooler with ice or cold packs.Take all samples to the lab.
FIGURE 14.12 Sampling bottle. Filling to shoulder assures col-lecting enough sample. Do not overfill. (From Spellman, F.R.,Spellman’s Standard Handbook for Wastewater Operators,Vol. 1, Technomic Publ., Lancaster, PA, 1999.)
Fill bottle toshoulder
© 2003 by CRC Press LLC

Biomonitoring, Monitoring, Sampling, and Testing 403
14.3.6.2 Screw-Cap Bottles
To collect water samples using screw-cap bottles, use thefollowing procedures (see Figure 14.12):
1. Label the bottle with the site number, date, andtime.
2. Remove the cap from the bottle just before sam-pling. Avoid touching the inside of the bottle orthe cap. If you accidentally touch the inside ofthe bottle, use another one.
3. Wading — Try to disturb as little bottom sedi-ment as possible. In any case, be careful not tocollect water that has sediment from bottomdisturbance. Stand facing upstream. Collect thewater sample on your upstream side, in front ofyou. You may also tape your bottle to an exten-sion pole to sample from deeper water.Boat — Carefully reach over the side and col-lect the water sample on the upstream side ofthe boat.
4. Hold the bottle near its base and plunge it(opening downward) below the water surface.If you are using an extension pole, remove thecap, turn the bottle upside down, and plunge itinto the water, facing upstream. Collect a watersample 8 to 12 in. beneath the surface, or mid-way between the surface and the bottom if thestream reach is shallow.
5. Turn your bottle underwater into the current andaway from you. In slow moving stream reaches,
push the bottle underneath the surface and awayfrom you in the upstream direction.
6. Leave a 1-in. air space (except for DO and BODsamples). Do not fill the bottle completely (sothat the sample can be shaken just before anal-ysis). Recap the bottle carefully, rememberingnot to touch the inside.
7. Fill in the bottle number or site number on theappropriate field data sheet. This is importantbecause it tells the lab specialist which bottlegoes with which site.
8. If the samples are to be analyzed in the lab,place them in the cooler for transport to the lab.
14.3.7 SAMPLE PRESERVATION AND STORAGE
Samples can change very rapidly. However, no single pres-ervation method will serve for all samples and constitu-ents. If analysis must be delayed, follow the instructionsfor sample preservation and storage listed in StandardMethods, or those specified by the laboratory that willeventually process the samples (see Table 14.6). In gen-eral, handle the sample in a way that prevents changesfrom biological activity, physical alterations, or chemicalreactions. Cool the sample to reduce biological and chem-ical reactions. Store in darkness to suspend photosynthesis.Fill the sample container completely to prevent the lossof dissolved gases. Metal cations, such as iron and lead,and suspended particles may adsorb onto container surfacesduring storage.
TABLE 14.6Recommended Sample Storage and Preservation Techniques
Test Factor Container Type PreservationMax. Storage Time
Recommended/Regulatory
Alkalinity P, G Refrigerate 24 h/14 dBOD P, G Refrigerate 6 h/48 hConductivity P, G Refrigerate 28 d/28 dHardness P, G Lower pH to <2 6 mos/6 mosNitrate P, G Analyze ASAP 48 h/48 hNitrite P, G Analyze ASAP none/48 hOdor G Analyze ASAP 6 h/N/ROxygen, dissolved
Electrode G Immediately analyze 0.5 h/statWinkler G Fix Immediately analyze 8-h/8 h
pH P, G Immediately analyze 2 h/statPhosphate G(A) Filter immediately 48 h/N/R; refrigerateSalinity G, was seal Immediately analyze or use was seal 6 mos/N/RTemperature P, G Immediately analyze stat/statTurbidity P, G Analyze same day or store in dark up to 24 h, refrigerate 24 h/48 h
Note: P = plastic; G = glass; N/R = no result.
Source: Spellman, F.R., Spellman’s Standard Handbook for Wastewater Operators, Vol. 1, Technomic Publ., Lancaster, PA, 1999.)
© 2003 by CRC Press LLC

404
Handbook of Water and Wastewater Treatment Plant Operations
14.3.8 STANDARDIZATION OF METHODS
References used for sampling and testing must correspondto those listed in the most current federal regulation. Forthe majority of tests, to compare the results of eitherdifferent water quality monitors or the same monitors overthe course of time requires some form of standardizationof the methods. The American Public Health Association(APHA) recognized this requirement in 1899 when itappointed a committee to draw up standard procedures forthe analysis of water. The report (published in 1905) con-stituted the first edition of what is now known as StandardMethods. This book is now in its 20th edition and servesas the primary reference for water testing methods and thebasis for most EPA-approved methods.
14.4 TEST METHODS (DRINKING WATER AND WASTEWATER)
(Note: The material presented in this section is based onpersonal experience and adaptations from Standard Meth-ods, Federal Register, and The Monitor’s Handbook,LaMotte Company, Chestertown, MD, 1992.)
Descriptions of general methods to help you under-stand how each works in specific test kits follow. Alwaysuse the specific instructions included with the equipmentand individual test kits.
Most water analyses are conducted either by titrimet-ric analyses or colorimetric analyses. Both methods areeasy to use and provide accurate results.
14.4.1 TITRIMETRIC METHODS
Titrimetric analyses are based on adding a solution ofknow strength (the titrant, which must have an exactknown concentration) to a specific volume of a treatedsample in the presence of an indicator. The indicator pro-duces a color change indicating the reaction is complete.Titrants are generally added by a Titrator (microburet) ora precise glass pipette.
14.4.2 COLORIMETRIC METHODS
Colorimetric standards are prepared as a series of solutionswith increasing known concentrations of the constituentto be analyzed. Two basic types of colorimetric tests arecommonly used:
1. The pH is a measure of the concentration ofhydrogen ions (the acidity of a solution) deter-mined by the reaction of an indicator that variesin color, depending on the hydrogen ion levelsin the water.
2. Tests that determine a concentration of an ele-ment or compound are based on Beer’s law.Simply, this law states that the higher theconcentration of a substance, the darker the
color produced in the test reaction and the morelight absorbed. Assuming a constant viewpath,the absorption increases exponentially withconcentration.
14.4.3 VISUAL METHODS
The Octet comparator uses standards that are mounted in aplastic comparator block. It employs eight permanent trans-lucent color standards and built-in filters to eliminate opticaldistortion. The sample is compared using either of twoviewing windows. Two devices that can be used with thecomparator are the B-color reader, which neutralizes coloror turbidity in water samples, and viewpath, which intensi-fies faint colors of low concentrations for easy distinction.
14.4.4 ELECTRONIC METHODS
Although the human eye is capable of differentiating colorintensity, interpretation is quite subjective. Electronic col-orimeters consist of a light source that passes through asample and is measured by a photodetector with an analogor digital readout.
Besides electronic colorimeters, specific electronicinstruments are manufactured for lab and field determina-tion of many water quality factors, including pH, totaldissolved solids and conductivity, DO, temperature, andturbidity.
14.4.5 DISSOLVED OXYGEN TESTING
(Note: In this section and the sections that follow, wediscuss several water quality factors that are routinelymonitored in drinking water operations. We do not discussthe actual test procedures to analyze each water qualityfactor; refer to the latest edition of Standard Methods forthe correct procedure to use in conducting these tests.)
A stream system used as a source of water producesand consumes oxygen. It gains oxygen from the atmo-sphere and from plants because of photosynthesis.Because of running water’s churning, it dissolves moreoxygen than does still water, such as in a reservoir behinda dam. Respiration by aquatic animals, decomposition,and various chemical reactions consume oxygen.
Oxygen is actually poorly soluble in water. Its solu-bility is related to pressure and temperature. In watersupply systems, DO in raw water is considered the nec-essary element to support life of many aquatic organisms.From the drinking water practitioner’s point of view, DOis an important indicator of the water treatment process,and an important factor in corrosiveness.
Wastewater effluent often contains organic materialsthat are decomposed by microorganisms that use oxygenin the process. (The amount of oxygen consumed by theseorganisms in breaking down the waste is known as theBOD. We include a discussion of BOD and how to monitor
© 2003 by CRC Press LLC

Biomonitoring, Monitoring, Sampling, and Testing 405
it later.) Other sources of oxygen-consuming wasteinclude stormwater runoff from farmland or urban streets,feedlots, and failing septic systems.
Oxygen is measured in its dissolved form as DO. Ifmore oxygen is consumed than produced, DO levelsdecline and some sensitive animals may move away,weaken, or die.
DO levels fluctuate over a 24-h period and seasonally.They vary with water temperature and altitude. Cold waterholds more oxygen than warm water (see Table 14.7), andwater holds less oxygen at higher altitudes. Thermaldischarges (e.g., water used to cool machinery in a man-ufacturing plant or a power plant) raise the temperatureof water and lower its oxygen content. Aquatic animalsare most vulnerable to lowered DO levels in the earlymorning on hot summer days when stream flows are low,water temperatures are high, and aquatic plants have notbeen producing oxygen since sunset.
14.4.5.1 Sampling and Equipment Considerations
In contrast to lakes, where DO levels are most likely to varyvertically in the water column, changes in DO in rivers and
streams move horizontally along the course of the water-way. This is especially true in smaller, shallow streams. Inlarger, deeper rivers, some vertical stratification of DOmight occur. The DO levels in and below riffle areas,waterfalls, or dam spillways are typically higher than thosein pools and slower-moving stretches. If you wanted tomeasure the effect of a dam, sampling for DO behind thedam, immediately below the spillway, and upstream of thedam would be important. Because DO levels are criticalto fish, a good place to sample is in the pools that fishtend to favor, or in the spawning areas they use.
An hourly time profile of DO levels at a sampling siteis a valuable set of data, because it shows the change inDO levels from the low point (just before sunrise) to thehigh point (sometime near midday). However, this mightnot be practical for a volunteer monitoring program. Notethe time of your DO sampling to help judge when in thedaily cycle the data were collected.
DO is measured either in milligrams per liter of per-cent saturation. Milligrams per liter are the amount oroxygen in a liter of water. Percent saturation is the amountof oxygen in a liter of water relative to the total amountof oxygen that the water can hold at that temperature.
DO samples are collected using a special BOD bottle:a glass bottle with a turtleneck and a ground stopper. Youcan fill the bottle directly in the stream if the stream canbe waded in or boated in, or you can use a sampler droppedfrom a bridge or boat into water deep enough to submerseit. Samplers can be made or purchased.
14.4.5.2 Dissolved Oxygen Test Methods
DO is measured primarily either by using some variationof the Winkler method, or by using a meter and probe.
14.4.5.2.1 Winkler Method (Azide Modification)
The Winkler method (azide modification) involves fillinga sample bottle completely with water (no air is left tobias the test). The DO is then fixed using a series ofreagents that form a titrated acid compound. Titrationinvolves the drop-by-drop addition of a reagent that neu-tralizes the acid compound, causing a change in the colorof the solution. The point at which the color changes isthe end point and is equivalent to the amount of oxygendissolved in the sample. The sample is usually fixed andtitrated in the field at the sample site. Preparing the samplein the field and delivering it to a lab for titration is possible.
The azide modification method is best suited for rel-atively clean waters; otherwise, substances such as color,organics, suspended solids, sulfide, chlorine, and ferrousand ferric iron can interfere with test results. If fresh azideis used, nitrite will not interfere with the test.
In testing, iodine is released in proportion to theamount of DO present in the sample. By using sodium
TABLE 14.7 Maximum DO Concentrations vs. Temperature Variations
Temperature (ºC) DO (mg/L) Temperature (ºC) DO (mg/L)
0 14.60 23 8.561 14.19 24 8.402 13.81 25 8.243 13.44 26 8.094 13.09 27 7.955 12.75 28 7.816 12.43 29 7.677 12.12 30 7.548 11.83 31 7.419 11.55 32 7.28
10 11.27 33 7.1611 11.01 34 7.0512 10.76 35 6.9313 10.52 36 6.8214 10.29 37 6.7115 10.07 38 6.6116 9.85 39 6.5117 9.65 40 6.4118 9.45 41 6.3119 9.26 42 6.2220 9.07 43 6.1321 8.90 44 6.0422 8.72 45 5.95
Source: Spellman, F.R., Spellman’s Standard Handbook for WastewaterOperators, Vol. 1, Technomic Publ., Lancaster, PA, 1999.)
© 2003 by CRC Press LLC

406
Handbook of Water and Wastewater Treatment Plant Operations
thiosulfate with starch as the indicator, the sample can betitrated to determine the amount of DO present.
The chemicals used include
1. Manganese sulfate solution2. Alkaline azide-iodide solution3. Sulfuric acid (concentrated)4. Starch indicator5. Sodium thiosulfate solution 0.025 N, phenyl-
arsine solution 0.025 N, or potassium biniodatesolution 0.025 N
6. Distilled or deionized water
The equipment used includes:
1. Buret (graduated to 0.1 mL)2. Buret stand3. 300 mL BOD bottles4. 500 mL Erlenmeyer flasks5. 1.0 mL pipets with elongated tips6. Pipet bulb7. 250 mL graduated cylinder8. Laboratory-grade water rinse bottle9. Magnetic stirrer and stir bars (optional)
14.4.5.2.1.1 ProcedureThe procedure for the Winkler method includes thefollowing:
1. Collect sample in a 300 mL BOD bottle.2. Add 1 mL manganous sulfate solution at the
surface of the liquid.3. Add 1 mL alkaline-iodide-azide solution at the
surface of the liquid.4. Stopper the bottle and mix by inverting the bottle.5. Allow the floc to settle halfway in the bottle,
remix, and allow to settle again.6. Add 1 mL concentrated sulfuric acid at the sur-
face of the liquid.7. Restopper the bottle, rinse top with laboratory-
grade water, and mix until precipitate isdissolved.
8. The liquid in the bottle should appear clear andhave an amber color.
9. Measure 201 mL from the BOD bottle into anErlenmeyer flask.
10. Titrate with 0.025 N PAO or thiosulfate to apale yellow color. Note the amount of titrant.
11. Add 1 mL of starch indicator solution.12. Titrate until blue color first disappears.13. Record total amount of titrant.
14.4.5.2.1.2 CalculationTo calculate the DO concentration when the modifiedWinkler titration method is used:
(14.1)
Note: Using a 200-mL sample and a 0.025 N (N =Normality of the solution used to titrate thesample) titrant reduces this calculation to:
EXAMPLE 14.1
Problem:
The operator titrates a 200-mL DO sample. The buretreading at the start of the titration was 0.0 mL. At the endof the titration, the buret read 7.1 mL. The concentrationof the titrating solution was 0.025 N. What is the DOconcentration in milligrams per liter?
Solution:
DO field kits using the Winkler method are relativelyinexpensive, especially compared to a meter and probe.Field kits run between $35 and $200, and each kit comeswith enough reagents to run 50 to 100 DO tests. Replace-ment reagents are inexpensive, and you can buy themalready measured out for each test in plastic pillows.
You can also purchase the reagents in larger quantitiesin bottles, and measure them out with a volumetric scoop.The pillows’ advantage is that they have a longer shelflife and are much less prone to contamination or spillage.Buying larger quantities in bottles has the advantage ofconsiderably lower cost per test.
The major factor in the expense for the kits is themethod of titration used: — eyedropper-type or syringe-type titrator. Eyedropper-type or syringe-type titration isless precise than digital titration, because a larger drop oftitrant is allowed to pass through the dropper opening, andon a microscale, the drop size (and thus volume of titrant)can vary from drip to drop. A digital Titrator or a buret (along glass tube with a tapered tip like a pipette) permitsmuch more precision and uniformity for titrant it allowsto pass.
If a high degree of accuracy and precision in DOresults is required, a digital titrator should be used. A kitthat uses an eyedropper-type or syringe-type titrator issuitable for most other purposes. The lower cost of thistype of DO field kit might be attractive if several teams
D
Sample
O mg L
Buret mL Buret mL N 8000
Volume mLFinal Start
( ) =
( ) - ( )[ ] ¥ ¥( )
DO mg L mL( ) = Titrant Used
DO mg L7.1 mL 0.0 mL 0 8000
00 mL
mg L
( ) [ ]=- ¥ ¥
=
.
.
025
2
7 1
© 2003 by CRC Press LLC

Biomonitoring, Monitoring, Sampling, and Testing 407
of samplers and testers at multiple sites at the same timeare used.
14.4.5.2.2 Meter and Probe
A DO meter is an electronic device that converts signalsfrom a probe placed in the water into units of DO inmilligrams per liter. Most meters and probes also measuretemperature. The probe is filled with a salt solution andhas a selectively permeable membrane that allows DO topass from the stream water into the salt solution. The DOthat has diffused into the salt solution changes the electricpotential of the salt solution. This change is sent by electriccable to the meter, converting the signal to milligrams perliter on a scale that the user can read.
14.4.5.2.2.1 Methodology
If samples are to be collected for analysis in the laboratory,a special APHA sampler or the equivalent must be used.This is the case because if the sample is exposed or mixedwith air during collection, test results can change dramat-ically. Therefore, the sampling device must allow collec-tion of a sample that is not mixed with atmospheric airand allows for at least 3 times-bottle overflow (seeFigure 14.12).
Again, because the DO level in a sample can changequickly, only grab samples that should be used for DO test-ing. Samples must be tested immediately (within 15 min)after collection.
Note: Samples collected for analysis using the modi-fied Winkler titration method may be preservedfor up to 8 h by adding 0.7 mL of concentratedsulfuric acid or by adding all the chemicalsrequired by the procedure. Samples collectedfrom the aeration tank of the activated sludgeprocess must be preserved using a solution ofcopper sulfate-sulfamic acid to inhibit biologi-cal activity.
The advantage of using the DO oxygen meter methodis that the meter can be used to determine DO concentrationdirectly (see Figure 14.13). In the field, a direct readingcan be obtained using a probe (see Figure 14.14) or bycollection of samples for testing in the laboratory using alaboratory probe (see Figure 14.15).
Note: The field probe can be used for laboratory workby placing a stirrer in the bottom of the samplebottle, but the laboratory probe should never beused in any situation where the entire probemight be submerged.
The probe used in the determination of DO consistsof two electrodes, a membrane, and a membrane fillingsolution. Oxygen passes through the membrane into thefilling solution and causes a change in the electrical cur-rent passing between the two electrodes. The change ismeasured and displayed as the concentration of DO. Inorder to be accurate, the probe membrane must be inproper operating condition, and the meter must be cali-brated before use.
The only chemical used in the DO meter method duringnormal operation is the electrode filling solution. How-ever, in the Winkler DO method, chemicals are requiredfor meter calibration.
Calibration prior to use is important. Both the meterand the probe must be calibrated to ensure accurate results.The frequency of calibration is dependent on the fre-quency of use. For example, if the meter is used once aday, then calibration should be performed before use.There are three methods available for calibration: satu-rated water, saturated air, and the Winkler method. It isimportant to note that if the Winkler method is not usedfor routine calibration method, periodic checks using thismethod are recommended.
FIGURE 14.13 Dissolved oxygen meter. (From Spellman, F.R., Spellman’s Standard Handbook for Wastewater Operators, Vol. 1,Technomic Publ., Lancaster, PA, 1999.)
.
DISSOLVED OXYGEN METER-DIGITAL READOUT
4.14 mg/L
Temp
Zero
Off
DO 0.1 mg/L
DO
DO
ZeroCalibration
0.01 mg/L
% Sat
© 2003 by CRC Press LLC

408 Handbook of Water and Wastewater Treatment Plant Operations
14.4.5.2.2.2 ProcedureIt is important to keep in mind that the meter and probemanufacturer’s operating procedures should always befollowed. Normally, the manufacturer’s recommendedprocedure will include the following generalized steps:
1. Turn DO meter on, and allow 15 min for it towarm up.
2. Turn meter switch to zero, and adjust as needed.3. Calibrate meter using the saturated air, saturated
water, or Winkler azide procedure for calibration.4. Collect sample in 300 mL bottle, or place field
electrode directly in stream.5. Place laboratory electrode in BOD bottle with-
out trapping air against membrane, and turn onstirrer.
6. Turn meter switch to temperature setting, andmeasure temperature.
7. Turn meter switch to DO mode, and allow 10 secfor meter reading to stabilize.
8. Read DO in milligrams per liter from meter,and record the results.
No calculation is necessary using this method becauseresults are read directly from the meter.
DO meters are expensive compared to field kits thatuse the titration method. Meter or probe combinations runbetween $500 and $1200, including a long cable to con-nect the probe to the meter. The advantage of a meter orprobe is that DO and temperature can be quickly read atany point where the probe is inserted into the stream. DOlevels can be measured at a certain point on a continuousbasis. The results are read directly as milligrams per liter,unlike the titration methods, in which the final titrationresult might have to be converted by an equation to mil-ligrams per liter.
DO meters are more fragile than field kits, and repairsto a damaged meter can be costly. The meter or probemust be carefully maintained. It must also be calibratedbefore each sample run, and if many tests are done,between sampling. Because of the expense, a small wateror wastewater facility might only have one meter or probe,which means that only one team of samplers can sampleDO and must test all the sites. With field kits, severalteams can sample simultaneously.
14.4.6 BIOCHEMICAL OXYGEN DEMAND TESTING
As mentioned, BOD measures the amount of oxygen con-sumed by microorganisms in decomposing organic matterin stream water. BOD also measures the chemical oxida-tion of inorganic matter (the extraction of oxygen fromwater via chemical reaction). A test is used to measure theamount of oxygen consumed by these organisms duringa specified period of time (usually 5 d at 20ºC). The rate
FIGURE 14.14 Dissolved oxygen-field probe. (From Spell-man, F.R., Spellman’s Standard Handbook for Wastewater Oper-ators, Vol. 1, Technomic Publ., Lancaster, PA, 1999.)
FIGURE 14.15 Dissolved oxygen-lab probe. (From Spellman,F.R., Spellman’s Standard Handbook for Wastewater Operators,Vol. 1, Technomic Publ., Lancaster, PA, 1999.)
Membrane(inside cap)
Protective cap
Weighted cap
Probe body
Cable to meter
Membrane
Temperature sensorMixer
Probe body
Cable to meter
Mixer switch
© 2003 by CRC Press LLC

Biomonitoring, Monitoring, Sampling, and Testing 409
of oxygen consumption in a stream is affected by a numberof variables: temperature, pH, the presence of certainkinds of microorganisms, and the type of organic andinorganic material in the water.
BOD directly affects the amount of DO in water bodies.The greater the BOD, the more rapidly oxygen is depletedin the water body, leaving less oxygen available to higherforms of aquatic life. The consequences of high BOD arethe same as those for low DO: aquatic organisms becomestressed, suffocate, and die. Most river waters used aswater supplies have a BOD less than 7 mg/L, makingdilution unnecessary.
Sources of BOD include leaves and wood debris; deadplants and animals; animal manure; effluents from pulpand paper mills, wastewater treatment plants, feedlots, andfood-processing plants; failing septic systems; and urbanstormwater runoff.
Note: To evaluate raw water’s potential for use as adrinking water supply, it is usually sampled,analyzed, and tested for BOD when turbid, pol-luted water is the only source available.
14.4.6.1 Sampling Considerations
BOD is affected by the same factors that affect DO. Aer-ation of stream water (e.g., by rapids and waterfalls) willaccelerate the decomposition of organic and inorganicmaterial. Therefore, BOD levels at a sampling site withslower, deeper waters might be higher for a given columnof organic and inorganic material that the levels for asimilar site in high aerated waters.
Chlorine can also affect BOD measurement by inhib-iting or killing the microorganisms that decompose theorganic and inorganic matter in a sample. If sampling inchlorinated waters (such as those below the effluent froma sewage treatment plant), neutralizing the chlorine withsodium thiosulfate is necessary (see Standard Methods).
BOD measurement requires taking two samples ateach site. One is tested immediately for DO, and thesecond is incubated in the dark at 20ºC for 5 d and testedfor remaining DO. The difference in oxygen levelsbetween the first test and the second test (in milligramsper liter) is the amount of BOD. This represents theamount of oxygen consumed by microorganisms and usedto break down the organic matter present in the samplebottle during the incubation period. Because of the 5-dincubation, the tests are conducted in a laboratory.
Sometimes by the end of the 5-d incubation period,the DO level is zero. This is especially true for rivers andstreams with a lot of organic pollution. Since knowingwhen the zero point was reached is not possible, deter-mining the BOD level is also impossible. In this case,diluting the original sample by a factor that results in afinal DO level of at least 2 mg/L is necessary. Special
dilution water should be used for the dilutions (see Stan-dard Methods).
Some experimentation is needed to determine theappropriate dilution factor for a particular sampling site.The result is the difference in DO between the first mea-surement and the second, after multiplying the secondresult by the dilution factor. Standard Methods prescribesall phases of procedures and calculations for BOD deter-mination. A BOD test is not required for monitoring watersupplies.
14.4.6.2 BOD Sampling, Analysis, and Testing
The approved biochemical oxygen demand sampling andanalysis procedure measures the DO depletion (biologicaloxidation of organic matter in the sample) over a 5-dayperiod under controlled conditions (20ºC in the dark). Thetest is performed using a specified incubation time andtemperature. Test results are used to determine plant load-ings, plant efficiency, and compliance with NPDES efflu-ent limitations. The duration of the test (5 days) makes itdifficult to use the data effectively for process control.
The standard BOD test does not differentiate betweenoxygen used to oxidize organic matter and oxygen usedto oxidize organic and ammonia nitrogen to more stableforms. Because many biological treatment plants now con-trol treatment processes to achieve oxidation of the nitrogencompounds, there is a possibility that BOD test results forplant effluent and some process samples may produceBOD test results based on both carbon and nitrogen oxi-dation. To avoid this situation, a nitrification inhibitor canbe added. When this is done, the test results are known ascarbonaceous BOD (CBOD). A second uninhibited BODshould also be run whenever CBOD is determined.
When taking a BOD sample, no special sampling con-tainer is required. Either a grab or composite sample canbe used. BOD5 samples can be preserved by refrigerationat or below 4ºC (not frozen) — composite samples mustbe refrigerated during collection. Maximum holding timefor preserved samples is 48 h.
Using the incubation of dissolved approved testmethod, a sample is mixed with dilution water in severaldifferent concentrations (dilutions). The dilution watercontains nutrients and materials to provide optimum envi-ronment. The chemicals used are DO, ferric chloride,magnesium sulfate, calcium chloride, phosphate buffer,and ammonium chloride.
Note: Remember all chemicals can be dangerous ifnot used properly and in accordance with therecommended procedures. Review appropriatesections of the individual chemical materialssafety data sheet to determine proper methodsfor handling and for safety precautions thatshould be taken.
© 2003 by CRC Press LLC

410 Handbook of Water and Wastewater Treatment Plant Operations
Sometimes it is necessary to add (seed) healthy organ-isms to the sample. The DO of the dilution and the dilutionwater is determined. If seed material is used, a series ofdilutions of seed material must also be prepared. Thedilutions and dilution blanks are incubated in the dark for5 days at 20ºC ± 1ºC. At the end of 5 d, the DO of eachdilution and the dilution blanks are determined.
For the test results to be valid, certain criteria must beachieved. These test criteria are listed as follows:
1. Dilution water blank DO change must be£0.2 mg/L.
2. Initial DO must be >7.0 mg/L, but £9.0 mg/L(or saturation at 20ºC and test elevation).
3. Sample dilution DO depletion must be ≥2.0 mg/L.4. Sample dilution residual DO must be ≥1.0 mg/L.5. Sample dilution initial DO must be ≥7.0 mg/L.6. Seed correction should be ≥0.6, but £1.0 mg/L.
The BOD5 test procedure consists of 10 steps (forunchlorinated water) as shown in Table 14.8.
Note: BOD5 is calculated individually for all sampledilutions that meet the criteria. Reported resultis the average of the BOD5 of each valid sampledilution.
14.4.6.2.1 BOD5 Calculation (Unseeded)
Unlike the direct reading instrument used in the DO anal-ysis, BOD results require calculation. There are severalcriteria used in selecting which BOD5 dilutions should beused for calculating test results. Consult a laboratory test-ing reference manual (such as Standard Methods) for thisinformation.
At the present time, there are two basic calculationsfor BOD5. The first is used for samples that have not been
seeded. The second must be used whenever BOD5 samplesare seeded. In this section, we illustrate the calculationprocedure for unseeded samples:
(14.2)
EXAMPLE 14.2
Problem:
The BOD5 test is completed. Bottle 1 of the test had aDO of 7.1 mg/L at the start of the test. After 5 d, bottle1 had a DO of 2.9 mg/L. Bottle 1 contained 120 mg/L ofsample. Determine the BOD5
Solution:
14.4.6.2.2 BOD5 Calculation (Seeded)
If the BOD5 sample has been exposed to conditions thatcould reduce the number of healthy, active organisms, thesample must be seeded with organisms. Seeding requiresuse of a correction factor to remove the BOD5 contributionof the seed material:
(14.3)
EXAMPLE 14.3
Problem:
Using the data provided below, determine the BOD5:
TABLE 14.8BOD5 Test Procedure
1. Fill two bottles with BOD dilution water. Insert stoppers.2. Place sample in two BOD bottles. Fill with dilution water.
Insert stoppers.3. Test for DO.4. Incubate for 5 d.5. Test for DO.6. Add 1 mL MnSO4 below surface.7. Add 1 mL alkaline Kl below surface.8. Add 1 mL H2SO4.9. Transfer 203 mL to flask.
10. Titrate with polyalphaolefin or thiosulfate.
Source: Spellman, F.R., Spellman’s Standard Handbook forWastewater Operators, Vol. 1, Technomic Publ., Lancaster, PA,1999.)
BOD5 of Seed Material 90 mg/L
Dilution #1 mL of seed material 3 mLmL of sample 100 mLStart DO 7.6 mg/LFinal DO 2.7 mg/L
B Unseeded
Sample
OD
DO mg L DO mg L 300 mL
Volume mL
5
Start Final
( ) =
( ) - ( )[ ] ¥( )
B UnseededOD 7.1 mg L 2.9 mg L 300 mL
20 mL
mg L
5( ) [ ]=
- ¥
=
1
10 5.
Seed Correction
Seed
Material BOD Seed in Dilution mL
300 mL5
=
¥ ( )
B Seeded
Seed Correction
Sample
OD
DO mg L DO mg L 300
Volume mL
5
Start Final
( )
[ ] [ ]( )[ ]( )
=
- - ¥
(14.4)
© 2003 by CRC Press LLC

Biomonitoring, Monitoring, Sampling, and Testing
411
Solution:
14.4.7 TEMPERATURE MEASUREMENT
As mentioned, an ideal water supply should have, at alltimes, an almost constant temperature or one with mini-mum variation. Knowing the temperature of the watersupply is important because the rates of biological andchemical processes depend on it.
Temperature affects the oxygen content of the water(oxygen levels become lower as temperature increases);the rate of photosynthesis by aquatic plants; the metabolicrates of aquatic organisms; and the sensitivity of organ-isms to toxic wastes, parasites, and diseases.
Causes of temperature change include weather;removal of shading streambank vegetation, impoundments(a body of water confined by a barrier, such as a dam);and discharge of cooling water, urban stormwater, andgroundwater inflows to the steam.
14.4.7.1 Sampling and Equipment Considerations
Temperature, for example, in a stream, varies with widthand depth; the temperature of well-sunned portions of astream can be significantly higher than the shaded portionof the water on a sunny day. In a small stream, the tem-perature will be relatively constant as long as the streamis uniformly in sun or shade. In a large stream, temperaturecan vary considerably with width and depth, regardless ofshade. If safe to do so, temperature measurements shouldbe collected at varying depths and across the surface ofthe stream to obtain vertical and horizontal temperatureprofiles. This can be done at each site at least once todetermine the necessity of collecting a profile during eachsampling visit. Temperature should be measured at thesame place every time.
Temperature is measured in the stream with a thermom-eter or a meter. Alcohol-filled thermometers are preferredover mercury-filled because they are less hazardous ifbroken. Armored thermometers for field use can withstandmore abuse than unprotected glass thermometers and areworth the additional expense. Meters for other tests (e.g.,pH [acidity] or DO) also measure temperature and can beused instead of a thermometer.
14.4.8 HARDNESS MEASUREMENT
As mentioned, hardness refers primarily to the amount ofcalcium and magnesium in the water. Calcium and mag-nesium enter water mainly by leaching of rocks. Calciumis an important component of aquatic plant cell walls andthe shells and bones of many aquatic organisms. Magne-sium is an essential nutrient for plants and is a componentof the chlorophyll molecule.
Hardness test kits express test results in parts permillion of CaCO3, but these results can be converteddirectly to calcium or magnesium concentrations:
(14.5)
(14.6)
Note: Because of less contact with soil minerals andmore contact with rain, surface raw water isusually softer than groundwater.
As a rule, when hardness is greater than 150 mg/L,softening treatment may be required for public water sys-tems. Hardness determination via testing is required toensure efficiency of treatment.
14.4.8.1 Measuring Hardness
(Note: Keep in mind that when measuring calcium hard-ness, the concentration of calcium is routinely measuredseparately from total hardness. Its concentration in waterscan range from 0 to several thousand mg/L, as CaCO3.Likewise, when measuring magnesium hardness, magne-sium is routinely determined by subtracting calcium hard-ness from total harness. There is usually less magnesiumthan calcium in natural water. Lime dosage for watersoftening operation is partly based on the concentrationof magnesium hardness in the water.)
In the hardness test, the sample must be carefullymeasured. A buffer is then added to the sample to correctpH for the test and an indicator to signal the titration endpoint.
The indicator reagent is normally blue in a sample ofpure water, but if calcium or magnesium ions are presentin the sample, the indicator combines with them to forma red-colored complex. The titrant in this test is ethylene-diaminetetraacetic acid (EDTA; used with its salts in thetitration method), a chelant that actually pulls the calciumand magnesium ions away from a red-colored complex.The EDTA is added dropwise to the sample until all thecalcium and magnesium ions have been chelated awayfrom the complex and the indicator returns to its normalblue color. The amount of EDTA required to cause thecolor change is a direct indication of the amount of cal-cium and magnesium ions in the sample.
Seed Correction 0 mg L 3 mL
300 mL
mg L
=¥
=
9
0 90.
B SeededOD 7.6 mg 2 mg 300
100 mL
5
L L
mg L
( ) ( )[ ]=
- - ¥
=
. .7 0 90
12
Calcium Hardness as ppm CaCO3
¥ =0 40. ppm Ca
Magnesium Hardness as ppm CaCO3
¥ =0 24. ppm Mg
© 2003 by CRC Press LLC

412 Handbook of Water and Wastewater Treatment Plant Operations
Some hardness kits include an additional indicator thatis specific for calcium. This type of kit will provide threereadings: total hardness, calcium hardness, and magne-sium hardness. For interference, precision, and accuracy,consult the latest edition of Standard Methods.
14.4.9 PH MEASUREMENT
pH is defined as the negative log of the hydrogen ionconcentration of the solution. This is a measure of theionized hydrogen in solution. Simply, it is the relativeacidity or basicity of the solution. The chemical and phys-ical properties and the reactivity of almost every componentin water are dependent upon pH. It relates to corrosivity,contaminant solubility, and the water’s conductance. It hasa secondary maximum contaminant level (MCL) range setat 6.5 to 8.5.
14.4.9.1 Analytical and Equipment Considerations
The pH can be analyzed in the field or in the lab. Ifanalyzed in the lab, it must be measured within 2 h of thesample collection. This is because the pH will change fromthe carbon dioxide from the air as it dissolves in the water,bringing the pH toward 7.
If your program requires a high degree of accuracyand precision in pH results, the pH should be measuredwith a laboratory quality pH meter and electrode. Metersof this quality range in cost from around $250 to $1000.Color comparators and pH pocket pals are suitable formost other purposes. The cost of either of these is in the$50 range. The lower cost of the alternatives might beattractive if multiple samplers are used to sample severalsites at the same time.
14.4.9.2 pH Meters
A pH meter measures the electric potential (millivolts)across an electrode when immersed in water. This electricpotential is a function of the hydrogen ion activity in thesample; therefore, pH meters can display results in eithermillivolts or pH units.
A pH meter consists of a potentiometer, which mea-sures electric potential where it meets the water sample;a reference electrode, which provides a constant electricpotential; and a temperature compensating device, whichadjusts the readings according to the temperature of thesample (since pH varies with temperature). The referenceand glass electrodes are frequently combined into a singleprobe called a combination electrode.
A wide variety of meters are available, but the mostimportant part of the pH meter is the electrode. Purchasinga good, reliable electrode and following the manufac-turer’s instructions for proper maintenance is important.Infrequently used or improperly maintained electrodes aresubject to corrosion, which makes them highly inaccurate.
14.4.9.3 pH Pocket Pals and Color Comparators
pH pocket pals are electronic handheld pens that aredipped in the water, providing a digital readout of the pH.They can be calibrated to only one pH buffer. (Lab meterscan be calibrated to two or more buffer solutions and aremore accurate over a wide range of pH measurements.)
Color comparators involve adding a reagent to thesample that colors the sample water. The intensity of thecolor is proportional to the pH of the sample, then matchedagainst a standard color chart. The color chart equatesparticular colors to associated pH values that can be deter-mined by matching the colors from the chart to the colorof the sample.
For instructions on how to collect and analyze sam-ples, refer to Standard Methods.
14.4.10 TURBIDITY MEASUREMENT
As previously described, turbidity is a measure of waterclarity — how much the material suspended in waterdecreases the passage of light through the water. Turbidityconsists of suspended particles in the water and may becaused by a number of materials, organic and inorganic.These particles are typically in the size range of 0.004(clay) to 1.0 mm (sand). The occurrence of turbid sourcewaters may be permanent or temporary. It can affect thecolor of the water.
Higher turbidity increases water temperatures becausesuspended particles absorb more heat. This reduces theconcentration of DO because warm water holds less DOthan cold. Higher turbidity also reduces the amount oflight penetrating the water, which reduces photosynthesisand the production of DO. Suspended materials can clogfish gills, reducing resistance to disease in fish, loweringgrowth rates, and affecting egg and larval development.As the particles settle, they can blanket the stream bottom(especially in slower waters) and smother fish eggs andbenthic macroinvertebrates
Turbidity also affects treatment plant operations. Forexample, turbidity hinders disinfection by shieldingmicrobes, some of them pathogens, from the disinfectant.Obviously, this is the most important significance of tur-bidity monitoring; the test for it is an indication of theeffectiveness of the filtration of water supplies. It is impor-tant to note that turbidity removal is the principal reasonfor chemical addition, settling, coagulation, settling, andfiltration in potable water treatment. Sources of turbidityinclude:
1. Soil erosion
2. Waste discharge
3. Urban runoff
4. Eroding stream banks
© 2003 by CRC Press LLC

Biomonitoring, Monitoring, Sampling, and Testing 413
5. Large numbers of bottom feeders (e.g., carp)that stir up bottom sediments
6. Excessive algal growth
14.4.10.1 Sampling and Equipment Considerations
Turbidity can be useful as an indicator of the effects ofrunoff from construction, agricultural practices, loggingactivity, discharges, and other sources. Turbidity oftenincreases sharply during rainfall, especially in developedwatersheds that typically have relatively high proportionsof impervious surfaces. The flow of stormwater runofffrom impervious surfaces rapidly increases stream veloc-ity, increasing the erosion rates of streambanks and chan-nels. Turbidity can also rise sharply during dry weather ifEarth-disturbing activities occur in or near a stream with-out erosion control practices in place.
Regular monitoring of turbidity can help detect trendsthat might indicate increasing erosion in developing water-sheds. However, turbidity is closely related to stream flowand velocity and should be correlated with these factors.Comparisons of the change in turbidity over time, there-fore, should be made at the same point at the same flow.
Keep in mind that turbidity is not a measurement ofthe amount of suspended solids present or the rate ofsedimentation of a stream; it measures only the amountof light that is scattered by suspended particles. Measure-ment of total solids is a more direct measurement of theamount of material suspended and dissolved in water.
Turbidity is generally measured by using a turbiditymeter or turbidimeter. The turbidimeter is a modernnephelometer. (Originally, this was a box containing alight bulb that directed light at a sample. The amount oflight scattered at right angles by the turbidity particles wasmeasured, as a measure of the turbidity in the sample, andregistered as nephelometric turbidity units [NTUs].) Theturbidimeter uses a photoelectric cell to register the scat-tered light on an analog or digital scale, and the instrumentis calibrated with permanent turbidity standards composedof the colloidal substance, formazin. Meters can measureturbidity over a wide range — from 0 to 1000 NTUs. Aclear mountain stream might have a turbidity of around1 NTU, whereas a large river like the Mississippi mighthave a dry-weather turbidity of 10 NTUs. Because thesevalues can jump into hundreds of NTUs during runoffevents, the turbidity meter to be used should be reliableover the range in which you will be working. Meters ofthis quality cost about $800. Many meters in this pricerange are designed for field or lab use.
An operator may also take samples to a lab for analysis.Another approach, discussed previously, is to measuretransparency (an integrated measure of light scattering andabsorption) instead of turbidity. Water clarity or transpar-ency can be measured using a Secchi disk (see Figure 14.11)or transparency tube. The Secchi disk can only be used in
deep, slow moving rivers; the transparency tube (a com-paratively new development) is gaining acceptance in andaround the country, but is not widely used.
14.4.10.2 Using a Secchi Disk
A Secchi disk is a black and white disk that is loweredby hand into the water to the depth at which it vanishesfrom sight (see Figure 14.11). The distance to vanishingis then recorded — the clearer the water, the greater thedistance. Secchi disks are simple to use and inexpensive. Forriver monitoring they have limited use because in most casesthe river bottom will be visible and the disk will not reacha vanishing point. Deeper, slower moving rivers are the mostappropriate places for Secchi disk measurement. However,the current might require that the disk be extra-weighted soit does not sway and make measurement difficult. Secchidisks cost about $50, but can be homemade.
The line attached to the Secchi disk must be markedin waterproof ink according to units designated by thesampling program. Many programs require samplers tomeasure to the nearest 1/10 m. Meter intervals can betagged (e.g., with duct tape) for ease of use.
To measure water clarity with a Secchi disk:
1. Check to make sure that the Secchi disk issecurely attached to the measured line.
2. Lean over the side of the boat and lower theSecchi disk into the water, keeping your backto the sun to block glare.
3. Lower the disk until it disappears from view.Lower it 1/3 m and then slowly raise the diskuntil it just reappears. Move the disk up anddown until you find the exact vanishing point.
4. Attach a clothespin to the line at the point wherethe line enters the water. Record the measurementon your data sheet. Repeating the measurementprovides you with a quality control check.
The key to consistent results is to train samplers tofollow standard sampling procedures. If possible, have thesame individual take the reading at the same site through-out the season.
14.4.10.3 Transparency Tube
Pioneered by Australia’s department of conservation, thetransparency tube is a clear, narrow plastic tube markedin units with a dark pattern painted on the bottom. Wateris poured into the tube until the pattern disappears. SomeU.S. volunteer monitoring programs (e.g., the TennesseeValley Authority [TVA] Clean Water Initiative and theMinnesota Pollution Control Agency [MPCA]) are testingthe transparency tube in streams and rivers. MPCA usestubes marked in centimeters. It has found tube readings to
© 2003 by CRC Press LLC

414 Handbook of Water and Wastewater Treatment Plant Operations
be related fairly well to lab measurements of turbidity andtotal suspended solids (TSS), but does not recommend thetransparency tube for applications where precise and accu-rate measurement is required or in highly colored waters.
The TVA and MPCA recommended the followingsampling considerations:
1. Collect the sample in a bottle or bucket in mid-stream and at middepth if possible. Avoidstagnant water and sample as far from theshoreline as is safe. Avoid collecting sedimentfrom the bottom of the stream.
2. Face upstream as you fill the bottle or bucket.
3. Take readings in open but shaded conditions.Avoid direct sunlight by turning your back tothe sun.
4. Carefully stir or swish the water in the bucketor bottle until it is homogeneous, taking care nota produce air bubbles (these scatter light andaffect the measurement). Pour the water slowlyin the tube while looking down the tube. Mea-sure the depth of the water column in the tubeat the point where the symbol just disappears.
14.4.11 ORTHOPHOSPHATE MEASUREMENT
Earlier we discussed the nutrients phosphorus and nitro-gen. Both phosphorus and nitrogen are essential nutrientsfor the plants and animals that make up the aquatic foodweb. Because phosphorus is the nutrient in short supplyin most freshwater systems, even a modest increase inphosphorus can (under the right conditions) set off a wholechain of undesirable events in a stream. These eventsinclude accelerated plant growth; algae blooms; low DO;and the death of certain fish, invertebrates, and otheraquatic animals.
Phosphorus comes from many sources, both naturaland human. These include soil and rocks, wastewater treat-ment plants, runoff from fertilized lawns and cropland,failing septic systems, runoff from animal manure storageareas, disturbed land areas, drained wetlands, water treat-ment, and commercial cleaning preparations.
14.4.11.1 Forms of Phosphorus
Phosphorus has a complicated story. Pure, elemental phos-phorus (P) is rare. In nature, phosphorus usually exists aspart as part of a phosphate molecule (PO4). Phosphorusin aquatic systems occurs as organic phosphate and inor-ganic phosphate. Organic phosphate consists of a phosphatemolecule associated with a carbon-based molecule, as inplant or animal tissue. Phosphate that is not associated withorganic material is inorganic, the form required by plants.Animals can use either organic or inorganic phosphate.
Both organic and inorganic phosphate can either bedissolved in the water or suspended (attached to particlesin the water column).
14.4.11.2 The Phosphorus Cycle
Recall that phosphorus cycles through the environment,changing form as it does so (see Figure 11.19). Aquaticplants take in dissolved inorganic phosphorus, as itbecomes part of their tissues. Animals get the organicphosphorus they need by eating either aquatic plants, otheranimals, or decomposing plant and animal material.
In water bodies, as plants and animals excrete wastesor die, the organic phosphorus they contain sinks to thebottom, where bacterial decomposition converts it back toinorganic phosphorus, both dissolved and attached to par-ticles. This inorganic phosphorus gets back into the watercolumn when animals, human activity, interactions, orwater currents stir up the bottom. Then plants take it upand the cycle begins again.
In a stream system, the phosphorus cycle tends tomove phosphorus downstream as the current carriesdecomposing plant and animal tissue and dissolved phos-phorus. It becomes stationary only when it is taken up byplants or is bound to particles that settle to the bottom ofponds.
In the field of water quality chemistry, phosphorus isdescribed by several terms. Some of these terms are chem-istry based (referring to chemically based compounds),and others are methods based (they describe what is mea-sured by a particular method).
The term orthophosphate is a chemistry-based termthat refers to the phosphate molecule all by itself. Morespecifically, orthophosphate is simple phosphate or reac-tive phosphate (i.e., Na3PO4), sodium phosphate (triba-sic), NaH2PO4, and sodium phosphate (monobasic).Orthophosphate is the only form of phosphate that can bedirectly tested for in the laboratory; it is the form thatbacteria use directly for metabolic processes. Reactivephosphorus is a corresponding method-based term thatdescribes what is actually being measured when the testfor orthophosphate is being performed. Because the labprocedure is not quite perfect, mostly orthophosphate isobtained along with a small fraction of some other forms.
More complex inorganic phosphate compounds arereferred to as condensed phosphates or polyphosphates. Themethod-based term for these forms is acid hydrolyzable.
14.4.11.3 Testing Phosphorus
Testing phosphorus is challenging because it involves mea-suring very low concentrations, down to 0.01 mg/L or evenlower. Even such very low concentrations of phosphoruscan have a dramatic impact on streams. Less sensitive meth-ods should be used only to identify serious problem areas.
© 2003 by CRC Press LLC

Biomonitoring, Monitoring, Sampling, and Testing 415
While many tests for phosphorus exist, only four arelikely to be performed by most samplers:
1. The total orthophosphate test is largely a mea-sure of orthophosphate. Because the sample isnot filtered, the procedure measures both dis-solved and suspended orthophosphate. TheEPA-approved method for measuring is knownas the ascorbic acid method. Briefly, a reagent(either liquid or powder) containing ascorbicacid and ammonium molybdate reacts withorthophosphate in the sample to form a bluecompound. The intensity of the blue color isdirectly proportional to the amount of ortho-phosphate in the water.
2. The total phosphate test measures all the formsof phosphorus in the sample (orthophosphate,condensed phosphate, and organic phosphate).It first digests (heating and acidifying) the sampleto convert all the other forms to orthophosphate,and the orthophosphate is then measured by theascorbic acid method. Because the sample isnot filtered, the procedure measures both dis-solved and suspended orthophosphate.
3. The dissolved phosphorus test measures thatfraction of the total phosphorus that is in solutionin the water (as opposed to being attached tosuspended particles). It is determined by filter-ing the sample and analyzing the filtered samplefor total phosphorus.
4. Insoluble phosphorus is calculated by subtract-ing the dissolved phosphorus result from thetotal phosphorus result.
All these tests have one thing in common — they alldepend on measuring orthophosphate. The total ortho-phosphate test measures the orthophosphate that is alreadypresent in the sample. The others measure that which isalready present and that which is formed when the otherforms of phosphorus are converted to orthophosphate bydigestion.
Monitoring phosphorus involves two basic steps:
1. Collecting a water sample2. Analyzing it in the field or lab for one of the
types of phosphorus described above
14.4.11.4 Sampling and Equipment Considerations
Sample containers made of either some form of plastic orPyrex® glass are acceptable to EPA. Phosphorus moleculeshave a tendency to absorb (attach) to the inside surface ofsample containers. Therefore, if containers are to be reused,they must be acid-washed to remove absorbed phosphorus.
The container must be able to withstand repeated contactwith hydrochloric acid. Plastic containers, either high-density polyethylene or polypropylene, might be prefera-ble to glass from a practical standpoint because they arebetter able to withstand breakage. Some programs usedisposable, sterile, plastic Whirl-pak bags. The size of thecontainer depends on the sample amount needed for thephosphorus analysis method chosen, and the amountneeded for other analyses to be performed.
All containers that will hold water samples or comeinto contact with reagents used in the orthophosphate testmust be dedicated. They should not be used for other tests,eliminating the possibility that reagents containing phos-phorus will contaminate the labware. All labware shouldbe acid-washed.
The only form of phosphorus this text recommendsfor field analysis is total orthophosphate, which uses theascorbic acid method on an untreated sample. Analysis ofany of the other forms requires adding potentially hazard-ous reagents, heating the sample to boiling, and using toomuch time and too much equipment to be practical. Inaddition, analysis for other forms of phosphorus is proneto errors and inaccuracies in field situations. Pretreatmentand analysis for these other forms should be handled in alaboratory.
14.4.11.5 Ascorbic Acid Method for Determining Orthophosphate
In the ascorbic acid method, a combined liquid or pre-packaged powder reagent consisting of sulfuric acid,potassium antimonyl tartrate, ammonium molybdate, andascorbic acid (or comparable compounds) is added toeither 50 or 25 mL of the water sample. This colors thesample blue in direct proportion to the amount of ortho-phosphate in the sample. Absorbance or transmittance isthen measured after 10 minutes, but before 30 minutes. Itis measured by using a color comparator with a scale inmilligrams per liter that increases with the increase incolor hue, or an electronic meter that measures the amountof light absorbed or transmitted at a wavelength of 700 to880 nm (depending on manufacturer’s directions).
A color comparator may be useful for identifyingheavily polluted sites with high concentrations (greaterthan 0.1 mg/L). However, matching the color of a treatedsample to a comparator can be very subjective, especiallyat low concentrations, and lead to variable results.
A field spectrophotometer or colorimeter with a 2.5-cmlight path and an infrared photocell (set for a wavelengthof 700 to 880 nm) is recommended for accurate determi-nation of low concentrations (between 0.2 and 0.02 mg/L).Using a meter requires that a prepared known standardconcentration be analyzed ahead of time to convert theabsorbence readings of a stream sample to milligrams perliter, or that the meter reads directly in milligrams per liter.
© 2003 by CRC Press LLC

416 Handbook of Water and Wastewater Treatment Plant Operations
For information on how to prepare standard concentra-tions and on how to collect and analyze samples, refer toStandard Methods and EPA’s Methods for Chemical Anal-ysis of Water and Wastes, 2nd ed., 1991, Method 365.2.
14.4.12 NITRATES MEASUREMENT
As mentioned, nitrates are a form of nitrogen found inseveral different forms in terrestrial and aquatic ecosys-tems. These forms of nitrogen include ammonia (NH3),nitrates (NO3), and nitrites (NO2). Nitrates are essentialplant nutrients, but excess amounts can cause significantwater quality problems. Together with phosphorus,nitrates in excess amounts can accelerate eutrophication,causing dramatic increases in aquatic plant growth andchanges in the types of plants and animals that live in thestream. This affects DO, temperature, and other indicators.Excess nitrates can cause hypoxia (low levels of DO) andcan become toxic to warm-blooded animals at higher con-centrations (10 mg/L or higher) under certain conditions.The natural level of ammonia or nitrate in surface water istypically low (less than 1 mg/L); in the effluent of wastewatertreatment plants, it can range up to 30 mg/L. Conventionalpotable water treatment plants cannot remove nitrate. Highconcentrations must be prevented by controlling the inputat the source.
Sources of nitrates include wastewater treatmentplants, runoff from fertilized lawns and cropland, failingon-site septic systems, runoff from animal manure storageareas, and industrial discharges that contain corrosioninhibitors.
14.4.12.1 Sampling and Equipment Considerations
Nitrates from land sources end up in rivers and streamsmore quickly than other nutrients like phosphorus. Thisis because they dissolve in water more readily than phos-phorus, which has an attraction for soil particles. As aresult, nitrates serve as a better indicator of the possibilityof a source of sewage or manure pollution during dryweather.
Water that is polluted with nitrogen-rich organic mat-ter might show low nitrates. Decomposition of the organicmatter lowers the DO level, which slows the rate at whichammonia is oxidized to nitrite (NO2) and then to nitrate(NO3). Under such circumstances, monitoring for nitritesor ammonia (considerably more toxic to aquatic life thannitrate) might be also necessary. (See Standard MethodsSection 4500-NH3 and Section 4500-NH2 for appropriatenitrite methods.)
Water samples to be tested for nitrate should be col-lected in glass or polyethylene containers that have beenprepared by using Method B (see Section 14.3.4.2).
Two methods are typically used for nitrate testing: thecadmium reduction method and the nitrate electrode. Themore commonly used cadmium reduction method pro-duces a color reaction measured either by comparison toa color wheel or by use of a spectrophotometer. A fewprograms also use a nitrate electrode, which can measurein the range of 0 to 100-mg/L nitrate. A newer colorimetricimmunoassay technique for nitrate screening is also nowavailable.
14.4.12.2 Cadmium Reduction Method
In the cadmium reduction method, nitrate is reduced tonitrite by passing the sample through a column packedwith activated cadmium. The sample is then measuredquantitatively for nitrite.
More specifically, the cadmium reduction method isa colorimetric method that involves contact of the nitratein the sample with cadmium particles, which cause nitratesto be converted to nitrites. The nitrites then react withanother reagent to form a red color, in proportional inten-sity to the original amount of nitrate. The color is measuredeither by comparison to a color wheel with a scale inmilligrams per liter that increases with the increase incolor hue, or by use of an electronic spectrophotometerthat measures the amount of light absorbed by the treatedsample at a 543-nm wavelength. The absorbence valueconverts to the equivalent concentration of nitrate againsta standard curve. Methods for making standard solutionsand standard curves are presented in Standard Methods.
The sampling or monitoring supervisor before eachsampling run should create this curve. The curve is devel-oped by making a set of standard concentrations of nitrate,reacting them, developing the corresponding color, andplotting the absorbence value for each concentrationagainst concentration. A standard curve could also be gen-erated for the color wheel. Use of the color wheel isappropriate only if nitrate concentrations are greater than1 mg/L. For concentrations below 1 mg/L, use a spectro-photometer. Matching the color of a treated sample at lowconcentrations to a color wheel (or cubes) can be verysubjective and can lead to variable results. Color compar-ators can, however, be effectively used to identify siteswith high nitrates.
This method requires that the samples being treatedare clear. If a sample is turbid, filter it through a 0.45-mmfilter. Be sure to test to make sure the filter is nitrate-free.If copper, iron, or others metals are present in concentra-tions above several milligrams per liter, the reaction withthe cadmium will slow down and the reaction time mustbe increased.
The reagents used for this method are often prepack-aged for different ranges, depending on the expected con-centration of nitrate in the stream. For example, the Hackcompany provides reagents for the following ranges: low
© 2003 by CRC Press LLC

Biomonitoring, Monitoring, Sampling, and Testing 417
(0 to 0.40 mg/L), medium (0 to 15 mg/L), and high (0 to30 mg/L). Determining the appropriate range for thestream being monitored is important.
14.4.12.3 Nitrate Electrode Method
A nitrate electrode (used with a meter) is similar in func-tion to a DO meter. It consists of a probe with a sensorthat measures nitrate activity in the water; this activityaffects the electric potential of a solution in the probe.This change is then transmitted to the meter, which con-verts the electric signal to a scale that is read in millivolts.The millivolts are then converted to milligrams per literof nitrate by plotting them against a standard curve. Theaccuracy of the electrode can be affected by high concen-trations of chloride or bicarbonate ions in the samplewater. Fluctuating pH levels can also affect the meterreading.
Nitrate electrodes and meters are expensive comparedto field kits that employ the cadmium reduction method.(The expense is comparable if a spectrophotometer is usedrather than a color wheel.) Meter or probe combinationsrun between $700 and $1200, including a long cable toconnect the probe to the meter. If the program has a pHmeter that displays readings in millivolts, it can be usedwith a nitrate probe and no separate nitrate meter isneeded. Results are read directly as milligrams per liter.
Although nitrate electrodes and spectrophotometerscan be used in the field, they have certain disadvantages.These devices are more fragile than the color comparatorsand are more at risk of breaking in the field. They mustbe carefully maintained and must be calibrated before eachsample run; if many tests are being run they must becalibrated between samplings. This means that samplesare best tested in the lab. Note that samples to be testedwith a nitrate electrode should be at room temperature,whereas color comparators can be used in the field withsamples at any temperature.
14.4.13 SOLIDS MEASUREMENT
Solids in water are defined as any matter that remains asresidue upon evaporation and drying at 103°C. They areseparated into two classes: suspended solids and dissolvedsolids:
As shown above, total solids are dissolved solids plussuspended and settleable solids in water. In natural fresh-water bodies, dissolved solids consist of calcium, chlorides,nitrate, phosphorus, iron, sulfur, and other ions — parti-cles that will pass through a filter with pores of around
2 mm (0.002 cm) in size. Suspended solids include silt andclay particles, plankton, algae, fine organic debris, andother particulate matter. These are particles that will notpass through a 2-mm filter.
The concentration of total dissolved solids affects thewater balance in the cells of aquatic organisms. An organ-ism placed in water with a very low level of solids (e.g.,distilled water) swells because water tends to move intoits cells, which have a higher concentration of solids. Anorganism placed in water with a high concentration ofsolids shrinks somewhat because the water in its cellstends to move out. This in turn affects the organism’sability to maintain the proper cell density, making keepingits position in the water column difficult. It might float upor sink down to a depth to which it is not adapted, and itmight not survive.
Higher concentrations of suspended solids can serveas carriers of toxics, which readily cling to suspendedparticles. This is particularly a concern where pesticidesare being used on irrigated crops. Where solids are high,pesticide concentrations may increase well beyond thoseof the original application as the irrigation water travelsdown irrigation ditches. Higher levels of solids can alsoclog irrigation devices; they might become so high thatirrigated plant roots will lose water rather than gain it.
A high concentration of total solids will make drinkingwater unpalatable, and might have an adverse effect onpeople who are not used to drinking such water. Levelsof total solids that are too high or too low can also reducethe efficiency of wastewater treatment plants, as well asthe operation of industrial processes that use raw water.
Total solids affect water clarity. Higher solids decreasethe passage of light through water, slowing photosynthesisby aquatic plants. Water heats up more rapidly and holdsmore heat; this might adversely affect aquatic life adaptedto a lower temperature regime.
Sources of total solids include industrial discharges,sewage, fertilizers, road runoff, and soil erosion. Totalsolids are measured in milligrams per liter.
14.4.13.1 Solids Sampling and Equipment Considerations
When conducting solids testing, there are many things thataffect the accuracy of the test or result in wide variationsin results for a single sample. These include the following:
1. Drying temperature2. Length of drying time3. Condition of desiccator and desiccant4. Nonrepresentative samples’ lack of consistency
in test procedure5. Failure to achieve constant weight prior to cal-
culating results
Total Solids Suspended Solids nonfilterable residue
Dissolved Solids filterable residue
= +( )
( )
© 2003 by CRC Press LLC

418
Handbook of Water and Wastewater Treatment Plant Operations
There are several precautions that can help to increasethe reliability of test results:
1. Use extreme care when measuring samples,weighing materials, and drying or coolingsamples.
2. Check and regulate oven and furnace tempera-tures frequently to maintain the desired range.
3. Use an indicator drying agent in the desiccatorthat changes color when it is no longer good.Change or regenerate the desiccant whennecessary.
4. Keep desiccator cover greased with the appro-priate type of grease. This will seal the desic-cator and prevent moisture from entering thedesiccator as the test glassware cools.
5. Check ceramic glassware for cracks and glassfiber filter for possible holes. A hole in a glassfilter will cause solids to pass through and giveinaccurate results.
6. Follow manufacturer’s recommendation forcare and operation of analytical balances.
Total solids are important to measure in areas wheredischarges from sewage treatment plants, industrial plants,or extensive crop irrigation may occur. In particular,streams and rivers in arid regions where water is scarceand evaporation is high tend to have higher concentrationsof solids, and are more readily affected by human intro-duction of solids from land use activities.
Total solids measurements can be useful as an indica-tor of the effects of runoff from construction, agriculturalpractices, logging activities, sewage treatment plant dis-charges, and other sources. As with turbidity, concentrationsoften increase sharply during rainfall, especially in devel-oped watersheds. They can also rise sharply during dryweather if earth-disturbing activities occur in or near thestream without erosion control practices in place. Regularmonitoring of total solids can help detect trends that mightindicate increasing erosion in developing watersheds.Total solids are closely related to stream flow and velocity,and should be correlated with these factors. Any changein total solids over time should be measured at the samesite at the same flow.
Total solids are measured by weighing the amount ofsolids present in a known volume of sample; this is accom-plished by weighing a beaker, filling it with a knownvolume, evaporating the water in an oven and completelydrying the residue, and weighing the beaker with the resi-due. The total solids concentration is equal to the differencebetween the weight of the beaker with the residue and theweight of the beaker without it. Since the residue is solight in weight, the lab needs a balance that is sensitive toweights in the range of 0.0001 g. Balances of this typeare called analytical or Mettler balances and are expensive
(around $3000). The technique requires that the beakersbe kept in a desiccator, a sealed glass container that con-tains material that absorbs moisture and ensures that theweighing is not biased by water condensation on the bea-ker. Some desiccants change color to indicate moisturecontent.
The measurement of total solids cannot be done in thefield. Samples must be collected using clean glass or plas-tic bottles or Whirl-pak bags and taken to a laboratorywhere the test can be run.
14.4.13.2 Total Suspended Solids
As mentioned, the term solids means any material sus-pended or dissolved in water and wastewater. Althoughnormal domestic wastewater contains a very small amountof solids (usually less than 0.1%), most treatment pro-cesses are designed specifically to remove or convert solidsto a form that can be removed or discharged withoutcausing environmental harm.
In sampling for TSS, samples may be either grab orcomposite and can be collected in either glass or plasticcontainers. TSS samples can be preserved by refrigerationat or below 4ºC (not frozen). However, composite samplesmust be refrigerated during collection. The maximumholding time for preserved samples is 7 d.
14.4.13.2.1 Test ProcedureIn short, to conduct a TSS test procedure, a well-mixedmeasured sample is poured into a filtration apparatus and,with the aid of a vacuum pump or aspirator, is drawnthrough a preweighted glass fiber filter. After filtration, theglass filter is dried at 103 to 105ºC, cooled and reweighed.The increase in weight of the filter and solids comparedto the filter alone represents the TSS.
An example of the specific test procedure used forTSS is given below.
1. Select a sample volume that will yield between10 and 200 mg of residue with a filtration timeof 10 min or less.
Note: If filtration time exceeds 10 min, increase filterarea or decrease volume to reduce filtration time.
Note: For nonhomogenous samples or samples withvery high solids concentrations (e.g., rawwastewater or mixed liquor), use a larger filterto ensure a representative sample volume canbe filtered.
2. Place preweighed glass fiber filter on filtrationassembly in a filter flask.
3. Mix sample well, and measure the selected vol-ume of sample.
4. Apply suction to filter flask. Wet filter with asmall amount of laboratory-grade water to seal it.
© 2003 by CRC Press LLC

Biomonitoring, Monitoring, Sampling, and Testing 419
5. Pour the selected sample volume into filtrationapparatus.
6. Draw sample through filter.7. Rinse measuring device into filtration apparatus
with three successive 10 mL portions of labo-ratory-grade water. Allow complete drainagebetween rinsings.
8. Continue suction for 3 min after filtration offinal rinse is completed.
9. Remove the glass filter from the filtrationassembly (membrane filter funnel or cleanGooch crucible). If using the large disks andmembrane filter assembly, transfer the glass fil-ter to a support (aluminum pan or evaporatingdish) for drying.
10. Place the glass filter with solids and support(pan, dish, or crucible) in a drying oven.
11. Dry filter and solids to constant weight at 103 to105ºC (at least 1 h).
12. Cool to room temperature in a desiccator.13. Weigh the filter. Support and record the con-
stant weight in test record.
14.4.13.2.2 TSS CalculationsTo determine the total suspended solids concentration inmilligrams per liter, we use the following equations:
1. To determine weight of dry solids in grams:
2. To determine weight of dry solids in milligrams:
(14.8)
3. To determine the TSS concentration in milli-grams per liter;
(14.9)
EXAMPLE 14.4
Problem:
Using the data provided below, calculate TSS:
Solution:
Dry Solids (g) = 2.305 g – 2.297 g = 0.008 gDry Solids (mg) = 0.008 g ¥ 1000 mg/g = 8 mg
14.4.13.3 Volatile Suspended Solids Testing
When the total suspended solids are ignited at 550 ± 50ºC,the volatile (organic) suspended solids of the sample areconverted to water vapor and carbon dioxide and arereleased to the atmosphere. The solids that remain afterthe ignition (ash) are the inorganic or fixed solids.
In addition to the equipment and supplies required forthe TSS test, you need the following:
1. Muffle furnace (550 ± 50ºC)2. Ceramic dishes3. Furnace tongs4. Insulated gloves
14.4.13.3.1 Test ProcedureAn example of the test procedure used for volatile sus-pended solids is given below:
1. Place the weighed filter with solids and supportfrom the TSS test in the muffle furnace.
2. Ignite filter, solids, and support at 550 ± 50ºCfor 15 to 20 min.
3. Remove the ignited solids, filter, and supportfrom the furnace, and partially air cool.
4. Cool to room temperature in a desiccator.5. Weigh ignited solids, filter, and support on an
analytical balance.6. Record the weight of ignited solids, filter, and
support.
14.4.13.3.2 Total Volatile Suspended Solids Calculations
Calculating total volatile suspended solids (TVSS)requires the following information:
1. Weights of dry solids, filter, and support in grams2. Weight of ignited solids, filter and support in
grams
(14.10)Sample Volume (mL) 250 mLWeight of Dry Solids and Filter (g) 2.305 gWeight of Dry Filter (g) 2.297 g
Dry Solids g Wt. of Dry Solids and Filter, g
Wt. of Dry Filter g
( )
( )
= -
(14.7)
Dry Solids mg Wt. of Solids and Filter, g
Wt. of Dry Filter g
( )
( )
= -
Tml Sample
SS mg LDry Solids mg 1000 ml L
( ) ( )
=¥
TmL
SS mg L8.0 1000 mL L
mg L
( ) =¥
=
250
32 0.
TV
CS
SS mg L
A 1000 mg g 1000 mL L ample Volume mL
( ) =
-( ) ¥ ¥( )
© 2003 by CRC Press LLC

420 Handbook of Water and Wastewater Treatment Plant Operations
whereA = Weight of dried solids, filter, and supportC = Weight of ignited solids, filter, and support
EXAMPLE 14.5
Problem:
Given:
A = 1.6530 gC = 1.6330 gSample volume = 100
Calculate the TVSS.
Solution:
Note: Total fixed suspended solids (TFSS) is the dif-ference between the TVSS and the TSS con-centrations:
(14.11)
EXAMPLE 14.6
Problem:
Given:
TSS = 202 mg/LTVSS = 200 mg/L
Calculate TFSS.
Solution:
14.4.14 CONDUCTIVITY TESTING
Conductivity is a measure of the capacity of water to passan electrical current. Conductivity in water is affected bythe presence of inorganic dissolved solids such as chloride,nitrate, sulfate, and phosphate anions (ions that carry anegative charge), or sodium, magnesium, calcium, iron,and aluminum cations (ions that carry a positive charge).
Organic compounds like oil, phenol, alcohol, and sugardo not conduct electrical current very well and have a lowconductivity when in water. Conductivity is also affectedby temperature: the warmer the water, the higher theconductivity.
Conductivity in streams and rivers is affected prima-rily by the geology of the area through which the waterflows. Streams that run through areas with granite bedrocktend to have lower conductivity because granite is com-posed of more inert materials that do not ionize (dissolveinto ionic components) when washed into the water. Onthe other hand, streams that run through areas with claysoils tend to have higher conductivity because of the pres-ence of materials that ionize when washed into the water.Groundwater inflows can have the same effects, dependingon the bedrock they flow through.
Discharges to streams can change the conductivitydepending on their makeup. A failing sewage systemwould raise the conductivity because of the presence ofchloride, phosphate, and nitrate; an oil spill would lowerconductivity.
The basic unit of measurement of conductivity is themho or siemens. Conductivity is measured in micromhosper centimeter or microsiemens per centimeter. Distilledwater has conductivity in the range of 0.5 to 3 µmhos/cm.The conductivity of rivers in the U.S. generally rangesfrom 50 to 1500 µmhos/cm. Studies of inland freshwatersindicated that streams supporting good mixed fisherieshave a range between 150 and 500 µmhos/cm. Conductiv-ity outside this range could indicate that the water is notsuitable for certain species of fish or macroinvertebrates.Industrial waters can range as high as 10,000 µmhos/cm.
14.4.14.1 Sampling, Testing, and Equipment Considerations
Conductivity is useful as a general measure of sourcewater quality. Each stream tends to have a relatively con-stant range of conductivity that, once established, can beused as a baseline for comparison with regular conductiv-ity measurements. Significant changes in conductivitycould indicate that a discharge or some other source ofpollution has entered a stream.
The conductivity test is not routine in potable watertreatment, but when performed on source water is a goodindicator of contamination. Conductivity readings can alsobe used to indicate wastewater contamination or saltwaterintrusion.
Note: Distilled water used for potable water analysesat public water supply facilities must have aconductivity of no more than 1 µmho/cm.
Conductivity is measured with a probe and a meter.Voltage is applied between two electrodes in a probeimmersed in the sample water. The drop of voltage caused
TV
g
mL
SS mg L
1.6530 g 1 1000 mg g 1000 mL L
00
mg L
mg L
( )
( )=
- ¥ ¥
=¥
=
.
. , ,
6330
1
0 02 1 000 000
100
200
TFSS mg L TSS TVSS( ) = -
TFSS mg L mg L mg L
mg L
( ) = -
=
202 200
2
© 2003 by CRC Press LLC

Biomonitoring, Monitoring, Sampling, and Testing 421
by the resistance of the water is used to calculate theconductivity per centimeter. The meter converts the probemeasurement to micromhos per centimeter and displaysthe result for the user.
Note: Some conductivity meters can also be used totest for total dissolved solids and salinity. Thetotal dissolved solids concentration in milli-grams per liter (mg/L) can also be calculatedby multiplying the conductivity result by a fac-tor between 0.55 and 0.9, which is empiricallydetermined (see Standard Methods #2510).
Suitable conductivity meters cost about $350. Metersin this price range should also measure temperature andautomatically compensate for temperature in the conduc-tivity reading. Conductivity can be measured in the fieldor the lab. In most cases, collecting samples in the fieldand taking them to a lab for testing is probably better. Inthis way, several teams can collect samples simulta-neously. If testing in the field is important, metersdesigned for field use can be obtained for around the samecost mentioned above.
If samples will be collected in the field for later mea-surement, the sample bottle should be a glass or polyethylenebottle that has been washed in phosphate-free detergentand rinsed thoroughly with both tap and distilled water.Factory-prepared Whirl-pak bags may be used.
14.4.15 TOTAL ALKALINITY
As mentioned, alkalinity is defined as the ability of waterto resist a change in pH when acid is added; it relates tothe pH buffering capacity of the water. Almost all naturalwaters have some alkalinity. These alkaline compounds inthe water, such as bicarbonates (baking soda is one type),carbonates, and hydroxides, remove H+ ions and lower theacidity of the water (which means increased pH). Theyusually do this by combining with the H+ ions to makenew compounds. Without this acid-neutralizing capacity,any acid added to a stream would cause an immediatechange in the pH. Measuring alkalinity is important indetermining a stream’s ability to neutralize acidic pollu-tion from rainfall or wastewater — one of the best mea-sures of the sensitivity of the stream to acid inputs.
Alkalinity in streams is influenced by rocks and soils,salts, certain plant activities, and certain industrial waste-water discharges.
Total alkalinity is determined by measuring theamount of acid (e.g., sulfuric acid) needed to bring thesample to a pH of 4.2. At this pH all the alkaline com-pounds in the sample are completely used up. The resultis reported as milligrams per liter of calcium carbonate(mg/L CaCO3).
Alkalinity is important in water treatment plant oper-ations. For example, testing for alkalinity in potable water
treatment is most important for its relation to coagulantaddition; it is important that there exists enough naturalalkalinity in the water to buffer chemical acid addition sothat floc formation will be optimum, and the turbidityremoval can proceed. In water softening, proper chemicaldosage will depend on the type and amount of alkalinityin the water. For corrosion control, the presence of ade-quate alkalinity in a water supply neutralizes any acidtendencies, and prevents it from becoming corrosive.
14.4.15.1 Analytical and Equipment Considerations
For total alkalinity, a double end point titration using apH meter (or pH pocket pal) and a digital titrator or buretis recommended. This can be done in the field or in thelab. If alkalinity must be analyzed in the field, a digitaltitrator should be used instead of a buret, because buretsare fragile and more difficult to set up. The alkalinitymethod described below was developed by the Acid RainMonitoring Project of the University of MassachusettsWater Resources Research Center (from River WatchNetwork, Total Alkalinity and pH Field and LaboratoryProcedures, July 1992).
14.4.15.2 Burets, Titrators, and Digital Titrators for Measuring Alkalinity
The total alkalinity analysis involves titration. In this test,titration is the addition of small, precise quantities ofsulfuric acid (the reagent) to the sample, until the samplereaches a certain pH (known as an end point). The amountof acid used corresponds to the total alkalinity of thesample. Alkalinity can be measured using a buret, titrator,or digital titrator (described below):
1. A buret is a long, graduated glass tube with atapered tip like a pipette and a valve that opensto allow the reagent to drop out of the tube. Theamount of reagent used is calculated by sub-tracting the original volume in the buret fromthe column left after the end point has beenreached. Alkalinity is calculated based on theamount used.
2. Titrators forcefully expel the reagent by usinga manual or mechanical plunger. The amountof reagent used is calculated by subtracting theoriginal volume in the titrator from the volumeleft after the end point has been reached. Alka-linity is then calculated based on the amountused or is read directly from the titrator.
3. Digital titrators have counters that display num-bers. A plunger is forced into a cartridge con-taining the reagent by turning a knob on thetitrator. As the knob turns, the counter changes
© 2003 by CRC Press LLC

422 Handbook of Water and Wastewater Treatment Plant Operations
in proportion to the amount of reagent used.Alkalinity is then calculated based on theamount used. Digital titrators cost approxi-mately $100.
Digital titrators and burets allow for much more pre-cision and uniformity in the amount of titrant that is used.
14.4.16 FECAL COLIFORM BACTERIA TESTING
(Note: Much of the information in this section is fromEPA’s Test Methods for Escherichia coli and Enterococciin Water by the Membrane Filter Procedure (Method#1103.1), EPA 600/4–85–076, 1985; and BacteriologicalAmbient Water Quality Criteria for Marine and FreshRecreational Waters, EPA 440/5–84–002, Office ofResearch and Development, Cincinnati, OH, 1986.)
Fecal coliform bacteria are nondisease-causing organ-isms that are found in the intestinal tract of all warmblooded animals. Each discharge of body wastes containslarge amounts of these organisms. The presence of fecalcoliform bacteria in a stream or lake indicates the presenceof human or animal wastes. The number of fecal coliformbacteria present is a good indicator of the amount ofpollution present in the water.
EPA’s Total Coliform Rule, (816-F-01–035, Nov. 2001)specifies the following:
1. The purpose of the Total Coliform Rule is toimprove public health protection by reducingfecal pathogens to minimal levels through con-trol of total coliform bacteria, including fecalcoliforms and Escherichia coli (E. coli).
2. The Total Coliform Rule Establishes an MCLbased on the presence or absence of totalcoliforms, modifies monitoring requirementsincluding testing for fecal coliforms or E. coli,requires use of a sample siting plan, and alsorequires sanitary surveys for systems collectingfewer than five samples per month.
3. The Total Coliform Rule applies to all publicwater systems.
4. Implementation of the Total Coliform Rule hasresulted in reduction in risk of illness from dis-ease causing organisms associated with sewageor animal wastes. Disease symptoms mayinclude diarrhea, cramps, nausea, and possiblyjaundice, and associated headaches and fatigue.
14.4.16.1 Fecal Coliforms: General Information
As mentioned, fecal coliforms are used as indicators ofpossible sewage contamination because they are com-monly found in human and animal feces. Although theyare not generally harmful, they indicate the possible pres-
ence of pathogenic (disease-causing) bacteria, and protozoathat also live in human and animal digestive systems. Theirpresence in streams suggests that pathogenic microorgan-isms might also be present, and that swimming in or eatingshellfish from the waters might present a health risk. Sincetesting directly for the presence of a large variety of patho-gens is difficult, time-consuming, and expensive, water isusually tested for coliforms and fecal streptococci instead.Sources of fecal contamination to surface waters includewastewater treatment plants, on-site septic systems,domestic and wild animal manure, and storm runoff.
In addition to the possible health risks associated withthe presence of elevated levels of fecal bacteria, they canalso cause cloudy water, unpleasant odors, and anincreased oxygen demand.
Note: In addition to the most commonly tested fecalbacteria indicators, total coliforms, fecalcoliforms, and E. coli, fecal streptococci andenterococci are also commonly used as bacteriaindicators. The focus of this presentation is ontotal coliforms and fecal coliforms.
14.4.16.2 Fecal Coliforms
Fecal coliforms are widespread in nature. All members ofthe total coliform group can occur in human feces, butsome can also be present in animal manure, soil, andsubmerged wood, and in other places outside the humanbody. The usefulness of total coliforms as an indicator offecal contamination depends on the extent to which thebacteria species found are fecal and human in origin. Forrecreational waters, total coliforms are no longer recom-mended as an indicator. For drinking water, total coliformsare still the standard test, because their presence indicatescontamination of a water supply by an outside source.
Fecal coliforms, a subset of total coliform bacteria,are more fecal-specific in origin. However, even this groupcontains a genus, Klebsiella, with species that are notnecessarily fecal in origin. Klebsiella are commonly asso-ciated with textile and pulp and paper mill wastes. If thesesources discharge to a local stream, consideration shouldbe given to monitoring more fecal and human-specificbacteria. For recreational waters, this group was the pri-mary bacteria indicator until relatively recently, when EPAbegan recommending E. coli and enterococci as betterindicators of health risk from water contact. Fecalcoliforms are still being used in many states as indicatorbacteria.
14.4.16.3 Sampling Requirements
Under EPA’s Total Coliform Rule, sampling requirementsare specified as follows:
© 2003 by CRC Press LLC

Biomonitoring, Monitoring, Sampling, and Testing 423
14.4.16.3.1 Routine Sampling Requirements
1. Total coliform samples must be collected atsites that are representative of water qualitythroughout the distribution system according toa written sample siting plan subject to statereview and revision.
2. Samples must be collected at regular time inter-vals throughout the month. Groundwater systemsserving 4900 persons or fewer may collect themon the same day.
3. Monthly sampling requirements are based onpopulation served (see Table 14.9 for the min-imum sampling frequency).
4. A reduced monitoring frequency may be avail-able for systems serving 1000 persons or fewerand using only groundwater. This is only if asanitary survey within the past 5 years showsthe system is free of sanitary defects (the fre-quency may be no less than 1 sample/quarterfor community and 1 sample/year for non-com-munity systems).
5. Each total coliform-positive routine samplemust be tested for the presence of fecalcoliforms or E. coli.
14.4.16.3.2 Repeat Sampling Requirements
1. Within 24 h of learning of a total coliform-positive ROUTINE sample result, at least 3REPEAT samples must be collected and ana-lyzed for total coliforms.
2. One REPEAT sample must be collected fromthe same tap as the original sample.
3. One REPEAT sample must be collected withinfive service connections upstream.
4. One REPEAT sample must be collected withinfive service connections downstream.
5. Systems that collect one ROUTINE sample permonth or fewer must collect a fourth REPEATsample.
6. If any REPEAT sample is total coliform-positive:7. The system must analyze that total coliform-
positive culture for fecal coliforms or E. coli.8. The system must collect another set of REPEAT
samples, as before, unless the MCL has beenviolated and the system has notified the state.
14.4.16.3.3 Additional Routine Sample Requirements
A positive ROUTINE or REPEAT total coliform resultrequires a minimum of five ROUTINE samples be col-lected the following month the system provides water tothe public unless waived by the state.
14.4.16.3.4 Other Total Coliform Rule Provisions
1. Systems collecting fewer than 5 ROUTINEsamples per month must have a sanitary surveyevery 5 years (or every 10 years if it is a non-community water system using protected anddisinfected groundwater).
2. Systems using surface water or groundwaterunder the direct influence of surface water andmeeting filtration avoidance criteria must col-
TABLE 14.9 Public Water System ROUTINE Monitoring Frequencies
Population Minimum Samples/Month
25–1,000a 11001–2500 22501–3300 33301–4100 44101–4900 54901–5800 65801–6700 76701–7600 87601–8500 98501–12,900 10
12,901–17,200 1517,201–21,500 2021,501–25,000 2525,001–33,000 3033,001–41,000 4041,001–50,000 5050,001–59,000 6059,001–70,000 7070,000–83,000 8083,001–96,000 9096,001–130,000 100
130,000–220,000 120220,001–320,000 150320,001–450,000 180450,001–600,000 210600,001–780,000 240780,001–970,000 270970,001–1,230,000 330
1,520,001–1,850,000 3601,850,001–2,270,000 3902,270,001–3,020,000 4203,020,001–3,960,000 450
≥3,960,001 480
a Includes public water systems that have at least 15service connections, but serve < 25 people.
Source: Spellman, F.R., Spellman’s Standard Hand-book for Wastewater Operators, Vol. 1, TechnomicPubl., Lancaster, PA, 1999.)
© 2003 by CRC Press LLC

424 Handbook of Water and Wastewater Treatment Plant Operations
lect and have analyzed one coliform sampleeach day the turbidity of the source waterexceeds 1 NTU. This sample must be collectedfrom a tap near the first service connection.
14.4.16.3.5 Compliance
Compliance is based on the presence or absence of totalcoliforms. Compliance is also determined each calendarmonth the system serves water to the public (or eachcalendar month that sampling occurs for systems onreduced monitoring). The results of ROUTINE andREPEAT samples are used to calculate compliance.
In regards to violations, a monthly MCL violation istriggered if a system collecting fewer than 40 samples permonth has greater than 1 ROUTINE/REPEAT sample permonth that is total coliform-positive. In addition, a systemcollecting at least 40 samples per month has greater than5.0% of the ROUTINE/REPEAT samples in a month thatis total coliform-positive is technically in violation of theTotal Coliform Rule. An acute MCL violation is triggeredif any public water system has any fecal coliform- orE. coli-positive REPEAT sample or has a fecal coliform-or E. coli-positive ROUTINE sample followed by a totalcoliform-positive REPEAT sample.
The Total Coliform Rule also has requirements forpublic notification and reporting. For example, for amonthly MCL Violation, the violation must be reportedto the state no later than the end of the next business dayafter the system learns of the violation. The public mustbe notified within 14 days. For an acute MCL violation,the violation must be reported to the state no later thanthe end of the next business day after the system learnsof the violation. The public must be notified within72 hours. Systems with ROUTINE or REPEAT samplesthat are fecal coliform- or E. Coli-positive must notify thestate by the end of the day they are notified of the resultor by the end of the next business day if the state officeis already closed.
14.4.16.4 Sampling and Equipment Considerations
For many reasons, bacteria can be difficult to sample andanalyze. These reasons include:
1. Natural bacteria levels in streams can varysignificantly.
2. Bacteria conditions are strongly correlated withrainfall, making the comparison of wet and dryweather bacteria data a problem.
3. Many analytical methods have a low level of pre-cision, yet can be quite complex to accomplish.
4. Absolutely sterile conditions are essential tomaintain while collecting and handling samples.
The primary equipment decision to make when sam-pling for bacteria is what type and size of sample containeryou will use. Once you have made that decision, the samestraightforward collection procedure is used, regardless ofthe type of bacteria being monitored.
When monitoring bacteria, it is critical that all con-tainers and surfaces with which the sample will come intocontact be sterile. Containers made of either some formof plastic or Pyrex glass are acceptable to EPA. However,if the containers are to be reused, they must be sturdyenough to survive sterilization using heat and pressure.The containers can be sterilized by using an autoclave, amachine that sterilizes with pressurized steam. If using anautoclave, the container material must be able to withstandhigh temperatures and pressure. Plastic containers, eitherhigh-density polyethylene or polypropylene, might bepreferable to glass from a practical standpoint becausethey will better withstand breakage. In any case, be sureto check the manufacturer’s specifications to see whetherthe container can withstand 15 minutes in an autoclave ata temperature of 121°C without melting. (Extreme cautionis advised when working with an autoclave.) Disposable,sterile, plastic Whirl-pak bags are used by a number ofprograms. The size of the container depends on the sampleamount needed for the bacteria analysis method youchoose and the amount needed for other analyses.
The two basic methods for analyzing water samplesfor bacteria in common use are the multiple tube fermen-tation method and the membrane filtration (MF) method(described later).
Given the complexity of the analysis procedures andthe equipment required, field analysis of bacteria is notrecommended. Bacteria can either be analyzed by thevolunteer at a well-equipped lab or sent to a state-certifiedlab for analysis. If you send a bacteria sample to a privatelab, make sure that the lab is certified by the state forbacteria analysis. Consider state water quality labs, uni-versity and college labs, private labs, wastewater treatmentplant labs, and hospitals. You might need to pay these labsfor analysis.
On the other hand, if you have a modern lab with theproper equipment and properly trained technicians, thefecal coliform testing procedures described in the follow-ing section will be helpful. A note of caution: if you decideto analyze your samples in your own lab, be sure to carryout a quality assurance or quality control program.
14.4.16.5 Fecal Coliform Testing
The Code of Federal Regulations (CFR) cites twoapproved methods for the determination of fecal coliformin water: (1) the multiple tube fermentation or most prob-able number (MPN) procedure, and (2) the MF procedure.
Note: Because the MF procedure can yield low orhighly variable results for chlorinated wastewa-
© 2003 by CRC Press LLC

Biomonitoring, Monitoring, Sampling, and Testing
425
ter, EPA requires verification of results usingthe MPN procedure to resolve any controver-sies. Do not attempt to perform the fecalcoliform test using the summary informationprovided in this handbook. Refer to the appro-priate reference cited in CFR for a completediscussion of these procedures.
14.4.16.5.1 Testing PreparationsThe preparations for fecal coliform testing are describedbelow:
14.4.16.5.1.1 Equipment and TechniquesWhenever microbiological testing of water samples is per-formed, certain general considerations and techniques willbe required. Because these are basically the same for eachtest procedure, they are reviewed here prior to discussionof the two methods:
1. Reagents and media — All reagents and mediautilized in performing microbiological tests onwater samples must meet the standards speci-fied in the reference cited in CFR.
2. Reagent grade water — Deionized water that istested annually and found to be free of dis-solved metals and bactericidal or inhibitorycompounds is preferred for use in preparingculture media and test reagents, although dis-tilled water may be used.
3. Chemicals — All chemicals used in fecalcoliform monitoring must be American Chem-ical Society reagent grade or equivalent.
4. Media — To ensure uniformity in the test pro-cedures, the use of dehydrated media is recom-mended. Sterilized, prepared media in sealedtest tubes, ampoules, or dehydrated media padsare also acceptable for use in this test.
5. Glassware and Disposable Supplies — allglassware, equipment, and supplies used inmicrobiological testing should meet the stan-dards specified in the references cited in CFR.
14.4.16.5.1.2 Preparation of Equipment and ChemicalsAll glassware used for bacteriological testing must be thor-oughly cleaned using a suitable detergent and hot water.The glassware should be rinsed with hot water to removeall traces of residual from the detergent and, finally, shouldbe rinsed with distilled water. Laboratories should use adetergent certified to meet bacteriological standards or, ata minimum, rinse all glassware after washing with two tapwater rinses followed by five distilled water rinses.
For sterilization of equipment, the hot air sterilizer orautoclave can be used. When using the hot air sterilizer,all equipment should be wrapped in high-quality (Kraft)paper or placed in containers prior to hot air sterilization.All glassware, except those in metal containers, should be
sterilized for a minimum of 60 min at 170°C. Sterilizationof glassware in metal containers should require a mini-mum of 2 h. Hot air sterilization cannot be used for liquids.
When using an autoclave, sample bottles, dilutionwater, culture media, and glassware may be sterilized byautoclaving at 121°C for 15 min.
14.4.16.5.1.3 Sterile Dilution Water Preparation
The dilution water used for making sample serial dilutionsis prepared by adding 1.25 mL of stock buffer solutionand 5.0 mL of magnesium chloride solution to 1000 mLof distilled or deionized water. The stock solutions of eachchemical should be prepared as outlined in the referencecited by the CFR. The dilution water is then dispensed insufficient quantities to produce 9 or 99 mL in each dilutionbottle following sterilization. If the membrane filter proce-dure is used, additional 60- to 100-mL portions of dilutionwater should be prepared and sterilized to provide rinsewater required by the procedure.
14.4.16.5.1.4 Serial Dilution Procedure
At times, the density of the organisms in a sample makesit difficult to accurately determine the actual number oforganisms in the sample. When this occurs, the samplesize may need to be reduced to as one millionth of amilliliter. In order to obtain such small volumes, a tech-nique known as serial dilutions has been developed.
14.4.16.5.1.5 Bacteriological Sampling
To obtain valid test results that can be utilized in the evalu-ation of process efficiency of water quality, proper technique,equipment, and sample preservation are critical. These fac-tors are especially critical in bacteriological sampling.
1. Sample dechlorination — When samples ofchlorinated effluents are to be collected andtested, the sample must be dechlorinated. Priorto sterilization, place enough sodium thiosulfatesolution (10%) in a clean sample container toproduce a concentration of 100 mg/L in thesample (for a 120-mL sample bottle, 0.1 mL isusually sufficient). Sterilize the sample con-tainer as previously described.
2. Sample procedure:A. Keep the sample bottle unopened after ster-
ilization until the sample is to be collected.B. Remove the bottle stopper and hood or cap
as one unit. Do not touch or contaminate thecap or the neck of the bottle.
C. Submerge the sample bottle in the water tobe sampled.
D. Fill the sample bottle approximately 3/4 full,but not less than 100 mL.
E. Aseptically replace the stopper or cap on thebottle.
© 2003 by CRC Press LLC

426 Handbook of Water and Wastewater Treatment Plant Operations
F. Record the date, time, and location of sam-pling, as well as the sampler’s name and anyother descriptive information pertaining tothe sample.
3. Sample preservation and storage — Examina-tion of bacteriological water samples should beperformed immediately after collection. If test-ing cannot be started within 1 h of sampling,the sample should be iced or refrigerated at 4°Cor less. The maximum recommended holdingtime for fecal coliform samples from waste-water is 6 h. The storage temperature and hold-ing time should be recorded as part of the testdata.
14.4.16.5.2 Multiple Tube Fermentation Technique
The multiple fermentation technique for fecal coliformtesting is useful in determining the fecal coliform densityin most water, solid, or semisolid samples. Wastewatertesting normally requires use of the presumptive and con-firming test procedures. It is recognized as the method ofchoice for any samples that may be controversial (enforce-ment related). The technique is based on the MPN ofbacteria present in a sample that produces gas in a series
of fermentation tubes with various volumes of dilutedsample. The MPN is obtained from charts based on sta-tistical studies of known concentrations of bacteria.
The technique utilizes a two-step incubation proce-dure (see Figure 14.16). The sample dilutions are firstincubated in lauryl (sulfonate) tryptose broth for 24 to 48 h(presumptive test). Positive samples are then transferredto EC broth and incubated for an additional 24 h (con-firming test). Positive samples from this second incubationare used to statistically determine the MPN from theappropriate reference chart.
A single media, 24-hour procedure is also acceptable.In this procedure, sample dilutions are inoculated in A-1media and are incubated for 3 h at 35°C then incubatedthe remaining 20 h at 44.5°C. Positive samples from theseinoculations are then used to statistically determine theMPN value from the appropriate chart.
14.4.16.5.2.1 Fecal Coliform MPN Presumptive Test Procedure
The procedure for the fecal coliform MPN Presumptivetest is described below:
1. Prepare dilutions and inoculate five fermenta-tion tubes for each dilution.
2. Cap all tubes, and transfer to incubator.
FIGURE 14.16 Diagram of the basic test for total coliforms and second-phase confirmatory test for thermotolerant fecalcoliforms. (From Spellman, F.R., Spellman’s Standard Handbook for Wastewater Operators, Vol. 1, Technomic Publ., Lancaster,PA, 1999.)
Cap
Lauryltryptosebroth
Nogrowthor growthwithoutgas
Nogrowthor growthwithoutgas
Growthwith gasin theinvertedvial Growth
with gasin theinvertedvial
Invertedvial
Fermentationtube
Incubationat 35°C
Incubationat 44.5°C
Watersample
Negativetest
Negativetest
Positivetest
Positivetest
ECmedium
Growth transferredby wire loop
Fecal coliforms test
Total coliforms test
© 2003 by CRC Press LLC

Biomonitoring, Monitoring, Sampling, and Testing 427
3. Incubate 24 + 2 hours at 35 ± 0.5°C.4. Examine tubes for gas.
A. Gas present = Positive test — transferB. No gas = Continue incubation
5. Incubate total time 48 ± 3 hours at 35 ± 0.5°C.6. Examine tubes for gas.
A. Gas present = Positive test — transferB. No gas = Negative test
Note: Keep in mind that the fecal coliform MPN con-firming procedure of fecal coliform procedureusing A-1 broth test is used to determine theMPN/100 mL. The MPN procedure for fecalcoliform determinations requires a minimum ofthree dilutions with five tubes per dilution.
14.4.16.5.2.2 Calculation of MPN/100 mL
The calculation of the MPN test results requires selectionof a valid series of three consecutive dilutions. The numberof positive tubes in each of the three selected dilutioninoculations is used to determine the MPN/100 mL. Inselecting the dilution inoculations to be used in the cal-culation, each dilution is expressed as a ratio of positivetubes per tubes inoculated in the dilution (i.e.; three posi-tive/five inoculated [3/5]). There are several rules to followin determining the most valid series of dilutions. In thefollowing examples, four dilutions were used for the test:
1. Using the confirming test data, select the high-est dilution showing all positive results (nolower dilution showing less than all positive)and the next two higher dilutions.
2. If a series shows all negative values with theexception of one dilution, select the series thatplaces the only positive dilution in the middleof the selected series.
3. If a series shows a positive result in a dilutionhigher than the selected series (using rule #1),it should be incorporated into the highest dilu-tion of the selected series. After selecting thevalid series, the MPN/1000 mL is determinedby locating the selected series on the MPN ref-erence chart. If the selected dilution seriesmatches the dilution series of the referencechart, the MPN value from the chart is thereported value for the test. If the dilution seriesused for the test does not match the dilutionseries of the chart, the test result must be cal-culated.
EXAMPLE 14.7
Problem:
Using the results given below, calculate the MPN/100 mL.
Given:
Solution:
1. Select the highest dilution (tube with the lowestamount of sample) with all positive tubes (1.0-mLdilution). Select the next two higher dilutions(0.1 mL and 0.01 mL). In this case, the selectedseries will be 5–3–1.
2. Include any positive results in dilutions higher thanthe selected series (0.001 mL dilution 1/5). Thischanges the selected series to 5–3–2.
3. Using the first three columns of Table 14.10, locatethis series (5–3–2).
4. Read the MPN value from the fourth column (140).5. In Table 14.10, the dilution series begins with 10 mL.
For this test, this series begins with 1.0 mL.
14.4.16.5.3 Membrane Filtration TechniqueThe membrane filtration technique can be useful for deter-mining the fecal coliform density in wastewater effluents.Two exceptions to this technique are (1) primary treatedwastewater that has not been chlorinated, and (2) waste-water that contains toxic metals or phenols. Chlorinatedsecondary or tertiary effluents may be tested using thismethod, but results are subject to verification by MPNtechnique.
The membrane filter technique utilizes a speciallydesigned filter pad with uniformly sized pores (openings)that are small enough to prevent bacteria from enteringthe filter (see Figure 14.16). Another unique characteristicof the filter allows liquids, such as the media, placed underthe filter to pass upward through the filter to providenourishment required for bacterial growth.
Note: In the membrane filter method, the number ofcolonies grown estimates the number ofcoliforms.
M
S
S
PN 100 mL MPN
ample Volume in 1 Dilution
ample Volume in 1 Dilution
Chart
stChart
stSample
= ¥
(14.12)
Sample in each serial dilution (mL)
Positive Tubes (Inoculated)
10.0 5/51.0 5/50.1 3/50.01 1/50.001 1/5
MPN mL MPN mLmL
MPN mL
100 140 1001
1
1400 100
= ¥
=
0 mL
© 2003 by CRC Press LLC

428 Handbook of Water and Wastewater Treatment Plant Operations
14.4.16.5.3.1 Membrane Filter Procedure
The procedure for the membrane filter method is describedbelow:
1. Sample filtration
A. Select a filter, and aseptically separate itfrom the sterile package.
B. Place the filter on the support plate with thegrid side up.
C. Place the funnel assembly on the support;secure as needed (see Figure 14.17).
D. Pour 100 mL of sample or serial dilutiononto the filter. Apply vacuum.
Note: The sample size or necessary serial dilutionshould produce a growth of 20 to 60 fecalcoliform colonies on at least 1 filter. Theselected dilutions must also be capable of show-ing permit excursions.
E. Allow all of the liquid to pass through thefilter.
F. Rinse the funnel and filter with three por-tions (20 to 30 mL) of sterile, buffered dilu-tion water. (Allow each portion to passthrough the filter before the next addition.)
Note: Filtration units should be sterile at the start ofeach filtration series and should be sterilized
TABLE 14.10 MPN Reference Chart
Sample Volume (mL) Sample Volume (mL)
10 1.0 0.1 MPN/100 mL 10 1.0 0.1 MPN/100 mL
0 0 0 0 4 2 0 220 0 1 2 4 2 1 260 1 0 2 4 3 0 270 2 0 4 4 3 1 33
4 4 0 341 0 0 21 0 1 4 5 0 0 231 1 0 4 5 0 1 311 1 1 6 5 0 2 431 2 0 6 5 1 0 33
5 1 1 462 0 0 5 5 1 2 632 0 1 72 1 0 7 5 2 0 492 1 1 9 5 2 1 702 2 0 9 5 2 2 942 3 0 12 5 3 0 79
5 3 1 1103 0 0 8 5 3 2 1403 0 1 113 1 0 11 5 3 3 1803 1 1 14 5 4 0 1303 2 0 14 5 4 1 170
3 2 1 17 5 4 2 2205 4 3 280
4 0 0 13 5 4 4 3504 0 1 174 1 0 17 5 5 0 2404 1 1 21 5 5 1 3504 1 2 26 5 5 2 540
5 5 3 9205 5 4 16005 5 5 ≥2400
Source: Spellman, F.R., Spellman’s Standard Handbook for Wastewater Operators, Vol.1, Technomic Publ., Lancaster, PA, 1999.)
© 2003 by CRC Press LLC

Biomonitoring, Monitoring, Sampling, and Testing 429
again if the series is interrupted for 30 minutesor more. A rapid interim sterilization can beaccomplished by 2 minutes exposure to ultravi-olet (UV) light, flowing steam or boiling water.
2. IncubationA. Place absorbent pad into culture dish using
sterile forceps.B. Add 1.8 to 2.0 mL M-FC media to the
absorbent pad.C. Discard any media not absorbed by the pad.D. Filter sample through sterile filter.E. Remove filter from assembly. Place on
absorbent pad (grid up).F. Cover culture dish.G. Seal culture dishes in a weighted plastic bag.H. Incubate filters in a water bath for 24 h at
44.5 ± 0.2°C.
14.4.16.5.3.2 Colony Counting
Upon completion of the incubation period, the surface ofthe filter will have growths of both fecal coliform andnonfecal coliform bacterial colonies. The fecal coliformwill appear blue in color, while nonfecal coliform colonieswill appear gray or cream colored.
When counting the colonies, the entire surface of thefilter should be scanned using a 10¥ to 15¥ binocular,wide-field dissecting microscope.
The desired range of colonies, for the most valid fecalcoliform determination is 20 to 60 colonies/filter. If mul-tiple sample dilutions are used for the test, counts for eachfilter should be recorded on the laboratory data sheet:
1. Too many colonies — Filters that show agrowth over the entire surface of the filter with
no individually identifiable colonies should berecorded as confluent growth. Filters that showa very high number of colonies (greater than200) should be recorded as too numerous tocount (TNTC).
2. Not enough colonies — If no single filter meetsthe desired minimum colony count (20 colo-nies), the sum of the individual filter counts andthe respective sample volumes can be used inthe formula to calculate the colonies/100 mL.
Note: In each of these cases, adjustments in sampledilution volumes should be made to ensurefuture tests meet the criteria for obtaining avalid test result.
14.4.16.5.3.3 Calculation
The fecal coliform density can be calculated using thefollowing formula:
EXAMPLE 14.8
Problem:
Using the data shown below, calculate the colonies per100 mL for the influent and effluent samples noted.
FIGURE 14.17 Diagram of membrane filter technique for coliform testing. (From Spellman, F.R., Spellman’s Standard Handbookfor Wastewater Operators, Vol. 1, Technomic Publ., Lancaster, PA, 1999.)
Watersample
Suctionflask
Filtermembrane Filter placed in
a culture dish onM-Endo medium
Funnel andfilter holder Incubation
at 35°C
No growth oratypical colonies
Negative test
Typical coliformcolonies
Positive test
Sample Location
Influent Sample Dilutions
Effluent Sample Dilutions
Sample (mL) 1.0 0.1 0.01 10 1.0 0.1Colonies counted 97 48 16 10 5 3
CC
Sample Volumeolonies 100 mL
olonies Counted
mL mL= ¥( ) 100
(14.13)
© 2003 by CRC Press LLC

430 Handbook of Water and Wastewater Treatment Plant Operations
Solution:
Step 1: Influent sample
Select the influent sample filter that has a colony countin the desired range (20 to 60). Because one filter meetsthis criterion, the remaining influent filters that did notmeet the criterion are discarded:
Step 2: Effluent sample
Because none of the filters for the effluent sample meetsthe minimum test requirement, the colonies/100 mL mustbe determined by totaling the colonies on each filter andthe sample volumes used for each filter.
Note: The EPA criterion for fecal coliform bacteria inbathing waters is a logarithmic mean of200/100 mL, based on the minimum of 5 sam-ples taken over a 30-d period, with not morethan 10% of the total samples exceeding400/100 mL. Because shellfish may be eatenwithout being cooked, the strictest coliform cri-terion applies to shellfish cultivation and har-vesting. EPA criterion states that the mean fecalcoliform concentration should not exceed14/100 mL, with not more than 10% of thesamples exceeding 43/100 mL.
14.4.16.5.3.4 InterferencesLarge amounts of turbidity, algae, or suspended solids mayinterfere with this technique, blocking the filtration of thesample through the membrane filter. Dilution of thesesamples to prevent this problem may make the test inap-propriate for samples with low fecal coliform densities.This is because the sample volumes after dilution may betoo small to give representative results. The presence oflarge amounts of noncoliform group bacteria in the sam-ples may also prohibit the use of this method.
Note: Many NPDES discharge permits require fecalcoliform testing. Results for fecal coliform testingmust be reported as a geometric mean (average)of all the test results obtained during a reportingperiod. A geometric mean, unlike an arithmetic
mean or average, dampens the effect of veryhigh or low values that otherwise might causea non-representative result.
14.4.17 APPARENT COLOR TESTING/ANALYSIS
As mentioned, color in water often originates from organicsources: decomposition of leaves and other forest debrissuch as bark, pine needles, etc. Tannins and lignins, organiccompounds, dissolve in water. Some organics bond to ironto produce soluble color compounds. Biodegrading algaefrom recent bloom may cause significant color. Thoughless likely a source of color in water, possible inorganicsources of color are salts of iron, copper, and potassiumpermanganate added in excess at the treatment plant.
Note: Noticeable color is an objectionable character-istic that makes the water psychologically unac-ceptable to the consumer.
Recall that true color is dissolved. It is measured col-orimetrically and compared against an EPA color standard.
Apparent color may be caused by suspended material(turbidity) in the water. It is important to point out thateven though it may also be objectionable in the watersupply, it is not meant to be measured in the color analysisor test. Probably the most common cause of apparent coloris particulate oxidized iron.
Over the years, several attempts to standardize themethod of describing the apparent color of water using com-parisons to color standards have been made. Standard Meth-ods recognizes the Visual Comparison Method as a reliablemethod of analyzing water from the distribution system.
One of the visual comparison methods is the Forel-Ule color scale, consisting of a dozen shades ranging fromdeep blue to khaki green, typical of offshore and coastalbay waters. By using established color standards, peoplein different areas can compare test results.
Another visual comparison method is the Borger colorsystem, which provides an inexpensive, portable colorreference for shades typically found in natural waters. Itcan also be used for its original purpose — describing thecolors of insects and larvae found in streams of lakes. ThisSystem also allows the recording of the color of algae andbacteria on streambeds.
Note: Do not leave color standard charts and compar-ators in direct sunlight.
Measured levels of color in water can serve as indica-tors for a number of conditions. For example, transparentwater with a low accumulation of dissolved minerals andparticulate matter usually appears blue, indicating lowproductivity. A yellow to brown color normally indicatesthat the water contains dissolved organic materials, humicsubstances from soil, peat, or decaying plant material.Deeper yellow to reddish colors indicates some algae and
Cc
mLolonies 100 mL
olonies
1 mL
48,000 colonies 100 mL
= ¥
=
48
0100
.
Total colonies colonies
Total sample
olonies 100 mL olonies
1 mL
1 colonies 100 mL
= + + =
= + + =
= ¥
=
10 5 3 18
10 0 1 0 0 1 11 1
18
11100
62
. . . .
.
mL mL mL mL
Cc
mL
© 2003 by CRC Press LLC

Biomonitoring, Monitoring, Sampling, and Testing 431
dinoflagellates. A variety of yellows, reds, browns, andgrays are indicative of soil runoff.
Note: Color of itself has no health significance indrinking waters. A secondary MCL is set at 15color units, and it is recommended that commu-nity supplies provide water that has less color.
To ensure reliable and accurate descriptions of apparentcolor, use a system of color comparisons that is reproducibleand comparable to the systems used by other groups.
In treating for color in water, alum and ferric coagu-lation is often effective. It removes apparent color andoften much of the true color. Oxidation of color causingcompounds to a noncolored version is sometimes effective.Activated carbon treatment may adsorb some of the organ-ics causing color. For apparent color problems, filtrationis usually effective in trapping the colored particles.
14.4.18 ODOR ANALYSIS OF WATER
Odor is expected in wastewater. Any water containingwaste, especially human waste, has a detectable (expected)odor associated with it. Odor in a raw water source (forpotable water) is caused by a number of constituents. Forexample, chemicals that may come from municipal andindustrial waste discharges, or natural sources such asdecomposing vegetable matter or microbial activity maycause odor problems. Odor affects the acceptability ofdrinking water, the aesthetics of recreation water, and thetaste of aquatic foodstuffs.
The human nose can accurately detect a wide varietyof smells, which is the best odor-detection and testingdevice presently available. To measure odor, collect a sam-ple in a large-mouthed jar. After waving off the air abovethe water sample with you hand, smell the sample. Usethe list of odors provided in Table 14.11 — a system ofqualitative description that helps monitors describe andrecord detected odors to describe the smells. Record allobservations. (see Standard Methods).
In treating for odor in water, removal depends uponthe source of the odor. Some organic substances that causeodor can be removed with powdered activated carbon. Ifthe odor is of gaseous origin, scrubbing (aeration) mayremove it. Some odor-causing chemicals can be oxidizedto odorless chemicals with chlorine, potassium perman-ganate, or other oxidizers. Settling may remove somematerial that when later dissolved in the water may havepotential odor-causing capacity.
Unfortunately, the test for odor in water is subjective.There is no scientific means of measurement and othermethods are not very accurate.
In testing odor in water intended for potable wateruse, a sample is generally heated to 60°C. Odor isobserved and recorded. A threshold odor number (TON)is assigned. TON is found by using the following equation:
(14.14)
14.4.19 CHLORINE RESIDUAL TESTING/ANALYSIS
Chlorination is the most widely used means of disinfectingwater in the U.S. When chlorine gas is dissolved into(pure) water, if forms hypochlorous acid, hypochlorite ion,and hydrogen chloride (hydrochloric acid).
The total concentration of HOCl and OCl ion is knownas free chlorine residual.
Currently, CFR cites seven approved methods fordetermination of TRC:
1. N,N diethyl-p-phenylenediamine- (DPD) spec-trophotometric
2. Titrimetric — amperometric direct3. Titrimetric — iodometric direct4. Titrimetric — iodometric back
A. Starch iodine end point — iodine titrantB. Starch iodine end point — iodate titrant
5. Amperometric end point6. DPD-ferrous ammonium sulfate (FAS) titration7. Chlorine electrode
All of these test procedures are approved methods and,unless prohibited by the plant’s NPDES discharge permit,can be used for effluent testing. Based on current mostpopular method usage in the U.S., discussion is limited tothe following:
TABLE 14.11Descriptions of Odors
Nature of Odor Description Examples
Aromatic Spicy Camphor; cloves; lavenderBalsamic Flowery Geranium; violet; vanilla
Industrial wastes or treatments chlorinous
Chlorine
Hydrocarbon Oil refinery wastesMedicinal Phenol and iodineSulfur Hydrogen sulfide
Disagreeable Fishy Dead algaePigpen AlgaeSeptic Stale sewage
Earthy Damp earthPeaty Peat
Grassy Crushed grassMusty Decomposing straw
Moldy Damp cellarVegetable Root vegetables
Source: From American Public Health Association, Standard Methodsfor the Examination of Water and Wastewater, 20th ed., Washington,D.C., 1998.
TONT
Lowest Sample Volume w= otal Volume of Water Sample
ith Odor
© 2003 by CRC Press LLC

432 Handbook of Water and Wastewater Treatment Plant Operations
1. DPD-spectrophotometric2. DPD-FAS titration3. Titrimetric — amperometric direct
Note: Treatment facilities required to meet nondetect-able TRC limitations must use one of the testmethods specified in the plant’s NPDES dis-charge permit.
For information on any of the other approved methods,refer to the appropriate reference cited in the CFR.
14.4.19.1 DPD-Spectrophotometric
DPD reacts with chlorine to form a red color. The intensityof the color is directly proportional to the amount ofchlorine present. This color intensity is measured using acolorimeter or spectrophotometer. This meter reading canbe converted to a chlorine concentration using a graphdeveloped by measuring the color intensity produced bysolutions with precisely known concentrations of chlorine.In some cases, spectrophotometer or colorimeters areequipped with scales that display chlorine concentrationdirectly. In these cases, there is no requirement to preparea standard reference curve.
If the direct reading colorimeter is not used, chemicalsthat are required to be used include:
1. Potassium dichromate solution 0.100N2. Potassium iodine crystals3. Standard FAS solution 0.00282 N4. Concentrated phosphoric acid5. Sulfuric acid solution (1 + 5)6. Barium diphenylamine sulfonate 0.1%
If an indicator is not used, DPD indicator and phos-phate buffer (DPD prepared indicator — buffer + indicatortogether) are required.
In conducting the test, one of the following is required:
1. Direct readout colorimeter designed to meet thetest specifications
2. Spectrophotometer (wavelength of 515 nm andlight path of at least 1 cm)
3. Filter photometer with a filter having maximumtransmission in the wavelength range of 490 to520 nm and a light path of at least 1 cm
In addition, for direct readout colorimeter procedures,a sample test vial is required. When the direct readoutcolorimeter procedure is not used, the equipment requiredincludes:
1. 250 mL Erlenmeyer flask2. 10 mL measuring pipettes3. 15 mL test tubes
4. 1 mL pipettes (graduated to 0.1 mL)5. Sample cuvettes with 1 cm light path
Note: A cuvette is a small, often tubular laboratoryvessel that is usually made of glass.
14.4.19.1.1 Procedure
Note: For direct readout colorimeters, follow the pro-cedure supplied by the manufacturer.
The standard procedure for using spectrophotometer orcolorimeter is listed below:
1. Prepare a standard curve for TRC concentra-tions from 0.05 to 4.0 mg/L — chlorine versuspercent transmittance.
Note: Instructions on how to prepare the TRC con-centration curve or a standard curve is normallyincluded in the spectrophotometer manufac-turer’s operating instructions.
2. Calibrate the colorimeter in accordance with themanufacturer’s instructions using a laboratory-grade water blank.
3. Add one prepared indicator packet (or tablet)of the appropriate size to match sample volumeto a clean test tube or cuvette or one of thefollowing:A. Pipette 0.5 mL phosphate buffer solution.B. Pipette 0.5 mL DPD indicator solution.C. 0.1-g potassium iodide crystals to a clean
tube or cuvette.4. Add 10 mL of sample to the cuvette.5. Stopper the cuvette. Swirl to mix the contents
well.6. Let stand for 2 min.7. Verify the wavelength of the spectrophotometer
or colorimeter. Check and set the 0% T usingthe laboratory-grade water blank.
8. Place the cuvette in instrument, read %T, andrecord reading.
9. Determine the milligrams per liter of TRC fromstandard curve.
Note: Calculations are not required in this testbecause the milligrams per liter of TRC is readdirectly from the meter or from the graph.
14.4.19.2 DPD-FAS Titration
The amount of FAS solution required to just remove thered color from a TRC sample that has been treated withDPD indicator can be used to determine the concentrationof chlorine in the sample. This is known as a titrimetrictest procedure.
© 2003 by CRC Press LLC
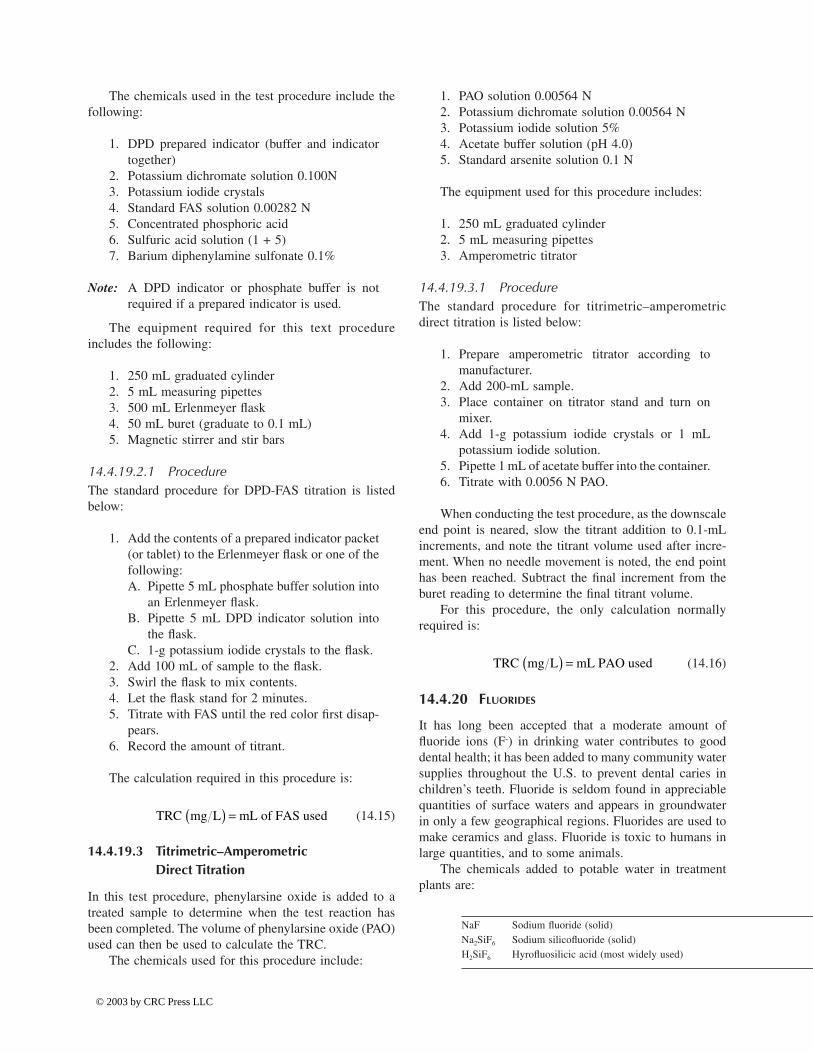
Biomonitoring, Monitoring, Sampling, and Testing
433
The chemicals used in the test procedure include thefollowing:
1. DPD prepared indicator (buffer and indicatortogether)
2. Potassium dichromate solution 0.100N3. Potassium iodide crystals4. Standard FAS solution 0.00282 N5. Concentrated phosphoric acid6. Sulfuric acid solution (1 + 5)7. Barium diphenylamine sulfonate 0.1%
Note: A DPD indicator or phosphate buffer is notrequired if a prepared indicator is used.
The equipment required for this text procedureincludes the following:
1. 250 mL graduated cylinder2. 5 mL measuring pipettes3. 500 mL Erlenmeyer flask4. 50 mL buret (graduate to 0.1 mL)5. Magnetic stirrer and stir bars
14.4.19.2.1 ProcedureThe standard procedure for DPD-FAS titration is listedbelow:
1. Add the contents of a prepared indicator packet(or tablet) to the Erlenmeyer flask or one of thefollowing:A. Pipette 5 mL phosphate buffer solution into
an Erlenmeyer flask.B. Pipette 5 mL DPD indicator solution into
the flask.C. 1-g potassium iodide crystals to the flask.
2. Add 100 mL of sample to the flask.3. Swirl the flask to mix contents.4. Let the flask stand for 2 minutes.5. Titrate with FAS until the red color first disap-
pears.6. Record the amount of titrant.
The calculation required in this procedure is:
(14.15)
14.4.19.3 Titrimetric–Amperometric Direct Titration
In this test procedure, phenylarsine oxide is added to atreated sample to determine when the test reaction hasbeen completed. The volume of phenylarsine oxide (PAO)used can then be used to calculate the TRC.
The chemicals used for this procedure include:
1. PAO solution 0.00564 N2. Potassium dichromate solution 0.00564 N3. Potassium iodide solution 5%4. Acetate buffer solution (pH 4.0)5. Standard arsenite solution 0.1 N
The equipment used for this procedure includes:
1. 250 mL graduated cylinder2. 5 mL measuring pipettes3. Amperometric titrator
14.4.19.3.1 ProcedureThe standard procedure for titrimetric–amperometricdirect titration is listed below:
1. Prepare amperometric titrator according tomanufacturer.
2. Add 200-mL sample.3. Place container on titrator stand and turn on
mixer.4. Add 1-g potassium iodide crystals or 1 mL
potassium iodide solution.5. Pipette 1 mL of acetate buffer into the container.6. Titrate with 0.0056 N PAO.
When conducting the test procedure, as the downscaleend point is neared, slow the titrant addition to 0.1-mLincrements, and note the titrant volume used after incre-ment. When no needle movement is noted, the end pointhas been reached. Subtract the final increment from theburet reading to determine the final titrant volume.
For this procedure, the only calculation normallyrequired is:
(14.16)
14.4.20 FLUORIDES
It has long been accepted that a moderate amount offluoride ions (F-) in drinking water contributes to gooddental health; it has been added to many community watersupplies throughout the U.S. to prevent dental caries inchildren’s teeth. Fluoride is seldom found in appreciablequantities of surface waters and appears in groundwaterin only a few geographical regions. Fluorides are used tomake ceramics and glass. Fluoride is toxic to humans inlarge quantities, and to some animals.
The chemicals added to potable water in treatmentplants are:
TRC mg L mL( ) = of FAS used
NaF Sodium fluoride (solid)Na2SiF6 Sodium silicofluoride (solid)H2SiF6 Hyrofluosilicic acid (most widely used)
TRC mg L( ) = mL PAO used
© 2003 by CRC Press LLC
434 Handbook of Water and Wastewater Treatment Plant Operations
Analysis of the fluoride content of water can be per-formed using the colorimetric method. In this test, fluorideion reacts with zirconium ion and produces zirconiumfluoride, which bleaches an organic red dye in direct pro-portion to its concentration. This can be compared tostandards and read colorimetrically.
14.5 CHAPTER REVIEW QUESTIONS AND PROBLEMS
14.1. What equipment, apparatus, or instrumenta-tion is required to perform the total solidstest?
14.2. How soon after the sample is collected mustthe pH be tested?
14.3. What is a grab sample?14.4. When is it necessary to use a grab sample?14.5. What is a composite sample?14.6. List three sample rules for sample collection.14.7. What is the acceptable preservation method
for suspended solids samples?14.8 Most solids test methods are based upon
changes in weight. What can cause changesin weight during the testing procedure?
REFERENCES
1. Spellman, F.R. and Drinan, J.E., Stream Ecology & Self-Purification: An Introduction, 2nd ed., Technomic Publ.,Lancaster, PA, 2001, p. 149.
2. Adapted from Biomonitoring, Vermont Dept. of Envi-ronmental Conservation — Water Quality Division,http://www.anr.state.vt.us/dec/waterq/headmap.map.Accessed October 28, 2002.
3. Bly, T.D. and Smith, G.F., Biomonitoring Our Streams:What’s It all About?, U.S. Geological Survey, Nashville,TN, 1994, p. 23.
4. Camann, M., Freshwater Aquatic Invertebrates: Biomon-itoring, http://www.humboldt.edu, 1996, pp. 1–4.
5. Huff, W.R., Biological indices define water quality stan-dard, Water Environ. and Technol., 5, 21–22, 1993.
6. O’Toole, C., Ed., The Encyclopedia of Insects, Facts onFile, Inc., New York, 1986, p. 134.
7. U.S. Environmental Protection Agency, MonitoringWater Quality: Intensive Stream Bioassay, Washington,D.C., Aug. 18, 2000.
8. Tchobanoglous, G. and Schroeder, E.D., Water Quality,Addison-Wesley, Reading, MA, 1985, p. 53.
9. Kittrell, F.W., A Practical Guide to Water Quality Stud-ies of Streams, U.S. Department of Interior, Washington,D.C., 1969, p. 23.
10. Velz, C.J., Applied Stream Sanitation, Wiley-Inter-science, New York, 1970, pp. 313–315.
11. Barbour, M.T., Gerritsen, J., Snyder, B.D., and Stibling,J.B., Revision to Rapid Bioassessment Protocols for Usein Streams and Rivers, Periphyton, Benthic Macroinver-tebrates, and Fish, EPA 841-D-97-002, U.S. Environ-mental Protection Agency, Washington, D.C., 1997,pp. 1–29.
12. Botkin, D.B., Discordant Harmonies, Oxford UniversityPress, New York, 1990, p. 12; Pimm, S.L., The Balanceof Nature: Ecological Issues in the Conservation of Spe-cies and Communities, University of Chicago Press,Chicago, 1991, p. 32; Huston, M.A., Biological Diver-sity: The Coexistence of Species on Changing Land-scapes, Cambridge University Press, New York, 1994, p.56; Hillborn, R. and Mangel, M., The Ecological Detec-tive: Confronting Models with Data, Princeton Univer-sity Press, Princeton, NJ, 1997, p. 76.
13. American Water Works Association, Water Treatment,2nd ed., Denver, 1995.
© 2003 by CRC Press LLC
![Monit - utility for monitor · 2020. 8. 13. · NAME Monit - utility for monitoring services on a Unix system SYNOPSIS monit [options] {arguments} DESCRIPTION monit is a utility for](https://img.dokumen.tips/doc/110x75/60b322b03f37fa393d044aa4/monit-utility-for-monitor-2020-8-13-name-monit-utility-for-monitoring-services.jpg)