Embed Size (px)
Citation preview

J. Fluid Mech. (2011), vol. 677, pp. 342–382. c© Cambridge University Press 2011
doi:10.1017/jfm.2011.90
Vortex-induced vibrations of a long flexiblecylinder in shear flow
REMI BOURGUET1†, GEORGE E. KARNIADAKIS2
AND MICHAEL S. TRIANTAFYLLOU1
1Department of Mechanical Engineering, Massachusetts Institute of Technology, Cambridge,MA 02139, USA
2Division of Applied Mathematics, Brown University, Providence, RI 02912, USA
(Received 18 June 2010; revised 11 December 2010; accepted 15 February 2011;
first published online 27 April 2011)
We investigate the in-line and cross-flow vortex-induced vibrations of a long cylindricaltensioned beam, with length to diameter ratio L/D = 200, placed within a linearlysheared oncoming flow, using three-dimensional direct numerical simulation. Thestudy is conducted at three Reynolds numbers, from 110 to 1100 based on maximumvelocity, so as to include the transition to turbulence in the wake. The selectedtension and bending stiffness lead to high-wavenumber vibrations, similar to thoseencountered in long ocean structures. The resulting vortex-induced vibrations consistof a mixture of standing and travelling wave patterns in both the in-line andcross-flow directions; the travelling wave component is preferentially oriented fromhigh to low velocity regions. The in-line and cross-flow vibrations have a frequencyratio approximately equal to 2. Lock-in, the phenomenon of self-excited vibrationsaccompanied by synchronization between the vortex shedding and cross-flow vibrationfrequencies, occurs in the high-velocity region, extending across 30 % or more ofthe beam length. The occurrence of lock-in disrupts the spanwise regularity of thecellular patterns observed in the wake of stationary cylinders in shear flow. Thewake exhibits an oblique vortex shedding pattern, inclined in the direction ofthe travelling wave component of the cylinder vibrations. Vortex splittings occurbetween spanwise cells of constant vortex shedding frequency. The flow excites thecylinder under the lock-in condition with a preferential in-line versus cross-flowmotion phase difference corresponding to counter-clockwise, figure-eight orbits; butit damps cylinder vibrations in the non-lock-in region. Both mono-frequency andmulti-frequency responses may be excited. In the case of multi-frequency responseand within the lock-in region, the wake can lock in to different frequencies at variousspanwise locations; however, lock-in is a locally mono-frequency event, and hence theflow supplies energy to the structure mainly at the local lock-in frequency.
Key words: flow–structure interactions, vortex shedding, vortex streets
1. IntroductionVortex-induced vibrations (VIV) of long flexible structures with bluff cross-sections
are encountered in a great variety of physical problems, from the aeolian vibrationsof hanging strings in air, to the vibrations of cables and risers placed within ocean
† Email address for correspondence: [email protected]

Vortex-induced vibrations of a long flexible cylinder in shear flow 343
currents. The possible fatigue damage resulting from VIV on these structures and thesignificantly increased drag forces require a careful calculation and prediction of theresponses, and often the use of vortex-suppressing devices.
The simpler problem of a finite-span circular rigid cylinder, placed within a uniformflow, allowed to vibrate in the cross-flow direction only, has become the canonicalproblem of flow–structure interactions. The dual problems of a flexibly mountedcylinder free to vibrate in a cross-flow, and a cylinder forced to move harmonicallyat a prescribed frequency and amplitude, have shed light on the principal VIVmechanisms (Bearman 1984; Sarpkaya 2004; Williamson & Govardhan 2004). Large-amplitude, self-excited oscillations of flexibly mounted cylinders are observed when thevortex shedding frequency is synchronized with the structural cross-flow vibration,a condition referred to as ‘lock-in’. Lock-in can occur over a range of oncomingflow velocities, and the vortex shedding frequency can be driven relatively far fromthe Strouhal frequency. The analysis of the vortex shedding pattern in the wake ofoscillating rigid cylinders revealed the existence of different shedding modes associatedwith distinct regions of the synchronized regime (Williamson & Roshko 1988; Jauvtis& Williamson 2004; Dahl et al. 2007). These different vortex shedding modes havebeen related to significant changes of the fluid forces exerted on the body.
For a cylinder allowed to move in the in-line and cross-flow directions, significantdifferences were noted, because the shedding patterns are altered, and hence theforces and the overall response of the structure differ substantially relative to acylinder vibrating in the cross-flow direction only (Sarpkaya 1995; Jeon & Gharib2001; Jauvtis & Williamson 2004). In particular, the phase difference between in-lineand cross-flow vibrations can have a strong influence on the regularity of the cylindertrajectory as well as on the possible occurrence of large high harmonics in the liftforce (Jauvtis & Williamson 2004; Dahl et al. 2007, 2010).
For stationary long rigid cylinders, which either have a constant diameter and areplaced in a sheared flow, or have a varying diameter and are placed in a uniform flow,the wake forms a cellular pattern composed of spanwise regions each with a differentvortex shedding frequency (e.g. Gaster 1969, 1971; Griffin 1985; Peltzer & Rooney1985; Noack, Ohle & Eckelmann 1991; Piccirillo & Van Atta 1993; Kappler et al.2005). This cellular pattern is accompanied by an oblique orientation of the vortexrows, and vortex splittings between cells, similar to the vortex dislocations observedby Williamson (1992).
The investigation of the wake of rigid cylinders oscillating in the cross-flow directionin shear flow revealed the occurrence of lock-in on large spanwise cells; the cell lengthincreased with the amplitude of vibration (Stansby 1976). For long tapered and pivotedcylinders in uniform flows, Techet, Hover & Triantafyllou (1998) and Flemming &Williamson (2005) reported the formation of a hybrid shedding mode composed oftwo distinct vortex shedding modes connected with a vortex split.
There are considerably fewer publications for the case of long flexible cylinders.Brika & Laneville (1993) studied a flexible cylinder in uniform flow, vibrating in itsfirst mode in the cross-flow direction. They showed the existence of different vortexshedding modes at lock-in, similar to those observed behind rigid cylinders. Peltzer& Rooney (1985) studied the wake of a cable forced to oscillate in the cross-flowdirection within a linearly sheared flow. As in the case of an oscillating rigid cylinder(Stansby 1976), increasing the amplitude of vibration induces a larger spanwise lock-inregion.
Field and laboratory experiments on long flexible cylinders in sheared currentshighlighted the mixed nature of the vibrations, involving high structural wavenumbers

344 R. Bourguet, G. E. Karniadakis and M. S. Triantafyllou
and, often, multiple frequencies of response (e.g. Trim et al. 2005; Lie & Kaasen 2006;Jaiswal & Vandiver 2007; Vandiver, Jaiswal & Jhingran 2009). These studies havemainly focused on the quantification of the structure response but did not provideinformation concerning the localization and extent of the lock-in region or regardingthe vortical patterns in the wake. Chaplin et al. (2005) and Huera-Huarte & Bearman(2009a) performed laboratory experiments on flexible cylinders in stepped currents.Chaplin et al. (2005) reported a range of excited wavenumbers in the in-line and cross-flow directions. For a flexible cylinder responding in its first structural mode in boththe in-line and cross-flow directions, Huera-Huarte & Bearman (2009a ,b) observeda well-defined synchronization between in-line and cross-flow motions at lock-inand reported much larger drag coefficients than those in the case of a stationarycylinder. Flow visualizations showed the occurrence of two distinct vortex sheddingregimes depending on the vibration amplitude, as observed previously by Techet et al.(1998) and Flemming & Williamson (2005) for rigid cylinders under varying spanwiseconditions.
Few numerical studies have been carried out on the VIV of flexible cylinders.Facchinetti, de Langre & Biolley (2004), Mathelin & de Langre (2005) and Violette,de Langre & Szydlowski (2007) modelled the fluid excitation by means of an empiricalrepresentation of the flow through a distribution of wake oscillators. They reportedgood agreement of this model with direct numerical simulation predictions. By meansof direct numerical simulations, Newman & Karniadakis (1997) and Evangelinos &Karniadakis (1999) examined the VIV of a cylinder of aspect ratio 4π in uniform flow,at Reynolds numbers 100, 200 and 1000. These works provided a detailed analysis ofthe wake pattern and revealed the influence of the nature of the vibration (standingor travelling wave) on the vortical structure development. In these studies, lock-in wasobserved along the entire span. The influence of the Reynolds number on vibrationamplitudes has been emphasized by Evangelinos & Karniadakis (1999) who showedthat cross-flow motions of approximately one cylinder diameter occur at a Reynoldsnumber of 1000, compared to 0.5–0.6 diameters at a Reynolds number of 100.Newman & Karniadakis (1997) also considered a flexible cylinder of aspect ratio 100,allowed to oscillate in the cross-flow direction, under the effect of a shear oncomingflow with a maximum Reynolds number of 100. They reported a mixed standing–travelling wave response. The case of long flexible cylinders of aspect ratio larger than500, allowed to oscillate in the cross-flow direction only, and submitted to shear flows,has been investigated by Lucor, Imas & Karniadakis (2001) and Lucor, Mukundan& Triantafyllou (2006) at a Reynolds number of 1000 by means of low-resolutiondirect numerical simulations. In a linear shear flow, Lucor et al. (2001) reported aregion of lock-in located in the high-velocity zone. Lucor et al. (2006) compared thecross-flow vibrations induced by linear and exponential shear flows and identified, inparticular, a larger vibration bandwidth in the latter case. No analysis concerning thewake pattern and fluid–structure energy exchange was provided in this work.
Hence, when we consider long structures in shear flows, it is unclear whetherthe hydrodynamic data and even the insight from short-span rigid cylinders areapplicable, and what new phenomena may appear. For this reason, in the presentwork we study the VIV of a flexible tensioned beam of aspect ratio 200, pinned atboth ends and free to move in both the in-line and cross-flow directions under theeffect of a linear shear flow. We employ direct numerical simulation in the rangeof Reynolds numbers of 110–1100. The structural parameters are chosen such thathigh-wavenumber vibrations similar to those observed in the laboratory and fieldexperiments of Trim et al. (2005) and Vandiver et al. (2009), for example, are excited.

Vortex-induced vibrations of a long flexible cylinder in shear flow 345
A joint analysis of the cylinder response and the vortical wake patterns is presentedon the basis of high-resolution simulations.
The paper is organized as follows. The physical fluid–structure model and thenumerical method are presented in § 2. The cylinder vibrations are examined in § 3.The mechanisms of the coupled fluid–structure system are investigated in § 4. Themain findings of the present work are summarized in § 5.
2. Direct numerical simulation of the flow past a flexible cylinderThe three-dimensional flow past a flexible cylinder placed in sheared oncoming
cross-flow is predicted using the direct numerical simulation of the incompressibleNavier–Stokes equations. The cylinder has circular cross-section and is submitted toan oncoming flow which is everywhere parallel to the global x-axis and is linearlysheared along the global z-axis.
In the following, all physical variables are non-dimensionalized using the cylinderdiameter D and the maximum inflow velocity U , which occurs at z = 0. The non-dimensional time variable is denoted by t . The Reynolds number (Re) is based onD and the inflow velocity. The flow shear parameter is defined as β =(1/Ua)∂Ul/∂z,where Ul and Ua are the local and span-averaged non-dimensional oncoming flowvelocities. The ratio between the maximum and the minimum inflow velocities isequal to 3.67 which leads to a value of the shear parameter (β = 0.006) comparable tothe experimental work of Peltzer & Rooney (1985) concerning stationary and flexiblecylinders in a linear shear flow. Three Reynolds number ranges are considered:Re∈ [30, 110], Re∈ [90, 330] and Re∈ [300, 1100]; the minimum and maximum Revalues are based on the minimum and maximum inflow velocities, respectively, whilethe three corresponding simulations are denoted by the maximum Reynolds numberRem (Rem ∈ {110, 330, 1100}).
The cylinder structure is modelled as an extensible tensioned beam; it has an aspectratio of L/D = 200, where L is the cylinder length in its equilibrium position inquiescent flow, it is pinned at both ends, while it is free to move in both the in-line(x) and cross-flow (y) directions. The cylinder mass ratio is defined as m = ρc/ρf D2,where ρc is the cylinder mass per unit length, and ρf is the fluid density (Newman &Karniadakis 1997). The actual ratio between the mass of the cylinder and the massof the displaced fluid is equal to 4m/π. For the simulations herein, m is set equal to 6.The tension, bending stiffness and damping of the structure, designated by T , EI andK , respectively, are kept constant for the three simulations. The in-line and cross-flowdisplacements of the cylinder are denoted by ζx and ζy , respectively. The total dragand lift coefficients, including both pressure and viscous contributions, are denoted byCx and Cy , respectively. The influence of gravity is neglected. The structural dynamicsare governed by a tensioned beam model, expressed as follows in non-dimensionalformulation:
∂2ζ
δt2− ω2
c
∂2ζ
δz2+ ω2
b
∂4ζ
δz4+
K
m
∂ζ
δt=
1
2
Cm
, (2.1)
where ζ = [ζx, ζy]T and C = [Cx, Cy]
T. ωc and ωb are the cable and beam phasevelocities, defined by ω2
c = T/m and ω2b = EI/m, respectively. The structural damping
is set equal to zero (K =0) to allow maximum amplitude oscillations to develop.A tensioned beam is considered in this study with ωc = 4.55 and ωb = 9.09. Asshown in § 3, these structural parameters lead to vibrations involving high structuralwavenumbers, which are representative of configurations encountered in the contextof ocean engineering.

346 R. Bourguet, G. E. Karniadakis and M. S. Triantafyllou
The coupled fluid–structure system is solved by the parallelized code Nektar, basedon the spectral/hp element method (Karniadakis & Sherwin 1999). The versionof the code employs a hybrid scheme with Fourier expansion in the spanwise(z) direction and Jacobi–Galerkin formulation in the (x, y) planes. A boundary-fitted coordinate formulation is used to take into account the cylinder unsteadydeformation. Details regarding time integration schemes and validation studies of thenumerical method and parameters have been reported in Newman & Karniadakis(1997) and Evangelinos & Karniadakis (1999), which addressed similar physicalconfigurations. The computational domain extends 50D downstream and 20D infront, above and below the cylinder. A two-dimensional grid of 2175 elements withpolynomial order p = 6 or p = 7, depending on the Reynolds number, is used in the(x, y) planes. In the z-direction, 512 planes (256 complex Fourier modes) are used forthe Rem =110 case, and 1024 planes (512 complex Fourier modes) in the Rem =330and Rem = 1100 cases. This leads to a spatial resolution similar to that in the study ofEvangelinos & Karniadakis (1999) for a cylinder of aspect ratio L/D =4π constrainedto oscillate in the cross-flow direction, at Re = 1000. The boundary conditions havebeen implemented as described in Newman & Karniadakis (1997). A no-slip conditionis applied on the cylinder surface. Fourier expansion implies spanwise periodicity ofthe flow and structural properties, and of the imposed shear velocity profile. Thetechnique first used by Lucor (2004) is adopted here, wherein the inflow velocityprofile is adjusted to enforce periodicity in a buffer region. The details and numericaltests concerning the buffer region are reported in Appendix A. The buffer region isnot presented in the following. Information concerning the computational resourcesused is given in Appendix B.
3. In-line and cross-flow vibrations in shear flowThe cylinder VIV are quantified and analysed in this section. The investigation of
the nature of structural response in shear flow is a first step leading to the identificationof the principal mechanisms of the coupled fluid–structure system. An overview ofthe main features of the structural response is presented in § 3.1. A spectral analysisis carried out in § 3.2, with an emphasis on responses involving multiple frequencies.Finally, the synchronization between in-line and cross-flow motions is investigatedin § 3.3.
3.1. Space–time evolutions and statistics
The time-averaged in-line displacement of the cylinder is presented in figure 1(a)for the three different Reynolds numbers. The shear of the oncoming flow inducesan asymmetric bending of the structure with respect to the midspan point. Thisis also noted in experimental studies concerning a cylinder submitted to a steppedcurrent (Chaplin et al. 2005). The maximum in-line displacement occurs at 40 % ofthe span and corresponds approximately to 6 % of the cylinder length. The Reynoldsnumber considered in the simulation has only a small influence on the in-line steadydisplacement (3 % of relative difference on the maximum displacement between theRem = 110 and Rem = 1100 cases). The effect of structural in-line bending on the flowpatterns is discussed in §§ 4.1 and 4.2. The spanwise evolution of the time-averageddrag coefficient Cd is plotted in figure 1(b). In these plots, the drag coefficientis normalized by the local inflow velocity. The time-averaged drag coefficient isinfluenced by structural motion, in particular by the cross-flow vibration pattern.When Rem increases from 110 to 1100, a slight increase of the Cd local maxima can

Vortex-induced vibrations of a long flexible cylinder in shear flow 347
6 7 8 9 10 11 12 130
20
40
60
80
100
120
140
160
180
ζx
zRem = 110Rem = 330Rem = 1100
(a)
1 1.2 1.4 1.6 1.8 2.0 2.2 2.40
20
40
60
80
100
120
140
160
180
Cd
(b)
Figure 1. Time-averaged (a) in-line displacement and (b) drag coefficient,along the cylinder span.
be noticed in the region of maximum in-line displacement. Forces and fluid–structureenergy transfer are investigated in § 4.3.
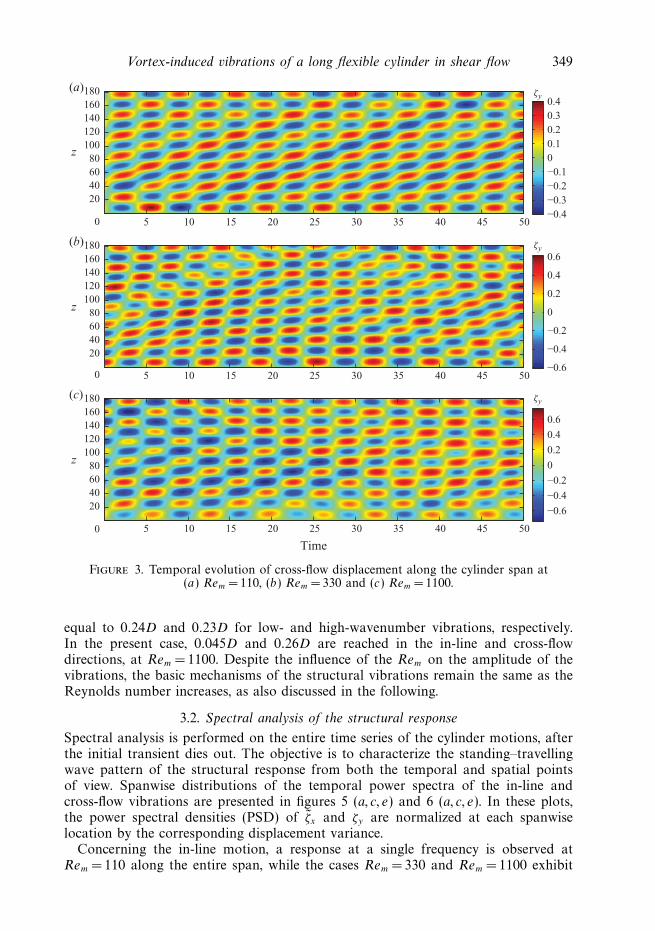
Selected time series of in-line and cross-flow motions, non-dimensionalized by D,are plotted along the cylinder span in figures 2 and 3. In these plots and in thefollowing, only the deviations of the in-line motion from its mean value, ζx , areshown.
A first review of the results raises several points: in both directions, the structuralresponse is a combination of standing and travelling wave patterns as previouslyreported by Lucor et al. (2006) in the case of a long flexible cylinder constrainedto oscillate in the cross-flow direction. The travelling character of these waves ispreferentially oriented from high- to low-velocity regions (increasing z) and is morepronounced in the in-line direction. The structural displacements are not strictlyperiodic and transients can occur that perturb the spatio-temporal pattern of theresponse. Concerning the in-line motion, standing wave patterns strongly modulatethe travelling waves near the ends, especially in the high-velocity region, for 0<z < 20at Rem =110, and for 0 <z < 40 at Rem = 330. Beyond these regions, distinct travellingwaves can be observed. cross-flow responses present more homogeneously mixedstanding and travelling wave patterns along the span. The case Rem = 1100 exhibitsless pronounced travelling wave patterns in both directions. These points are furtherinvestigated quantitatively in the following.
Maximum and root mean square (r.m.s.) values of the structural responseamplitudes along the cylinder span are presented in figure 4. Both maximum and r.m.s.values reflect the above-mentioned standing–travelling wave patterns. The standingcharacter of the responses leads to the formation of cells along the span correspondingto alternating ‘nodes’ (minima of the response envelope) and ‘anti-nodes’ (maximaof the response envelope). Despite the shear flow, the displacements associated with‘anti-nodes’ remain relatively constant along the cylinder span. This partitioning ofthe responses in spanwise cells is modulated by the superimposed travelling wavepatterns. In particular, it appears that the r.m.s. values of displacements associatedwith ‘nodes’ are different from zero which indicates that these ‘nodes’ are moving

348 R. Bourguet, G. E. Karniadakis and M. S. Triantafyllou
z
z
z
5 10 15 20 25 30 35 40 45 500
20406080
100120140160180 ζx
ζx
ζx
−0.010
−0.005
0
0.005
0.010(a)
5 10 15 20 25 30 35 40 45 500
20406080
100120140160180
−0.02
−0.01
0
0.01
0.02
(b)
Time5 10 15 20 25 30 35 40 45 500
20406080
100120140160180
−0.10
−0.05
0
0.05
0.10
(c)
Figure 2. Temporal evolution of in-line displacement fluctuation along the cylinder span at(a) Rem = 110, (b) Rem = 330 and (c) Rem =1100.
due to the presence of travelling wave components. The dominant character of thetravelling wave pattern on in-line displacements almost suppresses these standingwave cells on most of the cylinder span at Rem = 110 and Rem = 330.
The effect of the Reynolds number on response amplitudes had previously beenreported by Evangelinos & Karniadakis (1999), concerning cross-flow vibrations inuniform flow. It can be observed that the Rem influence appears more pronouncedin the in-line direction and that the ratio between the cross-flow and the in-linemaximum oscillation amplitudes decreases as Rem increases. The Reynolds numbereffect on the structural response can partly be related to modifications occurring in thewake pattern as shown in § 4.2. The amplitudes of vibration observed at Rem = 1100are similar to those observed in the experimental measurements carried out withflexible cylinders at higher Reynolds numbers (Chaplin et al. 2005; Trim et al. 2005;Lie & Kaasen 2006; Huera-Huarte & Bearman 2009a). In a linear shear flow and forRem ∈ [4800, 34 200], Lie & Kaasen (2006) reported span-averaged r.m.s. values of thedisplacement in the range 0.05D–0.08D in the in-line direction and about 0.25D inthe cross-flow direction. In the case of flexible cylinders constrained to oscillate in thecross-flow direction in a linear shear flow at Rem = 1000, Lucor et al. (2001) and Lucoret al. (2006) reported span-averaged r.m.s. values of the displacement approximately
Vortex-induced vibrations of a long flexible cylinder in shear flow 349
z
z
z
5 10 15 20 25 30 35 40 45 500
20406080
100120140160180 ζy
ζy
ζy
−0.4−0.3−0.2−0.100.10.20.30.4
(a)
5 10 15 20 25 30 35 40 45 500
20406080
100120140160180
−0.6
−0.4
−0.2
0
0.2
0.4
0.6
(b)
Time
5 10 15 20 25 30 35 40 45 500
20406080
100120140160180
−0.6
−0.4
−0.2
0
0.2
0.4
0.6
(c)
Figure 3. Temporal evolution of cross-flow displacement along the cylinder span at(a) Rem = 110, (b) Rem = 330 and (c) Rem = 1100.
equal to 0.24D and 0.23D for low- and high-wavenumber vibrations, respectively.In the present case, 0.045D and 0.26D are reached in the in-line and cross-flowdirections, at Rem = 1100. Despite the influence of the Rem on the amplitude of thevibrations, the basic mechanisms of the structural vibrations remain the same as theReynolds number increases, as also discussed in the following.
3.2. Spectral analysis of the structural response
Spectral analysis is performed on the entire time series of the cylinder motions, afterthe initial transient dies out. The objective is to characterize the standing–travellingwave pattern of the structural response from both the temporal and spatial pointsof view. Spanwise distributions of the temporal power spectra of the in-line andcross-flow vibrations are presented in figures 5 (a, c, e) and 6 (a, c, e). In these plots,the power spectral densities (PSD) of ζx and ζy are normalized at each spanwiselocation by the corresponding displacement variance.
Concerning the in-line motion, a response at a single frequency is observed atRem = 110 along the entire span, while the cases Rem = 330 and Rem = 1100 exhibit

350 R. Bourguet, G. E. Karniadakis and M. S. Triantafyllou
0.05 0.10 0.15 0.200
20
40
60
80
100
120
140
160
180
(ζx)max~
(ζy)max
zRem = 110Rem = 330Rem = 1100
(a)
0.1 0.2 0.3 0.4 0.5 0.6 0.7 0.80
20
40
60
80
100
120
140
160
180(b)
0.01 0.02 0.03 0.04 0.05 0.060
20
40
60
80
100
120
140
160
180
(ζy)rms
z
(c)
0.05 0.10 0.15 0.20 0.25 0.30 0.35 0.400
20
40
60
80
100
120
140
160
180(d )
(ζx)rms~
Figure 4. (a, b) Maximum and (c, d ) r.m.s. values of (a, c) in-line displacement fluctuationand (b, d ) cross-flow displacement along the cylinder span.
responses at several frequencies. These two types of responses are referred to herein as‘mono-frequency’ and ‘multi-frequency’, respectively. The possible causes of a switchbetween mono- and multi-frequency responses, as Rem is changed, are currently underinvestigation.
At Rem =330, four response frequencies of relatively similar amplitude arecompeting, while secondary peaks are also present. It can be observed that the peaksare clearly defined and distinct from each other, despite a narrow-band vibration,in the range of [0.24, 0.36]. The corresponding frequencies present spectral peaksalong the entire span. This is also the case at Rem = 1100 where a single spectralpeak dominates among several response peaks. In all cases, the spanwise pattern ofPSD exhibits well-defined cells that are related to the excitation of specific structuralwavelengths, as shown in the following. The standing or travelling character of eachexcited temporal response is studied by means of a technique suggested by Lucoret al. (2006). Fourier series can be used to approximate the structure response asfollows, using N + 1 temporal Fourier modes:

Vortex-induced vibrations of a long flexible cylinder in shear flow 351
z
z
z
0.24 0.26 0.28 0.30 0.32 0.34 0.360
20
40
60
80
100
120
140
160
180PSD – ζx
0
0.02
0.04
0.06
0.08
0.10
0.12
0.14
(a)
–4000 –3000 –2000 –1000 0
20
0
40
60
80
100
120
140
160
180f = 0.292
(b)
Temporal frequency
0.24 0.26 0.28 0.30 0.32 0.34 0.360
20
40
60
80
100
120
140
160
180PSD – ζx
0.005
0.010
0.015
0.020
0.025
0.030
(c) (d )
–4000 –3000 –2000 –1000 00
20
40
60
80
100
120
140
160
180
Phase (deg.)
f = 0.286f = 0.298f = 0.311f = 0.337
0.24 0.26 0.28 0.30 0.32 0.34 0.360
20
40
60
80
100
120
140
160
180PSD – ζx
0.02
0.04
0.06
0.08
0.10
0.12
(e)
–4000 –2000 0 2000 40000
20
40
60
80
100
120
140
160
180
f = 0.291f = 0.306f = 0.323f = 0.342
( f )
Figure 5. Temporal spectral analysis of in-line displacement fluctuation: (a, c, e) PSD of ζx
along the cylinder span and (b, d, f ) spanwise evolution of selected temporal mode phase anglesat (a, b) Rem = 110, (c, d ) Rem = 330 and (e, f ) Rem = 1100.

352 R. Bourguet, G. E. Karniadakis and M. S. Triantafyllou
z
0.10 0.12 0.14 0.16 0.18 0.20 0.220
20
40
60
80
100
120
140
160
180PSD – ζy
0.02
0.04
0.06
0.08
0.10
0.12
0.14
0.16
(a)
–2000 –1500 –1000 –500 0 5000
20
40
60
80
100
120
140
160
180f = 0.146
(b)
z
0.10 0.12 0.14 0.16 0.18 0.20 0.220
20
40
60
80
100
120
140
160
180PSD – ζy
0
0.02
0.04
0.06
0.08
0.10
0.12
(c)
–2000 –1500 –1000 –500 0 5000
20
40
60
80
100
120
140
160
180f = 0.149f = 0.162f = 0.174
(d)
Temporal frequency
z
0.10 0.12 0.14 0.16 0.18 0.20 0.220
20
40
60
80
100
120
140
160
180PSD – ζy
0.02
0.04
0.06
0.08
0.10
0.12
(e)
–2000 –1500 –1000 –500 0 500 10000
20
40
60
80
100
120
140
160
180
Phase (deg.)
f = 0.139f = 0.151f = 0.156f = 0.164
( f )
Figure 6. Temporal spectral analysis of cross-flow displacement: (a, c, e) PSD of ζy along thecylinder span and (b, d, f ) spanwise evolution of selected temporal mode phase angles at (a, b)Rem = 110, (c, d ) Rem = 330 and (e, f ) Rem = 1100.

Vortex-induced vibrations of a long flexible cylinder in shear flow 353
ζx(z, t) ≈N/2∑
q=−N/2
axq (z) exp[2πifqt] =
N/2∑q=−N/2
|axq |(z) exp
[i(2πfqt + ψx
q (z))]
(3.1)
ζy(z, t) ≈N/2∑
q=−N/2
ayq (z) exp[2πifqt] =
N/2∑q=−N/2
|ayq |(z) exp
[i(2πfqt + ψy
q (z))]
, (3.2)
where fq = q/Ts is the frequency associated with the qth mode and Ts the samplingperiod. The complex modal coefficients ax
q and ayq are also written in terms of their
moduli (|axq | and |ay
q |) and their spatial phase angles (ψxq and ψy
q ). The spanwiseevolution of the phase angles are presented in figures 5 (b, d, f ) and 6 (b, d, f ), for theselected frequencies shown in figures 5 (a, c, e) and 6 (a, c, e), respectively, throughdashed lines (lower part of the PSD plots); only positive frequencies (q ∈ [0, N/2]) areplotted. As a consequence, spatial phase angles which are decreasing along the span(increasing z) denote travelling waves oriented from high-velocity regions (near z = 0)towards the low-velocity regions; and vice versa for phase angle increasing along thespan. At Rem = 110 and Rem =330, the predominant frequencies of in-line vibrationare associated with travelling waves moving towards the low-velocity regions.
Modulations can be noticed in the nearly linear evolution of the spatial phaseangles. This saw-tooth or zigzagging evolution is due to the underlying standingwave pattern. In the idealized case of a strictly linear spatial phase variation (puretravelling wave), the total phase of the qth mode becomes 2πfqt + 2πkx
q z + ηxq . The
slope of ψxq can be used to determine the excited structural wavenumber kx
q ; ηxq
denotes a phase lag which is independent of z. Sine Fourier modes (sin(πnzD/L)for the nth mode) are often used to describe the structural response (e.g. Chaplinet al. 2005; Lie & Kaasen 2006). For illustration purposes, and comparison with theexisting literature, the excited wavenumber kx
q can be related to the sine Fourier mode2kx
q (L/D). In the case Rem = 110, a linear approximation of ψxq indicates that the
excited wavenumber corresponds to the 22nd structural mode, which is also verifiedin the following by a joint space/time spectral analysis. The in-line response is morecomplex at Rem = 1100.
A similar analysis is carried out for cross-flow vibrations (figure 6). At Rem = 110,a single frequency is excited along the span and corresponds to a wave travellingtowards low-velocity regions. The case Rem =330 exhibits a multi-frequency responsewith three frequencies emerging; they are all related to waves travelling towards thelow-velocity region. For free vibrations in the cross-flow direction only, Lucor et al.(2006) also reported three excited frequencies associated with waves travelling in thesame direction, in a linear shear flow. The wave associated with a wider predominantpeak at Rem =1100 is also travelling towards the low-velocity region. The wavecorresponding to one of the secondary peaks is travelling towards z = 0 near the ends.
The ratio between in-line and cross-flow predominant frequencies is very close to2 at Rem =110. In the case Rem = 330, the predominant frequency in the cross-flowdirection (0.149) can be linked to the peak occurring at 0.298 in the in-line direction,leading to a ratio of 2. The second cross-flow frequency (0.162) is associated througha ratio of 2 with secondary in-line peaks. The third cross-flow frequency (0.174) canbe linked to a very small in-line contribution around 0.35, that can be identified forz < 40. The frequency ratio of in-line and cross-flow predominant frequencies is equalto 2.03 at Rem = 1100. This apparent slight deviation from 2 is due to irregularitiesoccurring in the instantaneous excited frequencies, in both directions.

354 R. Bourguet, G. E. Karniadakis and M. S. Triantafyllou
In order to relate the excited frequencies to structural wavenumbers, a spatio-temporal spectral analysis based on a two-dimensional fast Fourier transform of theevolution of structural responses is performed. In figure 7, two-dimensional PSDof in-line and cross-flow motions are plotted as functions of frequency and spatialwavenumber. Positive frequencies are presented and thus negative wavenumbers(upper part of each plot) are associated with travelling waves moving towards low-velocity regions, while positive wavenumbers (lower part of each plot) representtravelling waves moving towards high-velocity regions. The PSD is normalized bythe maximum value observed in both domains (positive and negative wavenumbers).The frequencies identified in figures 5 and 6 are indicated by white vertical dashedlines in the corresponding plots. For comparison purposes, selected sine Fourier modewavenumbers are indicated by yellow horizontal dashed lines.
The predominant excited wavenumbers correspond to modes n ∈ {22, 23, 24, 25}in the in-line direction and n ∈ {13, 14, 15} in the cross-flow direction. These modenumbers are close to those measured experimentally by Trim et al. (2005) and Lie &Kaasen (2006), where cases of multi-frequency response have been reported in shearflow. It is recalled that in the present case of mixed standing–travelling wave responses,the concept of structural modes and the association of the excited wavenumbers withthe corresponding sine Fourier modes are used loosely, for illustration purposes only.The proximity of the contributions of wavenumbers ±0.0325 and ±0.035 in the caseRem = 330 (cross-flow) is in agreement with the fact that 12 or 13 nodes can beobserved alternatively in the response pattern.
In all cases, the ratio between the in-line and cross-flow excited wavenumbers isdifferent from 2 as expected, since for a mixed cable/beam structure, the relationbetween a spatial wavenumber and the corresponding natural frequency is not linear(see expression (3.3) in the following). As a consequence, the nodes of standing wavepattern in the cross-flow direction do not necessarily coincide with in-line motionnodes. This creates a perturbation of the in-line/cross-flow motion synchronizationpattern as explained in § 3.3.
In general, at a given vibration frequency it appears that only a single peak emergesin the spatial spectrum, at the same wavenumber on both the negative and positivesides; i.e. a single structural wavelength is excited at a given frequency. Conversely,a given spatial wavelength responds mainly to a single frequency that depends onRem. Exceptions exist, as for instance in the case Rem = 330, where the wavenumber0.0575 is excited at two distinct frequencies in the in-line direction. As expected, theexcited structural wavenumber increases with increasing excitation frequency. Thenatural frequency f nat of the tensioned beam associated with the wavenumber k canbe evaluated as follows, in vacuum:
f nat (k) = k
√ω2
c + 4π2ω2bk
2. (3.3)
The frequencies corresponding to the selected wavenumbers are indicated by whitecrosses in figure 7. The effective vibration frequencies present a strong drift from thenatural frequency spectrum. This spectrum can be modified as follows to take intoaccount the immersion of the cylinder into the fluid:
f mod = f nat
√√√√ m
m +π
4Cm
, (3.4)

Vortex-induced vibrations of a long flexible cylinder in shear flow 355
Spa
tial
wav
enum
ber
−0.070
−0.065
−0.060
−0.055
−0.050
−0.045
PSD
0
0.1
0.2
0.3
0.4
0.5
0.6
0.7
0.8
0.9
1.0
0.26 0.28 0.30 0.32 0.34 0.36
0.045
0.050
0.055
0.060
0.065
0.070
n = 22
(a)
n = 22
−0.045−0.040−0.035−0.030−0.025−0.020
PSD
0
0.1
0.2
0.3
0.4
0.5
0.6
0.7
0.8
0.9
1.0
0.12 0.14 0.16 0.18 0.20
0.0200.0250.0300.0350.0400.045
n = 13
(b)
n = 13
−0.070
−0.065
−0.060
−0.055
−0.050
−0.045
PSD
0
0.1
0.2
0.3
0.4
0.5
0.6
0.7
0.8
0.9
1.0
Spa
tial
wav
enum
ber
0.26 0.28 0.30 0.32 0.34 0.36
0.045
0.050
0.055
0.060
0.065
0.070
n = 22n = 23n = 24n = 25
(c)
n = 22
n = 25n = 24n = 23
–0.045–0.040–0.035–0.030–0.025–0.020
PSD
0
0.1
0.2
0.3
0.4
0.5
0.6
0.7
0.8
0.9
1.0
0.12 0.14 0.16 0.18 0.20
0.0200.0250.0300.0350.0400.045
n = 13n = 14n = 15
(d )
n = 13n = 14n = 15
−0.070
−0.065
−0.060
−0.055
−0.050
−0.045
PSD
0
0.1
0.2
0.3
0.4
0.5
0.6
0.7
0.8
0.9
1.0
Temporal frequency
Spa
tial
wav
enum
ber
0.26 0.28 0.30 0.32 0.34 0.36
0.045
0.050
0.055
0.060
0.065
0.070
(e)
–0.045–0.040–0.035–0.030–0.025–0.020
PSD
0
0.1
0.2
0.3
0.4
0.5
0.6
0.7
0.8
0.9
1.0
Temporal frequency0.12 0.14 0.16 0.18 0.20
0.0200.0250.0300.0350.0400.045
n = 13n = 14n = 15
n = 12
( f )
n = 13n = 14n = 15
n = 12
n = 22n = 23n = 24n = 25
n = 22
n = 25n = 24n = 23
Figure 7. Spatio-temporal spectral analysis of (a, c, e) in-line displacement fluctuation and(b, d, f ) cross-flow displacement at (a, b) Rem = 110, (c, d ) Rem = 330 and (e, f ) Rem = 1100. Thewhite vertical dashed lines denote the frequencies identified in figures 5 and 6. The wavenumbersof selected sine Fourier modes are indicated by yellow horizontal dashed lines. The white (red)crosses denote the natural (modified) frequencies associated with these wavenumbers.

356 R. Bourguet, G. E. Karniadakis and M. S. Triantafyllou
where Cm is the added mass coefficient induced by the fluid. The correspondingmodified frequencies f mod , for a choice of Cm = 1, are indicated by red crossesin figure 7. While this modified spectrum seems to provide a reasonable approximationto the effective excited frequencies in some cases, significant discrepancies appear inother cases, as for example in both directions at Rem = 110 and in the in-line directionat Rem =1100. This emphasizes the variability of the added mass coefficient and hencethe difficulty of estimating a priori the structural response.
The relative weights of negative and positive wavenumber peaks for the samefrequency confirm the observations made previously concerning the mixed standing–travelling character of structural vibrations and, especially, the reinforced standingcharacter of the response at Rem =1100.
The spectral analysis demonstrates the existence of multi-frequency responses, wheredifferent structural wavenumbers are excited. At a given spanwise location, severalstructural wavenumbers can contribute significantly to the total vibration. This is thecase at Rem = 330 in the cross-flow direction, for instance (figure 6c). Since the threeexcited frequencies are associated with a distinct wavenumber, the distribution ofnodes and anti-nodes along the span leads to three possible vibrating configurations,with one, two or three frequencies present at each spanwise location. It should benoted, again, that we are using the term ‘node’ loosely, to denote a minimum in theenvelope of the response; it is not strictly speaking a node where the response is zero.
The question that arises is whether the response is instantaneously mono-frequency,with a shifting frequency in time, or it is multi-frequency at all times. This questionis addressed by means of time/frequency analysis. At each spanwise location, theinstantaneous frequency content of the response can be monitored as a function oftime by computing a scalogram, which shows the squared magnitude of a continuouswavelet transform as a function of the frequency and time (Boashash 2003). Threedifferent locations, that exhibit one-, two- and three-frequency responses, are selectedalong the span (z = 94, z = 44 and z =7.5, respectively), and the correspondingtime series and scalograms are plotted in figure 8 over a selected time interval.In these plots, the three predominant frequencies identified in the previous spectralanalysis are indicated by dashed lines. The mono-frequency case (figure 8a) exhibitsonly small deviations about the predominant frequency. In both multi-frequencycases (figure 8b,c), the structural response does not exhibit an instantaneous broadspectrum; instead the vibration is instantaneously dominated by a single frequency,that drifts relatively regularly from one predominant frequency to another. As aconsequence, the response previously identified as multi-frequency, because of itsoverall spectral content, can be regarded as ‘instantaneously mono-frequency’. Thisobservation is verified along the whole span and is also verified in the case of amulti-frequency response in the in-line direction, even though the scalograms arenoisier in this case.
Figure 8 shows that the temporal variation of the dominant frequency doesnot occur simultaneously along the entire span. As a result, different structuralwavenumbers can be excited instantaneously along the cylinder span. To illustratethis point, the instantaneous predominant frequency fp is plotted as a functionof time and space in figure 9. The three dashed lines indicate the location of thesignals analysed in figure 8. This spatio-temporal map of the response frequencyconfirms that different frequencies, and thus structural wavenumbers, are excitedsimultaneously, but at different locations along the cylinder span. The distributionof excited frequencies resembles a low-frequency travelling wave with non-constantamplitude, as it is modulated by the standing-wave component of the structural

Vortex-induced vibrations of a long flexible cylinder in shear flow 357
0 20 40 60 80 100 120 140 160
−0.6−0.4−0.2
00.20.40.6
ζy
(a)T
empo
ral f
requ
ency
0 20 40 60 80 100 120 140 160
0.12
0.14
0.16
0.18
0.20
Weight
0.0050.0100.0150.0200.0250.0300.0350.0400.045
0 20 40 60 80 100 120 140 160
−0.6−0.4−0.2
00.20.40.6
ζy
ζy
(b)
Tem
pora
l fre
quen
cy
0 20 40 60 80 100 120 140 160
0.12
0.14
0.16
0.18
0.20
Weight
0.0050.0100.0150.0200.0250.0300.0350.040
0 20 40 60 80 100 120 140 160−0.6−0.4−0.2
00.20.40.6(c)
Time
Tem
pora
l fre
quen
cy
0 20 40 60 80 100 120 140 160
0.12
0.14
0.16
0.18
0.20
Weight
0.0050.0100.0150.0200.0250.0300.0350.0400.045
Figure 8. Selected cross-flow displacement time series (upper part) and correspondingfrequency content as a function of time (scalogram, lower part) in the case Rem = 330 at(a) z =94, (b) z = 44 and (c) z = 7.5. The dashed lines denote the predominant frequenciesidentified in figure 6(c).

358 R. Bourguet, G. E. Karniadakis and M. S. Triantafyllou
Time
z
20 40 60 80 100 120 140 1600
20
40
60
80
100
120
140
160
180 fp
0.145
0.150
0.155
0.160
0.165
0.170
0.175
Figure 9. Predominant frequency of cross-flow displacement as a function of time along thecylinder span in the case Rem = 330. The dashed lines indicate the time series presented infigure 8.
motion. In high (low) dominant frequency regions, the distance between two adjacentnodes tends to decrease (increase) leading to an undulated stripped pattern.
So far, in-line and cross-flow vibrations have been reported separately. They are,in fact, coupled nonlinearly via the flow forces, and hence an investigation of thesynchronization between the in-line and cross-flow displacements is performed nextto properly characterize the structural response.
3.3. Synchronization of in-line and cross-flow vibrations
The synchronization between the in-line and cross-flow displacements of an elasticallymounted rigid cylinder has been investigated experimentally in Dahl et al. (2007) andDahl et al. (2010). It was shown that there is a strong influence of the in-line versuscross-flow motion phase difference on the wake patterns and hence on the forcesacting on the structure. Concerning long flexible cylinders in shear flows, Vandiveret al. (2009) and Modarres-Sadeghi et al. (2010) have emphasized, on the basis ofexperimental measurements, a possible link between this synchronization and thedistribution of excitation and damping regions along the span.
The same phenomena are also addressed here in § 4.3. Synchronization is quantifiedin terms of the phase difference between in-line and cross-flow vibrations along thecylinder span and is shown to be related to the nature of the fluid–structure energytransfer. Selected cylinder trajectories at different spanwise locations are shown infigure 10. These Lissajous curves depict ‘figure-eight’ orbits, which often characterizein-line responses at approximately twice the cross-flow frequency. The phase differencebetween synchronized in-line and cross-flow motions controls the specific shape anddirection of travel in these orbits.
The instantaneous phases of in-line and cross-flow vibrations (φx and φy
respectively) are determined by means of the Hilbert transform. Adopting an approachsimilar to that in Huera-Huarte & Bearman (2009a), the phase difference Φxy isevaluated as follows:
Φxy = [pφx − qφy, mod 360◦], (3.5)

Vortex-induced vibrations of a long flexible cylinder in shear flow 359
−0.2 −0.1 0 0.1 0.2
−0.4−0.3−0.2−0.1
00.10.20.30.4
Rem = 1100 Rem = 110 Rem = 330
Rem = 1100 Rem = 110 Rem = 330
ζy
(a)
z = 12.5
z = 40.5 z = 83 z = 10.5
Φxy ≈ 35°
Φxy ≈ 285° Φxy ≈ 325°Φxy ≈ 165°
Φxy ≈ 95°Φxy ≈ 60°
−0.4
−0.3
−0.2
−0.1
0
0.1
0.2
0.3
0.4(b)
z = 5 z = 5.5
−0.04 −0.02 0 0.02 0.04
−0.6
−0.4
−0.2
0
0.2
0.4
0.6
(c)
−0.2 −0.1 0 0.1 0.2
−0.6
−0.4
−0.2
0
0.2
0.4
0.6
ζxζx ζx
ζy
(d)
−0.010 −0.005 0 0.005 0.010
−0.010 −0.005 0 0.005 0.010
−0.4
−0.3
−0.2
−0.1
0
0.1
0.2
0.3
0.4(e)
−0.04 −0.02 0 0.02 0.04
−0.6
−0.4
−0.2
0
0.2
0.4
0.6
(f)
Figure 10. Selected trajectories of the cylinder at different spanwise locations in the threecases Rem = 110, Rem = 330 and Rem = 1100.
where p and q are two integer numbers defining the level of synchronization.Considering the spectral analysis presented in § 3.2, the couple (p, q) = (1, 2) is chosenhere. Values of Φxy in the range 0◦–180◦ (180◦–360◦, respectively) correspond toorbits where the cylinder moves upstream (downstream, respectively) when reachingthe cross-flow oscillation maxima. These two types of trajectories are referred to as‘counter-clockwise’ and ‘clockwise’, respectively (Dahl et al. 2007). Values of Φxy arespecified for each trajectory in figure 10.
Spatio-temporal evolutions of the phase difference associated with the time seriespresented in figures 2 and 3 are plotted in figure 11. As previously mentioned inHuera-Huarte & Bearman (2009a), an analysis of the phase angle assumes that thein-line and cross-flow motions are synchronized over an extended time interval, i.e.the temporal evolution of Φxy exhibits plateaux. Such plateaux are observed for thethree cases studied herein, as illustrated in figure 10. Figure 11 depicts for each case ahorizontally stripped pattern with relatively regular jumps along the span. At a givenspanwise location, the unsteadiness of phase difference increases with Rem.
To quantify the predominant phase difference along the span, histograms of Φxy
are evaluated from the entire time series. Figure 12 shows, for each Rem andat each spanwise location, the relative weights of phase difference angles. Thecontributions are normalized by the maximum weight. Increasing unsteadiness ofthe phase difference leads to noisier histograms as Rem increases. Despite this, apredominant phase difference can be identified in most cases.
At Rem =110, a first region can be distinguished for z < 20, approximately, wherethe spanwise evolution of the phase angle resembles that of standing waves in the

360 R. Bourguet, G. E. Karniadakis and M. S. Triantafyllou
5 10 15 20 25 30 35 40 45 500
20406080
100120140160180(a) Φxy
0
50
100
150
200
250
300
350
5 10 15 20 25 30 35 40 45 500
20406080
100120140160180 Φxy
0
50
100
150
200
250
300
350
Time5 10 15 20 25 30 35 40 45 500
20406080
100120140160180 Φxy
0
50
100
150
200
250
300
350
z
z
z
(b)
(c)
Figure 11. Temporal evolution of the phase difference between in-line and cross-flowdisplacements (3.5) along the cylinder span at (a) Rem = 110, (b) Rem = 330 and
(c) Rem = 1100.
in-line and cross-flow directions with the excited in-line structural mode correspondingto twice the cross-flow modal number. Indeed, in that case the anti-node of cross-flowdisplacement corresponds to a node of in-line displacement, where a change in orbitorientation also occurs. Here, Φxy ≈ 60◦ at z =5 and Φxy ≈ 300◦ at z = 14.
A similar pattern can be identified in the case Rem = 330, with a switch betweenclockwise and counter-clockwise trajectories. This is related to the predominantstanding wave pattern in this region.
Note that the excited structural wavelength in the in-line direction is not exactlyhalf of the cross-flow one, and the standing waves are perturbed by the developmentof travelling waves; this explains why the alternating clockwise/counter-clockwisepattern does not persist beyond this region.
In the idealized case of pure travelling waves in both directions, with doublefrequency in the in-line direction, a constant phase difference could be observedalong the span. At Rem =110, the mixed standing–travelling wave patterns lead toa zigzagging distribution of Φxy . Jumps of +130◦ occur between cells defined by

Vortex-induced vibrations of a long flexible cylinder in shear flow 361
Φxy
z
100 200 3000
20
40
60
80
100
120
140
160
180Weight
0
0.1
0.2
0.3
0.4
0.5
0.6
0.7
0.8
0.9
1.0
(a)
Φxy Φxy
100 200 3000
20
40
60
80
100
120
140
160
180Weight
0
0.1
0.2
0.3
0.4
0.5
0.6
0.7
0.8
0.9
1.0
(b)
100 200 3000
20
40
60
80
100
120
140
160
180Weight
0
0.1
0.2
0.3
0.4
0.5
0.6
0.7
0.8
0.9
1.0
(c)
Figure 12. Histogram of the phase difference (3.5) along the cylinder span at (a) Rem = 110,(b) Rem = 330 and (c) Rem = 1100.
cross-flow displacement nodes. In each cell the phase difference decreases byapproximately −80◦. As a result, a drift of the pattern towards higher phase anglesoccurs along the span (increasing z). It is interesting to note that this pattern ismainly located in the range Φxy ∈ [0◦, 180◦] in the high-velocity region, which meansthat counter-clockwise orbits are preferred in this region; this coincides with theexperimental observations of Modarres-Sadeghi et al. (2010). The zigzagging patternis altered beyond z = 140, where travelling waves are less pronounced.
A very similar analysis can be carried out at Rem = 330. Even though noisier, thesame pattern can be identified as counter-clockwise trajectories seem also predominantin the high-velocity region, except very close to z = 0. The case Rem = 1100 exhibitssome differences, as two peaks emerge near z = 0, which correspond to two possiblesynchronized states. The fact that a peak appears at Φxy ≈ 30◦ around z =14, whereasa peak exists at Φxy ≈ 20◦ near z = 5, could appear to contradict the above-describedclockwise/counter-clockwise alternating pattern in regions dominated by standingwaves. In fact, a careful monitoring of the Φxy temporal evolution shows that thislast peak is related to secondary peaks at Φxy ≈ 215◦ (z = 14) and Φxy ≈ 345◦ (z = 14),while Φxy ≈ 30◦ (z = 14) and Φxy ≈ 210◦ (z =5) occur simultaneously. Therefore, theclockwise/counter-clockwise alternating pattern is preserved in this region as well. Thestanding character of the structural displacements is more pronounced at Rem = 1100,which causes a distortion of the zigzagging pattern. In particular, larger jumpsare observed between spanwise cells. In the high-velocity region (10< z < 60), mostof phase difference peaks occur between 0◦ and 180◦ with a preferential angle of

362 R. Bourguet, G. E. Karniadakis and M. S. Triantafyllou
Φxy ≈ 160◦. The drift towards higher angles along the span is less pronounced thanin previous cases and occurs mainly beyond z = 60.
In all studied cases, synchronization states between in-line and cross-flow motionscan be found along the cylinder span. A region of alternating clockwise/counter-clockwise motions can be identified near z = 0, where the standing character of thestructure response dominates. Beyond this region, the distribution of phase differencebetween in-line and cross-flow vibrations follows a zigzagging pattern which occurswithin the range Φxy ∈ [0◦, 180◦] in the high-velocity region, and is thus related tocounter-clockwise orbits.
Next we proceed to correlate the observations made on the nature of the structuralresponse and the synchronization between in-line and cross-flow motions with flowpatterns and fluid–structure interaction mechanisms.
4. Coupled fluid–structure systemThis section focuses on the fluid–structure interaction mechanisms causing the
vibrations analysed in § 3. The occurrence of the lock-in phenomenon is studied in§ 4.1, and an analysis of the wake patterns is presented in § 4.2. Finally, fluid forcesand fluid–structure energy transfer are studied in § 4.3.
4.1. Lock-in within shear flow
The phenomenon of lock-in in flexibly mounted rigid cylinders within uniformflow consists of self-excited, VIV accompanied by the ‘locking’ of the frequency ofvortex formation with the frequency of cylinder vibrations, rather than the Strouhalfrequency, which is associated with the von Karman instability behind a stationarycylinder. It has been investigated extensively in the literature, as reviewed by Bearman(1984) and Williamson & Govardhan (2004). This is an important feature of VIV; ithas been shown, in particular, that maximum oscillation amplitudes occur under thelock-in condition. This synchronization can exist over a wide range of oncoming flowvelocities, especially for low mass ratios.
Studies of rigid cylinders forced to vibrate harmonically at a prescribed amplitudeand frequency have underscored the importance of the phenomenon of ‘wake capture’,i.e. the entrainment of the vortex shedding frequency relatively far from the Strouhalfrequency (Sarpkaya 2004).
A long flexible cylinder in shear flow is also known to undergo self-inducedvibrations, but the wake capture is exhibited only over part of the cylinder span; inthe remaining part, the wake does not lock in to the structural vibration frequency.As a result, when a flexible structure undergoes VIV, we refer to a ‘region of lock-in’versus a ‘region of non-lock-in’ across the span. Even within a lock-in region, thephenomenon of frequency entrainment is much more complex in shear flow becauseseveral frequencies may potentially be excited. Indeed, a uniform oncoming flow pasta constant diameter cylinder induces a narrow excitation bandwidth, resulting ina single frequency of vortex shedding. In contrast, it is unclear for a non-uniformcurrent how the flow–structure interaction mechanisms apply when several naturalfrequencies are within the bandwidth of excitation by the flow, and which frequencymay dominate.
In the case of forced cross-flow oscillations of rigid and flexible cylinders in shearedcurrents, Stansby (1976) and Peltzer & Rooney (1985) have emphasized the formationof long (>40D) spanwise cells of constant shedding frequency equal to the forcingfrequency. This partial lock-in of the wake perturbs the pattern observed in the case of

Vortex-induced vibrations of a long flexible cylinder in shear flow 363
a stationary cylinder in shear flow (or stationary tapered cylinder in a uniform flow)that is composed of smaller cells separated by regular discontinuities of sheddingfrequency (Noack et al. 1991). For a long flexible cylinder constrained to oscillatein the cross-flow direction and using a low-resolution simulation, Lucor et al. (2001)have reported a partial lock-in spanwise distribution with a synchronization regionlocated in the high-velocity zone, and an unsynchronized state region elsewhere.
A detailed analysis of the lock-in phenomenon is presented here for the flexiblecylinder under study. The lock-in condition at any location along the cylinder spanis established when the frequency of the wake velocity oscillations coincides with thefrequency of the local cross-flow structural response; otherwise, we characterize thecondition as non-lock-in. We define a ‘lock-in region’ of the structure to be acontinuous part of the span which contains all locally locked-in locations. We payparticular attention to both the lock-in and non-lock-in regions, especially for thecases of multi-frequency response. The influence of lock-in/non-lock-in conditions onthe fluid–structure energy transfer is addressed in § 4.3.
The vortex shedding frequency is established from the cross-flow componentof the flow velocity, v, which was recorded over the same time interval as thestructural displacements, along a spanwise line located downstream of the cylinder at(x, y) = (20, 0). The PSD of the v velocity component is plotted along the span for thethree Rem in figure 13. Selected frequencies, previously identified by spectral analysisof the structure response (§ 3.2), are indicated by dashed lines. Two main spanwiseregions can be distinguished in all cases: a region of lock-in, where the vortex sheddingfrequency coincides with the structural cross-flow vibration frequency (or frequencies,in the case of multi-frequency response), can be identified in the high-velocity region,near z = 0. The rest of the span corresponds to a non-lock-in region, where vortexshedding and structural vibrations are not synchronized.
The detailed plots of the lock-in regions are presented in figures 13(b), 13(d ), 13 (f ).At Rem = 110, lock-in occurs over 59D, starting from z = 0. The case Rem = 330exhibits lock-in at the three distinct frequencies identified in the multi-frequencystructural response. The region where vortex shedding is synchronized with at leastone of these frequencies covers 75D.
At Rem =1100, the spanwise evolution of the predominant frequency of v presentsmore irregular events than in previous cases due to the absence of stable wakepatterns in several spanwise regions, as discussed in the following. These zones,where no predominant frequency peak can be identified, create ‘holes’ in the lock-inspanwise pattern. The synchronization zone can be referred to as a ‘discontinuouslock-in region’ and covers 77D.
Two possible causes can be suggested to explain the tendency observed concerningthe length increase of the lock-in region as Rem increases, especially between Rem = 110and the two other cases. Previous studies on forced oscillations in shear flow (Stansby1976; Peltzer & Rooney 1985) have reported that the lock-in region grows in sizeas the oscillation amplitude increases. Such an increase in the oscillation amplitudeis observed in the present case as a function of Rem (figure 4). Another possibleexplanation is related to a larger variation of the Strouhal number in the regionz ∈ [50, 80] in the case Rem = 110 (Re∈ [75, 90]) than at higher Rem (Williamson1992; Braza, Faghani & Persillon 2001).
It can be noted that for z ∈ [0, 80] approximately, the quasi-static bending of thecylinder, due to the time mean component of drag force, can tend to oppose the shearflow effect by increasing the magnitude of the velocity component normal to thecylinder for increasing z. For z > 80, approximately, the structural static bending can

364 R. Bourguet, G. E. Karniadakis and M. S. Triantafyllou
z
z
z
0.05 0.10 0.15 0.200
20
40
60
80
100
120
140
160
180PSD – υ
0.02
0.04
0.06
0.08
0.10
0.12
0.14
0.16
(a)
0.10 0.12 0.14 0.16 0.18 0.200
10
20
30
40
50
60
70
80
90 PSD – υ
0.02
0.04
0.06
0.08
0.10
0.12
0.14
0.16
(b)
0.05 0.10 0.15 0.200
20
40
60
80
100
120
140
160
180PSD – υ
0.005
0.010
0.015
0.020
0.025
0.030
0.035
0.040
(c)
0.10 0.12 0.14 0.16 0.18 0.200
10
20
30
40
50
60
70
80
90 PSD – υ
0.005
0.010
0.015
0.020
0.025
0.030
0.035
0.040
(d)
Temporal frequency
0.05 0.10 0.15 0.200
20
40
60
80
100
120
140
160
180PSD – υ
0.004
0.006
0.008
0.010
0.012
0.014
0.016
0.018
0.020
(e)
Temporal frequency0.10 0.12 0.14 0.16 0.18 0.200
10
20
30
40
50
60
70
80
90 PSD – υ
0.004
0.006
0.008
0.010
0.012
0.014
0.016
0.018
0.020
( f )
Figure 13. PSD of the temporal evolution of the cross-flow component of the flow velocityalong a spanwise line at (x, y) = (20, 0), at (a, b) Rem = 110, (c, d ) Rem = 330 and (e, f )Rem = 1100. The detailed views of lock-in regions are plotted in (b, d, f ). The white dashedlines indicate the frequencies identified in figure 6. In (d ), the yellow dashes indicate the localpredominant structure vibration frequency identified from figure 6(c).

Vortex-induced vibrations of a long flexible cylinder in shear flow 365
increase the effect of the shear flow by reducing the flow normal velocity component,as z increases.
Under the lock-in condition, large deviations from the Strouhal shedding frequencyare observed. The non-dimensional local shedding frequency is defined as fl = f/Ul ,where f is the local predominant frequency non-dimensionalized by U , the maximumoncoming flow velocity (z = 0), and Ul is the local oncoming flow velocity non-dimensionalized by U . The local shedding frequencies identified at lock-in are in theranges fl ∈ [0.146, 0.191], fl ∈ [0.149, 0.221] and fl ∈ [0.151, 0.216] for Rem = 110,Rem = 330 and Rem =1100 respectively.
In the case of multi-frequency response (Rem = 330), the spectral analysis carriedout in § 3.2 revealed that three frequencies can contribute to the structural cross-flowvibration at a given spanwise location. In this context, the question arises whether thevortex shedding is synchronized with preferentially a single frequency. Despite somesecondary peak contributions, figure 13(d ) shows that, at each spanwise location,the vortex shedding is mainly synchronized with a single frequency, which can bea different one for each location. It has been emphasized previously that multi-frequency responses are instantaneously mono-frequency and that the globally multi-frequency character is due to a temporal evolution of the excited frequency. Hence,at a given spanwise location vortex shedding occurs mainly at a single frequency,while the structural vibration frequency may vary among the predominant vibrationfrequencies. As a consequence, the lock-in condition does not occur continuously asa function of time.
These observations raise a second question regarding which vibration frequency isselected by the wake to lock-in. In figure 13(d ), yellow dashes are used to indicatethe local predominant structure vibration frequency issued from figure 6(c). Thediscontinuous line formed by these yellow dashes describes the lock-in patternrelatively accurately, showing that the wake lock-in frequency corresponds to thelocal predominant vibration frequency. It should be noted that some exceptions existas for z ∈ [24, 28] where lock-in occurs at a vibration frequency equal to 0.162, whilethis frequency has a secondary but significant contribution to the structural vibrationin this region.
In non-lock-in regions, a global decrease of the vortex shedding frequency isobserved along the span, in agreement with the spanwise decrease of the local sheddingfrequency based on the Strouhal number, the local Strouhal frequency, which followsthe linear reduction of the oncoming flow velocity. In the cases Rem = 110 andRem = 330, a cellular pattern can be clearly identified: spanwise regions of constantshedding frequencies are separated by discontinuities. The frequency within a cellremains constant along its length; hence, the locations away from the centre of thecell violate the local Strouhal frequency; at the ends of the cell a threshold event isreached, and a new cell starts accompanied by a discontinuous jump in frequency tobetter agree with the local Strouhal frequency.
The question arises: what is the event that triggers the end of a cell? Similarcellular patterns have been reported for stationary cylinders in shear flow and taperedcylinders in uniform flow (e.g. Gaster 1971; Griffin 1985; Peltzer & Rooney 1985;Noack et al. 1991; Piccirillo & Van Atta 1993). These previous works have emphasizedthe influence of several parameters on the cell length, such as for instance the shearparameter, the cylinder aspect ratio and the Reynolds number. For a stationarycylinder of aspect ratio L/D = 107 and a comparable shear parameter, Peltzer &Rooney (1985) observed spanwise cells of 11 diameters on average, at a higherReynolds number. Here, the cases Rem = 110 and Rem =330 exhibit cells of 13D–16D

366 R. Bourguet, G. E. Karniadakis and M. S. Triantafyllou
which correspond approximately to half of the excited wavelength in the cross-flowdirection. At Rem = 110, it can be noticed that frequency discontinuities betweencells coincide roughly with the nodes of the structural response. Moreover, it canbe observed that the cellular pattern exists beyond z ≈ 140 (Re <48), while vortexshedding vanishes in this region as shown in the following. This is due to a persistingundulation of the wake, probably triggered by the adjacent vortex shedding. Similarobservations can be made concerning the forcing of the cellular pattern by structuralvibration in the case Rem = 330. However, the existence of three competing excitedwavenumbers induces less sharp transitions between cells, since vibration nodes aremoving in the spanwise direction. At Rem = 1100, the non-lock-in region exhibitsa noisier frequency distribution, illustrating the increased complexity of the wakepatterns; however, the general tendency towards decreasing shedding frequency alongthe span as well as the appearance of frequency discontinuities are clearly visible. Insummary, the half-wavelength of the local cross-flow structural vibrations seems tobe a significant parameter for the formation of cells.
A comparison of the lock-in/non-lock-in spanwise distribution and in-line/cross-flow motion synchronization patterns (figure 12) shows that counter-clockwise orbitsare the most likely trajectories under the lock-in condition. This corroborates theexperimental observations of Dahl et al. (2007) who reported that, for a rigid cylinderin uniform flow, regular ‘figure-eight’ motions as those described in the presentstudy are generally associated with counter-clockwise orbits at lock-in. This point isdiscussed from the fluid–structure energy transfer point of view in § 4.3.
To summarize, the lock-in region is located in the high-velocity zone and representsapproximately 30 %, or more, of the total cylinder length. In this region, spatialintermittencies of lock-in can be observed. In the case of multi-frequency response,the wake is mainly synchronized with a single frequency in each particular locationalong the cylinder, that is mainly the locally predominant vibration frequency. Thenon-lock-in region is characterized by a cellular pattern as in the case of a stationarycylinder in shear flow.
4.2. Wake patterns
In this section, the wake patterns behind the cylinder are studied in light of thelock-in/non-lock-in spanwise distribution identified in § 4.1. The objective is to clarifythe interaction between wake structures and cylinder motions that leads in shearcross-flows to the formation of a mixed standing and travelling wave response.
For better visualization of the wake patterns, instantaneous iso-surfaces of spanwisevorticity (ωz) are presented in figure 14. Only part of the computational domain isplotted downstream of the cylinder: [0.6D, 32D], [0.6D, 25D] and [0.6D, 20D] for thecases Rem = 110, Rem = 330 and Rem = 1100, respectively. The effect of the transitionto turbulence as Rem increases is visible in these plots.
For Rem =110, the Reynolds number is in the range [30, 110]. The strongly three-dimensional wake observed here, which is different than the wake behind a straightrigid cylinder in uniform flow, is due to the joint effects of shear flow, cylinderstatic bending due to the time mean component of the drag force and cylindervibrations. For Rem = 330, the Reynolds numbers are within the range where thesecondary instability, corresponding to a spanwise undulation of the von Karmanvortices, develops in the wake of a straight stationary cylinder in uniform flow.Different transition patterns have been reported in this context and are related to thecharacteristic wavelengths of the secondary instability. The A- and B-mode transitionpatterns have been studied both experimentally (e.g. Williamson & Roshko 1988;

Vortex-induced vibrations of a long flexible cylinder in shear flow 367
10
20
30
40
50
60
70
80
90
100
110
120
130
140
150
160
170
180
z
(c)(b)(a)
xy
z
Figure 14. Instantaneous iso-surfaces of spanwise vorticity (ωz) downstream of the cylinderat (a) Rem =110, ωz = ± 0.13, (b) Rem =330, ωz = ± 0.3, and (c) Rem = 1100, ωz = ± 0.8. Thearrows represent the linear shear oncoming flow. The dashed lines indicate the locations of the(x, y) planes presented in figure 18.
Williamson 1992) and numerically (e.g. Braza et al. 2001). Another transition pattern,the C-mode, has also been put forward in particular in the case of forced asymmetry(Zhang et al. 1995). In the present case, the secondary instability is affected by thepreviously mentioned sources of three-dimensionality, as illustrated in figure 14(b).

368 R. Bourguet, G. E. Karniadakis and M. S. Triantafyllou
The case Rem =1100 exhibits a more developed turbulent wake, but the von Karmanvortices are still visible.
At lock-in, vortex shedding occurs at the same frequency (or frequencies, in thecase of multi-frequency vibrations) over a long spanwise region (>59D), while theoncoming flow velocity varies linearly. This results in an oblique vortex sheddingpattern where the distance between two consecutive vortex rows decreases alongthe span, due to the difference in the convective velocity, for increasing z. Such anoblique vortex shedding pattern has been reported in the literature in uniform flowsperturbed by end effects (Williamson 1989), as well as in shear flows past stationarycylinders (Mukhopadhyay, Venugopal & Vanka 1999), and uniform flows past taperedcylinders (Gaster 1971; Piccirillo & Van Atta 1993). The oblique shedding pattern isclearly visible in the lock-in region for example for z ∈ [20, 55] at Rem =110. Thisorientation of the vortex shedding is illustrated by further detailed flow visualizationsin the following.
In the case of forced standing wave motions in uniform flow, Newman &Karniadakis (1997) have reported an interwoven wake structure due to alternatingpositive and negative cross-flow displacements and the 180◦ phase difference betweentwo adjacent anti-nodes. In particular, the connections between co-rotating vortexrows present a spanwise symmetry about the anti-nodes. This pattern is stronglymodulated in the present case of free vibrations in shear flow. Connections betweenvortex rows are not symmetrical and are oriented according to the above-mentionedoblique shedding pattern. The alternating near-nodes and anti-nodes of cross-flowvibration induce, however, a spanwise undulation of the vortex rows.
As shown in § 4.1, the identifiable wake patterns in the non-lock-in region(Rem = 110, Rem = 330) consist of spanwise cells of constant shedding frequencyeach, similar to the case of a stationary tapered cylinder in uniform flow or astationary cylinder in shear flow, as described, for example, in Gaster (1971), Piccirillo& Van Atta (1993) and Mukhopadhyay et al. (1999). There are two principal features:oblique vortex shedding in each cell and vortex splittings between adjacent cells. Asreported above, oblique vortex shedding also occurs within the lock-in region. Novortex shedding is found beyond z ≈ 140 (Re<48) at Rem = 110.
The observed vortex splitting is required to ensure continuity of the spanwise vorti-city filaments, since the shedding frequency is discontinuous as we cross from one cellto the next. Vortex splitting is referred to as ‘vortex dislocation’ in studies of stationarycylinders in uniform flow (Williamson 1992), and also as ‘vortex adhesion points’(Zhang et al. 1995). Similar vortex splitting has been observed in studies of shear flowspast uniform cylinders or uniform flows past stationary and moving tapered cylinders(e.g. Piccirillo & Van Atta 1993; Techet et al. 1998; Mukhopadhyay et al. 1999).
When lock-in occurs at more than one frequency, as in the case Rem =330, vortexsplitting is also observed within the lock-in region. Several vortex splitting eventscan be observed in figure 14, while detailed visualizations of this phenomenon areprovided in the following.
In figure 15, the instantaneous iso-surfaces of spanwise vorticity are plotted inselected regions of the wake and at different instants in time. Figure 15(a) focuseson the lock-in/non-lock-in transition region where nine vortex rows (lock-in region)are connected to six vortex rows (non-lock-in region) via multiple vortex splittings.Figures 15(b) and 15(c) illustrate the oblique vortex shedding pattern in the non-lock-in region, as well as vortex splittings. Even in the very near region, the wakeexhibits strong oblique shedding. As can be observed in figure 15(c), vortex splittingscan occur simultaneously between several adjacent cells.

Vortex-induced vibrations of a long flexible cylinder in shear flow 369
(a)
xy
z(b) (c)
Figure 15. (Colour online available at journals.cambridge.org/FLM) Instantaneous iso-surfaces of spanwise vorticity (ωz) downstream of the cylinder in the case Rem = 110,ωz = − 0.045: (a) z ∈ [47, 100], (b) z ∈ [84, 134] and (c) z ∈ [86, 136]. Several snapshotsat different instants are presented.
(a) (b) (c) (d)
Figure 16. (Colour online) Instantaneous iso-surfaces of (a, b) spanwise vorticity (ωz) inthe case Rem = 330 and (c, d ) pressure in the case Rem = 1100, downstream of the cylinder:(a) z ∈ [32, 80], ωz = − 0.24, (b) z ∈ [75, 128], ωz = − 0.14, (c) z ∈ [49, 92], p = − 0.13, and(d ) z ∈ [107, 141], p = − 0.09. Several snapshots at different instants are presented.
A detailed visualization of the wake patterns at Rem = 330 and Rem = 1100is presented in figure 16. The oblique vortex shedding pattern is illustrated infigures 16(a) and 16(c), which show iso-surfaces of spanwise vorticity and negativepressure. As noted previously, the oblique orientation of the vortices relative tothe cylinder axis can be identified in the near region, closest to the cylinder. Theorientation of the vortex rows, observed in all cases studied herein, can be related tothe orientation of the travelling wave component of structural vibrations describedin § 3.2. The oblique peeling-off of the vortices as they form, i.e. the travelling vortexshedding phase, appears to ‘drive’ the travelling wave component from high- tolow-velocity regions.
At Rem = 330 the spanwise discontinuities of the lock-in frequency lead to multiplevortex splittings in the lock-in region (figure 16a). Vortex splittings are also observed

370 R. Bourguet, G. E. Karniadakis and M. S. Triantafyllou
Time Time Time
z
0 20 40 60
80
90
100
110
120
130
140
(a)
0 20 40 60
120
125
130
135
140
145
150
155
160
165
170(b)
0 10 20 30
60
70
80
90
100
110
120
130
140
(c)
Figure 17. Selected time series of the cross-flow component of the flow velocity along selectedspanwise regions at (x, y) = (20, 0), at (a) Rem = 110, (b) Rem = 330 and (c) Rem = 1100. Positive(negative) values are plotted in white (black).
in the non-lock-in region as shown in figure 16(b). The triangle-shaped connectionsappearing between some rows of vortices near cross-flow vibration nodes resemblethose reported by Newman & Karniadakis (1997) in uniform flow. The structuralmotion has a strong influence on the wake in the non-lock-in region as illustratedin figure 16(d ) at Rem = 1100: in certain zones, no well-defined vortex rows can beidentified in the vicinity of vibrational nodes, while the vortices shed in adjacent cellsare bent and seem to merge together in nodal regions.
Figure 17 depicts the spatio-temporal evolution of the cross-flow component of theflow velocity downstream of the cylinder, at several time intervals. Vortex splittingsare associated with spanwise bifurcations in the cross-flow velocity patterns. Theseevents can be isolated in time and space, but also often occur in groups or in cascade.No periodicity in vortex splitting has been identified in the present study.
Several investigations have been carried out to identify and classify the vortexshedding patterns occurring in the wake of vibrating rigid cylinders in uniform flow(Williamson & Roshko 1988; Jeon & Gharib 2001; Jauvtis & Williamson 2004;Carberry, Sheridan & Rockwell 2005). When there are spanwise variations in theconfiguration, Techet et al. (1998) and Flemming & Williamson (2005) have shownthe possible co-existence of different shedding patterns along the span. In the caseof flexible cylinders, the experimental studies of Brika & Laneville (1993) and morerecently Huera-Huarte & Bearman (2009b) have shown that two principal ‘vortexmodes’, characterized by two single vortices per cycle (2S mode) and two pairs ofvortices per cycle (2P mode), dominate the wake.
As previously detailed, the wake of the present freely vibrating cylinder mainlyconsists of oblique vortex rows, often inter-connected through vortex splittings. It isimportant to note that almost periodic shedding patterns can be identified only insome spanwise regions. In addition, strong modulations due to the combined effects

Vortex-induced vibrations of a long flexible cylinder in shear flow 371
6 8 10 12 14 16 18 20–4
–2
0
2
4
6: –0.80 –0.57 –0.34 –0.11 0.11 0.34 0.57 0.80
(a)
y
ωz
8 10 12 14 16 18 20–4
–2
0
2
4
6: –0.80 –0.57 –0.34 –0.11 0.11 0.34 0.57 0.80
(b)
ωz
12 14 16 18 20 22 24–4
–2
0
2
4
6: –0.35 –0.25 –0.15 –0.05 0.05 0.15 0.25 0.35
(c)
ωz
4 6 8 10 12 14–4
–2
0
2
4(d)
y
12 14 16 18 20 22–4
–2
0
2
4: –0.70 –0.50 –0.30 –0.10 0.10 0.30 0.50 0.70
(e)
ωz
8 10 12 14 16 18–4
–2
0
2
4( f )
6 8 10 12
–2
0
2
(g)
y
x x x12 14 16 18 20
–2
0
2
: –0.85 –0.61 –0.36 –0.12 0.12 0.36 0.61 0.85
(h)
ωz
6 8 10 12 14
–2
0
2
(i)
: –1.10 –0.79 –0.47 –0.16 0.16 0.47 0.79 1.10ωz
: –0.80 –0.57 –0.34 –0.11 0.11 0.34 0.57 0.80ωz : –0.40 –0.29 –0.17 –0.06 0.06 0.17 0.29 0.40ωz
: –0.40 –0.29 –0.17 –0.06 0.06 0.17 0.29 0.40ωz
Figure 18. Instantaneous iso-contours of spanwise vorticity in the (x, y) plane, in the nearwake, at (a–c) Rem = 110, (d–f ) Rem = 330, (g–i ) Rem = 1100. The spanwise locations of the(x, y) planes are indicated in figure 14 by dashed lines: (a) z =18, (b) z = 25, (c) z = 109,(d ) z =7, (e) z = 50, (f ) z = 149, (g) z = 12, (h) z = 114 and (i ) z = 174. The cylinder centreposition is indicated by short dashed segments. Several snapshots at different instants arepresented.
of shear flow, multiple vortex splittings, structural bending and structural vibrations,limit a clear definition of these patterns to an area close to the cylinder, the near-wakezone, especially at Rem = 330 and Rem =1100. In these cases, a major part of thenear wake is dominated by irregular and intermittent patterns, that cannot alwaysbe classified according to the canonical patterns identified by Williamson & Roshko(1988) for a rigid cylinder in uniform flow.
In some cases, however, wake patterns resembling the canonical shedding modescan be identified, as illustrated in figure 18, where the instantaneous iso-contours ofthe spanwise vorticity are plotted in selected (x, y) planes, downstream of the cylinder.The spanwise locations of the corresponding (x, y) planes are indicated by dashedlines in figure 14. The cylinder position is indicated by short dashed segments infigure 18. At Rem = 110, a shedding pattern resembling a 2S mode is observed onmost of the cylinder span, including the non-lock-in region (figures 18a, 18b and 18c). At lock-in, the vibration amplitude has an influence on the wake width as illustratedin figures 18(a) and 18(b), which correspond to the planes located near a node and ananti-node of the structural cross-flow motion, respectively. The absence of 2P sheddingpatterns at this Reynolds number is in agreement with the study of Williamson &

372 R. Bourguet, G. E. Karniadakis and M. S. Triantafyllou
Govardhan (2004). In the cases Rem = 330 and Rem = 1100, a pattern resembling a2P mode can be identified intermittently in the high-velocity zone, within the lock-inregion, as shown in figures 18(d ) and 18(g). This shedding mode is not observedin the non-lock-in region. When identifiable, vortex patterns are mostly dominatedby 2S-like modes in both the lock-in and non-lock-in regions (figures 18e, 18h and18i ). A shedding pattern resembling a 2C mode, characterized by two co-rotatingvortices per half-cycle (Flemming & Williamson 2005), can develop in the wake inthe non-lock-in region (figure 18f ).
The mutual influence of the wake patterns and the cylinder vibrations is evident,in particular through the lock-in phenomenon, and the strong link between obliquevortex shedding and the orientation of the travelling wave component of the structuralresponse. A detailed quantification of fluid forces and fluid–structure energy transfermechanisms is provided in the next section.
4.3. Fluid forces and fluid–structure energy transfer
In this section we study the fluid forces exerted on the cylinder and relate them tothe cylinder vibrations and wake patterns analysed in §§ 3 and 4.2. These forces arerepresentative of nonlinear equilibrium states reached by the coupled fluid–structuresystem and can be used to identify the spatio-temporal properties of the fluid–structureenergy transfer. Such energy exchanges are critical to the phenomenon of VIV andhave both theoretical interest and impact on applications.
The evolution of the drag and lift coefficients in space and time, which correspondto the results of the cylinder vibrations presented in figures 2 and 3, are plotted infigures 19 and 20. The fluid forces include both the pressure and viscous componentsand are normalized by the local oncoming flow velocity; they are denoted by Cd andCl , to avoid confusion with Cx and Cy , which are normalized using the maximumvelocity. The evolution of the force coefficients is strongly affected by the cross-flowvibrations; the maxima of the drag coefficient are located in the region of the anti-nodes of cross-flow motion. This is in agreement with the experimental observationsof Huera-Huarte, Bearman & Chaplin (2006) obtained from a flexible cylinder withina stepped current. Both standing and travelling aspects of structural motion areclearly visible, while, as previously mentioned, it can be noticed that the standingwave pattern is more pronounced in the case Rem = 1100.
Occasional non-stationary behaviour can be observed in the evolution of bothcoefficients, especially for Rem = 330. This behaviour is exhibited simultaneously inthe structural vibrations (figures 2b and 3b). The lowest values of the amplitude ofthe lift coefficient occur in the lock-in region. In the non-lock-in region, the lift forceamplitudes increase relatively regularly along the span, while the drag coefficientexhibits a similar behaviour in the non-lock-in region, as confirmed by the maximumand r.m.s. values shown in figure 21. It can be noticed that both coefficients reachvery high magnitudes in the non-lock-in region, compared to the case of a stationarycylinder, reported for example in Persillon & Braza (1998). Despite the influencefrom Rem on the force coefficient amplitudes, the three Reynolds number casespresent comparable spanwise trends. The very high amplitudes of the lift and dragcoefficients in the non-lock-in region are due to the non-dimensionalization based onthe local current velocity that linearly decreases along the span, while the structuralmotions lead to significant fluid forces; this representation, however, adds insight intohow local forces relate to the local velocity in a sheared current.
The force coefficient in phase with the cylinder velocity is used to quantify thefluid–structure energy transfer in a similar way as used in Newman & Karniadakis

Vortex-induced vibrations of a long flexible cylinder in shear flow 373
z
z
z
0
20406080
100120140160180 Cd
Cd
Cd
1.21.31.41.51.61.71.81.92.0
(a)
0
20406080
100120140160180
1.01.21.41.61.82.02.22.42.6
(b)
5 10 15 20 25 30 35 40 45 50
5 10 15 20 25 30 35 40 45 50
5 10 15 20 25 30 35 40 45 50
20
0
406080
100120140160180
1.01.52.02.53.03.54.04.5
(c)
Time
Figure 19. Temporal evolution of drag coefficient along the cylinder span at(a) Rem = 110, (b) Rem = 330 and (c) Rem = 1100.
(1997), Hover, Techet & Triantafyllou (1998) and Dahl et al. (2010). The presentanalysis includes both in-line and cross-flow contributions of this coefficient. Thetime-averaged force coefficient in phase with the cylinder velocity is defined as
Cf v(z) =
2
Ts
∫Ts
(Cx(z, t)˙ζx(z, t) + Cy(z, t)ζy(z, t)) dt√
2
Ts
∫Ts
(˙ζ 2x (z, t) + ζ 2
y (z, t))dt
, (4.1)
where Cx is the fluctuating component of the drag coefficient and p denotes the timederivative of p. The lift and fluctuating drag coefficients are based on the maximumoncoming flow velocity U (z = 0) so that Cf v is representative of the relativecontribution of each spanwise location to the overall energy transfer. Cf v quantifiesthe power developed by the fluid acting on the vibrating cylinder. Positive Cf v impliesthat the fluid supplies, on average, energy to the structure and hence excites cylindervibration, while negative Cf v indicates that the fluid is damping the cylinder motion.
The spanwise distribution of Cf v is plotted in figures 22(a), 22(c) and 22(e) for thethree Rem studied. Regions of positive Cf v are located in the high-velocity zone for all

374 R. Bourguet, G. E. Karniadakis and M. S. Triantafyllou
z
z
z
5 10 15 20 25 30 35 40 45 500
20406080
100120140160180 Cl
−2.0−1.5−1.0−0.500.51.01.52.0
(a)
5 10 15 20 25 30 35 40 45 500
20406080
100120140160180 Cl
−4−3−2−101234
(b)
Time5 10 15 20 25 30 35 40 45 500
20406080
100120140160180 Cl
−3
−2
−1
0
1
2
3
(c)
Figure 20. Temporal evolution of lift coefficient along the cylinder span at(a) Rem = 110, (b) Rem = 330 and (c) Rem =1100.
Re cases, corresponding principally to the lock-in regions. In the non-lock-in region,Cf v remains negative. To study the relation between lock-in/non-lock-in conditionsand fluid–structure energy transfer, a frequency decomposition of Cf v is presented infigures 22(b), (d ) and (f ). Previously selected vibration frequencies (§ 3.2) are indicatedby dashed lines. It can be observed that energy transfer occurs essentially at cross-flowvibration frequencies. The contributions of in-line vibration frequencies ([0.24, 0.36])are negligible and are not presented here.
Positive energy transfer occurs under the lock-in condition, as a comparison of thelock-in pattern (figure 13) and the Cf v frequency decomposition (figure 22) shows.Negative values of Cf v can be observed within the lock-in region, especially nearstructural vibration nodes. It is recalled that we refer only loosely to ‘nodes ofstructural vibration’, because they are not strictly nodes in the sense of zero localmotion, because of the superimposed travelling wave component. Spatial interruptionsin the lock-in pattern can induce spanwise variations of Cf v as observed in the caseRem = 1100.

Vortex-induced vibrations of a long flexible cylinder in shear flow 375
2 4 6 8 10 12 14 160
20
40
60
80
100
120
140
160
180
(Cd)max
zRem = 110Rem = 330Rem = 1100
(a)
2 4 6 8 10 12 14 160
20
40
60
80
100
120
140
160
180(b)
1.0 1.5 2.0 2.5 3.0 3.5 4.0 4.5 5.0 5.50
20
40
60
80
100
120
140
160
180
z
(c)
1 2 3 4 5 6 7 80
20
40
60
80
100
120
140
160
180
(Cl)max
(Cd)rms (Cl)rms
(d )
Figure 21. (a, b) Maximum and (c, d ) r.m.s. values of (a, c) drag and (b, d ) lift coefficientsalong the cylinder span.
In the case Rem =330, which exhibits a multi-frequency response, it has beenshown previously that lock-in occurs mainly at a single frequency at each spanwiselocation; as a consequence, positive energy transfer at each location is expected tooccur mainly at this frequency. This is verified in figure 22(d ), where white dashesare used to indicate the local predominant lock-in frequency as determined fromfigure 13(d ): the three main peaks of positive Cf v (z ≈ 18, z ≈ 38, z ≈ 57) occur at thelocally predominant lock-in frequencies.
Within the lock-in region, Cf v exhibits large spanwise variations. As noted,negative peaks can occur near vibration nodes in all studied cases. Cf v can alsobe influenced by in-line/cross-flow motion synchronization. Near z =0, a standingwave-like synchronization pattern has been identified, with alternating counter-clockwise and clockwise trajectories as z increases (figure 12). The passage fromcounter-clockwise to clockwise motion can be related to a significant reductionof Cf v . For a rigid cylinder in uniform flow, Dahl et al. (2007) reported thatcounter-clockwise orbits are more favourable to stable vibrations. Such orbits

376 R. Bourguet, G. E. Karniadakis and M. S. Triantafyllou
Modal Cfv
0.10 0.12 0.14 0.16 0.18 0.20 0.220
20
40
60
80
100
120
140
160
180
−0.01
−0.02
0
0.01
0.02
0.03
0.04
−0
−0
0
0.
0.
0.
0.
−0.2 −0.1 0 0.1 0.2 0.3 0.40
20
40
60
80
100
120
140
160
180
z
z
z
(a)
0.10 0.12 0.14 0.16 0.18 0.20 0.220
20
40
60
80
100
120
140
160
180 Modal Cfv
Modal Cfv
−0.02
−0.01
0
0.01
0.02
0.03
0.04
(b)
−0.2 −0.1 0 0.1 0.2 0.3 0.40
20
40
60
80
100
120
140
160
180(c) (d )
−0.2 0 0.2 0.4 0.60
20
40
60
80
100
120
140
160
180
Cfv
(e)
Temporal frequency
0.10 0.12 0.14 0.16 0.18 0.20 0.220
20
40
60
80
100
120
140
160
180
−0.01
0
0.01
0.02
0.03
0.04
( f )
Figure 22. Force coefficient in phase with the cylinder velocity along the cylinder span:(a, c, e) total and (b, d, f ) frequency decomposition, at (a, b) Rem = 110, (c, d ) Rem = 330 and(e, f ) Rem = 1100. The black dashed lines indicate the frequencies identified in figure 6. In(d ), the white dashes indicate the local predominant vortex shedding frequency obtained fromfigure 13 (d ).
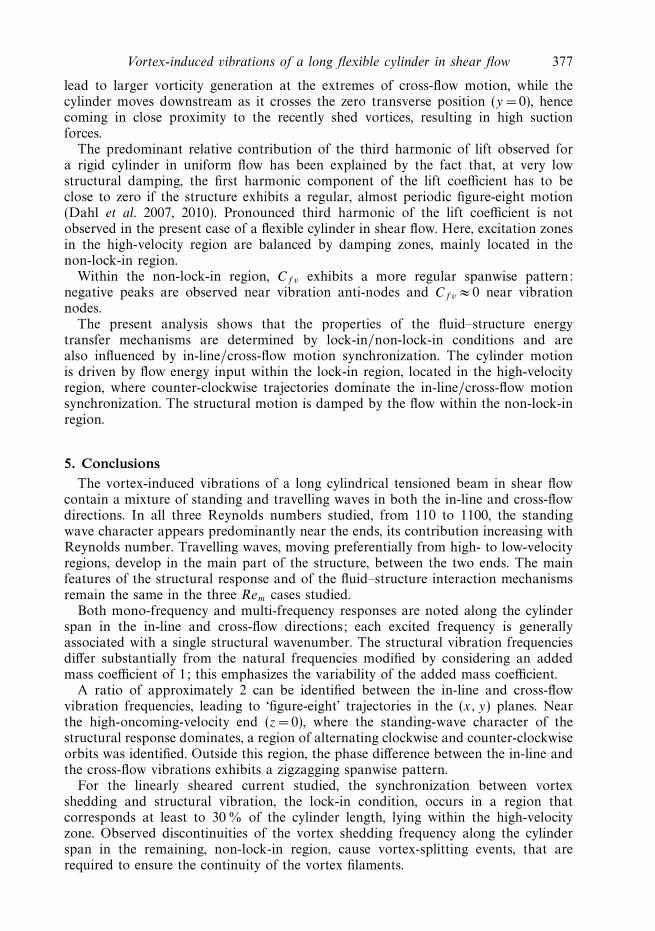
Vortex-induced vibrations of a long flexible cylinder in shear flow 377
lead to larger vorticity generation at the extremes of cross-flow motion, while thecylinder moves downstream as it crosses the zero transverse position (y = 0), hencecoming in close proximity to the recently shed vortices, resulting in high suctionforces.
The predominant relative contribution of the third harmonic of lift observed fora rigid cylinder in uniform flow has been explained by the fact that, at very lowstructural damping, the first harmonic component of the lift coefficient has to beclose to zero if the structure exhibits a regular, almost periodic figure-eight motion(Dahl et al. 2007, 2010). Pronounced third harmonic of the lift coefficient is notobserved in the present case of a flexible cylinder in shear flow. Here, excitation zonesin the high-velocity region are balanced by damping zones, mainly located in thenon-lock-in region.
Within the non-lock-in region, Cf v exhibits a more regular spanwise pattern:negative peaks are observed near vibration anti-nodes and Cf v ≈ 0 near vibrationnodes.
The present analysis shows that the properties of the fluid–structure energytransfer mechanisms are determined by lock-in/non-lock-in conditions and arealso influenced by in-line/cross-flow motion synchronization. The cylinder motionis driven by flow energy input within the lock-in region, located in the high-velocityregion, where counter-clockwise trajectories dominate the in-line/cross-flow motionsynchronization. The structural motion is damped by the flow within the non-lock-inregion.
5. ConclusionsThe vortex-induced vibrations of a long cylindrical tensioned beam in shear flow
contain a mixture of standing and travelling waves in both the in-line and cross-flowdirections. In all three Reynolds numbers studied, from 110 to 1100, the standingwave character appears predominantly near the ends, its contribution increasing withReynolds number. Travelling waves, moving preferentially from high- to low-velocityregions, develop in the main part of the structure, between the two ends. The mainfeatures of the structural response and of the fluid–structure interaction mechanismsremain the same in the three Rem cases studied.
Both mono-frequency and multi-frequency responses are noted along the cylinderspan in the in-line and cross-flow directions; each excited frequency is generallyassociated with a single structural wavenumber. The structural vibration frequenciesdiffer substantially from the natural frequencies modified by considering an addedmass coefficient of 1; this emphasizes the variability of the added mass coefficient.
A ratio of approximately 2 can be identified between the in-line and cross-flowvibration frequencies, leading to ‘figure-eight’ trajectories in the (x, y) planes. Nearthe high-oncoming-velocity end (z =0), where the standing-wave character of thestructural response dominates, a region of alternating clockwise and counter-clockwiseorbits was identified. Outside this region, the phase difference between the in-line andthe cross-flow vibrations exhibits a zigzagging spanwise pattern.
For the linearly sheared current studied, the synchronization between vortexshedding and structural vibration, the lock-in condition, occurs in a region thatcorresponds at least to 30 % of the cylinder length, lying within the high-velocityzone. Observed discontinuities of the vortex shedding frequency along the cylinderspan in the remaining, non-lock-in region, cause vortex-splitting events, that arerequired to ensure the continuity of the vortex filaments.

378 R. Bourguet, G. E. Karniadakis and M. S. Triantafyllou
The principal new findings on the fluid–structure interaction mechanismsinvolved in the VIV of long flexible cylinders in shear flow are summarized asfollows.
Wake patterns. Within both the lock-in and non-lock-in regions, mostly obliquevortex shedding is observed. The orientation of the travelling wave component of thestructural vibration, from high- to low-velocity regions, follows the orientation of theoblique vortex rows. The non-lock-in region contains discontinuous cellular patterns,composed of spanwise cells of constant shedding frequency, similar to the case of along stationary cylinder in shear flow. We find that the cell length is approximatelyequal to half the wavelength of the cross-flow structural vibration.
Orbital motion as it relates to lock-in/non-lock-in conditions. Lock-in versus non-lock-in conditions influence the phase angle between the in-line and cross-flow motions;we find mainly counter-clockwise orbits within the lock-in region. The flow providesenergy to the structure within the lock-in region, while it damps the structuralvibrations in the non-lock-in region. We find, however, that the energy input is notuniform across the entire lock-in region, due to the observed changes from counter-clockwise to clockwise structural orbits, which cause a significant reduction in theforce coefficient in phase with the velocity.
Mechanisms of multi-frequency vibration. We find that multi-frequency responsesconsist of several locally and instantaneously mono-frequency events. The overallmulti-frequency character is due to a temporal drift of the excited frequency, whichswitches smoothly among the predominant frequencies. In the lock-in region, at anygiven spanwise location, the wake is synchronized with a single vibration frequency,that also corresponds to the locally predominant frequency of the structural response.As a consequence, the lock-in condition does not occur continuously as a functionof time. In addition, the spanwise lock-in pattern is discontinuous and thus multiplevortex splitting events occur. As in the mono-frequency case, the flow excites thestructure under the lock-in condition, supplying energy mainly at a single frequencyfor a given spanwise location, even though the cylinder may exhibit, overall, a multi-frequency vibration.
The results found herein have implications for applications, especially in the field ofmarine structures, such as risers and cables in sheared ocean currents. The Reynoldsnumbers in the present study were chosen to reach the regime of turbulent wake,as this ensures capturing principal mechanisms of vortex formation. Although theReynolds numbers are relatively low compared to full-scale applications, experimentaland field studies carried out at much higher Reynolds numbers (Lie & Kaasen2006; Vandiver et al. 2009; Dahl et al. 2010) have provided evidence that importantfeatures of the free vibrations described here, such as the possibility of multi-frequencyresponse and the preferential in-line/cross-flow motion synchronization patterns, arealso observed at high Reynolds numbers. A major finding in this study is thatwhen multi-frequency response occurs, the mechanism of excitation is that of locallymono-frequency excitation; this is expected to influence the semi-empirical modellingefforts to predict VIV, which are based on short-span rigid cylinder hydrodynamicresults. As a consequence, the present results can provide insights for both thedevelopment of VIV suppression or control techniques and the elaboration ofsimplified low-order models for fatigue damage quantification and offshore structuredesign.
The authors wish to acknowledge support from the BP-MIT Major ProjectsProgramme, monitored by M. Tognarelli and P. Beynet; and the Office of Naval

Vortex-induced vibrations of a long flexible cylinder in shear flow 379
0.3 0.4 0.5 0.6 0.7 0.8 0.9 1.00
20
40
60
80
100
120
140
160
180
200
Ul
z
Buffer region
�z = 16�z = 11�z = 21
Figure 23. Oncoming flow velocity profile, including buffer regions of various sizes.
Research under grants N00014-07-1-0135 and N00014-07-1-0446, monitored byT. Swean, Jr.
Appendix A. Buffer regionA buffer region is used to enforce the spanwise periodicity of the inflow velocity
profile. The buffer region inflow velocity profile is represented by a third-orderpolynomial that ensures continuity of the velocity profile and its slope. The size of thebuffer region is chosen equal to 8 % of the cylinder length (�z = 16), in agreementwith the recommendations of Lucor et al. (2006). To quantify the influence of thebuffer region on the rest of the domain, two additional simulations with �z =11and �z =21 have been performed, at Rem = 110. The corresponding inflow velocityprofiles are plotted in figure 23. A comparison of the time-averaged in-line bendingand r.m.s. values of the structure displacements, force coefficients and cross-flowcomponent of the flow velocity in the wake, for the different buffer region sizes, ispresented in figure 24. The relative difference in the vibration frequencies is smallerthan 0.5 % between �z = 11 and �z =21 cases. It appears that the buffer regionsize has a negligible impact on the flow and structural vibrations in the rest of thedomain, as long as it remains small compared to the cylinder length.
In addition, the vibrations observed in the present work are similar to thosemeasured experimentally by Trim et al. (2005), Lie & Kaasen (2006) and Vandiveret al. (2009), for example, which corroborates the absence of spurious effects due tothe buffer region in the simulations.

380 R. Bourguet, G. E. Karniadakis and M. S. Triantafyllou
6 8 10 12
ζx
z
z
�z = 16�z = 11�z = 21
2 4 6 8
(×10−3)
0.1 0.2 0.3
20
0
40
60
80
100
120
140
160
(ζy)rms
(Cd)rms (Cl)rms (v)rms
˜(ζx)rms
(c)
20
0
40
60
80
100
120
140
160
(b)
20
0
40
60
80
100
120
140
160
(a)
( f )(e)(d )
1.2 1.4 1.6 1.8 2.0 2.2
20
0
40
60
80
100
120
140
160
1 2 3 4 5
20
0
40
60
80
100
120
140
160
0.1 0.2 0.3
20
0
40
60
80
100
120
140
160
Figure 24. Impact of the buffer region size on the: (a) time-averaged in-line displacement,and r.m.s. values of the (b) in-line displacement fluctuation, (c) cross-flow displacement,(d ) drag coefficient, (e) lift coefficient and (f ) cross-flow component of the flow velocity at(x, y) = (20, 0), along the cylinder span, at Rem = 110.
Appendix B. Computational resourcesSimulation runs have been performed on a Cray XT5 (Navy DoD Supercomputing
Resource Center – Navy DSRC) and a Cray XT4 (Engineer Research andDevelopment Center – ERDC), using one core per Fourier mode. Simulation atRem = 1 100 was conducted on 512 cores and took approximately 3 s per time step.In this case, a non-dimensional time step of 0.0005 was considered, leading toapproximately 13 000 time steps per cross-flow vibration cycle.
The typical integration time interval is approximately 600 convective time units,including approximately 300 time units of initial transient and 300 time units of data
Vortex-induced vibrations of a long flexible cylinder in shear flow 381
sampling. Data sampling is started after convergence of the time-averaged in-linedisplacement of the cylinder.
REFERENCES
Bearman, P. W. 1984 Vortex shedding from oscillating bluff bodies. Annu. Rev. Fluid Mech. 16,195–222.
Boashash, B. 2003 Time Frequency Signal Analysis and Processing: A Comprehensive Reference, 1stedn. Elsevier.
Braza, M., Faghani, D. & Persillon, H. 2001 Successive stages and the role of natural vortexdislocations in three-dimensional wake transition. J. Fluid Mech. 439, 1–41.
Brika, D. & Laneville, A. 1993 Vortex-induced vibrations of a long flexible circular cylinder. J.Fluid Mech. 250, 481–508.
Carberry, J., Sheridan, J. & Rockwell, D. 2005 Controlled oscillations of a cylinder: forces andwake modes. J. Fluid Mech. 538, 31–69.
Chaplin, J. R., Bearman, P. W., Huera-Huarte, F. J. & Pattenden, R. J. 2005 Laboratorymeasurements of vortex-induced vibrations of a vertical tension riser in a stepped current. J.Fluids Struct. 21, 3–24.
Dahl, J. M., Hover, F. S., Triantafyllou, M. S., Dong, S. & Karniadakis, G. E. 2007 Resonantvibrations of bluff bodies cause multivortex shedding and high frequency forces. Phys. Rev.Lett. 99, 144503.
Dahl, J. M., Hover, F. S., Triantafyllou, M. S. & Oakley, O. H. 2010 Dual resonance invortex-induced vibrations at subcritical and supercritical Reynolds numbers. J. Fluid Mech.643, 395–424.
Evangelinos, C. & Karniadakis, G. E. 1999 Dynamics and flow structures in the turbulent wakeof rigid and flexible cylinders subject to vortex-induced vibrations. J. Fluid Mech. 400, 91–124.
Facchinetti, M. L., de Langre, E. & Biolley, F. 2004 Vortex-induced travelling waves along acable. Eur. J. Mech. B/Fluids 23, 199–208.
Flemming, F. & Williamson, C. H. K. 2005 Vortex-induced vibrations of a pivoted cylinder. J.Fluid Mech. 522, 215–252.
Gaster, M. 1969 Vortex shedding from slender cones at low Reynolds numbers. J. Fluid Mech. 38,565–576.
Gaster, M. 1971 Vortex shedding from circular cylinders at low Reynolds numbers. J. Fluid Mech.46, 749–756.
Griffin, O. M. 1985 Vortex shedding from bluff bodies in a shear flow: a review. J. Fluids Engng107, 298–306.
Hover, F. S., Techet, A. H. & Triantafyllou, M. S. 1998 Forces on oscillating uniform andtapered cylinders in crossflow. J. Fluid Mech. 363, 97–114.
Huera-Huarte, F. J. & Bearman, P. W. 2009a Wake structures and vortex-induced vibrations of along flexible cylinder. Part 1. Dynamic response. J. Fluids Struct. 25, 969–990.
Huera-Huarte, F. J. & Bearman, P. W. 2009b Wake structures and vortex-induced vibrationsof a long flexible cylinder. Part 2: Drag coefficients and vortex modes. J. Fluids Struct. 25,991–1006.
Huera-Huarte, F. J., Bearman, P. W. & Chaplin, J. R. 2006 On the force distribution along theaxis of a flexible circular cylinder undergoing multi-mode vortex-induced vibrations. J. FluidsStruct. 22, 897–903.
Jaiswal, V. & Vandiver, J. K. 2007 VIV response prediction for long risers with variable damping. InProceedings of the 26th International Conference on Offshore Mechanics and Arctic Engineering(OMAE2007-29353).
Jauvtis, N. & Williamson, C. H. K. 2004 The effect of two degrees of freedom on vortex-inducedvibration at low mass and damping. J. Fluid Mech. 509, 23–62.
Jeon, D. & Gharib, M. 2001 On circular cylinders undergoing two-degree-of-freedom forcedmotions. J. Fluids Struct. 15, 533–541.
Kappler, M., Rodi, W., Szepessy, S. & Badran, O. 2005 Experiments on the flow past long circularcylinders in a shear flow. Exp. Fluids 38, 269–284.

382 R. Bourguet, G. E. Karniadakis and M. S. Triantafyllou
Karniadakis, G. E. & Sherwin, S. 1999 Spectral/hp Element Methods for CFD, 1st edn. OxfordUniversity Press.
Lie, H. & Kaasen, K. E. 2006 Modal analysis of measurements from a large-scale VIV model testof a riser in linearly sheared flow. J. Fluids Struct. 22, 557–575.
Lucor, D. 2004 Generalized polynomial chaos: applications to random oscillators and flowstructureinteractions. PhD Thesis, Brown University.
Lucor, D., Imas, L. & Karniadakis, G. E. 2001 Vortex dislocations and force distribution of longflexible cylinders subjected to sheared flows. J. Fluids Struct. 15, 641–650.
Lucor, D., Mukundan, H. & Triantafyllou, M. S. 2006 Riser modal identification in CFD andfull-scale experiments. J. Fluids Struct. 22, 905–917.
Mathelin, L. & de Langre, E. 2005 Vortex-induced vibrations and waves under shear flow with awake oscillator model. Eur. J. Mech. B/Fluids 24, 478–490.
Modarres-Sadeghi, Y., Mukundan, H., Dahl, J. M., Hover, F. S. & Triantafyllou, M. S. 2010The effect of higher harmonic forces on fatigue life of marine risers. J. Sound Vib. 329, 43–55.
Mukhopadhyay, A., Venugopal, P. & Vanka, S. P. 1999 Numerical study of vortex shedding froma circular cylinder in linear shear flow. J. Fluids Engng 121, 460–468.
Newman, D. J. & Karniadakis, G. E. 1997 A direct numerical simulation study of flow past afreely vibrating cable. J. Fluid Mech. 344, 95–136.
Noack, B. R., Ohle, F. & Eckelmann, H. 1991 On cell formation in vortex streets. J. Fluid Mech.227, 293–308.
Peltzer, R. D. & Rooney, D. M. 1985 Vortex shedding in a linear shear flow from a vibratingmarine cable with attached bluff bodies. J. Fluids Engng 107, 61–66.
Persillon, H. & Braza, M. 1998 Physical analysis of the transition to turbulence in the wake of acircular cylinder by three-dimensional Navier–Stokes simulation. J. Fluid Mech. 365, 23–88.
Piccirillo, P. S. & Van Atta, C. W. 1993 An experimental study of vortex shedding behind linearlytapered cylinders at low Reynolds number. J. Fluid Mech. 246, 163–195.
Sarpkaya, T. 1995 Hydrodynamic damping, flow-induced oscillations, and biharmonic response. J.Offshore Mech. Arctic Engng 117, 232–238.
Sarpkaya, T. 2004 A critical review of the intrinsic nature of vortex-induced vibrations. J. FluidsStruct. 19, 389–447.
Stansby, P. K. 1976 The locking-on of vortex shedding due to the cross-stream vibration of circularcylinders in uniform and shear flows. J. Fluid Mech. 74, 641–665.
Techet, A. H., Hover, F. S. & Triantafyllou, M. S. 1998 Vortical patterns behind a taperedcylinder oscillating transversely to a uniform flow. J. Fluid Mech. 363, 79–96.
Trim, A. D., Braaten, H., Lie, H. & Tognarelli, M. A. 2005 Experimental investigation ofvortex-induced vibration of long marine risers. J. Fluids Struct. 21, 335–361.
Vandiver, J. K., Jaiswal, V. & Jhingran, V. 2009 Insights on vortex-induced, traveling waves onlong risers. J. Fluids Struct. 25, 641–653.
Violette, R., de Langre, E. & Szydlowski, J. 2007 Computation of vortex-induced vibrationsof long structures using a wake oscillator model: comparison with DNS and experiments.Comput. Struct. 85, 1134–1141.
Williamson, C. H. K. 1989 Oblique and parallel modes of vortex shedding in the wake of a circularcylinder at low Reynolds numbers. J. Fluid Mech. 206, 579–627.
Williamson, C. H. K. 1992 The natural and forced formation of spot-like ‘vortex dislocations’ inthe transition of a wake. J. Fluid Mech. 243, 393–441.
Williamson, C. H. K. & Govardhan, R. 2004 Vortex-induced vibrations. Annu. Rev. Fluid Mech.36, 413–455.
Williamson, C. H. K. & Roshko, A. 1988 Vortex formation in the wake of an oscillating cylinder.J. Fluids Struct. 2, 355–381.
Zhang, H.-Q., Fey, U., Noack, B. R., Konig, M. & Eckelmann, H. 1995 On the transition of thecylinder wake. Phys. Fluids 7, 779–794.