Embed Size (px)
Citation preview

Rijkswaterstaat Technisch Document (RTD)
Validation of the Guidelines for Nonlinear Finite Element Analysis of Concrete Structures
Part: Pre-stressed beams
Doc.nr.: RTD 1016-3B:2017
Versie: 1.0 Status: Final Datum: 15 June 2017
Water. Wegen. Werken. Rijkswaterstaat

Rijkswaterstaat Centre for Infrastructure
Validation of the Guidelines for Nonlinear Page 2 of 113
Finite Element Analysis of Concrete Structures Issued: 15 June 2017
Part: Pre-stressed beams Version: 1.0
RTD: 1016-3B:2017 Status: Final
Preface
At an international workshop on shear force capacities of concrete structural element,
held in Rotterdam, the Netherlands in 2007, predictions of the ultimate limit state of
three different girder experiments were presented. This workshop was initiated by the
Dutch Ministry of Infrastructure and organized by TNO (Vervuurt & Leeghwater,
2008). The ultimate capacities, predicted by six teams using different nonlinear
software packages, showed a large scatter. Also the predicted crack patterns showed a
large scatter.
With this in mind, research on the development of a “guideline for nonlinear analysis
of concrete girders” was started. The fib Model Code 1990 was the background
document when Peter Feenstra started with the development of the guideline. Also,
Joop den Uijl was involved in validating the guidelines. From 2010 the draft version of
the fib Model Code 2010 was used as background document. Today, both the MC2010
and the Eurocode2 allow the use of nonlinear analysis to verify the design capacity of
concrete objects.
The validation of the guidelines is done by simulating old and new experiments. To
verify human and software factors, several people were involved in this project and
two commercially available software packages were used. Finally the first version of
the guideline was published in May 2012. It is used by the Dutch Ministry of
Infrastructure and the Environment when commissioning engineering work for re-
examinations of existing concrete structures in the Netherlands to reveal extra
remaining structural capacity.
To verify whether the guideline is also valid for a larger group of international end-
users and for other software packages, a prediction contest of T-shaped prestressed
girders was set up in 2014. The tests were performed by Sebastiaan Ensink in the
Stevin Laboratory of the Delft University of Technology. The participants of the
contest gathered in a workshop in Parma. The outcome of this contest showed that the
guidelines are indeed helpful for reducing model and human factors when predicting
the behaviour of concrete structures by means of nonlinear finite element analysis.
As a result of additional validation studies and making use of the experiences of the
workshop in Parma a new version of the guidelines has been published in 2016. The
present document gives an overview of validations studies for this version of the
guideline. Maciej Kraczla has contributed to this document.
This document is one from a series of documents. At the time of writing, the
following documents have been drafted:
RTD 1016-1: Guidelines for Nonlinear Finite Element Analysis of Concrete
Structures
RTD 1016-2: Validation of the Guidelines for Nonlinear Finite Element
Analysis of Concrete Structures - Part: Overview of results
RTD 1016-3A: Validation of the Guidelines for Nonlinear Finite Element
Analysis of Concrete Structures - Part: Reinforced beams
RTD 1016-3B: Validation of the Guidelines for Nonlinear Finite Element
Analysis of Concrete Structures - Part: Prestressed beams
RTD 1016-3C: Validation of the Guidelines for Nonlinear Finite Element
Analysis of Concrete Structures - Part: Slabs
Beatrice Belletti, Cecilia Damoni, Max A.N. Hendriks, Ane de Boer
March 2017

Rijkswaterstaat Centre for Infrastructure
Validation of the Guidelines for Nonlinear Page 3 of 113
Finite Element Analysis of Concrete Structures Issued: 15 June 2017
Part: Pre-stressed beams Version: 1.0
RTD: 1016-3B:2017 Status: Final
Contents Preface ............................................................................................................................ 2
1 Introduction ............................................................................................................ 5
1.1 Background .................................................................................................... 5
1.2 Scope and objectives ...................................................................................... 5
1.3 Outline ........................................................................................................... 6
2 Methods used for modelling reinforced concrete members .................................... 7
2.1 Analytical code provisions ............................................................................. 7
2.2 Nonlinear finite element modelling approach ................................................ 7
2.3 Nonlinear finite element limit state verifications ........................................... 8
3 Case PB1: Leonhardt, Koch et al. (1973) ............................................................... 9
3.1 Experimental setup and results ...................................................................... 9
3.2 Analytical analysis ....................................................................................... 13
3.3 Finite element model .................................................................................... 16
3.4 Nonlinear finite element analysis ................................................................. 21
3.5 Application of safety format ........................................................................ 29
3.6 Parametric study on crack models ............................................................... 32
3.7 Concluding remarks ..................................................................................... 33
4 Case PB2 (NSEL): Sun and Kuchma (2007) ........................................................ 35
4.1 Experimental setup and results .................................................................... 35
4.2 Analytical analysis ....................................................................................... 38
4.3 Finite element model .................................................................................... 42
4.4 Nonlinear finite element analysis ................................................................. 48
4.5 Application of safety format ........................................................................ 54
4.6 Parametric study on crack models ............................................................... 57
4.7 Concluding remarks ..................................................................................... 59
5 Case PB3 (MnDOT): Runzell et al. (2007) .......................................................... 60
5.1 Experimental setup and results .................................................................... 60
5.2 Analytical analysis ....................................................................................... 65
5.3 Finite element model .................................................................................... 70
5.4 Nonlinear finite element analysis ................................................................. 76
5.5 Application of safety format ........................................................................ 81
5.6 Parametric study on crack models ............................................................... 83
5.7 Concluding remarks ..................................................................................... 84
6 Case PB4: Leonhardt, Koch et Rostásy (1973) .................................................... 86
6.1 Experimental setup and results .................................................................... 86
6.2 Analytical analysis ....................................................................................... 90

Rijkswaterstaat Centre for Infrastructure
Validation of the Guidelines for Nonlinear Page 4 of 113
Finite Element Analysis of Concrete Structures Issued: 15 June 2017
Part: Pre-stressed beams Version: 1.0
RTD: 1016-3B:2017 Status: Final
6.3 Finite element model .................................................................................... 94
6.4 Nonlinear finite element analysis ................................................................. 99
6.5 Application of safety format ...................................................................... 107
6.6 Parametric study on crack models ............................................................. 110
6.7 Concluding remarks ................................................................................... 111
References .................................................................................................................. 113

Rijkswaterstaat Centre for Infrastructure
Validation of the Guidelines for Nonlinear Page 5 of 113
Finite Element Analysis of Concrete Structures Issued: 15 June 2017
Part: Pre-stressed beams Version: 1.0
RTD: 1016-3B:2017 Status: Final
1 Introduction
In the period 2008-2015 the Dutch Ministry of Infrastructure and the Environment has
financed a project leading to a set of guidelines for the nonlinear finite element analysis
of concrete structures (RWS, 2016). Apart from the guidelines document itself, the
project resulted in the present publication: a document that describes the validation of
the guidelines.
This introductory chapter begins with describing the background of the project. It
continues with presenting the objectives and the outline of the present validation report.
1.1 Background
Modern codes of practice for civil engineering projects offer so-called levels-of-
approximations (Muttoni & Ruiz, 2012). Depending on the stage of the project, e.g.
preliminary design, executive design or a reassessment study, a modern code
distinguishes several levels of design expressions and design methods. The fib Model
Code for concrete structures 2010 (fib, 2013) is a good example. The idea is: the higher
the level-of-approximation, the more sophisticated the analysis, the more realistic the
estimation of the safety, the more possibilities of finding “hidden” structural capacities,
the higher is the likelihood of avoiding over-conservative designs and reassessments,
the more probable is that unnecessary costs can be avoided. The highest level-of-
approximation, sometimes denoted as level IV, is a design or a reassessment method
based on nonlinear finite element analysis.
Whereas the lower levels-of-approximations are usually well-described using clear-cut
expressions, applicability statements and examples, the situation is remarkably
different when it comes to using nonlinear finite element analysis for design or
reassessment studies. The fib Model Code has made an important step by providing
safety formats to be used in connection with nonlinear finite element analysis. These
safety formats define safety factors for the material properties and the global structural
resistance. However the development of specifications on how to perform the analyses
has not kept pace with the development of safety formats. It is beyond doubt that the
results of nonlinear finite element analysis can be substantially influenced by model
and human factors.
1.2 Scope and objectives
The development of the guidelines for the nonlinear finite element analysis of concrete
structures (RWS, 2016) has the primary goal to advice the analysts and consequently to
reduce the model and human factors. The development of the guidelines went hand in
hand with the performance of numerical benchmark studies. The guidelines were tuned
and, in the end, validated by comparing the results of numerical analyses with
experimental results. It is believed that by this process a coherent set of advices was
obtained. This document gives an overview of the main case studies that were used
during the development of the guidelines.
The case studies include numerical examples with reinforced concrete beams,
prestressed beams and slabs. The main objective is to compare the results of the
numerical analyses with the experimental results for these cases and, in this way, to
validate the set of advices.

Rijkswaterstaat Centre for Infrastructure
Validation of the Guidelines for Nonlinear Page 6 of 113
Finite Element Analysis of Concrete Structures Issued: 15 June 2017
Part: Pre-stressed beams Version: 1.0
RTD: 1016-3B:2017 Status: Final
Next to the main objective, the case studies reported in this document are used to
demonstrate sensitivities of modelling choices, to compare the applications of different
safety formats and to show examples of documenting finite element analysis results.
1.3 Outline
After this introductory chapter, Chapter 2 summarizes the used methods. Each
subsequent chapter addresses a single case study of a reinforced concrete beam. These
chapters use a similar structure of sections, describing respectively: the experimental
setup and results, the finite element model adopting the advices of the guidelines,
analytical verifications, the nonlinear finite element results using mean or “measured”
material properties and the application of safety formats. Additional sections are e.g.
used to show sensitivity studies.

Rijkswaterstaat Centre for Infrastructure
Validation of the Guidelines for Nonlinear Page 7 of 113
Finite Element Analysis of Concrete Structures Issued: 15 June 2017
Part: Pre-stressed beams Version: 1.0
RTD: 1016-3B:2017 Status: Final
2 Methods used for modelling reinforced concrete members
This chapter summarizes the methods that are used in the subsequent chapters.
2.1 Analytical code provisions
The analytical methods used in this report are based on the CEN Eurocode 2 (EC,
2005) and the fib Model Code 2010 (fib, 2013).
2.2 Nonlinear finite element modelling approach
There is a great variety of modelling options for modelling the nonlinear behaviour of
concrete structures. The guidelines for the nonlinear finite element analysis of concrete
structures (RWS, 2016) comprise specific modelling choices. It is important to
consider these modelling choices as a coherent set of advices. For the details about
these advises the reader is referred to the guidelines document itself. This section
includes a summary of the main advices.
Units. The preferred units are the base units of the International System of Units (SI).
Possibly, the length unit might be replaced by millimetres.
Constitutive models for concrete. Smeared cracking models are considered. A total
strain-based rotating or fixed crack model is preferred. Adequate tensile softening and
compressive hardening-softening relations should be considered, based on the
specification of tensile and compressive fracture energies and the definition of
equivalent lengths to define “crack-band” widths. For the fixed crack models variable
shear retention models are recommended. Tension-compression interaction needs to be
addressed in structures subjected to multi-axial stress states. These include the
reduction of the compressive strength due to lateral cracking and a diminishing Poisson
effect upon cracking.
Constitutive models for reinforcement. Elasto-plastic material models with
hardening should be used.
Constitutive models for concrete-reinforcement interaction. At the macro-level,
simplified models can be used, taking into account tension stiffening effects. Limited
attention is devoted to modelling slip and dowel action. These aspects should not be
significant in the global behaviour of a structure and are more related to details near the
USL load level.
Finite elements for concrete. Elements with quadratic interpolation of the
displacement field should be used. Typically, at least 6 elements over the height of a
structural element should be used.
Finite elements for reinforcement. Embedded reinforcement elements are preferred;
both embedded bars and grids can be used.
Prestressing. Prestressing should be applied taking into account prestress losses.
Existing cracks. Existing cracks in the structure should be taken into account
whenever detailed information about the location and crack widths is available.

Rijkswaterstaat Centre for Infrastructure
Validation of the Guidelines for Nonlinear Page 8 of 113
Finite Element Analysis of Concrete Structures Issued: 15 June 2017
Part: Pre-stressed beams Version: 1.0
RTD: 1016-3B:2017 Status: Final
Loads. The design codes and national guidelines in force should be applied.
Boundary conditions. Unless the objective of the analysis is to study the detailed
behaviour of the loading and support points, the supports and loading platens should be
modelled such that local stress concentrations are reduced.
Loading. The loading sequence will contain an initial phase where dead weight,
permanent loads and, if appropriate, prestressing is applied to the structure. Following
the initial phase, the variable loads are increased until a clear failure mode is present or
a significant load reduction was achieved.
Note that in the current report, for all cases, we are referring to experimental tests. For
this reason, when safety formats are applied to obtain the design resistance, we are
considering a load combination of action with a partial safety factor related to self-
weight of 1.0.
Equilibrium iterations. Equilibrium between internal and external forces should be
achieved iteratively using a Newton-Raphson method with arc-length procedure.
Preferably an energy-norm together with a force-norm should be used.
All analyses have been performed with Diana 9.4.4.
2.3 Nonlinear finite element limit state verifications
Serviceability limit states. As requested by current codes (EC2, MC2010)
serviceability limit states verifications must be performed as post-analysis checks. For
the crack opening calculation, the average strain values are obtained from the analysis,
whereas crack spacings are obtained from codes.
Ultimate limit states. Three alternative methods to obtain the design resistance from
the non-linear finite element analysis: the Global Resistance Factor method (GRF), the
Partial Factor method (PF) and the Estimate of Coefficient of Variation or resistance
method (ECOV).

Rijkswaterstaat Centre for Infrastructure
Validation of the Guidelines for Nonlinear Page 9 of 113
Finite Element Analysis of Concrete Structures Issued: 15 June 2017
Part: Pre-stressed beams Version: 1.0
RTD: 1016-3B:2017 Status: Final
3 Case PB1: Leonhardt, Koch et al. (1973)
The first analysed case is a prestressed beam IP1 from the experiments of Leonhardt. In
these experiments a total of ten beams were tested. Beam PB1 (IP1 in experiments) is
selected as case study due to its flexural-compressive failure mechanism.
3.1 Experimental setup and results
Geometry The beam has a total length of 7.0m, a span of 6.5m, a depth of 0.9m and a variable
thickness of the web. The geometry, cross-sections, experimental set-up and
reinforcement layout are presented in Figure 3-1 and Figure 3-2. The beam is
reinforced in the longitudinal direction with bars ϕ8 and ϕ14 and non-symmetric
stirrups ϕ16 on the left hand side and ϕ12 on the right hand side spaced 140mm.
The prestressing reinforcement consists of 2 post-tensioned tendons prestressed at both
sides made of 1212.2 strands each; the initial stress in each tendon is equal to 635
MPa. The assumed cover of 20 mm is considered.
Figure 3-1 Case PB1. Elevation and cross-sectional details (dimensions in
cm)(Leonhardt et al. 1973)

Rijkswaterstaat Centre for Infrastructure
Validation of the Guidelines for Nonlinear Page 10 of 113
Finite Element Analysis of Concrete Structures Issued: 15 June 2017
Part: Pre-stressed beams Version: 1.0
RTD: 1016-3B:2017 Status: Final
Figure 3-2: Case PB1. Reinforcement (dimensions in cm) (Leonhardt et al. 1973)
Figure 3-3: Case PB1. Reinforcement cage and prestressing cables (Leonhardt et al.
1973)
Material Properties Concrete and reinforcement properties as given in references are outlined in Table 3-1.
Table 3-1: Case PB1. Concrete and reinforcement properties
Concrete properties
fcm (N/mm2) fctm,sp (N/mm
2) Ec (N/mm
2) dmax (mm)
25.3 2.4 26675 22
Reinforcement properties
Bar
(mm)
As
(mm2)
Es
(N/mm2)
fym
(N/mm2)
ftm
(N/mm2)
12 12.0 113 203000 500 611
16 16.0 201 195000 400 512
8 8.0 50 197000 460 567
14 14.0 154 207000 397 517
12.2 12×12.2 12×117 207000 1225 1363
Loading and Boundary Conditions Loading and boundary conditions of the experimental setup are shown in Figure 3-4
and Figure 3-5. The force unit used in the reference is Mp (megaponds) which is
approximately equivalent to 9.086 kN. The prestressing was applied at a load level of
995 kN (101.5 Mp) at each cable and after the losses the measured prestressing was
equal to 891 kN in each cable. The counteracting point load equal to 196kN (20Mp)
was applied simultaneously with prestressing of the tendons. Subsequently, the beam
was subjected to 3 point bending until failure.

Rijkswaterstaat Centre for Infrastructure
Validation of the Guidelines for Nonlinear Page 11 of 113
Finite Element Analysis of Concrete Structures Issued: 15 June 2017
Part: Pre-stressed beams Version: 1.0
RTD: 1016-3B:2017 Status: Final
Figure 3-4: Case PB1. Loading and boundary conditions (Leonhardt et al. 1973)
Figure 3-5: Case PB1. Experimental setup (Leonhardt et al. 1973)
Experimental Results At the load equal to 1897.5 kN (193.5Mp) no further loading was possible and the
beam exhibited a flexural-compressive failure mode. In Figure 3-6 the experimental
crack pattern is shown at a load equal to 1765 kN (180 Mp). The development of the
crack pattern is shown in Figure 3-7. The measured deflections at various points across
the span are shown in Table 3-2. The load-deflection curve of the center of the beam
(point D0) is shown in Figure 3-8.
Figure 3-6: Case PB1. Crack pattern at load 1765 kN (Leonhardt et al. 1973)

Rijkswaterstaat Centre for Infrastructure
Validation of the Guidelines for Nonlinear Page 12 of 113
Finite Element Analysis of Concrete Structures Issued: 15 June 2017
Part: Pre-stressed beams Version: 1.0
RTD: 1016-3B:2017 Status: Final
Figure 3-7: Case PB1. Development of the crack pattern during the experiment
(Leonhardt et al. 1973)
Figure 3-8: Case PB1. Load-deflection of point D0
Beam IP1
P=981 kN
P=1177 kN
P=1373 kN
P=1570 kN
P=1570 kN
-5
0
5
10
15
20
25
30
35
0 40 80 120 160 200
Def
lect
ion
(m
m)
Last P (Mp)
D0

Rijkswaterstaat Centre for Infrastructure
Validation of the Guidelines for Nonlinear Page 13 of 113
Finite Element Analysis of Concrete Structures Issued: 15 June 2017
Part: Pre-stressed beams Version: 1.0
RTD: 1016-3B:2017 Status: Final
Table 3-2: Case PB1. Measured deflection at various points across the span (Leonhardt
et al. 1973)
3.2 Analytical analysis
In Figure 3-9 the load configuration at failure is depicted.
Figure 3-9: Case PB1. Load configuration at failure (force in kN, dimensions in m)
Load case 1:
self-weight:
Figure 3-10: Case PB1: Load case 1: self-weight. Internal forces (dimensions in m)
prestressing

Rijkswaterstaat Centre for Infrastructure
Validation of the Guidelines for Nonlinear Page 14 of 113
Finite Element Analysis of Concrete Structures Issued: 15 June 2017
Part: Pre-stressed beams Version: 1.0
RTD: 1016-3B:2017 Status: Final
Figure 3-11: Case PB1: Load case 1: prestressing. Internal forces
Counteracting point load
Figure 3-12: Case PB1. Load case 1: Counteracting point load: Internal forces
Load case 2: point load
Figure 3-13: Case PB1. Load case 2: internal forces (dimensions in m)

Rijkswaterstaat Centre for Infrastructure
Validation of the Guidelines for Nonlinear Page 15 of 113
Finite Element Analysis of Concrete Structures Issued: 15 June 2017
Part: Pre-stressed beams Version: 1.0
RTD: 1016-3B:2017 Status: Final
Bending moment resistance:
The height of compression zone is calculated assuming a bilinear stress block and
elastic-plastic relationship for reinforcing and prestressing steel. The partial safety
factors were taken as: 1.15 for reinforcement and prestressing steel and 1.5 for
concrete. The compression zone was determined from the horizontal force equilibrium
assuming yielding strains in steel in the top and bottom flanges as well as yielding of
one row of steel in the web; see figure below
ydangeSteelTopFlcp,ydpp,pssSteelWebydSteelWebydmFlangeSteelBotto fAF)σ(fAσAΕεAfAfA infinf
The resulting height is mmxCompZone 337
Figure 3-14: Case PB1: Determination of design bending moment resistance
Ultimate moment resistance was calculated around the centroidal axis.
kNmmm.kN.kNm.kNm.m.m.kN.
m.m.kN.m.kNmmh)σ( fA
hmmmmΕεAmmmmhfA
)c(zfA)c(zfAy)(zF
p,ydp
ssSteelWebydSteelWeb
mSteelBottocbydmFlangeSteelBottoSteelTopctydangeSteelTopFlctc
148457450192633339100880450417
208804508357734702389572
218321751831752
inf
The maximum load that the beam can carry follows from the summation of all the
internal forces from loads, Figure 3-10-Figure 3-13 and equating them to the bending
moment resistance.
kNPkNmPm.kNm.kNm.kNm.kNm. Rd 1097148422535318723884456367
Shear force resistance:
Resistance attributed to stirrups:
kN..MPa.mmmm
mmθzf
s
AV ywd
swRd,s 48416729cot8393754
140
226cot
2
Crushing of concrete compressive struts:
kN.).().(
MPa,mmmm.
)(
fzνbαV cdwcw
Rd,c 068426729tan6729cot
5411754300251
tan)cot(
1
Where the effective shear depth z was calculated according to (Model Code 2010):
ppss
ppss
AzAz
AzAzz
22
Shear resistance after extraction of the shear force due to self-weight (considered at
distance d from the support and equal around 30kN) is kNkNkN 4.811304.841 . The
maximum load P which the beam can withstand without failing in shear is:
kNkNPRd 8.16224.8112 .
From the comparison of the points corresponding to the bending and shear failures, it
can be concluded that because kNkN 8.16221097 , the beam fails in flexure.

Rijkswaterstaat Centre for Infrastructure
Validation of the Guidelines for Nonlinear Page 16 of 113
Finite Element Analysis of Concrete Structures Issued: 15 June 2017
Part: Pre-stressed beams Version: 1.0
RTD: 1016-3B:2017 Status: Final
In Table 3-3 the design value of beam resistance expressed in terms of applied load PRd
obtained with the Eurocode 2 (CEN, 2005) and the Model Code 2010 (fib, 2013)
expressions is highlighted.
Table 3-3: Case PB1. Design value of beam resistance expressed in terms of applied
load PRd
PRd (EC2 – MC2010)
(kN)
1097
3.3 Finite element model
Units Units are N, mm.
Material models and parameters The concrete model is based on a total strain rotating crack model with
exponential softening in tension and parabolic behavior in compression,
variable Poisson’s ratio of concrete,
reduction of compressive strength of concrete due to lateral cracking with a
lower limit of 0.6 and
increase in compressive strength due to lateral confinement according to the
model proposed by Selby and Vecchio (Selby and Vecchio 1993).
The mechanical properties are summarized in Table 3-4. In the input file of the
analysis, the GF value has been decreased with a factor 2 in order to compensate for
an underestimation of the crack band width for cracks with an inclination angle of 45
degrees, 093021310 ./.GF,reduced . The uniaxial stress-strain curve is shown in Figure
3-15.
The model for the reinforcement bars and stirrups is based on hardening plasticity.
Geometrical and mechanical properties of reinforcement are summarized in Table 3-1.
The stress-strain curve of the bars 8 is plotted in Figure 3-16.
Table 3-4: Case PB1. Constitutive model parameters for concrete
fcm
(N/mm2)
fctm
(N/mm2)
Ec
(N/mm2)
ν GF
(Nmm/mm2)
Mean measured
values 25.3 2.16
** 26675 var 0.131
*
*Not specified in reference;
estimated according to Model Code 2010 (fib, 2013)
**Estimated from the mean splitting tensile strength of concrete as ctm,spctm f.f 90
according to Eurocode 2 formulation (CEN, 2005).
According to Model Code 2010 (fib, 2013) the mean tensile strength of concrete can be
estimated from the mean tensile strength of concrete as ctm,spctm ff 1 ; hence
reasonable values of mean tensile strength of concrete used in calculation range from
ctm,spf.90 and ctm,spf1

Rijkswaterstaat Centre for Infrastructure
Validation of the Guidelines for Nonlinear Page 17 of 113
Finite Element Analysis of Concrete Structures Issued: 15 June 2017
Part: Pre-stressed beams Version: 1.0
RTD: 1016-3B:2017 Status: Final
Figure 3-15: Case PB1. Stress-strain curve for concrete
Figure 3-16: Case PB1. Stress-strain curve adopted for bars 8
For the steel plates a linear elastic behavior is assumed, see Table 3-5.
Table 3-5: Case PB1. Steel plates properties
E
(N/mm2)
200000 0.3
Interface elements were applied between the steel plates and the concrete beam at the
supports and at the loading location. The interface stiffness was derived on the basis of
concrete properties. The total thickness of interface elements equals 1 mm.
-800
-600
-400
-200
0
200
400
600
800
-0.020 -0.012 -0.004 0.004 0.012 0.020s(N
/mm
2)
e

Rijkswaterstaat Centre for Infrastructure
Validation of the Guidelines for Nonlinear Page 18 of 113
Finite Element Analysis of Concrete Structures Issued: 15 June 2017
Part: Pre-stressed beams Version: 1.0
RTD: 1016-3B:2017 Status: Final
A bilinear behavior in the normal direction (see Figure 3-17) and a linear elastic
relation in the shear direction were assumed. The normal stiffness in tension and the
stiffness in the shear direction were taken as almost equal to zero. For stableness of the
analysis horizontal displacements of one pair of nodes across the interface elements of
support plates and loading plate were tied. The mechanical properties of the interface
elements are summarized in Table 3-6.
Figure 3-17: Case PB1. Traction-displacement diagram in normal direction for
interfaces
Table 3-6: Case PB1. Interface properties
Knn in tension
(N/mm3)
Knn in compression
(N/mm3)
Kt
(N/mm3)
2.68E-02 2.68E+04 2.68E-02
Element types and finite element mesh To discretize concrete beam, 8-node membrane elements (CQ16M) with a full
integration scheme (3x3) were used. The average element size is 50×55 mm2. The
reinforcement bars and stirrups were modelled with embedded truss elements with two
Gauss integration points along the axis of the element and the assumption of perfect
bond. For the steel plates 8-node membrane elements (CQ16M) were used. The 6-node
interfaces elements have three Lobatto integration points.
The dimensions of the beam and the transversal cross section used in the numerical
analyses are given in Figure 3-18 and Figure 3-19 respectively.
Figure 3-18: Case PB1. Dimensions adopted for the beam (in m)
sn (N/mm )2
un (mm)10
2.68
3
-103
x101
2.68x10⁷

Rijkswaterstaat Centre for Infrastructure
Validation of the Guidelines for Nonlinear Page 19 of 113
Finite Element Analysis of Concrete Structures Issued: 15 June 2017
Part: Pre-stressed beams Version: 1.0
RTD: 1016-3B:2017 Status: Final
(a)
(b)
Figure 3-19: Case PB1. (a) Web thickness variation along length of the beam
(dimension in mm) (b) Dimensions adopted for the transversal cross section of the
beam (in mm)
The mesh of the beam is presented in Figure 3-20(a). The web thickness variation
along the length of the beam was modeled as plotted in Figure 3-20(b). The groups
name used to model the web thickness variation, starting from the end to the middle of
the beam are: WEB_RING, WEB_VA, WEB_VB, WEB_VC, WEB_VD, WEB_VE,
WEB_VF, WEB_VG, WEB_VH, WEB_VI, WEB_VL, WEB_VM and WEB_VN.
The different materials are indicated with different colors in Figure 3-20(c).
Different groups of elements were generated to distinguish the concrete elements that
can crush during the analyses and the steel elements that can yield during the analysis.
In that way these groups of elements can be monitored during the analysis in order to
determine the failure mode. For monitoring yielding of steel, groups “REBTOPF14”,
“REBWEBF8”, “REBBOTTF8”, “STIRRLEFTF16”, “STIRRRIGHTF12”,
“STRANDS” are created and indicated in Figure 3-21(a). Figure 3-21 shows the
groups of elements named CRUSHING and SHEAR, used for tracking the inelastic
behavior of concrete in compression. The group of elements named CRUSHING has a
length equal to 5 times the length of the loading steel plate and a depth equal to the
length of the loading steel plate, whereas the group of element named SHEAR has a
length equal to the space between the end of the loading plate and the end of the
support plate and a depth equal to the distance between upper and lower reinforcement.

Rijkswaterstaat Centre for Infrastructure
Validation of the Guidelines for Nonlinear Page 20 of 113
Finite Element Analysis of Concrete Structures Issued: 15 June 2017
Part: Pre-stressed beams Version: 1.0
RTD: 1016-3B:2017 Status: Final
(a)
(b)
(c)
Figure 3-20: Case PB1. (a) Mesh, (b) modeling of web thickness variation, (c) material
sets
(a)
Figure 3-21: Case PB1. Groups of steel elements monitoring (a) yielding of
reinforcement, (b) inelastic behavior of concrete
WE
B_
RIN
G
WE
B_
VA
WE
B_
VB
WE
B_
VC
WE
B_
VD
WE
B_
VE
WE
B_
VF
WE
B_
VG
WE
B_
VH
WE
B_
VI
WE
B_
VL
WE
B_
VM
WE
B_
VN
REBTOPF14
REBWEBF8
REBBOTTF8
STRANDS
STIRRRIGHTF12
STIRRLEFTF16
Crushing
Shear

Rijkswaterstaat Centre for Infrastructure
Validation of the Guidelines for Nonlinear Page 21 of 113
Finite Element Analysis of Concrete Structures Issued: 15 June 2017
Part: Pre-stressed beams Version: 1.0
RTD: 1016-3B:2017 Status: Final
Boundary conditions and loading Boundary condition are applied to nodes of steel plates; translation along x axis and y
axis at a single node of the left steel plate (support 1) and translation along y axis at
single nodes of the right steel plates (support 2) are constrained, Figure 3-22.
In Load case 1, dead load q(1), pre-stress [P0(1)] and a concentrated load P [P1(1)] at
the middle node of the loading plate equal to 196×103 N to counteract the effect of the
post- tensioning are applied.
In Load case 2 a concentrated load P [P(2)] applied at the middle node of the loading
plate as a unit load of 4×10³ N is added to load case 1, Figure 3-22.
Figure 3-22: Case PB1. Boundary conditions and load cases 2
Load increments and convergence criteria Load case 1 was applied in a single step. The regular Newton-Raphson method was
used.
Load case 2 was applied with automatic adaptive load increments based on energy. The
upper limit of the incremental load factor was set to 10. The lower limit of the
incremental load factor equaled 5. The maximum number of steps was 170. Arc-length
control was applied based on the translation along y axis of node 284 (“indirect
displacement control”), Figure 3-23. The analysis continues even if the convergence
criteria are not satisfied. The convergence tolerances are equal to 1×10⁻³
and 1×10⁻²
for
energy and forces respectively. A maximum of 50 iterations is used.
Figure 3-23: Case PB1. `Indirect Displacement control' technique applied referring to
node 284
3.4 Nonlinear finite element analysis
Load deflection The load-deflection curve of the mid-span point is presented in Figure 3-24. In this
figure the values of applied load corresponding to the beginning of yielding of bars,
yielding of stirrups placed at the right side, yielding of tendons and crushing of
concrete are highlighted. The onset of crushing of concrete is defined as the moment at
which the first integration point reaches a minimum principal strain value equal to -
3.5‰.
For load case 2 the peak load is defined as the highest load step where the energy norm
ratio satisfies the fixed tolerance of 1×10⁻³
. The convergence behavior is quite poor
after reaching the peak load. After step 137, the analysis continues even if the energy
convergence criteria are not satisfied within the maximum number of iterations equal
node 284
X
Y
Z
Model: PB1
17 JUN 2010 15:15:08 meshiDIANA 9.3-01 : TU Delft

Rijkswaterstaat Centre for Infrastructure
Validation of the Guidelines for Nonlinear Page 22 of 113
Finite Element Analysis of Concrete Structures Issued: 15 June 2017
Part: Pre-stressed beams Version: 1.0
RTD: 1016-3B:2017 Status: Final
to 50. The post peak branch of the load- deflection curve is for this reason plotted with
a dash-dotted line.
Figure 3-24: Case PB1. Load-deflection curve
Convergence behavior For most steps convergence is reached on the basis of the energy criterion, Figure 3-25
and Figure 3-26. For load case 2, the energy norm ratio satisfies the fixed tolerance of
1×10⁻³
for all the steps of the analysis until to the peak load, while the force norm ratio
is higher than the fixed tolerance for most of the steps. In Figure 3-25 and Figure 3-26,
the red circle indicates the peak load position on the graph.
Figure 3-25: Case PB1. Evolution of the energy norm (blue lines indicate steps, red
line indicates tolerance, green points indicate iterative results)
Rijkswaterstaat Centre for Infrastructure
Validation of the Guidelines for Nonlinear Page 23 of 113
Finite Element Analysis of Concrete Structures Issued: 15 June 2017
Part: Pre-stressed beams Version: 1.0
RTD: 1016-3B:2017 Status: Final
Figure 3-26: Case PB1. Evolution of the force norm (blue lines indicate steps, red line
indicates tolerance, green points indicate iterative results)
Strains Figure 3-27 shows the crack strain values at the peak load at step 137.
The first crack strain value plotted in Figure 3-27, equal to 0.00081, corresponds to the
ultimate crack strain value calculated asctmeq
Ft,u
fh
Gε
(in this case hheq 2 ), while
the third crack strain value, equal to 0.0038, is the crack strain value corresponding to
1% of fctm. An intermediate crack strain value was added in the contour plot.
In Figure 3-28 the minimum principal strain values at the peak load, at step 137, is
shown. The first minimum principal strain value presented in Figure 3-28, equal to -
0.00032, corresponds to the elastic principal strain valuec
cmc,el
E
fε
3; the second
minimum principal strain value plotted in Figure 3-28, equal to -0.0016, corresponds to
the peak strain value E
fε c
c,p3
5 while the last minimum principal strain value, equal
to -0.0385 is the crushing strain value calculated as cm
Cc,pc,u
fh
Gεε
2
3. Two
intermediate minimum principal strain values have been added between pc,e and uc,e .
From the crack pattern depicted through the contour plot of crack strains at the peak
load, it can be observed that the major flexural cracks are open – stress free, hugely
exceeding the value of the ultimate crack strain. In addition to that, based on the
magnitude of compressive strains at the location of the loading plate (Figure 3-27),
concrete undergoes compressive softening. Consequently, from the above
considerations, it can be concluded that the beam fails due to flexure with crushing of
concrete (flexural-compressive failure mode).

Rijkswaterstaat Centre for Infrastructure
Validation of the Guidelines for Nonlinear Page 24 of 113
Finite Element Analysis of Concrete Structures Issued: 15 June 2017
Part: Pre-stressed beams Version: 1.0
RTD: 1016-3B:2017 Status: Final
Figure 3-27: Case PB1. Crack strain values at step 137 (peak load)
Crushing is defined as soon as the softening branch in compression is reached. It is at
the minimum principal strain of -1.6×10⁻³
.
Figure 3-28: Case PB1. Minimum principal strain values at step 137 (peak
load)
Figure 3-29: Case PB1. Experimental crack pattern at a load kNP 1765
Yielding of the longitudinal rebars 8 located in the web and the bottom flange of the
beam occurs when strains amount to 310332197460 .GPaMPa . The yielding strain in
the bars placed in the bottom flange is reached first at the load of 1292 kN (step 69)
whereas the web reinforcement starts to yield at later step – 71 and the load equal to
1312 kN. Figure 3-30 shows yielding of the bottom and web bars a few steps after an
onset of yielding (step 84).
0.0
0.5
1.0
1.5
2.0
2.5
0.000 0.001 0.002 0.003 0.004 0.005
s(N
/mm
2)
e (-)
0
0.5
1
1.5
2
2.5
0.0000 0.0010 0.0020 0.0030 0.0040 0.0050 0.0060
-30
-25
-20
-15
-10
-5
0
-0.045 -0.030 -0.015 0.000
s(N
/mm
2)
e (-)
0
0.5
1
1.5
2
2.5
0.0000 0.0010 0.0020 0.0030 0.0040 0.0050 0.0060

Rijkswaterstaat Centre for Infrastructure
Validation of the Guidelines for Nonlinear Page 25 of 113
Finite Element Analysis of Concrete Structures Issued: 15 June 2017
Part: Pre-stressed beams Version: 1.0
RTD: 1016-3B:2017 Status: Final
Figure 3-30: Case PB1. Yielding of bottom bars 8 at step 84
The yielding strain of stirrups 12 is equal to 310462203500 .GPaMPa . Stirrups
start to yield at the load equal to 1672 kN (step 101). In Figure 3-31, yielding of
stirrups a few steps after the first yielding point is shown, at step 115.
Figure 3-31: Case PB1. Yielding of stirrups 12 at step 115
The yielding strain of bars 14 placed at the upper flange of the beam is equal to 31091207397 .GPaMPa . Bars placed in this region start to yield at a load equal to
1768 kN (step 109). Figure 3-32 shows the yielding of top bars a few steps after the
yielding point – at step 117.
-800
-600
-400
-200
0
200
400
600
800
-0.020 -0.010 0.000 0.010 0.020
s(N
/mm
2)
e (-)
-800
-600
-400
-200
0
200
400
600
800
-0.020 -0.015 -0.010 -0.005 0.000 0.005 0.010 0.015 0.020s[M
Pa]
e[]-800
-600
-400
-200
0
200
400
600
800
-0.020 -0.015 -0.010 -0.005 0.000 0.005 0.010 0.015 0.020s[M
Pa
]
e[]
0
0.5
1
1.5
2
2.5
0.0000 0.0010 0.0020 0.0030 0.0040 0.0050 0.0060
-800
-600
-400
-200
0
200
400
600
800
-0.010 -0.005 0.000 0.005 0.010
s(N
/mm
2)
e (-)
-800
-600
-400
-200
0
200
400
600
800
-0.010 -0.005 0.000 0.005 0.010s[M
Pa
]
e[]
-800
-600
-400
-200
0
200
400
600
800
-0.010 -0.005 0.000 0.005 0.010s[M
Pa
]
e[]
0
0.5
1
1.5
2
2.5
0.0000 0.0010 0.0020 0.0030 0.0040 0.0050 0.0060
-600
-400
-200
0
200
400
600
-0.020 -0.010 0.000 0.010 0.020
s(N
/mm
2)
e (-)
-600
-400
-200
0
200
400
600
-0.020 -0.015 -0.010 -0.005 0.000 0.005 0.010 0.015 0.020s[M
Pa
]
e[]

Rijkswaterstaat Centre for Infrastructure
Validation of the Guidelines for Nonlinear Page 26 of 113
Finite Element Analysis of Concrete Structures Issued: 15 June 2017
Part: Pre-stressed beams Version: 1.0
RTD: 1016-3B:2017 Status: Final
Figure 3-32 Case PB1. Yielding of top bars 14 at step 117
The yielding strain of prestressing tendons was assumed to be equal to 310952071225 .GPaMPa . The tendons start to yield at the load equal to 1824 kN
(step 113). Figure 3-33 shows yielding of tendons at the yielding point at step 113.
Figure 3-33: Case PB1. Yielding of tendons at step 113
Gauss point statistics In Table 3-7 the number of cracking points, crushing points and yield points are
reported at step 69 (yielding of bottom bars), at step 71 (yielding of web bars), at step
101 (yielding of stirrups placed in the right part), at step 109 (yielding of top bars), at
step 113 (yielding of tendons), at step 118 (crushing of concrete) and at step 137 (peak
load).
Table 3-7: Case PB1. Number of cracking points, crushing points and yield points
STEP 69 ITERATIONS 6
GROUP NAME PLAST PRV.
PL CRITIC
PLAST
NEW
PRV.PL
NEW
CRITIC
NEW
REBBOTTF8 1 0 0 1 0 0
TOTAL MODEL 1 0 0 1 0 0
CRACKING LOGGING SUMMARY
GROUP NAME CRACK OPEN CLOSED ACTIVE INACTI ARISES
FL_INF 415 415 0 252 163 15
CRUSHING 22 22 0 16 6 1
WEB_RING 2 2 0 0 2 0
WEB 328 328 0 234 94 16
SHEAR 433 433 0 319 114 25
TOTAL MODEL 1102 1102 0 749 353 49
STEP 71 ITERATIONS 7
GROUP NAME PLAST PRV.
PL CRITIC
PLAST
NEW
PRV.PL
NEW
CRITIC
NEW
REBWEBF8 1 0 0 1 0 0
REBBOTTF8 1 0 0 0 0 0
TOTAL MODEL 2 0 0 1 0 0
0
0.5
1
1.5
2
2.5
0.0000 0.0010 0.0020 0.0030 0.0040 0.0050 0.0060
0
200
400
600
800
1000
1200
1400
1600
0.000 0.005 0.010 0.015 0.020
s(N
/mm
2)
e (-)
0
0.5
1
1.5
2
2.5
0.0000 0.0010 0.0020 0.0030 0.0040 0.0050 0.0060

Rijkswaterstaat Centre for Infrastructure
Validation of the Guidelines for Nonlinear Page 27 of 113
Finite Element Analysis of Concrete Structures Issued: 15 June 2017
Part: Pre-stressed beams Version: 1.0
RTD: 1016-3B:2017 Status: Final
CRACKING LOGGING SUMMARY
GROUP NAME CRACK OPEN CLOSED ACTIVE INACTI ARISES
FL_INF 436 436 0 273 163 6
CRUSHING 26 26 0 20 6 2
WEB_RING 2 2 0 0 2 0
WEB 359 359 0 267 92 17
SHEAR 495 495 0 364 131 29
TOTAL MODEL 1211 1211 0 849 362 54
STEP 101 ITERATIONS 1
GROUP NAME PLAST PRV.
PL CRITIC
PLAST
NEW
PRV.PL
NEW
CRITIC
NEW
FL_SUP 35 0 0 3 0 0
CRUSHING 31 0 0 2 0 0
SHEAR 2 0 0 1 0 0
STIRRRIGHTF12 1 0 0 1 0 0
REBWEBF8 8 0 0 0 0 0
REBBOTTF8 37 1 0 4 0 0
TOTAL MODEL 107 1 0 10 0 0
CRACKING LOGGING SUMMARY
GROUP NAME CRACK OPEN CLOSED ACTIVE INACTI ARISES
FL_INF 760 760 0 623 137 9
FL_SUP 2 2 0 2 0 0
CRUSHING 198 198 0 167 31 4
WEB_RING 2 2 0 0 2 0
WEB 1049 1049 0 869 180 14
SHEAR 1276 1276 0 1035 241 14
WEB_VL 2 2 0 2 0 1
WEB_VM 3 3 0 3 0 0
WEB_VN 5 5 0 5 0 0
TOTAL MODEL 2916 2916 0 2369 547 36
STEP 109 ITERATIONS 24
GROUP NAME PLAST PRV.
PL CRITIC
PLAST
NEW
PRV.PL
NEW
CRITIC
NEW
FL_SUP 28 13 0 0 13 0
CRUSHING 23 13 0 0 13 0
SHEAR 3 1 0 1 0 0
STIRRRIGHTF12 1 0 0 0 0 0
REBTOPF14 1 0 0 1 0 0
REBWEBF8 2 9 0 0 9 0
REBBOTTF8 39 22 0 1 19 0
TOTAL MODEL 89 58 0 3 54 0
CRACKING LOGGING SUMMARY
GROUP NAME CRACK OPEN CLOSED ACTIVE INACTI ARISES
FL_INF 851 851 0 489 362 13
FL_SUP 3 3 0 1 2 0
CRUSHING 275 275 0 185 90 12
WEB_RING 2 2 0 0 2 0
WEB 1176 1176 0 649 527 33
SHEAR 1495 1495 0 796 699 33
WEB_VH 1 1 0 1 0 0
WEB_VI 2 2 0 2 0 0
WEB_VL 4 4 0 4 0 1
WEB_VM 4 4 0 4 0 0
WEB_VN 7 7 0 7 0 0
TOTAL MODEL 3332 3332 0 1821 1511 79
STEP 113 ITERATIONS 24
GROUP NAME PLAST PRV.
PL CRITIC
PLAST
NEW
PRV.PL
NEW
CRITIC
NEW
FL_SUP 34 11 0 1 11 34

Rijkswaterstaat Centre for Infrastructure
Validation of the Guidelines for Nonlinear Page 28 of 113
Finite Element Analysis of Concrete Structures Issued: 15 June 2017
Part: Pre-stressed beams Version: 1.0
RTD: 1016-3B:2017 Status: Final
CRUSHING 25 15 0 1 15 25
SHEAR 6 1 0 2 0 6
STIRRRIGHTF12 3 0 0 0 0 3
REBTOPF14 4 0 0 0 0 4
REBWEBF8 5 7 0 0 6 5
REBBOTTF8 51 13 0 0 7 51
STRANDS 12 0 0 12 0 12
TOTAL MODEL 130 47 0 15 39 130
CRACKING LOGGING SUMMARY
GROUP NAME CRACK OPEN CLOSED ACTIVE INACTI ARISES
FL_INF 883 883 0 600 283 11
FL_SUP 5 5 0 3 2 0
CRUSHING 294 294 0 218 76 11
WEB_RING 2 2 0 0 2 0
WEB 1243 1243 0 769 474 40
SHEAR 1550 1550 0 977 573 27
WEB_VG 1 1 0 1 0 1
WEB_VH 2 2 0 2 0 0
WEB_VI 3 3 0 3 0 0
WEB_VL 4 4 0 4 0 0
WEB_VM 4 4 0 4 0 0
WEB_VN 8 8 0 7 1 0
TOTAL MODEL 3482 3482 0 2202 1280 75
STEP 118 ITERATIONS 2
GROUP NAME PLAST PRV.
PL CRITIC
PLAST
NEW
PRV.PL
NEW
CRITIC
NEW
FL_SUP 52 0 0 2 0 0
CRUSHING 52 0 0 2 0 0
SHEAR 16 1 0 3 0 0
STIRRRIGHTF12 5 0 0 0 0 0
REBTOPF14 10 0 0 0 0 0
REBWEBF8 21 0 0 0 0 0
REBBOTTF8 101 3 0 9 0 0
STRANDS 44 0 0 3 0 0
TOTAL MODEL 283 4 0 18 0 0
CRACKING LOGGING SUMMARY
GROUP NAME CRACK OPEN CLOSED ACTIVE INACTI ARISES
FL_INF 925 925 0 719 206 7
FL_SUP 6 6 0 5 1 0
CRUSHING 309 309 0 257 52 5
WEB_RING 2 2 0 0 2 0
WEB 1326 1326 0 964 362 17
SHEAR 1622 1622 0 1225 397 19
WEB_VG 1 1 0 1 0 0
WEB_VH 2 2 0 2 0 0
WEB_VI 4 4 0 4 0 0
WEB_VL 4 4 0 4 0 0
WEB_VM 7 7 0 6 1 0
WEB_VN 9 9 0 7 2 0
TOTAL MODEL 3677 3677 0 2749 928 42
STEP 137 ITERATIONS 2
GROUP NAME PLAST PRV.
PL CRITIC
PLAST
NEW
PRV.PL
NEW
CRITIC
NEW
FL_SUP 61 10 0 2 1 0
CRUSHING 103 27 0 9 1 0
WEB 28 6 0 2 0 0
SHEAR 80 17 0 9 1 0
STIRRLEFTF16 17 2 0 5 1 0
STIRRRIGHTF12 92 0 0 10 0 0
REBTOPF14 17 0 0 1 0 0

Rijkswaterstaat Centre for Infrastructure
Validation of the Guidelines for Nonlinear Page 29 of 113
Finite Element Analysis of Concrete Structures Issued: 15 June 2017
Part: Pre-stressed beams Version: 1.0
RTD: 1016-3B:2017 Status: Final
REBWEBF8 82 0 0 5 0 0
REBBOTTF8 155 5 0 0 0 0
STRANDS 77 0 0 3 0 0
TOTAL MODEL 633 57 0 38 3 0
CRACKING LOGGING SUMMARY
GROUP NAME CRACK OPEN CLOSED ACTIVE INACTI ARISES
FL_INF 1069 1069 0 839 230 3
FL_SUP 12 12 0 9 3 0
CRUSHING 341 341 0 276 65 4
WEB_RING 2 2 0 0 2 0
WEB 1547 1547 0 1174 373 9
SHEAR 1843 1843 0 1493 350 11
WEB_VE 2 2 0 2 0 1
WEB_VF 2 2 0 2 0 0
WEB_VG 4 4 0 4 0 0
WEB_VH 6 6 0 6 0 1
WEB_VI 7 7 0 7 0 1
WEB_VL 10 10 0 7 3 0
WEB_VM 12 12 0 7 5 0
WEB_VN 12 12 0 7 5 0
TOTAL MODEL 4258 4258 0 3323 935 22
3.5 Application of safety format
As proposed by the Model Code 2010 (fib, 2013) (section 7.11.3) safety formats for
nonlinear analyses include three numerical methods denoted as GRF (Global
Resistance Factor method), PF (Partial Factor method) and ECOV (Method of
Estimation of a Coefficient Of Variation of resistance).
In Table 3-8 to Table 3-13, the properties of concrete and steel applied in the nonlinear
analyses are summarized.
Table 3-8: Case PB1. Constitutive model parameters for concrete
fc
(N/mm2)
fct
(N/mm2)
Ec
(N/mm2)
GF
(Nmm/mm2)
GC
(Nmm/mm2)
Mean measured 25.31 2.16 26675 var 0.131 32.65
Characteristic 17.31 1.51 25349 var 0.122 30.49
Mean GRF 14.72 1.80 24143 var 0.118 29.61
Design 11.54 1.01 22057 var 0.113 28.35
Table 3-9: Case PB1. Constitutive model parameters for reinforcing bars 12
(mm)
As
(mm2)
fy
(N/mm2)
ft
(N/mm2)
Es
(N/mm2)
εsy
(-)
Mean measured 12.0 113 500 611 203000 0.0025
Characteristic 12.0 113 452.87 553.41 203000 0.0022
Mean GRF 12.0 113 498.16 608.75 203000 0.0024
Design 12.0 113 393.80 481.23 203000 0.0019
Table 3-10: Case PB1. Constitutive model parameters for reinforcing bars 16
(mm)
As
(mm2)
fy
(N/mm2)
ft
(N/mm2)
Es
(N/mm2)
εsy
(-)

Rijkswaterstaat Centre for Infrastructure
Validation of the Guidelines for Nonlinear Page 30 of 113
Finite Element Analysis of Concrete Structures Issued: 15 June 2017
Part: Pre-stressed beams Version: 1.0
RTD: 1016-3B:2017 Status: Final
Mean measured 16.0 201 400 512 195000 0.0020
Characteristic 16.0 201 362.30 463.74 195000 0.0018
Mean GRF 16.0 201 398.53 510.11 195000 0.0020
Design 16.0 201 315.04 403.25 195000 0.0016
Table 3-11: Case PB1. Constitutive model parameters for reinforcing bars 8
(mm)
As
(mm2)
fy
(N/mm2)
ft
(N/mm2)
Es
(N/mm2)
εsy
(-)
Mean measured 8.0 50 460 567 197000 0.0023
Characteristic 8.0 50 416.64 513.56 197000 0.0021
Mean GRF 8.0 50 458.31 564.91 197000 0.0023
Design 8.0 50 362.30 446.57 197000 0.0018
Table 3-12: Case PB1. Constitutive model parameters for reinforcing bars 14
(mm)
As
(mm2)
fy
(N/mm2)
ft
(N/mm2)
Es
(N/mm2)
εsy
(-)
Mean measured 14.0 154 397 517 207000 0.0019
Characteristic 14.0 154 359.58 468.27 207000 0.0017
Mean GRF 14.0 154 395.54 515.10 207000 0.0019
Design 14.0 154 312.68 407.19 207000 0.0015
Table 3-13: Case PB1. Constitutive model parameters for strands
(mm)
As
(mm2)
fy
(N/mm2)
ft
(N/mm2)
Es
(N/mm2)
εsy
(-)
Mean measured 12×12.2 1404 1225 1363 207000 0.0059
Characteristic 12×12.2 1404 1109.53 1234.53 207000 0.0059
Mean GRF 12×12.2 1404 1220.49 1357.98 207000 0.0065
Design 12×12.2 1404 964.81 1073.50 207000 0.0046
In Figure 3-34 the load-deflection curves obtained with mean measured, characteristic,
mean GRF and design values of material strengths are shown.

Rijkswaterstaat Centre for Infrastructure
Validation of the Guidelines for Nonlinear Page 31 of 113
Finite Element Analysis of Concrete Structures Issued: 15 June 2017
Part: Pre-stressed beams Version: 1.0
RTD: 1016-3B:2017 Status: Final
Figure 3-34: Case PB1. Load-deflection curves obtained with mean measured,
characteristic, mean GRF and design values of material strength
The ultimate resistance of specimen PB1 was searched for with a use of analytical and
numerical approaches. In Figure 3-35, the design values of beam resistance obtained
with the designing codes and numerical analyses are compared. The presented results
are expressed in terms of a percentage of the ultimate value of applied load from
experiments. The analysis titled “no safety format” refers to the NLFE analysis carried
out using mean measured materials properties therefore without application of safety
coefficient.
Figure 3-35: Case PB1. Analytical and numerical design values of beam resistance
expressed in terms of a percentage of the experimental ultimate value of applied load,
kNPExp 5.1897

Rijkswaterstaat Centre for Infrastructure
Validation of the Guidelines for Nonlinear Page 32 of 113
Finite Element Analysis of Concrete Structures Issued: 15 June 2017
Part: Pre-stressed beams Version: 1.0
RTD: 1016-3B:2017 Status: Final
In Table 3-14 the design values of beam resistance, expressed in terms of applied load
PRd, obtained from numerical and analytical procedures are outlined.
Table 3-14: Case PB1. Values of beam resistance, expressed in terms of applied load
PRd
PExp EC2,MC2010 GRF PF ECOV No Safety Formats
(kN) (kN) (kN) (kN) (kN) (kN)
1897.46 1097 1352.36 1376.20 1513.77 2044.20
3.6 Parametric study on crack models
A parametric study was carried out by varying a number of sensitive parameters of the
concrete constitutive model, such as the crack model, and the fracture energy of
concrete in tension.
The material parameters implemented in NLFE analyses of the parametric study are
listed in Table 3-15. Analyses 1 to 3 refer to the three analyses carried out with mean
measured values of material strength and varying material parameters (crack model and
tensile fracture energy) of a concrete constitutive model. The numerical models
included a parabolic law in compression and an exponential law in tension for concrete
as well as an elasto-plastic law with hardening for steel. All models exercised reduction
of Poisson’s ratio due to cracking.
A limit value of the concrete compressive strength reduction due to lateral cracking
was adopted according to Vecchio et al. (Vecchio et al., 1986):
6.0,
min, cm
redc
f
fs
The influence of the used value of fracture energy of concrete in tension on the beam
response was investigated by adopting the formulation proposed by Model Code 1990
(CEB-FIP, 1993) and the formulation proposed by Model Code 2010 (fib, 2013). The
fracture energy of concrete in compression was considered for all analyses equal to
250GF (Nakamura et al. 2001).
In the fixed crack model, a variable shear retention factor dependent on a mean
aggregate size daggr, a crack normal strain en and a crack bandwidth value h was used as
follows from:
hd
n
aggr
e
21
In Figure 3-36 the load-deflection curves obtained from the parametric study are
plotted. The peak load of each analysis is indicated with a circular marker. The peak
load is defined in correspondence of the highest load step for which the energy norm
ratio satisfies the fixed tolerance of 1×10⁻³
.The peak load values are reported in Table
3-15.
Table 3-15: Case PB1. Parametric study on crack models
Analysis Total strain
crack model GF GC
Peak load value
(kN)
Analysis 1 rotating MC2010 250 GF 2044.20
Analysis 2 rotating MC1990 250 GF 2000.20
Analysis 3 fixed (=variable) MC2010 250 GF 1948.20

Rijkswaterstaat Centre for Infrastructure
Validation of the Guidelines for Nonlinear Page 33 of 113
Finite Element Analysis of Concrete Structures Issued: 15 June 2017
Part: Pre-stressed beams Version: 1.0
RTD: 1016-3B:2017 Status: Final
Figure 3-36: Case PB1. Parametric study on crack model
Comparing the models’ response from analyses 1 and 2, one can see the influence of
the adopted values of fracture energy of concrete in tension mmNG MCF 078.01990, (
mmNG MCF 131.02010, ) and most importantly, the impact of the corresponding values
of compression fracture energy. Due to the fact that the beam fails in bending
accompanied with crushing of concrete, the fracture energy of concrete in compression
plays a meaningful role on the ductility of the beam – especially on the peak and post-
peak deformation. Further, from a comparison of analyses 1 and 3, it can be noted that
the crack model (total strain rotating or fixed crack model) has a small influence on the
beam response, both in terms of peak load and peak deformation. The experimental
crack pattern and failure mode could be better reproduced when the rotating crack
model was used.
3.7 Concluding remarks
The selected benchmark prestressed beam PB1 subjected to 3 point bending exhibited
in laboratory tests a flexural-compressive failure mechanism at the ultimate applied
load P=1897.5kN.
In order to simulate the experimental results, a FE model was created and studied in a
number of NLFE analyses.The beam was modelled with a total strain rotating crack
model, exponential softening in tension and parabolic behavior in compression,
variable Poisson’s ratio of concrete and reduction of compressive strength of concrete
due to lateral cracking with a lower limit of 0.6. The model for the reinforcement bars
and stirrups was based on hardening plasticity. The prestressing reinforcement
consisted of 2 post-tensioned tendons prestressed with an initial effective stress of 635
MPa.
From NLFEA conducted with mean measured values of material strength, it was
possible to obtain a flexural-compressive failure mechanism. The failure occurred at
the peak value of the applied load of 2044.2kN and was characterized by crushing of
concrete in the web and in the vicinity of loading plate accompanied by yielding of the
web and bottom longitudinal reinforcement as well as yielding of stirrups.
Safety formats for nonlinear finite element analyses as proposed by the Model Code
2010 (fib, 2013) were applied to derive the design value of beam resistance expressed
in terms of applied load. The design value of beam resistance obtained from safety

Rijkswaterstaat Centre for Infrastructure
Validation of the Guidelines for Nonlinear Page 34 of 113
Finite Element Analysis of Concrete Structures Issued: 15 June 2017
Part: Pre-stressed beams Version: 1.0
RTD: 1016-3B:2017 Status: Final
formats methods appeared to be higher than the design value of beam resistance
obtained with analytical sectional analysis.
In the last part of the chapter, a sensitivity study was carried out. The study
investigated the influence of different crack models and varying values of fracture
energy of concrete in tension and equivalently in compression. Because the beam failed
in bending with crushing of concrete, the response of the models is influenced
primarily by input parameters related to compressive behaviour of concrete.
Based on the results it can be concluded that consistent and reliable results can be
obtained by applying variable Poisson’s ratio, reduction of the compressive strength
due to lateral cracking with a low limit of 0.6, total strain rotating crack model and
fracture energy of concrete in tension according to Model Code 2010. An energy norm
with a tolerance of 10-3
is recommended.
References Leonhardt E.F., Kock R., Rostasy F. S. “Schubversuche an Spannbetontragern”,
Deutscher Ausschuss fur Stahlbeton, Berlin 1973.
Nakamura H., Higai T., “Compressive Fracture Energy and Fracture Zone Length of
Concrete”, Benson P. Shing (editor), J. Str. Eng. ASCE, 2001, pp. 471-487.
Oliver, J. “A consistent characteristic length for smeared cracking models”,
International Journal for numerical Methods in Engineering, 1989, 28, 461^474.
Selby R.G., Vecchio F.J. “Three-dimensional Constitutive Relations for Reinforced
Concrete”, Tech. Rep. 93-02, Univ. Toronto, dept. Civil Eng., Toronto, Canada, 1993.
Vecchio F. J., Collins M. P. (1986), “The modified compression-field theory for
reinforced concrete elements subjected to shear”, ACI Journal 83, 219-231.

Rijkswaterstaat Centre for Infrastructure
Validation of the Guidelines for Nonlinear Page 35 of 113
Finite Element Analysis of Concrete Structures Issued: 15 June 2017
Part: Pre-stressed beams Version: 1.0
RTD: 1016-3B:2017 Status: Final
4 Case PB2 (NSEL): Sun and Kuchma (2007)
The objective of the Sun and Kuchma report (Sun and Kuchma 2007) was to develop
and improve understanding of the shear behavior and bearing capacity of high strength
concrete prestressed girders through detailed analyses of dense experimental test data.
To achieve this, HSC prestressed girders were designed according to AASHTO LRFD
Bridge Design Specifications, fabricated, instrumented and tested at the Newmark
Structural Engineering Laboratory so as to enable a comprehensive evaluation of the
mechanism of shear. A total of twenty experiments on ten 1600 mm deep and 15850
mm long bulb-tee girders were planned. Girder 3 was selected as the benchmark for the
present case study due to its shear-compressive failure mechanism.
4.1 Experimental setup and results
Geometry The geometry of the beam and reinforcement details are shown in Figure 4-1 and
Figure 4-2, respectively. The beam has a total length of 15.85 m and a total depth of
1.6 m; the T-shape cross section of the beam is shown in Figure 4-1. A concrete deck is
casted on top of the girder.
Figure 4-1: Case PB2. Cross section details (dimensions in inch) (Sun and Kuchma
2007)
Figure 4-2: Case PB2. Reinforcement and strands details (Sun and Kuchma 2007)
The reinforcement consists of #4 double legged deformed bars with spacing 203 mm In
the region with higher shear forces. At both ends of the girder along the length of
500mm, the shear reinforcement was increased to #5 double legged bars with spacing
50 mm apart. The longitudinal reinforcement consisted of two pairs of #3 longitudinal

Rijkswaterstaat Centre for Infrastructure
Validation of the Guidelines for Nonlinear Page 36 of 113
Finite Element Analysis of Concrete Structures Issued: 15 June 2017
Part: Pre-stressed beams Version: 1.0
RTD: 1016-3B:2017 Status: Final
bars with spacing 458 mm and one layer of #8 longitudinal bar placed in the top flange.
The East end was designed to satisfy the LRFD end reinforcement requirements while
the West end region contained addition reinforcement. It consisted of additional
distributed horizontal reinforcement, vertical reinforcement and confinement
reinforcement. The 3048 mm long horizontal bars were distributed along both faces of
West web end and consisted of #3 bars at spacing 152.4 mm. Four pairs of #4 vertical
bars were provided from the inside face of the support towards the center of the girder
to increase horizontal shear strength along the web. The confinement reinforcement #3
was used in the bottom flange for 2540 mm from each end. In the deck, two layers of
#6 235 mm spacing were placed.
A total of 44 seven-wire low-relaxation prestressing straight strands with a diameter of
15.2 mm each one were used: 42 strands in the bottom bulb and 2 strands in the top
flange. The effective initial stress in prestressing steel sp0, measured before testing
after immediate losses, was equal to 1068 N/mm2. The actual prestressing loss at the
time of testing was determined from displacement measurements of the change in a
distance between targets mounted on the bottom bulb of the girder at the level of the
centroid of the prestressing steel. The measured prestressing losses ranged from about
15 % to 25 % and these measured values were used in calculations of the nominal
capacities of the girders. Four spirals were placed around the strands to reduce strand
slip. Lastly, two 229 mm wide steel plates were placed at the support.
Material Properties Concrete and reinforcement properties from the reference are given in Table 4-1.
Table 4-1: Case PB2. Concrete and reinforcement properties
Concrete properties of girder
fcm (N/mm2) fctm,sp (N/mm
2) Ec (N/mm
2) dmax (mm)
109.63 5.28 52710 13
Concrete properties of deck
fcm (N/mm2) Ec (N/mm
2) dmax (mm)
24.82 25076 13
Bar
(mm)
As
(mm2)
Es
(N/mm2)
fym
(N/mm2)
ftm
(N/mm2)
#3 9.5 71 200000 413.7 620.5
#4 12.7 129 200000 467.5 731.5
#5 15.9 200 200000 445.4 701.9
#6 19.1 284 200000 413.7 620.5
#8 25.4 510 200000 413.7 620.5
strands,7wire 15.24 140 196500 1675 1862
Loading and Boundary Conditions The loading and boundary conditions in the experimental setup are shown in Figure
4-3.

Rijkswaterstaat Centre for Infrastructure
Validation of the Guidelines for Nonlinear Page 37 of 113
Finite Element Analysis of Concrete Structures Issued: 15 June 2017
Part: Pre-stressed beams Version: 1.0
RTD: 1016-3B:2017 Status: Final
Figure 4-3: Case PB2. Loading, boundary conditions and dimension (in ft) (Sun and
Kuchma 2007)
Experimental Results The beam exhibited a shear-compression failure mechanism with crushing of concrete
at the web-bulb interface, Figure 4-4. After the East end failed the test was stopped.
The beam was unloaded and the East end was repaired by removing all loose concrete
from the failed region, adding reinforcement on either side of the web and casting a
3050 to 4500 mm long repair on either side of the web using self-compacting concrete.
Later, the failed region was vertically post-tensioned with post- tensioning bars. The
beam was reloaded one week later using the same loading pattern until the West end
failed. During the second part of the test, the West end was already damaged from the
previous test and it was not repaired before the beginning of the second part of the test.
The East end failed at the maximum load equal to 6983.35 kN and the maximum
deflection of 76.2 mm whereas the West end failed at the maximum load equal to
7597.92 kN and the maximum deflection of 97.8 mm, Figure 4-5.
(a)
(b)
Figure 4-4: Case PB2. Failure mechanisms at ultimate load of (a) East end, (b) West
end (Sun and Kuchma 2007)
(a) (b)

Rijkswaterstaat Centre for Infrastructure
Validation of the Guidelines for Nonlinear Page 38 of 113
Finite Element Analysis of Concrete Structures Issued: 15 June 2017
Part: Pre-stressed beams Version: 1.0
RTD: 1016-3B:2017 Status: Final
(c)
Figure 4-5: Case PB2. Load-deflection response, (a) East End, (b) West End, (c)
Position of LVDTs (in kips/ft/inches)
4.2 Analytical analysis
In Figure 4-6 the load configuration at failure is shown.
Figure 4-6: Case PB2. Load configuration at failure (dimensions in m)
Load case 1:
the distributed load equivalent to the beam and slab weights is equal to:
mkN.mkNm.m.mkNAAq slabbeam 52717242710459024 3223 .The maximum
bending moment at the mid-span of the girder then is: kNm.M 03508max
Figure 4-7: Case PB2. Load 1: Internal forces (dimensions in m)
Another external load is prestressing. The beam has 42 strands in the bottom part of the
section and 2 strands in the top flange. The resulting moment calculated around the
centroidal axis of the beam alone is given below.

Rijkswaterstaat Centre for Infrastructure
Validation of the Guidelines for Nonlinear Page 39 of 113
Finite Element Analysis of Concrete Structures Issued: 15 June 2017
Part: Pre-stressed beams Version: 1.0
RTD: 1016-3B:2017 Status: Final
Figure 4-8: Case PB2: Load case 1: Internal forces from prestressing
Load case 2:
Figure 4-9 shows maximum moment at mid-span equal to:
8
4113
2
91504132
max
m.q
m.m.qM
Figure 4-9: Case PB2. Load 2: Internal forces (dimensions in m)
Bending moment resistance:
Figure 4-10: Case PB2: Forces acting on section, ULS

Rijkswaterstaat Centre for Infrastructure
Validation of the Guidelines for Nonlinear Page 40 of 113
Finite Element Analysis of Concrete Structures Issued: 15 June 2017
Part: Pre-stressed beams Version: 1.0
RTD: 1016-3B:2017 Status: Final
The design value of bending moment resistance was calculated assuming a bi-linear
stress block for a deck and an elastic-plastic stress-strain relationship for both
reinforcement and prestressing steel. The partial safety factors were taken as: 1.15 for
reinforcement and prestressing steel and 1.5 for concrete.
The height of compression zone was searched for neglecting strains in the beam alone
resulting from the self-weight of the beam and the deck before setting of concrete. It
was assumed that bars in the concrete slab, the flange and the web yield which was
later verified to be true. Consequently, the horizontal force equilibrium is:
infinf386 2 p,pypp,pyds#yds#yds#c σfAσAfAfAfAF
The resulting value of concrete compression zone is: 405mm.
The ultimate bending moment resistance calculated around the centroidal axis:
kNmkNmkNmkNm.kNm.kNm.kNm.m.kN
mmzσfACzσAmmfA
mmfAmm.hzfAh.zfAyzF
cbp,pypG,girdercbp,pyds#
yds#deckctyds#deckctyds#ctc
77021336153963178358254362958506702
142381
12645450
infinf3
386
The maximum value of the distributed load that the beam is able to withstand is:
mkN.qM
m.q
m.m.qMM RdpSelfWeight 7389
8
4113
2
91504132
.
The resultant of the distributed load is kNm.kN/m.m.qPEd, 5226411373894113max
Shear force resistance:
Eurocode 2:
mmdzmmd pp 15419.01712 taking into account the concrete slab under the
assumption that stirrups are properly anchored in the slab and a truss model can
develop.
kN.MPa.mmmm
mmθfz
s
AV ywd
swRd,s 18035243651541
203
258cot
2
kN..
..mm.MPa.
θθ
νzαbfV cwwebcd
Rd, 33145240
50211141527567
cottan
1max
Where: 2111132214459341
65792
inf.
f
σαMPa.
mm
kN
A
σAσ
cd
cp
cw
beam
p,p
cp
and 5.01
Model Code 2010
The design value of shear resistance of the beam is also calculated according to the
Model Code 2010 (fib, 2013) applying three levels of approximations.
Table 4-2: Case PB2. Parameters used in the calculation of VRd
Level I Level II Level III
min (°) 25 20 20
max (°) 45 45 45
ke 0.55 0.65 0.65
Level I Approximation
kNMPammmm
mmzf
s
AV ywd
ssRd 1546)25(cot4.3651541
203
258cot
2
minmin,

Rijkswaterstaat Centre for Infrastructure
Validation of the Guidelines for Nonlinear Page 41 of 113
Finite Element Analysis of Concrete Structures Issued: 15 June 2017
Part: Pre-stressed beams Version: 1.0
RTD: 1016-3B:2017 Status: Final
kN)()(
mmmm..
MPa..θθzb
γ
fkθV w
c
ck
cRd,
223025cos25sin
1541415251
631013660cossin minminminmax
Level II Approximation
For the assumed value of shear resistance kNV trialEd 1851, , xe is negative therefore
according to the Model Code 2010, 0xe . This implies that the minimum angle for
compressive struts is: deg2010000deg20min xεθ . From the calculations
conducted for this angle, the condition sRdRd VV ,max, was violated. This imposes the
need to increase the angle. It is thus assumed that 28.20 .The evaluation for this
angle is shown below.
013.0cot002.02
min1 eee xx
519.0552.1
1
1
e
ek
1666.030 3
1
ck
fcf
MPa
346.0 fcc kk e
kN).(MPa.mmmm
mmθzf
s
AθV ywd
s
Rd,s 18512821cot23681541203
258cot
2
min
kN
mmmmMPa
zbf
kV w
c
ck
cRd
1856)28.21(cos)28.21(sin
15411525.1
6.101346.0cossinminmax,
Note: the effective shear depth was taken including the depth of the deck. It is
mmmmdz p 154117129.09.0
The shear resistance of stirrups is lower than the cut-off limit dictated by crushing of
concrete. The shear resistance is 1851kN.
Level III Approximation
For the same reason as explained in the level II approximation calculations, the angle is
assumed:
deg28.20θ . It follows then that:
kN).(MPa.mmmm
mmθzf
s
AθV ywd
sRd,s 18512821cot23681541
203
258cot
2
min
kN).().(mmmm.
MPa..θθzb
γ
fkθV w
c
ckcRd, 18562821cos2821sin1541152
51
61013460cossinminmax
0115001
4.0
max,
,
Rd
trialEd
x
vV
Vk
e
0 zbγ
fkV w
c
ck
vRd,c
minmax θVVVV Rd,Rd,cRd,sRd
kNVRd 1851
The assumed shear resistance is equal to the calculated design shear resistance hence
no further iterations are required. Moreover, due to the shear resistance of the value

Rijkswaterstaat Centre for Infrastructure
Validation of the Guidelines for Nonlinear Page 42 of 113
Finite Element Analysis of Concrete Structures Issued: 15 June 2017
Part: Pre-stressed beams Version: 1.0
RTD: 1016-3B:2017 Status: Final
close to max,RdV the contribution of concrete is negligibly small. It means that the shear
resistances of levels II and III approximations are the same.
The value of load q was determined in the following way. Shear force caused by the
self-weight at a location d from the support is kNV SWEd 103, . Combining of the actions
on the beam and equating them to the shear resistance results in:
mkNqkNkNmmm
q /97.2951851103914.0741.1(2
41.13
(for LoA II and III)
From the obtained results, it can be seen that the beam fails in shear. The calculated
value of the bending moment resistance is higher than shear force resistance attributed
to stirrups. The lower value of distributed load mkNq LoAIIIshear 97.295, related to the
shear resistance would lead to failure earlier than load mkNqbending .389 . The
resultant corresponding to the shear failure is kNP LoAIIIEd 3968max,, for LoA II and III.
For LoA I and EC2 it is the resultant of kNP LoAIEd 3275max,, and kNP ECEd 38592max,,
respectively. Note values of distributed load are already reduced by the effect of the
self-weight. The values are summarized in Table 4-3.
Table 4-3: Case PB2. Design value of beam resistance expressed in terms of resultant
load PRd (Model Code 2010)
EC2 Level I Level II Level III
PRd (kN) 3859 3275 3968 3968
4.3 Finite element model
Units Units are N, mm.
Material models and parameters The concrete model is based on a total strain rotating crack model with:
exponential softening in tension and parabolic compression curve,
variable Poisson’s ratio of concrete,
reduction of compressive strength of concrete due to lateral cracking with a
lower limit of 0.6,
increase in compressive strength due to lateral confinement according to the
model proposed by Selby and Vecchio (Selby and Vecchio 1993)
The mechanical properties are summarized in Figure 4-5. On input, the GF value has
been decreased with a factor 2 in order to compensate for an underestimation of the
crack band width for cracks with an inclination angle of 45 degrees. The uniaxial
stress-strain curve is shown in Figure 4-11.
The model for the reinforcement bars and stirrups is based on hardening plasticity.
Geometrical and mechanical properties of reinforcement are summarized Table 4-1.
The stress-strain curve of the #5 bars is plotted in Figure 4-12.

Rijkswaterstaat Centre for Infrastructure
Validation of the Guidelines for Nonlinear Page 43 of 113
Finite Element Analysis of Concrete Structures Issued: 15 June 2017
Part: Pre-stressed beams Version: 1.0
RTD: 1016-3B:2017 Status: Final
Table 4-4: Case PB2. Constitutive model parameters for concrete
Girder
fcm
(N/mm2)
fctm
(N/mm2)
Ec
(N/mm2)
ν GF
(Nmm/mm2)
Mean measured value 109.63 5.28# 52710 var 0.170
*
*Not specified in reference; estimated according to Model Code 2010 (fib, 2013)
#Estimated according to Model Code 2010 (fib, 2013) as spctmctm ff ,1
Deck
fcm
(N/mm2)
fctm
(N/mm2)
Ec
(N/mm2)
ν GF
(Nmm/mm2)
Mean measured value 24.82 2.65* 25076 var 0.130*
*Not specified in reference; estimated according to Model Code 2010 (fib, 2013)
Figure 4-11: Case PB2. Stress-strain curve for concrete girder
Figure 4-12: Case PB2. Stress-strain curve adopted for #5 bars
For the steel plates a linear elastic behavior is assumed, see Table 4-5.
-120
-100
-80
-60
-40
-20
0
20
-0.02 -0.015 -0.01 -0.005 0 0.005
s(N
/mm
2)
e (-)
-800
-600
-400
-200
0
200
400
600
800
-0.15 -0.1 -0.05 0 0.05 0.1 0.15
s(N
/mm
2)
e (-)

Rijkswaterstaat Centre for Infrastructure
Validation of the Guidelines for Nonlinear Page 44 of 113
Finite Element Analysis of Concrete Structures Issued: 15 June 2017
Part: Pre-stressed beams Version: 1.0
RTD: 1016-3B:2017 Status: Final
Table 4-5: Case PB2. Steel plates properties
E
(N/mm2)
200000 0.3
Interface elements were used between the steel support plates and the concrete beam at
the supports and loading positions. The interface stiffness was derived on the basis of
concrete properties. The total thickness of interface elements equals 1 mm. A bilinear
behavior is assumed in the normal direction (see Figure 4-13) and a linear elastic
relation is assumed in shear direction. The normal stiffness in tension and the stiffness
in shear direction were assumed almost equal to zero.
The mechanical properties of the interface elements are summarized in Table 4-6.
Figure 4-13: Case PB2. Traction-displacement diagram in normal direction for
interfaces
Table 4-6: Case PB2. Interface properties
Knn in tension
(N/mm3)
Knn in compression
(N/mm3)
Kt
(N/mm3)
5.27E+01 5.27E+04 5.27E+01
Element types and finite element mesh For meshing concrete, 8-node membrane elements (CQ16M) with a full integration
scheme (3×3) were used the beam. The average element size is 50×50 mm2. The
dimensions of the elements were established on the basis of assumed fixed thickness in
the flange with variable thickness, see Figure 4-16.
The reinforcement bars and stirrups are modelled with embedded truss elements with
two Gauss integration points along the axis of the element. Perfect bond is assumed.
The bottoms strands were combined and placed in the centre of gravity. For the steel
plates 8-node membrane elements (CQ16M) were used. The 6-node interfaces
elements have three Lobatto integration points.
The adopted dimensions of the beam and its transversal cross-section are given in
Figure 4-14 and Figure 4-15, respectively.
The mesh of the beam is presented in Figure 4-15(a) whereas the individual materials
in the model are indicated with different colors in Figure 4-15(b).
sn (N/mm )2
un (mm)10
5.27
3
-103
x101
5.27x10⁷

Rijkswaterstaat Centre for Infrastructure
Validation of the Guidelines for Nonlinear Page 45 of 113
Finite Element Analysis of Concrete Structures Issued: 15 June 2017
Part: Pre-stressed beams Version: 1.0
RTD: 1016-3B:2017 Status: Final
(a)
(b)
Figure 4-14: Case PB2. (a) Dimensions of the beam (in mm) and loading scheme, (b)
Reinforcement, cross section and support plate details (dimensions in mm)
(a)
(b)
Figure 4-15: Case PB2. (a) Mesh and (b) material sets
Different groups of elements are defined to distinguish the concrete elements and the
steel elements. These groups will be used in section 3.4 to monitor the failure mode
during the analysis. For monitoring yielding of steel, the groups STIRRUPS, BARS
and STRANDS refer to stirrups, bars and strands of the beam respectively, see Figure
4-16(a). Figure 4-16 (b) shows the group of elements named SHEAR which served to
track the inelastic behavior of concrete. The groups of elements named FL_INF_C,
FL_INF_P, FL_INF_S, WEB FL_SUP_P, FL_SUP_S, FL_SUP_C, DECK given in
Figure 4-16(c), were used to model the cross section dimensions.

Rijkswaterstaat Centre for Infrastructure
Validation of the Guidelines for Nonlinear Page 46 of 113
Finite Element Analysis of Concrete Structures Issued: 15 June 2017
Part: Pre-stressed beams Version: 1.0
RTD: 1016-3B:2017 Status: Final
(a)
(b)
(c)
Figure 4-16: Case PB2. Groups of steel elements monitoring (a) yielding of
reinforcement, (b) inelastic behavior of concrete, (c) groups of elements used to model
the beam cross sectional dimensions
Boundary conditions and loading The boundary conditions were applied to a single node at each steel plate. In the left
steel plate, the constraints of degrees of freedom in both x and y directions were
applied whereas in the second support (right steel plate) only translation in the y
direction was prevented, Figure 4-17.
In the model two load cases were considered. In the first load case, dead weight q(1)
and prestressing force P0(1) were applied. Next, the uniformly distributed load q(2) of
1N/mm is applied in the load case 2, Figure 4-17 (a).The initial effective stress in
prestressing steel spcs (P0=spcs·Ap), measured during experiments after initial losses to
be 1068 N/mm2, was introduced gradually over a transmission length equal to 610 mm,
as indicated by (Sun and Kuchma, 2007).
STIRRUPS #4 STRANDS
BARS #3STIRRUPS #5
Shear
DECK
FL_SUP_CFL_SUP_PFL_SUP_S
WEB
FL_INF_SFL_INF_PFL_INF_C
DECK
FL_SUP_CFL_SUP_PFL_SUP_S
WEB
FL_INF_SFL_INF_PFL_INF_C

Rijkswaterstaat Centre for Infrastructure
Validation of the Guidelines for Nonlinear Page 47 of 113
Finite Element Analysis of Concrete Structures Issued: 15 June 2017
Part: Pre-stressed beams Version: 1.0
RTD: 1016-3B:2017 Status: Final
(a)
(b)
Figure 4-17: Case PB2. (a) Boundary conditions and load cases 1 and 2, (b) initial
stress in prestressing steel distribution
Load increments and convergence criteria Load case 1 was applied in 2 steps. The regular Newton-Raphson method with a
maximum of 25 iterations was used. As convergence criteria, the force and energy
norms were selected. The analysis was set to continue even if the convergence criteria
were not satisfied. The convergence tolerances were 1×10⁻²
for the force norm and
1×10⁻³
for the energy norm. A Line Search algorithm was used to improve the
convergence performance.
Load case 2 was applied with automatic adaptive load increments based on energy. The
initial load factor equaled 5, the upper limit of the incremental load factor was 10 and
the lower limit of the incremental load factor was 2. The maximum number of steps
was 100. Arc-length control was applied based on translation along y axis of node 625
(“indirect displacement control”), Figure 4-18. The analysis continued even if the
convergence criteria were not satisfied. The convergence tolerance was equal to 1×10⁻³
and 1×10⁻²
for energy and force respectively. The maximum of 50 iterations was used.
A line search algorithm was applied to improve the convergence performance.
Figure 4-18: Case PB2. `Indirect Displacement control' technique applied referring to
node 625
Support 1
X
Y
Z
Model: NSEL
12 APR 2010 11:51:41 meshiDIANA 9.3-01 : TU Delft
Support 2
q
P0 P0
Support 1
X
Y
Z
Model: NSEL
12 APR 2010 11:51:41 meshiDIANA 9.3-01 : TU Delft
Support 2
q
P0 P0 P0(1) P0(1)
q(1)
q(2)
distance (mm)
spcs (N/mm )
610
1068
158500 15240
X
Y
Z
Model: NSEL
12 APR 2010 11:51:41 meshiDIANA 9.3-01 : TU Delft
625

Rijkswaterstaat Centre for Infrastructure
Validation of the Guidelines for Nonlinear Page 48 of 113
Finite Element Analysis of Concrete Structures Issued: 15 June 2017
Part: Pre-stressed beams Version: 1.0
RTD: 1016-3B:2017 Status: Final
4.4 Nonlinear finite element analysis
Load deflection The load-deflection curve is presented in Figure 4-19 where the applied load values
corresponding to the beginning of yielding of bars #3, yielding of stirrups #4 and
crushing of concrete are marked. The onset of crushing of concrete was set to occur
when the minimum principal strain of -3.5‰ was reached in an integration point.
For load case 2, the peak load was defined as the highest load step where the energy
norm ratio satisfied the fixed tolerance of 1×10⁻³
. The convergence behavior was quite
poor after reaching the peak load. After step 72, the analysis continued even if the
energy convergence criteria are not satisfied within the maximum number of iterations
equal to 50. The post peak branch of the load – deflection curve is for this reason
plotted with a dot-dashed line.
Figure 4-19: Case PB2. Load-deflection curve
Convergence behavior For most steps, the convergence was reached on the basis of the energy criterion, see.
For load case 2, the energy norm ratio satisfied the fixed tolerance of 1×10⁻³
for almost
all the steps of the analysis, while the force norm ratio was typically higher than the
fixed tolerance. The red circle in Figure 4-20 and Figure 4-21 indicates the peak load
position on the above load-displacement curve.

Rijkswaterstaat Centre for Infrastructure
Validation of the Guidelines for Nonlinear Page 49 of 113
Finite Element Analysis of Concrete Structures Issued: 15 June 2017
Part: Pre-stressed beams Version: 1.0
RTD: 1016-3B:2017 Status: Final
Figure 4-20: Case PB2. Evolution of the energy norm (blue lines indicate steps, red
line indicates tolerance, green points indicate iterative results)
Figure 4-21: Case PB2. Evolution of the force norm (blue lines indicate steps, red line
indicates tolerance, green points indicate iterative results)
Strains in concrete In Figure 4-22 and Figure 4-23, the positive and negative crack strains contours at the
peak load 72 are shown. From the depicted contours, which in the case of positive
numbers can be regarded as a representation of a crack pattern, and corresponding
values, it can be seen that the occurred failure mechanism is due to combined shear and
crushing of concrete. Crushing of concrete can be especially well observed in Figure
4-23.

Rijkswaterstaat Centre for Infrastructure
Validation of the Guidelines for Nonlinear Page 50 of 113
Finite Element Analysis of Concrete Structures Issued: 15 June 2017
Part: Pre-stressed beams Version: 1.0
RTD: 1016-3B:2017 Status: Final
Figure 4-22: Case PB2. Crack strain values at step 72 (peak load)
Figure 4-23: Case PB2. Minimum principal strain values at step 72
Figure 4-24: Case PB2. Experimental crack pattern at failure (load kNP 35.6983 )
Strains in steel The yielding strain of stirrups #4, which equals to 310332200435 .GPaMPa , was
reached at the load of 4624.47 kN (step 37). Figure 4-25 shows yielding of stirrups a
few steps after the first yielding point (at step 50).
0
1
2
3
4
5
6
0 0.001 0.002 0.003 0.004
s(N
/mm
2)
e (-)
0
0.5
1
1.5
2
2.5
0.0000 0.0010 0.0020 0.0030 0.0040 0.0050 0.0060
-120
-100
-80
-60
-40
-20
0
-0.02 -0.015 -0.01 -0.005 0
s[N
/mm
2]
e [-]
0
0.5
1
1.5
2
2.5
0.0000 0.0010 0.0020 0.0030 0.0040 0.0050 0.0060

Rijkswaterstaat Centre for Infrastructure
Validation of the Guidelines for Nonlinear Page 51 of 113
Finite Element Analysis of Concrete Structures Issued: 15 June 2017
Part: Pre-stressed beams Version: 1.0
RTD: 1016-3B:2017 Status: Final
Figure 4-25: Case PB2. Yielding of stirrups #4 at step 50
The yielding strain of bars #3 is equal to 310022007413 .GPaMPa. . The bars
began to yield at the load equal to 5402.25 kN (step 47). In Figure 4-26 yielding of
longitudinal reinforcement #3 at step 56 is shown.
Figure 4-26: Case PB2. Yielding of bars #3 at step 56
The yielding strain of strand equal to 31052851961675 .GPa.MPa was exceeded at
the load value of 7172.37 kN (step 68). Figure 4-27 shows the yielding of strands at
step 68:
-800
-600
-400
-200
0
200
400
600
800
-0.15 -0.1 -0.05 0 0.05 0.1 0.15
s(N
/mm
2)
e (-)
-1000
-800
-600
-400
-200
0
200
400
600
800
1000
-0.15 -0.1 -0.05 0 0.05 0.1 0.15
-1000
-800
-600
-400
-200
0
200
400
600
800
1000
-0.15 -0.1 -0.05 0 0.05 0.1 0.15
-1000
-800
-600
-400
-200
0
200
400
600
800
1000
-0.15 -0.1 -0.05 0 0.05 0.1 0.15
-1000
-800
-600
-400
-200
0
200
400
600
800
1000
-0.15 -0.1 -0.05 0 0.05 0.1 0.15
-1000
-800
-600
-400
-200
0
200
400
600
800
1000
-0.15 -0.1 -0.05 0 0.05 0.1 0.15
-800
-600
-400
-200
0
200
400
600
800
-0.15 -0.1 -0.05 0 0.05 0.1 0.15
s(N
/mm
2)
e (-)
-800
-600
-400
-200
0
200
400
600
800
-0.15 -0.1 -0.05 0 0.05 0.1 0.15 0.2
-800
-600
-400
-200
0
200
400
600
800
-0.15 -0.1 -0.05 0 0.05 0.1 0.15 0.2
-800
-600
-400
-200
0
200
400
600
800
-0.15 -0.1 -0.05 0 0.05 0.1 0.15 0.2
-800
-600
-400
-200
0
200
400
600
800
-0.15 -0.1 -0.05 0 0.05 0.1 0.15 0.2
-800
-600
-400
-200
0
200
400
600
800
-0.15 -0.1 -0.05 0 0.05 0.1 0.15 0.2
0
0.5
1
1.5
2
2.5
0.0000 0.0010 0.0020 0.0030 0.0040 0.0050 0.0060
-2500
-2000
-1500
-1000
-500
0
500
1000
1500
2000
2500
-0.03 -0.02 -0.01 0 0.01 0.02 0.03s(N
/mm
2 )
e (-)

Rijkswaterstaat Centre for Infrastructure
Validation of the Guidelines for Nonlinear Page 52 of 113
Finite Element Analysis of Concrete Structures Issued: 15 June 2017
Part: Pre-stressed beams Version: 1.0
RTD: 1016-3B:2017 Status: Final
Figure 4-27: Case PB2. Yielding of strands at step 68
Table 4-7: Case PB2. Summary of strains in reinforcement and concrete and
corresponding load steps of occurrence
Reinforcement Yield Strain Onset of yielding Stirrups #4 2.33∙10
-3 37
Rebars #3 2.00∙10-3
47
Strands 8.52∙10-3
68
Concrete Strain Load Step Crushing -0.35∙10
-2 63
Peak load -0.444∙10-1
and 0.105 72
Gauss point statistics In Table 4-8, numbers of cracking points, crushing points and yield points at step 37
(yielding of stirrups #4), at step 47 (yielding of bars #3), at step 63 (crushing of
concrete), at step 68 (yielding of strands) and at step 72 (peak load) are given.
Table 4-8: Case PB2. Number of cracking points, crushing points and yield points
STEP 37 ITERATIONS 18
GROUP
NAME PLAST
PRV.
PL CRITIC
PLAST
NEW
PRV.PL
NEW
CRITIC
NEW
STIRRUPS 3 0 0 3 0 0
TOTAL
MODEL 3 0 0 3 0 0
CRACKING LOGGING SUMMARY
GROUP
NAME CRACK OPEN CLOSED ACTIVE INACTI ARISES
FL_INF_C 38 38 0 38 0 12
FL_INF_P 64 63 1 50 14 24
FL_INF_S 172 171 1 96 76 14
WEB 9594 9554 40 4834 4760 1554
FL_SUP_P 276 274 2 202 74 198
DECK 2955 2955 0 0 2955 0
SHEAR 4053 4032 21 2779 1274 1113
TOTAL
MODEL 13099 13055 44 5220 7879 1802
STEP 47 ITERATIONS 32
GROUP
NAME PLAST
PRV.
PL CRITIC
PLAST
NEW
PRV.PL
NEW
CRITIC
NEW
STIRRUPS 2 5 0 2 2 0
BARS 2 0 0 2 0 0
TOTAL
MODEL 4 5 0 4 2 0

Rijkswaterstaat Centre for Infrastructure
Validation of the Guidelines for Nonlinear Page 53 of 113
Finite Element Analysis of Concrete Structures Issued: 15 June 2017
Part: Pre-stressed beams Version: 1.0
RTD: 1016-3B:2017 Status: Final
CRACKING LOGGING SUMMARY
GROUP
NAME CRACK OPEN CLOSED ACTIVE INACTI ARISES
FL_INF_C 2004 1926 78 833 1171 128
FL_INF_P 658 644 14 472 186 63
FL_INF_S 431 407 24 265 166 22
WEB 14520 14298 222 4789 9731 939
FL_SUP_P 529 529 0 172 3.57E+02 21
DECK 2955 2955 0 0 2955 0
SHEAR 5904 5835 69 1975 3929 294
TOTAL
MODEL 21097 20759 338 6531 14566 1173
STEP 63 ITERATIONS 50
GROUP
NAME PLAST
PRV.
PL CRITIC
PLAST
NEW
PRV.PL
NEW
CRITIC
NEW
WEB 87 65 0 1 65 0
DECK 641 718 0 212 718 0
SHEAR 43 49 0 1 49 0
STIRRUPS 73 282 0 33 274 0
BARS 1 70 0 0 66 0
TOTAL
MODEL 802 1135 0 246 1123 0
CRACKING LOGGING SUMMARY
GROUP
NAME CRACK OPEN CLOSED ACTIVE INACTI ARISES
FL_INF_C 5008 4849 159 1726 3282 487
FL_INF_P 1929 1888 41 826 1103 238
FL_INF_S 1562 1506 56 853 709 199
WEB 35369 34314 1055 14982 20387 7413
FL_SUP_P 760 760 0 213 547 28
DECK 3046 3046 0 28 3.02E+03 5
SHEAR 10144 9984 160 3328 6816 1553
TOTAL
MODEL 47674 46363 1311 18628 29046 8370
STEP 68 ITERATIONS 2
GROUP
NAME PLAST
PRV.
PL CRITIC
PLAST
NEW
PRV.PL
NEW
CRITIC
NEW
WEB 312 1 0 29 1 0
DECK 2167 0 0 162 0 0
SHEAR 170 1 0 15 1 0
STIRRUPS 533 42 0 111 2 0
BARS 62 21 0 7 0 0
STRANDS 49 0 0 49 0 0
TOTAL
MODEL 3123 64 0 358 3 0
CRACKING LOGGING SUMMARY
GROUP
NAME CRACK OPEN CLOSED ACTIVE INACTI ARISES
FL_INF_C 5703 5525 178 3729 1974 204
FL_INF_P 2163 2081 82 1688 475 40
FL_INF_S 1788 1706 82 1451 337 35
WEB 39965 37440 2525 22304 17661 420
FL_SUP_P 866 866 0 776 90 20
DECK 3103 3103 0 113 2990 17

Rijkswaterstaat Centre for Infrastructure
Validation of the Guidelines for Nonlinear Page 54 of 113
Finite Element Analysis of Concrete Structures Issued: 15 June 2017
Part: Pre-stressed beams Version: 1.0
RTD: 1016-3B:2017 Status: Final
SHEAR 11589 11205 384 6286 5303 141
TOTAL
MODEL 53588 50721 2867 30061 23527 736
STEP 72 ITERATIONS 2
GROUP
NAME PLAST
PRV.
PL CRITIC
PLAST
NEW
PRV.PL
NEW
CRITIC
NEW
FL_INF_C 2 0 0 2 0 0
FL_INF_S 2 0 0 2 0 0
WEB 444 137 0 150 44 0
DECK 2919 0 0 159 0 0
SHEAR 243 87 0 95 15 0
STIRRUPS 765 57 0 78 20 0
BARS 166 11 0 32 0 0
STRANDS 182 0 0 18 0 0
TOTAL
MODEL 4480 205 0 441 64 0
CRACKING LOGGING SUMMARY
GROUP
NAME CRACK OPEN CLOSED ACTIVE INACTI ARISES
FL_INF_C 6723 6559 164 4683 2040 355
FL_INF_P 2350 2268 82 1983 367 56
FL_INF_S 2043 1963 80 1682 361 89
WEB 43102 40606 2496 26788 16314 862
FL_SUP_P 1168 1168 0 987 181 60
FL_SUP_S 96 96 0 92 4 43
DECK 3130 3130 0 60 3070 7
SHEAR 12241 11857 384 7118 5123 196
TOTAL
MODEL 58612 55790 2822 36275 22337 1472
4.5 Application of safety format
As proposed by the Model Code 2010 (fib, 2013) safety formats for non-linear
analyses include three numerical methods denoted as GRF (Global Resistance Factor
method), PF (Partial Factor method) and ECOV (Method of Estimation of a Coefficient
of Variation of resistance).
In Table 4-9to Table 4-16 the mechanical properties of concrete and steel applied in the
non-linear analyses are summarized.
Table 4-9: Case PB2. Constitutive model parameters for concrete girder
fc
(N/mm2)
fct
(N/mm2)
Ec
(N/mm2)
GF
(Nmm/mm2)
GC
(Nmm/mm2)
Mean measured 109.63 5.28 52710* var 0.170 42.5060
Characteristic 101.63 3.70 43107 var 0.168 41.9302
Mean GRF 86.39 5.86 41055 var 0.163 40.7214
Design 67.75 2.46 38170 var 0.156 38.9790
* Note that the used value of mean measured value for Young’s modulus is questionable.
Strictly applying the guidelines will lead to lower value of mean measured Ec

Rijkswaterstaat Centre for Infrastructure
Validation of the Guidelines for Nonlinear Page 55 of 113
Finite Element Analysis of Concrete Structures Issued: 15 June 2017
Part: Pre-stressed beams Version: 1.0
RTD: 1016-3B:2017 Status: Final
Table 4-10: Case PB2. Constitutive model parameters for concrete deck
fc fct Ec
GF GC
(N/mm2) (N/mm
2) (N/mm
2) (Nmm/mm
2) (Nmm/mm
2)
Mean measured 24.82 2.64 25076* var 0.130 32.5332
Characteristic 16.82 2.09 25130 var 0.121 30.3327
Mean GRF 14.30 1.88 23934 var 0.118 29.4582
Design 11.21 1.59 22251 var 0.113 28.1978
* Note that the used value of mean measured value for Young’s modulus is questionable.
Strictly applying guidelines will lead to higher value of mean measured Ec
Table 4-11: Case PB2. Constitutive model parameters for reinforcing bars (#3)
As fy ft Es εsy
(mm) (mm2) (N/mm
2) (N/mm
2) (N/mm
2) (-)
Mean measured 9.5 71 413.70 620.50 200000 0.0021
Characteristic 9.5 71 374.71 562.01 200000 0.0019
Mean GRF 9.5 71 412.18 618.21 200000 0.0021
Design 9.5 71 325.83 488.71 200000 0.0016
Table 4-12: Case PB2. Constitutive model parameters for reinforcing bars (#4)
As fy ft Es εsy
(mm) (mm2) (N/mm
2) (N/mm
2) (N/mm
2) (-)
Mean measured 12.7 129 467.50 731.53 200000 0.0023
Characteristic 12.7 129 423.43 662.58 200000 0.0021
Mean GRF 12.7 129 465.78 728.84 200000 0.0023
Design 12.7 129 368.20 576.15 200000 0.0018
Table 4-13: Case PB2. Constitutive model parameters for reinforcing bars (#5)
As fy ft Es εsy
(mm) (mm2) (N/mm
2) (N/mm
2) (N/mm
2) (-)
Mean measured 15.9 200 445.40 701.89 200000 0.0022
Characteristic 15.9 200 403.42 635.73 200000 0.0020
Mean GRF 15.9 200 443.76 699.30 200000 0.0022
Design 15.9 200 350.80 552.81 200000 0.0018
Table 4-14: Case PB2. Constitutive model parameters for reinforcing bars (#6)
As fy ft Es εsy
(mm) (mm2) (N/mm
2) (N/mm
2) (N/mm
2) (-)
Mean measured 19.1 284 413.70 620.50 200000.00 0.0021
Characteristic 19.1 284 374.71 562.01 200000.00 0.0019
Mean GRF 19.1 284 412.18 618.21 200000.00 0.0021
Design 19.1 284 325.83 488.71 200000.00 0.0016

Rijkswaterstaat Centre for Infrastructure
Validation of the Guidelines for Nonlinear Page 56 of 113
Finite Element Analysis of Concrete Structures Issued: 15 June 2017
Part: Pre-stressed beams Version: 1.0
RTD: 1016-3B:2017 Status: Final
Table 4-15: Case PB2. Constitutive model parameters for reinforcing bars (#8)
As fy ft Es εsy
(mm) (mm2) (N/mm
2) (N/mm
2) (N/mm
2) (-)
Mean measured 25.4 510 413.70 620.50 200000 0.0021
Characteristic 25.4 510 374.71 562.01 200000 0.0019
Mean GRF 25.4 510 412.18 618.21 200000 0.0021
Design 25.4 510 325.83 488.71 200000 0.0016
Table 4-16: Case PB2. Constitutive model parameters for reinforcing bars (strands)
As fy ft Es εsy
(mm) (mm2) (N/mm
2) (N/mm
2) (N/mm
2) (-)
Mean measured 44×15.24 44×140 1675.00 1862.00 196500 0.0085
Characteristic 44×15.24 44×140 1517.12 1686.49 196500 0.0077
Mean GRF 44×15.24 44×140 1668.83 1855.14 196500 0.0085
Design 44×15.24 44×140 1319.23 1466.52 196500 0.0067
In Figure 4-28, the load-deflection curves obtained with mean measured, characteristic,
mean GRF and design values of material strengths are shown.
Figure 4-28: Case PB2. Load-deflection curves of analyses with mean measured,
characteristic, mean GRF and design mechanical properties
The resistance of the beam along with the governing failure mechanism were check
analytically by means of expressions from codes and numerically with the application
of NLFEA. In Figure 4-29 the comparison of analytical and numerical design values of
beam resistance PRd expressed in terms of a percentage of the experimental ultimate
value of applied load are shown.
0
1000
2000
3000
4000
5000
6000
7000
8000
0 30 60 90 120 150
Lo
ad
(k
N)
Deflection (mm)
Mean measured values of material strength
Characteristic valus of material strength
Mean GRF values of material strength
Design values of material strength
Experimental

Rijkswaterstaat Centre for Infrastructure
Validation of the Guidelines for Nonlinear Page 57 of 113
Finite Element Analysis of Concrete Structures Issued: 15 June 2017
Part: Pre-stressed beams Version: 1.0
RTD: 1016-3B:2017 Status: Final
Figure 4-29: Case PB2. Analytical and numerical design values of beam resistance
expressed in terms of a percentage of the experimental ultimate value of applied load,
PExp=6983.35kN
The analysis named “no safety format” refers to the NLFE analysis carried out using
mean measured values of material strengths without application of safety coefficient.
In Table 4-17, the design values of beam resistance, expressed in terms of applied load
PRd, obtained from numerical and analytical analyses are summarized.
Table 4-17: Case PB2. Values of beam resistance, expressed in terms of applied load
PRd (in kN)
PExp EC2 Level I
MC2010
Level II
MC2010
Level III
MC2010 GRF PF ECOV
No safety
formats
6983.35 3859 3275 3968 3968 4638.68 4773.96 5390.96 7413.75
4.6 Parametric study on crack models
A parametric study was carried out by varying a number of sensitive parameters of the
concrete constitutive model, such as the crack model and the fracture energy of
concrete in tension.
In Table 4-17 the material parameters implemented in NLFE analyses performed for
the parametric study are given. The analyses 1 to 3 refer to the three analyses carried
out by varying the aforementioned material parameters. All the analyses were
conducted considering mean measured values of material strengths. Parabolic law in
compression and exponential law in tension were used for concrete, while an elasto-
plastic law with hardening was applied for steel. The analyses were carried out in load-
control with arc-length control. A variable Poisson ratio and a limit value of the
reduction of the compressive strength of concrete due to lateral cracking according to:
6.0,
min, cm
redc
f
fs
were adopted for all analyses. The effects of the applied value of the fracture energy of
concrete in tension on the beam response was investigated by means of comparison of

Rijkswaterstaat Centre for Infrastructure
Validation of the Guidelines for Nonlinear Page 58 of 113
Finite Element Analysis of Concrete Structures Issued: 15 June 2017
Part: Pre-stressed beams Version: 1.0
RTD: 1016-3B:2017 Status: Final
the formulation of Model Code 1990 (CEB-FIB, 1993) and Model Code 2010 (fib,
2013). The fracture energy of concrete in compression was always considered to be
250GF (Nakamura et al. 2001).
In the fixed crack model, a variable shear retention factor, that depends on the mean
aggregate size daggr, the crack normal strain en and the crack bandwidth value h was
used:
hd
n
aggr
e
21
Table 4-18: Case PB2. Parametric study on crack models
Analysis Total strain
crack model GF GC
Peak load value
(kN)
Analysis 1 rotating MC2010 250 GF 7413.75
Analysis 2 rotating MC1990 250 GF 7279.65
Analysis 3 fixed MC2010 250 GF 8057.43
Figure 4-30: Case PB4. Parametric study
In Figure 4-30 the load-deflection curves obtained from the parametric study are
plotted and the peak load of each analysis is marked with a circular indicator. The peak
load is defined in correspondence of the highest load step where the energy norm ratio
satisfies the fixed tolerance of 1×10⁻³
. The peak load values are reported in Table 4-18.
Comparing analysis 1 with analysis 2, the relatively small influence of the adopted
value of the fracture energy of concrete in tension ( mmNG MCF 149.01990, ;
mmNG MCF 170.02010, ) and the relative value of the fracture energy of concrete in
compression ( mmNG MCF 33.371990, ; mmNG MCF 51.422010, ) can be noted, despite
the beam having failed in shear compression. This is due to the fact that by increasing
the compressive strength value, the difference between the fracture energy of concrete

Rijkswaterstaat Centre for Infrastructure
Validation of the Guidelines for Nonlinear Page 59 of 113
Finite Element Analysis of Concrete Structures Issued: 15 June 2017
Part: Pre-stressed beams Version: 1.0
RTD: 1016-3B:2017 Status: Final
in tension calculated according to the Model Code 2010 and the Model Code 1990
decreases-fracture energy of concrete in tension is exponentially dependent on the
compressive strength. Therefore, because the compressive strength of PB2 beam is
equal to 109.63 MPa, the difference between the fracture energy of concrete in tension
calculated according to the Model Code 2010 and the Model Code 1990 is relatively
small.
From the comparison of analyses 1 and 3, it can be seen that the adopted crack model
(total strain rotating or fixed crack model) has a big influence on the beam response,
especially in terms of peak deformation. The peak load and peak deformation are
significantly overestimated when a fixed crack model with a shear retention factor
dependent on the aggregate size diameter is adopted. Furthermore, the crack pattern
and failure mode from experiments can be better reproduced with the analysis
containing rotating model.
4.7 Concluding remarks
Prestressed beam PB2 subjected to uniformly distributed load exhibited a shear-
compressive failure mechanism at a load equal to kNP 35.6983 . The simulation of
the experiment was executed with a FEA model studied in multiple analyses. The
concrete beam was modelled with a total strain rotating crack model, exponential
softening in tension and parabolic behavior in compression, variable Poisson’s ratio of
concrete and reduction of compressive strength of concrete due to lateral cracking. The
model for the reinforcement bars and stirrups was based on hardening plasticity.
As presented in the preceding section, the NLFEA with mean measured values of
material strength resulted in a shear-compressive failure mechanism. The failure
occurred at the peak load of 7413.75kN and was characterized by crushing of concrete
at the level of the web-bulb interface near the support along with yielding of #4 stirrups
and longitudinal #3 rebars.
Safety formats for non-linear finite element analyses as proposed by the Model Code
2010 (fib, 2013) were applied to derive the design value of beam resistance. The design
values of beam resistance obtained from safety formats methods were higher than the
design value of beam resistance obtained with analytical sectional analysis.
Besides the application of safety formats, a sensitivity study investigating the influence
of applied fracture energy of concrete and a crack model on the specimen’s response
was conducted. Because the beam failed in shear due to crushing of concrete, the beam
response and failure mode are substantially influenced by the applied crack model, but
also by the values of fracture energy of concrete in tension and compression. The shear
resistance computed with the fixed crack model was significantly overestimated.
Based on the results of the analyses, it can be concluded that consistent and reliable
results can be obtained by applying variable Poisson’s ratio, reduction of the
compressive strength due to lateral cracking with a low limit of 0.6, total strain rotating
crack model and fracture energy of concrete in tension according to Model Code 2010.
An energy norm with a tolerance of 10-3
is recommended.

Rijkswaterstaat Centre for Infrastructure
Validation of the Guidelines for Nonlinear Page 60 of 113
Finite Element Analysis of Concrete Structures Issued: 15 June 2017
Part: Pre-stressed beams Version: 1.0
RTD: 1016-3B:2017 Status: Final
5 Case PB3 (MnDOT): Runzell et al. (2007)
This prestressed beam case is beam PB3 from the experiments of Runzell, Shield,
French (Runzell et al. 2007), in which two ends of a 26.822 m girder removed from
Mn/DOT Bridge No. 73023 were tested. The original bridge girder was likely more
than 20 years old when it was removed from service. This means that the girder was
designed according to either the 1983 Standard or 1979 Interim specifications.
5.1 Experimental setup and results
Geometry The original length of the girder was 26.82 m.
The test specimens were brought to the University of Minnesota Structures Laboratory
and tested with a MTS 600 kip Universal Testing Machine. The specimens were
moved into the testing apparatus using the Structures Laboratory crane, which had a
maximum capacity of 15 tons. To avoid exceeding this capacity, the specimen length
delivered to the laboratory was limited to 9.29 m with the bridge deck removed.
To investigate the effect of the deck on shear capacity, the specimens were tested with
and without a deck, referred to subsequently as Specimens I and II, respectively. Since
the deck had been removed prior to transport, a new deck was added to the specimen
after it was situated in the testing apparatus. The maximum deck width that the 600kip
Universal Testing Machine could accommodate was 12.19 m. The bridge deck was
designed to be the same thickness and have the same longitudinal steel layout as the
deck from the in-service bridge.
The testing machine was designed to apply a single concentrated load to the specimens.
To avoid transferring shear to the support via a direct compressive strut, it was decided
to maintain a shear span-to-depth ratio of at least 2.7. The depth of Specimen I was 1.6
m, which made it necessary to apply the load at least 4.3 m away from either support to
achieve the proper shear span. With the test setup used the predicted shear capacity
from for Specimen I was 276 kips according to the 2002 Standard code, which was
close to the maximum capacity that could be attained with the 600 kip testing machine
for the desired shear span-to-depth ratio. Thus, it was decided to modify the test
specimens to maintain the shear span-to-depth ratio of 2.7 and provide ample buffer
between the predicted shear capacity and maximum capacity of the MTS machine.
The specimen modification involved lengthening the beams from 9.29 m to
approximately 12.19 m by splicing a cast-in-place beam extension onto the original
prestressed girder section. The cast-in-place extension was designed to resist the
moment and shear from the maximum possible load applied by the 600 kip machine.
In Figure 5-1, the original girder geometry is illustrated while in Figure 5-2 and Figure
5-3 the modified specimen and the construction phase of the extension are shown. In
Figure 5-4 the cross sectional details are depicted.
Figure 5-1: Case PB3. Girder of Mn/DOT Bridge No. 73023 (dimensions in mm)
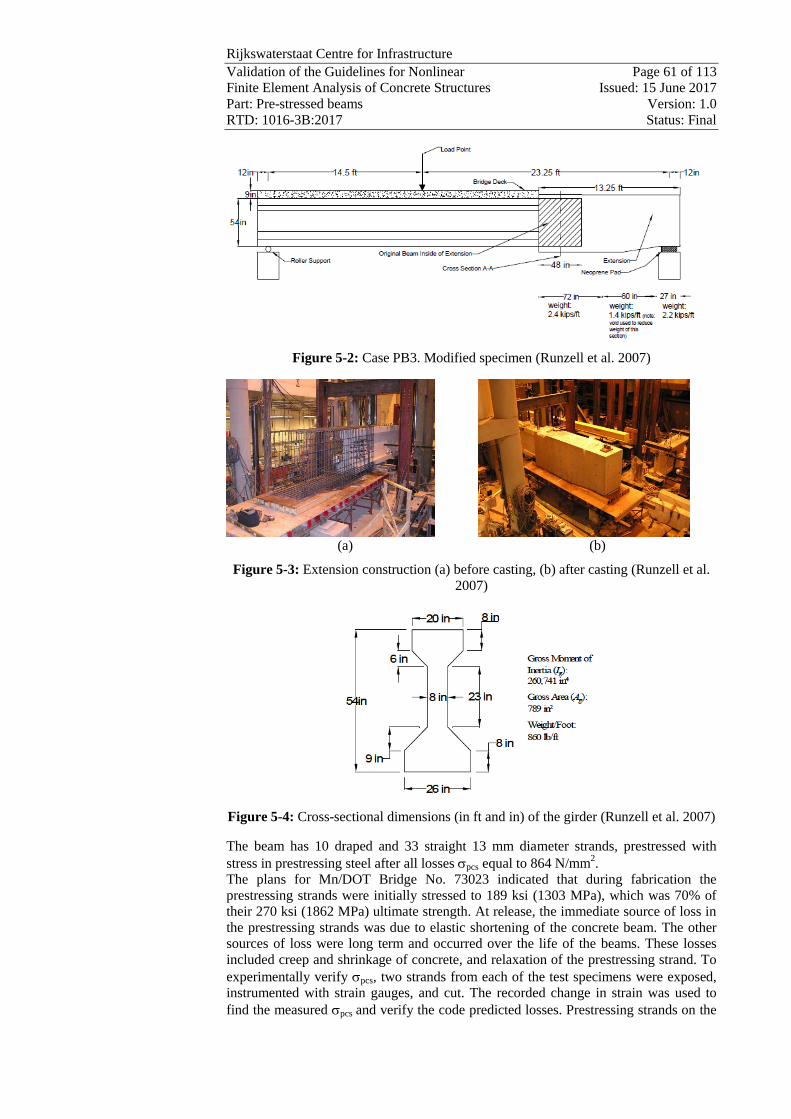
Rijkswaterstaat Centre for Infrastructure
Validation of the Guidelines for Nonlinear Page 61 of 113
Finite Element Analysis of Concrete Structures Issued: 15 June 2017
Part: Pre-stressed beams Version: 1.0
RTD: 1016-3B:2017 Status: Final
Figure 5-2: Case PB3. Modified specimen (Runzell et al. 2007)
(a) (b)
Figure 5-3: Extension construction (a) before casting, (b) after casting (Runzell et al.
2007)
Figure 5-4: Cross-sectional dimensions (in ft and in) of the girder (Runzell et al. 2007)
The beam has 10 draped and 33 straight 13 mm diameter strands, prestressed with
stress in prestressing steel after all losses spcs equal to 864 N/mm2.
The plans for Mn/DOT Bridge No. 73023 indicated that during fabrication the
prestressing strands were initially stressed to 189 ksi (1303 MPa), which was 70% of
their 270 ksi (1862 MPa) ultimate strength. At release, the immediate source of loss in
the prestressing strands was due to elastic shortening of the concrete beam. The other
sources of loss were long term and occurred over the life of the beams. These losses
included creep and shrinkage of concrete, and relaxation of the prestressing strand. To
experimentally verify spcs, two strands from each of the test specimens were exposed,
instrumented with strain gauges, and cut. The recorded change in strain was used to
find the measured spcs and verify the code predicted losses. Prestressing strands on the

Rijkswaterstaat Centre for Infrastructure
Validation of the Guidelines for Nonlinear Page 62 of 113
Finite Element Analysis of Concrete Structures Issued: 15 June 2017
Part: Pre-stressed beams Version: 1.0
RTD: 1016-3B:2017 Status: Final
non-test end, for shear, were cut prior to the ultimate shear test to ensure spcs was
measured from undamaged strands. The test location was approximately 1.27 m from
the end, which was well outside the 760 mm transfer region. A jackhammer was used
to expose a 381 mm section of the bottom, outer strand on each side of the beam as
shown in Figure 5-5(a). The concrete was carefully removed to avoid damaging the
strand with the jackhammer. At least three FLK-1-11-5LT strain gauges were attached
to the strand and oriented along the axis of the wire as shown in Figure 5-5(b). A wet
paper towel along with several rebar ties were then attached to the strand a short
distance away from the strain gages, Figure 5-5(c), to protect them from heat during
cutting and to prevent the strand from unwinding. The prestressing strand was then
flame-cut with an oxy-acetylene torch while strain data were recorded.
The strains were measured before the bridge deck was added to Specimen I. The
average change in strain values from all of the gauges was 3,964 με, neglecting the
extreme high and low values. Because the change in strain was measured using strain
gauges oriented along the axis of the wires, it was necessary to measure the apparent
modulus of elasticity of the strand along this axis so the change in strain could be
converted to an effective prestressing. To measure the apparent modulus of elasticity,
several samples of prestressing strand were removed from the specimens after the
ultimate shear tests. These samples were fitted with strain gauges oriented along the
axis of the strand and tested to ultimate. The apparent modulus of elasticity of the
prestressing strand was 217875 N/mm2, which was obtained from the stress-strain
curves of the prestressing strands. Using the average change in strain of 3.964e and
the apparent modulus of elasticity of 217875 N/mm2 that corresponded with the gauge
orientation, the effective prestressing for the two test beams was 864 N/mm2. The
effective prestressing subtracted from the initial prestressing of 1303 N/mm2 gave
losses of about 34%.
(a) (b) (c)
Figure 5-5: Case PB3. (a) Prestressing Strand Test Location, (b) Strain Gages on
Prestressing Strand, (c) Final Prestressing Strand Test Setup, (Runzell et al. 2007)
The stirrups spacing in the specimens is 531 mm over the entire length of the beam,
except at the original ends of the 26.82 m girder, which had closer spacing over the
support in the prestressing strand anchorage zone. The stirrups are double leg, Grade
420, with diameter 13 mm. In addition to the full depth stirrups there are stirrups
spaced at 531 mm for horizontal shear; these are non-continuous stirrups that are
terminate at the top web/flange intersection, and were designed to ensure composite
action between the girder and bridge deck. In the bridge deck two layers of Grade 60,
13 mm diameter longitudinal reinforcement spaced at 457 mm and 229 mm are added.
In Figure 5-6 and Figure 5-7 the reinforcement details are depicted.

Rijkswaterstaat Centre for Infrastructure
Validation of the Guidelines for Nonlinear Page 63 of 113
Finite Element Analysis of Concrete Structures Issued: 15 June 2017
Part: Pre-stressed beams Version: 1.0
RTD: 1016-3B:2017 Status: Final
(a) (b)
Figure 5-6: Case PB3. Prestressing strand pattern at: (a) girder end; (b) harp point
(Runzell et al. 2007)
Figure 5-7: Case PB3. Reinforcement layout (Runzell et al. 2007)
Material Properties Concrete and reinforcement properties given in references are shown in Table 5-1.
Table 5-1: Case PB3. Concrete and reinforcement properties
Concrete properties
fcm (N/mm2) Ec (N/mm
2) dmax (mm)
69.84 34819 16
Bar
(mm)
As
(mm2)
Es
(N/mm2)
fym
(N/mm2)
ftm
(N/mm2)
13 13.0 132.73 210000 464 570
strands 11.2 43x11.2 43x98.77 196500 1675 1862
Loading and Boundary Conditions The loading and boundary conditions in the experimental setup are shown in Figure
5-8.
Figure 5-8: Case PB3. Loading, boundary conditions and dimensions (Runzell et al.)

Rijkswaterstaat Centre for Infrastructure
Validation of the Guidelines for Nonlinear Page 64 of 113
Finite Element Analysis of Concrete Structures Issued: 15 June 2017
Part: Pre-stressed beams Version: 1.0
RTD: 1016-3B:2017 Status: Final
Experimental Results The beam exhibited a shear-compressive failure mechanism with crushing of concrete
at the web/flange interface, see Figure 5-9 and Figure 5-10. The first visible cracks
were flexural cracks on the bottom flange directly below the applied load. At a certain
level of load an audible popping sound was heard and several large web cracks formed
simultaneously. These cracks continued to grow and widen and many flexural cracks
formed. When the test terminated there was significant crushing at the web/flange
interface that resulted in spalling of the web concrete.
(a)
(b)
Figure 5-9: Case PB3. Failure mechanisms at peak load: (a) cracking, (b) web
crushing, (Runzell et al. 2007)

Rijkswaterstaat Centre for Infrastructure
Validation of the Guidelines for Nonlinear Page 65 of 113
Finite Element Analysis of Concrete Structures Issued: 15 June 2017
Part: Pre-stressed beams Version: 1.0
RTD: 1016-3B:2017 Status: Final
Figure 5-10: Case PB3. Load-deflection curve of Specimen II (Runzell et al. 2007)
5.2 Analytical analysis
In Figure 5-11 the load configuration at failure is reported.
Figure 5-11: Case PB3. Load configuration at failure (dimensions in m)
Load case 1:
Self-weight was taken into account through the equivalent distributed load –
mkNqextension 1.35 and mkNqextension 1.35 . In Figure below the bending moment of
interest is at the location of application of the point load. It is 257.5kNm.

Rijkswaterstaat Centre for Infrastructure
Validation of the Guidelines for Nonlinear Page 66 of 113
Finite Element Analysis of Concrete Structures Issued: 15 June 2017
Part: Pre-stressed beams Version: 1.0
RTD: 1016-3B:2017 Status: Final
Figure 5-12: Case PB3. Load case 1: self-weight (dimensions in m)
The loading effect of prestressing on the member was included through equivalent
bending moment and shear forces at each end. The bending moment is calculated as
the effective prestressing force in the fictitious tendon acting on an eccentricity respect
to the centroidal axis of the beam. From the source document, the center of gravity of
strands at the free end is 0.356m and hence the eccentricity
m.m.m.CC sG 272035606290 ; where CG is the center of gravity of the concrete
section. In a similar fashion, the estimated eccentricity at the enclosed end is
m.m.m. 46901606290 . The resulting internal forces are depicted in Figure 5-13.
Figure 5-13: Case PB3. Load case 1: prestressing (dimensions in m)
Load case 2: The moment and shear force envelope as a result of the loading from the testing
machine is given below, Figure 5-14. The unknown magnitude of force P is searched
for.

Rijkswaterstaat Centre for Infrastructure
Validation of the Guidelines for Nonlinear Page 67 of 113
Finite Element Analysis of Concrete Structures Issued: 15 June 2017
Part: Pre-stressed beams Version: 1.0
RTD: 1016-3B:2017 Status: Final
Figure 5-14: Case PB3. Load 2: Internal forces from testing machine (dimensions in
m)
Bending moment resistance
Figure 5-15: Case PB3: Forces acting on a section, ULS
Horizontal force equilibrium to determine a compression zone height; assumptions:
bilinear stress block and yielding of the bottom strands.
mmxEAfAAF CompZonepeppppepydpppeC 433)(10)(3343 1 sess
where:
kNbhhhMPaF
kNmmMPaMPammmm
hbb
F
kNMPaMPa
mmmmbf
mmhF
kNfbmmF
webinclinedflangezonecomp
inclined
flangehwebflange
flange
flcd
flange
cdflange
809.775.055.10
11722292
8.3255.10
2
204508
22
11022
8.3222.41149203
2149
3127149
.4
3
2
1
ss
s

Rijkswaterstaat Centre for Infrastructure
Validation of the Guidelines for Nonlinear Page 68 of 113
Finite Element Analysis of Concrete Structures Issued: 15 June 2017
Part: Pre-stressed beams Version: 1.0
RTD: 1016-3B:2017 Status: Final
3
3
1 1006166901092
.E
σ
x
)xmm(h.ε
p
pe
comp.zone
comp.zone
p which is lower than the yielding
strain of prestressing steel 310712.6 p
yd
pyE
fe therefore the increase of force in
prestressing steel at this location is as given in the equation for the horizontal force
equilibrium. At the level of straight strands, the strain in prestressing steel reached the
yielding strain therefore assuming no hardening of the steel, the increase of force in
prestressing steel is: )σ(fA pepydp 33 .
kNmkNmkNmmmkN
CmmEAmmCfAyzFM GpepppgpepydpctcRd
408286.1904.768142.0734.05478
)690)((10111)(33 1
ses
With superposition of bending moments from Load cases 1 and 2 at the location of
load P on the left hand side of the equation and the calculated design bending moment
resistance on the other, it is possible to determine the maximum load that can be
applied. It is: kNPkNmkNmkNmPm 115640825.257128642.4
Shear resistance
Shear resistance calculated according to EC2.
Resistance of stirrups:
kN..MPa.mmmm
mm.θfz
s
AV ywd
swRd,s 87426524365934
531
4265cot
2
kN..
..mmMPa.
θθ
νzαbfV cwwebcd
Rd, 18775240
5901812032341
cottan
1max
Where: 1811217inf
.f
σαMPa.
A
σAσ
cd
cp
cw
beam
p,p
cp
and 591.0200
9.01 ckf
The value of load P after accounting for the contribution of prestressing and the effect
of self-weight is: kNPkNPkNkN 42.66845.8662.087.4264.74
The design value of shear resistance of PB3 beam is also calculated according to the
Model Code 2010 (fib, 2013) applying three levels of approximations proposed for
analytical calculations.
Table 5-2: Case PB3. Parameters used in the calculation of VRd
Level I Level II Level III
min (°) 25 20 20
max (°) 45 45 45
ke 0.55 0.65 0.65
Level I Approximation
kNMPammmm
mmzf
s
AV ywd
s
sRd 8.365)25(cot4.365934531
4.265cot
2
minmin,
kN
mmmmMPa
zbf
kV w
c
ck
cRd
1294
)25(cos)25(sin9342035.1
84.61432.0cossin minminminmax,

Rijkswaterstaat Centre for Infrastructure
Validation of the Guidelines for Nonlinear Page 69 of 113
Finite Element Analysis of Concrete Structures Issued: 15 June 2017
Part: Pre-stressed beams Version: 1.0
RTD: 1016-3B:2017 Status: Final
Level II Approximation
Because of xe is negative for a whole range of EdV , the minimum angle of compressive
struts in taken in the calculations. It follows that: deg2010000deg20min xεθ
493.0552.1
1
1
e
ek
1786.030 3
1
ck
fcf
MPa
387.0 fcc kk e
kNMPammmm
mmzf
s
AV ywd
ssRd 7.468)20(cot8.365934
531
4.265cot
2
minmin,
kN.)()(mmmm.
MPa..
θθzbγ
fkθV w
c
ckcRd,
0497320cos20sin93420351
84613870
cossin minminminmax
Level III Approximation
0
2
2
1
pp
p
sss
EdEd,trialEd
x
AEz
zAE
z
z
z
ΔeNV
z
M
ε calculated at the critical section at the distance d
from the edge of the support for kNV trialEd 615, . Because 0xe , the minimum value
of an angle of compressive struts is investigated.
deg2010000deg20min xεθ
015.0cot002.02
min1 eee xx
493.0552.1
1
1
e
ek
1786030 3
1
.
f
MPaη
ck
fc
3870.ηkk fcεc
kN
)()(mmmm.
MPa..θθzb
γ
fkθV w
c
ck
cRd,
973
20cos20sin93420351
84613870cossin minminminmax
kN.)(MPa.mmmm
mm.θzf
s
AθV ywd
sRd,s 746820cot8365934
531
4265cot
2
minmin
147.0115001
4.0
max,
,
Rd
trialEd
x
vV
Vk
e
kN.mmmm.
MPa..zb
γ
fkV w
c
ck
vRd,c 619293420351
84611820
minmax θVVVV Rd,Rd,cRd,sRd
kN.VθVV Rd,cRd,sRd 4615min

Rijkswaterstaat Centre for Infrastructure
Validation of the Guidelines for Nonlinear Page 70 of 113
Finite Element Analysis of Concrete Structures Issued: 15 June 2017
Part: Pre-stressed beams Version: 1.0
RTD: 1016-3B:2017 Status: Final
The assumed trial shear resistance is equal to the calculated design shear resistance
hence no further iterations are required. The load P calculated including advantageous
contribution of prestressing and self-weight e.g. for LoA III:
kNkNPkNVVPV RdpSWRdsRd 745.7062.04.61562.0, gives kNPRd 23.998
Similar calculations were performed for the remaining levels of approximation.
The design value of beam resistance expressed in terms of applied load PRd are
summarized in Table 5-3.
Table 5-3: Case PB3. Design value of beam resistance expressed in terms of applied
load PRd (Model Code 2010)
EC2 Level I Level II Level III
PRd(kN) 668.42 595.64 761.6 998.23
5.3 Finite element model
Units Units are N, mm.
Material models and parameters The concrete model is based on a total strain rotating crack model with:
exponential softening in tension and parabolic behavior in compression,
variable Poisson’s ratio of concrete,
reduction of compressive strength of concrete due to lateral cracking with a
lower limit of 0.6.
increase in compressive strength due to lateral confinement according to the
model proposed by Selby and Vecchio (Selby and Vecchio 1993).
The mechanical properties are summarized in Table 5-4. On input, the GF value has
been decreased with a factor 2 in order to compensate for an underestimation of the
crack band width for cracks with an inclination angle of 45 degrees. The uniaxial
stress-strain curve is shown in Figure 5-16.
Table 5-4: Case PB3. Constitutive model parameters for concrete
fcm
(N/mm2)
fctm
(N/mm2)
Ec
(N/mm2)
ν GF
(Nmm/mm2)
Mean measured value 69.84 4.40* 34819 var 0.157
*
*Not specified in reference; calculated according to Model Code 2010 (fib, 2013)
cmct ff 1.01ln12.2

Rijkswaterstaat Centre for Infrastructure
Validation of the Guidelines for Nonlinear Page 71 of 113
Finite Element Analysis of Concrete Structures Issued: 15 June 2017
Part: Pre-stressed beams Version: 1.0
RTD: 1016-3B:2017 Status: Final
Figure 5-16: Case PB3. Stress-strain curve for concrete
The model for the reinforcement bars and stirrups is based on hardening plasticity.
Geometrical and mechanical properties of reinforcement are summarized in Table 5-1.
The stress-strain curve of stirrups is plotted in Figure 5-17.
Figure 5-17: Case PB3. Stress-strain curve adopted for stirrups
For the steel plates a linear elastic behavior is assumed, see Table 5-5.
Table 5-5: Case PB3. Steel plates properties
E
(N/mm2)
210000 0.3
-80
-70
-60
-50
-40
-30
-20
-10
0
-0.02 -0.015 -0.01 -0.005 0 0.005
s(N
/mm
2)
e (-)
-600
-400
-200
0
200
400
600
-0.03 -0.02 -0.01 0 0.01 0.02 0.03s(
N/m
m2)
e (-)

Rijkswaterstaat Centre for Infrastructure
Validation of the Guidelines for Nonlinear Page 72 of 113
Finite Element Analysis of Concrete Structures Issued: 15 June 2017
Part: Pre-stressed beams Version: 1.0
RTD: 1016-3B:2017 Status: Final
Interface elements were used between the steel support plates and the concrete beam at
the supports and loading positions. The interface stiffness was derived based on the
concrete properties. The total thickness of interface elements equals 1 mm.
A bilinear behavior in the normal direction (see Figure 5-18) and a linear elastic
relation in the shear direction were assumed. The normal stiffness in tension and the
stiffness in the shear direction were taken as almost equal to zero.
The mechanical properties of the interface elements are summarized in Table 5-6.
Table 5-6: Case PB3. Interface properties
Knn in tension
(N/mm3)
Knn in compression
(N/mm3)
Kt
(N/mm3)
3.48E-02 3.48E+04 3.48E-02
Figure 5-18: Case PB3. Traction-displacement diagram in normal direction for
interfaces
Element types and finite element mesh To mesh concrete beam 8-node membrane elements (CQ16M) with a full integration
scheme (3×3) were used. The average element size is 72×72 mm2. The dimensions of
the elements were established on the basis of an assumed constant thickness per
element, Figure 5-21 (c).
The reinforcement bars and stirrups were modelled with embedded truss elements with
two Gauss integration points along the axis of the element. Perfect bond is assumed.
Strands placed at the bottom were grouped and placed in the centerline. For the steel
plates 8-node membrane elements (CQ16M) were used. The 6-node interfaces
elements have three Lobatto integration points.
The adopted dimensions for the beam and for the transversal cross section of the beam
are given in Figure 5-19. The mesh of the beam is presented in Figure 5-20(a). The
different materials are indicated with different colors in Figure 5-20(b).
sn (N/mm )2
un (mm)10
3.48
3
-103
x101
3.48x10⁷

Rijkswaterstaat Centre for Infrastructure
Validation of the Guidelines for Nonlinear Page 73 of 113
Finite Element Analysis of Concrete Structures Issued: 15 June 2017
Part: Pre-stressed beams Version: 1.0
RTD: 1016-3B:2017 Status: Final
Figure 5-19: Case PB3. Dimensions of the beam and loading scheme; reinforcement,
cross section and support plate details (in m)
(a)
(b)
Figure 5-20: Case PB3. (a) Mesh and (b) material sets
Different groups of elements were defined to distinguish the concrete elements and the
steel elements. These groups will be used in section 5.4 to monitor the failure mode
during the analysis. For monitoring yielding of applied steel, groups STIRRUPS and
STRANDS refer to stirrups and strands of the beam respectively, see Figure 5-21 (b).
Figure 5-21 shows the groups of elements named SHEAR, used for tracking inelastic
behavior of concrete. Figure 5-21(c) shows the groups of element named FL_INF_C,
FL_INF_P, FL_INF_S, FL_INF_T, WEB, FL_SUP_P, FL_SUP_S, FL_SUP_C used
to model the cross section dimensions.
(a)
STIRRUPS STRANDS
extension
P0
P0P0
P0
P
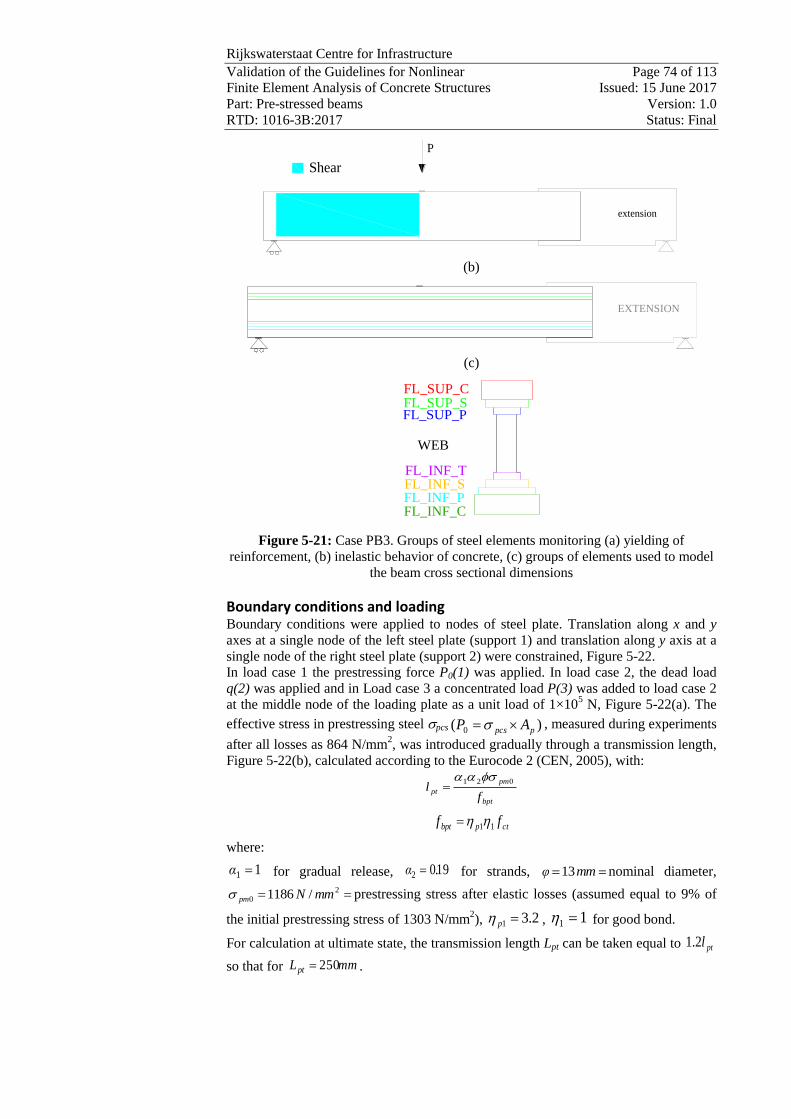
Rijkswaterstaat Centre for Infrastructure
Validation of the Guidelines for Nonlinear Page 74 of 113
Finite Element Analysis of Concrete Structures Issued: 15 June 2017
Part: Pre-stressed beams Version: 1.0
RTD: 1016-3B:2017 Status: Final
(b)
(c)
Figure 5-21: Case PB3. Groups of steel elements monitoring (a) yielding of
reinforcement, (b) inelastic behavior of concrete, (c) groups of elements used to model
the beam cross sectional dimensions
Boundary conditions and loading Boundary conditions were applied to nodes of steel plate. Translation along x and y
axes at a single node of the left steel plate (support 1) and translation along y axis at a
single node of the right steel plate (support 2) were constrained, Figure 5-22.
In load case 1 the prestressing force P0(1) was applied. In load case 2, the dead load
q(2) was applied and in Load case 3 a concentrated load P(3) was added to load case 2
at the middle node of the loading plate as a unit load of 1×10⁵ N, Figure 5-22(a). The
effective stress in prestressing steel spcs )( 0 ppcs AP s , measured during experiments
after all losses as 864 N/mm2, was introduced gradually through a transmission length,
Figure 5-22(b), calculated according to the Eurocode 2 (CEN, 2005), with:
bpt
pm
ptf
l021 s
ctpbpt ff 11
where:
11 α for gradual release, 1902 .α for strands, mmφ 13 nominal diameter,
2
0 /1186 mmNpms prestressing stress after elastic losses (assumed equal to 9% of
the initial prestressing stress of 1303 N/mm2), 2.31 p , 11 for good bond.
For calculation at ultimate state, the transmission length Lpt can be taken equal to ptl2.1
so that for mmLpt 250 .
P
extension
Shear
EXTENSION
FL_SUP_CFL_SUP_SFL_SUP_P
WEB
FL_INF_TFL_INF_SFL_INF_PFL_INF_C
EXTENSION
FL_SUP_CFL_SUP_SFL_SUP_P
WEB
FL_INF_TFL_INF_SFL_INF_PFL_INF_C

Rijkswaterstaat Centre for Infrastructure
Validation of the Guidelines for Nonlinear Page 75 of 113
Finite Element Analysis of Concrete Structures Issued: 15 June 2017
Part: Pre-stressed beams Version: 1.0
RTD: 1016-3B:2017 Status: Final
(a)
(b)
Figure 5-22: Case PB3. (a) Boundary conditions and load cases 1 and 2, (b) initial
stress in prestressing steel distribution
Load increments and convergence criteria Load case 1 was applied in 2 steps. The regular Newton-Raphson method with a
maximum of 25 iterations was used. As convergence criteria, the force and energy
norms were selected. The analysis was set to continue even if the convergence criteria
were not satisfied. The convergence tolerances were equal to 1×10⁻²
for the force norm
and 1×10³ for the energy norm. A Line Search algorithm was used to improve the
convergence performance.
Load case 2 was applied in 1 step. The regular Newton-Raphson method with a
maximum of 25 iterations was used. As convergence criteria, the norms of the force
and energy were selected. The analysis continued even if the convergence criteria were
not satisfied. The convergence tolerances were equal to 1×10⁻²
for the force norm and
equal to 1×10⁻³
for the energy norm. A Line Search algorithm was used to improve the
convergence performance.
Load case 3 was applied with automatic adaptive load increments, based on energy has
been selected. The initial load factor was 5, the upper limit of the incremental load
factor equaled 10 and the lower limit of the incremental load factor equaled 3. The
maximum number of steps was 100. Arc-length control was applied based on
translation along y axis of node 2394 (“indirect displacement control”), Figure 5-23.
The analysis continued even if the convergence criteria were not satisfied. The
convergence tolerance was equal to 1×10⁻³
and 1×10⁻²
for the energy and force norms
respectively. A maximum of 50 iterations was used. A line search algorithm was used
to improve the convergence performance.
Figure 5-23: Case PB3. `Indirect Displacement control' technique applied referring to
node 2394
P0(1)P0(1)
P0(1)q(1)
P(2)
Support 1 Support 2P0(1)
P(3)
q(2)
864
242 9296
spcs (N/mm )
distance (mm)
2394

Rijkswaterstaat Centre for Infrastructure
Validation of the Guidelines for Nonlinear Page 76 of 113
Finite Element Analysis of Concrete Structures Issued: 15 June 2017
Part: Pre-stressed beams Version: 1.0
RTD: 1016-3B:2017 Status: Final
5.4 Nonlinear finite element analysis
Load deflection The load-deflection curve with marked values of the applied load corresponding to the
beginning of yielding of stirrups and crushing of concrete are presented in Figure 5-24.
The depicted load-deflection curve does not include the response of the beam from
application of prestressing and dead load.
The onset point of crushing of concrete was registered when the first integration point
reaches the minimum principal strain value of -3.5‰.
For the load case 3, the peak load was defined as the highest load step where the
energy norm ratio satisfied the fixed tolerance of 1×10⁻³
.
The convergence behavior was quite poor after reaching the peak load. After step 75,
the analysis continued even if the energy convergence criteria were not satisfied within
the maximum number of iterations equal to 50. The post peak branch of the load –
deflection curve is for this reason plotted with a dot line.
Figure 5-24: Case PB3. Load-deflection curve
Convergence behavior For most steps convergence was achieved on the basis of the energy criterion, Figure
5-25-Figure 5-26. For load case 3, the energy norm ratio satisfied the fixed tolerance of
1×10⁻³
for almost all the steps of the analysis until to the peak load, while force norm
ratio was higher than the fixed tolerance for most of steps.

Rijkswaterstaat Centre for Infrastructure
Validation of the Guidelines for Nonlinear Page 77 of 113
Finite Element Analysis of Concrete Structures Issued: 15 June 2017
Part: Pre-stressed beams Version: 1.0
RTD: 1016-3B:2017 Status: Final
Figure 5-25: Case PB3. Evolution of the energy norm (blue lines indicate steps, red
line indicates tolerance, green points indicate iterative results)
Figure 5-26: Case PB3. Evolution of the force norm (blue lines indicate steps, red line
indicates tolerance, green points indicate iterative results)

Rijkswaterstaat Centre for Infrastructure
Validation of the Guidelines for Nonlinear Page 78 of 113
Finite Element Analysis of Concrete Structures Issued: 15 June 2017
Part: Pre-stressed beams Version: 1.0
RTD: 1016-3B:2017 Status: Final
Strains Figure 5-27 shows the crack strain values at the peak load –step 75. Figure 5-28 shows
the minimum principal strain values at crushing of concrete – step 71. From the values
of crack strain and the contours which can be regarded as the representation of crack
pattern, it can be concluded that the beam failed due to diagonal-tension. The crack
pattern from the NLFEA can be compared with the experimental crack pattern in
Figure 5-29
Figure 5-27: Case PB3. Crack strain values at step 75 (peak load)
Figure 5-28: Case PB3. Minimum principal strain values at step 71
0
1
2
3
4
5
0.0000 0.0005 0.0010 0.0015 0.0020
s(N
/mm
2)
e (-)
0
0.5
1
1.5
2
2.5
0.0000 0.0010 0.0020 0.0030 0.0040 0.0050 0.0060
-80
-70
-60
-50
-40
-30
-20
-10
0
-0.02 -0.015 -0.01 -0.005 0
s(N
/mm
2)
e (-)
0
0.5
1
1.5
2
2.5
0.0000 0.0010 0.0020 0.0030 0.0040 0.0050 0.0060

Rijkswaterstaat Centre for Infrastructure
Validation of the Guidelines for Nonlinear Page 79 of 113
Finite Element Analysis of Concrete Structures Issued: 15 June 2017
Part: Pre-stressed beams Version: 1.0
RTD: 1016-3B:2017 Status: Final
Figure 5-29: Case PB3. Experimental crack pattern at failure (load kNP 2313 )
The yielding strain for stirrups is equal to 310222210464 .GPaMPa . The stirrups
start to yield at a load equal to 1770 kN (step 53). Figure 5-30 shows yielding of
stirrups a few steps after the yielding point – step 65.
Figure 5-30: Case PB3. Yielding of stirrups at step 65
Gauss point statistics In Table 5-6 the number of cracking points, crushing points and yield points are
reported at step 53 (yielding of stirrups), at step 71 (crushing of concrete) and at step
77 (peak load).
Table 5-7: Case PB3. Number of cracking points, crushing points and yield points
STEP 53 ITERATIONS 8
GROUP
NAME PLAST PRV. PL CRITIC
PLAST
NEW
PRV.PL
NEW
CRITIC
NEW
STIRRUPS 1 0 0 1 0 0
TOTAL
MODEL 1 0 0 1 0 0
CRACKING LOGGING SUMMARY
GROUP
NAME CRACK OPEN CLOSED ACTIVE INACTI ARISES
WEB 488 483 5 360 128 41
fl_sup_c 2 2 0 0 2 0
fl_inf_p 98 89 9 76 22 12
-600
-400
-200
0
200
400
600
-0.03 -0.02 -0.01 0 0.01 0.02 0.03
s(
N/m
m2)
e (-)
0
0.5
1
1.5
2
2.5
0.0000 0.0010 0.0020 0.0030 0.0040 0.0050 0.0060
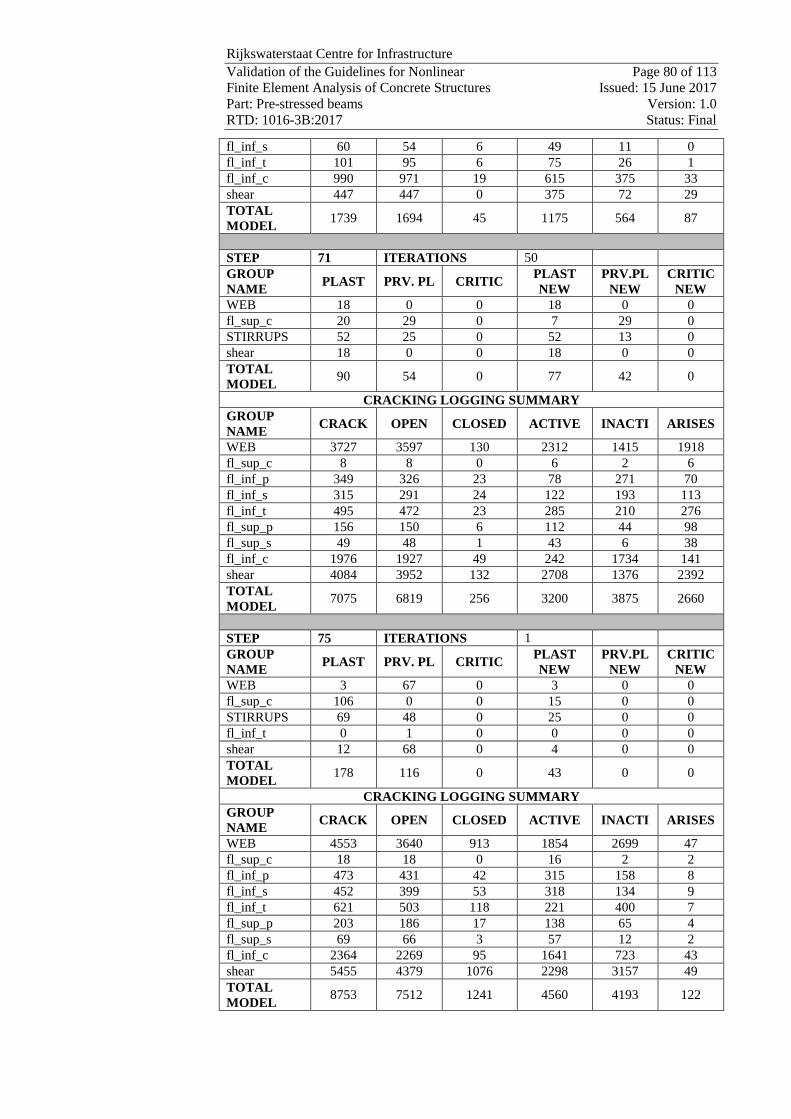
Rijkswaterstaat Centre for Infrastructure
Validation of the Guidelines for Nonlinear Page 80 of 113
Finite Element Analysis of Concrete Structures Issued: 15 June 2017
Part: Pre-stressed beams Version: 1.0
RTD: 1016-3B:2017 Status: Final
fl_inf_s 60 54 6 49 11 0
fl_inf_t 101 95 6 75 26 1
fl_inf_c 990 971 19 615 375 33
shear 447 447 0 375 72 29
TOTAL
MODEL 1739 1694 45 1175 564 87
STEP 71 ITERATIONS 50
GROUP
NAME PLAST PRV. PL CRITIC
PLAST
NEW
PRV.PL
NEW
CRITIC
NEW
WEB 18 0 0 18 0 0
fl_sup_c 20 29 0 7 29 0
STIRRUPS 52 25 0 52 13 0
shear 18 0 0 18 0 0
TOTAL
MODEL 90 54 0 77 42 0
CRACKING LOGGING SUMMARY
GROUP
NAME CRACK OPEN CLOSED ACTIVE INACTI ARISES
WEB 3727 3597 130 2312 1415 1918
fl_sup_c 8 8 0 6 2 6
fl_inf_p 349 326 23 78 271 70
fl_inf_s 315 291 24 122 193 113
fl_inf_t 495 472 23 285 210 276
fl_sup_p 156 150 6 112 44 98
fl_sup_s 49 48 1 43 6 38
fl_inf_c 1976 1927 49 242 1734 141
shear 4084 3952 132 2708 1376 2392
TOTAL
MODEL 7075 6819 256 3200 3875 2660
STEP 75 ITERATIONS 1
GROUP
NAME PLAST PRV. PL CRITIC
PLAST
NEW
PRV.PL
NEW
CRITIC
NEW
WEB 3 67 0 3 0 0
fl_sup_c 106 0 0 15 0 0
STIRRUPS 69 48 0 25 0 0
fl_inf_t 0 1 0 0 0 0
shear 12 68 0 4 0 0
TOTAL
MODEL 178 116 0 43 0 0
CRACKING LOGGING SUMMARY
GROUP
NAME CRACK OPEN CLOSED ACTIVE INACTI ARISES
WEB 4553 3640 913 1854 2699 47
fl_sup_c 18 18 0 16 2 2
fl_inf_p 473 431 42 315 158 8
fl_inf_s 452 399 53 318 134 9
fl_inf_t 621 503 118 221 400 7
fl_sup_p 203 186 17 138 65 4
fl_sup_s 69 66 3 57 12 2
fl_inf_c 2364 2269 95 1641 723 43
shear 5455 4379 1076 2298 3157 49
TOTAL
MODEL 8753 7512 1241 4560 4193 122

Rijkswaterstaat Centre for Infrastructure
Validation of the Guidelines for Nonlinear Page 81 of 113
Finite Element Analysis of Concrete Structures Issued: 15 June 2017
Part: Pre-stressed beams Version: 1.0
RTD: 1016-3B:2017 Status: Final
5.5 Application of safety format
As proposed by the Model Code 2010 (fib, 2013), the safety formats for non-linear
analyses include three numerical methods denoted as GRF (Global Resistance Factor
method), PF (Partial Factor method) and ECOV (Method of Estimation of a Coefficient
of Variation of resistance). In Table 5-8 to Table 5-10, the mechanical properties of
concrete and steel applied in the non-linear analyses are summarized.
Table 5-8: Case PB3. Constitutive model parameters for concrete
fc
(N/mm2)
fct
(N/mm2)
Ec
(N/mm2)
GF
(Nmm/mm2)
GC
(Nmm/mm2)
Mean measured 69.84 4.40 34819 var 0.157 39.1924
Characteristic 61.84 3.08 37138 var 0.153 38.3435
Mean GRF 52.56 4.21 35371 var 0.149 37.2380
Design 41.22 2.05 32885 var 0.143 35.6447
Table 5-9: Case PB3. Constitutive model parameters for reinforcing bars (stirrups)
As fy ft Es εsy
(mm) (mm2) (N/mm
2) (N/mm
2) (N/mm
2) (-)
Mean measured 13 132.7 464 570 210000 0.0022
Characteristic 13 132.7 420.26 516.27 210000 0.0020
Mean GRF 13 132.7 462.29 567.90 210000 0.0022
Design 13 132.7 365.45 448.93 210000 0.0017
Table 5-10: Case PB3. Constitutive model parameters for reinforcing bars (strands)
As fy ft Es εsy
(mm) (mm2) (N/mm
2) (N/mm
2) (N/mm
2) (-)
Mean measured 43×11.2 4247 1675 1862 196500 0.0085
Characteristic 43×11.2 4247 1517.11 1686.49 196500 0.0077
Mean GRF 43×11.2 4247 1668.83 1855.14 196500 0.0084
Design 43×11.2 4247 1319.23 1466.51 196500 0.0067

Rijkswaterstaat Centre for Infrastructure
Validation of the Guidelines for Nonlinear Page 82 of 113
Finite Element Analysis of Concrete Structures Issued: 15 June 2017
Part: Pre-stressed beams Version: 1.0
RTD: 1016-3B:2017 Status: Final
Figure 5-31: Case PB3. Load-deflection curves obtained with mean measured,
characteristic, mean GRF and design mechanical properties
PB3 beam was analyzed with the analytical and numerical methods. Figure 5-32 shows
the comparison between analytical and numerical design values of beam resistance PRd
expressed in terms of a percentage of the experimental ultimate value of applied load.
The analysis named “no safety format” refer to a NLFE analysis carried out using
mean measured values of material strengths without applying any safety coefficient.
Figure 5-32: Case PB3. Analytical and numerical design values of beam resistance
expressed in terms of a percentage of the experimental ultimate value of applied load,
kNPExp 2313
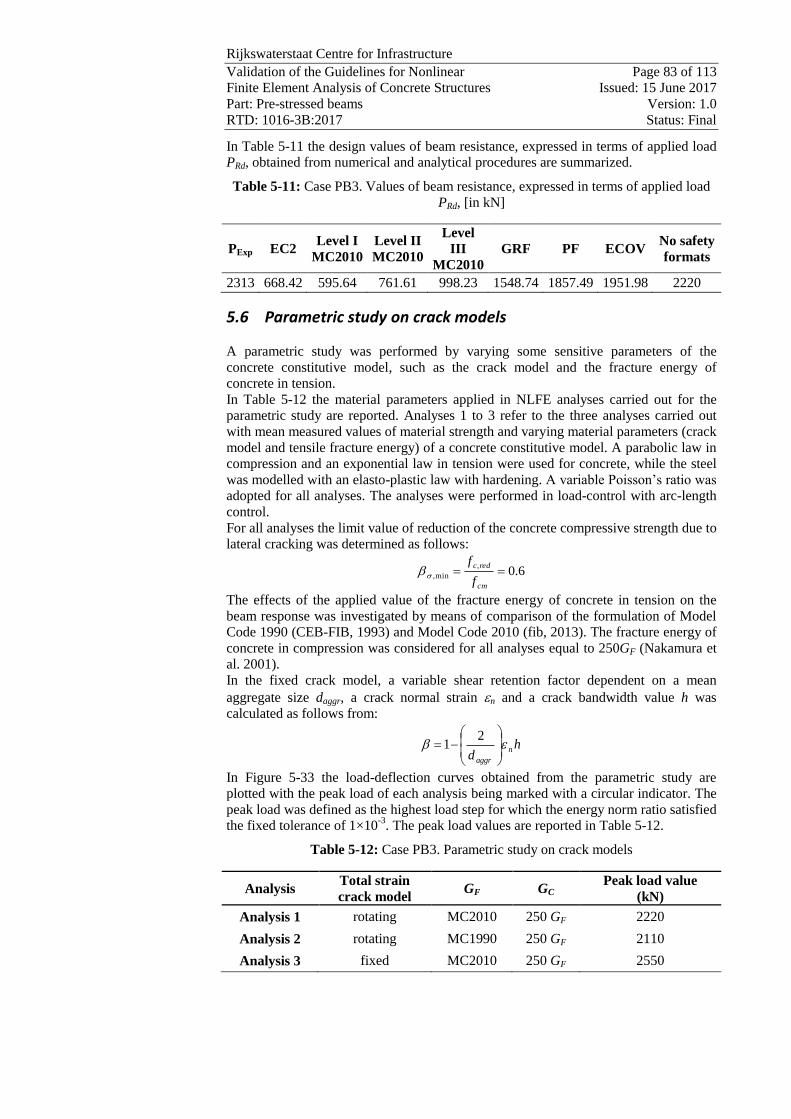
Rijkswaterstaat Centre for Infrastructure
Validation of the Guidelines for Nonlinear Page 83 of 113
Finite Element Analysis of Concrete Structures Issued: 15 June 2017
Part: Pre-stressed beams Version: 1.0
RTD: 1016-3B:2017 Status: Final
In Table 5-11 the design values of beam resistance, expressed in terms of applied load
PRd, obtained from numerical and analytical procedures are summarized.
Table 5-11: Case PB3. Values of beam resistance, expressed in terms of applied load
PRd, [in kN]
PExp EC2 Level I
MC2010
Level II
MC2010
Level
III
MC2010
GRF PF ECOV No safety
formats
2313 668.42 595.64 761.61 998.23 1548.74 1857.49 1951.98 2220
5.6 Parametric study on crack models
A parametric study was performed by varying some sensitive parameters of the
concrete constitutive model, such as the crack model and the fracture energy of
concrete in tension.
In Table 5-12 the material parameters applied in NLFE analyses carried out for the
parametric study are reported. Analyses 1 to 3 refer to the three analyses carried out
with mean measured values of material strength and varying material parameters (crack
model and tensile fracture energy) of a concrete constitutive model. A parabolic law in
compression and an exponential law in tension were used for concrete, while the steel
was modelled with an elasto-plastic law with hardening. A variable Poisson’s ratio was
adopted for all analyses. The analyses were performed in load-control with arc-length
control.
For all analyses the limit value of reduction of the concrete compressive strength due to
lateral cracking was determined as follows:
6.0,
min, cm
redc
f
fs
The effects of the applied value of the fracture energy of concrete in tension on the
beam response was investigated by means of comparison of the formulation of Model
Code 1990 (CEB-FIB, 1993) and Model Code 2010 (fib, 2013). The fracture energy of
concrete in compression was considered for all analyses equal to 250GF (Nakamura et
al. 2001).
In the fixed crack model, a variable shear retention factor dependent on a mean
aggregate size daggr, a crack normal strain en and a crack bandwidth value h was
calculated as follows from:
hd
n
aggr
e
21
In Figure 5-33 the load-deflection curves obtained from the parametric study are
plotted with the peak load of each analysis being marked with a circular indicator. The
peak load was defined as the highest load step for which the energy norm ratio satisfied
the fixed tolerance of 1×10⁻³
. The peak load values are reported in Table 5-12.
Table 5-12: Case PB3. Parametric study on crack models
Analysis Total strain
crack model GF GC
Peak load value
(kN)
Analysis 1 rotating MC2010 250 GF 2220
Analysis 2 rotating MC1990 250 GF 2110
Analysis 3 fixed MC2010 250 GF 2550

Rijkswaterstaat Centre for Infrastructure
Validation of the Guidelines for Nonlinear Page 84 of 113
Finite Element Analysis of Concrete Structures Issued: 15 June 2017
Part: Pre-stressed beams Version: 1.0
RTD: 1016-3B:2017 Status: Final
Figure 5-33: Case PB3. Load-deflection curves of parametric study
Comparing analysis 1 to analysis 2, a relatively small influence of the adopted values
of the fracture energy of concrete in tension ( mmN.GF,MC 11701990 ;
mmN.GF,MC 15702010 ) and the corresponding values of the fracture energy of concrete
in compression ( mmN.GC,MC 24291990 ; mmN.GC,MC 19392010 ) can be noted, despite
the beam having failed in shear compression. It is due to the fact that by increasing the
compressive strength, the difference between the fracture energy of concrete in tension
calculated according to the Model Code 2010 and Model Code 1990 decreases; with
the fracture energy of concrete in tension being exponentially dependent on the
compressive strength. Since the compressive strength of PB3 beam is equal to 69.84
MPa, the difference between the fracture energy of concrete in tension calculated
according to the Model Code 2010 and the Model Code 1990 is relatively small.
From the comparison of analyses 1 and 3, it can be noted that for beam PB3 the
adopted crack model (total strain rotating or fixed crack model) has a big influence on
the beam response, especially in terms of peak deformation. The peak load and peak
deformation are significantly overestimated if a fixed crack model with the aggregate
size based shear retention factor is applied. Furthermore, the crack pattern and failure
mode from experiments can be better reproduced with the analysis containing the
rotating crack model.
5.7 Concluding remarks
Prestressed beam PB3 subjected to a concentrated loading exhibited a shear-
compressive failure mechanism at a load equal to kNP 2313 .
The beam was modeled with 8-node membrane elements for the concrete and
embedded truss elements for the reinforcement. Perfect bond is assumed. The concrete
model is based on a total strain rotating crack model with exponential tension softening
in tension and parabolic behavior in compression, variable Poisson’s ratio of concrete
and reduction of compressive strength of concrete due to lateral cracking with a lower
limit of 0.6. The model for the stirrups is based on hardening plasticity.
A shear-compressive failure mechanism was achieved from NLFEA carried out with
mean measured values of material strengths. The peak value of applied load obtained

Rijkswaterstaat Centre for Infrastructure
Validation of the Guidelines for Nonlinear Page 85 of 113
Finite Element Analysis of Concrete Structures Issued: 15 June 2017
Part: Pre-stressed beams Version: 1.0
RTD: 1016-3B:2017 Status: Final
from NLFEA is equal to 2020 kN and the failure mode is characterized by sudden
opening of shear cracks in the web, yielding of stirrups and crushing of concrete in the
web.
Safety formats for non-linear finite element analyses as proposed by the Model Code
2010 (fib, 2013) were applied to compute the design values of beam resistance
expressed in terms of applied load. From the results, it was concluded that the design
resistance obtained with the safety formats was higher than the design resistance
calculated with the analytical methods for sectional analysis.
Next, a sensitivity study on models which contained different values of fracture energy
of concrete in tension i.e. according to the Model Code 2010 and 1990, the
corresponding fracture energy of concrete in compression and different crack models
were examined.Since the beam failed in shear due to crushing of concrete, the failure
mode was influenced by both the adopted crack model and the values of fracture
energy of concrete in tension and in compression.
Based on the results, it can be concluded that consistent and reliable results can be
obtained by adopting variable Poisson’s ratio, reduction of the compressive strength
due to lateral cracking with a low limit of 0.6, total strain rotating crack model and
fracture energy of concrete in tension according to Model Code 2010. An energy norm
with a tolerance of 10-3
is recommended.

Rijkswaterstaat Centre for Infrastructure
Validation of the Guidelines for Nonlinear Page 86 of 113
Finite Element Analysis of Concrete Structures Issued: 15 June 2017
Part: Pre-stressed beams Version: 1.0
RTD: 1016-3B:2017 Status: Final
6 Case PB4: Leonhardt, Koch et Rostásy (1973)
This prestressed beam case is beam TP2 from the experiments of Leonhardt, Koch, and
Rostásy (Leonhardt et al. 1973). The beam was loaded in 3-points until to the shear
compressive failure was reached. Beam PB4 (TP2 in experiments) was selected as case
study due to its shear-compression failure mechanism.
6.1 Experimental setup and results
Geometry The geometry, cross-sectional details and the reinforcement details are shown in Figure
6-1, Figure 6-2 and Figure 6-3. The span is 6.5 m with a total length equal to 7.0 m.
The depth of the beam is 0.97 m with a variable thickness of the web. The beam has
longitudinal reinforcement, non-symmetric layout of stirrups characterized by stirrups
12 on the left hand-side and stirrups 10 on the right hand-side and two post-
tensioned prestressing strands which are slightly curved upwards near the ends of the
beam. Each strand contains 12 wires with a diameter of 12.2 mm. The initial stress in
each tendon, measured after the losses is equal to 681 MPa.
Figure 6-1: Case PB4. Overall dimensions (in cm) (Leonhardt et al. 1973)
Figure 6-2: Case PB4. Reinforcement details and cross-sectional dimensions (in cm)
(Leonhardt et al. 1973)
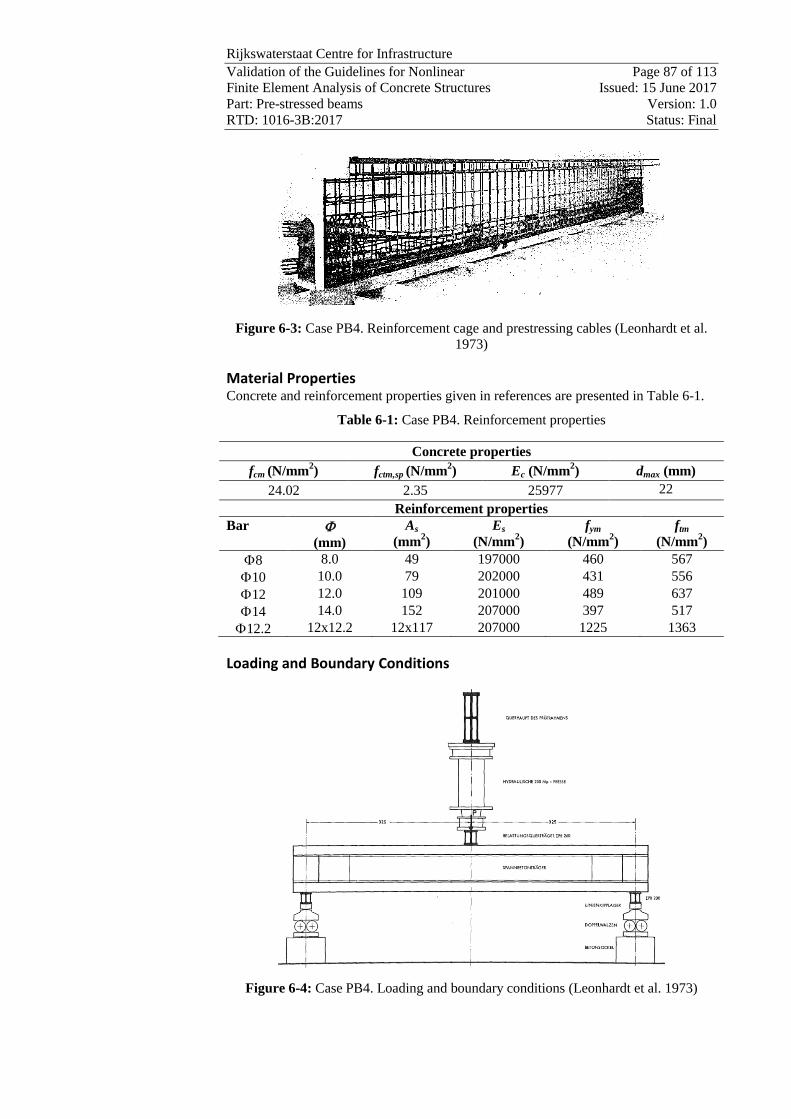
Rijkswaterstaat Centre for Infrastructure
Validation of the Guidelines for Nonlinear Page 87 of 113
Finite Element Analysis of Concrete Structures Issued: 15 June 2017
Part: Pre-stressed beams Version: 1.0
RTD: 1016-3B:2017 Status: Final
Figure 6-3: Case PB4. Reinforcement cage and prestressing cables (Leonhardt et al.
1973)
Material Properties Concrete and reinforcement properties given in references are presented in Table 6-1.
Table 6-1: Case PB4. Reinforcement properties
Concrete properties
fcm (N/mm2) fctm,sp (N/mm
2) Ec (N/mm
2) dmax (mm)
24.02 2.35 25977 22
Reinforcement properties
Bar
(mm)
As
(mm2)
Es
(N/mm2)
fym
(N/mm2)
ftm
(N/mm2)
8 8.0 49 197000 460 567
10 10.0 79 202000 431 556
12 12.0 109 201000 489 637
14 14.0 152 207000 397 517
12.2 12x12.2 12x117 207000 1225 1363
Loading and Boundary Conditions
Figure 6-4: Case PB4. Loading and boundary conditions (Leonhardt et al. 1973)

Rijkswaterstaat Centre for Infrastructure
Validation of the Guidelines for Nonlinear Page 88 of 113
Finite Element Analysis of Concrete Structures Issued: 15 June 2017
Part: Pre-stressed beams Version: 1.0
RTD: 1016-3B:2017 Status: Final
The loading and boundary conditions in the experimental setup are shown in Figure
6-4. The unit for the forces used in the reference is Mp which is approximately 10 kN.
The prestressing was applied 20 days after casting in four step of stressing to the stress
level of 995kN in each cable. The measured prestressing after losses was equal to
956kN in each cable. During the prestressing process, a vertical load equal to 588 kN,
was applied as the counteraction force to minimize the tensile stress in the upper flange
of the beam.
Experimental Results The beam exhibited a shear-compressive failure mode at the maximum load equal to
1491.12 kN (152 Mp) at which the concrete in the top part of the web at right hand side
clearly crushed. In Figure 6-5 the experimental crack pattern at failure is shown. The
development of the crack pattern is shown Figure 6-6. The measured deflections at
various points across the span are shown in Table 6-2 and the load-deflection curve of
the center of the beam (point D0) is shown in Figure 6-7.
Figure 6-5: Case PB4. Crack pattern at ULS load level, equal to 1491.12 kN
(Leonhardt et al. 1973)
Table 6-2: Case PB4. Measured deflection at various points across the span (Leonhardt
et al. 1973)
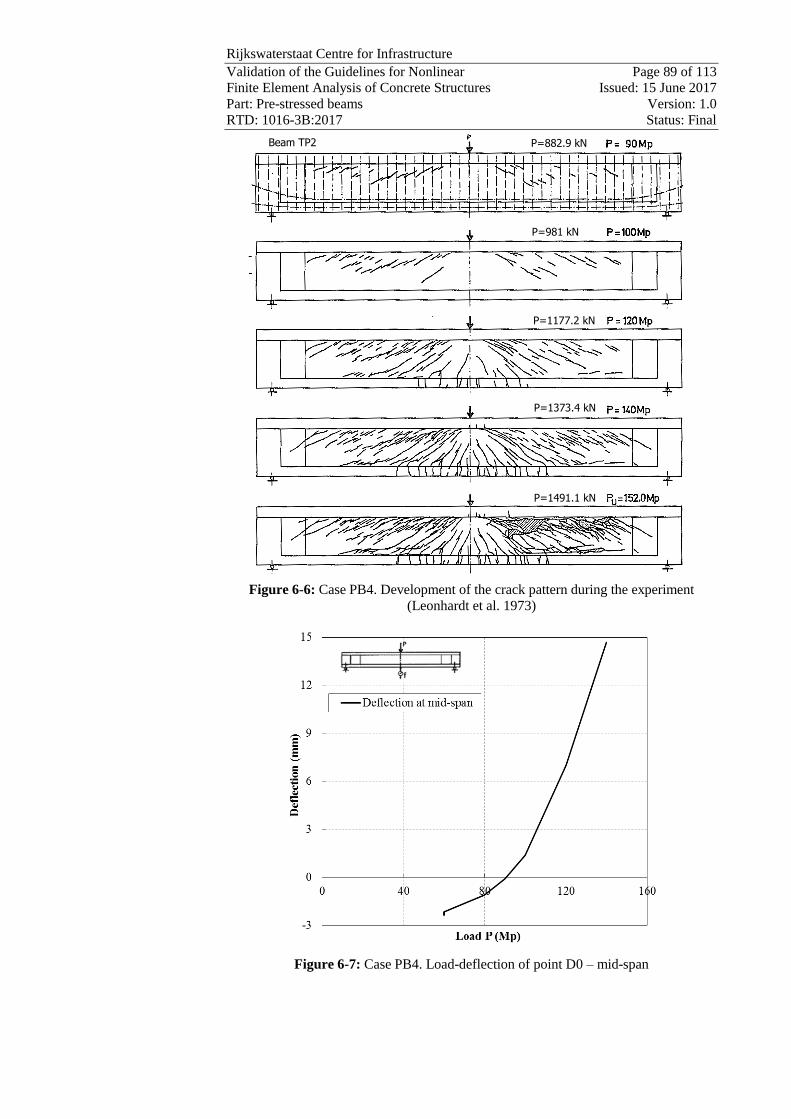
Rijkswaterstaat Centre for Infrastructure
Validation of the Guidelines for Nonlinear Page 89 of 113
Finite Element Analysis of Concrete Structures Issued: 15 June 2017
Part: Pre-stressed beams Version: 1.0
RTD: 1016-3B:2017 Status: Final
Figure 6-6: Case PB4. Development of the crack pattern during the experiment
(Leonhardt et al. 1973)
Figure 6-7: Case PB4. Load-deflection of point D0 – mid-span
Beam TP2 P=882.9 kN
P=981 kN
P=1177.2 kN
P=1373.4 kN
P=1491.1 kN

Rijkswaterstaat Centre for Infrastructure
Validation of the Guidelines for Nonlinear Page 90 of 113
Finite Element Analysis of Concrete Structures Issued: 15 June 2017
Part: Pre-stressed beams Version: 1.0
RTD: 1016-3B:2017 Status: Final
6.2 Analytical analysis
In Figure 6-8 the load configuration at failure is reported.
Figure 6-8: Case PB4. Load configuration at failure (dimensions in m)
Load case 1:Self-weight
Figure 6-9: Case PB4. Internal forces from self-weight (dimensions in m)
Counteracting point load:
Figure 6-10: Case PB4. Load 1: Internal forces from counteracting point load
(dimensions in m)
Prestressing force:
Prestressing applied on to the beam on an eccentricity gives rise to bending moment of
the value:
kNmm.kNeσAM ppPP 944494019122 inf
0,250 6,500
P = 1491 kN
0,250

Rijkswaterstaat Centre for Infrastructure
Validation of the Guidelines for Nonlinear Page 91 of 113
Finite Element Analysis of Concrete Structures Issued: 15 June 2017
Part: Pre-stressed beams Version: 1.0
RTD: 1016-3B:2017 Status: Final
where pe is the difference between the centroidal axis and the centre of gravity of
prestressing steel: mmmA
mmAmmACe
p
pp
Gp 494.013.0624.02
75185
It is assumed that the bottom strand is straight whereas the upper inclined 14 degrees to
horizontal at the ends.
Figure 6-11: Case PB4: Internal forces from prestressing
Load case 2: Figure 6-12 shows the maximum moment at mid-span
Figure 6-12: Case PB4. Load 2: Internal forces from point load (dimensions in m)
Bending moment resistance: The design value of bending moment resistance was calculated assuming a bi-linear
concrete stress block, an elastic-plastic stress-strain relation without hardening
(horizontal plastic branch) and safety factors as given in Eurocode 2.
The bending moment capacity of the section presented in Figure 6-13 was calculated
assuming yielding of the reinforcement located in the top and bottom flange. The
reinforcement in the web remained in the elastic range.
The height of the compression zone was determined from the horizontal force
equilibrium.

Rijkswaterstaat Centre for Infrastructure
Validation of the Guidelines for Nonlinear Page 92 of 113
Finite Element Analysis of Concrete Structures Issued: 15 June 2017
Part: Pre-stressed beams Version: 1.0
RTD: 1016-3B:2017 Status: Final
2
infinf211
2502
22
ydstopwebcdflangewebcdflangeflangecd
p,pypp,pss,webs,webss,webs,webydsb
fAbxf.hxbfhbf
)σ( fAσAEεAEεAfA
Solving the quadratic equation, the height of compressive zone is: 474mm
Figure 6-13: Case PB4: Forces acting on a section
The design bending moment resistance calculated around the centre of gravity of the
section CG
mkNM Rd 1150
In order to determine the maximum value of the load that the member is able to
withstand, the design bending moment has to be equated with the loads acting on the
beam, RdEd MM
kNPmkNP.mkN.mkNmkN.mkN. 7901150456122294459558444
is the additional load that can be applied apart from the counteracting point load.
Shear resistance
EC2 calculations
kN.).(MPa.mm.mm
mmθzf
s
AV ywd
swRd,s 7333438cot533926744
150
157cot
2
max
kN.).().(
MPa..mmmm.fzνbαV cdwcw
Rd, 7333438tan438cot
681060744115251
)tan()cot(
1
max
taking into account that:
mmφ 70 is external grouted sleeve dimeter φ.bb./b/ w 50751881508
Model Code 2010, Levels of Approximation II and III
Table 6-3: Case PB4. Parameters used in the calculation of VRd
Level I Level II Level III
min (°) 25 20 20
max (°) 45 45 45
ke 0.55 0.65 0.65

Rijkswaterstaat Centre for Infrastructure
Validation of the Guidelines for Nonlinear Page 93 of 113
Finite Element Analysis of Concrete Structures Issued: 15 June 2017
Part: Pre-stressed beams Version: 1.0
RTD: 1016-3B:2017 Status: Final
Level of approximation I
kN.)(MPa..mmmm
mmθzf
s
AV ywd
swRd,s 564245cot5339744
150
157cot
2
max
kN.)()(mmmm.
MPa.θθzb
γ
fkV w
c
ckcRd, 425145cos45sin744115
51
16550cossin maxmaxmax
Thus solution acc. to LoA I is not possible.
Level of approximation II
The shear resistance was considered at the critical section located d from the edge of
the support. For the whole range of the assumed values of trialEdV , , the resulting value
of strain parameter xe was very low or negative (then according to the code 0xε ).
This translates into a low angle of inclination of compressive struts i.e. the value close
to the prescribed minimum of 20 degrees. It is well known that, although it increases
the resistance attributed to stirrups, low angles may imply crushing of concrete at a
lower load. Because of a brittle nature of shear failure due to crushing of concrete,
shear resistance of stirrups must be lower than shear force that would lead to crushing
of concrete.
In the considered case study the shear resistance is governed by crushing of concrete
and consequently it was necessary to find such an angle minθ that fulfilled the balance
condition. It constitutes the highest possible shear resistance, yet the code’s provisions
are still met. The balance condition was obtained for the angle of 41.9 degrees. The
angle fits within the allowable range of angles given in the code. The shear resistance
is:
kN).(MPa.mm.mm
mmθzf
s
AV ywd
swRd,s 295941cot533926744
150
157cot
2
kN).().(mm.mm.
MPa.θθzb
γ
fkV w
c
ckcRd, 295941cos941sin26744115
51
16650cossinmax
Level of approximation III
Because from the calculations it appears that the governing failure mechanism is due to
crushing of concrete, the concrete contribution to the total shear resistance cannot be
accounted for. Hence, the shear resistance is calculated as in the level II approximation.
In Table 6-4 the results of the shear resistance calculations according to the EC2 and
Model Code 2010 are listed. These results were obtained taking into account the self-
weight but excluding the positive effect of prestressing (active only in the regions were
inclined strands are present i.e. closer than the location of the critical section d from the
support). An example of such calculations is given for the case of EC2 and shear force
from the self-weight at the section d from the support:
kNPkN.P.kN. 6267120507333 is the total load which can be applied to a member.
Table 6-4: Case PB4. Design value of beam resistance expressed in terms of applied
load PRd (Model Code 2010)
EC2 Level I Level II Level III
PRd (kN) 626.0 - 548.58 548.58
From the above calculations, it is concluded that the beam fails in shear.

Rijkswaterstaat Centre for Infrastructure
Validation of the Guidelines for Nonlinear Page 94 of 113
Finite Element Analysis of Concrete Structures Issued: 15 June 2017
Part: Pre-stressed beams Version: 1.0
RTD: 1016-3B:2017 Status: Final
6.3 Finite element model
Units Units are N, mm.
Material models and parameters The concrete model is based on a total strain rotating crack model with:
exponential softening in tension and parabolic behavior in compression,
variable Poisson’s ratio of concrete and
reduction of compressive strength of concrete due to lateral cracking with a
lower limit of 0.6
increase in compressive strength due to lateral confinement according to the
model proposed by Selby and Vecchio (Selby and Vecchio 1993).
The mechanical properties are summarized in Table 6-5. On input, the GF value has
been decreased with a factor 2 in order to compensate for an underestimation of the
crack band width for cracks with an inclination angle of 45 degrees. The uniaxial stress
-strain curve is shown in Figure 6-14.
The model for the reinforcement bars and stirrups is based on hardening plasticity.
Geometrical and mechanical properties of reinforcement are summarized in Table 6-1.
The stress – strain curve of the stirrups 10 is plotted in Figure 6-15.
Table 6-5: Case PB4. Constitutive model parameters for concrete
fcm
(N/mm2)
fctm
(N/mm2)
Ec
(N/mm2)
ν GF
(Nmm/mm2)
Mean measured
value 24.02 2.12
# 25977 var 0.129
*
*Not specified in reference; estimated according to Model Code 2010 (fib, 2013)
#Estimated from the mean splitting tensile strength of concrete as ctm,spctm f.f 90
according to Eurocode 2 formulation (CEN, 2005)
Figure 6-14: Case PB4. Stress-strain curve for concrete

Rijkswaterstaat Centre for Infrastructure
Validation of the Guidelines for Nonlinear Page 95 of 113
Finite Element Analysis of Concrete Structures Issued: 15 June 2017
Part: Pre-stressed beams Version: 1.0
RTD: 1016-3B:2017 Status: Final
Figure 6-15: Case PB4. Stress-strain curve adopted for stirrups 10
For the steel plates a linear elastic behavior is assumed, see Table 6-6.
Table 6-6: Case PB4. Steel plates properties
E
(N/mm2)
210000 0.3
Interface elements were used between the steel support plates and the concrete beam at
the supports and loading positions. The interface stiffness was derived on the basis of
concrete properties. The total thickness of interface elements equals 1 mm. A bilinear
behavior is assumed in the normal direction (see Figure 6-16) and a linear elastic
relation is assumed in the shear direction. The normal stiffness in tension and the
stiffness in shear direction were assumed almost equal to zero. The mechanical
properties of the interface elements are summarized in Table 6-7.
Figure 6-16: Case PB4. Traction-displacement diagram in normal direction for
interfaces
sn (N/mm2 )
un (mm)103
2.60x101
-103
2.60x10⁷
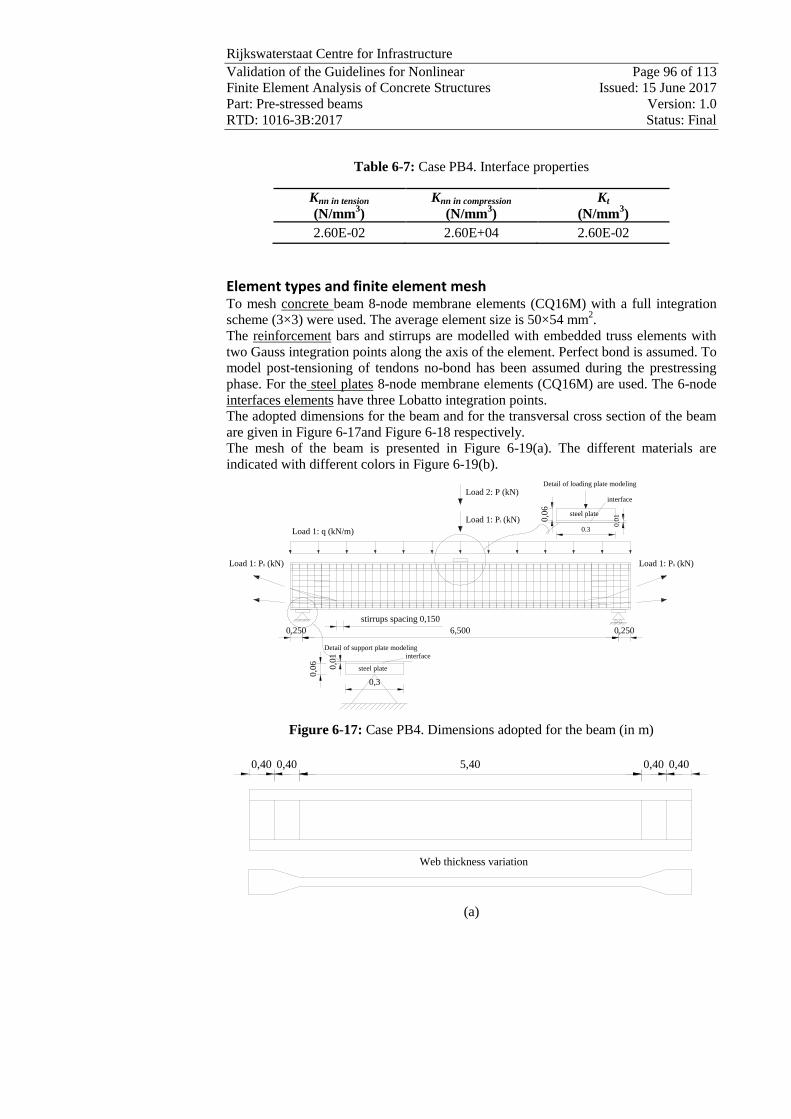
Rijkswaterstaat Centre for Infrastructure
Validation of the Guidelines for Nonlinear Page 96 of 113
Finite Element Analysis of Concrete Structures Issued: 15 June 2017
Part: Pre-stressed beams Version: 1.0
RTD: 1016-3B:2017 Status: Final
Table 6-7: Case PB4. Interface properties
Knn in tension
(N/mm3)
Knn in compression
(N/mm3)
Kt
(N/mm3)
2.60E-02 2.60E+04 2.60E-02
Element types and finite element mesh To mesh concrete beam 8-node membrane elements (CQ16M) with a full integration
scheme (3×3) were used. The average element size is 50×54 mm2.
The reinforcement bars and stirrups are modelled with embedded truss elements with
two Gauss integration points along the axis of the element. Perfect bond is assumed. To
model post-tensioning of tendons no-bond has been assumed during the prestressing
phase. For the steel plates 8-node membrane elements (CQ16M) are used. The 6-node
interfaces elements have three Lobatto integration points.
The adopted dimensions for the beam and for the transversal cross section of the beam
are given in Figure 6-17and Figure 6-18 respectively.
The mesh of the beam is presented in Figure 6-19(a). The different materials are
indicated with different colors in Figure 6-19(b).
Figure 6-17: Case PB4. Dimensions adopted for the beam (in m)
(a)
Load 1: q (kN/m)
Load 1: P1 (kN)
Load 2: P (kN)
Load 1: P0 (kN) Load 1: P0 (kN)
steel plate
interface
steel plate
interface
Detail of support plate modeling
Detail of loading plate modeling
6,500 0,2500,250
0,0
6
0,3
0,0
1
stirrups spacing 0,150
0.3
0,0
6
0,0
1
Web thickness variation
0,40 0,40 0,400,405,40

Rijkswaterstaat Centre for Infrastructure
Validation of the Guidelines for Nonlinear Page 97 of 113
Finite Element Analysis of Concrete Structures Issued: 15 June 2017
Part: Pre-stressed beams Version: 1.0
RTD: 1016-3B:2017 Status: Final
(b)
Figure 6-18: Case PB4. (a) Web thickness variation along length of the beam (in m)
(b) Dimensions adopted for the transversal cross section of the beam (in m)
The web thickness variation along the length of the beam was modeled as shown in
Figure 6-19(a). The groups name used to model the web thickness variation, starting
from the end to the middle of the beam are: WEB_RING, WEB_VA, WEB_VB,
WEB_VC, WEB_VD, WEB_VE, WEB_VF, WEB_VG, WEB_VH, WEB_VI,
WEB_VL, WEB_VM, WEB_VN. The different materials are indicated with different
colors in Figure 6-19(b).
(a)
(b)
Figure 6-19: Case PB4. (a) Mesh and modeling of web thickness variation, (b)
material sets
Different groups of elements were generated to distinguish these concrete and steel
elements that can undergo crushing and yielding.In this manner, these groups of
elements can be monitored during the analysis in order to recognize the failure mode.
For the ease of monitoring yielding of reinforcing steel, groups “REBTOPF14”,
“REBWEBF8”, “REBBOTTF8”, “STIRRLEFTF12”, “STIRRRIGHTF10”,
“STRANDS” were created. The groups are indicated in Figure 6-20(a).
12 left half
10 right half
8
14
8
14
12 left half
10 right half
0,7
95
End section Midspan section
0,400
1,050
0,9
70
0,1
50
0,6
45
0,1
75
0,1
40
1,050
0,400
0,1
75
0,9
70
0,4
20
0,1
85
X
Y
Z
Model: PB4
01 JUN 2010 16:43:35 meshiDIANA 9.3-01 : TU Delft
WE
B_
RIN
G
WE
B_
VA
WE
B_
VB
WE
B_
VC
WE
B_
VD
WE
B_
VE
WE
B_
VF
WE
B_
VG
WE
B_
VH

Rijkswaterstaat Centre for Infrastructure
Validation of the Guidelines for Nonlinear Page 98 of 113
Finite Element Analysis of Concrete Structures Issued: 15 June 2017
Part: Pre-stressed beams Version: 1.0
RTD: 1016-3B:2017 Status: Final
Figure 6-20(b) shows the groups of elements named SHEAR, used for tracking the
inelastic behavior of concrete in compression. The group of element named SHEAR
has the length equal to the space between the end of the loading plate and the end of
the support plate and a depth equal to the space between upper and lower
reinforcement.
(a)
(b)
Figure 6-20: Case PB4. Groups of steel elements monitoring (a) yielding of
reinforcement, (b) inelastic behavior of concrete
Boundary conditions and loading Boundary conditions were applied to nodes of steel plate. Translation along x and y
axes at a single node of the left steel plate (support 1) and translation along y axis at a
single node of the right steel plate (support 2) were constrained, Figure 6-21.
In Load case 1, the beam was subjected to the dead load q(1), pre-stress [P0(1)] and a
concentrated load P [P1(1)=588kN] counteracting the effect of the post-tensioning
applied to the middle node of the loading plate.
In Load case 2, a concentrated load P [P(2)] applied at the middle node of the loading
plate as a unit load of 3×10³ N was added to load case 1, Figure 6-21.
Figure 6-21: Case PB4. Boundary conditions and load cases
Load increments and convergence criteria Load case 1 was applied in 1 step. The regular Newton-Raphson method was used.
Load case 2 was applied with automatic adaptive load increments based on energy. The
initial load factor was 5, the upper limit of the incremental load factor equaled 10 and
the lower limit of the incremental load factor was 2. The maximum number of steps
was 180. Arc-length control was applied based on translation along y axis of node 4529
(“indirect displacement control”), Figure 6-22. The analysis was set continue even if
the convergence criteria were not satisfied. The convergence tolerance was equal to
STIRRLEFTF12
STIRRRIGHTF10
STRANDS
REBBOTTF8
REBWEBF8
REBTOPF14
Shear

Rijkswaterstaat Centre for Infrastructure
Validation of the Guidelines for Nonlinear Page 99 of 113
Finite Element Analysis of Concrete Structures Issued: 15 June 2017
Part: Pre-stressed beams Version: 1.0
RTD: 1016-3B:2017 Status: Final
1×10⁻³
and 1×10⁻²
for energy and force respectively. A maximum of 70 iterations was
used. To improve the convergence performance, a line search algorithm was applied.
Figure 6-22: Case PB4. `Indirect Displacement control' technique applied referring to
node 4529
6.4 Nonlinear finite element analysis
Load deflection The load-deflection curve is presented in Figure 6-23. The applied load values
corresponding to the beginning of yielding of stirrups placed at the right side, yielding
of bars and crushing of concrete are highlighted with markers. The onset of crushing of
concrete occurred when the first integration point reaches the minimum principal strain
value equal to -3.5‰.
For load case 2 the peak load was defined in correspondence of the highest load step
where the energy norm ratio satisfied the fixed tolerance of 1×10⁻³
. The convergence
behavior was quite poor after reaching the peak load. After step 137, the analysis
continued even if the energy convergence criteria were not satisfied within the
maximum number of iterations equal to 50. The post peak branch of the load-deflection
curve was for this reason plotted with a dot line.
Figure 6-23: Case PB4. Load-deflection curve
Convergence behavior For the majority of steps the convergence was achieved on the basis of both energy and
force criteria, Figure 6-24- Figure 6-25. For load case 2, the energy norm ratio satisfied
the fixed tolerance of 1×10⁻³
for most of the steps of the analysis prior to the peak load,
X
Y
Z
Model: PB4
01 JUN 2010 16:43:35 meshiDIANA 9.3-01 : TU Delft
node 4529

Rijkswaterstaat Centre for Infrastructure
Validation of the Guidelines for Nonlinear Page 100 of 113
Finite Element Analysis of Concrete Structures Issued: 15 June 2017
Part: Pre-stressed beams Version: 1.0
RTD: 1016-3B:2017 Status: Final
while force norm ratio was higher than the fixed tolerance for some steps. In the
figures, the peak load positions are indicated in the graph with the red marker.
(a)
(b)
Figure 6-24: Case PB4. (a) Evolution of the energy norm (blue lines indicate steps, red
line indicates tolerance, green points indicate iterative results), (b) enlargement of the
iterations prior to the peak load

Rijkswaterstaat Centre for Infrastructure
Validation of the Guidelines for Nonlinear Page 101 of 113
Finite Element Analysis of Concrete Structures Issued: 15 June 2017
Part: Pre-stressed beams Version: 1.0
RTD: 1016-3B:2017 Status: Final
(a)
(b)
Figure 6-25: Case PB4. (a) Evolution of the force norm (blue lines indicate steps, red
line indicates tolerance, green points indicate iterative results), (b) enlargement of the
iterations prior to the peak load
Strains Figure 6-26 shows the crack strain values at the peak load at step 104.
The first crack strain plotted value, equal to 0.00083, corresponds to the ultimate crack
strain value calculated as ctmeq
f
utfh
G
,e (in this case hheq 2 ). The third crack strain
value, equal to 0.0038, is the crack strain value corresponding to 1% of fctm. The
intermediate crack strain value was added in the contour plot.
Figure 6-27 and Figure 6-28 show the minimum principal strain values at step 79 – at
point of crushing of concrete and at step 104, where crushing of concrete is more
advanced hence more visible.

Rijkswaterstaat Centre for Infrastructure
Validation of the Guidelines for Nonlinear Page 102 of 113
Finite Element Analysis of Concrete Structures Issued: 15 June 2017
Part: Pre-stressed beams Version: 1.0
RTD: 1016-3B:2017 Status: Final
The first minimum principal strain value plotted in Figure 6-27, equal to -0.0003,
corresponds to the elastic principal strain valuec
cmelc
E
f
3,e . The second minimum
principal strain value depicted in Figure 6-27, equal to -0.0015, is the peak strain value
pc,e . The lowest negative value of the principal strain -0.040 is the crushing strain
calculated withcm
cpcuc
hf
G
2
3,, ee . The two intermediate values were added between
pc,e and uc,e .
Figure 6-26: Case PB4. Crack strain values at step 104 (peak load)
Figure 6-27: Case PB4. Minimum principal strain values at step 79
(crushing of concrete)
0
0.5
1
1.5
2
2.5
0.000 0.001 0.002 0.003 0.004 0.005
s(N
/mm
2)
e (-)
0
0.5
1
1.5
2
2.5
0.0000 0.0010 0.0020 0.0030 0.0040 0.0050 0.0060
-30
-25
-20
-15
-10
-5
0
-0.05 -0.03 -0.01
s(N
/mm
2)
e (-)
0
0.5
1
1.5
2
2.5
0.0000 0.0010 0.0020 0.0030 0.0040 0.0050 0.0060

Rijkswaterstaat Centre for Infrastructure
Validation of the Guidelines for Nonlinear Page 103 of 113
Finite Element Analysis of Concrete Structures Issued: 15 June 2017
Part: Pre-stressed beams Version: 1.0
RTD: 1016-3B:2017 Status: Final
Figure 6-28: Case PB4. Minimum principal strain values at step 104 (peak
load)
Figure 6-29: Case PB4. Experimental crack pattern at failure (load kNP 12.1491 )
Yielding strain for stirrups 10 is equal to 31012202431 .GPaMPa . Stirrups start to
yield at a load equal to 1323.60 kN (step 77). Figure 6-30 shows yielding of stirrups a
few steps after the yielding point (at step 80).
Figure 6-30: Case PB4. Yielding of stirrups 10 at step 80
Yielding strain for the bottom longitudinal reinforcement 8 is equal to 310332197460 .GPaMPa . The bars start to yield at the load equal to 1482.60 kN
(step 96).
-30
-25
-20
-15
-10
-5
0
-0.05 -0.03 -0.01
s(N
/mm
2)
e (-)
0
0.5
1
1.5
2
2.5
0.0000 0.0010 0.0020 0.0030 0.0040 0.0050 0.0060
-600
-400
-200
0
200
400
600
-0.02 -0.01 0 0.01 0.02s(N
/mm
2)
e (-)
0
0.5
1
1.5
2
2.5
0.0000 0.0010 0.0020 0.0030 0.0040 0.0050 0.0060

Rijkswaterstaat Centre for Infrastructure
Validation of the Guidelines for Nonlinear Page 104 of 113
Finite Element Analysis of Concrete Structures Issued: 15 June 2017
Part: Pre-stressed beams Version: 1.0
RTD: 1016-3B:2017 Status: Final
Figure 6-31 shows yielding of the bars several steps after the yielding point (at step
104).
Figure 6-31: Case PB4. Yielding of bottom bars 8 at step 104
Yielding strain for top longitudinal reinforcement 14 is equal to 31091207397 .GPaMPa . The bars start to yield at the load equal to 1521.60 kN
(step 101). Figure 6-32 shows the progression of yielding of the 14 bars a number of
steps after the yielding point (at step 104).
Figure 6-32: Case PB4. Yielding of top bars 14 at step 104
The contour plot of the crack strain values can be interpreted as a crack pattern. Based
on this it can be said that the crack pattern is extensive with most of the crack being
inclined –thus shear, stress free (open) cracks. At the same time, from the contour plot
of the negative principal strains it can be observed that compressive struts undergo
crushing. On the other hand, yielding of stirrups as well as bending reinforcement
occurred only locally and its effect is significantly less far-reaching. From the above
consideration, it is concluded that the beam failed in shear due to crushing of concrete
compressive struts.
Gauss point statistics In Table 6-8 the number of cracking points, crushing points and yield points are
reported at step 77 (yielding of right side stirrups), at step 79 (crushing of concrete), at
-600
-400
-200
0
200
400
600
-0.02 -0.01 0 0.01 0.02s(N
/mm
2)
e (-)
0
0.5
1
1.5
2
2.5
0.0000 0.0010 0.0020 0.0030 0.0040 0.0050 0.0060
-600
-400
-200
0
200
400
600
-0.02 -0.01 0 0.01 0.02s(N
/mm
2)
e (-)
0
0.5
1
1.5
2
2.5
0.0000 0.0010 0.0020 0.0030 0.0040 0.0050 0.0060

Rijkswaterstaat Centre for Infrastructure
Validation of the Guidelines for Nonlinear Page 105 of 113
Finite Element Analysis of Concrete Structures Issued: 15 June 2017
Part: Pre-stressed beams Version: 1.0
RTD: 1016-3B:2017 Status: Final
step 96 (yielding of bottom bars 8), at step 101 (yielding of top bars 14) and at step
104 (peak load).
Table 6-8: Case PB4. Number of cracking points, crushing points and yield points
STEP 77 ITERATIONS 2
GROUP NAME PLAST PRV.
PL CRITIC
PLAST
NEW
PRV.PL
NEW
CRITIC
NEW
FL_SUP 65 0 0 2 0 0
FL_INF 3 0 0 0 0 0
WEB 935 16 0 56 4 0
SHEAR 1362 31 0 74 7 0
STIRRRIGHTF10 3 0 0 3 0 0
TOTAL MODEL 2368 47 0 135 11 0
CRACKING LOGGING SUMMARY
GROUP NAME CRACK OPEN CLOSED ACTIVE INACTI ARISES
WEB_VB 1 1 0 1 0 0
WEB_VC 12 12 0 11 1 0
WEB_VD 23 23 0 21 2 1
WEB_VE 44 44 0 37 7 2
WEB_VF 70 70 0 47 23 2
WEB_VG 81 81 0 46 35 0
WEB_VH 129 129 0 90 39 0
FL_SUP 109 109 0 74 35 3
FL_INF 1365 1365 0 1157 208 19
WEB 5051 5049 2 4239 812 20
SHEAR 4956 4952 4 4073 883 14
TOTAL MODEL 11841 11835 6 9796 2045 61
STEP 79 ITERATIONS 3
GROUP NAME PLAST PRV.
PL CRITIC
PLAST
NEW
PRV.PL
NEW
CRITIC
NEW
FL_SUP 71 0 0 5 0 0
FL_INF 3 0 0 0 0 0
WEB 1003 39 0 55 22 0
SHEAR 1442 74 0 73 36 0
STIRRRIGHTF10 8 0 0 4 0 0
TOTAL MODEL 2527 113 0 137 58 0
CRACKING LOGGING SUMMARY
GROUP NAME CRACK OPEN CLOSED ACTIVE INACTI ARISES
WEB_VB 3 3 0 3 0 2
WEB_VC 13 13 0 12 1 1
WEB_VD 23 23 0 19 4 0
WEB_VE 48 48 0 42 6 2
WEB_VF 72 72 0 47 25 0
WEB_VG 81 81 0 44 37 0
WEB_VH 136 136 0 92 44 1
FL_SUP 126 126 0 92 34 6
FL_INF 1407 1407 0 1172 235 24
WEB 5093 5091 2 4155 938 22
SHEAR 4987 4983 4 4002 985 18
TOTAL MODEL 11989 11983 6 9680 2309 76
STEP 96 ITERATIONS 1
GROUP NAME PLAST PRV.
PL CRITIC
PLAST
NEW
PRV.PL
NEW
CRITIC
NEW

Rijkswaterstaat Centre for Infrastructure
Validation of the Guidelines for Nonlinear Page 106 of 113
Finite Element Analysis of Concrete Structures Issued: 15 June 2017
Part: Pre-stressed beams Version: 1.0
RTD: 1016-3B:2017 Status: Final
WEB_VH 1 0 0 0 0 0
FL_SUP 139 0 0 3 0 0
FL_INF 16 0 0 2 0 0
WEB 1941 80 0 88 0 0
SHEAR 2572 126 0 105 7 0
STIRRRIGHTF10 141 0 0 9 0 0
REBBOTTF8 1 0 0 1 0 0
TOTAL MODEL 4811 206 0 208 7 0
CRACKING LOGGING SUMMARY
GROUP NAME CRACK OPEN CLOSED ACTIVE INACTI ARISES
WEB_VA 5 5 0 5 0 1
WEB_VB 13 13 0 13 0 0
WEB_VC 33 33 0 27 6 1
WEB_VD 45 45 0 37 8 0
WEB_VE 84 84 0 75 9 1
WEB_VF 96 96 0 74 22 0
WEB_VG 91 91 0 68 23 0
WEB_VH 164 164 0 148 16 2
FL_SUP 219 219 0 184 35 11
FL_INF 1718 1718 0 1554 164 18
WEB 5309 5307 2 4174 1135 5
SHEAR 5195 5191 4 4123 1072 7
TOTAL MODEL 12972 12966 6 10482 2490 46
STEP 101 ITERATIONS 1
GROUP NAME PLAST PRV.
PL CRITIC
PLAST
NEW
PRV.PL
NEW
CRITIC
NEW
WEB_VH 4 0 0 3 0 0
FL_SUP 160 0 0 5 0 0
FL_INF 24 0 0 2 0 0
WEB 2256 51 0 64 5 0
SHEAR 2974 100 0 77 10 0
STIRRRIGHTF10 205 0 0 12 0 0
REBTOPF14 1 0 0 1 0 0
REBBOTTF8 5 0 0 2 0 0
TOTAL MODEL 5629 151 0 166 15 0
CRACKING LOGGING SUMMARY
GROUP NAME CRACK OPEN CLOSED ACTIVE INACTI ARISES
WEB_VA 8 8 0 8 0 1
WEB_VB 18 18 0 17 1 2
WEB_VC 44 44 0 35 9 1
WEB_VD 55 55 0 44 11 1
WEB_VE 91 91 0 79 12 3
WEB_VF 98 98 0 76 22 1
WEB_VG 96 96 0 74 22 1
WEB_VH 168 168 0 155 13 0
FL_SUP 255 255 0 210 45 9
FL_INF 1799 1799 0 1676 123 14
WEB 5348 5346 2 4323 1025 7
SHEAR 5231 5228 3 4373 858 9
TOTAL MODEL 13211 13206 5 11070 2141 49
STEP 104 ITERATIONS 1
GROUP NAME PLAST PRV.
PL CRITIC
PLAST
NEW
PRV.PL
NEW
CRITIC
NEW
WEB_VH 9 0 0 2 0 0

Rijkswaterstaat Centre for Infrastructure
Validation of the Guidelines for Nonlinear Page 107 of 113
Finite Element Analysis of Concrete Structures Issued: 15 June 2017
Part: Pre-stressed beams Version: 1.0
RTD: 1016-3B:2017 Status: Final
FL_SUP 143 19 0 63 0 0
FL_INF 33 0 0 2 0 0
WEB 2127 319 0 268 0 0
SHEAR 2651 641 0 365 0 0
STIRRRIGHTF10 220 10 0 15 0 0
REBTOPF14 4 0 0 0 0 0
REBBOTTF8 10 1 0 4 0 0
TOTAL MODEL 5197 990 0 719 0 0
CRACKING LOGGING SUMMARY
GROUP NAME CRACK OPEN CLOSED ACTIVE INACTI ARISES
WEB_VA 10 10 0 8 2 0
WEB_VB 21 21 0 19 2 0
WEB_VC 53 53 0 39 14 1
WEB_VD 56 56 0 44 12 0
WEB_VE 100 100 0 89 11 3
WEB_VF 107 107 0 86 21 2
WEB_VG 99 99 0 78 21 1
WEB_VH 170 170 0 154 16 0
WEB_RINGR 1 1 0 1 0 1
FL_SUP 293 293 0 214 79 7
FL_INF 1836 1836 0 1479 357 17
WEB 5369 5367 2 3353 2016 2
SHEAR 5275 5272 3 3888 1387 3
TOTAL MODEL 13390 13385 5 9452 3938 37
6.5 Application of safety format
As proposed by the Model Code 2010 (fib, 2013) safety formats for nonlinear analyses
include three numerical methods denoted as GRF (Global Resistance Factor method),
PF (Partial Factor method) and ECOV (Method of Estimation of a Coefficient of
Variation of resistance). In Table 6-9 to Table 6-14 the mechanical properties of
concrete and steel applied in the nonlinear analyses are summarized.
Table 6-9: Case PB4. Constitutive model parameters for concrete
fc fct Ec
GF GC
(N/mm2) (N/mm
2) (N/mm
2) (Nmm/mm
2) (Nmm/mm
2)
Mean measured 24.02 2.12 25977 var 0.129 22.839
Characteristic 16.02 1.48 24765 var 0.120 21.233
Mean GRF 13.62 1.71 23586 var 0.117 20.621
Design 10.68 0.99 21928 var 0.111 19.739
Table 6-10: Case PB4. Constitutive model parameters for reinforcing bars (8)
As fy ft Es εsy
(mm) (mm2) (N/mm
2) (N/mm
2) (N/mm
2) (-)
Mean measured 8 49 460.00 567.00 197000 0.0023
Characteristic 8 49 416.64 513.56 197000 0.0021
Mean GRF 8 49 458.31 564.91 197000 0.0023
Design 8 49 362.30 446.57 197000 0.0018

Rijkswaterstaat Centre for Infrastructure
Validation of the Guidelines for Nonlinear Page 108 of 113
Finite Element Analysis of Concrete Structures Issued: 15 June 2017
Part: Pre-stressed beams Version: 1.0
RTD: 1016-3B:2017 Status: Final
Table 6-11: Case PB4. Constitutive model parameters for reinforcing bars (10)
As fy ft Es εsy
(mm) (mm2) (N/mm
2) (N/mm
2) (N/mm
2) (-)
Mean measured 10 79 431.00 556.00 201000 0.0021
Characteristic 10 79 390.38 503.59 201000 0.0019
Mean GRF 10 79 429.41 553.95 201000 0.0021
Design 10 79 339.46 437.91 201000 0.0017
Table 6-12: Case PB4. Constitutive model parameters for reinforcing bars (12)
As fy ft Es εsy
(mm) (mm2) (N/mm
2) (N/mm
2) (N/mm
2) (-)
Mean measured 12 109 489.00 637.00 202000 0.0024
Characteristic 12 109 442.91 576.96 202000 0.0022
Mean GRF 12 109 487.20 634.65 202000 0.0024
Design 12 109 385.14 501.70 202000 0.0019
Table 6-13: Case PB4. Constitutive model parameters for reinforcing bars (14)
As fy ft Es εsy
(mm) (mm2) (N/mm
2) (N/mm
2) (N/mm
2) (-)
Mean measured 14 152 397.00 517.00 207000 0.0019
Characteristic 14 152 359.58 468.27 207000 0.0017
Mean GRF 14 152 395.54 515.10 207000 0.0019
Design 14 152 312.68 407.19 207000 0.0015
Table 6-14: Case PB4. Constitutive model parameters for reinforcing bars (strands)
As fy ft Es εsy
(mm) (mm2) (N/mm
2) (N/mm
2) (N/mm
2) (-)
Mean measured 12.2 12x117 1225.00 1363.00 207000 0.0059
Characteristic 12.2 12x117 1109.53 1234.53 207000 0.0054
Mean GRF 12.2 12x117 1220.49 1357.98 207000 0.0059
Design 12.2 12x117 964.81 1073.50 207000 0.0047
In Figure 6-33 the load-deflection curves obtained with mean measured, characteristic,
mean GRF and design values of material strengths are shown. The analysis carried out
with the design values of material strength interrupted after the application of the first
load step which is the dead load, the prestressing force and the vertical force equal to
588 kN. The maximum load reached using the design values of material strength was
then considered equal to 588 kN.

Rijkswaterstaat Centre for Infrastructure
Validation of the Guidelines for Nonlinear Page 109 of 113
Finite Element Analysis of Concrete Structures Issued: 15 June 2017
Part: Pre-stressed beams Version: 1.0
RTD: 1016-3B:2017 Status: Final
Figure 6-33: Case PB4. Load-deflection curves obtained with mean measured,
characteristic, mean GRF and design mechanical properties
PB4 beam is analyzed with analytical and numerical approaches. Figure 6-34 shows
the comparison of the analytical and numerical design values of beam resistance PRd
expressed in terms of a percentage of the experimental ultimate value of applied load.
The analysis named “no safety format” refers to the NLFE analysis carried out using
mean measured values of material strengths without applying any safety coefficient.
Figure 6-34: Case PB4. Analytical and numerical design values of beam resistance
expressed in terms of a percentage of the experimental ultimate value of applied load,
kNPExp 12.1491

Rijkswaterstaat Centre for Infrastructure
Validation of the Guidelines for Nonlinear Page 110 of 113
Finite Element Analysis of Concrete Structures Issued: 15 June 2017
Part: Pre-stressed beams Version: 1.0
RTD: 1016-3B:2017 Status: Final
From Figure 6-34 it can be noted that due to the low value of concrete compressive
strength the design values of beam resistance is significantly influenced by the safety
coefficients.
In Table 6-15 the design values of beam resistance obtained from numerical and
analytical procedures expressed in terms of applied load PRd, are listed.
Table 6-15: Case PB4. Beam resistance PRd in kN
PExp EC2 Level I
MC2010
Level II
MC2010
Level III
MC2010 GRF PF ECOV
No safety
formats
1491.12 625.98 - 548.58 548.58 809.43 588.60 874.19 1527.60
6.6 Parametric study on crack models
A parametric study was carried out by varying some sensitive parameters of the
concrete constitutive model, such as the crack model, and the fracture energy of
concrete in tension.
In Table 6-16 the material parameters applied in NLFE analyses performed for the
parametric study are reported. Analyses 1 to 3 refer to the three analyses carried out by
varying the aforementioned material parameters. In all analyses mean measured values
of material strength were considered. Parabolic law in compression and exponential
law in tension were used for concrete, while an elasto-plastic with hardening law was
adopted for steel. A variable Poisson’s ratio was adopted for all analyses. The analyses
were carried out in load-control with arc-length control.
For all analyses the limit value of the reduction of the compressive strength of concrete
due to lateral cracking was determined according to (Vecchio et al., 1986) as follows:
6.0,
min, cm
redc
f
fs
The effects of the applied value of the fracture energy of concrete in tension on the
beam response was investigated by means of comparison of the formulation of Model
Code 1990 (CEB-FIB, 1993) and Model Code 2010 (fib, 2013). The two values used
are respectively equal to mmNG MCF 062.01990, and mmNG MCF 129.02010, .The
fracture energy of concrete in compression was considered for all analyses equal to
250GF (Nakamura et al. 2001).
In the fixed crack model, a variable shear retention factor dependent on the mean
aggregate size daggr, the crack normal strain en and the crack bandwidth value h follows
from:
hd
n
aggr
e
21
In Figure 6-35 the load-deflection curves obtained from the parametric study are
plotted. The peak load of each analysis, which is defined as the highest load step for
which the energy norm ratio satisfied the fixed tolerance of 1×10⁻³
, is marked with a
circular indicator. The peak load values are given explicitly in Table 6-16.
Table 6-16: Case PB4. Parametric study on crack models
Analysis Total strain
crack model GF GC
Peak load value
(kN)
Analysis 1 rotating MC2010 250 GF 1527.60
Analysis 2 rotating MC1990 250 GF 1464.60
Analysis 3 fixed (=variable) MC2010 250 GF 1662.60

Rijkswaterstaat Centre for Infrastructure
Validation of the Guidelines for Nonlinear Page 111 of 113
Finite Element Analysis of Concrete Structures Issued: 15 June 2017
Part: Pre-stressed beams Version: 1.0
RTD: 1016-3B:2017 Status: Final
Figure 6-35: Case PB4. Parametric study
Comparing analysis 1 with analysis 2, the influence of the adopted values of the
fracture energy of concrete in tension (GF,MC1990=0.062N/mm; GFM,C2010=0.129N/mm)
and the corresponding values of the fracture energy of concrete in compression
(GC,MC1990=15.58N/mm; GC,MC2010=32.34N/mm) is visible. Since the beam fails in shear
with crushing of concrete, both the fracture energy of concrete in tension and in
compression play an important role on the load-deflection response.
From the comparison of analyses 1 and 3, it can be recognized that for PB4 the adopted
crack model (total strain rotating and fixed crack model) has a big influence on the
beam response, both in terms of the peak load and peak deformation. The peak load
and peak deformation are significantly overestimated if a fixed crack model with the
aggregate size based shear retention factor is applied. Furthermore, the crack pattern
and the failure mode obtained from NLFEA bears a better resemblance to the
experimental crack pattern when the rotating crack model is adopted.
6.7 Concluding remarks
The simply support prestressed beam PB4 subjected to three point bending exhibited a
shear-compressive failure mechanism at a load equal to P=1491.12kN.
The beam was modeled with 8-node membrane elements for the concrete and
embedded truss elements for the reinforcement. Perfect bond is assumed. The concrete
model is based on a total strain rotating crack model with exponential tension softening
in tension and parabolic behavior in compression, variable Poisson’s ratio of concrete
and reduction of compressive strength of concrete due to lateral cracking with a lower
limit value equal to 0.6. The model for the reinforcement bars and stirrups is based on
hardening plasticity.
A shear-compressive failure mechanism was achieved from NLFEA carried out with
mean measured values of material strengths. The peak value of applied load obtained
from NLFEA is equal to 1527.60 kN and the failure mode is characterized by crushing
of concrete at the junction of web and upper flange, yielding of right side stirrups and
yielding of bottom bars.
Safety formats for nonlinear finite element analyses as proposed by the Model Code
2010 (fib, 2013) were applied to obtain the design value of beam resistance expressed
in terms of applied load. The design values of beam resistance obtained with the

Rijkswaterstaat Centre for Infrastructure
Validation of the Guidelines for Nonlinear Page 112 of 113
Finite Element Analysis of Concrete Structures Issued: 15 June 2017
Part: Pre-stressed beams Version: 1.0
RTD: 1016-3B:2017 Status: Final
application of safety formats were higher than the design resistance calculated with the
analytical methods for sectional analysis.
To investigate an influence of different input parameters such as fracture energy of
concrete in tension, the corresponding fracture energy of concrete in compression and
shear behaviour through implementation of fixed crack model, a sensitivity study was
performed. From the registered results, it was recognized that because the failure was
caused by crushing of compressive struts, the response of the beam is highly influenced
by these parameters. Another very influential parameter is the concrete compressive
strength. It could be well observed from the results of the analyses with safety formats.
The design values of the beam resistance are significantly lower than from the model
with mean measured material properties. Moreover, the design beam resistance
obtained with the Partial Factor method is comparable to the design value of beam
resistance obtained with analytical calculations.
Based on the results, it can be concluded that consistent and reliable results can be
obtained by adopting variable Poisson’s ratio, reduction of the compressive strength
due to lateral cracking with a low limit of 0.6, total strain rotating crack model and
fracture energy of concrete in tension according to Model Code 2010. An energy norm
with a tolerance of 10-3
is recommended.

Rijkswaterstaat Centre for Infrastructure
Validation of the Guidelines for Nonlinear Page 113 of 113
Finite Element Analysis of Concrete Structures Issued: 15 June 2017
Part: Pre-stressed beams Version: 1.0
RTD: 1016-3B:2017 Status: Final
References
CEB-FIP Model Code 1990. (1993), Bullettin d’Information n° 213/214. Thomas
Telford.
CEN (2005), Eurocode 2 - Design of concrete structures - Part 1-1: General rules and
rules for buildings, EN 1992-1-1, Brussels: CEN.
fib (2013), fib Model Code for Concrete Structures 2010, Ernst & Sohn.
Leonhardt, F., Koch R. & Rostacy, F.S. (1973), "Schubversuche an
Spannbetonträgern", Heft 227, Berlin: Deutscher Ausschuss für Stahlbeton.
Nakamura, H. & Higai T. (2001), "Compressive Fracture Energy and Fracture Zone
Length of Concrete" in "Modeling of Inelastic Behavior of RC Structures under
Seismic Loads", Benson P. Shing (editor), ASCE J. Str. Eng., 471-487, Benson P.
Shing.
Oliver, J. (1989), "A consistent characteristic length for smeared cracking models",
International Journal for numerical Methods in Engineering, 28, 461- 474
Runzell B., Shield C., French C., (2007). “Shear capacity of prestressed beams”,
Minnesota Department of transportation Research Services Section.
Selby R.G., Vecchio F.J. (1993). “Three-dimensional Constitutive Relations for
Reinforced Concrete”, Tech. Rep. 93-02, Univ. Toronto, dept. Civil Eng., Toronto,
Canada.
Sun S., Kuchma D. A. (2007), “Shear behavior and capacity of large- scale prestressed
high- strength concrete bulb- tee girders”, Department of Civil and Environment
Engineering University of Illinois at Urbana- Champaign, Report No. NSEL-002,
November.
Vecchio F. J. & Collins M. P. (1986), "The modified compression-field theory for
reinforced concrete elements subjected to shear", ACI Journal 83, 219-231
Vervuurt, A.H.J.M. & Leegwater, G.A. (2008), “Workshop on the assessment of the
shear strength of concrete structures”, TNO report 2008-D-R0010.