Embed Size (px)
Citation preview

NONLINEAR FINITE ELEMENT ANALYSIS OF CONCRETE COLUMNS
CONFINED BY FIBRE- REINFORCED POLYMERS
SABREENA NASRIN
STUDENT NO: 1009042348
MASTER OF SCIENCE IN CIVIL ENGINEERING (STRUCTURAL)
DEPARTMENT OF CIVIL ENGINEERING
BANGLADESH UNIVERSITY OF ENGINEERING AND TECHNOLOGY
DHAKA-1000, BANGLADESH
JULY, 2013

NONLINEAR FINITE ELEMENT ANALYSIS OF CONCRETE COLUMNS
CONFINED BY FIBRE- REINFORCED POLYMERS
SUBMITTED BY
SABREENA NASRIN
STUDENT NO: 1009042348
A Thesis submitted in Partial Fulfillment of the Requirements for the Degree of Master of Science in Civil Engineering (Structural)
DEPARTMENT OF CIVIL ENGINEERING
BANGLADESH UNIVERSITY OF ENGINEERING AND TECHNOLOGY
DHAKA-1000, BANGLADESH
JULY, 2013

DEDICATED
TO
My Beloved Parents
Late Dr. Nazrul Islam Miah
Mrs. Meherunnesa Khan
Engr. Humayun Kabir
&
Mrs. Nurunnahar Begum
CERTIFICATE OF APPROVAL

The thesis titled “Nonlinear Finite Element Analysis of Concrete Columns Confined by Fibre-Reinforced Polymers” submitted by Sabreena Nasrin, Student Number 1009042348F, Session: October, 2009 has been accepted as satisfactory in partial fulfillment of the requirement for the degree of Master of Science in Civil Engineering (Structural) on 29th July, 2013.
BOARD OF EXAMINERS
1. Dr. Mahbuba Begum Chairman Associate Professor (Supervisor) Department of Civil Engineering BUET, Dhaka-1000
2. Dr. Md. Mujibur Rahman Member Professor and Head (Ex-Officio) Department of Civil Engineering BUET, Dhaka-1000
3. Dr. Sk. Sekender Ali Member Professor Department of Civil Engineering BUET, Dhaka-1000
4. Dr. A. M. M. Taufiqul Anwar Member Professor Department of Civil Engineering BUET, Dhaka-1000
5. Dr. Md. Mozammel Hoque Member Associate Professor (External) Department of Civil Engineering
DUET, Gazipur

1
CHAPTER 1
INTRODUCTION 1.1 General
In recent years, considerable attention has been focused on the use of fibre-reinforced
polymer (FRP) composite materials for structural rehabilitation and strengthening purpose.
Highly aggressive environmental conditions have a significant effect on the durability and
structural integrity of steel reinforced concrete piles, piers and columns. Corrosion of steel
rods is a potential cause for the structural damage of these reinforced concrete columns.
Dealing with the problem of steel reinforcement corrosion has usually meant improving the
quality of the concrete itself, but this approach has had only limited success. A traditional
way of repair of damaged concrete columns is wrapping a sheet of steel around the column.
While the strength of repaired columns can be increased for a short-term, the steel wrapping
suffers from the same problem as the steel rebar, corrosion and poor durability. It also suffers
from labor-intensive construction problem due to its weight.
In a new approach, FRPs are now being used as alternatives for steel wrappings in repair,
rehabilitation and strengthening of reinforced concrete columns. If correctly applied, the use
of FRP composites for strengthening reinforced concrete (RC) structures can result in
significant enhancements to durability, and decreased maintenance costs, as well as in
improved serviceability, ultimate strength, and ductility. Moreover, the FRP composites can
generally be applied while the structure is in use, with negligible changes in the member
dimensions. Other advantages include high strength and stiffness-to-weight ratios, a high
degree of chemical inertness, controllable thermal expansion, damping characteristics, and
electromagnetic neutrality. In addition to repair, FRP confined concrete columns have been
developed in new construction and rebuilding of concrete piers/piles in engineering
structures.
Extensive experimental studies have been conducted by several research groups on the
behavior of confined concrete columns (Benmokrane and Rahman, 1998; Saadatmanesh and
Ehsani, 1998; Meir and Betti 1997; El-Badry 1996). However, most of these studies are
confined to circular shaped columns. Experimental studies related to rectangular and square
columns are limited (Bousias et.al. 2004). Despite of the availability of a large amount of
experimental data for predicting the behavior of FRP confined concrete circular columns, a

2
complete 3-D finite element model for understanding the influence of geometric shapes,
aspect ratios and FRP stiffness is somewhat lacking. As a contribution to fill this need an
attempt has been taken to develop a complete 3-D finite element model to investigate the
effect of aspect ratios, corner radius and thickness of FRP wrap on the behavior of FRP
wrapped concrete columns. This study also aims to evaluate the effect of FRP-concrete
interface on the behavior of FRP confined concrete.
1.2 Objectives of the Study
The objectives of the study are
1 To perform a nonlinear 3D finite element analysis on concrete columns of different
shapes confined with FRP wrap.
2 To validate the numerical model with respect to the experimental database available in
the literature.
3 To study the effect of selected parameters such as aspect ratio (a/b), the corner radius (R)
and the thickness of FRP wrap (tf) on the strength and ductility of FRP confined concrete
columns under concentric axial loading only.
1.3 Scope
The numerical simulation of concentrically loaded FRP confined concrete column has been
performed using ABAQUS, a finite element software package. A 3D finite element model
incorporating the nonlinear material behavior of concrete has been developed. The interface
between concrete and FRP has been modeled using contact pair algorithm in ABAQUS. A
perfect bond and a cohesion based surface interaction model have been assumed to define the
contact behavior of the concrete-FRP interface. The nonlinear load displacement response up
to failure of the confined columns has been traced using Riks solution strategy.
The performance of the developed model has been studied by simulating test columns
confined with FRP available in the published literature. These columns had various geometric
shapes as well as various FRP configurations. Finally the effect of the selected parameters
like cross-section shape factor, corner radius and the thickness of the FRP wrap on the
strength and ductility of FRP confined concrete columns have been investigated.

3
1.4 Organization of the Study
The thesis has been organized in six chapters. Chapter 1 includes the background of the
work along with the objectives and scope of current study. A brief review on the available
literatures regarding the characteristics and available types of composites as well as different
rehabilitation schemed for various structural components has been reported in chapter 2.
Moreover, this chapter presents various analytical models proposed by different research
groups for predicting the behavior of concrete rectangular and square columns confined with
Fibre reinforced polymers
.
Chapter 3 includes the properties of reference columns and the characteristics of the finite
element. The performance of the FE model has been studied in chapter 4 by comparing the
numerically obtained graphs with available experimental graphs.
Chapter 5 incorporates the parametric study which includes the effects of aspect ratio, corner
sharpness and confinement effectiveness of FRP-strengthened concrete columns. Finally, the
summary and conclusions of the work along with the recommendations for future research
have been included in chapter 6.

4
CHAPTER 2
LITERATURE REVIEW
2.1 General
Recent evaluation of civil engineering infrastructure has demonstrated that most of it will
need major repairs in the near future. The strength and stability of these structural members,
bridges, water retaining structures, sewerage treatment plants, wharfs, etc. are provided by
concrete. Therefore it is very important to protect concrete and any deterioration or damage
to concrete must be repaired promptly in order not to compromise the integrity of structures
built with concrete. Concrete rehabilitation particularly in critical infrastructures is as
important as any other maintenance activity and must be carried out in a timely manner.
Repairs performed at early stage would save extremely expensive remediation that may
become necessary at latter stages. Concrete can be deteriorated for many reasons such as-
Accidental Loadings
Chemical Reactions
Construction Errors
Corrosion of Embedded Metals
Design Errors
Abrasion and Cavitations
Freezing and Thawing
Settlement and Movement
Shrinkage
Temperature Changes
Weathering etc.
The strengthening and retrofitting of existing concrete structures to resist higher design loads,
correct deterioration-related damage or increased ductility has traditionally been
accomplished using conventional materials and construction techniques. Externally bonded
steel plates, steel or concrete jackets and external post tensioning are just some of the many
techniques available. However, to repair and extend the life of damaged structures externally
bonded fibre reinforced polymers (FRP) have been proved to be the most effective alternative
to the conventional ones. Despite a high material cost, some advantages like high strength to
weight ratio, high corrosion resistance, easy handling and installation processes are

5
establishing them as the most convenient option over the traditional strengthening materials
for rehabilitation of corroded RC structures, seismic damaged structures and so on. (Nasrin et
al., 2010). The composition and the type of this new composite material are presented in this
chapter. The material’s mechanical behavior is also included here. This chapter mainly
focuses on the repairing techniques by FRP laminates for shear and flexural strengthening of
corroded RC structures, strengthening of concrete beam-column joints and strengthening of
rectangular concrete columns in accordance with the numerical and experimental
investigations. The behavior of FRP confined concrete columns along with the design
guidelines are also reported in the literatures.
2.2 Fibre-Reinforced Polymers
Fibre-reinforced polymer (FRP) composites consist of continuous carbon (C), glass (G) or
aramid (A) fibres bonded together in a matrix of epoxy, vinylester or polyester. The fibres are
the basic load carrying component in FRP whereas the plastic, the matrix material, transfers
shear. FRP products commonly used for structural rehabilitation can take the form of strips,
sheets and laminates as shown in Figure 2.1.
Figure 2.1 FRP products for structural rehabilitation, (a) FRP strips and (b) FRP sheets (Rizkalla et al. 2003).
Use of FRP has now become a common alternative over steel to repair, retrofit and strengthen buildings and bridges. FRP materials may offer a number of advantages over steel plates which include,
1. High specific stiffness (E/ρ).
2. High specific strength (σult /ρ)
3. High corrosion resistance
4. Ease of handling and installation
Moreover, its resistance to high temperature and extreme mechanical and environmental
conditions has made it a material of choice for seismic rehabilitation. Some of the
(a) (b)

6
disadvantages of using FRP materials include their high cost, low impact resistance and high
electric conductivity.
2.3 Properties and Behavior of FRP
2.3.1 Tensile Behavior
The tensile strength and stiffness of FRP material is dependent on several factors. As the
fibres of FRP are the main load-carrying constituents, so the type of fibres, the orientation of
fibres and the quantity of fibres govern the tensile behavior mostly. When this FRP is loaded
under direct tension it does not exhibit any plastic behavior (yielding) before rupture. Most of
the time, FRP shows a linearly elastic stress-strain relationship until failure. Table 2.1 present
the tensile properties of commercially available FRP system.
Table 2.1 The tensile properties of some of the commercially available FRP systems
Fibre type Elastic modulus Ultimate Strength Rupture
strain, min
103 ksi GPa ksi MPa %
Carbon
General Purpose 32-34 220-240 300-550 2050-3790 1.2
High Strength 32-34 220-240 550-700 3790-4820 1.4
Ultra- High Strength 32-34 220-240 700-900 4820-6200 1.5
High modulus 50-75 340-520 250-450 1720-3100 0.5
Ultra- High modulus 75-100 520-690 200-350 1380-2400 0.2
Glass
E-glass 10-10.5 69-72 270-390 1860-2680 4.5
S-glass 12.5-13 86-90 500-700 3440-4140 5.4
Aramid
General Purpose 10-12 69-83 500-600 3440-4140 2.5
High performance 16-18 110-124 500-600 3440-4140 1.6
(Italian National Research Council, 2004)

The typicshown in
Figur
2.3.2 Com
The tests
insufficie
recomme
buckling
longitudi
In gener
except in
strength
Saadatma
The mod
elasticity
CFRP an
1990).
cal tensile stn Figure 2.2
re 2.2 The ty
mpressive B
for predic
ent, so it sho
ended to rely
or transvers
inal compres
I.
II.
III.
ral, compres
n the case of
of 55%,
anesh, 1990)
dulus of elast
y. The comp
nd 100% for
trengths and
ypical tensilereinforcem
Behavior
cting compr
ould not be
y on FRP sy
se tensile fai
ssion. The m
The type o
The fibre-v
The type o
ssive strengt
f a FRP. It is
78% and
).
ticity of com
ressive mod
r AFRP of t
stress-strain
e strengths, ents (https://
ressive stre
used as com
ystems to res
ilure is some
modes of failu
of fibre
volume frac
of resin.
ths are high
s reported th
20% of th
mpressive str
dulus of elas
the tensile m
7
n relationship
and stress-st/www.build-
ength of ex
mpressive re
sist compres
e modes of f
ure depends
tion and
her for mat
hat GFRP, C
he tensile
ress is genera
sticity is app
modulus of e
p of FRP and
train relation-on-prince.c
xternally bo
inforcement
ssive stress.
failure of FR
on
terials with
CFRP and A
strength re
ally lower th
proximately
elasticity (E
d steel reinfo
nship of FRPom)
onded FRP
t. For this re
Shear failur
RP laminate
higher tens
AFRP exhibit
espectively
han the tensi
80% for GF
hsani and S
orcements ar
P and steel
systems ar
eason it is no
e, fibre micr
s subjected t
sile strength
t compressiv
(Ehsani an
le modulus o
FRP, 85% fo
Saadatmanesh
re
re
ot
ro
to
hs,
ve
nd
of
or
h,

8
2.4 Applications of FRP in Structural Rehabilitation
In the last ten to fifteen years, FRP materials have emerged as promising alternative repair
materials for reinforced concrete structures and they are rapidly becoming materials of choice
for strengthening and rehabilitation of concrete infrastructure. There are currently three main
applications for the use of FRPs as external reinforcement of reinforced concrete structures
such as
Flexural strengthening (FRP materials are bonded to the tension face of a beam)
Shear strengthening (FRP materials are bonded to the side faces of a beam) and
Confining reinforcement (columns are wrapped in the circumferential direction with
FRP sheets)
2.4.1 Beam Strengthening with FRP Laminates
Flexural strengthening of reinforced concrete beams using FRP composites is generally done
by bonding of FRP sheets at the tension side of the beam. The bonded sheets work as tension
reinforcement and in turn increase the flexural capacity of the beam considerably.Bonding of
FRP plates and laminates to RC beams has now become a popular strengthening technique
which was first introduced by Meier’s group (Meier 1997) at the Swiss Federal Laboratories
for Materials Testing and Research. Since then, extensive experimental and analytical studies
(Colalillo and Sheikh 2009; Saxena et al. 2008; Choi et al. 2008; Nitereka and Neal 1999;
Brena et al. 2003; Bonacci and Maalej 2000) have been carried out all over the world on
flexural strengthening of concrete beams. These studies have concluded that introduction of
FRP can significantly enhance the flexural strength of a reinforced concrete beam.
Considerable research has been conducted to establish a better understanding of these
laminated system behavior .Several types premature failure modes such as tensile failure of
the bonded plate, concrete failure in the compressive zone, and sudden or continuous peeling
off of the laminate have also been observed. According to ACI code 2005 the following
failure modes should be investigated for an FRP strengthened section
Yielding of the steel in tension followed by rupture of the FRP laminate.
Yielding of the steel in tension followed by concrete crushing.
Debonding of the FRP from the concrete substrate.
Shear / tension delamination of the concrete cover (cover delamination);and
Crushing of the concrete in compressive before yielding of the reinforcing steel.
9
Some factors like the composite ratio Ac/As, the percentage of conventional tensile steel
reinforcement ρ; and the bond achieved between the FRP and the concrete influence the
degree of strength enhancement attained. It is reported that bonding very thin FRP plates to
the tension face of the beams can introduce a significant amount of enhancement in the
flexural strength of lightly reinforced beam, while more heavily reinforced beams requires an
increased amount of FRP, or a comparable composite ratio to achieve comparable strength
enhancement (Ross et.al., 1999). High composite ratio plays an important part in the
strengthening effect of light to moderately reinforced beams. By CFRP application,
approximately 10 to 35% higher load carrying capacity can be obtained along with a 10 to
32% decrease in the beam deflections at ultimate failure (Bonnaci et al.,2000) .
In addition to the strength enhancement, the FRP strengthening scheme with anchoring
system improves the ductility of the retrofitted beam by confining the concrete. Various
analytical models (Saadatmanesh et al. 1996, Niterika and Neale, 1999) have been proposed
to predict the ultimate moment capacities of reinforced concrete beams strengthened with
externally bonded composite laminates. In general, these models ignore the nonlinear stress–
strain behavior of the concrete and the contribution of tension concrete. Applications based
on such models are limited to structures with fairly simple geometries and loading conditions.
In addition to flexural strengthening, many experiments are now being carried out on shear
strengthening with FRP composites. The results show that significant increases in shear
capacity are possible with this FRP repair technique. The failure modes and degree of
strength enhancement, however, are strongly dependent on the details of the bonding scheme
and anchorage method. Shear strengthening using external FRP may be provided at locations
of expected plastic hinges or stress reversal and for enhancing post yield flexural behavior of
members in moment frames resisting seismic loads only by completely wrapping the section.
However, since the FRP materials behave differently than steel, the contribution of FRP
materials need to be included carefully in the design equations on the basis of detailed
experimental evaluation.
The bond behavior and load transfer behavior between concrete beam and FRP laminates is
an important tool to predict the failure behavior and stress distribution of retrofitted beams.
Experimental studies (Brena et al. 2003; Hamad et al. 2004; Saxena et al. 2008; and Choi
et al. 2008) indicated that debonding of the bottom strip from the concrete surface is the most

10
common mode of failure for concrete beams strengthened by externally bonded FRP sheets.
The debonding results in the loss of the composite action between the concrete and FRP
laminates. The effective stress transfer between FRP and concrete is essential to develop the
composite action. The local debonding initiates when high interfacial shear and normal
stresses exceed the concrete strength (Kotynia et al. 2008). Additional U-jacket strips or
sheets can be provided in the debonding initiation region to delay the FRP debonding
resulting in increased efficiency of the FRP retrofitting scheme. More experimental and
analytical studies should be carried out to find a more reliable relation between bond behavior
of FRP laminates and concrete to make sure that the FRP fitted structure does not fail
prematurely.
2.4.2 Column Strengthening
Reinforced concrete columns are considered to be the most important part of a typical
reinforced concrete structure as they are the major load carrying element of the building.
Minimum cross section size and lack of steel reinforcement in under designed columns leads
to a weak column—strong beam construction. To avoid a soft story collapse of a building due
to seismic action, columns should be adequately designed.
During an earthquake, plastic hinges are most likely to form in columns in weak column—
strong beam construction which may result in a sudden story collapse of the whole structure.
So it is very necessary to strengthen the columns so that plastic hinges are formed in the
beams since it allows more effective energy dissipation. It is reported that, closely spaced
transverse reinforcement used in the plastic hinge zone of concrete bridge columns will help
in increasing the compressive strength as well as increase the ultimate compressive strain in
the core concrete (Mirmiran and Shahawy 1997). Therefore, a significant amount of increase
in compressive strain will result in increasing the ductility of concrete columns. Researchers
have shown that an increase in the thickness of CFRP and AFRP jacket proportionally
increases the shear strength of the upgraded column or pier (Fujisaki et al. 1997; Masukawa
et al. 1997).
2.4.2.1 Experimental investigations
Unidirectional FRP sheets can be wrapped around the concrete columns as an external
reinforcement and confinement. Several investigations (Benzoni et al., 1996; Masukawa
et al., 1997; Seible et al., 1997; Lavergne and Labossiere, 1997; Saadatmanesh et al., 1997;

11
Seible et al., 1999; Mirmiran and Shahawy 1997; Fukuyama et al., 1999; Pantelides et al.
2000b; Bousias et al. 2004 and Harajli et al. 2006) have been conducted to study the
effectiveness of FRP in restrengthening of circular, square and rectangular reinforced
concrete columns. Most of the research works were done for identifying the behavior of FRP
confined concrete circular columns.
Saafi et.al. (1999) confirmed that for circular columns external confinement of concrete by
FRP tubes can significantly enhance the strength, ductility, and energy absorption capacity of
concrete.
Experiments regarding behavior of rectangular columns confined with FRP laminates are
limited. Haralji et al. (2006) reported that for square column sections without longitudinal
reinforcement (plain concrete) the increase in axial strength was found to be 154%, 213%,
and 230% for one, two, or three layers of CFRP wraps, respectively.
Rochette and Labossie`re (2000) performed experimental research for identifying the
influence of FRP thickness and corner radius of rectangular columns. They reported that for a
given number of wraps around a section (or a given transverse reinforcement ratio), the
confinement effect is directly related to the shape of the section and the section corners
should always be rounded off sufficiently to prevent premature failure by punching of the
fibres in the wrap. To investigate the influence of aspect ratio Chaallal, O. et al. (2003)
performed an experiment having different cross sectional properties and material properties
of rectangular columns. The gain in performance of axial strength and ductility due to the
wrapping was found greater for the 3 ksi concrete wrapped columns than for the
corresponding 6 ksi concrete columns. The maximum gain achieved for the 3 ksi concrete
wrapped columns was approximately 90% as compared to only 30% for the 6 ksi columns.
Figure 2.3 shows a picture of FRP applications on concrete column for retrofitting.

F
2.4.2.2 N
Though a
influentia
columns
rectangul
modeling
the geom
sharpnes
/Ec),the
factor (K
(2004) al
strength
understan
rectangul
need of d
polymers
2.5. Beh
Fibre rein
when sub
Figure 2.3 A
Numerical in
a large amou
al paramete
but full s
lar columns
g one fourth
metric confin
s factor (a/R
confinement
Karam and T
lso confirme
enhancemen
nding the c
lar columns
developing a
s which can
havior of FR
nforced poly
bjected to an
Applications
nvestigations
unt of experi
rs which ca
scale nume
by the FRP
h of the colu
nement effici
R), and to a
t effectivene
Tabbara, 200
ed that the s
nt as compa
complete ax
full numeric
a complete 3
be able to tr
RP Confin
ymer (FRP)
n axial comp
of FRP for c
s
imental work
an significa
erical invest
P laminates
umn cross–s
iency were th
much lesser
ess decrease
05). Anothe
strength gain
ared to the
xial stress-s
cal model sh
3-D model o
ace the peak
ned Concre
confined co
pressive load
12
column retro
ks were don
antly affect
tigations re
are in scarc
section sugg
he cross-sec
r extent the
es linearly w
er numerical
n due to a s
enhancemen
strain respon
hould be dev
of concrete
k and post-pe
te Column
oncrete colum
d. The stress
ofitting (Oba
e by the rese
the axial c
egarding the
ce. A numer
ested that th
ction shape f
confinemen
with the incr
l investigatio
single wrap
nt from add
nse of the
veloped. Thi
column con
eak behavior
ns
mn shows a
-strain plot r
aidat, et al., 2
earchers to in
capacity of
e behavior
rical study b
he paramete
factor (a/b) a
nt stiffness fa
rease in corn
on done by
typically re
ditional wrap
FRP confi
s study aims
fined by Fib
r quite accur
a unique bilin
reveals that
2010)
nvestigate th
the confine
of confine
based on onl
rs controllin
and the corne
actor (t /a)(E
ner sharpnes
Malvar et. a
esulted in les
ps. For bette
ined concre
s to fill up th
bre-reinforce
rately.
near behavio
FRP confine
he
ed
ed
ly
ng
er
Ej
ss
al.
ss
er
te
he
ed
or
es

13
the concrete shortly after the concrete has reached its ultimate compressive strength. To better
understand the FRP confinement of the concrete a proper stress-strain model has to be
developed. Exclusive work has been done in understanding this behavior.
2.5.1. Circular Columns
The confinement action exerted by the FRP on the concrete core is of the passive type, that is,
it arises as a result of the lateral expansion of concrete under axial load. As the axial stress
increases, the corresponding lateral strain increases and the confining device develops a
tensile hoop stress balanced by a uniform radial pressure which reacts against the concrete
lateral expansion (De Lorenzis & Tepfers, 2003.). When an FRP confined cylinder is subject
to axial compression, the concrete expands laterally and this expansion is restrained by the
FRP. The confining action of the FRP composite for circular concrete columns is shown in
Figure 2.4.
For circular columns, the concrete is subject to uniform confinement, and the maximum
confining pressure provided by FRP composite is related to the amount and strength of FRP
and the diameter of the confined concrete core. The maximum value of the confinement
pressure that the FRP can exert is attained when the circumferential strain in the FRP reaches
its ultimate strain and the fibres rupture leading to brittle failure of the cylinder. This
confining pressure is given by Equation 2.1:
(2.1)
Figure 2.4 Confinement action of FRP composite in circular sections
(Benzaid and Mesbah, 2013)
ffrp ffrp
tfrp tfrp

14
Where fl is the lateral confining pressure, Efrp is the elastic modulus of the FRP composite, εfu
is the ultimate FRP tensile strain, ffrp is the ultimate tensile strength of the FRP composite, tfrp
is the total thickness of the FRP, d is the diameter of the concrete cylinder, and ρfrp is the FRP
volumetric ratio given by the following Equation 2.2 for fully wrapped circular cross section:
= / (2.2)
2.5.2. Rectangular Columns
A square column with rounded corners is shown in Figure 2.4. To improve the effectiveness
of FRP confinement, corner rounding is generally recommended. Due to the presence of
internal steel reinforcement, the corner radius R is generally limited to small values. Existing
studies on steel confined concrete (Park and Paulay, 1975; Mander, et al.1988; Cusson and
Paultre, 1995). have led to the simple proposition that the concrete in a square section is
confined by the transverse reinforcement through arching actions, and only the concrete
contained by the four second-degree parabolas as shown in Figure 2.5 (b) is fully confined
while the confinement to the rest is negligible. These parabolas intersect the edges at 45°.
While there are differences between steel and FRP in providing confinement, the observation
that only part of the section is well confined is obviously also valid in the case of FRP
confinement. Youssef et al. (2007) showed that confining square concrete members with FRP
materials tends to produce confining stress concentrated around the corners of such members,
as shown in Figure 2.5(a). The reduced effectiveness of an FRP jacket for a square section
than for a circular section has been confirmed by experimental results (Rochette &
Labossière, 2000). Despite this reduced effectiveness, an FRP-confined square concrete
column generally also fails by FRP rupture (Benzaid et. al., 2008). For finding the confining
pressure for rectangular columns in Equation (2.1), d is replaced by the diagonal length of the
square section. For a square section with rounded corners, d can be written as:
√2 2 √2 1 (2.3)

2.6 Failu
Failure o
the fibre
fibre tub
fracture
Figure 2
principal
(1999).
Carbon w
near the
ductile b
Failure is
fails, the
significan
However
attributed
2003). T
occasion
almost al
at the en
under 1%
(a
Figu
ure Mecha
of the FRP c
tube with b
bes, the failu
of the comp
.6 (a). Altho
l failure mod
wrapped rect
corner of the
ehavior, fail
s usually ca
e concrete c
ntly over f‘c
r, popping
d to micro-c
The breakag
s, a very sli
ll cases, and
nd of the rou
% because fib
a) Dilated sqcarbon/ep
ure 2.5 Con
anism
confined circ
bursting alon
ure is more
posite hoop
ough some
de was a typ
tangular spe
e specimens
lure of the c
aused by sud
core is unab
c. Rupture o
noises are
cracking of
ge line is ge
ight slip bet
for whateve
unding as sh
bre punchin
quare columpoxy jacket
nfinement act
cular concre
ng the mid
sudden and
and the con
local buckli
pical shear fa
ecimens also
s. Even thou
confined con
dden rupture
ble to with
of the confin
heard durin
the concrete
enerally cle
tween the tw
er corner rad
hown in Figu
g occurred f
mn confined w
tion of FRP Mesba
15
ete specimen
height of th
d catastroph
ncrete core
ing and wav
failure of the
o failed by f
gh the stress
ncrete prism
e of the com
hstand the l
nement thus
ng various
e and shiftin
ean and per
wo external
dius, the brea
ure 2.6. The
first. It was,
(b)with
composite inah, 2013)
ns is general
he specimen
hic, accomp
in the form
ving of the t
e FRP tube a
fracture of th
s-strain curv
s occurred w
mposite wrap
oad, which
triggers a su
stages of l
ng of the ag
rpendicular t
plies of the
akage line ap
e ultimate co
of course, h
) Effectivelyin a square
n square sec
lly marked b
n However,
anied by a
m of a cone,
tubes were
as reported b
he CFRP co
ves indicate a
without adva
p. When the
correspond
udden failure
loading. The
ggregates (C
to the fibre
e specimens
ppears at a c
omposite str
higher for sp
y confined ce column
ctions (Benza
by fracture o
in the carbo
simultaneou
as shown i
observed, th
by Saafi et a
omposite at o
an increase i
ance warnin
e confinemen
ds to a stres
e mechanism
e sounds ar
Chaallal et al
es. On a fe
s occurred. I
orner, exactl
rain remaine
pecimens wit
oncrete
aid and
of
on
us
in
he
al.
or
in
g.
nt
ss
m.
re
l.,
w
In
ly
ed
th
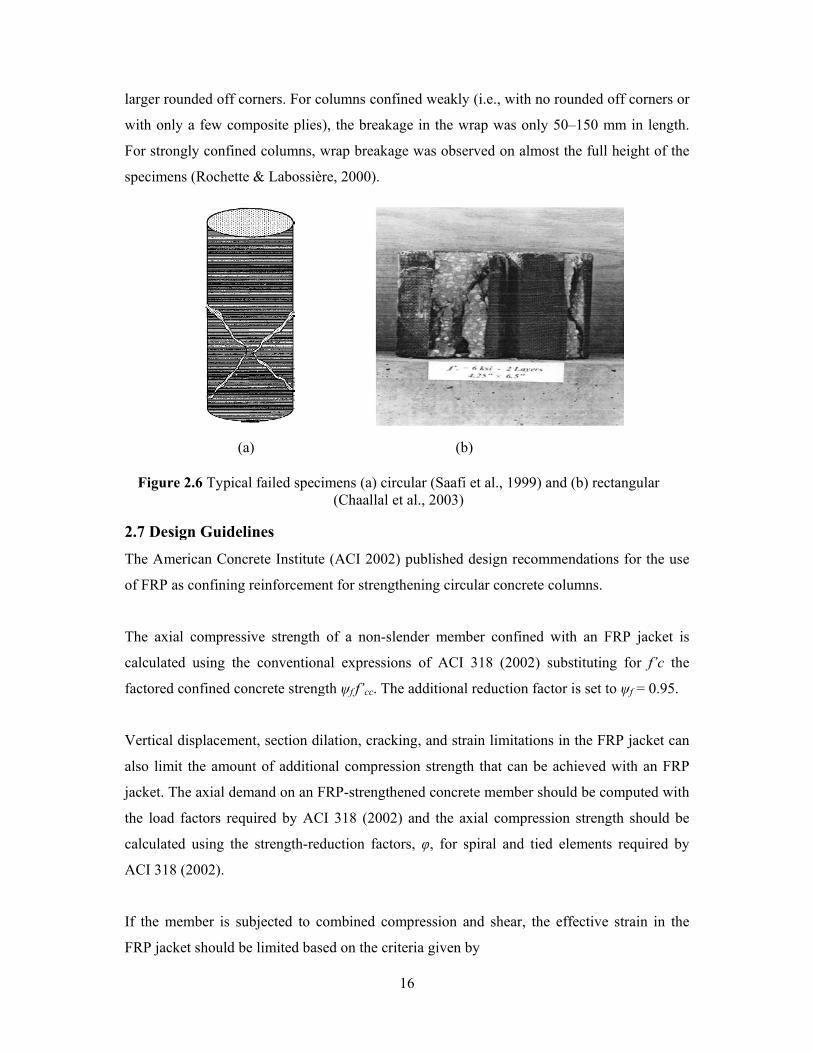
larger rou
with only
For stron
specimen
2.7 Desi
The Ame
of FRP a
The axia
calculate
factored
Vertical
also limi
jacket. Th
the load
calculate
ACI 318
If the me
FRP jack
Figure
unded off co
y a few com
ngly confined
ns (Rochette
ign Guideli
erican Concr
as confining r
al compressi
d using the
confined con
displacemen
it the amoun
he axial dem
factors requ
d using the
(2002).
ember is sub
ket should be
e 2.6 Typical
(a
orners. For c
mposite plies
d columns, w
& Labossiè
ines
rete Institute
reinforceme
ive strength
e convention
ncrete streng
nt, section di
nt of additio
mand on an F
uired by AC
strength-red
bjected to c
e limited bas
l failed spec
a)
columns conf
s), the break
wrap breaka
ère, 2000).
e (ACI 2002
ent for streng
of a non-sl
nal expressio
gth ψf f’cc. Th
ilation, crack
nal compres
FRP-strength
CI 318 (2002
duction fact
combined co
sed on the cr
imens (a) cir(Chaallal
16
fined weakly
kage in the w
age was obse
2) published
gthening circ
lender mem
ons of ACI
he additiona
king, and str
ssion strengt
hened concre
2) and the a
tors, φ, for
ompression a
riteria given
rcular (Saafiet al., 2003)
(b
y (i.e., with n
wrap was on
erved on alm
design reco
cular concret
mber confine
318 (2002)
l reduction f
rain limitatio
th that can b
ete member
axial compre
spiral and ti
and shear, t
by
i et al., 1999
b)
no rounded
nly 50–150 m
most the full
ommendation
te columns.
ed with an F
) substitutin
factor is set t
ons in the FR
be achieved
should be co
ession streng
ied element
the effective
9) and (b) rec
off corners o
mm in length
l height of th
ns for the us
FRP jacket
ng for f’c th
to ψf = 0.95.
RP jacket ca
with an FR
omputed wit
gth should b
s required b
e strain in th
ctangular
or
h.
he
se
is
he
an
RP
th
be
by
he

17
0.004 0.75 (2.4)
At load levels near ultimate, damage to the concrete in the form of significant cracking in the
radial direction occurs. The FRP jacket contains the damage and maintains the structural
integrity of the column. At service load levels, this type of damage should be avoided. In this
way, the FRP jacket will only act during overloads that are temporary in nature. To ensure
that radial cracking will not occur under service loads, the stress in the concrete is limited to
0.65f ′c. In addition, the stress in the steel should remain below 0.60fy to avoid plastic
deformation under sustained or cyclic loads. By maintaining the specified stress in the
concrete at service, the stress in the FRP jacket will be negligible. (Nanni, A. 2001). These
guidelines are only for the circular FRP-wrapped columns under concentric axial load
because test data on square and rectangular, slender, and eccentrically-loaded columns are
comparatively scarce.
Guidelines in Canada (CSA and ISIS) and Europe (FIB) provide design equations for
strengthening rectangular columns retrofitted with externally-bonded confining composite
wrap. The enhancement of confined concrete strength depends on the passive confinement
due to the lateral pressure generated by the lateral FRP fibres. The design and construction
guide for strengthening concrete structures with externally bonded FRP systems reported by
the ACI Committee 440 (2002) is aware of the enhanced concrete strength reported by
researchers, but it still considers it as marginal and no recommendations have yet been
provided, given the many unknowns related to this type of application. It should be
mentioned that most of the research on confinement of rectangular concrete columns was
presented after the ACI 440.2R guidelines were published.
2.7.1 CSA-S806-022 (2002)
According to the Canadian Standards CSA-S806-02 the load carrying capacity of a confined
column can be calculated as follows
(2.5)
where ke is a resistance factor (= 0.80 for columns with transverse steel ties), φc and φs are the
resistance factors for concrete and steel (φc = 0.6 and φs = 0.85), α1 is the ratio of average

18
compression stress to the concrete strength, that is, α1 = (0.85 – 0.0015f ′ c ) ≥ 0.67, Ag and Ast
are the gross concrete area and the area of steel bars respectively.
The CSA guidelines limit the applicability of the design equations to columns with small
aspect ratios and rounded corners. The maximum aspect ratio is limited to 1.5 (that is, b/h ≤
1.5). Also, the corner radius is to be greater than or equal to 20 mm (0.8 in.) (r ≥ 20 mm [0.8
in.]). For rectangular columns meeting these conditions, the confined concrete strength f ′cc
can be calculated using Equation (2.6) to (2.8).
0.85 (2.6)
6.7 -0.17 (2.7)
(2.8)
Where, kc is a confinement coefficient equal to 0.25 for rectangular columns, D is the
diameter of an equivalent circular column; tj is the thickness of the FRP jacket, fFj is the
stress in the FRP jacket (= minimum [0.004Ej, φF fFu]), φF is the resistance reduction factor
for FRP and fFu is the ultimate FRP tensile strength.
2.7.2 ISIS Canada (2001)
According to the design guidelines provided by ISIS Canada the confined concrete strength
can be calculatedusing Equation (2.9) ,
1 (2.9)
where αpr is a performance coefficient (=1); Ww is the volumetric strength ratio. To ensure an
effective confinement, the ISIS guidelines limit the applicability of the design equations to
quasi-square columns with rounded corners because the maximum aspect ratio is limited to
1.1 (b/h ≤ 1.1). Also, the corner radius should be greater than or equal to b/6 and not less than
35 mm (1.4 in.) [(r ≥ b/6] and [r ≥ 35 mm (1.4 in.)]. The guidelines, however, do not specify
any limiting values on the confining pressure as was the case for circular columns.

19
2.7.3 FIB Guidelines (2001)
In its technical report “Externally Bonded FRP Reinforcement for RC Structures,” the
International Federation of Structural Concrete (FIB) provides equations for the design of
rectangular columns confined with FRP wrap. The ultimate confined concrete strength is
calculated using Equation (2.10) to (2.13).
0.2 3 (2.10)
Where can be calculated from Equation 2.11
(2.11)
(2.12)
(2.13)
where ke is the effectiveness coefficient representing the ratio of the effectively confined area
of the cross section to the total cross-sectional area and εju is the effective ultimate
circumferential strain of the FRP jacket. The guidelines state that in view of the limited
proper values of εju, the value chosen should be justified by experimental evidence.
2.8 Summary From the review of literature presented in this chapter it is clear that extensive experimental
investigations have been performed on strengthening of concrete circular columns using fibre
reinforced polymers. The performance of FRP confined concrete circular columns is now
relatively well understood from the experimental point of view. But information about
behavior of confined rectangular columns is limited. Since laboratory experiments are
expensive and time-consuming, reliable analytical procedures should be developed for
predicting the structural response of concrete columns confined by fibre-reinforced polymers.
To fully simulate their behavior up to failure, numerical models which are capable of
predicting the complexities of material nonlinearity, concrete post cracking tension softening,
as well as interaction between the concrete and FRP surface, is required. Therefore, an
attempt has been made in current study to address these issues and thereby to develop a full
scale 3D finite element model for FRP confined concrete columns under axial loading.

20
CHAPTER 3
FINITE ELEMENT MODELING
3.1 General
Due to relatively high cost of large-scale experimental research, a means of modeling FRP-
confined concrete columns using computer aided program is needed to broaden the current
knowledge about the complete behavior and influence of the geometric properties. In this
study an attempt has been made to develop a complete Finite Element model that can be
applied for a variety of geometries of FRP confined concrete columns subjected to uniaxial
loading and provide accurate simulations of the compressive behavior. The model therefore is
to be capable of simulating numerically the compressive behavior of concrete columns
confined by Fibre-Reinforced Polymers. The model is developed using the
ABAQUS/Standard finite element software code.
A concrete damage plasticity model which is capable of predicting both compressive and
tensile failures is used to model the concrete material behavior. The FRP–concrete interface
in the confined concrete column is modeled using the contact pair algorithm in ABAQUS.
Both cohesion and perfect bond formulation having simple master–slave contact are used at
the interface of the FRP laminate and concrete infill. Nonlinear material behavior as well as
the geometric nonlinearities is accounted for in the numerical model. A static Riks solution
strategy is used to trace a stable post-peak response of the composite system up to failure.
Experimental results of 11 specimens, representing FRP-confined concrete columns are used
to validate the numerical results. To validate the model, simulations are conducted for axially
loaded rectangular test specimens reported in the literature, varying in cross section from
152×152 mm to 108×165 mm, including a variety of corner radius and concrete compressive
strength (25 MPa to 42 MPa). For circular columns the diameter of the columns are 152 mm.
The thickness of the FRP sheets is also varied here.
Detailed descriptions of the test specimens are provided in the following section. This is
followed by a description of the finite element model geometry used to simulate the various
tests, the material model parameters, as well as the loading program.

21
3.2 Properties of Reference Test Specimens
3.2.1 Geometric and Material Properties of Square Columns
The column sets tested by Rochette and Labossie`re (2003) includes five square specimens
named S5C5, S25C3, S25C4, S25C5 and S38C3 are modeled for finite element analysis. The
lists of these specimens, along with their geometric properties, are given in Table 3.1 and
shown in Figure 3.1. These specimens had square cross sections of 152 mm X 152 mm with a
height of 500 mm. The corner radiuses of the specimens were varied from 5 mm to 38 mm
where 5 mm represented the sharpest square column. The material properties of these test
specimens are presented in Table 3.2. These specimens were wrapped with two to five plies
of carbon fibre. In all cases, the principal fibres were oriented perpendicular to the column
axis, in a so-called 0º orientation. The mechanical properties of these test specimens are
presented in Table 3.2. To provide confinement, composite sheets were wrapped around the
column models in a continuous manner. Once the appropriate number of laps had been
placed, the outermost confining sheet was extended by an additional overlapping length, in
order to provide a sufficient anchorage and prevent slip between layers. An overlap length of
100 mm was applied and was found to be sufficient. After placement of the external 0º layer,
a 25 mm wide strip was added at each end of the specimens. This additional local
confinement prevents local damages and ensures that compressive failure occurs in the
central portion of the model. The specimens were subjected to a monotonic uniaxial
compression loading up to failure. The load was applied at a strain rate of 10 µε/s with a
hydraulic press. Prior to the test, a thin sulfide layer was put on both ends of the column to
ensure that contact areas were flat and parallel. These specimens were modeled to investigate
the confinement efficiency and influence of the corner radius for a constant FRP laminate
thickness.
3.2.2 Geometric and Material Properties of Rectangular Columns
Four rectangular columns SC-1L3-0.7, SC-2L3-0.7, SC-3L3-0.7 and SC-4L3-0.7 constitute
the column set of Chaallal et al.(1999) having different aspect ratio (a/b=0.7) are also
modeled to validate the numerical results. These specimens had rectangular cross sections of
165 mm X 108 mm with a height of 305 mm which is shown in Figure 3.1. The compressive
strength of concrete was around 21 MPa. For the specimens receiving carbon lamination, the
required layers of the standard CFRP system were applied. The standard system consists of a

22
bidirectional weave with an average of 6.7 yarns per inch in each direction and per layer.
Details of the material properties of the CFRP are presented in Table 3.2. For each specimen,
the corners were rounded with a corner radius equal to 25.4 mm to improve their behavior
and to avoid premature failure of CFRP material due to shearing at sharp corners. All
specimens were tested using a 550 kip (2,446 kN) MTS compression machine and an
automatic data acquisition system. Specimens were tested to failure under a monotonically
increased concentric load and a displacement control mode. Failure was usually caused by
sudden rupture of the composite wrap. After failure, the confined concrete was found to be
disintegrated in about one third of the total volume of the specimen. Experimental
observations suggest that the micro-cracking occurs in a more diffuse manner than in
unconfined concrete. Despite all measures, it was impossible to precisely identify the exact
location where failure initiated in the confining laminate (Chaallal et al., 2003)
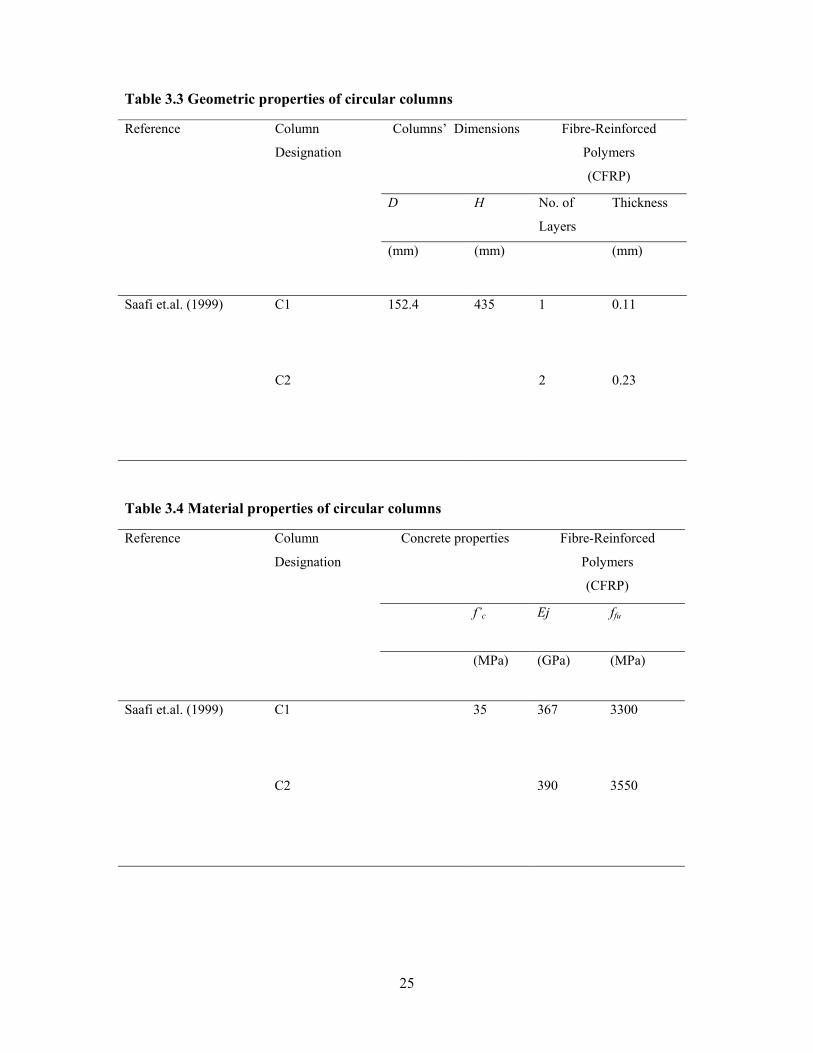
3.2.3 Geometric and Material Properties of Circular Columns
To test the performance of circular concrete columns confined with FRP tubes, two circular
columns named C1 and C2 of Saafi et.al. (1999) with different thickness of FRP laminates
are also modeled under compression. All specimens consisted of short columns with a length-
to-diameter ratio of 2.85. Each specimen measured 152.4 mm in diameter and 435 mm in
length. The geometric properties are summarized in Table 3.3. The mechanical properties of
the FRP tubes are summarized in Table 3.4. The FRP tubes used in that study were made of
carbon-fibre filament winding-reinforced polymers, all consisting of 60 percent fibre and 40
percent polyester resin. The fibres oriented in the circumferential direction of the cylinders.
The concrete consisted of ASTM Type I Portland cement, river sand aggregate with a
fineness modulus of 2.6 and a crushed limestone aggregate with a maximum size of 10 mm.
The water-cement ratio (w/c) was 0.5 by mass. The average 28-day compressive strength of
the concrete was 38 MPa, and the modulus of elasticity was 30 GPa. Concrete encased with
carbon FRP tubes of thicknesses of 0.11 and 0.23 mm were designated as C1 and C2. The
confined cylinders, as well as unconfined samples, were tested using a 300-kip testing
machine. The load was applied to the specimen through a pad having the same area as the
concrete core. Failure of the composite specimens was initiated by fracture of the fibre tube.

23
Figure 3.1 Geometric properties of square, rectangular and circular columns
b = 152 mm
R
a=152 mm
500 mm
R
b =165.10 mm
108 mm
305 mm 435 mm
D=152.4

24
Table 3.1 Geometric properties of square and rectangular columns
Reference
Column
Designation
Columns’ Dimensions (mm) Fibre-Reinforced
Polymers
(CFRP)
a (shorter
side)
b(longer
side)
H
Corner
Radius (R)
No. of
Layers
Thickness
(mm) (mm) (mm) (mm) (mm)
Rochette and
Labossie`re(2000)
S25C3 152 152 500 25 3 0.9
S25C4 4 1.2
S25C5 5 1.5
S38C3 38 3 0.9
S5C5 5 5 1.5
Chaallal, O. et
al.(2003)
SC-1L6-0.7 108.00 165.1 305 25.4 1 0.5
SC-2L6-0.7 2 1.0
SC-3L6-0.7
SC-4L6-0.7
3
4
1.5
2.0
Table 3.2 Material properties of square and rectangular columns
Reference
Column
Designation
Concrete Properties Fibre-Reinforced Polymers
(CFRP)
ρ
(%)
f�c
(MPa)
w
(g/cm3)
εult
%
Ej
(GPa)
ffu
(MPa)
Rochette, and
Labossie`re,(2000)
S25C3 2.26 42.00 1.80 1.5 82.7 1265
S25C4 3.02 43.90
S25C5 3.79 43.90
S38C3 2.25 42.00
S5C5 3.93 43.90
Chaallal, O. et al.(2003) SC-1L6-0.7 0.37 25.10 - 0.28 231 3650
SC-2L6-0.7 0.75 0.50
SC-3L6-0.7
SC-4L6-0.7
1.12
1.5
0.60
0.50
25
Table 3.3 Geometric properties of circular columns
Reference
Column
Designation
Columns’ Dimensions
Fibre-Reinforced
Polymers
(CFRP)
D
H
No. of
Layers
Thickness
(mm) (mm) (mm)
Saafi et.al. (1999) C1 152.4 435 1 0.11
C2 2 0.23
Table 3.4 Material properties of circular columns
Reference
Column
Designation
Concrete properties Fibre-Reinforced
Polymers
(CFRP)
f’c
Ej
ffu
(MPa) (GPa) (MPa)
Saafi et.al. (1999) C1 35 367 3300
C2 390 3550

3.3 Cha
3.3.1 Geo
In this st
like cross
stiffness
The mod
section is
3.3.1.1 E
As report
the simu
capture t
whereas
used to s
Typically
brick ele
translatio
Figure
L
X
racteristics
ometric Pro
tudy FRP co
s-sectional s
factor on
del used in th
s shown.
Element selec
ted in chapte
ultaneous oc
this behavio
eight-node
simulate the
y, the numb
ement is ca
onal degrees
e 3.2 (a) 3-D
Y
Z
s of the Fin
operties and
onfined conc
shape factor
n confineme
he analysis i
ction
er 2, the FR
ccurrence of
or eight node
finite strain
FRP sheets
er of nodes
alled C3D8
of freedom
D view of the
(a)
nite Elemen
d Finite Elem
crete column
(a/b), the co
ent efficien
is shown in
RP-confined c
f rupture of
e brick elem
n reduced in
s and lamina
in an eleme
8R and the
are consider
e column me
26
nt Model
ment Model
ns are mode
orner sharpn
ncy of exp
Figure 3.2(a
concrete col
f FRP lamin
ments (C3D8
ntegration co
ates, Details
ent is clearl
8-node she
red in each n
sh and (b) C
a
ls
eled to study
ness factor (a
perimental
a) and in the
lumns reach
nates and c
8R) are use
ontinuum sh
s are shown
y identified
ell element
node for both
Cross section
(b)
y the effect o
a/R) and the
FRP confin
e Figure 3.2
their ultima
crushing of
d to model
hell element
in Figure 3
in its name
is called S
h elements.
n (with CFRP
b
of paramete
e confinemen
ned column
2 (b) the cros
ate capacity
concrete. T
the concret
s (SC8R) ar
.3(a) and (b
e. The 8-nod
SC8R. Thre
For modelin
P laminate)
R
rs
nt
n.
ss
at
To
te,
re
b).
de
ee
ng
)

the circu
provide f
A body
symmetry
3.3(c) sh
point on
coordinat
Figur
ular columns
for the mode
of revolutio
y axis) and
ows a typica
this cross-se
tes coincide
re 3.3 Finite
(a)
s axisymmet
eling of bodi
on is genera
is readily d
al reference
ection are de
with the glo
elements us
(c
tric element
ies of revolu
ated by revo
described in
cross-sectio
enoted by r a
obal Cartesia
sed in the mo
c) Axisymme
(c)
27
ts (CAX4R)
ution under a
olving a pla
cylindrical
on at �=0. T
and z, respec
an X- and Y-c
odel, (a) 8-no
etric solid el
) were used.
axially symm
ane cross-se
polar coord
The radial a
ctively. At �
coordinates.
ode solid (b
lement
(b)
. Axisymme
metric loadin
ection about
dinates r, z, a
and axial coo
�=0. , the ra
b) 8- shell el
etric elemen
ng condition
t an axis (th
and �. Figur
ordinates of
adial and axi
lement and
nts
ns.
he
re
f a
al

28
3.3.1.2 Mesh description
The mesh configuration for the full FRP confined concrete column model is shown in Figure
3.2. A sensitivity analysis was performed using 5×5×5 mm, 25×25×25 mm and 50×50×50
mm rectangular block to optimize the mesh in order to produce proper representation of the
rupture of FRP sheets. Since, the rupture of the FRP sheets always started at the corners
(Rochette and Labossie`re, 2000) a finer mesh was defined at the corners of the rectangular
and square columns. The mesh size of other portions didn’t have any significant influence on
the compressive behavior of confined columns. The element sizes of the concrete and FRP
are selected to be approximately 50×50×50 mm rectangular block as it can properly simulate
the behavior and minimize the computational time.
3.3.1.3 Modeling of concrete-FRP interface
One of the most challenging aspects of this study was to model successfully the concrete –
FRP interaction at their interfaces with a contact algorithm. Contact conditions are a special
class of discontinuous constraint in numerical analysis. They allow forces to be transmitted
from one surface to another only when they are in contact. When the surfaces separate, no
constraint is applied. ABAQUS provides two algorithms for modeling contact: a general
contact algorithm and a contact-pair algorithm. The general contact algorithm is more
powerful and allows in simpler cases where as a contact pair algorithm is needed for
specialized contact features such as in the current problem.
Two different models were used to represent the interface between concrete and CFRP. In the
first model the interface was modeled as a perfect bond while in the second it was modeled
using a cohesive zone model. In perfect bond model contact pair algorithm is used between
concrete –FRP interface. First, two surfaces were defined geometrically. The surface of the
FRP laminates was defined as slave surface whereas the concrete surface was defined as
master surface. As long as the two surfaces were in contact, they transmitted shear and
normal force across the interface.
In cohesive based interface model simple traction-separation law is used in between master –
slave interfaces. Figure 3.4 shows a graphic interpretation of a simple bilinear traction–
separation law written in terms of the effective traction τ and effective opening displacement
δ.

29
Figure 3.4 Bilinear traction separation constitutive law
The interface is modeled as a rich zone of small thickness and the initial stiffness K0 is
defined as: 1
3.1
where, ti is the resin thickness, tc is the concrete thickness, and Gi and Gc are the shear
modulus of resin and concrete respectively.
The values used for this study were ti = 1 mm, tc = 5 mm, Gi = 0.665 GPa, and Gc = 10.8 GPa.
From Figure 3.4, it is obvious that the relationship between the traction stress and effective
opening displacement is defined by the stiffness, K0, the local strength of the material, τmax, a
characteristic opening displacement at fracture, δf, and the energy needed for opening the
crack, Gcr, which is equal to the area under the traction– displacement curve. Equati` on.
3.2 provides an upper limit for the maximum shear stress, τmax, giving τmax = 3 MPa in this
case:
1.5 (3.2)
where
2.25 / 1.25
3.3
and bf is CFRP plate width, bc is concrete width and fct is concrete tensile strength.
Gcr
δ
τ
τmax
δf δ0
K0
Eff
ectiv
e tr
actio
n, τ
Effective opening displacement, δ

30
The initiation of damage was assumed to occur when a quadratic traction function involving
the nominal stress ratios reached the value one. This criterion can be represented by
1 3.4
where σn is the cohesive tensile and τs and τt are shear stresses of the interface, and n, s, and t
refer to the direction of the stress components.
Interface damage evolution was expressed in terms of energy release. The description of this
model is available in the Abaqus material library. The dependence of the fracture energy was
defined based on the Benzaggah–Kenane fracture criterion. Benzaggah–Kenane fracture
criterion is particularly useful when the critical fracture energies during deformation purely
along the first and the second shear directions are the same;
i.e., Gsc= Gt
c. It is given by:
3.5
where Gζ = GS + Gt , Gξ= Gn + Gs and η are the material parameter. Gn, Gs and Gt refer to
the work done by the traction and its conjugate separation in the normal, the first and the
second shear directions, respectively. (Obaidat et.al, 2009)
Axial stress vs. axial strain responses of confined columns found from both models ensured
same ultimate capacity. Actually the failure of the FRP-confined concrete columns is
governed by the rupture of the FRP laminates at corners. Debonding of FRP sheets is not an
important criterion of failure in FRP confined concrete columns. So, the cohesion model
didn’t affect the ultimate capacity at all. Figure 3.5 (a) and (b) clearly illustrates that for
concentric loading there is no significant influence of cohesion model. However, it may
affect the ultimate capacity for eccentric loading condition. Hence perfect bond model is used
for further numerical modeling as it minimizes the computational time.

31
(a) (b)
Figure 3.5 Axial stress vs. axial strain responses of column S25C5 (a) using cohesive zone model (b) using perfect bond model.
3.3.1.4. Load application & boundary condition
In the experiments the specimens were subjected to a monotonic uniaxial compression
loading up to failure. The load was applied with a hydraulic press. Prior to the test, a thin
sulfide layer was put on both ends of the column to ensure that contact areas were flat and
parallel. Uniaxial compressive load is applied in the model just like the experimental way
shown in Figure 3.6. As full cylinders and prisms have been modeled so fixed support is
applied at bottom end and displacement controlled loading is applied on the top. The top
surface is made rigid to ensure uniform transfer of the applied loading to the adjacent
concrete and FRP nodes.
Figure 3.6 Load application and boundary condition
FEM FEM
TEST TEST
Axial Strain % Axial Strain %
Axi
al S
tress
(MPa
)
Displacement control loading
Fixed Support
0
20
40
60
80
0 0.5 1 1.5
0
10
20
30
40
50
60
70
0 0.5 1 1.5

32
3.3.2 Material Properties
3.3.2.1 Concrete
Concrete is modeled using concrete damaged plasticity model provided by ABAQUS
software. The concrete damaged plasticity model is primarily intended to provide a general
capability for the analysis of concrete structures under cyclic and/or dynamic loading. The
model is also suitable for the analysis of other quasi-brittle materials, such as rock, mortar
and ceramics; but it is the behavior of concrete that is used in the remainder of this section to
motivate different aspects of the constitutive theory. Under low confining pressures, concrete
behaves in a brittle manner; the main failure mechanisms are cracking in tension and crushing
in compression. The brittle behavior of concrete disappears when the confining pressure is
sufficiently large to prevent crack propagation. In these circumstances failure is driven by the
consolidation and collapse of the concrete micro porous microstructure, leading to a
macroscopic response that resembles that of a ductile material with work hardening.
The model is capable of taking into consideration the degradation of elastic stiffness (or
“damage”) induced by reversible cycles as well as high temperatures both in tension and
compression. The concrete damage plasticity model uses a non-associated plastic flow rule in
combination with isotropic damage elasticity. The Drucker–Prager hyperbolic function is
used to define the plastic flow potential. The dilation angle defines the plastic strain direction
with respect to the deviatoric stress axis in the meridian plane. The volumetric expansion of
concrete can be controlled by varying the dilation angle.
The model uses the yield function of Lubliner et al. (1989), with modifications to account for
a different evolution of strength under tension and compression using multiple hardening
variables. The two hardening variables used to trace the evolution of the yield surface are the
effective plastic strains in compression and in tension, εc~pl and εt
~pl, respectively. The start of
compressive yield in a numerical analysis using this model occurs when εc~pl > 0, whereas
when εt~pl > 0 and the principal plastic strain is positive, it indicates the onset of tensile
cracking.
Uniaxial tension and compression stress behavior
The uniaxial tensile and compressive responses (Figures 3.3(a) and 3.3(b), respectively) of
concrete used in this model are somewhat simplified to capture the main features of the
response. Under uniaxial compression, the stress–strain response (as shown in Figure 3.7(b))

33
is assumed to be linear up to the initial yield stress, which is assumed to be 0.30fcu in the
current study. The plastic region is characterized by stress hardening, followed by strain
softening after reaching the ultimate strength, fcu. The uniaxial compression hardening curve
is defined in terms of the inelastic strain, εc~in, which is calculated using Equation (3.6). The
damage plasticity model automatically calculates the compressive plastic strains, εc~pl,
Equation (3.7), using a damage parameter, dc, that represents the degradation of the elastic
stiffness of the material in compression.
~ 3.6
~ ~ 1 3.7
Figure 3.7(a) shows the uniaxial tensile behavior of concrete used in the damage plasticity
model. The stress–strain curve in tension is assumed to be linearly elastic until the failure
stress, ftu , is reached. After this point strain softening represents the response of the cracked
concrete that is expressed by a stress versus cracking displacement curve. The values of the
plastic displacements calculated by the damage model are equal to the cracking
displacements since the tensile damage parame ter, dt , is zero for current study.

34
Figure 3.7 Response of concrete to uniaxial loading in (a) tension and (b)compression.
A general form of serpentine curve, as given by the following equations (Carriera and Chu,
1985) is used to represent the complete stress-strain relationship of unconfined concrete
1 3.8
1
1 3.9
(a)
(b)

35
Where, β is a material parameter which depends on the shape of the stress- strain diagram.
The value of β = 3 is used in this thesis which is proposed by Tulin and Grestle (1964).A
stress-strain relationship curve of concrete for different values of ε′c is plotted using the
above equations and this curve is shown in Figure 3.8 (a). Figure 3.8 (b) shows axial stress
versus plastic strain curve for compression hardening of concrete.
Figure 3.8 Stress-strain relationship curve of concrete for compression hardening
(a) stress versus total strain (b) stress versus plastic strain
(a)
(b)
0
5
10
15
20
25
30
35
40
45
0 1000 2000 3000 4000 5000 6000
Stre
ss, M
Pa
Strain , µε
0
5
10
15
20
25
30
35
40
45
50
0 1000 2000 3000 4000 5000
Stre
ss, M
Pa
Plastic Strain (µε)

36
A same form of serpentine curve is used shown in Figure 3.9 (a) and (b) for the average
stress-strain diagram and stress- inelastic strain diagram of reinforced concrete in tension.
Figure 3.9 Stress-strain relationship curve of concrete for tension stiffening
(a) stress versus total strain (b) stress versus inelastic strain
3.3.2.2 FRP laminate
The FRP laminate is modeled as an isotropic homogeneous material as shown in Figure 3.10
using a linear elastic stress-strain curve with a poison’s ratio of 0.30. The density used in
modeling is 1.8 g/cc (Rochette and Labossie`re, 2000).
Stre
ss, M
Pa
(a)
(b)
Stre
ss, M
Pa
0
0.5
1
1.5
2
2.5
3
0 0.0001 0.0002 0.0003 0.0004 0.0005
Strain, ε
0
0.5
1
1.5
2
2.5
3
0 0.0001 0.0002 0.0003 0.0004 0.0005Inelastic strain

37
Figure.3.10 Typical Elastic stress-strain curve of CFRP
Most of the FRP confined rectangular columns failed due to rupture of the FRP laminate at
the corners when the FRP sheets reached their hoop strength (Chaallal et al., 2003; Rochette
and Labossière, 2000). Hoop strength of carbon sheet generally ranges from 0.41 to 0.61 of
the tensile ultimate strength as reported by Rousakis et al. To simulate the failure behavior
hoop stress is provided 0.5 of the tensile strength.
3.3.3 Solution Strategy
The solution strategy is based on the Riks method. In simple cases linear eigenvalue analysis
may be sufficient for design evaluation; but if there is concern about material nonlinearity,
geometric nonlinearity prior to buckling, or unstable postbuckling response, a load-deflection
(Riks) analysis must be performed to investigate the problem further. The Riks method:
• Generally is used to predict unstable, geometrically nonlinear collapse of a structure.
• Can include nonlinear materials and boundary conditions.
• Often follows an eigenvalue buckling analysis to provide complete information about
a structure's collapse and
• Can be used to speed convergence of ill-conditioned or snap-through problems that do
not exhibit instability.
The Riks method uses the load magnitude as an additional unknown; it solves simultaneously
for loads and displacements. Therefore, another quantity must be used to measure the
progress of the solution; Abaqus/Standard uses the “arc length,” s, along the static
equilibrium path in load-displacement space. This approach provides solutions regardless of
whether the response is stable or unstable shown in Figure 3.11.
Tens
ile
Stre
ss, M
Pa
Strain, %
εult= 1.5%
ftf=1265 MPa
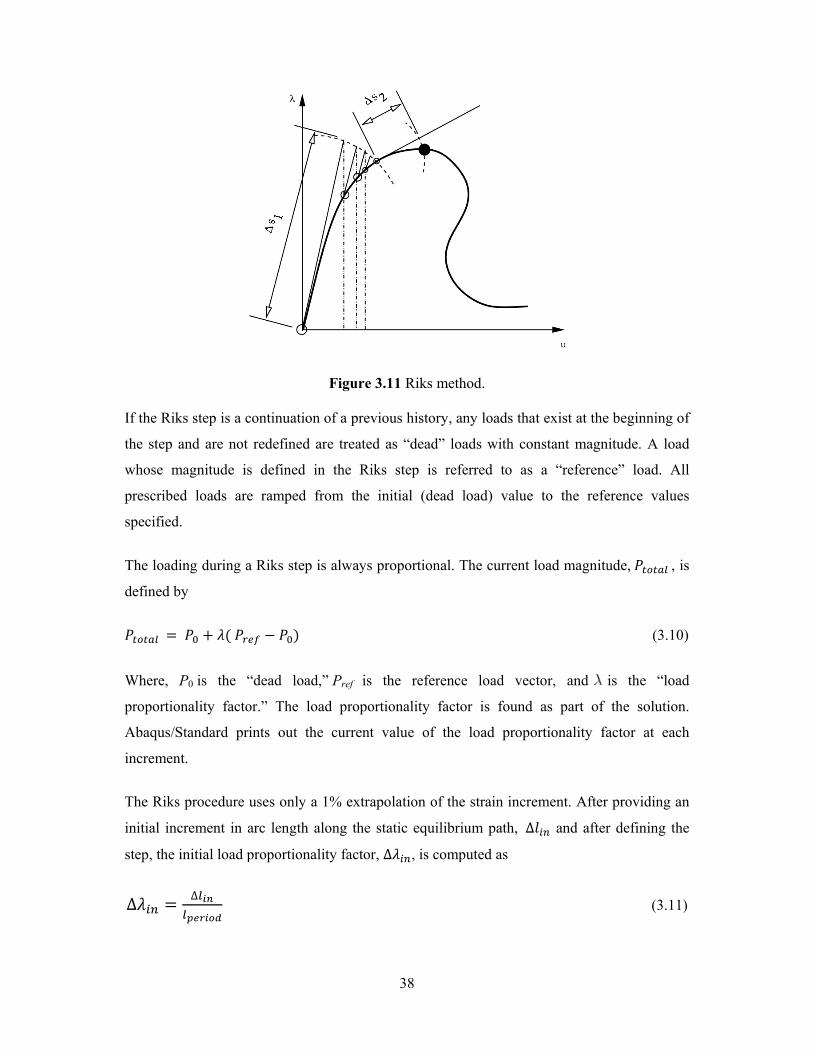
If the Rik
the step
whose m
prescribe
specified
The load
defined b
Where,
proportio
Abaqus/S
incremen
The Riks
initial inc
step, the
∆
ks step is a c
and are not
magnitude is
ed loads are
d.
ding during a
by
P0 is the “
onality facto
Standard pri
nt.
s procedure u
crement in a
initial load p
∆
continuation
redefined a
s defined in
e ramped fr
a Riks step i
“dead load,
or.” The loa
ints out the
uses only a
arc length a
proportional
Figure 3.1
of a previou
are treated a
n the Riks
rom the ini
s always pro
,” Pref is th
ad proportio
e current va
1% extrapol
long the sta
ity factor, ∆
38
11 Riks meth
us history, an
s “dead” loa
step is refe
itial (dead l
oportional. T
he reference
onality facto
alue of the
lation of the
atic equilibri
, is comp
hod.
ny loads tha
ads with con
erred to as
load) value
The current l
e load vec
or is found
load propo
e strain incre
um path, ∆
puted as
t exist at the
nstant magn
a “referenc
to the refe
load magnitu
tor, and
as part of
ortionality fa
ement. After
and after
e beginning o
nitude. A loa
ce” load. A
erence value
ude, ,
(3.10
is the “loa
the solution
actor at eac
r providing a
r defining th
(3.11
of
ad
All
es
is
0)
ad
n.
ch
an
he
1)

39
Where lperiod is a user-specified total arc length scale factor (typically set equal to 1). This
value of ∆ is used during the first iteration of a Riks step. For subsequent iterations and
increments the value of λ is computed automatically, so there is no control over the load
magnitude. The value of λ is part of the solution. Minimum and maximum arc length
increments, ∆ and ∆ , can be used to control the automatic incrementation.

40
CHAPTER 4
PERFORMANCE OF FINITE ELEMENT MODELS
4.1 General
The finite element models developed in chapter 3 are validated using simulations of 11 FRP-
confined concrete columns reported in literature (Chaallal et al.,2003 ; Rochette and
Labossière, 2000 and Shaafi et al., 1999). The tests were performed on a wide variety of
concrete columns confined with fibre-reinforced polymers with different geometric properties
and material properties. The descriptions of the geometric and material properties of these
columns have been reported in chapter 3. From the finite element analysis of each of these
test columns, the predicted axial stress versus axial strain and transverse strain response are
obtained and compared with the corresponding experimental results. Moreover the finite
element model is also used to study the effect of corner radius, confinement effectiveness and
shape factor on the strength of confined concrete columns.
4.2 Performance of FEM Models
4.2.1 Ultimate Capacity and Strain
A finite element model with FRP wrapping was developed to predict the compressive
behavior of confined column under uniaxial loading. The ultimate capacities obtained from
numerical models are compared with those obtained from the experiments in Table 4.1. The
maximum axial stresses are found to be very close to those observed in the experiments. The
mean value of the experimental-to-numerical stress ratio is 1.01 with a standard deviation of
0.03.
The axial strain values at the ultimate strain for numerical models, along with the ratios of the
experimental-to-numerical failure strains are shown in Table 4.1. The numerically predicted
ultimate axial strains are found to be higher compared to the experimental values with an
average experimental-to-numerical ratio of 0.96 with a standard deviation of 0.09.
Table 4.1 contains all the results for concrete columns confined with carbon sheets. As
expected, the ratio increases with the confinement effectiveness. It also confirms that each

41
additional layer for a given section shape provides a significant increase in compressive
strength and for any constant number of confining layers, an increase of the corner radius has
positive consequences on the axial strength.
Table 4.1 Performance of Numerical Models
Specimen
Designation
Axial Stresses fexp./fnum Axial strain at ultimate
point
εexp/εnum
Experimental Numerical
Experimental
Numerical
fz,max fz,max εmax εmax
(MPa) (MPa)
% %
SC-1L3-0.7 29.2 29.0 1.01 0.38 0.35 1.09
SC-2L3-0.7 34.3 33.7 1.01 0.50 0.49 1.01
SC-3L3-0.7 41.2 40.5 1.01 0.60 0.62 0.97
SC-4L3-0.7 47.6 46.8 1.02 0.60 0.71 0.85
S5C5 43.9 46.8 0.94 1.02 1.58 0.65
S25C3 41.6 43.1 0.97 0.94 0.94 1.00
S25C4 50.9 47.5 1.07 1.35 1.25 1.08
S25C5 47.9 47.9 1.00 0.90 1.1 0.82
S38C3 47.5 45.5 1.04 1.08 1.13 0.96
C1 55.0 56.9 0.97 1.00 1.13 0.88
C2 68.0 69.4 0.98 1.25 0.93 1.34
Mean* 1.01 0.96
Standard deviation* 0.03 0.09
*Excluding the value of S5C5 as it was not confined properly during experiment.

42
4.2.2 Axial stress versus Axial Strain Response
Figures 4.1 to 4.11 show the numerically and experimentally obtained axial strains plotted
against average longitudinal strain of the concentrically loaded five square specimens, four
rectangular specimens and two circular specimens. In all graphs shown in the figures, the
axial stress was calculated by dividing the axial load by the concrete cross sections, assuming
that the composite wrapping has a negligible stiffness in the longitudinal direction.
4.2.2.1 Rectangular columns
Figures 4.1 to 4.4 show the comparison of axial stress versus axial strain response of
rectangular columns having 25mm corner radius and different confinement effectiveness. In
the initial stages of loading, up to a value close to the concrete f′c, the relationship follows a
curve typical of unconfined concrete specimens in compression. It is then followed by a
plastic zone in which maximum measured strains are much more important than for the
unconfined concrete.
In general, the initial portions of the numerical stress versus strain curves match very well
with the experimental ones, though a slight underestimation of axial stiffness is observed in
the initial curves for specimens SC-3L3-0.7 and SC-4L3-0.7. The axial stress versus axial
strain responses of the SC-1L3-0.7 and SC-2L3-0.7 specimens are in good agreement with
the experiment in both peak and post peak region.
It can be observed that the number of layers had little effect on the initial slope. However, as
the number of layers increased, the inflection point moved up to a higher stress level. The
slope of the second branch of the stress-strain curves increased with the number of CFRP
layers, while the first branch was generally not affected.

43
Figure 4.1 Numerical and experimental axial stress versus axial strain response for column SC-1L3-0.7
Figure 4.2 Numerical and experimental axial stress versus axial strain response for column SC-2L3-0.7
Axial Strain (%)
Axi
al S
tres
s (M
Pa)
Axi
al S
tres
s (M
Pa)
Axial Strain (%)
0
5
10
15
20
25
30
35
0 0.1 0.2 0.3 0.4
TEST
FEM
EXPERIMENT
0
5
10
15
20
25
30
35
40
0 0.1 0.2 0.3 0.4 0.5 0.6
TEST
FEM
EXPERIMENT

44
Figure 4.3 Numerical and experimental axial stress versus axial strain response for column SC-3L3-0.7
Figure 4.4 Numerical and experimental axial stress versus axial strain response for column SC-4L3-0.7
Axi
al S
tres
s (M
Pa)
Axi
al S
tres
s (M
Pa)
Axial Strain (%)
Axial Strain (%)
0
5
10
15
20
25
30
35
40
45
0 0.1 0.2 0.3 0.4 0.5 0.6 0.7
TEST
FEM
EXPERIMENT
0
10
20
30
40
50
60
0 0.2 0.4 0.6 0.8
TEST
FEM
EXPERIMENT
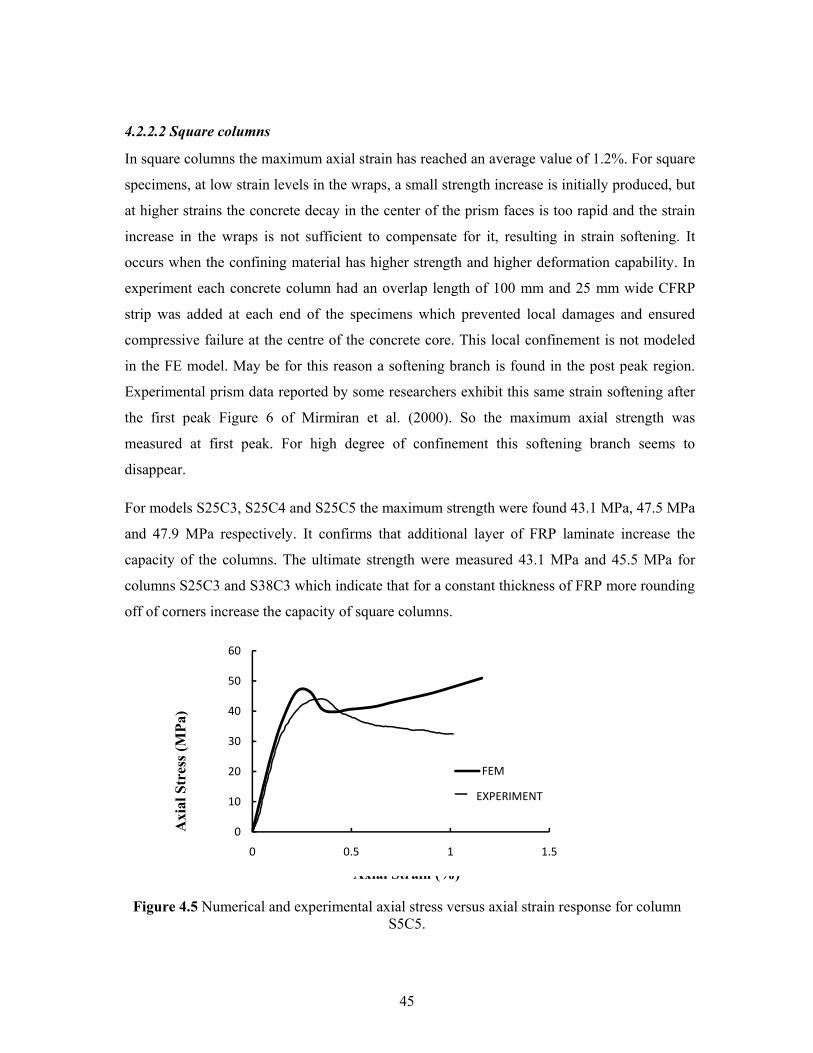
45
4.2.2.2 Square columns
In square columns the maximum axial strain has reached an average value of 1.2%. For square
specimens, at low strain levels in the wraps, a small strength increase is initially produced, but
at higher strains the concrete decay in the center of the prism faces is too rapid and the strain
increase in the wraps is not sufficient to compensate for it, resulting in strain softening. It
occurs when the confining material has higher strength and higher deformation capability. In
experiment each concrete column had an overlap length of 100 mm and 25 mm wide CFRP
strip was added at each end of the specimens which prevented local damages and ensured
compressive failure at the centre of the concrete core. This local confinement is not modeled
in the FE model. May be for this reason a softening branch is found in the post peak region.
Experimental prism data reported by some researchers exhibit this same strain softening after
the first peak Figure 6 of Mirmiran et al. (2000). So the maximum axial strength was
measured at first peak. For high degree of confinement this softening branch seems to
disappear.
For models S25C3, S25C4 and S25C5 the maximum strength were found 43.1 MPa, 47.5 MPa
and 47.9 MPa respectively. It confirms that additional layer of FRP laminate increase the
capacity of the columns. The ultimate strength were measured 43.1 MPa and 45.5 MPa for
columns S25C3 and S38C3 which indicate that for a constant thickness of FRP more rounding
off of corners increase the capacity of square columns.
Figure 4.5 Numerical and experimental axial stress versus axial strain response for column S5C5.
Axi
al S
tres
s (M
Pa)
Axial Strain (%)
0
10
20
30
40
50
60
0 0.5 1 1.5
FEM
TESTEXPERIMENT

46
Figure 4.6 Numerical and experimental axial stress versus axial strain response for column S25C3.
Figure 4.7 Numerical and experimental axial stress versus axial strain response for column S25C4
Axi
al S
tres
s (M
Pa)
Axial Strain (%)
Axi
al S
tres
s (M
Pa)
Axial Strain (%)
0
10
20
30
40
50
60
0 0.2 0.4 0.6 0.8 1 1.2
FEM
TESTEXPERIMENT
0
10
20
30
40
50
60
70
0 0.5 1 1.5
FEM
TESTEXPERIMENT

47
Figure 4.8 Numerical and experimental axial stress versus axial strain response for column S25C5
Figure 4.9 Numerical and experimental axial stress versus axial strain response for column S38C3
Axi
al S
tres
s (M
Pa)
Axial Strain (%)
Axial Strain (%)
Axi
al S
tres
s (M
Pa)
0
10
20
30
40
50
60
70
0 0.2 0.4 0.6 0.8 1 1.2
FEM
TESTEXPERIMENT
0
10
20
30
40
50
60
70
0 0.2 0.4 0.6 0.8 1 1.2 1.4
FEM
TESTEXPERIMENT

48
4.2.2.3 Circular columns
Carbon fibre-confined circular concrete columns exhibited strength, ductility, and energy
absorption capacity superior to that of unconfined concrete Figures 4.10 and 4.11 show the
axial stress plotted as a function of axial strain carbon fibre reinforced polymer encased
columns.
Figures 4.10 to 4.11 show that the curves are bilinear in nature with a small transition zone.
In the first linear zone, concrete primarily takes the axial load; the slope of the confined
concrete is the same as the slope for the unconfined concrete. The stress-strain curves show
that confinement with FRP tubes does not have much effect on the elastic modulus of the
concrete specimens. At stress levels near to ultimate stress of unconfined concrete, a
transition zone to the second portion of the bilinear curve starts. This region signified that
concrete had cracked, and the FRP tube started to show its full confining characteristics. This
phenomenon can be explained in terms of the composite action between the FRP tube and the
concrete core. At the earlier stage of loading, the Poisson’s ratio of the concrete is lower than
that of the composite tube, thus, the FRP tube has no confining effect on the concrete core.
As the longitudinal strain increases, the lateral expansion of unconfined concrete gradually
becomes greater than that of the FRP tube. A radial pressure develops at the FRP-concrete
interface; the concrete is stressed triaxially and the tube uniaxially. The intersection point
between the two linear branches on the stress-strain curve denotes the initial failure of the
confined concrete core.
The observed increase in axial stress over the unconfined specimen ranged from 51 to 137
percent for the concrete-filled carbon FRP tube. For the carbon FRP tube-confined concrete,
the increase in the ultimate axial strain ranged from 660 to 1100 percent. The relatively low
axial strain reported for Specimen C1 reflects both lower strain and thickness of the tubes.

49
Figure 4.10 Numerical and experimental axial stress versus axial strain response for column C1
Figure 4.11 Numerical and experimental axial stress versus axial strain response for column C2
Axi
al S
tres
s (M
Pa)
Axial Strain (%)
Axi
al S
tres
s (M
Pa)
Axial Strain (%)
0
10
20
30
40
50
60
0 0.2 0.4 0.6 0.8 1 1.2
FEM
TESTEXPERIMENT
0
10
20
30
40
50
60
70
80
0 0.2 0.4 0.6 0.8 1 1.2 1.4
FEM
TESTEXPERIMENT

50
4.3 Summary
The performance of finite element model in predicting the behavior of a variety of FRP
confined concrete columns under concentric loading in summarized as follows
The FE model developed in the study was observed to predict the experimental
capacity quite accurately.
In the post-peak region, a softening branch was achieved in square columns due to
high deformation capacity of FRP laminate but the model predicted the post-peak
response for both rectangular and circular columns very well.
The static, Riks solution strategy used in the finite element models made it possible
to trace the full behavior of confined columns without any numerical difficulties.
The interaction between the concrete surface and FRP surface is successfully modeled
using contact pair algorithm with perfect bond formulation.

51
CHAPTER 5
PARAMETRIC STUDY
5.1 General
Most of the building columns and bridge piers are made up of rectangular columns. These
columns are often in need of strengthening and retrofitting. The use of externally bonded FRP
composites for repair can be a cost-effective alternative for restoring or upgrading the
performance of existing concrete columns. However, majority of the CFRP confining
procedures and models were developed for circular columns and cannot be used in the case of
rectangular columns. The fibre-reinforced polymer (FRP)-jacketed rectangular concrete
prisms in axial compression reveals a number of differences with the circular counterparts
and a set of important new phenomena. For example, while an FRP jacket can lead to an
increase in compression capacity; this increase may be significantly less for rectangular
column than that associated with a circular geometry. As a second example, while the
performance of jacketed circular columns is a strong function of jacket thickness, the
rectangular counterpart is a strong function of geometry. Furthermore, jacketed circular
cross-sections lead to a hardening stress-strain response whereas rectangular specimens often
exhibit strain-softening after the peak strength (Rochette and Labossière, 2000).
The effective confined cross section of rectangular columns depends on the aspect ratio and
the diameter of the rounded corners, as well as the lateral confining pressure. Therefore to
extend the range of applications of CFRP wrapping in strengthening and to enhance the
limited data on rectangular columns retrofitted by FRP wrapping, a parametric analysis is
required using a validated analytical model. The results and observations presented in this
chapter are useful to practicing engineers who have to predict the enhanced compressive
strength of concrete columns retrofitted with externally bonded FRP wrap.
5.2 Design of Parametric Study
The finite element model generated in this research will be used to conduct a detailed
parametric study on the behavior of FRP wrapped concrete rectangular columns. The variable
and fixed geometric as well as material properties used in the parametric study with their
range of values are included in the following sections.

52
5.2.1 Variable Parameters
For designing the parametric study, the geometric properties of FRP-confined concrete
rectangular column that can significantly affect their behavior under uniaxial compression are
identified as potential variables. Among these, the aspect ratio (a/b) of column cross section,
corner sharpness factor (a/R) and thickness of FRP are identified as the most important
geometric variables. The geometric and material properties of the columns designed for
parametric study are included in Table 5.1. The definition of each parameter, along with its
selected range for this study, is presented in turn below.
5.2.1.1 Aspect ratio (a/b) of the column cross section
The level of concrete confinement is significantly affected by column geometry. Three cross
sections were considered in the analysis as shown in Figure 5.1: a square cross section with
dimensions 300 mm x 300 mm and two rectangular cross sections with dimensions 150 mm x
300 mm and 210 mm x 300 mm. The variation of side dimension is presented by introducing
a term aspect ratio (a/b, where a and b are, respectively, the shorter and longer sides of the
cross section). The cross-sectional aspect ratio for the selected columns varied from 0.5 to 1
with an intermediate value of 0.7.
Figure 5.1 Cross sections of rectangular and square columns used in the parametric study
5.2.1.2 Corner radius(R)
The failure behavior of FRP wrapped concrete columns can be greatly affected by the corner
radius of the column to be retrofitted. To evaluate these effects three different corner radii
i.e., R=10 mm, 25 mm and 50 mm were used for each a/b ratio selected in the parametric
study as shown in Figure 5.2. These values were selected on the basis of the most commonly
encountered radii in rehabilitation practices for reinforced concrete columns. The 10 mm
radius corresponds practically to the sharp edge whereas, the 25 mm and 50 mm are typical
150 mm 210 mm 300 mm
300m
m
R=50mm R=50mm R=50mm

53
of edge rounding that are encountered in rectangular columns to which FRP wrapping is
applied.
Figure 5.2 Variation of corner radius for square columns
5.2.1.3 Thickness of FRP wrap (tf)
The ultimate strength and the ductility of the CFRP confined concrete increase with
increasing number of confining layers. The no. of FRP laminate increases the thickness of
FRP wrap which in turn increases the confinement stiffness. The thickness of a single FRP
layer is assumed to be 0.5 mm. The thickness varied from 0.5mm, 1mm and 2mm which are
used practically. The effect of the selected layers of FRP wrap is studied for fixed values of
a/b and R.
5.2.2 Fixed Parameters
For all column specimens the longer dimension (b) was fixed at 300mm. The length of the
columns was also fixed at 1500 mm. Only the shorter dimension (a) was varied to obtain the
required aspect ratios. The compressive strength of concrete for these columns was fixed at
21 MPa (3 ksi) which is most common value for a deteriorated structure. The equations
proposed by Carriera and Chu (1985) were used to define the concrete stress-strain curves for
the finite element analyses of these columns. Both curves for response of concrete to uniaxial
loading in compression and tension are shown in figure 5.3 (a) and (b) respectively. The
material properties of FRP were also kept constant. Carbon fibre reinforced polymer wrap
with a tensile strength of 3.65 GPA (530 ksi) and tensile modulus of elasticity of 230 GPa
(33500 ksi) were used in current study. The ultimate tensile elongation for the wrap was
defined as 1.4% (Chaallal et al., 2003).
R=50mm R=10mm R=25mm
300mm 300mm 300mm
300m
m

54
Figure 5.3 Response of concrete to uniaxial loading in (a) compression and
(b) tension
5.3 Results and Discussion
This section presents the influence of each parameter on the behavior of FRP concrete
columns having various geometric properties in comparison to the concrete column in its
unconfined state which are not confined by FRP wrap. The specimens are named as PCX-
YTZ where X, Y and Z represent aspect ratio, thickness of FRP wrap in mm and corner radius
in mm respectively. All of the numerical models failed due to rupture of the FRP laminates at
(a)
(b)
0
5
10
15
20
25
0 1000 2000 3000 4000 5000 6000
Stre
ss, M
Pa
Strain , µε
0
0.5
1
1.5
2
2.5
3
0 0.0001 0.0002 0.0003 0.0004 0.0005Strain, ε
Stre
ss,M
Pa

55
corners. The output parameters that have been extracted from the analysis are: the axial
stress, f′cc, and average axial strain, εau. The average axial strain is calculated by dividing the
total displacement in the axial direction by the length of the column. The summary of the
results is shown in Table 5.2. The axial stress versus axial strain and the axial stress versus
transverse strain curves are then generated from the numerical analyses for each parametric
column. The effects of the selected geometric parameters on the enhancement of ultimate
load carrying capacity and ductility of the concrete columns are also investigated in this
study.

56
Table 5.1 Geometric properties of parametric columns
Column
Specimen
Short
dimension
Long
Dimension
Height
Corner
Radius
No. of
FRP
layer
Variables used in
parametric study
(a) (b) (H)
(R)
(a/b) tf
(mm) (mm) (mm) (mm) (mm)
PC1-0T50 300 300 1500 50 0 1 0
PC1-0.5T50 300 300 1500 50 1 1 0.5
PC1-1T50 300 300 1500 50 2 1 1
PC1-2T50 300 300 1500 50 4 1 2
PC0.7-0T50 210 300 1500 50 0 0.7 0
PC0.7-0.5T50 210 300 1500 50 1 0.7 0.5
PC0.7-1T50 210 300 1500 50 2 0.7 1
PC0.7-2T50 210 300 1500 50 4 0.7 2
PC0.5-0T50 150 300 1500 50 0 0.5 0
PC0.5-0.5T50 150 300 1500 50 1 0.5 0.5
PC0.5-1T50 150 300 1500 50 2 0.5 1
PC0.5-2T50 150 300 1500 50 4 0.5 2
PC1-1T10 300 300 1500 10 2 1 1
PC1-1T25 300 300 1500 10 2 1 1
PC0.5-2T10 150 150 1500 10 4 0.5 2
PC0.5-2T25 150 150 1500 10 4 0.5 2

57
Table 5.2 Results of parametric study
Column Specimen Maximum Axial Stress
Maximum Axial Strain
Maximum Transverse
Strain
Ductility Ratios
f′cc εau εtu
(MPa) (%) (%) Apost/Apeak Atot/Aep
PC1-0T50 20.9 0.28 0.11 - -
PC1-0.5T50 22.0 0.31 0.55 0.41 0.96
PC1-1T50 23.0 0.52 0.75 1.62 0.98
PC1-2T50 30.2 0.67 0.90 3.01 1.07
PC0.7-0T50 20.6 0.30 0.08 - -
PC0.7-0.5T50 21.9 0.42 0.47 0.98 0.92
PC0.7-1T50 23.4 0.55 0.69 1.00 0.96
PC0.7-2T50 31.4 0.70 0.77 3.47 1.13
PC0.5-0T50 20.4 0.24 0.05 - -
PC0.5-0.5T50 21.8 0.38 0.11 0.73 0.48
PC0.5-1T50 23.3 0.66 0.86 1.60 1.02
PC0.5-2T50 33.0 0.87 1.06 5.00 1.15
PC1-1T10 22.1 0.38 0.44 0.88 0.93
PC1-1T25 22.7 0.43 0.48 1.27 0.94
PC0.5-2T10 23.6 0.82 1.01 2.50 0.95
PC0.5-2T25 24.3 0.84 1.02 2.12 1.01

58
5.3.1 Effect of Aspect Ratio (a/b) of the Column Cross Section
Three aspect ratios were considered: a/b=0.5, a/b=0.70, and a/b=1.0 to evaluate the influence
of different cross sectional aspect ratios on gain in compressive strength. Table 5.3 along with
the Figures 5.4(a), (b) and (c) show the effect of the aspect ratios on the stress versus strain
response. The results are presented by organizing the parametric columns in three sets (Set I,
II and III-I as shown in Table 5.3 (a)). Each set of columns have a specific combination of
corner radius and thickness of the FRP wrap. Within each set the shorter dimension (a) is
varied only.
5.3.1.1 Axial stress versus strain response
As observed from Figures 5.4 (a), (b) and (c), a significant increase in ultimate compressive
strength is anticipated with the decrease in aspect ratio from 1 to 0.5. However, the effect of
aspect ratio has negligible effect on initial stiffness of the column prior to peak axial stress.
As the aspect ratio decreases the capacity increases as observed in the stress strain response
of all three sets of columns (Figure 5.4 (a), (b) and (c)). The stiffness of the columns also
increases with the decrease in the aspect ratio after reaching the peak. This is due to the fact
that after concrete crushing only confinement effect of FRP wrapping exists. The maximum
axial strain and maximum transverse strain is significantly affected by the aspect ratio. From
the Figure 5.4 it is observed that both the axial and transverse stain increase with the decrease
in aspect ratio for all the sets.

59
(R=50 mm and tf = 0.5 mm, L/a = variable)
(R=50 mm and tf = 1 mm, L/a = variable)
Figure 5.4 Effect of aspect ratio on the strain-strain responses of FRP wrapped columns (continued)
Transverse Strain (%)
(b) Set II columns
Transverse Strain (%)
(a) Set I columns
0
5
10
15
20
25
‐0.6 ‐0.4 ‐0.2 0 0.2 0.4 0.6
Axi
al S
tres
s (M
Pa)
Axial Strain (%)
a/b=1
a/b=0.7
a/b=0.5
0
5
10
15
20
25
30
‐1 ‐0.8 ‐0.6 ‐0.4 ‐0.2 0 0.2 0.4 0.6 0.8
Axi
al S
tres
s (M
Pa)
Axial Strain (%)
a/b=1
a/b=0.7
a/b=0.5

60
(R=50 mm and tf = 2 mm, L/a = variable)
Figure 5.4 Effect of aspect ratio on the strain-strain responses of FRP wrapped columns
Transverse Strain (%)
(c) Set III-I columns
0
5
10
15
20
25
30
35
‐1.5 ‐1 ‐0.5 0 0.5 1
Axi
al S
tres
s (M
Pa)
Axial Strain (%)
a/b = 1
a/b=0.7
a/b=0.5
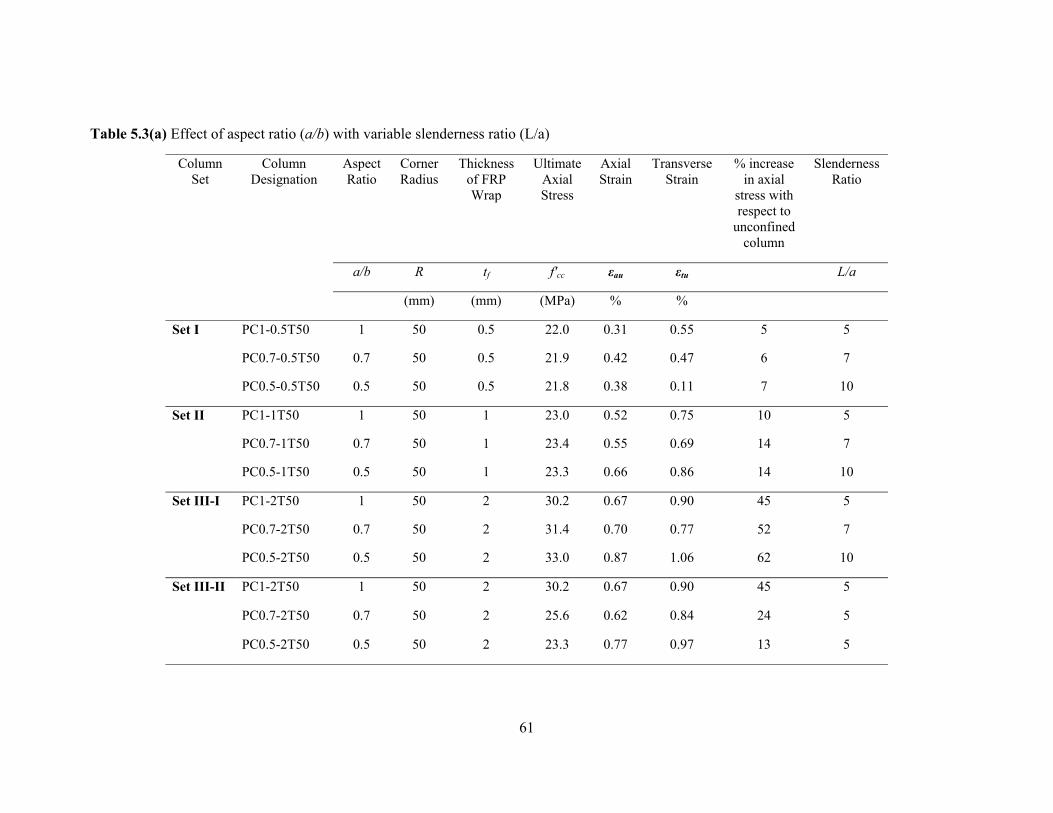
61
Table 5.3(a) Effect of aspect ratio (a/b) with variable slenderness ratio (L/a)
Column Set
Column Designation
Aspect Ratio
Corner Radius
Thickness of FRP Wrap
Ultimate Axial Stress
Axial Strain
Transverse Strain
% increase in axial
stress with respect to
unconfined column
Slenderness Ratio
a/b R tf f′cc εau εtu L/a
(mm) (mm) (MPa) % %
Set I PC1-0.5T50 1 50 0.5 22.0 0.31 0.55 5 5
PC0.7-0.5T50 0.7 50 0.5 21.9 0.42 0.47 6 7
PC0.5-0.5T50 0.5 50 0.5 21.8 0.38 0.11 7 10
Set II PC1-1T50 1 50 1 23.0 0.52 0.75 10 5
PC0.7-1T50 0.7 50 1 23.4 0.55 0.69 14 7
PC0.5-1T50 0.5 50 1 23.3 0.66 0.86 14 10
Set III-I
PC1-2T50 1 50 2 30.2 0.67 0.90 45 5
PC0.7-2T50 0.7 50 2 31.4 0.70 0.77 52 7
PC0.5-2T50 0.5 50 2 33.0 0.87 1.06 62 10
Set III-II PC1-2T50 1 50 2 30.2 0.67 0.90 45 5
PC0.7-2T50 0.7 50 2 25.6 0.62 0.84 24 5
PC0.5-2T50 0.5 50 2 23.3 0.77 0.97 13 5

62
5.3.1.2 Effect of aspect ratio on ultimate capacity
The specimens with a/b=0.50 confirmed in all cases the highest compressive strength as
shown in Figure 5.5. Small variation is observed between the maximum strength of the
square columns (a/b=1) and that of the corresponding rectangular columns with a/b=0.70.
For column set III-I, the columns having an aspect ratio of a/b= 0.5 showed considerable
increase in strength as compared to that with a/b=1. For column set I, there is no significant
effect of aspect ratio on gain in compressive strength. Figure 5.5 clearly explains that the
maximum effect of aspect ratio is achieved for column Set III-I having 4 layers of
confinement. An increase of 52%, 62% and 45% is found for the columns having a/b=0.7,
a/b=0.5 and a/b=1 respectively. The results show that the ultimate strength gain for the
columns with an aspect ratio of a/b=0.5 ranges between 7% and 62%. It can be seen that
rectangular short columns achieved higher ultimate strength than square columns.
Figure 5.5 Effect of aspect ratio (a/b)
But usually decrease in the aspect ratio should result in a decrease in the confinement.
However, the unexpected behavior with a/b = 0.5 occurred due the fact that the slenderness
ratio (L/a) of these specimens was variable. For a/b=0.5, slenderness ratio (L/a) was 10
which was higher than square columns having slenderness ratio 5.
Therefore, to identify the effect of aspect ratio another set (Set III-II) of analysis is conducted
with columns having a fixed slenderness ratio (L/a=5) with cross sections 300 x 450 mm and
300 x 600 mm. The details of the results and axial stress vs. axial strain responses of this set
R=50mm
0
0.2
0.4
0.6
0.8
1
1.2
1.4
1.6
1.8
0 0.2 0.4 0.6 0.8 1 1.2
f'cc/
f'co
a/b ratio
tf=0.5
tf=1
tf=2

63
of columns are shown in Table 5.3(b) and Figure 5.6 respectively. The results shows that for
column set III-II, the columns having an aspect ratio of a/b= 0.5 showed considerable
decrease in strength as compared to that with a/b=1 for a fixed slenderness ratio.
Table 5.3(b) Effect of aspect ratio (a/b) with fixed slenderness ratio
Column Set
Column Designation
Aspect Ratio
Corner Radius
Thickness of FRP Wrap
Ultimate Axial Stress
Axial Strain
Transverse Strain
% increase in axial stress with
respect to unconfined column
Slenderness Ratio
a/b R tf f′cc εau εtu L/a
(mm) (mm) (MPa) % %
Set III-II PC1-2T50 1 50 2 30.2 0.67 0.90 45 5
PC0.7-2T50 0.7 50 2 25.6 0.62 0.84 24 5
PC0.5-2T50 0.5 50 2 23.3 0.77 0.97 13 5
(R=50 mm and tf = 2 mm, L/a = 5)
Figure 5.6 Effect of aspect ratio on the strain-strain responses of FRP wrapped columns with fixed slenderness ratio
Axi
al S
tres
s (M
Pa)
Axial Strain (%) Transverse Strain (%)
Set III-II columns
0
5
10
15
20
25
30
35
‐1.5 ‐1 ‐0.5 0 0.5 1
a/b=1
a/b=0.67
a/b=0.5
a/b=0.7

64
5.3.2 Effect of Corner Radius (R)
Figure 5.6 (a) and (b) show the effect of corner radius (R) on the stress strain curve of the
confined columns. The effect of corner radius is studied for three different corner radii (10
mm, 25 mm and 50 mm). Again for each corner radius the thickness of FRP layer is varied
between 1 mm and 2 mm. Two sets (Set IV and Set V) of analysis have been conducted. The
geometric properties and the results of the analyses are presented in Table 5.4 and Figure 5.6.
5.3.2.1 Axial stress versus strain response
Figure 5.7(a) illustrates the stress-strain curve obtained for three concrete square models
confined with 2 layers of FRP laminates compared to an unconfined column. Each square
column had a different corner radius. The right portion of the curve shows the axial stress vs.
axial strain response whether the left side represents the response of transverse strain with the
axial stress. The Figure clearly shows that the confinement effectiveness increases gradually
with the rounding of the corners. In addition, the curves illustrate the three types of behavior
in the post-peak region of the load deflection response. For a corner radius R = 10 mm,
softening behavior is characterized by a rapid decrease of the curve after it reaches a
maximum. For R = 25 mm, less softening behavior is obtained. Finally, a stiffening behavior
is observed for sections with a small side-to-radius ratio, including the one with R = 50 mm.
The rectangular columns having aspect ratio 0.5 shown in Figure 5.7(b) also confirmed
similar behavior for different corner radius.
It can be seen that the post-peak drop of the curve is always followed by an increase in
stiffness. As the confinement effectiveness increases with the most important rounding of the
corner, the curves show that it has an actual effect only on the strains and ductility
characteristics of the sections.

65
(a/b = 1 and tf = 1 mm)
(a/b = 0.5 and tf = 2 mm)
Figure 5.7 Effect of corner radius on confinement effectiveness
Axial Strain (%) A
xial
Str
ess (
Mpa
) Transverse Strain (%)
Transverse Strain (%)
Axi
al S
tres
s (M
pa)
(a) Set IV columns
(b) Set V columns
0
5
10
15
20
25
‐1 ‐0.8 ‐0.6 ‐0.4 ‐0.2 0 0.2 0.4 0.6
R=50 mmR=10 mmR=25mmunconfined
0
5
10
15
20
25
30
35
‐1.5 ‐1 ‐0.5 0 0.5 1 1.5Axial Strain (%)
UNCONFINEDR= 50 mmR=25 mmR=10mm

66
5.3.2.2 Effect of corner radius (R) on ultimate capacity
The ultimate capacity of the columns of Set IV and Set V are shown in Table 5.4 along with
the percent increase in the capacity with respect to the unconfined column. For an increase in
corner radius (R) from 10 mm to 50 mm, the increase in ultimate capacity ranges from 6% to
62%. This increase in load carrying capacity is significant in rehabilitation practice. It is seen
that for column Set IV, rounding off the corner from 10 mm to 25 mm and 50 mm can
increase the capacity 3% and 8% respectively. However, for column Set V, the increase in
capacity is found 3% and 46% for rounding off the corner radius from 10 mm to 25 mm and
50 mm respectively. So it can be said that the corner radius plays a significant role in gaining
strength of the FRP confined columns especially for columns with lower aspect ratio and
higher thickness of the FRP wrap.
Table 5.4 Effect of corner radius (R)
Column Set
Column Designation
Aspect Ratio
Corner Radius
Thickness of FRP Wrap
Ultimate Axial Stress
Axial Strain
Transverse Strain
% increase in axial stress with respect to unconfined column
a/b R tf f′cc εau εtu
(mm) (mm) (MPa) % %
Set IV PC1-1T10 1 10 1 22.1 0.38 0.44 6
PC1-1T25 1 25 1 22.7 0.43 0.48 9
PC1-1T50 1 50 1 23.0 0.52 0.75 14
Set V PC0.5-2T10 0.5 10 2 23.6 0.82 1.01 16
PC0.5-2T25 0.5 25 2 24.3 0.84 1.02 19
PC0.5-2T50 0.5 50 2 33.0 0.87 1.06 62

67
5.3.3 Effect of Thickness of FRP Wrap (tf)
The effect of the thickness of the FRP wrap on the behavior of the column models is shown
in Figure 5.8 (a) to (c) presenting the axial stress-axial strain responses and axial stress-
transverse strain responses. Three thicknesses were considered: tf =0.5 mm, tf = 1mm and tf
=2 mm to evaluate the influence of thickness on gain in compressive strength. The results are
presented by organizing the parametric columns in three sets (Set VI, VII and VIII as shown
in Table 5.5). Each set of columns have a specific combination of corner radius and aspect
ratio. Within each set the thickness of FRP is varied only.
5.3.3.1 Axial stress versus strain response
The Figure 5.8 gives the average axial stress versus the axial strain responses and axial stress
versus the transverse strain responses for the specimens with zero, one, two, three, and four
layers. It can be observed that the thickness of layers had little effect on the initial slope for
all curves. However, as the thickness increased, the inflection point moved up to a higher
stress level. The slope of the second branch of the stress-strain curves increased with the
number of CFRP layers, while the first branch was generally not affected. This behavior was
also observed for circular columns (Mirmiran and Shahawy, 1997; Picher et al. 1996 and
Nanni and Bradford, 1995). The Figure clearly shows that confinement with CFRP can
significantly enhance the performance of concrete, both its strength and its ductility, under
axial load.

Figure 5
‐1
‐1
5.8 Effect of
‐0.8
‐0.8
Transve
FRP thickne
‐0.6 ‐0.
‐0.6 ‐
Transv
erse Strain (%
(a/b = 1 an
(a/b = 0.7 a
ess on the cocolumns
.4 ‐0.2
0.4 ‐0.2
verse Strain
(b)
(a
%)
Axi
al S
tres
s (M
pa)
nd R= 50 m
and R= 50 m
ompressive bs (continued
0
5
10
15
20
25
30
35
0 0
‐5
0
5
10
15
20
25
30
35
0
Axi
al S
tres
s (M
pa)
n %
) Set VII col
a) Set VI co
mm)
mm)
behavior of Fd)
.2 0.4
0.2
Axial Stra
lumns
olumns
Axial Strain
FRP confine
0.6 0
unconfinedtf=1tf =0.5tf=2
0.4 0
ain %
unconfitf=0.5tf =1tf=2
n (%)
ed rectangula
0.8
0.6 0.8
fined
ar

69
(a/b = 0.5 and R= 50 mm)
Figure 5.8 Effect of FRP thickness on the compressive behavior of FRP confined rectangular columns
Figure 5.9 Effect of layer thickness on confinement effectiveness.
(b) Set VIII columns
0
5
10
15
20
25
30
35
‐1.5 ‐1 ‐0.5 0 0.5 1
Axi
al S
tres
s (M
Pa)
Transverse Strain % Axial Strain %
unconfinedtf=0.5tf =1tf=2
0
0.2
0.4
0.6
0.8
1
1.2
1.4
1.6
1.8
0 0.5 1 1.5 2 2.5
Nor
mal
ized
axi
al st
ress
(f
'cc/
f'co)
Thickness of CFRP (mm)
a/b=1
a/b=.7
a/b=0.5
R= 50 mm

70
5.3.3.2 Effect of FRP thickness (tf) on ultimate capacity
Figure 5.9 shows that the thickness of FRP wrap has significant effect on ultimate capacity of
confined columns. The ultimate capacity of the columns of Set VI, Set VII and Set VIII are
shown in Table 5.5 along with the percent increase in the capacity with respect to the
unconfined column. The increase in ultimate capacity of confined columns ranges from 5% to
62%. However, the percent increase in capacity is not proportional to the jacket thickness.
For example, for Set VII, the increase in compressive strength when the number of layers
increased from two to four is 38%, while the increase in compressive strength when the
number of layers increased from one to two is 8%. For Set VI consisting square columns, the
increase in compressive strength when the number of layers increased from two to four is
35%, while the increase in compressive strength when the number of layers increased from
one to two is 5%. An increase of 48% in compressive strength is found when the number of
layers increased from 2 to four for Set VIII consisting rectangular columns having aspect
ratio 0.5.
Table 5.5 Effect of the FRP thickness (tf)
Column Set
Column Designation
Aspect Ratio
Corner Radius
Thickness of FRP Wrap
Ultimate Axial Stress
Axial Strain
Transverse Strain
% increase in axial stress with respect to unconfined column
a/b R tf f′cc εau εtu
(mm) (mm) (MPa) % %
Set VI PC1-0.5T50 1 50 0.5 22.0 0.31 0.55 5
PC1-1T50 1 50 1 23.0 0.52 0.75 10
PC1-2T50 1 50 2 30.2 0.67 0.90 45
Set VII PC0.7-0.5T50 0.7 50 0.5 21.9 0.42 0.47 6
PC0.7-1T50 0.7 50 1 23.4 0.55 0.69 14
PC0.7-2T50 0.7 50 2 31.4 0.70 0.77 52
Set VIII PC0.5-0.5T50 0.5 50 0.5 21.8 0.38 0.11 7
PC0.5-1T50 0.5 50 1 23.3 0.66 0.86 14
PC0.5-2T50 0.5 50 2 33.0 0.87 1.06 62

71
5.3.4 Proposed Equation
Simple polynomial equations are developed using a statistical software SPSS v.17 to predict
the confined concrete strength and ultimate axial strain of FRP-confined concrete rectangular
columns having different aspect ratios, corner radius and thickness of FRP laminates. The
trend line of the numerical data can be closely approximated using the following equations:
13.36 5.65 0.002 1.15 (5.1)
3292 2500 0.10 1625 (5.2)
Where, tf is the thickness of FRP layers in mm, R is the corner radius in mm and (a/b) is the
aspect ratio of rectangular columns. The numerical results of peak compressive strength and
ultimate axial strain and the predicted compressive strength and strain are presented in Table
5.6.

72
Table 5.6 Comparison between numerical values and predicted values by equation
Column
designation f′cc
Predicted
ultimate axial
stress from
Equation 5.1
Error (∆ %) ε'cc
Predicted
ultimate axial
strain from
Equation 5.2
Error (∆ %)
(MPa) (MPa)
(µε) (µε)
PC1-0.5T50 22.0 22.3 1.3 3100 3167 2.1
PC1-1T50 23.0 25.2 8.7 5200 4417 17.7
PC1-2T50 30.2 30.8 1.9 6700 6917 3.1
PC0.7-0.5T50 21.9 21.6 1.4 4200 4235 0.8
PC0.7-1T50 23.4 24.4 4.1 5500 5485 0.3
PC0.7-2T50 31.4 30.1 4.3 7000 7985 12.3
PC0.5-0.5T50 21.8 21.3 2.3 3800 4589 17.2
PC0.5-1T50 23.3 24.2 3.7 6600 5839 13.0
PC0.5-2T50 33.0 29.8 10.7 8700 8339 4.3
PC1-1T10 22.1 20.4 8.3 3800 4177 9.0
PC1-1T25 22.7 21.4 6.1 4300 4230 1.7
PC0.5-2T10 23.6 25.0 5.6 8200 8099 1.2
PC0.5-2T25 24.3 26.1 6.9 8400 8151 3.0
Figures 5.10 and 5.11 are the plots of the predicted values vs. numerical values of peak axial
stress and ultimate axial strain. The trend line of this figure shows a very good correlation
between the predicted and numerical values.

73
Figure 5.10 Predicted values vs. numerical values of ultimate axial stress
Figure 5.11 Predicted values vs. numerical values of ultimate axial strain
y = 0.8278x + 4.257R² = 0.8446
15
20
25
30
35
15 20 25 30 35
Pred
icte
d ax
ial s
tres
s by
Equ
atio
n (M
Pa)
Axial stress measured from numerical model (MPa)
y = 0.928x + 421.9R² = 0.928
0
1000
2000
3000
4000
5000
6000
7000
8000
9000
0 2000 4000 6000 8000 10000
Pred
icte
d ax
ial s
trai
n fr
om E
quat
ion
(µε)
Axial strain measured from numerical model (µε)

5.3.5 Eva
Ductility
strain. Th
element
areas und
before th
differenc
material.
as follow
Figure
A
pr
re
A
st
an
th
ad
el
aluation of D
y can be cha
his surface p
under the ap
der the stress
he initial str
ce of behavi
These two r
ws:
e 5.12 Area u
Apost/Apeak, wh
rovides info
eached.
Atot/Aep, wher
tress-strain c
nd the plasti
he shaded ar
dding the s
lement show
Ductility
aracterized b
provides info
pplied loadi
s-strain curv
ress peak to
ior between
ratios are ca
used to calcu
here parame
rmation on t
re paramete
curve and th
ic plateau. I
reas (Apost an
haded and
ws an almost
by the area
ormation ab
ing. Two fo
ve, are presen
o the area a
the actual
lculated usin
ulate ductility
eters Apost an
the strain res
ers Atot and
he total area
n Figure 5.1
nd Apeak) an
gray areas.
elastic-perfe
under the c
out strain en
ormulations,
nted. The fir
after this po
material an
ng areas illu
y ratios.( Ro
nd Apeak are d
serve still av
Aep are, res
bounded by
12, the first
nd the secon
When this
fectly plastic
curve of the
nergy accum
based on d
rst compares
oint; the oth
nd that of an
strated in Fi
ochette, P. an
defined in th
vailable after
spectively, th
y a slope of
parameter c
nd parameter
ratio is clo
behavior.
axial stress
mulated in th
ifferent ratio
s the area be
her ratio is
n elastic-per
gure 5.12 an
nd Labossie
he Figure 5.
r the initial p
he area und
f constant el
corresponds
r is the tota
ose to 1.0,
s versus axi
he structure o
os of specif
low the curv
based on th
rfectly plast
nd are define
`re, P.2000)
12. This rati
peak has bee
der the actu
astic stiffnes
to the sum o
l obtained b
the structur
al
or
fic
ve
he
tic
ed
io
en
al
ss
of
by
ral

75
For heavily confined specimens, it is difficult to identify the value of the peak stress level
shown in Figure 5.12. The various portions of the stress-strain curve are thus determined as
follows. The longitudinal strain at failure of an unconfined specimen is first identified; its
value usually corresponds to the strain level in the concrete when the axial stress reaches f′c.
The value of fpeak for a confined specimen is then defined as that reached when the strain εco
is attained. The value of fpeak delimits the pre peak and post peak surfaces under the stress-
strain curve.
For all of the confined column models, the values of the two ratios defined above are given in
the right-hand side of Table 5.2. The value of Apost/Apeak is particularly useful to identify the
specimens that reached the most important axial deformations, even in the case when plastic
deformations continued to increase at a stress level lower than f′c.
The ratio, Atot/Aep, allows identification of the specimens exhibiting a behavior similar to that
of a strain hardening material. Only the highly confined specimens present a value above 1.0
for this ratio. Considering the definition of ductility, which assumes that plastic deformations
must occur without any substantial loss of strength, this ratio should be more appropriate to
qualify the ductility of the specimens with square or rectangular sections confined with
composite materials. The specimens with a value of Atot/Aep of 1.0, or higher, can be
considered ductile. Although the rectangular specimens with corners rounded to 25 mm with
four layers of CFRP wrapping showed improved ductility properties, the radius has to be
increased to 50 mm for 2 layers of CFRP wrapping for same cross section. This clearly
indicates that the stiffness of the confining material is of major importance in improving the
ductility of the structural element.
For confined columns to achieve improved behavior under axial compression, it is suggested
that the confinement characteristics should be selected in such a way that the ratio Atot/Aep is
always greater than 1.0. In addition, the ratio Apost/Apeak should also exceed a value of
Apost/Apeak >3.0 (Rochette, P. and Labossie`re, P., 2000). If the same rule is applied to the
carbon-wrapped rectangular and square columns modeled here, it would appear that only
configurations with corners rounded to 50 mm within at least four plies having thickness
2mm provide satisfy the ductility requirements.

76
5.4 Summary
A comprehensive parametric analysis was performed to study the behavior of FRP confined
concrete columns subjected to axial compression. Three geometric parameters were varied
and their influences were demonstrated with respect to the ultimate axial stress and over all
column stress-strain responses. The important findings of the study presented in this chapter
are summarized below.
The parameters controlling the geometric confinement efficiency are the cross-section
aspect ratio (a/b), the corner radius (R), and the thickness of the FRP wrap (tf).
The confinement provided by the CFRP improves both the load-carrying capacity and
the ductility of the rectangular columns.
The strength of the confined rectangular columns increases with the decrease in the
aspect ratio or the increase in the rectangularity of the cross section. On the other hand
considering only enhancement of load carrying capability, the capacity of confined
rectangular columns increases with the decrease in rectangularity. So, further study is
required with a wide range of aspect ratio to take any concrete decision about effect of
aspect ratio.
The thickness of FRP wrap has significant effect on ultimate capacity of confined
columns. The increase in ultimate capacity of confined columns ranges from 5% to
62%. The maximum increase in axial strength is found 62% for confined column
having aspect ratio 0.5 and 2 mm of FRP wrapping.
The axial capacity of confined concrete increases with the increases in corner radius
of the rectangular columns. For an increase in corner radius (R) from 10 mm to 50
mm, the enhancement in ultimate capacity can be achieved 6% to 62%.

77
CHAPTER 6
CONCLUSIONS AND RECOMMENDATIONS
6.1 General
Nonlinear 3D finite element models have been developed using ABAQUS finite element
software to investigate the compressive behavior of FRP confined concrete rectangular
columns. A static, Riks solution strategy was implemented in the numerical model to trace a
stable post peak response in the load-deformation curve. The concrete material in the
confined column was modeled using the damage plasticity model available in ABAQUS. The
FRP-concrete interface was simulated using two contact pair algorithms: perfect bond model
and cohesion model. To investigate the performance of this FEM model, simulations were
conducted for FRP confined concrete column test, reported in the literature. The confined
rectangular columns with normal strength concrete were varied in cross-sectional size from
152 mm x 152 mm to 108 mm x 165 mm, including a variety of confinement stiffness and
corner radius. The loading condition was limited to only concentric loading. The model was
found able to predict the peak load and post-peak behavior quite accurately. A parametric study was conducted using the numerical model to investigate the effect of a
full range of parameters on concentrically loaded FRP confined concrete column. The
parameters that were varied include the aspect ratio (a/b), corner radius (R) and thickness of
FRP wrap (tf). The cross sections were selected 150 mm x 300 mm, 210 mm x 300 mm and
300 mm x 300 mm. The length was selected 1500 mm. The effects of the selected parameters
on the behavior of FRP confined concrete columns were studied with respect to axial stress
versus strain curve. An equation on the basis of this model was proposed to identify the peak
axial stress. The conclusions of the parametric study and the performance of the finite
element model are listed below.
6.2 Conclusions
6.2.1 Performance of the Finite Element Model
In general the finite element models for FRP confined concrete columns developed in this
study were able to simulate the full behavioral histories of a variety of confined rectangular
and circular columns with a very good accuracy. The interaction between FRP-concrete
interfaces was successfully modeled using contact pair algorithm with perfect bond

78
interaction at the FRP concrete interfaces. The numerical model also provided good
representations of ultimate axial stress and ultimate axial strain. The average experimental-to-
numerical ratio of the ultimate axial stress was obtained 1.01 with a standard deviation of
0.03. The numerically predicted ultimate axial strains are found to be higher compared to the
experimental values with an average experimental-to-numerical ratio of 0.96 with a standard
deviation of 0.09. These values demonstrate a very good correlation between the
experimental and numerical results.
6.2.2 Parametric Study
The parametric study was conducted using the validated finite element to investigate the
effects of the aspect ratio, corner radius and the thickness of the FRP wraps on rectangular
concrete columns. The following conclusions can be drawn from the parametric study.
6.2.2.1 Effect of aspect ratio (a/b)
The aspect ratio of the cross section had a significant influence on the increase in
compressive strength. The aspect ratio was varied from 0.5 to 1 in this study. It was found
that the confined-to-unconfined concrete strength ratio changes considerably with the
variation of the aspect ratio in the range of 0.5 to 1. The gain in confined compressive
strength ranges from 5% to 62%. The results show that decrease in aspect ratio causes a
reduction in the ultimate capacity for a fixed slenderness ratio.
6.2.2.2 Effect of corner radius (R)
The corner radius of rectangular columns influences significantly the strength and the
ductility of the columns. Rounding off the corners from 10 mm to 25 mm and 50 mm can
significantly increase the axial stress. The gain in confined compressive strength of column
due to the increase in the corner radius enhances the ultimate capacity from 6% to 62% with
respect to unconfined column. It should be noted that increasing the corner radius is not
always feasible due to the existence of reinforcing steel bars at the corners of rectangular
columns. Therefore, a corner radius of 25.4 mm (1 in.) is suitable in practical cases to ensure
an effective confinement.
6.2.2.3 Effect of FRP thickness (tf)
It is evident that in all cases the presence of external CFRP jackets increased the mechanical
properties of concrete columns in different amount according to the number of composite
layers. Increasing the amount of CFRP sheets can significantly increase the compressive

79
strength of the confined column. But it is not proportional to the jacket thickness. For square
columns, an increase in compressive strength was found 5% and 35% when the thickness
increased from 0.5 mm to 1 mm and 1 mm to 2 mm respectively. On the other hand for
rectangular columns having aspect ratio 0.5 the increase in compressive strength was found
7% and 48% for increasing the thickness from 0.5 mm to 1 mm and 1 mm to 2 mm
respectively.
6.3 Recommendations for Future Research
In this study the finite element model developed herein was verified for concentric loading
only. However, eccentric loading may cause buckling or bending in a short column.
Therefore, in future research eccentric loading should be incorporated in the finite element
model.
This study only considers normal strength concrete. A limited number of tests have been
performed to date on high strength concrete. To include the effect of high strength concrete
on confined concrete stress large-scale experimental investigations are required. Also, the
effect of lateral reinforcement is not included in this study
The concrete columns were assumed to be in its original state before applying FRP
confinement. But in real case, damages are present. Therefore, in future research the
deteriorated state of the concrete columns should be integrated in the numerical model.
The aspect ratios considered in this study were 0.5, 0.7 and 1. For better understanding the
effect of aspect ratios, more research should be carried out including a wide range of aspect
ratios, dimension effect and the effect of shape factor. Further work is required to expand the
current work and integrate it with the effects of the FRP jacket stiffness on the strength and
ductility of the FRP confined concrete columns.

80
REFERENCES
Ahmad, S. H.; Khaloo, A. R. and Irshaid, A.(1991).“Behavior of concrete spirally confined
by fibreglass filaments.” Magazine of Concrete Research, 43(156), 143-148.
American Concrete Institute (ACI). (2002). “Guide for the design and construction of
externally bonded FRP reinforcement.” ACI 440.2R-02, Farmington Hills, Mich.
Arduini, M. and Nanni, A. (1997). “Parametric study of beams with externally bonded FRP
reinforcement.” ACI Structural Journal, 94(5), 493-501.
Benmokrane, B. and Rahman, H. (1998). “Durability Of Fiber-Reinforced Polymer (FRP)
composite for construction”, Proceedings of the First International Conference on Durability
of Composites for Construction, Sherbrooke, Quebec, Canada, Aug. 5-7, 692 .
Benzaid, R., Chikh, N. E. and Mesbah, H. (2008).” Behaviour of square concrete columns
confined with GFRP composite wrap.”Journal of Civil Engineering and Management, 14(2),
115-120.
Benzoni, G., Ohtaki, T. and Priestley M.J.N. (1996). “Seismic performance of a full scale
bridge column as built and as repaired’’, Structural Systems Research Project, Report No.
SSRP-96/07 University of California, San Diego.
Bonacci, J. F. and Maalej, M. (2000). “Externally bonded fiber-reinforced polymer for
rehabilitation of corrosion damaged concrete beams.” ACI Structural Journal, 97(5), 703-
711.
Bousias, S.N., Triantafillou, T.C., Fardis, M.N., Spathis, L. and O’Regan, B.A. (2004).
“Fiber-reinforced polymer retrofitting of rectangular reinforced concrete columns with or
without corrosion”, ACI Structural Journal, 101(4), 512-520.
Brena, S.F., Bramblett, R.M., Wood, S.L., and Kreger, M.E. (2003) “Increasing flexural
capacity of reinforced concrete beams using carbon fiber-reinforced polymers composites”,
ACI Structural Journal, 100(1), 36-46.
Carriera, D. J. and Chu, K.M. (1985). “Stress-strain relationship for plain concrete in
compression.” ACI Structural Journal, 82(6), 797-804.

81
Chaallal, O., Hassan, M. and Shahawy, M. (2003). “Confinement model for axially loaded
short rectangular columns strengthened with fiber-reinforced polymer wrapping.”ACI
Structural Journal, 100( 2).
Choi, H.T, West, J.S., and Soudki, A.K. (2008) “Analysis of the flexural behavior of partially
bonded frp strengthened concrete beams”, Journal of Composites for Construction, ACSE,
12(4), 375-386.
CSA-S806-02,(2002). “Design and construction of building components with fibre-reinforced
polymers,” Canadian Standard Association, Rexdale, Toronto, ON, Canada.
Cusson, D. and Paultre, P. (1995). “Stress-strain model for confined high-strength concrete”.
ASCE Journal of Structural Engineering, 121(3), 468-477.
De Lorenzis, L. and Tepfers, R. (2003). “ A comparative study of models on confinement of
concrete cylinders with fiber-reinforced polymer composites.” ASCE Journal of Composites
for Construction, 7(3), 219-237.
Demers, M.; Hebert, D., Labossière, P. and Neale, K. W.(1995). “The strengthening of
structural concrete with an aramid woven fiber/epoxy resin composite,” Proceedings of
Advanced Composite Materials in Bridges and Structures II, Montreal, Quebec, Canada, 435-
442.
Ehsani, M.R., Saadatmanesh, H. and Al-Saody. (1997). “A shear behaviour of URM
retrofitted with FRP overlays’’, Journal of Composites for Construction ASCE, 17-25.
El-Badry, M.(1996). “Advanced composite materials in bridges and structures”. Proceedings
of the Second International CSCE Conference, Montreal, Quebec, Canada, Aug. 11-14, 1996,
1027 pp.
Fardis, M. N. and Khalili, H. H.(1981). “Concrete encased in fiberglass- reinforced plastic,”
ACI journal, Proceedings.78(6), 440-446.
FIB,(2001).“Externally bonded FRP reinforcement for RC structures,” Bulletin No. 14, Task
Group 9.3, Fédération Internationale du Béton.
Fujisaki, T., Hosotani, M., Ohno, S. and Mutsuyoshi, H. (1997). “JCI state-of-the- art on
retrofitting”, Proceedings of the Third Conference on Non-Metallic (FRP) Reinforcement for
Concrete Structures 1, Japan Concrete Institute, 613-620.

82
Fukuyama, H., Suzuki, H. and Nakamura, H. (1999). “Seismic retrofit of reinforced concrete
columns by fiber sheet wrapping without removal of finishing mortar and side wall concrete”,
Fiber Reinforced Polymer Reinforcement for Reinforced Concrete Structures, ACI Report No
SP-188, Detroit, Michigan. 205-216.
Ghobarah, A. and Said, A. (2001). “Seismic rehabilitation of beam-column joints using FRP
laminates”, Journal of Earthquake Engineering, 5(1), 113-129.
Hamad, B.S., Soudki, K.A., Harajli, M.A and Rteil, A. (2004).“Experimental and analytical
evaluation of bond strength of reinforcement in fiber-reinforced polymer-wrapped high-
strength concrete beams.” ACI Structural Journal, 101(6), 747-754.
Harajli, M.H., Hantouche, E. and Soudki, K. (2006). “Stress-Strain model for fiber-
reinforced polymer jacketed concrete columns”, ACI Structural Journal, 103(5), 672-682.
https://www.build-on-prince.com/frp-reinforcement.html#sthash.Mxiox877.dpbs.Date:
7/7/2013
ISIS M04, (2001).“Externally bonded FRP for strengthening reinforced concrete structures,”
The Canadian Network of Centres of Excellence on Intelligent Sensing for Innovative
Structures, Winnipeg, MB, Canada.
Italian National Research Council (2004).”Guide for the design and construction of externally
bonded frp systems for strengthening existing structures.” Advisory Committee on Technical
Recommendations for Construction. CNR-DT 200/2004, ROME – CNR July 13th, pp1-31.
Kobatake, Y., Kimura, K. and Katsumata, H. (1993). “A retrofitting method for reinforced
concrete structures using carbon fiber”, Fiber-Reinforced-Plastic (FRP) Reinforcement for
Concrete Structures: Properties and Applications, Nanni, A.(ed.), Elsevier Science
Publishers, 435-450.
Lavergne, S. and Labossiere, P. (1997). “Experimental study of concrete columns confined
by a composite jacket under combined axial and flexural loads.” Proceedings CSCE Annual
Conference, Sherbrook, Quevec, 6, 11-20.
Lubliner, J., Oliver, J., Oller, S. and Onate, G.(1989). “A Plastic- Damage model for
concrete”. Internation Journal of Solids And Structures, 25(3), 229-326.

83
Mander, J. B., Priestley, M. J. N. and Park, R. (1988). “Theoretical stress-strain model for
confined concrete. ” ASCE Journal of Structural Engineering, 114(8), 1804-1826.
Masukawa, J., Akiyama, H. and Saito, H. (1997). “Retrofit of existing reinforced concrete
piers by using carbon fiber sheet and aramid fiber sheet.” Proceedings of the 3rd Conference
on Non-Metallic (FRP) Reinforcement for Concrete Structures 1, Japan Concrete Institute,
411-418.
Meier U. (1997) “Post strengthening by continuous fiber laminates in europe”, Non-Metallic
(FRP) Reinforcement for Concrete Structures (Vol I), Japan Concrete Institute, 41-56.
Meier, U., and Betti, R.(1997). “Recent advances in bridge engineering”. Proceedings of the
U.S.-Canada-Europe Workshop on Bridge Engineering organized by EMPA, Zurich,
Switzerland, July 14-15, 429 pp.
Mirmiran, A. and Shahawy, M. (1997). “Behavior of concrete columns confined by fiber
composites”. ASCE-Journal of Structural Engineering, 123(5), 583-590.
Mirmiran, A., Zagers, K. and Yuan, W. (2000). ‘‘Nonlinear finite element modeling of
concrete confined by fiber composites.’’ Finite Elem. Anal. Design, 35(1), 79–96.
Miyaushi, K.; Nishibayashi, S. and Inoue, S. (1997). “Estimation of strengthening effects
with carbon fiber sheet for concrete column.” Non Metallic (FRP) Reinforcement for
Concrete Structures, Proceedings of the Third International Symposium, V. 1, Sapporo,
Japan, pp. 217-232.
Motavalli, M. and Czaderski, C. (2007). “FRP composites for retrofitting of existing civil
structures in europe: State-of-the-Art Review''. Composites and Polycon, American
Composites Manufacturers Association, October 17-19, Tampa, FL USA.
Nanni, A., and Bradford, M. N.(1995). “FRP jacketed concrete under uniaxial compression.”
Construction & Building Materials, V. 9, No. 2, 115-124.
Nasrin, S., Begum, M. and Sarkar, P.(2010). “Fiber reinforced polymers for structural
rehabilitation”. The Third International Conference on Structure, Processing and Properties
of Materials, SPPM2010, Dhaka, Bangladesh, 100-108.
Nitereka, C. and Neal, K.W. (1999). “Analysis of reinforced concrete beams strengthened in
flexure with composite laminates”, Canadian Journal of Civil Engineering, 26, 646-654.

84
Obaidat, Y.T., Heyden, S. and Dahlblom, O. (2010). “The effect of CFRP and CFRP/
concrete interface models when modelling retrofitted RC beams with FEM.” Composite
structures, 92, 1391-1398.
Pantelides, C.P., Clyde, C. and Reaveley, L.D. (2000a). “Rehabilitation of R/C buildings
joints with FRP Composites.” Proceedings of the 12th World Conference on Earthquake
Engineering, New Zealand, 2306.
Pantelides, C.P., Gergely, J., Reaveley, L.D. and Volnyy, V.A. (2000b) “Seismic
strengthening of reinforced concrete bridge pier with FRP Composites”. Proceedings of the
12th World Conference on Earthquake Engineering, New Zealand, 127.
Park, R. and Paulay, T. (1975). “Reinforced concrete structures.” John Wiley and Sons, N.Y.,
U.S.A. 800 p.
Picher, F.; Rochette, P.; and Labossiere, P. (1996). “Confinement of concrete cylinders with
CFRP,” fiber composites in infrastructure, Proceedings, First International Conference on
Composites in Infrastructure, pp. 829-841.
Rochette, P. and Labossière, P. (2000) “Axial testing of rectangular column models confined
with composites,” Journal of Composites for Construction. 4(3), 129-136.
Ross,C.A., Jerome,D.M.,Tedesco,J.W., and Hughes,M.L.,(1999)."Strengthening of
reinforced concrete beams with externally bonded composite laminates.” ACI Structural
Journal, Title No.96-S23, V. 96(2), 212-220.
Rousakis, T.; You, C. S.; De lorenzis, L.; Tamuzs, V. and Tepfers, R. “Concrete cylinders
confined by CFRP sheets subjected to cyclic axial compressive load”. A report for “Research
leading to the development of design guidelines for the use of FRP in concrete structures”,
European commission-TMR-network, Confibrecrete, Stockholm.
Saadatmanesh, H., Ehsani, M.R., and Jin, L. (1996) “Seismic strengthening of circular
bridge pier models with fiber composites”, ACI Structural Journal, 93(6), 639-647.
Saafi, M., Toutanji, H. A. and Li, Z.(1999). “Behavior of concrete columns confined
withfiber-reinforced polymer tubes”. ACI Structural Journal, 96(4), 500-509.
Samman, M.; Mirmiran, A. and Shahawy M.( 1998). “Model of concrete confined by fiber
composites.” Journal of Structural Engineering, Sept, 1025-1031.

85
Saxena, P., Toutanji, H., and Noumowe, A. (2008) “Failure analysis of FRP-strengthened rc
beams”, Journal of Composites for Construction, 12(1),2-10.
Seible, F., Innamorato, D., Baumgartner, J., Karbhari, V. and Sheng, L.H. (1999). “Seismic
retrofit of flexural bridge spandrel columns using fiber reinforced polymer composite
jackets”. Fiber Reinforced Polymer Reinforcement for Reinforced Concrete Structures, ACI
Report No-188, Detroit, Michigan, 919-931.
Seible, F., Priestley, M.J.N., Hegemier, G.A. and Innamorato, D. (1997). “Seismic retrofit of
rc columns with continuous carbon fiber jackets”. ASCE-Journal of Composites for
Construction, 1(2), 52-62.
Spoelstra, M. R. and Monti, G..(1999) “FRP-confined concrete model,” Journal of
Composites for Construction, 3(3), 884-888.
Teng, J.G., Lu, X.Z., Ye, L.P. and Jiang, J. J. (2004). “Recent research on intermediate
crack-induced debonding in FRP strengthened RC beams.”Proc.,4th Int. Conf. on advanced
composite materials in bridges and structures, M.El-Badry and L.Dunaszegi, eds., Canadian
Society for Civil Engineering, Calgary, Canada.
Toutanji, H. A. (1999). “Stress–strain characteristics of concrete columns externally confined
with advanced fiber composite sheets.” ACI Mater. J., 96(3), 397–404.
Tsionis, G., Negro P., Molina, J. and Colombo, A. (2001). "Pseudodinamic tests on a 4-
storey RC dual frame building", Report EUR 19902, Ispra, Italy.
Tulin, L. G. and Grestle, K.H.(1964). “Discussion of the equation for the stress-strain curve
of the concrete.” ACI Structural Journal, 61( 9), 1236-1238.
Wang, Y. C., and Restrepo, J. I.(2001) “Investigation of concentrically loaded reinforced
concrete columns confined with glass fiber-reinforced polymer jackets,” ACI Structural
Journal, 98(3), 377-385.
Xiao, Y. and Wu, H. (2000). “Compressive behavior of concrete confined by carbon fiber
composite jackets.” J. Mater. Civ. Eng., 12(2), 139–146.
Youssef, M.N., Feng, M.Q., & Mosallam, A.S. (2007). “Stress-strain model for concrete
confined by FRP composites”. Composites: Part B, 38, 614-628.

86

iii

iv
DECLARATION
Except for the contents where specific references have been made to the work of others, the
studies embodied in this dissertation are the outcome of the research conducted by the author.
It is here by declared that, this thesis or any part of it has not been submitted elsewhere for
award of any degree or diploma or other qualification (except for publication).
Sabreena Nasrin

v
ACKNOWLEDGEMENT
“Praise be to Allah, The Cherisher and Sustainer of the world.”
The author would like to sincerely thank the Almighty, the most Gracious, and the most
Merciful. The author prays to Almighty Allah for being in good health and condition, for the
successful completion of the study.
The author expresses, with due respect her deepest gratitude to her supervisor Dr. Mahbuba
Begum, Associate Professor, Department of Civil Engineering, BUET, whose guidance and
valuable directives have made the research project possible. Her guidance on research
methods, incredible editing skills and encouragement in all stages of this research work has
made this task a significant degree less difficult than it could have been. Her valuable
comments and insights helped to improve my work enormously. The author’s thanks to her
are endless.
The author would like to show appreciation to the Head, Department of Civil Engineering,
BUET for providing all the computation facilities to materialize this work.
The author would like to thank her family, specially her parents for their undying support,
continuous inspiration and kind co-operation.
The author acknowledges with gratitude the help granted by her husband Mr. Nurullah Bin
Humayun who enriched this research work by providing his precious opinions. His
unwavering support in all of her endeavors continues to provide her with the confidence that
she can complete the tasks ahead.
Finally, the author admits the priceless supports of her friends and colleagues specially Ms.
Zasiah Tafheem, Mr. Nazmus Sakib and Mr. A.K.M Abir.
vi
ABSTRACT
The use of fibre-reinforced polymer (FRP) is an efficient and technically sound method for
strengthening the damaged structures or upgrading the inadequately designed members or
retrofitting of seismically damaged reinforced concrete structures. Although there is a large
amount of experimental data available on the compressive behavior of fibre-reinforced
polymer (FRP) confined concrete columns, a full understanding of the behavior of FRP
confined rectangular concrete columns is somewhat lacking. This study aims to generate a 3D
finite element model for FRP confined concrete columns under axial loading to overcome the
deficiencies in the available experimental database.
The nonlinear finite element analysis on FRP confined plain concrete was performed using
ABAQUS/Standard (HKS 2009) finite element code. Both material and geometric
nonlinearities were included in the model. A damage plasticity model was used to simulate
the behavior of confined concrete. The interface between FRP and concrete was simulated
using contact pair algorithm. Two different types of formulation: cohesion based surface
interaction and friction type perfect bond interactions were defined at the FRP-concrete
interface. A static Riks formulation was implemented to trace the stable load-displacement
history of FRP confined concrete up to failure. The load was applied through displacement
control technique. The numerical model was successfully applied to simulate the behavior of
eleven columns from three experimental programs including square, rectangular and circular
columns. The model reliably reproduced the peak axial stress, axial deformation at the peak
stress, the post-peak behavior and the failure mode observed in the tests.
A parametric study was conducted to investigate the influence of several geometric
parameters such as aspect ratio, corner radius and the thickness of the FRP wrap on strength
and ductility of FRP confined rectangular columns. The maximum effect of confinement was
achieved for square columns. Decreasing the aspect ratio from 1 to 0.7 and 0.5 reduces the
ultimate capacity of the confined column by 20% and 30% respectively with respect to the
square column. Moreover, the axial capacity and ductility of the rectangular columns were
found to increase significantly with the increase in corner radius and thickness of the FRP
laminates. Finally, a simple form of polynomial equation was proposed to predict the
confined compressive strength and the ultimate axial strain of concrete.

vii
TABLE OF CONTENTS
DECLARATION IV
ACKNOWLEDGEMENT V
ABSTRACT VI
TABLE OF CONTENTS VII-IX
LIST OF FIGURES X-XI
LIST OF TABLES XII
NOTATIONS XIII-XIV
CHAPTER 1
INTRODUCTION
1.1. General 1
1.2 Objectives of the Study 2
1.3 Scope 2
1.4 Organization of the Study 3
CHAPTER 2
LITERATURE REVIEW
2.1 General 4
2.2 Fiber-Reinforced Polymers 5
2.3 Properties and Behavior of FRP 6
2.3.1 Tensile Behavior 6
2.3.2 Compressive Behavior 7
2.4 Applications of FRP in Structural Rehabilitation 8
2.4.1 Beam Strengthening with FRP Laminates 8
2.4.2 Column Strengthening 10
2.4.2.1 Experimental investigations 10
2.4.2.2 Numerical investigations 12
2.5. Behavior of FRP Confined Concrete Columns 12
2.5.1 Circular Columns 13
2.5.2 Rectangular Columns 14
2.6 Failure Mechanism 15
2.7 Design Guidelines 16
2.7.1 CSA-S806-022 (2002) 17
viii
2.7.2 ISIS Canada (2001) 18
2.7.3 FIB Guidelines (2001) 19
CHAPTER 3
FINITE ELEMENT MODELING 20
3.1 General 20
3.2 Properties of Reference Test Specimens 21
3.2.1 Geometric and Material Properties of Square Columns 21
3.2.2 Geometric and Material Properties of Rectangular Columns 21
3.2.3 Geometric and Material Properties of Circular Columns 22 3.3 Characteristics of the Finite Element Model 26
3.3.1 Geometric Properties and Finite Element Models 26
3.3.1.1 Element selection 26
3.3.1.2 Mesh description 28
3.3.1.3 Modeling of concrete-FRP interface 28
3.3.1.4. Load application & boundary condition 31
3.3.2 Material Properties 32
3.3.2.1 Concrete 32
3.3.2.2 FRP laminate 36
3.3.3 Solution Strategy 37
CHAPTER 4
PERFORMANCE OF FINITE ELEMENT MODELS
4.1 General 40
4.2 Performance of FEM Models 40
4.2.1 Ultimate Capacity and Strain 40
4.2.2 Axial Stress versus Axial Strain Response 42
4.2.2.1 Rectangular columns 42
4.2.2.2 Square columns 45
4.2.2.3 Circular columns 48
4.3 Summary 50

ix
CHAPTER 5
PARAMETRIC STUDY
5.1 General 51
5.2 Design of Parametric Study 51
5.2.1 Variable Parameters 52
5.2.1.1 Aspect ratio (a/b) of the column cross section 52
5.2.1.2 Corner radius(R) 52
5.2.1.3 Thickness of FRP wrap (tf) 53
5.2.2 Fixed Parameters 53
5.3 Results and Discussion 54
5.3.1 Effect of Aspect Ratio (a/b) of the Column Cross Section 58
5.3.1.1 Axial stress versus strain response 58
5.3.1.2 Effect of aspect ratio on ultimate capacity 61
5.3.2 Effect of Corner Radius (R) 64
5.3.2.1 Axial stress versus strain response 64
5.3.2.2 Effect of corner radius (R) on ultimate capacity 66
5.3.3 Effect of Thickness of FRP Wrap (tf) 67
5.3.3.1 Axial stress versus strain response 67
5.3.3.2 Effect of FRP thickness (tf) on ultimate capacity 70
5.3.4 Proposed Equation 71
5.3.5 Evaluation of Ductility 74
5.4 Summary 76
CHAPTER 6
CONCLUSIONS AND RECOMMENDATIONS
6.1 General 77
6.2 Conclusions 77
6.2.1 Performance of the Finite Element Model 77
6.2.2 Parametric Study 78
6.2.2.1 Effect of aspect ratio (a/b) 78
6.2.2.2Effect of corner radius (R) 78
6.2.2.3 Effect of FRP thickness (tf) 78
6.3 Recommendations for Future Research 79
REFERENCES 80

x
LIST OF FIGURES
Figure 2.1 FRP products for structural rehabilitation, (a) FRP strips and (b) FRP sheets
(Rizkalla et al. 2003). 5
Figure 2.2 The typical tensile strengths, and stress-strain relationship of FRP and steel
reinforcements (https://www.build-on-prince.com) 7
Figure 2.3 Applications of FRP for column retrofitting (Obaidat, et al., 2010) 12
Figure 2.4 Confinement action of FRP composite in circular sections (Benzaid and Mesbah,
2013) 13
Figure 2.5 Confinement action of FRP composite in square sections (Benzaid and Mesbah,
2013) 15
Figure 2.6 Typical failed specimens (a) circular (Saafi et al., 1999) and (b) rectangular
(Chaallal et al., 2003) 16
Figure 3.1 Geometric properties of square, rectangular and circular columns 23
Figure 3.2 (a) 3-D view of the column mesh and (b) Cross section (with CFRP laminate) 26
Figure 3.3 Finite elements used in the model, (a) 8-node solid (b) 8- shell element and 27
(c) Axisymmetric solid element 27
Figure 3.4 Bilinear traction separation constitutive law 29
Figure 3.5 Axial stress vs. axial strain responses of column S25C5 (a) using cohesive zone
model (b) using perfect bond model. 31
Figure 3.6 Load application and boundary condition 31
Figure 3.7 Response of concrete to uniaxial loading in (a) tension and (b)compression. 34
Figure 3.8 Stress-strain relationship curve of concrete for compression hardening 35
(a) stress versus total strain (b) stress versus plastic strain 35
Figure 3.9 Stress-strain relationship curve of concrete for tension stiffening 36
(a)stress versus total strain (b) stress versus inelastic strain 36
Figure.3.10 Typical Elastic stress-strain curve of CFRP 37
Figure 3.11 Riks method. 38
Figure 4.1 Numerical and experimental axial stress versus axial strain response for column
SC-1L3-0.7 43
Figure 4.2 Numerical and experimental axial stress versus axial strain response for column
SC-2L3-0.7 43
Figure 4.3 Numerical and experimental axial stress versus axial strain response for column
SC-3L3-0.7 44

xi
Figure 4.4 Numerical and experimental axial stress versus axial strain response for column
SC-4L3-0.7 44
Figure 4.5 Numerical and experimental axial stress versus axial strain response for column
S5C5. 45
Figure 4.6 Numerical and experimental axial stress versus axial strain response for column
S25C3. 46
Figure 4.7 Numerical and experimental axial stress versus axial strain response for column
S25C4 46
Figure 4.8 Numerical and experimental axial stress versus axial strain response for column
S25C5 47
Figure 4.9 Numerical and experimental axial stress versus axial strain response for column
S38C3 47
Figure 4.10 Numerical and experimental axial stress versus axial strain response for column
C1 49
Figure 4.11 Numerical and experimental axial stress versus axial strain response for column
C2 49
Figure 5.1 Cross sections of rectangular and square columns used in the parametric study 52
Figure 5.2 Variation of corner radius for square columns 53
Figure 5.3 Response of concrete to uniaxial loading in (a) compression and(b) tension 54
Figure 5.4 Effect of aspect ratio on the strain-strain responses of FRP wrapped columns 59
Figure 5.4 Effect of aspect ratio on the strain-strain responses of FRP wrapped columns 60
Figure 5.5 Effect of aspect ratio (a/b) 62
Figure 5.6 Effect of aspect ratio on the strain-strain responses of FRP wrapped columns with
fixed slenderness ratio 63
Figure 5.7 Effect of corner radius on confinement effectiveness 65
Figure 5.8 Effect of FRP thickness on the compressive behavior of FRP confined rectangular
columns (continued) 68
Figure 5.8 Effect of FRP thickness on the compressive behavior of FRP confined rectangular
columns 69
Figure 5.9 Effect of layer thickness on confinement effectiveness 69
Figure 5.10 Predicted values vs. numerical values of ultimate axial stress 73
Figure 5.11 Predicted values vs. numerical values of ultimate axial strain 73
Figure 5.12 Area used to calculate ductility ratios.( Rochette, P. and Labossie`re, P.2000) 74

xii
LIST OF TABLES
Table 2.1 The tensile properties of some of the commercially available FRP systems 6
Table 3.1 Geometric properties of square and rectangular columns 24
Table 3.2 Material properties of square and rectangular columns 24
Table 3.3 Geometric properties of circular columns 25
Table 3.4 Material properties of circular columns 25
Table 4.1 Performance of numerical models 41
Table 5.1 Geometric properties of parametric columns 56
Table 5.2 Results of parametric study 57
Table 5.3(a) Effect of aspect ratio (a/b) with variable slenderness ratio (L/a) 61
Table 5.3(b) Effect of aspect ratio (a/b) with fixed slenderness ratio 63
Table 5.4 Effect of corner radius (R) 66
Table 5.5 Effect of the FRP thickness (tf) 70
Table 5.6 Comparison between numerical values and predicted values by equation 72

xiii
NOTATIONS
a Short Dimension of column cross section, mm
b Long Dimension of column cross section, mm
H Height of column cross section, mm
d Diameter of concrete cylinder, mm
R Corner radius of concrete section
Ec Modulus of elasticity of concrete, GPa
Efrp Modulus of elasticity of FRP, GPa
εnom Nominal strain, mm/mm
fc' Specified compressive stress of concrete, MPa
ffrp Tensile strength of FRP, MPa
fl Lateral confining pressure, MPa
ρfrp Volumetric ratio of FRP
ψf Reduction factor
φ Strength reduction factor
Prmax capacity of a confined column, MPa
kc Confinement coefficient for rectangular columns
tf Thickness of the FRP jacket, mm
αpr Performance coefficient
Ww Volumetric strength ratio
α1 Ratio of average compression stress to the concrete strength
Effective strain in concrete, mm/mm
εfu Ultimate strain in FRP, mm/mm
ke Resistance Factor
φc Resistance factors for concrete
φs Resistance factors for steel εju Effective ultimate circumferential strain of the FRP jacket
ke Effectiveness coefficient
ti Resin thickness
tc Concrete thickness
Gi Shear modulus of resin
Gc Shear modulus of concrete
K0 Initial stiffness of interface

xiv
τmax Maximum shear stress, MPa
fct Concrete tensile strength, MPa
bc Concrete width, mm
bf CFRP plate width, mm
δf Opening displacement at fracture, mm
Gcr Energy needed for opening crack
σn Cohesive tensile
τs Shear stresses of the interface, MPa
τt Shear stresses of the interface, MPa
η Material parameter
εc~in Inelastic strain, mm/mm
εc~pl Plastic strain, mm/mm
dc Damage parameter
Gn Work done by the traction in the normal direction
Gs Work done by the traction in the first shear direction
Gt Work done by the traction in the second shear direction
ρ Transverse reinforcement ratio
f‘cc Compressive stress of confined concrete, MPa