Embed Size (px)
Citation preview

THESES, SIS/LIBRARY
A.G. MENZIES BUILDING N0.2
Australian Natiooal University
Canberra ACT 0200 Australia
USE OF THESES
This copy is supplied for purposes of private study and research only. Passages from the thesis may not.be
copied or closely paraphrased without the written consent of the author.
THE AUSTRALIAN NATIONAL UNIVERSITY
Te~phooe: +61 2 6125 4631
Facsimile: +61 2 6125 4063
Email: [email protected]

Some Aspects of the Ecology and Behaviour of the Australian
Red Cedar Tip Moth, Hypsipyla robusta Moore
A thesis submitted for the degree of Doctor of Philosophy of the
Australian National University
Jianhua Mo
(April 1996)

Responsibility
The research presented in this thesis is conducted by me, unless
otherwise explicitly acknowledged.
Jianhua Mo
(April 1996)
ii

iii
Acknowledgements
I sincerely thank the following people and organizations for advice and
assitance during my project:
To my supervisor Dr. Mick T. Tanton (chairperson) and Dr. Fyfe L. Bygrave,
for many fruitful discussions, valuable sugestions, proof-reading of the
thesis, and personal involvement in a number of the field excursions. The
professional help from Dr. Tanton is particularly appreciated. Thanks also to
Dr. Bygrave for providing the field study site.
To Central-south Forestry College of P. R. China for giving me the
opportunity to study in Australia and to Australian International
Developemnt Assistance Bureau for providing me scholarship in the first
three years of the project.
To the Department of Forestry of the Australian National University for
providing me with the facilities to study and research and occasional
financial support. Special thanks to Dr. J. Banks for identifying some of the
test plants, Mr. R. Jahnke, Mr. M. Devanzo for assisting me in collecting
field data, Mr. C. Hilliker for helping me making cages and an olfactometer.
To all staff in the Plant Facility Complex of the university for helping me
maintaining the Red Cedar trees.
To Dr. Ross Wylie of the Queensland Forestry Service for funding my trip to
Brisbane to attend a workshop on Australian Red Cedar Tip Moth.
iv
To CSIRO Division of Entomolgy in Camberra for allowing me to use the wintltunnel.
To Ms Ruth Sutherland of the Numbucca Hotel in Macksville for showing
me some mature Red Cedar trees in the local forests.
Finally, to my wife Yilan Li and my son Lin Mo, whose cooporation and
support are essential for the completion of the project. They have even
helped me in some laboratory work.

v
Abstract
The primary objective of this study was to provide some basic
information about the ecology and behaviour of Hypsipyla robusta Moore, a
serous shoot borer of Australian red cedar (Toona australis (F. Muell.)
Harmes). First, quantitative analyses were made on the temporal and spatial
patterns of infestation. This was followed by artificial rearing of the insect in
the laboratory, modelling of temperature-dependent development, studies
of the feeding behaviour of larvae, analyses of the die! patterns of
reproductive activities, and preliminary investigations of the host selection
behaviour of larvae and adults.
The infestation patterns of the insect were investigated with sample
data from a red cedar plantation. The temporal pattern of infestation levels
was closely correlated to rainfall: the larger the amount the rainfall the
higher the infestation levels. Temperature did not affect the general
infestation levels, but low daily minimum temperatures in the winter(< 6.5
0C) were always associated with low proportions of attacked trees. Attack by
the insect was concentrated on open-grown trees. However, attack on forest
located trees was also observed. Among trees planted in the open, attack was
largely a random process, i.e. all trees had similar likelihood of being
attacked. The only exception was trees 5 1.5 m tall, which were attacked
significantly less often than larger trees. For attacked trees, the percentages of
shoots attacked per tree decreased as tree size increased. Within an attacked
tree, shoots positioned among the upper tree crown were attacked
significantly more often than those positioned in the lower tree crown or
offshoots.
Damaged shoots are likely to retain the section starting from the
position of 1.0 cm diameter to the shoot base. The most significant factors
affecting the height increments and changes in tree-form values of trees in
the heavily infested open plot were all associated with initial tree size or

vi
tree form: larger and less-well formed trees achieved larger height
increments and better-formed trees achieved less gain in tree-form values.
For trees with initial height in the same range, the average height
increment of trees in the forest during the same period was over twice as
much as that in the open plot.
The insect had been successfully reared on an artificial diet for 23
generations. The colony reared in this study compared favourably to other
artificially-reared colonies of H. robusta in terms of pupal weight and
fecundity. Duration of development was comparable to that observed for
individuals reared with host tissues. The number of larval instars varied
from five to seven, with most larvae completing six instars before pupating.
Mating in indoor cages was enhanced by exposing the moths to wind.
Mortality due to non-feeding was reduced by confining the neonates to
small rearing vials.
Mean rate of development of the combined larval and pupal period
in the temperature range of 16.4 °C - 28.7 °C was closely fitted by the linear
model. Based on the model parameters and data on duration of egg
development, the maximum number of annual generations of the insect
around the field study site was estimated at five to six. Variable
development rates among individual insects were evident at all the five
constant temperatures tested. Distribution of develop times at different
temperatures can be modelled by a common 3-parameter Weibull function,
which can be incorporated into field phenology models in estimating the
proportions of individuals completing development by a certain amount of
accumulated DD. A simpler but practical approach to modelling the
stochastic process of development was also demonstrated by directly fitting
the proportional development data to the logistic phenology model, which
can be used to estimate the proportions of individuals in each development
stages at a given time.

vii
Feeding bioassays using neutral substrates confirmed the existence of
feeding stimulants in the ethanol extracts of young shoots. Larvae fed more
intensively on agar-cellulose medium or filter paper treated with the
ethanol extracts than on the corresponding plain substrates in both non
choice and choice tests. The biting response could be elicited by the presence
of host odour alone. Feeding stimulants for the insect was not confined to
red cedar. The larvae readily bored into the shoots of three non-host
meliaceous species: Spanish Cedar (Cedrela odorata), Chinese toon (Toona
sinensis), and white cedar (Melia azadirachta var. australasica ), although
those bored into the shoots of the latter two species later died.
Feeding spots with respect to hust tissues changed as the larva aged.
Feeding by larvae of the first two instars were mostly found in terminal
foliage (buds and unexpanded foliage) or damaged tissues (leaf scars or other
damaged areas on the surface of shoots or stems). Pith-feeding (tunnelling)
started at later 2nd instar. Some larvae came out of the tunnels before
pupating. With potted plants, the preferred pupation sites was around the
base of the plant close to the soil level. On average, a larva initiated feeding
in 5.4 different locations during its life time, with a minimum of three and
a maximum of 11. Switching of feeding spots was most frequent during
early first instar and much of the 3rd and 4th instar.
Most moths emerged in the early hours of the scotophase (82%), the
rest before light-off. Female calling started at 3 hours after light-off and
peaked around 5.5-7.5 hours after light-off. There was an apparent trend for
earlier calling as the females aged. Mating started 1.5 hours later than calling
but reached its peak around the same time as calling. Mating was recorded
for females aged 1-6 days and for males aged 0-4 days. Females appeared to be
most receptive to males in the 2nd-3rd day following emergence. Egg-laying
was observed in all but the first 0.5 hour and the last 1.5 hours of the
scotophase. There appears to be no single, dominant peak in the die! pattern
of egg-laying. Despite being nocturnal, adults of the insect, irrespective of

viii
their sex and mating history, periodically underwent rest in the dark phase.
Virgin females were more active during the early half of the scotophase and
remained relatively stationary during the latter half of the scotophase.
Average duration of active intervals was significantly longer in mated
females than that in virgin females. Males were most active in the first
scotophase following emergence, and virgin females in the second
scotophase following emergence. The results suggest that mated females
may be responsible for host finding.
Volatiles from the young foliage of the host plant were attractive to
larvae when tested in the larval olfactometer. However, tests in the Y-tube
olfactometer and wind tunnel failed to detect apparent directional responses
toward host volatiles in virgin and mated females. Hypotheses were
proposed to explain the lack of olfactory responses of females to host
volatiles.
Implications of results of this study for the management of the insect
are discussed.

Section
Chapter 1
Chapter 2
Chapter 3
Chapter 4
Chapter 5
Chapter 6
Chapter 7
Chapter 8
Chapter 9
References
Contents
Title Section
General Introduction
A Review of Hypsipyla robusta Moore
Infestation Patterns of Hypsipyla robusta Moore in a
Red Cedar Plantation
Artificial Rearing of Hypsipyla robusta Moore
Temperature-dependant Development of Hypsipyla
robusta Moore
Feeding Behaviour of Larvae of Hypsipyla robusta
Moore
Diel Patterns of Reproductive Activities of
Hypsipyla robusta Moore
Effects of Host Volatiles on the Orientation of
Larvae and Adults and Host Acceptance by Gravid
Females of Hypsipyla robusta Moore
General Discussion
ix
Page
4
28
94
121
155
1b6
205
233
242

Appendix Estimation of Larval Instars of Hypsipyla robusta
Moore by Larval Frass Widths
x
265

Plate 1
Plate 2
Plate 3
List of Plates
A mature larvae of H. robusta and its tunnel inside a
growing shoot
A larva of the H. robusta in the progress of boring
into the shoot of a potted White Cedar (Melia
azadirachta var. australasica ) tree
Two naturally-grown Red Cedar (Toona australis (F.
Muell.) Harmes) trees in a forest patch close to
Kempsey, NSW. The two trees must have been free
of attack by H. robusta for a long period, as shown
by the long and straight boles
xi
93
185
241

Chapter 1
General Introduction
Australian Red Cedar, Toona australis (F. Muell.) Harmes·
(Swietenoidea: Meliaceae), is a deciduous rainforest species distributed along
the eastern coastline of New South Wales and Queensland (Floyd, 1989).
Timber of Red Cedar is durable, easy to work, and considered as one of the
best furniture materials in Australia (Floyd, 1989). The attractive wood
properties of the tree have long been recognised and generated considerable
demand for its supply during the early period of European settlement,
resulting in its massive destruction (Vader, 1987). As a result, standing
mature trees of the once abundant species are now found only in a few
isolated locations (Vader, 1987).
Attempts to grow Red Cedar in plantations have so far been
unsuccessful due to the attack by the Australian Red Cedar Tip Moth,
Hypsipyla robusta Moore (Lepidoptera: Pyralidae). Larvae of the insect feed
primarily inside the growing shoots of the host tree (Anon., 1918). As a
result of larval tunnelling, terminal sections of the shoots eventually die or
break off. Secondary shoots are formed, only to be attacked again in the same
way as the primary shoots. Repeated destruction of the growing shoots
results in the severe deformation of the host tree, as characterised by
numerous branches and stunted height growth, rendering them of little
commercial value. The severity of the problem is perhaps no more
strikingly shown than the fact that the insect is mentioned in almost all
forestry publications (scientific or non-scientific) or pamphlets which have
devoted some length to the cultivation of Red Cedar. The 'gloomy'
situation has even prompted the suggestion for the discouragement of any
•The name Toona australis M. Roemer is used in a recent revision of the genus Toona by K.N. Bahdur (1988) [Monograph on the genus Toona (Meliaceae), iii+251 pp. Forest Research Institute and Colleges, Dehra Dun, India]. See Chapter 2 for further discussion.
,

future plantations of Red Cedar (pamphlet, New South Wale Forestry
Commission). In addition to Red Cedar, H. robusta attacks related Meliaceae
species in Asia and Africa, including the mahogany (Swietenia spp.) and
African mahogany (Kltaya spp.) (Beeson, 1919; Roberts, 1968). Planting
efforts of these valuable timber species are similarly constrained by the
insect (Entwistle, 1967).
Despite the devastating effects of H. robusta, there have been
surprisingly few studies of the insect. Much of what we know about the
insect was provided by Beeson (1919) almost 80 years ago. Since then, there
have been few advances toward a better understanding of the insect. The
ecology and behaviour of the insect remains poorly understood. While a
number of reports has addressed the temporal and spatial patterns of attack
(eg. Campbell, 1964; Roberts, 1968; Wagner et al., 1991), there have been
practically no quantitative studies of the infestation patterns. No attempts
have been made to determine the ecological and/or behavioural
mechanisms underlying the infestation patterns. Although the composition
of female sex pheromones of the insect has been identified (Bosson and
Gallois, 1982), behavioural aspects of host selection in larvae and adults are
unknown (Newton et al., 1993). Studies of the insect in Australia are
particularly lacking, with only four reports published so far, all of which are
descriptions of damage characteristics based on casual observations and lack
the support of concrete data (eg. Anon., 1918; Froggatt, 1923, 1927; Campbell,
1964). This overall lack of knowledge greatly hinders the development of
efficient control strategies against H. robusta.
Recognising the acute shortage of information with respect to H.
robusta, a broad approach has been adopted in studying the insect, rather
than focusing on particular aspects. The primary objective of this study was
to provide some basic information about the ecology and behaviour of the
insect. First, a quantitative approach is made in describing the temporal and
spatial patterns of attack of the insect on Red Cedar based on systematic

3
sampling data from a Red Cedar plantation in New South Wales (Chapter
3). Temporal patterns of attack are analysed in relation to temperature and
rainfall. Spatial patterns of attack are analysed at three levels: within-tree
variations, inter-tree variations, and habitat differences. Growth of trees in
an infested open plot was also investigated. To provide a steady supply of
test insects for off-site studies, a rearing programme was initiated using an
artificial diet. The performance of the diet in rearing the insect was assessed
and a novel solution provided to the long-standing problem of mating in
cages (Chapter 4). With the success of artificial rearing, it was possible to
study temperature-dependent development of the insect (Chapter 5), larval
feeding behaviour with respect to host tissues and host chemicals (Chapter
6), die! patterns of emergence, calling, mating, and physical activities of the
moths (Chapter 7), orientation responses of larvae and adults to host odours
and host acceptance in egg-laying femciles (Chapter 8). Results from
individual chapters are drawn together and discussed in Chapter 9. Where
applicable, implications of the results of this study to the control of the
insect are discussed, and recommendations suggested as to the future areas
of research. Finally, a technique using frass widths to estimate larval instars
in the field is described (Appendix).
It is hoped that the information presented here will better our
understanding of H. robusta and its infestation of Red Cedar, and serve as a
basis for future studies, leading ultimately to the establishment of integrated
pest management strategies against the insect.
4
Chapter 2
A Review of Hypsipyla robusta Moore
2.1 Introduction
Attack by Hypsipyla robusta Moore (Lepidoptera: Pyralidae) on
Australian Red Cedar (Toona australis (F. Muell.) Harmes) has been
recognised since early this century (Anon., 1918). The insect is also
responsible for extensive damage on related Meliaceae species in Asia
(Beeson, 1919) and Africa (Roberts, 1966). Within the same genus is another
equally notorious shoot borer of important Meliaceae species in Latin
America, H. grande//a (Zeller). Collectively, the tvw shoe• borer:; are known
as mahogany shoot borers. Mahogany shoot borers are c .msidered as the
overriding factor restricting the establishment and cultivation of many
tropical members of the Meliacae, some of which are the world's best
regarded timber species (Newton et al., 1993).
The devastating effect of damage by H. robusta on its host trees has
been well documented (Coventry, 1899; Anon. 1918; Beeson, 1919; Froggatt,
1923; Roberts, 1968; Grijpma, 1976; Newton et al., 1993). As a result of
tunnelling by larvae, the infested shoots eventually die or break off above
the entrance holes and then branch out below (Beeson, 1919). Killing of host
trees is unusual, but, instead of forming long and straight boles, the infested
trees resemble orchard trees, losing much of their timber value (Grijpma,
1976). Wherever host trees are planted in groups, attack by H. robusta
generally occurs (Coventry, 1899). As a result, attempts to grow the native
host trees have largely failed in Australia (Campbell, 1964), in India (Rao
and Bennet, 1969) and in Africa (Wagner et al., 1991). The same problem; ·as
reported in Latin America (see Newton et al., 1993).
Reviews of the mahogany shoot borers include Tillmans (1964),
Entwistle (1967), Grijpma and Styles (1973), Grijpma (1976), and Newton et

5
al. (1993). Although of recent date, the review by Newton et al. (1993)
concentrated on the damage patterns and control of the insects, particularly
H. grandella, with only brief mention of other aspects. No comprehensive
reviews have been done specifically on H. robusta. The review below
therefore attempts to offer a comprehensive view of existing information
on H. robusta. Relevant information on H. grandella is also discussed, as the
two species of Hypsipyla appear to behave similarly (Newton et al., 1993).
2.2 Distribution
H. robusta has been recorded in 20 countries, scattered around in
tropical and subtropical regions of Africa, Asia, and Australia and
neighbouring islands (Commonwealth Institute of Entomology, 1983).
Countries where the insect has attracted considerable attention are: India,
Indonesia, Nigeria, Ghana, and Australia.
2.3 Host Trees
2.3.1 Host range
Long-time isolation of regional populations of H. robusta has resulted
in different species being used as its host trees in different geographic
regions. A list of host plants and the countries in which the attack occurs
was compiled by Entwistle (1967) (Table 2.1). Most of the host plants were
recorded in Africa and the Indian subcontinent, including the well-known
mahogany (Swietenia spp.) and African mahogany (Khaya spp.). In
Australia, only Red Cedar is attacked by the insect. However, the possibility
of alternative hosts was suspected since Red Cedar trees planted many miles
away from the natural cedar country were similarly attacked (Anon., 1918).
Except for four species, all host plants of H. robusta fall in the subfamily
Swietenioideae of the family Meliaceae (see Grijpma, 1976). It is interesting
to note that Cedrela odorata L. was also attacked by H. robusta, while T.

6
australis was not attacked by H. grandella and was poisonous to it (Grijpma,
1970, 1976; Grijpma and Roberts, 1975).
There is no agreement as yet as to whether the Red Cedar should be
treated as a separate species or as a variety of T. ciliata M. Roem., the major
host of the insect in India (Beeson, 1919). This is reflected in the parallel use
of the name T. australis and the name T. ciliata var. australis in current
literature (Edmonds, 1993). The name T. australis is adopted in this thesis in
accordance with the usage in a recent Australian botanical book on
rainforest tree species (Floyd, 1989). Also included in the genus Toona are at
least three other species: T. sinensis (A. Juss.) M. Roem., T. fargesii A. Chev.,
and T. sureni (BL) Merr. sensu lato (Edmonds, 1993). Only T. australis is
native to Australia, the other Toona species occurring in India, Pakistan,
South East Asia, China and Malaysia (Edmonds, 1993).
2.3.2 Natural distribution and habitats of Red Cedar
Red cedar is distributed along the coastal rainforests of Australia from
Benandrarah, NSW to the Mcilwraith Range, Qld , covering a range in
latitude from 13 - 35 °5 (Floyd, 1989). The main distribution is between
Ulladulla, NSW, and Gympie, Qld, with disjunct populations further north
and in New Guinea (Boland et al., 1984). The mean monthly temperature
range in this region is 5 - 31 °C and the mean annual rainfall 1200 - 3800
mm. It is most abundant in moist gullies or along streams and requires
alluvial or volcanic soils for its best development (Anon., 1918; Mitchell,
1972; Boland et al, 1984). The rainforest types it occurs in range from warm
temperate (simple notophyll vine forests) to subtropical (complex notophyll
vine forests) and tropical rainforests (mesophyll vine forests), where it is
often associated with white and black booyong (Argyorodendron
trifoliolatum and A. actinop!zyllum), Red Carabeen (Geissois bent!zamiana),
sassafras (Doryp!zora sassafras), Yellow Carabeen (Sloanea woollsii) and
occasionally Hoop Pine (Araucaria cunninghamii) ( Boland et al., 1984 ).

7
2.3.3. Characteristics of Red Cedar
Red cedar is a large deciduous tree attaining a height of 45 m and a
breast diameter of 210 cm (Floyd, 1989). The tree crown is very open with
large spreading limbs (Boland et al., 1984). In comparison with other related
Swietenoideae species, growth of Red Cedar is rapid (Grijpma, 1970). In
Costa Rico, Red Cedar was reported to reach a height of 6.8 m in 13 months
(Edmonds, 1993). An early report based on tree ring studies of old stumps
over 200 years old put the annual girth increment at ca. 2.54 cm (Anon.,
1918). Seedlings of Red Cedar have recorded a growth rate of 3 cm/day in
growth tubes (Applegate and Bragg, 1989). The mature timber is red, soft,
light and durable and considered as one of the best for furniture in Australia
(Boland et al., 1984; Floyd, 1989). Current price of the timber is estimated at
around A$1000/ m3 (Beutel, P., Forestry Dept., ANU, Australia. pers.
comm.). Apart from its attractive timber, Red Cedar is highly regarded as an
ornamental, wildlife shelter and shade species (Cremer, 1990).
The timber value of Red Cedar created a large demand in Australia
and overseas in the late 19th century, resulting in its rapid destruction
(Vader, 1987). The destruction was so severe that this once abundant species
is now confined to a few isolated localities (Cremer, 1990; Vader, 1987), with
scattered trees from Ulladulla, NSW, to Atherton, Qld (Cremer, 1990).
2.4 Systematic Position
H. robusta belongs to the subfamily Phycitinae of the family Pyralidae
(Beeson, 1919). It was first described in 1886 as Magiria robusta Moore in Sri
Lanka and later found to be synonymous with Hypsipyla pagodella Ragonot
described two years later in India and subsequently renamed as Hypsipyla
robusta Moore (Bradley, 1968). The genus Hypsipyla Ragonot contains 11
species, of which four are from the New World and seven from the Old
World (Entwistle, 1967). H. robusta and H. grandella (Zeller) are the two
most economically important and widely distributed species (Newton et al.,

8
1993). H. grandella closely resembles H. robusta in morphology and attacks
related Meliaceae species, mainly Cedrela spp. and Swietenia spp., in the
New World from Florida to Brazil (Entwistle, 1967). Other species in the
genus are of limited distribution and not well known (Entwistle, 1967).
After examination of specimens from a number of geographic areas, Bradley
(1968) suggested that H. robusta probably comprised several geographical
races or subspecies.
2.5 Morphological Characteristics
Diagnostic characteristics of H. robusta, as shown in the wing
venation and genitalia, have been provided by Bradley (1968) and more
recently by Sharma and Singh (1980b). Moths of both sexes are dark grey and
of medium size, with a wing-span of 18-31 mm (Roberts, 1966). Detailed
descriptions of the external morphology of the insect at individual
developmental stages are given by Beeson (1919). The most striking feature
is shown in the colour of the last instar larvae, changing from reddish
brown immediately after moult to light blue just before pupation. Described
in India, this feature is shared by H. robusta in Africa (Roberts, 1966) and
Australia (Froggatt, 1923, 1927). The colour of the eggs is also characteristic,
with distinctive red and white patches developing in about one day after
egg-laying (Beeson, 1919; Atuahene and Souto, 1983). Sex of the insect can be
identified at the pupal stage, with the male genital opening at the 9th
abdominal segment and the female at the 8th abdominal segment (Sharma
and Singh, 1980a).
2.6 Biology
2.6.1 Life history
Considerable regional variations exist in the life history of H. robusta.
Based on his study in India, Beeson (1918, 1919) reported five annual
generations, the first and second generations developing on flower and

9
fruits, respectively, and the next three generations on growing shoots.
Evidence of flower- and fruit-feeding generations are lacking in other parts
of Asia (Entwistle, 1967). In Africa, attack on flowers and fruits did occur but
seemed to be restricted to certain host plant species and regions. Only shoot
feeding generations have been reported in Australia (Froggatt, 1923, 1927).
Reports on the number of larval instars are also inconsistent. Earlier studies
indicated 4 larval instars (Beeson, 1919; Roberts, 1968), while later studies
showed either 5 instars (Morgan and Suratmo, 1976) or a 5-7 instar pattern
with the majority exhibiting 6 instars (Couilloud and Guiol, 1980; Atuahene
and Souto, 1983). It is suspected that larvae of certain instars may have been
overlooked in early studies (Atuahene and Souto, 1983). This seems likely
as the results of those studies were obtained with field observations or
samples.
2.6.2 Habits of larvae, pupae and adults
Larvae of H. robusta are cryptic, spending most of their life in
concealment inside shoot tunnels, fruits, self-constructed silk enclosures
(Beeson, 1919), or under the bark (Roberts, 1968). When feeding on flowers,
the larvae feed gregariously on all parts of the inflorescence by binding
together individual flowers through a loose network of silk threads
(Beeson, 1919). Early instar larvae of the fruit generation select the young
and soft fruits and feed on the epidermis, while older larvae attack more
advanced fruits and feed inside (Beeson, 1919). Tunnelling of shoots usually
commences at leaf axils (Ballard, 1914; Coventry, 1899). Late instar larvae
may emerge from existing tunnels and construct new ones (Beeson, 1919), as
shown by the many empty tunnels found in the field (Roberts, 1968).
Occasionally more than one larvae may be found in a single shoot, in which
case the larvae either occupy separate tunnels or a single continuous tunnel
(Roberts, 1966). As many as 20-40 wounds may occur on a single stem,
resulting in heavy sap exudation (Wagner et al., 1991). Feeding on the
10
cambium has also been reported (Ballard, 1914; Roberts, 1968). Where both
shoot- and bark- feeding occurs, cambium-feeding was more likely to occur
on mature trees, whereas shoot-feeding was the primary form of damage on
young trees (Ballard, 1914). Cambium-feeding or barking at the bases of the
stems may lead to the death of young trees (Menendez and Berrios, 1992). In
times of high population density, larvae may disperse in groups, usually
during the 3rd instar, to other trees (Beeson, 1919). Larvae of H. robusta can
be cannibalistic, with the young and weak ones eaten by the more mature
and robust ones when confined together (Froggatt, 1923, 1927).
Pupation site differs with the plant tissues used by larvae for feeding,
and in relation to regional populations. In India, pupation of the flower
and fruit-feeding generations takes place almost invariably under flakes of
barks (Beeson, 1919), while in Nigeria the flower- and fruit- feeding larvae
frequently pupate in ground vegetation (Roberts, 1966). Shoot feeding larvae
usually pupate inside larval tunnels (Beeson, 1919; Roberts, 1966).
Little is known about the behaviour of the moths of H. robusta
(Newton et al., 1993). Beeson (1919) noted that the moth is of retiring habit
and is rarely seen in the field and that they were inactive most of the time
except for wing-fanning in early morning and late evening. Moth
emergence concentrates during the early evening (Atuahene and Souto,
1982). Beeson (1919) reported a highly male-biased sex ratio (75%). However,
later studies indicate a roughly 1:1 sex ratio (Atuahene and Souto, 1982;
Couilloud and Guiol, 1980). The maximum number of eggs laid per female
ranges from 228 to 624, with an average of 472 (Beeson, 1919). Egg-laying
females exhibit strong preferences for cracks or creased spots as oviposition
sites (Atuahene and Souto, 1982) and may be attracted to products from
larval feeding activities (Roberts, 1968). Typical oviposition sites are
unexpanded young leaves and leaf buds (Beeson, 1919) and shoots (Beeson,
1919; Roberts, 1968). Eggs are laid singly, firmly attached by a fluid secretion
from the cement gland of the female moth (Beeson, 1919).

11
More detailed information of moth behaviour is available on H.
grandella, which appears to behave similarly to H. robusta (Newton et al.,
1993). Oviposition of H. grandella occurs during evening or early morning
(Wilkins, 1972; Holsten, 1977). Eggs are laid singly or occasionally in small
clusters ( Grijpma, 1971). Usually only 1-3 eggs are laid on each tree. Peak
flight activity takes place in the latter half of the night (Gara et al., 1973).
Active flight of females concentrates during the first two days after
emergence, while that of males last for about four days. One- to two-day-old
females fly farther than males of similar ages (Fasoranti et al., 1982).
Although they are able to fly over 14 kilometres within one day (Fasoranti
et al., 1982), the moths apparently do not disperse readily from areas of
active infestation (Grijpma and Gara, 1970a).
2.7Ecology
2.7.1 Damage patterns
Spatial patterns
Attack by H. robusta is usually more severe in open habitats (Froggatt,
1923; Mitchell, 1972; Wagner et al., 1991). Campbell (1964) indicated that 50%
shade is necessary to reduce infestation. Growing host plants with non-host
plants seems to lessen the attack (Newton et al., 1993). Roberts (1968) found
that host and non-host plants mixed in the same lines, instead of in pure
lines, afforded some degree of protection against the insect.
Intensity of attack within a host stand differs with tree age and height.
Morgan and Suratmo (1976) reported negative correlations between attack
intensities and tree height and age. Trees less than 13 years old were attacked
more often, with the heaviest attack on trees 3-6 years old and 2-8 m tall,
whereas trees over 15 m high and aged 13 years or more were only slightly
attacked or not attacked at all. It is worth noting that large and old trees are
by no means immune from attack (Coventry, 1899; Anon., 1958). However,
mature trees are more tolerant to, and suffer Jess from, the attack (Coventry,

12
1899; Grijpma, 1976; Newton et al., 1993). Minimal height and age of
susceptible trees appears to be low. In India, host trees were attacked when as
young as 3-month-old and ca. 30 cm tall (Entwistle, 1967). In Nigeria, most
of the host tree species became susceptible at the age of 1-2 years (Roberts,
1966). For trees of similar age and height, vigorously-growing trees are more
likely to be attacked than slow-growing trees (Entwistle, 1967; Lamb, 1968;
Newton et al., 1993). Such a preference pattern can also be seen temporally.
Brunck and Fabre (1974) noted a high correlation between the attack rates by
H. robusta and the monthly growth rates of its host trees. Tree form also
influences the attack rates, with those producing greater quantity of shoots
likely to be attacked more often than single-stemmed trees (Entwistle, 1967;
Grijprna, 1976). However, this tendency may be counterbalanced by the
negative association between shoot size and shoot abundance (Entwistle,
1967). A study on the within-tree distribution of H. grandella indicates that
the upper main sterns of trees are more frequently attacked than offshoots
or middle sterns (Yamazaki et al., 1992). Attack on the offshoots is mainly
the work of 1st-2nd instar larvae (Yamazaki et al., 1992).
Where multiple host species coexist, H. robusta exhibits preference for
some species over others. Of the 6 genera of Meliaceae attacked in Nigeria,
Khaya spp., in particular K. ivorensis, suffer the heaviest attack, whereas
Entandrophroagma spp. and Lovoa trichilioides are attacked much less
severely even when planted in pure lines (Roberts, 1966). In Indonesia,
larvae of H. robusta demonstrated a distinct preference for S. macrophylla
over K. anthotheca and T. sureni (Morgan and Suratrno, 1976). With respect
to exotic Meliaceae species, it is of interest to note that T. australis is not
attacked by H. grandella, and C. odorata, the major host of H. grandella,
suffered little attack from H. robusta (Grijpma, 1970).

13
Temporal patterns
In Australia, attack by the insect appears to be more active in mid
summer than in winter (Froggatt, 1923, 1927). In areas where temperature is
not a restricting factor, peak infestation coincides with the rainy season and
leaf flush (Brunck and Fabre, 1974; Morgan and Suratmo, 1976; Wagner et
al., 1991). Two factors may be responsible for the correlation between attack
intensity and rainfall. First, egg-laying females are particularly attracted to
new foliage (Grijpma and Gara, 1970a), which is most abundant during the
rainy season. Secondly, the ample supply of succulent young shoots during
the rainy season ensures better growth of larvae and high fertility of adults.
2.7.2 Attack on tree growth
While the devastating effects of Hypsipyla on the growth of their host
trees are well known, few studies have attempted to quantify such effects.
Existing information on the C. odorata - H. grandella interactions showed
that attacked trees produced more branches than un-attacked trees, but loss
of tree height and girth was insignificant after initial exposure to the insect
(Howard and Meerow, 1993). Apparently the impact of attack varies with
tree species. Some trees may possess higher compensation potential than
others.
2.7.3 Host selection
Hypsipyla spp. appear to have remarkable host finding capabilities.
Irrespective of their locations, plantations of host trees in their native
countries seldom escape attack (Newton et al., 1993). Even isolated trees
planted a long distance from the infestation sources are sometimes attacked
(Anon., 1918). However, little is known about the mechanisms by which the
moths locate the host habitats and eventually lay eggs on their preferred
host tree species. Current knowledge in this context is fragmentary and
speculative and mainly concerned with H. grande/la. Studies with field

14
olfactory cages indicates that the moths are attracted to the odour of new
leaves of the host trees (Grijpma and Gara, 1970a). This finding was later
supported by similar experiments with the chemical extracts of the new
leaves (Gara et al., 1973) and preliminary electro-antennogram
investigations (Schoonhoven, 1974). Antennae of H. grandella may
function both as the sense organ of host odours and sex pheromones
(Callahan, 1973). Although not yet demonstrated experimentally, H. robusta
may possess similar olfactory responses, as attack by this insect is positively
correlated with the vigour and growth rate of its host trees (Entwistle, 1967).
The responsible volatiles are suspected to involve sesquiterpenes (Carruyo,
1973, 1976). Some of the volatile constituents of T. australis and S.
macrophylla have been identified (Oliveira et al., 1986), but their relevance
to host selection by Hypsipyla is not known. The task of locating host plants
is thought to be accomplished by virgin females (Gara et al., 1973; Holsten
and Gara, 1977). Males are subsequently attracted to the females by sex
pheromones (Holsten and Gara, 1974). The chemical composition of the sex
pheromone is not known, but that of H. robusta consists of a mixture of
tetradecenyl acetates (Bosson and Gallois, 1982). In addition to olfactory cues,
the involvement of light in the host selection process is also raised.
Campbell (1964) speculated that H. robusta would not lay eggs in stands
where light intensity is less than 50% of normal incident radiation. Grijpma
(1971) went further to suggest that long distilnce orientation of H. grande/la
is solely guided by infrared light reflected from host leaves. While direct
evidence for the above hypotheses are lacking, the overwhelming number
of reports of concentrated attacks on open-grown trees (see Entwistle, 1967;
Newton et al., 1993) may be linked to the positive response of Hypsipyla to
light. Although nocturnal, oviposition of H. grandella occurs primarily
during evening and early morning (Wilkins, 1972; Holsten, 1977), when
moderate light intensity is to be expected.

15
2.7.4 Mortality and natural enemies
No life table data are available on H. robusta. Mortality during the
larval stage appears to be high, with drowning by sap suspected to be the key
factor (Roberts, 1968). The production of sap as a host plant defence
mechanism against the larvae of Hypsipyla has been suggested by a number
of authors (Lamb, 1968; Wilkins, 1972). A large number of natural enemies
has been found attacking H. robusta. Rao (1969) and Rao and Bennet (1969)
listed more than 40 species of parasitoids in India, including 17 braconids, 9
chalcids, 1 elasmid, 1 eulophid, 1 eurytomid, 13 ichneumonids, 2
trichogrammids, 2 tachinids, 2 coleopterans and 1 nematode. Roberts (1968)
bred out 5 insect parasitoid species and a nematode parasite from field
collected larvae in Nigeria. The level of parasitisation was found to be very
low (usually < 1 %), with the possible exception of the nematode. Predators
recorded so far are found only in small numbers and do not appear to play
an important role in the control of H. robusta (Singh and Misra, 1988).
2.7.5 Development rate
Development rates differ with food source and climate. Beeson (1919)
noted that development was faster for the flower and fruit generations (24-
29 d) than that for the shoot generations (64-79 d) and attributed the
differences to the higher nutritional values of the flowers and fruits. For the
cambium feeders, the poorer nutritional value of the bark as compared with
shoots resulted in an approximately two-week lengthening of the
generation time (Roberts, 1968). Under favourable conditions, as indicated
by ample food supply and adequate temperature and rainfall, the insect can
complete up to 10 generations per year on shoots (Roberts, 1968; Morgan and
Suratmo, 1976). In places where temperature or rainfall periodically
becomes a limiting factor, the last instar larvae may undertake a period of
aestivation (Beeson, 1919; Froggatt, 1923, 1927; Roberts, 1968).
16
Data on temperature-dependent development are not available. The
only available information relating development rate to temperature is
obtained with studies of artificial rearing and only one temperature was
tested (Atuahene and Souto, 1983; Couilloud and Guiol, 1980).
2.8 Artificial Rearing
Early attempts to mate H. robusta in indoor cages largely failed
(Beeson, 1919; Roberts, 1966). The problem was not rectified by increasing
the sizes of, or providing the host plants in, the mating cages (Beeson, 1919).
A similar problem was encountered in the rearing of H. grandella (Grijpma,
1971). Fertile eggs can be readily obtained, however, in outdoor cages
(Grijpma, 1971). It is not known what factors contributed to the difference.
Fasoranti (1985) found that mating of H. grandella could be significantly
enhanced by flying the moths in pairs in a windmill before placing them in
mating cages, suggesting the involvement of wind in mating behaviour.
Direct application of Fasoranti's approach toward the mating problem,
however, is not practical in mass rearing of the insect, as it is time
consuming and requires sophisticated equipment. Rearing of H. robusta on
artificial diets has been attempted by a number of authors (Achan, 1968;
Couilloud and Guiol, 1980; Atuahene and Souto, 1983). It is surprising to
note that mating was not mentioned as a problem in any of the three
reports. However, other problems arose with artificial diets, namely
lengthened development duration (Achan, 1968) and high larval mortality
(Achan, 1968; Atuahene and Souto, 1983). Large percentages of larvae died
due to non-feeding in the first instar (Atuahene and Souto, 1983). The
rearing technique of Couilloud and Guiol (1980) appears to be satisfactory, as
no adverse effects were mentioned.

17
2.9 Control
2.9.l Silvicultural control
Control of H. robusta infestation through silvicultural methods was
stressed when the insect problem was first brought to attention around the
turn of this century (Coventry, 1899; Anon., 1918; Beeson, 1919). Suggested
approaches included cutting and burning infested shoots, planting young
seedlings away from flowering trees, and/or sack-banding of flowering trees.
These approaches are either labour-intensive or based on the assumption
that the annual infestation by H. robusta began with the flower generation,
which has so far been found true only in northern India (eg Beeson, 1919).
Summarising earlier studies, Entwistle (1967) recommended growing host
species a) with some lateral shade, b) with ca. 50% overhead shade, c) with
an admixture of a non-host species, preferably within the same row as the
host, and d) if possible away from the centres of active infestation. While
many reports pointed to lessened attack of host trees planted in shade
(Kalshoven, 1926; Beeson, 1941; Campbell, 1964; Lamb, 1968), conflicting
reports exist regarding the shade effect. Roberts (1966) found that shade or
cover did not reduce attack by H. robusta. Studies in Latin America
indicated that attack by H. grandella is widespread regardless of whether
host trees are grown in the open or in heavy shade (Tillmans, 1964; Chable,
1967; Combe and Gewald, 1979). Newton et al. (1993) explained the
conflicting reports by the contrasting effects of overhead and lateral shade.
They suggested that host trees planted in excessive overhead shade are less
likely to recover after attack, thus accentuating the infestation problem,
whereas lateral shade reduces the growth and production of branches and
thereby also reduces the number of sites available for attack. Efforts
involving mixed-species planting did achieve some success. Trials in
Nigeria showed that when the host and the non-host plants were planted in
the same lines, some degree of control was evident (Roberts, 1968). Similar
success was reported with regard to the control of H. grandella (see Newton
18
et al., 1993). However, planting of mahoganies in mixture with non-
susceptible species does not guarantee successful shoot borer control
(Newton et al., 1993). The partial success may be explained by the possibility
that the presence of non-host trees hinders the location of host trees by egg
laying moths (Grijpma, 1976; Morgan and Suratmo, 1976). Growing host
trees away from the centres of active infestation is another approach aimed
at hindering the host-locating process. The practice is encouraged in India
(Beeson, 1941) and Australia (Froggatt, 1923, 1927). However, this approach
is unlikely to maintain lasting protection, considering the strong flying
capability of Hypsipyla (Fasoranti et al., 1982). In fact, host trees planted a
long distance away from their natural centres are similarly attacked (Anon,
1918). Some authors proposed planting the host trees at a large spacing (10
trees/ha on maturity) (Beard, 1942; Holdridge, 1943; Cater, 1945). Low
densities of susceptible trees may prevent build-up of insect populations (eg
Weaver and Bauer, 1986; see also Watt, 1992). The relevance of the
hypothesis to Hypsipyla is seen in the notion that moths of H. grandella
tend not to disperse away from active infestation sites (Grijpma and Gara,
1970a). Accepting the seemingly inevitability of attack, some workers
proposed planting the trees on good sites to increase their tolerance, since
sap production, which sometimes drowns the invading larvae (Roberts,
1968), is more vigorous in fast-growing trees than in slow-growing trees
(Lamb, 1968) and trees which display higher vigour are also better able to
recover after attack (Grijpma, 1976).
As an alternative to traditional silvicultural control methods,
Grijpma (1976) and Newton et al. (1993) stressed the need to switch to
resistant Meliaceae species or to select races or strains of the meliaceous
species that display resistance. This approach appears to be promising, as
exotic Meliaceae species often have been less susceptible to attacks by native
Hypsipyla spp. (Chable, 1967; Lamb, 1968; Grijpma and Ramalho, 1969;
Grijpma, 1970; Akanby, 1973) and some of them are of comparable wood

19
qualities to the native host trees (Grijpma, 1976). A good example is shown
by the fact that T. australis and C. odorata, the respective principal host of H.
robusta and H. grandella, can be safely grown in pure plantations in Latin
America and in Nigeria respectively (Grijpma, 1976). The relative
immunity of C. odorata in Nigeria was suspected to be the result of non
preference, while that of T. australis in Latin America appears to be due to
antibiosis (Grijpma, 1976). The toxic effects of T. australis to H. grande/la can
be successfully translocated to C. odorata shoots by grafting (Grijpma and
Roberts, 1975). A major obstacle in adopting this approach is the tendency
for the susceptible meliaceous species to be favoured in countries where
they are indigenous (Grijpma, 1976). An alternative approach is to select
resistant strains or races within the favoured Meliaceae species. The possible
existence of such strains or races has been suggested by a number of authors
(Lamb, 1966; Roberts, 1966; Grijpma, 1976). A report in Australia claimed to
have found a variety of T. australis that appeared to be more resistant
(Anon., 1958). No follow-up reports are available in support of this claim.
However, a number of reports has pointed to the presence of more tolerant
provenances (Burley and Nikles, 1973; Nikles et al., 1978; Mccarter, 1986,
1988). The tolerance was characterised by the vigorous growth of the young
plants and the re-establishment of a new leading shoot with strong apical
growth after attack (Newton et al., 1993).
Selection of resistant species or subspecies appears to have a sound
chemical basis. Species in the family Meliaceae are characterised by the
common occurrence of limonoids (derivatives of triterpenes), which are
found also only in two other families (Taylor, 1981). Many of the limonoids
exhibit strong insecticidal properties (Kubo and Klocke, 1986). Different
species of Meliaceae have involved limonoids of different structures
(Taylor, 1981). For un-adapted insects, the presence of particular limonoids
may pose an insurmountable chemical barrier in the form of antifeedants or
growth inhibitors. This is shown perhaps no more strikingly than the

20
Jimonoids from the Neem tree, Azadirachta indica A. Juss., which have
been found to be effective against over 200 species of insects and mites and
have attracted world-wide attention (see Champagne et al., 1989, 1992; Lee et
al., 1991}. Although found mon: widespread in the subfamily Melioideae,
limonoids possessing insecticidal properties have also been demonstrated in
certain species in the subfamily Swietenioideae (Champagne et al., 1989,
1992). In fact, Cedrelone, a limonoid isolated from T. australis was the
second-most powerful insect growth inhibitor of the 18 limonoids tested by
Kubo and Klocke (1986). A recent study has indicated that the toxic effects of
T. australis to H. grandella are due to the presence of A,B-seco limonoids
(Agostinho et al., 1994). The fact that H. robusta is able to restrict its host
exclusively to the otherwise highly toxic T. australis is not surprising ng
time co-evolution may have led to the formation of some forms of
detoxification mechanism in the insect. Utilisation of plants with potent
toxic chemicals by specialist insects have been well documented (see Bell,
1987). These insects may even use the toxic chemicals or their derivatives to
aid their host selection processes. It is of interest to see whether the effective
components of the volatiles from T. australis that have been shown to be
toxic to H. grandel/a (Grijpma and Gara, 1970b) are used by H. robusta as
olfactory cues.
2.9.2 Biological control
Although a large number of natural enemies has been reported, the
observed natural mortality rates of H. robusta due to these parasites and
predators are very low (Roberts, 1968; Singh and Misra, 1988). A fungus was
recently isolated from the dead larvae of H. robusta in India (Misra, 1993). It
achieved an 80% kill of the larvae when sprayed with a spore culture of the
fungus in water. Further studies are needed to evaluate the effectiveness of
the fungus in natural populations of the insect. No reports on the effects of
artificial release of natural enemies against H. robusta are available. A

21
serious attempt was made in the 1960s and 1970s to introduce some
parasitoid species of H. robusta from India to Trinidad and other parts of the
Caribbean to control H. grandella (Cock, 1985). Out of the four species
released, only the egg parasitoid Trichogrammatoidea robusta Nagaraja has
been recovered consistently from the field and the parasitisation rates were
low. It appears that biological control alone holds little promise in solving
the Hypsipyla problem.
2.9.3 Chemical Control
Information on chemical control attempts against H. robusta is
lacking. Control with conventional insecticides does not offer much hope
due to the hidden location of the larvae and the widespread distribution of
the pest (Roberts, 1968). Only partial success has been achieved with the
application of systemic insecticides (Wagner et al., 1991). Experience with H.
grandel/a revealed some effective systemic insecticides, of which carbofuran
appears to be most effective (Allan et al., 1970; Wilkins et al., 1976). It
achieved complete control for 340 days at one of the sites tested. However,
the uptake and translocation of insecticides during dry seasons may be
ineffective and caution must be exercised against the possible effects of these
insecticides on natural enemies and other insecticides (Grijpma, 1974). Due
to these considerations, chemical control with systemic insecticides is
recommended only as an interim measure and only as part of an overall
programme of integrated pest management (Wilkins et al., 1976).
2.9.4 Other control methods
Samaniego and Katiyar (1974) tested the effect of gamma radiation on
final instar larvae, pupae and adults of H. grandel/a. Complete sterilisation
of male and female moths was obtained in all treated development stages,
with the adult as the most effective stage. The prospect of using sex
pheromone to control the Hypsipyla problem appears to be good, as males of

22
H. robusta and H. grandella exhibit distinct pheromone-guided sexual
behaviour (Holsten and Gara, 1974; Bosson and Gallois, 1982).
2.10 Conclusions
Attack by the mahogany shoot borers on the Swietenioideae species of
the Meliaceae has probably existed for thousands of years. The problem was
brought to attention when the timber value of these species was realised.
Ironically, human efforts to boost the production of these valuable timber
trees by establishing them in large scale plantations have aggravated the
problem by providing the insects with abundant food sources and an
environment unfavourable for the full expression of their natural
controlling factors.
Two distinct control strategies have emerged in the quest to solve the
Hypsipyla problem. One focuses on the selection of resistant species or
strains or races within susceptible species. Avoiding the problem altogether,
Grijpma (1976) proposed planting alternative Meliaceae species that are
resistant to Hypsipyla attack and yet are of comparable timber qualities
(Grijpma, \976). The feasibility of such an approach has already been
demonstrated for H. grandella. As mentioned before, the insect cannot
complete its development in T. australis because of antibiosis. Species
completely immune to the attack of H. robusta within the subfamily
Swietenioideae are yet to be found, but C. odorata is reported to be a less
likely recipient of H. robusta eggs, although in this case development of the
insect does not appear to be negatively affected (Grijpma, 1976). More studies
are needed concerning the non-selection of C. odorata by H. robusta.
Another possible approach is to switch to the subfamily Melioideae, where
none of the species has been reported attacked so far. Some Melioideae
species, such as the White Cedar, Melia azadarach var. australasica produce
high quality timber (Floyd, 1989). Promising as it appears, there may be
considerable reluctance to plant alternative species in countries where

23
susceptible indigenous species are favoured for cultural and economic
reasons (Newton et al., 1993). Selection of resistant strains or races within
susceptible species is an obvious alternative when such considerations
cannot be compromised. Since tree form is the major concern of Hypsipyla
attack, any selections based on superior apical growth or recuperative ability
should also lead to improvements in tree form as well as tolerance to attack
(Newton et al., 1993). Special attention should be paid to the apical growth of
young trees, as attack on mature trees has little impact on tree form. Projects
investigating this approach have already been initiated to combat the
Hypsipyla problem in Latin America (Newton et al., 1993) and in Australia
(Spok, D., University of Queensland, Australia. PhD project). The latter
project is of particular interest as it attempts to quantify the relationship
between H. robusta attack and losses of tree form in T. australis, with the aid
of computer simulations. Finally, there may be scope in the future for
manipulating the genetic structure of susceptible species to achieve some
degree of protection against the mahogany shoot borers, for example, by
inserting genes of Bacillus thuringiensis (Newton et al., 1993; see also
Strauss et al., 1991).
Accepting the inevitability of attack, the other strategy seeks to
minimise the damage levels to susceptible species by targeting directly the
insect populations or by selecting approporiate planting designs. Approaches
directly targeted on the insect populations include the utilisation of natural
enemies and applications of chemical control agents. Although a
considerable number of natural enemies has been recorded attacking H.
robusta in the field, their efficiency in containing the insect populations has
not been seriously investigated. Existing information is restricted to the
form of sample data and points to general lack of effective control. This is
not surprising as the insect is exposed to its natural enemies for only brief
periods during its life cycles and usually occur in low densities. The cryptic
habit of the larvae also denies the prospect of success of conventional

24
insecticides. Applications of slow-release systemic insecticides may offer
some hope in containing the damage, but their effectiveness is constrained
by soil and climatic conditions and further studies are needed to assess their
effects on other insects and natural enemies (Grijpma, 1974). Selection of
approporiate planting designs is the most widely explored approach in
combating the Hypsipyla problem. It is also an approach where reports
concerning the control of the insects are least consistent, such as mixed
species planting (Newton et al., 1993). The inconsistency can be partly
attributed to the different conditions under which individual studies were
conducted. Consequently, results obtained in these studies are not strictly
comparable. Any hasty inference drawn from such studies is subject to
further scrutiny. Newton et al. (1993) explained the contrasting reports of
the effectiveness of shade provided by non-host species on Hypsipyla attack
observed in the literature, in terms of the different effects of lateral and
overhead shading, claiming that overhead shading aggravates the problem
as plants growing under such conditions are less able to recover after attack.
Lateral shading reduces the growth of branches and thus the number of sites
available for attack. Two different attack indices are mixed up in the
explanation: the likelihood of attack and tolerance, the relative levels of
which are not clear for both of the two shading schemes. What the authors
actually explained appears to be the after-attack conditions of host trees. The
effects of mixed-species planting are nested with the effects of shade and
host tree densities. No data are available for an independent appraisal of its
efficiency in reducing damage. More studies are needed to clarify the effects
of individual silvicultural methods.
Successful control of insect problems requires in-depth knowledge of
the biology and ecology of the insects and their impact on host plants. On
the part of the insects, of particular importance are the host selection
behaviour, dispersal, and population dynamics. With respect to
silvicultural control, knowledge about the host selection behaviour may

25
help determine the approporiate plant compositions and layout of mixed-
species plantations. The same plantation layout may lead to different attack
levels under different host-searching behaviour and dispersal patterns
(Stanton, 1983). On the other hand, understanding of the population
dynamics of the insects is essential for timing control applications, such as
insecticides and artificial release of natural enemies. Unfortunately, such
knowledge is scarce and fragmentary for H. robusta. Host selection patterns
are known to some extent on H. grandella, but the underlying mechanisms
remains largely unaccounted for. Practically nothing is known about the
population dynamics of eithf'~ of the two species, except that peak
infestation coincides with rainy periods. On the part of the impact of
damage on host trees, what is seen in the literature is a profusion of claims
of the seriousness of attack on tree form. Very little is known about the
quantitative aspects of the impact, such as the extent of loss of tree form or
height increment incurred on trees of different age and height under given
attack intensities. Yet knowledge of such aspects is essential in determining
the acceptable levels of attack and to what age or height young trees should
be protected before they can survive the attacks without significant Joss of
their commercial values.
Previous control attempts against the insects have been carried out
largely on a trial-and-error basis and, not surprisingly, resulted in general
lack of success. The prospect of integrated pest management (IPM) strategies
against the Hypsipyla problem has been highlighted by several authors
(Grijpma, 1974; Morgan and Suratmo, 1976; Newton et al., 1993). As it is
probably impossible to totally eliminate their damage and the objective is
rather to reduce the damage to a tolerable level, an IPM approach appears to
be ideally suited to the Hypsipyla problem. However, the economic
thresholds of the insects are expected to be very low, considering the nature
of their damage (Grijpma, 1974). Until more knowledge on the insect-plant
26
interactions and the economical impact of the damage is acquired, the full
implementation of IPM strategies is not possible.

27
Table 2.1. Plants on which attack by Hypsipyla rob11sta Moore has been recorded (from
Entwistle, 1967). Plants suspected to be attacked are not included.
Species Attacked
Toona australis (F. Muell) Harmes
T. ciliata M. Roem. T. surimi (Bl.) Men.
T. serrata (Royle) M. Roem.
T. macrocarpa (C. DC.) Harmes
Cedre/a odorata L. Cedrela spp.
Meliaceae
Pseudocedrela kotschy (Schwinf.) Harmes
Swietenia macrophylla King
S. malwgani (L.) Jacq.
Carapa guianensis Aubl.
C. procera DC.
Xylocarpus granatum Koen.
X. moluciensis (Lam.) M.J. Roem.
Khaya anthotheca (Welw.) C. DC.
K. grandifoliola C. DC.
K. senegalensis (Desr.) A. juss.
K. nyasica Stapf ex Bak. f.
K. ivorensis A. Chev.
Entandrophragma excelsum (Dawe & Sprague) Sprague
E. cylindricum (Sprague) Sprague
E. angolimse (Welw.) C. DC.
E. candollei Harmes
E. utile (Dawe & Sprague) Sprague
Chukrasia tabularis A. Juss.
Chloroxylon swietenia (Roxb.) A. juss.
Soymida febrifuga (Roxb.) A. juss.
Lovoa trichilioides Harmes
Non-Meliaceae
Dracontomelium multijugum Radek. (Anacardiaceae)
A/bizzin spp.(Mimosaceae)
Pamelia pinnata Forst. (Sapindaceae)
Tectonn gmndis L. f. (Verbenaceae)
Countries
Australia, Sri Lanka, India, Malawi, Pakistan, Solomon Islands
India, Burma
Indonesia
India, Pakistan
India
India, Indonesia
Zambia
Nigeria
Sri Lanka, India, Indonesia, Papua, Nigeria, Pakistan, Sarawak, Solomon Islands, Uganda
India, Indonesia, Pakistan, Papua
Pakistan
Nigeria
India
Indonesia
Nigeria, Pakistan, Papua, Uganda
Malawi, Nigeria, Uganda
Nigeria, Uganda
Malawi, Nigeria, Papua, Zambia
Ivory Coast, Nigeria
Uganda
Ivory Coast, Nigeria
Ivory Coast, Nigeria, Pakistan
Nigeria
Uganda India, Pakistan
India
India, Pakistan
Nigeria
India
Solomon Islands
Salomone Islands
Andaman Islands

Chapter 3
Infestation Patterns of Hypsipyla robusta Moore in a Red
Cedar Plantation
3.1 Introduction
28
Hypsipyla spp. are among the most economically important insect
pests in tropical forestry (Newton et al., 1993). Attack by the shoot borers is
the overriding factor restricting the establishment and cultivation of many
tropical members of the Meliaceae, including the Australian Red Cedar
(Toona australis (F. Muell.) Harms), Spanish Cedar (Cedrela odorata L.),
African mahogany (Khaya spp.), and mahogany (Swietenia spp.) in
countries of their origin (Newton et al., 1993). In Australia, the severe and
almost invariable attack by Hypsipyla robusta Moore, locally known as the
Red Cedar Tip Moth, has even prompted the decision to discourage any
further plantation efforts on Red Cedar (pamphlet, NSW Forestry Service),
despite its well recognised timber value (Boland et al., 1984; Floyd, 1989).
Damage by H. robusta is mainly caused by the tunnelling activity of
the larvae in the growing shoots (Entwistle, 1967). Although it does not
usually result in the death of the whole tree, attack by the shoot borer
retards the height growth and destroys the tree form, rendering it of little
commercial value (Coventry, 1899; Beeson, 1919; Anon., 1958; Entwistle,
1967). At times of high infestation levels, the attack may completely nullify
the season's growth; not only are main leaders of the current year killed, but
also laterals which have made progress on the woody sterns of the previous
years (Beeson 1919). Height growth of host trees depends on the occasional
escape of some shoots before lignification. Tunnelling usually commences
from the axil of a leaf (Coventry, 1899; Anon., 1958). Length of the larval
tunnels is often over 30 cm (Coventry, 1899). The tunnel may go as far
downward as 60 cm into the stern (Beeson, 1919; Anon., 1958) and

29
sometimes continues down into the stems of the previous year's growth,
although the latter do not usually die as a result of the hollowing (Beeson,
1919). As many as 20-40 wounds may occur on a single stem. The larva
usually remains in one shoot and pupates inside the tunnel (Beeson, 1919).
Construction of secondary tunnels may also occur (Anon., 1958), especially if
the original shoot no longer meets the developmental requirement
(Beeson, 1919), resulting in many empty tunnels found in the field (Roberts,
1968). Feeding on the bark of tree trunks and branches has also been
reported (Roberts, 1968).
Peak infestation by the insect coincides with the rainy season (Brunck
and Fabre, 1974; Morgan and Suratmo, 1976; Wagner et al., 1991). The
correlation was attributed to the triggering of leaf flush and sprouting of
new shoots. The insect population is usually kept at relatively low levels
during the dry season. Attack-induced sprouting is suspected to play a major
role in maintaining population density of Hypsipyla spp. at a certain level
until the beginning of the next rainy season (Yamazaki et al., 1992). Effects of
temperature on the temporal patterns of H. robusta have not been studied,
but low temperatures probably cause diapause of mature larvae (Beeson,
1919), and hence lower activity levels of the insect during winter months.
Attack levels vary with plot, tree and vertical positions of the shoots
or stems. A number of reports has pointed to the effects of mixed-species
planting in reducing the attack levels of Hypsipyla spp. (see Newton et al.,
1993). The practice was found to be more effective when the non-host trees
were planted within the same Jines as the host trees (Roberts, 1968).
Retention of weeds is also considered effective in reducing infestation
(Anon., 1918). In Peru, plantations of Cedrela spp. that were initially heavily
attacked by H. grandella recovered after weed control was abandoned
(Dourojeanni, 1963). The protective effects of mixed-species planting cannot
be entirely attributed to the physical disruption of the host-finding procesess
by the presence of non-host species. Grijpma (1976) reported that H.

30
grandella was able to limit its attack on the local Meliaceae species and leave
the exotic Meliaceae species intact, although the latter were mixed with the
former at an inter-tree distance of only 3 metres. The same study also
reported exclusive attack on host Meliaceae species when the host and non
Meliaceae species were mixed at a ratio of only 1 to 11. Newton et al. (1993)
attributed the success of mixed-species planting to the combined effects of
three factors: (1) shading, (2) low density of susceptible species, and (3)
growth rate, with all factors contributing in a synergistic way due to the
often interactive nature of their effects. Attack is usually more severe on
trees growing in full sunlight than on trees growing under the shade of
other tree species (Froggatt, 1923; Mitchell, 1972; Wagner et al., 1991).
Campbell (1964) indicated that SO'Yo shade is necessary to reduce infestation.
Lateral rather than overhead shade is suggested as protective as it reduces
the production and growth of branches and promotes the growth of the
leader and thereby reduces the number of sites available for attack (Newton
et al., 1993). Low-density planting of susceptible species is considered as
effective in preventing the build up of the pest populations, as such a
system mimics that in the natural forest (see Newton et al., 1993). The effect
of growth rate has been subjected to conflicting viewpoints. Some advocated
that slower growing trees were more susceptible to attack (Lamb, 1968),
while others reported a positive correlation between growth rates and attack
levels (Whitmore, 1978). The latter viewpoint is supported by the finding
that the insects select for oviposition sites the newly produced shoots (Gara
et al., 1973), which are more abundant on faster growing trees. In addition,
higher population densities of natural enemies may also have contributed
to the lower attack levels in mixed plantations (Anon., 1958).
Distribution of attack levels within a plot does not seem to be
uniform or random. Froggatt (1923, 1927) noted that susceptible trees were
often less than 5-6m tall. Roberts (1966) even gave the maximum tree
heights of three host species below which attack was observed. The lower

31
threshold in tree height of susceptible trees appears to be very low. In India,
vigorous seedlings of host trees are attacked when as young as 3 months and
less than 50 cm high (Beeson, 1941). Morgan and Suratmo (1976) reported
that trees less than 13 years old were attacked more often, with the heaviest
attack on trees 3-6 years old and 2-8 m tall. Trees over 15 m tall and aged 13
years or more were only slightly attacked or not attacked at all. They fitted
linear regressions of attack intensity against tree height and age. This height
related difference in attack levels was suspected to be caused by the flight
behaviour of the moths, as most did not exceed an altitude of 10 m (Morgan
& Suratmo, 1976). Lower incidence of shoot attack in mature trees was
attributed to their seasonally more restricted production and elongation of
terminal shoots (see Entwistle, 1967). In addition, the terminal shoots of
fruiting trees were suspected to contain chemicals that cause antibiosis in
the larvae (Grijpma, 1976). It is also possible that large trees were similarly
attacked as small trees but, due to their numerous branches and shoots, the
percentages of shoots attacked would be lower and hence they appear to be
less heavily attacked. Attack on mature trees by H. robusta has been reported
(Coventry, 1899; Anon., 1958). It is even claimed that any infestation that
occurs is traceable to mature trees in the neighbourhood (Beeson, 1918). A
more consistent hypothesis regarding the effects of tree size is that large
trees suffer Jess from the attack than small trees in terms of height growth
and deterioration of tree form (Coventry, 1899; Grijpma, 1976; Newton et al.,
1993), as attack in large trees tends to be confined to branches (Coventry,
1899) and therefore poses no threat to the already established straight bole
(Grijpma, 1976). Based on the more tolerant response of large trees,
Holdridge (1943) suggested planting host trees in full sunlight in favourable
sites so that they could pass quickly through the susceptible stage with the
chance of establishing a reasonable length of straight bole before attack
ensues. In addition to tree size, the inter-tree variations in attack levels may
also be influenced by tree vigour (Entwistle, 1967) and attack history of
32
individual trees. The latter possibility is backed by the suggestion that egg
laying females are attracted by volatiles given out by the activities of feeding
larvae (Roberts, 1968).
The within-tree distribution of attack of H. robusta has not be<>n
separately studied. Coventry (1899) noted that attacked shoots were often
over 30 cm in length. Study on H. grandella indicates that upper and
terminal shoots are more frequently attacked than lateral shoots or middle
stems (Yamazaki et al., 1992). The pattern appeared to apply only to the
tunnelling activity of mature larvae, as 1st-2nd instar larvae were mostly
found in the lateral shoots. Shoot diameter and slenderness may also affect
the susceptibility of shoots to attack, as small and slender shoots are less
likely to harbour late instar larvae (Grijpma, 1976).
Despite the enormous effort devoted to the study of Hypsipyla spp.
around the world, current knowledge on the temporal and spatial patterns
of the infestation and its impact on the growth of host trees is largely
qualitative rather than quantitative. Much of the published information in
this field is in the form of anecdotal reports or summaries based on such
reports, coupled with the authors' speculations or untested hypotheses.
Frequently these reports are subjected to conflicting viewpoints. Concrete
data on H. robusta are especially lacking. The few reports available are
mostly concerned with the Indian and African populations of the insect.
Quantitative data on the damage characteristics of H. robusta on Australian
Red Cedar are therefore urgently needed.
Studies of the temporal and spatial patterns of infestation are
important in pest management. Results obtained by such studies can be
used directly in timing controls and setting up efficient monitoring
programmes. Indirectly, they provide us with valuable information as to
the major factors governing the population dynamics of the pest insects,
which, in turn, can be used to design better management strategies.

33
3.2 Methods
3.2.l Description of the field site
The field site is in a private farm ca. 5 km north of Macksville, a
coastal town in mid-north New South Wales (30°42'S, 152°55'E). The region
has an annual rainfall of 1492 mm and a minimum monthly temperature
of ca. 12° C. Red Cedar is indigenous to this part of New South Wales and
mature trees can still be found in scattered locations. These mature trees
probably host active H. robusta populations, as an examination of one of the
trees revealed a substantial number of live pupae of this insect.
The farm has a total area of 22 ha. The land is a mosaic of pasture,
patches of remnant forest, and planted trees. Trees in the remnant forest
mainly consist of Sydney Blue Gum (Eucalyptus saligna), Flooded Gum (E.
grandis), Tallow Wood (E. microcorys), and some rainforest tree species.
Most of the eucalypt trees are over 15 m tall. One of the remnant forest
patches, situated along the eastern boundary of the farm, is relatively large,
occupying almost one quarter of the land. In the middle of the farm is a 3 ha
block planted, until recently, with peach and nectarine.
Since January 1987, Red Cedar trees have been planted at various
locations on the farm (Figure 3.1). Except for a few scattered trees, all
planting was concentrated in four plots: Open-1, Open-2, Forest-1 and
Forest-2. The four plots and the three isolated groups are separated by at
least 50 m. Plot Open-1 was established during January 1987 - December 1989
in an open area on the eastern slope. The eastern edge of the plot is ca. 10 m
away from the large forest patch. The plot consists of a total of 746 trees, 495
of which are Red Cedar. The rest are Silky Oak (Grevillia robusta Cunn.,
n=209), White Beech (Gmelzna leichhadtii F. Muell., n=14) and Teak
(Flindersia australis R. Br., n=28). All trees were planted at a 3 x 3 m spacing.
The layout of the plot is shown in Figure 3.2. According to species
composition, the plot can be divided into three blocks: block-1 (columns 1-
6), pure Red Cedar, block-2 (columns 7-16), a mixture of Red Cedar and other
34
species, and block-3 (columns 17-26), predominantly Red Cedar with a few
Silky Oaks in the north-east corner. Due to their different planting dates, the
size of the trees generally decrease from block-1 to block-3. Plot Forest-1 was
established during December 1989 - January 1991 in partially-cleared areas
inside the large forest patch. Altogether 170 Red Cedar trees were planted.
Plot Open-2 and Forest-2 were established after the initiation of sampling in
this site. Plots Open-2, consisting of 59 Red Cedar trees, were planted in July
1992 in an open area ca. 50 m from the north west corner of the large forest
patch. Surrounding the plot were some young Cedrela odorata and C.fissilis Plot
Forest-2 was established during July 1992 - August 1993 inside another forest
patch in the south-western corner of the farm. A total of 85 Red Cedar trees
were planted in this plot. The scattered trees were planted during January -
March 1987 in three isolated groups: Iso-1 (n=8), Iso-2 (n=S) and Iso-3 (n=3),
with an inter-group distance of <:100 m.
3.2.2 Sampling Procedures
From April 1992 to November 1994, 13 samples were drawn at one to
four month intervals from various plots in the field site, referred to as 51-
513 according to the sequence of the sampling. Plot Open-1 was sampled on
each of the 13 sampling occasions, as this was the plot where most Red
Cedar trees were planted. The other plots were sampled less frequently.
Fifty-two Red Cedar trees from plot Open-1 were selected as sample
trees. Care was taken to ensure that the selected trees were representative of
different tree height and locations. On each sampling occasion, all trees in
the fixed sample were measured for size and checked for damage by H.
robusta. The size indices measured were height (Ht), DBH and the number
of shoots with fully-expanded leaves (NSL) (ignoring tiny, newly sprouted
shoots) were recorded for each sample tree. Damage data were obtained by
randomly checking 10 shoots of current growth (non-lignified) from each
sample tree. When less than 10 shoots were available all shoots were
35
checked. Inaccessible shoots were cut from the bases by a pole-pruner. A
shoot was considered as damaged by H. robusta if it showed masses of larval
frass and fragments of the shoot tissue as a result of larval feeding. These
shoots were then dissected to check for the presence of larvae. The
developmental stages of the larvae were roughly determined as 1st-6th
instars according to previous rearing experiences with the insect (see
Chapter 4). Any larval tunnels found inside the main stems of the sampled
shoots were measured for length and inner diameters at both ends. Shoot
specific data were recorded for all sampled shoots on 5 sampling occasions.
The data recorded were shoot height (SHt), measured from the ground to
the terminal buds, shoot length (SL), and shoot basal diameters (SBD).
The same sampling procedure was applied to other plots in the field
site. A minimum of 60 trees in Forest-I and all trees in lso-1 - lso-3 were
sampled on each sampling occasion. Trees sampled in Forest-1 were not
fixed with regard to sampling occasions, but care was taken to ensure that
they were representative of tree height and locations. Trees in Open-2 and
Forest-2 were not sampled until July 21, 1993, due to their late planting
dates. These trees were all sampled.
Additional samplings were made in the field site to supplement
information on the damage characteristics of H. robusta and the impact of
damage on tree growth. These included tunnel dimensions and associated
larval instars, the branch height of trees (measured from the ground to the
bases of the lowest branches), and the diameters of damaged shoots at the
positions where the live and dead sections of the shoots separated
(boundary diameters). The first data set was randomly taken from Open-1
among Red Cedar trees not included in the fixed sample. Data on the branch
height were taken from all Red Cedar trees sampled with the standard
procedure. Measurements on the boundary diameters of damaged shoots
were taken on the live section sides of the boundaries as the dead sections
often showed some degree of shrinkage. Shoots containing live larvae were

36
excluded from the data as damage in these shoots was probably still in
progress. The height and DBH of all Red Cedar trees in Open-1 were
recorded on the first and last sampling occasions.
3.2.3 Weather Data
Daily rainfall data were obtained from two neighbouring farms, about
300 and 500 m away from the field site, respectively. The average of the two
data sets was used to represent rainfall in the field site. Daily temperatures
were estimated as the average of the data from the weather station in Coffs
Harbour and that in Kempsey (Australian Weather Bureau). Both weather
stations, one in the north and one in the south, are ca. 55 km away from the
field site and similarly located in the coastal areas of New South Wales,
with little elevation differences.
3.2.4 Data Analysis
Data from Open-1 were used to analyse the temporal and spatial
patterns of H. robusta infestation, as well as the damage characteristics.
Infestation levels from all plots and isolated groups of trees were then
compared to study the habitat differences. Effects of damage on tree growth
were analysed with data from Open-1 and Forest-I.
Infestation patterns
I. Temporal patterns
The temporal patterns of tip moth attack levels were analysed in
relation to rainfall and minimum daily temperature. Two attack levt;
indices were used: proportions of attacked trees and the mean percentages of
attacked shoots per tree. To enable comparisons of temporal patterns,
accumulated rainfall 30 days prior to each of the 13 sampling dates was
extracted from the daily rainfall data. The reason for such a treatment of
data is that the observed attack level in a particular sampling date was the

37
accumulated expression of continuous H. robusta activities in a period
before the sample was drawn and any possible influence of rainfall on the
attack levels should likewise be exerted through a period of time. Here the
length of the influence period of rainfall was arbitrarily taken as 30 days,
which was shorter than the length of time between any successive sampling
dates and probably long enough to take into account the indirect nature of
the influence. The temperature index used in the comparisons was the
average daily minimum temperature during the 15 days prior to each
sampling dates. The purpose was to see whether H. robusta activities were
constrained by low temperature during the winter months in the field site.
Considering the more direct nature of the influence of temperature, the
length of the influence period was taken as half of that of rainfall.
II. Spatial patterns of attack
i. Inter-tree patterns
The attack level of a sample tree can be split into two components: the
attack status (attacked or non-attacked) and the attack intensity (the
percentage of shoots attacked once the tree is attacked). Effects of five tree
specific factors on the inter-tree variations of attack status and attack
intensities were investigated. The tree-specific factors considered were: tree
height (Ht), DBH, tree form (TF, =Ht/DBH), the number of shoots with
fully-expanded leaves (NSL), and the block from which the tree was located
(Blk); the first four were numerical factors and the last a categorical factor.
For trees shorter than 1.3 m, the DBH values were extrapolated from the
diameters of tree trunks at the height of 0.5 m by assuming a constant ratio
of diameter over height in the 0.5 -1.3 m sections of the tree trunks.
Effects of individual tree-specific factors on the attack status of sample
trees were first investigated, with the exception of Blk, by comparing the
average values of the respective factors between attacked and non-attacked
trees. The effect of Blk was analysed directly by comparing the proportions of
------- ---------------------

38
attacked trees in the three location blocks. Considering the limited number
of trees in individual samples, direct comparisons in the proportions of
attacked trees among trees at various ranges of Ht, DBH and TF were
performed only on the pooled data. Such comparisons were not attempted
on NSL due to its cyclical seasonal variations. The relative importance of
these factors was assessed by logistic regressions and associated analysis of
deviance (Everitt, 1994), with the attack status of individual trees (1 for
attacked, 0 for non-attacked) as the dependent variable and the tree-specific
factors as the independent variables. Analyses on the attack status were
performed for those samples with the proportion of attacked trees in the
range of 20-80%. Samples outside this range were excluded as little
information was available concerning the suitability of sample trees when
the attack level was too high or too low.
Similar analyses were applied to the effects of tree-specific factors on
the attack intensities. In the case of numerical factors, the effects were
analysed by comparing the average values of each factor between relatively
heavily attacked and relatively lightly attacked trees. A tree was considered
as relatively heavily attacked if its percentage of attacked shoots was higher
than the sample average. Otherwise it was considered as relatively lightly
attacked. The effect of Blk was analysed by comparing the average
percentages of attacked shoots per tree of trees in the three location blocks.
To ensure adequate group sizes, separate comparisons were made only for
those samples with the number of attacked trees <::20. The relative
importance of individual tree-specific factors was analysed by linear
regression models and associated ANOVAs (Neter and Wasserman, 1974).
As the dependent variable, the percentages of attacked shoots per tree were
transformed with the arcsine-squared root transformation to stabilise the
variances (Steel and Torrie, 1960). Due to the limited number of attacked
trees in individual samples, the regression analysis was applied only to
samples with the number of attacked trees <::20.

39
ii. Within-tree patterns
Within-tree patterns of attack were investigated with respect to shoot
height (SHt), relative shoot height (RHt, =shoot height /tree height), shoot
length (SL), shoot basal diameter (SBD), and shoot slenderness (SS, =shoot
height /shoot basal diameter). Effects of shoot-specific factors on the attack
status of shoots were analysed by comparing the proportions of attacked
shoots at various ranges of each factor and by logistic regressions. The
analyses were performed on the pooled data of all shoots from attacked trees
of all samples with shoot-specific data collected. Shoots from non-attacked
trees were excluded as they might not have been subjected to H. robusta
selections.
iii. Habitat differences
Proportions of attacked trees planted in the open (Open-1 and Open-2)
and inside the forest (Forest-1 and Forest-2) at the same sampling occasions
were compared to assess the effects of host habitat on attack levels.
Comparisons of attack levels were also made between trees in Open-1 and
trees in the three isolated groups (Iso-1, Iso-2 and Iso-3).
Impact of damage
I. Damage characteristics
Two damage characteristics were investigated with data from Open-1:
(a) the number of shoots attacked per larva, (b) damage site, and (c) tunnel
size. The number of attacked shoots per larva was estimated from sampled
shoots of trees on which larvae were found. Damage site was analysed with
respect to the types of host tissues (buds, leaf petioles, shoots, lignified stems
or tree trunks) and the diameter of the shoot or stem at the position where
the tunnel started. Tunnel volumes were calculated from the median
diameters ((upper diameter + lower diameter)/2) of the tunnels and tunnel
lengths, by assuming cylindrical shapes of the tunnels. Since tunnel

40
diameters were only measured for those constructed by mature larvae, the
diameters of tunnels constructed by younger larvae were indirectly
estimated by assuming a constant ratio of tunnel diameter to larval head
capsule width. Head capsule widths of individual larval instars were
extracted from a separate study (Chapter 4).
II. Survival of damaged shoots
The boundary diameter of a shoot marks the lowest position in the
shoot below which the shoot has survived the boring activities of larvae of
H. robusta attack. Since the diameter of a shoot generally increases from tip
to base, the boundary diameter also indicates the minimum diameter in the
live section of the shoot. In other words, the shoot is dead from tip down to
any positions with diameters less than that boundary diameter. Hence, the
probability of a damaged shoot dying from tip up to a given diameter can be
estimated by the percentage of damaged shoots with boundary diameters
greater than the given diameter. Estimation was done for each boundary
diameter in the data set. The estimated probabilities were modelled by the
equation:
P = c I [a +exp( b· BD)], BD2:0 (3.1)
where P is the probability of a shoot dying from tip to a position with
diameter BD, a, b and care model parameters, with c= a+ 1. Pis a monotonic
decrease function of BD, obtaining its maximum value of 1 when BD is 0
and approaches 0 when BD approaches 00 •
III. Effects of damage on tree growth
Effects of damage on the growth of tree height and the changes of tree
form during the period between the first and the last samples were
investigated. The height increments of individual trees in Open-1 during
41
that period were studied in relation to their attack levels (percentages of
attacked shoots) in individual samples and the number of times each tree
was attacked across the samples, as well as their initial height, DBH and tree
form values as shown in the first sample (51). ANOVA based on linear
models was used to assess the effects of individual factors and multiple
factors. The same set of factors was considered in logistic regressions to
assess their effects on the directions of changes in tree-form values (increase
or decrease) of sample trees in Open-1 during the same period. Damage on
the growth of trees in Forest-1 can not be directly assessed in the same way
as in Open-1 since the trees sampled on each sampling occasion were
randomly taken from the plot and hence the damage history of individual
trees was not known. However, as has been pointed out earlier, these
Forest-located trees had experienced relatively less attack compared to those
planted in the open and in isolated groups. It is of interest to see whether
the light attack levels were reflected in better tree growth. To this end, the
overall height increment of trees in Forest-1 and Open-1 between the first
and the last sample was compared. To reduce the effect of initial tree height,
the comparison was restricted to trees with their initial height in the range
of 200-300 cm (inclusive at right). Comparison was also made of the tree
form values and the percentages of unbranched trees in the last sample
between the two plots.
Statistical tests
All statistical analyses were performed in 5-Plus (Everitt, 1994) in the
Unix environment. The 5-Plus functions and associated test statistics used
in testing the significance of attack-related differences, correlations,
goodness of fit, and effects of factors in regression models are summarised
in Table 3.1.

42
3.3 Results
3.3.l Temporal patterns
Summary statistics of infestation levels at successive sampling dates
are given in Table 3.2. The proportions of attacked trees varied between O
and 100%. Except for the two samples (52 and 53) showing no attack, the
average percentages of attacked shoots per tree ranged from 2.6 to 74.3%. The
relationship between the proportions of attacked trees and the average
percentages of attacked shoots per tree can be described by an upper-plateau
exponential equation (Figure 3.4).
Variations in the average percentages of attacked shoots per tree
among the 13 samples were significantly correlated to the rainfall index (P
<0.05). The two variables were closely matched over most of the sampling
period, with apparent mismatch shown only in 59 (Figure 3.3). For some
successive sample pairs, matching was shown not only in direction but also
in magnitude. Temporal variations in proportions of attacked trees were
only Elightly correlated with the rainfall index (P< 0.1). The temperature
index was significantly correlated to both of the attack indices (P <0.05), with
a better matching shown with the proportions of attacked trees (Figure 3.3).
Although peak periods of the temperature index did not always correspond
to peak attack proportions, the 3 valleys in their temporal trends all
coincided. Of special interest were the two samples (52, 512) recording no H.
robusta attack. Both samples corresponded to the times when the average
minimum daily temperature was below 6.5°C.
3.3.2 Spatial patterns
Inter-tree patterns
I. Attack status
Six samples had the proportions of attacked trees in the range of 20-
80%, namely 53, SS, 56, 58, Sll and 513 (Table 3.2). All showed higher
average values in Ht, DBH and NSL, and lower values in TF among

43
attacked trees (Figure 3.S). However, significant differences (P< O.OS) in the
average values of all the four factors between attacked and non-attacked
trees were detected only in S3. The other significant differences detected
were Ht in S6 and TF in SS. No significant differences in the proportions of
attacked trees among trees in the three location blocks were detected (P >0.1).
Analyses on the pooled data showed that the attack proportions increased
with Ht and DBH but decreased with TF (Figure 3.6). The overall changes
were significant with respect to each of the three factors (P< O.OS). However,
after the exclusion of trees with Ht5 lSO cm, or DBH5 O.S cm, or TF> 100, the
attack proportions of trees in the remaining ranges of the respective factors
(Figure 3.6) no longer differed significantly (P> 0 1).
Factors included in the final logistic models through stepwise
regressions for each of the six samples are shown in Table 3.3. At the
significance level of P <0.0S, non-null models were obtained only for 53 and
SS, with TF and NSL as the sole independent variables included,
respectively. At the significance level of P <0.1, two more samples yielded
non-null models, S6 and S13 (Table 3.3). Again only one variable was
selected for each model, Ht in S6 and DBH in S13. Models in S3 and SS
remain the same despite the relaxation of the entry criterion. It needs to be
pointed out that in 53, Ht, DBH and NSL also showed significant effects (P<
0.0S) on the independent variable when introduced alone, but the addition
of any of them did not result in any significant improvements of the model
with TF already in. The same was true with DBH, the inclusion of which
even made TF redundant. However, the selection of Ht or NSL as the first
variables still left room for the introduction of either TF or DBH (P< O.OS).
None of the tree-specific factors showed significant effects on the
logarithmic odds of attack in SS and Sll (P> 0.1). The deviance explained by
<.'1e significant models in individual samples was ger.erally low ( < 2S%)
(Table 3.3).

44
II. Intensities of attack
Eight samples had the numbers of attacked trees :2:20: Sl, S3-S6, SB, Sll
and S13. In most samples, the differences in the average values of Ht, DBH,
TF and NSL between relatively heavily attacked and relatively lightly
attacked trees were not significant (P >0.1) (Table 3.4). The differences were
slightly significant for NSL in S4 and for Ht and DBH in SS (P< 0.1), with
lower average values of NSL and higher average values of Ht and DBH
among attacked trees. However, the attack intensities appeared to be
influenced by tree locations. Trees mixed with non-host trees (block-2)
generally had lower attack intensities than trees planted in pure host tree
blocks (block-1 and block-3) (Figure 3.7). Significant differences of
comparisons involving block-2 trees were found in 4 samples (P <0.1 in Sl,
P<O.OS in S2 and S13, P<0.01 in S4), all revealing less intensive attack among
block-2 trees, at least in comparison with trees in one of the other two
location blocks (P <0.0S).
Linear dependence of the attack intensities on the tree-specific factors
was detected by ANOVA in 4 samples, Sl, S3, S4 and S6, at the significance
level of P<O.OS (Table 3.5). NSL showed significant effect in all the 4 samples.
It was the only significant variable in 53 and 56 and the most significant
variable in S4. The identities of other significant variables were not
consistent. In 51, all the numeric variables were significant, the most
significant of which was DBH, followed by Ht, NSL and TF. In addition to
NSL, Blk and TF also contributed significantly to the attack intensities in 54
when introduced alone into the model. When the entrance criterion was
relaxed to P<0.1, two more samples resulted in non-null models, SS and
Sl3, both including Blk as their significant variables. After the selection of
the most significant variables, no other variables could be entered into the
models in 3 of the 6 samples. Blk was the only additional variable that could
be entered in the 3 remaining samples. When significant, the tree size
variables, Ht, DBH and NSL, contributed negatively and tree form (TF)

45
positively to the attack intensities, as indicated by the signs of their
coefficients in the models (Table 3.5).
Within-tree patterns
The pooled data contained a total of 1231 shoots from attacked trees,
of which 314 shoots were attacked. There appeared to be a gradual increase
in the proportions of attacked shoots as the values of all the shoot-specific
factors increased (Figure 3.8). However, the patterns of the increase and their
significance (P< 0.05) varied with factors. With regard to shoot vertical
positions, the attack proportions were more influenced by relative shoot
height than by absolute shoot height. Shoots with their terminal buds
positioned at over 80% of tree height suffered significantly more attacks
than shoots positioned at ::;70% of tree height, with the top shoots (RHt
>0.90) attacked over twice as severely as most of the lower-positioned
shoots. Significant effects of absolute shoot height were shown only when
the comparisons involved shoots of ::;100 cm high. An almost linear
relationship was apparent between the attack proportions and shoot length,
with significant differences detected between all non-adjacent columns. The
effect of shoot basal diameter was less gradual. Shoots with SBD ::; 0.4 cm
were significantly Jess frequently attacked than shoots in any of the other
SBD ranges. Significant increases in the attack proportions over shoot
slenderness was restricted in the range of SS ::;Jo.
Results of logistic regressions showed that all shoot-specific factors
had significant effects on the logarithmic odds of attack (P< 0.05) (Table 3.6).
The most significant factor was RHt and the least significant SHt. The final
model contained 3 factors: RHt, SBD and SS, and was highly significant (P<
0.0001) (Table 3.6). As with tbe analyses of the attack status of trees, the
model accounted for only a small proportion of the null deviance in the
logarithmic odds ( <5.81 %).
46
Habitat differences
Trees in Forest-1 were sampled for H. robusta damage on 10 of the 13
sampling occasions. The proportions of attacked trees stayed below 21 %,
with no attack recorded in three samples (Figure 3.9). In five of the seven
samples where attack was observed in both plots, the attack proportions in
Forest-1 were only about one-tenth to one-third of that in Open-1. Higher
attack levels were observed in Forest-1 in the remaining two samples. As
with the spatial attack patterns in Open-1, the average height of attacked
trees in Forest-1 was consistently greater than that of non-attacked trees,
with significant differences detected in most samples (P<0.05) (Table 3.7).
The differences appeared to be caused by the lower limit of the height
ranges, as the upper limit was very close between attacked and non-attacked
trees (Table 3.7). The shortest attacked trees recorded in these samples were
60 cm tall. Analyses of the pooled data revealed a steady increase in the
attack proportions as tree height increased (Figure 3.10). Trees over 400 cm
tall suffered over 4 times as much attack as trees below or equal to 100 cm
tall. Despite the possible effect of tree size, the generally lower attack
frequencies among forest-located trees as compared with open-located trees
were still evident after the removal of trees ~ 200 cm tall in both plots (Table
3.8). However, as expected, the proportions of attacked trees increased
somewhat in Forest-1 after the exclusion of small trees, reaching a
maximum of 43.2%. Statistical tests in the attack proportions between the
two plots were performed only for 3 samples due to the requirement of the
chi-square test (the number of attacked and non-attacked trees in either plot
should be at least 5) (Steel and Torrie, 1960). The only significant differences
detected at P<0.05 pointed to higher attack proportion in Open-1.
The effects of habitat on attack levels was more sharply shown in the
comparison between Forest-2 and Open-2 (Figure 3.9). Most trees in both
plots were planted about 3 months after the initiation of sampling in the
field site. One year later attack by H. robusta was observed in Open-2.
47
Within 5 months, the proportion of attacked trees rose to about 70% and
this high level was basically maintained, with the exception of 512, where
no attack was recorded in all plots, during the rest of the sampling period.
On the contrary, attack in Forest-2 was recorded only on one sampling
occasion and only on a single tree.
Proportions of attacked trees among isolated trees across the samples
were comparable to those in Open-1 (Figure 3.11). The two trends generally
agreed, with their correlation significantly different from zero (P< 0.05). The
temporal correlation in attack proportions still held when data from
isolated trees, Open-1 and Forest-1 were considered together (P< 0.05).
However, attack within the isolated trees did not seem to be synchronous
(P> 0.1). More persistent infestationswere seen in Iso-3 than in the other two
isolated groups (Figure 3.11). The discrepancy probably arose as a result of
the small number of trees in each group.
3.3.3 Impact of damage
Damage characteristics
A striking feature of H. robusta damage noticed during the sampling
process was the high number of shoots showing damage symptoms but with
no larvae. The percentages of trees attacked but with no larvae (live or dead)
often exceeded 25% and could be as high as 100% (Table 3.9). Even among
those trees on which larvae were found, not every attacked shoot yielded
larvae. The average number of attacked shoots per larva found among
attacked trees was 2.6 ± 1.6 (0.5-8) (mean± SD). Mortality during the larval
stage appeared to be high (Table 3.9). In seven of the 10 samples where
larvae were found, at least one third of the larvae were dead and most of the
dead larvae were already in their late instars (5-6th).
Larval tunnels were found at all above ground non-photosynthetic
tissues of the host trees, with the current-growth shoots as the most
frequent tunnel construction site (Plate 1). Tunnels constructed by young
48
larvae were mainly found in leaf petioles and terminal buds and those by
older larvae in the stems of the shoots. However, there were some
exceptions. Some mature larvae bored into lignified stems for pupation and
many young larvae were found inside abandoned tunnels. Some larvae did
not construct any tunnels and fed directly on the epidermis of the shoots or
stems under the concealment of frass or other existing forms of
concealment. Different choices of tunnel construction sites by larvae of
different instars were partly reflected in the diameters of the host tissues at
tunnel entrances (Figure 3.12). Although there was considerable
overlapping, the average entrance diameters differed significantly between
larvae of 1st-2nd, 3rd-4th and 5th-6th instars (P< 0.0001). Entrance diameters
below 0.30 cm were only associated with larvae of the first two instars and
those above 1.00 cm were restricted to larvae of the last two instars. Highly
significant differences (P< 0.0001) among larvae of the three age groups were
also found in tunnel lengths, the average of which increased from 2.2 cm in
the 1st-2nd instars to 6.3 cm in the 5th-6th instars. Tunnels constructed by
1st-2nd instar larvae were not longer than 5 cm whereas those by 5th-6th
instar larvae could be as long as 22 cm. However, as with the entrance
diameters, clear boundaries did not exist in tunnel lengths between larvae
of successive age groups. Tunnels constructed by mature larvae were
sometimes well within the length range of tunnels produced by young
larvae. These short tunnels of mature larvae were probably of secondary
entries and made for pupation rather than feeding, as most of them were
found inside lignified tissues. A better distinction between tunnels
prodl.lced by larvae of the three age groups was seen in tunnel volumes.
Tunnels constructed by the last two instar larvae had an average volume of
l.41 cm3, with a maximum of 5.77 cm3, while those made by larvae of lst-
2nd and 3rd-4th instars were 0.02 cm3 and 0.27 cm3, respectively. The
relative volumes of the tunnels for larvae of the 3 age groups were ca.
1:14:71.

49
Survival of damaged s/Joots
The shoot boundary diameters obtained fell in the range of 0.3 -1.5
cm, with the majority distributed between 0.4 cm and 0.8 cm (Figure 3.13).
The estimated probabilities that shoots damaged by H. robusta would die
from tip down to given positions decreased in a 'Z'-shaped fashion as the
diameters of the positions increased, approaching zero when the diameters
were greater than 1.0 cm (Figure 3.14). The relation was well fitted by the
modified logistic equation (Equation 3.1) (Figure 3.14), with 99.36% of the
variations in the estimated probabilities explained by the model. Both
parameters in the model were significant (t-test, P<0.0001).
Damage to tree growth
The height of the sample trees in Open-1 increased on average by
78.36 cm during the 32-month sampling period. The increment for
individual trees ranged from -90 cm to 218 cm, with 4 trees recording
negative growth. Except for SS, variations in the height increment (Ht;ncre)
were not significantly influenced by the attack levels of individual trees
(percentages of attacked shoots) recorded in individual samples (P> 0.1)
(Table 3.10). Slightly significant effects (P< 0.1) were shown in bs. Compared
with the attack levels in individual samples, the number of times
individual trees were attacked across the samples exhibited much stronger
influence on the height increment, but the effect was positive, ie. larger
height increment was associated with more frequently attacked trees (Table
3.10). However, none of the damage indices were significant (P> 0.1) after
the effect of initial tree height was introduced into the linear model. In fact,
all the three numerical tree-specific factors considered in the initial sample,
Ht1, DBH1 and TF1,, were highly significant (P< 0.001) on the tree height
increment, with TF1 as the most significant factor (Table 3.10). The final
model included 2 initial factors, DBH1 and Blk at the significance level of P<
0.05, although the latter was not significant (P> 0.1) on its own:
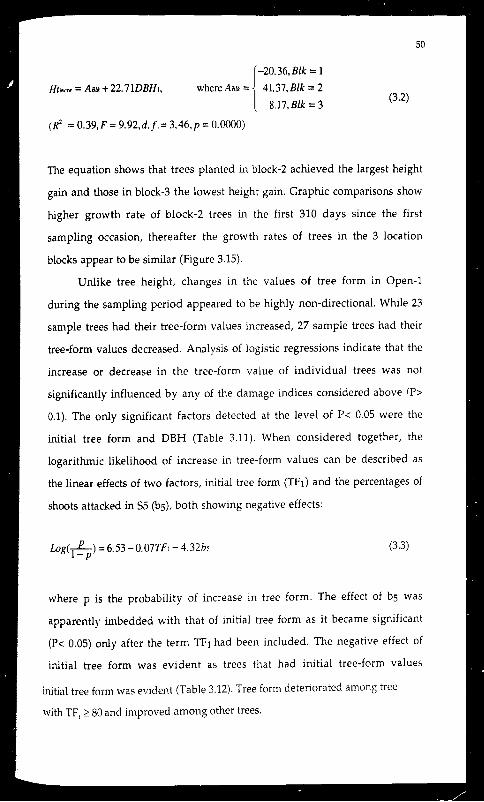
Htu.m = ABlk+22.7IDBH1, J-20.36,Blk = 1
where ABlk "' [ 41.37, Blk : 2 8.17,Blk - 3
(R2 = 0.39,F = 9.92,d.f.= 3,46,p = 0.0000)
50
(3.2)
The equation shows that trees planted in block-2 achieved the largest height
gain and those in block-3 the lowest height gain. Graphic comparisons show
higher growth rate of block-2 trees in the first 310 days since the first
sampling occasion, thereafter the growth rates of trees in the 3 location
blocks appear to be similar (Figure 3.15).
Unlike tree height, changes in the values of tree form in Open-1
during the sampling period appeared to be highly non-directional. While 23
sample trees had their tree-form values increased, 27 sample trees had their
tree-form values decreased. Analysis of logistic regressions indicate that the
increase or decrease in the tree-form value of individual trees was not
significantly influenced by any of the damage indices considered above IP>
0.1). The only significant factors detected at the level of P< 0.05 were the
initial tree form and DBH (Table 3.11). When considered together, the
logarithmic likelihood of increase in tree-form values can be described as
the linear effects of two factors, initial tree form (TF1) and the percentages of
shoots attacked in SS (b5), both showing negative effects:
Log(_p_I )=6.53-0.07TF1-4.32b -p
(3.3)
where p is the probability of increase in tree form. The effect of bs was
apparently imbedded with that of initial tree form as it became significant
(P< 0.05) only after the term TF1 had been included. The negative effect of
initial tree form was evident as trees that had initial tree-form values
initial tree form was evident (Table 3.12). Tree form deteriorated among tree
with TF, ~ 80 and improved among other trees.
51
Similar effects were also evident in initial tree height and DBH except that
their effectswere positive, ie., bigger trees tended to increase their tree-form
values whereas smaller trees tended to decrease their tree-form values
(Table 3.12).
Forest-located trees appeared to have been growing at a faster rate
than Open-located trees (Figure 3.16). The overall height increment in plot
Forest-1 was over twice as much as that in plot Open-1 for trees with their
initial height in the same range (200-400 cm). Better growth of Forest-located
trees was more convincingly shown in the tree-form values. For trees tall
enough to have DBH records (>1.30 m), the average tree-form values in
Forest-1 (189.95 ± 87.22) (mean± SD) was almost 2.5 times as high as that in
Open-1 (78.76 ± 16.47 ) in the last sample. The difference can be partly
explained by the percentages of un-branched trees in the two plots. While
each sample tree in Open-1 had branched by the last sampling occasion, 47%
of the trees in forest still maintained the single-stem form. Even for trees
over 300 cm tall, the percentage was still over 15%.
3.4 Discussion
3.4.l Temporal Patterns
Comparisons of the temporal trends between the attack levels and the
weather data indicate that levels of H. robusta infestation were influenced
by the amount of rainfall and by the daily minimum temperature. The
average percentages of attacked shoots per tree of all trees in Open-1 were
closely correlated with the amount of rainfall, with high rainfall enhancing
the actJ ;·ities of the insect. Temporal synchrony between rainfall and
mahogany shoot borers has been noted by a number of authors (Grijpma
and Gara, 1970a; Brunck and Fabre, 1974; Morgan and Suratmo, 1976;
Wagner et al., 1991). The positive association can be attributed to the indirect
role of rainfall in promoting host tree growth, which in turn attracts the
attack of the insect. This explanation was backed by the finding that egg-

52
laying females are attracted to the newly produced shoots for oviposition
(Gara et al., 1973). Effects of daily minimum temperature apper.red to be
more pronounced on the proportions of attacked trees, with low minimum
daily temperature reducing the namber of trees attacked. When the average
daily minimum temperature was below 6.5°C in the previous 15 days, no
fresh attack by H. robusta was recorded. Low temperatures of this level
probably induced some degree of winter diapause of this insect (Beeson,
1919). Further evidence is seen in the simultaneous recording of no fresh
attack in all the 4 plots in the field site at the time when 512 was taken
(Figure 3.9). Dissecting of some previously damaged shoots in Open-1 at that
time revealed only mature blue larvae and pupae that could have been in
diapause.
3.4.2 Spatial patterns
Inter-tree patterns
Levels of H. robusta attack did not seem to be randomly distributed
among trees. Comparisons of the tree-specific factors between attacked and
non-attacked trees suggest that larger trees (higher values in Ht, DBH and
NSL) tended to be attacked more often than smaller trees, while better
shaped trees (lower value in TF) tended to be less often attacked than less
well-shaped trees. The same patterns were shown by logistic models
describing the logarithmic odds of attack of individual trees as linear
combinations of the tree-specific factors. However, the degree of the
tendency was not consistent with respect to samples, as indicated by the
sporadic detection of significance in the parameter comparisons and in the
logistic models. Considering that the attack status of sample trees was
determined by checking 10 shoots from each tree, the probability of having
the attacked shoots included in the 10-shoot sample (ie. detecting an
attacked tree) would be much lower among large trees than that among
small trees. As a result, the significance levels of the tree-size factors might
53
have been under-estimated. Preference toward larger trees is not surprising,
as these trees have higher number of shoots and therefore are more
attractive to the shoot borer (Gara et al., 1973). The same factor may be
responsible for the preference toward less well-shaped trees, as the latter are
often characterised by higher number of branches than their better shaped
counterparts. Support for the proposed common basis of the observed attack
patterns is seen by the mutual exclusions of some of the significant factors
in the logistic models shown in the previous section and by the considerable
correlations between the tree-specific factors (Table 3.13). The implication for
the negative association between tree form and attack rates is obvious. It
highlights the need to protect young seedlings from initial damage as the
latter would open up the tree crown (decreasing the tree-form values) and
to cultivate varieties of the host trees with strong apical growth. The latter
need was recognised by Grijpma (1976) in his review of the H. grande/la
problem. Morgan and Suratmo (1976) reported a negative linear dependence
of the proportions of attacked trees on tree height. However, the heaviest
attacked trees were 200 - 800 cm tall in their study, which covers almost the
entire height range of sample trees in Open-1. Also, the negative
dependence of attack rates on tree height is doubtful, as the detection of
attacked shoots within the relativeljdense crowns of large trees can be
extremely difficult when the percentages of attacked shoots are low.
The fact that significant differences in the attack proportions among
trees at different ranges of the tree-specific factors disappeared after the
removal of the lowest ranges in Ht and DBH and the highest range in TF
suggests that only very small (Ht ~150 cm) and very slender (TF >100) trees
tend to be less often attacked by H. robusta. Once grown to a certain size and
stoutness, Red Cedar trees are likely to be attacked with similar risk. The
large proportions of similarly attacked trees may have contributed to the
high percentages of unexplained residual deviance in the logistic models.
The overall results suggest that the selection of host trees for attack by H

54
robusta in Open-1 was largely a random process with the likelihood of attack
slightly modified by the tree-specific factors. The hypothesis was supported
by the finding that the distribution in the number of times individual trees
were attacked across the samples was well fitted by the binomial distribution
(Preject > 0.1) (Figure 3.17). Partial mixing of host and non-host trees in a
plot as shown in Open-1 did not seem to have any effects on the attack
status of host trees.
The intensities of attack among attacked trees, as expressed by the
percentages of shoots attacked per tree, appeared to be determined primarily
by the number of shoots with fully expanded leaves (NSL) and the location
of blocks to which the sample trees belonged (Blk). The fewer the NSL the
higher the percentages of shoots attacked. An study on H. grandella showed
that females laid only a few eggs on each tree (Gr;jpma, 1974). If the same
attribute is true with H. ro/Justa, then the observed negative density
dependency of the attack intensities can be rightly justified, as the number of
attacked shoots per tree would be limited irrespective of the total number of
shoots available. The occasional significant effects of Ht, DBH and TF on the
attack intensities might have been due to their correlations with NSL (Table
3.13). However, the more frequent detection of the significant effects of Blk
was unexpected. It seemed to have been brought about by the lower attack
intensities among trees in block-2 (Figure 3.15), where host and non-host
trees were mixed. The reason is unclear. It was unlikely to be attributable to
differences in tree sizes, as block-2 trees were, on average, bigger than block-3
trees but smaller than block-1 trees. A possible explanation is that the
proximity to non-host trees may have somehow decreased the number of
eggs laid on the host trees. In some lepidoptera species, "'olatiles from non
host plants were found to deter egg-laying females (see Renwick and Chew,
1994). As with the attack status of trees, the tree-specific factors showed
significant effects on the attack intensities in some samples but not in
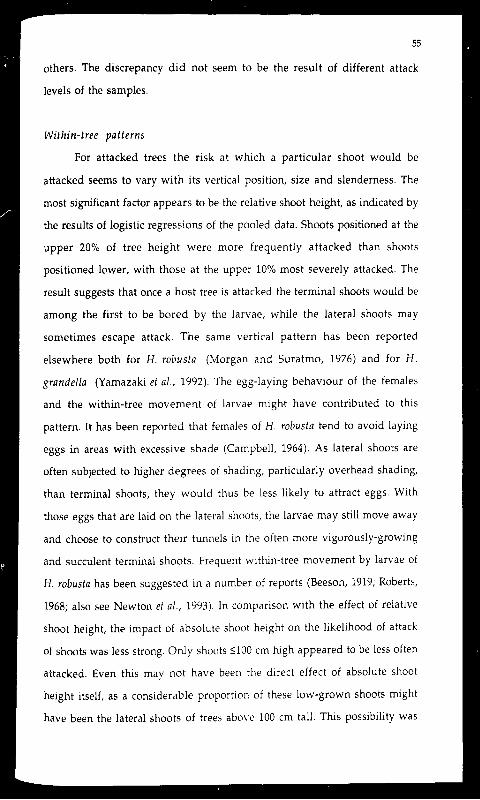
55
others. The discrepancy did not seem to be the result of different attack
levels of the samples.
Within-tree patterns
For attacked trees the risk at which a particular shoot would be
attacked seems to vary with its vertical position, size and slenderness. The
most significant factor appears to be the relative shoot height, as indicated by
the results of logistic regressions of the pooled data. Shoots positioned at the
upper 20% of tree height were more frequently attacked than shoots
positioned lower, with those at the upper 10% most severely attacked. The
result suggests that once a host tree is attacked the terminal shoots would be
among the first to be bored by the larvae, while the lateral shoots may
sometimes escape attack. The same vertical pattern has been reported
elsewhere both for H. robusta (Morgan and Suratmo, 1976) and for H.
grandella (Yamazaki et al., 1992). The egg-laying behaviour of the females
and the within-tree movement of larvae might have contributed to this
pattern. It has been reported that females of H. robusta tend to avoid laying
eggs in areas with excessive shade (Campbell, 1964). As lateral shoots are
often subjected to higher degrees of shading, particularly overhead shading,
than terminal shoots, they would thus be less likely to attract eggs. With
those eggs that are laid on the lateral shoots, the larvae may still move away
and choose to construct their tunnels in the often more vigorously-growing
and succulent terminal shoots. Frequent within-tree movement by larvae of
H. robusta has been suggested in a number of reports (Beeson, 1919; Roberts,
1968; also see Newton et al., 1993). In comparison with the effect of relative
shoot height, the impact of absolute shoot height on the likelihood of attack
of shoots was less strong. Only shoots ~100 cm high appeared to be less often
attacked. Even this may not have been the direct effect of absolute shoot
height itself, as a considerable proportion of these low-grown shoots might
have been the lateral shoots of trees above 100 cm tall. This possibility was

56
supported by the results of logistic regressions, which showed that SHt was
no longer significant after RHt had been introduced into the models (Table
3.6). The direct role of shoot length and shoot basal diameter in influencing
the shoot selection behaviour of the insect is also questionable. Shoots with
longer length and bigger basal diameter were exposed to attack for a longer
duration than their shorter and smaller counterparts. As a result, they were
more likely to be found as attacked shoots at the time of the sampling. The
almost linear relationship between shoot length and the attack proportions
(Figure 3.8) provides good evidence for the exposure-time effect.
Admittedly, behavioural aspects are probably involved in the
discrimination against the selection of very small shoots by late-instar
larvae as the size of these shoots may not be adequate for the larval
tunnelling and development. The observed preference toward more slender
shoots was probably because these shoots were still in the process of fast
elongation and were thus more vigorous. When considered together, the
attack status of individual shoots appears to be influenced by the
simultaneous effects of three shoot-specific factors: relative shoot height,
shoot basal diameter and shoot slenderness. However, the degree to which
the final attack status was determined by these factors was extremely low
(<6%), suggesting the largely random nature of the shoot selection process
by H. robusta.
III. Habitat differences
In agreement with previous reports (Frogatt, 1923; Mitchell, 1972;
Wagner et al., 1991), host trees planted inside forest appeared to have been
afforded some degree of protection against the shoot borer attack. Although
attack did occur there, forest-located trees were generally less frequently
attacked than open-located trees. The proportions of attacked trees of the
forest trees never exceeded 21 'l\, throughout the sampling period, while that
of the trees in the open frequently rose to over 40% and could be as high as

57
100% (Figure 3.9). The difference was still evident after the removal of trees
S200 cm high in both plots , indicating that the relative immunity exhibited
by Forest-located trees was unlikely to be caused solely by the more
widespread distribution of small trees (Ht< 200 cm) in Forest-1 than that in
Open-1. Nevertheless the frequency of attack did increase with tree height in
both plots and trees S200 cm tall suffered only about half as much attack as
their taller counterparts. This probably explained the virtual non-existence
of attack in the other forest plot (Forest-2), since all but one tree in that plot
stayed below 200 cm throughout the sampling period and 53% were still
below 150 cm in height on the last sampling occasion. Apart from the
possible effects of shade (Campbell, 1964), the presence of non-host trees on
host selection behaviour of the moths (Renwick and Chew, 1994), and tree
size, the habitat difference appeared to be attributable to tree vigour. Forest
located trees showed much slower growth rates than openly-located trees,
especially during the early stage of their establishment, as was convincingly
shown by the comparison of trees between Forest-2 and Open-2. Most of the
trees in the two plots were planted around the same time. Yet, in contrast to
the slow growth rate in Forest-2, the growth rate of Open-2 trees was
surprisingly high, with some trees reaching a height of over 300 cm within
one year of planting and in another 3 months some had grown to over 400
cm tall. Corresr·nding to the strong vigour of trees shown in that plot was
the unusually high attack levels, even during times when the attack level
was relatively low in Open-1.
Trees planted in small groups in isolated locations did not seem to
reduce the tip moth infestation. They were discovered and attacked to a
similar extent as trees planted in the open. Although there were
considerable variations in the attack levels within isolated trees,
examination of the data showed each tree was attacked at some stage during
the sampling period. While each individual attack within an isolated group
did not necessarily originate from dispersing moths from outside, the

58
observed attack in every isolated group did point to the strong host-finding
capability of the insect. Once discovered, trees in an isolated group may be
subjected to heavy attack due to the presence of a local poptilation of the
insect and the relatively small number of trees available for attack in that
location. Infestation by H. robusta at various locations over the field site were,
overall, not synchronous. Attack levels in different plots appeared to have
been fluctuating independently of each other, as was shown in the lack of
correlations in the proportions of attacked trees between Forest-1 and Open-
1 and among isolated groups of trees. The observed correlations in the attack
proportions between Open-1 and isolated trees as a whole probably reflected
more of their habitat similarity (both were relatively exposed in comparison
to forest habitat) rather than synchrony between local H. robusta
populations. The localised infestation pattern of Hypsipyla spp. has been
noted by Newton et al. (1993). According to their review, the females tend to
restrict themselves in areas where host trees have already been discovered
and few would venture out to search for new resources. This behaviour of
the moth probably evolved as a trait to combat the scattered occurence of
their host trees in nature.
3.4.3 Impact of Damage
A H. robusta larva may inflict damage on more than one shoot
during its development, as revealed by the low percentages of attacked
shoots with larvae (including dead larvae) in the sample data. The missing
larvae in those damaged shoots cannot be entirely attributed to predation,
the level of which is usually low (Roberts, 1968; Singh and Misra, 1988). A
more likely explanation is that the larvae sometimes abandoned their
established feeding spots and wandered off in search of new feeding spots, as
was noted by Beeson (1919) and Roberts (1968). Too vigorous a sap exudation
by the damaged tissue has been cited as the probable reason for the
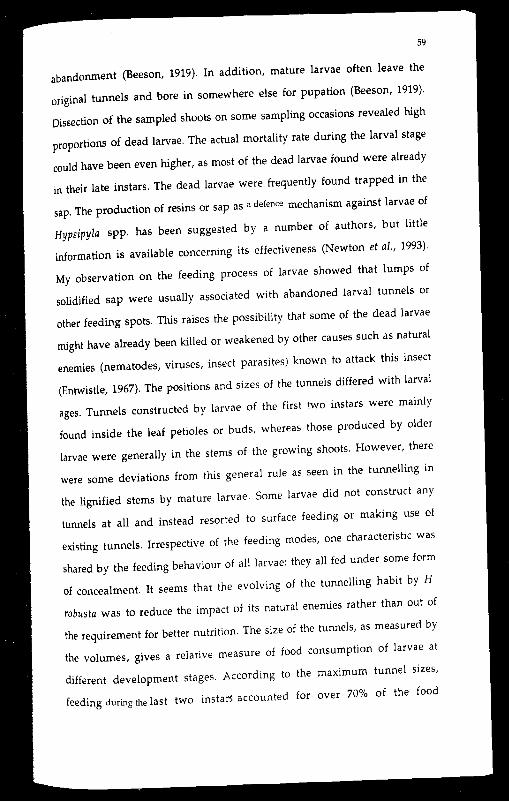
59
abandonment (Beeson, 1919). In addition, mature larvae often leave the
original tunnels and bore in somewhere else for pupation (Beeson, 1919).
Dissection of the sampled shoots on some sampling occasions revealed high
proportions of dead larvae. The actual mortality rate during the larval stage
could have been even higher, as most of the dead larvae found were already
in their late instars. The dead larvae were frequently found trapped in the
sap. The production of resins or sap as a defence mechanism against larvae of
Hypsipyla spp. has been suggested by a number of authors, but little
information is available concerning its effectiveness (Newton et al., 1993).
My observation on the feeding process of larvae showed that lumps of
solidified sap were usually associated with abandoned larval tunnels or
other feeding spots. This raises the possibility that some of the dead larvae
might have already been killed or weakened by other causes such as natural
enemies (nematodes, viruses, insect parasites) known to attack this insect
(Entwistle, 1967). The positions and sizes of the tunnels differed with larval
ages. Tunnels constructed by larvae of the first two instars were mainly
found inside the leaf petioles or buds, whereas those produced by older
larvae were generally in the stems of the growing shoots. However, there
were some deviations from this general rule as seen in the tunnelling in
the lignified stems by mature larvae. Some larvae did not construct any
tunnels at all and instead resorted to surface feeding or making use of
existing tunnels. Irrespective of the feeding modes, one characteristic was
shared by the feeding behaviour of all larvae: they all fed under some form
of concealment. It seems that the evolving of the tunnelling habit by H.
robusta was to reduce the impact of its natural enemies rather than out of
the requirement for better nutrition. The size of the tunnels, as measure<l by
the volumes, gives a relative measure of food consumption of larvae at
different development stages. According to the maximum tunnel sizes,
feeding during the last two instars accounted for over 70% of the food

60
consumption of the entire larval stage. The longest tunnel recorded was 22
cm in length.
As a result of the tunnelling activities of larvae, growth of the
infested shoots is stopped and their physical strength weakened. A terminal
section of the shoot would later die or break off, leaving a basal section
standing. Examination of the upper diameters of the basal sections
(boundary diameters) of sampled shoots indicated that less than 5% of
damaged shoots had their boundary diameters greater than 1.0 cm (Chapter
3}. The percentages were close to zero for boundary diameters greater than
1.2 cm. Assuming a gradual decrease of the diameters of a shoot from tip to
base, the results suggest that most damaged shoots are likely to retain the
section from the 1.0 cm diameter mark to shoot base, since all shoots with
boundary diameters smaller than 1.0 cm had kept extra slender sections. The
probability of damaged shoots surviving from tip to any given diameter can
be estimated from the fitted logistic equation (Figure 3.14). For an individual
shoot, the exact position above which the shoot would die, depends on the
location and relative size of the larval tunnel with respect to shoot size. A
relatively young and slender shoot would probably have a large section
surviving the tip moth attack if damaged by early instar larvae close to the
shoot base. On the other hand, an old and stout shoot may Jose a large
section of it if it is tunnelled by mature larvae close to the base. It also needs
to be pointed out that the observed boundaries may deviate from the
eventual boundaries, since the latter are determined by the locations of the
first replacement shoots immediately below the damaged area. My
observations showed that the undamaged section of a shoot located between
the bottom of the larval tunnel and the next replacement shoot would
eventually die, due to the diversion of nutrients into the new shoot.
None of the attack indices considered, neither the percentages of
attacked shoots in individual samples nor the number of times individual
trees were attacked across the samples, showed convincing negative impact

61
on the height growth of trees in plot Open-1. Increment in tree height
appeared to be mainly determined by initial tree size and form, with better
growth associated with larger and less well-formed trees (lower tree height
DBH ratios) (Table 3.10). The failure to detect any significant effects of the
attack indices on the height increment of trees may have arisen because of
the dependence of attack levels on tree vigour. Whitmore (1978) indicated
that high levels of attack by H. grandella tended to be concentrated on
vigorously-growing trees. If this is true · for . H. robusta, then the larger gain
in tree height among more vigorous-growing trees is likely to be lost due to
the disproportionately high levels of attack, which, in turn, would make the
attack levels seemingly unrelated to tree growth. In the case of insufficient
cancelling effects by the attacking larvae, attack levels may even appear to be
positively correlated with height increments, as was shown by the number
of times individual trees were attacked across the samples (Table 3.10). It
thus seems that the effect of damage can be fully and realistically shown
only after the correction of tree vigour. However, the nature of the sample
data in this study precluded such an analysis, as the rates of shoot
production of individual trees had not been continually monitored
throughout the sampling period. The obtained positive and negative
dependence of tree height increment on tree size and tree form,
respectively, were probably because larger and less-well formed trees had
more shoots and thus were more likely to have some shoots escaping attack,
as the attack intensity of attacked trees were found to be negatively
correlated with shoot abundance (Table 3.5).
The directions in the changes of tree-form values (tree height and
DBH ratios) of individual trees (increase or decrease) during the same
period could be explained by two factors, the initial tree-form values and the
percentages of shoots attacked in 55 (b5), both contributing negatively to the
logarithmic likelihood of increase in tree form. The results suggest that
damage by H. robusta in the open plot tends to make the host trees
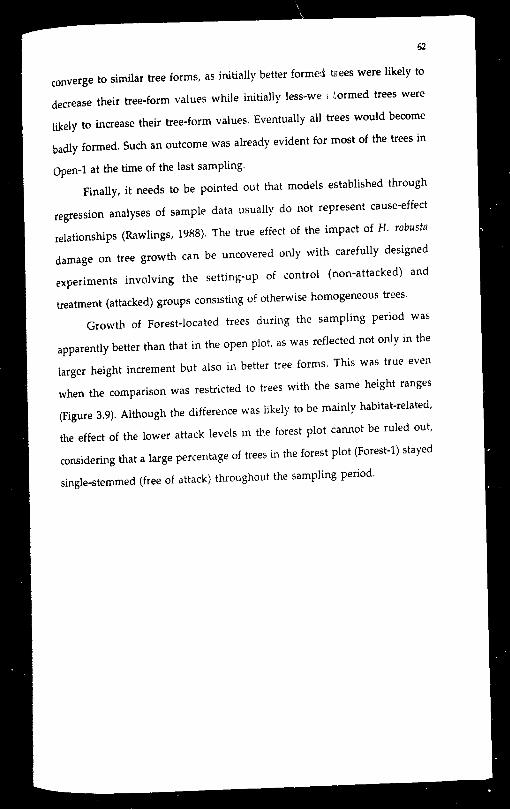
62
converge to similar tree forms, as initially better formf:d t1iees were likely to
decrease their tree-form values while initially less-we·' I.armed trees were
likely to increase their tree-form values. Eventually all trees would become
badly formed. Such an outcome was already evident for most of the trees in
Open-1 at the time of the last sampling.
Finally, it needs to be pointed out that models established through
regression analyses of sample data usually do not represent cause-effect
relationships (Rawlings, 1988). The true effect of the impact of H. robusta
damage on tree growth can be uncovered only with carefully designed
experiments involving the setting-up of control (non-attacked) and
treatment (attacked) groups consisting of otherwise homogeneous trees.
Growth of Forest-located trees during the sampling period was
apparently better than that in the open plot, as was reflected not only in the
larger height increment but also in better tree forms. This was true even
when the comparison was restricted to trees with the same height ranges
(Figure 3.9). Although the difference was likely to be mainly habitat-related,
the effect of the lower attack levels in the forest plot cannot be ruled out,
considering that a large percentage of trees in the forest plot (Forest-1) stayed
single-stemmed (free of attack) throughout the sampling period.

63
Table 3.1. 5-Plus functions and associated test statistics used in the statistical
analyses of the sampling data in the field site.
Parameters or effects to be tested S·Plus functions
Differences in the proportions of prop.test attacked trees or shoots
Differences in the values of tree- wilcox.test specific or shoot-specific factors
Correlations between weather self-written function indices and attack indices
Goodness of fit in spatial distributions
Effects of tree or shoot specific factors on attack status (logistic model)
Effects of tree or shoot specific factors on attack intensity (linear model)
self-written function
glm (link=binomial) anova (glim object)
Im anova (Im object)
Test statistic
Pe.;rson's chi-square
Wilcoxon rank sum W
Ktndaih: rank correlation tau
Pearson's chi-square
Pearson's chi-square
Fisher's F

64
Table 3.2. Proportions of attacked trees and mean percentages of attacked
shoots per tree in each of the 13 samples (n=52)
Samples Date Attacked trees% Attacked shoots%± S "~
51 03 April 92 100.0 74.3 ± ; :
52 15 July 92 0 0
53 060ct. 92 59.6 10.9 ± I
54 01Dec.92 86.5 23.2 ± 1
55 15 Feb. 93 78.9 20.8 ± . '
56 20 April 93 44.2 16.3 ±
57 21 July93 5.8 2.6±
58 200ct. 93 42.3 6.2 ±
59 19 Dec. 93 13.5 2.7 ±I
510 27 Jan. 94 7.7 5.5 ±
511 18 April 94 53.9 21.3 ± ) . 512 27 Aug.94 () 0
513 25 Nov. 94 51.9 15.4 ± .

65
Table 3.3. Tree-specific factors showing significant effect (P< 0.1) on the
logarithmic odds of attack (log(p/(1-p)) of trees as determined by analyses of
deviance (chi-square test). Only samples with the proportions of attacked
trees in the range of 20-80% were considered. Number of trees in each
sample was 52. Ht: tree height (cm), DBH: diameter of tree trunk at 1.3 m
high (cm), TF: tree form (=Ht/ DBH), NSL: number of shoots with fully
expanded leaves. Data from Open-1.
Deviance p Deviance Sign of
Sample Factor D.F. (= chi. sq.) reduced(%) coefficient
53 Ht 9.06 0.0026 12.91 +
DBH 13.00 0.0003 18.53 +
TF' 15.13 0.0001 21.57
NSL 9.06 0.0026 12.92 +
55 DBH 3.69 0.0546 6.88 +
NSL' 6.88 ll.0087 12.82 +
56 Ht' 3.81 0.05f1:i 5.34 +
58 no significant factor
511 no significant factor
513 Ht 3.29 0.0697 4.57 +
DBH' 3 32 0.0683 4.62 +
•factors included in the final model at P<O.l.

66
Table 3.4. Comparisons of average values of numerical factors between
lightly attacked and heavily attacked trees. Ht: tree height (cm), DBH:
diameter of tree trunk at 1.3 m high (cm), TF: tree form (=Ht/ DBH), NSL:
number of shoots with fully-expanded leaves. Data from Open-1.
Sample Factor mean±5D(n) Pwilcoxon
lightly attacked heavily attacked
SI Ht 257.5 ± 78.5 (20) 232.2 ± 85.4 (32) 0.1343
DBH 3.6 ± 1.6 (20) 3.1±1.7 (32) 0.2143
TF 76.3 ± 16.2 (20) 84.9 ± 27.0 (32) 0.3715
N5L 9.8 ± 4.4 (20) 8 8 ± 4.6 (32) 0.2161
53 Ht 290.3 ± 78.7 (18) 270.5 ± 86.3 (13) 0.2971
DBH 4.2 ± 1.5 (18) 1.7 ± 3.9 (13) 0.3167
TF 73.9 ± 17.3 (18) 73.3 ± 12.8 (13) 0.7947
N5L 25.0 ± 9.6 (18) 19.7 ± 8.1 (13) 0.1728
S4 Ht 290.9 ± 88.4 (20) 251.8 ± 86.3 (25) 0.1703
DBH 4.0 ± 1.8 (20) 3.4 ± 1.8 (25) 0.3316
TF 77.6 ± 14.0 (20) 85.7 ± 29.7 (25) 0.5374
N5L 24.8 ± 12.7 (20) 18.7 ± 10.l (25) 0.0928
SS Ht 257.8 ± 100.7 (20) 313.3 ± 110.0 (21) 0.0976
DBH 3.7 ± 2. 1 (20) 4.6 ± 2.0 (21) 0.0874
TF 81.4 ± 27.l (20) 71.4 ± 13.5 (21) 0.3411
N5L 18.4 ± 11.5 (20) 22.2 ± 12.2 (21) 0.2729
56 Ht 308.8 ± 90.l (13) 311.7 ± 121.1 (10) 0.9505
DBH 4.6 ± 2.3 (13) 4.0 ± 1.7 (10) 0.5348
TF 75.0 ± 13.8 (13) 79.4 ± 14.2 (10) 0.3852
NSL 16.9 ± 19.2 (13) 11.0 ± 7.8 (10) 0. 1065
58 Ht 315.4 ± 113.3 (16) 363.8 ± 170.9 (6) 0.9689
OBH 4.4 ± 2.0 (16) 4.7 ± 2.9 (6) 0.7260
TF 75.2 ± 14.0 (16) 83.4 ± 12.2 (6) 0.2590
NSL 24.2 ± 16.8 (16) 20.0 ± 12.7 (6) 0.5073
SI 1 Ht 3139 ±99.2 (14) 304.6 ± 117.8 (14) 0.7827
DBH 4.4 ± 1.9 (14) 4.7 ± 2.3 (14) 0.6458
TF 75.3 ± 17.0 (14) 69.9 ± 19.5 (14) 0.4763
NSL 3.5 ± 4.1 (14) 1.7 ± 2.7 (14) 0.2746
Sl3 Ht 338.4 ± 103.6 (18) 385.7 ± 114.2 (9) 0.1291
DBH 4.8 ± 2.2 (18) 5.9 ± 2.1 (9) 0.1427
TF 76.0 ± 16.3 (18) 68.0 ± 15.8 (9) 0.2472
NSL 18.0 ± 9.5 ( 18) 18.4 ± 5.4 (9) 0.8769

67
Table 3.5. Tree-specific factors showing significant effect (P< 0.1) on the
attack intensities of attacked trees (percentages of shoots attacked yer tree) as
determined by ANOV A of linear models. Only samples with the number of
attacked trees ~20 were considered. Data on the attack intensities were
transformed by arcsine ..J x. Ht: tree height, DBH: diameter of tree trunk at
l.3m high, TF: tree form (=Ht/ DBH), NSL: number of shoots with fully
expanded leaves, Blk: location of trees with respect to the three blocks in
Open-1.
Sample Factor D.F. F p Swn of sq. Sign of reduced(%) coefficient
S l Ht 1, SO 4.60SO 0.0368 8.43 DBH 1, 50 4.8879 ll.0316 8.91 TF 1, SO 3.0794 0.0854 5.80 + NSL 1, 50 4.2837 ll.0437 7.89 Factors in the final model: DBH, Blk; F=3.4650, d.f.=3, 48, P= 0.0233
S3 NSL l, 30 10.2293 0.0033 26.08 Factors in the final model: NSL; F=l0.2293, d.f.=1, 30, P=0.0033
S4 TF l, 43 3.4346 0.0707 7.40 + NSL 1, 43 6.5292 ll.0142 13.18 Bl k 2, 42 3.4607 0.0406 14.15 NA Factors in the final model: NSL, Blk; F=4.461, d.f.=3, 41, P=0.0084
SS Bl k 2, 38 2.9333 0.0654 21.41 NA Factors in the final model: Blk, Ht; F=3.36, d.f.=3, 37, P=0.0289
S6 NSL 1, 22 5.2048 ll.0331 19.86 Factors in the final model: NSL; F=5.2048, d.f.=l, 22, P=0.0331
58 No significant factors
Sll No significant factors
Sl3 TF 1, 2S 3.9149 0.0590 13.54 Blk 2, 24 3.2634 0.0558 21.38 NA Factors in the final model: TF, Blk; F=3.5230, d.f.=3, 23, P=0.0310
NA: not applicable, as Blk is a categorical factor

68
Table 3.6. Shoot-specific factors showing significant effect (P< 0.1,) on the
logarithmic odds of attack (log(p/(1-p)) of shoots as determined by analyses
of deviance (chi-square test). Pooled data from Open-1 of all shoots from
attacked trees. Total number of shoots: 1231. SHt: shoot height, RHt: relative
shoot height, SI: shoot length. SBD: shoot basal diameter, SS: shoot
slenderness(= SL/ SBD).
Factor D.F. Deviance p Deviance Sign of
(=chi. sq.) reduced(%) coefficient
SHt 8.77 ll.0031 0.63 +
RHt 49.83 0.0000 3.56 +
SL 37.56 0.0000 2.69 +
SBD 47.32 0.0000 3.38 +
SS 13.46 0.0002 0.96 +
factors included in the final model at P< 0.1: RHt,S1W, SS
sig!:!ificance level of the final model: P< 0.0001
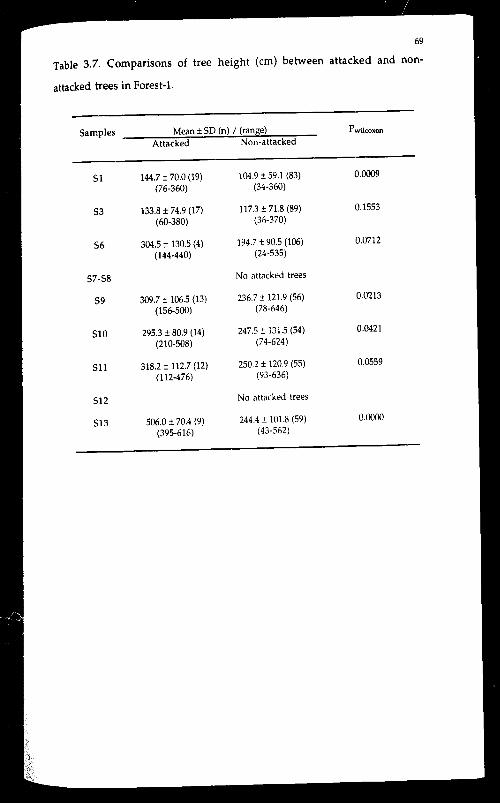
69
Table 3.7. Comparisons of tree height (cm) between attacked and non
attacked trees in Forest-1.
Samples Mean+ SD (n) I (range)
Attacked Non-attacked Pwikoxon
Sl 144.7 ±. 70.0 (19) 104.9 ± 59.1 (83) 0.0009
(76-360) (34-360)
S3 133.8 ± 74.9 (17) 117.3 ± 71.8 (89) 0.1553
(60-380) (36-370)
S6 304.5 ± 130.5 (4) 194.7 ± 90.5 (106) 0.0712
(144-440) (24-535)
S7-S8 No attacked trees
S9 309.7 ± 106.5 (13) 236.7 ± 121.9 (56) 0.0213
(156-500) (78-646)
510 295.3 ± 80.9 (14) 247.5 ± 131.5 (54) 0.0421
(210-508) (74-624)
S11 318.2 ± 112.7 (12) 250.2 ± 120.9 (55)
(112-476) (93-636)
0.0559
S12 No attacked trees
S13 506.0 ± 70.4 (9) 244.4 ± 101.8 (59)
(395-616) (43-562)
0.0000

70
Table 3.8. Proportions of attacked trees (%) in Forest-1 and Open-1 after the
removal of trees with Ht :S:200 cm. Numerals in the brackets are the total
number of trees in that height category. The p-values are obtained from chi
square tests of the differences in the attack proportions. NA's indicate non
test (due to inadequate number of either attacked or un-attacked trees in
either plot (see text for detail).
Plot 51 53 56 57 58 59 510 511 512 513
Open-1 100.0 67.4 45.0 46.5 4.8 14.0 9.3 55.8 0.0 59.1
(35) (43) (40) (42) (43) (43) (43) (43) (43) (44)
Forest-1 33.3 20.0 6.0 0.0 0.0 25.6 31.8 43.2 0.0 19.6
(9) (10) (50) (42) (41) (43) (44) (44) (46) (46)
p-value NA NA NA NA NA 0.3 NA 0.3 NA 0.0

71
Table 3.9. Percentages of trees attacked but with no larvae (PnoL) and
percentages of dead larvae (P dead) on various sampling occasions.
Sample 51 53 54 55 56 57 58 59 510 511 513
PnoL 19.2 29.0 18.0 83.3 100.0 66.7 76.7 0.0 80.0 28.6 55.6
(n) (52) (31) (39) (48) (23) (3) (30) (7) (15) (28) (27)
Pctead 45.1 38.7 34.6 16.7 NA 33.3 82.4 25.0 33.3 6.7 28.6
(n) (122) (31) (52) (12) (3) (17) (8) (3) (30) (14)
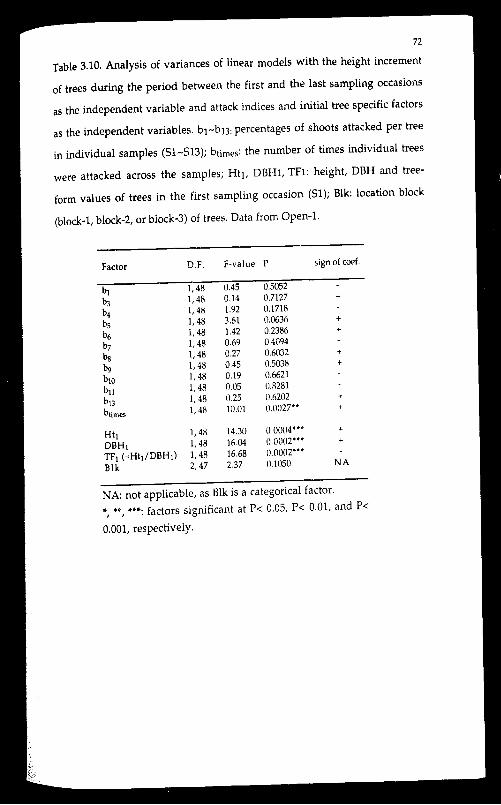
72
Table 3.10. Analysis of variances of linear models with the height increment
of trees during the period between the first and the last sampling occasions
as the independent variable and attack indices and initial tree specific factors
as the independent variables. bl-bl3: percentages of shoots attacked per tree
in individual samples (Sl-513); btimes: the number of times individual trees
were attacked across the samples; Ht1, DBHl, TFl: height, DBH and tree
form values of trees in the first sampling occasion (Sl); Blk: location block
(block-1, block-2, or block-3) of trees. Data from Open-1.
Factor D.F. F-value p sign of coef.
b1 1, 48 0.45 0.5052
hJ 1, 48 0.14 0.7127 +
b4 1, 48 1.92 0.1718
bs 1, 48 3.61 0.0636 +
b6 1, 48 1.42 0.2386 +
b7 1, 48 0.69 0.4094
bs 1, 48 0.27 0.6032 +
"9 1, 48 0.45 0.5038 +
b10 I, 48 0.19 0.6621
bu I, 48 0.05 0.8281
b13 I, 48 0.25 11.6202 +
btimes I, 48 JO.OJ 0.0027•• +
Ht1 !, 48 14.30 0.0004 ... +
DBH1 !, 48 16.04 0.0002· .. +
TF1 (=Ht1/DBH1) I, 48 16.68 0.0002 ...
Blk 2, 47 2.37 0.1050 NA
NA: not applicable, as Blk is a categorical factor.
•, ••, ... : factors significant at P< 0.05, P< 0.01, and P<
0.001, respectively.

73
Table 3.11. Analysis of deviances of logistic models with the logarithmic
odds of trees recording positive increase in tree-form values (Height/OBH)
during the period between the first and the last sampling occasions as the
independent variable and attack indices and initial tree specific factors as the
independent variables. b1-b13: percentages of shoots attacked per tree in
individual samples (Sl-513); btimes: the number of times individual trees
were attacked across the samples; Ht1, DBHl, TFl: height, OBH and tree
form values of trees in the first sampling occasion (Sl); Blk: location block
(block-1, block-2, or block-3) of trees. Data from Open-1.
Factor D.F. Deviance D.F. Deviance p
reduced reduced residual residual
NULL 49 68.99
b1 1.02 48 67.98 0.3125
h3 2.28 48 66.72 0.1311
b4 0.01 48 68.99 0.9203
bs 1.63 48 67.36 0.2017
b6 1.03 48 67.97 0.3102
b7 1.03 48 67.97 0.3102
bs 0.01 48 68.99 0.9203
b<; 0.07 48 68.93 0.7913
b10 0.00 48 68.99 1.0000
b11 0.61 48 68.39 0.4348
b13 0.42 48 68.57 0.5169
btimes 0.75 48 68.25 0.3865
Ht1 3.25 48 65.75 0.0714
DBH1 6.03 48 62.96 0.0141•
TF1(=Hti/DBH1) 12.92 48 56.07 0.0003' ..
Blk 2 3.20 47 65.79 0.2019
•, ••, •••: factors significant at P< 0.05, P< 0.01, and P< 0.001,
respectively.
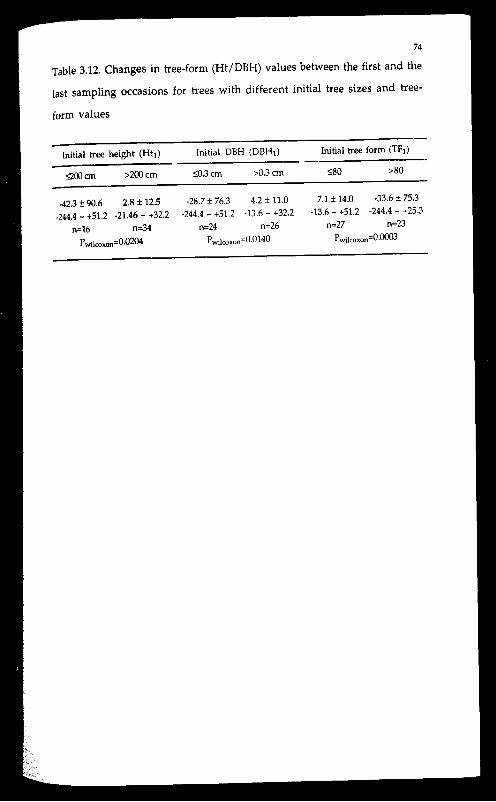
74
Table 3.12. Changes in tree-form (Ht/DBH) values between the first and the
last sampling occasions for trees with different initial tree sizes and tree
form values
Initial tree height (Ht1) Initial DBH (DBH1) Initial tree form (TF1)
~oocm >200cm ~0.3cm >ll.3cm ~80 >80
-42.3 ± 90.6 2.8±12.5 -28.7 ± 76.3 4.2 ± 11.0 7.1±14.0 -33.6 ± 75.3
-244.4 - +51.2 -21.46 - +32.2 -244.4 - +51.2 -13.6 - +32.2 -13.6 - +51.2 -244.4 - +25.3
n=16 n=34 n=24 n=26 n=27 n=23
P wilcoxon=0.0204 Pwilcoxon=0.0140 P wilcoxon=0.0003

75
Table 3.13. Correlation matrix of the four numerical tree-specific factors.
Pooled data of all samples from Open-1.
Ht DBH TF NSL
Ht 0.91 -0.44 0.48
DBH 0.91 -0.68 0.51
TF -0.44 -0.68 -0.35
NSL 0.48 0.51 -0.35

Q grass
Y Y y y YT Y Y Y Y Y Y y Y TTY Y
TY Y Y y Y Y Y VY Y Y YT Y Y Y Y 't
y y y y y y y y y y y T y y 't y y y
~,,,,,,,,,,,,,,,,,,
D red cedar plot
T V 'f V Y Y Y Y Y Y Y Y Y V 't T Y Y T Y T
Y Y Y Y 't Y Y Y Y Y Y YT YT Y Y Y Y y y
y y y y y y y y y y y y ., y y '( y y y y y y
Y Y Y Y Y Y Y VY Y Y YT Y YT Y Y Y Y Y Y Y Y Y
Y y T Y Y Y Y Y Y Y Y V Y Y Y Y T Y Y T Y T Y Y Y Y Y Y
... y y y y y y., v ... v., y y.,, y y y y y y y y y y y y y 'I' y
Y Y Y Y Y y y Y y Y Y Y ~ Y Y Y Y T Y Y 't Y Y Y Y Y Y Y Y Y Y T Y
Y Y Y Y Y Y Y Y Y Y 'I Y Y VY Y Y YT TY TY Y Y Y YT Y Y Y Y YT Y
• Y Y Y Y Y 'I V Y T T Y Y Y T Y Y V T Y Y T Y T T Y "''iliilllllilil
y y T y y y y y y ,. v T y ., T., y y y y y y y y YI Cedrela odorata and C. fissilis
forest patch (mainly Eucalyptus saligna, E. grandis and E. microcorys)
orchard (peach and nectarine)
Other planted trees (mainly Grevillia robusta)
VY Y Y VY YT Y YT YT TY VY TTY TY TV Y
v v v v ., ., v " v ... v v v v v v v ., y v " ., v " ., Forest-2
: : : : : : : : : : : : : : : : : : :~l : : ::•···· ,,.vvvvvvvvvvvvvTTTYYY~~y~·: Y Y Y YT Y Y Y Y YT Y \'TY TY TY Y Y
TY yyyyYYYTVYYYYYTTTYTT ···~
: : : : : : : : : : : : : : : : : : : : : : : : : : lso-3 Vo Y YT TY Ty YT Y YT Ty Y Y Y Y Y Y Y Y YT Y Y
~ spring or pond ~ house
Figure 3.1. Relative positions oi sample plots and isolated groups of Red
Cedars in the field site. Figure not drawn to scale

c. ~d Cedar ( Toona australis ( F. Muell.) Harms ) , .C. · sample trees S . Silky Oak ( G-evellia robusta Gunn.), T · Teak ( Rindersia aust ralis R Br.) B · White Beech (G-nelina /eichhardtii F. Muell.)
35 CCCC.Q.CS SS ccccccscsssss .Q.GCCQ.CCCSCSSSS cccccccscscsss .c.ccc.c.cscscsssss
.... _.ic----N
30 cc cc cc cs cs cs cs s s s s cc cc cc cc CC.Q.C.Q.CSCTCSCSSSSSSCCCCCCCC ccccccsscscscsscssscccccci:;, cc.c.cccssrcscsssssssscccci:;,c cccc.c.csscsrscsssccccccci:;,cc
25 CCC CCC SST CS CS SSS CCC CCC .C. CCC ccc.c..c.ccssscBCSSSCCCCCCCCCC ccccccscsBSCCSCSCCCCCCCCCC CCCC.Q.CCSCTCBCSSSCCCCCCCCCC CCC C .C. C S CT C T C S S S S1C C C C C C C C C C
20 c.c.c.c.c.c..c.s.c.r.c.s.c.srs.c..c..c.c.c..c..c..c..c..c. ccccccscrsscsssscccccccccc cccccc.c.scBSBTSSSCCCCCCCCCC ccccccs.c.scrccsssccccccccc cccc.c.css.c.ccrcsssccccccccc
15 ccccccscsrBC.C.SSSCCCCCCCC cccc.c.ccscs.c.rcssscccccccc ccccccscssr.c.rsssccccccc cccc.c.ccsrrcrsssscccccc ccccccscc.c.sBSSSSCCCCCC
10 cccc.c.ccsrcBCSSSSCCCCC ccccccsccBCSSSSSCCCCC cccc.c.ccrscrcssssccccc ccccccscrBCBSSSSCCCC cccccc.csccFCSSSSCCCC
5 cccc.c.csrsrBsssss.c.ccc cccccccscsssssssccc cccc.c.cscBCTSSSSSCC.C. C .C. C C CCC S T S S S S S S:C C C CC C C C S C S S S S S S S S'C C
5 1 0 15
block-1 block-2 I_. 7 Jan. 1987 1 O Jan. 1989 I
Red Cedar Plant1 ng Date
Figure 3.2. Layout of trees in plot Open-1.
20
block-3
20 Dec. 1989

78
s1 s2 s3 •• s5 s6 s7 sB s9 s1 O s11 s12 s13
100 500
~ ~ 80 q •OO :0
~
"O 60
;;· . 300 ~ .. ~ 40
200 3 " < .3.
100
#- 20
100 ii:: . .0.
20 ?' . q 18
• 80
" 16 ..
"O 60 a 3
t 14 al
40 12 iil
~ 2"
10 ;
#- 20 .9
500 '; 100 . ~ 80
400 :0 ~ ;;·
~ 60 300 ~
"Ii al
40 200 3 100
.3. .. 20
~ 0 #-
'; 100 20 ii::
• a .0. ?' . 18
" 80 .Ci
Ji] 0
0 16 .. a 3
0 60 a 14 al
~ 40 12 iil
"O d 2"
~ ~~~-~·· o·
10 ;
u 20 - •··- .... ,,.,,,•,,-.....' • ,'!! .. ~ / .9 < 0 #-
Jan Apr Jul Oct Jan Apr Jul Oct Jan Apr Jul Oct Jan
Sampling time
Figure 3.3. Temporal patterns of the attack indices and the rainfall and
temperature indices. Rainfall: the total amount of rainfall in the previous
30 days; Minimum temperature: average daily minimum temperature in
the previous 15 days. Solid circles: attack indices; empty circle: weather
indices. Data from Open-1.
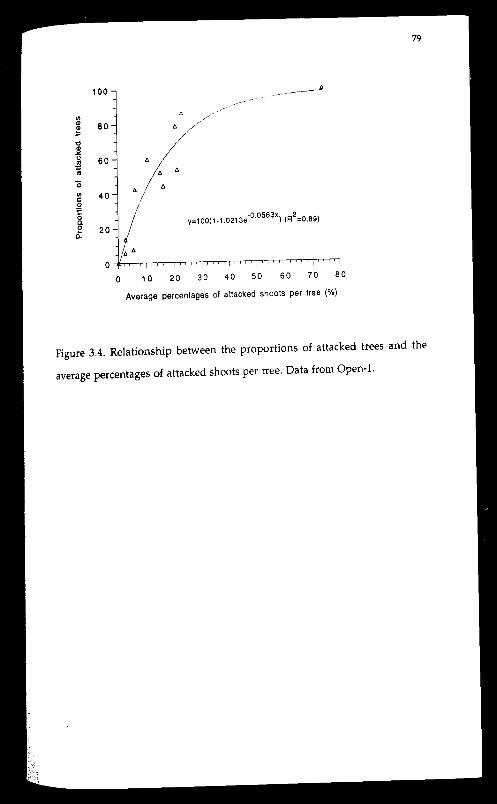
100 . ____ .___.-J
~
"' .. 80
.( ~ .,, .. "' 0 60 -.. ::: .. 0
"' 40 c:: 0
I t: 0 Y=100(1-1.0213eO.OSSax) (R2=0.89) a. 0 20 a:
0 10 20 30 40 50 60 70 80
Average percentages of attacked shoots per tree (%)
Figure 3.4. Relationship between the proportions of attacked trees and the
average percentages of attacked shoots per tree. Data from Open-1.

80
e ~
:;: • ~ 180 c > <( 90
7 6
I :i: 4 Ol 0
& 3
e 2 c ~
0
120
u.. 90 >-& 60 e . > <(
30
40
(/) 32 ...J z • 24
"' e • 16 ~
53 55 56 se 511 513
Samples
Figure 3.5. Comparisons of average values in tree height (Ht), diameters at
breast height (DBH), tree from (TF, =Ht/DBH) and the number of leaf
bearing shoots per tree between attacked trees (hatched columns) and non
attacked trees (blank columns). Stopped lines on top of the columns indicate
half of the standard deviations. Data from Open-1.

81
l 100
! ao
1 . 60
l,i 0 '° ~ 0 20 ·i: 0
"' g
"' 100 200 300 400 500 600 700
Tree height (cm)
c 100
fil ao .,, ~ 60 ll . 0 40
~ € 20
8.. ~ g
"' 10 12
DBH (cm)
l 100
j 80 .,, ~ 60
~ 0 40
~ 0 20 e 0
~ ~ ~ 1 1: ~ 0 " "' " " ~
£ 20 '° 60 80 100 120 140 160 180
Tree form ( = Ht/DBH)
Figure 3.6. Proportions of attacked trees at different ranges of Ht, DBH and
TF (=Ht/ DBH). The lengths and locations of the ranges are shown by the
column boundaries and the attack proportions shown by the column
heights. The overlaid lines show the relationship between the attack
proportions and the average values of the respective factors. Pooled data of
53, SS, 56, 58, 511 and 513 from Open-1
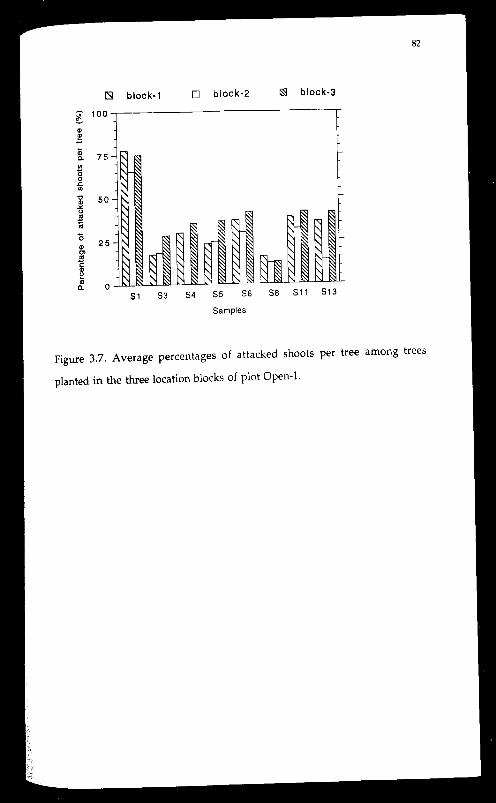
[Sl block-1 D block-2 ~ block-3
l 100
., ~ (jj
75 Q.
~ 0 .c. "' ,,
50 ., "" 0
"' ::: "' 0 ., 25 C>
"' c ., 0 (jj 0.. 0
81 83 84 85 86 SB 811 813
Samples
Figure 3.7. Average percentages of attacked shoots per tree among trees
planted in the three location blocks of plot Open-1.

150·200 200·2SO 250300
1hoot heigh! (cm)
shoo! le~h {cm)
,hoot slertdemes'
01·0.8
Relalllle 'hoot height
,hoot basal d11mellH (cm)
83
Figure 3.8. Proportions of attacked shoots at different ranges of shoot-specific
factors. A range denoted by x-y indicates that the value of the shoot-specific
factor is greater than x but smaller than or equal to y. Relative shoot height:
shoot height/tree height, shoot slenderness: shoot length/ shoot basal
diameter. Pooled data of shoots from all attacked trees. Columns in the
same graph not sharing common letters are significantly different in height
(P <0.05, chi-square test)

"' .. " ~ "C
~ u ~ "' 0
"' " 0 t: 0 a. 0 a:
---...-- Forest-1 -o-- Open-1 ····0-·· · Open-2
100
80
4 6 7 8 10
Samples
84
····•··· Forest-2
,, , 2 13
Figure 3.9. Comparisons of the proportions of attacked trees between trees
planted inside the forest (Forest-1, Forest-2) and trees planted in the open
(Open-1, Open-2).

85
~
~ !... 30
"' b ii) 25 ii)
- -J::
al 20 :.:.
- -ab
" "' 15 :::: - -
"' i5 10
"' c: 0 5 "i'. 0 c. I:! 0 0..
- a a
0 -
a
~ I I -
136 297 96 64
,,;100 100-200 200-300 300-400 >400
Tree height ranges (cm)
Figure 3.10. Proportions of attacked trees at different tree height ranges
(inclusive on the right) in Forest-1. Numerals inside the columns indicate
the number of trees. Columns sharing no common letters are significantly
different at P<0.05 by chi-square test.

100
80
c 60 (/) ..
40 : .,, 20 ~ 0 0 !'l a; 0
100
(/) c: 80 0
~ 60 a. 40 0 ct
20
0
---e--- all isolated trees
---6--lso-1 -4-lso-2
0 ._,·,
--open-1
····O-··· lso-3
0
~~ S1 S3 SS S6 S7 SB S9 510 511 512 513
Samples
Figure 3.11. Comparisons in the proportions of attacked trees between
isolated trees and trees in Open-1.
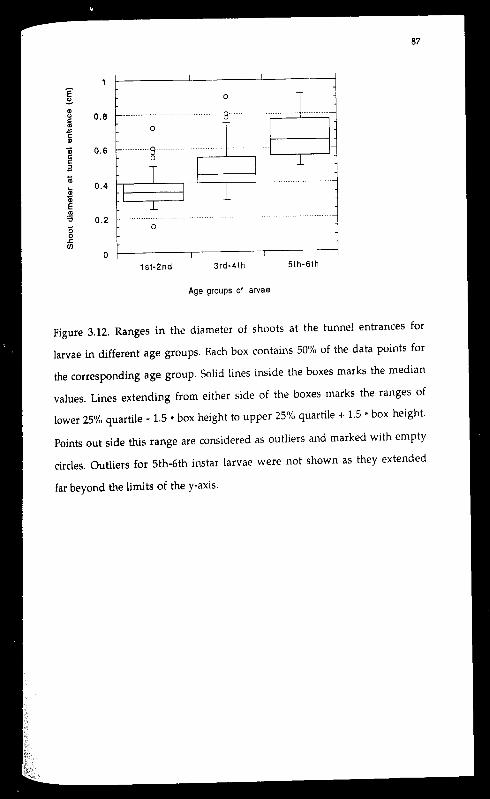
0.8 0
0.6
0.4
0.2 0
0 1st-2nd
....... : ··~
±~ ¥ ...
3rd-4th 5th-6th
Age groups of larvae
87
Figure 3.12. Ranges in the diameter of shoots at the tunnel entrances for
larvae in different age groups. Each box contains 50% of the data points for
the corresponding age group. Solid lines inside the boxes marks the median
values. Lines extending from either side of the boxes marks the ranges of
lower 25% quartile - 1.5 •box height to upper 25% quartile + 1.5 •box height.
Points out side this range are considered as outliers and marked with empty
circles. Outliers for 5th-6th instar larvae were not shown as they extended
far beyond the limits of the y-axis.
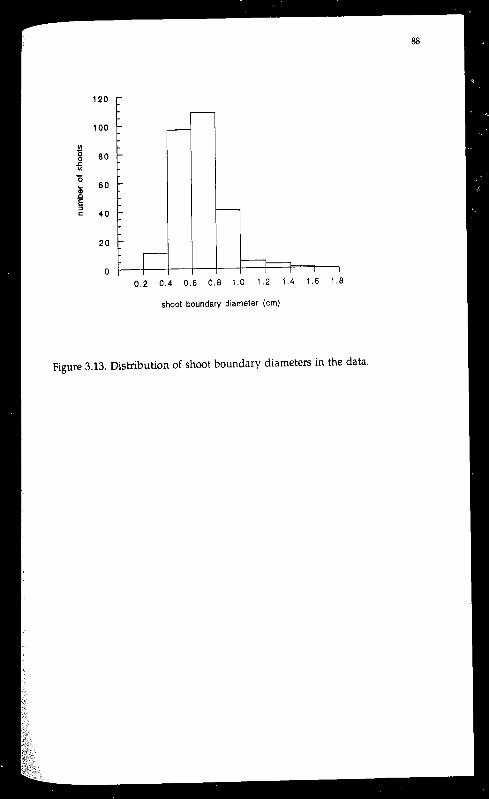
120
100
~ 80 0 .s:; Cll
0 :;; 60
.Q
E ::l c: 40
20
0 0.2 0.4 0.6 0.8 1.0 1.2 1.4 1.6 1.8
shoot boundary diameter (cm)
Figure 3.13. Distribution of shoot boundary diameters in the data.

89
0.8
0.6
1009.06
0.4 1008.06+exp(10.64 BD)
0.2 -
0
0.2 0.4 0.6 0.8 1.2 1.4 1.6
s~oot diameter (cm)
Figure 3.14. Estimated and predicted probabilities of shoot death from tip
down to positions with given diameters.

300
250
-1r-- block-1
'cr
0
0
cr I
o····O
200
90
- -o - -block-2 · · · -o- ·· · block-3
o- .a-····o···· . -0··
0-.
0 .... -a·
400 600 800 1000
Number of days since the first sampling occasion
Figure 3.15. Growth of tree height in the three location blocks in Open-1.
Data points from left to right corresponds to sample 51, 52, ... , 512, and 513,
respectively.

500
e 450 .!:!-:;:
400 .!2' Q) .c; Q) Q) 350 .::. Q)
"' "' 300 Q)
~
forest-1
open-1 /
_o- - 0"
400
-o""' -o-o- -o- -
600 800
Number of days since the first sampling occasion
_o
1000
Figure 3.16. Growth of tree height in Open-1 and Forest-1. Only trees with
their initial height in the range of 200-400 cm were used. Data points from
left to right corresponds to sample 51, 53, and 56, 57, ... , 512, and 513,
respectively.

20
D binomial
r?d oberved
15
"' Q)
~ 0 Q; 10 .Q
E :J z
5
0 0 2 3 4 5 6
Number of times attacked
Figure 3.17. Comparison of the frequency distributions of the number of
times individual sample trees were attacked and that estimated from the
binomial distribution. Pooled data from Open-1 of all samples with the
proportions of attacked trees in the range of 20-80%.
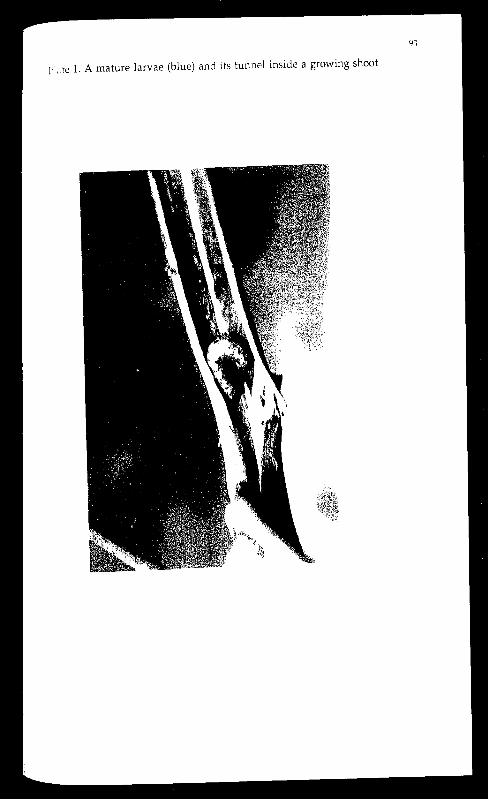
I'',1tc 1. A mature larvae (blue) and its tunnel inside a growing shoot

94
Chapter 4
Artificial Rearing of Hypsipyla robusta Moore
4.1 Introduction
With its ability in providing large numbers of uniform insects with
known nutrition and quality at desired time and free of restrictions posed by
the availability of host materials (Singh and Ashby, 1985), artificial rearing is
widely used in researches and management of pest insects (Knipling, 1984;
Singh, 1984; Reinecke, 1985; Wagge et al., 1985). A key aspect of artificial
rearing is the development of satisfactory diets (Singh and Ashby, 1985).
Although numerous artificial diets have been reported (Singh, 1985), the
search for a suitable diet for a particular species can be a long and tedious
process (Moore, 1985). Apart from meeting the basic nutritional
requirement (Dadd, 1985; Reinecke, 1985), the diet must also be made
inductive to feeding, as "insects, like fussy children, may not eal what is
good for them" (Moore, 1985). Initiation and continuation of feeding rely on
the positive feedback from phagostimulants present in the diet (Bernays,
1985). On the other hand, feeding may be disrupted by the presence of
deterrents (Bernays, 1985). The nature of phagostimulants is complex. They
may appear as part of the nutrients such as carbohydrates and protein or
secondary plant metabolites (Reinecke, 1985). Where more than one
phagostimulant is required, individual phagostimulants may show little or
no effect when applied alone (Bernays, 1985). Moreover, the same chemicals
may act as phagostimulant, deterrent, or neutral, at different concentrations
(Lewis and van Emden, 1986 ). In addition to its chemical completeness, the
diet must have appropriate physical properties, such as hardness, texture,
water content, and homogeneity, much of which can be controlled by
gelling and bulking agents (agar and cellulose, respectively) (Moore, 1985).
After a suitable diet has been found, the performance of the diet and the

95
quality of the rearing hinges on the actual procedure whereby the rearing is
administered, such as microbial control and the choice of rearing
environment (Singh, 1985). Infection of the diet by micro-organisms may
cause high mortality and delay larval development (Bell et al., 1981). In one
case, a particular microbe species was thought to be able to kill larvae of the
first instar, slow the development of the second, and have no detectable
effects on the later stages (Sikorowski and Goodwin, 1985).
Three artificial diets have been attempted on H. robusta. Achan (1968)
was the first to try to rear this insect with an artificial diet. This diet was
unsatisfactory, as the length of development time from egg hatching to
adult emergence almost doubled from that obtained with a natural diet. The
diet of Couilloud and Guiol (1980) (CGD) appeared to be satisfactory as no
adverse effects were mentioned by the authors. Atuahene and Souto (1983)
tried a diet that had been used in the rearing of H. grandella. The length of
development time was reduced to acceptable levels but a high percentage of
larvae died due to non-feeding and pupae were apparently smaller than
those found in the field. Two diets for the sibling species H. grandella in
Latin America have been used, the Hidalgo-Salvatierra Diet (HSD) (Hidalgo
Salvatierra and Berrios, 1972) and the McMorran-Grisdale Diet (MGD) (see
Atuahene and Souto, 198? ). In comparison to the natural diet consisting of
shoots and leaves, the HSD produced individuals with longer lengths of
development time from eggs to pupae and from eggs to adults, but resulted
in larger and more fecund adults (Grijpma, 1971). The better performance in
terms of adult size and fecundity was more likely due to the inadequacy of
the natural diet rather than the superiority of the artificial diet, since in the
field larvae feed inside the living shoots instead of leaves and shoot
cuttings. With MGD, the same problem of high larval mortality due to non
feeding shown by H. robusta was observed on H. grandella (Creasap, 1973).
Another problem commonly experienced with the rearing of
Hypsipyla spp. is the high proportion of infertile eggs in indoor cages
96
(Atuahene and Souto, 1982; Grijpma, 1971), apparently caused by low
mating success. Mating of this insect under indoor conditions has been
largely unsuccessful (Beeson, 1919; Roberts 1968). Fertile eggs were obtained
in substantial quantity only in outdoor cages (Grijpma, 1971). However, the
latter requirement denied the artificial rearing of the species all year round
in most of the temperate regions where winter temperature can be too low
to be tolerated by the moths. Difficulty of mating in laboratory colonies can
be caused by a number of factors, among them the size of mating cages, the
requirement for the presence of host materials (Raina et al., 1992), humidity
(Callahan, 1962), habituation by males to the female pheromone in a
confined environment (Colvin et al., 1994), and differences in the rate at
which males and females reaches sexual maturity (Colvin et al., 1994). The
first two factors have been ruled out as the bottleneck to mating in H.
robusta (Beeson, 1919). Work on H. grandella (Zeller), with which the same
problem was experienced (Grijpma, 1971), showed that mating could be
achieved indoors if the moths were previously allowed to fly in pairs in a
wind mill for some time (Fasoranti, 1985). The result points to a possible
link between wind and the mating behaviour and/or sexual maturity of
Hypsipyla spp ..
In addition to feeding and mating, the rearing of Hypsipyla spp. can be
improved by imposing strict microbial control and reducing the rearing
density (Sterringa, 1973). Among other things, low-density rearing has the
advantage of minimising cannibalism among larvae, the latter being found
to be common in both H. robusta (Beeson, 1919; Froggatt, 1923) and H.
grandella (Grijpma, 1971).
Artificial rearing of H. robusta has not been attempted before in
Australia. Development of such a technique is highly desirable as it would
facilitate studies into various aspects of this insect and its interactions with
the Red Cedar, especially considering the scant information available so far
about this insect relative to the other regional populations of H. robusta.

97
Apart from general considerations, artificial rearing has its special bearing to
this PhD project, as the natural host of the insect does not occur in Canberra
where the project is based. This chapter reports the results of rearing the
insect using CGD as the larval diet. This particular diet was chosen because
of its reported success (Couilloud and Guiol, 1980). Emphases are given to
the solving of larval feeding and moth mating problems. Also reported and
discussed are the performance of CGD and some basic biological attributes of
the cedar tip moth as shown by the laboratory colony.
4.2 Methods
4.2.l Rearing procedure
The CGD was prepared according to Couilloud and Guiol (1980) The
diet was cast in glass jars (90 x 60 mm) to a depth of ca. 2 cm and kept at L
in a refrigerator for later use. Rearing was conducted in a temperature
controlled room at 24-26°C, 14L:lOD. Daylight was simulated by a 250 W
mirror-backed globe. Humidity (> 60%) was not strictly controlled but high
humidity (>60% RH) was maintained in the room by an evaporator (KAZ
Model 76). The laboratory colony was started with final instar larvae,
prepupae or pupae collected from infested Red Cedar trees in a field site ca. 5
km north of Macksville, NSW.
Newly-hatched larvae ( <24 h old) were transferred with a fine brush
into plastic tubes (76 x 10 mm) containing cylindrical cores (40 x 4 mm) of
the diet, punched out using a drinking straw. Each tube contained 10-20
larvae and was capped with cotton wool. At the time when most of the
larvae reached the 3rd instar (approximately 10 days later) they were
transferred to the glass jars where the diet was kept with vertical holes bored
(ca. 4 mm diameter) into it to facilitate the burrowing activities of the
larvae. The top of the glass jar was covered with black cloth. About 40-60
larvae were introduced into each jar. Another transfer was made at the late
5th instar to reduce the density to 20-30 larvae per jar. Transfers were also

98
made if the diet was infected with fungi or almost completely consumed.
Larvae that had developed blue coloration and had ceased f Peding and
crawled out of the diets were taken away and put into plastic jars (50 x 40
mm), with the caps of the jars loosely sitting on top. This step was taken as
earlier observations showed that the inactive prepupae and pupae were
sometimes eaten by younger larvae. A maximum of 10 mature larvae was
put into each plastic jar. To facilitate the construction of pupation cells, a
small amount of cotton wool was placed inside the jars.
Moths of mixed ages and sexes were put in a Perspex cage (250 x 250 x
820 mm) for mating and egg-laying. The two ends of the cage were covered
with cheese cloth and the floor covered with corrugated paper towels.
Cotton wool soaked with 5% sugar solution was put in petri dishes and
placed inside the cage as the moths' food. Viable eggs (red) laid on the
cheese cloth and paper towels were cut out and placed in plastic vials for egg
hatching.
4.2.2 Development rate
Duration of the egg stage was recorded for 250 eggs laid on the same
night. These eggs were placed in a plastic vial with the opening covered
with black cloth. Newly-hatched larvae were removed and counted daily
just before 'daybreak' (19:00-20:30 under reversed light cycle) until the third
consecutive day recording no new hatch!ings. For the study of larval and
pupal development rate, ninety newly hatched larvae ( <24 hour old) were
individually placed in the plastic feeding tubes described in the previous
section. Development stages of the larvae were checked daily just before
dark (9:00-10:30 under reversed light cycle). A larva was considered to have
advanced into the next instar if a new head capsule was found inside the
rearing tube. The head capsule and the rest of the exuviae were removed
with a fine brush after checking and the head capsules measured for width
with a stereoscopic microscopic microscope eq1.tipped with an eyepiece scale

99
(20 x). Due to frequent rupture of the head capsule during the final moult,
the head capsule widths of the last instar were estimated on the basis of the
head widths measured from a separate batch of similarly reared larvae.
Larvae not moulted were recorded as either live or dead. If the larva was
not seen, the diet core was taken out and opened to reveal the status of the
larva and a new diet core was supplied. The diet was also replaced if it was
nearly consumed or considered no longer fresh. For mature larvae, the
dates at which the larvae turned blue, stopped feeding (indicated by the
construction of pupation cells) and pupated were also recorded. The sexes of
the pupae were determined according to Sharma and Singh (1980a).
Checking terminated when the last adult had emerged.
4.2.3 Pupal weight and fecundity
Pupae were weighed to micrograms with a fine balance (GMBH,
Sartorius). Mated females of less than 4-day-old were removed from the
mating cage immediately after separation from copulation and placed
individually in cages made from cardboard tubes (155 x 74 mm), with the
two ends covered with black cloth. Balls of cotton wool soaked with 5%1
sugar solution were placed inside the oviposition cages to serve as food for
the gravid females. The number of red eggs laid by each female was checked
after the female died and before the hatching of any eggs. Dead females were
dissected under a stereoscopic microscope and the number of mature eggs
(those with similar sizes as laid eggs) retained in the ovary were counted.
4.2.4 Non-diet factors affecting egg hatching and survival of neonates
Egg hatching rates
Red eggs laid in the same night by different females were cut out from
the paper towels and mixed. These eggs were divided into 3 groups each
containing 60 eggs and placed separately in plastic vials, two of which were
filled with fresh diet to a depth of ca. 1 cm and the other left empty. Eggs in

100
one of the diet-filled vial were allowed direct contact with the diet while in
the other they were separated from the diet by aluminium foil. The
percentage of eggs hatched in each group was checked 10 days later.
Tolerance to starving in the neonates
Four batches of larvae (> 10 larvae each), hatched within the one-hour
period between 9:00-17:00, were individually placed in plastic tubes with
their hatching hours marked and capped with cotton wool. No food was
provided. The survival status of the larvae (live or dead), determined by
lightly poking the larvae with a fine brush, was checked hourly between
9:00-21:00 each day. The length of survival time was estimated as
cumulative hours from the hatching hour to the time of death. Larvae that
died outside the daily checking period were considered to have died at 3:00
the previous night. To study the effect of access to water, the survival time
was similarly estimated for another two batches of larvae with water-soaked
balls of cotton wool placed at the bottom of the plastic tubes. In a separate
study, 80 neonates each were transferred to the diet at 6, 24 and 36 h after
hatching and allowed to feed for 3 days, at the end of which time the
survival rates of the neonates were checked. The experiment was conducted
in plastic tubes (76 x 10 mm) each containing a length of the diet core (ca. 40
x 4 mm). Twenty neonates were introduced into each tube.
Effect of egg-laying substrates on the feeding readiness of neonates
The first-3-day survival of neonates in the artificial diet was tested for
those hatched from eggs laid on the paper towels and those on host leaves.
The test was conducted in plastic tubes each containing a length of cylinder
core of the diet (ca. 40 x 4 mm). The neonates were transferred to the diet
within 16 hours of their hatching. Each egg-laying substrate was tested on 60
neonates with 20 neonates in each tube.

101
Effect of the size of the rearing containers on the survival of neonates
Three types of containers, plastic tubes (76 x 10 mm), plastic vials (50 x
40 mm), and the glass jar (90 x 60 mm) in which the diet was cast, were
assessed for their performance in rearing the neonates with artificial diet.
For the plastic tubes the diet was supplied in the same way as above. For the
plastic vials the diet was filled to a depth of ca. 1 cm. Diet in the both the
plastic vials and the glass jar was densely punched with vertical holes (ca. 4
mm in diameter), using a drinking straw. Twenty neonates were introduced
into each of the five plastic tubes and each of the five plastic vials. The glass
jar was inoculated with 100 neonates. The plastic tubes were capped with
cotton wool and the plastic vials and the glass jar by black cloth. Survival of
the neonates was checked 3 days later by counting the number of dead
larvae outside the diet (inner walls of the containers, caps, and the surface of
the diet).
4.2.5 Feeding enhancement
CGD fortified with leaf powder
Healthy Red Cedar leaves were cut off at the base and air-dried in the
laboratory. The dried leaves, after being stripped of the petioles and midribs,
were ground to fine pieces in a hand grinder. The leaf powder was
incorporated into the ready-made diet in a 1:10 weight ratio by thoroughly
mixing the two in the grinder. Performance of the fortified diet in attracting
feeding by the neonates relative to the plain diet was tested by packing the
two diets in the same plastic vial (76 x 10 mm) to a depth of 10 mm, each
occupying a little under one half of the floor space, with a narrow gap left
between the interfaces. Twenty newly hatched larvae ( < 16 h old) were
transferred with a fine brush to the surface of each of the two diets. The test
was replicated 5 times. The number of larvae in or on each diet was checked
one week later. Also recorded were the relative amount of feeding tunnels
or other feeding scars.

102
CGD fortified with the ethanol extract of young shoots and leaves
Preliminary trials indicated that incorporation of methanol extract of
young shoots into the artificial diet showed some degree of feeding
enhancement in lst-instar larvae, whereas extract of the non-polar solvent,
light petroleum, was Jess effective. In light of this finding, later experiments
on feeding enhancement were carried out on extracts with ethanol, which
has similar polarity as methanol but, unlike methanol, is natural to plants.
The ethanol extract were obtained by soaking the young shoots (including
leaves) in 95% ethanol for 3 days at room temperature (20-25°C). The extract
was filtered and reduced to near dryness in a rotatory evaporator at 40°C.
Ethanol was re-added to the residue so that the extract reached a
concentration of 10 g /ml fresh weight equivalent (FWE) of the host tissue.
Incorporation of the extract into the artificial diet was made during the
preparation process of the diet in a way similar to that reported by Hsiao and
Frankael (1968). The extract was applied to the cellulose constituent of the
diet. After evaporation of the solvent, the treated cellulose was mixed with
the other constituents as in the original diet preparing process. The control
diet was likewise prepared but the cellulose was applied with pure solvent
of the same volume. Three concentrations: 1, 5 and 10 g FWE of extract in 50
g of a!Lificial diet, were tested in a non-choice bioassay at 24-26°C and light
period of 14L:lOD.
Newly hatched larvae were individually transferred into test tubes (10
x 76 mm) each containing a small amount of the diet in the form of
cylindrical (5 x 50 mm) and capped with cotton wool. Each treatment and
control diet was tested with 30 larvae. Development and mortality of the
test larvae was followed daily until the 3rd instar. The feeding stimulating
effect of the ethanol extract was evaluated further in a dual-choice test,
using the 5 g FWE diet and the control diet. Ten hatchlings were introduced
into each tube containing cylindrical (20 x 4 mm) of both treatment and

103
control diet, with 5 larvae placed on each diet. The two diet cores were
separated by a thin plastic panel (ca. 30 x 5 mm) to prevent physic:il contacts.
As the plastic panel was shorter and narrower than the test tube, larvae
could move across the two diets. The test was replicated 8 times. The
number of larvae on the treatment and control diets was checked daily, just
before the start of the dark period, for 3 days starting on the second day and
the relative intensities of feeding, as shown by surface tunnels or entry
holes, checked at the end of the test.
4.2.6 Mating
In an effort to improve the mating rate of caged moths in the rearing
room, the effect of wind on mating success was investigated. Two
experimental designs were tried. (a) Mating in wind and windless cages.
Two perspex cages of the same dimension (250 x 250 x 820 mm) were placed
side by side, with their openings covered by cheese cloth. One cage was
blown continually by wind generated from a fan (160 mm diameter.) placed
at ca. 30 cm from one end of the cage and the other blocked from wind by
plastic sheets at both ends. Wind speed inside the cage was low (ca. 0.5 m/s
in the centre). Twenty virgin males and twenty virgin females, emerged
within the last three days, were placed in the ventilated cage, and the same
number in the windless cage. The moths were then observed for mating for
three consecutive nights, with the aid of a red florescent light tube (25 W)
sitting lengthwise on top of the two cages in the centre. On the 4th night, air
was blown through the windless cage to see if there was any change in
mating activity. Three experiments of this type were performed. (b) Mating
during wind and windless intervals. Virgin males and females of mixed
ages were left in one cage and the fan was switched on and off alternately at
fixed intervals. Three fan-on and fan-off interval ratios were used: 20:20,
20:40 and 20:60 minutes. During the fan-off phases, plastic sheets were used
to cover the cage ends to simulate windless conditions inside the cage. Four

104
experiments, each running a full night phase of the inverted light cycle,
were conducted for each of the three fan-on and fan-off interval ratios. The
number of copulations at each interval was recorded. Comparisons were
made between the number of copulations per hour during wind and
windless intervals. In all experiments, a petri dish containing cotton wool
saturated with 5% sugar solution was placed on the floor at either end of the
mating cage to serve as food of the moths.
4.3 Results
4.3.l Performance of the laboratory colony
Egg hatching and development
Newly laid fertile eggs were creamy white. Within 24 hours, distinctive
red bands appeared, which did not occur among unfertile eggs. Egg hatching
rates, estimated from batches of eggs (n> 50) laid by mated females on the
same nights, varied from 56% to 81 % (average 68%). Not all eggs in the
same batches developed the red bands, indicating some of them may have
been unfertilised. Egg period averaged 5.2 days (range 5-6 days).
Development of larvae and pupae
The number of larval instars varied from five to seven, with the
majority (69.1%) passing through 6 instars before pupation. The 5-instar
form was more common (21.8%) than the 7-instar form (9.1%). Except for
the missing 6th instar, head capsule widths of the 5-instar form were similar
to that of the 6-instar form, the mean and ranges of the latter shown in
Figure 4.1. Neighbouring larval instars were clearly separated by their head
capsule widths except for the last two instars. Overlapping in the head
capsule width ranges of the last two instars may have been due in part to the
fact that the head capsule widths of the last instar were estimated by using
the head widths instead of being measured on the head capsules as in the
other instars. Development times of individual larval instars and of pupae

105
are given in Table 4.1. Total length of larval and pupal period between the 5-
and 6-instar-form were close, averaging 33.25 days and 33.53 days,
respectively. The development time of the 7-instar form took, on average,
an extra time of five days. However, the lengthened development time
needs to be verified as the number of larvae showing this form was very
low (Table 4.1). Irrespective of development forms, lengths of the last instar
were considerably longer than that of any other instars, accounting for over
one third of the total larval period. The differences remained apparent after
the time spent as prepupae was deducted from the last instar, except in
comparison with the 3rd instar of the 5-instar-form. The last instar larvae
turned blue in 2-4 days, with about three quarters of the last instar spent as
blue larvae. The mature larvae did not stop feeding upon turning blue: they
continued to feed for ca. 3 days before constructing the pupation cells. The
non-feeding prepupal stage took an average of 3.1-3.8 d (range 2-6 d),
accounting for 12.6-13.4% of the total larval period. Within-stage variation
in development times was smallest in the pupal stage, with the standard
deviation within 7% of the mean for the 5- and 6-instar forms. No
significant difference in the means of the combined development time of
larvae and pupae between males (averaging 34.9 d) and females (averaging
35.0 d) was detected (P> 0.1, Welch modified t-test).
Sex ratio, pupal weight, adult life span and fecundity
Examination of 319 pupae revealed no significant deviation of sex ratio
from 1:1. (P>0.1, Chi-square test). Pupal weight averaged 150.2 mg (± 26.2
mg), ranging from 80 mg to 221.2 mg. Female pupae (154.5±28.6 mg) were
significantly heavier than male pupae (145.6 ± 22.5 mg) (P< 0.01, Welch
modified t-test). However, the ranges of pupal weight in the two sexes were
highly overlapped and it was impossible to tell the sex of an individual
pupa based on either its length or maximum width (casual observation).
With the provision of 5% sugar solution, females lived for an average of
106
9.76 days (5-15 d) and males 8.5 days (3-16 d). The difference in the life span
between the two sexes was not significant (P> 0.1, Welch modified t-test).
Within females, mated individuals lived significantly longer (11.1 ± 2.3 d)
than unmated individuals (8.5 ± 2.9 d) (P< 0.05, Wilcoxon rank sum test).
The number of eggs laid per female, determined from a sample of 28
females, ranged from 24 to 193, with a mean of 93. Dissection of newly-dead
gravid females showed large numbers of unlaid eggs in some individuals.
The potential fecundity, as estimated from the sum of the number of eggs
laid and the number of mature eggs retained in the ovary, ranged from 112
to 276, with a mean of 168.
Mortality during the larval and pupal stage
Total mortality during the larval and pupal stage ranged from 23% to
54%. The mortality was highest during the 1st instar (17-41 %) and relatively
low in the later stages. A typical mortality-age curve is shown in Figure 4.2,
with data taken from the development study. Of the 114 larvae reared
individually on the CGD, ca. 36% died during the first instar, accounting for
ca. 70% of all larval and pupal deaths. Except for the second instar, which
recorded a 12.33% death rate, mortalities during the later larval instars were
below 7%. No death was recorded in the pupal stage. Among those that
reached the third instar, 91.5% survived to the adult stage.
4.3.2 Non-diet factors on egg hatching and the survival of neonates
Egg hatching rates
Only 4 of the 60 eggs (6.7%) placed directly on top of the diet hatched. A
hatching rate of 58.3% was achieved for eggs placed in the empty jar, similar
to that (63.3%) in the diet jar where larvae were separated from the diet by
aluminium foil. Some of those that failed to hatch died after the completion
of embryo development, as indicated by the formation of the outlines of the
larvae under the egg shells.

107
Survival of neonates
The neonates lived for a maximum of 60 hours in the absence of food,
with a mean of 36 hours. The first-3-day survival rates of neonates
decreased as the length of the hunger period increased. Neonates transferred
to the diet within 6 hours of their hatching achieved 73.8% survival during
the first 3 days while only 12.5% of those transferred after 36 hours
survived. The survival rate for those transferred after 24 hours was 51.3%,
which was significantly lower than for those transferred within 6 hours (P<
0.05, Chi-square test).
Larvae hatched from eggs laid on paper towels started feeding more
readily than those from eggs laid on host leaves, as seen in the significantly
higher first-3-day survival rate for the first group (68.3%) in comparison
with the latter group (40.0%) (P<0.05, Chi-square test).
Survival rates of the neonates decreased with the size of the rearing
containers. Rearing the neonates in the plastic tubes yielded the least dead
larvae during the first 3 days (22%), followed by that in the plastic jars (46%)
and the glass jar (74%). The differences were all significant (P> 0.05, Chi-
square test)
4.3.3 Feeding enhancement
CGD fortified with leaf powder
Feeding preference of young larvae toward the leaf powder fortified
diet was overwhelming. A total of 84 live larvae (2nd-3rd instar) were
recovered at the end of the experiment. In four of the five plastic vials all
larvae were found on or inside the leaf powder diet. In the other plastic vial,
3 larvae were found feeding on the plain diet and 14 on the treatment diet.
The feeding preference was supported by the relative densities of feeding
scars on the two diets, which were consistently higher on the fortified diet
than on the plain diet.

108
CGD fortified with the ethanol extract of young shoots and leaves
Feeding on the CGD was apparently improved with the addition of
ethanol extracts of young shoots (Figure 4.3). Mortalities of the neonates in
the first 24 and 48 hours of introduction were reduced to below 14% and
30%, respectively, about half of that on the plain diet. While 73% of those
reared on the plain diet died during the first two instars, the majority of the
larvae (>62%) reared on the fortified diet successfully developed into the 3rd
instar. Among the three extract concentrations tested, the effect of feeding
enhancement was most obvious when the extract was incorporated at the
concentration of 10 g FWE/50 g diet. The feeding enhancement effect was
more convincingly shown when both the plain and fortified diet were
placed in the same plastic tubes (Figure 4.4). Daily inspections in the first 3
days after larval introduction consistently showed more larvae on the
fortified diet than on the plain diet in all the test tubes. Direct evidence of
feeding enhancement was shown in the density of surface tunnels and entry
holes at the end of the experiment. These feeding scars were found densely
distributed in all the 8 fortified diet cores, whereas only 2 control cores
showed apparent feeding symptoms.
4.3.4 Effects of wind on mating success
Mating was not observed in the windless cage in any experiments
during the three observation nights when wind was completely blocked,
whereas the ventilated cage produced a total of 11, 9, and 6 copulations per
experiment. However, on the fourth night, when wind was provided, 3, 5,
and 3 females mated in the windless cage in the three experiments,
respectively. Under alternating wind and windless conditions, mating did
occur during the windless intervals, although it was less frequent. The
number of copulations per hour was consistently lower for the windless
intervals than that for the wind intervals (Table 4.2).

109
4.4 Discussion
The study has shown that, H. robusta occurring in Australia can be
reared successfully on the CGD. The insect had been maintained
continuously in the laboratory for 23 generations. The colony reared in this
study compared favourably to other colonies of H. robusta reared on
synthetic diets in terms of pupal weight and the numbers of eggs laid per
female but the development time from egg to adult in this study was a little
longer (Table 4.3), the latter may be due partly to the different temperature
regimes used. Pupal weight in this study was higher than those reported for
field individuals by Atuahene and Souto (1983). Duration of development
was comparable to that observed for individuals reared with host tissues
(see Chapter 5).
Inconsistency exists in the published reports concerning the number of
larval instars. While the same pattern of variation in development forms as
revealed in this study was seen in the artificial rearing of Atuahene and
Souto (1983), only 5- and 6-instar forms were reported by Couilloud and
Guiol (1980). Discrepancies between artificially reared and field populations
were even greater. In the two classical papers on the biology of H. robusta,
Beeson (1919) and Roberts (1966) reported only four larval instars. The
inconsistency cannot be explained solely by possible differences among
regional populations of H. robusta, as different development forms were
observed in studies of the same regional populations (Atuahene and Souto,
1982 vs Couilloud and Guiol, 1980) and the same number of larval instars
was reported for different regional populations (Beeson, 1919; Roberts, 1968).
The choice of diet cannot be held solely responsible either, as seen in the
agreement between the results of Atuahene and Souto (1983) and those of
this study, although different diets were used. While the combined effect of
population origin and diet cannot be ruled out, it appears more likely that
certain instars were overlooked in some studies, especially those of a field
110
nature. Due to their cryptic nature and small sizes, larvae of the first and
second instars are difficult to find in the field. Dissections of infested tissues
mostly revealed larvae already in their third or later instars (casual
observation). The number of larval instars does not appear to be controlled
by sex, as the three development forms were recorded for larvae of both
sexes. Irrespective of the development forms, the longest development time
was recorded in the last instar, accounting for about one third of the total
larval period. Food consumption rate during the last instar was also higher
than that during any of the other instars, as seen in the need for more
frequent supply of diet (casual observation). The combined effect of the
relative long duration and high food consumption rate would make the last
instar the most destructive stage, at least in terms of quantitative damage
that would be incurred to the host tree. Except for the relatively rare 7-instar
form, the pupal stage was the longest and yet the most stable development
stage (Table 4.1), making the onset of pupation an ideal predictor of the
timing of adult emergence.
The CGD apparently lacks the feeding stimulants that the insect has
become adapted to in the field. Relatively high proportions of larvae died
during the first instar, apparently due to non-feeding. Feeding became less
of a problem once initial feeding commenced, as reflected in the much
lower mortality rates among older larvae. The non-feeding problem was
particularly prominent during initial rearing trials, when the neonates were
directly transferred to relatively large containers containing bulky diet, as
was the technique used by Couilloud and Guiol (1980) in their use of the
CGD. The same feeding problem was reported for H. robusta populations in
Africa (Atuahene and Souto, 1982) and for the sibling species H. grandella in
Latin America (Creasap, 1973). This is not surprising, as an artificial diet is
usually drastically different from the natural diet both in chemical and
physical properties (Moore, 1985).
111
Several non-diet factors influenced the survival of the neonates. The
degree of non-feeding of the neonates differed with the substrates on which
eggs were deposited. Larvae hatched from eggs laid on paper towels began
feeding on the artificial diet more readily than those on host tissues (leaves,
leaf petioles or shoot stems). The likely reason is that larvae hatched from
eggs on host tissues had already taken their first meal in the host tissues
before being transferred to the artificial diet, causing them to avoid any
unnatural and less 'tasteful' food. The size of the rearing containers also
influenced the mortality rates due to non-feeding. In comparison to rearing
in the relative large glass jars and the plastic vials with the diet flatly packed
inside, rearing in the small plastic tubes, with the diet supplied as cylindrical
cores, resulted in relatively low percentages of neonate deaths. Apart from
the size of the rearing containers, the way the diet was presented may have
also contributed to the difference, as the cylindrical cores resembles the
shape of the shoots, the preferred feeding tissue of the larvae in the field.
Rearing the neonates in small containers has the additional advantage of
maintaining fresh diet, as the latter can be easily replaced without losing
track of the reared larvae. Finally, survival rates of the neonates can be
increased by shortening their pre-feeding hunger period, as larvae
transferred to the diet short! y after their hatching ( < 6 hours) showed
significantly higher survival rates than those transferred after 24 hours or
later. However, placing the eggs directly on top of the diet is to be avoided,
as the practice was found to result in extremely low egg hatching rates,
probably due to the high acidity level of the diet (pH 4.8). The best way
appears to be placing the eggs inside the rearing containers but separating
them from the diet with non-water-absorbent material, as in Couilloud and
Guiol (1980).
More significant improvement in the feeding of the neonates lies in
the introduction of some form of feeding stimulants that are present in the
host tissues into the artificial diet. Evidence for the existence of feeding
112
stimulants in host tissues was shown in increased survival rates on fortified
diets. The nature of the feeding stimulants was not investigated. They were
found to be present in dry leaves and in the ethanol extracts of young shoots
and leaves. The fortified diets were not used in the normal rearing of the
insect in this study as they were less chemically defined and more difficult
to standardise. More detailed discussions on the feeding stimulants of the
insect are presented in Chapter 6.
Another important aspect in the artificial rearing of the insect is adult
mating. As noted elsewhere (Beeson, 1919; Grijpma, 1971; Atuahene and
Souto, 1985; Fasoranti, 1985), mating was found to be difficult in indoor
cages during the early phase of artificial rearing. Cages of various sizes have
been tried, from small wooden cages (35 x 35 x 35 cm) to a large nylon mesh
enclosure (195 x 170 x 140 cm) '" rnpying much of the rearing room, but
mating rates remained low. Provision of host plants did not seem to help
either. The problem was solved by blowing wind through the mating cages.
Wind showed direct and indirect enhancement of mating success.
Mating frequencies were significantly higher in the presence of wind,
whether applied continuously or alternately. In the wind and windless cage
experiments, the result was extreme: no mating occurred in the windless
cage during the first three nights when wind was blocked, whereas
copulations took place in the ventilated cage each night. The absence of
mating in the windless cage did not seem to be the result of accidentally
allocating sexually inferior moths to that cage, as mating was recorded on
the fourth night when wind was provided. In the alternating wind and
windless experiments, the number of matings per hour was consistently
higher for the wind intervals than for the windless intervals. Previous
exposure to wind appears to enhance the mating activity, as a number of
females mated during the windless intervals under alternating wind and
windless conditions. The result indicates that current or past exposure to
113
wind both enhances mating success, but simultaneous presence of wind is
not a pre-requisite of the mating process.
The mechanism for the mating-enhancement effect of wind is not
clear. It is suspected that the relatively easy locating of calling females by
males in the presence of wind may be partly responsible. Other contributing
factors may be: (a) wind stimulates flight, which, in turn, speeds up the
sexual maturity of the moths, and (b) males and females select their mates
before mating and the chances for suitable matching pairs to end up in
mating would be much lower in still air than in moving air. Hypothesis (a)
is supported by the finding of Fasoranti (1985), who demonstrated that
mating of H. grandella could be greatly enhanced by flying the moths in a
windmill for some time before subjecting them to mating cages. The mate
selection hypothesis is supported by the observations that some males came
into direct contact with calling females without showing any courtship
behaviour and some calling females walked away from approaching males.
When the number of sexually-active males and females is low, such mate
selection behaviour may result in the absence of mating.
The positive association between wind and mating may be partly
responsible for the relatively low infestation levels of host trees planted
inside forests as compared to those planted in the open, a pattern widely
reported on Hypsipyla spp (see Entwistle 1967; Newton et al. 1993). Wind
inside a dense forest may, at times, be so low that the process of locating
calling females by males is hampered and the pre-courtship flight of the
moths suppressed. It is worth while investigating whether moths emerged
from such a habitat may choose to fly out of the forest to engage in their
reproductive activities.

114
Table 4.1. Duration of development (days) of H. robusta in individual larval
instars and the pupal stage for the 5-, 6-, and 7-instar development forms.
Data from larvae that died before reaching the adult stage were not
included. Larvae were reared with the CGD at the temperature of 25±2°C
and the light period of 14L:10D.
Stage II III IV v VI VII p Total
5-instar mean 3.8 3.6 5.2 3.8 8.1 n.a. n.a. 8.8 33.3
form SD 0.8 1.2 1.6 1.0 1.2 n.a. n.a. 0.6 2.5
(n=12) range 2-5 2-6 3-7 3-6 7-11 n.a. n.a. 8-10 30-37
6-instar mean 3.9 3.5 2.9 2.9 3.1 8.4 n.a. 8.8 33.5
form SD 0.7 0.6 1.0 0.9 0.5 1.4 n.a. 0.6 2.1
(n=38) range 3-6 2-4 2-6 2-6 2-4 6-12 n.a. 8-10 30-39
7-instar mean 3.0 3.8 2.2 3.0 2.8 3.8 11.0 9.2 38.8
form SD 0.7 0.5 0.5 0.7 0.5 1.8 3.1 1.5 3.4
(n=5) range 2-4 3-4 2-3 2-4 2-3 3-7 8-15 7-11 33-44

115
Table 4.2. Number of females mated per hour under alternating wind and
windless conditions. Each experiment lasted the entire 10-hour scotophase
and began with the wind interval.
Number Interval length (min) No. mated/hour
of moths wind windless wind windless
49 20 20 2.2 0.4
28 20 20 l .O 0.4
25 20 20 0.4 0.2
38 20 20 1..0 0.2
36 20 40 l.8 0.9
34 20 40 2. l O.J
45 20 40 3. 3 0.0
15 20 40 0.60 0.2
26 20 60 0.8 0.3
23 20 60 I.I 0.1
37 20 60 4.5 0.0
12 20 60 0.8 0.0
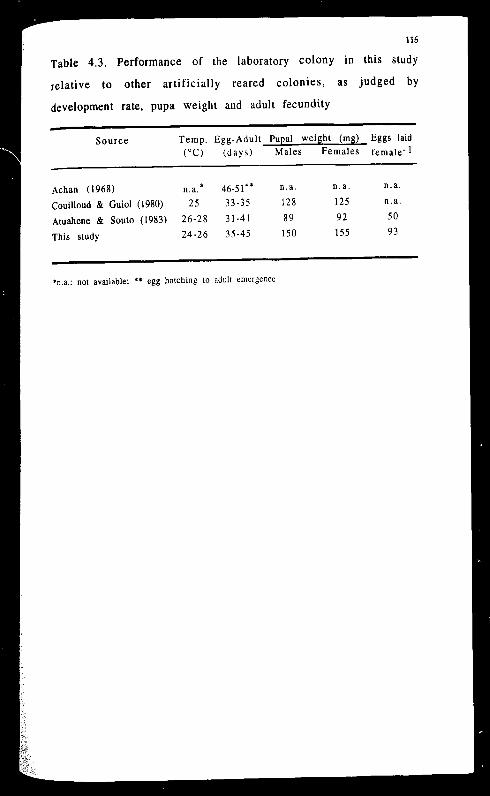
116
Table 4.3. Performance of the laboratory colony in this study
relative to other artificially reared colonies, as judged by
development rate, pupa weight and adult fecundity
Source Temp. Egg-Adult Pu Eal wei!,\ht (ml,\) Eggs laid
(oC) (days) Males Females female·!
Achan (1968) • 46-51** n. a. n.a. n.a. n.a.
Couilloud & Guiol (1980) 25 33-35 128 125 n.a.
Atuahene & Souto (1983) 26-28 31-41 89 92 50
This study 24-26 35-45 150 155 93
*n.a.: not available; •• egg hatching to adult emergence

117
3
2.5 I E' .s I ¥; 2
j
" 1.5
1 'S en a. .. 0
'ti .. I " J: 0.5 1
0 -II Ill IV v VI
Larval instar
Figure 4.1. Mean and ranges of head capsule widths of 6-instar-forrn larvae
of H. robusta reared on the CGD. The head capsule widths of the last instar
were estimated with head widths.

~ stage mortality D proportional mortality
70
60
l 50
.. 40 ~ ~ 30 iii 1: 0 ~ 20
10
0 II Ill IV V-Vll pp p
Development stage
Figure 4.2. Stage-specific mortalities of H. robusta reared on the CGD.

119
D plain diet r:::l 5g FWE
IZl 1 gFWE • 10 g FWE
0.8
0.7
0.6
~ $
0.5
~
.~ 0.4
~ 0.3 0 E
0.1
0
24 h later 48 h later before 3rd-instar
Figure 4.3. Mortality rates of H. robusta larvae reared on the CGD fortified
with 95% ethanol extract at various concentrations (fresh weight
equivalents (FWE) of host tissues in 50 g of the CGD) and on the plain CGD
in non-choice tests in plastic tubes (76 x 10 mm).

120
D plain diet • fortified diet ~ not on diet
60
50 ., "' c: .!!! 40 0 Cii 30 .c E :J c: a; 20 0 I-
10
0 2 3
Days after introduction
Figure 4.4. Relative performance of the fortified and plain CGD in arresting
feeding by neonates of H. robusta as measured by the number of larvae on
the respective diet, provided as cylindrical cores (20 x 4 mm), in the first
three days in a dual-choice test in plastic tubes (76 x 10 mm). Larvae not in
contact with neither the fortified diet nor the plain diet were recorded as
'not on diet'. The fortified diet was incorporated with 95% ethanol extract at
the concentration of 5 g of fresh weight equivalent of host tissue in 50 g
plain diet.

Chapter 5
Temperature-dependent Development of Hypsipyla robusta
Moore
5.1 Introduction
121
The relationship between insect development and temperature has
Jong been appreciated (see Wagner et al., 1984a). Understanding this
relationship is critical for accurate scheduling of census samples and control
strategies. For any species, development occurs within a narrow
temperature range, characterised by a lower and upper threshold (Lamb,
1992). Two different approaches have been used to describe insect
development within this tolerable temperature range, i.e., the linear
approach and the non-linear approach. With the linear approach, the
development rate (reciprocal of development time) is taken as a linear
function of temperature (Campbell et al., 1974; Pruess, 1983). The underlying
hypothesis is that the total thermal units, given by the sum of time units
(days or hours) with temperature above a certain threshold required to
complete the development, is constant. Despite its simplicity, this approach
often yields approximately correct values and is widely used (see Wagner et
al., 1984a). However, most authors argue that linear development is valid
only over intermediate temperatures. Over the entire range of tolerable
temperature, the relationship between development rate and temperature
often appear as curvilinear, characterised by a lower asymptote of zero in the
left region, an approximate linear section in the mid-region, and a falling
off section in the right region (Wagner et al., 1984a). A number of
mathematical equations has been proposed to describe the curve nature of
the relationship. Some of the widely used models are: the logistic equation
of Davidson (1944), modified sigmoid (Stinner et al., 1974), various matched
asymptotic curves (Logan et al., 1976; Hilbert and Logan, 1983), and the

122
biophysical model of Sharpe and DeMichele (1977) modified by Schoolfield
et al. (1981). These and other empirical models describe part or all of the
response curve. The biophysical model is favoured because of its basis on
biophysical laws (Wagner et al., 1984a). Furthermore, the model can be
easily reduced to simpler forms to cater for particular temperature ranges.
However, insofar as goodness-of-fit is concerned, different non-linear
models may appear equally acceptable (see Worner, 1992, Liu el al., 1995).
Sometimes simple linear models perform even better than non-linear
models in this respect (see Roltsch et al., 1990). Parameters in rate models,
linear or non-linear, are estimated with constant temperature data. The rate
models can be used to describe or predict the mean duration of
development of field populations experiencing variable temperatures. This
is achieved by summing up fractions of development rates at discrete
intervals until the sum reaches unity, i.e., rate summation (Kaufmann,
1932). Conflicting reports exist concerning the applicability of rate models to
variable temperature conditions. Given the same mean temperatures,
development under fluctuating temperature regimes can be accelerated,
decelerated, or similar to that at constant temperatures (see Worner, 1992).
Reasons for such variable reports were attributed to the limited temperature
ranges in which the studies were carried out (Worner, 1992; Liu et al., 1995).
When a full range of variable temperature range is investigated,
development is generally more rapid with lower mean temperatures and
greater diurnal fluctuations (Worner, 1992). A recent study by Liu et al.
(1995), based on a re-examination of published data, demonstrates that the
disparity in development between constant and variable temperature
conditions results primarily from the curve nature of the relationship
between developmer•t rate and temperature and is less likely to be caused by
any physiological char.ges of insects.
Insects held under identical temperature and other experimental
conditions often comriete development at different times due to inherent

123
differences among individuals in a population (Wagner et al., 1984b). The
stochastic nature of development also may have contributed to the
observation that, in field populations, samples drawn at the same dates
rarely reveal individuals in the same developmental stages (Dennis et al.,
1986). Individuals at different development stages may cause different
damage levels to the host plants and may show different susceptibility to
particular control methods (Shoemaker, 1979). Consequently, pest managers
are concerned with estimating the proportion of the insect population in
various stages over time, as well as predicting the times at which the
majority of the population is in those stages most receptive to control agents
(Stedinger et al., 1985).
Proportions of a population in individual developmental stages can
be estimated by ordinal regression models (Candy, 1991). A biologically
based, yet easy to use, model in this category is given by Dennis et al. (1986).
The model assumes that the development of a given insect is a stochastic
process consisting of accumulated small increments of development time
(measured by degree-days) starting at a given stage (e.g. egg). As the amount
of development increases, the insect passes through successive stages,
delimited by a set of signpost values corresponding to the development
times necessary for successive moults. The stochastic process takes the
logistic distribution as its probability distribution. One of the advantages of
the model is that it requires, in essence, no more than the proportions of
various stages sampled at discrete intervals and the corresponding
accumulated degree-days for its calibration (Candy, 1991; Munholland and
Dennis, 1992). Hence it can be used in situations where only the relative
abundance of the insect is sampled, e.g. data from sweepnets or traps.
Statistical inference of the model is provided by Dennis et al. (1986) and
Dennis and Kemp (1988). The model has been successfully applied to a
number of insect species (e.g. Kemp et al., 1986; Kemp and Onsager, 1986).
This and other similar models (Osawa et al., 1983; Stedinger et al., 1985) are

124
based on population attributes rather than the progression of individuals
through stages over time, which are more biologically appealing (Candy,
1991). The latter are dealt with by a group of models termed by Munholland
and Dennis (1992) as microscopic models (Manly, 1974, 1989; Kempton, 1979;
Munholland et al., 1989; Munholland and Dennis, 1992). However, they
suffer from the limitation that development depends on only a single time
dependent variable (Candy, 1991). Additional drawbacks are difficulty in
parameter estimation and convergence problems (Munholland and Dennis,
1992). As an alternative to the ordinal regression approach, Candy (1991)
proposed the use of continuation ratios (conditional probabilities) and
generalised linear models to model the insect population phenology. These
models may perform better than ordinal regression models in predicting
stage-specific proportions, but lack a biological basis (Candy, 1991).
Instead of describing directly the stage-specific frequency data on
population development, Wagner et al. (1985) present a rate-summation
approach for modelling the development times of individuals of a
population. This approach integrates a temperature-dependent rate function
and a probability distribution into a simulation model, with the rate
function determining the median rate of development per day at a given
temperature and the distribution function (Wagner et al., 1984b)
determining the fraction of cohort development at a given accumulated
rate. Their model can be used to predict the cumulative proportions of
individuals completing the development of a particular stage through time
under variable field temperatures but it appears to be unsuitable to describe
proportions of individuals at different stages at given times.
No studies have been attempted to quantify the temperature
dependent development of Hypsipyla robusta Moore. Reports concerning
the development of this species are mostly given in the form of the number
of generations per year (2-10 generations/year) or generation times (21-79
days, non-aestivation generations) (Beeson, 1919, 1941; Roberts, 1966, 1968;
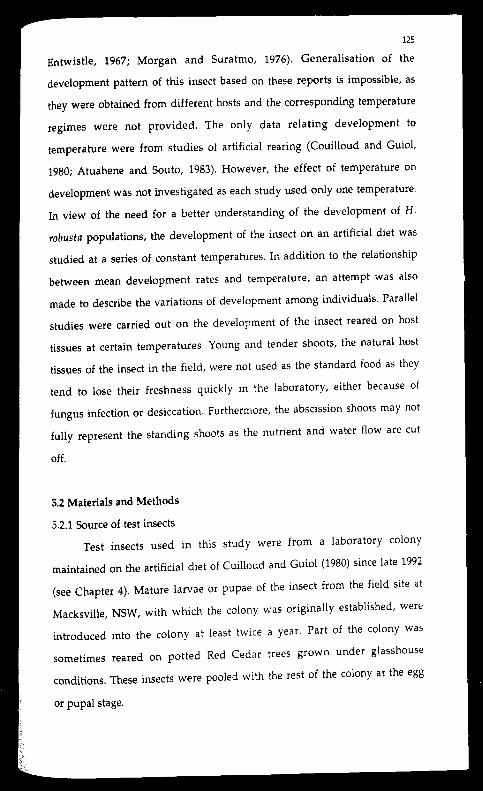
125
Entwistle, 1967; Morgan and Suratmo, 1976). Generalisation of the
development pattern of this insect based on these reports is impossible, as
they were obtained from different hosts and the corresponding temperature
regimes were not provided. The only data relating development to
temperature were from studies of artificial rearing (Couilloud and Guiol,
1980; Atuahene and Souto, 1983). However, the effect of temperature on
development was not investigated as each study used only one temperature.
In view of the need for a better understanding of the development of H.
robusta populations, the development of the insect on an artificial diet was
studied at a series of constant temperatures. In addition to the relationship
between mean development rates and temperature, an attempt was also
made to describe the variations of development among individuals. Parallel
studies were carried out on the development of the insect reared on host
tissues at certain temperatures. Young and tender shoots, the natural host
tissues of the insect in the field, were not used as the standard food as they
tend to lose their freshness quickly in the laboratory, either because of
fungus infection or desiccation. Furthermore, the abscission shoots may not
fully represent the standing shoots as the nutrient and water flow are cut
off.
5.2 Materials and Methods
5.2. l Source of test insects
Test insects used in this study were from a laboratory colony
maintained on the artificial diet of Cuilloud and Guiol (1980) since late 1992
(see Chapter 4). Mature larvae or pupae of the insect from the field site at
Macksville, NSW, with which the colony was originally established, were
introduced into the colony at least twice a year. Part of the colony was
sometimes reared on potted Red Cedar trees grown under glasshouse
conditions. These insects were pooled with the rest of the colony at the egg
or pupal stage.

126
5.2.2 Test temperatures and other conditions
Development of the test insects was studied at 5 constant
temperatures, 16.4, 19.5, 22.3, 26.2 and 28.7°C, with a daily variation ±1°.
Light period was set at 12L:l2D. Humidity was not strictly controlled.
However, relative humidity inside the rearing container was high, as fresh,
wet diet was maintained in the container.
5.2.3 Test procedure and data collection
Newly hatched larvae of ~12 h old were individually transferred with
a fine brush to plastic tubes (76 x 10 mm) containing 2 cylindrical cores (40 x
4 mm) of the artificial diet and capped with cotton wool. Experiments at
each temperature started with 60 larvae. Replacement of the diet was made
if the old diet was nearly completely consumed or considered no longer
fresh, as indicated by the dark brown colour. Development progress of
individual test insects was checked daily until moth emergence. The data
recorded were the dates of each moult of larvae, pupation, moth emergence,
and when the larvae were found dead. The cast skin and head capsules were
removed upon detection. An individual was considered to have advanced
to the next stage in the last 24 hours if new exuviae, pupa, or moth was
discovered on the day of checking. Larvae that were not seen were recorded
as 'NS'. If the NSs were recorded for three consecutive days, the
corresponding diet cores were dissected on the third day. Events noted on
that day, moulting or death, were assumed to have taken place during the
second day. Pupae were sexed according to Sharma and Singh (1980) after
the hardening of the pupal skin.
To compare the development rates between larvae reared on the
artificial diet and those reared on host tissues, a parallel experiment was
conducted at 25 °C. Sixty larvae each was tested with the artificial diet and
Red Cedar shoots. Fresh and tender shoots ( <5 mm in diameter) were cut
into sections of about 20 mm in length. One such shoot section was
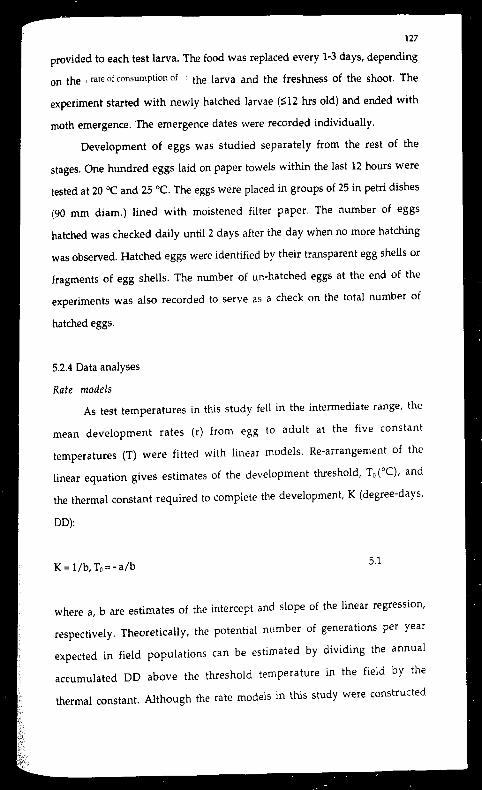
127
provided to each test larva. The food was replaced every 1-3 days, depending
on the ' rate of consumption of : the larva and the freshness of the shoot. The
experiment started with newly hatched larvae (Sl2 hrs old) and ended with
moth emergence. The emergence dates were recorded individually.
Development of eggs was studied separately from the rest of the
stages. One hundred eggs laid on paper towels within the last 12 hours were
tested at 20 °C and 25 °C. The eggs were placed in groups of 25 in petri dishes
(90 mm diam.) lined with moistened filter paper. The number of eggs
hatched was checked daily until 2 days after the day when no more hatching
was observed. Hatched eggs were identified by their transparent egg shells or
fragments of egg shells. The number of un-hatched eggs at the end of the
experiments was also recorded to serve as a check on the total number of
hatched eggs.
5.2.4 Data analyses
Rate models
As test temperatures in this study fell in the intermediate range, the
mean development rates (r) from egg to adult at the five constant
temperatures (T) were fitted with linear models. Re-arrangement of the
linear equation gives estimates of the development threshold, T0 (°C), and
the thermal constant required to complete the development, K (degree-days,
DD):
K = l/b, T0= -a/b 5.1
where a, b are estimates of the intercept and slope of the linear regression,
respectively. Theoretically, the potential number of generations per year
expected in field populations can be estimated by dividing the annual
accumulated DD above the threshold temperature in the field by the
thermal constant. Although the rate models in this study were constructed

128
with data from insects reared on artificial diet, a study by Couilloud and
Guiol (1980) indicated similar development rates of H. robusta reared with
this diet and those observed in field populations. Hence an attempt was
made to estimate the number of annual generations of the insect in the field
site in Macksville, NSW, where infestation levels of the insect had been
sampled systematically. As daily temperatures were not recorded all year
round in the field site, temperature data from a weather station in Urunga,
about 30 km north of Macksville, were used to calculate the annual
accumulated DD above the threshold temperature of T0. The data were
obtained from the Australian Weather Bureau and consisted of daily
maximum and minimum temperatures covering a period of 3 years from
1992 to 1994. In calculating the annual accumulated DD, hourly
temperatures were first estimated from the daily maxima and minima
assuming the sinusoidal temperature regime (Hudes and Shoemaker, 1988):
T .. =_!..{ [max(i)-min(i)]•sin( 2Jr j)+[max(i)+min(i)]}
I] 2 24 5.2
where Tii is the temperature at hour j at day i, and max(i) and min(i) are
maximum and minimum temperatures at day i, respectively. Based on T11.
the annual accumulated DD was calculated as follows:
365 24
C = I,~)r,i -T0 ) / 24 53
i=I j=I
subject to the restriction that
if Tii >35°C then T1i = 35°C
Distribution of development time
Relative frequencies of moth emergence were calculated daily to
construct the cumulative probability distribution of the post-egg
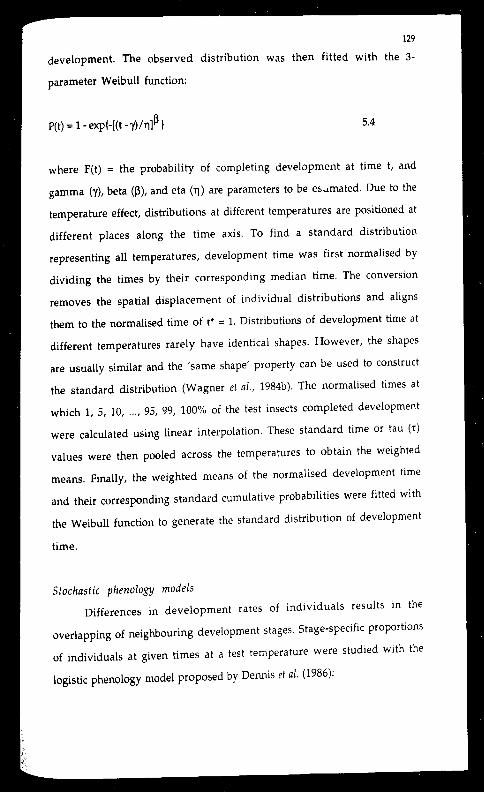
129
development. The observed distribution was then fitted with the 3-
parameter Weibull function:
P(t) = 1 - exp{-[(t -y)/Tll~) 5.4
where F(t) = the probability of completing development at time t, and
gamma (y), beta (~), and eta (Tl) are parameters to be eb..imated. Due to the
temperature effect, distributions at different temperatures are positioned at
different places along the time axis. To find a standard distribution
representing all temperatures, development time was first normalised by
dividing the times by their corresponding median time. The conversion
removes the spatial displacement of individual distributions and aligns
them to the normalised time of t• = 1. Distributions of development time at
different temperatures rarely have identical shapes. However, the shapes
are usually similar and the 'same shape' property can be used to construct
the standard distribution (Wagner et al., 1984b). The normalised times at
which 1, 5, 10, ... , 95, 99, 100% of the test insects completed development
were calculated using linear interpolation. These standard time or tau (i:)
values were then pooled across the temperatures to obtain the weighted
means. Finally, the weighted means of the normalised development time
and their corresponding standard cumulative probabilities were fitted with
the Weibull function to generate the standard distribution of development
time.
Stochastic phenology models
Differences in development rates of individuals results in the
overlapping of neighbouring development stages. Stage-specific proportions
of individuals at given times at a test temperature were studied with the
logistic phenology model proposed by Dennis et al. (1986):

130
5.5
where P;i = the proportion of insects in stage i at sampling time j (j = 1, 2, ... ,
q, q =number of sampling times), ti = DD accumulated at sampling time j, ai
= amount of DD needed to complete the ith stage (i=l, 2, ... , r-1, r = number
of development stages), and b2 = positive constant measuring the spread in
the distribution of development time. For completeness, a0 and a, are
assumed as -oo and oo, respectively. The model was originally designed for
progressive sampling data on stage-specific proportions (or numbers) of
field populations with all individuals in a pre-determined initial stage at
time t0
• Theoretically, it is equally applicable to data from constant
temperature experiments, although by doing so the original appeal of the
model is lost. The primary objective of using this model in this study was to
assess its appropriateness in describing the stochastic process of
development of H. robusta, rather than providing a practical phenology
model of the insect. Only data from the larval and pupal stages were used to
fit the model. Data from the egg stage were excluded as they were studied
separately from the rest of the developmental stages.
Larvae of H. robusta exhibit variable development patterns in terms
of number of instars, ranging from 4 instars (Beeson, 1919; Roberts, 1968) to
a maximum of 7 instars (Atuahene and Souto, 1983). Artificial rearing of the
insect by the author indicated a 5-7 instar range, with the majority passing
through 6 instars before pupation (see Chapter 3). Considering the limited
number of insects reared through at each temperature, only larvae showing
the 6-instar-pattern were used to fit the model. Adding the pupal and adult
stages, the total number of post-egg de\'elopment stages wa> 8 (r~ 8). The date> at
which experiments at each temperature started were set as day zero. The
amount of DD accumulated to the jth day was given by
~ = j.(T-To) 5.6

131
where T = test temperature, and T0 = threshold temperature above which
deveiopmenl occurs. To was estimated from the linear rate model. It should
be indicated that, when applying to sample data collected in the field, as the
model was originally designed for, ti should be calculated as the sum of (T
To) measured at short intervals (hourly or shorter) from day zero to the jth
day.
Statistical analyses
Parameters of the Weibull function and the logistic phenology
models were estimated using the 'nlin' (non-linear) procedure of SAS (SAS
Institute, 1982). All other statistical analyses were carried out in S-Plus
(Everitt, 1994), including the fitting of linear rate models and hypothesis
tests.
5.3 Results
5.3.l Development forms and sex ratios
At all temperatures, the number of larval instars varied between 5
and 7 instars. Proportions of larvae of the 6-instar-form were consistently
higher than those of the other two development forms, accounting for
about 55 - 89% of the test insects (Table 5.1). Except at the lowest
temperature, larvae of the 5-instar-form were commoner than the 7-instar
form. Significant tests were not performed on the differences, due to
insufficient numbers of test insects in either development form. Sex ratios
were not significantly different from 1:1 at all temperatures except 19.5°C (P>
0.05, X2 tests), where significantly more females emerged.
5.3.2 Duration of post-egg development
Duration of post-egg development decreased steadil;' as test
temperature increased (Table 5.2). Average duration of larvae and pupae
ranged from 28 days at 28.7°C to 81 days at 16.4°C. The effect of temperature
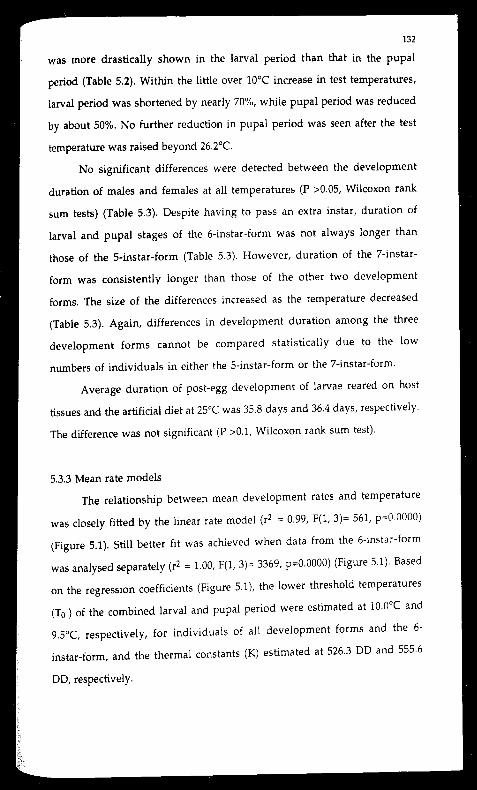
132
was more drastically shown in the larval period than that in the pupal
period (Table 5.2). Within the little over 10°C increase in test temperatures,
larval period was shortened by nearly 70%, while pupal period was reduced
by about 50%. No further reduction in pupal period was seen after the test
temperature was raised beyond 26.2°C.
No significant differences were detected between the development
duration of males and females at all temperatures (P >0.05, Wilcoxon rank
sum tests) (Table 5.3). Despite having to pass an extra instar, duration of
larval and pupal stages of the 6-instar-form was not always longer than
those of the 5-instar-form (Table 5.3). However, duration of the 7-instar
form was consistently longer than those of the other two development
forms. The size of the differences increased as the temperature decreased
(Table 5.3). Again, differences in development duration among the three
development forms cannot be compared statistically due to the low
numbers of individuals in either the 5-instar-form or the 7-instar-form.
Average duration of post-egg development of larvae reared on host
tissues and the artificial diet at 25°C was 35.8 days and 36.4 days, respectively.
The difference was not significant (P >0.1, Wilcoxon rank sum test).
5.3.3 Mean rate models
The relationship between mean development rates and temperature
was closely fitted by the linear rate model (r2 = 0.99, F(l, 3)= 561, p=O 0000)
(Figure 5.1). Still better fit was achieved when data from the 6-instar-form
was analysed separately (r2 = 1.00, F(l, 3)= 3369, p=0.0000) (Figure 5.1). Based
on the regression coefficients (Figure 5.1), the lower threshold temperatures
(To) of the combined larval and pupal period were estimated at 10.0°C and
9.5°C, respectively, for individuals of all development forms and the 6-
instar-form, and the thermal constants (K) estimated at 526.3 DD and 555.6
DD, respectively.

133
5.3.4 Number of generations per year
The thermal constants as estimated above show the amount of DD
required for the completion of post-egg development. Separate experiments
on the development of eggs at 20°C (n=58) and 25°C (n= 73) indicated an
average egg period of 7.2 and 5.5 days, respectively. Assuming the same
threshold temperature as that of the post-egg development (10°C), this gives
a weighted mean of 77.9 DD. The total number of DD for the period from
egg to adult was thus estimated as 603.2 DD and 633.5 DD for all
development forms and for the 6-instar-form, respectively. The annual
accumulated DD above the threshold temperatures in Urunga in the period
of 1992-1993 are shown in Table 5.4. Assuming similar development rates tor f(,/r
the laboratory colony and.Jield populations and continuous generations in
the field, H. robusta would be able to complete a maximum of 7-8
generations per year in the Urunga region during the three-year period.
5.3.5 Distribution of development times
Variable development rates among individuals were evident at all
temperatures (Table 5.2). Emergence of the first and last adults were
separated in time by at least 9 days. The gap became wider as temperature
decreased, reaching a maximum of 38 days at 16.4°C. The negative
association between the variations and temperatures was more clearly seen
in the cumulative probability distributions of development time (Figure 5.2,
A). The distributions were much more spread out at low temperatures than
at high temperatures. Differences in the development rates of individuals
caused some overlapping in the development times between neighbouring
temperatures. In other words, some individuals subjected to a certain
temperature were able to complete the development before all individuals
subjected to the next higher temperature had entered into the adult stage.
The degree of overlapping was high, with the exception of data from the
the lowest temperature tested.

134
Cumulative probability distributions of development times of the
combined larval and pupal period at all temperatures were well fitted by the
three-parameter Weibull function (Figure 5.2, A). Estimates of the
parameters and the overall r2 values at individual temperatures are given
in Table 5.5. Despite their seemingly difforent shapes, the cumulative
probability distributions at different temperatures aligned nicely after the
normalisation of development time (Figure 5.2, B). Data points from
different temperatures genl:!rally overlapped or fell within short distances of
one another, with no clear systematic deviations with regard to
temperature. Hence, a temperature-independent distribution can be used to
characterise the distributions of development times at all temperatures. The
weighted means of normalised development times when 1, 5, 10, ... , 95, 99,
100% of the test insects had completed development, or tau values, were
well fitted by the Weibull distribution (r2 = 0.99) (Figure 5.3), yielding the
standard distribution of development times for all temperatures.
Parameters of the distribution are given in Table 5.6.
5.3.6 Stage-specific development
Examination of the stage-specific development of the 6-instar-form
larvae (Table 5.6) indicated that most of the post-egg development time was
spent as the last instar larvae and pupae. Together two periods
accounted for 48% - 54% of the total development duration. Duration of the
last instar larvae was slightly shorter than that of pupae. Pre-last-instar
development of individual instars, i.e 1st-5th instar, appeared to take
similar lengths of time. As temperature increased, mean duration of these
~: ".":1 r.t (), decreased, reaching a minimum of 2.0-3.5 days, depending
on instar, at 28.7°C. Variable development rates were evident at all stages.
As a result, individuals of different stages were simultaneously present at

135
5.3.7 Logistic phenology models
Proportions of individual development stages of the 6-instar-form
larvae at given sampling times were closely fitted by the logistic phenology
model (Figures 5.4 - 5.8). Parameters of the models are shown in Table 5.7.
Parameter a; (i=l, ... , r-1) indicates the amount of development in DD
necessary for the insect to undergo the ith moult. According to the
estimated values, development from larval hatching to moth emergence
required 545-581 DD, which is in line with the thermal constant of 556 DD of
post-egg development estimated from linear models. Parameter b2
measures
the variability of the data and the resulting individual model. The larger the
value of b2, the wider the distribution will be at any given time. The values
of b2 in this study varied between 0.58 and 2.03, with no clear pattern in
relation to temperature. The resulting models well described the temporal
occurrence of each stage at each temperature, especially with respect to the
peak occurrences. Depending on the test temperature, peak occurrences in
degree-days (above 9.5 °C} of the 2nd- to 6th-instar and pupa stage took place
at 76-101 DD, 127-155 DD, 174-202 DD, 230-253 DD, 322-349 DD, and 470-493
DD, respectively. Timing of the peak occurrence of the lst-instar could not
be estimated as all experiments began with newly hatched larvae, instead of
with eggs. The estimated ranges of DD for the peak occurrences of
individual stages at different temperatures were quite small, with a
maximum of 28 DD, transforming to a real time range of less than one day
at 25 °C. This is remarkable, considering the often unavoidable variations in
test conditions other than temperature in different experiments. It
highlights the strict thermal requirement of the development process of the
insect. Visual examination of the figures indicated some deviations of the
estimated starting and ending times from the corresponding actual times.
Starting times were generally underestimated and ending times generally
overestimated. However, the differences were mostly within the range of 40
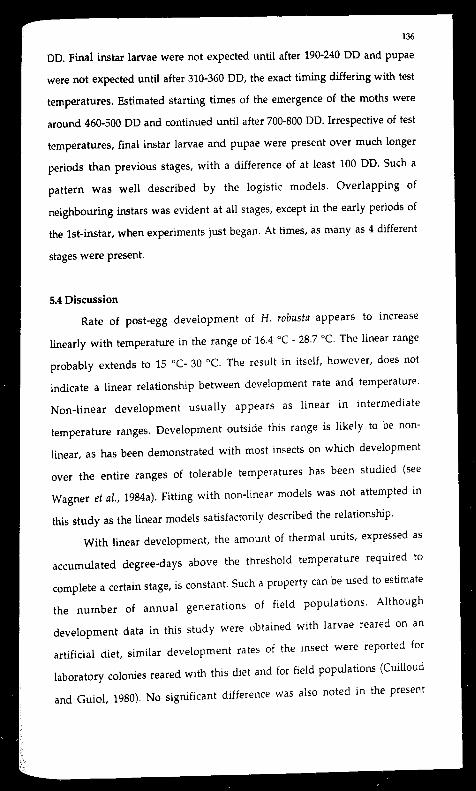
136
DD. Final instar larvae were not expected until after 190-240 DD and pupae
were not expected until after 310-360 DD, the exact timing differing with test
temperatures. Estimated starting times of the emergence of the moths were
around 460-500 DD and continued until after 700-800 DD. Irrespective of test
temperatures, final instar larvae and pupae were present over much longer
periods than previous stages, with a difference of at least 100 DD. Such a
pattern was well described by the logistic models. Overlapping of
neighbouring instars was evident at all stages, except in the early periods of
the lst-instar, when experiments just began. At times, as many as 4 different
stages were present.
5.4 Discussion
Rate of post-egg development of H. robusta appears to increase
linearly with temperature in the range of 16.4 °C - 28.7 °C. The linear range
probably extends to 15 °C- 30 °C. The result in itself, however, does not
indicate a linear relationship between development rate and temperature.
Non-linear development usually appears as linear in intermediate
temperature ranges. Development outside this range is likely to be non
linear, as has been demonstrated with most insects on which development
over the entire ranges of tolerable temperatures has been studied (see
Wagner et al., 1984a). Fitting with non-linear models was not attempted in
this study as the linear models satisfactorily described the relationship.
With linear development, the amount of thermal units, expressed as
accumulated degree-days above the threshold temperature required to
complete a certain stage, is constant. Such a property can be used to estimate
the number of annual generations of field populations. Although
development data in this study were obtained with larvae reared on an
artificial diet, similar development rates of the insect were reported for
laboratory colonies reared with this diet and for field populations (Cuilloud
and Guiol, 1980). No significant difference was also noted in the present
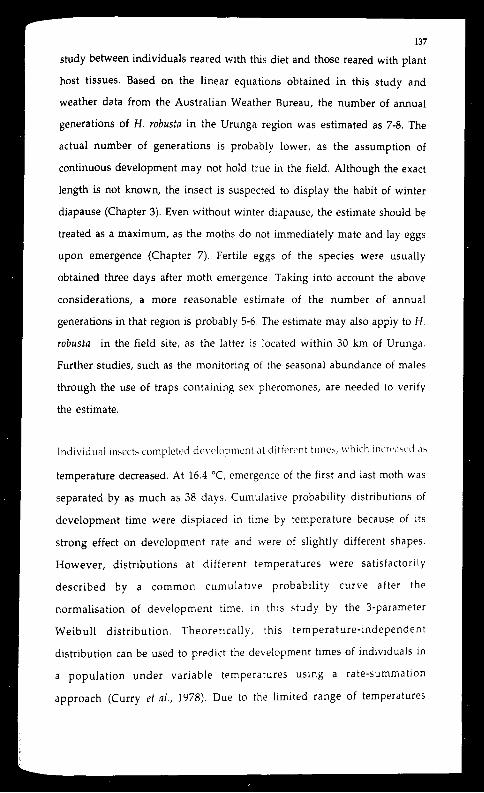
137
study between individuals reared with this diet and those reared with plant
host tissues. Based on the linear equations obtained in this study and
weather data from the Australian Weather Bureau, the number of annual
generations of H. robusta in the Urunga region was estimated as 7-8. The
actual number of generations is probably lower, as the assumption of
continuous development may not hold true in the field. Although the exact
length is not known, the insect is suspected to display the habit of winter
diapause (Chapter 3). Even without winter diapause, the estimate should be
treated as a maximum, as the moths do not immediately mate and lay eggs
upon emergence (Chapter 7). Fertile eggs of the species were usually
obtained three days after moth emergence. Taking into account the above
considerations, a more reasonable estimate of the number of annual
generations in that region is probably 5-6. The estimate may also apply to H.
robusta in the field site, as the latter is located within 30 km of Urunga.
Further studies, such as the monitoring of the seasonal abundance of males
through the use of traps containing sex pheromones, are needed to verify
the estimate.
lndi\'idual insL'cts rnmpleted de\'l'lupment at different time;,, which innl'.J,,c•d ,1,,
temperature decreased. At 16.4 °C, emergence of the first and last moth was
separated by as much as 38 days. Cumulative probability distributions of
development time were displaced in time by temperature because of its
strong effect on development rate and were of slightly different shapes.
However, distributions at different temperatures were satisfactorily
described by a common cumulative probability curve after the
normalisation of development time, in this study by the 3-parameter
Weibull distribution. Theoretically, this temperature-independent
distribution can be used to predict the development times of individuals in
a population under variable temperatures using a rate-summation
approach (Curry et al., 1978). Due to the limited range of temperatures

138
studied, the temperature-independent distribution obtained in this study
may not fully represent the development under field conditions. However,
the results indicate that the cumulative probability distributions of H.
robusta at different temperatures share a certain degree of similarity in
shape and can be standardised by appropriate normalisation procedures.
Differences in the development rates of individuals invariably result
in the overlapping of development stages of an initially homogeneous
insect population after some time. In this study overlapping involved as
many as 4 consecutive stages. The degree of overlapping decreased
somewhat late in the life cycles, when only two neighbouring stages were
simultaneously present, eg. pupa and moth. Proportions of individual
stages were well described by the logistic phenology models. The models
performed particularly well in estimating the timing of the peak
occurrences of individual developmental stages, irrespective of the test
temperatures. Pupae and the last instar larvae were present over much
longer periods than previous stages, apparently due to the longer duration
of the two stages. Such a pattern was also well described by the models.
The logistic phenology model was initially designed to deal with
stage-specific frequency (or relative frequency) data of field populations
sampled at discrete intervals. No prior knowledge of the insect's
development at constant temperatures is needed. The model was tested
here with constant temperature data to determine its general applicability in
describing the development process of H. robusta populations. It is not
intended as a practical phenology model of the insect. However, the
stochastic characteristics as disclosed by the models may serve as a useful
guide in understanding the development process of the insect in field
conditions. Assuming similar development patterns of the insect under
constant and variable temperature conditions, parameters of the model
estimated through constant temperature data should be at least as accurate
and stable as those estimated through sample data, since in the latter case

139
the data itself are often subject to samplinj <errors. Admittedly, the
assumption may not be met and direct studie.'. of the development of the
insect in the field gf~;riable temperature conditions are needed before the
establishment of practical phenology models.

140
Table 5.1 Percentages of individuals of different sex and development forms.
Only those that survived to the moth stage were counted.
16.4°C 19.5°C 22.3°C 26.2°C 28.7°C
(n=35) (n=27) (n=33) (n=55) (n=38)
males 45.7 33.3 51.5 50.9 50.0
females 54.3 66.7 48.5 49.1 50.0
5-instar-form 2.9 14.8 24.3 21.8 36.8
6-instar-form 88.6 81.5 63.6 69.1 55.3
7-instar-form 8.5 3.7 12.1 9.1 7.9

Table 5.2. Duration of post-egg development of H. robusta at 5 constant
temperatures (days, mean± SD (range)).
Larvae Pupae Larvae+ Pupae
16.4°C (n=35) 60.6±7.6 (52-89) 19.8±2.1 (14-26) 80.7±9.0 (71-Hl9)
195°C (n=27) 41.3±5.2 (34-56) 16.4±3.2 (10-20) 57.7±5.8 (49-72)
223°C (n=33) 32.6±4.5 (26-38) 12.1±1.1 (11-16) 44.7±4.7 (37-55)
26.2°C (n=55) 25.1±2.6 (21-35) 8.8±0.7 (7-10) 33.9±2.7 (30-44)
28.7°C (n=38) 18.9±2.0 (16-24) 9.1±0.5 (8-10) 28.0±2.1 (25-34)
141

142
Table 5.3 Duration of post-egg development of different sex and
development forms (mean± SD /(range)) at 5 constant temperatures
16.4°C 19.5°C 22.3°C 26.2°C 28.7°C
males 79.7±9.4 62.5±5.7 46.2±4.9 34.9±2.0 28.7±2.0 (72-108) (54-73) (39-55) (31-39) (26-30)
females 81.6±8.9 57.7±4.9 43.2±4.0 35.0±3.3 29.3±2.2 (71-109) (51-67) (37-50) (31-44) (26-30)
5-instar-lorm 74.0±NA• 61.0±5.4 42.3±3.5 33.3±2.5 26.6±2.2
(74-74) (53-64) (37-48) (30-37) (25-32)
6-instar-lorm 78.6±5.0 57.9±6.1 44.1±3.6 33.5±2.0 28.7±1.6 (71-90) (50-72) (38-51) (30-39) (27-34)
7-instar-lorm 101.7±11.8 66±NA 53.0±2.2 38.8±3.4 29.0±1.7
(88-109) (66-66) (50-55) (35-44) (28-31)
•NA: Standard deviations can not be calculated due to unit sample size

143
Table 5.4. Maximum number of annual generations of H. robusta in regions
around Macksville, NSW, estimated from developmental data conducted at
constant temperatures, assuming linear relationships between development
rate and temperature and continuous generations. Annual accumulated
degree days above the threshold temperatures (DD (To)) were calculated
from data taken at a weather station in Urunga, NSW, with the maximum
development temperature arbitrarily taken as 35°C.
6-instar-form all development forms
DD(To) generations DD(To) generations
1992 4605 7.3 4423 7.3
1993 4800 7.6 4617 7.7
1994 4622 7.3 4440 7.4

144
Table 5.5 Parameters of the Weibull function estimated from the
cumulative distributions of the development of post-egg development of
Hypsipyla robusta reared on artificial diet at five constant temperatures and
the pooled distributions under normalised time scale (=time/median time).
Data from larvae of all development forms (5-, 6-, and 7-instar forms) were
combined.
16.4°C 19.5°C 22.3°C 26.2°C 28.7°C pooled
a 71.58 46.21 36.07 28.32 22.94 0.88
~ 8.27 12.24 9.23 5.67 5.06 0.16
y 1.09 1.91 1.81 2.31 2.47 1.61
R2 0.99 0.99 1.00 0.99 0.99 0.99

145
Table 5.6 Duration of individual development stages of the 6-instar-form
larvae and pupae of H. robusta at 5 constant temperatures (days) (mean ±SD
/(range)).
1st 2n:I 3rd 4th 5th 6th p
16.4°C 8.6±1.8 6.4±1.3 9.0±2.2 8.0±1.7 8.8±1.4 18.2±2.8 19.5±1.8
(n=31) (5-13) (4-9) (7-14) (5-12) (6-12) (14-29) (14-23)
19.5°C 4.9±1.8 5.5±2.3 5.0±1.2 4.7±1.0 6.2±1.3 14.7±2.7 16.9±1.7
(n=22) (3-8) (2-11) (3-8) (3-7) (5-10) (11-20) (12-20)
22.3°C 4.1±1.0 4.6±0.8 4.2±1.4 3.8±1.1 4.5±1.1 10.2±2.2 12.7±1.0
(n=21) (2-6) (2-6) (2-7) (2-6) (2-6) (7-15) (11-15)
26.2°C 3.9±0.7 3.5±0.6 2.9±1.0 2.9±0.9 3.1±0.5 8.4±1.3 8.8±0.6
(n=38) (3-6) (2-4) (2-6) (2-6) (2-4) (6-12) (8-10)
28.7°C 3.5±0.5 2.0±0.6 2.2±0.4 2.5±0.7 3.0±0.5 6.2±1.3 9.2±0.4
(n=21) (3-4) (1-3) (2-3) (2-4) (2-4) (4-9) (9-10)
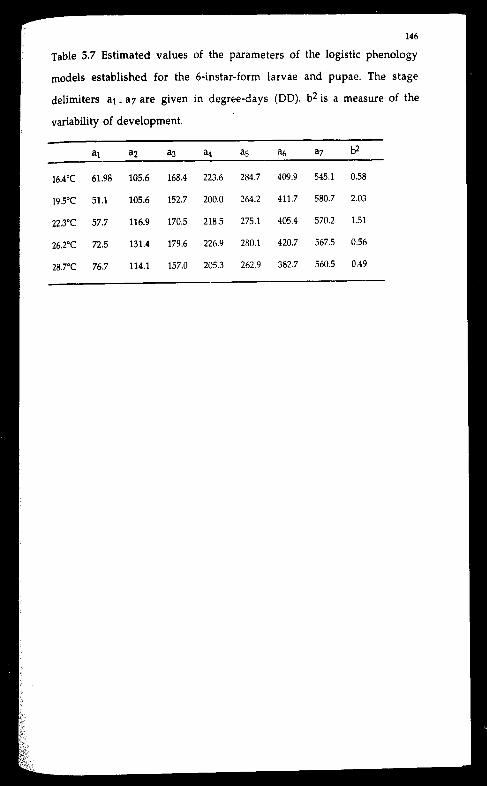
146
Table 5.7 Estimated values of the parameters of the logistic phenology
models established for the 6-instar-form larvae and pupae. The stage
delimiters a1 _ a7 are given in degree-days (DD). b2 is a measure of the
variability of development.
a1 a2 a3 a4 as <16 a7 b2
!6.4'C 61.98 105.6 168.4 223.6 284.7 409.9 545.1 0.58
19.5'C 51.1 105.6 152.7 200.0 264.2 411.7 580.7 2.03
22.3'C 57.7 116.9 170.5 218.5 275.l 405.4 570.2 1.51
26.2'C 72.5 131.4 179.6 226.9 280.1 420.7 567.5 0.56
28.7°C 76.7 114.1 157.0 205.3 262.9 382.7 560.5 0.49

147
0.04 > .. ~ 0.035 6-instar-form / s !
0.03
c: 0.025 .. E Q,
~ 0.02
~ r = -0.0171 + 0.0007 T 'C c 0.015 .. .. ::i
0.01 ~
1 6 18 20 22 24 26 28 30
Temperature (T) (oC)
0.04 >
•1 ""'°Pm"' lo~ ., ?, 0.035
-.. 0.03 '§ c: 0.025 <D E Q, 0 0.02 'i > .. r = -0.0189 + 0.0019 T 'O
c 0.015 .. .. ::i
0.01
16 1 8 20 22 24 26 28 30
Temperature (T) (oC)
Figure 5.1. Mean development rates of H. robusta of the 6-instar-form and
all development forms for the combined larval and pupal period at five
constant temperatures.
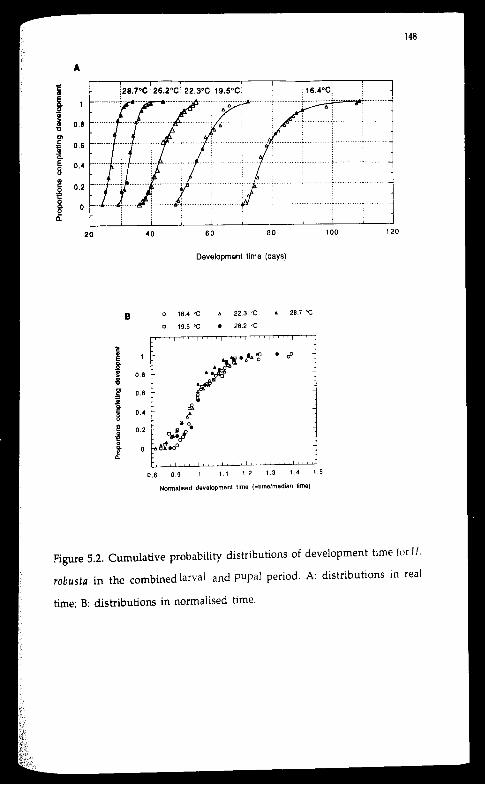
A
" i .. i O.B .., "' c i ii e 0.4 8 " c 0.2 ~ ~ 0..
20
f28.7°C i26.2°Ci 22.3'C' 19.S'C'
40
B
c $ E j ~ 0.8 .!J
I 0.6
~ 0.4 8 ~ .2
0.2
" ~ Q.
0.8
60 80
Development time (days)
16.4 °C
19.s •c
22.3 ·c
2s.2 ·c
;-1····'fi .. ·~· a
di. .. • 0
o..!j" e~.<P
0.9 1.1 1.2
•
1 3
20.1 ·c
<f'
1.4
Normalised development time (=lime/median time)
148
100 120
1.5
Figure 5.2. Cumulative probability distributions of development time for H.
robusta in the combined larval and pupal period. A: distributions in real
time; B: distributions in normalised time.

149
t. weighted mean -- estimated
"' c: 0.8 0 t 0 c. 0.6 0 ii ~ 0.4 .. .,, c: s 0.2 en
0
0.8 0.9 1.1 1.2 1.3 1.4 1.5
Normalised development time (=time/median time)
Figure 5.3 Weibull function fitted to the weighted means of normalised
development times when 1, 5, 10, ... , 95, 99, and 100% individuals completed
development (tau values).
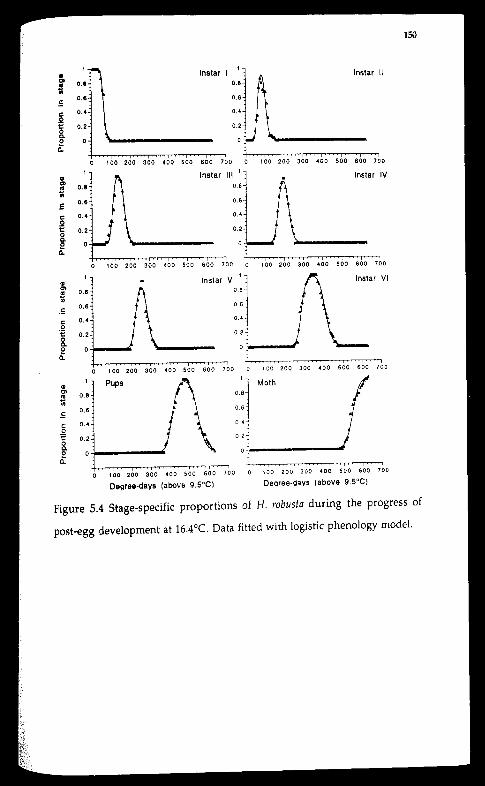
150
• lnstar lnstar II
"' 0.1 .. 0.8
'ii .E
o.• 0.6
c 0.4 0.4
.2 "' 0.2 0.2 0 Cl. e Q.
Figure 5.4 Stage-specific proportions of H. robusta during the progress of
post-egg development at 16.4°C. Data fitted with logistic phenology model.

.. "' 0.1 .. di
.E 0.6
c 0.4
.2 1:: 0.2 0 a. e 0.
0.8
0.6
c: 0.4 .2 '§ 0.2 a. e 0.
.. "' ~ o.o
.5 0.6
c .2
0.4
1:: 0.2 0 0. e 0.
.. "' .. 0.8 di .5 0.6
c 0.4 .2 1:: 0.2 0 a. e 0.
lnstar I 1
lnstar II O.B
0.6
0.4
O.?.
o 100 200 300 400 soo soo 100 eoo o 100 200 300 400 soo soc 100 abo lnstar Ill
O.B
0.6
0.4
0.2
100 200 300 ·400 500 600 700 800
lnstar V 0.8
0.6
0.4
0.2
100 200 300 400 500 600 700 800
Pupa OB
0.6
0.4
0 2
+.-~~.-~~~~~~~·•T'""""'T'""'_,.,.,
100 200 300 400 500 600 700 800
Oeqree-davs (above 9.5°Cl
lnstar IV
..
\ 00 200 300 400 500 600 700 800
lnstar VI
, 00 200 300 400 500 600 700 800
Moth
100 200 300 400 500 600 700 800
Oeqree-days (above 9.5°C)
151
Figure 5.5. Stage-specific proportions of H. robusta during the progress of
post-egg development at 19.5°C. Data fitted with logistic phenology model.

• .. O.B " 'ii
.E 0.6
c 0.4
~ 0.2 0 a. e a.
.. "' o.o .. 'ii .5
0.6
c 0.4 0 'E 0.2 0 a. 0 Q.
.. "' 0.8 .. ;; .5
0.6
c 0.4 0 'E 0.2 0 a. e a.
.. CJ> .. 0.8 ;; .5
0.6
c 0.4 0 'E 0.2 0 a. e a.
lnstar
100 200 300 400 500 600 700
lnstar Ill 0.8
100 200 300 400 500 600 700
lnstar v '1
o.a
J\_ 0.6
0.4
0 2
100 200 300 400 500 600 700
Pupa o a
0.6
0 4
0.2
100 200 300 400 500 600 700
Oeqree-davs (above 9.5°C)
lnstar II
100 200 300 400 500 600 700
lnstar IV
\ 00 200 300 400 500 600 700
100 200 300 400 500 600 700
Moth
, 00 200 300 400 500 600 700
Oeqree-days (above 9.5°C)
152
Figure 5.6 Stage-specific proportions of H. robusta during the progress of
post-egg development at 22.3°C. Data fitted with logistic phenology model.

, • "' .. o.• ;; .5
0.6
c 0.4 . 2 t: 0
0.2 Q,
e Q,
.. "' .. 0.8 ;; .5
0.6
c 0.4 .2 t: 0.2 0 Q,
e Q,
.. "' ! 0.8
"' .5
0.6
c 0.4 .Q t: 0.2 0 Q,
e 0..
.. "' .. 0.8 ;; .5 0.6
c 0.4 .Q t: 0.2 0 Q,
e 0..
\ ,
lnstar I lnstar II 0.8
0.6
0.4
l .... 0.2
• ±Zl£&£&1£•6loM66&616l&&
100 200 300 400 500 600 700 0 100 200 300 400 500 600 700
lnstar
"~:i lnstar IV
0.6
0.4
''.!::::0:::: 100 200 300 400 500 600 700 0 \00 200 300 400 500 600 700
In star v 'l
J\_ ........... -. 0.8 i 0 '] 0.4 -I
1 0 21
01 I I I I I I
100 200 300 400 500 600 700 100 200 300 400 500 600 700
'l Moth J 0 Bl • 0 •j
::~ 0 ~••••• .. o11aaaaa&aou&M:i
Pup&
100 200 300 400 500 600 700
Deqree-davs (above 9.5°C)
I 100 200 300 400 500 600 700
Oeqree-davs (above 9.5°C)
153
Figure 5.7. Stage-specific proportions of H. robusta during the progress of
development at 26.2°C. Data fitted with logistic phenology model.
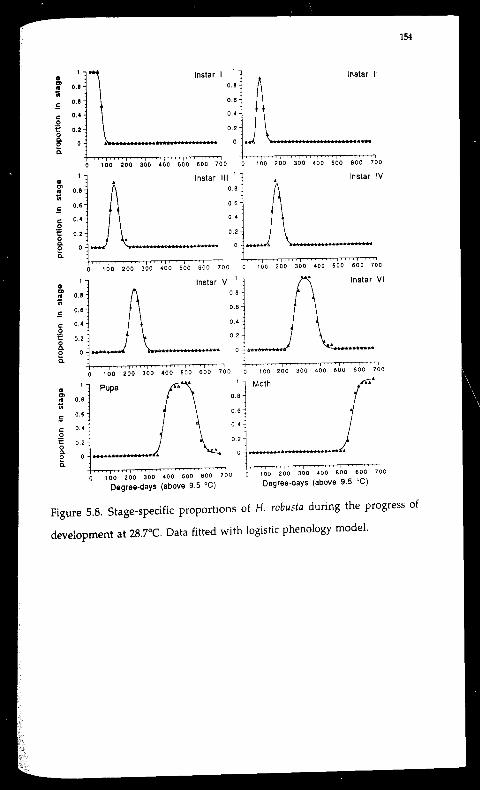
.. "' o.• ~ .: o.• c 0.4
.2 t: 0.2 0 a. e a.
.. "' 0.8 .. 'iii .5
0.6
c 0.4 0 t: 0.2 0 a. e a.
.. "' 0.8 .. 'iii .5
0.6
c 0.4 0 t: 0.2 0 a. e a.
.. "' .. 0.8 'iii .5
0.6
c 0.4 0 t: 0.2 0 a. e a.
lnstar I lnstar II 0.8
0.6
0.4
0.2
100 200 300 400 500 600 700 ~
\00 200 300 400 500 600 700
lnstar Ill 1 i ,
~~!Jl-1 I I 600 700 100 200 300 400 500 600 700 1 oo 200 300 ·mo soo
lnstar IV
lnstar V lnstar VI
0.8
0.6
0.4
0.2
oj-I ii~
100 200 300 400 500 600 700 0 1 00 200 300 400 500 600 700
Pupa 1 j Moth
081
::1 0:1--..----..-..<'.
100 200 300 400 500 600 700
Degree-days (above 9.5 °C)
100 200 300 400 500 600 700
Degree-days (above 9.5 'C)
154
Figure 5.8. Stage-specific proportions of H. robusta during the progress of
development at 28.7°C. Data fitted with logistic phenology model.

155
Chapter 6
Feeding Behaviour of Larvae of Hypsipyla robusta Moore
6.1 Introduction
Feeding involves a consecutive sequence of behavioural components
that are triggered and regulated by specific stimuli operating through neural
pathways (Hsiao, 1985). For insects with chewing mouthparts, the sequence
can be characterised by four steps: biting, ingestion (swallowing),
continuation of feeding, and cessation of feeding (Dethier, 1966). The
initiation and continuation of feeding require some form of positive
stimuli, while the existence of negative stimuli terminate the normal
feeding process (Bernays, 1985). Chemicals play a major role in regulating
the feeding behaviour of insects (Bernays, 1985; Hsiao, 1985). Those that
initiate or inhibit feeding are termed feeding stimulants (phagostimulants)
and feeding deterrents, respectively. Some authors advocate the use of the
terms feeding incitants and gustatory stimuli to refer separately to chemicals
that evoke the biting responses and those that stimulate the ingestion
phase, respectively (Beck, 1965). However, separation of the two feeding
phases is often difficult in practice (Chapman, 1974; Schoonhoven, 1982).
Phagostimulants may appear as primary (nutrients) and/or secondary plant
metabolites (Thorsteinson, 1960). Often secondary plant metabolites are used
by monophagous and oligophagous insects in selecting their food plants (see
Fraenkel, 1959, 1969; Hedin et al., 1974). These chemicals are neither utilised
nor required by the plant but the presence or absence of them determines
whether or not it will be fed upon by the insect and, for this reason, they are
sometimes called token stimuli or sign stimuli (Hsiao, 1985). For most
phytophagous insects, however, multiple chemicals, either of primary or
secondary plant metabolites, are believed to be involved in the selection
process (Hsiao, 1985). Even in cases where dominant substances are known,

156
they alone do not account for host discrimination even for specialised feeders
(see Miller and Strickler, 1984). Some chemicals may not elicit feeding by
themselves but produce synergistic effects when combined with
phagostimulants (Hsiao, 1985). In addition to external stimuli (positive or
negative), the process of feeding is also influenced by the internal excitatory
or inhibitory status of the insect. A marginally acceptable plant may be
accepted if the insect is in a state of hunger (high internal excitatory input
and low internal inhibitory input); the same plant may be rejected if
internal inhibitory input outweighs the internal excitatory input (Dethier,
1982).
Effects of plant chemicals on the feeding process of insects are studied
with various types of bioassays. A treatise on bioassay designs is provided by
Lewis and van Emden (1986). Important aspects in the design of the
bioassays are selection of feeding substrates, application of the chemicals or
plant extracts, conditions of the test, and measurement and observation of
the feeding responses. Bioassays on phagostimulants are usually carried out
on artificial substrates, such as elder pith, filter paper, styropor, and agar
cellulose medium. The chemicals are applied and tested at a wide range of
concentrations to search for response threshold and peak. Apart from the
physical environment, such as light, temperature and humidity, the
conditions of the test insects, such as age, sex and hunger status, should also
be carefully controlled to bring about clear and consistent feeding patterns.
For chewing insects, the responses of feeding can be measured directly by
area or weight loss of the substrates or indirectly by the amount of faecal
production or weight gain of the test insects. The adequacy of these
measurements in quantifying insect feeding responses to test chemicals
depends on a number of factors, e.g. the distribution of the chemicals in the
substrates and the emptiness of the gut before the test. Sometimes the effects
of chemicals can be detected by direct observation of the feeding process.
This method, although time consuming, is considered as much more

157
revealing than a simple measurement of the total substrates ingested. Two
approaches are used in searching for phagostimulants. One is to screen
potential chemicals (primary or secondary plant metabolites) known to
occur in the plant. The other approach starts with the crude extracts of host
materials. The extracts are then fractionated and each fraction is assayed
behaviourally for activity. Since the number of potential chemicals is large,
the second approach is more practical (Hanson, 1983).
Four aspects of larval feeding behaviour are reported and discussed in
this chapter. (a) Feeding on inert substrates treated with the ethanol extracts
of host tissues. It has been shown in Chapter 4 that the incorporation of
ethanol extracts of host-plan tissue enhanced larval feeding on the artificial
diet. To further confirm the existence of phagostimulants in the extracts, the
latter were tested using filter paper and agar-cellulose medium as feeding
substrates. These substrates have the advantage of being chemically inert
and thus avoid possible synergistic effects between the chemicals tested and
chemicals present in the substrates. Chemicals present in the artificial
substrates have been shown to interact with test chemicals in feeding
bioassays (Reese, 1979). (b) The role of host odour in eliciting the biting
response. The involvement of plant volatiles in host-plant finding has been
well established (see Ramaswamy, 1988; Renwick and Chew, 1994). In some
insects, odour also influences feeding behaviour, such as the elicitation of
biting response (see Miller and Strickler, 1984). It is of interest to see whether
host odour is involved in the feeding process of H. robusta. Insect response
to olfactory stimuli is difficult to isolate from gustatory stimuli during the
ingestion phase of feeding in bioassays, as some gustatory receptors of
insects can also be stimulated by volatile chemicals (Hsiao, 1985). However,
the effect of odour in the initiation of biting can be detected by measuring
the relative biting frequencies of test insects in the presence or absence of
odour prior to their contacting with the food. Results of this study will help
us understand the mechanisms of the larval feeding process. (c) Suitability
158
of non-host species as larval food. Although no alternative hosts have been
reported for H. robusta in Australia, the species was able to complete its life
cycle on the introduced C. odorata in Africa (Roberts, 1966), suggesting the
possible suitability of other Meliaceae species as larval food. There may be
some other plant species that are acceptable to the larvae when provided
artificially although they may be unsuitable for larval development or even
be toxic to the larvae. Knowledge of the range of acceptable plants is helpful
in understanding the chemical and physical requirement of feeding of the
insect. Host range of Hypsipyla spp. is reported to be confined to the
subfamily Swietenoideae (Grijpma, 1976). The specialisation may be linked
to some common chemicals present in all the species in this subfamily. d)
Within-tree distribution of feeding sites. Despite being termed a shoot borer,
larvae of H. robusta have been reported to feed on various tissues of its host
plants in addition to the growing sh00ts, such as flowers, fruits (Beeson,
1919) and bark (Roberts, 1968). Even the leaves were sometirr"'' fee' upon
(Beeson, 1919). The diverse range of feeding sites prompted the sugge~ ·ion
for the existence of distinct regional species or subspecies (Roberts, 1968).
While the possibility of the existence of regional subspecies cannot be
rejected, the observed different feeding habits can be explained by some
biological and environmental factors. As pointed out by Beeson (1919), fruit
and flower generations of H. robusta occur at the time when the growing
shoots are not widely available. Grijpma (1971) indicated that H. grandella
would feed on the bark when the shoots had been fully utilised. Variation
in feeding sites also differs with larval age. Young larvae tend to feed in
buds and leaf petioles and extensive shoot feeding only takes place at later
developmental stages (Beeson, 1919). Study of the within-tree distribution of
feeding sites is important for the formulation of better sampling and control
strategies.
6.2 Methods
6.2.1 Feeding on inert materials
Agar-cellulose medium
159
Agar··cellulose medium (4% of each constituent) was prepared
according to Hsiao and Fraenkel (1968). The ethanol extract of young shoots
was tested at 2.5, 5 and 10 g fresh weight equivalent (FWE) in 50 g of agar
cel!ulose medium. The extract was pipetted to the cellulose portion of the
medium, which, after evaporation of the solvent, was combined with the
agar solution. Control medium was made in the same way as treatment
medium but incorporated with only pure ethanol. Control and treatment
media were cast in glass bottles to a depth of ca. 0.5 cm. Cylinder cores of the
test media (1 cm diameter) were cut out with cork borer. The effect of the
ethanol extract in feeding was tested in binary-choice and non-choice
experiment~. In the binary-choice experiment, two treatment cores and 2
control cores were alternately arranged in the periphery of the petri dish
floor with equal distances between neighbouring cores. One 6th-intar larva
(non-blue stage) was introduced into the petri dish. Two tests of 20 replicates
each were run in this experiment. The tests were conducted in darkness at
25 ± 2°C. The test cores were checked 24 h later and recorded as either
chewed or nearly completely chewed. The non-choice test was conducted in
a similar way except that only one cylinder core, control or treatment, was
placed in the centre of the petri dish (90 mm diam.) floor and the test larvae
were starved for 24 hours before being placed into the petri dishes Apart
from scoring the chewing intensities on the test cores as outlined above, the
number of faecal pellets produced by each larva was recorded. Ten control
and 10 treatment cores were tested for each extract concentration.
Filter paper
Filter paper disks (80 mm diam.) were dipped in either ethanol extract
(treatment) or pure ethanol (control). After evaporation of the solvent, they
160
were tightly rolled to cylindrical shapes to resemble the shoot stems. The
ethanol extract was tested at 3 concentrations: 0.05, 0.5, and 5 g FWE/ml, in
4-choice tests, with the control as the 4th choice. Four filter paper rolls, each
with a particular extract concentration, were inserted through four evenly
spaced holes (10 mm diam.) bored in the periphery of the cap of a plastic jar
(50 x 40 mm), with the lower ends of the rolls touching the vial floor. One
5th- or 6th- instar larva (non-blue stage) was introduced into each vial.
Three tests, each with 15 replicates, were performed in darkness at 25 ± 2°C.
Each test was run for 12 h. Evidence of feeding was recognised by the
presence of chewing holes or roughened surface (surface chewing) in the
filter paper. The same bioassay technique was used to test the relative
strength of the feeding stimulant effect of the ethanol extract of young shoot
stems, young leaves and young shoot stems plus young leaves, all tested at
the concentration of 0.5 g FWE/ml. Two tests, each consisting of 20
replicates, were performed.
6.2.2 Host odour and initiation of feeding
Cuttings of freshly-collected young leaves or young shoot stems of
approximately equal sizes were placed inside 1 cm sections of opaque
drinking straws (4 mm diameter, red or blue, but the colour was fixed
within individual experiments) and then blocked in the two ends with
cotton wool. For controls, the straws were left empty but similarly blocked
with cotton wool. Treatment and control straws were individually placed
inside gelatine capsules (0.95 ml, transparent). Twelve small and evenly
distributed holes of were punched in the top and bottom quarters of each of
the capsules with entomological pins (0.6 mm diam.). These loaded gelatine
capsules were then placed vertically in the bottom halves of petri dishes (90
mm diam.) by inserting them through pre-punched holes of slightly smaller
diameter in the covering paper. The bottoms of the capsules touched the
petri dish floor. About three-quarters of the length of the capsule were
161
inside the petri dish. Four gelatin capsules (two treatments and two
controls) were alternately placed in each petri dish. The set-up of the test
unit is shown in Figure 6.1. One 4th-6th instar larva was introduced into
each petri dish and each test consisted of 15 replicate petri dishes. The
experiment was run for 18 h in darkness at 25 ± 2°C. Feeding was considered
to have been attempted if the gelatin capsules bore chewing holes. Five such
tests were performed. To check for the uniqueness of the plant volatiles that
could elicit the biting response, a similar test of 15 replicates was performed
on the young leaves of the White Cedar, Melia azadirachta var. australasica
(A. Juss.) C. DC.
6.2.3 Feeding on non-host species
Three non-host Meliaceae species, Spanish Cedar (Cedrela odorata),
Chinese Toon (Toona sinensis) and White Cedar (Melia azadirachta var.
australasica) and one non-Meliaceae species, Southern Blue Gum
(Eucalyptus glob11lus ssp. bicostata}, were tested for feeding by H. robusta.
The Meliaceae plants were grown in pots in the glasshouse. The Southern
Blue Gum grew mature trees outside the glasshouse. Acceptance of the
three Meliaceae species by the larvae was first tested by individually placing
4-6th instar larvae onto five plants of each species on two separate occasions
and observing their activity for one hour. A plant was considered to have
been accepted if the larva completely burrowed into the shoot and did not
come out before the end of the observation period. Infested shoots were
dissected three days later to check for the feeding progress and the status of
the larvae (live or dead, present or gone). The relative acceptance of the four
test species as compared with the Red Cedar was assessed in binary-choice
tests in plastic jars (50 x 40 mm). Two opposite holes (5 mm diam.) were
drilled through the caps of the bottles. Fresh young shoots of the test plants
of slightly smaller diameter than these holes, one from the Red Cedar and
the other from one of the four non-host species, were inserted through the

162
holes until the lower ends touched the floor of the bottles. The upper ends
of the shoots were ca. 0.5 cm above the caps. One 5-6th instar larvae was
introduced into each bottle and allowed to feed for 24 hours in darkness, at
the end of which time the presence or absence of feeding tunnels and the
relative area of epidermis removed were checked. Each plant species pair
was tested with 20 larvae. As the leaves are readily fed upon by the larvae in
the laboratory (personal observation), another binary-choice experiment was
presented in petri dishes (85 mm diam.) using leaf discs as feeding material.
Four holes (10 mm diam.) were punched in the periphery of a filter paper
(Whatrnan No. 1, 80 mm diam.), which, after being moistened with distilled
water, was placed on the floor of the petri dish. Leaf disks of the same
diameter as the filter paper holes were punched from freshly picked young
leaves of the test species. Four such disks, two from the Red Cedar and two
from one of the non-host species were placed individually into the four
holes with leaf disks of the same species opposite each other. A 5-6th instar
larva was placed at the centre of the filter paper and the petri dish was
covered. The larva was allowed to feed for 24 hours in darkness. The
percentage of each leaf disk consumed by the larva was recorded at the end
of the experiment. Each species pair was tested with 10 larvae.
6.2.4 Within-tree distribution of feeding spots
Test trees were 2-year-old potted Red Cedar trees maintained under
glasshouse conditions. These trees had been artificially infested with H.
robusta and old stems had been cut to a height of ca. 30 cm in the previous
winter. Only one shoot was retained for each tree from the coppices. To
standardise the test trees, each shoot was allowed to retain 8 mature
compound leaves, the rest being removed manually from the bases. At the
start of the experiment, the new shoots had grown to an average height of
122 ± 35 cm and an average basal diameter of 0.65 ± 0.08 cm. Larvae were
from a laboratory stock originated from mature larvae collected in a Red

163
Cedar plantation in Macksville, NSW, and maintained on the artificial diet
of Couilloud and Guiol (1980).
Fifty test trees were arranged in a 5 x 10 layout on the glasshouse floor.
Spacing was not strictly controlled but care was taken that foliage of
neighbouring trees did not touch. One newly-hatched lst-instar larva was
introduced to each tree on the shoot stems with a fine brush. Locations of
larval feeding were checked daily between 10.00-12.00 from the next day on.
New feeding spots, recognised by the presence of new frass and absence of
previously-attached paper labels, were recorded with regard to locations and
type of tissues and then marked with tiny paper labels bearing the attack
sequences (#1, #2, etc.) which were kept in position by sticky tape. The frass
was carefully removed from the feeding spots with a fine brush and
transferred into a plastic jar, together with a piece of paper showing the
collection date of the frass. Twenty air-dried frass pellets were randomly
selected from each day's frass collection and measured for width under a
stereo microscope fitted with an eyepiece scale to the nearest 1I40 mm.
Feeding tissues were grouped into terminal foliage, pith, damaged tissues
and other tissues. Terminal foliage included terminal buds, unexpanded or
juvenile leaflets and leaf petioles. Feeding at leaf axils was considered as the
start of tunnelling, i.e. pith-feeding. The association was previously noted
(Coventry, 1899; Anon., 1958) and supported by personal observations. J\
larva was considered alive in the tunnel if new frass was found at thl' tunnl'l
opening on the day of checking or the day before. The latter situation wa;,
included to account for the fact that larvae would not feed for some timl' lwforl'
and after molting. Damaged tissues included leaf scars on the shoot surfon·
where leaves had been removed and other damaged area;, on the '>hoots or old
stems. Checking stopped when no more new frass was found on any of the test
trees. One week later, all test trees were searched thoroughly and shoots
dissected to check for the dewlopmental stage of lan·ae present Data from

164
individual trees were pooled to estimate the proportions of feeding in
various tissue categories. Assuming the relatively low mortality rate among
late instar larvae, trees that had ceased to show any new frass but had been
recording new frass at tunnel openings until as late as 30 days after larval
introduction were interpreted as containing larvae that had entered into
non-feeding stages, i.e. prepupae or pupae, and were still included in the
pith-feeding group.
To further qualify the preferred feeding tissues, 40 lst-instar larvae and
20 each of 2nd-3rd instar larvae were individually introduced into a tree at
various locations and followed until the initiation of feeding or for a
maximum of 30 minutes if no feeding took place before then. The tree was
of similar height and form as those used above.
6.3 Results
6.3.1. Feeding on inert substrates
Agar-cellulose substrate
The plain agar-cellulose cores were chewed almost as intensively as
those incorporated with the ethanol extract at any of the 3 tested
concentrations in the binary-choice experiment (Figure 6.2). Like the
treatment cores, some of the control cores were completely chewed to pieces.
The same situation was found in the non-choice experiment with regard to
the chewing intensities (Figure 6.3). However, the number of faecal pellets
produced was significantly higher for larvae fed with the treatment cores
than that for larvae fed with the control cores (P< 0.05, Wilcoxon rank sum
test; pooled data of all concentrations) (Figure 6.3), with the highest
differences recorded for the highest concentration, e.g. 10 g FWE in 50 g
plain medium. Only one of the 10 larvae in the control group produced
faeces, while faecal pellets were found for over half of the test larvae in any
of the three treatment groups.
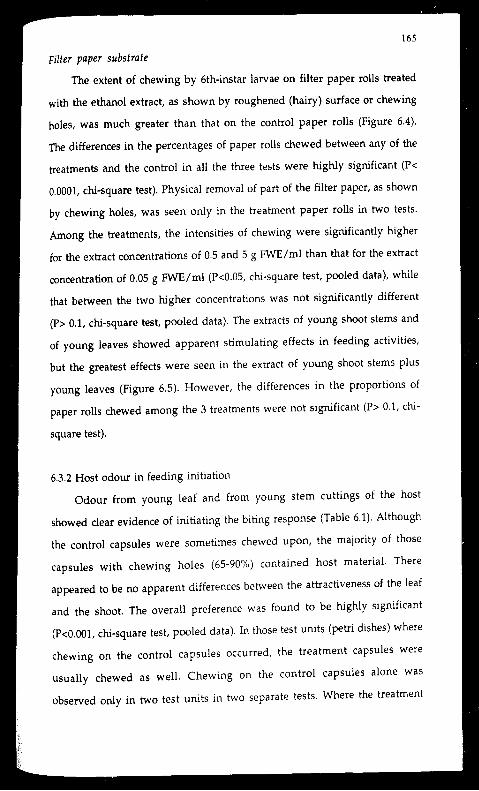
165
Filter paper substrate
The extent of chewing by 6th-instar larvae on filter paper rolls treated
with the ethanol extract, as shown by roughened (hairy) surface or chewing
holes, was much greater than that on the control paper rolls (Figure 6.4).
The differences in the percentages of paper rolls chewed between any of the
treatments and the control in all the three tests were highly significant (P<
0.0001, chi-square test). Physical removal of part of the filter paper, as shown
by chewing holes, was seen only in the treatment paper rolls in two tests.
Among the treatments, the intensities of chewing were significantly higher
for the extract concentrations of 0.5 and 5 g FWE/ml than that for the extract
concentration of 0.05 g FWE/ml (P<0.05, chi-square test, pooled data), while
that between the two higher concentrations was not significantly different
(P> 0.1, chi-square test, pooled data). The extracts of young shoot stems and
of young leaves showed apparent stimulating effects in feeding activities,
but the greatest effects were seen in the extract of young shoot stems plus
young leaves (Figure 6.5). However, the differences in the proportions of
paper rolls chewed among the 3 treatments were not significant (P> 0.1, chi-
square test).
6.3.2 Host odour in feeding initiation
Odour from young leaf and from young stem cuttings of the host
showed clear evidence of initiating the biting response (Table 6.1). Although
the control capsules were sometimes chewed upon, the majority of those
capsules with chewing holes (65-90°/c>) contained host material. There
appeared to be no apparent differences between the attractiveness of the leaf
and the shoot. The overall preference was found to be highly significant
(P<0.001, chi-square test, pooled data). In those test units (petri dishes) where
chewing on the control capsules occurred, the treatment capsules were
usually chewed as well. Chewing on the control capsules alone was
observed only in two test units in two separate tests. Where the treatment
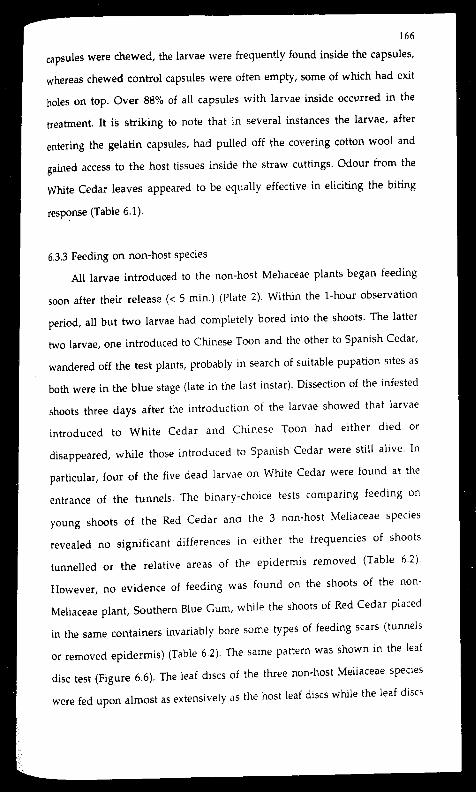
166
capsules were chewed, the larvae were frequently found inside the capsules,
whereas chewed control capsules were often empty, some of which had exit
holes on top. Over 88% of all capsules with larvae inside occurred in the
treatment. It is striking to note that in several instances the larvae, after
entering the gelatin capsules, had pulled off the covering cotton wool and
gained access to the host tissues inside the straw cuttings. Odour from the
White Cedar leaves appeared to be equally effective in eliciting the biting
response (Table 6.1).
6.3.3 Feeding on non-host species
All larvae introduced to the non-host Meliaceae plants began feeding
soon after their release(< 5 min.) (Plate 2). Within the 1-hour observation
period, all but two larvae had completely bored into the shoots. The latter
two larvae, one introduced to Chinese Toon and the other to Spanish Cedar,
wandered off the test plants, probably in search of suitable pupation sites as
both were in the blue stage (late in the last instar). Dissection of the infested
shoots three <lays after the introduction of the larvae showed that larvae
introduced to White Cedar and Chinese Toon had either died or
disappeared, while those introduced to Spanish Cedar were still alive. In
particular, four of the five dead larvae on White Cedar were found at the
entrance of the tunnels. The binary-choice tests comparing feeding on
young shoots of the Red Cedar and the 3 non-host Meliaceae species
revealed no significant differences in either the frequencies of shoots
tunnelled or the relative areas of the epidermis removed (Table 6.2).
However, no evidence of feeding was found on the shoots of the non
Meliaceae plant, Southern Blue Gum, while the shoots of Red Cedar placed
in the same containers invariably bore some types of feeding scars (tunnels
or removed epidermis) (Table 6.2). The same pattern was shown in the leaf
disc test (Figure 6.6). The leaf discs of the three non-host Meliaceae species
were fed upon almost as extensively as the host leaf discs while the leaf discs

167
of the eucalypt were mostly avoided by the larvae with feeding scars shown
only in 3 leaf discs.
6.3.4 Within-tree distribution of feeding spots
Twenty-one out of the 50 larvae introduced survived into the blue
larvae or the prepupal stage. The majority of deaths (79%) occurred during
the first three days after introduction. The relationship between frass width
and sampling time, expressed as the number of days since the introduction
of newly-hatched lst-instar larvae, was significantly fitted by a logistic
equation (F=345.65, df=l,36, p=0.0000) (Figure 6.7). Based on this equation,
the moulting dates for successive larval instars were estimated by
supplanting the inter-instar boundaries in frass widths (Appendix) into the
equation and solving for the corresponding dates (Figure 6.7). The estimated
moulting dates for 1st-5th instars were 3.4, 11.9, 19.4 26.8 and 35.0 days
following larval introduction. These were estimates of population averages.
Individual larva may have developed at different rates.
Relative proportions of feeding in terminal foliage, pith, damaged
tissues and other tissues varied as larval development progressed (Figure
6.8). Feeding by first instar larvae was exclusively confined to the terminal
and damaged tissues, of which damaged tissues were attacked about four
times as much as terminal tissues. Among terminal tissues, buds and leaf
petioles were most favoured. On only one occasion was a larva found
feeding on the surface of a young leaflet. Feeding on damaged tissues was
mainly found in leaf scars. The same confinement of feeding activities
continued until late second instar, when terminal feeding dropped to zero
and feeding in pith through stem tunnelling commenced. No more
terminal feeding was observed thereafter. The period from late second
ins tar to late 5th ins tar revealed a steady decrease of larval proportions in
damaged tissues (from about 90% to zero) and a general increase of larval
proportions in pith (from zero to about 90%), reflecting a continuing shift

168
from surface feeding to pith feeding. All pith feeding began at leaf axils.
Feeding in other tissues commenced at early third instar and fluctuated
around 20% during the rest of the larval period. Typical locations were
epidermis (or bark) of shoots or stems, shoot bases Uunctions of shoots and
tree stems), and bases of tree stems at the soil level. Coinciding with the
sudden rise of feeding in other tissues was a sharp drop of larval
proportions in pith. Despite the drop, pith-feeding still accounted for most
of the feeding activities (60%). Larval proportions in the various tissues
stabilised after 48 days of larval development.
Larvae seldom remained at the same feeding locations during their
development. On average, a larva initiated feeding in 5.4 different locations
during its life time, with a minimum of 3 and a maximum of 11. When
plotted against larval development time, two peaks are evident in the
distribution of average number of new feeding spots per larva (Figure 6.9).
The first peak was recorded within one day of larval introduction, i.e.
among newly-hatched lst-instar larvae, and the second during much of the
third and early fourth instar. Thereafter it decreased as larval development
progressed.
The length of time that a larva would stay at a particular feeding spot
differed with the location of the feeding spot. The average stay time was
highest in pith (6.8 ± 7.6 days), followed by damaged tissues (4.3 ± 3 6 days),
terminal foliage (3.0 ± 2.1 days) and other tissues (2.6 ± 2.0 days). The
difference was significant at P= 0.05 level when pith was compared with any
of the other tissue categories (Wilcoxon rank sum test), which is not
surprising as H. robusta is a shoot borer. However, most feeding spots were
abandoned within one day of feeding initiation (66%, pooled data),
regardless of the tissue where feeding took place.
Observations on the settlement processes of larvae released
individually supported the above-outlined shoot selection patterns (Table
6.3). It is worthwhile to note that feeding by first instar larvae tended to start

169
in the vicinity of the locations where they were released, whereas that by
older larvae did not show apparent correlations with their release locations.
All lst-instar larvae released at the terminal buds started feeding in
terminal foliage and those released on shoot stems or old stems ended up in
damaged areas along the stems. Larvae of 4-6th instars walked extensively
on the release trees before settling down to feed, usually at leaf axils on the
upper sections of the shoots. Some even moved away from the release trees.
6.4 Discussion
The feeding process of insects with chewing mouthparts contains two
important phases: biting and ingestion. During the biting phase, the
suitability of the food, especially the chemical structure and composition, is
assessed by the insect through various receptor cells located in the
mouthparts. The ingestion phase, in which the food is swallowed, would
proceed if the necessary signal pattern is received by the central nervous
system. When biting is not followed by ingestion, no faeces would be
produced, assuming the gut is empty before the current feeding process.
With H. robusta, separation of the two feeding phases is further facilitated
by the fact that conspicuous piles of food fragments are produced and these
food fragments can be distinguished from the faeces by their less regular
shapes and less smooth surfaces. This criterion was used in analysing the
results of the no-choice test using the agar-cellulose medium as feeding
substrate. As reported previously (Hsiao and Fraenkel, 1968), the plain agar
cellulose medium was sometimes extensively chewed but no or few faeces
were produced. 1: contrast. !arvae fed with the treatment medium to which
the ethanol extracts w12re incorporated mostly produced faecal pellets in
addition to the chewing fragments of food. The result suggests that the
ethanol extracts contained at least some of the necessary phagostimulants,
the presence of which was detected by the larvae through the gustatory
receptor cells located in the mouthparts and led to ingestion of the test

170
medium. Similar discriminatory feeding behaviour against chemicals
might have also been exhibited by larvae in the choice tests but the faeces
produced could not be ascribed with confidence to the ingestion of either of
the two test media, control or treatment. Extensive chewing on the plain
medium was probably driven by hunger, which, in turn, drove the larvae to
make repetitive sampling of the medium in an attempt to find suitable food
somewhere within the test medium. Hence the chewing intensity alone
appears to be insufficient to characterise the chemical-mediated feeding
behaviour of H. robusta larvae when the agar-cellulose medium is used as
the feeding substrate. This does not mean, however, that the act of biting or
chewing was completely random with respect to food. In fact, the intensity
of chewing was found to be different between the control and the treatment
when filter paper was used as the feeding substrate. Filter paper rolls loaded
with the ethanol extracts were chewed more intensively than the control
rolls, suggesting the involvement of contact and/or olfactory stimuli in
initiating and sustaining the chewing activity. The involvement of olfactory
stimuli in initiating the biting response was convincingly shown in the
gelatin capsule tests. Although the test larvae were prevented from having
direct contact with the test material, they were able to concentrate their
chewing on those gelatin capsules containing sections of fresh young leaves
or shoots, apparently as a result of their detecting the host volatile reaching
them through the punched holes on the walls of the treatment capsules.
The possibility of capsule softening in the treatment by the water vapour
emitted from the host material was minimal as the latter were placed in
plastic straws blocked at both ends by cotton wool. In summary, the feeding
behaviour of H. robusta larvae was regulated by chemicals present in the
young shoots and leaves of host trees and some of these chemicals could be
extracted by ethanol. These chemicals might have functioned as olfactory,
contact, or gustatory stimuli. Olfactory stimuli alone could initiate the biting
response. Biting could also be initiated by contact stimuli, whether chemical

171
or physical, or simply by hunger. The reliance of feeding on these chemicals
was more strict during the ingestion phase than that during the biting
phase. Certain gustatory stimuli had to be present for any significant
ingestion of the food.
Although H. robusta attacks only Red Cedar in Australia, the stimuli
(chemical or physical) necessary for initiating and sustaining larval feeding
are likely to be widely distributed among various Meliaceae species. This
was seen in the ready burrowing into the shoots of all the three Meliaceae
species tested, despite one of them, the White Cedar, being in a different
subfamily. Furthermore, the intensities of feeding on these non-host
Meliaceae species were comparable to that on the host and the volatiles
from the White Cedar appeared to be equally attractive as that from the host
tree in eliciting the biting response. It is not known whether this is due to
some commonly existing chemicals in this family. Species in the family
Meliaceae are characterised by the common occurrence of limonoids
(derivatives of triterpenes), which are found also only in two other families
(Taylor, 1981). Current knowledge of the biological activities of the
limonoids and their derivatives is restricted to the insecticidal properties
(Champagne et al., 1992; Agostinho et al., 1994).
Two of the tested non-host Meliaceae species, Chinese Toon and White
Cedar, apparently contained chemicals that were toxic or detrimental to the
normal development of the larvae, as the test larvae either died or
disappeared after some time. Assuming the attractiveness of the two species
to egg-laying moths, these trees may be used in controlling the insect by
planting them in mixture with the Red Cedar. The prospect looks
particularly promising for the White Cedar as feeding on it inevitably
resulted in the death of the larvae and the tree did receive some eggs
(personal observation). In addition, White Cedar grows naturally within the
geographic range of Red Cedar and it also produces good timber (Floyd,
1989).

172
It is striking to note that more early-instar larvae were found feeding
in damaged tissues than in terminal foliage, considering that the latter has
been described as the favourite site for initial feeding (Beeson, 1919). The
selection of damaged tissues was also observed in the field where young
larvae were found inside old, abandoned tunnels or tunnels occupied by
mature larvae. Feeding in damaged tissues appears to have some
advantages, like more protection sites and possibly weaker antibiosis
reactions from host plants. Early locating of suitable feeding sites is of vital
importance to newly-hatched larvae. As they did not seem to travel far
before starting feeding, the fate of these larvae depends very much on the
oviposition sites.
The sudden drop in the proportions of pith-feeding larvae early in the
sixth instar indicates that a considerable number of larvae left their original
tunnels, probably searching for alternative pupation sites. Abandonment of
old feeding spots was common in this study and probably resulted from
vigorous sap exudation or shoot size being too small (Beeson, 1919). It seems
that larvae had to search and try a number of locations in the plant before
settling down to feed.
As feeding began from outside, the variation in the number of new
feeding spots per Jarva per day can be considered as a measure of the
changes in the intensities of surface activities of larvae. The pattern of the
variations suggests that there was a re-emergence of larvae from previously
established feeding sites during much of the third and early fourth instar. If
proven, such a period may by used in timing control approaches.

173
Table 6.1. Frequencies of gelatin capsules with chewing holes and with
larvae inside in the treatment (containing young leaf or shoot cuttings) and
the control (containing no plant material) as shown in choice tests. Each test
consisted of 15 test units and each test unit contained 2 treatment capsules
and 2 control capsules arranged alternately in pre-punched holes in the
periphery of a petri dish base (see Figure 6.1 for detail). One 4-6th instar
larva was introduced in a test unit and allowed to feed for 18 h in darkness.
Materials tested in leaf-1 to leaf-3 and shoot-1 to shoot-2 were of the host
tree, T. australis. Only young leaves were tested with the White Cedar, M.
azadirchrata.
le af-1 leaf-2 leaf-3 shoot-I shoot-2 total White Cedar
Treatment with holes I 3 14 I 0 5 4 I 0
(Tl larva in 34 4
Control with holes I 8
(C) larva in 0 0 0
T/(T+C) with holes 80.0 65 .0 90.0 7 3 .7 7 6. 9 7 5 .0 8 3. 3
(%) larva in 100 88 .89 100 8 8 .8 9 100 94.4 100

174
Table 6.2. Relative intensities of feeding of H. robusta larvae on the shoots
of non-host species as compared with that on the host shoots as revealed by
a binary-choice test. Differences in the frequencies of shoots tunnelled were
tested by chi-square test and that in relative surface feeding intensities by
Wilcoxon sign test.
nonhost No. of shoots tunnelled
species host nonhost p-value
C. odorara I 0 0.75
T. sinensis 6 0. 74
M. azadirachra 14 I 0 0 .3 3
E. globulus 0 NA*
No. of shoots with greater surface-feeding in
host nonhost neither p-value
0.58
4 9 0.38
12 0.49
I 8 0 0.00
*the number of tunnelled shoots in the non-host was too low to allow a chi-square test.

175
Table 6.3. Proportions of initial feeding locations of larvae released
individually. Feeding at leaf axils signals the start of tunnel excavation and
thus pith feeding.
larval number initial feeding locations ~%l
i nstar started terminal leaf damaged other
feeding foliage axils tissues tissues
I st 23 34.8 0.0 65.2 0.0
2nd 12 50.0 8.3 41.7 0.0
3rd 18 0.0 25.0 50.0 25.0
4th 16 0.0 75.0 0.0 25.0
5th 9 0.0 100.0 0.0 0.0
6th 6 0.0 66.7 0.0 33.3

176
paper holes covering
cotton wool gelatin capsule drlnldng straw
petri dish base host tissue
Figure 6.1. Design of the gelatin capsule test unit in the study of the role of
host odour in eliciting the biting response from the larvae

177
• chewed D nearly completely chewed
test·1 test·2 100 -
~ 2:' BO 0
"' "' '" 0 60 .<: 0
'" "' .~ 40 "
-"' "' .. 'E "' 20 0 Q;
CL
0 n n n l, I I
l, 11
0 2.5 5 1 0 10 0 2.5
Concentrations of test extract (g FWE I g medium)
Figure 6.2. Intensities of larval chewing on cylindrical cores of the agar
cellulose medium incorporated with the ethanol extract at different
concentrations. The concentration of 0 g FWE/50 g medium denotes the
control.
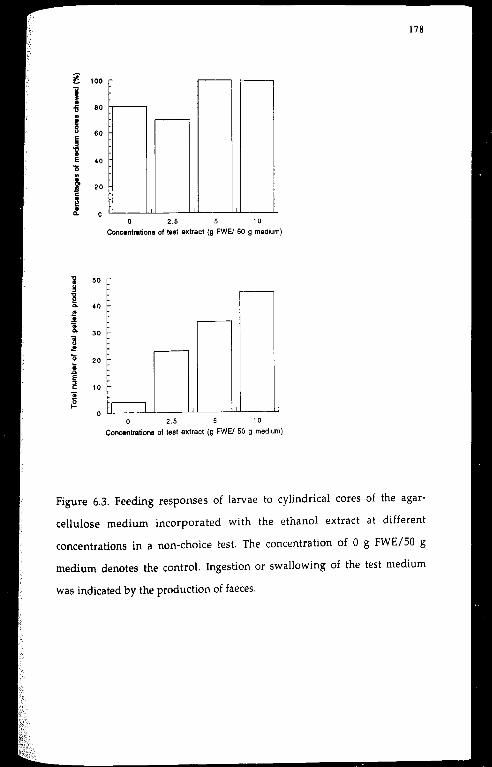
178
~ 100
1 • ii 80 .. I! 8 60 E :J
~ E 40 '5
& 20 s c: ~ ~
2.5 1 0
Concentrations of test extract (g FWE/ 50 g medium)
1 50
~ Cl. 40
J 8. 30 3 ~
0 20 j E :J c: 10 s 0 ....
2.5 1 0
Concentrations of test extract (g FWE/ 50 g medium)
Figure 6.3. Feeding responses of larvae to cylindrical cores of the agar
cellulose medium incorporated with the ethanol extract at different
concentrations in a non-choice test. The concentration of 0 g FWE/50 g
medium denotes the control. Ingestion or swallowing of the test medium
was indicated by the production of faeces.

179
D chewed • chewing holes
test-1 test-2 test-3
~ 100 0
"' $
"' " 80 ~
" "' .. .!: 60
.!!l e a; 40 c. "' Q.
t. 20
0 "' "' 0 "' "' "' 0 "' 0 "' "' 0 ci 0 c:i 0 c:i ci ci c:i
concentrations of extract (g FWE/ml)
Figure 6.4. Larval chewing on filter paper rolls treated with the ethanol
extract at different concentrations in 4-choice tests. The concentration of 0 g
FWE/ml denotes the control.
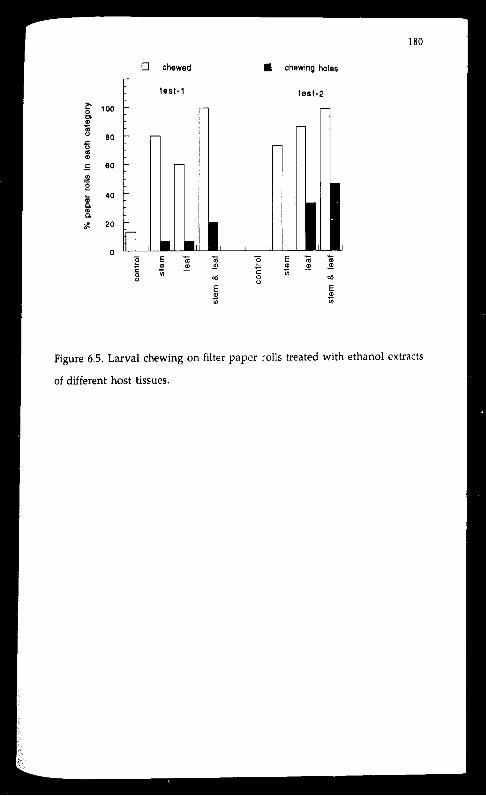
180
D chewed • chewing holes
test-1 test-2
?' 100 0
"' '" a; " eo
.i::.
" .. '" .S: 60
.!!l -e a; 40 c. .. c. 'I- 20
0 e E c;; c;; c: " ~ ~ 0 u;
Oil "
g E c;; c;;
" ~ ~ c: u; 0 Oil
" E E Q)
w $ ..
Figure 6.5. Larval chewing on filter paper rolls treated with ethanol extracts
of different host tissues.

nonholll= Spanl1h cedar
nonho11t= white cedar
• host only
D non·hos1 only
~ host+non·host
0 neither
• host only
0 non·hosl only
IS:'! host+non·hoa!
0 neither
181
nonhos1= Chinese loon
nonhost= south9rn blue gum
Figure 6.6. Feeding by larvae of H. robusta on the leaf discs of the host, Red
Cedar, and four non-host species in pair-wise choice tests. The area in each
pie represent 10 test units, each consisting of 2 leaf discs from the host and 2
leaf discs from the non-host. The leaf discs were arranged alternately in the
periphery of a petri dish floor. The percentages given in the four categories
represent, respectively, the proportions of test units in which feeding was
observed on the leaf discs of the host orJy, non-host only, both the host and
the non-host, and neither the host nor the non-host.

E' §. 0.8 .c: '6 'i 0.6
"' "' ~ 0.4
<D
"" 0.2 ~ <D
~ 0 0
3rd 4th 5th
10 20 30
y=0.91/(1+17.61e·0·11x)
(R2=0.97)
6th-instar
40 50
days since the introduction of newly-hatched 1st-in star larvae
60
Figure 6.7. Average frass widths (mm) of larvae and the estimated larval
instars during the course of larval development on potted Red Cedar plants.
One newly hatched larva was introduced to each plant. The boundaries
separating the frass widths of neighbouring larval instars were taken from
Appendix 1.
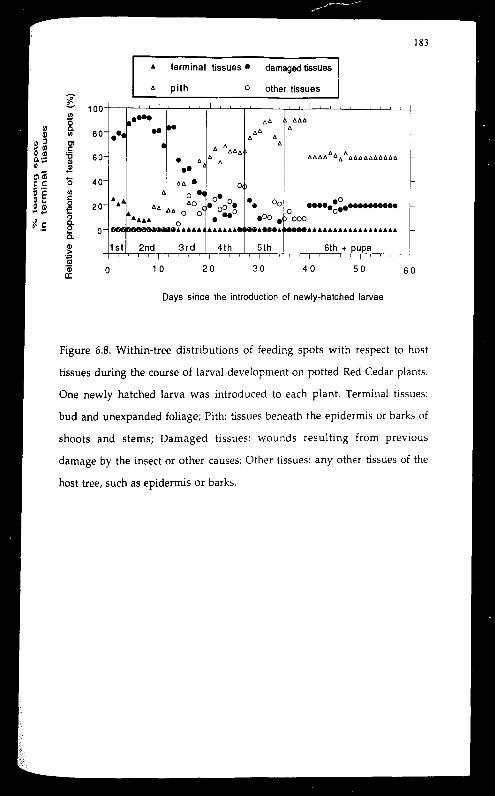
183
terminal tissues• damaged tissues
A pith 0 other tissues ~ 0
100 23 .... •• Mt. 0 a.
80 •• .. •• • IJ) A A
C7I lJ. lJ.lJ.66
A c: '6 60 • t. 666!J.
66A
6lJ.666lJ.666A6 ., A A
.! •• 0 40 66 • 0 IJ) 0 •
o• o c: • ·····~~··········· 0 20 • AQ • Do '€ .. ,, I 00 I • A 0 0 .. 0 0 0 .......... • ,oo • 000 8- 0
Q. 0 II 11.&AA.t.A ........... ........ ................................
., 1st 2nd 3rd 4th 5th 6th + pupa > ..., ca a; 0 1 0 20 30 40 50 60 a:
Days since the introduction of newly-hatched larvae
Figure 6.8. Within-tree distributions of feeding spots with respect to host
tissues during the course of larval development on potted Red Cedar plants.
One newly hatched larva was introduced to each plant. Terminal tissues:
bud and unexpanded foliage; Pith: tissues beneath the epidermis or barks of
shoots and stems; Damaged tissues: wounds resulting from previous
damage by the insect or other causes; Other tissues: any other tissues of the
host tree, such as epidermis or barks.
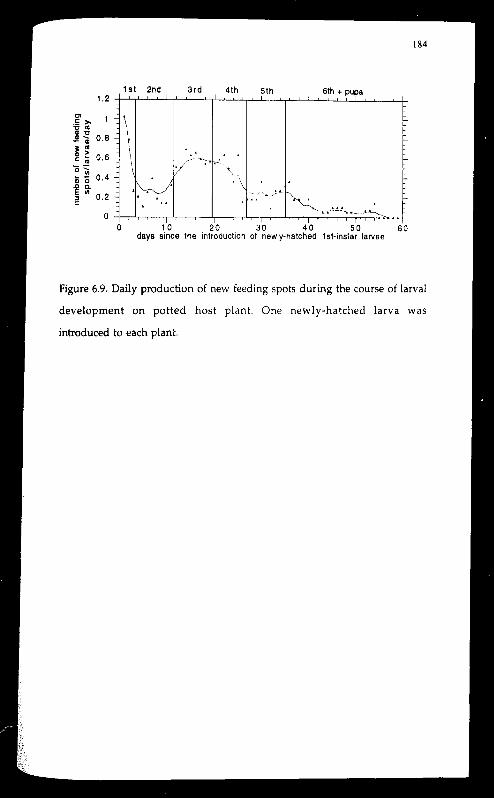
"' £>
"'"' '""' ~a; 0.8 ;i:"' ~ ~ 0.6 o~ a; 0 0.4
~ ~ 0.2 c:
1st 2nd 3rd
~~ "J~
4th
'\ ·\
5th
; : -~' ! ~< .. -"-~~--'-0 -j-.,.._._,,--,-,--'.--,---,-,-T-,--,--r',---,--,---,"r-.-.-.-r--r-,--,--.---,-.~.-.+
0 1 0 20 30 40 50 60 days since the introduction of newiy-hatched 1 st-instar larvae
Figure 6.9. Daily production of new feeding spots during the course of larval
development on potted host plant. One newly-hatched larva was
introduced to each plant.

I S'i
!'late 2. A larva of the H. robusta in the progress of boring into the shoot of
J potted White Cedar (Melia azadirachta var. australasicn ) tree.

Chapter 7
Diel Patterns of Reproductive Activities of Hypsipyla robusta
Moore*
7.1 Introduction
186
Reproduction in most lepidopteran species is accomplished through a
series of distinct phases of moth activity, eg. female calling (pheromone
release), male activation, copulation, and oviposition. Knowledge about the
patterns of these activities is important in establishing successful control
strategies aimed at the reproductive stage of the targeted insects, such as the
use of sex pheromones in mating disruption (Shorey, 1977; Carde and
Minks, 1995) and mass release of sterile males (Boake et al., 1996). These
strategies hold a special place in integrated pest management (IPM), because
of their environmentally safe and species-specific properties.
Although the structure of the sex pheromones of Hypsipyla robusta
Moore (Lepidoptera: Pyralidae) has been worked out (Bosson and Gallois,
1982) for the African race, little is known about the reproductive behaviour
of the moths. All reproductive activities probably take place at night, as the
moths are inactive during the day (Beeson, 1919). Studies of an artificially
reared colony indicated a peak emergence period between 18:00 and 19:00 h
(Atuahene and Souto, 1982). The same authors found that females exhibited
strong preferences for cracks or creased spots as oviposition sites. Relatively
more information is available on the sibling species, H. grandella (Zeller)
(see Newton et al., 1993). According to Sliwa and Becker (1973), emergence of
the moths occurs just before dark, with no significant differences in the
emergence times between males and females. Calling started about 6 hours
after light-off and peaked about 3 hours thereafter. The length of an average
calling period is about one and half hours and that of copulation about 2
*An earlier version of this chapter has been accepted for publication in Australian Forestry

187
hours. Mating takes place at some 8 hours after light-off (Holsten and Gara,
1977a). Females mate only once and stop calling after mating, whereas re
mating in males is not unusual (Holsten and Gara, 1977a). Males aged 3-4
days are most receptive to calling females (Holsten and Gara, 1974). Males
are most responsive to females aged 2-3 days, coinciding with the peak
period of sex pheromone production (Holsten and Gara, 1977b). Flight
activities of the moths occur between 24:00 and 05:00 h and cease when
temperature falls below 15°C and during high precipitation (Gara et al.,
1973). Oviposition occurs in the evening or early morning (Wilkins, 1972;
Holsten, 1977).
In an effort to understand the reproductive behaviour of H. robusta,
die! patterns of moth emergence, female calling, mating, egg-laying, and
physical activities were studied under laboratory conditions. The effects of
age on these reproductive activities were also analysed. Host searching
behaviour of the moths will be dealt with in Chapter 8.
7.2 Methods
7.2.1 Source of the moths and observation environment
Moths used in this study were from a laboratory colony reared on the
artificial diet of Couilloud and Guiol (1980). Field-collected larvae were
periodically introduced into the colony. Temperature was maintained at 26
± 2 °C. From the pupal stage, light period was strictly controlled at 14L:100,
in a reversed cycle. Daylight was simulated by a 250 W mirror-backed globe,
and night time observations were facilitated by a 20 W red fluorescent light.
Diel patterns of moths of mixed ages were studied in Perspex cages (250 x 250
x 820 mm), the openings of which were covered with cheese cloth. Two
petri dish bases containing 10% sugar-saturated cotton wool were placed on
the cage floor to serve as food for the moths. Observations of activities of
individual moths were made in plastic vials (40 x 50 mm). The caps of the

188
vials were placed in such a way that a small slit was kept between the cap
and the vial opening to maintain basic ventilation.
7.2.2 Moth emergence
Pupae were sexed according to the characteristics given by Sharma
and Singh (1980a) and individually placed in plastic vials. Emergence time
of the moths in the scotophase was recorded.
7.2.2 Female calling
After emergence, males were put in the Perspex cage and females left
in the plastic vials to allow the recording of calling time. The calling posture
of a female was recognised by its lowered wings and raised abdomen. The
time when individual females first started calling was recorded. Some
calling females were immediately transferred to the Perspex cage containing
the males, for mating. Initial calling time of the remaining females was
recorded daily until they died.
7.2.3 Mating
Males and females of mixed ages were allowed to mate in the Perspex
cage. The time of individual copulations was recorded. Mated females were
transferred to another Perspex cage upon separation from the males for
oviposition. In a separate experiment, females of given ages were placed in a
cage of males to study the effect of age on mating success.
7.2.4 Egg-laying
Egg-laying was considered to have been attempted if, while stationary,
the abdomen of the female arched down and the tip of the ovipositor
touched the cage surface. Active walking, flying, or wing-fanning between
successive egg-laying attempts were considered to be part of egg-laying
activities. The timing of individual egg-laying bouts was recorded.

189
7.2.5 Physical activities
A moth was considered as physically active if it was flying, walking or
wing-fanning. This definition is based entirely on the moth's physical
rather than physiological status. Hence individuals engaged in calling and
mating are not considered as active since they rarely move, although they
are not really at rest. Diel patterns of physical activities were studied
separately for males, virgin females and mated females. Physical activities of
the moths were studied both in groups and in solitary confinement.
Group confinement
On each observation night, selected individuals in the Perspex cage
were monitored for their activity status, active or inactive. The monitored
individuals were so selected that they could be easily distinguished from
others by their morphological characteristics, eg. size, completeness of
wings. The starting and ending times of each active interval of the
monitored individuals during the night period were recorded. Males and
females that mated during the period of observations were not included in
the analysis, as their normal activity rhythms would be disrupted by mating.
Solitary confinement
Activity status of individual moths in plastic vials was recorded
every 5 minutes during the scotophase. A moth was considered as active in
a 5-minute interval if it had walked or fanned its wings sometime during
that interval. Physical activities of these moths were monitored nightly
until their death or relocation to the mating cages. Data from the night of
moth death or relocation were excluded from analyses. For mated females,
recording of physical activities commenced on the first night after mating.

190
7.3 Results
7.3. l Moth emergence
Most moths emerged in the early hours of the scotophase (82%), the
rest before light-off. The frequency distribution of emergence in the
scotophase was relatively sharp and narrow (Figure 7.1). Nearly 50% of
nightly emergence occurred in the half-hour interval of 1.0-1.5 h after dark.
No more emergence was observed 3.5 h after dark. The emergence patterns
of males and females were very similar, the only difference being the
slightly sharper peak in the males (Figure 7.1).
7.3.2 Female calling
The posture of calling was similar to that observed in H. grandel/a
(Sliwa and Becker, 1973). Before engaging in prolonged stationary calling,
virgin females were sometimes seen dragging their ovipositors across the
cage surface, probably leaving a trail of pheromones to aid in the elicitation
of males (Teal et al., 1981). Calling of females was observed as early as 3
hours after dark. However, the majority (67%) started calling at 5.5-7.5 h
after dark (Figure 7.2). Thereafter, calling recruitment continued at low
levels. There was an apparent trend for earlier calling as the females aged
(Figure 7.3A) (P< 0.05, Kendall's correlation test). The mean time of initial
calling was shifted forward by about 20 minutes each scotophase (Figure
7.3B). Once initiated, calling would usually continue until after light-up
unless disturbed; in the latter case the females would resume calling after a
short while. Most females stopped calling after mating. However, some
mated females continued to call in the following scotophases.
7.3.3 Mating
Mating began 1.5 hours later than calling but reached its peak around
the same time as calling (Figure 7.2). The decline of mating frequencies after
the peak was, however, more gradual and mating persisted till the end of

191
the night period. Mating was recorded on females aged 1-6 days and on
males aged 0-4 days. Females appeared to be most receptive to males in the
2nd-3rd day following emergence, accounting for 63% of all copulations
obtained in this study.
7.3.4 Egg-laying
Unlike the die! patterns of other reproductive activities, egg-laying in
the Perspex cage was observed in all but the first 0.5 hour and the last 1.5
hours of the scotophase. There appears to be no single, dominant peak in
the egg-laying pattern (Figure 7.2).
7.3.5 Physical activities
Group confinement
Despite being nocturnal, H. robusta moths spent considerable
proportions of the dark time resting. Individual moths, irrespective of their
sex and mating history, periodically underwent rest in the dark phase
(Figure 7.4). Virgin females appeared to be more active during the early half
of the scotophase and remained relatively stationary during the latter half of
the scotophase, apparently as a result of their calling patterns. The actual
proportions of time spent in active status by individual moths varied from
0 to 45%. On average, virgin females spent less time in active status than
mated females and males (Table 7.1), but the differences were not significant
( P>O.l, Mann-Whitney test). Mated females showed the longest average
duration of active intervals (Table 7.1), which is significantly higher than
that of virgin females (P<0.05, Mann-Whitney test).
Solitary confinement
Mean intensity of physical activities, as measured in the proportions
of active 5-minute intervals, was significantly higher in mated females than
that in virgin females and males (P< 0.05, Mann-Whitney test) (Figure 7.5).

192
Similar patterns were detected in the means of nightly maximum durations
of active intervals (Figure 7.5). Mated females, on average, stayed in active
status much longer than virgin females and males. One mated female was
observed to be active continuously for over 2 hours, while the maximum
durations were less than 1 hour in virgin females and males. No significant
differences were detected between males and virgin females in either the
proportions or the maximum durations of active intervals (P> 0.05, Mann
Whitney test). Physical activities of the moths, males or females, were
concentrated in the early and middle phases of the scotophase (Figure 7.6).
Mated females were especially active in the first 3 hours of the scotophase
(Figure 7.6). The intensity of physical activities decreased substantially after 7
hours into the scotophase. Males were most active in the first scotophase
following emergence and virgin females the second scotophase following
emergence (Figure 7.7). After the peak, activities of both sexes decreased
gradually as age increased. Females were relatively inactive in the night of
emergence, with an average intensity of activities comparable to those 5
days after emergence. Among females mated within 5 days of their
emergence, 53% reached the activity peaks in the first scotophase following
mating and 24% in the second scotophase following mating. The rest
exhibited peak activities before mating.
7.4 Discussion
The die! emergence pattern of moths of H. robusta observed here was
similar to that reported by Atuahene and Souto (1983), both indicating the
concentration of emergence in the early hours of the dark period. A
different emergence pattern was reported for H. grandel/a (Sliwa and
Becker, 1973), which showed a concentration of emergence just before dark.
Calling commenced 3 hours after light-off and terminated at the end
of the scotophase. Considering the persistent nature of female calling, most
females would be available for mating throughout the latter half of the

193
scotophase. The mean time of initial calling varied with age, shifting
forward by about 20 minutes each scotophase. Earlier calling in older
females may be an adaptive trait in the competition for males (Babilis and
Mazomenos, 1992). Most females (74%) called daily for about 6 days. Non
calling was observed in some females on the night of their emergence and
in some in the last two nights of their life. In the latter case the females were
probably too weak to adopt the typical calling postures. Some continued to
call after 10 days from their emergence. However, the sex pheromones
released by old calling females were probably of inferior quality or quantity,
as they were mostly ignored by males.
Male responded to the calling female by flying upwind toward it and
landing in the close vicinity, usually immediately below the female, and
then swiftly swiping the tip of its abdomen toward that of the female. Upon
clasping the female, the male would immediately turn its body to the
opposite direction. When mating took place on a vertical surface, the head
of the male always pointed downward. The diel pattern of male sexual
activity was not directly studied. Mating attempts by males were observed
only after females started calling. It is not known whether males were
sexually active before this time. The diel pattern of mating reveals that
some males were sexually active as early as 4 hours after dark. Mating
appeared to take place only between compatible males and females. Both
sexes possessed the ability to select their mates. Sexually active males,
recognised by their swinging of abdomens toward females, were seen
walking past some calling females without showing mating attempts. On
the other hand, not every calling female was receptive to males. The
unreceptive behaviour consisted of moving away from the approaching
male and flexing of the abdomen so that its tip was out of reach of the
male's claspers. In the event of successful grasping by the males, the females
would struggle until escape was achieved. It is not clear what criteria were
used by males in selecting the females and under what circumstances

194
females were unreceptive to males. Age may be one of the factors involved,
as copulations were observed only in moths of certain age groups, namely
aged 0-4 days in males and 1-6 days in females. In addition, unsuccessful
copulations often involved females on the night of their emergence, or old
females. The involvement of age in the unreceptive behaviour of females
has been documented in a number of lepidopteran species (Teal et al., 1981;
Colvin et al., 1994). The attractiveness of females to males may depend on
the production of sex pheromone of females, which, in turn, varies with
age. A study of H. grande/la indicates that the pheromone production of
virgin females reaches its peak 2-3 days after emergence and females of this
age elicited the strongest response (mating attempt) from males (Holsten
and Gara, 1977b ). It is interesting to note that some females continued to call
after mating. It suggests that single copulations did not always result in the
full fertilisations of eggs and females might be able to re-mate.
Incompatibility of the male partners cannot fully explain the after-mating
calling behaviour, since the latter was also observed in one female that had
already laid some fertile eggs.
Egg-laying in the Perspex cage appeared to be randomly distributed
throughout most of the night period, as indicated by the widespread
occurrence and the lack of a single, dominant peak. However, observations
of individual mated females in the plastic vials showed a concentration of
activities in the first 3 hours of the scotophase. This agrees partly with the
finding of the oviposition behaviour of H. grandella, which indicated active
egg-laying in the early and late hours of the night (see Newton et al., 1993).
Most eggs were probably laid in the first night following mating, as
suggested by the physical activities of mated females.
The die! patterns of physical activities of H. robusta appeared to be
similar to those of Chilo parte/lus, also a shoot borer in the family Pyralidae
(Pats and Wiktellius, 1992). Compared with mated females, virgin females
were much less active whether in group or solitary confinement. This was

195
shown both in the proportions and maximum durations of active intervals.
Assuming similar relative activity intensities of moths in the field, it
appears that mated females, rather than virgin females as was reported for
H. grandella (Holsten and Gara, 1977c), were mainly responsible for
dispersal and locating host plants. The priority of females appeared to be
attracting the males and getting mated. Under natural conditions,
populations of H. robusta often occur in low numbers due to the scattered
distribution of its host trees. Mating before dispersal would increase the
chance of reproduction in sparse populations. The hypothesis was
supported by the notion that virgin females were quite inactive on the night
of emergence. Their activities peaked 2 days later, one day after the earliest
recorded mating age. However, the hypothesis needs to be tested by field
studies. If the hypothesis is found to be correct, then control by mating
disruption or mass trapping with pheromones should be applied at the site
of current infestation rather than in healthy host stands surrounding the
infestation site.
As a result of calling in the latter half of the night, physical activities
of virgin females were seen mainly in the early and middle phases of the
scotophase. Male activities peaked one day earlier but declined more quickly
as age increased (Figure 7.2). No successful mating was recorded for males
aged over 5 days.
Study of the rhythms of physical activities is important for the
understanding of reproductive behaviour. Males at rest were seen to ignore
the calling females, even dunng the peak mating periods when they were
'supposed' to be sexually active. In other words, they did not engage in
mating behaviour immediately upon the reception of pheromone signals.
Sometimes the resting males were physically disturbed by the passing of
other moths, including females that had temporarily stopped calling, but
they soon returned to their rest after a few trivial movements. Such a rest
inhibited sexual activity of males has also been reported in other Pyralidae

196
species and may be the expression of an endogenous circadian rhythm
(Unnithan and Saxena, 1989). It suggests that high ratios of males to females
are needed to optimise mating in a cage environment. Female responses to
host-plant volatiles were also dependent on their activity status.
Preliminary olfactory experiments showed that calling virgin females often
remained stationary in the test arena (wind tunnel or olfactometer) and did
not make any choices for some time with regard to the presence or absence
of host-plant volatiles. It thus seems desirable that olfactory experiments be
conducted in the first half of the scotophase, when most of the females are
still actively walking or flying.
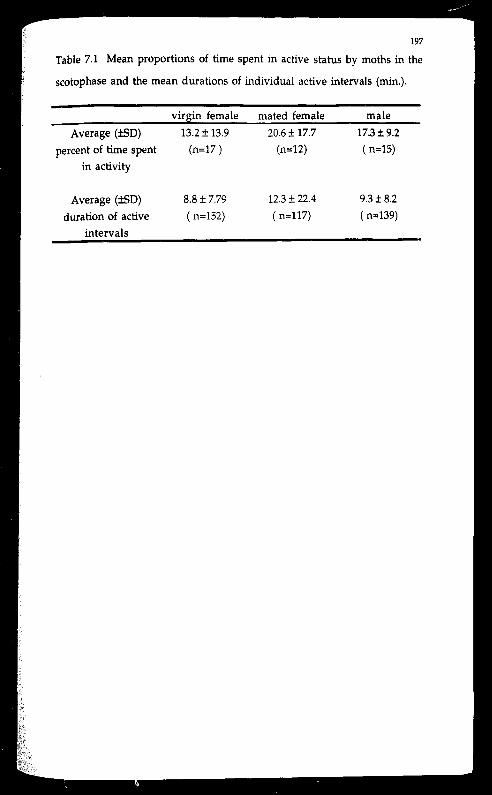
197
Table 7.1 Mean proportions of time spent in active status by moths in the
scotophase and the mean durations of individual active intervals (min.).
virgin female mated female male
Average (±SD) 13.2±13.9 20.6± 17.7 17.3 ± 9.2
percent of time spent (n=17) (n=12) ( n=15)
in activity
Average (±SD) 8.8 ± 7.79 12.3 ± 22.4 9.3±8.2
duration of active ( n=152) ( n=ll7) ( n=139)
intervals
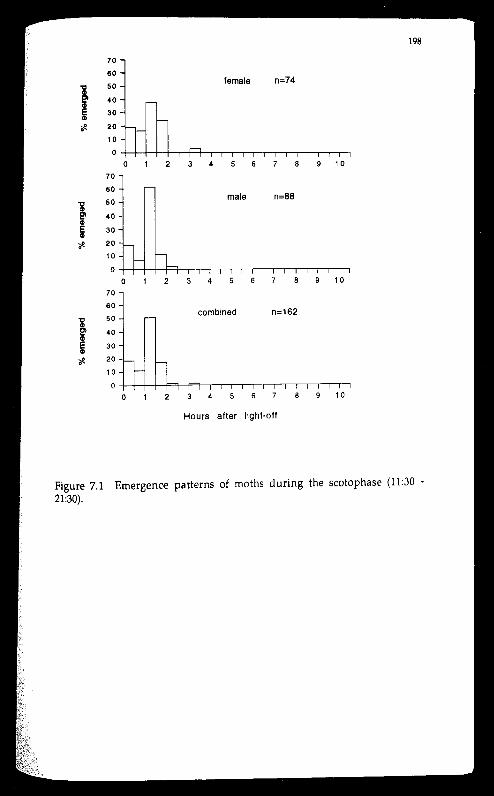
198
70
60
i 50 female n=74
I? 40
~ 30
;Ii. 20
10
0
0 2 4 10
70
60
i 50 male n=BB
I? 40 Cl)
E 30 Cl)
;Ii. 20
10
0
0 2 4 7 10
70
60 combined n=162
i 50
I? 40 Cl)
E 30 Cl)
;Ii. 20
10
0
0 2 3 4 1 0
Hours after light-off
Figure 7.1 Emergence patterns of moths during the scotophase (11:30 -21:30).

199
20
Cl .!! 15
B i 10
t:
~ ofi.
0
0 4 7 20
Cl .!ii 15 1ii E i 10
t:
~ :.!! 0 n=153
0 4 10 20
Cl 15 .5' ~ n=116
~ 10
.5 ofi.
0
0 2 4 10
Hours after light-off
Figure 7.2 Diel patterns of female calling, mating and egg-laying in the
scotophase (11:30 - 21:30).

200
1 0 0
~ 0 0 0
9 0 0 II
A 0 0 0
8 0 0 0
~= 8 0
~1 8 0 0 0 0 § 0 § 0 0
u .&: 7 0 § 0 0 og 0 0
~ § 0 . ~ 0
~ 0 0 0
E ! 6 8 @ ~ 0 0
= 'i 0 ~ ~ 0 0
'" .. 5 0 0 ~ 0 0 ~:; § 0 § 0 0 0 !'l _g 0 0
4 0
Ul - 0 (l 0 0 0 0
3 0 0 0 8 0
0
2 .----, 0 2 4 6 B 1 0 12 1 4
Moth age (days)
Figure 7.3 The effect of age on the time of initial calling. A. Raw data; B.
Means, bars indicate standard errors.

active
rest
active
rest
active
rest
virgin female
201
LIU__ L____J~Ln
r-~~--,~~~---,-~~--~~~~--.-~~~~~~~
0 100 200 300 400 500 600
Minutes after light-off
Figure 7.4 Typical rhythms of physical activities of virgin female, mated
female and male in group confinement in the scotophase.

"' " 0 'f 0 a. e a. a.
202
0 male ~ virgin female Cl mated female
intensity maxmum duration
Figure 7.5 Comparisons among males, virgin females and mated females in
the intensities of physical activities and maximum durations of nightly
activity bouts.

203
"' ta 0.2 ~ D Male ! .E IZI Virgin female ! 0.15 ;:, c:J Mated female c ·~
"' Q) 0.1
~ Ill
0
"' 0.05 c .Q t:: 0 c. e
Cl. 0
0-3 3-7 7-1 0
Hours after light-off
Figure 7.6 Diel patterns in the intensities of physical activities of males,
virgin females and mated females.

204
~ 0.14 i! _,,._male
.~ 0.12 ,Q ·····O···· virgin female
~ :i c: 0.1 .E .;, ii) 0.08 0, > ·.;:
" .,,
~ 0 0.06
Ul c: 0 0.04 '€ 0 0 c. e 0.02 a.
0 2 3 4 5 6
Days after eclosion
Figure 7.7 The effect of age on the intensities of physical activities of males
and virgin females.

205
Chapter 8
Effects of Host Volatiles on the Orientation of Larvae and Adults
and Host Acceptance by Gravid Females of Hypsipyla robusta
Moore
8.1 Introduction
Host plants of phytophagous insects are restricted in space, time, and
species. At a given time and space, the insect must find the appropriate
plant species in the often diversified plant communities to ensure the
success of its future generations. The task appears to be challenging for
oligophagous insects as their hosts are restricted to a few closely related
plant species. A typical example of an oligophagous insect is Hypsipyla
robusta Moore. In Australia, only one host plant, the Red Cedar (Toona
australis (F. Muell) Harmes), has been reported. Elsewhere in the world, a
few related species are attacked (Entwistle, 1967). In natural ecosystems, Red
Cedar is distributed in isolated locations and nowhere forms pure stands.
Yet the insect is able to colonise effectively its much-scattered resource.
More strikingly, almost any plantations of Red Cedar, regardless of their
location, are plagued by the pest. The highly effective host utilisation
pattern suggests that H. robusta possesses effective host-finding capabilities.
Host finding in phytophagous insects consists of ii sequence of
behavioural responses to an array of stimuli associated with host and non
host plants, which the insects are equipped with sensory receptors to
perceive (Visser, 1986). Plant stimuli involved include, in varying
proportions, visual, mechanical, gustatory, and olfactory characteristics. The
sequence of host finding is usually categorised into: host-habitat location,
host location and host acceptance (Ramaswamy, 1988). However, the
boundaries of the successive steps are not always clear. For this reason, some
authors .r~voured the simple division of pre-alighting and post-alighting for

206
the host-finding process of flying insects (Jones, 1992). Different sets of
sensory cues may be involved at different stages.
Although the roles of visual cues cannot be ruled out, host volatiles
appear to be the most likely sensory cues involved in the pre-alighting stage
of host finding by moths (Ramaswamy, 1988). The plant volatiles involved
may be specific or general in nature (Visser, 1986). Species-specific plant
volatiles arise from the breakdown of secondary plant substances, as in the
formation of isothiocyanates from the non-volatile glucosinolates in
Cruciferae (Finch, 1980). Olfactory responses of most oligophagous insects
are influenced by specific plant volatiles (Ramaswamy, 1988). General plant
volatiles are formed via biosynthetic pathways generally preseI. in the
plants, such as leaf alcohols, aldehydes, and derivatives from unsaturated
fatty acids (Visser et al., 1979). Ratios of the components of general plant
volatiles affect the olfactory responses of a number of insects (Visser, 1988).
Theoretically, three categories of behavioural responses assist an
insect in finding an odour source, namely chemotaxis, chemokineses, and
odour-mediated anemotaxis (Shorey, 1973). In chemotaxis, the insect aligns
its body in the direction of the odour source as a result of being able to sense
directly the gradient of odour molecules. In chemokineses, the insect does
not detect the direction of the odour gradient but instead is stimulated to
move at different rates (orthokinesis) or to turn at different frequencies
(klinokinesis) by changes in the local concentration of odorous chemicals.
Neither chemotaxis nor chemokinesis alone is sufficient for locating a
distant odour source but may be useful in guiding the insect to the nearby
host plant, arresting the insect in the vicinity of the host plant, or helping it
to track the odour plume (Kennedy, 1977). Odour-mediated anemotaxis, i.e.
up-wind flight or walk that is stimulated by host volatiles, appears to be the
only mechanism by which an insect can orientate to its distant host plants
(Kennedy, 19':'7). Such an orientation behaviour has been demonstrated in
many i115ects, including a few moth species (Ramaswamy, 1988). The

207
effective distance within which an insect can detect the responsible host
volatiles depends, among other factors, on the rate of emission of volatiles,
wind velocity, and the sensitivity of the olfactory receptors of the insect
(Wilson, 1970). However, the exact distances remains practically unknown.
The only seemingly authentic distance is 15 m recorded by Hawkes (1974) for
Erioischia brassicae. Despite its importance, odour-mediated anemotaxis is
by no means the only mechanism responsible for long-range host finding by
nocturnal insects. As pointed out by Thorsteinson (1960), the insect may
search randomly and arrive by chance at the vicinity of the host plant and
use vision or other olfactory mechanisms, such as chemokinesis or
chemotaxis, to land on the plant. This may explain the lack of evidence of
upwind movements toward the host plants in some oligophagous moths
(Fenemore, 1988).
Olfactory deterrence may also be involved in host finding. For
example, Shurr and Holdaway (1970) showed that volatiles emanating from
infested plants ensure dispersal of Ostrinia nubilalis females from them,
while odours from uninjured plants are attractive to the females. Renwick
and Radke (1982) also found that larval damage to the host cabbage plant
caused reduced landing by Cabbage Looper (Trichoplusia ni) females.
However, a recent study by Landolt (1993) indicated that the females were
actually attracted to damaged plants in wind tunnels but laid fewer eggs on
them compared with healthy plants. It thus seems that damage by larvae
attracts the Cabbage Looper in the distance but repels them at close range.
Volatiles from non-host plants may disrupt the normal host
searching behaviour of oligophagous insects (Kareiva, 1983; Stanton, 1983).
Tahvanainen and Root (1972} found that tomato plant odour interfered
with the ability of flea beetles to locate their crucifer hosts. Similarly, Altieri
et al. (1977) noted that the ability of Empoasca kraemeri to locate hidden
bean foliage was inhibited by placing grass cuttings with host plant material.
Odour from some non-host species repels approaching potato beetles

208
(Leptinotarsa decemlineata) (Visser and Nielson, 1977). However, Finch
(1980) cautioned that many of these results are subject to alternative
explanations.
After landing on a potential host plant, the gravid moth would
evaluate the suitability of the plant or plant parts based on an array of
sensory information at the plant surface. Combinations of physical and
chemical factors are involved in the evaluation process. The majority of
moth species seems to prefer hairy or rough surfaces (Ramaswamy, 1988),
possibly because hairy surfaces allow the female to maintain a better footing
and retain the eggs better than smooth surface (Callahan, 1957; Porter, 1984).
A recent detailed study of leaf surface characteristics affecting oviposition by
Heliothis virescens has emphasised the role of growth habit (erect vs
procumbent) as well as texture (Navasero and Ramaswamy, 1991). Contact
chemoreception is considered as the major and most common sensory
modality involved in host acceptance (Ramaswamy, 1988). Chemoreception
in Lepidoptera is perhaps best illustrated in the 'drumming' behaviour of
butterflies. in which the forelegs move rapidly :;o that the terminal
segments of the tarsi drum against the leaf surface (Feeny et al., 1983). The
drumming behaviour is suggested as an act of scraping the leaf surface to
release chemicals that subsequently would be picked up by chemoreceptors
located on the fore-tarsi. For moth species, the perception of surface
chemicals can be performed by any of the following appendages: antennae,
tarsi, proboscis, and ovipositors (Ramaswamy, 1988). Ramaswamy et al.
(1987) showed that the presence of one pair of intact tarsi is sufficient for
host plant discrimination by H. virescens. Rivet and Albert (1990) have
shown with ablation experiments that the Spruce Budworm (Choristoneura
fumiferana) depends on its proboscis for perception of chemicals in the wax
layer. In addition to contact chemicals, volatiles may also be involved in
host acceptance, both in the selection of food (Mitchell and McCashin, 1994)
and in choosing egg-laying substrates of adults (Yamamoto et al., 1969).

209
Apart from stimulating chemicals in host plants, host-specificity in
phytophagous insects may also arise as a result of the existence of deterrent
chemicals in non-host plants. An oviposition deterrent for a Rutaceae
feeding butterfly, Papilio xuthus, has been reported from a non-host
rutaceous plant (Nishida et al., 1990). The Cabbage Butterfly (Pieris rapae)
refuses to lay eggs on a plant that contains an oviposition stimulant when a
potent deterrent is present (Renwick and Radke, 1987). Sometimes,
deterrent chemicals are also found in acceptable plants (Renwick and Radke,
1985). In this situation, the concentration ratios of stimulants to deterrents
may affect the acceptability of a plant. Changes in the ratios may occur as a
result of different growing conditions and the ratios is likely to vary
according to plant age and the vegetative stage of selected foliage (Renwick
and Chew, 1994).
Different sensory cues often act synergistically in regulating host
selection behaviour of insects. Oviposition of swallowtail butterflies is
elicited by the combination of a number of chemical compounds (Feeny,
1990). Individual compounds elicit either weak oviposition responses or no
responses at all. Feeny et al. (1989) found that females of Papilio polyxens
laid more eggs on model plants treated with a combination of contact
stimulants and volatiles from carrot leaves than they did on plants treated
only with contact stimulants.
Olfactory responses of insects are studied with olfactometers, wind
tunnels, and electrophysiological bioassays. Various types of olfactometers
have been used, such as single-tube olfactometer, Y-tube olfactometer, and
small-arena olfactometer (Finch, 1986). Olfactometers have been used
succe~sfoily in studying the orientation behaviour of a number of moths
(Gupta and Thorsteinson, 1960; Thibout et al., 1982; Palaniswamy and
Gillott, 1986; Khan et al., 1987; Pivnick et al., 1990). Small-arena
olfactometers are commonly used to screen chemicals as larval attractants.
However, larval attractants may also attract adults, a behavioural

210
association thought to be common to many insects (Thorsteinson, 1960).
Ovipositional responses of gravid female moths to plant volatiles are
usually studied with box-like olfactometers, with a large enough arena to
allow the flight of test moths. The latter facilitation is important for moths
that need to fly before responding to host odours. Schurr and Holdaway
(1970) designed such an olfactometer based on an oviposition cage to study
the olfactory responses of female European Corn Borer (Ostrinia nubilalis).
A more sophisticated but similarly designed olfactometer was used by
Mitchell and Heath (1987) in demonstrating an oviposition stimulant of
Heliothis subflexa. Recognising the importance of anemotaxis in the long
range orientation of flying insects, many investigators have advocated the
use of wind tunnels (Renwick and Chew, 1994). Wind tunnels have been
used successfully with a few moth species (Phelan and Baker, 1987; Landolt,
1989; Tingle et al., 1990). In electrophysiology bioassays, the responses of
individual olfactory sense organs or receptors to plant volatiles were
recorded and amplified by electro-antenograms (EAGs). EAG recordings
from a number of volatiles or their fractions are then compared to find the
responsible components or combinations. The technique is often used in
preliminary screening of potential olfactory stimuli. Since only the olfactory
sense organs, usually antennae, are used, the results of EAG recordings need
to be confirmed by additional bioassays involving intact insects (Finch,
1986). Recently, the attraction of the Black Cutworm Moth (Agrotis ipsilon)
to flowers of 25 plant species was found to be correlated with the
corresponding EAG response (Zhu et al., 1993). In field conditions, olfactory
responses of insects are studied with traps of various designs (Finch, 1986).
Grijpma and Gara (1970b) used the so-called field olfactometers to study the
olfactory response of adult H. grande/la, a shoot borer of Meliaceae species in
Latin America. Data from trapping studies need to be interpreted with
caution. The higher number of trapped insects in traps loaded with host
volatiles than are trapped in control traps does not always indicate the
211
attractive potency of the volatiles. In reality, the volatiles may have only
arrested the insects in the vicinity of treatment traps, with subsequent
trivial movements contributing to the trapping of more insects (Finch,
1986).
Host-finding behaviour of H. robusta has never been studied. Host
volatiles from the young foliage have been found to be attractive to adults
(Grijpma and Gara, 1970a) and larvae (Grijpma and Gara, 1970b) of the
closely related H. grandella. It is of interest to see whether host odours play a
similar role in the orientation of H. robusta. In this chapter, this possibility
is assessed, as well as host acceptance by gravid females, based on
preliminary investigations.
8.2 Methods
8.2.1 Insects and plant materials
Larvae and adults were from a laboratory colony maintained since
late 1992 on the artificial diet of Cuilloud and Guiol (1980) (see Chapter 3).
Olfactory responses of females were tested only with the foliage of Red
Cedar. In addition to host foliage, larval orientation and egg-laying were
tested with the foliage of three other Meliaceae species, Spanish Cedar
(Cedrela odorata), Chinese Toon (Toona sinensis), and White Cedar (Melia
azadiraclita var. australasica), one Myrtaceae species, Southern Blue Gum
(Eucalyptus globulus ssp. bicostata), and one Aquifoliaceae species, English
Holly (Ilex aquifolium). Spanish Cedar and Chinese Toon also belong to the
same subfamily as Red Cedar (Swietenioideae). Test foliage of the
meliaceous species was obtained from potted trees in the glasshouse. The
two non-meliaceous species were picked for convenience, as they were
readily available outside the Department of Forestry Building.
212
8.2.2 Orientation of larvae
A novel 4-choice olfactometer was used to study the effect of plant
volatiles in larval orientation. The major components of the olfactometer
(Figure 8.1) were constructed with Perspex tubes of three different diameters.
In the centre was a unit consisting of a circular arena (32 x 22 mm) with a
cover on top, four horizontal choice tubes (42 x 13 mm) attached to the
arena wall through holes drilled at the base at equal angular distances (90°),
and four odour-source tubes (23 x 8 mm) each inserted vertically in the
choice tubes at a distance of 10 mm from the outer ends. The insertion ends
of the odour-source tubes were covered with fine metal mesh. The four-arm
central unit sat on the floor of a circular plastic container (150 x 144 mm)
with a mesh-covered hole (13 mm) in the centre. An air-outlet tube (42 x 13
mm) was attached vertically to the hole from outside. The lower end of the
air-outlet tube was connected with a water-driven vacuum pump. The
plastic container was fitted with a Perspex cover with an air-inlet tube in the
centre. Test materials were placed in the odour-source tubes which were
then covered with rubber caps. Powered by the vacuum pump, air from
outside was pulled into the plastic container through the air-inlet tube and
then into the central arena through the four choice tubes, carrying with it
odours from the test materials, and then passed through the outlet tube at
the bottom. Test larvae were directly placed on the floor of the central arena.
Larvae of the 4th-6th instar (excluding those in the blue stage) were
used to test orientation responses to host and non-host volatiles. Leaves of
the six plant species were tested either independently or in groups of four.
In independent tests, two oppositely positioned odour-source tubes were
packed with plant leaves and the other two left blank. In group test, leaves
of Red Cedar, Spanish Cedar, and Chinese Toon were tested together with
leaves of either White Cedar, Southern Blue Gum, or English Holly. In each
tests the four plant species were randomly assigned to the four odour-source
tubes. The amount of plant material loaded was such that each odour-

213
source tube was fully packed. Each loading of plant materials was tested on a
maximum of 10 larvae. Between successive loadings, the odour-source
tubes were washed with light petroleum ether (bp 60°C). Larvae were tested
individually and observed for a maximum of 5 minutes. Larvae that did not
enter any of the four choice tubes within 5 minutes of introduction were
removed and replaced with new ones. A minimum of 38 larvae was tested
in independent tests of each plant species. In group tests, each combination
of four plant species was tested with at least 64 larvae. Two criteria were
used to assess the larval responses to plant odours: (a) entering into a choice
tube and (b) contacting with the mesh separating the choice tube and the
corresponding odour-source tube.
8.2.3 Orientation of adults
¥-tube olfactometer
A simple glass Y-tube (internal diameter 2 cm) olfactometer (Figure
8.2) was used to study walking anemotaxis of the females. The length of the
stem section was 31 cm and that of the 2 arms 19 cm. The angle between the
two arms was 60°. Connected with each of the 3 openings of the Y-tube was a
plastic vial (50 x 40 mm) with a hole the size of the Y-tube drilled in the
centre of the floor. The plastic vial attached to the stem of the Y-tube was
used for moth introduction and that to each of the two arms for moth
recovery. A short tube (length 2 cm, internal diameter 0.8 cm) was inserted
through the cap of each of the plastic vials and stuck in position. An odour
delivery system was connected to the Y-tube through these tubes. The odour
delivery system consists of a tank of compressed air, a charcoal filter, and an
Erlenmeyer flask used to place test materials. Air from the compressed air
tank first passed through the charcoal filter and then divided into two
streams, one going directly to one arm of the Y-tube and the other passing
through the Erlenmeyer flask before going to the other arm of the Y-tube.
214
Virgin females of ~ day-old and gravid females mated within the
last two days were used to study walking anemotaxis. Moths were tested
individually. After the introduction of the test moth, the cap of the
introduction vial was closed. The host tissues tested were young shoots with
leaves, mature leaves, and tree stems. The amount of host tissue placed in
the odour-source flask was not fixed but was enough to generate distinctive
host odour in the exit air. The test tissues were replaced with fresh ones
once the distinctive smell disappeared (after about one hour). Each moth
was observed for a maximum of 10 minutes and the arm of the Y-tube into
which the moth initially walked was recorded. Moths that did not walk into
either of the two arms within 10 minutes of introduction were removed
and replaced with new ones. A minimum of 50 virgin females and 30
mated females were tested with each of the three types of host tissues. After
each test run, the treatment and control arms were swapped by changing the
connection of the air-delivery tubes. All tests were conducted in the first
four hours of the scotophase. Observation was facilitated by a 20-watt red
fluorescent light. The red light was placed in front of the Y-tube, with each
arm receiving a similar amount of light. The speed of the air flow inside the
Y-tube was controlled at 0.5-1 m /s through a valve fitted to the compressed
air tank.
Wind tunnel
Flight anemotaxis of the females was studied in a wind tunnel
housed in an air conditioned room (24 ± 1 °C). The wind tunnel was a clear
acrylic box (0.7 x 0.7 x 1.8 m) fitted with a blower fan at one end and an
exhaust fan at the other. Exhaust air was vented out of the room housing
the wind tunnel. Light intensity inside the tunnel was controlled at about 1
lux and the speed of air flow at about 0.5 m/s. A screened cylindrical cage (70
x 65 mm) containing fresh young leaves and shoots of the Red Cedar was
placed on a 30 cm tall metal stand standing at 30 cm from the upwind end in

215
the centre line. Another metal stand of the same height was similarly placed
at the downwind side and used for releasing the test moths. The test moth
was transferred to a screened cage before being released on the metal stand.
Each moth was observed for a maximum of 30 minutes. A total of 32 virgin
females and 15 mated females were tested in the wind tunnel. Data recorded
were whether the moth tracked the odour plume (flying toward the odour
cage) and/or landed on the odour cage. All tests were conducted at the first 4
hours of the scotophase.
8.3.4 Oviposition
Host selection by gravid females was studied in a modified
oviposition cage (Figure 8.3). The body of the cage was constructed with four
clear acrylic Perspex panels (500 x 250 mm). Two holes (150 mm diam.),
separated by a centre distance of 260 mm, were drilled on both the top and
bottom panel. The top two holes were covered with cheese cloth and the
bottom two holes left open.
The test foliage was compound leaves, or branchlets in the case of
Blue Gum and English Holly, each retaining the top nine leaflets or leaves.
They were cut to a length of about 50 cm and inserted into the cage through
the two uncovered holes. To slow down water loss, the lower part of the
foliage was wrapped with cotton wool and placed in a beaker containing
some water. Two hollowed styrofoam boxes, in which the beakers were
placed, were used to support the cage, with the uncovered holes facing the
open ends of the supporting boxes. The holes were then closed with paper
towels.
In each test, the host foliage was paired with the foliage from a non-
host plant. The host and non-host foliage, two compound leaves or
branchlets from each species, was piaced in the same beakers to prevent
possible location effects. Five to eight females mated the night before were
released into the cage one hour before the start of the scotophase and kept
216
there for 10 hours in darkness. The number of eggs laid o.I\ ,;;ch species was
counted after the test. Three tests each were run comparing \1), foliage of the
host with that of Spanish Cedar and Chinese Toon. Testo. .nvolving the
foliage of White Cedar, Southern Blue Gum, and English l!JHy were each
replicated 5 times.
A similar bioassay set up was employed to examine the effect of host
volatiles in eliciting oviposition. Four compound leaves of the host were
placed in one beaker in water-saturated cotton wool. Direct contact with the
host foliage by the test moths was prevented by enclosing the foliage with a
PVC tube (235 x 160 mm). Holes (55 mm diameter) were drilled around the
tube wall to allow the dispersal of host volatiles into the cage arena. The
tube was then wrapped with cheese cloth. Another such tube was placed
over the other beaker but no plant materials were placed inside. To
standardise the conditions of the two tubes, the beaker below the blank tube
was also provided with water-saturated cotton wool. Five females mated the
night before were released into the cage one hour before the start of the
scotophase and allowed to oviposit for 10 hours in darkness. The number of
eggs laid on the cheese cloth of each tube was counted. Five replicates were
run.
8.3.5 Statistical analyses
Data from the 4-choice larval olfactometer and Y-tube olfactometer
were analysed with the 'prop.test' function of 5-Plus (Everitt, 1994). The test
statistic used was Pearson's chi-square. In assessing the attractiveness of
odour from a particular plant species in individual tests against the control
(blank) in the 4-choice larval olfactometer, the proportion of larvae entering
either of the two treatment choice-tubes (associated with plant material) was
compared with that of larvae entering either of the two control choice-tubes.
In simultaneous tests of the relative attractiveness of odour from four
different plant species, the proportions of larvae entering individual choice-

217
tubes were tested against the null hypothesis that the four choice-tubes
attracted equal numbers of larvae. With data obtained with the Y-tube
olfactometer, the proportions of larvae entering the treatment and control
arms were compared. Differences in the number of eggs lilid on the foliage
of different plant species in dual-choice tests in the oviposition cage were
not compared statistically, since the total surface areas of the test foliage
were not strictly controlled.
8.4 Results
8.4.1 Orientation of larvae
Choice tubes associated with voung leaves of the four meliaceous
species and Southern Blue Gum attracted significantly more larvae than
blank tubes in independent tests (P< 0 llS) (Figure 8.4). Over 75% of larval'
entering the treatment tubes came into wntact with the mesh separating thl'
choice tube and the odour-source tube and often stayed there for some timt·
The percentages were less than w:;, for larvae choosing the blank tubl''
However, odour from young leaves of English Hollv showed little effect 1n
attracting the larvae, with a similar number of larvae entering treatment
tubes (23) and blank tubes (18) (P> 0.IJS, chi-square test) (Figure 8.4); no larval'
were seen staying close to the plant material. The lack of attractance of
English Holly was also evident 111 group tests (Figure 8.5, Group 3J. When
young leaves of the four meliaceous species were tested together, Red Cedar
attracted the highest number of larvae. followed bv Spanish Cedar, Chrnese
Toon, and White Cedar (Figure 8 5, Group 1) However, the distribution rn
the number of larvae entering the four choice tubes was not s1grnhcantlv
different from random (P> 0 05) The preference order changed when the
three Swietenioideae species and one pf the two non-meliaceous species
were tested simultaneous!\· Group test;; 1nrnl\'ing the Southern Blue Gum
showed it was the most attractl\·e species. followed bv Sparnsh Cedar, Red
Cedar and Chinese Toon (Figure 8.5. Gwup 21 In group tests !l1\'0l\lng the
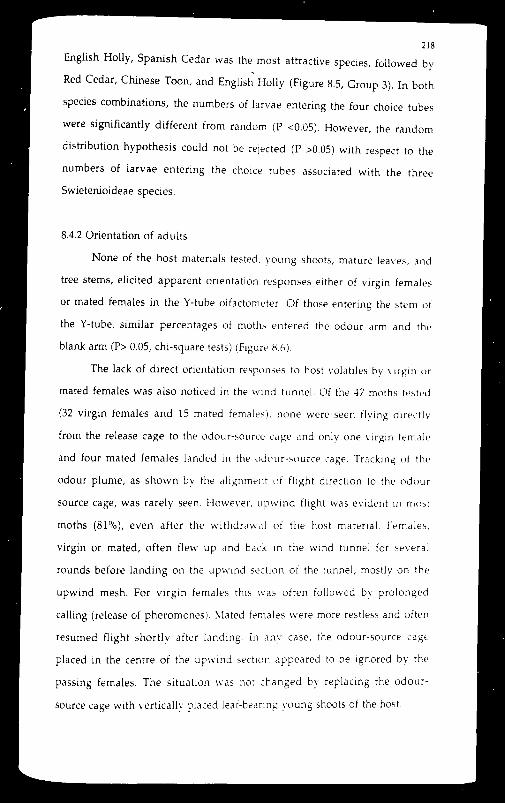
218
English Holly, Spanish Cedar was the most attractive species, followed by
Red Cedar, Chinese Toon, and English Holly (Figure 8.5, Group 3). In both
species combinations, the numbers of larvae entering the four choice tubes
were significantly different from random (P <0.05). However, the random
distribution hypothesis could not be rejected (P >0.05) with respect to the
numbers of larvae entering the choice tubes associated with the three
Swietenioideae species.
8.4.2 Orientation of adults
None of the host materials tested, young shoots, mature leaves. and
tree sterns, elicited apparent orientation responses either of virgin females
or mated females in the Y-tube olfactometer. Of those entering the stern nt
the Y-tube, similar percentages of moths entered the odour Mm and tht·
blank arm (P> 0.05, chi-square tests) (Figure 8.6).
The lack of direct orientation responses to host volatiles by virgin or
mated females was also noticed in the wind tunnel. Of the 47 moths tl•stc>d
(32 virgin females and 15 mated females). none were seen flyrng dirc>ctlv
from the release cage to the odour-source cage and only one virgin female
and four mated females landed lI1 the ndcur-source cage. Trcckrng of tht•
odour plume, as shown by the alignment of flight direction to the odour
source cage, was rarely seen. However, upwmd flight was evident lI1 mmt
moths (81%), even after the withdrawal of the host material females,
virgin or mated, often flew up and back m the wrnd tunnel for several
rounds before landing on the upwlnd section of the tunnel, mostly on the
upwind mesh. For virgin females this was often followed bv prolonged
calling (release of pheromones). \fated females were more restless and often
resumed flight shortly after landmg in anv case, the odour-source cage
placed in the centre of the upwind section appeared to be ignored bv the
passing females. The situat10n was not changed by replacmg the odour
source cage with verticallv placed leaf-bearing 1·oung shoots of the host.

219
8 4.3 Oviposition
Eggs were readily laid on the young foliage of the three non··host
meliaceous species as well as on that of the host in dual-ch0ice tests (Table
8.1). The percentages of eggs laid on the non-host foliage varied between 35 -
56%. Tests involving none of the three non-host meliaceous species showed
consistently more eggs on the host foliage. Significance tests on the
differences were not attempted as the total surface area of the test foliage was
not controlled. Preference toward the host foliage was apparent when the
latter was paired with the foliage of either Southern Blue Gum or English
Holly (Table 8.1). Of all the eggs laid on the test foliage, over 77% were found
on the host foliage. No eggs were found on the non-host foliage in two tests,
one involving Southern Blue Gum and one English Holly
The presence of host volatiles did not always result in an increasl's in
the numbers of eggs laid on the cheese cloth covering the odour source tubl'
(Figure 8.7). Of the five tests conducted, three showed more eggs on trw
odour tube and two showed more eggs on the blank tube. Most eggs Wl'fl'
found along the edges of the oviposit1on cage rather than on the pro\·1dl'd
egg-laying substrate.
Discussion
Host volatiles appeared to be ln\'l>lved ln larval orientation to host
plants. However, the responsible \·olatile constituents were not restricted to
the host plant, as seen in the attractiveness of voung leaves of White Cedar
and Southern Blue Gum. Lar\'ae of H. ro/irista may respond to the so-called
general green leaf odour as defined bv \'1sser ct al. (1979) rather than to
species-specific volatiles. The lack of response to voung lea\·es of English
Holly could be due to a lower release rate rather than to the absence of the
general leaf volatiles in that plant Young lea\·es of Southern Blue Cum
appeared to be more attrach\·e to the lan·ae than to those of the host
Eucalypt leaves are generallv rich ln esot>nt1al 01ls !Boland et ul, 1991 I and

220
odour from the young leaves of Southern Blue Gum was noticeably
stronger than that from the Red Cedar. It is of interest to investigate
whether the essential oils of eucalypts contain those volatile components of
Red Cedar that are attractive to H. robusta larvc.e.
Entrance to the odour-laden choice tubes from the central arena of
the larval olfactometer can be explained by odour-mediated anemotaxis.
Most larvae were seen raising their heads to the entrances of the choice
tubes to face the air streams while walking around the central arena before
climbing into one of them, possibly in an attempt to locate the right odour
The responsible plant volatiles also appeared to have an arresting effect on
the passing larvae as they tended to stay in contact with the mesh separating
the odour-source tube from the corresponding choice tube.
Neither virgin females nor mated females showed apparent
directional responses toward host volatiles in the Y-tube olfactometer,
regardless of the odour sources tested, 1.e voung leaves, mature lt>av1.",, or
tree stems. However, upwind walking wa> evident in moths that h.id
moved from the introduction vial into the stem of the olfactometer The
lack of straightforward response to thl' source of host volatiles was al,o
found in the wind tunnel, where flight of the test moths was allowed
Although the test moths generally flv upwmd, most of them ignored the
odour source and chose to land elsewhere in the upwind section.
Oviposition tests indicated some degree of host discrimination 1n
gravid females. Although leaves of the three non-host meliaceous plant<,
were accepted as egg-laying substrates as readilv as the host leaves, the
females apparently did not like the lea\·es of the two non-meliaceous plants
Discrimination appeared to be based on contact stimuli, as the tests were
conducted in darkness and the presence of host volatiles did not result 111
significant increases of eggs laid on the test substrate The role of contact
chemical cues was not inHst1gated, but mechanoreceptive cues appear to be
involved. Leaves of the meliaceous plants Me soft and similar m texture.

221
whereas those of Southern Blue Gum are waxy and those of English Holly
leathery. Further evidence for the involvement of mechanoreceptive cues
was shown in the congregation of eggs along the edges of the oviposition
cage.
Several factors may explain the lack of direct responses of females to
host odour sources. First, female of H. ro/111st<1 may rely on the provision of
a combination of host olfactory cues rather than individual olfactory cues
presented in this study to orientate to its host. Synergistic effects of chemical
sensory cues are well documented in phvtophagous insects (Visser, 198ti;
also see Renwick and Chew, 1994). In the extreme case, the insects reSf>Dnds
only to the full blend of necessary stimuli (Visser, 1986). A study of the
closely related H. grandella 111dicates that volatiles from acetone extracts ot
young leaves of C. odorata were meffective in attracting the moths when
provided alone, but the addition of potted host plants beanng onlv matun'
leaves in the olfactory traps resulted in sigrnficantly more catches (l;,ua l°I
al, 1973).
Secondly, the moths may need a J,1rge manoeuvnng space to l'xprl'S'>
their normal orientation behaviour. In odour-mediated anemotaxis, moths
usually fly upwind in a zig-zag wav 1n approaching the host (Kennedv,
1983). This behaviour is considered as necessarv for the moths to keep track
uf the odour plume. In the Y-tube olfactometer, castmg back into the odour
plume is prevented by the tube wall once the moth has entered the wrong
arm. The only way it can return to the l)dour plume is bv walking back to
the stem tube and entering another arm, which was observed 111 a number
of moths. In the wind tunnel. although the moths could flv, their
movements were still constrarned bv the tunnel walls This art1fic1allv
imposed restriction might have influenced the orientation behav·1our CJt
this insect. Also, the wav host n1latiles are pro\·ided 111 the wind tunnel
may be quite different from that percen·ed bv the 111sects 111 nature Insect
searching behav10ur in the field mav· be verv different from that 111 an

222
artificial environment. Field observations often reveal phytophagous
insects wandering past host plants, departing high-quality plants, or simply
wandering about in a seeming! y random manner (Morris and Kareiva,
1991). Clearly these variations have to be taken into account before
designing an appropriate bioassay.
Thirdly, orientation behaviour of phytophagous insects to host
volatiles may be different from that of males to female pheromones.
Among moth species, typical odour-mediated anemotaxis with
characteristic odour-plume tracking has so far been documented only in
Amyelois transiteel (Phelan and Baker, 1987), Hcliot!1is uirescens (Tingle ct
al., 1990; Tingle and Mitchell, 1992), H. suliflcxa (Tingle et al, 1989, 1990), and
Trichoplusia ni (Landolt, 1989). It is possible that many more moth species
have been subjected to the study of odour-mediated anemotaxis but tht>
negative results were not published. Different searching strategies are
needed since plant volatiles are complex in composition and usually are nut
species-specific. Instead of acting as attractants, host volatiles may function
as arrestants to host-seeking females and thus restrict their searching to the
immediate vicinity of host plants (Finch. 1986). Douwes (1968) found that
females of Cidaria albulata showed straighter flights and lower alighting
frequencies outside host habitats than 1ns1de and oriented back towards the
host habitat when out of it. Subsequent locating of host plants may be
assisted by visual and contact stimuli Although gravid females of fl
robusta did not seem to respond discrimrnatelv to host odour, they were
able to allocate more eggs on host foliage than on that of some non-host
species, such as Southern Blue Gum and English Holly, in dual-choice te'>ts
in the oviposition cage. Discrimination 1n this case was probably achieved
through contact evaluation with the possible involvement of
mechanoreceptive cues, as discussed abo1·e Furthermore, larval olfactorv
tests showed that volatiles of Southern Blue Gum were in fact quite
attractive to larvae. Volatiles of voung foliage were claimed to be attracti1 e

223
to females in H. grandella (Grijpma and Gara, 1970a; Gara et al., 1973), but
the claim was based on data of field trapping. As pointed out by Finch (1986),
such data offer no insight into the behavioural aspects of host finding. The
trapping of greater numbers of females in cages baited with the young
foliage of the host plant may be a result of the arresting effects of the host
material rather than of its attractive properties.
Finally, host-specific volatiles may not be involved in the host
finding process and host selection is through other sensory cues. One such
sensory cue is probably light intensity. Although visual discrimination of
host plants appears to be unlikely in rnght flying moths, changes m light
intensity may affect locomotory activitv and cause moths to disperse or
enter a search mode (Ramaswamy, 1988). ln addition, not all nocturnal
insects select their hosts in the middle of the night. Gravid females of fl
grandella concentrate their egg-laying activities m the evenmg or earlv
morning (Wilkins, 1972; Holsten, 1977). Thev are probably able to use soml'
visual cues from their host plants. Host selection can also be achievl'd bv th,•
combination of random dispersal and contact evaluation of encounll'rl'd
plants. Saxena (1969) pointed out that host-plant location mav be es><•ntiallv
by random, or at least undirected, mo\'t'ment, so that contact with su1tabl<·
plants is by chance or bv orientation 111 response to some pl·rn•i\·l'd
properties of the plant. Females of 11 gm11dcl/11 do not usually disperse out
of existing infestation areas (Gri1pma and Gara, l 970a) and onlv a fl'W <:gg..,
were laid in each tree (Grijpma, 1974). li 11 ro/iusta behave sim!larlv ao 11
grandella, then the high cost im·ol\·ed 111 random search111g mav be offset,
to some extent, by the tendencv of the moths to remam in the discovered
host habitat. Furthermore, the chance of a gra\'Jd female laving eggs on ho>.,t
plants in a diverse plant commurut\' would be enhanced bv its scattered egg-
laying strategy.
Based on the models ot Kogan (1977), Ramaswamv il%M1
conceptualised four models of host f111d111g 111 moths. Class1f1ed w1thm

224
model II are some oligophagous insects that use non-directional cues, such
as visual, textural and contact chemoreceptive cues, for host discrimination.
For these insects, long range olfactory cues are generally not involved and
short range olfactory cues, if used, are not species-specific. H. robusta appears
to fit into this category. However, this study is only exploratory and many
more studies are clearly needed before we can obtain a clearer picture of the
host finding process of the insect.
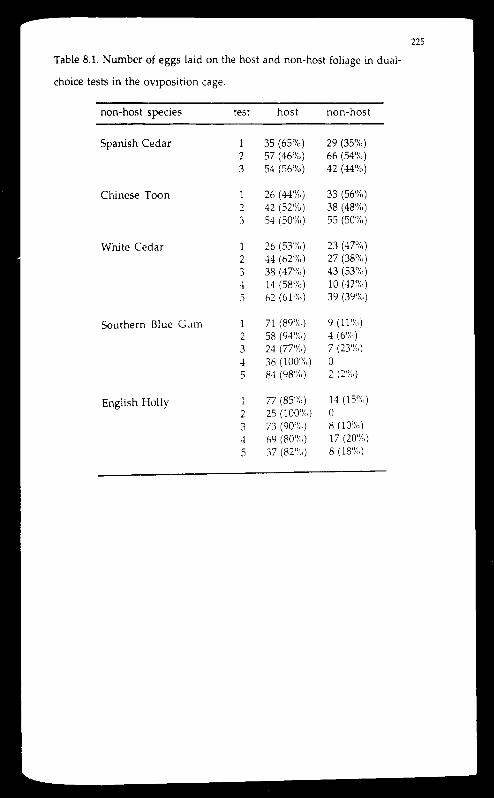
225
Table 8.1. Number of eggs laid on the host and non-host foliage in dual-
choice tests in the oviposition cage.
non-host species test host non-host
Spanish Cedar 1 35 (65%) 29 (35%) 2 57 (46%) 66 (54%) 3 54 (56%) 42 (44%)
Chinese Toon 1 26 (44%) 33 (56%)
2 42 (52%) 38 (48%) 3 54 (50%) 55 (50%)
White Cedar 26 (53%) 23 (47%)
2 44 (62%) 27 (38'Y.,)
3 38 (47%) 43 (53%)
4 14 (58%) 10 (42%)
5 62(61%) 39 (39%)
Southern Blue Gum 1 71 (89%) 9 (11%)
2 58 (94%) 4 (6%)
3 24 (77%) 7 (23%)
4 36 (100%) 0
5 84 (98%) 2 (2(~~))
English Holly 77 (85%) 14 (15%)
2 25 (100%) 0
3 73 (90%) 8 (10%)
4 69 (80%) 17 (20%)
5 37 (82'~o) 8 (18%)
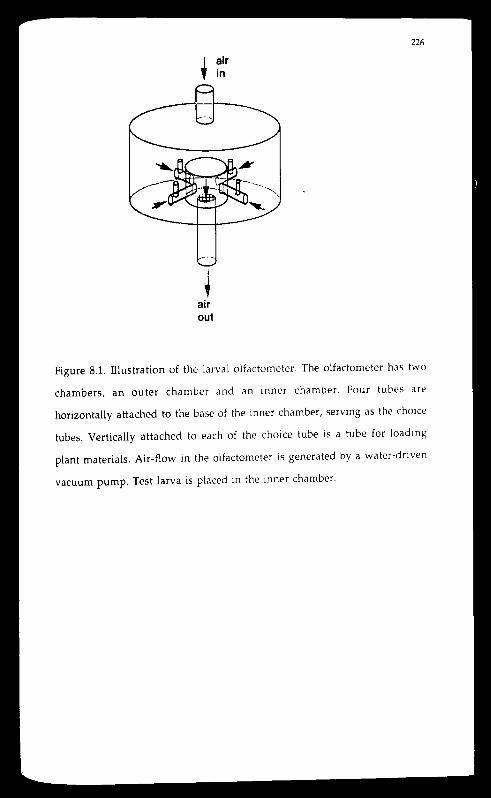
~ air out
226
Figure 8.1. Illustration of the larval olfactometer. The olfactometer has two
chambers, an outer chamber and an inner chamber. Four tubes are
horizontally attached to the base of the inner chamber, serving as the choice
tubes. Vertically attached to each of the choice tube is a tube for loading
plant materials. Air-flow in the olfactometer is generated by a water-driven
vacuum pump. Test larva is placed in the inner chamber.

moth introduction vial (screw-on cap) •
5 0
"8
Figure 8.2. Illustration of the Y-tube olfactumeter

beaker
water
cheese cloth oviposrtion cage
Figure 8.3. Illustration of the bioassay set-up for studying the effect of ho;,\
volatiles in stimulating egg-laying. In studying the acceptance of leaves ut
different plant species, the PVC enclosures were not used and both beakers
were inserted with leaves.

229
ISl treatment arms D blank arms
Q)
"' ~ .!!! 30 0 Q;
.D. 20 E :'l z
1 0
0
Figure 8.4. Number of larvae entering the treatment tubes (plant odour) and
the control tubes (no plant odour) in the -t-cho1ce larval olfactometer

a; ..a E :::l z
• RedCedar
~ Spanish Cedar
ISJ Chinese Toon 30 ------
~
j 0 +- --
Group 1
230
D White Cedar
EJ Southern B'.ue Gum
B English Holly
Group 3
Figure 8.5. Number of larvae entenng tuliL» 'upplied with ndour nt 1,·,n<''
of different species in the 4-chrnce larval nltal'tl1meter

231
~ odour arm D blank arm
35 ----· virgin females mated females
30
"' Q) 25 (ii E 2 20 0 Q; 1 5
f1 ..0 I: E 1 0 ::i '· z
I
I· I:
5 I I
J I 1.
0 - L_ !
young mature tree young mature tree
shoots leaves stems shoots leaves stems
Figure 8.6. Number of females choosing the odour and non-odour arm ot
the Y-tube olfactometer. The odour sources tested were young shooh.
mature leaves and tree stems of Red Cedar

232
f2}J odour tube D blank tube
35 ' ' '
30 '• e c
25 ' ,,, Cl Cl Q)
20 f-
0 a;
..Cl 15 E ::i z
1 0
5
0
test-1 test-2 test-3 test-4 test-5
Table 8.7. Number of eggs laid on the cheese cloth covering the PVC tubl'
with young Red Cedar leaves in and on that covering the blank PVC tubt•

Chapter 9
General Discussion
In this work, a number of important l'COlogic.11 ,111d b,,h,1\·i,1ur,1I ,1,,pL'Ch
of II. ro/111sl11 l\'tls im·estigated. These inclULkd tempor,11 ,111d ,,p,1ti.ll p,1ttL'rlb ,>1
infesL1tion (Chapll'r 1), ,irtificial rearing (Ch,1ptL'r .+). tL'l11f1l'r,1turl'-dL'f'L'nd,·nt
den·lopml'nt (Chapter 'i), feeding lwha\·iour ol IM\ ,w 1Ch,1pll'r hi. dil'I 11,1tlL'lll'
of rl'productin· ,icti\·ilil':. of ,1dulh (Chaf11L'r 71, .lnd L>li,llll1n l'l''i"''1tN'' ,11
lar\'<ll' and adults ,rnd ho:.t acCL·pt,111Cl' b\· gr,n·id fl'nul,,,, 1Ch,1111L·r .~I In tf11,
concluding di"'ussil1n, findings from tlw \·,iriL>LI" d1,1f11L'i"' ,HL' dr.m 11 t"i~'·tl1n
,111d discu,,,,ed with re:.pL'll tl1 thl'ir nmtributi"n" !L1 <>lll' l1\l'r.lll und,·r,L1nd1111~
of tlw in;,l'ct ,rnd, wherL' ,1pplic,1biL·, tl1 tlwir implic,iti"n" l<>r till' rn.111,1,g,·1n,·11t <>I
tlw in:,c'ct. Limit,1tion:. of thi" "tu,i\· ML' f'"intl'll <>lit .ind dtrt·, ltlll\' l<>r 1111111<·
9.1 Major findings
Until no\\', publi,,lwd krnm·IL-dgL' ol II ,.,,/•11,/<1 111 .·\11,tr.il1.1 h.1, 1>1·1·11
lin1ill'd tu dl'~cription~ or "Pl'nil,1t1on..., b,1~t 1d (lll <..,i--.11.il .i\ 1 ..... ('r\ ,J!lt111 ..... 1--,1't'
Ch,1p1L'r I). h1r till' lir;,t timL>, thi' ,,tuch h.1' f11"l1\tclt-.! cl.1t.1 .il 1<>ttl ti\\· l•t<d"c',\
l'Cllll1)2,\', ,111d bl'hd\'il1LII" l1f till' in"'·ct in till' t<l!llt•\I Lii ii' I!\lt'r.ll ll"I" \\ 1111
:\u;,tr,1li,rn Rl'd CL·d,ir. '-;l1nll' lindin,g' ,1bout tlw til'L'< I ,1rl' 111·\\ 11 '•rid\\,,\,
9.1.1 Infestation Pattens
ccl\TL'\.11L'd 11·ith till' ,111wunt cit r.11nf,1ll in thl' f'i"''''"u' 1111•nlh llw 1·. 111•·111
,1\,,,1 rL'f'c1rtl'd tc1r till' lll'L'cl .ltt,Kkin.~ «tlwr \kl1.1LL·,1c· 'I''" I<'' I 111\\ ,,1],. i"
winter diapause phase in ib lifecycle. The diapause stage mav bl' the !J-,t inst,ir
or pupa, the stages revealed by all dissections of infe:.ted :.itL':. during thl'
winter. Elsewhere, winter diapause ha;, been sugge:.ted onh· in nl1rtlwrn lndi,1
(Beeson, 1 Y1 Y).
Spatial patterns of attack bv the insect 1wrL' i111"L'stig.1kd .it thn·c· 1,., l'k
habitat, inter-tree, and within-tree. At the habitat IL·n·l, trL'L's pl.mkd 111,id,· tlw
forest appeJred tu ha1·e gained sumL' LiL·grL'L' "f prntl'cti,111 ,1g.ii11>t .1tt.1c \..
Although attack did occur ,1ml1ng trc'L'S pl.rnlL'd in tlw fun·st, thl' f'r"f''•rt1,111' ,,1
,1ttackl'd trees 11'L'rL' much il1wer cumparL·d Ill thl1sl' pl.rntl'd in thl' "f'c'll c;1rn1l.11
pattL•rns htl\'L' hL'L'n reported for tlw insect ,1tt.1cking utlwr hL»l 'I'''' I'" .11lll ILLt
11. gm11dd/11 (SL'L' NL·Wllln ct 11/., 1 '!'J:\). ThrL'L' f,1dL •rs rn.i\" h,11 ,. '' •11trt!>t1kd 1, • il1l'
rL•latin·ly low ,1tt,ick il'n·ls of hl1st trL'c's gm11·11 111 tlw lllrt"t ,1i.1,l11H~ i"'' growth r,1te, ,rnd tlw tnL•ch,rnic.11 and/or f'lll"sic.11 b,11-r1c·r> ,1l 11L111-h,»l tn""
J\t tlw intL·r-trL'L' il'nl .s111all tl"l'L'' (<I-; Ill t.il\1 11t·r,· .t!t.i, \._,.,\ 1,-,.,
frL•quentlv th,rn l.irgl'r trL'l'S. 1 his rn.i1· h.1n· l"l'>l!il<'d lrLLtll tlw 111.l'.!11 l•1·li.111"111
llf till' L'gg-l,1ving IL'rnalc•s. :\n1id.rnn· ut >hLLrt trL'L"-. h.i> h·c·11 dr·111 .. 11sl1.'l•-.I 111
II. gn111dcl/11 (I lolstl'n ,rnd ("ir,1, 1'17~1. (l111tr.1r1 Ill till' l1kr·l1lu""I "I .111.1< k 111•
intl'nsitv "f .itt,1ch ,l/lH11lf; ,1tt.1ckl'd tr'''" 11,1> 11t·g.lt11L·i1 '"11,·l.11<-,I '" 1111 Ir•'
sill'. This \\',lS likl'il" to lw due· tLI till' h1glll'r /lll!lli 1r·1 ,I) sh'""' Ill l.11-.·.·, Ii<' .
.ind lirnikd nurnbc·r lit t'f';,h' l.11d pl'r trc·c· h \ 1stl111_~ l1·111.1l1·s. tl11· I.ill• 1 i" •1,_·
\\'ithin ,1tt,ll·kl'd trl'L' ...... '.'-JHH1h ~l(P-.Jll\ltlL'll 111 tlH· llf~f't·r trt'l' \ 111\\11-... '.\
1·1
1
!11lH.l' llftL'l1 ,1ti.ll~L'd th,111 t)Hl~l' )~rtl\\T\ ,1\ ]tl\\t.'I" tlthl[H111'' ! h( r\"· .. \1]1-.., '--II ~.'.t",j
th,1
t nncl' ,1 hl)~t trl'L' i'.-> ,1tt.h:kl'd tl1L' tl'rn11n,i\ ...,h1ll 1I" \\1iuid l 1t' ,1111 1 1!1~: :Iii :1:-..1
1"
9.1.2 Feeding beha\·iour
F'\~lL'ritilL'llh u~1n~ !1L'Utr.1l :---ul1 ..,tr.1k.., ,kr~11\:··, .... t~·.1k,I
f'h,lhL»lllllllLlllts Ill till' tc'c0 d1nh f'i"l'cl'" ,.1 l.1r1.ic· l IL<f'i< r
._,\l'llb l)t '.->hl)l)t;-. l)t thL1 hll:---t trL'L' -lr'~'l'.H" !ii l1
'!1
l-1
\ll)rt,1\it\ l)t 1'\L'l)J1,1tL'~ lillL' Ill JlllJl-tl'L'lilllL_ 1.1'~ilffl11!',)\ 1',!'-..l'r\ t·,1
thL' \ll~L'lt. l'l)lllli llL' rL'lilkL'll -.,1~nltll.Hlth l'\ )!il\1'.l' 1 •r.1'.: '...'.. t'':'
/ 1 '1 I]] , 1 /·I j.
I
I ~ t

young shoots of the host trees into the synthetic diet. Althl1ugh H. n1/111sl11
attacks only Red Cedar in Australia, the phagostimulanb are likeh· tl> bl'
widely distributed among Meliaceae species. This \\'as Sl'l'n in tlw rL'<llh
burrowing by lar\·ae into the shoots of Spanish Cedar (Ct'drc/11 ,1,/,11.1/111 Chin''"'
Toon (Toonn si11rns1s), and White Cedar (Mcli1111:11dm1d1/11 \·cir. 1111,/rd/d,11111. tlw
last being in a different subfamilv. Some rnmpom·nt:, l>f tlw p11.1,g11ot1rn'.il.111to
may be \'l1latiil', as J,ir\·ae Wl'rl' abil' to concentr,1ll' tlwir biting l>n tl'ot 111.1tl'n.1I
loadL·d with host l'Xtracts without co!ll.lCt with tlw tl·:,t 111.11l'ri.1I'
Although thl·ir preferrt•d fL•eding sill'' .Hl' 1n.sidl' tlw gn111·1ng 'h"11t'. th1·
l,H\'dl' fl'l'd on ;1lmo:,t ,rny ti,,,,UL"' of tlw hll:,t f'l,rnh, ine·lud111g tlw l1u11'. 11".I\ ,.,.
and epicfrrmis of shoot:, or :,ll'll1S. It .1ppl'.H' th.11 tlw h,1b1t iii tun1wll111,g 1·1 ,,[, ,.,
,1:, ,1 trait to a\'(1id n.1tur.1l L'Ill'll1il'"· r,1tlwr th,111 llllt Ill .1 1wl'd I Pr l1l'll\'11111t11t1"11
Tlwrl' was a gr,1du.1I ch.rngl' uf !<.'!'ding llll.ltlllllS ch till' de•\ 1·111111111·111 .. 1 1111·
l.ir1'<1 progn'S"''d. h·L·ding bv J,ir1·,w lli tlw lirol l1111111,t.1ro 11.1, ,1i.1111h 11111111! 111
tlw terminal foli,1gl' (bueb, il'.1! f'l'tillll'" ol un·e'\l1.111ekd k.11l''l 11r 1111 1 1·1·111 111'1\
d.1maged ,HL'<1" on tlw h1ist 111,rnt. !'ith·ll'l'ding, 11r lt1111wll111g. did 11ril ,1.111 111itil
l,1tl' 2nd :,t.idiurn. \\'lwn tlw oh1H1t 11·a.' :,111,ill.111111i<'l'd111,l',11.1, n·1 1l.11 l'd h I"" 1-
fl•L'ding, l>r the l.H1.i would e·oml' lllll "I 1111' lt111rn·I, h·1 .. r1· 1·111"11111e· .11 1·1
n111:,trudl'd pup.1t1011 eTll:, ,m1und tlw b,1,e·' Ill the· 111.1111,
9.1.3 Development
l'lwnumhl'f'11!l.H\',1l 11ht.Hor.111,g1·d lr11111 :;111~ 1111\i 1111»\ l.111.wl1.1·.111.·
h inst.irs bl'11HL' puf»1t111g. (ln\\· -l 111'1.H' 111·r1· rq111rlt'd 11 1 l>r·1'"'" · l"i" 111.I
RobL'l'h (llih~). It io olhf'l'ltl'd th.it tlw l'.ll'il 111,l.il'' 111·r,· "''·rl'"''"I 11111"11
1i,•ld otudil'o. l)l'll'l1>f'I1ll'l1i r.1tL" t11r tlw 111mb11w1l l.1r1.1l .11hl 1·111· 11 i' ""'I ,1
tlw thr,·oh11ld tL'll1f'l'!'.1tllrL' .rnd tlw tlwrm.1l 11111,t.111\ 1»t1111.1\1·rl .1'. I·
[),·grL'l"l),11 , 1DDI. l'l''f'l'lll\l'h Dt:1' t11 tlw1r 111!wr1·:it ,l1i!l'r1·1·, ,., ::1.1'
',\• ,,.1,
I I i I I) > Jl.il...,h) \\ ,l.._ ti"l',j l1 1 ~Jt·-..,1 ;"'t"'t' t :,I f11l'll'' ''h\ 1111>t e' I e'lllll' 1. ,,
f'l'''f'' 1rt11 '11' , it 1 nd i\ 1d u.1 b .1 t .1 .~1' t'n ,rnir •u nt '•t I JI J
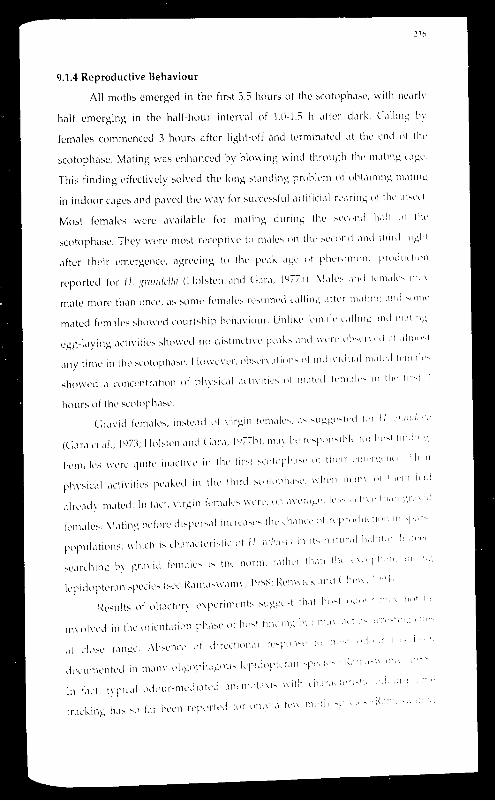
9.1.4 Reproductive Behaviour
All moths emerged in the first 3.5 hours of thl' scotophasL', \\'ith 1w.iril
half emerging in the half-hour inten·al of l.ll-1.; h ,1ttl'r d.irk. C.1lllllg b1·
females commenced 3 hours after light-off and terrninatl'd ,it thl' l'nd ol till'
scotophase. Mating was enhanced bv blowing wind through tlw m.itlllg c.1gl'
This finding dfecti1·ely soil·ed thl' long standing prnbkm ol obt.rn11ng lll.1tlllg
in indoor cages and p.ll'ed the 11'.lV for succL'ssful .1rtifiu.1l rl'.iring '''till' 111,,·, t
Most femaks were ,l\'aibbk for rn.iting during till' sL'C.>nd h.111 <>I thl'
scotophase. They \\'l'fl' most rL·ceptil'l' to maks lln till' sc·c·llnd .ind tl11rcl 111gl1t
,1ftl'r their ernergenCl', ,igrL•eing to till' PL'<llo. .1gl' lll f'lll'r»lll»lll' l''"clu, 11»11
L'gg-ll1ying tldi\'itil'~ ~hP\\'L'd no di~t1nd1\'l' PL'<lk-. ,ind \\'l'rl' (l\l-.,L'I"\ L'll .11 ,il111t1-..1
.rny tinw in tlw scotophasL'. I ltl\\'L'l't•r. obSL'rl .1t1lln' "' 111dl\ 1clu.il 111.11<',l 1,·111.11,·,
showed ,1 concentr.1tion ot phvsic.11 .1di1·itic'' "' m.11,·d ti·rn,il•·' 111 li1<· 111,1 "
hours of tlw scotophasl'.
(C.1r.1 t'I o/., l'Jn; I lolstl'n ,rnd C.ir.1, \'177bi, 111.11 l1 c· "'''l'"11'1lili· 1 .. 1 IH"I 1111,\111"'
i'L'lll• IL·s \\'L'rt' quill' in.1ct11·L' in till' lirst 'n1ti111h,1sc· lll li1l'1r i·11wr1'.1'll"' I lw11
pl11·sic.1l .1cti1·itiL'S 1w.1!..t•d in till' third """'11h.1''" 11·lw11 111.1111 "I 1
lw111 i1.1.I
,11n".1d1· rn.1tl'd. In f.1ct. 1·irgin tl'rn.1ks ll'L'rt'. lln .11l'r.1,~t'. IL'" .lll111· 111.111 ":1.111,\
tL>n1l1ll'~. l\t1ting bL'fPrc> di~pL'r~l1\ inLrL\hL':-o thl' lh,1nLt' 11! rc~ 1 r1illt11 t1t1J\ 1r1 ·~1 1r-..
1
popul.1tions. 11·h1ch i' ch.H.Kll'rist1c t1t I/ r,•/•11,:.1 111 11, 11.11ur,1I h,il•1t11 l:·,,I, ,.,\
,1t dl):-;L' 1«111,l;L' .. .\l>:--L'l1ll' l,f d1rL1ltlt\llc1l rl"·,F'\lll"l' t(• h1 1
--t 1 "l
11
'
dl'Lun1L'nkd in n1.1n~· t'l1~1.lrh.-1h1.'u" kT'1lilirkr,1n "r'l'' !t'...., l\,1:~ y
in f.1ct. t1T1c.1l ,1d,1ur-mc·ci1.1tc•,i .11wrn,1tJ\l' \\ tlh ci1.1r.i. \1·r:<•
I:- !
:'.'I

1988). Long-range host searching by this insect may be random. H111''i1'11/11
species appear to possess beha\'ioural attributes that are special\\· adaplL'd tll
the random searching strategy. It is reported that females ot II. sm11ddli1 L1id
only a few eggs on each tree (Grijpma, I <J7-± ). Such a be ha\ iour innL',bl's tlw
chance of searching females finding a host plant in a di\'l'r"' plant n>mmunit\'
In addition, once a host patch has bel'n found, nmths of \,1tn genn,1ti1>ns d1> n1>t
usually disperse out and continue to reproduce in l'\isting hllst pl.rnh il;riwm.1
and Cara, l<J70). This beha\·iour ensures tlw rnntinu,1tion ll! l1>c.li f'1>puL1t111ns
despite the high risk of f,1iling to find Ill'\\' ho-,! h.1ht,1h b\' till' r.111d11111
sL·arching str,1tegy.
The fact that fl-mall's \\'l'rl' ,1bil' t11 di-,criminatl' .1g,1111st till' 11il1»g1· 111
some non-host pl,rnts pair,·d \\'ith tlw h11st in c,1gl's su,ggl'sts till' 1111111\ 1'llH'Ilt 111
contact clwmic,11 and/m nwch,ll1ic,1I cul's in host ,ll.Ll'f't»llll' I 1.,111·s 111 llH· I\\»
rejl'CIL'd pl,l\1ts spL'ciL'S c•itlwr h,n'l' ,1 hc»11·\ l,1\'l'r 111"""1•r ,rn· 1,.,1tlH·11. 1H·11fi,.1
of tlwse l\\'ll ch.ir,1ctc·ristics ,l\'L' -,ho\\11 b1· till' IL»l\'l'S 1>1 h1ist ,\\)cl 1>lh1·r ,\> cl'f'l1'll
9.2 Implications for the Management of II. ro/,11sl11
rill' d,1\ll,\).';L' chcHdcll'ristiL'S (l! I I r:•/•11s/.I ,)\lei tlH· 1ks11>' 11•1 1 .. 11 .. : i1 II :ll1s
o! str,1ight t1mb1.•r suggl'sh thdt ,1 \'\'\'\. 111\\ 1·1111\llll\I< thn·slH•l,l 1·\lsls 11 11 1111
m,1n,1gl'nwnt ot the insect. ,.\ tt.1L ~ b1 111w l.1 n ,1 llll ,1 h1 ist I r1"' ,it '"' 1 "11 ii 1.,:1 · ' . 111
d,•strll\' till' trL'l' torm. 1:urtlll'rnlllrl'. till' l'rl'sl'\lt stud\ 1rnl1,,)t>'s 1[1,il »Ill I.II\ I
c,l\1 inflict multipil' 11·1n111ds tll thl' h1ist trL'L' il hc111 tt-r :-1 ,111cl il'rn1111.1l sl 11 " >Is
\\'lltild bl' ,\t1llll1).'; till' t1rst t11 bl' dtt,11~l'cl I( hc1f 1 tl'r ~1 ( «11'1.!1·1111.: liw
~L'riln1~nL'~~ pf thl' F1n,l1kn1, thL' l1L'~t .... tr,1tq . .:,~ ,1r"~11.·,ir-.. t1i ,1\(11d 11r ,lt'l.1'> 111.1, ~
b\' till' insl'Ct.
\\'hiic• t1>t,1f ,l\'l>Jd,l\1Cl' 1>t dtt,lC~ ,lf'f'L»ll'' unl1~1·l1 I» I•,. ,1t!.11i 1" I
Jli:-.L'l1lL' l,f rL':-:.i~L.1nt ~tr 11in:-- l'r \ c1ril'tlL':--, ...,1.1nH_' 11-1tu1«1ll\-r1·c:•'ll1'r,1!1 ,l l:1
,-...:
'.r1 •
I ~ I
rq.~ .. Hd tl' thL' rn .. 1n.1~L'll1L'11t ,)t f i \'1'.ii1'-~, .. 1 1\ ,r1 1 t~rn i
,-,, if,'""'
~"'1 .. 1ntinh ~lhL'll1L' tr1.1!· l"'L' Ul1l'll'llllJl11l,1l t1 1
!1ll1"t ~rl'\\l·:--

plant the host trees in small groups inside an established forest. R<:sulh uf this
study have demonstrated that Red Cedars planted in this \\'a\' suffered k•ss
frequent attack than those planted in the open (Chapkr 3). If planting 1n till'
open is desired, attack may be delayed b\· keeping thL' planting sltL's .it scinw
distance from existing infestation loci ur m,1ture RL·d CL·dM lrL'L'" iBL'L'sl1n. 1'11'11.
Once grown to a certain size, a tree could prub,1l:d\' tl1kr,1tL' sl1lllL' dq;n·,· , 11
damage without !using its height gruwth and form iCh,1pll'r ~I
Delaying ,1ttack in open sitL'S ma\· ,1bo bL' ach1L'\'L'd h1 f'l.1111111.~ I'<'\\''"
non-host trees around the hoo,t trL'L'" (St,lllt<ln, ]LJS~) ,\n 1dL'.ll ,.11icl1,L11,· l<'r th,·
non-host trL'L'O> apfwars to lw WhitL' CedM. Tlw .. trl'l' 1,·,is rt'.1d1il .tllt'f'i<'d l<ll
L'gg-l•1ying (Chapll'r S) ,rnd fL.eding iChaptl'r hi hut I.in .\l' 1111 .111.il•l1 ,l11·d
(Ch,1pll'r n). With widl' buffl'r /011l'O> L"<llbl0>l111g <ll lhts tl'l'l', ,\ S[\\,ill ill\ .1<l1tH'.
popul•1tion of till' insL'LI m.11· 1·,rnish lwl<lrl' rl'.lthtn~ tlw ht>st tr,.,., 111 till'
interior. Co110>L'l]Ul'lltlv, .itt,1(1' on 0>lll11L' h1ist lrt'l'S. 11 ll<ll .ill. 1n.11 !•,· ,l,·l.1\l·,I
sclll'nll' looks prum10,in.~.
!'in,\ 111· .• it l.1(1' (,lll bl' Lkl.l\'l'd I'>\' 'f'l'l Id I f 'l'l •i<'l I 11 l' l\\l ',[S[l [ l'S, s\ I< I 1 . I'· 11:.
.ip11li(,1tion ot lll>•l'diL·idL>s, dunng till' L'<ll'I\ sL\.~t· td l'l,rnl.1t1<>1l ,.,1,1l•l1sl1111. 111 I••
111 ,1,inii:-.l' tir~t-br,11 H·h hl'ight ()t trl'l'"' ,ind l (ltl'-.t'l]lh'll1h llll tt"1"1 tl11 !1111h 1
\·,1\uL'. t\Liint.1ininh ~·uunh trL'L'" in gt Hid tt irrn 111,1\ ,1]-...( i rt·,l t1t t' 1I1 1 ·11 11·,h 1 •
1
lwing .1tt.1l1'L·d .llll'I' till' \\lthdr.111,il td J'l'lll<'l !Ill' J\\l ,[S\l[l'S
ll'l.'l]UL'n(\' \\",lS 1wg.1tin·i1· ,\sS[lL],lll'd \\'Ith 1n1t1.il llt'l' 1«11\\ l( h.11·t··1
the s.lllll' t111ding, hr.111L·lwd tl'L'L's -.h"ul,i h· f'l'\IJll'd r,·~11l 11 l1 ,lt11 i:
tL'\\' yc.H:-. pf thl'ir ~')l.1nt1n:-:, Rl',~l\Llr rrun111~ h,1--. \\\(I ,hl\J1t1 1'i'i,1:
1: 1 r~t, it L'llllllJr,1hL'~ tL'rn1incil ~n1\\·th ,ind lll'J;lt' tht' ~r( 1 \"th 1 i1 !l1 1 J.,
~kin~. ~L'L1.1nd, it rL'dlllL'~ thL' nun1bvr l't .... 1tt·" ,1\ d1L1l~l1· !· 1r
ltnlg ll'rlll. the sJ/L' ,,f thL' J,1c,1i f'''f'lli.1l1t1ns t>I !Ill' 111,,., i.
Sm,·e 1L'm,1ks ,,f till' J11'L'll f'l'l'l',1H1 m.11< h·r,.,·,. ,.,._; '··"
,11 Ji,ist f111,i111g 1Ch.11'IL'r :"1. c,1ntr<il h m.1t:11c; ,J1,nq·:: .. ;·, ,.; :1
f'hL•rtlllltllll'S sl1L'UJcJ h• .lf'f'lll'lj dt till' sill' \ll 'l!rl't".l'
Jw,iltll\ htist sl.lllds slJJTtlllllcitlh~ till' illll''l.lt!«ll <i<'
111,J! h

Obser\'ations on the feeding process of lar\'ae (Chapter h) indicatl' a re
emergence of lar\'ae from pre\'iously established feeding sites during much llf
the 3rd and early 4th stadia. Such a period ma\' bv med in tirrnng tlw
application of insecticides. The actual time can be estimatL•d frpm fil·ld
phenology models of the insect, similar to tho'L' L'stabJi,Jwd ll1 th" ..,tuch
(Chapter 5). Howe\'er, the practice will be of \'aim· onh· fur tlw fir0>t P''"t-11 mtl'r
generation of the insect, as later gL'llL'rations M<' like\\· tll 'h"11· ,1 high dl'gr<'<' <'I
overlapping of indi1·iduab of diffl>rmt Lkwlopnwnt ..,1,1g<'' ilh.lf'il'r :;1
9.3 Recommended Areas for Future Research
inll'mkd ,is a c"mpn·lwn,i\'l' Ji,t ,,r imf•<'rLrnt re·"'""' h .1r'"''· 1•111 11L , .. 11
pruvidL' ,1 place to ,1,irt. Tlw llrdl'r ill 1,·hich '"1d1 l'l'<<llllllll'Jlli.1111111 ·11'1''""' ,j,,,.,
not rl'fkrt its rl'iatin· imp<'rt,1rK<'.
1. Exan1int1tiPn of pll1nh in <Hl\b '.'->Urnn111d111.~ rn,llun· l\l·ll l t·1L11 l1t·1"__, r'11
which ,1tt,1l'k bv II. r1•/•11,/u h,1.., h'l'll r<'«•r<i«d. I"'"" 11 ,,11"'1 1·1.1111, .11<·
,11,,0 ,1tt,ickl'd n.1tur.1lh· .rnd. 1t ,uch f'l.1nt ,\I'(' 1"1111<1. 11111'1111·1 tf,.·1 ·"'
c,1pabk "f ,uppllrt1ng tlw nimpktl' 111<' < 1 <I"' ii Iii<' 111''" I
:?.. Flight di,t,1tK<' .rnd !wight .1blll'<' gnn11ld "I II\ ill.~ 1n.il"' .111.I I• 111.11•·'
:i Flight p.1th lll fl'm,11«.., 11·1thin .rnd 11·1th"ut till' IH"l f'·il' 11
.+. Comp.H.itin· ..,tuch "' tlw d1'f'<'l''·1I f'•1tln111>1 .1d11fl, <'llH'J1:"•i l1••111 i1••-I
tr<'L'' gnn1·11 in tlw l<nc·..,t .rnd ''f'"n h.1l•11.1t
h.
1:urthL'r L'\.~"'IL'ril1lL'l1l~ tin thl' t1lf,1ltill-\ r1_' .... ~'tll'\'"'V". -l1r1·t 111 '1L1I 11r 11
111
dirl'cti<'ll•ll. ,,t tl'm.1lL'' t" 11,,..,t 1,1J,1tilc·..,
nwch.rn1c.1l cue'' 111 Jw..,t .1ccq•t.rncc·.
l it°L'-t,1l~k ~tudit'~ pt tht' in'.->L'ct in Rvl1 Cl'lL1r rL111L1t11lJI" 111
,lt·'.1
i'.1 I! I
1
!'
lJl'\l'l<'f'i1lL'llt Lltl' <'I till' 111'\'ct [L'.lrL'cJ <'I'
~"ht'lll)ll)~: !1h'dt1 l"

9. Controlled experiments to quantify the relationship bl't\\"L'L'n ,1tt,1ck
lcn'ls and tree growth and to estimate the economic thrL'shuld ut tlw
insect.
10. The efficiency of femille sex pheromones in attr,ictmg m;1lL's in tlw fil'ld
11. Planting triab to see if mixed planting of Red CL'd,ir ,rnd \\hitt· ll'cLir
has any effech in rL•ducing attack k\"l·ls on Rt'd Cedar trt't's
9.4 Conclusions
Attack by H. rn/111sl11 is a serious problt•m tP tlw c·tt!t11 .ltl\111 1>1 th1·
valu,1b!L> Red Cedar. Effectin' control of the inst•ct r<'qt11rl's g1"',\ 1'111111 l1·,lg1· ,,1
its interactions with the hosts ,rnd otlwr biolog1c.1I ,111d 11h1·,11.il «'11'1'"111·111' »I
it;, L'nvirunmL'nt. To this t•nd, till' prt•st•nt stud1 h,1, pn111,k,\ "'11'" 11\'\\
inform<1tion about tlw t•colog1· and bt•h,11·iour Pl till' il1't'< I. ""1111· 111><1111,> IJ.111·
direct implications fllr till' m.rnagt•mt·nt "' tlw 111,t•cl, 'li< Ii ,1, II"'" »II
i11ft·st,1tilln patterns. lltht•rs ma\' bt• usc·fu! in luturt• rt'''"'r' h ,111 Ii·'' 11"'"' .. 11
arlifici,11 reMing ,rnd tt'lllf't'r,1turt•·ckpl'nd,·11t dt·1l'l"f'llll'11t \II l11i.l111·.> .111·
m· 11· to ;\ustr,1Ji,1. Stllllt' llf tht• im·l'slig.1tion' n·p11rtt·d 1n 1111, 11"·'1' 11·1•11'-1111
pilllll'L'ring wt1rk un tlw insl'ct WPrld11·iclt-, 'li' h ·'' th'"" »11 1\1, 1. • 1111.·
bt•h,11·iuur ,rnd rt•pmducti1t• h·h.11·ipur \ lp11·,·1·l'r. ,1ud1t'' »I 11,, ,,, .. ,•I "'
1\ustr,1li,1 Mt' just bl'ginning. llur k11t111·il'd,gt· ti! th<' 111,,·,1 r' ,1tll 11.1 :11w11l.11\
I IPWL'l't'r, nrnlti-n,1tipnal l'lfprt rs 11J1\\· bt·rng "'ught I» , "1111 .11 11,, .11 •' 1
(\'n1n•t'dings p\ tht• \lJ'lh lntt:rn.1tiP11.1I 11·llrb\H,f' llll l/111·:; 11" '·i" '" \.,
11ublis!wd ). ! IPpt'lul\\· tlw dtt nt ll"l ill Id brin,g th 'It "t'r 11 • .1 ,,1 Ir ·I." 1, • r" ",:': r ''•I
ttl rl'dun· till' imp.1ct pf tlw 11. ,.,,/•11,/<1 f'l""bll'm

2'C-!
Plate 3. Three naturally-grown Red Cedar (Toona australis (F. Muell.)
Harmes) trees (with no leaves) in a forest patch close to Kempsey, NSW.
The three trees must have been free of attack by H. robusta for a period of
time, as shown by the long and straight boles

242
References
Achan, P.O. (1968) Preliminary observations on the development of an artificial
diet for Hypsipyla robusta Moore. Commonwealth Institute of Biological
Control Technical Bulletin 10, 23-26.
Agostinho, S.M.M., Silva, M.F.G.F., Fernandes, J.B., Vieira, P.C., Pinheiro, A.L.
and Vilela, E. F. (1994) Limonoids from Tau1iu ciliata and speculations on
their chemosystematic and ecological significance. Biochemical Systematics
and Ecology 22, 323-328.
Akanby, M.O. (1973) The major insect borers of mahogany - a review toward
their control - what step next? Federal Department of Forest Resources of
Nigeria, Report No. 16.
Allan, G.G., Gara, R.I. and Wilkins, R.M. (1970) Studies on the shootborer
Hypsipyla grandella Zeller. III The evaluation of some systemic insecticides
for the control of larvae in Cedrela odorata L. TL1rrialba 20, 478-487.
Altieri, M.A., van Schoonhoven, A. and Doll, J.D. (1977) The ecological role of
weeds in insect pest management systems: A review illustrated by bean
(Phaseolus Vlllgaris) cropping systems. PANS 23, 195-205.
Applegate, G.B. and Bragg, A.L. (1989) Improved growth rates of red cedar
(Toona australis (F. Muell.) Harmes) seedlings in growthtubes in North
Queensland. Allstralian Forestry 52, 293-297.
Anon. (1918) Forest trees of Queensland. JI.- Red Cedar. The AL1stralia11 Foresln/
follrnal 1, 38-39.
Anon. (1958) Shootborers of the Meliaceae. Unasylva 12, 30-31.
Atuahene, S.K.N. and Souto, D. 11983) The rearing and biology of the
mahogany shoot borer Hypsipyla robusta Moore (Lepidoptera: Pyralidae)
on an artificial medium. Insect Science and Application 4, 319-325.
Babilis, N.A. and Mazomenos, B.E. (1992) Mating behaviour of the corn stalk
borer Sesamia nonagrioides. Entomologia Experimentalis et Applicata 65, 199-
204.

243
Ballard, E. (1914) Two pests of mahogany in Nyasaland. Bulletin of Entomological
Research 5, 61-62.
Beard, J.S. (1942) Summary of silvicultural experience with Cedar, Cedreal
mexicana M.J. Roem. (C. odorata L.) in Trinidad. Caribbean Forestry 3, 91-
102.
Beck, S. D. (1965) Resistance of plants to insects. Annual Review of Entomology
10, 207-232.
Beeson, C.F.C. (1918) Cedar Twig Borer. Thi' Australian Forestry fozmrnl 1, 33.
Beeson, C.F.C. (1919) The life history of the toon shoot and fruit borer,
Hypsipyla robusta Moore (Lepidoptera: Pyralidae: Phycitinae) with
suggestions for i\s control. Indian Forest Records 7, 146-216.
Beeson, C.F.C. (1941) The ecology and control of the forest insects of India and
neighbouring countries. Vasant Press, Dehra Dun, India.
Bell, E.A. (1987) Secondary compounds and insect herbivores. In: l1N'CI /'!ant
Interactions (V. Labeyrie, G. Fabres and D. Lachaise eds), pp 19-24. Dr W.
Junk Publishers, Dordrecht and Boston.
Bell, J.V., King, E.G. and Hamalle, R.J. (1981) Some microbial cont;:iminants and
control agents in a diet and larvae of Heliothis spp. /01m111/ of i11Nrlcbmtc
Pathology 37, 243-248.
Bernays E. A. (1985) Regulation of feeding behaviour. In: Co111prclze11sil'C /n;;cct
Physiology, Biochemistry and Pharmacology, Volume 4, Regulation: Oigc;;tion,
Nutrition, Excretion. (G.A. Kerkut and LI. Gilbert eds), pp 1-32. Pergamon
Press, Oxford and New York.
Boake, C.R.B., Shelly, T.E. and Kaneshiro K. (1996) Sexual selection in relation
to pest-management strategies. A111111nl Review of Entomology 41, 211-229.
Boland, D.J., Brooker, M.I.H., Chippendale, G.M., Hall, N., Hyland, B.l' M. and
Johnston, R.D. (1984) Forest trees of Australia. Nelson-CSIRO, Melbourne,
Australia.
244
Boland, D.J., Brophy, J.J. and House A.P.N. eds (1991) Eucalyptus leaf oils -use,
chemistry, distillation and marketing. Inkata Press, Sydney and
Melbourne.
Bosson, G.A. and Gallois, M. (1982) Analyse de la secretion pheromonale emise
par !es femelles vierges de la Mineuse des pousses de l'Acajou: Hypsipyln
robusta (Moore) (Lepidoptere, Pyralidae: Phycitinae). Comptes Rendus de
Seances Academie de Science, Serie III 294, 819-822.
Bradley, J.D. (1968) Descriptions of two new genera and species of phyticinae
associated with Hypsipyla robllsta Moore on Meliaceae in Nigeria (Lep:
Pyralidae). Bulletin of Entomological Research 57, 605-613.
Brunck, F. and Fabre, J.P. (1974) Contribution a l'etude de la mineuse des
pousses de l'acajou: Hypsipyla robllsta Moore (Lepidoptere, Pyralidae).
Revue Bois et Forets des Tropiqlles 157, 3-20.
Burley, J. and Nikles, D.G. (1973) Tropical provenance and progeny rl'sl'arch
and international cooperation. Proc. IUFRO Working Party Ml'eting ilt
Nairobi, Kenya. 613pp. Commonwealth Forestry Institute, Oxford, UK.
Callahan, P.S. (1957) Oviposition response of the corn earworm to differences in
surface texture. Journal of the Kansas Ento111ologicnl Society 30, 59-63.
Callahan, P.S. (1962) Techniques for rearing the corn earworm, Heliot!tis :m.
Journal of Economic Entomology 55, 453-457.
C~llahan, P. S. (1973) Studies on the shootborer Hypsip11la grnndc/ln (Zeller)
(Lep., Pyralidae). XIX. The antenna of insects as an electromagnetic
sensory organ. Turrinlba 23, 263-274.
Campbell, A., Fraser, B.D., Gilbert, N., Gutierrez, A.P. and Mackauer, M. (1974)
Temperature requirements of some aphids and their parasites. Journal of
Applied Ecology 11, 431-438.
Campbell, K.G. (1964) Aspects of insect-tree relationship in forests of Ea~tern
Australia. In: Breeding pest resistant trees (H.D. Gerhold, E.j. Schreiner,
R.E.M. McDermott and J.A. Wilnieski eds), pp 239-250. Pergamon,
London.

245
Candy, S.G. (1991) Modeling insect phenology using ordinal regression and
continuation ratio models. Environmental Entomologtj 20, 190-195.
Carde, R.T. and Minks, A.K. (1995) Control of moth pests by mating disruption:
successes and con train ts. Annual Review of Entomologtj 40, 559-585.
Carruyo, L.J. (1976) Estudio preliminar de extractivos de las Meliaceas que
atraen a Hypsipyla grandel/a Zeller. In: IICA Studies on the shoot borer
Hypsipyla grandella (Zeller) Miscellaneous Publications No. 101, CATIE
(Whitmore, J.L. ed), pp 122-124. Turrialba, Costa Rica.
Cater, J.C. (1945) The silvicuture of Cedre/a mexicana. Caribbean Forestry 6, 89-
100.
Chable, A.C. (1967) Reforestation in the Republic of Honduras, Central
America. Ceiba 13, 1-56.
Champagne, D.E., Isman, M.B. and Towers, G.H.N. (1989) Insecticidal activity
of phytochemicals and extracts of the Meliaceae. In: Insecticides of Plant
Origin (J.T. Amason, B.J.R. Philogene and P. Morand eds), pp. 95-109. ACS
Symp. Ser. 387, Washington, DC.
Champagne, D.E., Kou!, 0., Isman, M.B., Scudder, G.G.E. and Tow,'rs, C.H.N.
(1992) Biological activity of limonoids from the Rutales. I'hytochc111isfrlf 31,
377-394.
Chapman, R. F. (1974) The chemical inhibition of feeding by phytophagous
insects: a review. Bulletin of Entomological Research 64, 339-363.
Cock, M.W. (1985) A review of the biological control of pests in the Caribbeun
and Bermuda up to 1982. C!BC Technical Communication 'J,
Commonwealth Institute of Biological Control, Trinidad. Commonwealth
Agricultural Bureaux, Slough, UK, 218 pp.
Combe, J. and Gewald, N.J. (1979) Guia campo de los ensayos forcstab del
CATIE in Turrialba, Costa Rica. Centro Agronomico Tropical de
Investigacion y Ensef\anza, Turrialba, Costa Rica.
Commonwealth Institute of Entomology (1983) Distribution maps of pests.
Series A (Agriculture), Map No. 448. London.

246
Colvin, J., Cooter, R.J. and Patel, S. (1994) Laboratory mating behaviour and
compatibility of Helicovera armigera (Lepidoptera: Noctuidae) originating
from different geographical regions. ournal of Economic Entomology 8, 1502-
1506.
Couilloud, R. and Guiol, F. (1980) Elevage en laboratoire d'Hypsipyla robusta
Moore (Lep, Pyralidae) (The laboratory breeding of Hypsipyla robusta
Moore (Lep. Pyralidae). Revue Bois et Fortis des Tropiques 194, 35-42.
Coventry, B.O. (1899) Life-history of the "toon twig borer", Magiria robusta.
Indian Forester 25, 367-370.
Creasap, V.L. (1973) Comparison of two diets for mass rearing the mahogany
shoot borer, Hypsipyla grandel/a (Zeller). Master thesis, College of Forest
Resources, University of Seattle, Seattle.
Cremer, K.W. (1990) Trees for rural Australia. Inkata Press, Melbourne and
Sydney, Australia.
Curry, G.L., Feldman, R.M. and Sharpe, P.J.H. (1978) Foundations of stochastic
development. Journal of Theoretical Biology 74, 397-410.
Dadd, R.H. (1985) Nutrition: organisms. In: Comprehensive Insect Pln1sioiogy,
Biochemistry and Pharmacology, Volume 4, Regulation: Digestion, Nutrition,
Excretion. (G.A. Kerkut and L.I. Gilbert eds), pp 313-390. Pergamon Press,
Oxford and New York.
Davidson, J. (1944) On the relationship between temperature and rate of
development of insects at constant temperatures. Journal of Animal
Ecology 13, 26-38.
Dennis, B., Kemp, W.P. and Beckwith, R.C. (1986) Stochastic model of insect
phenology: estimation and testing. EnPironmental Entomology 15, 541l-
546.
Dennis, B. and Kemp, W.P. (1988) Further statistical inference methods for a
stochastic model of insect phenology. Environmental Entomology 17, 887-
893.

247
Dethier, V. G. (1966) Feeding behaviour. In: Insect Behaviour (P. T. Haskell ed),
pp 46-58. Symposia of the Royal Entomological Society of London.
Dethier, V.G. (1982) Mechanisms of host-plant recognition. Entomologia
Experimentalis et Applicata 31, 49-56.
Dourojeanni, R.M. (1963) El barreno de los brotes (Hypsipyla grandel/a) en cedro
y caoba. Agronoma 30, 35-43.
Douwes, P. (1968) Host selection and host finding in the egg-laying female
Cidaria albulata L. (Lep. Geometridae). Opuscular Entomologia 33, 233-279.
Edmonds, J.M. (1993) The potential value of Toona species (Meliaceae) as
multipurpose and plantation trees in Southeast Asia. Co111111011wcnlth
Forestry Review 72, 181-186.
Entwistle, P.F. (1967) The current situation on shoot, fruit and collar borers of
the Meliaceae. Proceedings of the 9th British Commonwealth Forestry
Conference, Commonwealth Forestry Institute, Oxford.
Everitt, B.S. (1994) A Handbook of Statistical Analyses Using 5-PLUS. Chapman &
Hall, London.
Fasoranti, J.O. (1985) Influence of flight on the mating behaviour of thl·
mahogany shootborer Hypsipyla grandella (Zeller) (Lepidoptera:
Pyralidae). Turrialba 35, 300-302.
Fasoranti, J.O., Gara, R.I and Geizsler, D.R. (1982) Laboratory studies on the
flight capacity of the mahogany shoot borer, Hypsip!f/a grandella (Zeller)
(Lepidoptera: Pyralidae). Zeitschrift fiir angewandte Entomologie 93, 182-
186.
Feeny, P. (1990) Chemical constraints on the evolution of swallowtail
butterflies. In: Herbivory: Temperature and Tropical Perspectiues (P.W. Price,
T.M. Lewinsohm, Benson, W.W. and G.W. Fernandes eds), pp?_?. Wiley,
New York.
Feeny, P., Rosenbery, L. and Carter, M. (1983) Chemical aspects of oviposition
behavior in butterflies. In: Herbivorous Insects: Host-seeking belwv10r and

248
Mechanisms (Ahmad, S. ed), pp 27-76. Academic Press, New York and
London.
Feeny, P., Stadler, E., Ahman, I. and Carter M. (1989) Effects of plant odour on
oviposition by the black swallowtail butterfly, Papilio polyxens
(Lepidoptera: Papilionidae). Journal of Insect Behaviour 2, 803-827.
Fenemore, P.G. (1988) Host-plant location and selection by adult potato moth,
Phthorimaea operculella (Lepidoptera: Gelechiidae): a review. Journal of
Insect Physiologi; 34, 175-177.
Finch, S. (1980) Chemical attraction of plant-feeding insects to plants. In: Applied
Biology (T.H. Coaker ed), pp 67-143. Academic Press, New York.
Finch, S. (1986) Assessing host-plant finding by phytophagous insects. In:
Insect-Plant Interactions (J.R. Miller and T.A. Miller eds), pp 23-63.
Springer-Verlag, New York and Berlin.
Floyd, A. G. (1989) Rainforest trees of mainiand Sout/i-eastern Australia. lnkata
Press, Sydney, Australia.
Fraenkel, G. (1959) The raison d'etre of secondary plant substances. Scirncc
(Washington D. C.) 129, 1466-1470.
Fraenkel, G. (1969) Evolution of our thoughts on secondary plant substancL'S.
Entomologia Experimental is et Applicata 12, 473-486.
Froggatt, W.W. (1923) Forest Insects of Australia. Government Printer, Sydney,
Australia.
Froggatt, W.W. (1927) Forest Insects and timber borers. Government Printer,
Sydney, Australia.
Gara, R.l., Allan, G.G., Wilkins, R.M. and Whitmore, j.L (1973) Flight and host
selection behaviour of the mahogany shootborer, Hypsip11la xrnndella
(Zeller) (Lepidoptera: Phycitidae). Zeitschrift fiir anxewandte E11to1110/og1c
72, 259-266.
Grijpma, P. (1970) Immunity of Toona ciliata M. Roem. var ai1strnlis (F.\'.M.J
CDC. and Khaya ivorensis A. Chev. to attacks of Hypsip11la grnndella Zeller
in Turrialba, Costa Rica. Turrialba 20, 85-93.

249
Grijpma, P., (1971) Studies on the shoot borer Hypsipyla grandella (Zeller)
(Lepidoptera, Pyralidae). V. Observations on a rearing technique and on
host selection behaviour of adults in captivitiy. Turrialba, 21, 202-213.
Grijpma, P. (1974) Contributions to an integrated control programme of
Hypsipyla grandella (Zeller) in Costa Rica. Ph.D thesis, Wageningen,
Netherlands.
Grijpma, P. (1976) Resistence of Meliaceae against the shoot borer Hypsipyla
with particular reference to Toona ciliata M.J. Roem. var australis (F. v.
Muell.) C.DC. In: Tropical Trees: Variation, Breeding and Conservation (J.
Burley and B. T. Styles eds), pp 69-78. Linnaean Society, London.
Grijpma, P and Gara. RI. (1970a) Studies on the shootborer Hypsipyla grandclla
(Zeller). I. Host selection behaviour. Turria/ba 20, 233-240.
Grijpma, P and Gara. RI. (1970b) Studies on the shootborer Hypsipi1la grandclln
(Zeller). II. Host preference of the larva. Turrinlba 20, 241-247.
Grijpma, P. and Ramalho, R. (1969) Toona spp., posibles alternativas para el
problema de! barrenador Hypsipyla grandel/a de las Meliaccac en America
Latina. Turrialba 19, 531-547.
Grijpma, P. and Roberts, S.C. (1975) Studies on the shootborer Hypsipyla
grandella (Zeller) (Lep. Pyralidae) XXVIII. Biological and chemical
screening for the basis of resistance of Toona ciliata M.J. Roem. var. austral is
(F.v.M.) CDC. Turrialba 2:i, 152-159.
Grijpma, P. and Styles. B.T. (1973) Bibliografia selectiva sobre Meliaceaes.
Turrialba, Costa Rica, IICA-CTEI.
Gupta, P.D. and Thorsteinson, A.J. (1960) Food plant relationships of the
diamondback moth (Piute/la marnlipennis (Cur.)) II. Sensory regulation of
oviposition of the adult female. Entomologia Experimentalis et Applicatn 3,
305-314.
Hanson, F.E. (1983) The behavioral and neurophysiological basis of food plant
selection by lepidopterous larvae. In: HerbiL>orous Insects - Host-seekinx

250
Behavior and Mechanisms (A. Ahmad ed), pp 3-26. Academic Press, New
York and London.
Hawkes, C. (1974) Dispersal of cabbage root fly (Erioischia brassicae (Bouche)) in
relation to a brassica crop. Journal nf Applied Ecology 11, 83-93.
Hedin, P.A., Maxwell, F.G. and J.N. Jenkins (1974) Insect plant attractants,
feeding stimulants, repellents, deterrents, and other related factors
affecting insect behaviour. In: Proceedings of Summer Institute on Biological
Control of Plant Insects and Diseases (F.G. Maxwell and F.A. Harris eds), pp
494-527. University Press of Mississippi, Jackson.
Hidalgo-Salvatierra, 0. and Berrios F. (1972) Studies on the shootborer
Hypsipyla grandel/a Zeller (Lep., Pyralidae). XI. Growth of larvae reared on
a sythetic diet. Turrialba 22, 431-434.
Hilbert, D.W. and Logan, J.A. (1983) Empirical model of nymphal development
for the migratory grasshopper, Melanoplus sanguinipes (Orthopter~:
Acrididae). Environmental Entomology 12, 1·5
Holdridge, L.R. (1943) Comments on the silviculture of Cedrcla. Caribbean
Forestry 4, 77-80.
Holsten, E.H. (1977) Mating behaviour of the mahogany shoot borer, H11psip11la
grandella (Zeller) (Lepidoptera: Pyralidae) in Costa Rica. Ph.D thesis,
University of Washington.
Holsten, E.H. and Gara, R.I. (1974) Studies on attractants of the mahogany
shoot borer, Hypsipyla grandella (Zeller) (Lepidoptera: Pyralidae) in Costa
Rica. Zeitsc/irift fiir angewandte Ento111ologie 75, 645-653.
Holsten, E.H. and Gara, R.I. (1975) Flight of the mahogany shoot borer,
Hypsipyla grandel/a. Annals of the Entomological Society of America 68, 319-
320.
Holsten, E.H. and Gara, R.I. (1977a) Mating behaviour of the mahogany
shootborer, Hypsipyla grandella (Zeller) (Lep.: Pyralidae). Turrialba 27,
125-127.

251
Holsten, E.H. and Gara, R.I. (1977b) Factors affecting pheromone production by
female Hypsipyla grandella (Zeller) (Lep.: Pyralidae). Environmental
Entomologi; 6, 443-446.
Holsten, E.H. and Gara, R.I. (1977c) Attraction and ovipositional response of
Hypsipyla grandella (Zeller) (Lepidoptera: Pyralidae) to host and non-host
material. Annals of the Entomological Society of America. 70, 325-327.
Howard, F.W. and Meerow, A.W. (1993) Effect of mahogany shoot borer on the
growth of West Indies mahogany in Florida. Journal of Tmpical Forest
Science 6, 201-203.
Hudes, E.S and Shoemaker, CA. (1988) Inferential method for modeling insect
phenology and its application to the spruce budworm (Lepidoptera:
Tortricidae). Environmental Entomology 17, 97-108.
Hsiao, T. H., (1985) Feeding behaviour. In: Comprehensive InscLI I'lzysiologt/,
Biochemistry and Pharmacologi; (G. A. Kerkut and L. I. Gilbert eds). Vol. lJ.
pp 471-505. Pergamon Press, Oxford and New York.
Hsiao, T. H. and Fraenkel, G. (1968) The influence of nutrient chemicals on thl'
feeding behaviour of the Colorado potato beetle, Leptinotarsa decc111l111mla
(Coleoptera: Chrysomelidae). Annals of the En/0111ological Sociclt1 of A111crirn
61, 44-54.
Jones, R.E. (1992) Searching behaviour and outcomes. In: Proceedings of Ilic
Eiglzt/1 International Symposium 011 111sect-Planl !lileraclio11s (F.C. Menken,
J.H. Visser and P. Harrewijn eds), pp 93-102. Kluwr Academic, Dordrecht.
Kalshoven, L.G.E. (1926) Beschadigingen, ziekten en plagen van Mahonie (5.
malwgani en S. macrophyl/a), aangeplant op Java. Medede/ingen Jnsti/1111/ wor
Plantenziekten no. 69. 126 pp.
Kareiva, P. (1983) Influence of vegetation texture on herbivore populations:
Resource concentration and herbivore movement. In: Variable Plants a11d
Herbivores in Natural and Managed Systems (R.F. Denno and M.S. McClure
eds), pp 259-289. Academic Press, New York and London.

252
Kaufmann, 0. (1932) Einige Bermerkuungen uber den Einfluss von
Temperaturschwankungen auf die Entwicklungsdauer und Streuung bei
Insekten und seine graphische Darstellung durch Kettelinie und
Hyperbel. Z. Morph. Okol. Tiere 25, 353-361.
Kemp, W.P., Dennis, B. and Beckwith, R.C. (1986) Stochastic phenology model
for the Western Spruce Budworm (Lepidoptera: Tortricidae).
Environmental Entomology 15, 547-554.
Kemp, W.P. and Onsager, J.A. (1988) Rangeland grasshoppers (Orthoptera:
Acrididae): estimation and testing. Environmental Entomology 15, 924-
930.
Kempton, R.A. (1979) Statistical analysis of frequency data obtained from
sampling an insect population grouped by stages. In: Statistical
Distribution in Ecological Work, Vol. 4 (J. K. Ord, G. P. Patil and C. Taillie
eds), pp 401-418. International Publishing House, Fairland, MD.
Kennedy, J.S. (1977) Olfactory responses to distant plants and other sources. In:
Chemical Control of Insect Behaviour: Theory and Application (H.H. Shorey
and J.J. McKelvey, Jr. eds), pp 215-229. John Wiley and Sons, New York
and London.
Kennedy, J.S. (1983) Zigzagging and casting as a programmed response to
windborne odour: a review. P/1ysiological Entomology 8, 109-120.
Khan, Z.R., Ciepiela, A. and Norris, D.M. (1987) Behavioural and physiological
responses of cabbage looper, Triclzoplusia ni (Hubner), to steam distillates
from resistant versus susceptible soybean plants. Journal of Che111ical
Ecology 13, 1903-1915.
Knipling, E.F. (1984) What colonization of insects means to research and pest
management. In: Advances and Challenges in Insect Rearing (E.G. King
and N.C. Leppla eds), pp ix-xi. USDA/ ARS Pub!.
Kogan, M. (1977) The role of chemical factors in insect/plant relationships.
Proceedings of the 15th Congress of Entomology, Washington D.C., 1976.

253
Kubo, I. and Klocke, J. (1986) Insect ecdysis inhibitors. In: Natural Resistance of
Plants to Insects (M.B. Green and P.A. Hedin eds), pp 206-219. ACS
Symposium Series 296.
Lamb, A.F.A. (1968) Fast growing timber trees of the lowland tropics, No 2.
Cedrela odorata L.. Commonwealth Forestry Institute. 46 pp.
Lamb, F.B. (1966) Mahogany of tropical America: its ecology and management.
The University of Michigan Press, Ann Arbor, Ml, 220 pp.
Lamb, R.J. (1992) Developmental rate of Acyrtlwsiphon pis111n (Homoptera:
Aphididae) at low temperatures: implications for estimating rate
parameters for insects. Environmental Entomology 21, 10-19.
Landolt, P.J. (1989) Attraction of the cabbage looper to host plants and host host
plant odor in the laboratory. Entomologia Experimentalis ct Applicata 53,
117-124.
Landolt, P.J. (1993) Effects of host plant leaf damage on cabbage looper moth
attraction and oviposition. Entomologia Experimentalis ct Applicata 67, 79-H'i.
Lee, S.M., Klocke, J.A., Barby, M.A., Yamasaki R.B. and Balandrin, M.F. (1 YYJ)
Insecticidal Constituents of Azadiracl1ta indica and Melia azcdamc/1
(Meliaceae). In: Nall/rally Ocrnring Pest Reglllators (P.A. Hedin ed), pp 293-
304. American Chemical Society, Washington, DC.
Lewis, A.C. and van Emden, H.F. (1986) Assays for insect feeding. In: ilN'C/
Plant Interactions (J.R. Miller and T.A. Miller eds), pp 95-120. Springer
Verlag, New York and Berlin.
Liu, S., Zhang, G. and Zhu, J. (1995) Influence of temperature variations on rate
of development in insects: analysis of case studies from entomologicJI
literature. Annals of the Entomological Society of America 88, 107-119.
Logan, J.A., Wo!lkind, D.J., Hoyt, S.C. and Tanigoshi, L.K. (1976) An analytical
model for description of temperature dependent rate phenomena in
arthropods. Environmental Entomology 5, 1133-1140.

254
Manly, B.F.J. (1974) Estimation of stage-specific survival rates and other
parameters for insect populations developing through several stages.
Oecologia 15, 277-285.
Manly, B.F.J. (1989) A review of methods for the analysis of stage-frequency
data. In: Estimation and Analysis of Insect Populations (L. McDonald, B.
Manly, J. Lockwood and J. Logan eds), pp 3-69. Springer-Verlag, Berlin.
McCarter, P.S. (1986) The evaluation of the international provenance trials of
Cordia alliodora and Cedrela spp. Annual Report to the UK Overseas
Development Administration. Oxford Forestry Institute, Oxford, UK.
McCarter, P.S. (1988) Report on a visit to Colombia and Ecuador. Report to t/1c
UK Overseas Development Administration. Oxford Forestry Institute,
Oxford, UK.
Menendez, J.M. and Berrios, M. DEL C. (1992) Apuntes sobre modificatcioncs
observadas en la forma de ateque de Hypsipyla grandella (Lepidoptcra:
Phycitidae). Revista Baracoa 22, 41-45.
Miller, J.R. and Strickler, K.L. (1984) Finding and accepting host plants. In:
Chemical Ecology of Insects (W.J. Bell and Carde eds), pp 127-157. Chapman
and Hall, London and New York.
Misra, R.M. (1993) Beauveria bassiana (Balsamo) Vuillemin, a fungal pathogen of
Hypsipyla robusta Moore (Lepidoptera: Pyralidae). Indian journal of Forestry
16, 236-238.
Mitchell, AL. (1972) Planting trials with Red Cedar. Australian Forestry 35, 9-16.
Mitchell, B.K. and McCashin, B.G. (1994) Tasting green leaf volatiles by larvae
and adults of Colorado potato beetle, Leptinotarsa decemlineata. journal of
Chemical Ecology 20, 753-769.
Mitchell, E.R. and Heath, R.R. (1987) Heliothis subflexa (GN.) (Lepidoptera:
Noctuidae): Demonstration of oviposition stimulant from groundcherry
using novel bioassay. fournal of Chemical Ecology 13, 1849-1858.

255
Moore, R.F. (1985) Artificial diets: development and improvement. In: Handbook
of Insect Rearing, Vol. I. (P. Singh and R.F. Moore eds), pp 67-84. Elsevier,
Amsterdam.
Morgan, F.D. and Suratmo, F.G. (1976) Host preferences of Hypsipyla rob11sta
(Moore) (Lepidoptera: Pyralidae) in West Java. Australian Forestry 39, 103-
112.
Morris, W.F. and Kareiva, P.M. (1991) How insect herbivores find suitable host
plants: The interplay between random and nonrandom movement. In:
Insect-Plant Interactions. Volume III (E. Bernays ed). pp 175-208. CRC Press,
Boca Raton.
Munholland, P.L. and Dennis, B. (1992) Biological aspects of a stochastic model
for insect life history data. Environmental Entomology 21, 1229·· 1238.
Munholland, P.L., Kalbfleisch, J.D. and Dennis, B. (1989) A stochastic model for
insect life history data. In: Estimation and Analysis of Insect pop11latio11s (L.
McDonald, B. Manly, J. Lockwood and J. Logan eds), pp 136-144.
Springer-Verlag, Berlin.
Navasero, RC. and Ramaswamy, S.B. (1991) Morphology of leaf surface
trichomes and its influence on egglaying by He/iot/1is virescens. Crop Science
31, 342-353.
Neter, J. and Wasserman, W. ed. (1974) Applied Linear Statistical Models -
Regressions, Analysis of Variance, and Experimental Designs. Richard D.
IRWIN, Inc., Homewood, Illinois.
Newton, A.C., Baker, P., Ramnarine, S., Mesen, J.F. and Leaky, R.R.B. (1993)
The mahogany shoot borer: prospects for control. Forest Ecology and
Management 57, 301-328.
Nikles, D.G., Burley, J. and Barnes, R.D. (1978) Progress and problems of
genetic improvement of tropical forest trees: proceedings of a IUFRO
Working Party Meeting, Brisbane, Australia. 1066pp. Commonwealth
Forestry Institute, Oxford, UK.

256
Nishida, R., Ohsugi T., Fukami, H. and Nakajima, S. (1990) Oviposition
deterrents of a Rutaceae-feeding swallowtail butterfly, Papilio rnthus, from
a non-host rutaceous plant, Orixa japonica. Agricultural and Biological
Chemistry 54, 1256-1270.
Oliveira, J.S., Carnieri, N., Vilela, E.F. and Batista, M.S. (1986) Identifica<;ao de
componentes quimicos nos brotos terminais de Toona ciliata M. Roem. var.
australis E Swietenia macrophylla King. Experientia> 29, 125-142.
Osawa, A., Shoemaker, C.A. and Stedinger, J.R. (1983) A stochastic model of
balsam fir bud phenology utilizing maximum likelihood parameter
estimation. Forest Science 29, 478-490.
Palaniswamy, P. and Gillot C. (1986) Attraction of diamondback moths, P/11tcl/a
xylostella (L.) (Lepidoptera: Plutellidae) by volatile compounds of ;:anola,
white mustard, and faba bean. Canadian Ento111ologist 118, 1279-1285.
Pats, P. and Wiktelius, S. (1992) Diel flight periodicity of Cliilo partc/lus.
Entomologia Experimental is et Applicata 65, 165-170.
Pennington, D.T. and Styles, B.T. (1975) A generic monograph of the Meliaceae.
Bl11111ea 22, 419-540.
Phelan, P.L. and Baker, T.C. (1987) An attracticide for control of A111yclois
transitella (Lepidoptera: Pyralidae) in almonds. Journal of Eco110111ic
E11to111ology 80, 779-783.
Pivnick, K.A., Jarvis, B.j., Slater, G.P., Gillot, C. and Underhill, E.W. (1990)
Attraction of the Dianmondback moth (Lepidoptera: Plutellidae) to
volatiles of oriental mustard: the influence of age, sex, and prior exposure
to mates and host plants. Environmental Entomology 19, 704-709.
Porter, R.P. (1984) Role of host plant trichomes and tarsal sensillae in
oviposition by Heliothis virescens. MS thesis. Miss. State Univ., Mississipi
State, MI.
Pruess, K.P. (1983) Day-degree methods for pest management. Em•1ro11111cntal
E11to111ology 12, 613-619.

257
Raina, A.K.T., Kingan, T.G. and Mattoo, A.K. (1992) Chemical signals from host
plant and sexual behaviour in a moth. Science (Washington, DC) 255, 592-
594.
Ramaswamy, S.B. (1988) Host finding by moths: sensory modalities and
behaviours. Journal of Insect Physiology 34, 235-249.
Ramaswamy, S.B., Ma, W.K. and Baker, G.T. (1987) Sensory cues and receptors
for oviposition by Heliothis virescens. Entomologia Experimental is et Applicata
43, 159-168.
Rao, V.P. (1969) US PL-480 project: Survey for natural enemies of Hypsipyla
robusta Moore in India. Final technical report for the period 25 filly 1964 to 24
July 1969. Commonwealth Institute of Biological Control, Trinidad.
Rao, V.P. and Bennet, F.D. (1969) Possibilities of biological control of the
meliaceous shoot borers Hypsipyla spp. (Lepidoptera: Phycitidae).
Commonwealth Institute of Biological Control, Trinidad, Tccl1nical Bllllclin No.
12, 61-81.
Rawlings, J.O. (1988) Applied Regression Analysis - A Rcscarc/1 Tool. Wadsworth &
Brook/ Cole Advanced Books and Software, Pacific Grove, California.
Reese J. C. (1979) Interactions of allelochemicals with nutrients in herbivore
food. In: Herbivores: Their Interaction with Secondary Plant Metabolites (C. A.
Rosenthal and D. H. Janzen eds). pp 309-330. Academic Press, New York.
Reinecke, J.P. (1985) Nutrition: artificial diets. In: Co111prchcns1uc Insect
Physiology, Biochemistry and Plwrmacologlf, Volllme 4, Rcglllation: Dige.stion,
Nlltrition, Excretion. (G.A. Kerkut and L.I. Gilbert eds), pp 391-420.
Pergamon Press, Oxford and New York.
Renwick, J.A.A. and Chew, F.S. (1994) Oviposition behavior in Lepidoptera.
Annual RePiew of Entomology 39, 377-400.
Renwick, J.A.A. and Radke, CD. (1982) Activity of cabbage extracts in
deterring oviposition by the cabbage looper, Trichoplusia ni. In: Procccd111gs
of the Fifth International SymrJsi11m on Insect-Plant Relationships (J.H. Visser
and A.K. Minks eds), pp 139-143. Pudoc, Wageningen.

258
Renwick, J.A.A. and Radke, C.D. (1985) Constituents of host- and non-host
plants deterring oviposition by the cabbage butterfly, Pieris rapae.
Entomologia Experimentalis et Applicata 39, 21-26.
Renwick, J.A.A. and Radke, C.D. (1987) Chemical stimulants and deterrents
regulating acceptance or rejection of crucifers by cabbage butterflies.
Journal of Chemical Ecology 13, 1771-1776.
Rivet, M.P. and Albert, P.J. (1990) Oviposition behavior in spruce budworm
Choristoneura fumiferana (Clem.) (Lepidoptera: Tortricidae). fo11rna1 of Insect
Behavior 3, 395-400.
Roberts, H. (1966) A survey of the important shoot, stem, wood, flower, and
fruit boring insects of the Meliaceae in Nigeria. Nigerian Forcstn1
Information Bulletin (New Series) No. 15.
Roberts, H. (1968) An outline of the biology of Hypsipyln robustn Moore, the
shoot borer of the Meliaceae (mahoganies) of Nigeria, together with brief
comments on two stem borers and one other lepidopteran fruit borer also
found in Nigerian Meliaceae. Commonwealth Forestry Rci>iew. 47, 225-232.
Roltsch, W.J., Mayse, M.A. and Clausen, K. (1990) Temperature-dependent
development under constant and fluctuating temperatures: comparison
of linear versus non-linear methods for modeling development of
Western Grapeleaf Skeletonizer (Lepidoptera: Zygaenidae).
Environmental Entomology 22, 577-586.
Samaniego, A. and Katiyar, K. (1974) Estudios sobre el barrenador Hypsip11la
grnndelln (Zeller) (Lepidoptera: Pyralidae). XXIII Efectos de rad iacion
gamma en larvas, pupas y adultos. Turrinlba 24, 95-97.
SAS Institue (1982) SAS User's Guide: Statistics. SAS Institute, Cary, North
Carolina.
Saxena, K.N. (1969) Patterns of insect-plant relationships determining
susceptibility or resistance of different plants to an insect. £11!01110/ogza
Experimentnlis et Applicnta 12, 751-766.

259
Schoolfield, R.M., Sharpe, P.J.H. and Magnuson, C.E. (1981) Non-linear
regressions of biological temperature-dependent rate models based on
absolute reaction-rate theory. Journal of Theoretical Biology 88, 719-731.
Schoonhoven, L.M. (1974) Studies on the shootborer Hypsipyla grandella (Zeller)
(Lep., Pyralidae). XXIII. Electroantennograms (EAG) as a tool in the
analysis of insect attractants. Turrialba 24, 24-28.
Schoonhoven, L. M. (1982) Biological aspects of antifeedants. Entomologia
Experimentalis et Applicata 31, 57-69.
Schurr, K. and Holdaway, F.G. (1970) Olfactory responses of female Ostrinia
nubilalis (LepidopteraL Pyraustinae). Entomologia Experi111e11ta/is et
Applicata 13, 455-461.
Sharpe, P.J.H. and DeMichele, D.W. (1977) Reaction kinetics of poikilotherm
development. Journal of Theoretical Biology 64, 649-670.
Sharma, K.K. and Singh, P. (1980a) Studies of the Meliaceae shoot borer
Hypsipyla rohusta Moore. I. External morphology and distinguishing
characters of male and female pupae. Trmialba 30, 298-301.
Sharma, K.K. and Singh, P. (1980b) Studies of the Meliaceae shoot borer
Hypsipyla robusta Moore. II. External morphology of male and female
genitalia. T11rrialba 30, 302-307.
Shoemaker, C.A. (1979) Optimal timing of multiple applications of pesticides
with residual toxity. Biometrics 35, 803-812.
Shorey, H.H. (1973) Behavioural responses to insect pheromones. A111111al
Review of Entomology 18, 349-380.
Shorey, H.H. (1977) Manupulation of insect pests of agricultural crops. In:
Chemical Control of Insect Behavior -Theory and Application (H.H. Shorey and
J.J. McKelvey, Jr. eds), pp353-367. John Wiley & Sons, New York and
London.
Sikorowski, P.P. and Goodwin, R.H. (1985) Contaminant control and disease
recognition in laboratory colonies. In: Handbook of Insect Rearing, Vol. I. (P.
Singh and R.F. Moore eds), pp 85-106. Elsevier, Amsterdam.

260
Singh, P. (1984) Insect diets: historical developments, recent advances, and
future prospects. In: Advances and Challenges in Insect Rearing (E.G.
King and N.C. Leppla eds), pp 32-44. USDA/ ARS Pub!.
Singh, P. (1985) Multiple-species rearing diets. In: Handbook of Insect Rearing,
Vol. I. (P. Singh and R.F. Moore eds), pp 7-18. Elsevier, Amsterdam.
Singh, P. and Ashby, M.D. (1985) Insect rearing management. In: Handbook of
Insect Rearing, Vol. I. (P. Singh and R.F. Moore eds), pp 185-216. Elsevier,
Amsterdam.
Singh, P. and Misra, R.M. (1988) New records of predators of the Meliaceae
shoot borer Hypsipyla robusta Moore (Lepidoptera: Pyralidae). Indian
Forester. July, 399-404.
Sliwa, D.D. and Becker, V.O. (1973) Studies on the shootborer Hypsipy/11
grandella (Lepidoptera: Pyralidae). XX. Observations on emergence and
mating of adults in captivity. Turrialba 23, 352-356.
Southwood, T.R.E. ed. (1966) Ecological Methods - with partirnlar nfcrc11cc to the
study of insect populations. Methuen & Co Ltd, London.
Stanton, M.L. (1983) Spatial patterns in the plant community and their effects
upon insect search. In: Herbivorous Insects (S. Ahamad ed), pp 125-157.
Academic Press, Inc., New York and London.
Stedinger, J.R., Shoemaker, C.A. and Tenga, R. F. (1985) A stochastic modL·l uf
insect phenology with spatially variable developments rates. Biometrics
41, 691-701.
Steel, R.G.D. and Torrie, J.H. (1960) Principles and Procedures of Statistics - 1c1th
Special Reference to the Biological Science. McGraw-Hill Book Company, Inc ..
New York.
Sterringa, J.T. (1973) Studies on the shootborer HlfPsipyla ;.;rnndella (Zeller) (Lep.,
Pyralidae). XXII. An improved method for artificial rearing. T11rnalba 23,
394-402
261
Stinner, R.E., Gutierrez, A.P. and Butler, G.D., Jr (1974) An algorithm for
temperature-dependent growth rate stimulation. Canadian Entomologist
106, 519-524.
Strauss, S.H., Howe, G.T. and Goldfarb, B. (1991) Prospects for genetic
engineering of insect resistance in forest trees. Forest Ecology and
Management 43, 181-209.
Tahvanainen, J.O. and Root, R.B. (1972). The influ~nce of vegetational diversity
on the population ecology of a specialized herbivore, Phyllotreta cr11cifera
(Coleoptera: Chrysomelidae). Oecologia 10, 321-346.
Taylor, D.A.H. (1981) Chemotaxonomy. In: Flora Neotropica. Mo11ograpl1 N11ml1er
28, Meliaceae, pp 450-459. The New York Botanical Garden, New York.
Teal, P.E.A., McLaughlin, J.R. and Tumlinson, J.H. (1981) Analysis of
reproductive behaviour of Heliothis virescens (F.) under laboratory
conditions. Annals of the Entomological Society of America 74, 324-330.
Thibaut, E., Auger, J. and Lecomte, C. (1982) Host plant chemicals responsible
for attraction and oviposition in Acrplepiopsis ansectelln, In: Proceedings of
the Fifth International Symposium on Insect-Pinnt Relationships (J.H. Visser
and A.K. Minks eds), pp 197-115. Pudoc, Wagningen.
Thorsteinson, A.J. (1960) Host selection in phytophagous insects. A111111nl Rc11icw
of Entomology 5, 193-218.
Tillmans, H.J. (1964) Apuntos bibliographicos sabre Hypsipyln gra11de/ln Zeller.
Boletin del Instituto Foresta[ de Lntino-Americnno de /1111t>stigacio11 y
Capacitnci6n 16, 82-92.
Tingle, F.C. and Mitchell, E.R (1992) Attraction of He/iothis 1•iresccns (F.)
(Lepidoptera: Noctuidae) to volatiles from extracts of cotton flowers
foumnl of Chemical Ecology 18, 907-914.
Tingle, F.C., Mitchell, E.R. and Heath, R.R. (1989) Flight responses of He/1ot/11s
s11bfle:rn (GN.) females (Lepidoptera: Noctuidae) to an attractant from
groundcherry, Physnlis nng11lata L.. Jo1mwl of Chemical Ecology 15, 221-231.

262
Tingle, F.C., Mitchell, E.R. and Heath, R.R. (1990) Preferences of mated I-Ieliothis
virescens and H. subflexa for host and non-host volatiles in a flight tunnel.
Journal of Chemical Ecology 16, 2889-2898.
Unnithan, G.C. and Saxena, K.N. (1989) Diel periodicity of response in male C.
partel/us to female sex attractant. ICIPE 17th Annual Report 1989: 5.
Vader, J. (1987) Red Cedar: The Tree of Australian's History. Reed Books Pty Ltd,
Sydney, Australia.
Visser, J.H. (1986) Host odour perception in phytophagous insects. A111111al
Review of Entomology 31, 121-144.
Visser, J.I-I. and Nielson, J.K. (1977) Specificity in the olfactory orientation of the
Colorado beetle Leptinotarsa decemlineata. E11to111ologia Expcri111rntalis cl
Applicata 21, 14-22.
Visser, J.I-I., Van Straten, S. and Maarse, H. (1979) Isolation and identification of
volatiles in the foliage of potato, Solan11111 t11beros11111, a host plant of thl'
Colorado bee>le, Leptinotarsa decemlineata. Journal of Clu:n1icnl Ecology 5, 11-
23.
Wagge, J.K., Carl, K.P., Mills, N.J. and Greathead, D.j. (1985) RL'aring
entomophagous insects. In: Handbook of Insect Rearing, Vol. I. (P. Singh and
R.F. Moore eds), pp 45-66. Elsevier, Amsterdam.
Wagner, M.R., Atuahene, S.K.N. and Cobbinah, J.R. (1991) Forest entomology
in West tropical Africa: Forest insects of Ghana. Kluwer Academic
Publisher, Dordrecht, Netherlands.
Wagner, T.L., Wu, H., Sharpe, P.J.H., Schoolfield, R.M. and Coulson, R.N.
(1984a) Modeling insect development rates: a literature review and
application oi a biophysical model. Annals of the Entomological Socicllf of
A111erica 77, 208-225.
Wagner, T.L., Wu, H., Sharpe, P.J.H., Schoolfield, R.M. and Coulson, R.N.
(1984b) Modeling distributions of insect development time: a literature
review and application of the Weibull function. Annals of t/1e
Entomological Society of America 77, 475-487.
263
Wagner, T.L., Wu, H., Feldman, R.M., Sharpe, P.J.H. and Coulson, R.H. (1985)
Multiple-cohort approach for simulating development of insect
populations under variable temperatures. Annals of the Entomological
Society of America 78, 691-704.
Watt, A.D. (1992) Insect pest population dynamics: effects ot tree species
diversity. In: The Ecology Mixed Species Stands of Trees (M.G.R. Cannell,
D.C. Malcolm and P.A. Robertson eds). Special Publication No. 11 of the
British Ecological Society. Blackwell, Oxford.
Weaver, P.L. and Bauer, G.P. (1986) Growth, survival and shoot borer damage
in mahogany plantings in the Luquillo Forest in Puerto Rico. T11rrinlbn 36,
509-522.
Whitmore, J.L. (1978) Cedrela provenance trial in Puerto Rico and St. Croix:
establishment phase. USDA Forest Service Research Note. No. ITF 16.
Institute of Tropical Forestry, Puerto Rico.
Wilkins, R.M. (1972) Suppression of the shoot borer Hypsipyln gra11dcl/11 (Zl'ller)
(Lepidoptera: Phycitidae) with controlled release insecticides. l'h.D thesis,
University of Washington, DC, 103pp.
Wilkins, R.M., Allan, G.G. and Gara, R.l. (1976) Protection of Spanish CL'dar
with controlled release insecticides. In: Studies on t/1c Shoot Bol'l'r Hypsypiln
grandelln (Zeller) (Lep. Pyrnlidae) (J.L. Whitmore ed). pp 63-70 Vol. Ill.
IICA Miscellaneous Publications No 101, CATIE, Turrialba, Costa Rica.
Wilson, E.0. (1970) Chemical communication within animal species. In:
Chemical Ecology (E. Sondheimer and J.B. Simeone eds), pp 133-1 'i'i.
Academica Press, New York and London.
Worner, S.P. (1992) Performance of phenological models under variable
temperature regimes: consequences of the Kaufmann or rate summation
effect. E11viro11111ental E11to111ology 21, 689-699.
Yamamoto, R.T., Jenkins, R.Y. and McClusky, R.K. (1969) Factors determing the
selection of plants by the tobacco hornworm Mad11ca sexta. E11to1110/ogia
Experimentalis et Applicata 12, 504-508.

264
Yamazaki, S., Ikeda, T., Taketani, A., Pacheco, C.V. and Sato, T. (1992) Attack
by the mahogany shoot borer, Hypsipyla grandella Zeller (Lepidoptera:
Pyralidae), on the Meliaceous trees in the Peruvian Amazon. Applied
Entomology and Zoology. 27, 31-38.
Zhu, Y., Keaster, A.J. and Gerhardt, K.O. (1993) Field observations on
attractiveness of selected blooming plants to noctuid moths and
electroantennogram responses of black cutworm (Lepidoptera: Noctu1dae)
moths to flower volatiles. Environmental Entomology 22, 162-166.
Appendix
Estimation of Larval lnstars of Hypsipyla robusta Moore
(Lepidoptera: Pyralidae) By Larval Frass Widths ·
Introduction
265
Red Cedar Tip Moth, Hypsipyla robusta Moore (Lepidoptera: Pyralidae),
is a serious pest of a number of Meliaceae species, including Australian Red
Cedar, Toona austra/is (F. Muell.) Harms (Beeson, 1919). The larvae feed inside
various tissues of host plants, especially the growing shoots, and pupate inside
larval tunnels (Beeson, 1919). Due to their cryptic nature, the development
stages of larvae cannot be directly determined. As an indirect approach, this
paper explores the possibility of using larval frass widths (FW) to estimate
larval head capsule widths (HCW) and therefore larval instars. Such a
technique can be used by foresters in fine-tuning the timing of control measures
against this pest.
Frass of Red Cedar Tip Moth larvae is found as conspicuous clumps al
the openings to the larval tunnels (Roberts, 1968). The inside of the tunnels,
however, contains little frass (personal observation), suggesting that fresh frass
is constantly being pushed out. It is therefore possible to relate the exterior frass
with the current development stages of the larvae.
Methods
Larvae were obtained from a laboratory stock originated from mature
larvae collected in a Red Cedar plantation in Macksville, NSW, and maintained
on the artificial diet of Couilloud & Guiol (1980). To enhance feeding, a small
amount of macerated fresh, young Red Cedar shoots was incorporated into the
diet. Larvae from the original site were introduced into the stock at least twice a
year.
•Published in Australian Enromo/ogist 22. 59-62. 1995.

266
One hundred newly-hatched larvae were reared separately in glass vials
(50 x 12 mm) until pupation. The instar of a larva was determined from the
number of head capsules it shed. 1st-3rd instar larvae were fed with the
terminal parts of young shoots while the older larvae were supplied with
cuttings from the stouter parts of young shoots, in accordance with their
natural feeding habits (personal observation). Food was replaced every 1-3
days, depending on the consumption rate and freshness of the tissue. Frass was
removed daily from the glass vials. Rearing was in a room with temperature at
26 ± 1°C and light period at 14L:lOD. Humidity was not controlled but the
room was maintained humid by a vaporiser (KAZ Model 76).
At least 20 larvae at each instar were measured for HCW and FW.under
a stereo microscope fitted with an eyepiece scale to the nearest 1I40 mm. Due
to the frequent rupture of head capsules in the last moult, the HCW's of the last
instar larvae were replaced with the corresponding larval head widths just
before pupation. For each Jarva measured for HCW, 20 air-dried frass pellets
produced by that larva were measured and the mean FW calculated.
A separate set of data involving 30 larvae was collected in a Red Cedar
plantation in Macksville, NSW, to test the effectiveness of FW in estimating
larval instars in the field. The frass was first transferred from the infested
shoots to glass vials and then the shoots were dissected for larvae. The frass
and the associated larvae were taken back to the laboratory and the larvae were
further reared to obtain their head capsules for HCW measurements.
Results
Larvae molted either 5 (32'/c,) or 6 (68%) times before pupation as
previously noted by Atuahene & Souto (1983). A recent study by the authors
showed 5- and 6-instar forms in larvae of both sexes (82'\, and 75"·" of 6-instar
forms in males and females respectively), hence the \'ariation in the number of
larval instars is not likely to be sex dependant.

267
Larvae of the 5- and 6-instar forms showed similar HCW ranges in the
1st-5th instars. Hence data were pooled and the joint mean and ranges are
given in Table 1. Total separation was achieved by HCW for the first four
instars, whereas the 5th and 6th instar larvae showed some overlapping in their
HCW ranges. Further examination of the data showed that among the 25 5th
instar larvae measured, only one had its HOV fall in the HCW range of the 6th
instar larvae. Thus HCW can still be considered as a reliable predictor of larval
ages. The inter-instar boundaries in HCW for any two non-overlapping instars
were arbitrarily determined as the average of the maximum HCW of the former
instar and the minimal HCW of the following instar, and that for the 5th and
6th instars as the minimum HCW of the 6th instar (Figure Al.1).
Overlapping in FW started in the 4th instar and the relative within-instar
variations (expressed as SE/mean) were consistently higher than that in HCW
(Table Al.1). However, FW showed apparent positive correlation with HCW
(Figure Al.1) and the correlation was significant (t=Sl.3'7, df=133, p<ll.001). The
relationship was well fitted by linear regression (Figure A1.1). Assuming tl1l'
regression equation correctly described the true relationship between HCW
and FW, the inter-instar boundaries of FW obtained by supplanting the l ICW
boundaries into the equation (Figure Al.1) should perform equally well in
delimiting larval instars. In effect, the percentages of correct estimations of
larval instars by comparing individual FW's with the FW boundaries were
100'X, for the first 3 instars, 95% for the 4th instar, 76% for the 5th instar, and
90% for the 6th instar. Overall, 93% of the measured larvae were assigned to
their original instars by their FW's. Most of the misclassifications (lCCured in the
5th and 6th instar, which is probably due to the overlapping of the HCW
ranges of these two instars.
With field data, 26 larvae (87°/o) were assigned to the same imtars by
both HCW and FW. Two larvae that were assigned to the 5th instar by HCW
were estimated as 6th instar by FW, and 2 larvae that were determined as ~th
instar by HCW were estimated as 4th instar by FW.

268
Discussion
The above analysis demonstrates that FW is a useful predictor of larval
instars of Red Cedar Tip Moth, especially for the first four instars. The degree
of predictiveness is comparable to that of HCW. But, as the FW data are more
easily accessed than the HCW data, the FW approach appears promising.
When appllied to field situations, care should be taken to measure only
those frass pellets of apparently larger sizes to minimise the possibility of
accidently including frass pellets produced at earlier developmental stages. The
number of frass pellets required varies with instars. Under the assumption of
normal distribution of FW, a minimal number of 16 frass pellets is
recommended to keep the the relative sampling error below 10% ..
Finally, the inter-instar boundaries of FW given here are based on larvae
reared in an artificial environment. Although they were validated by one set of
field data, futher validation and possibly modification may be needed bpfore
widespread application of the method.
269
Refrences
Atuahene, S. K. N. and Souto, D. (1983). The rearing and biology of the
mahogany shoot borer Hypsipyla robusta Moore (Lepidoptera: Pyralidae)
on an artificial medium. Insect Science and Application 4, 319-325
Beeson, C. F. C. (1919). The life history of the Toon shoot and fruit borer,
Hypsipyla robusta Moore (Lepidoptera; Pyralidae; Phycitinae) with
suggestions for its control. Indian Forest Records 7, 1-216.
Couilloud, R., and Guiol, F. (1980). The laboratory rearing of Hypsipyla robusta
Moore. Revue Bois et Forets des Tropiques n" 194: 182-186.
Roberts, H. (1968). An outline of the biology of Hypsipyla rob11sta Moore, the
shoot borer of Meliaceae of Nigeria, together with brief comments on two
stem borers and one other lepidopteran fruit borer also found in Nigerian
Meliaceae. Commonwealt/i Forestry Review 47, 225-232.

270
Table Al.1. Larval head capsule widths and frass widths (mm)
larval head caesule width frass width
ins tar mean±SE(n) range mean±SE(n) range
ISE/mean) (SE/mean)
1st 0.29±0.01(20) 0.28-0.30 0.05±0.00(20) 0.05-0.06
(0.03) (0.05)
2nd 0.49±0.04(20) 0.45-0.53 0.10±0.02(20) 0.08-0.15
(0.08) (0.20)
3rd 0.85±0.08(20) 0.70-0.95 0.25±0.03(20) 0.16-0.29
(0.09) (0.12)
4th 1.24±0.13(20) 1.05-1.40 0.39±0.06(20) 0.30-0..18
(0.10) (0.15)
5th 1.78±0.15(25) 1.53-2.20 0.59±0.11(25) 0.46-0.93
(0.08) (0.19)
6th 2.25±0.15(30) 2.00-2.55 0.77±0 10(30) 0.60-1.02
(0.07) (0.13)

1.2
E 0.8 .s [
0.6 .<= i3 ~
~ 0.4
"' w ~ 0.2
o 1st instar c 3rd instar
• 2nd instar • 4th instar
lnter-instar boundaries in HCW
" .. 5th instar 6th instar
....
0.67
0,48 .
0.30
FW=·0.0671+0.3698'HCW 0.16
... rif.:~a ~.sJ.. .Q OJ.
0.5 1.5 2.5
Head capsule width (HCW) (mm)
271
Figure Al.I. The relationship between average frass width (FW) and lJrv,1\
head capsule width (HCW), with their inter-instar boudaries shown a' dotted
lines. Data from larvae reared on host plant material (see text for detail).


