Embed Size (px)
Citation preview

THE AUSTRALIAN NATIONAL UNIVERSITY
centre for
Aboriginal
onomic
esearch
The relative economic status ofindigenous people in Victoria,1991 and 1996
J. Taylor
No. 174/1998
Discussion Paper

Series Note
The Centre for Aboriginal Economic Policy Research (CAEPR) was established inMarch 1990 under an agreement between The Australian National University(ANU) and the Aboriginal and Torres Strait Islander Commission (ATSIC).CAEPR operates as an independent research unit within the University'sFaculty of Arts and is funded by ATSIC. the Commonwealth Department ofSocial Security and the ANU.CAEPR's principal objectives are to undertakeresearch to:
• Investigate the stimulation of Aboriginal and Torres Strait Islandereconomic development and issues relating to Aboriginal and Torres StraitIslander employment and unemployment:
• identify and analyse the factors affecting Aboriginal and Torres StraitIslander participation in the labour force; and
• assist in the development of government strategies aimed at raising thelevel of Aboriginal and Torres Strait Islander participation in the labourmarket.
The Director of the Centre is responsible to the Vice-Chancellor of the ANU andreceives assistance in formulating the Centre's research priorities from anAdvisory Committee consisting of five senior academics nominated by the Vice-Chancellor and four representatives nominated by ATSIC, the Department ofEmployment, Education. Training and Youth Affairs and the Department ofSocial Security.CAEPR Discussion Papers are intended as a forum for the rapid disseminationof refereed papers on research that falls within the CAEPR ambit. These papersare produced for discussion and comment within the research community andAboriginal affairs policy arena. Many are subsequently published in academicjournals. Publications can be purchased from:
Centre for Aboriginal Economic Policy Research2nd Floor. J.G. Crawford Building
Faculty of ArtsThe Australian National University
Canberra ACT 0200Telephone 02—6279 8211Facsimile 02—6249 2789
Abstracts or Summaries of all CAEPR Discussion Papers can be found at thefollowing World Wide Web address: http://online.anu.edu/caepr
As with all CAEPR publications, the views expressed in thisDiscussion Paper are those of the author(s) and do not reflect an official
CAEPR position.
Professor Jon AltmanDirector, CAEPR
The Australian National UniversityOctober 1998
The relative economic statusof indigenous people inVictoria, 1991 and 1996
J. Taylor
No. 174/1998
ISSN 1036-1774ISBN 0 7315 2609 0
Dr John Taylor is a Fellow at the Centre for Aboriginal Economic Policy Research,Faculty of Arts, The Australian National University.


DISCUSSION PAPER NO. 174 III
Foreword
A component of CAEPR's research charter requires it to examine the economicsituation of indigenous Australians at the State and Territory, as well as thenational and regional levels of aggregation. Accordingly, in 1994, a series of eightCAEPR Discussion Papers (Discussion Papers 55-62) were published outliningchanges in the relative economic status of indigenous Australians in each Stateand Territory using census data for the period 1986-91. These analyses, togetherwith CAEPR Research Monographs 5 and 6, formed CAEPR's commissionedcontribution to the mid-term evaluation of the Aboriginal EmploymentDevelopment Policy.
As part of CAEPR's continual monitoring of indigenous economic status,access to 1996 Census data now enables this series of Discussion Papers to beup-dated for the intercensal period 1991-96. As far as possible care has beentaken to ensure direct comparability in statistical content with the earlier series,thereby enabling longer-term analysis of change for the decade 1986-96. It isanticipated that these two series of Discussion Papers, taken together, will be ofassistance to policy development at State, Territory and national levels.
Professor Jon AltaianDirector, CAEPR
October 1998
C E N T R E F O R A B O R I G I N A L E C O N O M I C P O L I C Y R E S E A R C H

DISCUSSION PAPER NO. 174
Table of Contents
Foreword ill
Summary vii
Acknowledgments ix
Introduction 1
Population size and distribution, 1991 and 1996 1The indigenous population 2The non-indigenous population 3
The working-age population, 1991 and 1996 4Reconstructing the 1991 population 4
Labour force status, 1991 and 1996 6
Section-of-State and gender variations 7
Interpreting indigenous employment change, 1991 and 1996 10Revising employment change 11
Program intervention and employment growth 11
Income status, 1991 and 1996 14Income change by section-of-State 16Income change by sex 17Employment income and welfare dependence 17
Policy implications 19
Notes 23
References... . . 24
TablesTable 1. Change in indigenous population by section-of-State:
Victoria, 1991-96 3Table 2. Change in non-indigenous population by section-of-State:
Victoria, 1991-96 3Table 3. Estimated population aged 15 years and over: indigenous
and non-indigenous people in Victoria, 1991 and 1996 5Table 4. Labour force status of indigenous and non-indigenous people:
Victoria, 1991 and 1996 6
C E N T R E F O R A B O R I G I N A L E C O N O M I C P O L I C Y R E S E A R C H

VI TAYLOR
Table 5. Employment change among indigenous and non-indigenousAustralians by section-of-State: Victoria, 1991-96 8
Table 6. Labour force status of indigenous Australians bysection-of-State and gender: Victoria, 1991 and 1996 9
Table 7. Labour force status of non-indigenous Australians bysection-of-State and gender: Victoria, 1991 and 1996 9
Table 8. Estimated indigenous employment in Victoria,1991 and 1996 11
Table 9. Estimates of mainstream indigenous employmentVictoria. 1991 and 1996 13
Table 10. Income status of indigenous and non-indigenousAustralians: Victoria, 1991 and 1996 16
Table 11. Income status of indigenous and non-indigenousAustralians by section-of-State: Victoria, 1991 and 1996 17
Table 12. Income status of indigenous and non-indigenousAustralians by sex: Victoria, 1991 and 1996 17
Table 13. Total income of indigenous and non-indigenousAustralians by labour force status: Victoria,1991 and 1996 18
Table 14. Mean employment/non-employment income ofindigenous and non-indigenous Australians:Victoria, 1991 and 1996 19
FigureFigure 1. Annual income distribution of indigenous and
non-indigenous adults: Victoria, 1996 15
C E N T R E F O R A B O R I G I N A L E C O N O M I C P O L I C Y R E S E A R C H

DISCUSSION PAPER NO.174 v||
Summary
Census data remain the primary source of information on the economic status ofindigenous Australians in Victoria, and certainly the most comprehensive.However, some care is required in their interpretation for public policy purposes.In particular, it should be noted that any change in characteristics observedbetween censuses does not necessarily apply to the population identified at thestart of the intercensal period. In fact, because of the identification of a greaterthan expected indigenous population in 1996, change to the original 1991population cannot be adequately established. What can and should be done atthe aggregate State level is to estimate characteristics for the original populationusing Australian Bureau of Statistics experimental population estimates derivedfrom reverse survival procedures. This has the effect of properly aligning timeseries data.
These issues aside, a key question for policy arising from an examination of1991 and 1996 Census data is whether there has been any change in theabsolute and relative level of indigenous economic status in Victoria. The resultssuggest mixed outcomes:
• The number of indigenous people recorded as employed increased, theemployment rate was higher and the unemployment rate was lower but thegap in these indicators with the rest of the population remained the same.
• Employment growth, especially in non-metropolitan areas, was largelyrelated to an expansion of participation in the Community EmploymentDevelopment Projects (CDEP) scheme. Also contributing was enhancedindigenous participation in employment-related labour market programsunder the now defunct Working Nation initiatives.
• Growth in mainstream, or non-program linked employment, was insufficientto keep up with population growth and the true level of indigenousemployment has been falling as a ratio of that recorded for rest of the State'spopulation.
• The relatively low income status of indigenous people has remainedeffectively unaltered and welfare dependence remains high.
Sustained dependence over the decade to 1996 on programs for economicadvancement raises further pressing issues in the context of new directions forindigenous economic policy. These are:
• the shift in CDEP to focus solely on providing employment and skillsdevelopment with non-working participants becoming clients of the socialsecurity system;
• the freeze on further CDEP scheme expansion given that this has absorbedmuch of the excess labour supply in the past;
• orientation towards private sector activities as the primary source of futureemployment growth; and
C E N T R E F O R A B O R I G I N A L E C O N O M I C P O L I C Y R E S E A R C H

Vlll TAYLOR
• replacement of the Commonwealth Employment Service by contractedemployment provision agencies and the dismantling and restructuring ofgovernment employment assistance.
Just what effect these new arrangements will have on employmentoutcomes for indigenous people is unknown and in need of urgent consideration.As it stands, there are 36 Job Network member agencies registered in West andInner Melbourne, 35 in East Melbourne, 19 in Geelong, 18 in the CentralHighlands, and 13 in Gippsland. Many of these involve the same agenciesservicing multiple branches, but only one (in Mildura and also servicing Swan Hilland Robinvale) is an Aboriginal organisation. This leaves the whole issue ofdedicated services for indigenous job-seekers open to question.
In terms of anticipating where opportunities in the private sector might begenerated, an important consideration in Victoria is the greater concentration ofindigenous people in rural and often remote locations as well as ineconomicallydepressed country towns. As for those in Melbourne, despite being closer to thehub of private sector activity, they remain under-represented in many of theindustries that employ large numbers of metropolitan workers. For example, theretailing, manufacturing, hospitality, finance, construction and transportindustries.
This lack of penetration in leading urban employment sectors raisesquestions about the effectiveness of job programs and the prospect that a widerrange of industry strategies targeted at typically metropolitan jobs may berequired. Clearly, some focus on the special needs of the city-based population Isnecessary given the much larger population presence in Melbourne thanpreviously indicated.
It is important to ask how the broad strategy of raising employment levelsmight be targeted to suit particular regional and local circumstances. An initialrequirement is for detailed regionally-based quantitative assessments of thesupply of, and demand for, indigenous labour for different economic activities thateither exist already or that may be created at the local level. Only then, can theappropriate mix of resources for enterprise development and training beappropriately channelled.
C E N T R E F O R A B O R I G I N A L E C O N O M I C P O L I C Y R E S E A R C H

DISCUSSION PAPER NO. 174 lx
Acknowledgments
Statistical information contained in this paperwas prepared by Ms Jin Liu of theCommonwealth Grants Commission (CGC). Weare grateful to Jin Liu for her efforts and to theCGC for facilitating this process. Helpfulcomments on the text were received from JonAltaian while Linda Roach greatly assisted withthe initial analysis of intercensal changes incensus characteristics. Editorial assistance wasprovided by Hilary Bek and Linda Roach, andlayout by Jennifer Braid.
C E N T R E F O R A B O R I G I N A L E C O N O M I C P O L I C Y R E S E A R C H


DISCUSSION PAPER NO. 174
Introduction
Census-derived social indicators continue to provide the main statistical basis forassessing change in the economic status of indigenous Australians. By way ofinference, they also provide a means to assess likely aggregate impacts ofindigenous economic policy. Use of such data in this way formed the basis for amid-term review of the Aboriginal Employment Development Policy (AEDP) in1993. This involved a series of research papers aimed at establishing relativeshifts in indigenous employment and income status between 1986 and 1991(Taylor 1993a, 1993b; Taylor and Roach 1994).
Findings for Victoria indicated no change in the indigenous employmentrate and a rise in the unemployment rate with both of these remainingsubstantially below equivalent rates for the non-indigenous population (Taylorand Roach 1994: 7). Also of note was a lack of improvement in income relativitieswith the proportion of the adult population dependant on non-employmentsources of income rising from 26 per cent to 29 per cent. The release of 1996Census data now provides for an up-date of this economic profile covering theintercensal period 1991-96.
A degree of caution has been expressed with regard to the interpretation ofrecent change in social indicators for the indigenous population using censusdata (Australian Bureau of Statistics (ABS) 1998a; Taylor and Bell 1998). This isbecause indigenous population growth between 1991 and 1996 was augmentedby a large number of individuals who had previously not appeared in census dataas indigenous. Nationally, some 42 per cent of the intercensal increase in theindigenous population was due to factors other than natural causes (Gray 1997:13). As a consequence, change in census-based economic indicators cannot betaken at face value and some adjustment to the base year (1991) data isnecessary to establish meaningful comparison over time. A method for such anadjustment has been devised using reverse survival techniques (ABS 1998b;Taylor and Bell 1998) and this is applied here.
Population size and distribution, 1991 and 1996
To analyse change in the economic status of indigenous people in Victoriacompared to that of the rest of the population, an appreciation of respectivepopulation growth rates and spatial distributions is crucial. This is becausedifferent pressures are brought to bear on the need for new job creation byvariable rates of growth in the working-age population while the economy itselfvaries in its capacity to create employment in different parts of the State.
Previous analysis has identified a variation in economic status betweenindigenous people resident in urban centres as opposed to rural areas (Taylor andRoach 1994; ABS 1996a). Given the policy implications of this structuraldimension, and for consistency with data presented for the 1986-91 intercensal
C E N T R E F O R A B O R I G I N A L E C O N O M I C P O L I C Y R E S E A R C H

TAYLOR
period, the present analysis is organised according to the ABS section-of-Stateclassification with the standard four-way taxonomy for Victoria reduced to threecomponents by amalgamating data for bounded localities and the rural balance tocreate a single 'rural' category (0-999 persons).1 Although this represents anoversimplification of the settlement hierarchy, it is validated by the fact thatresidence in urban, as opposed to rural areas, remains the crucial determinant ofphysical access to the mainstream labour market and other economicopportunities.
The indigenous populationAt the 1996 Census, a total of 21,515 indigenous people were counted in
Victoria, an increase of 4,778 or 29 per cent since 1991. A more reliableindication of the size of the State's indigenous population is provided by theestimated resident population (ERP) which adjusts the census count of usualresidents according to an assessment of census error. This produced a populationin 1996 of 22,574 which was 11 per cent higher than the 20,434 expected on thebasis of ABS medium series experimental projections from the 1991 Census (ABS1996b: 16; 1998b: 10). Compared to most other jurisdictions, especially theadjoining States of New South Wales and Tasmania, this gap between theexpected and the recorded population in 1996 was relatively small (Taylor 1997b:4).
One of the features of the distribution of Victoria's enumerated indigenouspopulation over the two decades to 1991 was a gradual increase in the proportioncounted in Melbourne and a requisite decrease in the share counted in countryurban centres and rural areas. (Taylor and Roach 1994: 4; Maher and Caldow1997: 110-11). For example, over 70 per cent of the indigenous population waslocated in non-metropolitan Victoria in the early 1960s, but by 1991 thisproportion had fallen to 55 per cent with 45 per cent in Melbourne. Analysis ofindigenous population change by section-of-State for the most recent intercensalperiod between 1991 and 1996 indicates that this trend towards urbanisationcontinued (Table 1). Comparison of census counts in 1991 and 1996 reveals thatthe rate of population increase was highest in major urban areas (35 per cent). Asa consequence, Melbourne and Geelong accounted for a growing share of theState's indigenous population (47 per cent in 1996, up from 45 per cent in 1991).Nonetheless, this means that the majority of indigenous people counted inVictoria still remain located in other urban centres scattered across the State (40per cent) while 14 per cent are in small rural localities.
As far as the relatively higher population growth in Melbourneis concerned,this was not due to net migration gain from other parts of Victoria or frominterstate. Between 1991 and 1996, the indigenous population of Melbourneexperienced a net migration loss of 300 persons, with 60 per cent of this lossgoing to other States. This net movement out of Melbournewas more than doublethat recorded for the previous intercensal period (Taylor and Bell 1996: 401). Thefact that population growth in the city was still relatively high, despite increased
C E N T R E F O R A B O R I G I N A L E C O N O M I C P O L I C Y R E S E A R C H
DISCUSSION PAPER NO. 174
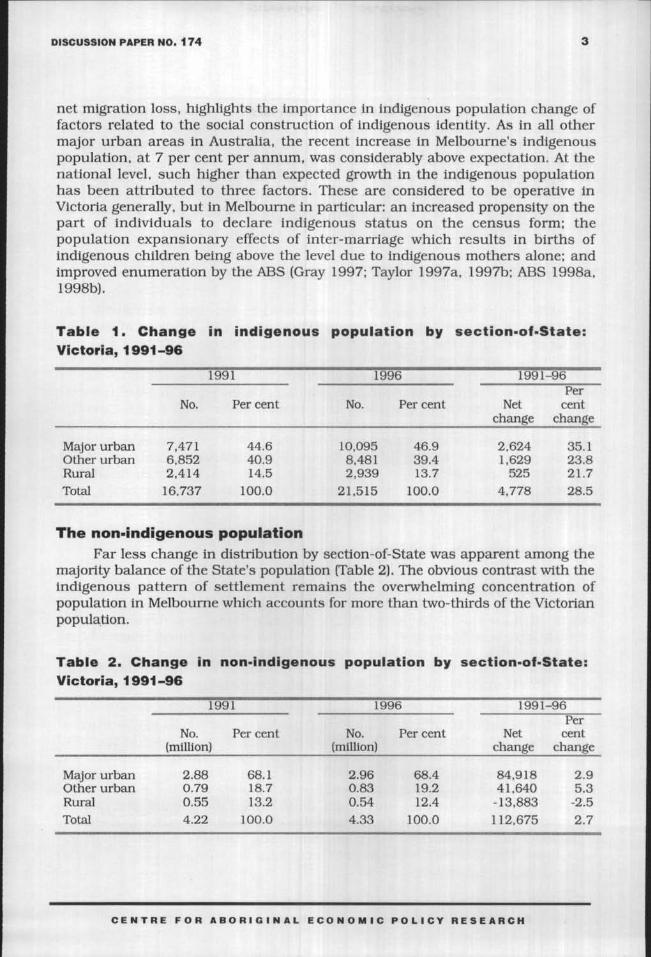
net migration loss, highlights the importance in indigenous population change offactors related to the social construction of indigenous identity. As in all othermajor urban areas in Australia, the recent increase in Melbourne's indigenouspopulation, at 7 per cent per annum, was considerably above expectation. At thenational level, such higher than expected growth in the indigenous populationhas been attributed to three factors. These are considered to be operative inVictoria generally, but in Melbourne in particular: an increased propensity on thepart of individuals to declare indigenous status on the census form; thepopulation expansionary effects of inter-marriage which results in births ofindigenous children being above the level due to indigenous mothers alone; andimproved enumeration by the ABS (Gray 1997; Taylor 1997a, 1997b; ABS 1998a,1998b).
Table 1. Change in indigenous population by section-of-State:Victoria, 1991-96
1991
Major urbanOther urbanRuralTotal
No.
7,4716,8522,414
16,737
Per cent
44.640.914.5
100.0
1996
No.
10,0958,4812,939
21,515
Per cent
46.939.413.7
100.0
1991-96
Netchange
2,6241,629
5254,778
Percent
change
35.123.821.728.5
The non-indigenous populationFar less change in distribution by section-of-State was apparent among the
majority balance of the State's population (Table 2). The obvious contrast with theindigenous pattern of settlement remains the overwhelming concentration ofpopulation in Melbourne which accounts for more than two-thirds of the Victorianpopulation.
Table 2. Change in non-indigenous population by section-of-State:Victoria, 1991-96
1991
Major urbanOther urbanRuralTotal
No.(million)
2.880.790.554.22
Per cent
68.118.713.2
100.0
1996
No.(million)
2.960.830.544.33
Per cent
68.419.212.4
100.0
1991-96
Netchange
84,91841,640-13,883112,675
Percent
change
2.95.3
-2.52.7
C E N T R E F O R A B O R I G I N A L E C O N O M I C P O L I C Y R E S E A R C H
TAYLOR
The fact that the highest growth of the majority population occurred in non-metropolitan urban centres contrasts with the situation observed for indigenouspeople and reflects to some extent counterurbanisation flows out of Melbourne aswell as the expansion of population on the metropolitan fringe (Hugo 1996; Maherand Caldow 1997:12-28). Much starker contrast with the pattern of indigenouspopulation change is provided by the general loss of population in rural areas. Asa consequence, the over-representation of indigenous people in rural areas hasbeen strengthened.
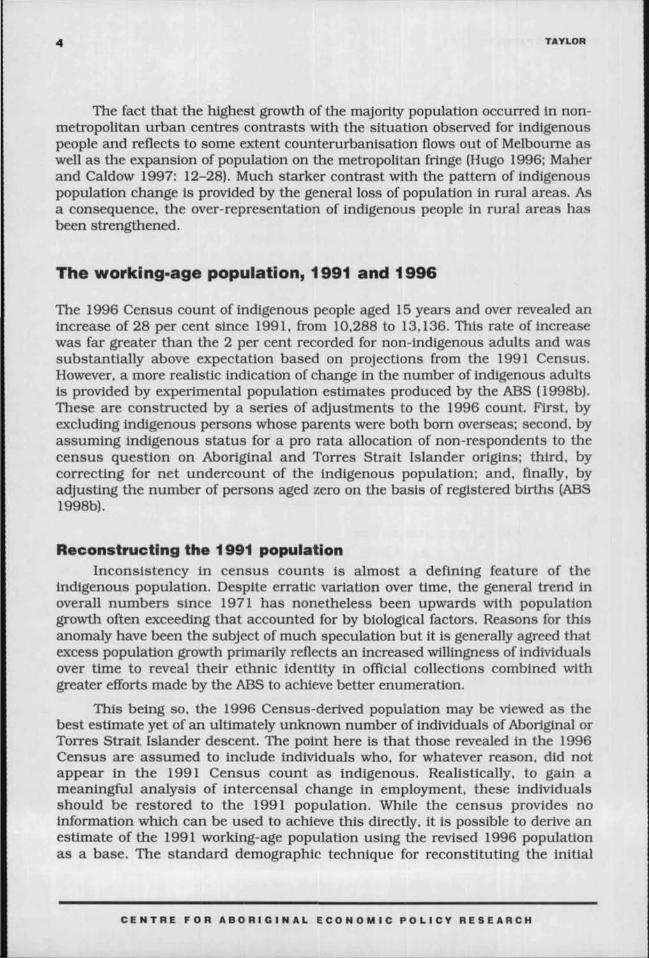
The working-age population, 1991 and 1996
The 1996 Census count of indigenous people aged 15 years and over revealed anincrease of 28 per cent since 1991, from 10,288 to 13,136. This rate of increasewas far greater than the 2 per cent recorded for non-indigenous adults and wassubstantially above expectation based on projections from the 1991 Census.However, a more realistic indication of change in the number of indigenous adultsis provided by experimental population estimates produced by the ABS (1998b).These are constructed by a series of adjustments to the 1996 count. First, byexcluding indigenous persons whose parents were both born overseas; second, byassuming indigenous status for a pro rata allocation of non-respondents to thecensus question on Aboriginal and Torres Strait Islander origins; third, bycorrecting for net undercount of the indigenous population; and,finally, byadjusting the number of persons aged zero on the basis of registered births (ABS1998b).
Reconstructing the 1991 populationInconsistency in census counts is almost a defining feature of the
indigenous population. Despite erratic variation over time, the general trend inoverall numbers since 1971 has nonetheless been upwards with populationgrowth often exceeding that accounted for by biological factors. Reasons for thisanomaly have been the subject of much speculation but it is generally agreed thatexcess population growth primarily reflects an increased willingness of individualsover time to reveal their ethnic identity in official collections combined withgreater efforts made by the ABS to achieve better enumeration.
This being so, the 1996 Census-derived population may be viewed as thebest estimate yet of an ultimately unknown number of individuals of Aboriginal orTorres Strait Islander descent. The point here is that those revealed in the 1996Census are assumed to include individuals who, for whatever reason, did notappear in the 1991 Census count as indigenous. Realistically, to gain ameaningful analysis of intercensal change in employment, these individualsshould be restored to the 1991population. While the census provides noinformation which can be used to achieve this directly, it is possible to derive anestimate of the 1991 working-age population using the revised 1996 populationas a base. The standard demographic technique for reconstituting the initial
C E N T R E F O R A B O R I G I N A L E C O N O M I C P O L I C Y R E S E A R C H

DISCUSSION PAPER NO. 174
population in this way is through reverse survival (Shyrock, Siegel and Associates1976: 262-3, 418-21) and this is applied by the ABS to generate new estimates ofthe 1991 population (ABS 1998b).
Application of the reverse survival procedure in this context involves takingthe population as counted in 1996, disaggregated by age and sex, and 'younging'this population by five years by making allowance for deaths that occurred overthe intercensal period, to estimate the population in each age-sex group in 1991(Taylor and Bell 1998). Thus, the population of males aged 20-24 in 1991 isestimated by applying reverse survival ratios to the male population aged 25-29in 1996. This is essentially the reverse of the standard procedure used in makingprojections of future population by the cohort-component method. The key toproducing reliable estimates by this technique is selection of the correct ratiosfrom an appropriate life table, that is, from a life table which accuratelysummarises the mortality experience of the relevant population over the periodbeing considered. Application of the reverse survival procedure to reconstitute theearlier population also assumes that the population is closed to interstatemigration.2
As indicated in Table 3, this procedure raises the 1991 working-agepopulation from the 10,288 revealed in the census count to an estimate of12,696. The 1996 estimated population is also higher at 13,863. Thus, theestimated increase in the indigenous working-age population over the intercensalperiod was only 1,167 or 9.2 per cent, though this is still substantially above theestimated growth of around 4 per cent recorded for the non-indigenous adultpopulation. The key policy implication of this differential is that the rate ofindigenous employment growth would need to be greater than for non-indigenouspeople, and at least equivalent to the growth in the indigenous working-age group,simply to maintain the employment/population ratio at its current low level. Theretrogressive nature of this connection is indicated by the fact that employmentgrowth could be relatively high but still have little appreciable impact on labourforce status.
Table 3. Estimated population aged 15 years and over: indigenous andnon-indigenous people in Victoria, 1991 and 1996
1 9 9 1 1 9 9 6 1 9 9 1 - 9 6Net change Per cent change
Indigenous 12,696 13,863 1,167 9.2Non-Indigenous 3.466,070 3.598,934 132,864 3.8
Source: ABS 1996b: 14, 1998b: 9-10.
C E N T R E F O R A B O R I G I N A L E C O N O M I C P O L I C Y R E S E A R C H
TAYLOR
Labour force status, 1991 and 1996
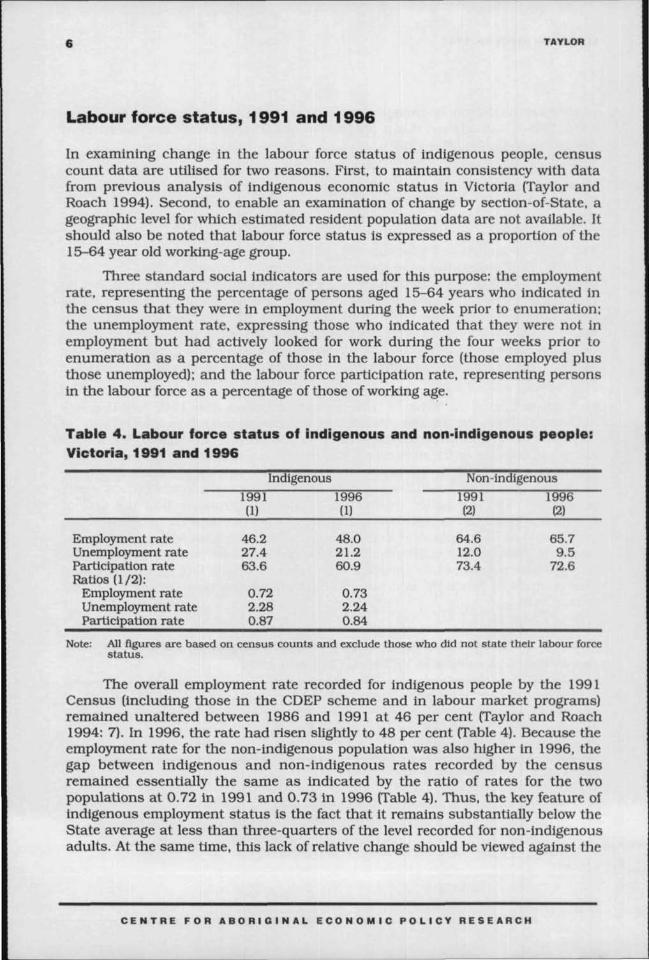
In examining change in the labour force status of indigenous people, censuscount data are utilised for two reasons. First, to maintain consistency with datafrom previous analysis of indigenous economic status in Victoria (Taylor andRoach 1994). Second, to enable an examination of change by section-of-State, ageographic level for which estimated resident population data are not available. Itshould also be noted that labour force status is expressed as a proportion of the15-64 year old working-age group.
Three standard social indicators are used for this purpose: the employmentrate, representing the percentage of persons aged 15-64 years who indicated inthe census that they were in employment during the week prior toenumeration;the unemployment rate, expressing those who indicated that they were not inemployment but had actively looked for work during the four weeks prior toenumeration as a percentage of those in the labour force (those employed plusthose unemployed); and the labour force participation rate, representing personsin the labour force as a percentage of those of working age.
Table 4. Labour force status of indigenous and non-indigenous people:Victoria, 1991 and 1996
Indigenous
Employment rateUnemployment rateParticipation rateRatios (1/2):
Employment rateUnemployment rateParticipation rate
1991(1)
46.227.463.6
0.722.280.87
1996(1)
48.021.260.9
0.732.240.84
Non-indigenous1991(2)
64.612.073.4
1996(2)
65.79.5
72.6
Note: All figures are based on census counts and exclude those who did not state their labour forcestatus.
The overall employment rate recorded for indigenous people by the 1991Census (including those in the CDEP scheme and in labour market programs)remained unaltered between 1986 and 1991 at 46 per cent (Taylor and Roach1994: 7). In 1996, the rate had risen slightly to 48 per cent (Table 4). Because theemployment rate for the non-indigenous population was also higher in 1996, thegap between indigenous and non-indigenous rates recorded by the censusremained essentially the same as indicated by the ratio of rates for the twopopulations at 0.72 in 1991 and 0.73 in 1996 (Table 4). Thus, the key feature ofindigenous employment status is the fact that it remains substantially below theState average at less than three-quarters of the level recorded for non-indigenousadults. At the same time, this lack of relative change should be viewed against the
C E N T R E F O R A B O R I G I N A L E C O N O M I C P O L I C Y R E S E A R C H
DISCUSSION PAPER NO. 174
background of sustained higher growth in the indigenous population of workingage.
Not surprisingly, given a rise in the employment rate, the census-derivedindigenous unemployment rate was lower in 1996,at 21 per cent, compared to1991, at 27 per cent (Table 4). However, once again, this was in line with thetrend generally in the State and the non-indigenous unemployment rate was alsolower in 1996 (9 per cent compared to 12 per cent). As a consequence, theunemployment level among indigenous people relative to that of the rest of thepopulation remained 2.2 times higher.
It is important to qualify discussions of relative employment andunemployment rates with data on relative rates of labour force participation, sincethe proportion of the indigenous population formally attached to the labourmarket has historically been well below the State average. The 1996 Censusindicates that this is still the case with the indigenous labour force participationrate actually lower in 1996 (61 per cent) compared to 1991 (64 per cent) and thusfell further behind relative to the rest of the population from 0.87 in 1991 to 0.84in 1996 (Table 4). This effectively means that more than one-third of allindigenous adults are neither working nor actively seeking work compared to onlyone-quarter of all other adults. It also suggests that any employment gains arelikely to have resulted more from people shifting out of unemployment as opposedto entering the workforce for the first time.
One factor which may have dampened growth in the indigenous labour forceparticipation rate is the effect of policies designed to encourage higher levels ofattendance and retention in educational institutions (Schwab 1995). In thiscontext, it is worth noting that attendance at educational institutions amongindigenous persons aged 15 years and over was 53 per cent higher at the 1996Census compared to the previous census. In 1991, a total of 1,655 adults wererecorded as attending an educational institution compared to 2,531 in 1996. Thisincrease was sufficient to slightly raise the proportion of the census-identifiedadult population in attendance at educational institutions from 16.1 per cent to19.3 per cent.
Section-of-State and gender variationsOne of the features of indigenous labour force status observed from the
1991 Census was a degree of difference between urban and rural populations,especially among males (Taylor and Roach 1994: 8-10). While the best labourmarket outcomes were observed in major urban areas, outcomes in rural areaswere generally better than those in other urban areas, partly because ruralemployment figures were inflated by the inclusion of participants in the LakeTyers Community Development Employment Projects (CDEP) scheme. Thispattern of labour force status by section-of-State was still evident in 1996.
Table 5 shows the net change between 1991 and 1996in the numbers ofindigenous and non-indigenous people employed by section-of-State. Overall, the
C E N T R E F O R A B O R I G I N A L E C O N O M I C P O L I C Y R E S E A R C H

TAYLOR
rate of increase in the number of indigenous employed was almost eight timesgreater than that recorded for the rest of the adult population. Furthermore, thisrelatively greater increase occurred regardless of location, although the highestrate of intercensal increase was recorded in urban centres. Also of note is the factthat indigenous employment growth was positive in rural areas even though non-indigenous rural residents experienced a net decline in employment. Thisvariation no doubt reflects the expansion of the CDEP scheme in ruralcommunities.
Table 5. Employment change among indigenous and non-indigenousAustralians by section-of-State: Victoria, 1991-96
Per cent employed
IndigenousMajor urbanOther urbanRuralTotal
1991
53.531.315.2
100.0
1996
54.531.314.2
100.0
ChangeNet
777420146
1,343
Per cent
33.330.722.030.7
Non-IndigenousMajor urbanOther urbanRuralTotal
69.817.013.2
100.0
70.217.312.4
100.0
57.57618,722-5,83270,466
4.66.2
-2.54.0
At the time of the 1991 Census, a total of 109 indigenous people wereregistered with the Aboriginal and Torres Strait Islander Commission asparticipants in the State's sole CDEP scheme at Lake Tyers. By 1996, the totalnumber of participants had grown to 355 while the number of individual schemeshad increased to 11. Most of the growth in participant numbers was accountedfor by the establishment of schemes in urban centres. In 1996, five CDEPschemes were located in urban settings in Melbourne, Bairnsdale, Shepparton,Swan Hill and Warrnambool and these accounted for 226 participants (63 percent of the State total). The question of how many of these participants wererecorded by the census as employed and what impact this had on estimatedchange in employment status is addressed in a later section.
The effect of variable jobs growth on changes in labour force status forindigenous and non-indigenous males and females by section-of-State is shown inTables 6 and 7. Among indigenous adults, the greatest shift, in terms of a higheremployment rate and lower unemployment rate, occurred in urban areas,especially away from Melbourne. Despite this, the poorest indigenous labour forcestatus is still recorded in non-metropolitan urban centres, a pattern which isrepeated among the non-indigenous labour force (Table 7).
C E N T R E F O R A B O R I G I N A L E C O N O M I C P O L I C Y R E S E A R C H

DISCUSSION PAPER NO. 174
Table 6. Labour force status of indigenous Australians by section-of-State and gender: Victoria, 1991 and 1996
Major urban Other urban Rural Total1991 1996 1991 1996 1991 1996 1991 1996
MalesEmployment rate 58.7 59.4 45.3 48.8 59.7 57.5 54.0 55.4Unemployment
rate 24.5 19.5 39.3 30.4 24.3 19.4 29.7 23.2Participation rate 77.8 73.8 74.7 70.0 79.0 71.4 76.9 72.1
FemalesEmployment rate 44.7 46.2 31.2 34.0 40.6 42.1 38.8 41.1Unemployment
rate 20.4 17.0 31.5 21.1 18.5 18.8 24.1 18.5Participation rate 56.1 55.6 45.5 43.1 49.8 51.8 51.1 50.4
As for gender differences, the employment rate for indigenous femalesremains substantially below that of indigenous males, especially outsideMelbourne, although a slight improvement in the relative position of females isevident in rural areas. This underlines the very low labour force status ofindigenous women in Victoria as they also fall considerably behind their non-indigenous counterparts with an overall employment rate at less than three-quarters that of other women in the State and an unemployment rate which ismore than twice as high. Furthermore, half of all indigenous women remainoutside of the labour force compared to around one-third of other women andone-quarter of indigenous men.
Table 7. Labour force status of non-indigenous Australians by section-of-State and gender: Victoria, 1991 and 1996
Major urban Other urban Rural Total1991 1996" ~1991 1996 1991 1996 1991 1996
MalesEmployment rate 72.7 73.5 72.7 72.6 75.1 75.0 73.0 73.5Unemployment
rate 13.0 9.9 13.1 11.3 11.0 8.7 12.8 10.0Participation rate 83.6 81.5 83.7 81.9 84.4 82.2 83.7 81.7
FemalesEmployment rate 56.9 58.9 52.3 54.2 56.9 58.7 56.1 58.0Unemployment
rate 11.3 8.8 11.4 9.9 8.9 7.2 11.0 8.8Participation rate 64.2 64.5 59.1 60.2 62.5 63.3 63.1 63.6
Overall, the key policy point to arise from these data is that the shift inindigenous labour force status has been more or less in line with the rest of the
C E N T R E F O R A B O R I G I N A L E C O N O M I C P O L I C Y R E S E A R C H

10 TAYLOH
population. Consequently the economic differentials remain largely unchangedwith outcomes for indigenous people still substantially behind those recorded forthe non-indigenous population regardless of sex and location.
Interpreting indigenous employment change, 1991and 1996
On the face of it, results from the 1996 Census regarding indigenous employmentsuggest a good news story—an increase of 1,348 people in work, constituting agrowth of 30 per cent since 1991 (6 per cent per annum). This apparent growthoccurred at a time when overall employment in Victoria increased by only 0.8 percent per annum. With a rate of employment expansion at the level implied by thisintercensal change, the policy goal of statistical equality in employment forindigenous people begins to look more achievable, contrary to earlier informedassessment (Sanders 1991). However, the ABS has advised a degree of cautionwhen interpreting apparent change to indigenous census characteristics as anyvariation may simply be a consequence of non-demographic increase in thepopulation (ABS 1998a).
Most research on this problem has been conducted in the United Stateswith respect to changes in the size and composition of the American Indianpopulation (Snipp 1986, 1997; Eschbach 1995; Sandefur, Rindfuss and Cohen1996; Eschbach, Supple and Snipp 1998). It is noted, for example, that theamount needed to make intercensal increase in numbers balance after accountingfor births, deaths and migration is usually small. However, in ethnic populationsdefined by self-identification, as in the case of American Indians, this 'error ofclosure' is often large due to shifts in the propensity of individuals to declare theirethnicity on census forms.3
What is not clear in such an event, is whether any aggregate changeobserved in population characteristics over time involves an alteration in thecircumstances of the original population or whether it merely reflects theparticular features of individuals appearing in the population for the first time.For example, it is possible that a comparison of census characteristics in 1991and 1996 could point to an improvement in economic status while the conditionof the original (1991) population had actually worsened. The problem for analystsand policy-makers is that any such change in the condition of the originalpopulation is undetectable. All that can be noted is different aggregate status.While there is some scope for estimating the compositional impact of newcomersto the population using fixed population characteristics, such as age left school(Eschbach, Supple and Snipp 1998; Hunter 1998), for characteristics that arevariable over time, such as employment status, this is simply not possible.
One correction to employment change data that can and should be made,however, is to establish a more realistic time series by estimating separatecomponents of employment at each census date. As a first step in this process,compensation for the effect of excess population increase is achieved by using therevised ABS estimate of the 1991 working-age population to re-align the 1991
C E N T R E F O R A B O R I G I N A L E C O N O M I C P O L I C Y R E S E A R C H

DISCUSSION PAPER NO. 174 11
employment level with an equivalent estimation for 1996. A further step is to thenestimate the contribution made to employment growth by non-market relatedgovernment program interventions. This has the effect of revealing the underlyingtrend in mainstream employment by discounting any cosmetic change broughtabout by merely administrative shifts in the labour force status of individuals.
Revising employment changeBecause reverse survival inevitably alters the age distribution, age-specific
employment rates from the 1991 Census are applied to the new estimated five-year age distribution of the working-age group to generate an upward adjustmentto the census-derived employment figure. Thus, as shown in Table 8, employmentin 1991 rises from the census count figure of 4,422 to an estimated 5,426.Likewise, the 1996 employment figure from the census is adjusted to align withthe 1996 ERP. This produces an estimate of employment in 1996 of 6,089. Usingthis adjusted estimate of 1991 employment as the new base, the intercensal risein the number of indigenous people employed becomes only 663 representing aincrease of 12 per cent. This is a much lower (and more realistic) growth rate thanthe 30 per cent increase obtained from a direct comparison of 1991 and 1996Census count data. However, a proportion of this growth can be accounted for byprogram intervention and this contribution has also to be estimated.
Table 8. Estimated indigenous employment in Victoria, 1991 and 1996
1991 1996"Estimate from
Census count reverse survival ERP
Population aged 15+
Employed
10,288
4,422
12,696
5,426
13,863
6,089
Program intervention and employment growth
An important consideration when accounting for variation in the number ofindigenous people recorded as employed is the fact that administrative changes inthe way the State handles entitlements for the unemployed and those not in thelabour force can effect a change in their labour force status as recorded by thecensus. Such program influences derive primarily from participation as paidemployees in the CDEP scheme and also via Department of EmploymentEducation Training and Youth Affairs (DEETYA) labour market programs thatwere in operation at the time of the 1991 and 1996 Censuses.
According to the ABS, the labour force status of labour market programparticipants is recorded by the census using the standard question aboutactivities in the week prior to enumeration (ABS 1995b: 8). Those in programsinvolving a form of wage subsidy or job placement are likely to regard themselves
C E N T R E F O R A B O R I G I N A L E C O N O M I C P O L I C Y R E S E A R C H
12 TAYLOR
as having undertaken paid work, and hence employed. Those in training, but withno subsidy, are more problematic. However, if these people held a part-time jobalong with their training then they were also likely to be regarded as employed.According to the Indigenous Employment Initiatives Branch of DEETYA, labourmarket programs that were likely to have contributed to employment numbers inthis way in 1996included various elements of the Training for AboriginalsProgram (TAP), Apprenticeship Wage Subsidies, Job Clubs, National TrainingWage Traineeships, the New Work Opportunities Program, Jobskills Projects, andthe various Jobtrain and Jobstart programs.
A question remains as to which of these programs actually generatedadditional employment for indigenous people. For example, some individuals inwage subsidised employment may have secured their position regardless.However, it is more likely that wage subsidies offer an important competitive edgefor indigenous people in the labour market given their multiple disadvantage insecuring employment (ABS/CAEPR 1996). Equally, it seems that indigenousDEETYA clients in wage subsidy programs would, in all probability, substitute fornon-indigenous employees given their small share of the population. This wouldserve to augment indigenous employment outcomes.
One pointer to this positive interpretation of the possible impact of programintervention is provided by the fact that nationally the indigenousemployment/population ratio was relatively stable between 1991 and 1994 ataround 35 per cent (ABS 1995a: 41), but in the space of two years to 1996 itincreased to 39 per cent. Accordingly, over the same two-year period theunemployment rate fell dramatically from 30.8 to 22.7. Such a positive shift inlabour force status is unlikely to have been produced by market forces alone,especially at a time of poor outcomes generally in the labour market. Given thecoincidence in timing, the suggestion here is that this improvement wasassociated with the introduction of the Working Nation initiatives launched by theLabor Government in May 1994, as well as by the continued expansion of theCDEP scheme. A key feature of the Working Nation initiatives was the JobCompact which gave people in receipt of unemployment allowances for more than18 months the guarantee of a job or training opportunity. Early interventions,case management and the National Training Wage were also major features ofWorking Nation programs.
The fact that indigenous people rely heavily on government program supportfor employment creation is well documented (Sanders 1993; Taylor and Hunter1996; Altman 1997; Taylor and Altman 1997). Any meaningful assessment ofintercensal employment change thus has to account for changes in suchprograms that may influence the number of individuals who could claim on thecensus form that they had a full-time or part-time job of any kind in the weekprior to enumeration. The contribution of these to employment growth isestimated using administrative data.
As far as employment via the CDEP scheme is concerned, this cannot beestablished for Victoria from census data. However, it was known from the 1993
C E N T R E F O R A B O R I G I N A L E C O N O M I C P O L I C Y R E S E A R C H

DISCUSSION PAPER NO.174 13
Review of the scheme that not all scheme participants were involved inemployment at any one time and an overall estimate of 60:40 working to non-working participants was derived from case studies (Deloitte Touche Tohmatsu1993: 51). Given that this estimate was drawn largely from rural-based schemes,the same ratio can be applied to participant numbers for the Lake Tyers schemeto derive an estimate of 65 CDEP employees in 1991. In urban schemes, othercase studies suggest a higher ratio of 80:20 working/non-working participants(Smith 1994a, 1995,1996). If this ratio is applied to those urban-based schemesoperating at the time of the 1996 Census then, altogether in 1996, an estimate of258 CDEP scheme employees is derived (Table 9). Subtraction of these 1991 and1996 estimates of CDEP scheme employment from total employment in each yearproduces estimates of non-CDEP scheme employment (Table 9). This is shown tohave risen by 9 per cent from 5,361 to 5,831.
Table 9. Estimates of mainstream indigenous employment Victoria,1991 and 1996
1991 1996Total employedEmployed in CDEPEmployed in non-CDEPEmployed in labour market programsEmployed in mainstreamMainstream employment/population ratio
Net change in mainstream employment
5,426a 6,089b
65C 258d5,361 5,831
123e 810f5,238 5,02141.2 36.2
-217 (-0.8per cent per annum)
Note: a. Estimated by applying 1991 age-specific employment rates to the 1991 ERP derived fromreverse survival.
b. Estimated by applying 1996 age-specific employment rates to the 1996 ERP.
c. Based on a ratio of 60:40 working to non-working participants.
d. Based on a ratio of 60:40 working to non-working CDEP scheme participants in ruralschemes and a ratio of 80:20 in all other schemes.
e. Includes placements in DEETYA programs A20. A30. A31, A42. HIS, U13. Wl 1, W12. W13,W15, W16, W20, W33.
f. Includes placements in DEETYA programs A20, A30, A31, F12, F13, G20, H15, H42, H43,N20. N21, N42. N43, Oil. Sll. U13, W40. W41, W42. W43.
Labour Market program codes: A20—Major Employment Strategies; A30—Job SkillsDevelopment (TAP Private Sector); A31—Work Experience/WIP; A42—Enterprise EmploymentAssistance; F12 and F13—New Enterprise Incentive Scheme Formal Training; G20—GroupEmployment Program; HIS—Disabled Apprenticeships; H42 and H43—Apprenticeship WageSubsidy; N20, N21,N42, N43—National Training Wage Program; Oil—New WorkOpportunities Program; Sll^Job Skills Umbrella Projects; U13—SAP; Wll , W12, W13, W15,W16, W20. W33, W40. W41, W42, W43-^Jobstart.
Further adjustment to this employment growth is achieved by accountingfor those employed via placement in a labour market program. The number ofindigenous placements in programs that were likely to have produced anemployment outcome at the time of the census are available from the DEETYA
C E N T R E F O R A B O R I G I N A L E C O N O M I C P O L I C Y R E S E A R C H

14 TAYLOR
program database. At the time of the 1991 Census, a total of 403 indigenouspeople were in such programs. By 1996, this number had risen to 1,096.
Subtraction of these figures from the non-CDEP employed produces a finalresidual estimate of non-program dependent mainstream employment. As shownin Table 9, this reveals an estimated net intercensal fall in mainstreamemployment of 217 positions representing a rate of decline of 0.8 per cent perannum. With growth in the estimated working-age population at 1.8 per cent perannum, this lag in employment growth resulted in a substantial drop in themainstream employment/population ratio from 41.2 to 36.2.
If the mainstream employment rates shown in Table 9 are compared withequivalent non-indigenous rates, by excluding non-indigenous labour marketprogram participants as well, then the ratio of indigenous to non-indigenousemployment rates is estimated to have fallen over the intercensal period from 0.65in 1991 to 0.57 in 1996.4 The policy message from this is clear. Without the propof program intervention in the labour market, the indigenous employment rate inVictoria would have been far below the level recorded by the 1996 Census andjust over half that recorded for the rest of the population.
Income status, 1991 and 1996
A key goal of government policy is to achieve an improvement in income levels forindigenous Australians to a point where they are equivalent to those of thegeneral population. In this endeavour, much depends not just on accelerating therate of employment growth among indigenous people above that of the rest of theworkforce, but also on ensuring that the types of jobs created generate incomesthat are at least commensurate with those of the general population.
Accurate data on overall levels of income, as well as on income derived fromemployment and non-employment sources, are notoriously difficult to obtain dueto a variety of conceptual problems. For one thing, the census collects and reportsinformation on income received 'each week', whereas the flow of income for manyindividuals, especially indigenous people, is often intermittent. Thus, the censusapproach refers to income received from all sources in respect of a 'usual week'and this is then rounded up to annual income. However, what might constitute'usual weekly' income in many households is difficult to determine. Aside fromregular income flows from employment or welfare payments, there is thelikelihood of intermittent employment income as well as windfall gains frominvestments or loans. Among some indigenous people this may extend to royaltyand rental payments. On the debit side, there may be sporadic reductions ofincome due to loss of employment or cash transfers to others. Taken together,these flows can create a highly complex picture, even over a short space of time,and one that census methods of data gathering are likely to misrepresent.
A further point to note is that census data report income as a range withinan income category with the highest category left open-ended. Consequently,actual incomes have to be derived. In estimating total and mean incomes, the
C E N T R E F O R A B O R I G I N A L E C O N O M I C P O L I C Y R E S E A R C H

DISCUSSION PAPER NO. 174 15
mid-point for each income category is used on the assumption that individualsare evenly distributed around this mid-point. The open-ended highest category isproblematic, but it is arbitrarily assumed that the average income received byindividuals in this category was one-and-a-half times the lower limit of thecategory (Treadgold 1988).5 Clearly, estimates of mean incomes will varyaccording to the upper level adopted.
Despite these caveats, the census remains the most comprehensive sourceof income data derived from a consistent methodology.The gross income reportedis intended to include family allowances, pensions, unemployment benefits,student allowances, maintenance, superannuation, wages, salary, dividends,rents received, interest received, business or farm income and worker'scompensation received. Apart from enabling comparison between populationgroups, individual and household income can be established. Also, by cross-tabulating census data on labour force status and income a basis fordistinguishing employment income from non-employment income is provided, thelatter being a proxy measure of welfare dependence.
Figure 1. Annual income distribution of indigenous and non-indigenousadults: Victoria,1996
40
35
£> 30
849
25
20
15
1.O
Indigenous-Non-indigenous
0-4.000 4.0OO-1 1.9OO
12.OOO-19.9OO
20,000-39.900
Dollars
40,000-59,900
60,000-79.OOO
8O.OOO+
Figure 1 describes the relative income distribution for indigenous adults inVictoria in 1996. Clearly, the bulk of indigenous incomes are clustered at thelower end of the distribution with as much as 44 per cent of individuals in receiptof incomes of less than $20,000 and a relatively small share (28 per cent) withincomes over $40,000. This contrasts markedly with the income distribution
C E N T R E F O R A B O R I G I N A L E C O N O M I C P O L I C Y R E S E A R C H

16 TAYLOR
pattern for all other adults with only 35 per cent receiving incomes below $20,000and 44 per cent over $40,000.
Surprisingly, given the lack of improvement in labour force status, thecensus indicates some narrowing of the income gap between indigenous and non-indigenous adults. Mean income for the indigenous adult population in 1996 was$16,600, up from $13,900 in 1991. This produces a ratio of mean indigenousincome to that for the rest of the population of 0.75 in 1996, which is higher thanthe ratio of 0.72 calculated for 1991 (Table 10). Median income figures appearsomewhat lower because of the different bases for calculation, although theincome ratios reveal the same trend. Notwithstanding this positive shift,indigenous incomes remain, on average, at only three-quarters of the levelreported generally in Victoria.
Table 10. Income status of indigenous and non-indigenous Australians:Victoria, 1991 and 1996
Mean ($000)Median ($000)
Indigenous1991
13.911.1
Individual incomeNon-indigenous
1996
16.612.5
1991
19.216.5
1996
22.117.7
Ratio of indigenous/non-indigenous
Mean ($000) 0.72 0.75Median ($000) 0.67 0.71
Income change by section-of-StateSome indication that better labour market outcomes in Melbourne may have
led to higher income is provided by data on the income status of indigenouspeople by section-of-State (Table 11). In 1991, and in 1996, average income forindigenous people in rural areas and non-metropolitan towns was around 20 percent below that of indigenous people in Melbourne. While a similarmetropolitan/non-metropolitan income differential is evident for the rest of thepopulation, this gap is less marked with non-metropolitan incomes only around12 per cent lower. As with the population generally, higher indigenous averageincome in Melbourne no doubt reflects the greater diversity of metropolitaneconomic activity and the relative concentration of higher status occupations,although for indigenous people it may also reflect the fact that much employmentgrowth away from Melbourne has been due to increased CDEP schemeparticipation which generates only part-time work with salaries tied to Newstartallowance.
C E N T R E F O R A B O R I G I N A L E C O N O M I C P O L I C Y R E S E A R C H

DISCUSSION PAPER NO. 174 17
Table 11. Income status of indigenous and non-indigenous Australiansby section-of-State: Victoria, 1991 and 1996
Individual incomeMajor urban19911996"
Other urban19911996"
Rural Total1991 1996 1991 1996
IndigenousMean ($000) 15.5 18.4 12.3 14.7 12.7 15.5 13.9 16.6Median ($000) 12.7 14.3 10.0 11.5 10.0 10.7 11.1 12.6
Non-indigenousMean ($000) 20.0 23.1 17.2 19.5 17.4 20.2 19.2 22.1Median ($000) 17.3 18.7 15.1 15.9 14.1 15.7 16.5 17.7
Ratio of indigenous/non-indigenous
Mean ($000) 0.78 0.79 0.72 0.75 0.73 0.77 0.72 0.75Median ($000) 0.73 0.77 0.66 0.72 0.71 0.68 0.67 0.71
Table 12. Income status of indigenous and non-indigenousAustraliansby sex: Victoria, 1991 and 1996
Individual incomeMales
IndigenousMean ($000)Median ($000)
Non-indigenousMean ($000)Median ($000)
Ratio of indigenous/non-indigenous
Mean ($000)Median ($000)
1991
16.013.8
23.921.2
0.670.65
1996
18.914.1
27.723.4
0.680.60
Females1991
11.89.6
14.211.4
0.830.84
1996
14.511.7
16.612.8
0.880.91
Total1991
13.911.1
19.216.5
0.720.67
1996
16.612.6
22.117.7
0.750.71
Income change by sexAs in 1991, the 1996 Census reveals a substantial income differential
between indigenous males and females in Victoria (Table 12), though the gap inaverage incomes ($18,900 for males and $14,500 for females) is far less thanamong their non-indigenous counterparts ($27,700 for males compared to$16,600 for females). One implication is that the ratio of average income forindigenous males compared to that of non-indigenous males (0.68) is far lowerthan the equivalent ratio between indigenous females and other females (0.88),while the gap between female incomes also narrowed considerably.
Employment income and welfare dependenceAn important issue with regard to the economic impact of employment
change concerns the contribution of employment income to total income relative
C E N T R E F O R A B O R I G I N A L E C O N O M I C P O L I C Y R E S E A R C H

18 TAYLOR
to the contribution made from other sources. This provides some indication of theability of regional populations to provide for their own welfare as opposed todepending on State support (Altman and Smith 1993). By cross-tabulatingemployment status against income, a direct measure of the income return fromemployment can be derived. Likewise, the income of those who are unemployed ornot in the labour force can be used as a proxy measure of welfare dependence.Average incomes calculated on this basis are shown in Table 13.
Overall, there has been little change in the contribution of employmentincome to total income. In 1991, 71.5 per cent of income for indigenous peoplewas derived from employment. By 1996, this proportion had barely risen to 72 percent. Compared to the equivalent figure of 88 per cent for the non-indigenouspopulation this means that a far higher proportion of indigenous people (28 percent compared to 12 per cent) remain dependant on non-employment sources ofincome.
Table 13. Total income of indigenous and non-indigenous Australians bylabour force status: Victoria, 1991 and 1996
1991Income
($million)Per cent
1996Income
($million)Per cent
IndigenousEmployed 84.3Unemployed 12.0Not in labour force 21.6Total 117.9
Non-indigenousEmployed 42,758.9Unemployed 1,782.4Not in labour force 4,066.1Total 48,607.4
71.510.218.3
100.0
88.03.78.4
100.0
135.112.340.1
187.5
53,230.71,496.15,266.7
59,993.5
72.06.6
21.4100.0
88.72.58.8
100.0
While this levelling off in the share of income from employment halts a long-term trend of a decline in employment income relative to total income noted forindigenous Australians (Daly and Hawke 1993), it also signals that increasedemployment alone is not sufficient to enhance income status. Of equal importanceto job creation is the nature of the work involved and the income it generates. Itcould be argued, for example, that the proportion of total income derived fromemployment should be lower by an amount equivalent to the notional citizenentitlements attached to CDEP participation as this represents income that isproperly welfare-related rather than employment-based (Smith 1994b).
Actual shifts in mean employment and non-employment incomes are shownin Table 14. The most striking feature is that mean employment income forindigenous people has increased at more or less the same rate as for others inemployment. This is indicated by the lack of change in the ratio of
C E N T R E F O R A B O R I G I N A L E C O N O M I C P O L I C Y R E S E A R C H

DISCUSSION PAPER NO. 174 19
indigenous/non-indigenous employment incomes which remains at around 0.83.As for non-employment income, the mean individual income of unemployedindigenous people in 1996was $8,420 and $9,490 for those not in the labourforce. Compared to income from employment, these figures have remainedessentially unaltered with the result that the income gap between thoseindigenous people in work and those more directly dependant on income transfersfrom the State has widened considerably.
Table 14. Mean employment/non-employment income of indigenous andnon-indigenous Australians: Victoria, 1991 and 1996
Mean income ($000) ChangeLabour force status 1991 1996 Net Percent
IndigenousEmployedUnemployedNot in labour forceTotal
20.378.157.69
13.98
24.368.429.49
16.69
4.00.31.82.7
19.63.3
23.519.4
Non-indigenousEmployed 24.91 29.42 4.5 18.1Unemployed 8.22 8.06 -0.2 -1.9Not in labour force 6.87 7.40 0.5 7.7Total 19.24 22.17 2.9 15.2
Ratio of indigenous/non-indigenous
EmployedUnemployedNot in labour forceTotal
0.820.991.120.73
0.831.041.280.75
0.010.050.160.03
1.25.3
14.63.6
Policy implications
Although census data remain the primary source of information on the economicstatus of indigenous Australians, and certainly the most comprehensive, somecare is required in their interpretation for public policy purposes. At amethodological level, it should be noted that any change in characteristicsobserved between censuses does not necessarily apply to the population identifiedat the start of the intercensal period. In fact, because of the identification of agreater than expected indigenous population in 1996, change to the original 1991population cannot be adequately established. What can and should be done inthis event is to estimate characteristics for the original population (whereappropriate) using ABS experimental population estimates derived from reversesurvival procedures as a basis. This has the effect of properly aligning time seriesdata.
C E N T R E F O R A B O R I G I N A L E C O N O M I C P O L I C Y R E S E A R C H

20 TAYLOR
On a more conceptual level, it should be noted that as long as the censusquestion on Aboriginal and Torres Strait Islander origins remains the sole meansof comprehensively defining the indigenous population, then it is likely that thenumbers identified in this way will continue to rise steadily due to improvedenumeration, changes in identification and the flow-on effects of inter-marriage(Gray 1997; ABS 1998c). At a time of growing pressure for targeted servicedelivery that is cost-effective and based on demonstrated need, this prospect of anever-expanding population requires careful consideration. In this context, it isworth recalling the Commonwealth's three-part definition of an indigenousAustralian:
• that an individual has Aboriginal or Torres Strait Islander descent;• identifies as an Aboriginal or Torres Strait Islander; and• is accepted as an Aboriginal or a Torres Strait Islander by the community in
which he or she lives.
The fact is, of course, that the indigenous population revealed by the censusconforms with only the first and/or second of these criteria, and even then only tothe extent that a collection of individuals tick the appropriate box on a censusform which asks if they are of Aboriginal or Torres Strait Islander origin.6 Whilethe third of these criteria may not always be applied when recording indigenousstatus in administrative statistical collections, its lack of application in the censusmethodology means that the census-derived indigenous population would almostcertainly be of a different size to any population based on the full Commonwealthdefinition. This effectively raises the prospect of different indigenous populationseventuating in different statistical contexts, with that derived from the censusbeing just one of these, though probably the most inclusive.
While recognising this complexity, the key question for policy analystsarising from an examination of census data is whether growth of the populationidentified by the census question on indigenous origins has resulted in analteration to the absolute and relative level of indigenous economic status inVictoria. Results from the above analysis suggest that it has not.
In assessing this, the first point to note is that change in social indicatorsfor the period 1986-91 (Taylor and Roach 1994), and now for the 1991-96 period,provides a ten-year window on the economic status of indigenous people in theState. This essentially covers a period of substantial efforts by the former federalLabor Government to enhance employment outcomes and income levels.
The results indicate a consistent pattern of outcomes over this period. Onthe one hand, the number of indigenous people recorded as employed has risen,the employment rate is higher and unemployment rate lower but there has beenno closing of the gap in these indicators with the rest of the population. When thedata are disaggregated by section-of-State, and the nature of employment growthis investigated, these achievements, especially in non-metropolitan areas, areshown to be largely related to an expansion of the CDEP scheme. Overall, othergovernment labour market programs under the now defunct Working Nation
C E N T R E F O R A B O R I G I N A L E C O N O M I C P O L I C Y R E S E A R C H

DISCUSSION PAPER NO. 174 21
initiatives also contributed. The indication is that growth in mainstream, or non-program linked employment, lagged behind population growth and that the truelevel of indigenous employment fell to almost half that recorded for the rest of theState's population.
The other consistent feature of the past decade is that the relatively lowincome status of indigenous people has remained effectively unaltered. In thecontext of apparently enhanced labour force status, this underlines the need forquality, as well as quantity, in job acquisition if the overall aim of governmentpolicy to raise economic status is to be achieved. From a labour marketperspective, one difficulty continues to be the substantial proportion ofindigenous adults of working age who are not in the labour force. This isespecially so among females and accounts, in large part, for the persistence ofrelatively high levels of welfare dependence.
A growing reliance on labour market programs to keep up with employmentdemand from population growth raises further pressing issues in the context ofnew directions for indigenous economic policy that have emerged since 1996. Ofparticular interest here is the 1998 Budget announcement that the objective ofthe CDEP scheme will be revised to focus solely on providing employment andskills development with non-working participants becoming clients of the socialsecurity system (Commonwealthof Australia 1998b: 11). Also of note is a freezeon further expansion of the CDEP scheme with a global allowance of 550 placesper annum in existing schemes to accommodate natural increase. Whilemovement off the scheme of non-working participants will create some space forworking participants, the effect of such changes on indigenous employment andunemployment statistics in non-metropolitan Victoria is difficult to predict.
Accompanying these changes to CDEP, and more generally in the thrust ofindigenous economic policy, is a re-orientation towards private sector activities asthe primary source of future employment growth. This trend appears inevitablegiven the downsizing of public sector opportunities and the fiscal squeeze onmany indigenous organisations and areas of the mainstream public sector whereindigenous people have, to date, found an employment niche. A paralleldevelopment of substantial significance is the replacement of the CommonwealthEmployment Service by contracted employment provision agencies and thedismantling and restructuring of government employment assistance. Under thenew Job Network system, intensive assistance is available to job seekers whoencounter the greatest employment placement difficulty. In this assessmentAboriginal and Torres Strait Islander status assumes considerable weighting asdo many other characteristics, such as duration of unemployment and loweducational status, which will favour indigenous people (Commonwealth ofAustralia 1998a). However, just what effect these new arrangements will have onemployment outcomes for indigenous people remains to be seen. As it stands,there are 36 Job Network member agencies registered in West and InnerMelbourne, 35 in East Melbourne, 19 in Geelong, 18 in the Central Highlands,and 13 in Gippsland. Many of these involve the same State-wide agenciesservicing multiple branches, but only one (in Mildura and also servicing Swan Hill
C E N T R E F O R A B O R I G I N A L E C O N O M I C P O L I C Y R E S E A R C H

22 TAYLOR
and Robinvale) is an Aboriginal organisation. This leaves the whole issue ofdedicated services for indigenous job-seekers open to question.
It seems inevitable, however, that the privatisation of employment serviceswill produce greater fluidity in the labour market circumstances of indigenouspeople. As far as engaging the private sector is concerned, some of the issueslikely to be encountered include a possible lowering of average incomes and thelikelihood of less job security, more casual/part-time work and feweropportunities for women and older people (Taylor and Hunter 1997).
In terms of anticipating where opportunities in the private sector might begenerated, an important consideration in Victoria is the greater concentration ofindigenous people in non-metropolitan parts of the State, especially ineconomically depressed country towns. As for those resident in Melbourne,despite being closer to the hub of private sector activity, they remain under-represented in many of the industries that employ large numbers of metropolitanworkers. For example, the retailing, manufacturing, hospitality, finance,construction and transport industries (Taylor and Liu Jin 1995; Taylor and Liu1996). This lack of penetration in leading urban employment sectors raisesquestions about the effectiveness of job programs and the prospect that a widerrange of industry strategies targeted at typically metropolitan jobs may berequired. Clearly, some focus on the special needs of the city-based population isnecessary given the much larger population presence in Melbourne thanpreviously indicated.
For all regions, though, it is important to ask how the broad strategy ofraising employment levels might be targeted to suit particular localcircumstances. In this context, an initial requirement is for detailed regionally-based quantitative assessments of the supply of, and demand for, indigenouslabour for different economic activities that either exist already or that may becreated at the local level. Only then can the appropriate mix of resources forenterprise development and training be appropriately channelled. There is a rolehere for the government-appointed Area Consultative Committees and, possibly,for indigenous organisations acting as employment providers within the new JobNetwork and engaging in the development of employment and training strategies.
Finally, even if sufficient new work in excess of growing demand were to begenerated, it is important to note that the enhancement of occupational status,and not just labour force status, will be necessary to meet policy goals. To date,improvements in labour force status while keeping just ahead of populationgrowth have not impacted on the gap in average incomes. For this to change,indigenous people will need to acquire employment at a much faster rate and inpositions that provide an income at least commensurate with those obtained bythe rest of the workforce. This places the policy focus firmly back on to skillsdevelopment.
C E N T R E F O R A B O R I G I N A L E C O N O M I C P O L I C Y R E S E A R C H

DISCUSSION PAPER NO. 174
Notes
1. The ABS sections-of-State within Victoria are as follows: 'major urban' (Melbourne andGeelong); 'other urban' (referred to as simply 'urban' in the text)—all urban centreswith a population of 1,000 to 99,999; 'bounded locality'—all population clusters of 200to 999 persons; 'rural balance'—the rural remainder of the State.
2. A net migration loss to the total indigenous population of Victoria of 516 persons wasrecorded over the 1991-96 intercensal (ABS 1998b: 24).
3. The term, error of closure, derives from the basic demographic balancing equation andrefers to the amount needed to make intercensal change in numbers balance afteraccounting for births, deaths and migration. Error of closure is usually small, but inpopulations defined by self-identification it is often large due to shifts in thepropensity to so identify. For further discussion see Passel (1997).
4. This is based on recalculating the non-indigenous employment rates in 1991 and1996 using data supplied by DEETYA on non-indigenous participation in job-relatedlabour market programs. This indicates that 2,294 non-indigenous persons were insuch programs in 1991 and 20,486 in 1996.
5. In this analysis the full range of income categories has been utilised with $70,000+ asthe highest category in 1991 and $78,000+ in 1996.
6. It is worth noting that the census question refers to 'origins' while the officialCommonwealth definition refers to 'descent'. These terms may well be construeddifferently by respondents to official statistical collections. I am grateful to Dr LenSmith of the ANU for pointing this out.
C E N T R E F O R A B O R I G I N A L E C O N O M I C P O L I C Y R E S E A R C H

24 TAYLOR
References
Altman, J.C. 1997. 'The CDEP scheme in a new policy environment: options for change?',CAEPR Discussion Paper 148, Centre for Aboriginal Economic Policy Research, TheAustralian National University, Canberra.
Altman, J.C. and Smith, D.E. 1993. The welfare dependence of Aboriginal Australians:policy implications', Social Security Journal, March 1993: 19-43.
Australian Bureau of Statistics (ABS) 1995a. National Aboriginal and Tones Strait IslanderSurvey 1994: Detailed Findings, cat. no. 4190.0, ABS, Canberra.
Australian Bureau of Statistics (ABS) 1995b. Measuring Employment and Unemployment:Information Paper, cat. no. 6279.0, ABS, Canberra.
Australian Bureau of Statistics (ABS) 1996a. 1994 National Aboriginal and Torres StraitIslander Survey: Victoria, cat. no. 4190.2, ABS, Canberra.
Australian Bureau of Statistics (ABS) 1996b. Experimental Projections: Aboriginal andTorres Strait Islander Population, June 1991-June 2001, cat. no. 3231.0, ABS,Canberra.
Australian Bureau of Statistics (ABS) 1998a. Occasional Paper: Population Issues,Indigenous Australians, cat. no. 4708.0, ABS, Canberra.
Australian Bureau of Statistics (ABS) 1998b. Experimental Estimates of the Aboriginal andTorres Strait Islander Population: 30 June 1991-30 June 1996, cat. no. 3230.0, ABS,Canberra.
Australian Bureau of Statistics (ABS) 1998c. Experimental Projections of the Aboriginal andTorres Strait Islander Population: 1996-2006, cat. no. 2035.0, ABS, Canberra.
Australian Bureau of Statistics/Centre for Aboriginal Economic Policy Research(ABS/CAEPR) 1996. 1994 National Aboriginal and Torres Strait Islander SurveyEmployment: Outcomes Jor Indigenous Australians, cat. no. 4199.0, ABS, Canberra.
Commonwealth of Australia 1998a. Job Network: Job Seeker Classification Instrument,Department of Employment, Education, Training and Youth Affairs, Canberra.
Commonwealth of Australia 1998b. Addressing Priorities in Indigenous Affairs, MinisterialStatement by Senator the Honorable John Herron, Minister for Aboriginal and TorresStrait Islander Affairs, 12 May 1998, Australian Government Publishing Service,Canberra.
Daly, A.E. and Hawke, A.E. 1993. 'Work and welfare for indigenous Australians', CAEPRDiscussion Paper No. 48, Centre for Aboriginal Economic Policy Research, TheAustralian National University, Canberra.
Deloitte Touche Tohmatsu 1993. No Reverse Gear: A National Review of the CommunityDevelopment Employment Projects Scheme, Report to the Aboriginal and Torres StraitIslander Commission. Canberra.
Eschbach, K. 1995. The enduring and vanishing American Indian: American Indianpopulation growth and intermarriage in 1990', Ethnic and Racial Studies, 18 (1):89-109.
C E N T R E F O R A B O R I G I N A L E C O N O M I C P O L I C Y R E S E A R C H

DISCUSSION PAPER NO. 174
Eschbach, K., Supple, K. and Snipp, M.C. 1998. 'Changes in racial identification and theeducational attainment of American Indians, 1970-1990', Demography, 35 (1):forthcoming.
Gray, A. 1997. "The explosion of aboriginality: components of indigenous population growth1991-96', CAEPR Discussion Paper No. 142, Centre for Aboriginal Economic PolicyResearch, The Australian National University, Canberra.
Hugo, G. 1996. 'Counter-urbanisation', in P.W. Newton and M. Bell (eds), Population Shift:Mobility and Change in Australia, Australian Government Publishing Service,Canberra.
Hunter, B. 1998. 'Assessing the utility of 1996 Census data on indigenous Australians',CAEPR Discussion Paper 154, Centre for Aboriginal Economic Policy Research, TheAustralian National University, Canberra.
Maher, C. and Caldow, W. 1997. Atlas oj the Australian People—1991 Census: Victoria,Australian Government Publishing Service, Canberra.
Passel, J.S. 1997. 'The growing American Indian population, 1969-1990: beyonddemography', in G.D. Sandefur, R.R. Rindfuss and B. Cohen (eds) Changing Numbers,Changing Needs: American Indian Demography and Public Health, National AcademyPress, Washington D.C.
Sandefur, G.D., Rindfuss, R.R. and Cohen, B. (eds) 1996. Changing Numbers, ChangingNeeds: American Indian Demography and Public Health, National Academy Press,Washington D.C.
Sanders, W. 1991. 'Destined to fail: the Hawke Government's pursuit of statistical equalityin employment and income between Aborigines and other Australians by the year2000 (or a cautionary tale involving the new managerialism and social justicestrategies)', Australian Aboriginal Studies, 1991/2: 13-18.
Sanders, W. 1993. The rise and rise of the CDEP scheme: an Aboriginal 'workfare' programin times of persistent unemployment', CAEPR Discussion Paper No. 54, Centre forAboriginal Economic Policy Research, The Australian National University, Canberra.
Schwab, R.G. 1995. 'Twenty years of policy recommendations for indigenous education:overview and research implications', CAEPR Discussion Paper No. 92, Centre forAboriginal Economic Policy Research, The Australian National University, Canberra.
Shyrock, H.S., Siegel, J.S. and Associates 1976. The Methods and Materials of Demography(Condensed Edition), Academic Press, New York.
Smith, D.E. 1994a. 'Working for CDEP: a case study of the Community DevelopmentEmployment Projects scheme in Port Lincoln, South Australia', CAEPR DiscussionPaper No. 75, Centre for Aboriginal Economic Policy Research, The Australian NationalUniversity, Canberra.
Smith, D.E. 1994b. The labour force status of indigenous Australians a consideration ofthe cross-cultural validity of social indicators', CAEPR Discussion Paper No. 65, Centrefor Aboriginal Economic Policy Research, The Australian National University,Canberra.
C E N T R E F O R A B O R I G I N A L E C O N O M I C P O L I C Y R E S E A R C H

26 TAYLOR
Smith, D.E. 1995.'Redfern works: the policy and community challenges of an urban CDEPscheme', CAEPR Discussion Paper No. 99, Centre for Aboriginal Economic PolicyResearch, The Australian National University, Canberra.
Smith, D.E.1996.'CDEP as urban enterprise: the case of Yarnteen Aboriginal and TorresStrait Islanders Corporation, Newcastle', CAEPR Discussion Paper No. 114, Centre forAboriginal Economic Policy Research, The Australian National University, Canberra.
Snipp, M.C. 1986. 'Who are American Indians? Some observations about the perils andpitfalls of data for race and ancestry', Population Research and Policy Review, 5:237-52.
Snipp, M.C. 1997. 'Some observations about racial boundaries and the experiences ofAmerican Indians', Ethnic and Racial Studies, 20 (4): 667-89.
Taylor, J. 1993a. The Relative Economic Status of Indigenous Australians, 1986-91,Research Monograph No. 5, Centre for Aboriginal Economic Policy Research, TheAustralian National University, Canberra.
Taylor, J. 1993b. Regional Change in the Economic Status of Indigenous Australians, 1986-91, Research Monograph No. 6, Centre for Aboriginal Economic Policy Research, TheAustralian National University, Canberra.
Taylor, J. 1997a. 'Policy implications of indigenous population change, 1991-1996', Peopleand Place, 5(4): 1-10.
Taylor, J. 1997b. 'Changing numbers, changing needs? a preliminary assessment ofindigenous population growth 1991-96', CAEPR Discussion Paper No. 143, Centre forAboriginal Economic Policy Research, The Australian National University, Canberra.
Taylor, J. and Altman, J.C. 1997. The Job Ahead: Escalating Economic Costs of IndigenousEmployment Disparity, Aboriginal and Torres Strait Islander Commission, Canberra.
Taylor, J. and Bell, M. 1996. 'Mobility among indigenous Australians', in P.L. Newton andM. Bell (eds) Population Shift: Mobility and Change in Australia, Australian GovernmentPublishing Service, Canberra.
Taylor J. and Bell, M. 1998. 'Making sense of census data: a components analysis ofemployment change among indigenous Australians', Journal of the AustralianPopulation Association, 15 (1): forthcoming.
Taylor, J. and Hunter, B. 1996. 'Indigenous participation in labour market and trainingprograms', CAEPR Discussion Paper No. 108,Centre for Aboriginal Economic PolicyResearch, The Australian National University, Canberra.
Taylor, J. and Hunter, B. 1997. 'Promoting growth in indigenous employment in the privatesector', Australian Bulletin of Labour, 23 (4):295-314.
Taylor, J. and Liu Jin 1995.'Change in the relative distribution of indigenous employmentby industry, 1986-91', CAEPR Discussion Paper No. 96, Centre for AboriginalEconomic Policy Research, The Australian National University, Canberra.
Taylor, J. and Liu, J. 1996. 'Change in the relative occupational status of indigenousworkers, 1986-91', CAEPR Discussion Paper No. 104, Centre for Aboriginal EconomicPolicy Research, The Australian National University, Canberra.
C E N T R E F O R A B O R I G I N A L E C O N O M I C P O L I C Y R E S E A R C H

DISCUSSION PAPER NO. 174 27
Taylor, J. and Roach, L.M. 1994. The relative economic status of indigenous people inVictoria, 1986-91', CAEPR Discussion Paper No. 57, Centre for Aboriginal EconomicPolicy Research, The Australian National University, Canberra.
Treadgold, M.L. 1988. 'Intercensal change in Aboriginal incomes, 1976-1986', AustralianBulletin of Labour, 14 (4): 592-609.
C E N T R E F O R A B O R I G I N A L E C O N O M I C P O L I C Y R E S E A R C H

Centre for Aboriginal Economic Policy Research
For information on earlier CAEPR Discussion Papers and ResearchMonographs please contact:
Publication SalesCentre for Aboriginal Economic Policy Research
Faculty of ArtsAustralian National University
Canberra ACT 0200Telephone: 02—6279 8211Facsimile: 02—6249 2789
Abstracts or summaries of all CAEPR Publicationscan be found at the following WWW address:
http://online.anu.edu/caepr/
MONOGRAPH SERIES
1. Aborigines in the Economy: A Select Annotated Bibliography of Policy-Relevant Research1985-90. L.M. Allen, J.C. Altman and E. Owen (with assistance from W.S. Arthur),1991.
2. AboriginalEmployment Equity by the Year 2000, J.C. Altman (ed.), published for theAcademy of the Social Sciences in Australia, 1991.
3. A National Survey of Indigenous Australians: Options and Implications.J.C. Altman (ed.), 1992.
4. Indigenous Australians in the Economy: Abstracts of Research. 1991-92,L.M. Roach and K.A. Probst, 1993.
5. The Relative Economic Status of Indigenous Australians, 1986-91, J.Taylor, 1993.
6. Regional Change in the Economic Status of Indigenous Australians, 1986-91,J. Taylor, 1993.
7. Mabo and Native Title: Origins and Institutional Implications, W. Sanders (ed.), 1994.
8. The Housing Need of Indigenous Australians, 1991, R.Jones, 1994.9. Indigenous Australians in the Economy: Abstracts of Research, 1993-94,
L.M. Roach and H.J. Bek, 1995.10. The Native Title Era: Emerging Issues for Research, Policy and Practice,
J. Finlayson and D.E. Smith (eds), 1995.11. The 1994 National Aboriginal and Torres Strait Islander Survey: Findings and Future
Prospects, J.C. Altman and J. Taylor (eds), 1996.12. Fighting Over Country: Anthropological Perspectives, D.E. Smith and
J. Finlayson (eds), 1997.
C E N T R E F O R A B O R I G I N A L E C O N O M I C P O L I C Y R E S E A R C H

RECENT DISCUSSION PAPER SERIES
136/1997 The interrelationships between arrest and employment: more evidenceon the social determinants of indigenous employment, B. Hunter andJ. Borland.
137/1997 A profile of indigenous workers in the private sector, J. Taylor andB. Hunter.
138/1997 Indigenous TAPE graduates: patterns and implications, R.G. Schwab
139/1997 The right to negotiate and the miner's right: a case study of native titlefuture act processes in Queensland, J.D. Finlayson.
140/1997 The future shape ofABSTUDY: practical and policy implications of therecent proposed changes, R.G. Schwab and S.F. Campbell.
141/1997 Opportunities and problems astride the welfare/work divide: the CDEPscheme in Australian social policy, W. Sanders.
142/1997 The explosion of aboriginally: components of indigenous populationgrowth 1991-1996, A. Gray.
143/1997 Changing numbers, changing needs? A preliminary assessment ofindigenous population growth, 1991-96, J.Taylor.
144/1997 The Native Title Amendment Bill 1997: a different order of uncertainty?J. Clarke.
145/1997 Indigenous heritage protection, native title and regional agreements:the changing environment, J.D. Finlayson.
146/1997 Regional agreements and localism: a case study from Cape YorkPeninsula, D.F. Martin.
147/1997 Towards a comprehensive regional agreement: Torres Strait,W.S. Arthur.
148/1997 The CDEP scheme in a new policy environment: options for change?J.C. Altaian.
149/1997 How does (and should) DBS treat CDEP participants? (What are theseallegations of racial discrimination?), W. Sanders.
ISO/1997 Growth of the Aboriginal and Torres Strait Islander population, 1991-2001 and beyond, A. Gray.
151/1998 Access to government programs and services for mainland Torres StraitIslanders, W.S. Arthur.
152/1998 Native title compensation: historic and policy perspectives for aneffective and fair regime, J.C. Altaian and D.P. Pollack.
153/1998 The continuing disadvantage of indigenous sole parents: a preliminaryanalysis of 1996 Census data, A.E. Daly and D.E. Smith.
154/1998 Assessing the utility of 1996 Census data on indigenous Australians,B. Hunter.
C E N T R E F O R A B O R I G I N A L E C O N O M I C P O L I C Y R E S E A R C H

155/1998 Estimating intercensal indigenous employment change, 1991-96,J. Taylor and M. Bell.
156/1998 The relative economic status oj indigenous people in the NorthernTerritory, 1991-96, J. Taylor and L. Roach.
157/1998 The relative economic status of indigenous people in Western Australia,1991 and 1996, J. Taylor.
158/1998 The relative economic status of indigenous people in Tasmania, 1991and 1996. J.Taylor.
159/1998 Labour market incentives among indigenous Australians: the cost of jobloss versus the gains from employment, B. Hunter and A.E. Daly.
16O/1998 The determinants of indigenous educational outcomes, B. Hunter andR.G. Schwab.
161/1998 Educational 'failure' and educational 'success' in an Aboriginalcommunity, R.G. Schwab.
162/1998 The supply of alcohol in remote Aboriginal communities: potential policydirections from Cape York, D.F. Martin.
163/1998 Indigenous land use agreements: the opportunities, challenges andpolicy implications of the amended Native Title Act, D.E. Smith.
164/1998 The relative labourforce status of indigenous people 1986-96: a cohortanalysis, B. Hunter and M.C.Gray.
165/1998 Homelands and resource agencies since the Blanchard Report: areview of the literature and an annotated bibliography, R. Davis andW.S. Arthur.
166/1998 Parentage and indigenous population change, A. Gray.
167/1998 New and emerging challenges for Native Title Representative Bodies,J.D. Finlayson.
168/1998 Financial aspects of Aboriginal land rights in the Northern Territory,J.C. Altman and D.P. Pollack.
169/1998 The Indigenous Land Corporation: a new approach to land acquisition?J.C. Altman and D.P. Pollack.
170/1998 A critical survey of indigenous education outcomes, 1986-96, M. Gray,B. Hunter and R.G. Schwab.
171/1998 Indigenous participation in health sciences education: recent trends inthe higher education sector, R.G. Schwab and I. Anderson.
172/1998 The relative economic status of indigenous people in Queensland, 1991and 1996, J. Taylor.
173/1998 The relative economic status of indigenous people in New South Wales,1991 and 1996, J. Taylor.
174/1998 The relative economic status of indigenous people in Victoria, 1991 and1996, J. Taylor.
C E N T R E F O R A B O R I G I N A L E C O N O M I C P O L I C Y R E S E A R C H