Embed Size (px)
Citation preview

Traffic Safety in Indonesia
Ministry of Regional Infrastructureand Settlement
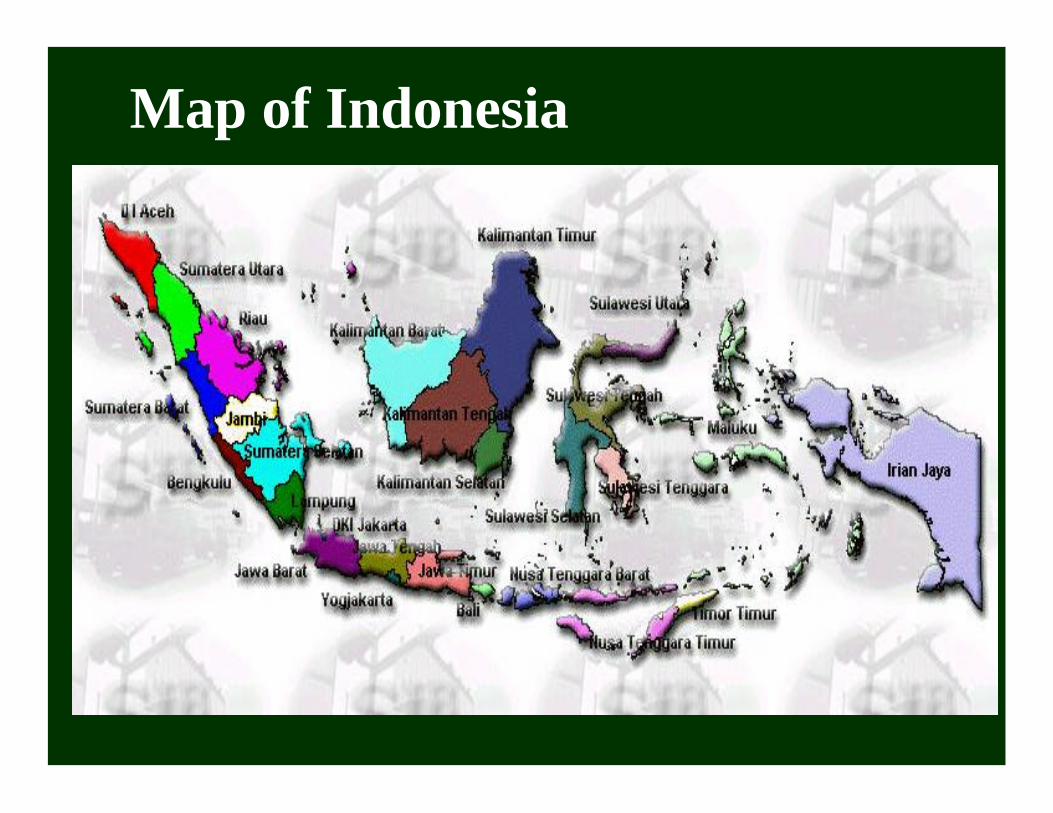
Map of Indonesia

Topic of Presentation
1. Traffic Characteristics2. Current Situation of the Traffic Safety3. Traffic Accident4. Pedestrian and Non Motorized Vehicles5. On Going Programs6. Future Strategies

1. Traffic Characteristics
• Demand > Supply• Mixed Traffic• Congestion Problems• Vehicle Movement Orientation• Less attention on Pedestrian and non
Motorized Vehicles

Road User Behavior of Pedestrian Crossings
1611
Under 110
Under 117
Under 14072
BangkokColomboCairoKingstonKarachiNicosiaSurabayaLondonKhucing
Percentage of drivers choosing to stop
City

No Helmed 2%
Wrong type of Helmed 3%
Wrong Use 57%
Good 38%
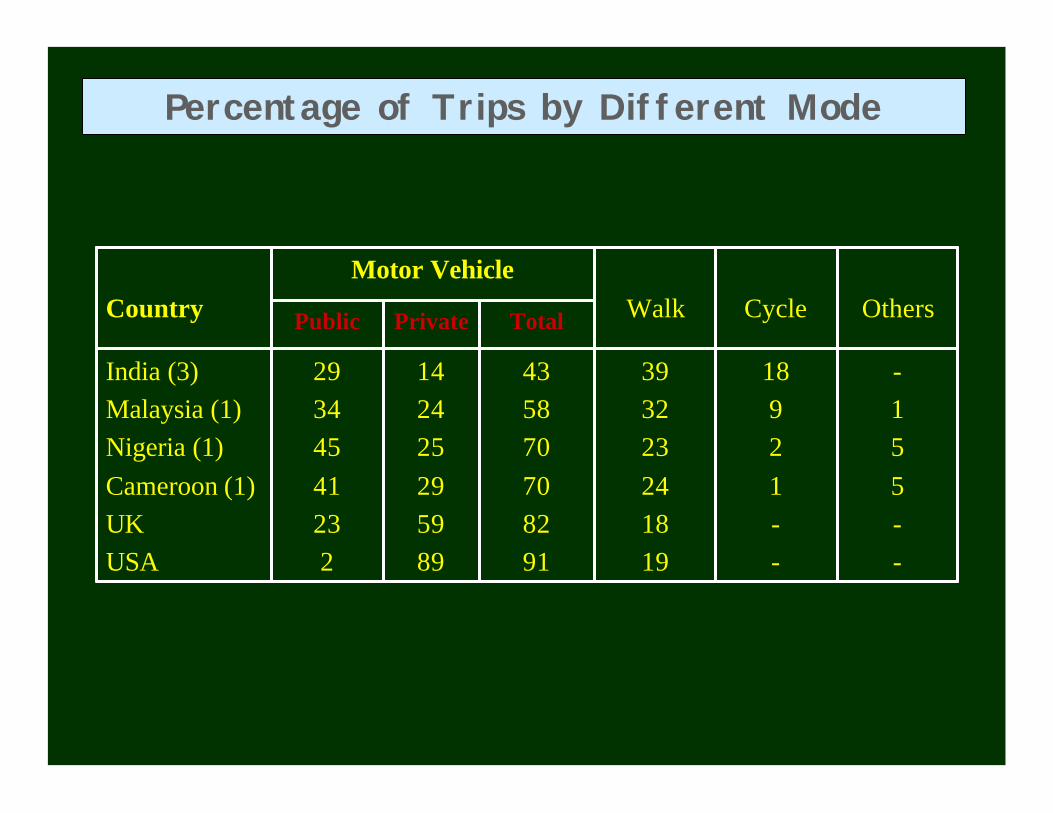
Percentage of Trips by Different Mode
India (3)Malaysia (1)Nigeria (1)Cameroon (1)UKUSA
Country
-155--
18921--
393223241819
435870708291
142425295989
29344541232
TotalPrivatePublic OthersCycleWalkMotor Vehicle

2. Current Situation
• Un-implementable Safety Related transport Policies
• Widely Spread Responsibilities of Transport Safety
• Limited Capabilities of Human Resources
• Low Expenditure on Road Safety• Sub Standard Design

3. Traffic AccidentRecent Trends in Traffic Accident in Indonesia
0
5000
10000
15000
20000
25000
30000
1990 1991 1992 1 9 9 3 1994 1995 1996 1 9 9 7
Accident Death
serious Injury Slight Injury

Accident Mortality Data in Indonesia
02040
6080
100
1988 1990 1992 1994 1996 1998Year
Reco
rded D
eath
s per
0
0.5
1
1.5
Reco
rded D
eath
s per
1000 V
ehic
les
Million People Road km (000)
Billion Veh.km Vehicle (000)

Malaysia Side or 90 Collisions (rural)
PNG Rollover collisions (high speed,rural road)
Bandung Collision with pedestrian

Major Collision Type on Toll Road
Rear end10%
Others10%
Uncontrolled80%

Causes of Traffic Accident on Toll Road
Driver65%
Vehicles30%
Road Environment
5%

4. Pedestrians and Non Motorized Vehicles– No relevant policies to NMV– Poor facilities– Comparatively less priority – Minimal expenditure– No exact regulation

Shares of NMV in Asian and Pacific Cities
0 10 20 30 40 50 60 70 80 90
Share (%)
Dhaka (Bangladesh)
Phom Penh (Cambodia)
Shanghai (PRC)
Kanpur (India)
Surabaya (Indonesia)
Tokyo (Japan)
Penang (Malaysia)
Metro Manila (Philippines)
Chiang Mai (Thailand)
Hanoi (Viet Nam)
city
Source: PADECO Co., Ltd., 1995

Growth Rate of NMV in Selected Cities
Source: PADECO Co., Ltd., 1995
City Type of NMV Period Average annualgrowth rate (%)
Bicycle 1980-1990 14.9
Other NMV 1980-1990 5.3
Bicycle 1983-1992 5.3
Cycle-rickshaw 1983-1992 2
Pushcart 1983-1992 1.5
Animal cart 1983-1992 -0.7
Surabaya (Indonesia) Cycle-rickshaw 1985-1992 -0.7
Penang (Malaysia) Cycle-rickshaw 1978-1992 -1.2
Chiang Mai (Thailand) Cycle-rickshaw 1978-1992 8.8
Kanpur (India)
Shanghai (PRC)

Pedestrian Fatalities as Percentage of All Road Accident Fatalities
20293142434451
Europe & USA (14)SE Asia (4)America (1)Asia (3)Africa (4)Caribbean (3)Middle East (5)
%Area

5. On-Going Programs
• Sumatera Region Road Project (SRRP)• SURIP-1A Component: Quality Life
Improvement

Road traffic and vehicle weights and dimensions enforcement components
• Reduce road damage due to overloading of good vehicles.
2. Reduce number of road accidents/fatalities at initially identified 4 priority black spots an 25 km of black link in each province.
3. Prevent a further increase of accident/fatalities, by implementing a series of schemes targeted at: improve of pedestrian safety, improve traffic signal, speed limit enforcement and traffic calming, road studs, road marking, seatbelts campaign.

1. Improve amenity for: -Pedestrian path (side walk)-Pedestrian crossing/bridge-Landscape, greenery
2. Traffic management to match with road class;( trough traffic, local traffic, parking,, public transport, intersectionbus stop, road marking, traffic sign (slants, separator, median).
3. Improve EnvironmentGreenery, waste disposal box, Drainage)
4. Improve urban facilities on the road ROW (telephone booth, street, trader, rest area/stop for pedestrian, road lighting)
5. Improve urban road performance(view of shop, buildings, billboard, advertisement board)

Slide -1

Slide - 2

Slide - 10

Slide - 4


7. Future strategies
• National Focused• Specified Measures

National Focused:• Public Transport Safety• Freight Transport Safety• Facilities for non Motorized Travelers• Standardized Traffic Signs• Transport Safety consideration to the Traffic Police• Accident Reporting System• Education• Regulation

1.Single site action plan (junction, small area, a short segment of road)
2.Mass action plans (General; skid, speed, seatbelt)
3.Route action plans (more than I km length)
4.Area action plans (by administration boundary or more than 1 km squares)

1.Identification.-Data-Statistic-Verify location-on site observation
2.Diagnosis-Detail data analysis-Identification of dominant factors -Determine nature of accident
3. Selection-Determine range of measures-Test measures-Economic assessment-Select measures (greatest safety benefit) -Public consultation -Select site for treatment