Embed Size (px)
Citation preview

TOTAL QUALITY MANAGEMENT AND KNOWLEDGE
MANAGEMENT IN MALAYSIAN MANUFACTURING AND
SERVICE FIRMS: A STRUCTURAL EQUATION MODELING
APPROACH
OOI KENG BOON
THESIS SUBMITTED IN FULFILMENT
OF THE REQUIREMENTS
FOR THE DEGREE OF DOCTOR OF PHILOSOPHY
FACULTY OF ECONOMICS AND ADMINISTRATION
UNIVERSITY OF MALAYA
KUALA LUMPUR
2013

ii
UNIVERSITI MALAYA
ORIGINAL LITERARY WORK DECLARATION
Name of Candidate: OOI KENG BOON (I.C/Passport No: 701129-08-5239)
Registration/Matric No: EHA070004
Name of Degree: DOCTOR OF PHILOSOPHY
Title of Project Paper/Research Report/Dissertation/Thesis (“this Work”):
TOTAL QUALITY MANAGEMENT AND KNOWLEDGE MANAGEMENT IN MALAYSIAN MANUFACTURING AND SERVICE FIRMS: A STRUCTURAL EQUATION MODELING
APPROACH
Field of Study: APPLIED STATISTICS
I do solemnly and sincerely declare that:
(1) I am the sole author/writer of this Work;
(2) This Work is original;
(3) Any use of any work in which copyright exists was done by way of fair dealing and for permitted purposes and any excerpt or extract from, or reference to or reproduction of any copyright work has been disclosed expressly and sufficiently and the title of the Work and its authorship have been acknowledged in this Work;
(4) I do not have any actual knowledge nor do I ought reasonably to know that the
making of this work constitutes an infringement of any copyright work;
(5) I hereby assign all and every rights in the copyright to this Work to the University of
Malaya (“UM”), who henceforth shall be owner of the copyright in this Work and that any
reproduction or use in any form or by any means whatsoever is prohibited without the
written consent of UM having been first had and obtained; (6) I am fully aware that if in the course of making this Work I have infringed any copyright
whether intentionally or otherwise, I may be subject to legal action or any other action as may be determined by UM.
Candidate’s Signature Date
Subscribed and solemnly declared before,
Witness’s Signature Date
Name: Professor Dr. Goh Kim Leng
Designation: Professor, Faculty of Economics and Administration, University of Malaya

iii
ABSTRACT
This thesis purports to empirically investigate the multidimensionality of total quality
management (TQM) and its association with knowledge management (KM) as
perceived by the middle to higher level managers (i.e. executives, managers, senior
managers, managing directors and chief executive officers (CEOs)) in the
manufacturing and service firms in Malaysia. Based on a thorough review of existing
literature, six dimensions of TQM (i.e. leadership, strategic planning, customer focus,
human resource management, process management and information and analysis)
grounded in Malcolm Baldrige National Quality Award (MBNQA) criteria and three
components of KM (i.e. knowledge acquisition, knowledge distribution and knowledge
application) were identified.
A total of 203 usable surveys were collected from the manufacturing and service sectors
that are planning for or have obtained the ISO 9001:2000 certification. They comprised
of small, medium and large Malaysian firms. Structural Equation Modeling (SEM)
technique was used to test the theoretical framework.
The findings of this study proposed that four dimensions of TQM are instrumental for
firms to increase their efficiency in KM. They are strategic planning, human resource
management, systematic process management, as well as possessing an adequate level
of information and analysis, in which strategic planning is the most significant
determinant for KM in both manufacturing and service firms thus filling the literature
gap of TQM and KM. However, leadership and customer focus were found to have no
significant relationship to KM in both the sectors surveyed. Result of this cross sectional
study also reveals insignificant difference with respect to the modeling of TQM‟s

iv
constructs validity between the two sectors. In other words, the chosen TQM practices
in this study are equally applicable across both sectors. Furthermore, there also lies no
significant difference in the relationship between TQM practices and the level of KM
between both these sectors.
One of the research limitations would be that the self-reported survey might include
some biased response from the target respondents and this may pose as a major concern
when verifying the pervasiveness or apparentness of the respondents towards TQM
practices on KM. Nevertheless, the research creates awareness among the middle to
higher level managers to focus on the six MBNQA dimensions that can help attain a
superior KM.
In terms of originality, this research examines the effect of six TQM practices on KM as
well as presents a comparative analysis on TQM practices and KM between the two
sectors from the perspective of both descriptive and structural relationships.
Specifically, the construct validity and criterion validity with regards to the TQM
practices is further confirmed in this thesis. Practically, this research can be used by
middle to higher level managers from both the manufacturing and service side to
evaluate the effectiveness of TQM practices on KM in their companies. They can focus
their efforts on practices that show the most promising result for the establishment of
competitive KM capabilities, by developing a deeper comprehension of the association
between TQM practices and KM.

v
ABSTRAK
Tujuan tesis ini adalah untuk menyelidik secara empirikal Pengurusan Kualiti
Menyeluruh (Total Quality Management @ TQM) dari berbilang dimensi dan
hubungannya dengan Pengurusan Pengetahuan (Knowledge Management @ KM)
berdasarkan anggapan pengurus lapisan pertengahan ke atas (iaitu eksekutif, pengurus,
pengurus kanan, pengarah urusan dan pegawai ketua eksekutif) dari sektor pembuatan
dan perkhidmatan di Malaysia. Berdasarkan satu ulasan menyeluruh tentang
penyelidikan masa kini, enam dimensi TQM (iaitu kepimpinan, perancangan strategik,
fokus terhadap pengguna, pengurusan sumber manusia, pengurusan proses, dan
maklumat dan analisis) berdasarkan kriteria daripada hasil kerja Malcolm Baldrige
National Quality Award (MBNQA) dan juga tiga komponen daripada KM (iaitu
pemerolehan pengetahuan, penyebaran pengetahuan dan aplikasi pengetahuan) telah
dikenalpasti.
Seramai 203 responden dari firma-firma Malaysia yang -merangkumi kategori kecil,
sederhana dan besar yang telah memperolehi atau dalam proses untuk memohon
pensijilan ISO 9001:2000. Kaedah Pemodelan Persamaan Struktur (Structural Equation
Modeling @ SEM) telah digunakan untuk mengkaji rangka teori tesis ini.
Hasil penemuan kajian mengusulkan bahawa terdapat empat dimensi TQM yang
memainkan peranan penting bagi firma-firma ini untuk mempertingkatkan kecekapan
mereka dalam pengurusan pengetahuan. Empat dimensi tersebut adalah perancangan
strategik, pengurusan sumber manusia, pengurusan proses secara sistematik, dan
memiliki maklumat dan analisa pada tahap yang memadai di mana perancangan
strategik merupakan faktor penentu terpenting pengurusan pengetahuan bagi kedua-dua

vi
firma pembuatan dan perkhidmatan dan justeru itu, mampu mengurangkan jurang
perbezaan kepustakaan di antara amalan TQM dan KM. Namun demikian, hasil kajian
mendapati kepimpinan dan fokus terhadap pengguna tidak mempunyai hubungan yang
signifikan dengan KM bagi kedua-dua sektor firma yang dikaji. Hasil penemuan
penyelidikan bercorak keratan rentas ini juga menunjukkan tiada perbezaan yang
signifikan dari segi kesahihan konstruk model TQM antara dua sektor tersebut. Dalam
ertikata lain, amalan-amalan TQM yang dipilih untuk kajian ini merentasi dan boleh
digunapakai oleh kedua-dua sektor tersebut. Tambahan pula, keputusan kajian juga
menunjukkan tiada perbezaan yang signifikan dalam hubungan antara amalan-amalan
TQM dengan tahap perlaksanaan KM bagi kedua-dua sektor tersebut.
Salah satu batasan kajian ini adalah kemungkinan wujud nyata anggapan berat sebelah
responden disebabkan oleh penggunaan borang soal-selidik laporan kendiri di mana
penentuan kesahan jawapan mereka boleh menjadi satu kebimbingan utama dalam
mengesahkan keluas-sebaran atau kejelasan para responden terhadap amalan-amalan
TQM atas KM. Walau bagaimanapun, kajian ini berjaya mewujudkan kesedaran
pengurus lapisan pertengahan ke lapisan atas supaya menumpukan perhatian terhadap
enam dimensi MBNQA yang boleh menyokong dalam mencapai perlaksanaan KM
yang unggul.
Dari segi keasliannya, kajian ini telah berjaya menguji kesan enam dimensi TQM atas
KM dari segi penyampaian satu analisis perbandingan amalan TQM dan KM antara dua
sektor tersebut dari perspektif perihalan statistik dan hubungan struktural. Secara
khususnya, kesahihan konstruk dan kriteria berkaitan dengan amalan-amalan TQM telah
disahkan dengan lebih lanjut oleh tesis ini. Secara praktikalnya, kajian ini boleh
digunakan oleh pengurus-pengurus lapisan pertengahan ke lapisan atas dari kedua-dua

vii
pihak pembuatan dan perkhidmatan untuk menilai keberkesanan amalan-amalan TQM
ke atas KM dalam syarikat mereka. Mereka boleh menumpukan usaha mereka dalam
amalan-amalan yang menunjukkan hasil yang paling memberangsangkan demi
membentuk kemampuan KM yang berdaya saing melalui pembentukan satu
pemahaman yang lebih mendalam terhadap hubungan antara amalan-amalan TQM dan
KM.

viii
ACKNOWLEDGEMENTS
Foremost, I would like to express my sincere appreciation and heartfelt gratitude to my
academic supervisor, Professor Dr. Goh Kim Leng for the continuous support for my
Ph.D research, for his patience, motivation, enthusiasm, and immense knowledge. His
encouragement, excellent guidance, and critical comments have greatly contributed to
the completion of this dissertation. I could not have imagined having a better supervisor
and mentor for my Ph.D study.
Besides my supervisor, I would like to specially thank Garry Wei-Han Tan, Jia-Jia Sim,
Aik-Chuan Teo, Ching-Mun Cheah, Bobby Chuah, Voon-Hsien Lee, Choy-Har Wong
and Alex Kim-Yin Loke for their support in my research journey and in helping me to
collect valuable data for my research.
Last but not the least, I would like to thank my family: my parents, and my parents-in-
law, and family members for supporting me spiritually throughout my life. Especially, I
would like to give my special thanks to my beloved wife Yin Theng, and my children,
Mun-Yee, Wai-Jun and Wai-Zen, whose patient love enabled me to complete this work.

ix
TABLE OF CONTENTS
ABSTRACT ………………………………………………………………………. iii
ABSTRAK ………………………………………………………………………… v
ACKNOWLEDGEMENTS ……………………………………………………….. viii
TABLE OF CONTENTS ………………………………………………………….. ix
LIST OF FIGURES ……………………………………………………………...... xiv
LIST OF TABLES ………………………………………………………………… xv
ABBREVIATIONS ……………………………………………………………….. xvii
CHAPTER 1: INTRODUCTION
1.1 Background of the Study ………………………………………………….. 1
1.2 Research Gap ……………………………………………………………… 4
1.3 Research Questions ……………………………………………………….. 8
1.4 Research Objectives ………………………………………………………. 9
1.5 Scope of the Study ………………………………………………………… 9
1.6 Research Stages …………………………………………………………… 10
1.7 Justification for the Research ……………………………………………… 12
1.7.1 Managerial Implications …………………………………………… 13
1.7.2 Theoretical Implications …………………………………………… 14
1.7.3 Methodological Contributions …………………………………….. 15
1.8 Definition of Terms ………………………………………………………... 16
1.9 Structure of the Thesis …………………………………………………….. 18
1.10 Research Limitations ……………………………………………………… 20
1.11 Chapter Summary ………………………………………………………… 21
CHAPTER 2: REVIEW OF THE LITERATURE
2.1 Introduction ……………………………………………………………….. 22
2.2 Quality Defined/The Quality Concept ……………………………………. 22
2.2.1 Product Quality ……………………………………………………. 24
2.2.2 Service Quality ……………………………………………………. 25
2.3 Review of TQM Concept from Quality Scholars ………………………… 27
2.3.1 TQM Approach by Deming ………………………………………. 27
2.3.2 TQM Approach by Juran …………………………………………. 30
2.3.3 TQM Approach by Crosby ……………………………………….. 32
2.3.4 TQM Approach by Ishikawa ……………………………………… 36
2.3.5 Reviews on TQM Concepts ….…………………………………… 38
2.4 Review of Quality Award Models ……………………………………….. 40
2.4.1 Malcolm Baldrige National Quality Award ……….……………… 40
2.4.2 European Quality Award ………………………………………….. 42
2.4.3 Malaysian Quality Award …………………………………………. 44
2.4.4 The Deming Prize …………………………………………………. 45
2.4.5 Results from Quality Awards ……………………………………... 48
2.5 Review Critical Practices of TQM from Other Researchers ……………… 49
2.6 TQM Practices in this Study …………………..………………………….. 53
2.7 Review of KM Concept ………………………………….……………….. 58
2.7.1 Theory of Knowledge …………………………………………….. 58
2.7.1.1 Explicit Knowledge ……………………………………. 59
2.7.1.2 Tacit Knowledge ……………………………………….. 59

x
2.7.2 Theory of KM ……………………………………………………... 60
2.7.3 Dimensions of KM …………………….…………………………... 61
2.7.3.1 Knowledge Acquisition ………………………………… 62
2.7.3.2 Knowledge Distribution ………………………………… 63
2.7.3.3 Knowledge Application ………………………………… 65
2.8 Chapter Summary ………………………………………………………….. 66
CHAPTER 3: RESEARCH FRAMEWORK AND HYPOTHESES
DEVELOPMENT
3.1 Introduction ……………………………………………………………….. 67
3.2 Research Framework ……………………………………………………… 67
3.3 Relationship between TQM and KM …………………………………….... 68
3.3.1 Leadership and KM ………………………………………………... 70
3.3.2 Strategic Planning and KM ………………………………………... 73
3.3.3 Customer Focus and KM ……………………….…………………. 77
3.3.4 Human Resource Management and KM …………………………... 79
3.3.5 Process Management and KM ………………………….................. 84
3.3.6 Information and Analysis and KM ………………………………... 87
3.4 Model Formulation ………………………………………………………... 91
3.5 Chapter Summary ………………………………………………………….. 92
CHAPTER 4: RESEARCH METHODOLOGY
4.1 Introduction ……………………………………………………………….. 93
4.2 Research Design …………………….…………………………………….. 93
4.2.1 Questionnaire Survey ……………………………………………... 94
4.2.2 Unit of Analysis …………………………………………………… 96
4.2.3 Sampling Size ……………………………………………………... 97
4.2.4 Questionnaire Pretesting ………………………………………….. 98
4.2.5 Pilot Test ………………………………………………………….. 99
4.2.6 Sampling and Data Collection Procedures ……………………….. 99
4.2.7 Statistical Power …………………………………………………... 102
4.3 Survey Instruments and Operationalization of Research Constructs …….. 102
4.3.1 Questionnaire Design ……………………………………………… 103
4.3.2 Questionnaire Scaling ……………………………………………... 103
4.3.3 Questionnaire Structure …………………………………………… 104
4.3.4 Questionnaire Section ……………………………………………... 104
4.3.5 Measurement of Variables ………………………………………… 105
4.3.5.1 Operationalization of TQM Practices ………………….. 105
4.3.5.1.1 Leadership …………………………………. 106
4.3.5.1.2 Strategic Planning …………………………. 106
4.3.5.1.3 Customer Focus ……………………………. 107
4.3.5.1.4 Human Resource Management …………….. 107
4.3.5.1.5 Process Management ………………………. 108
4.3.5.1.6 Information and Analysis ………………….. 108
4.3.5.2 Operationalization of KM …………………..………….. 109
4.3.5.2.1 Knowledge Acquisition ……………………. 109
4.3.5.2.2 Knowledge Distribution …………………… 110
4.3.5.2.3 Knowledge Application ……………..…….. 111
4.4 Methods of Statistical Analysis …………………………………………... 111
4.4.1 Data Screening …………………………………………………….. 112
xi
4.4.2 Refinement and Validation of Instrument ………………………… 112
4.4.2.1 Reliability ………………………………………………. 113
4.4.2.1.1 Unidimensionality Analysis ………………. 113
4.4.2.1.2 Reliability Analysis ……………………….. 113
4.4.3 Validity ……………………………………………………………. 114
4.4.3.1 Content Validity ……….……………………………….. 114
4.4.3.2 Convergent Validity ……………………………………. 114
4.4.3.3 Discriminant Validity ………………………………….. 115
4.4.3.4 Criterion Validity ………………………………………. 115
4.4.4 Statistical Procedure ………………………………………………. 115
4.4.4.1 Exploratory Factor Analysis …………………………… 116
4.4.4.2 Confirmatory Factor Analysis …………………………. 116
4.4.4.3 Structural Equation Modeling …………………………. 116
4.4.4.4 Overall Goodness-of-Fit Measures ……………………. 117
4.4.4.5 Absolute Fit Measures …………………………………. 118
4.4.4.5.1 Likelihood-ratio Chi-square Statistics ……. 118
4.4.4.5.2 Goodness-of-Fit Index …………………….. 119
4.4.4.5.3 Root Mean Square Residual ………………. 119
4.4.4.6 Incremental Fit Measures ……………………………... 119
4.4.4.6.1 Adjusted Goodness-of-Fit Index ………….. 119
4.4.4.6.2 Normed Fit Index ………………………….. 120
4.4.4.6.3 Comparative Fit Index ……………………. 120
4.4.4.7 Parsimonious Fit Measures …………………………….. 120
4.5 Chapter Summary …………………………………………………………. 121
CHAPTER 5: VALIDITY TESTS AND RELIABILITY ANALYSIS
5.1 Introduction ……………………………………………………………….. 122
5.2 Data Screening …………………………………………………………….. 123
5.2.1 Missing Value Exclusion ………………………………………….. 124
5.2.2 Common Method Variance Test …………………………………... 125
5.3 Demographic Profile and Other Characteristics …………………………... 125
5.4 Characteristics of Organizations‟ Profile ………………………………….. 127
5.5 Descriptive Analysis of the Constructs …………………………………… 128
5.6 Reliability and Validity Test ………………………………………………. 129
5.6.1 Exploratory Factor Analysis ………………………………………. 130
5.6.1.1 Exploratory Factor Analysis for TQM Constructs …….. 132
5.6.1.2 Exploratory Factor Analysis for KM …………………… 133
5.6.2 Confirmatory Factor Analysis …………………………………….. 134
5.6.2.1 Measurement Model: Independent Variables
(TQM Practices) ………………………………………... 135
5.6.2.2 Measurement Model: Dependent Variables
(KM Dimensions) ………………………………………. 137
5.6.3 Content Validity …………………………………………………… 138
5.6.4 Unidimensionality …………………………………………………. 138
5.6.5 Construct Validity …………………………………………………. 140
5.6.6 Convergent Validity ……………………………………………….. 141
5.6.7 Discriminant Validity ……………….…………………………….. 142
5.6.8 Nomological Validity ………………………………………………143
5.6.9 Criterion Validity ……………………………................................. 144
5.7 Chapter Summary …………………………………………………………. 144
xii
CHAPTER 6: THE RELATIONSHIP BETWEEN TOTAL QUALITY
MANAGEMENT AND KNOWLEDGE MANAGEMENT
6.1 Introduction ………………………………………………………………... 145
6.2 Structural Equation Modeling Analysis …………………………………… 145
6.2.1 Testing the Assumptions of Multivariate Analysis ……………….. 148
6.3 Overall Model Fit ………………………………………………………….. 150
6.4 The Relationship between TQM and KM …………………………………. 150
6.5 The Relationship between Specific TQM Practices and KM ……………... 152
6.5.1 The Structural Model ……………………………………………… 154
6.5.2 Testing Research Hypotheses ……………………………………... 154
6.5.3 Indirect Effects of Individual TQM Dimensions on Each
KM Practices ………………………………………………………. 155
6.6 Chapter Summary …………………………………………………………. 157
CHAPTER 7: COMPARATIVE ANALYSIS ON MANUFACTURING AND
SERVICE FIRMS
7.1 Introduction ……………………………………………………………….. 158
7.2 Multiple Group Comparison ……………………………………………… 158
7.2.1 Comparison of TQM Practices and KM ………………………….. 159
7.3 Test of Sector-invariance of the Measurement Model ……………………. 160
7.4 Multiple Group Analysis of Structural Model ……………………………. 161
7.4.1 Multiple Group Measurement Model Test ………………………... 161
7.4.2 Multiple Group Structural Model Test ……………………………. 162
7.4.3 Multiple Group Invariance Analysis of the Structural Model …….. 164
7.5 Chapter Summary …………………………………………………………. 165
CHAPTER 8: CONCLUSIONS AND IMPLICATIONS OF STUDY
8.1 Introduction ……………………………………………………………….. 166
8.2 Discussion of the Findings ………………………………………………… 166
8.2.1 Discussion of Findings – Research Question One ………………… 166
8.2.2 Discussion of Findings – Research Question Two ………………... 168
8.2.3 Discussion of Findings – Research Question Three ………………. 168
8.2.3.1 Hypothesis 1 – Relationship of Leadership and KM …... 169
8.2.3.2 Hypothesis 2 – Relationship of Strategic Planning
and KM …………………………………………………. 170
8.2.3.3 Hypothesis 3 – Relationship of Customer Focus
and KM …………………………………………………. 171
8.2.3.4 Hypothesis 4 – Relationship of Human Resource
Management and KM …………………………………... 172
8.2.3.5 Hypothesis 5 – Relationship of Process Management
and KM …………………………………………………. 174
8.2.3.6 Hypothesis 6 – Relationship of Information and
Analysis and KM ……………………………………….. 175
8.2.4 Discussion of Findings – Research Question Four ……………….. 176
8.2.5 Discussion of Findings – Research Question Five ………………... 177
8.2.6 Discussion of Findings – Research Question Six …………………. 178
8.3 Research Implications ……………………………………………………... 178
8.3.1 Managerial Implications ………………………………………....... 179
8.3.2 Theoretical Implications …………………………………………... 182
8.3.3 Methodological Implications ……………………………………… 184

xiii
8.4 Research Limitations and Future Research Directions …………………… 185
8.5 Conclusions ……………………………………………………………….. 186
REFERENCES …………………………………………………………………… 190
APPENDICES
Appendix A: Cover Letter ………………………………………………………… 222
Appendix B: Questionnaire ……………………………………………………….. 224
xiv
LIST OF FIGURES
Figure 1.1 Flow Chart of Research Activities ………………………………….. 12
Figure 3.1 Relationship of TQM Practices and KM Processes ………………… 91
Figure 4.1 Research Procedures ……………………………………………….. 95
Figure 5.1 Second-order CFA Model of TQM ………………………………… 136
Figure 5.2 Second-order CFA Model of KM ………………………………….. 137
Figure 6.1 Relationship of TQM Practices and KM ...…………………………. 147
Figure 6.2 Structural Model of the Relationship between TQM Practices
and KM ……..………………………………………………………. 153
xv
LIST OF TABLES
Table 2.1 Product Quality Dimensions ……………………………………… 25
Table 2.2 The Six Dimensions of TQM with Their Explanations …………… 58
Table 4.1 Operationalization of Leadership …………………………………. 106
Table 4.2 Operationalization of Strategic Planning …………………………. 106
Table 4.3 Operationalization of Customer Focus …………………………… 107
Table 4.4 Operationalization of Human Resource Management ……..……... 107
Table 4.5 Operationalization of Process Management ……………………… 108
Table 4.6 Operationalization of Information and Analysis ………………….. 108
Table 4.7 Operationalization of Knowledge Acquisition ……………………. 110
Table 4.8 Operationalization of Knowledge Distribution …………………… 110
Table 4.9 Operationalization of Knowledge Application …………………… 111
Table 5.1 Demographic Profile of Respondents …………………………….. 126
Table 5.2 Profile of Organizations …………………………………………... 127
Table 5.3 Descriptive Statistics of the Constructs …………………………… 128
Table 5.4 Exploratory Factor Analysis for TQM and KM ………………….. 134
Table 5.5 Measures and Test for Unidimensionality for First-order Factor … 140
Table 5.6 Latent Constructs Correlation …………………………………….. 143
Table 6.1 Univariate Normally - Skewness and Kurtosis of Constructs ……. 149
Table 6.2 The Results of SEM on the Relationship between TQM Practices
and KM ……………………………………………………………. 151
Table 6.3 Measures of the Model Fit ………………………………………... 154
Table 6.4 Hypothesis Testing Results ……………………………………….. 155
Table 6.5 Standardized Indirect Effects …………………………………….. 157
Table 7.1 Group Statistics for Manufacturing and Service Sector with
the Latent Mean Comparison Results …………………………….. 159

xvi
Table 7.2 Summary of Group-invariance Test of Measurement Model
of Manufacturing and Service Sectors ……………………………. 161
Table 7.3 Goodness-of-Fit for Measurement Models of the Manufacturing
and Service Sectors ……………………………………………….. 162
Table 7.4 Goodness-of-Fit for Structural Models of the Manufacturing
and Service Sectors ……………………………………………….. 163
Table 7.5 Regression Weights (Manufacturing Sector) …………………….. 163
Table 7.6 Regression Weights (Service Sector) …………………………….. 163
Table 7.7 Summary of Group-invariant Test of Structural Model of
Manufacturing and Service Sectors ………………………………. 164

xvii
ABBREVIATIONS
AGFI Adjusted Goodness-of-Fit Index
AQA Australian Quality Award
AVE Average Variance Extracted
BC Bias-corrected
CEOs Chief Executive Officers
CFA Confirmatory Factor Analysis
CFI Comparative Fit Index
CMV Common Method Variance
CR Composite Reliability
CSFs Critical Success Factors
EFA Exploratory Factor Analysis
EQA European Quality Award
EM Expectation Maximization
FMM Federation of Malaysian Manufacturers
GFI Goodness-of-Fit Index
IFI Incremental Fit Index
KM Knowledge Management
KMO Kaiser-Meyer-Olkin
MBNQA Malcolm Baldrige National Quality Award
MGA Multiple Group Analysis
MLE Maximum Likelihood Estimation
MQA Malaysian Quality Award
NGOs Non-governmental Organizations
NFI Normed Fit Index
NNFI Non-normed Fit Index
xviii
PCA Principle Component Analysis
PDCA Plan-Do-Check-Act
PMQA Prime Minister Quality Award
QMEA Quality Management Excellence Award
RMR Root Mean Square Residual
RMSEA Root Mean Square Error of Approximation
SEM Structural Equation Modeling
SPC Statistical Process Control
SRMR Standardized Root Mean Square Residual
TLI Tucker and Lewis Index
TQM Total Quality Management
1
CHAPTER 1
INTRODUCTION
1.1 Background of the Study
The intensification of global competition in a borderless society today sets the pace for
organizations worldwide to improve their aptitude and ability to perform well. With the
mushrooming of new markets and products, existing products becomes obsolete at a
faster pace. This poses a challenge for firms to churn up new products to satisfy
customers (Redmond, 2002). According to Alazmi and Zairi (2003), as the life of
products become shorter, technology becoming more advanced, competitors,
regulations and society keep on changing, a firm‟s human capital and the knowledge
that they carry has been considered as one important factor to gain competitive
advantage.
The global economy has moved from one that is focused on the manufacturing of
goods, to one that emphasizes on knowledge and services, where the main object of
trade is knowledge and information (Walczak, 2005). Knowledge has become an
interesting subject among firms as the managing, creating and sharing of it has become
an organization‟s competitive asset (Nonaka & Takeuchi, 1995; von Krogh & Roos,
1995; von Krogh, Roos, & Kleine, 1998), which can help firms to gain competitive
advantage (Barney, 1991; Itami, 1987; Rullani, 1992; Vicari, 1991). Since the new
millennium, the information and knowledge cultivated and adopted in manufacturing
firms have increased in complexity steadily and is changing rapidly ever (Molina,
Montes, & Ruiz-Moreno, 2007). Knowledge is seen by many organizations as one of
the main elements to be managed and applied in production as it can give rise to the
success or failure of companies, and in the larger context, the country‟s economy itself.

2
Due to this, knowledge management (KM) has taken centre stage in the business world.
It determines the success and failure of firms in the present day (Lim, Ahmed, & Zairi,
1999). Large firms have developed different methods to create, share and use the
knowledge generated (McAdam & Reid, 2001) for the company‟s benefits. One of the
high-tech industrialized countries – Japan, was researched by Nonaka and Takeuchi
(1995) and the findings have proven that mega firms, in the likes of Canon, Honda, and
Matsushita emphasized on KM to be a part of their company practices. Further, there
are also firms like Anderson Consulting, Boeing, British Petroleum and many more that
have been researched (Davenport & Prusak, 1998), in which they too have placed KM
as their main focal point. For a firm to create value for itself, it needs to have the
capability and capacity to exploit its intellectual capital, which is their human asset. The
KM process plays a major role in creating value for the firm in terms of new product
development (Madhavan & Grover, 1998), hence contributing to a firm‟s bottom line
(Gloet & Berrell, 2003; Lee & Yang, 2000; Prasad, 2001) and performance.
Total quality management (TQM) is defined as the dedication and effort put in by all
members of an organization towards improving the company‟s working processes, with
the purpose of fulfilling and satisfying customers‟ demands and needs (Lee & Chang,
2006). Zhang (1999) provides another definition of TQM, where TQM is seen as a
management approach that supports companies to enhance its performance and
effectiveness as a whole, thus facilitating companies that implement TQM to attain
world-class status. In the present competitive environment, the role played by TQM has
been widely acknowledged as a vital driver for both manufacturing and service
companies‟ survival and success (Claver-Cortes, Pereira-Moliner, Tari, & Molina-
Azorin, 2008). Previous empirical studies have proven that when TQM is implemented
effectively in an organization, it will bring about an improved company performance

3
(Anderson & Sohal, 1999; Flynn, Schroeder, & Sakakibara, 1994; Prajogo & Sohal,
2004; Samson & Terziovski, 1999) by lowering the cost of production and improving
productivity (Garvin, 1983), enhancing employees‟ job satisfaction (Ooi, Bakar,
Arumugam, Vellapan, & Loke, 2007), reducing role conflict among employees (Teh et
al., 2009) and in return, gaining a stronger market share (Phillips, Chang, & Buzzell,
1983) and market presence. This shows that TQM, which emphasizes on the continuous
improvement of products, process, and services, satisfying and anticipating customers‟
wants, needs and desires, looking after the employees‟ welfare and ensuring leadership
responsibility (Dean & Bowen, 1994), is essential for firms in gaining a sustainable
competitive edge (Yang, Chen, & Su, 2003). Following this argument, many companies
have applied and used the quality award models such as the Malcolm Baldrige National
Quality Award (MBNQA), and the European Quality Award (EQA) to signify the TQM
practices to be implemented in their organizations, particularly for the western countries
(Bou-Llusar, Escrig-Tena, Roca-Puig, & Beltran-Martin, 2009). Several software
packages have been developed to aid in the TQM process, which changes the way
managers and employees function today (Adamson, 2005). In general, TQM was and is
still seen as a relevant philosophy undertaken by many firms, seeking to differentiate
themselves from the rest (Terziovski, Howell, Sohal, & Morrison, 2000) to gain a
competitive edge. Several studies have found that TQM served as an enabler to assist in
the creation, sharing (Graham & Shiba, 1993; Grant, Shani, & Krishnan, 1994; Shiba,
Graham, & Walden, 1990; Sitkin, Sutcliff, & Schroeder, 1994; Thiagarajan & Zairi,
1997a; Youssef & Zairi, 1995) and distribution of knowledge. It is thus believed that
TQM can satisfy organizational needs through the acquisition of knowledge which is
beyond mundane operational needs that can be used for continuous improvement in
company processes and the level of innovation (Colurcio, 2009).
4
As can be seen in this age where competition is growing rapidly, it is vital that firms
appreciate the principles of both TQM and KM and the linkage between the two. Given
the significance of both TQM in the past and KM in the present, firms that are able to
apply both concepts into their company processes are certain to rise above the rest to
become the market leader. The idea that both TQM and KM have great effect on the
strategic competency of a firm prompts several researchers to find and establish the
linkage between these two concepts. For a firm‟s quality strategy, Lim et al. (1999)
suggested Deming‟s Plan-Do-Check-Act (PDCA) Cycle to be the steps towards
enhancing KM. Zetie (2002) emphasizes that TQM practices and KM are closely related
to one another in the development of a firm. Furthermore, past researchers have found
that TQM is intrinsically related to organizational learning (Colurcio & Mele, 2006;
Fine, 1986), in which it encompasses KM. It is believed that TQM practices have the
potential to create and share knowledge within the organization itself, hence a main
source of competitive advantage (Mele, 2003; Nonaka & Takeuchi, 1995). TQM is
highly regarded as a tool that can help a company to attain a higher degree of
knowledge that exceeds its operation requirements and indirectly contributes to the
continuous improvement for the company.
1.2 Research Gap
Despite the significance of both TQM practices and KM, little academic studies have
been done to research on the link and the relationship between these two concepts. As
such, it has not yet been fully build up in concrete terms (Monila, Montes, & Fuentes,
2004). Furthermore, past studies that attempted to connect TQM and KM behaviors
have been inadequate and research findings are limited or inaccurate in the
methodology. Moreover, qualitative techniques, such as case studies and literature
review (for example, see Adamson, 2005; Hsu & Shen, 2005; Johannsen, 2000; Lim et

5
al., 1999; Lin & Wu, 2005), have been widely used to sum up the results in their
research. It is noted that only a handful of empirical studies have applied inferential
statistics, such as multivariate analysis and principal component analysis to examine
their findings. Ngai and Cheng (1997) made a statement that many researchers of TQM
have not made full use of the statistical methods, in particular multivariate statistical
techniques, as compared with the social science researchers and marketing researchers.
Stickley and Winterbottom (1994) emphasized that statistics plays a very important role
for every activity that is related to the pursuit of quality. They cited a statement made by
Hogg (1993) originated from Harry Roberts of the University of Chicago, that: “TQM
comprises much more than statistics but without statistics it can be a lot of smoke and
mirrors” (as cited in Ngai & Cheng, 1997, p. 406). In order to close the gap and supply
firms with useful guidelines on how to deal with TQM‟s effects on KM activities, this
research proposed a set of TQM dimensions, and illustrate how to apply Structural
Equation Modeling (SEM), a multivariate statistical technique, as a statistical tool to
investigate the manufacturing and service companies in Malaysia on TQM effects
towards KM behaviors. By using this technique, it can assist quality practitioners, who
are often concerned with discovering and understanding the causal association in a
given set of data, to recognize problematic areas and provide possible solutions.
Furthermore, a deeper insight can also be developed on how the effective adoption of
TQM concepts can lead to a higher level of KM, which will then lead to improved
competitiveness.
In this study, the Malaysian firms in general have become the focal point. Since its
independence, Malaysia has experienced a dramatic increase in its prosperity and
economic development. According to Osman, Ho, and Galang (2011), the Malaysian
economy has been steadily growing from year 2002 to 2008, at a rate of 4.6 percent.

6
Malaysia is acknowledged in its manufacturing expertise such as computer, electrical
components, and medical products, as well as in various services such as information
technology, outsourcing of business processes and in healthcare (Gross & Minot, 2007).
The manufacturing sector has been identified as one of the major contributions to
Malaysia‟s economy, providing more than 25 percent to Malaysian economic growth
(Economy Watch, Malaysia Economic Growth, 2008). In terms of its services, the
healthcare and tourism industry have been doing considerably well, providing services
to the medical tourism sector and making significant contributions. According to Daljit
(2009), the medical tourism industry has contributed approximately RM540 million to
the Malaysian economy in fiscal year 2010, by giving medical treatment to about
625,000 patients, with the main bulk of them coming from Indonesia. The Malaysian
government has indeed invested much of its efforts, one of which is the multimedia
super corridor, to increase the nation‟s national income and re-position itself from a
“middle-income” nation to one that is well developed by the year 2020 (Jarman &
Chopra, 2008). However, despite the multibillion dollar state-led project, the
government has not been successful in drawing in much knowledge intensive operations
to Malaysia and realizing its initial purpose of churning out a revolutionary multimedia
research and development center. Instead, a blossoming business support services
division was developed (Jarman & Chopra, 2008).
Besides, it is notable that the applicability and the implementation of TQM practices
differ between the two sectors due mainly to the differences in the nature of their
businesses. The intangibility and heterogeneity of the outputs that the service firms
provide is the first notable characteristics, which is very different from the
manufacturing industry where their outputs are more standardized and measurable by
their specifications (Silvestro, 1998; Sureshchandar, Rajendran, & Anatharaman, 2001).

7
Secondly, due to the different operating systems, in which both delivery and
consumption occur concurrently for the service industry, there may be a problem in the
application of quality management tools and techniques (Prajogo, 2005). Hence, service
providers might face quality control problems prior to delivery of service outputs to the
customer, which is usually done with the manufactured products. The difference in the
adoption of TQM between manufacturing and service firms have been examined and
presented in a number of studies. Beaumont, Sohal, and Terziovski (1997) indicated that
the service industry utilizes only a few quality management techniques, particularly
statistical process control. As observed by Woon (2000), service firms implemented a
lower level of TQM practices as compared to their manufacturing counterparts,
particularly in the dimensions of process management, information and analysis and
quality performance, but remains no different in the aspects of leadership, customer
focus and human resource practices. In other words, the “soft” elements of TQM are
found to be more applicable than the “hard” elements for the service firms.
Furthermore, Huq and Stolen (1998) also concluded that the service firms are selective
in terms of their application towards TQM practices, as oppose to their manufacturing
counterparts that apply the full set of TQM practices.
This study aims to investigate how the application of TQM will improve KM in both the
manufacturing and service sectors; while at the same time, the degree of TQM
implementation between both these sectors will also be further examined, where the
validity of TQM construct and its association with KM (i.e. construct and criterion
validity) will also be compared, which is much lacking in previous empirical studies.
One of such comparative studies between the manufacturing and service sectors was
conducted by Prajogo (2005), where his study found insignificant difference in the
association between TQM and quality performance in both sectors. In another related
8
study, Cheah, Ooi, Teh, Chong, and Yong (2009) also concluded that no significant
difference was found in both of these sectors in Malaysia in terms of their level of TQM
practices and knowledge sharing. However, such comparative studies are still much
lacking and that the comparative analysis of TQM practices and KM between the
manufacturing and service sectors can hardly be found in the literature, hence this
research is done to fill in such literature gap.
1.3 Research Questions
With reference to the background of this research as well as the discussion of the
research gap in the abovementioned sections, six (6) research questions are posited as
follows:
RQ1: What are the key TQM practices that should be adopted, which are relevant for
the measurement of KM?
RQ2: Do TQM practices have an influence on KM on Malaysian firms?
RQ3: Which key practices of TQM are more significant and positive towards KM in
the Malaysian firms?
RQ4: Is there any significance difference between the manufacturing and service
sectors in terms of TQM linkages with KM behavior?
RQ5: Is there any difference in the modeling of the constructs validity of TQM
between manufacturing and service firms?
RQ6: Are there any significant difference in the predictive power of TQM practices on
KM between the manufacturing and service firms?

9
1.4 Research Objectives
Based on the abovementioned research questions, this research thus provides an
empirical study to examine six (6) objectives in our study:
RO1: To identify a set of TQM principles that is relevant for the measurement of KM.
RO2: To examine the multidimensionality of TQM that has positive influences on
KM.
RO3: To identify which TQM practices are more significant and positive towards KM
in the Malaysian firms.
RO4: To investigate the differences between manufacturing and service firms with
regards to the linkages between TQM and KM in the Malaysian firms.
RO5: To examine the differences between the manufacturing and service firms in
terms of the constructs validity of TQM.
RO6: To investigate the predictive power of TQM practices on KM between the
manufacturing and service firms.
1.5 Scope of the Study
The companies in the manufacturing and service sectors that are planning to apply for or
have obtained the ISO 9000 certification status within the Malaysian context will be the
focus of this study. In addition, the TQM practices selected and investigated in this
study are limited to only six practices based on the MBNQA framework. As this is a
quantitative and cross-sectional study, questionnaire was utilized as a research
instrument; while self-administered approach was used to collect the data. The middle
to higher level managers (i.e. executives, managers, senior managers, managing
directors and chief executive officer (CEOs)) were chosen as the analysis unit since they
are equipped with ample information of the company‟s quality management practices as

10
well as having an in-depth understanding on the KM level in their firms. This sample
consists of only one registered site per organization.
1.6 Research Stages
This study was conducted based on a series of research stages and each stage is well
explained and clearly illustrated in Figure 1.1.
Stage 1: Preliminaries and Identification of Research Domain
Academic references were first referred to for establishing the necessity of the research
required. Federation of Malaysian Manufacturers (FMM) directory was used for the
establishing the sampling frame. Discussions were conducted to seek input from other
experts colleagues, superior, etc to get more insights on the research subject for easier
identification and development on the topic of interest. In short, the domains of TQM
and KM are the main purpose of this research study.
Stage 2: Review of Literature
A systematic review on the current literature within the related areas was performed
with the aim to get hold of the depth and breadth of the present knowledge in the TQM
and KM areas. The variables and views which are vital for the development of the
theoretical foundation for the study were also acknowledged. This is followed by
determining the unknown research areas which are imperative for the development of
knowledge in both the TQM and KM domains.

11
Stage 3: Development of Research Model and Hypotheses
A theoretical framework was constructed following a comprehensive literature review
to investigate on the knowledge gaps within the research scope. As a result, six
hypotheses were postulated to examine and complete the configuration of the theoretical
framework.
Stage 4: Research Design and Development of Instrument
The appropriateness of the questionnaire survey design and sampling procedures were
determined in this stage. Following that, a range of analytical methods and measurement
magnitude for the research variables were developed to describe the parameters of the
research study. These scales were utilized in the formation of the self-administered
survey (i.e. questionnaire).
Stage 5: Quantitative Field Research
A total of 203 usable surveys were collected from both manufacturing and service firms
in Malaysia. Several issues pertaining to the conduct of the questionnaire (i.e. how to
reach out to the targeted group of respondents, where are their locations, when the
collection of data should commence and conclude, etc) were taken into consideration.
Apart from this, the respondents have been assured of the security and confidentiality of
the data provided by them for the purpose of this research.
Stage 6: Data Analysis and Interpretation of Findings
This stage involved the compilation, coding and data entering, in which the SEM
analysis was used to analyze and interpret the data collected. Numerous data analysis
was engaged to assess the data. Validity and scale of reliability issues were also
addressed in this stage.

12
Stage 7: Final Thesis Preparation
Finally, the outcomes of this research study were compiled and presented in a thesis
report format. The significance of the results in the academic field of study, the
theoretical and practical implications for managers, followed by limitations and
suggestions for future research were also included.
Figure 1.1: Flow Chart of Research Activities
1.7 Justification for the Research
This study has significantly contributed to the areas of theoretical and managerial
implications as well as in the area of research methodology. Each area is elucidated in
the following sections.
Step 1: Preliminaries and Identification of Research Domain
Step 2: Reviews of Literature
Step 3: Development of Research Model and Hypotheses
Step 4: Research Design and Development of Instrument
Step 5: Quantitative Field Research
Step 6: Data Analysis and Interpretation of Findings
Step 7: Final Thesis Preparation

13
1.7.1 Managerial Implications
Good learning behavior in a workplace is an important practice that could transform a
traditional firm to a developed one (Gilley & Maycunich, 2000). KM is one of the
learning elements that possesses a strong implication in the future management of
quality systems. Numerous companies are beginning to adopt KM activities to facilitate
them in achieving a competitive advantage over their competitors (Valkokari &
Helander, 2007). Indeed, the TQM dimensions have the capacity as a valued
management mechanism that could contribute to KM, therefore making them important.
The results and discussions shown in the previous section have demonstrated the
valuable lessons for practitioners and researchers in both areas of quality management
and KM. It is believed that when the importance of TQM practices is well understood
and acknowledged, it can improve the success of KM processes tremendously. To
ensure sustainable competitive advantages are achieved, a combination of both TQM
and KM practices may prove effective for various companies. By introducing and
implementing a well-designed and relevant TQM system inside the firm itself aide the
creation of knowledge, an implicit understanding of the firm‟s knowledge can be
constructed and with the participation from every employee. With the effective
implementation of TQM practices, it is believed that it can boost a firm‟s KM activities
in the business industry. As mentioned by Tseng (2008), the benefits are enormous.
First of all, there will be an improvement in the company itself, when KM activities are
led by TQM practices. Secondly, the company may become more diversified in its
working process; thirdly, an enhancement in the overall performance are noticeable;
fourthly, an innovative culture may be inculcated, which includes bringing in novel
ideas and better problem solving skills among employees; and finally, employees and
customers will be more satisfied with the usage of these practices.

14
This study has offered some practical approaches to the Malaysian organizations on the
effects TQM practices that could bring to KM activities. Even though a lot of
companies have utilized these practices, it is still imperative to establish the model,
verify it and then examine the types of TQM constructs that could contribute to the KM
accomplishment. In this study, it has been clearly illustrated that only four out of the six
TQM practices, namely strategic planning, human resource management, process
management and information and analysis, have a positive impact on the KM activities
on Malaysian companies. Hence, middle-level to higher management will have an idea
on which TQM constructs to focus on to promote the knowledge distribution activities.
Obviously, human resource management and strategic planning have the highest impact
on KM. Thus, it is essential for companies to look into the improvements of these
constructs in their individual organizations.
1.7.2 Theoretical Implications
Many studies that used KM as a research topic have provided the understanding and
support to augment the KM activities implementations. Unfortunately, there is paucity
in the study of TQM and KM linkages, although previous researchers have tried to link
both TQM and KM together. In this study, a model was proposed, consisting of six
TQM practices based on MBNQA framework to investigate whether such practices
would significantly improve the performance of KM in Malaysian companies.
From theoretical point of view, this study provides a model that combines six TQM
dimensions and KM behavior. With the deployment of multivariate analysis such as
SEM, it gives more accurate goodness-of-fit indices to ascertain that the model is well
defined. Based on the study conducted, the model has been found to be properly defined
and fits well with the data collected. Moreover, this study also provides the path for

15
linkages between the TQM dimensions and KM activities. Besides that, this research
report has also suggested the basis for future research to take place, so that the role of
TQM can be better understood and new ideas and technologies can be further developed
and improvised to enhance KM performance. Thus, to verify the validity of the
framework, this study may be used as a foundation for all future studies to be conducted.
From the theoretical aspect, this study offers empirical evidence for the model
developed by Molina et al. (2004; 2007). This study has empirically verified the
recommendations provided by these researchers, who suggest quality management
practices such as autonomy, teamwork, process control and cooperation with external
agents do influence an individual‟s attitude in transferring knowledge. Furthermore, this
study does not only integrate knowledge distribution but also its acquisition and
application.
Lastly, besides recognizing the significant role TQM played in supporting the KM
activities in the Malaysian manufacturing and service sectors, this study has also carved
a mark in the literature in terms of the effects TQM constructs have on KM activities.
Hence, the management team of any company may work towards modifying their TQM
activities to inculcate a more conducive KM culture within their companies; while
future researchers may also use this study to continuously examine the effects TQM
practices have on various industries.
1.7.3 Methodological Contributions
This study undertook a rigorous statistical validation of the influence TQM practices
have on KM. The relationship between these variables was strictly scrutinized for
validity and reliability across sample of Malaysian firms and was found to be well
fitted. Furthermore, the proposed model (i.e. connection between TQM practices and

16
KM) was empirically examined using Exploratory Factor Analysis (EFA), Confirmatory
Factor Analysis (CFA) and SEM analysis. Generally, the findings from the study have
provided a strong support for the proposed relationships. These findings may contribute
significantly to the Malaysian companies as they have been proven to be useful
examples in measuring the levels of TQM effects on KM. Companies may also utilize
this instrument as a basis of measurement for basic pre-test before returning to
periodically manage and identify the changes linked with TQM initiatives.
1.8 Definition of Terms
Some of terms that are more frequently used in this study are defined as follows:
Total Quality Management: TQM is described as incorporating all inclusive business
management beliefs that comprised of a set of guiding principles that explains the
foundation for continuous improvement. Therefore, it can be deemed as a “holistic”
strategy that is aimed for achieving sustainable organizational improvement (Lin &
Ogunyemi, 1996).
Leadership: Leadership in a firm is a motivating action from the role player to provide
direction or missions to their employees for achieving the organization‟s aims and
objectives (Bounds, Yorks, Adams, & Ranney, 1994).
Strategic Planning: Strategic planning is defined as the development of strategy and
policy, and how this set of strategy and policy is communicated and improved
throughout the company (Bohoris, 1995).

17
Customer Focus: Customer focus can be defined as the level in which a firm is able to
satisfy customer needs and demands on a continual basis (Zhang, Waszink, &
Wijngaard, 2000).
Human Resource Management: Human resource management is being described as
the integration of both quality and operational performance objectives into the
company‟s overall human resource plans for both short and long term plans. The
involvement and participation of employees are also emphasized, together with the need
to provide appropriate education and training for the employees. Furthermore, employee
performance, compensation, recognition and promotion in the company are emphasized,
together with the wellbeing and satisfaction of employees (Bohoris, 1995).
Process Management: Process management refers to the beliefs and organized
behavior that are vital for supervising the process rather than emphasizing on the end
results (Anderson, Rungtusanatham, & Schroeder, 1994; Teh, Ooi, & Yong, 2008).
Information and Analysis: Information and analysis role in a firm is to ensure that data
and information are processed in a timely manner and with high quality standard to be
available and accessible by all users, i.e. business partners, suppliers, employees and
customers (Lee, Rho, & Lee, 2003; Teh et al., 2008).
Knowledge Management: KM can be referred to as a process of enhancing the firm‟s
methodological capability in accumulating and organizing knowledge intended for the
betterment of decision making and business strategy (Hsu & Shen, 2005; Ooi, Teh, &
Chong, 2009).

18
Knowledge Acquisition: Being the first step of KM, knowledge acquiring comprises of
administrating and utilizing present information while capturing new ones (Gilbert &
Codey-Hayes, 1996). As mentioned by Sternberg (1983), the knowledge acquiring
process is a learning process by selecting and storing new information in the mind.
Knowledge Distribution: Knowledge distribution is defined as the management of
shared information within an organization for encouraging novel and resourceful ideas;
creating awareness for the previous fine practices as well as inspiring managers to
employ an enhanced technique for future decision making processes (Wijnhoven, 1999).
Knowledge Application: Knowledge application is defined as the growth of the gained
knowledge to increase its value and effectiveness. It assimilate the knowledge derived
from both the acquisition and distribution stages (Cagarra-Navarro & Martinez-Conesa,
2007) and are then incorporated into the organization‟s daily business processes to
improve its economic effectiveness and efficiency.
1.9 Structure of the Thesis
The research will be organized into eight chapters and the outline of each chapter is as
follows:
Chapter 1 presents the background of the study, followed by the research gaps,
research questions and research objectives of the study. Next, is the explanation on the
research steps involved and the justification for this research.

19
Chapter 2 reviews the previous studies done by many researchers and scholars,
specifically in the domain of TQM and KM. The concept of quality was defined,
followed by an in-depth discussion of the TQM concept based on the literatures by
Deming, Juran, Crosby and Ishikawa – the four eminence gurus in TQM. Subsequently,
four of the notable quality models, namely MBNQA, EQA, Minister Quality Award
(MQA) and Deming Prize are discussed. Additionally, the TQM practices by other
researchers in similar fields were also evaluated. In this study, the key practices of TQM
were identified based on the outcome of the literature review. Finally, the notion of
knowledge with reference to the literatures from previous researches, the theory of KM
and the three dimensions of KM (i.e. knowledge acquisition, knowledge distribution and
knowledge application) are presented.
Chapter 3 explains the development of TQM‟s theoretical framework and its influence
on KM. Based on the broad literature review of the association between TQM practices
and KM, a conceptual model that links TQM practices with KM is developed and six
hypotheses are proposed for this research.
Chapter 4 focuses on the identification and discussion of the methodology used in this
study. In addition, the sampling procedures are discussed while the validity and
reliability of the instruments used in this research including the theoretical foundations
and issues pertaining to validity and reliability analysis are also presented. Finally, the
definitions and details pertaining to the SEM application on the research framework are
elucidated.
Chapter 5 depicts the data analysis procedures and the research findings. Descriptive
analysis was also included, followed by the details of the reliability and validity tests.

20
Chapter 6 presents a detailed discussion of the two-step SEM approach to identify the
measurement and structural model to be fitted to the data. Each of the research question
as well as its respective research hypothesis is examined against a final data-fitted
model so that the decision to accept or reject can be reached.
Chapter 7 describes the Multiple Group Comparison Analysis to determine the
difference between TQM practices and KM among the manufacturing and service firms.
This chapter also presents the Multiple Group Analysis (MGA) of Structural Model for
testing whether the magnitude of the effect of each path is the same for both
manufacturing and service sectors.
Chapter 8 presents the conclusive chapter of this study. It encompasses the discussion
of the empirical findings of this study within the context of the six research questions as
well as the six proposed hypotheses. It also presents the research limitations,
suggestions for future research together with some theoretical and managerial
implications.
1.10 Research Limitations
As a consequence of time constraints and deficiency of resources, the findings from this
study have led to some limitations and shortcomings that need to be identified and
examined in the near future. First of all, this study only focused on Malaysian
companies and thus may not provide enough information needed to avoid the
occurrences of biasness. Another limitation of this study is the deployment of a cross-
sectional data collection procedure. As such, it is quite difficult to conclude the
association between time series variables. Hence, the findings from this study should
not be inferred as an evidence of a causal relationship. Besides, response bias and lack
21
of awareness of the subjects may still occur even though the survey method of
questionnaire is assumed to be cost-effective and reliable. Indeed, the target sample of
middle to higher level managers been another weakness of the study as their viewpoints
on the research topic could be different from that of ordinary employees and hence
creating bias. Finally, to further develop this topic, it is possible to identify the probable
research areas. The TQM practices selected in this study is limited in scope as only six
TQM practices were examined. Obviously, there are many more TQM practices that
could affect KM (e.g. organizational culture, organizational structure, continuous
improvement, corporate strategy and etc). They may play an imperative role in shaping
the attitudes of the employees towards KM.
1.11 Chapter Summary
This chapter presents an overview of the thesis. The background of the study and
research gap is also introduced. This is followed by the research objectives, research
questions, scope of the study and the stages of research. Then, the contributions of the
research methodology, theoretical and managerial implications are elucidated. Finally,
the definition of terms, structure of the thesis and limitations of the study are explicated.
The following chapter will presents a literature review of the TQM and KM concepts.

22
CHAPTER 2
REVIEW OF THE LITERATURE
2.1 Introduction
This chapter emphasizes on the identification of the concepts of TQM and KM as the
foundation of the literature review. Section 2.2 identifies the concept of quality. Section
2.3 presents the TQM concept from a synthesis of past studies on quality. Section 2.4
describes the four well recognized quality award models, namely MBNQA, EQA, MQA
and Deming Prize. Sections 2.5 and 2.6 present the definition of TQM and the key
practices adopted in this study. Section 2.7 describes the identification of the theory of
knowledge, discusses the theory of KM presents the identification and the explanation
of the key dimensions of KM. Finally, this chapter is summarized in section 2.8.
2.2 Quality Defined/The Quality Concept
Competition is rising at an alarming rate, whether locally or internationally – customer
expectations are getting higher and legal requirements that demands for higher quality
products and services within a reasonable price are becoming more challenging for
companies to meet these days (Sit, 2008). To ensure survival, quality is essential; hence
it is important to understand the terminology of quality. In this section, the definition of
quality by several quality scholars is discussed in details.
Quality is a multi-faceted term and is indefinite due to its intangible nature. In the past,
quality gurus have different views on what quality should be, resulting to an
inconclusive definition of quality, although there are a few ideas that exist when
interpreting quality. According to Crosby (1979), quality is defined as conforming to the
company‟s quality requirements. Ishikawa (1985) later adopted the term “company-
23
wide” as he accentuated that everyone in the organization is responsible in practicing
quality control. Ishikawa (1985) interpreted quality in two ways, which are product
quality when interpreted narrowly; and quality in work, service, information, process,
division and people when interpreted broadly. Juran (1999) on the other hand offered
two quality definitions in the opposite directions. One is that the product features meet
the needs of the customers, thus providing customer satisfaction. Second is that the
higher the quality, the lower the costs will be. In the meantime, quality according to
Juran (1999) also meant free from deficiencies, such as errors, dissatisfied customers,
increased in rework, etc. In accordance to this view, quality is associated with costs, in
which higher quality usually will costs less to produce.
In essence, the definition of quality normally includes certain common characteristics,
as mentioned by Goetsch and Davis (1997) and Lozano (1997). Firstly, they consist of
attaining or over exceeding the expectations and desires of customers as quality to
customers is related directly to their use, worthiness and usefulness it gives them.
Secondly, quality is relevant and related to the products, services, the general public,
processes, and the surroundings. Thirdly, the state of quality is ever-changing. The
quality of today may not be the same quality for tomorrow. With these commonalities
being placed together, Goetsch and Davis (1997) described quality as “a dynamic
situation related with products, services, people, processes, and environments that meets
or exceeds the expectations of customers”.

24
Quality can be viewed from two perspectives, namely internally and externally.
Internally quality is described as matching company‟s quality standards, as described by
Crosby (1979) in the earlier section. Externally quality is observed from the customer
perception, in which the product is free from any deficiencies, focusing on customer
needs and their satisfaction (Deming, 1986; Feigenbaum, 1986; Juran, 1988). Such
definition can be well applied in organizations of all sorts, be it the manufacturing,
services, profit or non-profit organizations (Juran, Gryna, & Bingham, 1974).
In a survey conducted by Mckinsey and European Foundation (1989) as cited in Dale
(2003, pp. 14-15) quality is perceived to be of great importance due to the following
reasons: (1) it is the main motive of purchase for the definitive customers; (2) it relates
to the reduction in costs; (3) it improves flexibility and enhanced responsiveness; and
(4) it reduces throughput time. Two common dimensions of quality are discussed next,
which are product and service quality.
2.2.1 Product Quality
Product quality, according to Dunk (2002), has become merely a competitive
requirement for firms rather than a provider of competitive advantage and this has
become an issue of concerns for many organizations. Without quality, an organization
will lose its credibility, affecting the trustworthiness of its product, thus resulting in
customers‟ dissatisfaction. According to Garvin (1987), there are eight dimensions in
product quality. They include performance, features, reliability, conformance,
durability, serviceability, aesthetics and perceived quality as shown in Table 2.1.
Meanwhile, Ahire, Golhar, and Waller (1996) only utilized the characteristics of
performance, reliability, and durability as indicators for product quality measurement.
Russell and Taylor (2006) on the other hand claimed that there are nine dimensions of

25
product quality instead of eight, with the additional characteristic being safety, which is
a promise and guarantee to customers that the product will inflict no harm upon the
users when using it.
Table 2.1: Product Quality Dimensions
Dimensions Descriptions
Performance The main operating features of a product.
Features The added characteristics that complement and enhance the basic function of a
product.
Reliability The likelihood that a product being able to function or use without failing
within a particular stated time period.
Conformance The extent to which the design and operating characteristic of the product meet
the predetermined standard.
Durability The expected amount of use of the product before it depreciates and wears out
physically.
Serviceability It reflects the speed, politeness and the capability of repair work.
Aesthetics It refers to how a person judge product appearance, based on the five senses of
smell, taste, look, touch and sound.
Perceived Quality The perceptions of customers on the quality of a product, based on the
reputation of the firm provider. Sources: Adapted from Hitt, Hoskisson, and Ireland (2007, pp. 144-145)
2.2.2 Service Quality
Service quality is highly stressed upon in the service sector, where expectations for
superior service for customers are placed upon by companies, daily (Cheah, 2008). If a
firm is able to provide the quality of service that is on par with the expectations and
requirements of its customers, the service firm will have an added value advantage that
can position the firm well in the competitive environment (Mehta, Lalwani, & Han,
2000). Wang, Lo, and Hui (2003) described service quality as the state of difference
between the expectations to receive a service and the customers‟ perceptions of actually
receiving the service. In simple terms, the state of difference is referred to as
“disconfirmation”. As services are experiences that are intangible, the nature of it makes
quality definition difficult. Due to its unique characteristics, many scholars and
researchers have attempted to uncover a model to assess service quality.

26
Camison (1998) suggested the literature of service quality is divided into two schools of
thoughts. One is the „Nordic School‟ and the other the „North American School‟. The
first school of thought is led by Gronroos (1988) and Gummesson (1988), which focus
mainly on differentiating the two basic elements of service quality, which are the
technical and functional quality. Derived from the concept of quality control in the
manufacturing side, the technical quality mainly focused on the appropriate generation
of the main benefit of service; meanwhile, focusing on the process of service delivery,
the function quality emphasize primarily on how the service is transported
(Gummesson, 1988).
The second school of thought, which is the „North American School‟, is headed by
scholars such as Parasuraman, Zeithaml, and Berry (1985; 1988). The emphasis of its
service quality lies on its customers‟ perceptions on the delivery aspects of service.
Drawing from the work of Parasuraman et al. (1988), five behavioral dimensions, which
are assurance, responsiveness, reliability, tangibles and empathy were revealed. The
initial report in 1985 revealed ten dimensions, which consists of tangibles, reliability,
responsiveness, communication, credibility, security, competence, courtesy,
understanding customers, and access (Parasuraman et al., 1985). To decrease the
number of items and to enhance the credibility of the measurement, a few stages were
engaged. Subsequent to the Gap Model, a 22-item instrument called the SERVQUAL
model was developed (Parasuraman et al., 1988). From the time when SERVQUAL was
developed, it has been used and applied by numerous scholars in many service
organizations to gauge the quality of service (e.g. Dotchin & Oakland, 1994; Frost &
Kumar, 2000; Yang, Jun, & Peterson, 2004).
27
2.3 Review of TQM Concept from Quality Scholars
A thorough review of the literature was carried out to acknowledge the TQM theory
defined by quality gurus such as Crosby (1979), Deming (1986), Ishikawa (1985) and
Juran and Gryna (1993). Their contributions served as a base to understand the theory of
TQM. Subsequent sections present the main TQM application proposed by them.
2.3.1 TQM Approach by Deming
Quality, as defined by Deming was emphasized in an article (or book?), “If Japan Can,
Why Can’t We?” (Kruger, 2001 in NBC White Paper 1980). The main idea of Deming
is to focus on creating an organizational system that learns and co-operate with top
management behavior. His main purpose is to improve on a company‟s development
system that enhances quality, leading to increased productivity, and achieving total
competitive advantage in the business world. He also pointed out that high cost due to
low quality may also lead to a failure in gaining a competitive status in the commercial
world (Kruger, 2001).
Cheaper cost refers to minimizing resource wastage, workforce and errors, hence
contributing to the organizations to differentiate through solid means when adjusting to
the challenging marketplace. According to Motwani (2001), vast difference creates the
unpredictability in performance, which brings about a result of low quality. Thus,
minimizing the difference is essential in the theory of TQM. In order to accomplish his
objectives, Deming has worked out several methods that are famously known as
Deming‟s PDCA Cycle and 14-points programme. Goetsch and Davis (1997) pointed
out that a correlation between production and consumers needs was established under
Deming‟s PDCA Cycle in order to maintain the resources of each department to cater
their needs. The following lists the Deming‟s PDCA Cycle (Goetsch & Davis, 1997):

28
1. Plan – Planning the goods to be produced to the consumers.
2. Do – Producing the goods.
3. Check – Assuring that the goods were manufactured based on plans.
4. Act – Marketing the goods.
5. Analyze – Examining consumer‟s feedback on the quality, cost, and other
criteria on the goods.
Furthermore, the research society has given a favorable assessment on the Deming‟s 14
points. Ross (1993) argued that Deming 14-point principles are a requirement for each
level in an organization. Deming‟s 14-point principles are summed up as follows
(Bendell, Penson, & Carr, 1995; Ghobadian & Speller, 1994; Kruger, 2001):
1. Develop consistency in objectives on goods and enhancing service. Innovation
and distributing resources for planning in the long-term.
2. Implementing new beliefs in which faults and flaws are uncompromised in this
new economic era by studying responsibilities and applying leadership for a
difference.
3. Discontinue reliance on mass inspection by enhancing on the work processes
and developing good quality in products.
4. Stop the exercise of honouring business based on price. Quality materials are
essential as working together with a sole supplier in the long run could assist in
the reduction in cost and achieving high level of quality.

29
5. Continually enhances the manufacturing system and service by minimizing
cost and improving both product production and quality.
6. Set up on-the-job training.
7. Assist employees, gadgets and machines to increase job productivity.
Management and supervision of production workers are in need of
redevelopment.
8. Remove worries for workers so that they can work more effectively and
efficiently with crystal clear understanding on the task assigned.
9. Eliminate obstacles between staff. Interaction and working together amongst
each department are needed for enhancement.
10. Remove mottos, exhortations and numeric goals.
11. Get rid of allocations.
12. Eliminate obstacles that restrict their privilege in their pride of workmanship.
13. Establish a vibrant education and self-improvement.
14. Changing is a portion of responsibility of each individual within the
organization.

30
In summary, Deming approach on TQM emphasizes more on the importance of an
organization system en route for quality improvement and variations reduction which
probably affect an organization‟s productivity and management. Besides, Deming‟s
method has also proven that an improved organization will be able to stay afloat in the
ever vulnerable marketplace.
2.3.2 TQM Approach by Juran
According to Juran and Gryna (1993), TQM is a system of actions aimed at achieving
employees‟ empowerment, costs reduction, customers‟ satisfactions, and profits
increment. Ghobadian and Speller (1994) indicated that Juran‟s tactic to TQM
emphasizes on both team and project work that improves quality development,
supporting the interaction between both managers and employees, along with enhancing
co-ordination between employees themselves. Juran also emphasized the important
requirements needed by top management, which is laid out in terms of empowerment,
participation, appreciation and rewards. He continues to stress that top management,
instead of employees, is responsible for the main quality problems. To accomplish
quality, it needs the cooperative actions from all functions within an organization.
Juran‟s philosophy is distinguishable from Deming‟s. According to Ghobadian and
Speller (1994), Deming‟s approach to quality is not only to merely satisfy customer
needs, but to exceed customer expectations; while Juran‟s quality approach is more
focus on the fitness for purpose or use. In addition, Deming‟s main emphasis is on the
processes of the company, in which techniques such as Statistical Process Control
(SPC) is used to measure the performance in all processes; while Juran mainly
emphasized on the human element, in which communication and coordination between
functions are vital. Furthermore, Deming‟s scope of application is more holistic; while

31
Juran has a comprehensive programme for product life span, which incorporates
designing, relationship with vendors, manufacturing control, process development,
inspection, testing, distribution, customer relationships and field service.
Apart from that, Juran further clarifies his theoretical method in quality management via
the quality trilogy, namely quality planning, quality control and quality improvement
(Goetsch & Davis, 1997; Kelada, 1996). Each of the three qualities has been
summarized as follows (Goetsch & Davis, 1997):
- Quality Planning: Spotting the target market, deciding and producing products
that satisfy customers‟ needs and execute this according to plan.
- Quality Control: Assessing the quality performance by comparing the actual
performance with the preset targets.
- Quality Improvement: Performing consistently in quality improvement.
Recognize faults and come out with answers to improve performance.
In addition to that, Juran has created the theory of quality cost that allows an
organization to assess quality in the form of currency. These four costs of qualities are
explained as follows (Ghobadian & Speller, 1994):
Internal Failure Costs – All flaws identified before the product is delivered to
customer, such as scrap, failure analysis, rework, etc.

32
External Failure Costs – Warranty charges, return of material, allowances, etc
associated with flaws which are discovered after product is delivered to
customer.
Appraisal Costs – Cost in deciding the requirements for quality such as testing,
audits on the products‟ quality, inspection cost, etc.
Prevention Costs – Cost incurred to minimize the failure and appraisal costs.
These involved quality planning, product review, assessment of supplier quality,
etc.
As a concluding remark, Juran focuses on all processes in making the quality
management at each level within an organization a success rather than concentrating on
the products specification itself. His contributions on the four quality costs have
facilitated organizations to enjoy a greater improvement in the quality management
process.
2.3.3 TQM Approach by Crosby
Crosby has made his work known on TQM with a few popular concepts. Two of his
famous sayings are “Do it Right First Time” and “Zero Defects” (as stated by
Rampersad, 2005). He emphasized that prevention is better than cure as developing
solutions after the faults is discovered will result in greater cost such as prevention cost,
appraisal costs, and failure costs. Crosby highlighted that causes of mistakes happens
because of a lack of both knowledge and awareness. Therefore, the importance of
improvement is again emphasized, in which Crosby (1979) has denoted several
exercises and laws to be implemented, which comprises of both management‟s

33
commitment, and attention to every details in order to for them to be held responsible
for quality management and improvement.
Similarities can be found in both Crosby and Juran‟s philosophy whereby both believe
that the top management should take full responsibility in administering the entire
operations of an organization and they also should be the one to come up with solutions
when problem occurs.
Crosby clearly defines quality as “requirements conformance”, the lack of quality is
largely because of the existence of non-conformance (Kruger, 2001). He also suggested
his four conclusive methods to manage quality (Kruger, 2001):
1. Quality is categorized as “requirements conformance” instead of goodness
whereby management leads and provides clear direction for workers to abide by.
2. The quality system is meant for avoidance.
3. The benchmark of performance must be completely defective free.
4. Quality measurement indicates the non-conformance of pricing.
Nevertheless, quality improvement introduced by Crosby‟s 14-steps helps companies to
practice quality enhancement. Such an approach is essential in enhancing the
competitiveness of a firm as it focuses on the commitment of the managers, encouraging
the development of an organizational culture that participates in developing quality
awareness and action throughout the firm, an emphasis in preventing defects from
occurring, and the continuous improvement in the quality process (Ghobadian &
Speller, 1994). The 14 steps are listed as below (Ghobadian & Speller, 1994):

34
1) Commitment from Top Management – Elucidate the management stands for
quality.
2) Quality Improvement Team – Implementing the Quality Improvement
Program.
3) Quality Measurement – A list of current and possible non-conformance
problems is presented, allowing for objective examination and corrective
measures.
4) Quality Cost – Detailing the elements that amounts to quality cost, which is
used as a tool by managers.
5) Quality Awareness – Providing a method that brings to awareness the personal
concern experienced by all employees within the organization regarding the
product or service conformance and the reputation of its quality.
6) Corrective Measures – Presenting a systematic way to resolve problems
experienced in the previous steps.
7) Zero Defects Planning – To assess the various events that are executed to make
ready for the official launching of the Zero Defects program.
8) Supervisor Training – Describing the type of training needed by supervisors in
order for them to actively participate in the quality improvement program.

35
9) Zero Defects Day – Using personal experience, put in place an event that
allows employees to be aware of the changes being made.
10) Goal Setting – Turning commitments and promises into actions by encouraging
members to come up with improvement goals for themselves and their groups.
11) Error Causal Removal – Presenting individuals with a platform to
communicate with the managers regarding situations that are complex for the
workers to meet the promise for enhancement.
12) Recognition – Value the ones who involved themselves.
13) Quality Councils – Assemble the individuals‟ professional quality for regular
interaction.
14) Do It Over Again – Ensuring continuous quality improvement program
Nonetheless, Crosby‟s 14-steps has included planning, contribution from each level in
an organization, and execution which leads to Zero Defects. This has given a clear
direction to the majority of the organizations. However, Crosby‟s approach has
presented more guidance to the management team instead of the practice, namely the
tools or techniques for engineers.

36
2.3.4 TQM Approach by Ishikawa
The quality perception by the Japanese is highly inspired by Ishikawa‟s work.
According to Ishikawa (1985), the Japanese‟s belief in quality control is innovation in
terms of managers creating an alternate method of thinking in management. Apart from
this, quality control can be applied in the development, design, production and quality
product service stages, whereby the good is reasonably priced, practical and commonly
satisfies the consumers‟ needs. Therefore, each individual has to participate in quality
control, notably the top management team (Kruger, 2001).
Ishikawa argued that the main rationale for an organization to be successful is largely
dependent on quality enhancement as a non-stop mission, whilst he too emphasized that
quality management goes beyond goods, and involves after-sales service; the quality of
top management, each individual and the organization itself. Nevertheless, commitment
to improve will enable life-long learning for workers, ensuring the success of TQM
(Ishikawa, 1985; Zhang, 2000).
Ishikawa has given his attention to the technical statistical techniques that are applicable
in industry (as quoted by Rampersad, 2005). He also focuses on good data collection
and presentation. Therefore, Ishikawa formulated on a few quality tools that involved
Histogram, Cause and Effect (Ishikawa diagram), Scatter diagram, Pareto Chart,
Stratification Chart, and Check Sheet (Evans & Dean, 2000). Ghobadian and Speller
(1994) have listed out Ishikawa‟s approach of TQM which consists of six fundamental
principles:
1. Quality should be given the priority instead of revenue in the short term.
2. Customer orientation should be targeted instead of producer orientation.

37
3. Overcoming the barrier of customers‟ sectionalism.
4. Showing of facts, data and the application of statistical methods are encouraged.
5. Respect as part of management philosophy and support the full involvement in
management.
6. Support the creation of cross-functional group.
Besides, the success of establishing Ishikawa‟s six basic principles has an effect on
(Rampersad, 2005):
- Enhancing on product quality and reliability, whilst faults and mistakes will be
reduced.
- Improving on products consistency.
- Cost-saving.
- Minimizing rework and wastage.
- Enlarging the sales market.
- Improving on management.
Ishikawa has been considered as one of the experts in TQM because of his emphasis on
quality. Based on this reason, he has developed a few methods called quality tools such
as Ishikawa diagram, etc (as listed above).
38
He places customer as a truly important person in the production process as he often
emphasizes that one should simply concentrate on goods or services. In reality, one
must include the quality control of the whole organization as operating a business is on
a long-term basis. In addition, quality control should be extended beyond the provision
of product, in which he argued that it should also include after-sales service, the quality
of the individuals, top management and the company itself (Ishikawa, 1985). This
concurs with the view of both Feigenbaum (1986) and Groocock (1986). By stressing
this, it helps to preserve or even enhance on the goods and services provided.
Conversely, the cost of production will minimize faults.
Besides that, Ishikawa also supports the deployment of „quality circles‟. Like all other
gurus, the importance of education was also emphasized in his work. He mentioned that
quality starts and ends with education. From his perspective, every employee should be
educated with the seven basic techniques of quality, which are histograms, process flow
chart, check sheets/tally charts, cause-and-effect analysis, Pareto analysis, control charts
and scatter diagrams (Ghobadian & Speller, 1994).
2.3.5 Reviews on TQM Concepts
Although different concepts exist among the scholars, the similarity is that all of them
focused on quality enhancement. Their methods and viewpoint are famous today and
have obtained good evaluation by the global organizations. Though, Deming‟s belief
has been focusing on the changes all through an organization, his objectives for
enhancing quality underlines on the significance of top management taking initiatives
controlling the entire operation development. His 14-points principles encouraged
implementation at all levels in the organizations; it has provided a clear guidance to
organizations in which they could improve on quality management.

39
According to Juran‟s methodology, he highlighted the magnitude in achieving
customers‟ satisfaction, whilst product quality has to be put behind the perception of
satisfying customers‟ needs which indicates that goods should be suitable to use instead
of conforming to the product specifications itself. He too stressed on both team and
project work. He emphasized that the management team is responsible for the key
problems with quality instead of the workers, thus accomplishing quality needs actions
and performances in all functions rather than the quality department alone. Besides,
Juran concentrated largely on both the process of technical and managerial - quality
trilogy has been a platform to guarantee quality can satisfy the customers‟ needs.
Crosby pointed out that his approach towards TQM focuses on achieving zero faults. He
professed that avoidance is better than looking for solutions when defects take place as
this will cause a higher cost of rework and wastage might be a problem to an
organization. His famous 14-steps approach has been applied regularly by organizations
when working towards zero defects management. Maybe to Crosby, planning has
played a major part than those practical tools and techniques when compared to other
scholars.
Ishikawa‟s opinion on quality management goes beyond goods; he considers both after-
sales service and the opinion of the consumers. His focus on collecting data and the
presentation of result produces a few quality tools such as his famous Cause and Effect
Diagram (Ishikawa‟s diagram), etc. However, he also suggested six basic principles that
highlight customers‟ orientation techniques leading towards quality management that
pursues improvement.
40
2.4 Review of Quality Award Models
This section will review the four major quality awards which are widely recognized as
the pinnacle of quality management achievement. They are MBNQA, EQA, MQA and
the Deming Prize. These awards symbolize the major quality award in their respective
continents. Those nominees in any of these quality awards are viewed as the greatest
accomplishment in their organization (Ghobadian & Woo, 1996). National and
international recognition are rewarded to the award winner for their exceptional
determination in achieving excellence in quality (Ghobadian & Woo, 1996).
2.4.1 Malcolm Baldrige National Quality Award
In 1987, a law was enacted in United States of America called Malcolm Baldrige
National Improvement Act which subsequently was launched as an annual award for
quality management recognition (Bohoris, 1995). The annual award is aim to show
appreciation to an organization in USA that has shown outstanding achievement in
continuous improvement and improving customer satisfaction (Ya‟acob, 2008). The
model structure of this award is used to assess the quality, standard performance of
organization‟s management against the world-class benchmarks and main competitors,
and to improve the organization‟s management practices on quality, standard
performance against world-class benchmarks and main competitors, and also to enhance
the rapport between suppliers and customers. The list below is extracted from the model
structure (1999) for MBNQA (Bohoris, 1995):
Leadership: Management headship; society duties.
Strategic Planning: Tactic progress; tactic set up.

41
Customer and Market Focus: Knowledge on customer and marketplace;
customer rapport and fulfillment.
Information and Analysis: Measurement and study on accomplishment of the
organization.
Human Resource Focus: Work system; employee learning, training and
development; employee welfare and fulfillment.
Process Management: Product and service procedures; supporting procedures;
supplier and partnering procedures.
Business Results: Customer based outcomes, financial markets outcomes,
manpower outcomes, and supplier and partner outcomes, organizational
efficiency outcomes.
Thousands of firms used the criteria to develop business processes vigorously in their
in-self-assessment and training. Various issues of quality are discussed by MBNQA to
achieve a full and comprehensive TQM system. Last but not least, for training and
education purposes MBNQA has examination, especially for management, as it draws
out main issues concerning managers. This uniquely differentiates excellence and
mediocrity (Evans & Lindsay, 1995; Lau & Idris, 2001).

42
2.4.2 European Quality Award
The European Foundation for Quality Management was established based on the
formation of 14 leading Western European business organizations in 1900 with the
objective to improve quality management in Europe. EQA was introduced after
MBNQA of United States of America (Bohoris, 1995). EQA stresses on resources
because it dedicates the overall part to management resources.
Bohoris (1995) explained that the model of EQA is clustered into enablers and results;
where leadership, management, policy and strategy, processes and resources are
indicated by the enablers whilst people satisfaction, society impact and business
outcomes are stated by the results.
The nine criteria of EQA are listed below (Bohoris, 1995; Rampersad, 2005):
1. Leadership
- Communications with customer and suppliers;
- Make sure progress, accomplishment and enhancement in an organization;
- Leader in total quality management;
- Applying stability in total quality culture.
2. Policy and Strategy
- Policy and strategy are constantly examined and enhanced;
- Created by information via research and analysis;
- How do they interact;
- How are they significant to the theory of total quality.

43
3. People
- Are the organization‟s resources well-prepared and in order?
- How was the enhancement development to be carried out?
- Are the people and teams obliged to the same objectives?
- How efficient is the interaction between top management and workers?
4. Resources
- Partnership;
- Finance;
- Properties and assets;
- Information technology.
5. Processes
- How processes head towards enhancement?
- How systematically organizations run?
- How organizations encourage improvement on to the progress of
enhancement?
- How organizations handle quality and relationships with customers?
6. Impact on Customers.
7. Impacts on People.
8. Society‟s Perception.
9. Business Performance.

44
2.4.3 Malaysian Quality Award
In 1990, the Malaysian Prime Minister‟s Quality Award was launched; it was renamed
as the MQA sometime later. This award is presented to give recognition and
appreciation to organizations in the private sector which have outstanding achievements
in quality management (Ya‟acob, 2008). The aim of MQA in the private sector is to
boost Quality Awareness and implementation of Quality values.
There are seven criteria used by MQA which are as follows (Ya‟acob, 2008, pp. 68-69):
Criteria 1: Leadership in quality management studies; which refers to the role of
management team in organizing and coordinating quality management
initiatives and other associated stages.
Criteria 2: The employment of Quality Data and Information; which refers to the
utilization of quality information and data for quality development purposes.
Criteria 3: The process of strategic planning; which is the practice of combining quality
planning within the strategic plans of the whole organization.
Criteria 4: To be human resource focused; which is to measure the effectiveness in
managing staff development, management, involvement as well as the
working culture in the organization.
Criteria 5: Steps taken by companies to make sure that outputs are in good quality,
which can be measured in terms of quality audit, process and documentation,
also known as Quality Assurance output.

45
Criteria 6: The Quality innovation improvement project; which is the attainment of
quality programs during the existing year as compared to the past years,
which is based on customer recognition, quality innovation and quality
output.
Criteria 7: Being customer focused; which is to undertake activities that enhance
customers‟ satisfaction.
The global development of national quality award has influenced the practices of
national quality award in Malaysia. This section will be concluded based on the finding
of the analysis conducted by Chuan and Soon (2000). The three most influential quality
awards, namely the Deming Prize, MBNQA and EQA have been used as the model for
most of the national quality awards. The criteria that form the national quality awards
have much similarity despite there are differences found in these models (Sila &
Ebrahimpour, 2002; Ya‟acob, 2008).
2.4.4 The Deming Prize
The Deming Prize was launched in 1951 by the Board of Directors of the Japanese
Union of Scientist and Engineers with the mission to give acknowledgement and share
the quality learning to organizations which have successfully practiced statistical quality
control techniques to achieve good quality control (Ghobadian & Woo, 1996).
Ten key aspects were stressed on and draw out from Deming Application Prize as the
checklist that rate the achievements of top management as it emphasizes on the
importance of their involvement in understanding quality management (Zhang, 2000).
Eventually, this has gradually evolved into the guideline to top management to identify

46
what are to be executed accordingly. Ten key aspects based on Deming Application
Prize (Zhang, 2000) are listed below:
Policies – Focus on quality and also the tactic to control quality including
targets, appropriate methods which come out with policies; short-term and long-
term planning; and leadership of the managements.
Organization – Explanation on function and duties as well as of arrangement
which involves each worker and the association with linked companies for
quality control.
Information – Gathering and translating both external and internal information
with the suitability of methods in data analysis, data processing, applying and
retaining of information.
Standardization – Develop typical system that consists of measures for adjusting
and removing standards; assess actual accomplishments.
Resources (Employees) – Training and knowledge given to workers which
would mould clear opinions in the understanding of quality control and quality;
suitability of guidance which inspires, encourages and establishes oneself
towards the enhancement programs.
Quality – Developing system that guaranteeing diagnosis, examine which aspect
operates well in quality control, quality development and quality improvement
and also in creating good customers‟ rapports.
47
Maintenance – Applying short-term and long-term procedures; enforcing ways
to work out on the level of control; cost management operating systems, quantity
and the activity of PDCA series.
Improvement – Exercising Quality control by choosing important events and
precedence subjects with the application of statistical method to examine
outcomes and making sure enhancement outcomes and transferring them to
maintenance advancement.
Effects – Involving both intangible and tangible (costs and revenues, quality)
effects; resolving customers‟ requirements and employee satisfaction and as well
as the consequence on organizations.
Future plans – Comprehend the present condition, planning for errors reduction
and faults. Estimating environmental variation and suitability of ways to satisfy
customers‟ requirement. Persistently exercising quality control.
The most vital issue in Deming Prize is that an organization should fully understand the
control in quality, assurance in quality and application of methods of quality control in
management. The efficiency of policies is verified through the temporary and
permanent plans made. On top of that, it also assesses the capability of employees and
satisfaction towards the management and whether the organization is implementing the
same philosophy to ensure that the organization is well organized. The status of the
organization is maintained or improved by setting high priority on quality control
activities. Besides this, in this highly competitive environment, the vision of
organization need to be drawn out by having a good planning and set it determinedly.

48
2.4.5 Results from Quality Awards
After reviewing the four Quality Awards - MBNQA, EQA, MQA and Deming Prize,
similar points are identified in each of the criteria or minor relationship that relate with
one another. The three qualities that are stressed on and which are rated important and
given credit in boosting the achievement of organizations are leadership, resources, and
customers‟ satisfaction, whereby processes are rated as important in quality
management and affect the business outcomes.
Several quality awards were reviewed and some differences were found. As reviewed
above, Deming was the first quality award introduced, followed by EQA. These two
awards are slightly different in the manner where MBNQA emphasizes on the customer
results and continuous improvement by assessing the management practices and boost
the bond with customer and suppliers through investigation; EQA recognizes the
effectiveness of the TQM development and stresses more on how it affects the
development to improve society and people who are related with the management team
with workers. On the contrary, MQA emphasizes on the application of quality data and
information and the Quality Assurance of the suppliers externally. It is also made to be
understood that the importance of corporate responsibilities in building up quality
management and also to acclimatize to world-wide standards. In Deming Prize, through
the ten elements it is clearly stated that to achieve good quality control, an organization
should have a full set of quality development from top to bottom. In view that the
achievement of TQM can improve business settings, each step in developing the plan is
important and should not be missed or erroneous.

49
2.5 Review Critical Practices of TQM from Other Researchers
The practice of TQM has been defined in many ways in the literature review of past
empirical articles, even though they complement one another (Prajogo & Sohal, 2003;
Terziovski & Samson, 1999). Quality gurus in the likes of Deming, Juran, Crosby,
Ishikawa, Feugenbaum and Gryna came up with certain recommendations in the field of
quality management. Their insightful views into quality management have provided a
well thought out quality management dimensions (Zhang et al., 2000).
Furthermore, well-known quality award models, namely the Deming Prize (1992) in
Japan, the EQA (1994) in Europe as well as MBNQA (1997) in the United States have
provided both researchers and practitioners with a useful benchmark model in which
organizations can assess their quality management techniques, the adoption of those
practices as well as evaluate the end results.
There have been several attempts made by researchers to identify, study, review and
assess the important factors that are found in the TQM strategy. Powell (1995) has
identified leadership commitment, the adoption of philosophy, customers as well as
suppliers‟ closeness, training and development, benchmarking, empowering employees,
open organization, flexible manufacturing, zero-defects perspective, process
improvement and measurement to be essential elements of a TQM framework. On the
other hand, eleven TQM practices have been identified by Zhang et al. (2000) on the
grounds that they are well-established and recognized practices for quality improvement
from the perspective of the Chinese. Embedded in the eleven practices are top
management, vision and strategic planning, assessment, process management and
improvement, designing of product, improvement in quality system, employee

50
involvement, reward and recognition, training and education, supplier quality
management and customer focus.
Review papers, such as those that have been written and published by renowned
researchers such as Ahire, Landeros, and Golhar (1995), Dean and Bowen (1994),
Fynes (1998), Ho and Fung (1994), Sila and Ebrahimpour (2002), Tari (2005),
Thiagarajan and Zairi (1997a; 1997b; 1997c) and Yong and Wilkinson (1999) are all
widely accepted to be the leading study in the TQM literature.
TQM is a management philosophy that can be categorized into many techniques and
dimensions (Dean & Bowen, 1994). The three core dimensions identified mainly
comprised of teamwork, continuous improvement and customer orientation. In turn,
these dimensions are supported by wide-ranging techniques. In the same year itself, Ho
and Fung (1994) went on to suggest that they are ten elements in TQM which
comprised of top management, continuous involvement, commitment, involvement and
participation, training and development, ownership, prevention of errors, rewards and
recognition, teamwork and cooperation, and lastly customer satisfaction.
In Ahire et al.‟s (1995), they have systematically analyzed a sum of 226, conceptual
framework articles, empirical studies, case studies as well as analytical journals from
the TQM related field between the years of 1970 to 1993, utilizing MBNQA as a
foundational framework. They concluded that many of the TQM articles being reviewed
are that of an overview, conceptual in nature and quite subjective. Therefore, the
empirical studies published were far from sufficient.

51
Similar with Ahire et al. (1995), TQM literature that used a set of criteria similar to that
of EQA and MBNQA have also been reviewed by Thiagarajan and Zairi (1997a; 1997b;
1997c). However, a huge portion of their review mainly emphasized on case studies and
the recommendations of quality gurus in the likes of Deming and Feigenbaum in the
various discussions related to TQM adoption.
Through a detailed review of the TQM literature, it was found that TQM can be divided
into „soft‟ and „hard‟ elements, as suggested by Thiagarajan and Zairi (1997a; 1997b;
1997c). The soft TQM elements comprised of leadership commitment, teamwork,
empowerment, effectual communication, a well-developed recognition system and an
appreciation for quality efforts, as well as training and development. In contrast, the
hard elements are those referred to as tools, techniques and systems used, such as
benchmarking, process management, quality management systems that are documented,
as well as supplier and customer management. In order have effective TQM
implementation, it is believed that both soft and hard elements must co-exist.
In another comprehensive TQM review, 20 empirical studies on TQM were examined
and investigated by Fynes (1998) in which the critical factors of TQM were tested and
confirmed. He identified and adopted the seven critical TQM factors proposed by Flynn
et al. (1994) as his conceptual framework and further examines the empirical studies
associated with the seven areas. The support of quality information, top management,
work management, process management, product design, supplier and customer
involvement remain the seven critical factors.

52
In another instance, 15 articles on the benefits of TQM on organizations were critically
reviewed by Yong and Wilkinson (1999). Most of the articles reviewed by them were
studies conducted on the association between TQM and company performances in
different countries. The conclusions were two folds. From the previous studies, some
reported that TQM is positively related to performance; whereas some revealed that
TQM adoption is unsuccessful and indifferent towards the company‟s performances.
Often, it was predicted that the downfall of TQM implementation is due to the partial
adoption of quality management.
At the beginning of the new millennium, Sila and Ebrahimpour (2002) conducted a
comprehensive review on 347 research journals that were published between the years
of 1989 to 2000 in an assortment of journals. Most of these scholarly articles have
adopted the survey approach in which were conducted in various countries. In their
investigation of 76 survey articles on TQM, they found that there were 25 TQM factors
that are most commonly used across these studies. Moreover, by utilizing these 25
factors to construct a framework model, they concluded that leadership commitment,
employee involvement, teamwork, customer focus, employee training, continuous
improvement, and having quality information and performance measurement remained
as the seven most often used TQM factors in the literature. Interestingly, in the 347
research papers that were reviewed and examined, only four were conducted in
Malaysia, which constitutes approximately 1.2 percent.
A more recent review on the literature of TQM by Tari (2005) revealed nine critical
factors pertaining to TQM practices. They are top leadership commitment, customer
based perspective, continuous improvement, quality planning, management based on
facts, human resource practices, process management, gaining supplier‟s cooperation,

53
and company‟s awareness with regards to issues relating to the social and environment.
Members‟ participation in firms, teamwork, training and communication systems are
some of the essential elements that are included in the human resource management
factor.
In essence, rich information from the review papers has provided both practitioners and
researchers a better understanding on the quality management area. However, as noted
by Ahire et al. (1996), the review papers are lacking in empirical confirmation and a
systematic scale development. Due to the significance of TQM being an essential
measurement instrument, many authors have started to identify, develop and test the
critical factors of TQM by utilizing the national quality award model, the in-depth
review of past literatures, and the recommendations by quality gurus (e.g. Ahire et al.,
1996; Black & Porter, 1996; Saraph, Benson, & Schroeder, 1989). Using meticulous
statistical analysis, the strength of the TQM critical factors are being verified in a
„statistical‟ way. Hence, it accommodates the development of scientific research on
TQM.
2.6 TQM Practices in this Study
TQM is depicted as a set of guiding values that characterizes the foundation of a firm
that continuously improve itself, in which the firm is advancing consistently in every
aspect of every process, level and activity and so on, it is perceived to be one of the
finest objective for the firm (Chang & Sun, 2007). In order to attain such a goal, it
requires the involvement of every employee in the firm, regardless of ranking or
position, to please the desires and needs of customers (Deming, 1986; Feigenbaum,
1980; Juran & Gryna, 1988). Apart from that, TQM can also be portrayed as an entire
company effort that includes every worker, trader and consumer, in which the firm aims

54
to consistently enhance the value of the goods and procedures, to satisfy and surpass the
expectations of the consumers (Dean & Bowen, 1994).
Past research has been conducted and the conclusion was drawn that the adoption and
implementation of TQM practices can enhance a firm‟s competitiveness and
performance (Dow, Samson, & Ford, 1999; Hendricks & Singhal, 2001a; Powell, 1995;
Terziovski & Samson, 2000). Many past studies confirmed that the application of TQM
practices has a positive force on a firm‟s end result, such as the enhancement of product
quality and other non-financial results (Choi & Eboch, 1998; Dow et al., 1999; Elmuti
& AlDiab, 1995; Forker, Mendez, & Hershauer, 1997; Mohrman, Tenkasi, Lawler, &
Ledford, 1995; Powell, 1995; Shetty, 1993; Terziovski & Samson, 1999; 2000),
monetary results (Easton & Jarrell, 1998; Hendricks & Singhal, 2001a; Hua, Chin, Sun,
& Xu, 2000) and also the value of the company‟s stock (Adams, McQueen, &
Seawright, 1999; Easton & Jarrell, 1998; Hendricks & Singhal, 1996; 2001b).
Therefore, by adopting TQM practices, company‟s management will reap the reward in
a tremendous manner as it results in an improved performance on the organization as a
whole (Adams et al., 1999; Choi & Eboch, 1998; Dow et al., 1999; Easton & Jarrell,
1998; Elmuti & AlDiab, 1995; Forker et al., 1997; Hendricks & Singhal, 1996; 2001a;
2001b; Hua et al., 2000; Martinez-Costa & Jimenez-Jimenez, 2008; Mohrman et al.,
1995; Powell, 1995; Shetty, 1993; Terziovski & Samson, 1999; 2000).
The most influential constructs of TQM, according to several researchers, are those that
are intangible, or cannot be seen. In other words, these dimensions can also be
expressed as the behavioral aspects, as Powell (1995) emphasized. Such behavioral
factors include leadership, customer and human resource focus, and they are believed to
pose a greater impact on the firm‟s performance. In line with this statement, Flynn,

55
Schroeder, and Sakakibara (1995) found that leadership support, human resource
management and by being customer and supplier focus can facilitate the firm to achieve
an impressive results through these three behavioral function aspects as „enablers‟ that
stimulate and encourage other elements. Furthermore, the three intangible variables
stated by Powell (1995), which are management support, the open-mindedness of a firm
and employee empowerment, increase the competitiveness of a firm as they are one of a
kind and are difficult to duplicate. Dow et al. (1999) described these intangible
behavioral factors as „soft variables‟, as these components are intangible but have a
direct effect on how well a firm performs. The findings from Sun (2000) show that
leadership, strategic management planning and customer focus are the most essential
elements; whereas the findings of Curkovic, Vickery, and Droge (2000) portray the
main elements are of the similar three, which are leadership, customer focus and
employee empowerment in an automobile industry.
From the literature review, numerous researchers have been found to use the six
dimensions of TQM presented by MBNQA. These consist of human resource
management, leadership, customer focus, process management, strategic planning and
information and analysis (Jitpaiboon & Rao, 2007; Prajogo & Sohal, 2003). Such
practices are used to examine on whether the TQM constructs do have an effect on the
development and improvement of a KM.
The MBNQA framework has been widely accepted by numerous academicians and
researchers as being one that signifies a complete set of TQM practices. According to
Garvin (1991), not only does the award make mention on the quality management
principles in a well-defined way, it also provides companies with an extensive structure
to assess and review their progress of managing organizations in a new way. As

56
mentioned by Garvin (1993), MBNQA has been a vital contribution to many United
States firms, be it the private or the public sector, to develop and revolutionize their
management principles, and this is set to reform and redesign the managers in their
opinions and their behaviors (Terziovski et al., 2000). As the MBNQA concepts have
surpassed the users‟ expectations, Bemowski and Stratton (1995) found that these six
practices were also employed to gather knowledge on the way to attain competitive
advantage. Moreover, apart from being identified as a standard target to indicate the
overall TQM concepts, the MBNQA practices also supply many United States public
and private companies with a complete framework, to examine and better manage their
companies‟ management standards (Terziovski et al., 2000). These six TQM practices
can be further narrowed down into two aspects, according to Yong and Wilkinson
(2001), that is the “soft” and “hard” elements (Wilkinson, 1992). The “soft” aspects,
which include the practices of leadership, customer focus and human resource
management, can arouse employees‟ awareness on the consumers‟ requirements and
encourage quality to be better handled in the firm (Yong & Wilkinson, 2001). In terms
of the “hard” components, which consist of practices such as strategic planning, process
management and information and analysis, it seeks to improve the production
techniques and also the business processes within the organization (Yong & Wilkinson,
2001).
Furthermore, it is an established fact that numerous manufacturing companies from the
developed countries, in particularly United States, Japan and Australia, have adopted the
six TQM practices and concluded that they are success factors for achieving sustainable
advantage (Samson & Terziovski, 1999). Apart from that, renown researchers such as
Dean and Bowen (1994), Prajogo and Sohal (2003) and Samson and Terziovski (1999)
have also employed these six practices in constructing their research framework to

57
investigate the link between TQM and other variables. As for its applicability in
developing country, academicians such as Hoang, Igel, and Laosirihongthong (2006)
have adopted these TQM dimensions to measure its influence on the innovation
performance of the Vietnamese firm. From the Malaysian context, several researchers,
such as Sit, Ooi, Lin, and Chong (2009), Teh et al. (2008) and Teh, Yong, Arumugam,
and Ooi (2009) have also used this six TQM practices to conduct their research and
found that TQM does have a positive impact on the morale, behavior and attitudes of
company employees.
Six TQM constructs were chosen after a thorough review of the literature. As can be
seen in Table 2.2, leadership, strategic planning, customer focus, human resource
management, process management, and information and analysis (Motwani, 2001;
Powell, 1995; Saraph et al., 1989; Teh et al., 2008) are chosen for three essential
reasons (Hoang et al., 2006):
a) The TQM dimensions integrated in our research framework originate from well-
acclaimed quality awards such as MBNQA, EQA and Australian Quality Award
(AQA).
b) Both soft (i.e. leadership, customer focus and human resource management) and
hard (i.e. process management, strategic planning and information and analysis)
elements of TQM as accorded in the literature that are incorporated into the
research model.

58
c) The TQM practices selected are well recognized by previous researchers and
scholars for being the key TQM practices in both manufacturing and service
sectors (Hoang et al., 2006; Powell, 1995; Prajogo & Sohal, 2003; Samson &
Terziovski, 1999).
Table 2.2: The Six Dimensions of TQM with Their Explanations
Constructs Related studies Explanations
Leadership Ahire et al. (1996); Dean and Bowen
(1994); Powell (1995); Prajogo and
Sohal (2003; 2004); Saraph et al.
(1989)
The extent of support top management
gives when creating a total quality
culture, which is important to the success
of TQM adoption.
Strategic
Planning
Anderson (2000); Motwani (2001);
Powell (1995); Prajogo and Sohal
(2003; 2004); Saraph et al. (1989)
The extent to which a clear mission,
vision, a long run strategic plan and
quality policy exist in a company.
Customer
Focus
Black and Porter (1996); Evans and
Lindsay (1995); Flynn et al. (1994);
Hoang et al. (2006); Powell (1995);
Prajogo and Sohal (2003); Samson
and Terziovski (1999)
It remains vital to keep the customers
satisfied, by developing and managing a
strong customer relationship for a longer
period. It is also important to understand
the current needs and future expectations
of the customers.
Human
Resource
Management
Black and Porter (1996); Flynn et al.
(1994); Samson and Terziovski
(1999); Wilson and Collier (2000)
The extent of creating a wide-ranging
management process to be incorporated
in a firm‟s strategy.
Process
Management
Ahire et al. (1996); Flynn et al.
(1994); Juran (1995); Motwani
(2001); Powell (1995); Samson and
Terziovski (1999); Teh et al. (2008);
Zairi (1997)
Adding value to processes, enhancing
quality levels and coming up with
programmes that decreases wasted time
and costs in all internal processes are
emphasized.
Information
and Analysis
Hackman and Wageman (1995);
Prajogo and Sohal (2003; 2004);
Samson and Terziovski (1999); Sila
and Ebrahimpour (2003)
The extent to which data and information
is gathered and examined for the purpose
of attaining quality improvement.
Sources: Adapted from Hoang et al. (2006); Ooi (2009)
2.7 Review of KM Concept
In this section, we provide a review on the literature of theory of knowledge, theory of
KM and the dimensions of KM.
2.7.1 Theory of Knowledge
Knowledge, in its simplest form, is defined as an intangible asset which is difficult to
duplicate and is viewed as a competitive tool that should be managed effectively (Lim et
al., 1999). Through the proper management of knowledge, it could help a company to

59
create value (Lin & Tseng, 2005) and drive the firm to become more effective in its
organization, hence increasing its competitiveness (Hlupic, Pouloudi, & Rzevski, 2002).
According to Lim et al. (1999), knowledge originates from raw data that are pooled
together to create information. Such information will then be shared to create
knowledge (Lim et al., 1999). Knowledge basically derives from an individual‟s
capability to use sensibly the available information obtained from the surrounding
environment, be it the social or workplace surroundings (Bentley, 1999; Broadbent,
1998). Mauro (1999) further pointed out that knowledge is obtained by experiencing,
seeing and reporting; and such knowledge can be explained with data and theories. Two
major components of knowledge are explicit and tacit.
2.7.1.1 Explicit Knowledge
According to Lin and Tseng (2005), explicit knowledge is defined as tangible
knowledge, which is clear and can be captured easily. Furthermore, such knowledge can
be transmitted to an external party by encoding it into a media of some form, such as
paper documents, electronic records, leaflets, advertising materials, brochures etc. In
other words, it can be distributed and replicated without much difficulty (Linderman,
Schroeder, Zaheer, Liedtke, & Choo, 2004). A company‟s mission and vision
statements, as well as business objectives and goals are some of the explicit knowledge
that is seen within a workplace (Waddell & Stewart, 2008).
2.7.1.2 Tacit Knowledge
Tacit knowledge is knowledge that is accumulated inside a person. As such, it is not
easily seen and is harder to formalize and communicate to another party (Lin & Tseng,
2005). Such knowledge comprises of cognitive learning and mental models (Walczak,
2005). Waddell and Stewart (2008) concluded that it is a technical know-how that is

60
possessed by an individual within him/herself and that it cannot be transferred to
another individual explicitly or documented on paper or electronic form.
Previous research has illustrated that both tacit and explicit knowledge are mutually
exclusive. Nonaka (1994) develop a theory suggesting that knowledge can be created
through a continuous interaction through the epistemological and ontological constructs
of knowledge. The four interaction of tacit and explicit knowledge includes tacit to tacit
(socialization), tacit to explicit (externalization), explicit to explicit (combination) and
explicit to tacit (internalization). With such interaction, new knowledge can be created
through existing knowledge.
2.7.2 Theory of KM
According to Yang (2008), one of the most adequate definitions of KM is to transform
tacit into explicit knowledge, so that knowledge can flow throughout the whole
organization, to different department and units (Lubit, 2001; Schulz & Jobe, 2001). KM
is not something new according to some researchers, as it has been applied for several
years without being defined precisely (DiMattia & Scott, 1999; Hansen, Nohria, &
Tierney, 1999). KM is referred to as a process of managing, controlling and effectively
using the knowledge systematically within a firm (Laudon & Laudon, 2001). The
purpose of KM is to steer clear of reinvention within the organization itself and decrease
idleness in firms‟ knowledge activities by exploiting the current knowledge assets (Hsu
& Shen, 2005). It is essential to be used in an unpredictable marketplace as KM is
needed to invent and improve on how individuals perform their tasks (Brown & Duguid,
2000). It is used widely in organizations to help control the intellectual competencies
and skills of workers (Adamson, 2005). To add on to this, to be able to manage different
types of information, firms have the advantage of using it to meet the needs of the

61
market, as they are better able at recognizing and developing existing acquired
knowledge to take advantage of the unexploited business opportunities (Quintas,
Lefrere, & Jones, 1997). Therefore, by managing knowledge well in an organization, it
helps the firm to create value and generate a competitive edge (Tiwana, 2001).
2.7.3 Dimensions of KM
The process of KM consists of five stages, which are knowledge acquisition, knowledge
codification, knowledge dissemination, knowledge development and knowledge
application, all of which are essential and unique on its own (Van Zolingen, Streumer,
& Stooker, 2001). Shin, Holden, and Schmidt (2001) on the other hand suggested a
simple four activities for KM value chain – creating, storing, distributing and the
application of knowledge. In this research paper, only three activities of knowledge
management are looked upon – knowledge acquisition, knowledge distribution and
knowledge application. These specific aspects are considered for three reasons. Firstly,
in order to be continuously improving in the quality of products and services, it is
essential that organizations acquire knowledge from employees, customers and
suppliers consistently. This can be done through the continuous interaction and getting
feedback from this group of people (Yang, 2008). By doing so, firms will have a better
understanding of their employees‟ skills and experiences, customers‟ preferred choices
of products (Yang, 2008), the financial status of their firms, the latest trends and
technological developments in the market and so on (Darroch, 2003). This in turn
facilitates the firm to store up tacit knowledge that is within these people, therefore
meeting quality assurance in each aspect is essential. Secondly, employees‟ involvement
in disseminating knowledge is essential to ensure that quality is maintained within a
company (Yang, 2008). According to Hsu and Shen (2005), only through the
participation and contribution from employees can the quality improvement be

62
maximized in a firm. Thirdly, knowledge application goes along with the line of
responding to the knowledge that has been acquired and shared (Darroch, 2003). For
example, organization responds to the knowledge acquired from customers by
producing products with their preferred features or applying knowledge that has been
shared by employees to improve the overall company processes. The required respond
time to such knowledge is seen to be vital as knowledge that is applied quickly enhance
the competitiveness of the firm (Darroch, 2003).
2.7.3.1 Knowledge Acquisition
Acquiring knowledge is the first step of KM, which consists of managing and using
existing information and capturing new ones (Gilbert & Codey-Hayes, 1996). The
process of acquiring knowledge, according to Sternberg (1983) is a learning process,
sifting out new information and accumulating them in the mind. Hence, knowledge
acquisition is an important process for both learning for the individual as well as the
organization stage (Hergenhahn & Olson, 1997; Nonaka, 1994). Furthermore, it is
identified as a process of recognizing knowledge in the external environment and
converts the knowledge to be used within the company, also known as externalization
(Holsapple & Singh, 2001). Both Zahra and George (2002) opined that knowledge
acquisition is the paramount to a firm to recognize and obtain information for the
efficiency of its operations.
Knowledge can be acquired from numerous sources. For SMEs that have limited
resources, they are likely to obtain knowledge from secondary data such as research
articles, trade journals and professional business magazines (Cegarra-Navarro, 2007). It
is believed that through the continuous acquisition of knowledge, firms‟ technological
innovation will inevitably increase (Darroch & McNaughton, 2002; Gilbert & Codey-

63
Hayes, 1996). The ability of a firm to retain and acquire knowledge in a society that
changes rapidly everyday will prosper and survive (Egbu, Hari, & Renukappa, 2005).
2.7.3.2 Knowledge Distribution
According to Egbu et al. (2005), the sharing and transferring of knowledge is part and
parcel of knowledge dissemination. Knowledge dissemination/distribution refers to
managing the sharing of information in an organization, to prompt innovative and
creative ideas, make aware of previous good practices and inspire managers to take on
more improved methods for future decision making processes (Wijnhoven, 1999). It
incorporates the passing of information from one individual to another individual within
a firm (Almond, 2001). Hence, knowledge sharing can be fostered among employees
within an organization as this is seen to be beneficial for the long term sustainability of
the firm (Lin, 2007; Ruhi, 2003; Wang, 2009).
Lin and Lee (2005) found that the sharing of knowledge can help to improve the firm‟s
performance. Through knowledge distribution, employees will be more aware of the
changes that are taking place in the firm itself, the marketplace, and the economy as a
whole, thus increasing firms‟ ability to better handle the relationships with business
partners (Ruhi, 2003). In addition, an environment that supports knowledge sharing
encourages the staff to be more open in their sharing, thus allowing existing knowledge
to be shared during meetings, group discussions and informal conversations, which will
indirectly make rooms for new knowledge to be created (Fernie, Green, Weller, &
Newcombe, 2003; Ho, 2009; Yang, Moon, & Rowley, 2009), therefore enhancing the
firm‟s ability to make high-quality decisions (Kearns & Lederer, 2001).

64
Knowledge distribution focuses on the process of knowledge sharing among members
who are involved in the business process (Molapo, 2007) and passing on of knowledge
among individuals within a firm (Almond, 2001). According to Yang (2004), the
sharing of knowledge is defined as information being disseminated and transferred to
every department and company. In other words, it is transferred from one member to
another (Lin, 2007). Similarly, Darr, Argote, and Epple (1995) also defined knowledge
sharing as a process where members share and learn from each other‟s experiences.
According to Molina et al. (2007), internal knowledge transfer indicates the sharing of
knowledge among members within a company itself. When the employees in an
organization are equipped with the relevant knowledge, it determines the course of
success for the company, giving the company a competitive advantage over the rest
(Han & Anantatmula, 2007). Hence, proper training should be provided to the freshly
joined workers to enable them to perform the job well with relevant knowledge.
Knowledge distribution is vital for any individuals in any organization. The concerns of
knowledge distribution are that there may be a lack of communication skills among the
employees, coupled with the rapid change of information and communication
technologies due to the lack of investment and the systematic use in such technologies
(Chong, Darmawan, Ooi, & Lin, 2010). However, the advantages of effective
knowledge sharing, in which knowledge is being disseminated throughout the whole
organization, is that it promotes creativity and innovation among the members
(Apostolou, Menttzas, & Abecker, 2008; Hong, Doll, Nahm, & Li, 2004), provides
additional information for effective decision making (Kearns & Lederer, 2001) as
knowledge is shared and disseminated through discussion and meetings (Fernie et al.,
2003; Ho, 2009; Yang et al., 2009), hence improving the competitive advantage of a
company in the long run (Lin, 2007; Ruhi, 2003; Wang, 2009). By cultivating an
environment that shares and transfers knowledge, it will transform the attitudes of the

65
employees so that they will be more willing to share and deliver their information
among each other for the benefit of the company (Connelly & Kelloway, 2003). As the
advantages of knowledge sharing are numerous, whereby knowledge can be shared
through distributing to one another in the firm, it is suggested that such motivational
activities be conducted often to promote the distribution of knowledge in the company
(Ardichvili, Page, & Wentling, 2002).
2.7.3.3 Knowledge Application
Knowledge application is defined as the development of existing knowledge acquired,
in order to make knowledge more effective and to increase its worth. It integrates the
knowledge obtained from both the acquisition and distribution stages (Cagarra-Navarro
& Martinez-Conesa, 2007) to enhance the firm‟s efficiency and effectiveness by
integrating them into daily business processes.
To enhance the technological capabilities of the firm, according to Zahra, Neubaum,
and Larrañeta (2007), the transferring, sharing and application of knowledge all play an
important role. Firms which have e-business systems in place and increasingly coming
out with new IT-enabled innovations are firms that consistently improved on their
knowledge application skills (Cagarra-Navarro & Martinez-Conesa, 2007). In Lin and
Lee‟s (2005) study, they also found that workers applying existing knowledge to
produce new information facilitate businesses that adopt the e-business concept.
Therefore, it can be well concluded that companies that emphasizes in enhancing their
knowledge application methods are firms that are more likely to take on new and radical
technology such as the internet-based businesses.

66
2.8 Chapter Summary
This chapter begins with reviewing quality concept. The TQM concept from quality
gurus such as Deming, Juran, Crosby and Ishikawa were also reviewed followed by
three quality award models. These three awards are: the Deming Prize in Japan, the
European Model for TQM in Europe, and the MBNQA in the United States of America.
In addition, some past works on TQM from other scholars were also studied. Based on
the results of the literature review, the key practices of TQM were identified.
Subsequently the theory of KM was reviewed. Lastly, the three key dimensions of KM
(i.e. knowledge acquisition, knowledge distribution and knowledge application) within
TQM were identified as important for the firms in Malaysia. These constructs were also
explained in greater details. The next chapter presents the model of the relationship
between TQM practices and KM. This model is then operationalized by using the
methodology described in Chapter 4.

67
CHAPTER 3
RESEARCH FRAMEWORK AND HYPOTHESES DEVELOPMENT
3.1 Introduction
This chapter presents the development of a theoretical framework involving TQM and
its association with KM. Section 3.2 elucidates the theoretical framework whereas
section 3.3 presents the hypotheses related to the TQM practices and KM model. This is
followed by section 3.4 which illustrates the research model of the TQM and KM
constructs. A summary for this chapter is included in section 3.5.
3.2 Research Framework
This study aims to investigate the influence of TQM practices on KM using SEM
approach. As depicted in Figure 3.1, the research framework engages the latent
variables of TQM and KM. Six observed variables, namely leadership, strategic
planning, customer focus, human resource management, process management, and
information and analysis were used as the indicators for the TQM construct and have
been discussed thoroughly in section 2.5 and shown as a summary in Table 2.2. On the
other hand, three observed variables, explicitly knowledge acquisition is presented in
section 2.7.3.1, knowledge distribution in section 2.7.3.2 and knowledge application in
2.7.3.3 were engaged as the indicators for KM construct. All of these constructs were
obtained through a comprehensive literature review as presented in Chapter 2.

68
3.3 Relationship between TQM and KM1
For an organization to experience improvement, the work processes must incorporate
both TQM and KM (Janpen, Praneetpolgrang, & Horadal, 2006). The similarities and
differences between TQM and KM have been compiled by Hsu and Shen (2005), in
which the similar characteristics consist of results orientation, human resource focus,
top management support and customers satisfaction; whereas the differences include
continuous improvement and improvement based on fact, as KM stresses on cultivating
a culture to amplify knowledge creation and sharing. Hsu and Shen (2005) further
argued that TQM can complement KM and vice versa, given proper planning by the
company. Janpen et al. (2006) conducted a study on the Thai communities and
confirmed that TQM model is important for the KM systems, as TQM could enhance
the transferring and creation of knowledge in a community.
Good management of knowledge within an organization has always been one of the
major concerns of every organization (Ju, Lin, Lin, & Kuo, 2006). It was found that
both TQM and KM approaches are compatible and may tremendously augment an
organization‟s competitive advantages (Lee & Asllani, 1997). Many scholars (e.g. Ju et
al., 2006; Molina et al., 2004; Yang, 2004) have conceded this statement and tried to
seek for commonality between the two variables and the connection between them. As
an imperative component of an organization‟s quality strategy, Lim et al. (1999)
recommended the use of Deming‟s PDCA Cycle as the key KM procedures. Obviously,
TQM and KM are strongly associated and in fact, they are both features of the
development of an organization (Zetie, 2002). Through the connection of TQM and KM,
it is believed that more explanatory models, theoretical and practical implications as
well as implementation options will be available for organizations which are longing for
1 Part of this section was published in Ooi (2009).

69
a change within the organizations (Zetie, 2002). Unfortunately, the scarcity of empirical
evidence to support the theoretical viewpoint of the linkage between TQM and KM has
been a major limitation in these studies.
In spite of the paucity in the above mentioned past empirical studies, there were several
empirical studies done on this subject matter. For example, a qualitative case study
followed by a quantitative case study on the linkage between TQM and KM revealed
that the Taiwanese manufacturing firms have devoted their attention on the Critical
Success Factors (CSFs) of TQM, as they realized the importance of KM in sustaining
growth through competition and thus began to introduce both TQM and KM in their
business operations (Ju et al., 2006). They further asserted that the nine TQM CSFs,
namely leadership support, benchmarking, process management, philosophy adoption,
measurement of quality, customer focus, product design, training and empowerment,
may act as a direction of KM implementation and a combination of both TQM and KM
can be considered as one of the management approaches in order to sustain competitive
advantages. This finding was also supported by the study done by Wong (2005), who
found that a set of CSFs which resembles TQM practices (e.g. leadership support,
measurement, organizational culture, strategic planning, training and development,
motivational aids, process management, company infrastructure and human resource
focus) may suit the small and medium enterprises in the implementation of KM
activities. Furthermore, a case study conducted by Colurcio (2009) also revealed that
TQM tools such as teamwork, feedback system, employee involvement and
organizational communication may serve as an effective knowledge enabler to generate
and disseminate new knowledge across the organization.

70
The ideas that both TQM and KM have an important control on an organization‟s
strategic competence and that TQM facilitates in the KM of a company, have been
proven by numerous past studies. However, empirical research is limited in Malaysia
and the objective of this study is to explore the six TQM practices and their associations
with the KM processes of a company.
With the theoretical review on TQM practices and KM in the previous chapter, we now
review in more details of the relationship between them. The discussion below supports
our proposed model in using the six TQM practices that we have identified; leadership,
strategic planning, customer focus, human resource management, process management
and information and analysis to have some effect on a firm‟s KM.
3.3.1 Leadership and KM
Leadership may be defined as the measures taken by senior managers in order to direct
an organization and to evaluate the performance of this organization (Kerr, Schriesheim,
Murphy, & Stogdill, 1974). In a nutshell, leadership refers to the capability of the leader
to influence his or her subordinates to follow and abide by the instructions that have
been given to them so as to attain the goals and objectives set by the organization
(Bounds et al., 1994; Goh, 2006; Robbins, 2003). “Leadership in the context of TQM is
not about power, authority and control, it is more about empowerment, recognition,
coaching and developing others” as observed by Zairi (1994, p. 10). Hence, according
to Ahmed (1998), to boost the strength of a group, one of the most powerful techniques
is for leaders to be ingenious in allowing innovation to take place in the group.

71
Nowadays, for firms that focus mainly on KM, TQM has to be changed in the main
organizational rudiments, particularly in the leadership approaches (Powell, 1995). In
addition, MacNeil (2001) asserted that leadership in management could drastically add
to the competencies and skills enhancements in a workplace of a learning organization,
especially in creating a KM atmosphere whereby workers are encouraged to apply their
inferred and tacit knowledge in their problems solving. It has been recognized by
several researchers (e.g. Bryant, 2003; Davenport & Volpel, 2001; MacNeil, 2001) that
leaders play a prominent role in cultivating a healthy KM environment, ensuring that
KM initiatives are successfully implemented (e.g. Holsapple & Joshi, 2000; Pan &
Scarbrough, 1998; Ribiere & Sitar, 2003). On the other hand, Bryant (2003) pointed out
that for a company that contributes the ways to trade knowledge, its mission, motivation,
systems and structures design for various company activities should be derived from the
leadership of the management.
Approximately 40 percent of companies that are in the Fortune 1000 have a chief
knowledge officer in their workplace (Roberts, 1996). Top management should
understand that they are in a position to influence. They have the capability and the
power to implement and move forward the KM activities in their companies. This can
be done by incorporating KM as part of company mission and vision, and by being a
good example themselves. Hence, it is highly encouraged that they involve themselves
in the knowledge acquisition, transfer and application activities to demonstrate their
strong support for the KM programme and policies in their organizations (Greengard,
1998; Guns & Valikangas, 1998). Furthermore, top management also plays a significant
role in sustaining workers‟ morale throughout the difficult changing period when KM
activities are being introduced (Salleh & Goh, 2002). With the changes coming from the
KM initiative programmes, the support and commitment from top management are
72
crucial in contributing to the success of KM (e.g. Davenport, De Long, & Beers, 1998;
Martensson, 2000; Sharp, 2003).
In this perspective, vital role is played by leaders to ensure that knowledge sharing does
occur in their organizations (Ellinger & Bostrom, 1999) and that the relevant knowledge
is being disseminated effectively to each and every member in the organizations.
Leaders are considered as facilitators in promoting the exchange of knowledge which
can eventually lead an organization towards achieving its competitive edge (Bryant,
2003; Lin & Lee, 2004). MacNeil (2003) opined that leaders act as facilitators in
instilling KM culture within an organization through incorporation of knowledge
distribution, as it is believed that such an environment would enhance the core
competencies of the organization whereby workers are encouraged to apply and share
their explicit and tacit knowledge in dealing with various problems. As a result, it would
eventually lead to improvement in expertise and skills.
Similarly, senior managers have always played an imperative role in affecting the
success rate of the knowledge improvement and distribution (Omerzel & Antoncic,
2008; Wong, 2005), especially in the organization‟s process management (Bryant,
2003). The role of senior managers to support the application of KM in teams,
specifically in knowledge acquisition, knowledge distribution and knowledge sharing is
important for the organizations‟ growth and improvement in collective learning aptitude
(Ellinger & Bostrom, 1999; Ooi, 2009). Moreover, as suggested by Wong (2005), the
management leadership ought to lead by good examples by contributing their
knowledge generously, emphasizes the importance of KM to other employees and
nurturing the society towards the sharing and creation of knowledge. In a nutshell,
management leadership is essential for creating an environment that enables KM to be

73
effective (Holsapple & Joshi, 2000; Ooi, 2009; Wong, 2005). Furthermore, both the
researchers and practitioners are aware and recognized that leaders are playing
imperative role in constructing and sustaining a conducive environment for KM (Bryant,
2003; Ellinger & Bostrom, 1999; Gupta, Iyer, & Aronson, 2000; MacNeil, 2001; Ooi,
2009). Storey and Barnett (2000) through their studies revealed that continual support
conveyed sensibly by management leadership can then be transformed into concerted
efforts and subsequently contributing towards KM success.
In addition, leaders may also encourage their workers to attend weekly meetings as a
channel for them to contribute their ideas freely while participating in the decision
making processes of the company (Arnold, Arad, Rhoades, & Drasgow, 2000). By
doing this, it would catalyze the desire to share and transfer knowledge among workers,
hence, inculcating a culture which encourages knowledge distribution (Wong, 2005).
Various past studies have shown that leaders who gave their support in instilling a
knowledge delivery environment have emerged as successful leaders (Bryant, 2003;
Davenport & Volpel, 2001; MacNeil, 2001). From the above discussion, a hypothesis is
developed:
H1: Leadership has a significant positive impact on KM.
3.3.2 Strategic Planning and KM
Calantone, Garcia, and Droge (2003) have categorized strategic planning as tasks that
are executed both socially and cognitively to gain success and maintain its
competitiveness in all sectors. Organizations, whether or not they are of not-for-profit or
profit organizations, are involved in the strategic planning process (Ketokivi &
Castaner, 2004). Through a suitable strategic plan, organizations are able to alter their
plans in accordance with the changes in the market needs while focusing on the

74
organizational planning process in order to integrate the organizations‟ ultimate
objectives into their plans and performance assessments (Brah & Lim, 2006). As a
matter of fact, organizations, regardless of their sizes, may obtain substantial advantages
with proper strategic planning (Miller & Cardinal, 1994). Based on the research
performed by Anderson (2000), strategic planning under some specific conditions and
circumstances has contributed to the elevated performance of an organization. The focus
of this measure is in the strategic planning and utilization of an organization‟s plan with
the integration of the organization‟s focus on core consumers and operational
performance requirements (Evans & Lindsay, 1995; Samson & Terziovski, 1999).
Carayannis, Alexander, and Loannidis (2000) and Grant (1996) asserted that the degree
of a firm competitiveness comes primarily from the special knowledge of its employees,
the capability of a firm to build new knowledge and be innovative as well as the
strategic actions taken by the firm. A firm is led by its strategy where it will show the
target destination and the direction the firm in the future (Beijerse, 2000; Ooi, 2009).
Possessing a good strategic planning within an organization is important for driving KM
success (Liebowitz, 1999) since a well-structured business plan may serve as a guidance
on employability and application of an organization‟s resources and capabilities to
achieve the KM goals. Closely associated with this is the establishment and
development of a shared vision that is clearly laid down and easily comprehended in
tandem with the hope of building passion among management and workers to pursue
KM (Wong, 2005). The integration of KM with strategic planning has significant
influence to increase competitiveness in all firms (Chong, Chong, & Yeow, 2006; Ooi,
2009). The practice of KM activities is closely associated with the strategy that
emphasizes in the creation of a shared and convincing vision. The employee‟s support
in sharing and trusting this vision will function is vital to make it happen (Ooi, 2009;

75
Wong, 2005). Wong (2005) further emphasized that a clearly defined direction is
important to ensure the passion among management and employees to achieve the
vision is established.
In a nutshell, all the above-mentioned fundamentals need to be cautiously developed
before a significant investment is made to initiate a KM effort. The American
Productivity and Quality Centre (1999) carried out a research and their finding is that
firms can use different KM strategies, of which strategies that could yield a more
fruitful result are those deployed to be aligned to their business strategic plan. Based on
this finding, it is crucial for firms that wish to practice KM activities to ensure that their
knowledge programs are in line with the company‟s mission (Ooi, 2009).
Besides that, benchmarking, which is a systematic and organized technique to excavate
the best practices across industry has been found to assist organization to attain superior
performance (Camp, 1989). In fact, benchmarking in the study of O‟Dell (1996) has
played an imperative role in the success of KM adoption especially for large
organizations. Once organizations benchmarked themselves against the industry‟s best
practices, knowledge strategy (e.g. knowledge acquisition, sharing and management)
would be easier to develop and apply within and around the organizations (Davis, 1996;
Day & Wendler, 1998). Benchmarking does not constrain an organization to just
process improvement but it further encourages the reception and extension of a learning
atmosphere across the organization. Integrating the knowledge sharing and transfer
strategy into the corporate strategy will lift an organization‟s performance as well as
competitive advantage (Carlucci & Schiuma, 2006). For knowledge distribution to
function a strategy needs to be first in place and members of the organization must be
passionate to plan and offer their full support (Pieris, David, & William, 2003).

76
Findings by Liebowitz (1999) revealed that a well thought-out strategic plan is one of
the key determinants for knowledge sharing to be successfully disseminated as it guides
organizations on how to organize and use its resources efficiently in order to obtain its
knowledge distribution goals with minimal wastage. Hence, a suitable strategy should
be well fitted to the environment and perspective of the organization so that knowledge
distribution may function effectively. Simply put, the strategy to achieve knowledge
sharing must be in line with the corporate business strategy (Cook, 1999; Lang, 2001;
Maier & Remus, 2002; Zack, 1999).
Another key factor to improve knowledge distribution is establishing a shared vision By
setting a clear vision and goal, it will help to create an environment for active
participation among members (Arthur Andersen Business Consulting and APQC, 1996)
whereby each member is sure of the relevant knowledge to be distributed to attain the
organization‟s objectives. Thus, the objectives, visions and goals set by the organization
need to be in easily understandable language as well as attainable by everyone involved
(Wong, 2005). It is also imperative for employees to offer their undivided support for
the organization‟s vision and trust that it will work (Wong, 2005). In conclusion, it is
better to devise a good strategic plan and at the same time outlining the value
proposition of the knowledge distribution to inculcate passion among the employees
before making a huge investment to initialize such effort (Wong, 2005). Thus, the
following hypothesis is made:
H2: Strategic planning has a significant positive impact on KM.

77
3.3.3 Customer Focus and KM
Customer focus refers to the satisfaction of customers‟ needs and requirements in a
continuous mode (Philips Quality, 1995). The act of putting customers first in all
decisions made has been a common practice in successful organizations (Zhang,
Waszink, & Wijngaard, 2000). Its main objective is to instill close relationships with the
customers by considering their suggestions and complaints as well as utilizing such
knowledge to satisfy their needs and enhance customer satisfaction (Ju et al., 2006).
Organizations have realized that customers‟ needs and wants are changing drastically
every day. It is indeed a necessity for organizations to acquire information from their
customers in order to clearly understand their expectations and hence produce the goods
that conform to their desires (Waddell & Stewart, 2008). As mentioned by Lee, Yang,
and Yu (2001), by being customer oriented, organizations will be able to establish
intimate ties with their customers and by constantly acquiring information regarding
their products through customers‟ feedbacks and responses, the organizations are likely
to improve the products‟ quality. In other words, customer focus as a dimension of
TQM emphasizes the competency of an organization to acquire information and use the
knowledge to better understand customers‟ needs. An organization that tackles
customers‟ complaints in no time (O‟Dell, Wiig, & Odem, 1999) and satisfy more
customers will lead to continual improvement and success of the organization (Zairi,
1995).

78
Customer focus concerns about collecting information on customers, understanding
their needs and implementing strategy in the company in response to fulfill customer
needs (O‟Dell et al., 1999). Liao (2006) opined that knowledge sharing on customers‟
requirements through customers‟ feedback, comments and sales purchase figures is vital
for any company and hence should be distributed among employees as it offers the
essential information about the desired goods to be delivered in order to satisfy the
customers. It is an advantage if such knowledge is swiftly transferred to satisfy
customers‟ expectations (Pfister, 2002). For example, Philips, a Holland electrical
company with the mission of placing customers first, has taken into consideration
customers‟ suggestions (e.g. customers‟ complaints or review) in their decision making
process to fulfill their needs and wants. When customers‟ requirements are known to the
employees, the company will be able to attain customers‟ satisfaction (Ju et al., 2006;
Wei, Van Der Ende, & Lin, 2009). The study by O‟Dell et al. (1999) further revealed
that a sophisticated customer feedback system has assisted the USAA Company to uplift
the knowledge about their customers via knowledge distribution. As a consequence,
they emerged as a leader among the insurance companies in their country. Besides that,
it is a bonus mark for any company that implements a business process which focuses
on customers‟ knowledge (Bassi & Van Buren, 1999; Ooi, 2009). In fact, Liao (2006)
stressed that knowledge sharing and distribution on customers‟ requirements provide
sustainable competitive edge to any company. In fact, it is of paramount importance to
understand the needs and problems faced by customers as these are the core factors for
on-going enhancements and innovations in any company (Stankosky & Baldanza,
2001). Therefore, the following hypothesis is posited:
H3: Customer focus has a significant positive impact on KM.

79
3.3.4 Human Resource Management and KM
People are most vital asset for the growth of today‟s knowledge-based economy (Fang,
Tsai, & Chang, 2005; Ooi, 2009). From the TQM perspective, it is commonly
recognized in the literature the importance of human facets, such as provision of
training and compensation plans (Tari, Molina, & Castejon, 2007). Oltra (2005, p. 71)
asserted that “both knowledge and human resources are being increasingly regarded as
key levers of competitive advantage in today‟s global, dynamic and complex business
environment”. Moreover, Alvesson (1993) argued that people are the supreme
knowledge inventor and possessors. This argument was supported by Davenport and
Volpel (2001) as cited in Wong (2005, p. 273) as they stated that “managing knowledge
is managing people; managing people is managing knowledge” .
Effective human resource management has been verified to elevate the speed of
knowledge transfer especially in the form of technology know-how (Sparkes & Miyake,
2000; Zander & Kogut, 1995). Organizations that have structured their members to
work in teams have enabled these members to coordinate better on the tasks assigned to
them (Grant et al., 1994). In fact, it is more effective to work in teams as quality goals
can be achieved in a timely way while strengthening the relationships among team
members within the organization (Dean & Evans, 1994). Therefore, it is crucial to
improve the search for information and knowledge transfer to ensure that working in
teams do function properly (Molina et al., 2007).

80
Human resource management is also believed to be closely related to knowledge
distribution, especially in the transferring of tacit knowledge (Sparkes & Miyake, 2000).
Teamwork provides an organization the flexibility to organize their human capital and
cluster them into temporary work groups in which communication is the foremost
success factor (Hedlund, 1994). This would enhance the knowledge transfer among
team members as they are given a chance to share their experiences (Crossan, Lane, &
White, 1999). When related knowledge is transferred from one member to the other
within the work groups, new knowledge will emerge and lead to group knowledge
whereby skills of the team members are united to attain the goals and missions set
(Wright, McMahan, & McWilliams, 1994).
Moreover, Cabrera and Cabrera (2002) concurred that knowledge sharing and
distribution of information in a team is beneficial to each member regardless of whether
they have contributed in the team dynamic or not and hence a rewarding system should
be established to reward those who are willing to share. Grant (1997) also concurred
that working in teams is preferable since it enhances the transient of knowledge within
the organizations. Brown and Duguid (1991) have coined the term “communities of
practice” to refer to work teams which are formed to perform the same task. As stated in
Brown and Duguid (2001, p. 202), “these groups of interdependent participants provide
the work context within which members construct both shared identities and the social
context that helps those identities to be shared”. Likewise, Orlikowski (2002) also
opined that for teams to work in an organized way, it is essential that knowledge
acquired through practice be conveyed to members who perform the same task.

81
Besides, by forming work teams, it can flatten the organizations‟ hierarchy, shorten the
communication chains as well as boosting the speed of knowledge transfer between the
consumers and the decision makers (Hansen, 2002; Teece, 2000). In fact, it is believed
that work teams can determine the success or failure of an organization (Leonard-
Barton, 1992). Unfortunately, Molina et al. (2007) could not confirm the positive
association between teamwork and knowledge distribution. This may be justified by the
fact that strong ties need to be established first between two parties before knowledge
transfer can happen. It indicates that a significant portion of the resources need to be
devoted (Hansen, 1999) within groups as well as among organizational units and the
formation of a common language should be present for knowledge transfer to happen
(Molina et al., 2007). According to Dougherty (2001), teamwork enhances knowledge
transfer by developing an image of work sharing within a firm.
To manage knowledge is to manage people and vice versa. This statement was given by
Davenport and Volpel (2001) and the relationship between human resource
management and KM activities has been hotly discussed by many researchers (e.g.
Brelade & Harman, 2000; Garavan, Gunnigle, & Morley, 2000; Robertson & O‟Malley
Hammersley, 2000; Soliman & Spooner, 2000). Soliman and Spooner (2000) asserted
that effective human resource practices may facilitate the employees‟ creation,
acquisition and distribution of new knowledge. For instance, applicants with the
propensity to create and shared knowledge besides having the required knowledge and
expertise should be recruited in order to fill the knowledge gaps (Wong, 2005). Once
recruited, they should be further developed. Human resource department plays an
imperative role to change the mindset of the employees so that they are more willing to
create and share knowledge (Garavan et al., 2000). In other words, employees need to
be trained to identify valuable knowledge that is worth sharing (Greco, 1999). This is a

82
way to develop human resources that can sustain value depreciation while contributing
to the organization‟s performance. Brelade and Harman (2000) further emphasized the
need to retain talent and knowledge of the existing workers through inception of human
resource policies that offer opportunities for workers to achieve their personal
aspirations. With this approach, it is believed that a lot of company-wide impediments
can be addressed (Bhatt, 2000) to ensure continuous process of innovation and
enhancement (Crauise O‟Brien, 1995).
As asserted by Robertson and O‟Malley Hammersley (2000), training and development
are crucial for knowledge workers in any profession. Training refers to “planned and
systematic effort to develop knowledge through learning experience in order to achieve
effective performance in an activity or range of KM activities” (Buckley & Caple, 1992
as cited in Ooi et al., 2009, p. 483) and is imperative in providing an opportunity for
knowledge creation and distribution to occur (Pangil & Nasurdin, 2005). Training and
development are provided to employees to enhance their skills and knowledge. For
example, formal training programs such as e-learning programs, in-house as well as
attaining external training program may be provided to the employees. After completing
these formal programs, the trainees are requested to give their feedbacks and
suggestions, therefore offering an opportunity for them to share and deliver their
knowledge to others while improving them (Lamoureux, 2006). In addition, these
training and development programs may also assist employees to solve problems
through knowledge sharing (Goh, 2002) and distribution. By using comprehensive
training programs, it is believed that the self-efficacy level of the organizational
members can be further improved, resulting in an increase level of competency and
ability in exchanging knowledge with others (Cabrera & Cabrera, 2005).

83
Furthermore, for knowledge distribution to occur in an organization, workers‟ autonomy
is vital. Decision made should be clear on where information is placed and what tacit
knowledge that is not easily transferable is held by the organization‟s workers or
subordinates. Hence, autonomy should be granted to the workers (Grant, 1997). Without
a doubt, many managers perceive that employee‟s participation and autonomy are
crucial since these employees are involved in the decision making processes and thus
have the relevant knowledge on how things are carried out (Dean & Evans, 1994). Thus,
it is important for knowledge transfer to take place between employees and top
management of an organization so that germane changes can be performed to ensure
organization‟s success (Hoopes & Postrel, 1999; Lessard & Zaheer, 1996).
Nevertheless, if there is a deficiency in the autonomy among workers, it may end up
with a highly ineffective decision being made since timely information is not
disseminated and this can be disastrous to the organization‟s future (Kogut & Zander,
1992). Therefore, when workers‟ autonomy is raised, they need to be more accountable
in their work (O‟Dell & Grayson, 1998). With a strong belief that they will obtain
greater reward in future by acquiring the relevant knowledge, these workers will embark
in quest of new knowledge and hence leading to knowledge sharing (Arias & Molina,
2002) and knowledge distribution. In fact, workers‟ autonomy was found positively
related to internal knowledge transfer since it gives the work teams freedom in
arranging their task and as they themselves own the best information pertaining to their
job scopes, they will be able to effectively search for the relevant information and hence
ensuring the exchange of knowledge via knowledge distribution (Molina et al., 2007).
Many researches were carried out to investigate the connections between human
resources and KM where one of these is Zupan and Kase (2007). By studying line
managers and human resource specialists and their structural positions in knowledge
formation and sharing, they have managed to explore the inferences for devising and
84
implementing human resource practices in knowledge intensive firms. The findings
revealed that line managers and not human resource specialists, are not the only prime
source to the knowledge networks, but also act as knowledge actors. From this study, it
may be concluded that decentralization is a more preferable method for human resource
management practices in a knowledge intensive firm. Hence, it is suggested that
attention on line managers in human resource practices can bring better impact on
creating and sharing of knowledge (Ooi, 2009). Hence, the following hypothesis can be
suggested:
H4: Human resource management has a significant positive impact on KM.
3.3.5 Process Management and KM
Anderson et al. (1994) defined process management as the means of actions, the
methods and the behavioural practices that manage the processes of an organization
rather than the result itself. Process management emphasizes on the appropriate
management of organizational processes so to attain higher level of innovation,
production and performances for the organization (Brah & Lim, 2006). Among the
benefits of a comprehensive process management are a set of improvised methods for
the work center and development of an operator-controlled process that can reduce the
unit cost incurred, lessen the duties of an operator handling the materials, help the work
design of a manufacturing program and attain a compressed process flow (Kasul &
Motwani, 1995). Molina et al. (2007) also concurred that the use of a systematic and
standardized process control such as SPC can reduce transfer costs. To lower the
probability of operation errors from occurring, Zhang et al. (2000) suggested that a good
process management such as documentation of the process procedures as well as
providing detailed instructions to the equipment operators should be put in place.
85
Many researchers have suggested a number of processes that are linked to KM. These
encompass knowledge distribution (Alavi & Leidner, 2001; Bhatt, 2000; Demarest,
1997; Despres & Chauvel, 1999; Marshall, Prusak, & Shpillberg, 1997; Nissen, Kamel,
& Sengupta, 2000; Wong & Aspinwall, 2003) such as the processes of knowledge
creation, transfer, application and storage/retrieval which are recommended by Alavi
and Leidner (2001). In order to create a successful knowledge-based company and also
to ensure that knowledge distribution processes are implemented effectively, application
from a process-based viewpoint to KM is indeed imperative (Wong, 2005).
The fundamental requirements of process management are to enhance efficiency and
reduce costs and cycle-time, all of which can be applied to KM activities (Ju et al.,
2006). Several processes and performances that embody the KM discipline (Wong,
2005) and literature emphasized a number of processes which are related to KM (Al-
Mabrouk, 2006). Indeed, sufficient measures are required to be ready in order to ensure
that KM processes are handled in a structured and organized manner. Thus, the way KM
processes are implemented is imperative (Al-Mabrouk, 2006; Holsapple & Joshi, 2000).
According to Clarke (2006), process management accomplishes the execution of
process capabilities to ensure steady outcomes in meeting customers‟ expectations and
needs. In fact, both structures of quality and KM are presumed to be matters that can be
addressed and controlled by the organization. In view of this, it is assumed that firms
implementing the process management approach will execute the structural approach to
KM concurrently. Ju et al. (2006) conducted a study on the connection between TQM
critical factors and KM value chain activities in Taiwan, where they discovered that in
ASE Inc., knowledge storage can reduce engineering time. From the perspective of
knowledge distribution, when company rearranges documents systematically, searching
time can be reduced while problem solving skills can be further enhanced. Meanwhile,

86
in order to apply process management in terms of knowledge applications, a company‟s
project reports must be accessible to every employee who needs them. Lee et al. (2001)
opined that an effective process management is likely to be associated with quality
performance. This can be achieved by alleviating process variation where quality
performance is acquired, disseminated and shared. As such, the likelihood to produce
defective parts will be lowered when there is a reduction in process variance.
According to Molina et al. (2004), process control such as application of SPC in the
TQM literature, has an influence on the scale of knowledge transfer as it enhances the
KM of the company. This statement was supported previously by Rungtusanatham,
Anderson, and Dooley (1997), as SPC reviews and updates the changes in knowledge
processes. Moreover, to ensure that the process of KM is handled in an organized and
systematic way, it is crucial to put in place proper interferences and instruments. For
instance, technical networking devices should be complemented with face-to-face
interaction since the latter provides a stronger means for knowledge transfer to happen.
This practice should be integrated into the workers‟ everyday work routine so that they
will become a common practice across the company (Wong, 2005).
As previously mentioned, process management focuses on ensuring all processes are
easily understood by employees who execute them (Saraph et al., 1989) and also assists
companies in identifying and minimizing error occurrences (Ahire & Dreyfus, 2000).
Fundamental tool such as SPC is used to provide valuable information pertaining to
major processes that are carried out within the company (Ahire & Dreyfus, 2000;
Rungtusanatham, 2000). Through installation of a systematic control process in the
company, the search and transfer of knowledge would be made simple (Molina et al.,
2007). SPC encodes the tacit knowledge used in the processes. This information is then

87
applied and transferred from one unit to another unit within the company to enhance its
performance. Without the encoding of knowledge, it could result in a lot of advantage
for the company itself (Winter, 1987).
Usage of related information on company processes can help the company in
recognizing errors and problems. With the continuous effort of process improvement,
companies will be able to utilize and identify the required knowledge for their own
improvements (Dean & Bowen, 1994). In fact, Molina et al. (2007) suggested that
process management is positively linked to knowledge distribution since the process
control assists in problem solving of the company, draws attention to the discrepancies
in the various process efficiencies carried out by the company and helps in the quest for
more efficient processes while uplifting the encoding level of the company‟s
knowledge. Hence, the following hypothesis is formulated:
H5: Process management has a significant positive impact on KM.
3.3.6 Information and Analysis and KM
Nowadays, the capability to manage information and knowledge of a company is crucial
for a company to compete effectively in the global scenario (Hsu, Ju, Yen, & Chang,
2007). Due to the keen competition among companies, there is an increase importance
of information technology system that acts as a platform for customers to express their
demands for superior products and services (Phusavat, Kanchana, & Helo, 2007; Teh et
al., 2008). Hence, it is essential for a company to acquire ample information pertaining
to their customers‟ requirements and the competitors‟ latest strategy and products in
order to succeed and survive.

88
Undeniably, information technology remains as one of the major enablers to arouse the
accomplishment of knowledge distribution within an organization. Historically,
information technology acted as a tool to store information. However, as time passes, it
evolved into a tool to connect people to information and people to people (Alavi &
Leidner, 2001; Lee & Hong, 2002). Examples of information technology such as
database system, knowledge platform, performance evaluation management system,
combined performance support system etc., have eased the search, access, retrieval and
delivery of information and assisted in the coordination of knowledge distribution
(Beckman, 1999). In short, the major aim of any company is to utilize the latest
technology advancement to perform an appropriate knowledge transfer (Alavi &
Leidner, 2001; McDermott, 1999; Skyrme & Amidon, 1997). Thus, it is believed that
information technology and KM that integrate knowledge distribution are indeed closely
connected.
In the current society, information technology is vital to support the KM processes of a
company (Alavi & Leidner, 2001; Lee & Hong, 2002) since it facilitates searches,
access and retrieval of information for the benefit of the company (Wong, 2005).
Actually, there is a wide variety of modern technologies such as business intelligence,
knowledge base, data mining, workflow and e-learning, to name a few, that support the
KM processes and may be integrated into the company‟s technological platform (Luan
& Serban, 2002). Although these technologies are essential for the success of KM
implementation, companies must still recognize the importance of information system
enablers to KM. Alternatively, a user friendly system is preferable to a complicated
software application in inducing knowledge sharing (Hendriks, 1999; King, 1996). It is
unfortunate that many companies still think that KM system is expensive and therefore
are reluctant to adopt or configure one. KPMG (1999) has reported that only an

89
insignificant 16 percent of the 423 companies in United States and the Europe continent
have a unique system configured to KM. In fact, Tiwana (2000) recommended that
organizations should make full use of their existing technologies by incorporating them
with their KM activities to form a unique KM system. Hence, a well-equipped
information technology infrastructure that is put in place will provide an edge for
organization to harvest on knowledge.
Information and analysis play an important role in KM activities‟ and provide support to
KM processes (Hussain, Lucas, & Ali, 2004; Wong, 2005). In fact, Stenmark (2002)
recommended a multi-perspective view of intranet that comprises of information,
awareness and communication perspectives to support an effective KM culture. Indeed,
information and analysis facilitates a faster information search and recovery while
enabling communication among employees and thus permitting the establishment and
transferring of KM processes within the firm (Al-Mabrouk, 2006).
Information plays an imperative role as a reflection mechanism, as information
viewpoint on the intranet is extremely relevant and applicable for tasks that require
knowledge (Hussain et al., 2004). Hence, it is recommended that explicit information
should be utilized to attain awareness and to connect a firm‟s employee and other
relevant individuals to avoid being deprived from information. Hung et al. (2005) have
conducted a study on discussing the critical success factors in implementing a KM
system for the pharmaceutical industry in Taiwan. The findings revealed that
information system infrastructures are important in KM adoption. It indicates that large
organizations are more inclined to be aware that an information system‟s success
depends mainly on the quality of the information structure and the aptitude of its
maintenance staff. From the communication viewpoint, Hussain et al. (2004) asserted

90
that information and analysis allows accessible information for interpretation,
discussion and negotiations in various forms and thus transforming of knowledge
among employees over the firm.
Wong (2005) asserts that there are a lot of information technology tools that support
knowledge transfer. They can be grouped into business intelligence, knowledge
platform, portals, consumer relationship arrangement, content and document
arrangement, data mining, work charts and e-learning (Luan & Serban, 2002). To form
an efficient KM system that supports knowledge transfer; the technology used should be
accessible effortlessly and user friendly (Lin & Tseng, 2005). Similarly, King (1996)
also concurred that organizations should consider the ease of use of the applications and
not just focusing on the comprehensiveness of the systems or the software itself for
knowledge to be easily disseminated and productively applied.
Information technology was found to have direct and indirect impacts in encouraging
employees to share and distribute their knowledge since it can eliminate barriers, act as
a medium for knowledge acquisition and rectify the workflow processes. Findings from
the study carried out in the city of Saint Louis by Smith, Campbell, Subramanian, Bird,
and Nelson (2001) revealed that advanced information technology allows knowledge
sharing and transfer across various platforms. Therefore, with the use of advanced
technological systems, information costs may be reduced while increasing the speed of
knowledge flow (Davenport et al., 1998; Demarest, 1997), leading to faster distribution
of knowledge. Thus, the following hypothesis is formulated:
H6: Information and analysis has a significant positive impact on KM.

91
3.4 Model Formulation
Figure 3.1 illustrates the research model of the TQM and KM constructs which is
formulated based on the above hypotheses. In this model, TQM constructs are classified
as the independent variables while knowledge acquisition, distribution and application
are regarded as dependent variables. To best knowledge of the author from all the
literature research conducted, as it is, there isn‟t any researcher who has empirically
examined the influence of TQM practices on knowledge acquisition, distribution and
application in a single model. Meanwhile a research model is proposed below based on
the six hypotheses that were presented above:
Total Quality
Management
Practices
Leadership
Strategic Planning
Customer Focus
Human Resource
Management
Process
Management
Information and
Analysis
Knowledge
Management
Knowledge
Acquisition
Knowledge
Distribution
Knowledge
Application
H1
H2
H3
H4
H5
H6
Independent Variables
Dependent Variables
Figure 3.1: Relationship of TQM Practices and KM Processes

92
3.5 Chapter Summary
As a summary, this chapter starts with the development of a model consisting of TQM
and KM constructs with six hypotheses. The purpose of this model is to investigate the
impact of six TQM practices on KM processes. Hence, it is possible to examine
empirically the theoretical model which is hypothesized in this research. The following
chapter will explain the methodology of the research that is used to investigate the six
proposed hypotheses.

93
CHAPTER 4
RESEARCH METHODOLOGY
4.1 Introduction
In this chapter, we will cover the major areas of research method in this study in which
it includes the research design developed to examine the research questions and the
theoretical framework is incorporated. In particular, it encompasses three major parts
which are as follows: (1) issues on research design; (2) survey instrument and
operationalized research constructs and (3) methods of statistical analysis. The
following sections discussed each of these major parts comprehensively.
4.2 Research Design
Punch (2000) mentioned that research design is part of the elementary plan for
experimental research which covers main ideas such as sample; approach and the
measures taken to gather and assess empirical data. On the other hand, Zhang (2000)
opined that the purpose for research design is to relate and demonstrate how the
research questions can be associated to the data and also the instruments and measures
to be utilized in answering them. Perry (1994) recommended that in a PhD thesis “there
will usually be only one major methodology which suits the research problem and
associated research gaps …..” (p. 15). As such, the research design must be derived
from the research questions and can fit the data collected (Zhang, 2000). Thus, a
questionnaire survey was employed in this study as the major methodology as it could
provide quantifiable data which were required for the development of a TQM model to
measure its impact on KM. The questionnaire survey approach and research sample are
discussed in the following sections.

94
4.2.1 Questionnaire Survey
A research model was developed to investigate the six research questions which are
more towards validating the existing theories. This is supported by Punch (2000) who
opined that a theory confirmation study was aimed at examining the research
hypotheses based on the existing theory. Thus, the research questions are best answered
through a questionnaire survey whereby the cost is relatively lower compared to other
methods in terms of geographical distance, larger sample size and also a broader scope
of sample population (Zhang, 2000). On a cautionary note, the survey questionnaire can
be practical only when the research objective of the particular study is straightforward
and unambiguous, as elucidated by Bourque and Fielder (1995). In particular, various
studies in the areas of TQM adoption have been performed using questionnaire surveys
for data and information collection (e.g. Anderson, Rungtusanatham, Schroeder, &
Devaraj, 1995; Choi & Eboch, 1998; Ooi, Lee, Chong, & Lin, 2011; Prajogo, 2005).
Generally, survey questionnaire was deployed to obtain a large database of TQM
information with low degree of details. In this study, the survey questionnaire was
applied to obtain information regarding TQM and KM from a wide range of
manufacturing and service firms. This data can be used to examine the influence of
TQM on the overall KM in these firms.
Since this study purports to investigate the effect of TQM on KM in the Malaysian
manufacturing and service firms, quantitative method via survey questionnaire is
considered to be the most suitable research strategy for this study. This is due to the fact
that there are many existing models in the literature on the TQM theories and with the
strong theoretical foundation for identification of variables and their relationships, a
causal design using survey questionnaire is considered suitable (Chew, 2007; Chong,

95
2008). The methodological process adopted in this study is illustrated in Figure 4.1. The
complete methodology entails two major stages, namely:
1) Development of instrument
2) Data collection and analysis
Figure 4.1: Research Procedures
Source: Adapted from Xie (2011, p. 110)
Literature Review
Develop Research Instruments
Pre-test Instruments
Initial Questionnaire
Step 1: Development of Instrument
Pilot Study
Reliability and Validity
Finalized Questionnaire
Main Questionnaire Survey
Step 2: Data Collection and Analysis
Data Cleansing
Data Analysis

96
During the preliminary stage, an initial questionnaire was developed and sent to two
ISO certified firms (i.e. one is service firm and another one is manufacturing firm) for
pre-testing (this important part is elaborated in section 4.3.3). The manufacturing firm
was chosen since it is a large TQM prize-winning semiconductor firm (i.e. Quality
Management Excellence Award) and had implemented TQM practices over 20 years.
While the service firm, one of the largest universities, was chosen as the university is
one of the ISO 9001 Quality Management System certified higher education
institutions. Both of these firms were situated in the state of Perak, Malaysia. A
structured interview with the senior managers of these firms was carried out to obtain
the feedback on the survey questionnaire so that refinements can be done on the
variables in the questionnaire. Besides that, about one week was spent on informal
interview with these managers via telephone calls. Subsequently, in the second stage of
the questionnaire survey methodology, an evaluation of the data and information
collected followed by recommendations based on the results obtained was performed.
4.2.2 Unit of Analysis
Unit of analysis is defined as the degree of exploration the study focuses on and the kind
of analysis including individuals, groups and dyads (Zikmund, 2000). Prior to the
commencement of this study, it is a necessity to disclose the unit of analysis since all
variables are encompassed in the conceptual model, the data gathering method and
sample size are affected by this measurement (Wong, 2002; Zikmund, 2000). The main
unit of analysis investigated in this study was the middle to higher level managers (i.e.
executives, managers, senior managers, managing directors and CEOs) from both the
service and manufacturing firms in Malaysia. Middle to higher levels managers are
selected as the unit of analysis as they have the essential information regarding quality
of management practices within their companies. They play a pivotal role as traffic

97
police who bear the responsibility to disseminate information to the employees in their
respective department (Ishikawa, 1985). Besides that middle to higher level managers
play a critical role to ensure a successful quality improvement process if they are
allowed to effectively utilize their years of experience to improve the product,
manufacturing processes, management systems, and working environment, processes
and organization will thrive (Roth, 1998).
4.2.3 Sampling Size
Adequacy of sample size should be ascertained based on the data analysis that was
conducted in this study. Several suggestions on the minimum sample size needed for
SEM have been recommended by various researchers. Williams and Holahan (1994)
opined that generally a minimum sample size of 100 is adequate for an SEM analysis.
On the other hand, Kelloway (1998) and Marsh, Balla, and McDonald (1988) asserted
that a sample size of 200 may be required in order to obtain valid goodness-of-fit
measures.
To perform the SEM analysis, it is recommended that “an optimal sample is between
100 and 200” for it to be considered as adequate and satisfactory (Hair, Anderson,
Tatham, & Black, 1992, p. 10 as cited by Forza & Filippini, 1998). A total of 1,000
middle to higher level managers were contacted for the survey and the response rate was
20.3% (see further discussion below). Since the number of firms which responded to the
survey for this study (N=203) falls within the acceptable range, it is concluded that the
sample size is therefore considered to be adequate.

98
4.2.4 Questionnaire Pretesting
The aim of the pretest was to ensure that all questions are relevant and easy to
comprehend. It serves as the foundation for amendment of the language structure in a
particular question when needed (Wong, 2002). Through this process, researchers will
be able to determine the relevancy of the research question (Bradburn, Sudman, &
Wansink, 2004). During pretest, researchers will be able to ascertain whether the
language structure, the length and flow of the survey are appropriate and whether the
time allocated to complete the questionnaire is well-managed (Xie, 2011). During the
pretest process, the instrument used is recommended to examine only the content and
constructs. In order to evaluate the content validity of the survey questionnaire, a draft
version of the survey was pre-tested by both academicians and TQM practitioners. The
participants were asked to assess the quality of the survey questionnaire in terms of its
wording, relevancy and clarity.
Even though the items were adapted from a thorough review of the past studies,
consideration on items chosen is in terms of accuracy from the perspective of Malaysian
manufacturing and service sectors. Several items in the pretest have been perceived by
the respondents as not in proper order. Hence, the order of these items was rearranged
according to their relevance. Otherwise irrelevant items would jeopardize the
motivation of the target respondents in answering the questions (Ya‟acob, 2008).

99
4.2.5 Pilot Test
Following the pretest, a pilot study is performed before the collection of primary data.
The procedure of data collection is conducted in the similar way to the main study with
the author as the data collector. The details of the data gathering procedures are outlined
in section 4.2.6. In order to measure the psychometric soundness of the scales, initial
findings from the pilot study were subjected to various types of reliability and validity
tests as discussed in the subsequent sections.
4.2.6 Sampling and Data Collection Procedures
A self-administered survey questionnaire was employed in this study with the sample
selected from the manufacturing and service sectors that are planning to apply for or
have obtained the ISO 9001:2000 certification from the Federation of Malaysian
Manufacturers (FMM) Directory (2009). ISO certified firms have been selected as the
certification of ISO 9000 quality management system is a vital international indicator
and evidence that TQM is the focus of the organization (Kirchenstein & Blake, 1999;
Teh et al., 2009). Meanwhile, FMM is the biggest trade organization in Malaysia
because it includes a total number of above 2,000 companies of both manufacturing and
industrial service of different sizes (Federation of Malaysian Manufacturers (FMM)
Directory, 2009). Given the strict regulations that control the full membership of the
FMM, 47 percent of the 2,135 FMM members have been awarded ISO certification
(Federation of Malaysian Manufacturers (FMM) Directory, 2010; Teh et al., 2009).
Besides that, FMM is a well-established and renowned representation of the Malaysian
manufacturing and service industries for more than 38 years. Thus, the chosen sample is
deemed to be a legitimate representation of the population.
100
The unit of analysis for this study consists of middle level to higher level managers (i.e.
executives, managers, senior managers, managing directors and CEOs) coming from
both manufacturing and service firms in Malaysia. They were chosen as the target group
for this study as they possess the essential knowledge regarding the quality management
practices, at the same time having in depth information on the KM level of their
companies. Furthermore, they also play an important role as traffic polices who are
responsible in disseminating information to the employees in their respective
departments (Ishikawa, 1985). Apart from that, they also play an essential role in
ensuring a successful quality improvement process, if they are given an opportunity to
use their years of experience of improving their companies‟ manufacturing processes,
management systems, and working environment (Roth. 1998). In fact, numerous
researchers in the likes of Cheah et al. (2009), Samat, Ramayah, and Mat Saad (2006),
Tavana, Mohebbi, and Kennedy (2003) and Vermeulen (1996) also have selected this
sample group as their target population in relation to TQM empirical studies. They
postulated that a commitment towards quality management was mainly initiated by the
management team as they are more familiar with the basic principles and terminology
of quality management. Hence, middle to higher level managers was chosen as the
sample group for this study.
Survey questionnaire was used to collect empirical data. In order to ensure content
validity, both academicians and practitioners were invited for a pretest to evaluate the
survey questionnaire on its wording, relevancy and clarity. Respondents were selected
from organizations located in different regions of Malaysia, namely Selangor, Kuala
Lumpur, Penang, Perak and Melaka. A selection of respondents who work in the above-
mentioned five states were made because these states are among the most industrialized
states in Malaysia (Federation of Malaysian Manufacturers (FMM) Directory, 2008;

101
Kuala Lumpur Structure Plan 2020, 2008; Teh et al., 2009). In addition, many of the
world's leading electronics firms with manufacturing operations and manufacturing
services are located in these states (Malaysian Industrial Development Authority, 2008;
Teh et al., 2009). All the organizations in these five states that are listed in the FMM
Directory 2009 with ISO certification as indicated in the directory were selected for the
survey.
The final version of the questionnaire was distributed to 1000 workers at the executive
or higher levels from the Malaysian manufacturing and service companies that are
planning to apply for or have obtained ISO certification to participate in the
investigation. From the total of 1,000 questionnaires distributed, only 203 were returned
with complete answers. Hence, the overall response rate is 20.3%. According to Sekaran
(2003), the low response rate from the main survey is considered acceptable, as a
general low response rate is expected for such type of correlation study in Malaysia.
When comparing with other similar studies, such as Ahmad and Yusof (2010), who
recorded a response rate of 21.9% in his study of TQM practices between Japanese and
non-Japanese electrical and electronics firms in Malaysia as well as Lam, Lee, Ooi, and
Phusavat (2012), whose response rate was reported at 20% in his study of TQM in
Malaysia, the response rate found in this study is considered acceptable.
To check the representativeness of the sample, the demographics obtained from the
early respondents were compared with the late respondents, as suggested by Lin and
Schaeffer (1995). Chi-square was the inferential statistics used to determine if there is
any statistical difference between the early and late responses. It was found that there is
no significant difference (p > 0.05) when comparing the demographic profile between
the early and late responses in terms of ownership, industry sector and organization size

102
(Jayasingam, Ansari, & Jantan, 2010). Besides that, the common method variance test
which may pose potential danger as a result of the application of a single informant
when data was collected in an organization was also performed (Martinez-Costa &
Jimenez-Jimenez, 2009; Podsakoff, MacKenzie, Lee, & Podsakoff, 2003). This type of
error is non-significant in the absence of a unique factor with eigenvalue more than one
(Martinez-Costa & Jimenez-Jimenez, 2009).
4.2.7 Statistical Power
Statistical power means “the probability of finding statistical relationships among
variables” (Malhotra & Grover, 1998 as cited in Wong, 2002, p. 111). As a way to
ensure the validity of the multivariate statistical methods, in this context, the SEM
approach, the number of cases required to have adequate statistical power is preferably
around 200 cases (Kline, 2010). Therefore, the 203 cases obtained for this study offers
reasonable statistical power for SEM analysis.
4.3 Survey Instruments and Operationalization of Research Constructs
Following the presentation of the research strategies, the subsequent stage is to
determine the research constructs and elucidate how they were operationalized into the
scaled items. Indeed, the prime purpose of the study is to investigate the six research
questions and the six research hypotheses as proposed in the earlier chapter. Thus, the
following subsections will justify the design of a survey instrument in order to meet this
objective. This entails the discussion on the kind of scale adopted in the questionnaire,
the structure of the questionnaire and the measures deployed in the variables of interest.
103
4.3.1 Questionnaire Design
The questionnaire has been designed with conciseness and simplicity in mind with
double negative statements avoided. The questions are designed to be self-explanatory
in nature and respondents may complete them by themselves. In order to raise the
validity of the questionnaire, several adaptations from other researches were performed.
The final set of questionnaire is presented in Appendix B.
4.3.2 Questionnaire Scaling
Based on the discourse in the preceding section, the questionnaire was comprehensively
pre-examined to alleviate the length needed to measure all the constructs satisfactorily
and to modify any items that may make the survey difficult to the respondents. As an
effort to enhance the reliability of the questionnaire measures, majority of the items in
the questionnaire were given in the form of statements via Likert-type scales (Churchill
& Peter, 1984; Wong, 2002). Likert-type scales are comparatively easy to establish and
administer as well as easy to comprehend by the respondents.
As asserted by Churchill and Peter (1984) and Wong (2002), a seven-point scale should
be used in the endeavor to augment the reliability of the scales. The seven-point scale
was recommended with the intention of discouraging the respondents from choosing the
midpoint by making it less obvious than a five-point scale. With a midpoint on the scale
offered for respondents who were neutral, it will alleviate any uneasiness and anxieties
which may have been caused by compelling respondents to choose a predisposition. As
an outcome, seven-point numerical scales are suggested for SEM “as a sufficient range
of score values introduces variance” (Schumacker & Lomax, 1996 as cited in Wong,
2002, p. 114). Hence, a consistent scoring procedure was retained throughout the
questionnaire.

104
4.3.3 Questionnaire Structure
The utmost purpose of this questionnaire was to collect information pertaining to the
constructs of the TQM and KM. The questionnaire comprises of ten (10) pages,
including an explanatory front cover, the detailed objectives and procedures of this
study, as well as the assurance of voluntary participation and the anonymity of the
respondents. The questionnaire was divided into several sections with each section
separated from the others by using important heading. Clear and precise instructions
were given prior to each section in order to reduce confusion (Wong, 2002). These
sections were presented in a logical order to ensure that they are easily comprehended in
completing the questionnaire.
4.3.4 Questionnaire Section
The first section entails demographics of the respondents such as gender, age, marital
status, education background, length of service, job scope and job position. The second
section involves details of the organization such as category of the organization (i.e.
manufacturing or service), number of employees, status of the organization (i.e. ISO
certification) and the ownership. Third section encompasses 30 questions linking the six
dimensions of the key TQM practices. The six dimensions understudied in this research
were: leadership (five items), strategic planning (four items), customer focus (six items),
human resource management (five items), process management (six items), information
and analysis (four items). Meanwhile, each of these TQM practices was measured
through a seven-point Likert scale ranging from 1 (strongly disagree) to 7 (strongly
agree). Last but not the least, the KM section consists of 19 questions related to the
three dimensions of knowledge management. The three dimensions of knowledge
management used in this study were knowledge acquisition (8 items), knowledge
distribution (6 items) and knowledge application (5 items). The items in this section

105
were also measured on a seven-point Likert scale ranging from 1 (strongly disagree) to
7 (strongly agree).
4.3.5 Measurement of Variables
This section elaborates on the development of the research instrument used in this study.
Closed ended questions were adopted to get the required data of the variables under
study. All questions are presented though a seven-point Likert scale. Mean score was
computed for each construct based on the respective items. Higher mean score will
reflect a higher level of TQM and KM practices.
4.3.5.1 Operationalization of TQM Practices
Many previous researches (e.g. Ahire et al., 1996; Anderson et al., 1994; Dean &
Bowen, 1994; Prajogo, 2005; Saraph et al., 1989) have verified the multidimensionality
of the TQM constructs. Six TQM dimensions were adopted from the previous studies
done by Prajogo (2006) and Prajogo and Sohal (2006). These measures have a well-
established theoretical basis and have demonstrated strong construct validity and
reliability (Prajogo & Cooper, 2010). The six scales utilized in this study include:
leadership, strategic planning, customer focus, human resource management, process
management and information and analysis. Each of these TQM practices was gauged
via a seven-point Likert scale ranging from 1 (strongly disagree) to 7 (strongly agree).
The six TQM dimensions are treated as reflective in nature, similar to many prior TQM
studies by Demirbag, Koh, Tatoglu, and Zaim (2006), Lee, Ooi, Tan, and Chong (2010),
Prajogo and Cooper (2010) and Santos-Vijande and Ălvarez-González (2007), whereby
the TQM construct in this study is measured as a whole as the construct itself is made
out of the six MBNQA dimensions.

106
4.3.5.1.1 Leadership
The leadership construct was measured with five items. These items were derived from
a thorough literature review. They were measured based on a seven-point Likert scale
with values ranging from 1 (strongly disagree) to 7 (strongly agree). The mean score of
the responses of these five items was calculated. A higher mean score implies higher
level of leadership practice of TQM. Table 4.1 shows the five items used in measuring
leadership practices of a firm.
Table 4.1: Operationalization of Leadership
No. Items
LD1 Senior executives share similar beliefs about the future direction of this organization.
LD2 Senior managers actively encourage change and implement a culture of improvement, learning,
and innovation towards „excellence‟.
LD3 Senior managers actively participate in quality management and improvement process.
LD4 Senior managers strongly encourage employee involvement in quality management and
improvement activities.
LD5 Senior managers arrange adequate resources for employee education and training. Note: LD = Leadership
Source: Prajogo and Sohal (2006, p. 308)
4.3.5.1.2 Strategic Planning
The level to which a firm practices strategic planning was gauged with four items as
portrayed in Table 4.2. These items were measured using a seven-point Likert scale
ranging from 1 (strongly disagree) to 7 (strongly agree). The mean of the responses of
these four items was calculated whereby a higher score will indicate higher practice of
strategic planning in TQM.
Table 4.2: Operationalization of Strategic Planning
No. Items
SP1 We know our company mission.
SP2 We have a comprehensive and structured planning process which regularly sets and reviews
short and long-term goals.
SP3 When we develop our plans, policies and objectives, we always incorporate the needs of all
stakeholders.
SP4 We have a written statement of strategy covering all business operations which is articulated
and agreed by our senior managers Note: SP = Strategic Planning
Source: Prajogo and Sohal (2006, p. 308)
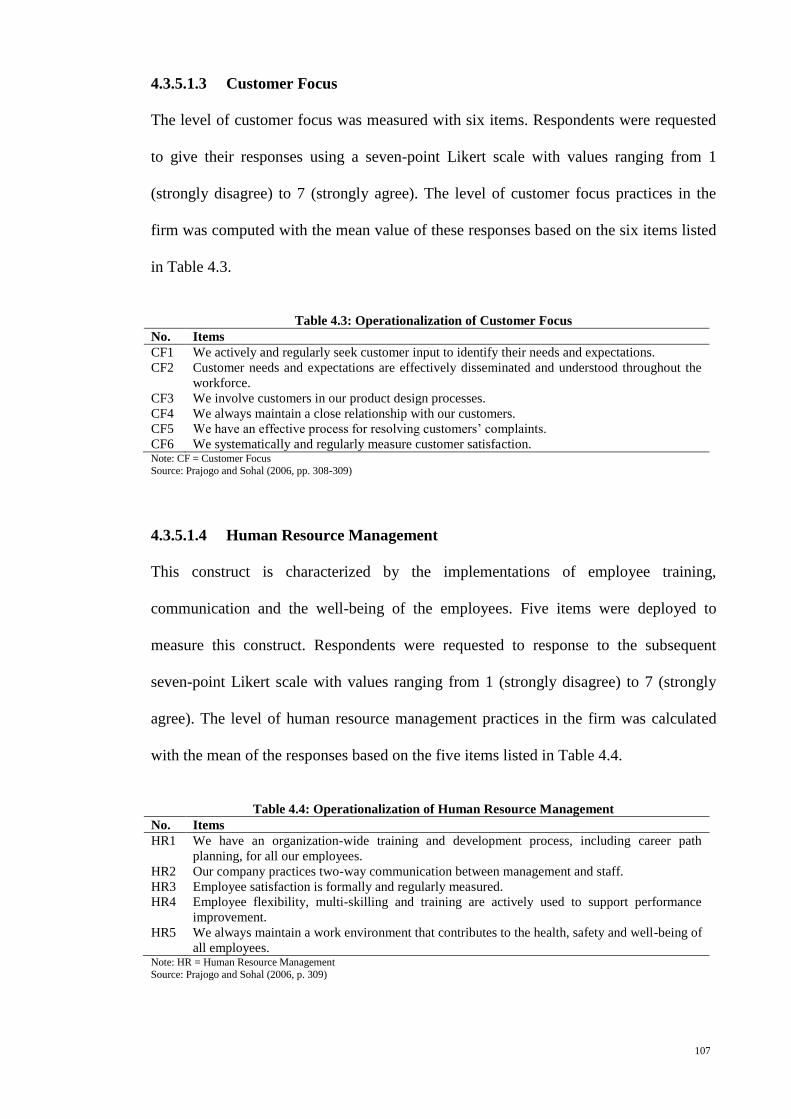
107
4.3.5.1.3 Customer Focus
The level of customer focus was measured with six items. Respondents were requested
to give their responses using a seven-point Likert scale with values ranging from 1
(strongly disagree) to 7 (strongly agree). The level of customer focus practices in the
firm was computed with the mean value of these responses based on the six items listed
in Table 4.3.
Table 4.3: Operationalization of Customer Focus
No. Items
CF1 We actively and regularly seek customer input to identify their needs and expectations.
CF2 Customer needs and expectations are effectively disseminated and understood throughout the
workforce.
CF3 We involve customers in our product design processes.
CF4 We always maintain a close relationship with our customers.
CF5 We have an effective process for resolving customers‟ complaints.
CF6 We systematically and regularly measure customer satisfaction. Note: CF = Customer Focus
Source: Prajogo and Sohal (2006, pp. 308-309)
4.3.5.1.4 Human Resource Management
This construct is characterized by the implementations of employee training,
communication and the well-being of the employees. Five items were deployed to
measure this construct. Respondents were requested to response to the subsequent
seven-point Likert scale with values ranging from 1 (strongly disagree) to 7 (strongly
agree). The level of human resource management practices in the firm was calculated
with the mean of the responses based on the five items listed in Table 4.4.
Table 4.4: Operationalization of Human Resource Management
No. Items
HR1 We have an organization-wide training and development process, including career path
planning, for all our employees.
HR2 Our company practices two-way communication between management and staff.
HR3 Employee satisfaction is formally and regularly measured.
HR4 Employee flexibility, multi-skilling and training are actively used to support performance
improvement.
HR5 We always maintain a work environment that contributes to the health, safety and well-being of
all employees. Note: HR = Human Resource Management
Source: Prajogo and Sohal (2006, p. 309)

108
4.3.5.1.5 Process Management
The level to which a firm emphasizes process management was measured by a six-item
construct. Respondents were requested to respond to the subsequent seven-point Likert
scale ranging from 1 (strongly disagree) to 7 (strongly agree). The score for the level of
process management is calculated based on the mean value of these responses. A list of
these items was shown in Table 4.5.
Table 4.5: Operationalization of Process Management
No. Items
PM1 The concept of the „internal customer‟ (i.e. the next process down the line) is well understood
in our company.
PM2 We design processes in our plant to be “fool-proof” (preventive-oriented).
PM3 We have clear, standardized and documented process instructions which are well-understood
by employees.
PM4 We make an extensive use of statistical techniques (e.g. SPC) to improve the processes and to
reduce variation.
PM5 We strive to establish long-term relationships with suppliers.
PM6 We use a supplier rating system to select our suppliers and monitor their performance. Note: PM = Process Management
Source: Prajogo and Sohal (2006, p. 309)
4.3.5.1.6 Information and Analysis
The level to which a firm has demonstrated good quality related to data and application
of information and analysis was measured with four items. A seven-point Likert scale
with score ranging from 1 (strongly disagree) to 7 (strongly agree) was utilized to
collect responses from the respondents. The level of having good quality related to data
as well as information and analysis was assessed by calculating the mean score of the
responses based on the four items of this variable as shown in Table 4.6.
Table 4.6: Operationalization of Information and Analysis
No. Items
IA1 Our company has an effective performance measurement system to track overall organizational
performance.
IA2 Up-to-date data and information of company‟s performance are always readily available for
those who need it.
IA3 Senior management regularly holds meeting to review company‟s performance and uses it as a
basis for decision-making.
IA4 We engage in an active competitive benchmarking program to measure our performance
against the „best practice‟ in the industry. Note: IA = Information and Analysis Source: Prajogo and Sohal (2006, p. 309)

109
4.3.5.2 Operationalization of KM
Empirical research in KM has attained its maturity level. Knowledge acquisition,
distribution and interpretation have been discussed in the literature section of KM
(Darroch, 2003; Lopez, Peon, & Ordas, 2006). For this study, the measures of KM were
adapted from the studies by Lopez et al. (2006) and Nonaka, Byosiere, Borucki, &
Konno (1994). Three measures of KM were chosen, namely knowledge acquisition
(eight items), knowledge distribution (six items) and knowledge application (five items)
based on their suitability with the aim of this study. Respondents were requested to give
their responses on a seven-point Likert scale ranging from 1 (strongly disagree) to 7
(strongly agree).
4.3.5.2.1 Knowledge Acquisition
“Knowledge may be acquired from the experience of others or through direct
experience” (Lopez et al., 2006, p. 223). Learning from others can be in the form of
common practices such as networking, strategic alliances or benchmarking (Lopez et
al., 2006). Operationalizations of knowledge acquisition were adopted from Goh and
Richards (1997), Lopez et al. (2006) and Nonaka et al. (1994). The scale raises
questions on the level to which new work methods and innovative processes are
supported and promoted. Eight items were employed to gauge this variable.
Respondents were requested to response to the seven-point Likert scale ranging from 1
(strongly disagree) to 7 (strongly agree). The level of knowledge acquisition practices in
a firm was then calculated based on the mean score of the respondents according to the
eight items listed in Table 4.7.

110
Table 4.7: Operationalization of Knowledge Acquisition
No. Items
KA1 We have a system that allows us to learn successful practices from other organizations.
KA2 The company is in touch with professionals and expert technicians.
KA3 The organization encourages the employees to join formal or informal networking made up by
people from outside the organization.
KA4 We often ask our customers what they want or need.
KA5 The employees attend fairs and exhibitions regularly.
KA6 There is a consolidated and resourceful R & D policy.
KA7 New ideas and approaches on work performance are experienced continuously.
KA8 The organizational systems and procedures support innovation. Note: KA = Knowledge Acquisition
Sources: Goh and Richards (1997); Lopez et al. (2006, p. 238); Nonaka et al. (1994)
4.3.5.2.2 Knowledge Distribution
Knowledge distribution can take place through role integration, the position of liaison,
face-to-face contact in meeting or usage of information and analysis to establish an
organizational bulletin board (Lopez et al., 2006). A seven-point Likert scale ranging
from 1 (strong disagree) to 7 (strongly agree) was utilized to collect responses from the
respondents. The level of knowledge distribution practices of the firm was calculated by
taking the mean score of the respondents using the six items as listed in Table 4.8.
Table 4.8: Operationalization of Knowledge Distribution
No. Items
KD1 All employees are informed about the aims of the company.
KD2 Meetings are periodically held to inform all the employees about the latest innovations in the
company.
KD3 The company has formal mechanisms to guarantee the sharing of the best practices among the
different fields of the activity.
KD4 Information technology is used to improve the flow of information and to encourage
communication between individuals within the company.
KD5 There are individuals within the organization who take part in several teams or divisions and
act as links between them.
KD6 There are individuals responsible for collecting, assembling and distributing internally
employees‟ suggestions. Note: KD = Knowledge Distribution
Source: Lopez et al. (2006, p. 238)

111
4.3.5.2.3 Knowledge Application
Five items were used to measure this construct. They were derived and adapted from
Bontis, Crossan, and Hulland (2002), Hult and Ferrel (1997), Lopez et al. (2006) and
Nonaka et al. (1994). The scale evaluates elements such as effective conflict resolution,
working in team and enactive liaison activities. A seven-point Likert scale ranging from
1 (strongly disagree) to 7 (strongly agree) was employed to collect responses from the
respondents. The level of knowledge application practices in the firm was calculated by
taking the mean score of the respondents based on the five items listed in Table 4.9.
Table 4.9: Operationalization of Knowledge Application
No. Items
KAP1 Our organization always apply the latest technology in the market/or our organization is
always up-to-date in technology application.
KAP2 Our employees are well trained in the latest knowledge in their respective position for better
job performance.
KAP3 Our training process is relevant and effective to improve performance and productivity.
KAP4 Our organization has processes for applying experimental knowledge.
KAP5 Our organization has processes for applying knowledge to solve new problems. Note: KAP = Knowledge Application
Sources: Bontis et al. (2002); Hult and Ferrel (1997); Lopez et al. (2006); Nonaka et al. (1994)
4.4 Methods of Statistical Analysis
The procedures applied to analyze the data with the objective of tackling and answering
research questions and hypotheses in this study range from correlation analysis to an
advanced analysis using SEM. Univariate statistical analysis was conducted to screen
the data whereas the initial statistical analysis was carried out via SPSS version 18
(Coakes & Steed, 2010) to examine the reliability and validity of the scales used in this
study. Eventually, SEM via AMOS version 18 was engaged to examine the research
questions and test the proposed hypotheses. These methods of statistical analysis will be
further described in the subsequent sections.

112
4.4.1 Data Screening
Data screening is performed to enhance the collected data and to obtain high quality of
data set using univariate statistical analysis (Xie, 2011). Data is screened to ensure that
all responses that have been entered do make sense besides detecting the existence of
outliers while ensuring the distribution of the responses does not violate the normality
assumptions needed for multivariate analysis (Wong, 2002). Hair, Anderson, Tatham,
and Black (1998) highlighted that outliers should be identified from the univariate,
bivariate and multivariate perspective whereby the most commonly used method to
detect outliers are scatter plots and the Mahalanobis D2 measures (Xie, 2011).
Moreover, evaluations of skewness and kurtosis statistics were performed as outlined in
the procedures recommended by Hair et al. (1998).
4.4.2 Refinement and Validation of Instrument
A comprehensive analysis of measurement of the research instrument utilized in this
empirical research is imperative for a number of reasons. First of all, empirical validated
scales can be deployed directly in other studies in this field on diverse populations.
Secondly, it offers “confidence that the empirical findings accurately reflect the
proposed constructs” (Flynn et al., 1994 as cited in Wong, 2002, p. 129). In fact, various
forms of reliability and validity can serve as a criterion for assessing the soundness of a
psychometric scale. In this study, Cronbach‟s alpha, composite reliability as well as
content, construct and criterion validity (Malhotra, Hall, Shaw, & Crisp, 1996) and
other forms of reliability and validity were assessed for the scale used in this study.
113
4.4.2.1 Reliability
Reliability relates to the level whether the same results can be obtained when using the
instruments to measure repeated thing (Bernard, 2000). Before evaluation of the scale
reliability is performed, unidimensionality should be examined first, since the lack of
unidimensionality may lead to the occurrence of correlation between artificial
constructs. Therefore, checks on the unidimensionality and reliability analysis were
carried out on each of the scales adopted in this study (Wong, 2002).
4.4.2.1.1 Unidimensionality Analysis
As mentioned by Anderson and Gerbing (1991), unidimensionality is a crucial condition
for the analysis of reliability and construct validity. Without unidimensionality, a single
number cannot be utilized to stand for the value of the scale, since items in a
unidimensionality scale can only estimate a single construct (Wong, 2002). In this
study, exploratory and confirmatory factor analyses were conducted to examine the
unidimensionality of the scales.
4.4.2.1.2 Reliability Analysis
Cronbach‟s alpha is used to examine the reliability of the internal consistency of the
constructs. A cut-off point of 0.60 in the alpha‟s value indicates an acceptable degree of
reliability of the construct (Hair et al., 1998). Hence, internal consistency method was
engaged in assessing the reliability of the survey instruments in this study.

114
4.4.3 Validity
Validity refers to “the degree to which any instrument measures what it is intended to
measure” (Zhang et al., 2000, p. 742). Among the methods of assessing the validity of a
measurement instrument are construct validity, content validity, criterion-related
validity, discriminant validity and convergent validity (Carmines & Zeller, 1979; Zhang
et al., 2000). These methods were adopted in this study in order to assess the
measurement instruments.
4.4.3.1 Content Validity
Content validity is defined as how extensive a particular domain of content is reflected
by empirical measurement (Zhang et al., 2000). It offers a strong foundation to establish
comprehensive evaluation of the validity of the survey instrument methodologically
(Zhang et al., 2000). To accomplish content validity, inter-item correlations should be
moderate. High loading (> 0.90) and high inter-item correlation (> 0.80) should be
avoided since high inter-item correlation implies that each item contributes minimal
information to clarify the factors (Choi, 2010). In this study, correlation analysis was
performed as a mean of evaluation of the content validity.
4.4.3.2 Convergent Validity
Convergent validity is a type of construct validity. It is the extent to which scale items
are presumed to be representing a construct based on a range of facts on the same
constructs (Parasuraman, Zeithaml, & Berry, 1991). To examine the convergent validity
of the scales adopted in this study, factor loadings of the observed items on the latent
construct were scrutinized (Wong, 2002). Therefore, confirmatory factor analysis was
engaged in order to assess the convergent validity of the constructs in this study
(Churchill, 1979).

115
4.4.3.3 Discriminant Validity
Discriminant validity is “theoretical based way of thinking about the ability of a
measure to estimate the underlying truth in a given area” (Litwin, 1995 cited in Wong,
2002, p. 133). In order to accomplish discriminant validity, it must be shown that the
measures are not to be strongly correlated with similar but distinct concepts (Wong,
2002). In this study, correlation analysis was deployed to examine the discriminant
validity.
4.4.3.4 Criterion Validity
Criterion validity measures the extent to which scale performed as anticipated in
connection to other variables (Malhotra et al., 1996; Wong, 2002). Basically, there are
two kinds of criterion validity, namely concurrent and predictive validity. Concurrent
validity was examined in this study to evaluate the criterion validity of the measures. In
order to establish concurrent validity, the magnitude and direction of the correlation
coefficients between the components in this study should be consistent with the
anticipated outcomes (Wong, 2002).
4.4.4 Statistical Procedure
In order to establish the relationships between the variables in this study, several
multivariate analyses were carried out. Among these are EFA, CFA and SEM. All of
these analyses will be elaborated in the next few sections.

116
4.4.4.1 Exploratory Factor Analysis
The key application of factor analysis is the use of factor scores as input for the
succeeding stages of analysis (Aaker, 1971; Wong, 2002). EFA was performed prior to
the SEM analysis. In particular, the principle component method with varimax rotation
was chosen as it is the most popular type of rotation and is commonly used in operation
management researches for simplifying factors rather than variables (Wells & Jagdish,
1971; Wong, 2002).
4.4.4.2 Confirmatory Factor Analysis
CFA techniques normally attempt to determine which sets of the observed variables that
share the characteristics of covariance or common variables can best describe the
constructs (Schumacker & Lomax, 1996). CFA is very much alike to EFA with the
exception that constraints derived from the hypotheses are embedded in the analysis.
These constraints may exist in the form of the number of factors hypothesized, the
nature of the connections between the factors and the magnitude of the factor loading
for every variable (Schumacker & Lomax, 1996). In this study, CFA was conducted to
evaluate the unidimensionality of the latent variables, convergent validity as well as the
discriminant validity (Hair et al., 1998).
4.4.4.3 Structural Equation Modeling
SEM has been widely adopted in social science research using quantitative study since
it permits modification and assessment of the theoretical models (Bentler, 1983; Xie,
2011). Indeed, SEM is very useful in examining the inter-dependent relationship among
some latent variables (Hair et al., 1998). It is designed to assess how good a proposed
conceptual model can fit the data collected and also to ascertain the structural
relationships between the sets of latent variables (Byrne, 2001). The modeling process

117
was accomplished by deploying the covariance matrix and this procedure involved
Maximum Likelihood Estimation (MLE). MLE is one of the most universally used
approaches and is efficient when the multivariate normality assumptions are met (Choi,
2010; Hair et al., 1998).
SEM was adopted in this study to examine the proposed hypotheses on the relationship
between TQM and KM model as stated in Chapter 3. According to Anderson and
Gerbing (1988), this structural test involves a two-stage process. The initial stage is to
ascertain good measurement of the constructs and the latter stage requires an evaluation
of the structural relationships. In this study, the measurement and structural models
were generated and estimated using SPSS 18 and AMOS 18.
4.4.4.4 Overall Goodness-of-Fit Measures
There is no single statistical test that the best describes the predictive power of a
structural model (Hair et al., 1998). Byrne (2009, p. 83) opined that determination of
which indices are acceptable estimators of goodness-of-fit is quite complex as
“particular indices have been shown to operate somewhat differently given the sample
size, estimation procedure, model complexity and/or violation of the underlying
assumptions of multivariate normality and variable independence” (as cited in Ulrich,
2009, p. 87). Hence, assessment of goodness-of-fit remains subjective whereby
researchers, armed with their own understandings of the various indices, the model and
the data, will decide on which indices should be utilized to best describe the model fit
and to what degree the described fit is considered good (Ulrich, 2009). As an
alternative, a combination of measures may be adopted to evaluate the overall
goodness-of-fit of a structural model and among the measures deployed in this study

118
include the absolute fit measures, the incremental fit measures and the parsimonious fit
measures (Jöreskog & Sörbom, 1998).
4.4.4.5 Absolute Fit Measures
Absolute fit measures determine the extent of the overall model (i.e. measurement and
structural models) in predicting the observed covariance (Hair et al., 1998). Some of the
examples of absolute fit measures which are widely used in SEM are likelihood-ratio
chi-square statistics, the goodness-of-fit index and the root mean square residual (Wong,
2002).
4.4.4.5.1 Likelihood-ratio Chi-square Statistics
According to Hair et al. (1998), this is the most fundamental measure of overall fit and
is the only statistically based measure of goodness-of-fit available in SEM. Assessment
of the model fit is based on the chi-square significance since a low chi-square statistics
implies less difference between the hypothesized and the estimated models.
Nevertheless, usage of chi-square in goodness-of-fit analysis in SEM has been
problematic due to the propensity to reject the fitted model (Schumacker & Lomax,
1996; Ulrich, 2009). These errors happen as a result of non-normality in the dataset and
are anticipated to be appearing when sample size increases (Byrne, 2009; Ulrich, 2009).
Hence, the chi-square measure is sensitive to large sample size and also very sensitive
to the deviation from multivariate normality of the observed variables (Wong, 2002).

119
4.4.4.5.2 Goodness-of-Fit Index
Goodness-of-Fit Index (GFI) estimates the goodness-of-fit of a model against a totally
non-fit of the data (Ho, 2006; Ulrich, 2009). The index ranges from zero (poor fit) to
one (perfect fit) and the higher the index, the better the goodness-of-fit of the model. It
is a universal consensus that a minimum value of 0.90 is required to indicate a good fit
(Hair et al., 1998).
4.4.4.5.3 Root Mean Square Residual
Root Mean Square Residual (RMR) is the square root of the mean of the squared
residuals which is the mean of the residuals between the observed and the estimated
input matrices (Hair et al., 1998). RMR ranges from zero (perfect fit) to one (poor fit)
and the lower the value, the better the goodness-of-fit (Hair et al., 1998).
4.4.4.6 Incremental Fit Measures
Incremental fit measures compare the estimated model to the baseline model or
frequently referred as the null model (Wong, 2002), which is a practical model that all
other models should be anticipated to surpass (Hair et al., 1998). Among the examples
are Normed Fit Index (NFI), Adjusted Goodness-of-Fit Index (AGFI) and Comparative
Fit Index (CFI).
4.4.4.6.1 Adjusted Goodness-of-Fit Index
AGFI is extended from GFI by adjusting the “degrees of freedom for the null model”
(Wong, 2002, p. 143). The index ranges from zero (poor fit) to one (perfect fit) and the
higher the index, the better the goodness-of-fit. A minimum value of 0.90 is generally
accepted as the standard of a good fit (Hair et al., 1998).
120
4.4.4.6.2 Normed Fit Index
NFI indicates the percentage of increment in fitness over the baseline independent
model (Bentler & Bonett, 1980). Even though NFI is widely used, it has been proven to
underestimate the goodness-of-fit of a model in small samples. The NFI index ranges
from zero (poor fit) to one (perfect fit), with the higher the index, the better the
goodness-of-fit. The common accord is to take the minimum value of 0.90 as a
benchmark for a good fit (Byrne, 2009; Hair et al., 1998).
4.4.4.6.3 Comparative Fit Index
CFI refers to the “comparisons between the estimated model and a null or independence
model” (Wong, 2002, p. 143). The index ranges from zero (poor fit) to one (perfect fit)
whereby the higher the index, the better the level of goodness-of-fit. The common
agreement is a minimum value of 0.90 to represent a good fit (Byrne, 2009; Hair et al.,
1998).
4.4.4.7 Parsimonious Fit Measures
Parsimonious fit measures refer to the goodness-of-fit of the model with regards to the
number of estimations required to obtain a proper level of fit (Hair et al. 1998). Smaller
values of Root Mean Square Error of Approximation (RMSEA), which is considered as
a parsimonious index, imply a better fit. According to Ho (2006), values ranging “from
0.05 to 0.08 indicate an acceptable fit, 0.08 to 0.10 represent a mediocre fit, and any
result greater than 0.10 suggest a poor fit” (as cited in Ulrich, 2009, p. 89).

121
4.5 Chapter Summary
This chapter has elaborated on the main issues with respect to the research methodology
and strategies adopted in the study. The first section explains the quantitative research
design which consists of the unit of analysis, sampling size, pilot study and procedures
for data collection. Meanwhile, the second section was about survey instrument and
operationalization of research constructs which explained the questionnaire scaling and
its structure as well as the operationalization of these constructs. The last section that
delved into methods of statistical analysis has discussed the data purification process,
scale refinement and validation procedures as well as statistical techniques such as EFA,
CFA, SEM and goodness-of-fit measures.
The preceding chapters and this chapter have focused on giving an elucidation of the
background of the research as well as the theoretical basis for the research questions,
hypotheses and methodology. The subsequent chapters will present and discuss the
results of the study and deal with each of the research questions and hypotheses
respectively.
122
CHAPTER 5
VALIDITY TESTS AND RELIABILITY ANALYSIS
5.1 Introduction
In the previous chapters, the theoretical framework and the literature for its
development, field study for survey, research questions, hypotheses to be tested and the
methodology adopted for analyzing them have been duly elucidated. For this chapter,
details and discussion about the findings of the validity and reliability analyses will be
presented. Based on the instruments derived from a pilot study, the main survey has
succeeded in gathering a new dataset to examine the research instruments. It is only
based on the scales of measurement that are reliable and valid that hypotheses testing
can be carried out.
This chapter is divided into seven sections. It starts with an explanation of the data
cleaning process and the respondents‟ demographics details which entails their gender,
age, marital status, education level, length of service within the organization, job
designation and job scope. Whereas in the second section, the organizations‟ details
such as their products and service levels, number of employees, status and ownership
were presented. This is followed by a detailed description of the analyses undertaken to
test the reliability and validity of the measures. In particular, the reliability of the
measures was examined with Cronbach‟s alpha values, scale composite reliability, EFA
as well as CFA.

123
A summary of the data screening procedures consists of the missing value exclusion and
common method variance test is presented in section 5.2. On the other hand,
respondents‟ demographic details and the organizations‟ characteristics are included in
sections 5.3 and 5.4 respectively. This is followed by the discussion on scale
development and validity test on the dimensions of the construct in section 5.6. Finally,
summary of the whole chapter is provided in section 5.7.
5.2 Data Screening
Analysis of data starts with the data screening techniques whereby result of the survey
for every item was extracted from the survey program into the SPSS software for data
cleaning and further analyses. Creswell (2005), Ulrich (2009) and Xie (2011) asserted
that data cleaning can be carried out using frequency distributions, histograms and box
plots to visually evaluate out-of-range data, missing values or input errors. No input
errors were anticipated or seen since the data were inputs from the survey and hence
human-generated errors can be avoided. The data were then imported into AMOS
version 18 for preliminary analysis of measurement modality (Ulrich, 2009). No cases
were identified as outliers based on the non-existence of substantial gaps in the
Mahalanobis D2 distances and hence none were discarded (Byrne, 2009).

124
5.2.1 Missing Value Exclusion
According to Xie (2011), missing data can be a consequence of any systematic external
activity from the respondents such as errors in data entry, data collection or the
reluctance in answering some questions which lead to missing values. Enders (2006)
stressed that a lot of past studies have employed various methods to examine structural
equation models which have missing data but the beliefs on the missing data mechanism
were different. Researchers such as Enders (2006), Olinsky, Chen, and Harlow (2003)
and Xie (2011) stated that missing data approaches can be done in two ways, namely by
elimination such as pairwise deletion and listwise deletion or imputation such as
regression imputation and mean imputation.
Among the approaches to treat the missing data, the deletion technique is not
recommended for it could lead to significant bias in the chi-square statistics (Xie, 2011)
whereas in the imputation technique, missing values are forecasted. In AMOS,
maximum likelihood imputation technique is adopted and many researchers concurred
that this technique has the minimum bias in comparison with the deletion technique
(Byrne, 2006). Another technique is the Expectation Maximization (EM) imputation
algorithm which is a method to determine the maximum likelihood predictive capability
in models for missing data (Dempster, Laird, & Rubin, 1977). Furthermore, Xie (2011)
opined that EM is less stringent in the missing data mechanism and performs well under
the random missing data mechanism. Dempster et al. (1977) and Xie (2011) justified
this by using the fact of EM‟s ability in linking the missing data with the results in the
complete dataset which is used as the input dataset for SEM analysis as well as other
multivariate analyses. Hence, in this study, SEM technique is adopted to deal with
missing data in the current sample of the main survey. The missing values of six cases

125
are relatively small as compared to the study sample size, and the sample size did not
reduce significantly hence this has not led to any biases.
5.2.2 Common Method Variance Test
The problem of Common Method Variance (CMV) bias occurs when both dependent
and independent variables are measured from the same respondents (Delerue &
Lejeune, 2010; Teh & Yong, 2011). The Harman‟s one-factor test can be utilized to
examine CMV bias. The result shows that a single factor contributed 35.629% (i.e. <
50%) of the total variance, implying the non-existence of a sole dominant factor. Hence,
CMV bias in the dataset is not significant (Delerue & Lejeune, 2010).
5.3 Demographic Profile and Other Characteristics
The employee profile of the 203 respondents is illustrated in Table 5.1. It shows that
there are more males employees (64.5%) than their female counterparts (35.5%). 55.7%
of the total respondents are married and the rest of them remain single. In terms of age,
a majority with 23.6% of the total respondents is below 25 years old followed by 18.7%
aged above 45 years old. The other age groups are almost evenly distributed as follows:
26-30 (16.3%), 31-35 (13.3%), 36-40 (13.3%), and 41-45 (14.8%). Majority of the
respondents (38.4%) are Bachelor degree holders, 29.1% Diploma holders, 23.1% with
high school education or lower level, 8.4% Master holders and only 1% are
PhD/doctoral graduates. From the perspective of the positions hold by the respondents
in the organization, 42.4% are executives, 26.6% are managers/head of departments,
18.7% are senior managers such as general managers, directors and CEOs, and the
remaining 12.3% are section heads, section managers, engineer, supervisors, etc. The
respondents represent various job functions in the organization which include finance,
information and technology, human resource management and procurement

126
departments. 31.1% of the total respondents have at least 10 years of working
experience in the present organization. Based on the information collected, this study is
able to identify several key characteristics of the respondents, namely relatively young
and with some reasonable good education background and prefer to look at both TQM
and KM practices.
Table 5.1: Demographic Profile of Respondents
Demographic Variables Frequency Percentage
Gender
Male 131 64.5
Female 72 35.5
Age
Below 25 years old 48 23.6
26 - 30 years old 33 16.3
31 - 35 years old 27 13.3
36 - 40 years old 27 13.3
41 - 45 years old 30 14.8
Above 45 years old 38 18.7
Marital Status
Single 90 44.3
Married 113 55.7
Education
No College Degree 47 23.1
Diploma/Advance Diploma 59 29.1
Bachelor Degree/Professional Qualification 78 38.4
Master Degree 17 8.4
PhD Degree 2 1.0
Length of Service
Less than 1 year 29 14.3
1 - 2 years 31 15.2
3 - 5 years 41 20.2
6 - 10 years 39 19.2
11 - 20 years 45 22.2
Above 20 years 18 8.9
Primary Job Scope
Research & Development 18 8.9
Finance 10 4.9
Production 28 13.8
Human Resource 7 3.4
Marketing 33 16.2
Information Technology 11 5.4
Administration 45 22.2
Procurement 4 2.0
Others 47 23.2

127
5.4 Characteristics of Organizations’ Profile
The collected data is divided into three sample groups according to the number of
employees a firm has. Firms with less than 50 employees are classified as small firms,
firms having between 50 to 200 employees are categorized as medium sized firms and
firms having more than 200 employees are grouped as large firms (Hoang et al., 2006).
Based on the gathered data, there are 43.3%, 29.6% and 27.1% small, medium sized and
large firms. Furthermore, Table 5.2 also demonstrated that 84.2% of the firms have ISO
certified status and the rest of 15.8% are intending to secure the ISO certification. The
respondents come from two groups, namely the manufacturing firms (62.6%) and the
service industries (37.4%). The sample manufacturing firms are from sectors such as
electrical and electronic (12.8%), food (8.4%), chemical (3.9%), rubber and plastic
(5.4%), textile (5.4%), machinery (9.4%) and other manufacturing firms (17.3%).
Whereas the service sectors encompass higher education (5.9%), healthcare (6.4%),
travel and tourism (2.0%), finance (3.0%), insurance (3.0%), entertainment (1.5%) and
other types of service firms (15.6%). With regard to ownership, 60.6% of the firms are
local private owned (i.e. owned by the Chinese (55.2%) and non-Chinese (5.4%)).
Besides that, 21.2% are foreign owned and 18.2% are owned by state/government.
Table 5.2: Profile of Organizations
Demographic Variables Frequency Percentage
Category of Organizations
Manufacturing 127 62.6
Service 76 37.4
Number of employees
Less than 50 88 43.3
50 - 200 60 29.6
Above 200 55 27.1
Status of organization
ISO certified 171 84.2
Planning to ISO certification 32 15.8
Ownership
Foreign Owned Company 43 21.2
State Owned Company 37 18.2
Local Private Family Owned Company
(i) Chinese 112 55.2
(ii) Non-Chinese 11 5.4
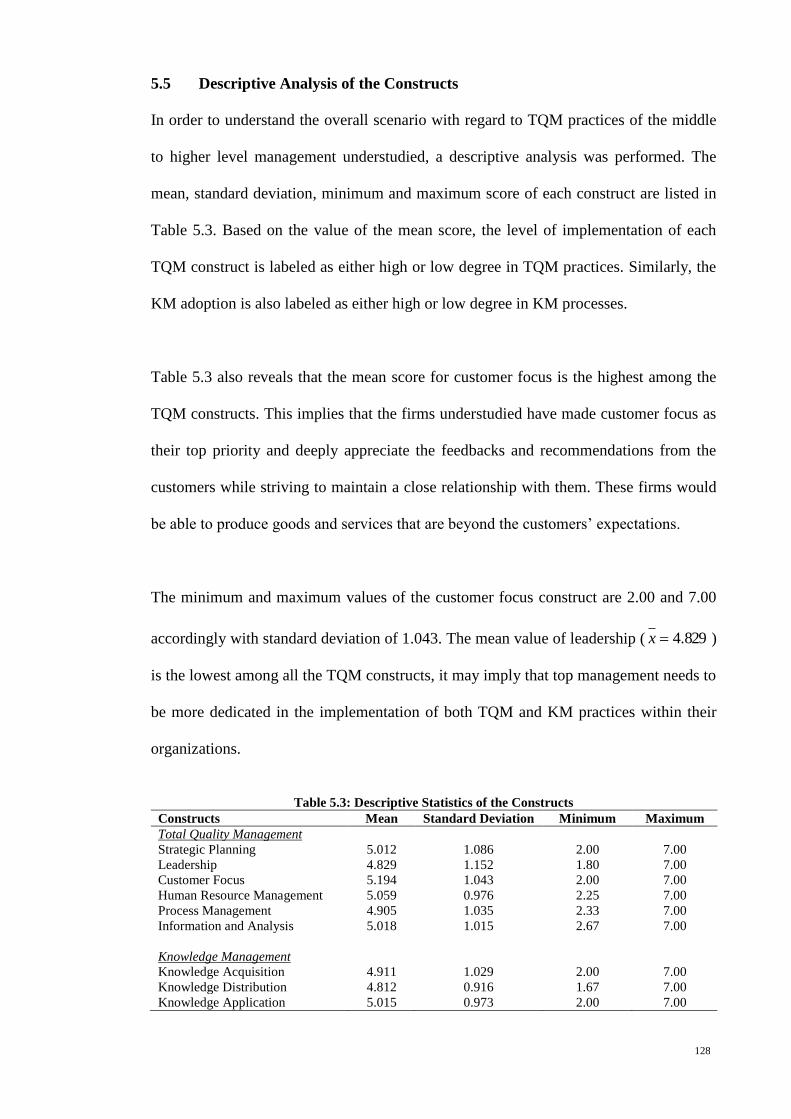
128
5.5 Descriptive Analysis of the Constructs
In order to understand the overall scenario with regard to TQM practices of the middle
to higher level management understudied, a descriptive analysis was performed. The
mean, standard deviation, minimum and maximum score of each construct are listed in
Table 5.3. Based on the value of the mean score, the level of implementation of each
TQM construct is labeled as either high or low degree in TQM practices. Similarly, the
KM adoption is also labeled as either high or low degree in KM processes.
Table 5.3 also reveals that the mean score for customer focus is the highest among the
TQM constructs. This implies that the firms understudied have made customer focus as
their top priority and deeply appreciate the feedbacks and recommendations from the
customers while striving to maintain a close relationship with them. These firms would
be able to produce goods and services that are beyond the customers‟ expectations.
The minimum and maximum values of the customer focus construct are 2.00 and 7.00
accordingly with standard deviation of 1.043. The mean value of leadership ( 829.4x )
is the lowest among all the TQM constructs, it may imply that top management needs to
be more dedicated in the implementation of both TQM and KM practices within their
organizations.
Table 5.3: Descriptive Statistics of the Constructs
Constructs Mean Standard Deviation Minimum Maximum
Total Quality Management
Strategic Planning 5.012 1.086 2.00 7.00
Leadership 4.829 1.152 1.80 7.00
Customer Focus 5.194 1.043 2.00 7.00
Human Resource Management 5.059 0.976 2.25 7.00
Process Management 4.905 1.035 2.33 7.00
Information and Analysis 5.018 1.015 2.67 7.00
Knowledge Management
Knowledge Acquisition 4.911 1.029 2.00 7.00
Knowledge Distribution 4.812 0.916 1.67 7.00
Knowledge Application 5.015 0.973 2.00 7.00

129
5.6 Reliability and Validity Test
Choi (2010) has emphasized the importance of both reliability and validity in the data
collection and instrument development stages. He also opined that reliability is the
degree to which constructs are free from random errors. On the other hand, Litwin
(1995) asserted that reliability can be utilized to ascertain whether an instrument‟s data
is reproducible. In fact, Sekaran (2003) has stated that four methods can be used to
estimate the reliability of measurements, namely test-retest method, split half method,
parallel or alternate form method and Cronbach‟s alpha coefficient method.
Nevertheless, the first three methods have been criticized for their limitations (Davis,
2000). The alternative form method is impractical and costly as researchers need to
develop a different but equivalent form of scales. Ya‟acob (2008, p. 208) pointed out
that “the test-retest reliability may generate a lower reliability over time because of the
changes in the subject form periodically”. Whereas the split half method of reliability
assessment will yield different coefficients of reliability depending on the way the
elements divided. Fortunately, these limitations can be resolved by using Cronbach‟s
alpha coefficient method. As asserted by Davis (2000) and Ya‟acob (2008), the
practicality of this method has been used by various researchers in the field of social
science compared to the other three methods. Due to this practicality, the reliability in
this study is measured by Cronbach‟s alpha, one of the most commonly used coefficient
methods to assess the internal consistency within the items. Hair et al. (1998) suggests
that as a rule of thumb, the cut-off value of Cronbach‟s alpha is 0.60 while a value of
0.80 is considered to be good. Choi (2010) has defined validity as the degree to which a
measurement assesses what it is supposed to measure. In the subsequent sections,
discussions on the various tests conducted to examine the seven dimensions of the
construct validity (i.e. unidimensionality, reliability, convergent validity, discriminant

130
validity, nomological validity, content validity and criterion related validity) will be
presented.
To ensure construct validity in this study, EFA was first conducted on the TQM
practices to confirm the underlying latent variables. As recommended by several
researchers (Choi, 2010; Morgan, Gliner, & Robert, 2005), items with factor loading
below 0.40 should be either discarded or refined. After the identification of latent and
observed variables was done and EFA, the measurement constructs were further verified
using CFA to examine whether the indicators are loaded on the chosen latent variables
(Choi, 2010).
5.6.1 Exploratory Factor Analysis
Basically, there are two major forms of factor analysis approaches, namely EFA and
CFA (Schumacker & Lomax, 1996). In previous literature, there were significant
arguments about the appropriateness of these two approaches. For example, Hurley et
al. (1997) opined that only a single approach should be used with respect to any given
dataset or research questions. Besides that, Nunnally and Bernstein (1994) argued that
the adoption of EFA “in the absence of strong theoretical construct is „shotgun
empiricism” (Wong, 2002, p. 191). This argument is further supported by Schriesheim‟s
statement in Hurley et al. (1997, p. 672) that theoretically EFA is less demanding in
comparison to CFA as a priori theory is needed by CFA (Wong, 2002).

131
Chong (2008) stated that most of the researchers have considered factor analysis as
exploratory and is effective in studying the structure of a set of variables. Although the
questionnaire developed in this study was adapted from prior studies, part of it was
integrated with new items which were developed to describe every factor based on a
comprehensive theoretical rationale. Furthermore, the adapted survey has not been
adopted in the context Malaysian firms. Therefore, factor analysis in this study was
exploratory instead of confirmatory. EFA was used to examine the unidimensionality of
the constructs rather than exploring the underlying dimensions of the factors. Hence, it
was used in this study. Furthermore, according to Wong (2002), CFA was also carried
out in order to provide greater support for the reliability and validity of the factors.
Principle Component Analysis (PCA) and common factor analysis are two methods of
implementing EFA. Chong (2008) and Zhang et al. (2000) concurred that common
factor analysis is appropriate if the aim is to identify the constructs indicated in the
original set of items. Conversely, Chong (2008), Hair et al. (2006) and Zhang et al.
(2000) mentioned that PCA is commonly preferred if the researchers are concern
primarily about the minimum number of constructs needed to describe the maximum
portion of the variance indicated in the original set of items. As a result, PCA was
chosen for this study as the main intention of performing the factor analysis was to
determine how and to what extent the items were correlated to their underlying factors
(Byrne, 1998; Chong, 2008). Zhang et al. (2000) asserted that PCA technique can help a
researcher in deciding whether the selected items cluster on one or more than one factor.
In fact, Chong (2008) and Zhang et al. (2000) further emphasized that this is crucial if
there are three or more items which are chosen for evaluating one construct.

132
5.6.1.1 Exploratory Factor Analysis for TQM Constructs
In the preliminary stage, a PCA with Varimax rotation was conducted to validate the
underlying structure of the TQM dimensions. This study proposes six key dimensions in
the examination of the core practices of TQM, namely leadership, strategic planning,
customer focus, human resource management, process management, information and
analysis.
Multiple indicators were derived from the past literature in order to describe the
comprehensive and rich meaning of each dimension especially leadership and human
resource management with five elements each; strategic planning and information and
analysis with four elements each; customer focus and process management with six
elements each. All together, the TQM construct consists of 30 elements. Hence, it is
imperative to identify the more significant indicative items to represent these
dimensions. Xie (2011, p. 198) stated that “in order to reduce redundant information,
extract the most meaningful information, establish the factorial dimensionality, and
confirm the validity of the factorial dimensionality”. Thus, EFA was employed to reveal
the basic factor structure of the TQM and then validated with CFA.
EFA was performed on the 30 items of TQM. To justify the factor, only factor loading
of at least 0.50 on the factor and at most 0.35 on the other factors was considered. In the
path of the validation process, 9 items (i.e. SP3, CF1, CF3, CF4, HR1, PM2, PM5, PM6
and IA4) with poor factor loadings of less than 0.50 on their respective unobserved or
latent variable were discarded (Hoang et al., 2006; Sit et al., 2009). The results of the
Varimax rotated EFA showed the existence of six significant factors with eigenvalues
more than one on all of the constructs‟ items, have significant factor loadings on their
single factor. Besides that, the Kaiser-Meyer-Olkin (KMO) measure of sampling

133
adequacy value for all items was greater than 0.60, with most of the analyses in the
range of 0.675 to 0.837, indicating adequate inter-correlations while the Bartlett‟s test of
sphericity was large and significant for all of the factors analyses, with value ranging
from 121.891 to 578.256. Therefore, it can be concluded that the factor loadings are
deemed robust in enhancing the construct validity of the scales (Churchill, 1979; Xie,
2011). In short, it is undisputable that all the items are reliable measures of the
constructs. Finally, the internal consistency of the measures was evaluated using
Cronbach‟s alpha and all values were found to be greater than the recommended
threshold of 0.60 (i.e. leadership = 0.891; strategic planning = 0.812; customer focus =
0.778; human resource management = 0.786; process management = 0.760; information
and analysis = 0.747). Table 5.4 illustrates the EFA results.
5.6.1.2 Exploratory Factor Analysis for KM
Similarly, EFA was performed on 19 items of KM by using the PCA with Varimax
rotation to examine their unidimensionality. In the validation process of EFA, several
items (i.e. KD1, KD2, KD4, KA1, KA4, KA5, KA7, KA8 and KAP4) in the KM
construct were dropped due to poor factor loadings of less than 0.50 on their respective
unobserved or latent variable (Hoang et al., 2006; Sit et al., 2009). The results of the
EFA for the KM dimensions are presented in Table 5.4. The KMO and Bartlett‟s test
(chi-square) values are adequate and significant at 0.000 levels and therefore support the
appropriateness of factor analysis on the data (Xie, 2011). The factor loadings are
significantly robust to support the construct validity of the scales (Churchill, 1979). All
factors of KM have acceptable reliability with alpha value ranging from 0.698 to 0.771.
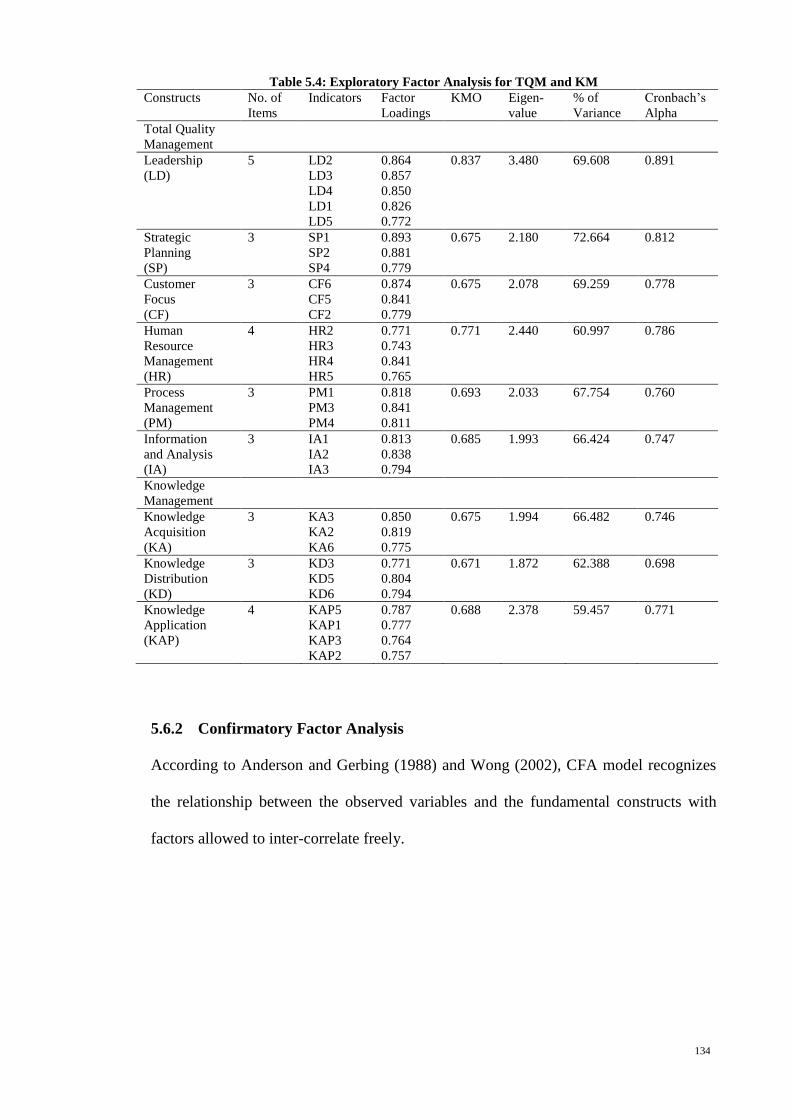
134
Table 5.4: Exploratory Factor Analysis for TQM and KM
Constructs No. of
Items
Indicators Factor
Loadings
KMO Eigen-
value
% of
Variance
Cronbach‟s
Alpha
Total Quality
Management
Leadership 5 LD2 0.864 0.837 3.480 69.608 0.891
(LD) LD3 0.857
LD4 0.850
LD1 0.826
LD5 0.772
Strategic 3 SP1 0.893 0.675 2.180 72.664 0.812
Planning SP2 0.881
(SP) SP4 0.779
Customer 3 CF6 0.874 0.675 2.078 69.259 0.778
Focus CF5 0.841
(CF) CF2 0.779
Human 4 HR2 0.771 0.771 2.440 60.997 0.786
Resource HR3 0.743
Management HR4 0.841
(HR) HR5 0.765
Process 3 PM1 0.818 0.693 2.033 67.754 0.760
Management PM3 0.841
(PM) PM4 0.811
Information 3 IA1 0.813 0.685 1.993 66.424 0.747
and Analysis IA2 0.838
(IA) IA3 0.794
Knowledge
Management
Knowledge 3 KA3 0.850 0.675 1.994 66.482 0.746
Acquisition KA2 0.819
(KA) KA6 0.775
Knowledge 3 KD3 0.771 0.671 1.872 62.388 0.698
Distribution KD5 0.804
(KD) KD6 0.794
Knowledge 4 KAP5 0.787 0.688 2.378 59.457 0.771
Application KAP1 0.777
(KAP) KAP3 0.764
KAP2 0.757
5.6.2 Confirmatory Factor Analysis
According to Anderson and Gerbing (1988) and Wong (2002), CFA model recognizes
the relationship between the observed variables and the fundamental constructs with
factors allowed to inter-correlate freely.
135
In this study, the confirmatory measurement model was utilized to assess
unidimensionality, convergent validity and construct reliability. Therefore,
measurement model was performed on both independent and dependent variables
(Wong, 2002) to evaluate how good the observed variables are linked to a set of latent
variables (Choi, 2002). In fact, all measurement models were established based on
theoretical and empirical backgrounds suggested in previous studies (Choi, 2010). The
goodness-of-fit of the measurement models determines how good the item in examining
the intended constructs (Choi, 2010). The goodness-of-fit indices that assess the
measurement model encompass the normed chi-square test, the Standardized Root
Mean Square Residual (SRMR), the Non-normed Fit Index (NNFI), the CFI, the GFI,
the AGFI and the RMSEA.
5.6.2.1 Measurement Model: Independent Variables (TQM Practices)
To examine the measurement characteristics of the scale, this study has taken the
indicators of the six-factor correlated model as a second-order factor of TQM practices.
In order to set the scales for the six dimensions, the variance of each dimension was
fixed at 1.0. Hence, the fundamental conditions of plausibility and identification have
been met and Figure 5.1 shows the standardized solution of the measurement model.
The goodness-of-fit indices for the measurement model are as follows: normed chi-
square value ( df2 ) of 0.966, SRMR = 0.043, GFI = 0.939, AGFI = 0.901, NFI =
0.943, CFI = 1.000 and RMSEA = 0.000. Significant result of the normed chi-square
test indicated that the model fits well with the dataset. The values of NFI and CFI which
are near to 1 imply a good fit and index value over 0.90 are considered as acceptable
(Choi, 2010; Steenkamp & van Trijp, 1991). Generally, these statistics have given
evidence of a reasonably good fit of data.

136
TQM
Note: The standardized solution to the second-order CFA model of TQM displaying
loadings of 21 items of six underlying latent factors. All standardized coefficients of
the estimates are significant at 5% level.
CF
CF2
CF5
CF6
0.71
0.62
0.56
PM
PM1
PM3
PM4
0.52
0.61
0.61
LD LD3
LD4
LD5
0.76
0.72
0.70
SP
SP1
SP2
SP4
0.76
0.78
0.65
IA
IA2
IA3
IA1
0.62
0.63
0.59
HR
HR4
HR5
HR3
0.54
0.56
0.57
HR2
LD1
LD2 0.72
0.71
0.48
0.50
0.52
0.49
0.52
0.57
0.60
0.61
0.35
0.31
0.39
0.50
0.37
0.38
0.28
0.35
0.40
0.38
0.32
0.32
0.29
0.23
TQM = Total Quality Management
LD = Leadership
SP = Strategic Planning
CF = Customer Focus
HR = Human Resource Management
PM = Process Management
IA = Information and Analysis
Figure 5.1: Second-order CFA Model of TQM
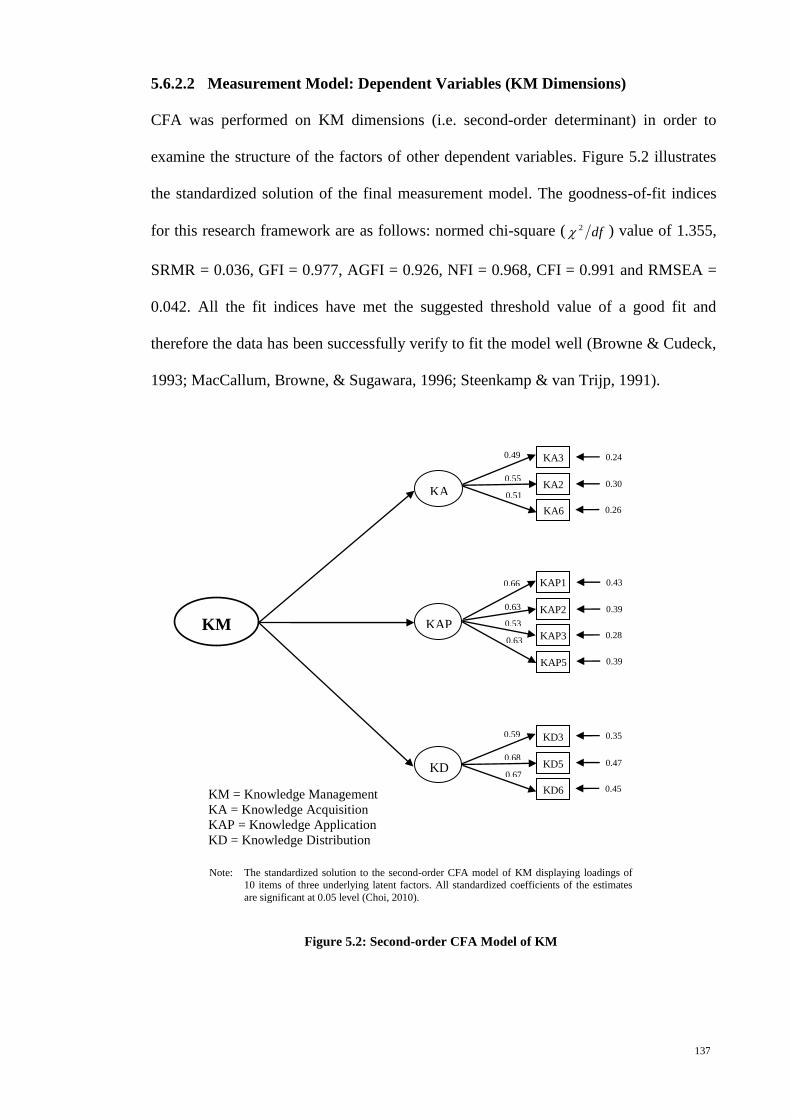
137
5.6.2.2 Measurement Model: Dependent Variables (KM Dimensions)
CFA was performed on KM dimensions (i.e. second-order determinant) in order to
examine the structure of the factors of other dependent variables. Figure 5.2 illustrates
the standardized solution of the final measurement model. The goodness-of-fit indices
for this research framework are as follows: normed chi-square ( df2 ) value of 1.355,
SRMR = 0.036, GFI = 0.977, AGFI = 0.926, NFI = 0.968, CFI = 0.991 and RMSEA =
0.042. All the fit indices have met the suggested threshold value of a good fit and
therefore the data has been successfully verify to fit the model well (Browne & Cudeck,
1993; MacCallum, Browne, & Sugawara, 1996; Steenkamp & van Trijp, 1991).
KM
Note: The standardized solution to the second-order CFA model of KM displaying loadings of
10 items of three underlying latent factors. All standardized coefficients of the estimates
are significant at 0.05 level (Choi, 2010).
KA
KA3
KA2
KA6
0.51
0.55
0.49
KD
KD3
KD5
KD6
0.67
0.68
0.59
KAP
KAP1
KAP2
KAP3
0.53
0.63
0.66
KAP5
0.63
0.24
0.30
0.26
0.35
0.47
0.45
0.43
0.39
0.28
0.39
KM = Knowledge Management
KA = Knowledge Acquisition
KAP = Knowledge Application
KD = Knowledge Distribution
Figure 5.2: Second-order CFA Model of KM
138
5.6.3 Content Validity
Content validity refers to the extent to which the measurement unveils the specific
aimed domain of the content (Carmines & Zeller, 1991). In order to obtain content
validity, the inter-item correlations must be moderate. As asserted by Choi (2010), high
loadings (> 0.90) and high inter-item correlation (> 0.80) should be avoided as high
inter-item correlation implies that each item adds minimal information to describe the
factor. Table 5.6 indicates that leadership and strategic planning have the highest
correlation coefficient value of 0.747 which is still under the 0.90 threshold.
5.6.4 Unidimensionality
Unidimensionality indicates the existence of sole factor underlying a set of items (Dunn,
Seaker, & Waller, 1994). Lopez et al. (2006, p. 226) stated that two approaches can be
applied to examine the unidimensionality hypothesis as follows: “(1) the significance of
the factor loading; that is the estimated correlation between specific items and the latent
construct it signifies and (2) the acceptance of the overall measurement model based on
the model‟s fit to the data”. In this study, the first-order measurement model of TQM
practices (i.e. df2 = 0.923; p-value = 0.731 > 0.05; CFI = 1.000; NFI = 0.948; RMR =
0.053 and RMSEA = 0.000) and the dimensions of KM (i.e. df2 = 0.637; p-value =
0.836 > 0.05; CFI = 1.000; NFI = 0.987; RMR = 0.032 and RMSEA = 0.000) have
shown an acceptable model fit (Anderson & Gerbing, 1988; Bagozzi & Yi, 1988;
Browne & Cudeck, 1993) while all item-to-construct loadings are statistically
significant, supporting the unidimensionality of the scale utilized (Lopez et al., 2006).
The results of the standardized factor loadings are shown in Table 5.5.

139
Furthermore, to evaluate the components of the measurement model, the researcher
should also check the direction, magnitude and the statistical importance of the
parameter estimates between the latent and indicator variables (Steenkamp & van Trijp,
1991). Ya‟acob (2008, p. 235) stated that “there are three major conditions that are
applied to study the unidimensionality of construct”, namely:
1) The parameter estimate‟s magnitude should be a minimum of 0.70.
2) The sign [i.e. positive (+), negative (-)] of the parameter estimates should be
consistent with the theory.
3) For every parameter estimate, the value should be statistically significant (p-
value < 0.05) with critical ratio (value) being a minimum of 2.00 (≥ 2.00).
Table 5.5 depicts that most of the parameter estimates‟ magnitudes were above the cut-
off value of 0.70. Moreover, all of them were positive and therefore are consistent with
the theory and literature. Last but not the least, all of them also has a critical ratio
exceeding 2.00, thus providing support for unidimensionality of the constructs.

140
Table 5.5: Measures and Test for Unidimensionality for First-order Factor
Measures Standardized Factor Loadings (CR)a
Total Quality Management Practices
First Order Measurement Model
LD5 LD 0.760 (N/A)
LD4 LD 0.775 (10.813**)
LD3 LD 0.782 (10.382**)
LD2 LD 0.796 (11.212**)
LD1 LD 0.764 (10.542**)
SP4 SP 0.629 (N/A)
SP2 SP 0.827 (9.391**)
SP1 SP 0.854 (9.570**)
CF6 CF 0.848 (N/A)
CF5 CF 0.725 (10.835**)
CF2 CF 0.651 (9.552**)
PM4 PM 0.681(N/A)
PM3 PM 0.765 (9.023**)
PM1 PM 0.720 (8.623**)
IA3 IA 0.680 (N/A)
IA2 IA 0.709 (8.599**)
IA1 IA 0.733 (9.089**)
HR5 HR 0.727 (N/A)
HR4 HR 0.756 (9.416**)
HR3 HR 0.703 (8.048**)
HR2 HR 0.643 (8.227**)
Knowledge Management
First Order Measurement Model
KA2 KA 0.736 (N/A)
KA3 KA 0.754 (6.644**)
KA6 KA 0.743 (6.028**)
KAP1 KAP 0.690 (N/A)
KAP2 KAP 0.720 (6.654**)
KAP3 KAP 0.734 (6.886**)
KAP5 KAP 0.702 (7.987**)
KD5 KD 0.824 (N/A)
KD3 KD 0.712 (7.879**)
KD6 KD 0.570 (6.279**) Notes: ** p-value < 0.01 (All standardized loadings are significant at p< 0.01); a Values in parentheses refer to critical ratio;
N/A = Not applicable; LD = Leadership; SP = Strategic Planning; CF = Customer Focus; PM = Process Management;
IA = Information and Analysis; HR = Human Resource Management; KA = Knowledge Acquisition; KAP = Knowledge Application; KD = Knowledge Distribution
5.6.5 Construct Validity
Hair et al. (2006) as cited in Chong (2008, p. 144) defined construct validity as “the
degree to which a set of measure items actually assess the identical construct”. In this
study, factor analysis with PCA and Varimax rotation was performed independently on
the core practices of TQM and KM in order to attain the dimensions of each construct as
well as to examine the construct validity (Hair et al., 2006). As indicated by the findings
in Table 5.6, all items have factor loadings exceeding the 0.50 recommended cut-off
value, further supporting the evidence of the factorability of the items and hence the

141
construct validity was duly determined (Hair et al., 1998). Similarly, construct validity
can also be unveiled by the Composite Reliability (CR) of the latent variable. Chau and
Hu (2001, p. 709) concurred that CR can be calculated by using the formula of “(Square
of the summation of the factor loadings)/{(Square of the summation of the factor
loadings) + (Summation of error variances)}”. Molina et al. (2007) has suggested that
the minimum value for CR is 0.70. Table 5.6 demonstrated that all CR values are in the
acceptable range. This is further emphasized by Nunnally (1978) and thus it may be
concluded that the measurement is reasonable.
5.6.6 Convergent Validity
Byrne (1994) as cited in Xie (2011, p. 194) stated that “convergent validity assesses the
degree to which dimensional measures of the same concept are correlated”. High
correlations indicate that the scale instrument is evaluating its proposed construct. Byrne
(1994) and Xie (2011) also stressed that items of the scale instrument should load
strongly on their common construct. Besides that CFA was also conducted to evaluate
the convergent validity of the measurement model based on three conditions
recommended by Fornell and Larcker (1981) as follows:
(1) All indicator factor loadings (λ) should be significant;
(2) CR is notated as ρ, with the criteria that composite reliability which is the
internal consistency of the indicator measuring the given factor, should exceed
0.60 (Bagozzi & Yi, 1988); and
(3) Average Variance Extracted (AVE) of every construct should be above 0.50
based on Kline (1998).

142
CR can be computed by the following formula: “(Square of summation of factor
loadings)/{(Square of summation of factor loadings) + (Summation of error
variances)}” (Chau and Hu, 2001, p. 709). Furthermore, AVE which “evaluates the total
of variance that is gained by the construct about the total of variance due to the
measurement error” (Xie, 2011, p. 195), can also be computed with the formula of
(Summation of squared factor loadings)/(Summation of squared factor loadings) +
(Summation of error variances) (Fornell & Larcker, 1981). The findings showed that all
λ values were well above the recommended value of 0.50 (Kline, 1998) whereas the CR
of each factor was: leadership = 0.883; strategic planning = 0.818; customer focus =
0.788; human resource management = 0.801; process management = 0.766 and
information and analysis = 0.750. As recommended by Molina et al. (2007) and shown
in Table 5.6, not only all scales are within the acceptable limits, but CR of all latent
constructs also exceeded the 0.7 cut-off value which implied that the measures are good,
hence, ensuring strong convergent validity. Moreover, AVE of each factor has exceeded
0.5, an indication that convergent validity and reliability are good (Table 5.6).
5.6.7 Discriminant Validity
According to Hair, Black, Babin, and Anderson (2010, p. 710), discriminant validity is
“the extent to which a construct is truly distinct from other constructs”. To evaluate the
discriminant validity test, the estimated correlations of the construct which highlight
sets of indicators anticipated to evaluate different constructs should not be too high (>
0.90) or low (< 0.10) (Hair et al., 1998; Lu, Yao, & Yu, 2005; Ooi et al., 2011). The
correlations estimated between the related constructs were shown in Table 5.6. As seen
in Table 5.6, the highest correlation coefficient value is 0.747 (strategic planning and
leadership) which is less than 0.90. Hence, it is confirmed that the discriminant validity
is acceptable (Jun, Cai, & Shin, 2006; Lin and Lee, 2004; Ooi et al., 2011).

143
For this study, discriminant validity is also examined through the comparison of the
square root of the AVE with the correlation coefficients between the constructs. Byrne
(1994) opined that discriminant validity is unveiled if the AVE of both constructs‟
values are higher than the square of the correlation. As presented in Table 5.6, all
unobserved variable‟s square root of AVE was larger than its correlation between every
pair of the latent variables. Hence, discriminant validity of all latent variables under
study was well recognized and acceptable (Fornell & Larcker, 1981; Kuo, Wu, & Deng,
2009; Schaupp, Carter, & McBride, 2010).
Table 5.6: Latent Constructs Correlation
LD CF IA PM HR SP KAP KA KD
LD 0.776
CF 0.632** 0.746
IA 0.584** 0.550** 0.708
PM 0.528** 0.557** 0.635** 0.723
HR 0.537** 0.509** 0.609** 0.556** 0.708
SP 0.747** 0.627** 0.568** 0.531** 0.518** 0.777
KAP 0.447** 0.472** 0.502** 0.485** 0.520** 0.534** 0.712
KA 0.386** 0.255** 0.444** 0.459** 0.448** 0.498** 0.464** 0.744
KD 0.415** 0.429** 0.494** 0.481** 0.475** 0.479** 0.659** 0.538** 0.710
AVEa 0.601 0.556 0.501 0.523 0.502 0.603 0.507 0.554 0.504
CRb 0.883 0.788 0.750 0.766 0.801 0.818 0.804 0.789 0.749
Notes: aAVE = (summation of squared factor loadings) / (Summation of squared factor loadings) + (summation of error variances)
(Fornell & Larcker, 1981); bCR = (square of summation of factor loadings) / (square of summation of factor loadings) + (summation of error variances) (Fornell & Larcker, 1981); **p<0.01; N = 203; LD = Leadership; CF = Customer Focus; IA
= Information and Analysis; PM = Process Management; HR = Human Resource Management; SP = Strategic Planning;
KAP = Knowledge Application; KA = Knowledge Acquisition; KD = Knowledge Distribution; Diagonal elements (bold) are the square root of the AVE for each construct. Off-diagonal factors demonstrate the inter-correlations
5.6.8 Nomological Validity
The aim of nomological validity is to seek and establish the associations between
theoretical constructs (Malhotra et al., 1996; Wong, 2002). Correlation matrix was
employed in order to examine the theoretically predicted correlations between the
research constructs (i.e. both independent and dependent variables) in the model. As
shown in Table 5.6, the correlation matrix has presented evidence of the nomological
validity for the research constructs of both independent and dependent variables
respectively. As can be seen, most of the constructs were significantly correlated at p-
value < 0.01. Therefore, these constructs were also deployed to examine the

144
multicollinearity problems. Since there were no factors with correlation values
exceeding 0.90 in Table 5.6, it can be concluded that there is no serious problem of
multicollinearity (Hair et al., 1998).
5.6.9 Criterion Validity
Criterion validity evaluates the extent to which the scale was conducted as expected
with respect to other variables (Malhotra et al., 1996; Wong, 2002). This kind of
validity can be evaluated in two ways, namely the concurrent and predictive validities.
However, predictive validity cannot be evaluated in this study since the data for the
measurement scale and criterion variable were gathered concurrently. Hence, concurrent
validity was examined and the findings in Table 5.6 clearly show the evidence of
concurrent validity for the research constructs of both independent and dependent
variables respectively since the direction and magnitude of the correlations between the
constructs were consistent to the expectations (Wong, 2002). In addition, all correlation
coefficients were significant at p < 0.01 level which are in accordance with the
predicted outcomes.
5.7 Chapter Summary
In summary, this chapter has presented the results of the reliability analysis and validity
tests. After the reliability analysis, factor analysis, and validity analysis had been
conducted, it was concluded that the TQM instruments and the instruments for
measuring KM are reliable and valid. The data obtained through these instruments can
be used for subsequent data analysis to test the theoretical model hypothesized and
research questions in this study.

145
CHAPTER 6
THE RELATIONSHIP BETWEEN TOTAL QUALITY
MANAGEMENT AND KNOWLEDGE MANAGEMENT
6.1 Introduction
This chapter describes the findings for the testing of the theoretical model hypothesized
in this study. Section 6.2 describes the SEM analysis for the model testing. Section 6.3
reports the overall fit of the structural equation model. Section 6.4 provides the results
for the testing of the association between TQM and KM. The relationships between
specific TQM practices and KM are given in section 6.5. Finally, Section 6.6
summarizes the findings of this chapter.
6.2 Structural Equation Modeling Analysis
Figure 6.1 depicts the research model that was examined using SEM. The SEM was
conducted by using the MLE procedure. MLE is one of the most popular methods and is
effective when the multivariate normality assumption has been fulfilled (Choi, 2010;
Hair et al., 1998).
In order to perform SEM, many researchers (Hair et al., 1998; Lin & Lee, 2004; 2005;
Sit et al., 2009) have recommended the two-stage process of modeling, whereby CFA is
tested before the testing of the structural model. There are three advantages of SEM.
Firstly, it provides a direct approach to manage relationships simultaneously; hence it is
able to provide statistical efficiency concurrently. This is not applicable in multiple
regression analysis. Secondly, SEM is able to examine comprehensively the
relationships between the observed and latent variables (Hoyle, 1995; Schaupp et al.,
2010). Therefore, it is able to shift from exploratory to confirmatory factor analysis.

146
Finally, SEM is also able to exhibit the concepts that are not observed through these
associations and justify the measurement error in the estimation process (Kline, 2001;
Prajogo and Cooper, 2010), which are not achievable in the multiple regression analysis.
Furthermore, by utilizing the SEM approach, it is able to provide full information on the
extent to which the research model is assisted by the data beyond the regression
approach. The conclusion is that a more accurate analysis of the proposed research
framework can be done and more often, it serves as a means of providing better
methodological evaluation (Bollen, 1989; Jimenez-Jimenez & Martinez-Costa, 2009;
Jöreskog & Sörbom, 1993). All of these are tasks that could be performed by SEM
approach. As recommended by several researchers (Lee et al., 2010; Lin & Lee, 2004;
2005), the assumptions of multivariate analysis should be first investigated before
conducting the SEM analysis, and this is followed by the examination of the structural
model. All these steps will be discussed in the following subsections.

147
TQM = Total Quality Management KM = Knowledge Management MLD = Mean of Leadership
LD = Leadership KA = Knowledge Acquisition MSP = Mean of Strategic Planning
SP = Strategic Planning KAP = Knowledge Application MCF = Mean of Customer Focus
CF = Customer Focus KD = Knowledge Distribution MPM = Mean of Process Management
HR = Human Resource Management MIA = Mean of Information and Analysis
PM = Process Management MHR = Mean of Human Resource Management
IA = Information and Analysis MKA = Mean of Knowledge Acquisition
MKAP = Mean of Knowledge Application
MKD = Mean of Knowledge Distribution
Figure 6.1: Relationship of TQM Practices and KM
TQM
MSP
1
MCF
MPM
MIA
MHR
1
1
1
1
1
1
1
1 1
KM
MKAP
N 1
MKA
1
1
MKD
1
1
MLD 1
1
e2
1
e3
e4
e5
e6
e7
e9
1
1
d1
e1
e8
1
LD
SP
CF
PM
IA
HR
KA
KAP
KD

148
6.2.1 Testing the Assumptions of Multivariate Analysis
Prior to the data analysis, both statistical assumptions as well as assumptions related to
the SEM sample size should be analyzed first (Fotopoulos & Psomas, 2009; Hair et al.,
2006; Lee et al., 2010; Lu et al., 2005). Hair et al. (1992) as cited by Forza and Filippini
(1998) had suggested a sample size of between 100 to 200 for SEM analysis. The
sample size of this study (N = 203) is within the acceptable range and hence can be
considered as sufficient and adequate.
Zhang (2000, p. 102) mentioned that SEM is “more sensitive to the distributional
characteristics of the data, particularly the departure from multivariate normality or a
strong kurtosis or skewness in the data”. On the other hand, Hair et al. (1992) as cited
by Zhang (2000) asserted that a lack of multivariate normality is particularly perturbing
since it can considerably inflate the chi-square statistics and yield an upward bias in the
critical values when determining significance of the coefficients. In this study,
normality test was performed using AMOS by integrating the Mahalanobis D2 distances
and also skewness and kurtosis. Generally, there are three indices to be adopted in
studying variable distribution (Finney & DiStefano, 2006; Xie, 2011). These include
univariate skewness, univariate kurtosis and multivariate kurtosis.
Even though there is no conventional cut-off values for univariate normality, Kline
(2005) has suggested that the absolute values of standardized skewness which are more
than 3 could be considered as highly skewed while absolute values of standardized
kurtosis which are greater than 8 may be problematic (Xie, 2011). As can be seen from
Table 6.1, majority of the variables are negatively skewed. In fact, the absolute value of
the skewness for the individual variable lies within the range of + 1 which is less than 3.
Furthermore, from the univariate and multivariate perspective (i.e. Mahalanobis

149
D2/number of independent variables < 3), the outliers were identified and removed from
the dataset. These basic assumptions of the multivariate model indicate that there were
no significant statistical violations. In general, it can be summarized that the univariate
normality test is satisfactory (Xie, 2011).
Another normality assumption of SEM is the need of continuous data with multivariate
normality. Small-sized sample or non-normally distributed variables may violate these
crucial assumptions. In fact, violations of multivariate normality can inflate the
computed chi-square statistics and also deflate the standard errors from a moderate to
severe degree (Xie, 2011). Despite of its significance, many prior studies have failed to
relate themselves with this assumption (Xie, 2011). In this study, the Bollen-Stine
bootstrap which was used as a multivariate normality test with p-value below 0.05 is
taken as the indicator of a non-normally distributed dataset. Table 6.1 demonstrated that
the p-value of the Bollen-Stine bootstrap is 0.935, which has exceeded the cut-off value
of 0.05. Thus, it implies that the model is of reasonably fit and without doubt, the
dataset is normally distributed (Byrne, 2001). Based on the above results, it can be
concluded that there is no statistically significant violations of the assumptions in this
model.
Table 6.1: Univariate Normality - Skewness and Kurtosis of Constructs
Variables Skewness Kurtosis
Leadership -0.544 -0.351
Customer Focus -0.384 -0.254
Information and Analysis -0.152 -0.581
Process Management -0.225 -0.408
Human Resource Management -0.437 0.229
Strategic Planning -0.319 -0.411
Knowledge Acquisition -0.407 -0.040
Knowledge Distribution -0.245 0.689
Knowledge Application -0.329 0.365 Note: p-value of Bollen-Stine bootstrap = 0.935 > 0.05

150
6.3 Overall Model Fit
The major issue in examining the theoretical framework is whether it is in conflict with
the reality as seen in the sample, i.e. how good is the theoretical model in fitting the
dataset (De Jong, 1999; Zhang, 2000). There are several indicators which are computed
by AMOS version 18 that can be utilized to examine the goodness of the model fit. As
suggested by Byrne (1998), Hair et al. (1992) and Jöreskog and Sörbom (1996),
generally, there are five measures to determine the goodness-of-fit. These include chi-
square statistics, the GFI, the AGFI, the RMSEA and the RMR.
The most fundamental measure of overall fit in a structural equation model is the
likelihood-ratio chi-square statistics. As suggested by Bagozzi and Yi (1988), a p-value
exceeding 0.05 and a normed chi-square value (χ2/df) that is below 3, are normally
considered as acceptable. They further asserted that goodness-of-fit indices such as GFI,
AGFI, CFI and NFI should be at least 0.90 to be considered as acceptable and to
indicate a good fit. While Byrne (1998) and De Jong (1999) mentioned that a RMSEA
value below 0.05 is considered as a good fit, values between 0.05 to 0.08 indicate a fair
fit. Finally, Browne and Cudeck (1993) suggested that a RMR value of not more than
0.08 implies a good fit.
6.4 The Relationship between TQM and KM
For this study, TQM is an abstract variable with six latent constructs whereby each
construct has several items associated to it (i.e. from three to five items for each
construct). Hence, with regard to RQ2, a CFA model with a second-order factor (Figure
6.1) was developed to examine the connections between the latent constructs in the
model (i.e. TQM and KM).

151
Several researchers (Hoang et al., 2006; Kaynak, 2003; Kline, 1998; Segars & Grover,
1998) concurred that besides the ratio of chi-square statistics to the degree of freedom
(χ2/df), there are five other goodness-of-fit measures to be used in evaluating the CFA‟s
model fit. These include the CFI, AGFI, GFI, NFI, RMSEA and the SRMR. It is
recommended that the χ2/df ratio should be less than 3 while the values for GFI, AGFI,
NFI and CFI should be at least 0.90. Moreover, the SRMR should be less than 0.10 and
RMSEA below 0.08. Based on the standardized estimates of the CFA model shown in
Figure 6.1 and the fit indices listed in Table 6.2, it is obvious that all of the
abovementioned requirements are fulfilled for both the measurement model and
structural relationship. In fact, to evaluate the latent constructs, all variables have high
factor loadings on their respective constructs and are statistically very significant (i.e. all
p-value < 0.01) (Hoang et al., 2006).
The standardized estimates of the structural model depicted in Figure 6.1 indicate that
TQM has a strong and positive impact on KM. Hence, with regard to RQ2, the findings
revealed that TQM as a latent construct has a positive relationship with KM.
Table 6.2: The Results of SEM on the Relationship between TQM Practices and KM
Second-order Latent Variable First-order Latent Variables Standardized Factor Loading
TQM Leadership 0.833
Strategic Planning 0.838
Customer Focus 0.800
Human Resource Management 0.703
Process Management 0.760
Information and Analysis 0.758
Exogenous Variable Endogenous Variable Structural Path
TQM KM 0.660
χ2/df = 1.156, p-value = 0.312; GFI = 0.987; AGFI = 0.946; NFI = 0.987; CFI = 0.998;
RMSEA = 0.028; SRMR = 0.0189 Notes: TQM = Total Quality Management; KM = Knowledge Management; GFI = Goodness-of-Fit Index; AGFI = Adjusted
Goodness-of-Fit Index; NFI = Normed Fit Index; CFI = Comparative Fit Index; RMSEA = Root Mean Square Error of Approximation; SRMR = Standardized Root Mean Square Residual

152
6.5 The Relationship between Specific TQM Practices and KM
SEM analysis was adopted to address RQ3 which is concerned with the influence of
specific TQM practices on KM. To achieve this, the hypotheses were tested. This study
allows the analysis of the effect of each TQM practices on KM. One approach that was
used in the previous studies has been adapted in this study (Lopez et al., 2006; Ooi et
al., 2011; Spreng, MacKenzie, & Olshavsky, 1996) i.e. where multidimensional
variables with many items were incorporated into the models. On the other hand, each
element of the KM factor was combined into one index. These indices are used as the
average score of the indicators from the result of the confirmatory measurement
framework. Every KM dimension, which was mentioned in the SEM as a factor with an
element, was also the index linking with this dimension. Lopez et al. (2006, p. 229)
mentioned “the error term of the items were set equal to the scale variance times 1
minus the reliability; thus the reliability of the construct is fixed at the value of the
composite reliability coefficients calculated in the previous confirmatory factor
analysis”. Alternatively, the constructs examining the TQM practices were
operationalized in the structural equation framework together with their indicators as
they were in the confirmatory measurement framework. The exact framework shown in
Figure 6.2 also provides the fit indices and the standardized path coefficient β.

153
TQM = Total Quality Management KM = Knowledge Management MLD = Mean of Leadership
LD = Leadership KA = Knowledge Acquisition MSP = Mean of Strategic Planning
SP = Strategic Planning KAP = Knowledge Application MCF = Mean of Customer Focus
CF = Customer Focus KD = Knowledge Distribution MPM = Mean of Process Management
HR = Human Resource Management MIA = Mean of Information and Analysis
PM = Process Management MHR = Mean of Human Resource Management
IA = Information and Analysis MKA = Mean of Knowledge Acquisition
MKAP = Mean of Knowledge Application
MKD = Mean of Knowledge Distribution
Figure 6.2: Structural Model of the Relationship between TQM Practices and KM
TQM
MSP
1
MCF
MPM
MIA
MHR
1.00
1
1.00
1
1
1.00
1.00
1.00 1
KM
MKAP
N 1.00
MKA
1
1.00
MKD
1
1.00
MLD 1.00
1
e2
1
e3
e4
e5
e6
e7
e9
1.00
1.00
d1
e1
e8
1
0.42
0.92
0.87
0.82
0.71
0.72
0.63
0.55
0.51
0.16
0.17
0.24
0.19
0.14
-0.27
-0.00
-0.01
0.35
-0.01
0.19
0.13
-0.11
0.40
0.41
-0.01
0.23
0.88
0.97
0.15
0.47
0.11
0.45
0.11
0.57
LD
SP
CF
PM
IA
HR
KA
KAP
KD
0.41

154
6.5.1 The Structural Model
Table 6.3 shows the overall result of the structural model study. Based on the chi-square
ratio (ratio of χ2
statistic to the degree of freedom (df) = 0.474; p-value = 0.908 > 0.05)
that is less than 3.0 as recommended by Bagozzi and Yi (1988) and other fit indices
(GFI = 0.995; AGFI = 0.976; CFI = 1.000; NFI = 0.995), the recommended cut-off
value of 0.90 has been exceeded (Anderson & Gerbing, 1988). Moreover, the RMSEA
= 0.000 is below 0.08 and RMR = 0.010 is below 0.1 as suggested by Browne and
Cudeck (1993). This indicates that the model has a good fit to the dataset. Since all fit
indices have met their individual common acceptable values, this verifies that an
acceptable fit of the structural model with the dataset (Bagozzi & Yi, 1988; Browne &
Cudeck, 1993; Hoang et al., 2006; Lin & Lee, 2005; Sit et al., 2009).
Table 6.3: Measures of the Model Fit
Goodness of
Fit Measures
χ2 test
statistics/df p-value GFI AGFI CFI NFI RMSEA RMR
Recommended
Value ≤ 3.00
a > 0.05
a ≥ 0.90
a ≥0.90
a ≥ 0.90
a ≥ 0.90
a ≤ 0.08
b ≤ 0.1
c
Structural
Model 0.474 0.908 0.995 0.976 1.000 0.995 0.000 0.010
Note: N = 203; GFI = Goodness-of-Fit Index; AGFI = Adjusted Goodness-of-Fit Index; CFI = Comparative Fit Index; NFI = Normed Fit Index; RMSEA = Root Mean Square Error of Approximation; RMR = Root Mean Square Residual
Sources: aBagozzi and Yi (1988); Anderson and Gerbing (1988); bBrowne and Cudeck (1993); cHoang et al. (2006)
6.5.2 Testing Research Hypotheses
In the stage of hypotheses testing, validity of the hypothesized path is verified by
evaluating the statistical significance of each structural parameter value. Based on the
set of result (Table 6.4), it was verified that strategic planning (β = 0.351, p < 0.01),
human resource management (β = 0.236, p < 0.01), process management (β = 0.192, p <
0.01) and information and analysis (β = 0.170, p < 0.05), were found to be significant
and positively associated to KM. Hence, hypotheses H2, H4, H5 and H6 were accepted.
On the other hand, customer focus (β = -0.268, p < 0.01) was found negatively related
to KM. However, leadership (β = -0.010, p > 0.05) was found to have insignificant

155
relationship with KM, and therefore, H1 and H3 were not supported. The results of the
hypothesis testing are shown in Table 6.4. Thus, with regard to RQ3, the findings of the
study revealed that H2 (strategic planning), H4 (human resource management), H5
(process management) and H6 (information and analysis) were found to have strong and
positive influence on KM. Meanwhile, H3 (customer focus) was found to have strong
and negative effect on KM. The findings also unveiled that strategic planning and
human resource management are the most imperative predictors of KM.
Table 6.4: Hypothesis Testing Results
Hypothesis Path Estimate Std. Error Critical Ratio p-value Remarks
H1 LD KM -0.010 0.063 -0.162 0.871 Not supported
H2 SP KM 0.351 0.069 5.059 0.000** Supported
H3 CF KM -0.268 0.088 -3.034 0.002** Not supported
H4 HR KM 0.236 0.063 3.771 0.000** Supported
H5 PM KM 0.192 0.060 3.178 0.001** Supported
H6 IA KM 0.170 0.075 2.282 0.022* Supported Notes: N = 203; ** p < 0.01; *p < 0.05; LD = Leadership; SP = Strategic Planning; CF = Customer Focus; HR = Human Resource
Management; PM = Process Management; IA = Information and Analysis; KM = Knowledge Management
6.5.3 Indirect Effects of Individual TQM Dimensions on Each KM Practices
In order to examine the effects of individual TQM dimensions on the KM practices, the
standardized indirect effects were estimated. The significance of the indirect effect is
determined using the Bias-corrected (BC) two-tailed percentile method with
bootstrapping. As shown in Table 6.5, customer focus, process management, human
resource management, strategic planning, information and analysis have significant
indirect effects on knowledge acquisition, knowledge application and knowledge
distribution. However, the result shows that there is no significant indirect effect of
leadership on all the KM practices (knowledge acquisition, knowledge distribution and
knowledge application). In terms of the effect on knowledge application, strategic
planning has the strongest effect followed by customer focus, human resource
management, process management and information and analysis. Hence, when more
effort is given to strategic planning, this will trigger more endeavors to adopt knowledge
application. A unit of increase in strategic planning will bring about an increment of

156
0.392 units in knowledge application practices. Interestingly, the result reveals that
customer focus has a negative significant effect on knowledge application. This may
happen as a result of less effort being put in knowledge application when the attention is
given in sustaining customer focus. The more time and effort spent on customer focus,
will lead to less concentration in applying the knowledge due to the constraints of time
and resources. From the knowledge acquisition perspective, strategic planning has the
strongest indirect effect followed by customer focus, human resource management,
process management and information and analysis. In fact, a unit of increment in
strategic planning will lead to an increase of 0.358 in the knowledge acquisition
practices. Surprisingly, customer focus was found to have a negative significant indirect
effect on knowledge acquisition. The justification may be that when more time and
attention are given to customer focus, the momentum to strive for knowledge
acquisition tends to slow down due to the lack of time and resources. Finally, from the
viewpoint of knowledge distribution, the result reveals that strategic planning also has
the strongest indirect effect on knowledge distribution and this is trailed by customer
focus, human resource management, process management and information and analysis.
Basically, a unit of increment in strategic planning will generate 0.365 increments in
knowledge distribution practices. Similarly, customer focus was found to have a
negative significant indirect effect on knowledge distribution. The argument may be the
lack of time and resource due to the vast attention and focus given to customer focus.
Generally, the impact of the indirect effects of the TQM dimensions on the KM
practices follows the order of strategic planning, human resource management, process
management and information and analysis (in descending order). Therefore, more
attention and consideration should be given to strategic planning in order to raise the
adoption of KM practices.

157
Table 6.5: Standardized Indirect Effects
MLD MCF MIA MPM MHR MSP
MKAP -0.012
(0.949)
-0.286*
(0.026)
0.178*
(0.015)
0.204**
(0.007)
0.237*
(0.011)
0.392**
(0.006)
MKA -0.011
(0.929)
-0.261*
(0.020)
0.162*
(0.020)
0.187**
(0.008)
0.216*
(0.012)
0.358**
(0.008)
MKD -0.011
(0.969)
-0.267*
(0.023)
0.165*
(0.019)
0.190**
(0.006)
0.220**
(0.008)
0.365**
(0.007) Notes: *p < 0.05; **p < 0.01; Bias-corrected (BC) two-tailed significance is shown in bracket; MLD = Mean of Leadership;
MCF = Mean of Customer Focus; MIA = Mean of Information and Analysis; MPM = Mean of Process Management;
MHR = Mean of Human Resource Management; MSP = Mean of Strategic Planning; MKAP = Mean of Knowledge
Application; MKA = Mean of Knowledge Acquisition; MKD = Mean of Knowledge Distribution
6.6 Chapter Summary
This chapter has presented the results of the data analysis and research findings of the
relationship between TQM practices and KM. Multivariate analyses such as CFA and
SEM analysis were performed in order to answer the second (RQ2) and third (RQ3)
proposed research questions and six hypotheses. The findings revealed that TQM has a
strong and significant positive impact on KM. A one unit increase in TQM dimensions
will contribute 0.660 unit of increase in the KM practices (Table 6.2). However, not all
dimensions of TQM were equally important as the findings showed that strategic
planning (β = 0.351, p < 0.01) has the greatest impact on KM followed by human
resource management (β = 0.236, p < 0.01), process management (β = 0.192, p < 0.01)
and of the least importance is information and analysis (β = 0.170, p < 0.05). Therefore,
H2 (strategic planning), H4 (human resource management), H5 (process management)
and H6 (information and analysis) were all statistically supported and the dimensions
related to the hypotheses were found to have significant and positive effect on
improving KM. However, H1 was not supported and leadership was found to have
insignificant impact on KM. Customer focus (H3) was found negatively related to KM
and thus H3 was not supported.

158
CHAPTER 7
COMPARATIVE ANALYSIS ON MANUFACTURING AND
SERVICE FIRMS
7.1 Introduction
This chapter presents a comparative analysis on the multidimensionality of TQM
practices, and the structural relationship of these practices with KM between the
manufacturing and service sectors.
Section 7.2 describes the Multiple Group Comparison Analysis to determine the
difference in the relationship of TQM practices and KM between the manufacturing and
service sectors. Section 7.3 presents the MGA for testing whether the effect of each path
of the relationship is the same for both manufacturing and service sectors, while the last
section elucidates the multiple group structural modeling analysis conducted to address
the predictive power of the TQM practices on KM.
7.2 Multiple Group Comparison
Multiple group comparison analysis was performed to determine whether there is any
significant statistical difference in the relationship of TQM practices and KM among the
firms in the manufacturing and service sectors as stated in the research question, RQ4:
“Is there any significance difference between the manufacturing and service sectors in
terms of TQM linkages with KM behavior?”

159
7.2.1 Comparison of TQM Practices and KM
In order to compare the mean difference between the two sectors, latent mean scores
were utilized when conducting the t-test. As shown in Table 7.1, significant differences
at p < 0.05 level exist in the leadership, customer focus, human resource management
and process management of the TQM dimensions whereby the service sector has
outperformed the manufacturing sector. On the other hand, there were no significant
differences for all the indicators of KM construct in both sectors statistically. Hence, in
response to RQ4, the result implies that there is a significant difference between
manufacturing and service firms in terms of TQM practices except for strategic
planning and information and analysis. Nevertheless, the results from this analysis is
inconsistent with the findings by previous researchers such as Beaumont et al. (1997),
Cheah et al. (2009) and Prajogo (2005) who found that there was no significant
difference in the TQM practices between the manufacturing and service firms. This
analysis also found that there is no significant difference in knowledge acquisition,
knowledge distribution and knowledge application between manufacturing and service
firms. The results are consistent with the findings from the previous study conducted by
Cheah et al. (2009) in which no difference was found in terms of knowledge sharing
between the two sectors.
Table 7.1: Group Statistics for Manufacturing and Service Sector with the Latent Mean
Comparison Results
Variables
Manufacturing Sector
(N=127)
Service Sector
(N=76) Difference of Latent
Mean Mean SD Mean SD
SP 4.92 1.04 5.16 1.15 0.24
LD 4.71 1.10 5.03 1.21 0.32*
CF 5.05 0.98 5.44 1.10 0.39*
HR 4.94 0.95 5.26 0.99 0.32*
PM 4.76 1.01 5.15 1.04 0.39*
IA 4.92 1.00 5.18 1.03 0.26
KA 4.81 0.98 5.08 1.09 0.27
KAP 5.00 0.96 5.04 0.99 0.04
KD 4.73 0.93 4.95 0.87 0.22 Notes: N = 203; * significant at p < 0.05; LD = Leadership; SP = Strategic Planning; CF = Customer Focus; HR = Human
Resource Management; PM = Process Management; IA = Information and Analysis; KA = Knowledge Acquisition; KAP
= Knowledge Application; KD = Knowledge Distribution

160
7.3 Test of Sector-invariance of the Measurement Model
MGA was performed to investigate research question five, RQ5: “Is there any
difference in the modeling of the constructs validity of TQM between manufacturing and
service firms?” in order to determine whether there is any significant difference in the
modeling of TQM‟s constructs validity between manufacturing and service firms.
The procedure of MGA was developed by Jöreskog and Sörbom (1993). In general, the
steps include determining whether the two groups of manufacturing and service sectors,
when subjected to similar model of relationship are indeed invariant (identical). This is
followed by the identification of differences, if any, from three perspectives, namely the
measurement model, structural relationships and error variances.
In fact, MGA with SEM is able to provide a stronger basis for cross-validation in order
to examine the size of the effect of each path for both sectors. The chi-square difference
( ) between the equality constrained model (where all factor loading were constrained
as equal) and the original model which is unconstrained will determine whether
invariance exists. If the difference in chi-square statistics ( 2 ) between the original
and the constrained models is less than the critical value (2
05.0 ) based on the difference
in degree of freedom ( df ) of the chi-square test then it can be confirmed that there is
no group variance and the model is robust across both groups of manufacturing and
service sectors. Moreover, as depicted in Table 7.2, the MGA of the measurement
model has unveiled that there is no significant difference between both groups.
Therefore, most of the TQM constructs measured in this study are applicable in both
sectors. It also provides a good basis for further group-invariant analysis of the
structural model (Feng, Prajogo, Tan, & Sohal, 2006).
2

161
Table 7.2: Summary of Group-invariance Test of Measurement Model of Manufacturing and
Service Sectors
Original model without imposing equality constrains
Model with
equality
constrains
imposed
Difference
between original
and constrained
models
2
05.0
critical
value
Group
variance 2
ingManufactur
(df)
2
Service
(df) 2 df
2 df 2 df
5.371(5) 2.217(4) 7.588 9 23.85 20 16.262 11 19.675 NS Note: NS = Not Significant
7.4 Multiple Group Analysis of Structural Model
To investigate research question six, RQ6: “Are there any significance difference in the
predictive power of TQM practices on KM between the manufacturing and service
sectors?”, the multiple group SEM approach was also conducted in order to determine
the overall differences in the predictor power of TQM practices on KM between the
manufacturing and service sectors. The SEM model entails two parts i.e. the
measurement and structural relationship model. The measurement model consists of six
dimensions of the TQM practices which are measured by six observed variables i.e.
leadership, strategic planning, customer focus, human resource management, process
management and information and analysis whereas KM was measured by three
observed variables i.e. knowledge acquisition, knowledge distribution and knowledge
application.
7.4.1 Multiple Group Measurement Model Test
In order to determine the goodness-of-fit of the measurement model, eight fit indices
were calculated in the SEM analysis, namely the normed chi-square, p-value, GFI, CFI,
Incremental Fit Index (IFI), Tucker and Lewis Index (TLI), RMSEA and SRMR. As
demonstrated in Table 7.3, all of these fit indices (i.e. GFI, CFI, IFI and TLI) for both
groups were well above the cut-off values of 0.90 as recommended by Bagozzi and Yi
(1988) and Arbuckle (2008), whereas the χ2
test statistic/df, RMSEA and SRMR were
well below the suggested cut-off values of 3 (Bagozzi & Yi, 1988), 0.08 (Browne &
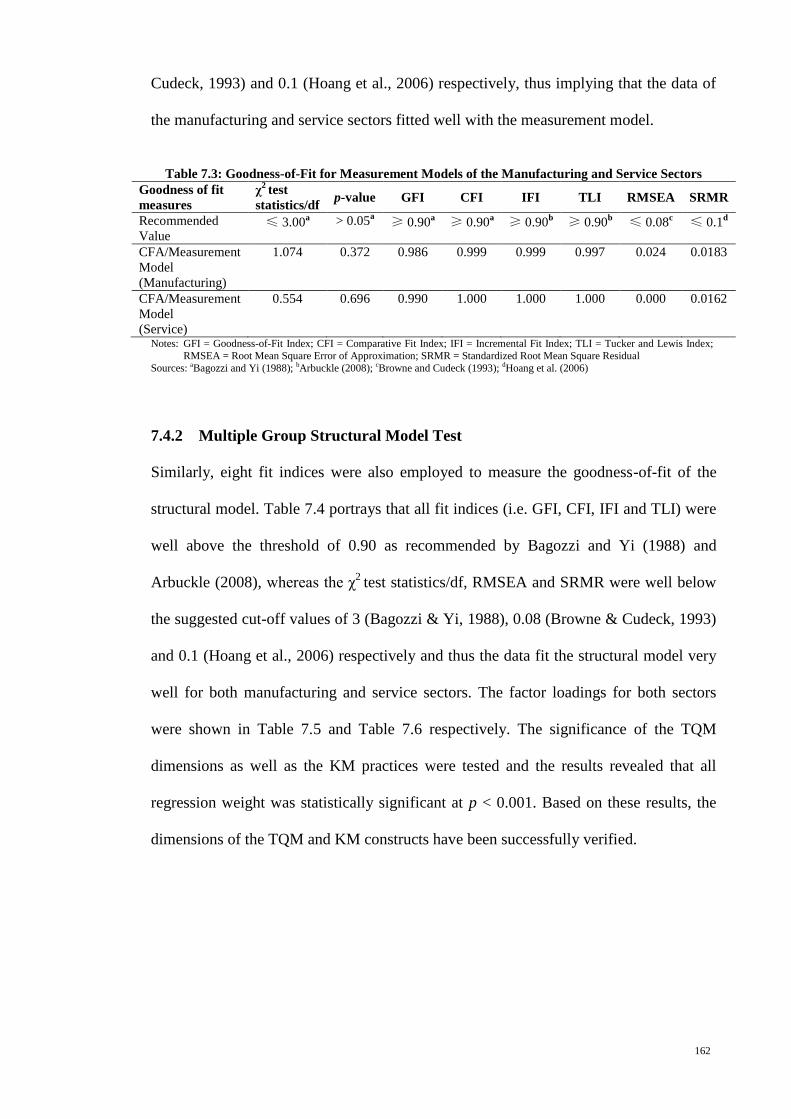
162
Cudeck, 1993) and 0.1 (Hoang et al., 2006) respectively, thus implying that the data of
the manufacturing and service sectors fitted well with the measurement model.
Table 7.3: Goodness-of-Fit for Measurement Models of the Manufacturing and Service Sectors
Goodness of fit
measures
χ2 test
statistics/df p-value GFI CFI IFI TLI RMSEA SRMR
Recommended
Value ≤ 3.00
a > 0.05
a ≥ 0.90
a ≥ 0.90
a ≥ 0.90
b ≥ 0.90
b ≤ 0.08
c ≤ 0.1
d
CFA/Measurement
Model
(Manufacturing)
1.074 0.372 0.986 0.999 0.999 0.997 0.024 0.0183
CFA/Measurement
Model
(Service)
0.554 0.696 0.990 1.000 1.000 1.000 0.000 0.0162
Notes: GFI = Goodness-of-Fit Index; CFI = Comparative Fit Index; IFI = Incremental Fit Index; TLI = Tucker and Lewis Index;
RMSEA = Root Mean Square Error of Approximation; SRMR = Standardized Root Mean Square Residual
Sources: aBagozzi and Yi (1988); bArbuckle (2008); cBrowne and Cudeck (1993); dHoang et al. (2006)
7.4.2 Multiple Group Structural Model Test
Similarly, eight fit indices were also employed to measure the goodness-of-fit of the
structural model. Table 7.4 portrays that all fit indices (i.e. GFI, CFI, IFI and TLI) were
well above the threshold of 0.90 as recommended by Bagozzi and Yi (1988) and
Arbuckle (2008), whereas the χ2
test statistics/df, RMSEA and SRMR were well below
the suggested cut-off values of 3 (Bagozzi & Yi, 1988), 0.08 (Browne & Cudeck, 1993)
and 0.1 (Hoang et al., 2006) respectively and thus the data fit the structural model very
well for both manufacturing and service sectors. The factor loadings for both sectors
were shown in Table 7.5 and Table 7.6 respectively. The significance of the TQM
dimensions as well as the KM practices were tested and the results revealed that all
regression weight was statistically significant at p < 0.001. Based on these results, the
dimensions of the TQM and KM constructs have been successfully verified.

163
Table 7.4: Goodness-of-Fit for Structural Models of the Manufacturing and Service Sectors
Goodness of fit
measures
χ2 test
statistics/df p-value GFI CFI IFI TLI RMSEA SRMR
Recommended
Value ≤ 3.00
a > 0.05
a ≥ 0.90
a ≥ 0.90
a ≥ 0.90
b ≥ 0.90
b ≤ 0.08
c ≤ 0.1
d
Structural Model
(Manufacturing)
0.921 0.535 0.978 1.000 1.000 1.000 0.000 0.0215
Structural Model
(Service)
1.140 0.316 0.951 0.995 0.995 0.987 0.043 0.0340
Notes: GFI = Goodness-of-Fit Index; CFI = Comparative Fit Index; IFI = Incremental Fit Index; TLI = Tucker and Lewis Index; RMSEA = Root Mean Square Error of Approximation; SRMR = Standardized Root Mean Square Residual
Sources: aBagozzi and Yi (1988); bArbuckle (2008); cBrowne and Cudeck (1993); dHoang et al. (2006)
Table 7.5: Regression Weights (Manufacturing Sector)
Estimate S.E. C.R. p
TQMLD 0.922 0.082 11.180 0.000
TQMSP 0.967 0.074 13.121 0.000
TQMCF 0.703 0.078 8.996 0.000
TQMPM 0.573 0.086 6.692 0.000
TQMHR 0.545 0.080 6.772 0.000
TQMIA 0.619 0.083 7.491 0.000
KM KA 1.000 N/A N/A N/A
KM KAP 1.079 0.141 7.761 0.000
KM KD 1.035 0.133 7.762 0.000 Notes: AB indicates regression weight of B on A; S.E. = Standard error, C.R. = Critical ratio; N/A = Not Applicable; TQM =
Total Quality Management; LD = Leadership; SP = Strategic Planning; CF = Customer Focus; PM = Process
Management; HR = Human Resource Management; IA = Information and Analysis; KM = Knowledge Management; KA = Knowledge Acquisition; KAP = Knowledge Application; KD = Knowledge Distribution
Table 7.6: Regression Weights (Service Sector)
Estimate S. E. C. R. p
TQMLD 1.039 0.116 8.937 0.000
TQMSP 0.854 0.117 7.275 0.000
TQMCF 0.861 0.109 7.923 0.000
TQMPM 0.747 0.110 6.782 0.000
TQMHR 0.700 0.104 6.705 0.000
TQMIA 0.768 0.107 7.203 0.000
KM KA 1.000 N/A N/A N/A
KM KAP 1.220 0.255 4.788 0.000
KM KD 0.924 0.202 4.579 0.000 Notes: AB indicates regression weight of B on A; S.E. = Standard error, C.R. = Critical ratio; N/A = Not Applicable; TQM =
Total Quality Management; LD = Leadership; SP = Strategic Planning; CF = Customer Focus; HR = Human Resource
Management; PM = Process Management; IA = Information and Analysis; KM = Knowledge Management; KA = Knowledge Acquisition; KAP = Knowledge Application; KD = Knowledge Distribution

164
7.4.3 Multiple Group Invariance Analysis of the Structural Model
The final structural model was examined for its group-invariance by constraining all
paths to be equal across both groups of manufacturing and service sectors. By
comparison of the chi-square statistics ( ) for the original and the constrained
structural model (Table 7.7), the findings revealed that there were no significant
differences. Thus, the final structural model is indeed group-invariant across both
sectors.
Table 7.7: Summary of Group-invariant Test of Structural Model of Manufacturing and
Service Sectors
Original model without imposing equality
constrains
Model with
equality
constrains
imposed
Difference
between original
and constrained
models
2
05.0
critical
value
Group
variance 2
ingManufactur
(df)
2
Service
(df) 2
df
2 df 2 df
12.896(14)
15.961(14) 38.792 28 56.871 48 18.079 20 31.410 NS Note: NS = Not Significant
Based on the SEM results, two essential findings were derived. Firstly, the two groups
of manufacturing and service sectors did not demonstrate any significant differences in
their measurement models. Therefore, with respect to RQ5, there is no significant
differences between the two groups‟ construct validity of the TQM practices. Secondly,
the structural relationship models for both groups also depicted no significant
differences thus supporting the criterion validity of the relationship between TQM and
KM in both sectors. Besides, the results also verified the content of MBNQA conditions
which signify the TQM construct across industries, i.e. manufacturing and service
sectors in this study. The findings of this study are in agreement with the work of
Prajogo (2005).
2

165
Hence, with respect to RQ6, the findings have indicated that there were no significant
differences between the manufacturing and service sectors in terms of the causal
relationships between TQM and KM practices. Generally, this study has confirmed that
the TQM-KM model is robust across different sectors. The robustness is not only
limited to its content, but also its significance and deep impact on KM practices in
organizations.
7.5 Chapter Summary
In this chapter, MGA was performed in order to answer the remaining three proposed
research questions, namely RQ4, RQ5 and RQ6. The measurement and structural
models have been statistically verified to be invariant across both manufacturing and
service sectors through the use of the MGA. The relationships among the items and
their respective constructs were also found to be stable or consistent among the two
groups. The fit of both measurement and structural models were also found to be very
good based on the goodness-of-fit indices. The thorough discussion of the outcomes
obtained in this chapter and their impact on the research questions and implications,
limitations and future research will be further explained in the final chapter of this
thesis, which is Chapter 8.
166
CHAPTER 8
CONCLUSIONS AND IMPLICATIONS OF STUDY
8.1 Introduction
In this final chapter, discussion on the findings of the research is provided. This research
focused on the field of TQM and the implications of both theoretical and managerial
perspectives were gathered. The contribution to the body of knowledge in terms of
theory is highlighted. The practical usefulness of the results is presented under the
discussion of managerial implications in section 8.3. The research shortcomings in this
study are explained and cautioned. Future studies to further improve the knowledge on
TQM and KM are also proposed.
8.2 Discussion of the Findings
According to the analysis in Chapter 5, the sections below will discuss the findings on
the six research questions and the six research hypotheses. The findings of each
hypothesis and research questions are summarized from Chapters 5 to 7.
8.2.1 Discussion of Findings – Research Question One
The first question (RQ1) – “What are the key TQM practices that should be adopted,
which are relevant for the measurement of KM?” requires a detailed analysis of
practices in different industries within the same country, Malaysia. With the purpose of
responding to the above question, an extensive literature review has identified the key
practices of TQM that have helped to provide an in-depth understanding of TQM
practices. The framework adopted by Samson and Terziovski (1999) as cited by Prajogo
(2005) was adapted to signify the main TQM constructs in this research especially for
the reason that it was applied in the largest study of Australian companies to date.

167
Furthermore, Samson and Terziovski argue that their framework contains the conditions
of the MBNQA characteristics that are identified as shown by a few scholars including
Ahire et al. (1995), Curkovic et al. (2000), Evans and Lindsay (1999), Juran (1995) and
Prajogo (2005). Additionally, the MBNQA framework is suitable for the industries of
manufacturing and services. The difference of the level of TQM practices in the
organizations between these two industries is likely to be compared (Curkovic et al.,
2000; Prajogo, 2005). TQM in this research was formulated as six constructs, in which
it is a set of independent or also known as exogenous variables, and they were derived
from the MBNQA framework. The MBNQA model comprised of six dimensions of
organizational practices and one criterion of organizational performance. MBNQA
possesses many characteristics that other quality awards such as Prime Minister Quality
Award (PMQA) and Quality Management Excellence Award (QMEA) try to emulate
(Ministry of International Trade and Industry, 1998; National Productivity Centre,
1993). Furthermore, the MBNQA framework also includes both soft and hard elements
of TQM (Vouzas & Psychogios, 2007). They are also used in both developing and
developed countries in their management practices (Samson & Terziovski, 1999) and by
many famous researchers to justify the selected TQM practices in their respective model
framework (Choi & Eboch, 1998; Samson & Terziovski, 1999). To apply TQM could
be just an adoption of these six practices via a set relevant technique.

168
8.2.2 Discussion of Findings – Research Question Two
With regard to the second research question (RQ2) – “Do TQM practices have an
influence on KM on Malaysian firms?”. Our findings for Malaysia indicate that TQM
significantly and positively influence the level of KM. The arguments from the
literature were clearly supported by our findings of a positive relationship between
TQM and KM. The result confirms findings from the studies in the past (Hsu & Shen,
2005; Janpan et al., 2006; Lee & Asllani, 1997; Molina et al., 2004). In summary, the
TQM practices, based on the MBNQA framework, have portrayed a positive association
with KM. Using SEM analysis, this study shows that strategic planning has the
strongest association with KM.
8.2.3 Discussion of Findings – Research Question Three
In response to RQ3 – “Which key practices of TQM are more significant and positive
towards KM in the Malaysian firms”, six hypotheses were established to examine
whether the dimensions of TQM, i.e. customer focus, information and analysis, process
management, human resource management, leadership and strategic planning were
significantly related to KM within the organizations in Malaysia. The overall
hypotheses testing results obtained from the structural analysis have shown that four of
the six dimensions have a positive effect on KM in Malaysian firms, while the
remaining practice, leadership and customer focus do not have a significant impact on
KM. The findings of each hypothesis of RQ3 are discussed in the following subsections.

169
8.2.3.1 Hypothesis 1 – Relationship of Leadership and KM
The initial conclusion that can be derived from this research is that leadership, being
one of the TQM constructs, has demonstrated an insignificant impact on KM among the
companies within Malaysia. This result indicates that top management has not
dynamically taken part in the knowledge management and worse, they even deterred
attempts to participate in the KM activities. Our research outcomes are inconsistent with
the results of Martinez-Costa and Jimenez-Jimenez (2008). Their study offers an
obvious signal which suggests leadership does promote learning in a company for the
organizations in Spain. Furthermore, this finding does not correspond with the works
carried out by Bryant (2003), Davenport and Volpel (2001) and Lin and Lee (2004), in
which leaders are portrayed as the drivers of knowledge exchange among workers in a
company, which can guide a company to develop further. This result is also inconsistent
with Greengard (1998) and Guns and Valikangas (1998) in which a strong support and
involvement from the top management is needed to initiate the KM programme and to
ensure its success. Furthermore, MacNeil (2001) believes that managers have the
capability to cultivate a knowledge sharing culture in which employees are not
constrained to share their explicit and implicit knowledge with others. Through such
cultivation, it is alleged that employees can thrive in both their skills and expertise,
benefiting the organization as a whole. In addition, a leader who encourages distribution
of knowledge amongst staff via various media platforms, teleconferencing, weekly
meetings, and official or unofficial chats, gives confidence and forums for workers to
join and share their ideas more openly. Besides, knowledge sharing assists a firm to
make better decisions, thus having an upper hand over other organizations. Our findings
contradict with the results of Arnold et al. (2000) which suggest lack of commitment
from leaders in cultivating a KM culture will build communication barriers among
employees and departments. This would prevent knowledge from flowing among the

170
various organizational units and levels, resulting in an inability to produce goods and
providing services that is of superior quality. As can be seen from the literature, senior
managers need to actively be involved in quality management and improvement
process, amidst encouraging change and implementation of KM activities. Managers of
the sampled firms need to ensure that sufficient resources are to be provided to the staff
for training and education purposes to show that they share the same belief about the
future direction of the company. By doing so, only then can the acquisition, distribution
as well as application of knowledge be properly executed to ensure the success of KM.
8.2.3.2 Hypothesis 2 – Relationship of Strategic Planning and KM
Strategic planning has been illustrated to affect KM among the companies in Malaysia.
Consistent to our result, Wong (2005) who studied on the small medium enterprises
discovered that strategic planning has demonstrated to be one of the critical success
determinants for KM to occur within a company. The author shared the view that a
vision that is simply comprehended and accomplished provides confidence to the
employees to be more involved in assisting the organization to accomplish its goals and
objectives. The result is also in line with Liebowitz‟s (1999) study, whereby the writer
suggested with a complete strategic planning that features sufficient KM, it leads the
organization to distribute its scarce resources and wastage could be reduced. This result
stressed on the fact that a clear mission statement communicated to all in the
organization can stimulate the partaking among workers to cultivate the practice of KM,
and this ultimately assists in the accomplishment of company set goals, objectives and
visions. This finding is in line with Carlucci and Schiuma (2006), whereby knowledge
sharing is best incorporated in an organization‟s strategy. In contrast with Safa, Shakir,
and Ooi‟s (2006) study, whereby the management of knowledge is not greatly
considered as a vital determinant in strategy implementation for the non-governmental

171
organizations (NGOs) in Maldives, the finding of their research implied that there is no
apparent strategy for these companies to keep their knowledge or a set vision to handle
knowledge at their workplace. As concluded from the findings given in this study, when
the vision of a company integrates with the activities of KM, coupled with a structured
plan that permits workers to obtain new ideas, share the best practices among various
departments, and transfer knowledge will allow knowledge to move freely among
various levels within the organization and provides the organization the capability to
churn out products and services that are of top quality.
8.2.3.3 Hypothesis 3 – Relationship of Customer Focus and KM
It was revealed in our results that customer focus has a negative influence in improving
the KM activities among workers in Malaysian companies. Interestingly, the result
reveals that customer focus has a negative significant effect on KM. In other words, the
more time and effort being focused on customers‟ needs, the less it will be in managing
the knowledge due to the constraints of time and resources. In addition, this
phenomenon may be caused by the continuous change in the customers‟ demands due to
the „law of dynamism‟ which occurred in recent years. As customers‟ wants and desires
are rapidly changing, companies are finding it hard to keep track of every customer‟s
demand as each is unique and one of kind. The surmountable requests made by the
customers in turn may deter many firms from learning their customers as this requires
extra time, efforts and resources from the firm itself, hence having a negative effect on
knowledge management. Our research result has been found to be inconsistent with the
study of Waddell and Stewart (2008), where they concluded that organizations are
encouraged to obtain information from customer so as to manufacture products that are
in line with customers‟ desires. Previous research by Lee et al. (2001) also validates the
findings from Waddell and Stewart (2008), where stronger relationships are required to

172
be developed between organizations and customers so that the information about
customers liking can be obtained to build better quality goods. Our research findings
also contradicts with the research conducted by Ju et al. (2006) that indicated the spread
of customers‟ feedbacks among the staff provides a chance for the organization to
obtain a competitive edge. Through the review of past literatures, the studies have
shown that by making customer focus their main concern, companies value the
feedbacks and suggestions provided by the customers, and in striving to retain a close
relationship with them, these companies will manufacture products and render services
that exceed customer expectations. Hence, managers of the Malaysian ISO firms should
look into allocating their resources wisely to take advantage of managing their
customers‟ needs in order to improve their management of knowledge within the
company. With that, competitive advantage can be achieved. In order to accomplish
this, members in a company, especially the front liners who deal with the customers
every day, are required to constantly obtain information from consumers, and from
there, distribute the knowledge to the various levels of the company. By doing so, they
will be able to manufacture products that fulfill the specifications of the users and
emerge as leaders in their own industry.
8.2.3.4 Hypothesis 4 – Relationship of Human Resource Management and KM
The finding from this empirical research study also shows that human resource
management is also a vital determinant of KM. This signified that company-wide
training programs for all workers working in Malaysian companies encourage the
distribution of knowledge within the company itself, in which it gives an opportunity for
staff to acquire new insights that can be shared together. This finding in this study is
similar to the results of Soliman and Spooner (2000) in which effective human resource
practices assist in obtaining, distributing and producing new knowledge. Our findings

173
also support those of Goh (2002), whereby training and development programs can
assist extensively in problem solving via the sharing and exchanging of knowledge
amongst workers. Ooi et al. (2009), in their conceptual paper also stressed that more
training and development programs will lead to greater KM activities among members
in the organization. As a result of its enormous benefits, such training programs should
be given on a constant and regular emphasis to improve the success of KM. Besides,
giving workers the flexibility and dividing them into teams have been discovered to
have a positive impact on KM activities. This showed that information sharing will
happen amongst workers as they work in teams, merging individual knowledge and
developing new skills to boost the competency of the company. In a research carried out
by Chong et al. (2010), the writers strongly stressed that teamwork and employee
empowerment is one of the most important decisive determinants that would allow KM
to successfully occur in a knowledge-based society. Our findings also supported the
works of Garavan et al. (2000) and Greco (1999) that suggested workers required
training and education so that they will be keener on developing and sharing knowledge.
Our finding showed that the sampled companies give solid emphasis on human resource
management practices, where appropriate company-wide trainings are given to workers
at all levels. When such a working environment is present, it allows workers to obtain
and share information easily via the training sessions and use such knowledge into
problem solving. This seems to be one of the most efficient methods to build human
resources so that they can continue to stay valuable in the improvement of company
performance. Moreover, our result also supported the research completed by Grant
(1997) and Hedlund (1994), where working in teams is deemed to give the company
more flexibility to coordinate their human capital, providing workers the opportunity to
spread and share knowledge, and raising the success rate of each task performed as a
team. This, to some extent raises the competitive advantage of a company.

174
8.2.3.5 Hypothesis 5 – Relationship of Process Management and KM
When workers are led by clear objectives and they comprehend their respective tasks
well, this is when KM is begun. The finding in our research has revealed it is as such.
With an appropriate and well-developed process management, the firms are able to
build a better process for KM activities to happen. Therefore, the empirical finding from
this research concluded that process management is ranked as the main priority among
the sampled companies, as process management certainly influences KM. Similarly, the
application of statistical control for process controlling, also popularly called SPC, has a
positive effect on the transmitting of knowledge, indirectly enhancing KM (Molina et
al., 2004). In line with this, Rungtusanatham et al. (1997) also encouraged SPC analysis
and to update the changes of knowledge process. When the workers are working
together in teams, and are led by clear objectives, they can better comprehend their
duties and responsibilities. This is when knowledge acquisition takes place, both
internally and externally. When knowledge is disseminated among organizational
members via periodic meetings or the application of information technology for
problem solving, the practice will rid itself of outdated knowledge and provides the
opportunity to look for newer options. Our finding also supported those of Ahire and
Dreyfus (2000), where they found that a process that is easily comprehended by workers
and carried out tasks in the process makes knowledge transfer easier, especially with the
application of basic SPC tools. In addition, Wong (2005) in his research on SMEs
supported the notion that processes and activities continue as one of the critical success
factors that aids KM. It was noted in Wong (2005) that appropriate and sufficient
interferences can improve the ways for knowledge transfer to happen in a company.
Furthermore, Molina et al. (2007) who performed a test on a sample of 197 companies
in Spain discovered that via an effective process control, the transfer of knowledge
within a company is able to emphasize the problems and issues faced by a company,

175
bringing to the firm‟s knowledge the discrepancies in the efficiency of various processes
based on the data generated rather than on management‟s own perception. This comes
to illustrate that process management and transferring of knowledge within a company
is extensively encouraged and should not be taken lightly by the companies in Malaysia
if they want to thrive and succeed.
8.2.3.6 Hypothesis 6 – Relationship of Information and Analysis and KM
The outcome of this research illustrates that information and analysis are significantly
linked to KM in Malaysian companies. This result is similar to those of Alavi and
Leidner (2001) and Lee and Hong (2002) where they found most recent technology
advancement plays a main function to connect people with information as well as
connect people with people via different media sources, platforms and databases. Wong
(2005) stated that together with easy-to-use technological devices and software,
information and knowledge can be shared with a simple click of a button. With the rapid
of advancement of technology, goods as well as processes could turn obsolete. Thus, it
is imperative for companies to obtain the most updated information and technology to
compete with the latest products and services offered by competitors especially for
companies in Malaysia. With the use of greatly improved technology, not only does it
boosts the speed of getting and distributing knowledge, the cost of spreading
information can also be reduced, hence encouraging appropriate KM. A case study
carried out by Yeh, Lai, and Ho (2006) on both Advanced Semiconductor Engineering,
Inc (ASE) and VIA Technologies, Inc. (VIA) situated in the region of Asia, validated
that information technology helps in the speedy exploration for information and this has
become ever more important for both firms in their management of knowledge. Chong
et al. (2010) based on the results of previous research, recognized information analysis
as one of its critical success factors that can assist KM in a company, whereby it has the

176
component of knowledge distribution. As stated in the article of Chong et al. (2010),
several researchers have supported the idea that with a complete information system
infrastructure, knowledge can be handled and executed efficiently and effectively. This
statement was also supported by Hasanali (2002) who suggested that a company
inevitably prevents its staff to have knowledge sharing on a greater scope if a solid
information technology infrastructure is absent. Another research by Luan and Serban
(2002) pointed out that practices on business intelligence, knowledge and data mining
support the KM processes, is in conflict with our study outcomes. Given such result, it
is advisable and important for the Malaysian companies to incorporate an exceptional
KM system, so that the most updated information about the latest trends, products, and
services offered by competitors and commanded by customers can be obtained in the
fastest time possible. Therefore, firms should identify the significance of information
systems as a stimulator of KM and such system should be easy to apply to improve its
productivity. Only through the application of the most advanced technology can the
speed of obtaining, distributing and using of knowledge can occur. In summary,
information and analysis are important in supporting a company‟s KM process and it is
closely connected with KM.
8.2.4 Discussion of Findings – Research Question Four
The next research question, RQ4 in this study asked “Is there any significance
difference between the manufacturing and service sectors in terms of TQM linkages
with KM behavior?”. The results shown in Table 7.1 indicate that four out of six
factors, namely leadership, customer focus, human resource management and process
management show a positive relationship and significantly difference between these two
sectors. Hence, in response to RQ4, the finding recommends that, with the exception of
strategic planning and information and analysis, there is a significant difference between

177
manufacturing and service firms in terms of TQM practices and KM. The result of these
findings are inconsistent with past studies such as Beaumont et al. (1997), Cheah et al.
(2009) and Prajogo (2005) that found no significant difference in the TQM adoption
between manufacturing and service firms. The results also illustrated that generally
service firms score more than manufacturing firms with respect to TQM practices and
KM. As service firms require more knowledge based abilities (i.e. soft skills) compared
to the manufacturing that demands more mechanical (i.e. machinery) skills, a stronger
emphasis should be placed on practicing TQM and KM for the service sector.
8.2.5 Discussion of Findings – Research Question Five
The fifth research question, RQ5 in this research enquired “Is there any difference in the
modeling of the constructs validity of TQM between manufacturing and service firms?”.
The main findings can be drawn from SEM results. The measurement frameworks of
the two groups were not significantly different. Therefore, in response to RQ5, the
findings revealed that there was no significant difference between manufacturing and
service firms in terms of construct validity of TQM. Besides, these results also confirm
that the contents of MBNQA criteria adopted for TQM constructs in both manufacturing
and service sectors are valid. The above results are in line with the outcomes from past
studies performed by Prajogo (2003; 2005). In other words, the MBNQA-TQM
elements could be conceptualized as one of the predictors that govern the occurrence
and effectiveness of KM among the middle to higher level managers in both the
manufacturing and service firms. Personnel from these two sectors will find this useful
as it may aid them in re-assessing and re-examining ways to improve their TQM
practices effectively so that they can improve the level of KM in their organizations. As
proven in the study by Cheah et al. (2009), it is also proven likewise that the
relationship between TQM practices (i.e. leadership, customer focus, training and

178
development, reward systems, teamwork, and organizational culture) and knowledge
sharing also showed insignificant difference between the manufacturing and service
sectors. Such result was also in line with Beaumont et al. (1997) as well as Prajogo
(2005) who also did not find significant difference in TQM adoption between the
manufacturing and service industries.
8.2.6 Discussion of Findings – Research Question Six
The sixth research question (RQ6) in this study asks – “Are there any significant
difference in the predictive power of TQM practices on KM between the manufacturing
and service firms?”. The result shows that the structural relationship models between
the manufacturing and service groups do not pose any significant differences. This
supports the criterion validity of the relationships between TQM and KM in both
manufacturing and service firms (Prajogo, 2005). Thus, in response to RQ6, these
findings suggest that in terms of the key practices of TQM and KM, there is no
significant difference between manufacturing and service firms. In general, this study
has demonstrated that the TQM model applied in this research is robust across different
sectors not only in terms of content (i.e. criterion) but also in terms of its significant and
strong effect on KM in Malaysian firms.
8.3 Research Implications
This research further advances the contemporary study in the area of TQM and the
implications of both theoretical and managerial perspectives are brought together in this
section. These implications will be further explained as follows:

179
8.3.1 Managerial Implications
In the place of work, learning is an important component to change a conservative
company to a developing one (Gilley & Maycunich, 2000). KM, that is an essential part
of learning, holds great connotation in the future management of quality systems. Many
businesses are starting to apply the KM activities; as such activities aid companies to
accomplish a sustainable competitive edge over their rivals (Valkokari & Helander,
2007). Moreover, the dimensions of TQM are found to be useful mechanisms for
management as they contribute to the distribution of knowledge. The findings and
discussion presented in the past sections revealed valuable lessons for practitioners, as
well as researchers in both quality and KM fields. It is deemed that if the significance of
TQM practices is well understood and valued, it can really improve the success of KM
processes.
To ensure sustainable competitive advantage, a combination of both TQM and KM can
be used as management practices for many firms. By introducing and executing a well-
designed and applicable TQM system within the company, an implicit understanding of
the company‟s knowledge can be built and worked towards by each worker within the
company itself. The benefits of TQM practices on KM are discussed by Tseng (2008).
Firstly, there will be a change in the company itself when KM activities are guided by
TQM practices. Secondly, TQM practices should identify the mission, objectives and
goals of the firm. Thirdly, the company may become more diversified in its working
process. Fourthly, an enhancement in the overall performance is noticeable. Finally, an
innovative culture can be encouraged, which involves getting new ideas and better
problem-solving skills among workers.
180
This study has provided some practical approaches to organizations, especially in the
Malaysian manufacturing and service companies, on whether TQM practices are able to
enhance KM activities. Although many companies have used such practices, it is still
important to build a framework, test it, and then study the TQM constructs that can
contribute towards the implementation of KM activities. This research clearly exhibits
that four out of six TQM practices, namely strategic planning, human resource
management, process management and information and analysis have a positive impact
on the KM activities in the manufacturing and service companies of Malaysia. As such,
the middle to higher level managers of these companies will have an idea on which
TQM constructs to concentrate on in order to improve the activities of KM. More
exclusively, strategic planning and human resource management emerged to be the two
most decisive TQM dimensions that are linked to KM. Hence, it is critical to enhance
both these two constructs in all organizations.
Due to the direct impact of strategic planning, human resource management, process
management and information and analysis, on KM, Malaysian companies should study
their workers‟ feedback, so that the overall KM activities can be enhanced. Besides, a
formal introductory program should also be carried out for new workers together with
the wide specifications of formal on-the-job training for the existing workers, with
mentoring programs put in place in order to increase the employees‟ dedication. Process
management can be further enhanced through the support of an appropriate
communication system. This will allow process flow information to be smoothly
disseminated all over the firm and easily understood by staff from all levels.
Additionally, middle to higher level managers should know the fact that there is a need
to study objectively the performance of their subordinates, so that staff will have a sense
of fair play and reliability, and this will promote higher KM. By using the results of this
181
study as a guide, middle to higher level managers will have a better understanding on
each TQM practice to be used when it comes to self-examination and further enhance
their TQM practices in order to improve the distribution of knowledge in their firms.
Information and analysis can be further enhanced via the application of appropriate
communication system. This will allow information to be distributed smoothly
throughout the firm, and comprehended easily by workers at all levels. By applying this
research result as a guideline, managers in the manufacturing and service sectors will
have a better understanding on the respective TQM practices especially in the reviewing
and revising of their TQM practices to enhance KM within the organization. Lastly, the
results also verify the adoption of TQM practices in both manufacturing and service
sectors and the validity of the MBNQA conditions in operationalizing TQM practices
into a set of organizational practices.
This empirical research holds strong significance for practitioners from the management
side. One of the main practical contributions is to create awareness among the middle to
higher level managers from both the manufacturing and services sectors on the
multidimensionality of TQM, and to bring their attention on how to devote more
attention on the six MBNQA elements that bring an equal effect to both sectors in terms
of attaining a higher level of KM. In other words, practitioners from both industries
should be aware of the importance of the MBNQA criteria in churning out a healthy
KM culture. Apart from that, appropriate measures, such as regular assessment of the
TQM practices implemented in firms, at the same time the introduction of suitable
programmes that can help boost the KM level can also be adopted by managers from
both sectors. Furthermore, both soft and hard TQM elements should be emphasized in
today‟s competitive and fast changing environment as both types of elements are
believed to be essential for company survival.

182
8.3.2 Theoretical Implications
By using KM as a research topic, a lot of studies strived to find the most consistent and
reliable ways to improve the KM activities. Unfortunately, there is still insufficient
research conducted in the area of TQM and KM relationships, even though studies in
the past have tried to accomplish this. In this research, we recommend a model that
incorporated the six TQM practices based on MBNQA framework to examine whether
such a practice would enhance the performance of KM in Malaysian companies.
Although past study such as Cheah et al. (2009) did a comparison between the
manufacturing and service sectors in Malaysia, it only compared the relationship
between TQM practices and knowledge sharing from the perspective of middle to
higher level managers. Furthermore, the TQM dimensions used in their study were not
of MBNQA criteria. On top of that, only the multiple linear regression technique was
used to analyze the relationship between the TQM principles and knowledge sharing.
Another study by Feng et al. (2006) compared the relationship of TQM on quality
performance between Australian and Singaporean firms. However, the said study is an
inter-country comparative study that focuses on organization performance (e.g. product
quality and product innovation) as a whole, but not on KM. Therefore, this study is
believed to contribute to the knowledge on TQM in the literature where a comparative
research was conducted on two major sectors in Malaysia - manufacturing and services.
Furthermore, a more comprehensive multivariate analysis technique, SEM was used to
test the relationships between the TQM dimensions with the KM constructs, so to
deepen the comprehension of the role of TQM plays in KM and also to prove the
validity of the model framework.

183
From the theoretical viewpoint, this research study offers a model where six dimensions
of TQM and KM behavior were combined. With the application of multivariate
analysis, namely SEM, the index fit were assessed comprehensively to ensure whether it
is a properly defined model. Based on the analysis, the model is suitable for the data
collected. In addition, this research also illustrates the links between the dimensions of
TQM and KM activities. This research has offered the foundation for future research to
be carried out, to inspect the link between TQM and KM dimensions, so the role of
TQM can be better understood and developed into new ideas and technologies. Hence,
to prove the validity of the framework, this research may be used as the base and
principles for future studies.
Finally, besides concluding TQM practices play an important role in supporting KM
activities in both manufacturing and service companies in Malaysia, this study also
contributes to the literature by highlighting the effects of the individual TQM constructs
on KM behaviors. From these findings, the management team of each firm can work on
the modification of their TQM activities to develop a more encouraging KM culture in
their own company and that future researchers can also consistently test on the impact
of different TQM practices on the different sectors.
Despite the wide spread attention and the countless papers written about TQM, research
comparing the relationship between TQM and KM in both the manufacturing and
service sectors is still limited. We believe this study has provided further insights into
the broader view of TQM dimensions, to investigate the effects the six MBNQA
dimensions have on KM for both the sectors. This study is one of the few that brings out
the idea of TQM being an influential predictor for KM. By using this idea, a comparison
study was done between the two sectors. From the research perspective, such an

184
examination is vital as there is a lack of empirical research which compares the two
major sectors in Malaysia in terms of the association between TQM and KM. As
indicated in the findings, no difference was found between the two sectors and that the
MBNQA practices are essential to both. With the validity of the TQM variables, and its
relationship with KM being demonstrated in both sectors, this study differs from others
in the literature that limit their investigation to comparing the differences in the level of
TQM implementation between the manufacturing and service sectors. Apart from that,
the constructed research model can be used by future researchers, within or outside
Malaysia, for further testing of its validity and applicability.
8.3.3 Methodological Implications
From the aspects of research methodology, this research embarked on a thorough
statistical validation of the influence of TQM practices on KM in the setting of
Malaysian companies. The relationship between the variables was rigorously studied for
consistency and validity and was discovered to perform well. In addition, the proposed
model (i.e. association between TQM practices and KM) was empirically tested using
EFA, CFA and SEM analysis. Overall, the findings provided strong support for the
proposed relationships. One major contribution from this study is that a measurement
system of TQM practices and KM has been developed, which is believed to prompt and
facilitate more of such research to be conducted in the developing countries in future.
These findings also contribute significantly as a benchmark methodology that can be
used to track the level of TQM effects on KM. Firms can apply this instrument to
conduct measurements of the basic pre-test, and then return to manage regularly to
identify changes linked with TQM efforts.

185
8.4 Research Limitations and Future Research Directions
Because of the resources and time constraints, the results in this thesis leave several
weaknesses which required acknowledgement and study further. This research focuses
on both manufacturing and service companies in Malaysia, in which a comparison was
made between both these industries. The first limitation identified here is that only the
Malaysian firms were being investigated. It is suggested that the study be broadened to
compare our findings with other countries, such as those from the Asia Pacific region or
with the developed countries, in the likes of the European countries, the United States
and Japan in the investigation of the differences in the relationship of TQM and KM.
Such studies are believed to contribute significantly across different nations.
One other weakness is the data used are cross-sectional, not longitudinal. Because of
this, the time sequence of the links among the variables cannot be determined. Only
through the application of data collected at different point of time can the causality
between variables be tested. Therefore, future research should include longitudinal
research designs so that a clearer picture of causation can be obtained.
Next, questionnaire survey is a way that is widely applied by many researchers as it is a
cost-effective and consistent for data collection. It is self-administered questionnaire
and the questions asked in survey may be unclear to some respondents and thus can be
affected by response biases. Hence, it is suggested that a field observation be performed
as to get a clearer picture from the respective respondents themselves. Additional
limitation is that the data is collected from middle to higher level managers. Their views
about the research topic could be different from that of the ordinary workers. Hereafter,
it is suggested to perform future surveys on the different management levels.
186
Despite the overall findings presented in this research, the MBNQA framework, which
comprises of six constructs, remains the only focus of the study. There is a possibility
that they are other factors which can be incorporated into the research model as the
operating nature between manufacturing and service is significantly different. For
example, the hard elements of TQM apply more to the manufacturing industry, whereas
the soft elements of TQM are more applicable to the service firms. Apart from that, the
dimensions in other Quality Award models, such as the EQA or the PMQA can also be
used as predictors in future studies.
The TQM practices selected in this research is limited in scope, as six TQM practices
were studied. Obviously, there are other broader factors governing TQM practices that
could have an effect on KM. Some examples are organizational culture, organizational
structure, corporate strategy and the practice of continuous improvement. They may
play an essential part to shape the workers‟ attitudes towards KM activities. Such
dimensions may as well be included into future research, as every organizational aspect
is interlinked.
8.5 Conclusions
In conclusion, the purpose of this study was to assess the influence of TQM practices on
KM, as perceived by middle to higher level managers in Malaysian companies. The
results have indicated that TQM practices posed a significant and positive impact on the
KM of Malaysian companies. Besides, it was discovered that the dimensions of TQM,
such as process management, strategic planning, information and analysis and human
resource management, having positive effect on KM. Strategic planning and human
resource management are main items of TQM which are strongly linked with KM in
Malaysian companies.

187
With the rapid progression of technological changes, combined with economic
globalization, „knowledge‟ has been regarded as a competitive asset by many
enterprises in order to be competitive. As human capital is the primary resource for the
production of knowledge, a lot of firms have started to involve themselves actively in
activities which encourage the generation of new knowledge. Therefore, if companies
can guarantee the critical practices that inspire the production of new knowledge and the
improvement of the present ones, it will boost the competency of KM.
From the study presented, we can conclude that TQM practices are essentially linked to
KM. The companies in Malaysia are aware of the significance of KM activities hence
have started to employ and include them into their day to day business processes. This
research evidently suggests KM to be more than merely conveying data. The different
types of information shared among workers from different departments and different
levels, and the speed in sharing knowledge within a company, institute the capability of
the company to succeed. It is undoubtedly that KM among workers is imperative and an
important method for companies to accomplish a competitive edge. KM certainly offers
many benefits to different types of firms, in this case, both the manufacturing and
service firms. It is important that organizations fit their TQM constructs to encourage
KM activities to take place within the company. In this thesis, it is recommended that
the four TQM practices (i.e. strategic planning, human resource management, process
management and information and analysis) to be used in both the manufacturing and
service companies in Malaysia, as they have exhibited a “fit” between the workers and
the company itself, and this can assist in the development of attitudes and behaviors that
are positive towards KM implementation.

188
According to Liebowitz (1999), the utmost precious resource of a company that needs to
be controlled and handled with care is knowledge. It is essential that companies do not
take too lightly the importance of KM. To survive and thrive in this competitive
business environment, enterprises need to consistently improve on their existing
knowledge and search for new ones. In order for them to do so, the proposed TQM
practices in supporting the KM process are especially significant, so that firms can
compete successfully in the marketplace and gain growth. Through the effective
distribution of knowledge, firms will have the ability to harvest the benefits and become
successful in the competitive surroundings.
This study also offered an empirical assessment on the differences in the link between
TQM and KM for both the manufacturing and service sectors. The results show that the
level of TQM practices and KM are not significantly difference between these two
sectors except for leadership, customer focus, human resource management and process
management where service companies illustrate scores that are significantly higher.
Through the application of SEM approach, this research has shown that the proposed
TQM constructs are valid and applicable to both manufacturing and service sectors and
their association with KM is also similar between the two. Therefore, this study
encourages the adoption of TQM practices in the manufacturing and service companies.
In particular, this research has verified the applicability of the MBNQA conditions as
named by Samson and Terziovski (1999) cited by Prajogo (2003; 2005) in both the
manufacturing and service companies. This research also adds to the literature by
demonstrating the validity of TQM construct and its relationship with KM in both
manufacturing and service firms. This varies from past works (e.g. Prajogo, 2003; 2005)
in areas that are normally limited to study the difference between the two industries in
the adoption of TQM.

189
In summary, this thesis has presented an empirical study examining the differences in
the relationship between TQM and KM from the perspective of both manufacturing and
service sectors. Firstly, no significant difference was found in terms of TQM practices
affecting KM level between both sectors. Secondly, it has also been proven that the
TQM model used in this study, which adopted the MBNQA criteria, is valid and
applicable across both sectors with the use of SEM analysis. Hence, the TQM principles
selected for this study can be concluded as equally applicable to both sectors. As a
general conclusion, it was successfully proven in this research that the MBNQA criteria
used to establish the TQM framework could be useful in conceptualizing the factors that
govern the occurrence and effectiveness of KM. For both the manufacturing and service
sectors, to improve KM within a firm can pose as a huge challenge. Therefore, both
sectors might find this study beneficial as this study provides the basic guideline for re-
evaluating the methods to enhance their TQM practices in a relatively inexpensive and
practical way, so that a higher KM can be attained. From the research perspective, a
more thorough understanding on how MBNQA-TQM concepts can affect the behaviors
of KM can be achieved by studying the multidimentionality of TQM practices,
contributing to the ever important TQM studies.

190
REFERENCES
Aaker, D. A. (1971). Multivariate Analysis in Marketing: Theory and Application.
Belmont, CA: Wadsworth Publishing Company.
Adams, G., McQueen, G., & Seawright, K. (1999). Revisiting the price impact of
quality awards. Omega, 27(4), 595-604.
Adamson, I. (2005). Knowledge management – the next generation of TQM. Total
Quality Management, 16(8-9), 987-1000.
Ahire, S. L., & Dreyfus, P. (2000). The impact of design management and process
management on quality: An empirical investigation. Journal of Operation
Management, 18(5), 549-575.
Ahire, S. L., Golhar, D. Y., & Waller, M. A. (1996). Development and validation of
TQM implementation constructs. Decision Sciences, 27(1), 23-56.
Ahire, S. L., Landeros, R., & Golhar, D. Y. (1995). Total quality management: A
literature review and an agenda for future research. Production and Operation
Management, 4(3), 227-306.
Ahmad, M. F., & Yusof, S. M. (2010). Comparative study of TQM practices between
Japanese and non-Japanese electrical and electronics companies in Malaysia:
Survey results. Total Quality Management, 21(1), 11-20.
Ahmed, P. K. (1998). Culture and climate for innovation. European Journal of
Innovation Management, 1(1), 30-43.
Alavi, M., & Leidner, D. E. (2001). Review: Knowledge management and knowledge
management systems: Conceptual foundations and research issues. MIS
Quarterly, 25(1), 107-136.
Alazmi, M., & Zairi, M. (2003). Knowledge management critical success factors. Total
Quality Management & Business Excellence, 14(2), 199-204.
Al-Mabrouk, K. (2006). Critical success factors affecting knowledge management
adoption: A Review of the literature. Innovations in Information Technology,
IEEE Xplore, 1-6.
Almond, N. (2001). The transportability and dissemination of knowledge - A surveyor‟s
perspective. Property Management, 19(2), 124-135.
Alvesson, M. (1993). Organizations as rhetoric: knowledge-intensive firms and the
struggle with ambiguity. Journal of Management Studies, 30(6), 997-1015.
American Productivity and Quality Centre (1999). Knowledge management:
Consortium benchmarking study (Best-practice Report). Houston, TX:
American Productivity & Quality Centre (APQC).

191
Anderson, J. C., & Gerbing, D. W. (1988). Structural equation modeling in practice: A
review and recommended two-step approach. Psychological Bulletin, 103(3),
411-423.
Anderson, J. C., Rungtusanatham, M., & Schroeder, R. G. (1994). A theory of quality
management underlying the Deming management method. Academy of
Management Review, 19(3), 472-509.
Anderson, J. C., Rungtusanatham, M., Schroeder, R. G., & Devaraj, S. (1995). A path
analytic model of a theory of quality management underlying the Deming
management method: Preliminary empirical findings. Decision Sciences, 26(5),
637-657.
Anderson, J., & Gerbing, D. (1991). Predicting the performance of measures in a
confirmatory factor analysis with a pretest assessment of their substantive
validities. Journal of Applied Psychology, 76(5), 732-740.
Anderson, M., & Sohal, A. S. (1999). A study of the relationship between quality
management practices and performance in small business. International Journal
of Quality & Reliability Management, 16(9), 859-877.
Anderson, T. J. (2000). Strategic planning, autonomous actions and corporate
performance. Long Range Planning, 33(2), 184-200.
Apostolou, D., Menttzas, G., & Abecker, A. (2008). Managing knowledge at multiple
organizational levels using faceted ontologies. Journal of Computer Information
Systems, 49(2), 32-49.
Arbuckle, J. L. (2008). Amos 17.0.2 (Version 17) [Software and Manual]. FL: Amos
Development Corporation Crawfordville.
Ardichvili, A., Page, V., & Wentling, T. (2002). Motivation and barriers to
participation in virtual knowledge-sharing communities of practice. Paper
presented at the Third European Conference on Organizational Knowledge,
Learning, and Capabilities-OKLC, Athens, Greece.
Arias, D., & Molina, L. M. (2002). Determinants of innovation through a knowledge-
based theory lens. Industrial Management and Data Systems, 102(5), 289-296.
Arnold, J. A., Arad, S., Rhoades, J. A., & Drasgow, F. (2000). The empowering
leadership questionnaire: The construction and validation of a new scale for
measuring leader behaviours. Journal of Organizational Behavior, 21(3), 249-
269.
Arthur Andersen Business Consulting and APQC (1996). The knowledge management
assessment tool: external benchmarking version. Houston, TX: The American
Productivity and Quality Center.
Bagozzi, R. P., & Yi, Y. (1988). On the evaluation of structural equation models.
Journal of the Academy of Marketing Science, 16(1), 74-94.
192
Barney, J. B. (1991). Firm resources and sustained competitive advantage. Journal of
Management, 17(1), 99-120.
Bassi, L. J., & Van Buren, M. E. (1999). Valuing investments in intellectual capital.
International Journal of Technology Management, 18(5/6/7/8), 414-432.
Beaumont, N. B., Sohal, A. S., & Terziovski, M. (1997). Comparing quality
management practices in the Australian service and manufacturing industries.
International Journal of Quality & Reliability Management, 14(8), 814-833.
Beckman, T. J. (1999). The current state of knowledge management. In J. Liebowitz
(Ed.), Knowledge management handbook (pp. 1.1-1.22). Boca Raton, FL: CRC
Press.
Beijerse, R. P. (2000). Knowledge management in small and medium sized companies:
Knowledge management for entrepreneurs. Journal of Knowledge Management,
4(2), 162-179.
Bemowski, K., & Stratton, B. (1995). How do people use the Baldrige award criteria?
Quality Progress, 28(5), 43-47.
Bendell, T., Penson, R., & Carr, S. (1995). The quality gurus – their approaches
described and considered. Managing Service Quality, 5(6), 44-48.
Bentler, P. M. (1983). Some contributions to efficient statistics in structural models:
Specification and estimation of moment structures. Psychometrika, 48(1), 493-
517.
Bentler, P. M., & Bonett, G. (1980). Significance tests and goodness of fit in the
analysis of covariance structures. Psychological Bulletin, 88(3), 588-606.
Bentley, T. (1999). Knowledge Management? Humbug! Management Accounting, 77(4),
89-89.
Bernard, H. R. (2000). Social research methods: Qualitative and quantitative
approaches. Thousand Oaks: Sage Publications.
Bhatt, G. D. (2000). Organizing knowledge in the knowledge development cycle.
Journal of Knowledge Management, 4(1), 15-26.
Black, S. A., & Porter, L. J. (1996). Identification of the critical factors of TQM,
Decision Sciences, 27(1), 1-21.
Bohoris, G. A. (1995). A comparative assessment of some major quality awards.
International Journal of Quality & Reliability Management, 12(9), 30-43.
Bollen, K. A. (1989). Structural equations with latent variables. New York, NY: Wiley.
Bontis, N., Crossan, M., & Hulland, J. (2002). Managing an organizational learning
system by aligning stocks and flows. Journal of Management Studies, 39(4),
437-469.

193
Bou-Llusar, L. C., Escrig-Tena, A. B., Roca-Puig, V., & Beltran-Martin, I. (2009). An
empirical assessment of the EFQM excellence model: Evaluation as a TQM
framework relative to the MBNQA model. Journal of Operations Management,
27(1), 1-22.
Bounds, G., Yorks, L., Adams, M., & Ranney, G. (1994). Beyond total quality
management: Toward the emerging paradigm. New York: McGraw-Hill
International Edition.
Bourque, L. B., & Fielder, E. P. (1995). How to conduct self-administered and mail
surveys - The survey kit 3. London: Sage Publications.
Bradburn, N., Sudman, S., & Wansink, B. (2004). Asking questions (2nd ed.). San
Francisco: Jossey Bass.
Brah, S. A., & Lim, H. Y. (2006). The effects of technology and TQM on the
performance of logistics companies. International Journal of Physical
Distribution & Logistics Management, 36(3), 192-209.
Brelade, S., & Harman, C. (2000). Using human resources to put knowledge to work.
Knowledge Management Review, 3(1), 26-29.
Broadbent, M. (1998). The phenomenon of knowledge management: What does it mean
to the information profession? Information Outlook, 2(5), 23-39.
Brown, J. S., & Duguid, P. (1991). Organizational learning and communities-of-
practice: Toward a unified view of working, learning, and innovation.
Organization Science, 2(1), 40-57.
Brown, J. S., & Duguid, P. (2000). Balancing act: How to capture knowledge without
killing it. Harvard Business Review, 78(3), 73-79.
Brown, J. S., & Duguid, P. (2001). Knowledge and organization: A social-practice
perspective. Organization Science, 12(2), 198-213.
Browne, M. W., & Cudeck, R. (1993). Alternative ways of assessing model fit. Newbury
Park, California: Sage Publications.
Bryant, S. E. (2003). The role of transformational and transactional leadership in
creating, sharing, and exploiting organizational knowledge. Journal of
Leadership and Organizational Studies, 9(4), 32-44.
Buckley, R., & Caple, J. (1992). The theory and practice of training. London: Kogan
Page Ltd.
Byrne, B. M. (1994). Structural equation modeling with EQS and EQS/Windows.
Thousand Oaks, CA: Sage.
Byrne, B. M. (1998). Structural equation modeling with LISREL, PRELIS, and
SIMPLIS: Basic concepts, applications, and programming. Mahwah, NJ:
Lawrence Erlbaum Associates.

194
Byrne, B. M. (2001). Structural equations modeling with AMOS: Basic concepts,
applications, and programming. New Jersey: Lawrence Erlbaum Associates,
Inc. Publisher.
Byrne, B. M. (2009). Structural equation modeling with AMOS: Basic concepts,
applications, and programming (Multivariate Applications Series). London:
Psychology Press.
Byrne, B. M. (2006). Structural equation modeling with EQS: Basic concepts,
applications, and programming (2nd ed.). Mahwah, N.J.: Lawrence Erlbaum
Associates.
Cabrera, A., & Cabrera, E. F. (2002). Knowledge-sharing dilemmas. Organizational
Studies, 23(5), 687-710.
Cabrera, E. F., & Cabrera, A. (2005). Fostering knowledge sharing through people
management practices. The International Journal of Human Resource
Management, 16(5), 720-735.
Cagarra-Navarro, J. G., & Martinez-Conesa, E. A. (2007). E-business through
knowledge management in Spanish telecommunications companies.
International Journal of Manpower, 28(3/4), 298-314.
Calantone, R., Garcia, R., & Droge, C. (2003). The effects of environmental turbulence
on new product development strategic planning. Journal of Product Innovation
Management, 20(2), 90-103.
Camison, C. (1998). Total quality management and cultural change: A model of
organizational development. International Journal of Technology Management,
16(4), 479-493.
Camp, R. C. (1989). Benchmarking: The search for industry best practices to lead to
superior performance. Milwaukee, Wisconsin: Quality Press.
Carayannis, E. G., Alexander, J., & Loannidis, A. (2000). Leveraging knowledge,
learning and innovation in forming strategic Government University-Industry
(GUI) R&D partnership in the US, Germany and France. Technovation, 20(9),
477-488.
Carlucci, D., & Schiuma, G. (2006). Knowledge asset value spiral: Linking knowledge
assets to company performance. Knowledge and Process Management, 13(1),
35-46.
Carmines, E. G., & Zeller, R. A. (1979). Reliability and validity assessment. Beverly
Hills, CA: Sage Publications.
Carmines, E. G., & Zeller, R. A. (1991). Reliability and validity assessment. Newbury
Park: Sage Publications.
Cegarra-Navarro, J. C. (2007). Linking exploration with exploitation through
relationship memory. Journal of Small Business Management, 45(3), 333-353.

195
Chang, D. S., & Sun, K. L. (2007). Exploring the correspondence between total quality
management and Peter Senge‟s disciplines of a learning organization: A Taiwan
perspective. Total Quality Management & Business Excellence, 18(7), 807-822.
Chau, P. Y. K., & Hu, P. J. H. (2001). Information technology acceptance by individual
professionals: A model comparison approach. Decision Science, 32(4), 609-719.
Cheah, W. C. (2008). A study of the relationship between TQM and knowledge sharing.
Unpublished Master thesis. Multimedia University, Malaysia.
Cheah, W. C., Ooi, K. B., Teh, P. L., Chong, A. Y. L., & Yong, C. C. (2009). Total
quality management and knowledge sharing: Comparing Malaysia‟s
manufacturing and service organizations. Journal of Applied Sciences, 9(8),
1422-1431.
Chew, K. W. (2007). Modified Technology Acceptance Model as predictor of online
purchase behavior: A Malaysian perspective. Unpublished PhD thesis.
Multimedia University, Malaysia.
Choi, K. (2002). Latent variable regression in a three–level hierarchical modeling
framework: A fully Bayesian approach (Doctoral Dissertation). University of
California, Los Angeles.
Choi, S. (2010). Exploring intention to adopt mobile TV Service in the United States:
Toward a new model with cognitive-based and emotional-based constructs.
Unpublished PhD thesis. School of Journalism and Mass Communications,
University of South Carolina, pp. 1-140.
Choi, T. Y., & Eboch, K. (1998). The TQM paradox: Relations among TQM practices,
plant performance, and customer satisfaction. Journal of Operations
Management, 17(1), 59-75.
Chong, A. Y. L. (2008). An empirical examination of collaborative commerce adoption
for supply chain management among Malaysian electrical and electronic
organizations. Unpublished PhD thesis. Multimedia University, Malaysia, pp. 1-
240.
Chong, A. Y. L., Darmawan, N., Ooi, K. B., & Lin, B. (2010). Adoption of 3G services
among Malaysian consumers: An empirical analysis. International Journal of
Mobile Communications, 8(2), 129-149.
Chong, C. W., Chong, S. C., & Yeow, P. H. P. (2006). KM implementation in
Malaysian telecommunication industry. Industrial Management & Data Systems,
106(8), 1112-1132.
Chuan, T. K., & Soon, L. C. (2000). A detailed trend analysis of national quality awards
worldwide. Total Quality Management, 11(8), 1065-1080.
Churchill, A., Jr. & Peter, J. (1984). Research design effects on the reliability of rating
scales: A Meta analysis. Journal of Marketing Research, 21(4), 360-375.

196
Churchill, G. A., Jr. (1979). A paradigm for developing better measures of marketing
construct. Journal of Marketing Research, 16(1), 64-73.
Clarke, A. J. (2006). Quality management practices and organizational knowledge
management: A quantitative and qualitative investigation. Unpublished PhD
thesis. Graduate College of Union Institute & University Cincinnati, Ohio.
Claver-Cortes, E., Pereira-Moliner, J., Tari, J. J., & Molina-Azorin, J. F. (2008). TQM,
managerial factors and performance in the Spanish hotel industry. Industrial
Management & Data Systems, 108(2), 228-244.
Coakes, S. J., & Steed, L. (2010). SPSS: Analysis without anguish. (Version 18 for
Windows). Brisbane: John Wiley & Sons.
Colurcio, M. (2009). TQM: A knowledge enabler? The TQM Magazine, 21(3), 236-248.
Colurcio, M., & Mele, C. (2006). TQM as a route to business excellence and
stakeholder value: Findings from a case studies research. Journal of Quality and
Reliability Management, 3(5), 464-489.
Connelly, C. E., & Kelloway, E. K. (2003). Predictors of employees‟ perceptions of
knowledge sharing cultures. Leadership & Organization Development Journal,
24(5), 294-301.
Cook, P. (1999). I heard it through the grapevine: Making knowledge management
work by learning to share knowledge, skills and experience. Industrial and
Commercial Training, 31(3), 101-105.
Crauise O‟Brien, R. (1995). Employee involvement in performance improvement: A
consideration of tacit knowledge, commitment and trust. Employee Relations,
17(3), 110-120.
Creswell, J. W. (2005). Educational research: Planning, conducting, and evaluating
quantitative and qualitative research (Vol. 2). Upper Saddle River, NJ: Pearson
Education.
Crosby, P. B. (1979). Quality is free: The art of making quality certain. New York:
McGraw-Hill.
Crossan, M. M., Lane, H. W., & White, R. E. (1999). An organizational learning
framework: From intuition to institution. Academy of Management Review,
24(3), 522-537.
Curkovic, S., Vickery, S., & Droge, C. (2000). Quality-related action programs: Their
impact on quality performance and firm performance. Decision Sciences, 31(4),
885-905.
Dale, B. G. (2003). Managing quality. Oxford: Blackwell Publishing.

197
Daljit, D. (2009). Medical tourism in Malaysia despite economic downturn. The Star
Newspaper, Malaysia. Retrieved January 19, 2012, from
http://biz.thestar.com.my/news/story.asp?file=/2009/3/25/business/3538109&sec
=business
Darr, E. D., Argote, L., & Epple, D. (1995). The acquisition, transfer, and depreciation
of knowledge in service organizations: Productivity in franchises. Management
Sciencie, 41(11), 1750-1762.
Darroch, J. (2003). Developing a measure of knowledge management behaviors and
practices. Journal of Knowledge Management, 7(5), 41-54.
Darroch, J., & McNaughton, R. (2002). Examining the link between knowledge
management practices and types of innovation. Journal of Intellectual Capital,
3(3), 210-222.
Davenport, T. H., & Prusak, L. (1998). Working knowledge: How organizations manage
what they know. Cambridge, MA: Harvard Business School Press.
Davenport, T. H., & Volpel, S. C. (2001). The rise of knowledge towards attention
management. Journal of Knowledge Management, 5(3), 212-221.
Davenport, T. H., De Long, D. W., & Beers, M. C. (1998). Successful knowledge
management projects. Sloan Management Review, 39(2), 43-57.
Davis, D. (2000). Business research for decision making (5th ed.). USA: Duxbury.
Davis, T. (1996). Managing knowledge-work support functions. Journal of General
Management, 22(1), 68-86.
Day, J., & Wendler, J. (1998). Best practice and beyond: knowledge strategies. The
McKinsey Quarterly, 1, 19-25.
De Jong, G. (1999). Causal loops in long-term supply relationships: Theory and
evidence from the United States, Japan, and Europe. Unpublished PhD thesis.
SOM, University of Groningen, The Netherlands.
Dean, J. W., & Bowen, D. E. (1994). Management theory and total quality: Improving
research and practice through theory development. Academy of Management
Review, 19(3), 392-418.
Dean, J. W., & Evans, J. R. (1994). Total quality management, organization and
strategy. St. Paul: Wet Publishing Co.
Delerue, H., & Lejeune, A. (2010). Job mobility restriction mechanisms and
appropriability in organizations: The mediating role of secrecy and lead time.
Technovation, 30(5/6), 359-366.
Demarest, M. (1997). Understanding knowledge management. Journal of Long Range
Planning, 30(3), 374-384.

198
Deming, W. E. (1986). Out of crisis. Cambridge, MA: Massachusetts Institute of
Technology Press.
Demirbag, M., Koh, S. C. L., Tatoglu, E., & Zaim, S. (2006). TQM and market
orientation‟s impact on SMEs‟ performance. Industrial Management & Data
Systems, 106(8), 1206-1228.
Dempster, A. P., Laird, N. M., & Rubin, D. B. (1977). Maximum likelihood from
incomplete data via the EM algorithm. Journal of the Royal Statistical Society,
39(1), 1-38.
Despres, C., & Chauvel, D. (1999). Knowledge management(s). Journal of Knowledge
Management, 3(2), 110-120.
DiMattia, S., & Scott, I. A. (1999). KM: Hope, hype or harbinger? Library Journal,
122(15), 33.
Dotchin, J. A., & Oakland, S. J. (1994). Total quality management in services: Part 2:
Service quality. International Journal of Quality & Reliability Management,
11(3), 27-42.
Dougherty, D. (2001). Organizing practice-based knowledge in service organizations.
Academy of Management Proceedings, Paper TIM: C1.
Dow, D., Samson, D., & Ford, S. (1999). Exploding the myth: Do all quality
management practices contribute to superior quality performance? Production
and Operations Management, 8(1), 1-27.
Dunk, A. S. (2002). Product quality, environmental accounting and quality
performance. Accounting, Auditing & Accountability Journal, 15(5), 719-732.
Dunn, S. C., Seaker, R. F., & Waller, M. A. (1994). Latent variables in business
logistics research: Scale development and validation. Journal of Business
Logistics, 15(2), 145-172.
Easton, G. S., & Jarrell, S. L. (1998). The effects of total quality management on
corporate performance: An empirical investigation. Journal of Business, 71(2),
253-307.
Economy Watch, Malaysia Economic Growth. (2008). Retrieved June 5, 2010, from
http://www.economywatch.com/economic-growth/malaysia.html
Egbu, C. O., Hari, S., & Renukappa, S. (2005). Knowledge management for sustainable
Competitiveness in small and medium surveying practices. Structural Survey,
23(1), 7-21.
Ellinger, A. D., & Bostrom, R. P. (1999). Managerial coaching behaviors in learning
organizations. The Journal of Management Development, 18(9), 752-771.
Elmuti, D., & AlDiab, T. F. (1995). Improving quality and organizational effectiveness
go hand in hand through Deming management system. Journal of Business
Strategies, 12(1), 86-98.

199
Enders, C. K. (2006). Analyzing structural equation models with missing data. In G. R.
Hancock & R. O. Mueller (Eds.), Structural equation modeling: A second course
(pp. 313-342). Greenwich, CT: IAP.
Evans, J. R., & Dean, J. W. (2000). Total quality: Management, organization, and
strategy (2nd ed.). Toronto: South-Western.
Evans, J. R., & Lindsay, W. M. (1995). The management and control of quality (3rd
ed.). New York: West Publishing.
Evans, J. R., & Lindsay, W. M. (1999). The management and control of quality.
Cincinnati, OH: South-Western College Publishing.
Fang, S. C., Tsai, F. S., & Chang, K. C. (2005). Knowledge sharing routines, task
efficiency, and team quality in instant service-giving settings. Journal of the
American Academy Business, 6(1), 62-67.
Federation of Malaysian Manufacturers (FMM) Directory (2008). Malaysian industries
(39th ed.). Kuala Lumpur, Malaysia: Federation of Malaysian Manufacturers.
Federation of Malaysian Manufacturers (FMM) Directory (2009). Malaysian industries
(40th ed.). Kuala Lumpur, Malaysia: Federation of Malaysian Manufacturers.
Federation of Malaysian Manufacturers (FMM) Directory (2010). Malaysian industries
(41st ed.). Kuala Lumpur, Malaysia: Federation of Malaysian Manufacturers.
Feigenbaum, A. V. (1980). Total quality control (2nd ed.). New York: McGraw-Hill.
Feigenbaum, A. V. (1986). Total quality control (3rd ed.). New York: McGraw-Hill.
Feng, J., Prajogo, D. I., Tan, K. C., & Sohal, A. S. (2006). The impact of TQM practices
on performance: A comparative study between Australian and Singaporean
organizations. European Journal of Innovation Management, 9(3), 269-278.
Fernie, S., Green, S. D., Weller, S. J., & Newcombe, R. (2003). Knowledge sharing:
Context, confusion and controversy. International Journal of Project
Management, 21(3), 177-187.
Fine, C. H. (1986). Quality improvement and learning productive systems. Management
Science, 32(10), 1301-1315.
Finney, S. J., & DiStefano, C. (2006). Non-normal and categorical data in structural
equation modeling. In G. R. Hancock & R. O. Mueller (Eds.), Structural
equation modeling: A second course (pp. 269-314). Greenwich, CT: IAP.
Flynn, B. B., Schroeder, R. G., & Sakakibara, S. (1994). A framework for quality
management research and an associated measurement instrument. Journal of
Operations Management, 11(4), 339-366.

200
Flynn, B. B., Schroeder, R. G., & Sakakibara, S. (1995). The impact of quality
management practices on performance and competitive advantage. Decision
Sciences, 26(5), 659-691.
Forker, L. B., Mendez, D., & Hershauer, J. C. (1997). Total quality management in the
supply chain: What is its impact on performance? International Journal of
Production Research, 35(6), 1681-1701.
Fornell, C., & Larcker, D. F. (1981). Evaluating structural equation models with
unobservable variables and measurement error. Journal of Marketing Research,
18(1), 39-50.
Forza, C., & Filippini, R. (1998). TQM impact on quality conformance and customer
satisfaction: A causal model. International Journal of Production Economics,
55(1), 1-20.
Fotopoulos, C. B., & Psomas, E. L. (2009). The impact of “soft” and “hard” TQM
elements on quality management results. International Journal of Quality &
Reliability Management, 26(2), 150-163.
Frost, F. A., & Kumar, M. (2000). INTSERVQUAL – An internal adaptation of the
GAP model in a large service organization. Journal of Services Marketing,
14(5), 358-377.
Fynes, B. (1998). Quality management practices: A review of the literature. Journal of
Irish Business and Administrative Research, 19/20(2), 113-138.
Garavan, T. N., Gunnigle, P., & Morley, M. (2000). Contemporary HRD research: A
triarchy of theoretical perspectives and their prescriptions for HRD. Journal of
European Industrial Training, 24(2/3/4), 65-93.
Garvin, D. A. (1983). Quality on the line, Harvard Business Review, 61(5), 64-75.
Garvin, D. A. (1987). Competing on the eight dimensions of quality. Harvard Business
Review, 65(6), 101-109.
Garvin, D. A. (1991). How the Baldrige Award really works. Harvard Business Review,
69(6), 80-93.
Garvin, D. A. (1993). Building a learning organization. Harvard Business Review, 71(4),
78-91.
Ghobadian, A., & Speller, S. (1994). Gurus of quality: A framework for comparison.
Total Quality Management, 5(3), 53-69.
Ghobadian, A., & Woo, H. S. (1996). Characteristics, benefits and shortcomings of four
major quality awards. International Journal of Quality & Reliability
Management, 13(2), 10-44.
Gilbert, M., & Codey-Hayes, M. (1996). Understanding the process of knowledge
transfer to achieve successful technological innovation. Technovation, 16(4),
301-312.

201
Gilley, J., & Maycunich, A. (2000). Organizational learning, performance, and change:
An introduction to strategic human resource development. Cambridge: Perseus.
Gloet, M., & Berrell, M. (2003). The dual paradigm nature of knowledge management:
Implications for achieving quality outcomes in human resource management.
Journal of Knowledge Management, 17(1), 78-89.
Goetsch, D. L., & Davis, S. B. (1997). Introduction to total quality: Quality
management for production, processing, and services (2nd ed.). Upper Saddle
River, NJ: Prentice Hall.
Goh, G. G. G. (2006). Knowledge management practices in multimedia super corridor
status companies in Malaysia. Unpublished dissertation, Master of Business
Information Technology. University of Southern Queensland, Toowoomba.
Goh, S. C. (2002). Managing effective knowledge transfer: An integrative framework
and some practice implications. Journal of Knowledge Management, 6(1), 23-
30.
Goh, S. C., & Richards, G. (1997). Benchmarking the learning capacity of organizations.
European Management Journal, 15(5), 575-583.
Graf, A. (2007). Changing roles of customers: consequences for HRM. International
Journal of Service Industry Management, 18(5), 491-509.
Graham, A., & Shiba, S. (1993). Total quality. The Center of Quality Management
Journal, 2(1), 3-8.
Grant, R. M. (1996). Toward a knowledge-based theory of the firm. Strategic
Management Journal, 17(7), 109-122.
Grant, R. M. (1997). The knowledge-based view of the firm: implications for
management practice. Long Range Planning, 30(3), 450-454.
Grant, R. M., Shani, R., & Krishnan, R. (1994). TQM‟s challenge to management
theory and practice. Sloan Management Review, 35(2), 25-35.
Greco, J. (1999). Knowledge is power. Journal of Business Strategy, 20(2), 18-22.
Greengard, S. (1998). Will your culture support KM? Workforce, 77(10), 93-94.
Gronroos, C. (1988). Service quality: The six criteria of good perceived service quality.
Review of Business, 9(3), 10-13.
Groocock, J. M. (1986). The chain of quality: Market dominance through superior
product quality. New York: Wiley.
Gross, A., & Minot, J. (2007). Malaysia HR update – 2007. Retrieved June 15, 2010,
from www.pacificbridge.com/publication.asp?id¼99
Gummesson, E. (1988). Service quality and product quality combined. Review of
Business, 9(3), 14-19.

202
Guns, W. D., & Valikangas, L. (1998). Rethinking knowledge work: creating value
through idiosyncratic knowledge. Journal of Knowledge Management, 1(4),
287-293.
Gupta, B., Iyer, L. S., & Aronson, J. E. (2000). Knowledge management: Practices and
challenges. Industrial Management & Data Systems, 100(1), 17-21.
Hackman, J. R., & Wageman, R. (1995). Total quality management: Empirical,
conceptual and practical issues. Administrative Science Quarterly, 40(2), 309-
342.
Hair, J. F., Jr., Anderson, R. E., Tatham, R. L., & Black, W. C. (1992). Multivariate
data analysis (3rd ed.). New York: Macmillan.
Hair, J. F., Jr., Anderson, R. E., Tatham, R. L., & Black, W. C. (1998). Multivariate
data analysis (5th ed.). Englewood Cliffs, NJ: Prentice-Hall.
Hair, J. F., Jr., Black, W. C., Babin, B. J., & Anderson, R. E. (2010). Multivariate data
analysis: A global perspective (7th ed.). Upper Saddle River, NJ: Prentice Hall.
Hair, J. F., Jr., Black, W. C., Babin, B. J., Anderson, R. E., & Tatham, R. L. (2006).
Multivariate data analysis (6th ed.). Upper Saddle River, NJ: Prentice Hall.
Han, B. M., & Anantatmula, V. S. (2007). Knowledge sharing in large IT organizations:
A case study. VINE, 34(4), 421-439.
Hansen, M. T. (1999). The search-transfer problem: The role of weak ties in sharing
knowledge across organization subunits. Administrative Science Quarterly,
44(1), 82-111.
Hansen, M. T. (2002). Knowledge networks: Explaining effective knowledge sharing in
multiunit companies. Organization Science, 13(3), 232-248.
Hansen, M. T., Nohria, N., & Tierney, T. (1999). What‟s your strategy for managing
knowledge? Harvard Business Review, 77(2), 106-116.
Hasanali, F. (2002). Critical success factors of knowledge management. Retrieved
November 20, 2003, from
www.kmadvantage.com/docs/km_articles/Critical_Success_Factors_of_KM.pdf
Hedlund, G. (1994). A model of knowledge management and the N-form corporation.
Strategic Management Journal, 15(2), 73-90.
Hendricks, K. B., & Singhal, V. R. (1996). Quality awards and the market value of the
firm: An empirical investigation. Management Science, 42(3), 415-436.
Hendricks, K. B., & Singhal, V. R. (2001a). Firm characteristics, total quality
management and financial performance. Journal of Operations Management,
19(3), 269-285.

203
Hendricks, K. B., & Singhal, V. R. (2001b). The long-run stock price performance of
firms with effective TQM programs. Management Science, 47(3), 359-368.
Hendriks, P. (1999). Why share knowledge? The influence of ICT on the motivation for
knowledge sharing. Knowledge and Process Management, 6(2), 91-100.
Hergenhahn, B. R., & Olson, M. H. (1997). An introduction to theories of learning.
Upper Saddle River, NJ: Prentice Hall.
Hitt, M. A., Hoskisson, R. E., & Ireland, R. D. (2007). Management of strategy:
Concepts and cases. OH: Thomson South-Western.
Hlupic, V., Pouloudi, A., & Rzevski, G. (2002). Towards an integrated approach to
knowledge management: „Hard‟, „soft‟ and „abstract‟ issues. Knowledge and
Process Management, 9(2), 90-102.
Ho, C. T. (2009). The relationship between knowledge management enablers and
performance. Industrial Management & Data Systems, 109(1), 74-97.
Ho, R. (2006). Handbook of univariate and multivariate data analysis and
interpretation with SPSS (1st ed.). Boca Ratan, FL: Chapman & Hall/CRC.
Ho, S. K. M., & Fung, C. K. H. (1994). Developing a TQM excellence model. TQM
Magazine, 6(6), 24-30.
Hoang, D. T., Igel, B., & Laosirihongthong, T. (2006). The impact of total quality
management on innovation, findings from a developing country. International
Journal of Quality & Reliability Management, 23(9), 1092-1117.
Hogg, R. V. (1993). A quality journey. Total Quality Management, 4(2), 195-214.
Holsapple, C. W., & Joshi, K. D. (2000). An investigation of factors that influence the
management of knowledge in organizations. Journal of Strategic Information
Systems, 9(3), 235-261.
Holsapple, C. W., & Singh, M. (2001). The knowledge chain model: Activities for
competitiveness. Expert Systems with Applications, 20(1), 77-98.
Hong, P., Doll, W. J., Nahm, A., & Li, X. (2004). Knowledge sharing in integrated
product development. European Journal of Innovation Management, 7(2), 102-
112.
Hoopes, D. G., & Postrel, S. (1999). Shared knowledge, „glitches‟, and product
development performance. Strategic Management Journal, 20(9), 837-865.
Hoyle, R. H. (1995). The structural equation modeling approach: Basic concepts and
fundamental issues. Thousand Oaks, CA: Sage.
Hsu, M. H., Ju, T. L., Yen, C. H., & Chang, C. M. (2007). Knowledge sharing behavior
in virtual communities: The relationship between trust, self-efficacy, and
outcome expectations. International Journal of Human-Computer Studies, 65(2),
153-169.

204
Hsu, S., & Shen, H. (2005). Knowledge management and its relationship with TQM.
Total Quality Management, 16(3), 351-361.
Hua, H., Chin, K. S., Sun, H., & Xu, Y. (2000). An empirical study on quality
management practices in Shangai manufacturing industries. Total Quality
Management, 11(8), 1111-1122.
Hult, G. T., & Ferrel, O. C. (1997). Global organization learning capacity in purchasing:
Construct and measurement. Journal of Business Research, 40(2), 97-111.
Hung, Y. C., Huang, S. M., Lin, Q. P., & Tsai, M. L. (2005). Critical factors in adopting
a knowledge management system for the pharmaceutical industry. Industrial
Management & Data Systems, 105(2), 164-183.
Huq, Z., & Stolen, J. D. (1998). Total quality management contrasts in manufacturing
and service industries. International Journal of Quality & Reliability
Management, 15(2), 138-161.
Hurley, A. E., Scandura, T. A., Schriesheim, C. A., Brarmick, T., Seers, A., Vandenberg,
R. J., et al. (1997). Exploratory and confirmatory factor analysis: Guidelines,
issues and alternatives. Journal of Organizational Behavior, 18(6), 667-683.
Hussain, F., Lucas, C., & Ali, M. A. (2004). Managing knowledge effectively. Journal
of Knowledge Management Practice. Retrieved March 20, 2011, from
http://www.tlainc.com/articl66.htm
Ishikawa, K. (1985). What is total quality control? The Japanese way. Englewood
Cliffs: Prentice-Hall Inc.
Itami, H. (1987). Mobilizing invisible assets. Boston, MA: Harvard University Press.
Janpen, P., Praneetpolgrang, P., & Horadal, P. (2006). Development of total quality
management (TQM) model for Thai communities knowledge management
systems. Paper presented at International Conference Management Technology,
Tsing Hua University, China, 22-26 May, pp. 1-8.
Jarman, J., & Chopra, P. S. (2008). Business services and the knowledge economy in
Malaysia. International Journal of Sociology and Social Policy, 28(5/6), 193-
203.
Jayasingam, S., Ansari, M.A., & Jantan, M. (2010). Influencing knowledge workers:
The power of top management. Industrial Management & Data Systems, 110(1),
134-151.
Jimenez-Jimenez, D., & Martinez-Costa, M. (2009). The performance effect of HRM
and TQM: A study in Spanish organizations. International Journal of
Operations and Production Management, 29(12), 1266-1289.
Jitpaiboon, T., & Rao, S. S. (2007). A meta-analysis of quality measures in
manufacturing system. International of Quality & Reliability Management,
24(1), 78-102.

205
Johannsen, C. G. (2000). Total quality management in a knowledge management
perspective. Journal of Documentation, 56(1), 42-54.
Jöreskog, K. G., & Sörbom, D. (1993). Structural equation modeling with the SIMPLIS
Command Language. Hillsdale, NJ: Lawrence Erlbaum.
Jöreskog, K. G., & Sörbom, D. (1996). LISREL 8: User’s reference guide. Chicago:
Scientific Software International.
Jöreskog, K., & Sörbom, D. (1998). LISREL 8.20 and PRELIS 2.20 for Windows.
Chicago, IL: Scientific Software International Inc.
Ju, T. L., Lin, B., Lin, C., & Kuo, H. J. (2006). TQM critical factors and knowledge
management value chain activities. Total Quality Management, 17(3), 373-393.
Jun, M., Cai, S., & Shin, H. (2006). TQM practice in maquiladora: Antecedents of
employee satisfaction and loyalty. Journal of Operations Management, 24(6),
791-812.
Juran, J. M. (1988). Juran on planning on quality. New York: Free Press.
Juran, J. M. (1995). A history of managing for quality: The evolution, trends, and future
directions of managing for quality. Wisconsin, USA: ASQC Quality Press.
Juran, J. M. (1999). How to think about quality. In J. M. Juran & A. B. Godfrey (Eds.),
Juran’s quality handbook (pp. 2.1-2.18). New York: McGraw-Hill.
Juran, J. M., & Gryna, F. M. (1988). Quality control handbook (4th ed.). New York:
McGraw-Hill.
Juran, J. M., & Gryna, F. M. (1993). Quality planning and analysis (3rd ed.). New York:
McGraw-Hill.
Juran, J. M., Gryna, F. M., & Bingham, R. S. (1974). Quality control handbook (3rd
ed.). New York: McGraw Hill.
Kasul, R., & Motwani, J. (1995). Total quality management in manufacturing: Thematic
factor assessment. International Journal of Quality & Reliability Management,
2(3), 57-76.
Kaynak, H. (2003). The relationship between total quality management practices and
their effects on firm performance. Journal of Operations Management, 21(4),
405-435.
Kearns, G. S., & Lederer, A. L. (2001). A resource-based view of strategic IT
alignment: How knowledge sharing creates competitive advantage. Decision
Sciences, 34(1), 1-29.
Kelada, J. N. (1996). Integrating reengineering with total quality. USA: ASQC Quality
Press.

206
Kelloway, K. E. (1998). Using LISREL for structural equation modelling: A
researcher’s guide. CA: Sage Publications.
Kerr, S., Schriesheim, C. A., Murphy, C. J., & Stogdill, R. M. (1974). Toward a
contingency theory of leadership based upon the consideration and initiating
structure literature. Organizational Behavior and Human Performance, 12, 62-
82.
Ketokivi, M., & Castaner, X. (2004). Strategic planning as an integrative device.
Administrative Science Quarterly, 49(3), 337-365.
King, W. (1996). IS and the learning organisation. Information Systems Management,
13(3), 78-80.
Kirchenstein, J. J., & Blake, R. (1999). Using ISO 9000 and the European Quality
Award approach to improve competitiveness. In M. J. Stahl (Ed.), Perspectives
in total quality (pp. 343-370). Malden, MA: Blackwell.
Kline, R. B. (1998). Principles and practice of structural equation modeling (1st ed.).
New York: Guilford Press.
Kline, R. B. (2001). Principles and practice of structural equation modeling (2nd ed.).
New York: Guilford Press.
Kline, R. B. (2005). Principles and practice of structural equation modeling (2nd ed.).
New York: Guilford Press.
Kline, R. B. (2010). Principles and practice of structural equation modeling (3rd ed.).
New York: Guilford Press.
Kogut, B., & Zander, U. (1992). Knowledge of the firm, combinative capabilities and
the replication of technology. Organization Science, 3(3), 383-397.
KPMG. (1999). KPMG Consulting, Knowledge Management Research Report 2000.
Retrieved August 3, 2010, from
http://www.providersedge.com/docs/km_articles/KPMG_KM_Research_Report
_2000.pdf
Kruger, V. (2001). Main schools of TQM: “The big five”. The TQM Magazine, 13(3),
146-155.
Kuala Lumpur Structure Plan 2020 (2008). Retrieved August 17, 2010, from
www.dbkl.gov.my/pskl2020/english/economic_base_and_population/index.htm
Kuo, Y. F., Wu, C. M., & Deng, W. J. (2009). The relationships among service quality,
perceived value, customer satisfaction, and post-purchase intention in mobile
value added services. Computers in Human Behavior, 25(4), 887-896.
Lam, S. Y., Lee, V. H., Ooi, K. B., & Phusavat, K. (2012). A structural equation model
of TQM, market orientation and service quality: Evidence from a developing
nation. Managing Service Quality, 22(3), 281-309.
207
Lamoureux, L. (2006). KM4Dev community notes: Developing capacity for the use of
knowledge sharing approaches and techniques. Knowledge Management for
Development Journal, 2(2), 103-108.
Lang, J. C. (2001). Managerial concerns in knowledge management. Journal of
Knowledge Management, 5(1), 43-59.
Lau, H. C., & Idris, M. A. (2001). The soft foundation of the critical success factors on
TQM implementation in Malaysia. The TQM Magazine, 13(1), 51-62.
Laudon, K. C., & Laudon, P. L. (2001). Management information systems. Englewood
Cliffs, NJ: Prentice-Hall.
Lee, C. C., & Yang, J. (2000). Knowledge value chain. Journal of Management
Development. 19(9), 783-793.
Lee, C. C., Yang, J., & Yu, L. M. (2001). The knowledge value of customers and
employees in product quality. Journal of Management Development, 20(8), 691-
704.
Lee, M. C., & Chang, T. (2006). Applying TQM, CMM and ISO 9001 in knowledge
management for software development process improvement. International
Journal Services and Standards, 2(1), 101-115.
Lee, S. M., & Asllani, A. (1997). TQM and BPR: Symbiosis and a new approach for
integration. Management Decision, 35(6), 409-416.
Lee, S. M., & Hong, S. (2002). An enterprise-wide knowledge management system
infrastructure. Industrial Management & Data Systems, 102(1), 7-25.
Lee, S. M., Rho, B. H., & Lee, S. G. (2003). Impact of Malcolm Baldrige National
Quality Award criteria on organizational quality performance. International
Journal of Production Research, 41(9), 2003-2220.
Lee, V. H., Ooi, K. B., Tan, B. I., & Chong, A. Y. L. (2010). A structural analysis of the
relationship between TQM practices and product innovation. Asian Journal of
Technology Innovation, 18(1), 73-96.
Leonard-Barton, D. (1992). The factory as a learning laboratory. Sloan Management
Review, 34(1), 23-38.
Lessard, D. R., & Zaheer, S. (1996). Breaking the silos: distributed knowledge and
strategic responses to volatile exchange rates. Strategic Management Journal,
17(7), 513-533.
Liao, L. F. (2006). A learning organization perspective on knowledge-sharing behavior
and firm innovation. Human Systems Management, 25(4), 227-236.
Liebowitz, J. (1999). Knowledge management handbook. Florida: CRC Press.
Lim, K. K., Ahmed, P. K., & Zairi, M. (1999). Managing for quality through knowledge
management. Total Quality Management, 10(4&5), 615-621.
208
Lin. B., & Ogunyemi, F. (1996). Implications of total quality management in Federal
services: the US experience. International Journal of Public Sector Management,
9(4), 4-11.
Lin, C., & Tseng, S. (2005). The implementation gaps for the knowledge management
system. Industrial Management & Data Systems, 105(2), 208-222.
Lin, C., & Wu, C. (2005). Managing knowledge contributed by ISO 9001:2000.
International Journal of Quality & Reliability Management, 22(9), 968-985.
Lin, H. F. (2007). Knowledge sharing and firm innovation capability: An empirical
study. International Journal of Manpower, 28(3/4), 315-332.
Lin, H. F., & Lee, G. G. (2004). Perceptions of senior managers toward knowledge-
sharing behaviour. Management Decision, 42(1), 108-125.
Lin, H. F., & Lee, G. G. (2005). Impact of organizational learning and knowledge
management factors on e-business adoption. Management Decision, 43(2), 171-
188.
Lin, I., & Schaeffer, N. C. (1995). Using survey participants to estimate the impact of
nonparticipation. Public Opinion Quarterly, 59, 236-258.
Linderman, K. M., Schroeder, R. G., Zaheer, S., Liedtke, C., & Choo, A. S. (2004).
Integrating quality management practices with knowledge creation processes.
Journal of Operations Management, 22(6), 589-607.
Litwin, M. S. (1995). How to measure survey reliability and validity. Thousand Oaks:
Sage Publications.
Lopez, S. P., Peon, J. M. M., & Ordas, C. J. V. (2006). Human resource management as
a determining factor in organizational learning. Management Learning, 37(2),
215-239.
Lozano, A. R. P. (1997). ISO 9000 and the total quality management models. Library
Management, 18(3), 148-150.
Lu, J., Yao, J. E., & Yu, C. S. (2005). Personal innovativeness, social influences and
adoption of wireless Internet services via mobile technology. Journal of
Strategic Information Systems, 14(3), 245-268.
Luan, J., & Serban, A. M. (2002). Technologies, products, and models supporting
knowledge management. New Directions for Institutional Research,
113(Spring), 85-104.
Lubit, R. (2001). Tacit knowledge and knowledge management: The keys to sustainable
competitive advantage. Organizational Dynamics, 29(4), 164-178.
MacCallum, R. C., Browne, M. W., & Sugawara, H. M. (1996). Power analysis and
determination of sample size for covariance structure modelling. Psychological
Methods, 1(2), 130-149.

209
MacNeil, C. (2001). The supervisor as a facilitator of informal learning in work teams.
Journal of Workplace Learning, 13(6), 246-253.
MacNeil, C. M. (2003). Line managers: Facilitators of knowledge sharing in terms.
Employee Relations, 25(3), 294-307.
Madhavan, R., & Grover, R. (1998). From embedded knowledge to embodied
knowledge: New product development as knowledge management. Journal of
Marketing, 62(4), 1-12.
Maier, R., & Remus, U. (2002). Defining process-oriented knowledge management
strategies. Knowledge and Process Management, 9(2), 103-118.
Malaysian Industrial Development Authority (2008). Retrieved August 17, 2010, from
www.mida.gov.my
Malhotra, M., & Grover, V. (1998). An assessment of survey research in POM: From
constructs to theory. Journal of Operations Management, 16(4), 407-425.
Malhotra, N. K., Hall, J., Shaw, M., & Crisp, M. (1996). Marketing research: An
applied orientation. Sydney: Prentice Hall Australia Pty Ltd.
Marsh, H. W., Balla, J. R., & McDonald, R. P. (1988). Goodness-of-fit indexes in
confirmatory factor analysis: The effect of sample size. Psychological Bulletin,
103(3), 391-410.
Marshall, C., Prusak, L., & Shpillberg, D. (1997). Financial risk and the need for
superior knowledge management. In L. Prusak (Ed.), Knowledge in
organizations. Boston, MA: Butterworth-Heinemann.
Martensson, M. (2000). A critical review of knowledge management as a management
tool. Journal of Knowledge Management, 4(3), 204-216.
Martínez-Costa, M., & Jimenez-Jimenez, D. (2008). Are companies that implement
TQM better learning organizations? An empirical study. Total Quality
Management & Business Excellence, 19(11), 1101-1115.
Martinez-Costa, M., & Jimenez-Jimenez, D. (2009). The effectiveness of TQM: The
key role of organizational learning in small businesses. International Small
Business Journal, 27(1), 98-125.
Mauro, N. J. (1999). The Deming leadership method and profound knowledge: A global
prescription. Cross Cultural Management, 6(3), 13-24.
McAdam, R., & Reid, R. (2001). SME and large organization perceptions of knowledge
management: Comparisons and contrasts. Journal of Knowledge Management,
5(3), 231-241.
McDermott, R. (1999). Why information technology inspired but cannot deliver
knowledge management. California management Review, 41(4), 103-117.

210
Mehta, S. C., Lalwani, A. K., & Han, S. L. (2000). Service quality in retailing: Relative
efficiency of alternative measurement scales for different product-service
environments. International Journal of Retail & Distribution Management,
28(2), 62-72.
Mele, C. (2003). Marketing e Qualita` nell’impresa che crea valore. Padova: Cedam.
Miller, C. C., & Cardinal, L. B. (1994). Strategic planning and firm performance: A
synthesis of more than two decades of research. Academy of Management
Journal, 37(6), 1649-1665.
Ministry of International Trade and Industry (1998). Anugerah Cemerlang Industri ’98
(Industrial Excellence Award ’98). Penang: Ministry of International Trade and
Industry.
Mohrman, S. A., Tenkasi, R.V., Lawler, E. E. III, & Ledford, G. E., Jr. (1995). Total
quality management: Practice and outcomes in the largest US firms. Employee
Relations, 17(3), 26-41.
Molapo, D. (2007). Knowledge dissemination: Determining impact. IFLA Conference,
Knowledge Management Workshop, Howard College Campus, University of
KwaZulu-Natal, Durban.
Molina, L. M., Montes, J. L., & Fuentes, M. (2004). TQM and ISO 9000 effects on
knowledge transferability and knowledge transfers. Total Quality Management,
15(7), 1001-1015.
Molina, L. M., Montes, J. L., & Ruiz-Moreno, A. (2007). Relationship between quality
management practices and knowledge transfer. Journal of Operations
Management, 25(3), 682-701.
Morgan, G. A., Gliner, J. A., & Robert, J. (2005). Understanding and evaluating
research in applied and clinical settings. Mahwah, NJ: Lawrence Erlbaum
Associates.
Motwani, J. (2001). Critical factors and performance measures of TQM. The TQM
Magazine, 13(4), 292-300.
National Productivity Centre (1993). Malaysia TQM casebook. Penang: National
Productivity Centre.
Ngai, E. W. T., & Cheng, T. C. E. (1997). Identifying potential barriers to total quality
management using principal component analysis and correspondence analysis.
International Journal of Quality & Reliability Management, 14(4), 391-408.
Nissen, M., Kamel, M., & Sengupta, K. (2000). Integrated analysis and design of
knowledge systems and processes. Information Resources Management Journal,
13(1), 24-43.
Nonaka, I. (1994). A dynamic theory of organizational knowledge creation.
Organization Science, 5(1), 14-37.

211
Nonaka, I., & Takeuchi, H. (1995). The knowledge-creating company. New York, NY:
Oxford University.
Nonaka, I., Byosiere, P., Borucki, P. C., & Konno, N. (1994). Organizational
knowledge creation theory: A first comprehensive test. International Business
Review, 3(4), 337-351.
Nunnally, J. C. (1978). Psychometric theory. New York: McGraw-Hill, Inc.
Nunnally, J. C., & Bernstein, I. H. (1994). Psychometric theory. New York: McGraw
Hill.
O‟Dell, C. (1996). A current review of knowledge management best practices.
Conference of Knowledge Management and the Transfer of Best Practices,
Business Intelligence, London.
O‟Dell, C., & Grayson, C. J. (1998). If only we know what we know: Identification and
transfer of internal best practices. California Management Review, 40(3), 154-
174.
O‟Dell, C., Wiig, K., & Odem, P. (1999). Benchmarking unveils emerging knowledge
management strategies. Benchmarking: An International Journal, 6(3), 202-211.
Olinsky, A., Chen, S., & Harlow, L. (2003). The comparative efficacy of imputation
methods for missing data in structural equation modeling. European Journal of
Operational Research, 151(1), 53-79.
Oltra, V. (2005). Knowledge management effectiveness factors: The role of HRM.
Journal of Knowledge Management, 9(4), 70-86.
Omerzel, D. G., & Antoncic, B. (2008). Critical entrepreneur knowledge dimensions for
the SME performance. Industrial Management & Data Systems, 108(9), 1182-
1199.
Ooi, K. B. (2009). TQM and knowledge management: Literature review and proposed
framework. African Journal of Business Management, 3(11), 633-643.
Ooi, K. B., Bakar, N. A., Arumugam, V., Vellapan, L., & Loke, K. Y. (2007). Does
TQM influence employees‟ job satisfaction? An empirical case analysis.
International Journal of Quality & Reliability Management, 24(1), 62-77.
Ooi, K. B., Lee, V. H., Chong, A. Y. L., & Lin, B. (2011). Does TQM improve
employees‟ quality of work life? Empirical evidence from Malaysia's
manufacturing firms. Production Planning & Control: The Management of
Operations. doi:10.1080/09537287.2011.599344
Ooi, K. B., Teh, P. L., & Chong, A. Y. L. (2009). Developing an integrated model of
TQM and HRM on KM activities. Management Research News, 32(5), 477-490.
Orlikowski, W. J. (2002). Knowing in practice: enacting a collective capability in
distributed organizing. Organization Science, 40(3), 249-273.

212
Osman, I., Ho, T. C. F., & Galang, M. C. (2011). The relationship between human
resource practices and firm performance: An empirical assessment of firms in
Malaysia. Business Strategy Series, 12(1), 41-48.
Pan, S. L., & Scarbrough, H. (1998). A socio-technical view of knowledge sharing at
Buckman Laboratories. Journal of Knowledge Management, 2(1), 55-66.
Pangil, F., & Nasurdin, A. M. (2005). Perceptions of human resource management
practices and knowledge sharing behavior: A proposed framework. Proceedings
of the 6th
Asian Academy of Management Conference, Universiti Sains Malaysia,
Penang, Vol. 1, pp. 77-84.
Parasuraman, A., Zeithaml, V. A., & Berry, L. L. (1985). A conceptual model of service
quality and its implications for future research. Journal of Marketing, 49(4), 41-
50.
Parasuraman, A., Zeithaml, V. A., & Berry, L. L. (1988). SERVQUAL: A multiple-item
scale for measuring consumer perceptions of service quality. Journal of
Retailing, 64(1), 12-40.
Parasuraman, A., Zeithaml, V. A., & Berry, L. L. (1991). Refinement and reassessment
of the SERVQUAL scale. Journal of Retailing, 67(4), 420-450.
Perry, C. (1994). A structured approach to presenting Phd thesis: Notes for candidates
and their supervisors. Paper presented to the ANZ Doctoral Consortium,
University of Sydney, pp. 1-32.
Pfister, I. (2002). Knowledge sharing in real time. Natural Gas, 18(7), 6-10.
Philips Quality (1995). Philips quality – Let’s make things better, Corporate Quality
Bureau. Eindhoven, The Netherlands: Philips Electronics N.V.
Phillips, L. W., Chang, D. R., & Buzzell, R. D. (1983). Product quality, cost position,
and business performance: A test of some key hypotheses. Journal Marketing,
47(2), 26-43.
Phusavat, K., Kanchana, R., & Helo, P. (2007). Supplier management: Past, present and
anticipated future perspectives. International Journal of Management and
Enterprise Development, 4(5), 502-519.
Pieris, C., David, L., & William, M. (2003). Excellence in knowledge management: An
empirical study to identify critical factors and performance measures. Measuring
Business Excellence, 7(2), 29-45.
Podsakoff, P. M., MacKenzie, S. B., Lee, J. Y., & Podsakoff, N. P. (2003). Common
method variance in behavioral research: A critical review of the literature and
recommended remedies. Journal of Applied Psychology, 88(5), 879-903.
Poh, J. P. (2000). Total quality management (TQM) in Malaysia: A comparative study
on employees‟ perceptions on management practices in TQM and non-TQM
companies. Unpublished Master‟s project. Universiti Tun Abdul Razak, Kuala
Lumpur, Malaysia.

213
Powell, T. C. (1995). Total quality management as competitive advantage: A review
and empirical study. Strategic Management Journal, 16(1), 15-37.
Prajogo, D. I. (2003). The comparative analysis of TQM practices and quality
performance between manufacturing and service firms in Australia. Proceedings
of the ANZAM 2003 Operations Management Symposium, Sydney, 12-13 Jun,
pp. 175-186.
Prajogo, D. I. (2005). The comparative analysis of TQM practices and quality
performance between manufacturing and service firms. International Journal of
Service Industry Management, 16(3), 217-228.
Prajogo, D. I. (2006). The relationship between innovation and business performance –
a comparative study between manufacturing and service firms. Knowledge and
Process Management, 13(3), 218-225.
Prajogo, D. I., & Cooper, B. K. (2010). The effect of people-related TQM practices on
job satisfaction: A hierarchical model. Production Planning & Control: The
Management of Operations, 21(1), 26-35.
Prajogo, D. I., & Sohal, A. S. (2003). The relationship between TQM practices, quality
performance, and innovation performance: An empirical examination.
International Journal of Quality & Reliability Management, 20(8), 901-918.
Prajogo, D. I., & Sohal, A. S. (2004). Transitioning from total quality management to
total innovation management: An Australian case. International Journal of
Quality & Reliability Management, 21(8), 861-875.
Prajogo, D. I., & Sohal, A. S. (2006). The integration of TQM and technology/R&D
management in determining quality and innovation performance. Omega, 34(3),
296-312
Prasad, B. (2001). Total value management – a knowledge management concept for
integrating TQM into concurrent product and process development. Knowledge
and Process Management, 8(2), 105-122.
Punch, K. F. (2000). Developing effective research proposals. London: Sage
Publications.
Quintas, P., Lefrere, P., & Jones, G. (1997). Knowledge management: A strategic
agenda. Journal of Long Range Planning, 30(3), 385-391.
Rampersad, H. K. (2005). Managing total quality: Enhancing Personal and Company
Value. New Delhi, India: Tata McGraw-Hill.
Redmond, W. H. (2002). The potential impact of artificial shopping agents in e-
commerce markets. Journal of Interactive Marketing, 16(1), 56-71.
Ribiere, V. M., & Sitar, A. S. (2003). Critical role of leadership in nurturing a
knowledge supporting culture. Knowledge Management Research and Practice,
1(1), 39-48.

214
Robbins, S. P. (2003). Organizational behaviour: Concepts, controversies, applications
(11th ed.). USA: Prentice-Hall.
Roberts, B. (1996, September 9). Intranet as knowledge manager. Web Week, p. 30.
Robertson, M., & O‟Malley Hammersley, G. (2000). Knowledge management practices
within a knowledge intensive firm: The significance of the people management
dimension. Journal of European Industrial Training, 24(2/3/4), 241-253.
Ross, J. E. (1993). Total quality management. Delray Beach, FL: St. Lucie Press.
Roth, W. (1998). Perspective middle management: The missing link. The TQM
Magazine, 10(1), 6-9.
Ruhi, U. (2003). Knowledge networks and lattices: A framework for intra and inter-
organizational knowledge sharing. Unpublished paper. McMaster University,
Ontario, Canada.
Rullani, E. (1992). Economia delle risorse immateriali: Una introduzione. Sinergie, 29,
8-50.
Rungtusanatham, M. (2000). The quality and motivational effects of statistical process
control. Journal of Quality Management, 4(2), 243-264.
Rungtusanatham, M., Anderson, J. C., & Dooley, K. L. (1997). Conceptualizating
organizational implementation and practice of statistical process control. Journal
of Quality Management, 2(1), 113-137.
Russell, R. S., & Taylor, B. W. (2006). Operation management: Quality and
competitiveness in a global environment (5th ed.). River Street: John Wiley &
Sons, Inc.
Safa, M. S., Shakir, F., & Ooi, K. B. (2006). Knowledge management: Practice and
performance of NGO in Maldives. International Journal of Management &
Entrepreneurship, 2(1), 69-86.
Salleh, Y., & Goh, W. K. (2002). Managing human resources toward achieving
knowledge management. Journal of Knowledge Management, 6(5), 457-468.
Samat, N., Ramayah, T., & Mat Saad, N. (2006). TQM practices, service quality, and
market orientation: Some empirical evidence from a developing country.
Management Research News, 29(11), 713-728.
Samson, D., & Terziovski, M. (1999). The relationship between total quality
management practices and operational performance. Journal of Operations
Management, 17(4), 393-409.
Santos-Vijande, M. L., & Ălvarez-González, L. I. (2007). Innovativeness and
organizational innovation in total quality oriented firms: The moderating role of
market turbulence. Technovation, 27(1), 514-532.

215
Saraph, J. V., Benson, P. G., & Schroeder, R. G. (1989). An instrument for measuring
the critical factors of quality management. Decision Sciences, 20(4), 810-829.
Schaupp, L. C., Carter, L., & McBride, M. E. (2010). E-file adoption: A study of US
taxpayers‟ intentions. Computer in Human Behavior, 26(4), 636-644.
Schulz, M., & Jobe, L. A. (2001). Codification and tacitness as knowledge management
strategies: An empirical exploration. The Journal of High Technology
Management Research, 12(1), 139-165.
Schumacker, R. E., & Lomax, R. G. (1996). A beginner's guide to structural equation
modeling. Mahwah, N.J: Lawrence Erlbaum Associates, Inc.
Segars, A. H., & Grover, V. (1998). Strategic information systems planning success: An
investigation of the construct and its measurement. MIS Quarterly, 22(2), 139-
163.
Sekaran, U. (2003). Research methods for business: A skill building approach (4th ed.).
New York: John Wiley and Sons.
Sharp, D. (2003). Knowledge management today: Challenges and opportunities.
Information Systems Management, 20(2), 32-37.
Shetty, Y. K. (1993). The Quest for quality excellence: Lessons from the Malcolm
Baldrige National Quality Award. Advanced Management Journal, 58(1), 34-40.
Shiba, S., Graham, A., & Walden, D. (1990). A new American TQM. Portland, OR:
Productivity Press.
Shin, M., Holden, T., & Schmidt, R. A. (2001). From knowledge theory to management
practice: Towards an integrated approach. Information Processing and
Management, 37(2), 335-355.
Sila, I., & Ebrahimpour, M. (2002). An investigation of the total quality management
survey based research published between 1989 and 2000. International Journal
of Quality & Reliability Management, 19(7), 902-970.
Sila, I., & Ebrahimpour, M. (2003). Examination and comparison of the critical factors
of total quality management (TQM) across countries. International Journal of
Production Research, 41(2), 235-268.
Silvestro, R. (1998). The manufacturing TQM and service quality literatures:
Synergistic or conflicting paradigms? International Journal of Quality &
Reliability Management, 15(3), 303-328.
Sit, W. Y. (2008). The impact of TQM on customer satisfaction: an empirical analysis
of service organizations in Malaysia. Unpublished Master thesis. Multimedia
University, Malaysia.
Sit, W. Y., Ooi, K. B., Lin, B., & Chong, A. Y. L. (2009). TQM and customer
satisfaction in Malaysia‟s service sector. Industrial Management & Data
Systems, 109(7), 957-975.

216
Sitkin, S. B., Sutcliff, K. M., & Schroeder, R. G. (1994). Distinguish control from
learning total quality management: A contingency perspective. Academy of
Management Review, 19(3), 537-564.
Skyrme, D., & Amidon, D. (1997). The knowledge agenda. Journal of Knowledge
Management, 1(1), 27-37.
Smith, L. D., Campbell, J. F., Subramanian, A., Bird, D. A., & Nelson, A. C. (2001).
Strategic planning for municipal information systems: Some lessons from a large
U.S. city. The American Review of Public Administration, 31(2), 139-157.
Soliman, F., & Spooner, K. (2000). Strategies for implementing knowledge
management: Role of human resource management. Journal of Knowledge
Management, 4(4), 337-345.
Sparkes, J. R., & Miyake, M. (2000). Knowledge transfer and human resource
development practices: Japanese firms in Brazil and Mexico. International
Business Review, 9(5), 599-612.
Spreng, R. A., MacKenzie, S. B., & Olshavsky, R. W. (1996). A re-examination of the
determinants of consumer satisfaction. Journal of Marketing, 60(3), 15-32.
Stankosky, M., & Baldanza, C. (2001). A systems approach to engineering a KM
system. Unpublished manuscript.
Steenkamp, J. B. E. M., & van Trijp, H. C. M. (1991). The use of LISREL in validating
marketing constructs. International Journal of Research in Marketing, 8(4), 283-
299.
Stenmark, D. (2002). Group cohesiveness and extrinsic motivation in virtual groups:
Lessons from an action case study of electronic brainstorming. In R. H. Sprague
(Ed.), Proceedings of the 35th Hawaii International Conference on System
Sciences, IEEE Computer Society Press, Los Alamitos, CA. pp. 160-169.
Sternberg, R. J. (1983). Components of human intelligence. Cognition, 15(1), 1-48.
Stickley, A., & Winterbottom, A. (1994). The nature of quality assurance and statistical
methods in BS 5750. The Statistician, 43(3), 349-370.
Storey, J., & Barnett, E. (2000). Knowledge management initiatives: Learning from
failure. Journal of Knowledge Management, 4(2), 145-156.
Sun, H. (2000). Total quality management, ISO 9000 certification and performance
improvement. International Journal of Quality and Reliability Management,
17(2), 168-179.
Sureshchandar, G. S., Rajendran, C., & Anatharaman, R. N. (2001). A conceptual
model for total quality management in service organizations. Total Quality
Management, 12(3), 343-363.
Tari, J. J. (2005). Components of successful total quality management. The TQM
Magazine, 17(2), 182-194.

217
Tari, J. J., Molina, J. F., & Castejon, J. L. (2007). The relationship between quality
management practices and their effects on quality outcomes. European Journal
of Operational Research, 183(2), 483-501.
Tavana, M., Mohebbi, B., & Kennedy, D. T. (2003). Total quality index: A
benchmarking tool for total quality management. Benchmarking: An
International Journal, 10(6), 507-527.
Teece, D. J. (2000). Strategies for managing knowledge assets: The role of firm
structure and industrial context. Long Range Planning, 33(1), 35-54.
Teh, P. L., & Yong, C. C. (2011). Knowledge sharing in IS personnel: Organizational
behavior‟s perspective. Journal of Computer Information Systems, 51(4), 11-21.
Teh, P. L., Ooi, K. B., & Yong, C. C. (2008). Does TQM impact on role stressors? A
conceptual model. Industrial Management & Data Systems, 108(8), 1029-1044.
Teh, P. L., Yong, C. C., Arumugam, V., & Ooi, K. B. (2009). Does total quality
management reduce employees‟ role conflict? Industrial Management & Data
Systems, 109(8), 1118-1136.
Terziovski, M., & Samson, D. (1999). The link between total quality management
practice and organizational performance. International Journal of Quality &
Reliability Management, 16(3), 226-237.
Terziovski, M., & Samson, D. (2000). The effect of company size on the relationship
between TQM strategy and organizational performance. The TQM Magazine,
12(2), 144-148.
Terziovski, M., Howell, A., Sohal, A., & Morrison, M. (2000). Establishing mutual
dependence between TQM and the learning organization: A multiple case study
analysis. The Learning Organization, 7(1), 23-31.
Thiagarajan, T., & Zairi, M. (1997a). A review of total quality management in practice:
Understanding the fundamentals through examples of best practice application-
Part III. The TQM Magazine, 9(6), 414-417.
Thiagarajan, T., & Zairi, M. (1997b). A review of total quality management in practice:
Understanding the fundamentals through examples of best practice application-
Part I. The TQM Magazine, 9(4), 270-286.
Thiagarajan, T., & Zairi, M. (1997c). A review of total quality management in practice:
Understanding the fundamentals through examples of best practice application-
Part II and III. The TQM Magazine, 9(5), 344-356.
Tiwana, A. (2000). The knowledge management toolkit: Practical techniques for
building a knowledge management system. New Jersey: Prentice Hall.
Tiwana, A. (2001). The essential guide to knowledge management: e-business and CRM
applications. Upper Saddle River, NJ: Prentice Hall.
218
Tseng, S. M. (2008). Knowledge management system performance measure index.
Expert Systems with Applications, 34(1), 734-745.
Ulrich, J. W. (2009). Test of a structural model to investigate the impact of instructor
knowledge, attitudes, and contextual constraints on intent to use Web 2.0 in
online courses. (Doctor of Education Dissertation), Graduate School of Western
Carolina University, pp. 1-196.
Valkokari, K., & Helander, N. (2007). Knowledge management in different types of
strategic SME networks. Management Research News, 30(8), 597-608.
Van Zolingen, S. J., Streumer, J. N., & Stooker, M. (2001). Problems in knowledge
management: A case study of a knowledge-intensive company. International
Journal of Training and Development, 5(3), 168-184.
Vermeulen, W. (1996). TQM in retail departmental grocery and clothing chain stores in
South Africa. The TQM Magazine, 8(6), 20-23.
Vicari, S. (1991). L’impresa Vivente. Itinerario in una diversa concezione. Milano: Etas
Libri.
von Krogh, G., & Roos, J. (1995). An essay on corporate epistemology. Strategic
Management Journal, 15, 53-71.
von Krogh, G., Roos, J., & Kleine, D. (1998). Knowing in firms: Understanding,
managing and measuring knowledge. London: Sage.
Vouzas, F., & Psychogios, A. G. (2007). Assessing managers‟ awareness of TQM. The
TQM Magazine, 19(1), 62-75.
Waddell, D., & Stewart, D. (2008). Knowledge management as perceived by quality
practitioners. The TQM Journal, 20(1), 31-44.
Walczak, S. (2005). Organisational knowledge management structure. The Learning
Organisation, 12(4), 330-339.
Wang, W. T. (2009). Knowledge management adoption in times of crisis. Industrial
Management & Data Systems, 109(4), 445-462.
Wang, Y., Lo, H., & Hui, Y. V. (2003). The antecedents of service quality and product
quality and their influences on bank reputation: Evidence from banking industry
in China. Managing Service Quality, 13(1), 72-83.
Wei, J., Van Der Ende, L., & Lin, B. (2009). Customer-focused e-business model for
the oil industry. Journal of Computer Information Systems, 49(3), 11-20.
Wells, D. W., & Jagdish, N. S. (1971). Factor analysis in marketing research. In D. A.
Aaker (Ed.), Multivariate analysis in marketing: Theory and application (pp.
212-227). Belmont, CA: Wads worth Publishing Company, Inc.
219
Wijnhoven, F. (1999). Development scenarios for organizational memory information
systems. Journal of Management Information Systems, 16(1), 121-147.
Wilkinson, A. (1992). The other side of quality: „Soft‟ issues and the human resource
dimension. Total Quality Management, 3(3), 323-329.
Williams, L. J., & Holahan, P. (1994). Parsimony-based fit indices for multiple-
indicator models: Do they work? Structural Equation Modeling: A
Multidisciplinary Journal, 1(2), 161-189.
Wilson, D. D., & Collier, D. A. (2000). An empirical investigation of the Malcolm
Baldrige National Quality Award causal model. Decision Sciences, 31(2), 361-
390.
Winter, S. G. (1987). Knowledge and competence as strategic asset. In D. Teece (Ed.),
The competitive challenge: Strategies for industrial renewal. Cambridge, MA:
Ballinger Publishing.
Wong, A. (2002). The management of customer relationships in the retail industry.
Unpublished PhD thesis. Faculty of Business & Economics, Monash University,
pp. 1-377.
Wong, K. Y. (2005). Critical success factors for implementing knowledge management
in small and medium enterprises. Industrial Management & Data Systems,
105(3), 261-279.
Wong, K. Y., & Aspinwall, E. (2003). Is knowledge management equivalent to
information technology? Proceedings of the 4th European Conference on
Knowledge Management, Oxford University, Oxford, pp. 989-997.
Woon, K. C. (2000). TQM implementation: Comparing Singapore‟s service and
manufacturing leaders. Managing Service Quality, 10(5), 318-331.
Wright, P. M., McMahan, G. C., & McWilliams, A. (1994). Human resources and
sustained competitive advantage: A resource-based perspective. International
Journal of Human Resource Management, 5(2), 301-326.
Xie, K. L. (2011). Examining structural relationships among cognitive destination,
image, destination personality and behavioural intentions: The case of Beijing.
Unpublished MPhil thesis. The Hong Kong Polytechnic University, pp. 1-379.
Ya‟acob, Z. (2008). A structural relationship between total quality management,
strategic control systems and performance of Malaysian local governments.
Unpublished Doctoral thesis. Universiti Utara Malaysia.
Yang, H. D., Moon, Y. J., & Rowley, C. (2009). Social influence on knowledge
worker‟s adoption of innovative information technology. Journal of Computer
Information Systems, 50(1), 25-34.
Yang, J. (2004). Knowledge management opportunities for cycle time reduction.
International Journal of Innovation and Learning, 1(2), 192-207.

220
Yang, J. (2008). Managing knowledge for quality assurance: An empirical study.
International Journal of Quality and Reliability Management, 25(2), 109-124.
Yang, T., Chen, M. C., & Su, C. T. (2003). A study of ISO 9000 process, motivation
and performance. Integrated Manufacturing System, 14(2), 153-159.
Yang, Z., Jun, M., & Peterson, R. T. (2004). Measuring customer perceived online
service quality: Scale development and managerial implications. International
Journal of Operations & Production Management, 24(1), 1149-1174.
Yeh, Y. J., Lai, S. Q., & Ho, C. T. (2006). Knowledge management enablers: A case
study. Industrial Management & Data Systems, 106(6), 793-810.
Yong, J., & Wilkinson, A. (1999). The state of total quality management: A review. The
International Journal of Human Resource Management, 10(1), 137-161.
Yong, J., & Wilkinson, A. (2001). Rethinking total quality management. Total Quality
Management, 12(2), 247-258.
Youssef, M. A., & Zairi, M. (1995). Benchmarking critical factors for TQM: Part II –
Empirical results from different regions in the world. Benchmarking – An
International Journal, 2(2), 3-19.
Zack, M. H. (1999). Developing a knowledge strategy. California Management Review,
41(3), 125-145.
Zahra, S. A., & George, G. (2002). Absorptive capacity: a review, reconceptualization,
and extension. Academy of Management Review, 27(2), 185-203.
Zahra, S. A., Neubaum, D. O., & Larrañeta, B. (2007). Knowledge sharing and
technological capabilities: The moderating role of family involvement. Journal
of Business Research, 60(10), 1070-1079.
Zairi, M. (1994). Leadership in TQM Implementation: Some Case Examples. The TQM
Magazine, 6(6), 9-16.
Zairi, M. (1995). Benchmarking innovation for best practice. World Class Design to
Manufacture, 2(3), 33-40.
Zairi, M. (1997). Business process management: A boundaryless approach to modern
competitiveness. Business Process Management Journal, 3(1), 64-80.
Zander, U., & Kogut, B. (1995). Knowledge and the speed of the transfer and imitation
of organizational capabilities: An empirical test. Organization Science, 6(1), 76-
92.
Zetie, S. (2002). The quality circle approach to knowledge management. Managerial
Auditing Journal, 17(6), 317-321.
Zhang, Z. H. (1999). Developing an instrument for measuring TQM implementation in a
Chinese Context. SOM Research Report, 99A48, University of Groningen,
Netherlands.

221
Zhang, Z. H. (2000). Implementation of total quality management: An empirical study
of Chinese manufacturing firms. Unpublished PhD thesis. University of
Groningen, Netherlands.
Zhang, Z. H., Waszink, A. B., & Wijngaard, J. (2000). An instrument for measuring
TQM implementation for Chinese manufacturing companies. International
Journal of Quality & Reliability Management, 17(7), 730-755.
Zikmund, W. G. (2000). Business research methods (6th ed.). FL: The Dryden Press.
Zupan, N., & Kase, R. (2007). The role of HR actors in knowledge networks.
International Journal of Manpower, 28(3/4), 243-259.

222
APPENDIX A
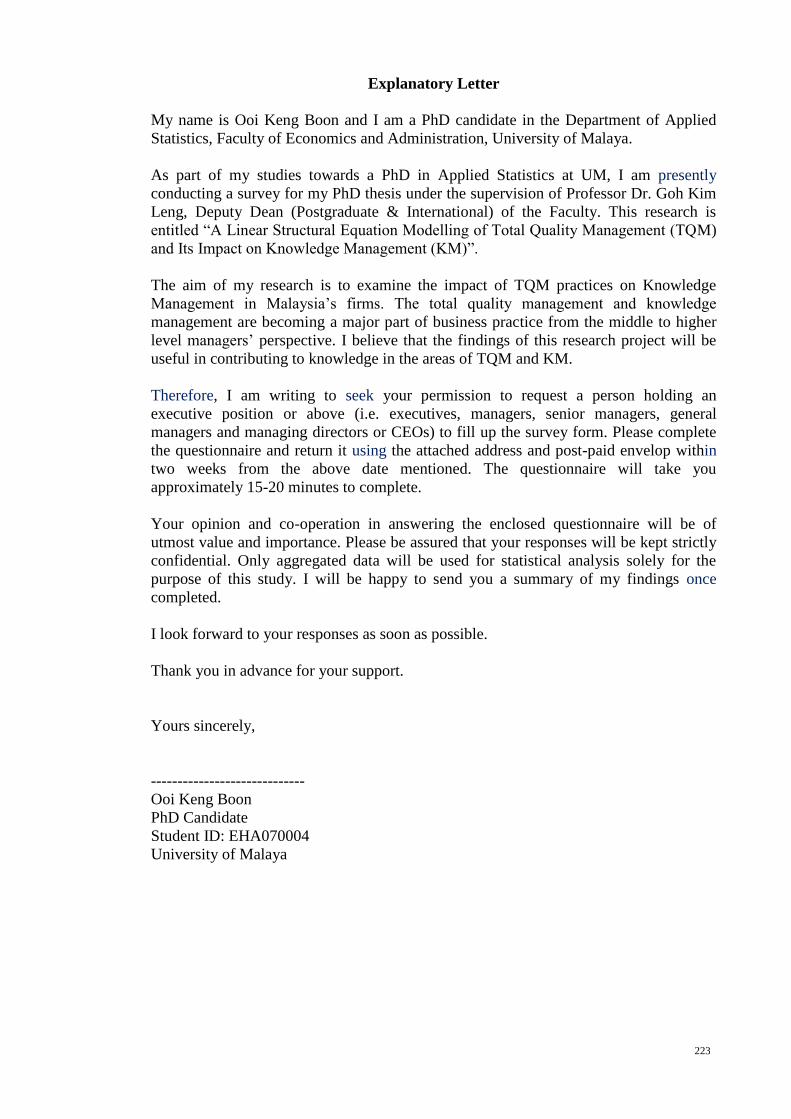
223
Explanatory Letter
My name is Ooi Keng Boon and I am a PhD candidate in the Department of Applied
Statistics, Faculty of Economics and Administration, University of Malaya.
As part of my studies towards a PhD in Applied Statistics at UM, I am presently
conducting a survey for my PhD thesis under the supervision of Professor Dr. Goh Kim
Leng, Deputy Dean (Postgraduate & International) of the Faculty. This research is
entitled “A Linear Structural Equation Modelling of Total Quality Management (TQM)
and Its Impact on Knowledge Management (KM)”.
The aim of my research is to examine the impact of TQM practices on Knowledge
Management in Malaysia‟s firms. The total quality management and knowledge
management are becoming a major part of business practice from the middle to higher
level managers‟ perspective. I believe that the findings of this research project will be
useful in contributing to knowledge in the areas of TQM and KM.
Therefore, I am writing to seek your permission to request a person holding an
executive position or above (i.e. executives, managers, senior managers, general
managers and managing directors or CEOs) to fill up the survey form. Please complete
the questionnaire and return it using the attached address and post-paid envelop within
two weeks from the above date mentioned. The questionnaire will take you
approximately 15-20 minutes to complete.
Your opinion and co-operation in answering the enclosed questionnaire will be of
utmost value and importance. Please be assured that your responses will be kept strictly
confidential. Only aggregated data will be used for statistical analysis solely for the
purpose of this study. I will be happy to send you a summary of my findings once
completed.
I look forward to your responses as soon as possible.
Thank you in advance for your support.
Yours sincerely,
-----------------------------
Ooi Keng Boon
PhD Candidate
Student ID: EHA070004
University of Malaya

224
APPENDIX B
A Linear Structural Equation Modelling of TQM
Practices and its Impact on Knowledge
Management
Survey Questionnaire
The purpose of this survey is pertaining to your organization‟s Total Quality
Management (TQM) adoption and Knowledge Management Behavior. Please
answer all questions to the best of your knowledge. There are no wrong responses
to any of these statements. All responses are completely confidential.
Thank you for your participation.
Instructions:
1) There are FOUR (4) sections in this questionnaire. Please answer ALL
questions in ALL sections.
2) Completion of this form will take you approximately 20 to 30 minutes.
3) Please feel free to share your comment in the space provided. The contents
of this questionnaire will be kept strictly confidential.
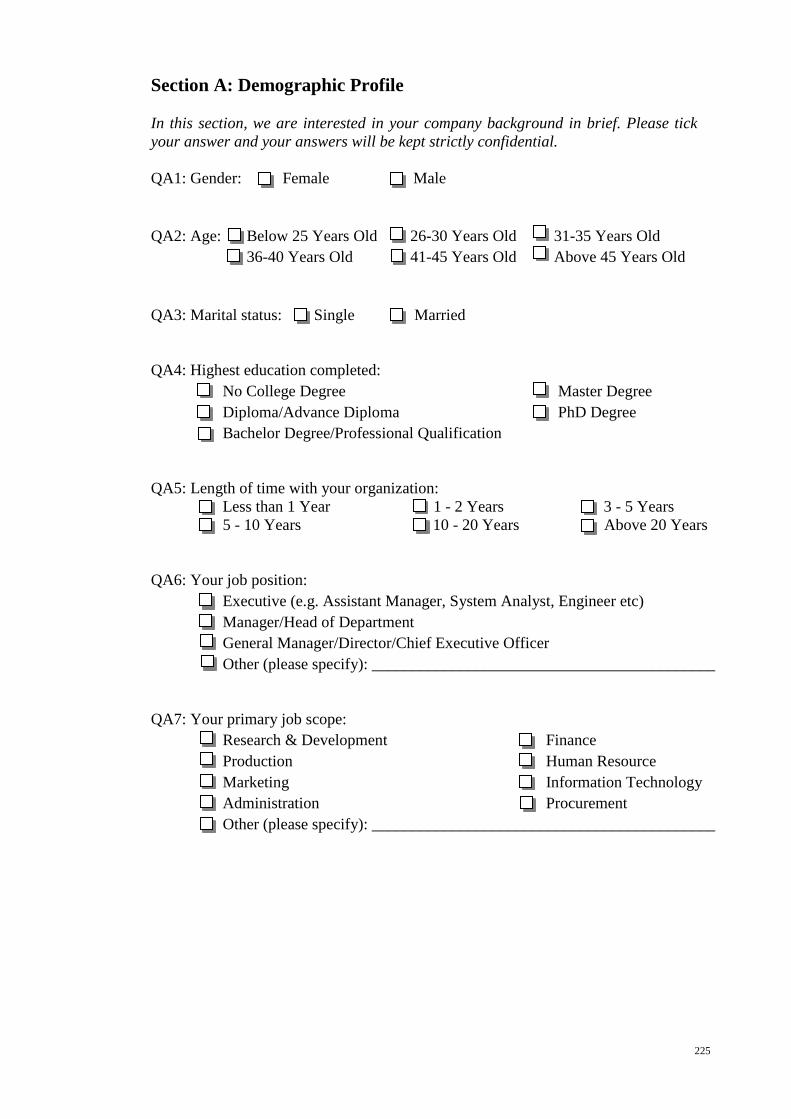
225
Section A: Demographic Profile
In this section, we are interested in your company background in brief. Please tick
your answer and your answers will be kept strictly confidential.
QA1: Gender: Female Male
QA2: Age: Below 25 Years Old 26-30 Years Old 31-35 Years Old
36-40 Years Old 41-45 Years Old Above 45 Years Old
QA3: Marital status: Single Married
QA4: Highest education completed:
No College Degree Master Degree
Diploma/Advance Diploma PhD Degree
Bachelor Degree/Professional Qualification
QA5: Length of time with your organization:
Less than 1 Year 1 - 2 Years 3 - 5 Years
5 - 10 Years 10 - 20 Years Above 20 Years
QA6: Your job position:
Executive (e.g. Assistant Manager, System Analyst, Engineer etc)
Manager/Head of Department
General Manager/Director/Chief Executive Officer
Other (please specify): ___________________________________________
QA7: Your primary job scope:
Research & Development Finance
Production Human Resource
Marketing Information Technology
Administration Procurement
Other (please specify): ___________________________________________

226
Section B: Details of Organization
In this section, we are interested in your company background in brief. Please tick
your answer and your answers will be kept strictly confidential.
QB1: Category of your organization‟s product or services:
Manufacturing (please specify):
Electrical & electronics products Food products
Chemical & chemical products Rubber & plastic products
Textiles & textile products Machinery & hardware
Other (please specify):________________________________________
Services (please specify):
Education Healthcare Travel & tourism
Finance Insurance Entertainment
Other (please specify):________________________________________
QB2: Number of employees in your organization:
Less than 50 50 - 200 Above 200
QB3: Status of your organization:
ISO Certified.
If yes, how long has your organization been committed to the certification?
Please specify: _______________
Planning to ISO Certification
Non-ISO Certified
QB4: Ownership:
Foreign owned company
State owned company
Local private family owned company
Chinese
Non-Chinese

227
Section C: Total Quality Management Practices
This section is seeking your opinion regarding the Total Quality Management (TQM)
practices in your company. Respondents are asked to indicate the extent to which they
agreed or disagreed with each statement using a 7-point Likert scale [(1) to (4) =
strongly disagree; (5) to (7) = strongly agree] response framework. Please circle one
number per line to indicate the extent to which you agree or disagree with the following
statements.
No. Questions Strongly
Disagree
Strongly
Agree
C1 Leadership
LD1 Senior executives share similar beliefs
about the future direction of this
organization.
1 2 3 4 5 6 7
LD2 Senior managers actively encourage
change and implement a culture of
improvement, learning, and innovation
towards „excellence‟.
1 2 3 4 5 6 7
LD3 Senior managers actively participate in
quality management and improvement
process.
1 2 3 4 5 6 7
LD4 Senior managers strongly encourage
employee involvement in quality
management and improvement activities.
1 2 3 4 5 6 7
LD5 Senior managers arrange adequate
resources for employee education and
training.
1 2 3 4 5 6 7
No. Questions Strongly
Disagree
Strongly
Agree
C2 Strategic Planning
SP1 We know our company mission.
1 2 3 4 5 6 7
SP2 We have a comprehensive and structured
planning process which regularly sets and
reviews short and long-term goals.
1 2 3 4 5 6 7
SP3 When we develop our plans, policies and
objectives, we always incorporate the
needs of all stakeholders.
1 2 3 4 5 6 7
SP4 We have a written statement of strategy
covering all business operations which is
articulated and agreed by our senior
managers.
1 2 3 4 5 6 7
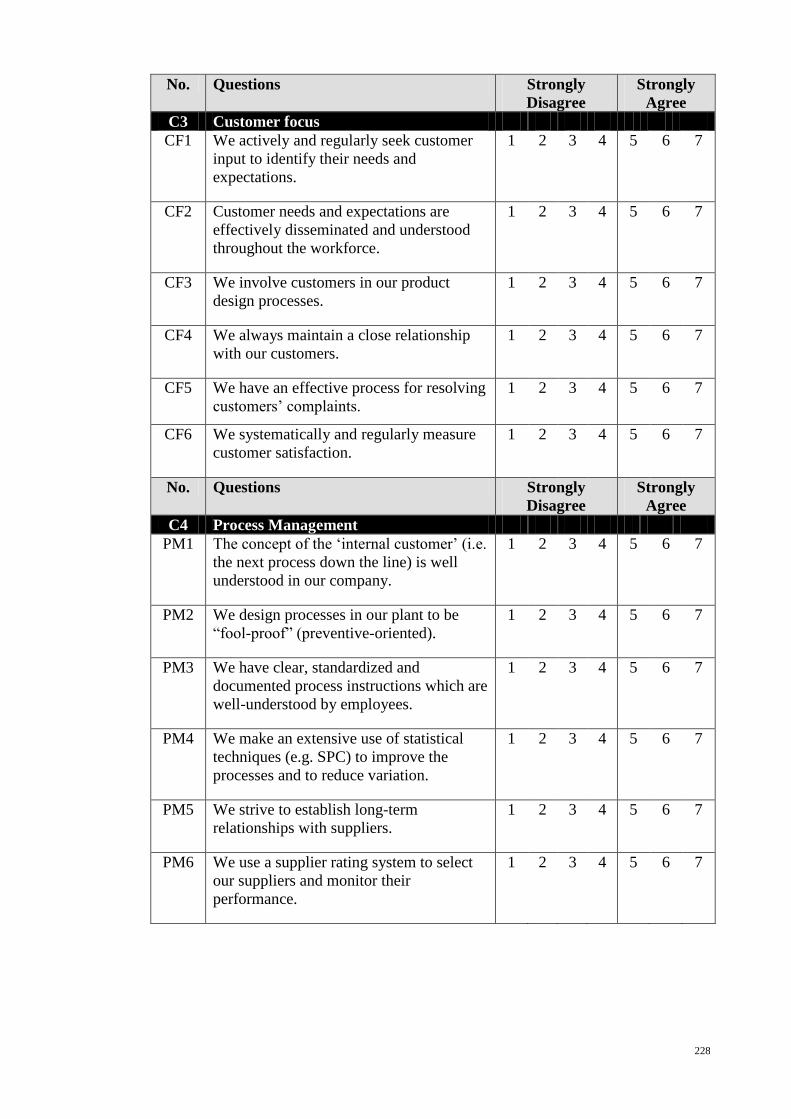
228
No. Questions Strongly
Disagree
Strongly
Agree
C3 Customer focus
CF1 We actively and regularly seek customer
input to identify their needs and
expectations.
1 2 3 4 5 6 7
CF2 Customer needs and expectations are
effectively disseminated and understood
throughout the workforce.
1 2 3 4 5 6 7
CF3 We involve customers in our product
design processes.
1 2 3 4 5 6 7
CF4 We always maintain a close relationship
with our customers.
1 2 3 4 5 6 7
CF5 We have an effective process for resolving
customers‟ complaints.
1 2 3 4 5 6 7
CF6 We systematically and regularly measure
customer satisfaction.
1 2 3 4 5 6 7
No. Questions Strongly
Disagree
Strongly
Agree
C4 Process Management
PM1 The concept of the „internal customer‟ (i.e.
the next process down the line) is well
understood in our company.
1 2 3 4 5 6 7
PM2 We design processes in our plant to be
“fool-proof” (preventive-oriented).
1 2 3 4 5 6 7
PM3 We have clear, standardized and
documented process instructions which are
well-understood by employees.
1 2 3 4 5 6 7
PM4 We make an extensive use of statistical
techniques (e.g. SPC) to improve the
processes and to reduce variation.
1 2 3 4 5 6 7
PM5 We strive to establish long-term
relationships with suppliers.
1 2 3 4 5 6 7
PM6 We use a supplier rating system to select
our suppliers and monitor their
performance.
1 2 3 4 5 6 7

229
No. Questions Strongly
Disagree
Strongly
Agree
C5 Information and Analysis
IA1 Our company has an effective
performance measurement system to track
overall organizational performance.
1 2 3 4 5 6 7
IA2 Up-to-date data and information of
company‟s performance are always readily
available for those who need it.
1 2 3 4 5 6 7
IA3 Senior management regularly holds
meeting to review company‟s performance
and uses it as a basis for decision-making.
1 2 3 4 5 6 7
IA4 We engage in an active competitive
benchmarking program to measure our
performance against the „best practice‟ in
the industry.
1 2 3 4 5 6 7
No. Questions Strongly
Disagree
Strongly
Agree
C6 Human Resource Management
HR1 We have an organization-wide training
and development process, including career
path planning, for all our employees.
1 2 3 4 5 6 7
HR2 Our company practices two-way
communication between management and
staff.
1 2 3 4 5 6 7
HR3 Employee satisfaction is formally and
regularly measured.
1 2 3 4 5 6 7
HR4 Employee flexibility, multi-skilling and
training are actively used to support
performance improvement.
1 2 3 4 5 6 7
HR5 We always maintain a work environment
that contributes to the health, safety and
well-being of all employees.
1 2 3 4 5 6 7

230
Section D: Knowledge Management Behavior
This section is seeking your opinion regarding the Knowledge Management (KM)
Behavior in your company. Respondents are asked to indicate the extent to which they
agreed or disagreed with each statement using a 7-point Likert scale [(1) to (4) =
strongly disagree; (5) to (7) = strongly agree] response framework. Please circle one
number per line to indicate the extent to which you agree or disagree with the following
statements.
No. Questions Strongly
Disagree
Strongly
Agree
D1 Knowledge Acquisition
KA1 We have a system that allows us to learn
successful practices from other
organizations.
1 2 3 4 5 6 7
KA2 The company is in touch with
professionals and expert technicians.
1 2 3 4 5 6 7
KA3 The organization encourages the
employees to join formal or informal
networking made up by people from
outside the organization.
1 2 3 4 5 6 7
KA4 We often ask our customers what they
want or need.
1 2 3 4 5 6 7
KA5 The employees attend fairs and exhibitions
regularly.
1 2 3 4 5 6 7
KA6 There is a consolidated and resourceful R
& D policy.
1 2 3 4 5 6 7
KA7 New ideas and approaches on work
performance are experienced
continuously.
1 2 3 4 5 6 7
KA8 The organizational systems and
procedures support innovation.
1 2 3 4 5 6 7

231
No. Questions Strongly
Disagree
Strongly
Agree
D2 Knowledge Distribution
KD1 All employees are informed about the aims
of the company.
1 2 3 4 5 6 7
KD2 Meetings are periodically held to inform all
the employees about the latest innovations
in the company.
1 2 3 4 5 6 7
KD3 The company has formal mechanisms to
guarantee the sharing of the best practices
among the different fields of the activity.
1 2 3 4 5 6 7
KD4 Information technology is used to improve
the flow of information and to encourage
communication between individuals within
the company.
1 2 3 4 5 6 7
KD5 There are individuals within the
organization who take part in several teams
or divisions and act as links between them.
1 2 3 4 5 6 7
KD6 There are individuals responsible for
collecting, assembling and distributing
internally employees‟ suggestions.
1 2 3 4 5 6 7
No. Questions Strongly
Disagree
Strongly
Agree
D3 Knowledge Application
KAP1 Our organization always apply the latest
technology in the market/or our
organization is always up-to-date in
technology application.
1 2 3 4 5 6 7
KAP2 Our employees are well trained in the latest
knowledge in their respective position for
better job performance.
1 2 3 4 5 6 7
KAP3 Our training process is relevant and
effective to improve performance and
productivity.
1 2 3 4 5 6 7
KAP4 Our organization has processes for
applying experimental knowledge.
1 2 3 4 5 6 7
KAP5 Our organization has processes for
applying knowledge to solve new
problems.
1 2 3 4 5 6 7
Thank you for your time, opinions and comments.
~ The End ~