Embed Size (px)
Citation preview
7/24/2019 TIMA 2013
http://slidepdf.com/reader/full/tima-2013 1/4
Proceedings of the International Conference on Trends in Industrial Measurements and Automation (TIMA-2013),
Department of Instrumentation Engineering, MIT Campus, Anna University, Chennai-44. Page 137
LEVEL CONTROL OF HORIZONTAL CYLINDRICAL TANK USING
INTELLIGENT CONTROL TECHNIQUES1. M. Ulaganathan M.Tech., Assistant Professor ([email protected]), 2. K. Abinaya, UG student
([email protected]), 3. M.Aarthi, UG student ([email protected])
Department of Electronics and Instrumentation
Easwari Engineering College
ABSTRACT: This paper proposes control techniques forthe nonlinear level process of a horizontal cylindrical
tank. The control techniques used are Neuro controllerand Fuzzy Logic Controller which are implementedusing LabVIEW. Based on the performance criteria, itcould be concluded that Fuzzy Logic Controllereffectively improves the performance of the system.
KEYWORDS: Fuzzy Logic Controller, Horizontal
cylindrical tank, Neuro Controller, Nonlinear Level
Process
I. INTRODUCTIONHorizontal cylindrical tank is unique in its shape,
as its area varies with increase in height. Many pro-
cess industries use horizontal tank for storage of oil orchemical liquid since it has a wide surface area. Levelcontrol of tanks is necessary to maximize productivity
and efficiency and to ensure safety. Poor operationsinclude overfilling of the tanks due to which cata-
strophic reactions may take place.
Traditionally, a nonlinear process has to be
linearized first before an automatic controller can be
effectively applied. This is typically achieved by
adding a reverse nonlinear function to compensate for
the nonlinearity. There was a proposal in 2005 [1]
which showed the level control of a horizontal tank
implemented using Fuzzy-PID Cascade controller.The application of a neural network trained for a
given set of inputs and output was published in 1993[2] which was used for level control in petrochemical
tanks.
In this paper, the first section describes the
process and the identification of transfer function. In
the second section, we will discuss the conventional
control technique and its tuning method. The third
section illustrates the training of a neural network and
its implementation as a controller. Finally the Fuzzy
logic control (FLC) technique is discussed and the
most effective control method is established based on
the comparison of Integral Absolute error (IAE).
II. PROCESS DESCRIPTION
A.SCHEMATIC DIAGRAM
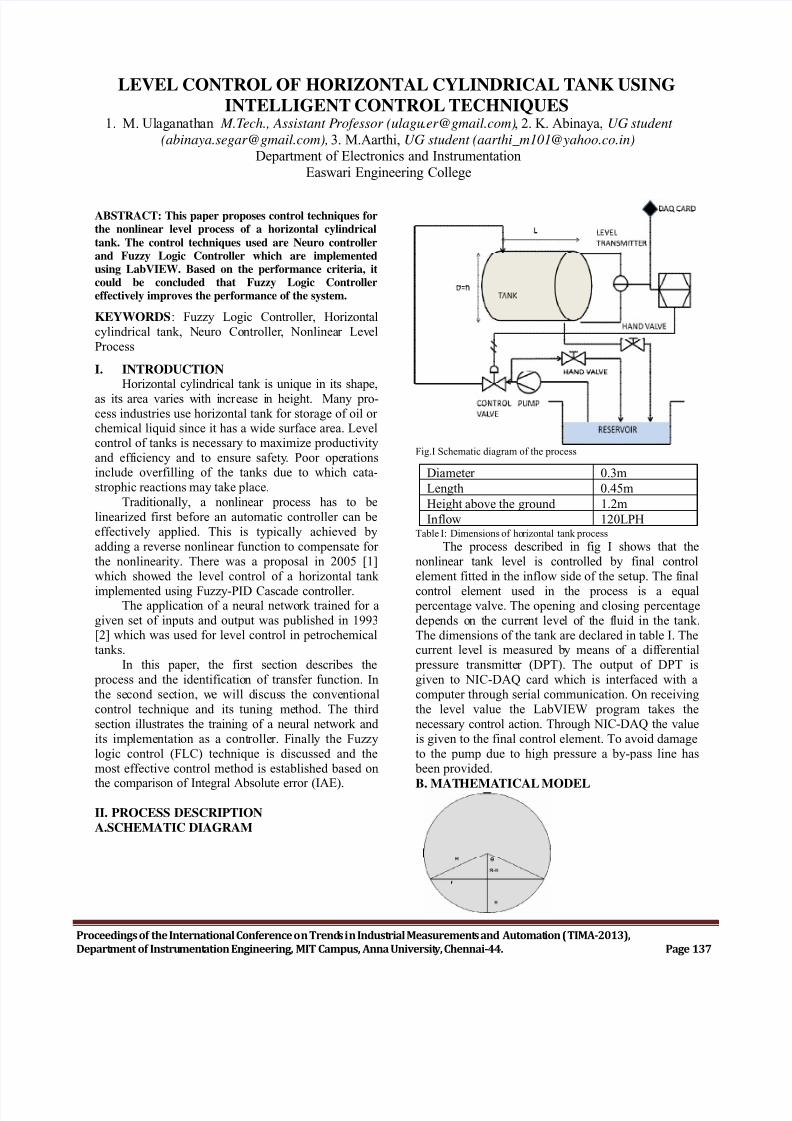
Fig.I Schematic diagram of the process
Diameter 0.3m
Length 0.45m
Height above the ground 1.2m
Inflow 120LPHTable I: Dimensions of horizontal tank process
The process described in fig I shows that the
nonlinear tank level is controlled by final control
element fitted in the inflow side of the setup. The final
control element used in the process is a equal percentage valve. The opening and closing percentage
depends on the current level of the fluid in the tank.
The dimensions of the tank are declared in table I. Thecurrent level is measured by means of a differential
pressure transmitter (DPT). The output of DPT is
given to NIC-DAQ card which is interfaced with a
computer through serial communication. On receiving
the level value the LabVIEW program takes the
necessary control action. Through NIC-DAQ the value
is given to the final control element. To avoid damage
to the pump due to high pressure a by-pass line has
been provided.
B. MATHEMATICAL MODEL
7/24/2019 TIMA 2013
http://slidepdf.com/reader/full/tima-2013 2/4
Proceedings of the International Conference on Trends in Industrial Measurements and Automation (TIMA-2013),
Department of Instrumentation Engineering, MIT Campus, Anna University, Chennai-44. Page 138
Fig II Side view of the cylindrical tank
The mathematical model is derived byconsidering the side view of the tank of radius R and
level in the tank (H). The nonlinearity of the level is
calculated by subtracting the area of the triangle from
the area of the sector as shown in fig II. The resultingarea A is differentiated to obtain a term for changing
level in the tank.
A 2) - r(R-H)
= ((2HR-H2)-1/2) [( ) + 6HR-2H2-2R 2] (1)
From (1), the Mass-Balance equation is derived as,
l * = q 1 - q 2
Substituting for from (1)
= (2)
III. STEADY STATE CHARACTERISTICS
The mathematical model is designed usingLabVIEW based on (2) as derived above. We obtained
the steady state characteristics curve by varying the
inflow to the process in steps and plotting the graph
for inflow vs. steady state.
Fig IV Steady State Characteristics for inflow values ranging from
1-32 LPH
The Steady state characteristics graph shown in
fig IV is divided into seven regions. We obtained the
transfer function for every region and tabulated the
result as follows:
Region
Steady
state
(cm)
K
Rise
time
(cm)
Transfer
Function
0-6 1.15 0.25 0.196
6-10 3.19 0.51 0.176
10-14 6.25 0.77 0.138
14-18 10.33 1.01 0.97
18-22 15.43 1.28 0.118
22-26 21.55 1.53 0.185
26-30 28.7 1.79 0.274
Table II : Transfer function by gain scheduling of the seven regions
A. SYSTEM IDENTIFICATIONSystem identification process is carried out using
the system identification function ‘ident ’ in MATLAB.
The input (inflow) and output (level) data from the
real time process in open loop arrangement applied to
the ident tool to obtain the transfer function of the
system. We obtained the transfer function for
maximum inflow as
We verified the real time transfer function to be
same as that of the simulation results. Hence theestimated transfer function is used in the following
sections for designing the controllers.
IV. CONVENTIONAL CONTROLLERWe designed PI controller for each of the
seven regions defined in table II using gain
scheduling. The gain scheduling is achieved by tuning
the PI parameters (i.e. Proportional gain, integral time,
derivative time) using Ziegler Nichols tuning rules.
The controller is designed in such a way thatdepending upon the input set value, the PI values for
the corresponding region is fired. This closed loop
system is implemented in LabVIEW and the responsecurve is obtained.
A. ZIEGLER NICHOLS TUNINGWe implemented the Ziegler Nichols tuning by
obtaining sustained oscillations using a P controller.
The PI parameters were calculated using the Ziegler
Nichols rules.
Region
(cm)
Proportional
gain (Kp)
Integral
gain (Ki)
0-6 58.55 0.038
6-10 25.62 0.028
10-14 13.64 0.031
14-18 7.16 0.02618-22 7 0.033
22-26 9.123 0.032
26-30 11.54 0.028Table III : PI parameters calculated for the seven regions of gainscheduling using Ziegler Nichols tuning rules.
7/24/2019 TIMA 2013
http://slidepdf.com/reader/full/tima-2013 3/4
Proceedings of the International Conference on Trends in Industrial Measurements and Automation (TIMA-2013),
Department of Instrumentation Engineering, MIT Campus, Anna University, Chennai-44. Page 139
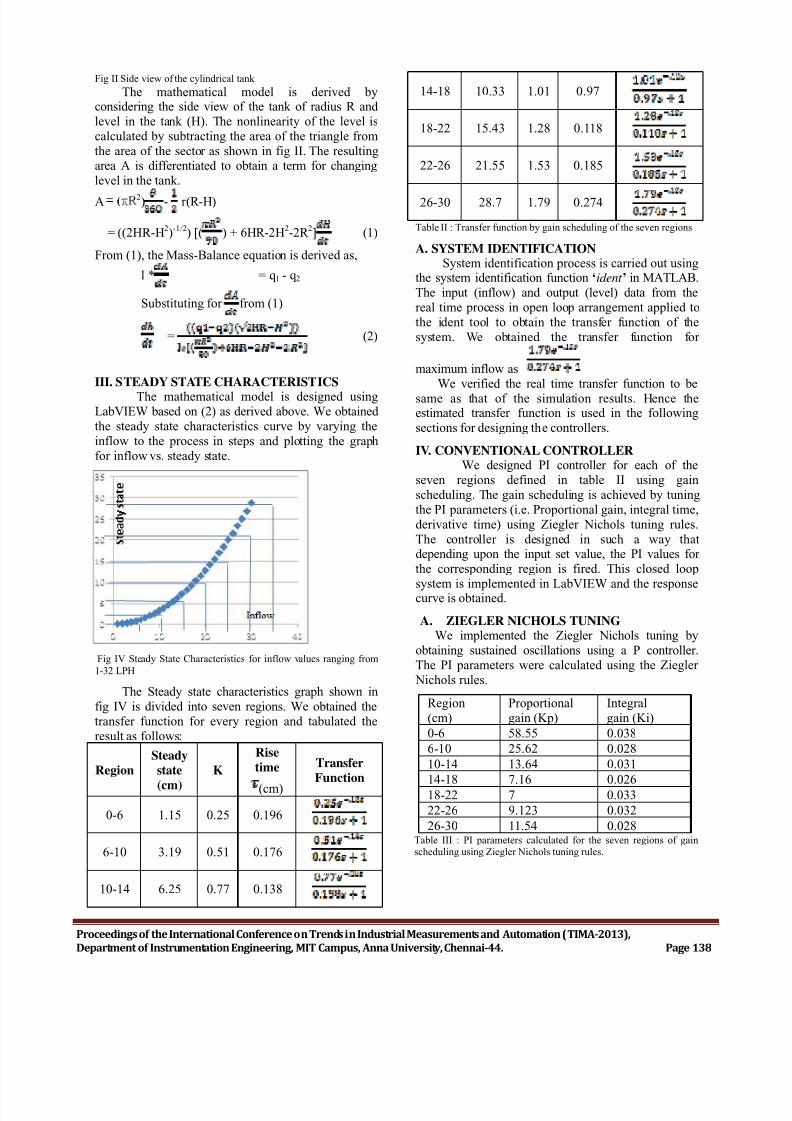
Fig V: Closed loop response by Ziegler Nichols tuning forconsecutive step inputs of 12cm, 20cm, 15cm
The PI controller designed for all the regions as
defined in table III is used to obtain the closed loopresponse shown in fig V.
IV.NEURAL NETWORKWe observed inaccurate control and large
overshoot in conventional controllers which could
cause instability for certain set values . To overcomethese drawbacks, we opted for Neuro Controller.
To implement Neuro Controller, we obtained real
time data by running the open loop system and trained the neural network with the inputs (set point and error)
and target output (percentage valve opening). We
designed the neural network in MATLAB using
‘nntool’ function and simulation block using ‘Gensim’
function. The Neuro controller designed in MATLAB
is called in LabVIEW using ‘mathscript’ function.
Fig VIII : Closed loop control using Neuro Controller for a set valueof 12cm, 20cm, 15cm
The controller called in LabVIEW is then
interfaced with the process to obtain the the closed
loop response shown in fig VIII.
V. FUZZY LOGIC CONTROLLERWe observed slow response in the neural
controller which we expected to overcome using FLC.
To design a fuzzy logic controller, we first
declared the universe of discourse for the input
variables (error and change in error) and the output
variable (percentage of valve opening). We defined the
membership functions and the rule base using the
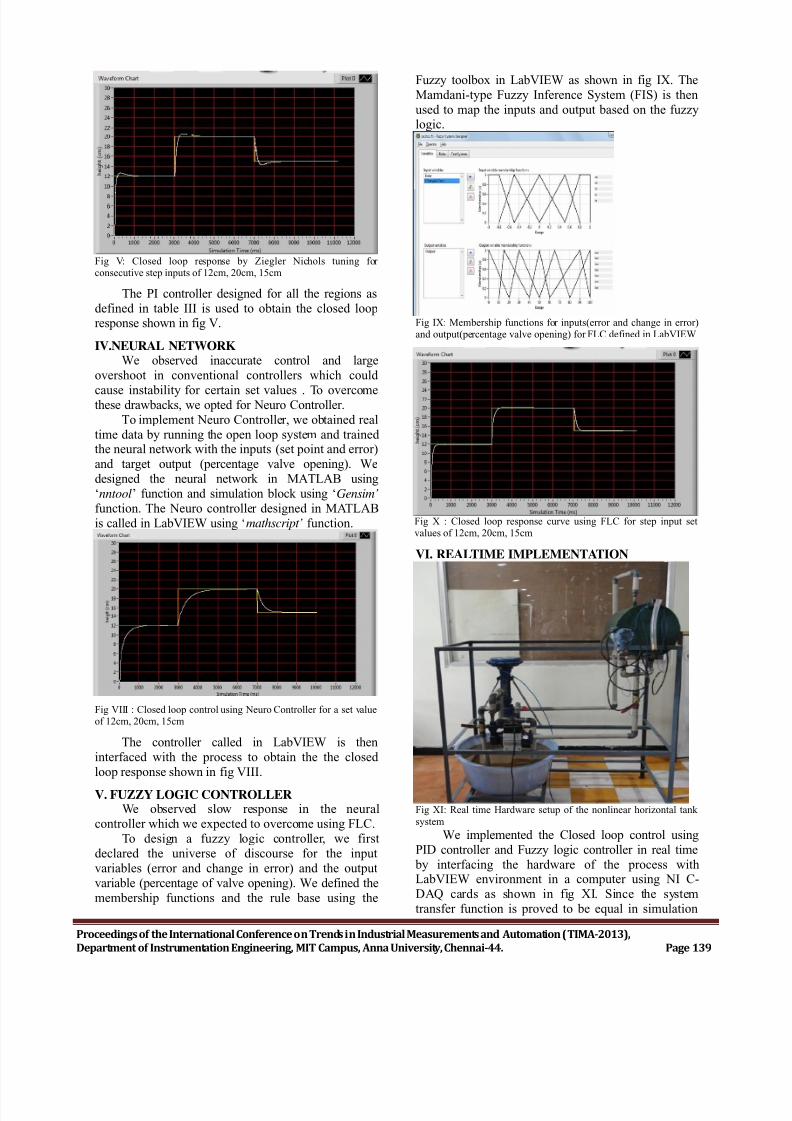
Fuzzy toolbox in LabVIEW as shown in fig IX. The
Mamdani-type Fuzzy Inference System (FIS) is then
used to map the inputs and output based on the fuzzylogic.
Fig IX: Membership functions for inputs(error and change in error)and output(percentage valve opening) for FLC defined in LabVIEW
Fig X : Closed loop response curve using FLC for step input setvalues of 12cm, 20cm, 15cm
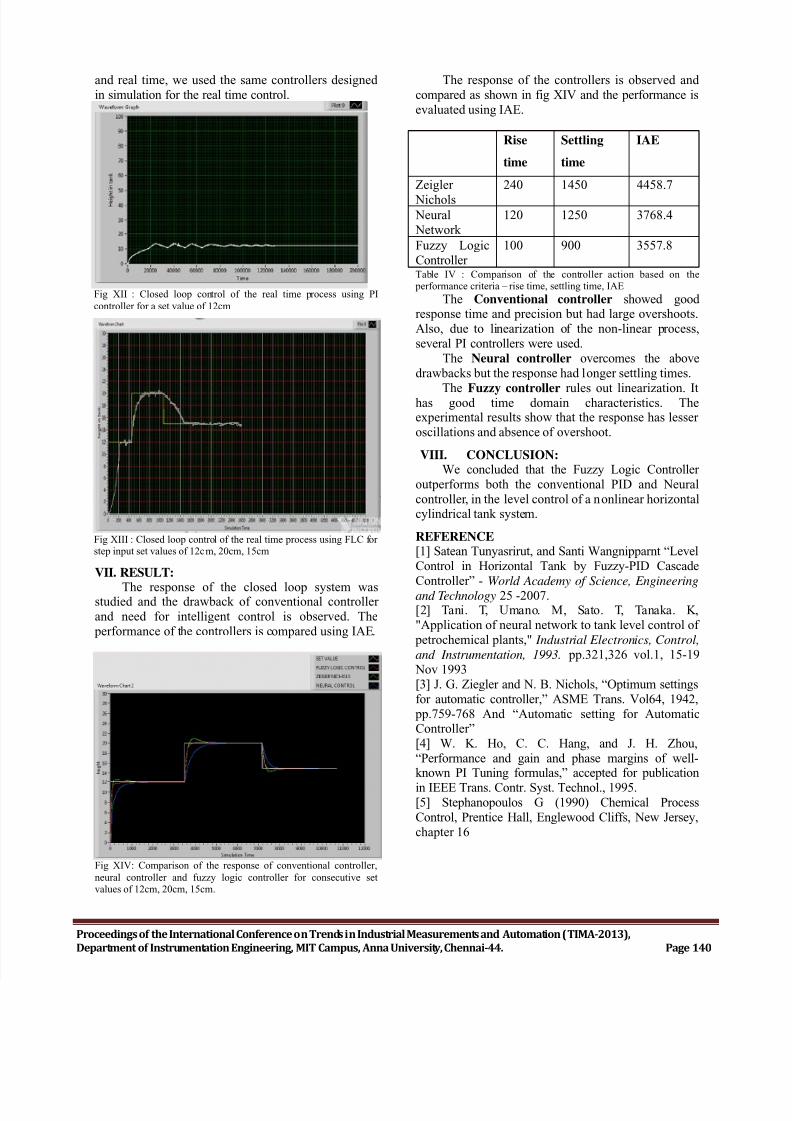
VI. REALTIME IMPLEMENTATION
Fig XI: Real time Hardware setup of the nonlinear horizontal tank
system
We implemented the Closed loop control using
PID controller and Fuzzy logic controller in real time
by interfacing the hardware of the process withLabVIEW environment in a computer using NI C-
DAQ cards as shown in fig XI. Since the system
transfer function is proved to be equal in simulation
7/24/2019 TIMA 2013
http://slidepdf.com/reader/full/tima-2013 4/4
Proceedings of the International Conference on Trends in Industrial Measurements and Automation (TIMA-2013),
Department of Instrumentation Engineering, MIT Campus, Anna University, Chennai-44. Page 140
and real time, we used the same controllers designed
in simulation for the real time control.
Fig XII : Closed loop control of the real time process using PI
controller for a set value of 12cm
Fig XIII : Closed loop control of the real time process using FLC forstep input set values of 12cm, 20cm, 15cm
VII. RESULT:
The response of the closed loop system wasstudied and the drawback of conventional controller
and need for intelligent control is observed. The
performance of the controllers is compared using IAE.
Fig XIV: Comparison of the response of conventional controller,
neural controller and fuzzy logic controller for consecutive setvalues of 12cm, 20cm, 15cm.
The response of the controllers is observed and
compared as shown in fig XIV and the performance is
evaluated using IAE.
Rise
time
Settling
time
IAE
Zeigler
Nichols
240 1450 4458.7
Neural
Network
120 1250 3768.4
Fuzzy Logic
Controller
100 900 3557.8
Table IV : Comparison of the controller action based on the performance criteria – rise time, settling time, IAE
The Conventional controller showed goodresponse time and precision but had large overshoots.
Also, due to linearization of the non-linear process,
several PI controllers were used.
The Neural controller overcomes the above
drawbacks but the response had longer settling times.
The Fuzzy controller rules out linearization. Ithas good time domain characteristics. Theexperimental results show that the response has lesser
oscillations and absence of overshoot.
VIII. CONCLUSION:We concluded that the Fuzzy Logic Controller
outperforms both the conventional PID and Neural
controller, in the level control of a nonlinear horizontalcylindrical tank system.
REFERENCE [1] Satean Tunyasrirut, and Santi Wangnipparnt “Level
Control in Horizontal Tank by Fuzzy-PID Cascade
Controller” - World Academy of Science, Engineering
and Technology 25 -2007.[2] Tani. T, Umano. M, Sato. T, Tanaka. K,
"Application of neural network to tank level control of
petrochemical plants," Industrial Electronics, Control,
and Instrumentation, 1993. pp.321,326 vol.1, 15-19
Nov 1993
[3] J. G. Ziegler and N. B. Nichols, “Optimum settings
for automatic controller,” ASME Trans. Vol64, 1942,
pp.759-768 And “Automatic setting for AutomaticController”
[4] W. K. Ho, C. C. Hang, and J. H. Zhou,
“Performance and gain and phase margins of well-known PI Tuning formulas,” accepted for publication
in IEEE Trans. Contr. Syst. Technol., 1995.[5] Stephanopoulos G (1990) Chemical Process
Control, Prentice Hall, Englewood Cliffs, New Jersey,
chapter 16