Embed Size (px)
Citation preview

Working Papers|026| March 2002
Liviu Voinea
SEE the Difference: Romanian Regional Trade and Investment
The wiiw Balkan Observatory
www.balkan-observatory.net
About Shortly after the end of the Kosovo war, the last of the Yugoslav dissolution wars, theBalkan Reconstruction Observatory was set up jointly by the Hellenic Observatory, theCentre for the Study of Global Governance, both institutes at the London School ofEconomics (LSE), and the Vienna Institute for International Economic Studies (wiiw).A brainstorming meeting on Reconstruction and Regional Co-operation in the Balkanswas held in Vouliagmeni on 8-10 July 1999, covering the issues of security,democratisation, economic reconstruction and the role of civil society. It was attendedby academics and policy makers from all the countries in the region, from a number ofEU countries, from the European Commission, the USA and Russia. Based on ideas anddiscussions generated at this meeting, a policy paper on Balkan Reconstruction andEuropean Integration was the product of a collaborative effort by the two LSE institutesand the wiiw. The paper was presented at a follow-up meeting on Reconstruction andIntegration in Southeast Europe in Vienna on 12-13 November 1999, which focused onthe economic aspects of the process of reconstruction in the Balkans. It is this policypaper that became the very first Working Paper of the wiiw Balkan ObservatoryWorking Papers series. The Working Papers are published online at www.balkan-observatory.net, the internet portal of the wiiw Balkan Observatory. It is a portal forresearch and communication in relation to economic developments in Southeast Europemaintained by the wiiw since 1999. Since 2000 it also serves as a forum for the GlobalDevelopment Network Southeast Europe (GDN-SEE) project, which is based on aninitiative by The World Bank with financial support from the Austrian Ministry ofFinance and the Oesterreichische Nationalbank. The purpose of the GDN-SEE projectis the creation of research networks throughout Southeast Europe in order to enhancethe economic research capacity in Southeast Europe, to build new research capacities bymobilising young researchers, to promote knowledge transfer into the region, tofacilitate networking between researchers within the region, and to assist in securingknowledge transfer from researchers to policy makers. The wiiw Balkan ObservatoryWorking Papers series is one way to achieve these objectives.
The wiiw Balkan Observatory
Global Development Network Southeast Europe
This study has been developed in the framework of research networks initiated and monitored by wiiwunder the premises of the GDN–SEE partnership. The Global Development Network, initiated by The World Bank, is a global network ofresearch and policy institutes working together to address the problems of national andregional development. It promotes the generation of local knowledge in developing andtransition countries and aims at building research capacities in the different regions. The Vienna Institute for International Economic Studies is a GDN Partner Institute andacts as a hub for Southeast Europe. The GDN–wiiw partnership aims to support theenhancement of economic research capacity in Southeast Europe, to promoteknowledge transfer to SEE, to facilitate networking among researchers within SEE andto assist in securing knowledge transfer from researchers to policy makers. The GDN–SEE programme is financed by the Global Development Network, theAustrian Ministry of Finance and the Jubiläumsfonds der OesterreichischenNationalbank. For additional information see www.balkan-observatory.net, www.wiiw.ac.at andwww.gdnet.org
The wiiw Balkan Observatory
1
SEE the Difference: Romanian regional trade and investment*
Liviu Voinea* March 2002
* The author would like to thank Michael Landesmann, Gabor Hunya, Vladimir Gligorov, Edward Christie, Vasily Astrov and Paul Brenton for their useful comments and remarks on an earlier draft. * Liviu Voinea is doctor in economics, Lecturer at the Faculty of European Integration Studies, Romanian-American University, and Research Fellow at the Romanian Academic Society. E-mail: [email protected]

2
1. Romanian economy dynamics in the regional context Over the transition years, the Romanian economy has proven to follow a path of its own, at a speed of its own. Episodes of recession and growth alternated, and, while limited spreading out and contagion effects occurred, this paper holds that boom and bust cycles were mainly driven by inner, rather than by external factors. The “ever closer” ties with EU led to Romania’s de facto integration in the EU as far as trade flows are concerned (about two thirds of the Romanian foreign trade takes place with EU). EU is also the largest investor in the Romanian economy (63% of FDI stock) and is becoming its largest donor, through the various pre-accession programs that it finances. Nevertheless, convergence towards similar structures of production between Romania and EU shows little improvement 1. Moreover, the fact that Romania is one of the largest net exporters of workforce from the region 2 indicates that wage differentials are large enough to stimulate temporary and/or permanent emigration, meaning that convergence over labor costs is still far ahead. Of course, these situations may end up with short and medium term positive results, as the differences in the production structures encourage specialization, and the money earned abroad return as foreign remittances in the domestic economy 3. These positive implications may, in turn, create further incentives for resources’ allocation outside the economic convergence paradigm. While the slim rate of growth recorded in 2000 could be regarded as “peripheral”4 (driven by the demand in the central area), there is little doubt that the path of growth the economy entered in 2001 owes much to the internal X-efficiency reserves. On the one hand, the 15% aggregate GDP fall during 1997-1999, when EU economy was rising, demonstrates the limited level of convergence achieved until now. On the other hand, the annual average growth rate of 5% forecast for the period 2001-20055 significantly exceeds the expectations for the EU area, therefore providing the premises for catching-up towards higher convergence levels.
1 See Catalin Pauna, Bianca Pauna, Output decline and the re-allocation of labor, “Economic transition in Romania”, World Bank and Romanian Center for Economic Policies, 2000. The authors calculate that 31.3 out of 100 workers had to change their job in 1989 for Romania to reach similar production structures with Southern EU-average (Greece, Italy, Portugal, Spain), the similar figure for 1997 being 33.1 workers out of 100. Since unemployment rate grew from virtually zero in 1989 to above 10%, it means that restructuring occurred, but not necessarily in the right direction. 2 According to Renate Langewiesche, Martina Lubyova, Migration, migration and free movement of persons: an issue for current and future EU members , WIIW working paper, 2000. 3 For a detailed analysis of foreign remittances in the Romanian economy, see Daniel Daianu, Liviu Voinea, Mugur Tolici, Balance of payments analysis in Romania. The role of foreign remittances, Romanian Center for Economic Policies, Working Paper 33/2001. According to this study, foreign remittances flows exceeded all other autonomous capital flows in 2000, amounting to 3.3% of GDP. 4 Gabor Hunya, Romania: mo dest recovery, WIIW Monthly Report 11/2000. 5 According to the Pre -Accession Economic Program committed by the Romanian Government on October 2001.
3
The gravity model explains commercial and investment flows with EU and with Eastern Europe inasmuch as cultural distance6 is primarily accounted for. Italy and France are Romania’s largest commercial partners and investment sources, while German, Austrian and Hungarian firms are more actively in the North-West of Romania. The inclusion in European networks of production also shapes foreign trade and investment dynamics differently from the predictions of the classic gravity model7. Placed on one of the rather remote circles of integration, Romania embraced regional cooperation, yet not as an alternative to EU accession, but as a mean to foster it. Romania is a founding member of The Stability Pact, The Black Sea Common Market and The South-East Cooperation Initiative, also joining Central European Initiative (1996) and Central European Free Trade Agreement (1997). The Club Theory is however not working well in the region, due to the large development gaps and different investment and reform priorities between regional economies. The objective of most regional initiatives, primarily The Stability Pact, targets stability and growth, which is conflicting in its very sense (durable growth can not be achieved without stability, but stability can be reached in the absence of growth). In this regard, I disagree with the opinion that SEE countries had similar adverse initial conditions8, including conflicts that disrupted normal economic activities. Romania did suffer losses as result of the conflict in former Yugoslavia, but war or severe civil and ethnic strife did not happen here. Path dependency, structural strain and institutional fragility were indeed featured by all regional economies, but at a different extent. Furthermore, if initial conditions were nonetheless different, the current conditions are also distinctive. Former Yugoslav republics and Albania undergo first generation reforms, Romania undertakes second generation reforms9, and some Central European countries even completed this latter stage. Hence, regional economies face different investment and reform priorities; funds directed to common projects have low chances to satisfy these priorities altogether. Romania has its particular story even when emergent economies, as a whole, are considered. Few months after the 1994 Mexican collapse, when the tequila effect hit many economies, Romania launched the Bucharest Stock Exchange. In 1997, when the
6 The term “cultural distance” shows the degree of cultural resemblance (language, customs, “way of doing things”) between two economic environments (nation-level, firm-level). “Cultural distance” is referred to in Gabriel Benito’s article Why Are Foreign Subsidiaries Divested? , “Driving Forces Behind Internationalisation” (ed. Bjorkman I., Forsgren M.), Copenhagen Business School, 1997; other authors prefer the term “psyhical distance” instead of “cultural distance” – see Petersen B., Pedersen T., Twenty Years After – Support and Critique of the Uppsala Internationalization Model, “Driving Forces Behind Internationalisation” (ed. Bjorkman I., Forsgren M.), Copenhagen Business School, 1997. 7 E.g., Romania has larger trade in machines and equipment with Poland than with Bulgaria, due to the presence of Daewoo affiliates in Romania and Poland (according to Bartolo miej Kaminski, Francis Ng, Trade and Production Fragmentation: Central European Economies in European Union Networks of Production and Marketing , World Bank, Working Paper 2611/2001). 8 This opinion is expressed in the World Bank’s regional strategy paper The Road to Stability and Prosperity in South Eastern Europe, 2000. 9 First generation reforms are those designed to change the rules of the game, while second generation reforms aim at teaching and supervising players to play the game within its new rules (see 2000 Annual review of Development Effectiveness published by the World Bank).

4
Asian crisis exploded, and massive sums of speculative capital were withdrawn from emergent economies, Romania witnessed a boom in “hot money” inflows10. The Russian crisis led to higher spreads on Romanian eurobonds11, but foreign investors did not rush to sell t-bills domestically issued by Romanian authorities, simply because they hold no such t-bills – the Romanian legislation restricted (and it still does) access to locally issued t-bills to Romanian persons only; moreover, 1998 was the year with the largest inflow of foreign direct investment to Romania. The threat of contagion from external financial crises really appeared only in the winter of 1996/1997 - amid harsh times in Bulgaria, the Romania mass-media invented the word “bulgarization”, to express the danger to which Romanian economy was exposed due to its similarities in production structures with the Bulgarian economy; that threat was short-lived, however, and it never materialized. By contrast, foreign investors became anxious on Romania in 1999, a time when the shock waves were taming down internationally, but when Romania was on the verge of default on its foreign debt service. Large portfolio outflows occurred, and no external borrowing was available at decent rates. The problem was solved internally, by transforming the foreign debt into domestic debt, and by undertaking severe fiscal adjustment measures – which shows the internal causa lity of the problem. The limited impact, if any, of the contagion effect on the Romanian economy is linked to the delayed structural reforms, that insulated Romania from international financial markets – and, consequently, from international financial crisis; it also acknowledges the different initial conditions of the Romanian economy that render comparisons with other economies difficult to account. This insulation from external shocks is once again demonstrated after the September 11 terrorist attacks. The financial turmoil that spreads over US and Western Europe will only marginally decrease the sustained growth estimations for the Romanian economy12. On the one hand, it should not be something to cheer about, since it means that Romania is simply too far, and convergence too weak, for the shock wave abroad to make a significant impact at home. On the other hand, convergence should be enhanced, taking advantage of the opportunity offered to grow at higher rates than the area of reference (EU). As this study later describes, it is noteworthy that trade creation with EU has not been accompanied by trade diversion from the regional area; enhanced convergence towards EU will therefore provide further trade and investment opportunities in the region. The remaining of this study is structured as follows. Section 2 makes a comparative analysis of the volume and composition of Romanian trade flows with EU, CEFTA and SEE; it also describes regional triggers and barriers to trade. Section 3 deals with foreign direct investment in Romania, comparing FDI originating in the region with FDI from EU countries in terms of volume, targeted sectors, preferred entry modes; it also
10 Almost 2 bn. USD in “hot money” net inflows, including 883 mil.USD in portfolio investments and 1097 mil.USD in errors and omissions. 11 For more on this, see Daniel Daianu, Liviu Voinea, Foreign Capital Flows in Romania, forthcoming ICEG Occasional Paper, 2002. 12 The effect will be mainly indirect, regarding financial results of some large companies that have business interests in the Arab world.
5
describes regional triggers and barriers to foreign investment. Section 4 draws some concluding remarks. 2. Regional Trade analysis 2.1. Trade statistics I hereby understand by EU, the EU-15 countries, including Greece; by CEFTA, the CEFTA-5 countries, including Hungary and Slovenia; finally, SEE consists of Turkey, former Yugoslav republics (Yugoslavia, Croatia, Bosnia-Herzegovina, FYROM), Albania, and Bulgaria13. Following the collapse of comunism, Romania undertook successive trade liberalizations; in conjunction with the untamed need for imported goods (final current consumption goods, in the first phase, and technological inputs, later on) and with changing domestic competition structures in certain product markets, this led to an increasing role of foreign trade in the overall functioning of the economy. Figure 1. Trade openness ratio and real GDP The increasing trend of the economic openness index stands out, but its evolution has also been influenced by the boom and bust cycles of the economy. The major role in this process of trade openness has been played by the reorientation of Romanian trade towards EU. As early as in 1991, EU turned out to be Romania‘s largest trade partner, a position further enhanced by the Association Agreement signed in 1993. Table 1. Romanian foreign trade (exports and imports), by partners, volume Table 2. Shares in aggregated Romanian foreign trade, by partners, % Table 3. Coverage ratio in Romanian foreign trade, by partners, % A peculiarity of Romanian foreign trade is that this diversification does not mean trade creation with some partners, at the expense of trade diversion with other significant partners. Quite the opposite, in absolute terms, the trade volume increased in the medium run with each of EU, CEFTA and SEE (table 1). In relative terms (table 2), the first year after signing the EU Association Agreement (1994) brought higher share in aggregated trade for CEFTA as well, while the first year after CEFTA than average. Conditions of trade liberalization episodes seem important in determining foreign trade results. The asymmetrical concessions of the EU Association Agreement created the premises for an impressive upturn in the coverage ratio, while the symmetrical
13 I consider that the differences within the region are too large to put all the eggs in the same basket. I isolate Bulgaria from CEFTA statistics, as recent studies13 reveal that, within CEFTA-7, Romania and Bulgaria are at a clear disadvantage with their free trade area partners (statistics including Bulgaria would deter us from the specificity of Romania‘s commercial relations with CEFTA countries). For reasons of simplicity, Turkey is included in the SEE group.
6
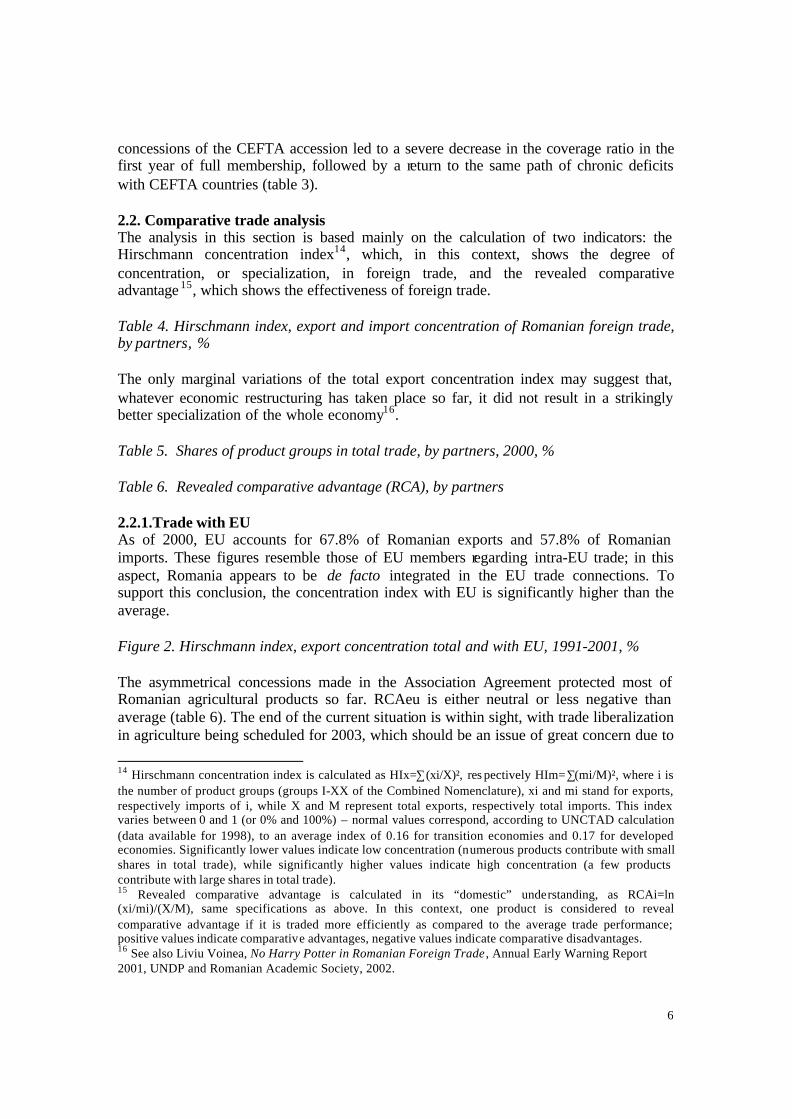
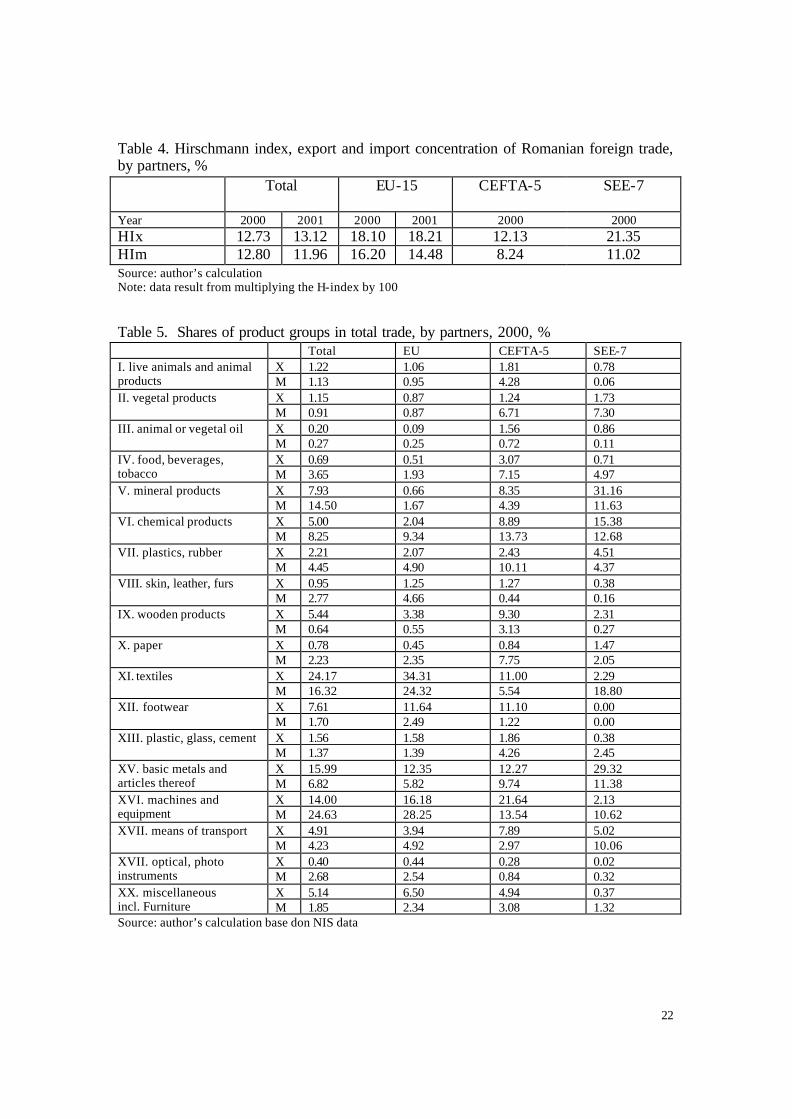
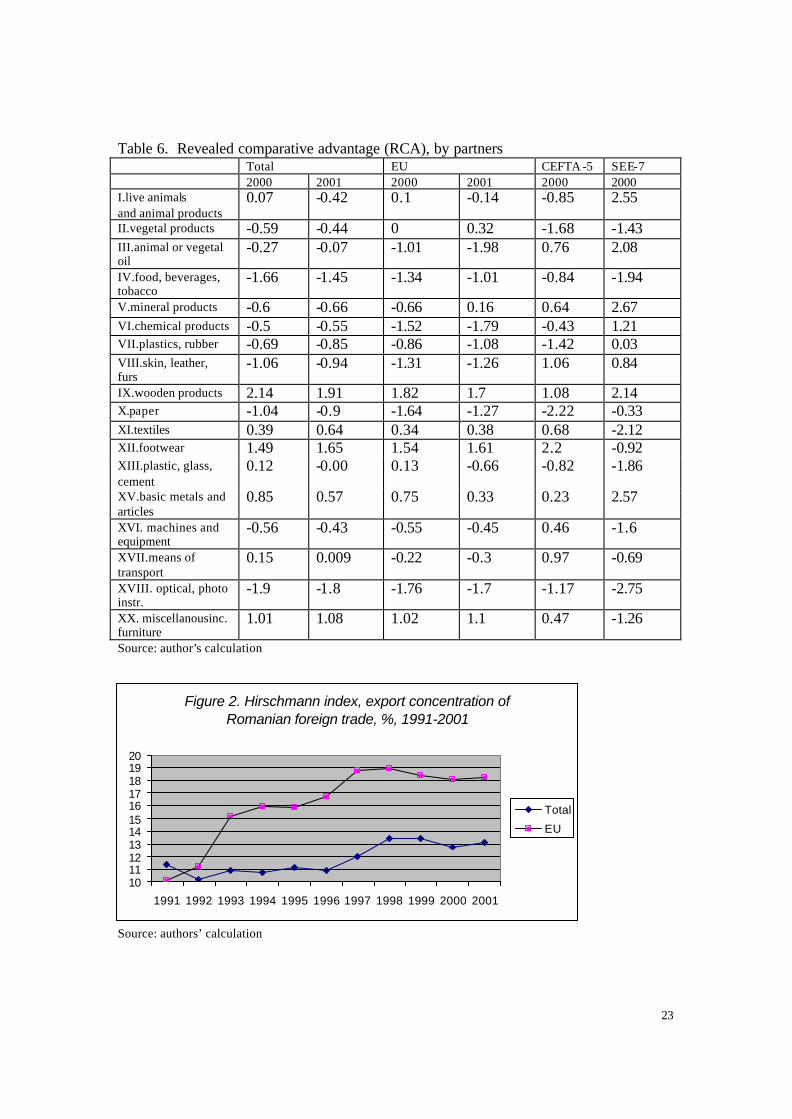
concessions of the CEFTA accession led to a severe decrease in the coverage ratio in the first year of full membership, followed by a return to the same path of chronic deficits with CEFTA countries (table 3). 2.2. Comparative trade analysis The analysis in this section is based mainly on the calculation of two indicators: the Hirschmann concentration index14, which, in this context, shows the degree of concentration, or specialization, in foreign trade, and the revealed comparative advantage 15, which shows the effectiveness of foreign trade. Table 4. Hirschmann index, export and import concentration of Romanian foreign trade, by partners, % The only marginal variations of the total export concentration index may suggest that, whatever economic restructuring has taken place so far, it did not result in a strikingly better specialization of the whole economy16. Table 5. Shares of product groups in total trade, by partners, 2000, % Table 6. Revealed comparative advantage (RCA), by partners 2.2.1.Trade with EU As of 2000, EU accounts for 67.8% of Romanian exports and 57.8% of Romanian imports. These figures resemble those of EU members regarding intra-EU trade; in this aspect, Romania appears to be de facto integrated in the EU trade connections. To support this conclusion, the concentration index with EU is significantly higher than the average. Figure 2. Hirschmann index, export concentration total and with EU, 1991-2001, % The asymmetrical concessions made in the Association Agreement protected most of Romanian agricultural products so far. RCAeu is either neutral or less negative than average (table 6). The end of the current situation is within sight, with trade liberalization in agriculture being scheduled for 2003, which should be an issue of great concern due to
14 Hirschmann concentration index is calculated as HIx=∑(xi/X)², res pectively HIm=∑(mi/M)², where i is the number of product groups (groups I-XX of the Combined Nomenclature), xi and mi stand for exports, respectively imports of i, while X and M represent total exports, respectively total imports. This index varies between 0 and 1 (or 0% and 100%) – normal values correspond, according to UNCTAD calculation (data available for 1998), to an average index of 0.16 for transition economies and 0.17 for developed economies. Significantly lower values indicate low concentration (numerous products contribute with small shares in total trade), while significantly higher values indicate high concentration (a few products contribute with large shares in total trade). 15 Revealed comparative advantage is calculated in its “domestic” understanding, as RCAi=ln (xi/mi)/(X/M), same specifications as above. In this context, one product is considered to reveal comparative advantage if it is traded more efficiently as compared to the average trade performance; positive values indicate comparative advantages, negative values indicate comparative disadvantages. 16 See also Liviu Voinea, No Harry Potter in Romanian Foreign Trade , Annual Early Warning Report 2001, UNDP and Romanian Academic Society, 2002.
7
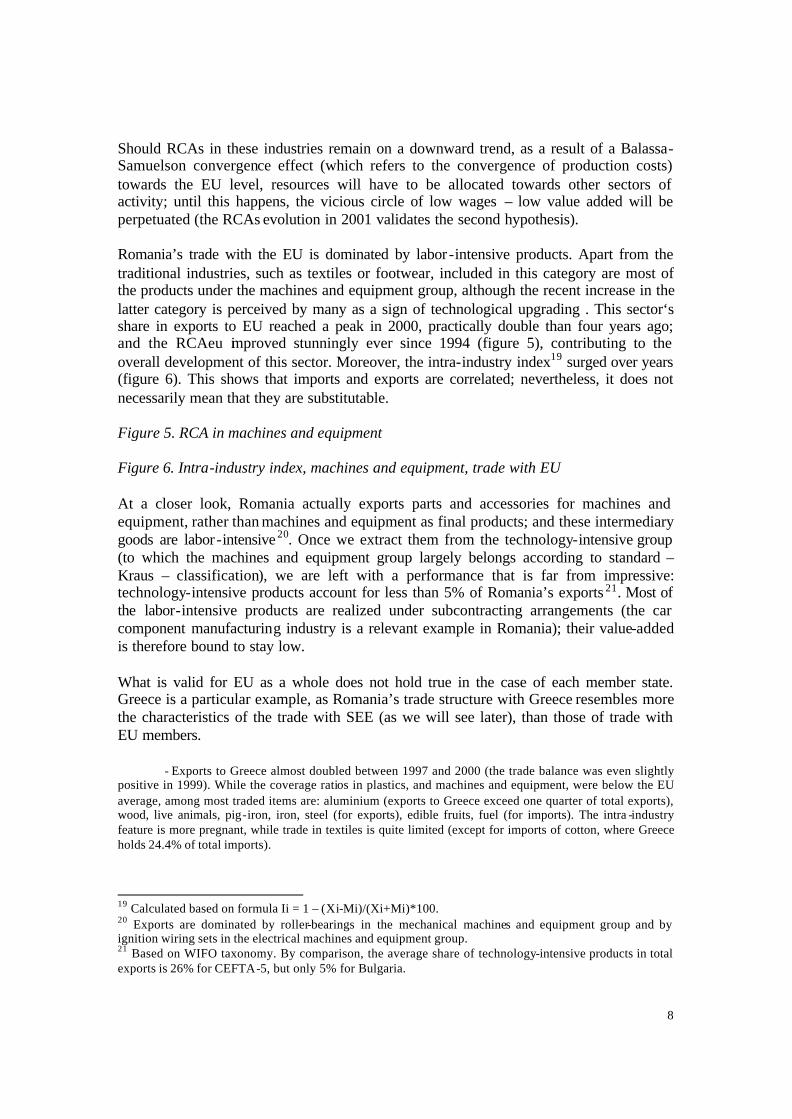
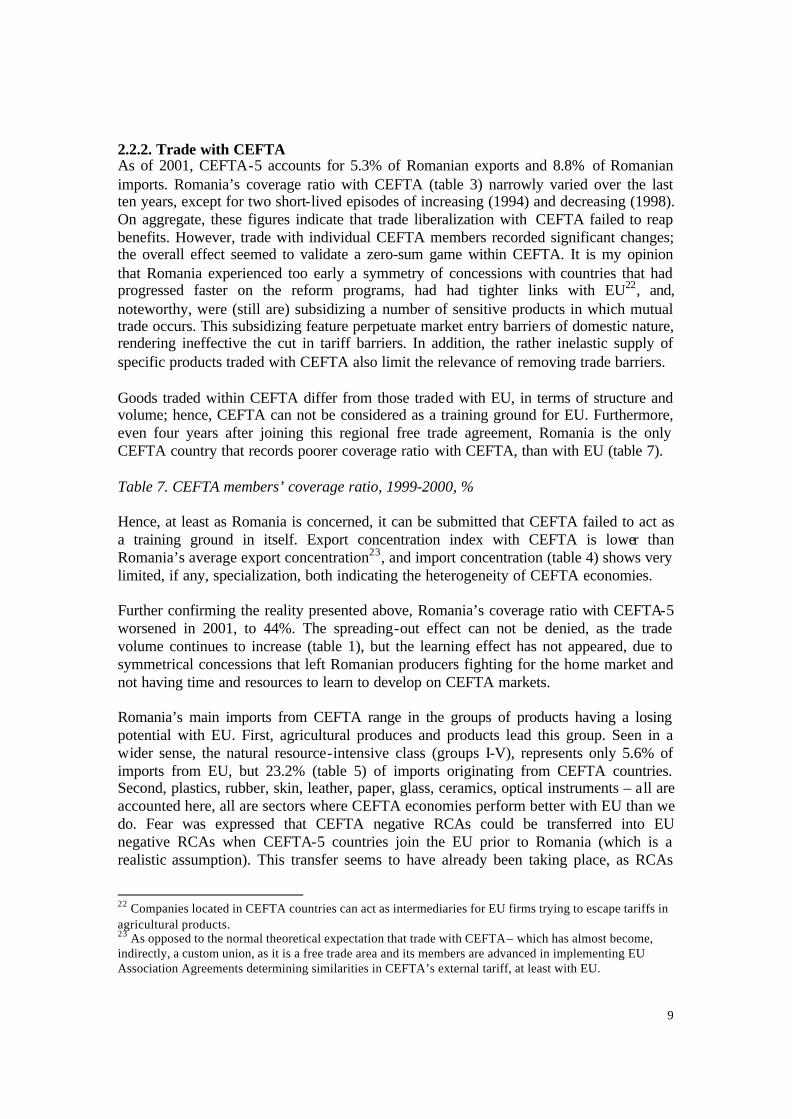
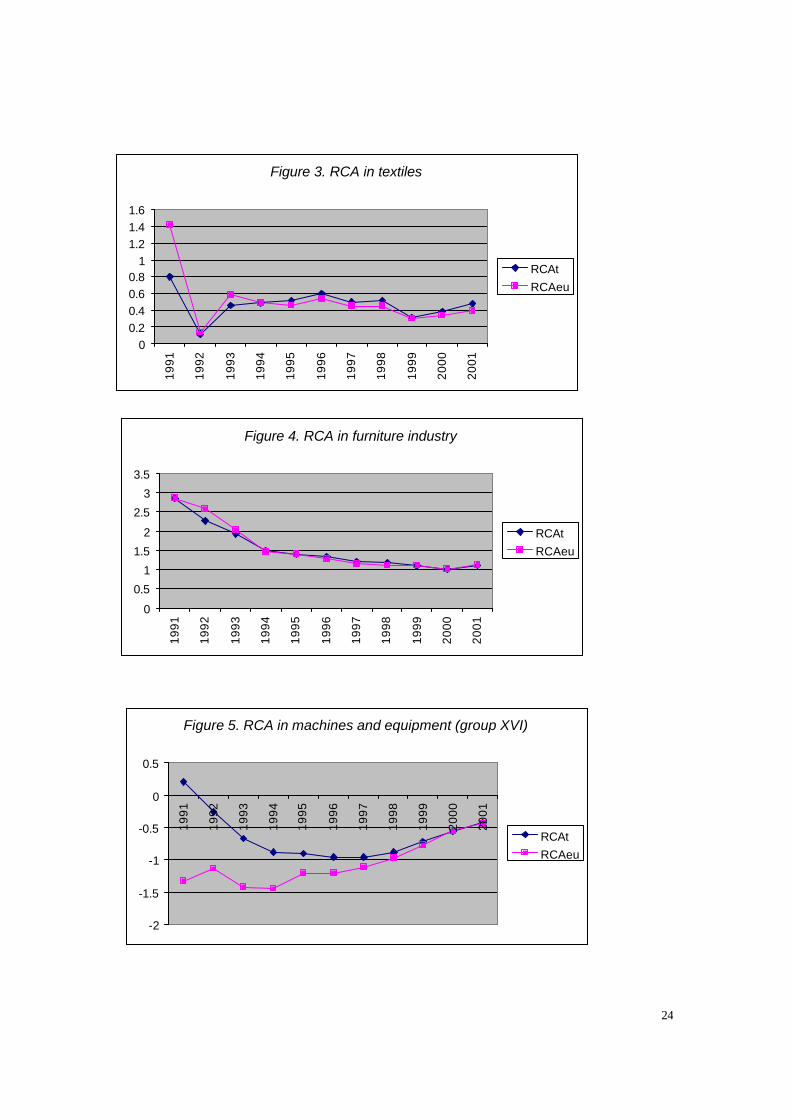
the large number of population working in agriculture. The transition process in Romania led to the phenomenon of reverse migration, with agriculture acting as an employer of last resort; almost half of the active population works in agriculture, yet it fails to produce more than one fifth of GDP and to contribute to exports by more than 3%. There is a mixed story to be told regarding Romania’s performances for groups VII (plastics and rubber), VIII (skin and leather), X (paper), XIII (glass, ceramics), XVII (means of transport), XVIII (optical, medical instruments). Romania records declining, severely negative in most cases, RCAeu, and, as the share of imports is increasing, deeper deterioration of performances is observed. Part of the downward evolution might be attributed to the transfer of negative RCA from CEFTA5 to EU, as CEFTA5 countries get closer to EU integration. Romania performs worse with EU, than with the rest of the world, as far as chemical sectors and metallurgy is concerned. The situation is, however, different in the two sectors. For the chemical sector, the prolongation of an inefficient pattern, with two thirds of chemical imports coming from EU, while exports more than halved over the last five years, has turned the deficit in one of a chronic nature, with restructuring perspectives being nipped in the bud. For the metallurgical sector, there are the non-tariff EU barriers that hurt the trade with EU, but their impact is outbalanced by the overall performances in terms of productivity and unit labor costs, also reflected in the rise of exports, particularly towards economies in the SEE region. There are also sectors where Romania performs well in our trade relation with EU. Unprocessed wood (group IX) is such a sector, RCAeu showing an upward trend, from 0.86 in 1995 to 1.68 in 2001. There is no surprise regarding this situation, as this group17 is usua lly identified among traditional winners for CEFTA countries. Despite existing potential, performances in the furniture industry are steadily declining (figure 4). Furniture exports represented only 6.6% of Romanian exports to EU in 2001, plunging from 18. 1% in 1992; at the same time, imports almost doubled their share. One explanation lies in the unit labor cost being well above the industry average, which is very harmful in a labor-intensive activity. The high unit labor cost in textiles as well (low wages, even lower productivity), is threatening to fade away (figure 3) the cheap labor advantage of a sector that accounts for more than one third of exports to EU (45.94% altogether with footwear industry). Another possible reason is the widespread practice of transfer pricing among foreign companies, in an industry heavily dominated by them18. Figure 3. RCA in textiles Figure 4. RCA in furniture industry
17 Havlik,Peter Industrial competitiveness of CEECs WIIW working paper, 2000 18 According to Munteanu,Costea; Boscaiu,Voicu; Liusnea,Daniela; Puscoi,Lucia The impact of foreign trade and foreign diect investments on productivity in the manufacturing industry. The case of Romania RCEP Working paper no.22/2000, 46% of the foreign companies that obtain more than 75% of their turnover from export activity make losses from exports
8
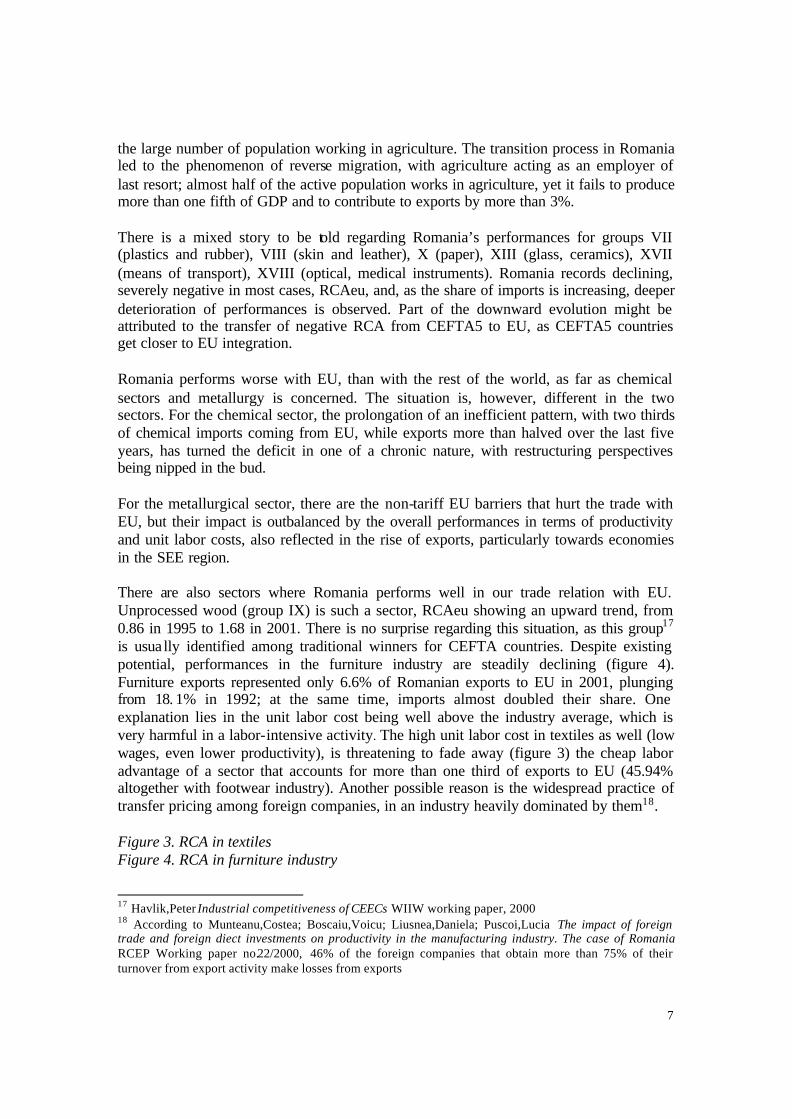
Should RCAs in these industries remain on a downward trend, as a result of a Balassa-Samuelson convergence effect (which refers to the convergence of production costs) towards the EU level, resources will have to be allocated towards other sectors of activity; until this happens, the vicious circle of low wages – low value added will be perpetuated (the RCAs evolution in 2001 validates the second hypothesis). Romania’s trade with the EU is dominated by labor -intensive products. Apart from the traditional industries, such as textiles or footwear, included in this category are most of the products under the machines and equipment group, although the recent increase in the latter category is perceived by many as a sign of technological upgrading . This sector‘s share in exports to EU reached a peak in 2000, practically double than four years ago; and the RCAeu improved stunningly ever since 1994 (figure 5), contributing to the overall development of this sector. Moreover, the intra-industry index19 surged over years (figure 6). This shows that imports and exports are correlated; nevertheless, it does not necessarily mean that they are substitutable. Figure 5. RCA in machines and equipment Figure 6. Intra-industry index, machines and equipment, trade with EU At a closer look, Romania actually exports parts and accessories for machines and equipment, rather than machines and equipment as final products; and these intermediary goods are labor -intensive 20. Once we extract them from the technology-intensive group (to which the machines and equipment group largely belongs according to standard – Kraus – classification), we are left with a performance that is far from impressive: technology-intensive products account for less than 5% of Romania’s exports 21. Most of the labor-intensive products are realized under subcontracting arrangements (the car component manufacturing industry is a relevant example in Romania); their value-added is therefore bound to stay low. What is valid for EU as a whole does not hold true in the case of each member state. Greece is a particular example, as Romania’s trade structure with Greece resembles more the characteristics of the trade with SEE (as we will see later), than those of trade with EU members.
- Exports to Greece almost doubled between 1997 and 2000 (the trade balance was even slightly positive in 1999). While the coverage ratios in plastics, and machines and equipment, were below the EU average, among most traded items are: aluminium (exports to Greece exceed one quarter of total exports), wood, live animals, pig-iron, iron, steel (for exports), edible fruits, fuel (for imports). The intra -industry feature is more pregnant, while trade in textiles is quite limited (except for imports of cotton, where Greece holds 24.4% of total imports).
19 Calculated based on formula Ii = 1 – (Xi-Mi)/(Xi+Mi)*100. 20 Exports are dominated by roller-bearings in the mechanical machines and equipment group and by ignition wiring sets in the electrical machines and equipment group. 21 Based on WIFO taxonomy. By comparison, the average share of technology-intensive products in total exports is 26% for CEFTA-5, but only 5% for Bulgaria.
9
2.2.2. Trade with CEFTA As of 2001, CEFTA-5 accounts for 5.3% of Romanian exports and 8.8% of Romanian imports. Romania’s coverage ratio with CEFTA (table 3) narrowly varied over the last ten years, except for two short-lived episodes of increasing (1994) and decreasing (1998). On aggregate, these figures indicate that trade liberalization with CEFTA failed to reap benefits. However, trade with individual CEFTA members recorded significant changes; the overall effect seemed to validate a zero-sum game within CEFTA. It is my opinion that Romania experienced too early a symmetry of concessions with countries that had progressed faster on the reform programs, had had tighter links with EU22, and, noteworthy, were (still are) subsidizing a number of sensitive products in which mutual trade occurs. This subsidizing feature perpetuate market entry barriers of domestic nature, rendering ineffective the cut in tariff barriers. In addition, the rather inelastic supply of specific products traded with CEFTA also limit the relevance of removing trade barriers. Goods traded within CEFTA differ from those traded with EU, in terms of structure and volume; hence, CEFTA can not be considered as a training ground for EU. Furthermore, even four years after joining this regional free trade agreement, Romania is the only CEFTA country that records poorer coverage ratio with CEFTA, than with EU (table 7). Table 7. CEFTA members’ coverage ratio, 1999-2000, % Hence, at least as Romania is concerned, it can be submitted that CEFTA failed to act as a training ground in itself. Export concentration index with CEFTA is lower than Romania’s average export concentration23, and import concentration (table 4) shows very limited, if any, specialization, both indicating the heterogeneity of CEFTA economies. Further confirming the reality presented above, Romania’s coverage ratio with CEFTA-5 worsened in 2001, to 44%. The spreading-out effect can not be denied, as the trade volume continues to increase (table 1), but the learning effect has not appeared, due to symmetrical concessions that left Romanian producers fighting for the home market and not having time and resources to learn to develop on CEFTA markets. Romania’s main imports from CEFTA range in the groups of products having a losing potential with EU. First, agricultural produces and products lead this group. Seen in a wider sense, the natural resource-intensive class (groups I-V), represents only 5.6% of imports from EU, but 23.2% (table 5) of imports originating from CEFTA countries. Second, plastics, rubber, skin, leather, paper, glass, ceramics, optical instruments – all are accounted here, all are sectors where CEFTA economies perform better with EU than we do. Fear was expressed that CEFTA negative RCAs could be transferred into EU negative RCAs when CEFTA-5 countries join the EU prior to Romania (which is a realistic assumption). This transfer seems to have already been taking place, as RCAs
22 Companies located in CEFTA countries can act as intermediaries for EU firms trying to escape tariffs in agricultural products. 23 As opposed to the normal theoretical expectation that trade with CEFTA – which has almost become, indirectly, a custom union, as it is a free trade area and its members are advanced in implementing EU Association Agreements determining similarities in CEFTA’s external tariff, at least with EU.
10
with the EU in these sectors have deteriorated in 2001 (table 6), as compared to previous years. As regional economies are concerned, let as have a more detailed knowledge on Romania’s trade structure with Hungary and Slovenia. - Hungary. Between 1997 and 2000, Romanian exports almost doubled, and the coverage ratio improved from 52% to 69%. Hungary has large comparative advantages in natural resource-intensive products; imports from Hungary represent 38.7% of Romania’s total imports of meat, and 48.9% of total imports of products of the milling industry. Hungary also records large positive trade balance in paper and paperboard (12.8% of total imports come from there), fuel, plastics, electrical machines and equipment. Exports concentrate in textiles (section 61 and 62 account together for 14.7% of Romania’s exports to Hungary), pig-iron, iron and steel, wood (8% of total exports go to Hungary), furniture, mechanical machines and equipment (13.7% of Romania’s exports to Hungary). - Slovenia. Romanian exports grew by three times over the last four years, and the coverage ratio moved from 58% to 100%. The bulk of imports is represented by fuel, and pharmaceutical products (making 56.8%, respectively 29.6% of total imports from Slovenia); other significant imports are in the rubber, paper and paperboard, and mechanical machines and equipment sectors. Exports are quite dispersed, with higher shares for pig-iron, steel, iron and articles thereof, vehicles, and edible fruits. 2.2.3.Trade with SEE Romania is very dynamic on the SEE market, a fact mainly explained by size (leaving Turkey aside, Romania has more than 40% of the cumulated population and GDP of the region) and psychical distance (traditional trade links with Turkey). These two factors have been enhanced by the ongoing process of trade liberalisation and facilitation in the region. SEE7 accounts, by the end of 2001, for 7.5% of exports and 3.7% of imports; coverage ratio was 149.6%. High export concentration with SEE actually points to the risk of vulnerability, which is also revealed by large annual fluctuations in the coverage ratio (table 3). That SEE is not a region in the making is supported by the two times lower import concentration index, indicating limited dependency, if any, between imports and exports – as opposed to one could expect from a potentially integrated area in economic terms. Table 8. Trade volume with SEE economies We will briefly summarize the trade patterns between Romania and each SEE economy. - Turkey. Turkey is Romania’s largest trade partner in SEE, and the fourth largest overall. In a three years period, 1998-2000, exports surged by 94.1%, while imports grew less explosively, by only 36.3%. It suggests that, as opposed to the general pattern of the Romanian foreign trade, the rise in exports is not imports-driven; or, if it is, the inputs come from other sources. When looking at the specific items of the bilateral trade, it is the metals group that dominates our exports. Sections 72 and 73 (pig-iron, steel, iron and products made of them) add up to 39.1% of Romania’s exports to Turkey in 1999, whereas the imports of these items account for only 5.7% of Romania’s imports from Turkey. The natural resource-intensive products rank also high in Romania’s trade with Turkey (edible fruits: 7% of imports; cereals: 7.2% of exports; mineral oils: 9.2% of exports). Finally, the chemical products group (sections 28-38) sums up to 14.4% of exports and 11.2% of imports. Out of Romanian total exports, Turkey accounts for 35.9% in cereals, 5.1% in man-made staple fibers, 21.2% in pig-iron, iron, steel, 14.5% in products of pig-iron, iron, steel. Despite widespread sentiment that textiles represent an important share of our trade with Turkey, the
11
recorded imports are very low (an explanation can lie either in the low value of second-hand goods, or in the prevalence of textile imports in the unrecorded traffic). - Bulgaria. The case of Bulgaria is a very special one. On the one hand, Bulgaria does not fit within CEFTA typology, as the trade structure between Romania and Bulgaria differs a lot than that of Romania and CEFTA -5. Pig-iron, steel and iron account for 10.5 of exports, and the natural resource-intensive group records supra-unit values of the coverage ratio, much different from the situation with the other CEFTA countries. On the other hand, the intra -industry characteristic of the bilateral trade must be taken into consideration, a fact well illustrated by the data reflecting the chemical sector (exports of 6.9 mil. USD, imports of 7.3 mil. USD) and the machines and equipment group (exports of 4.5 mil. USD, imports of 3.9 mil USD). This fact is normal, as the similarity of the structures of production is higher as compared to Bulgaria, than to other SEE countries, such as Turkey or Albania (due to the common communist type of resource allocation). The striking feature in the trade relationship with Bulgaria is the exports’ boom, while imports stayed rather flat. This feature appeared in 1997 and has gained consistency ever since. Romanian exports to Bulgaria increased by more than five times, from 57.4 mil. USD in 1997 to 289.5 mil. USD in 2000, and the trade balance changed to a large surplus for Romania (+201.7 mil. USD in 2000). It could be submitted that the reason for this spectacular evolution is linked to the exchange rate systems that function in these neighbouring countries. The surge in Romanian exports took place since the Currency Board Arrangement wa s introduced in Bulgaria. While the exchange rate is severely fixed in Bulgaria, Romania applies managed floating, that allows for competitive devaluation. In supporting this hypothesis, one can remark that the share of fuels and mineral oils in the Romanian exports to Bulgaria grew from 18.5% in 1997 to 51% in 1999; and fuels represent a good with high elasticity to changes in the relative prices. However, it seems that much of the exports surge in 2000 (about one third of total exports) comes from one Austrian company that based production facilities in Romania. When one company only makes such a difference in trade flows, it means that the overall volume of the trade flows could not be representative enough to develop more pretentious, exchange rate-based, explanations for the trade surplus between Romania and Bulgaria. The figures for 2001, with decreasing exports and surging imports, support a more prudent approach; however, part of the explanation can be the significant real appreciation of Romanian currency. - Former Yugoslav republics. Similar trade patterns can be found between Romania and former Yugoslav republics analyzed here. Apart from pig -iron, steel and iron (21.4% with Yugoslavia, 8.6% with Croatia, 12.6% with Bosnia-Herzegovina – all in 1999, 33.3% with FYROM – in 1998), main exports are: fuels and mineral oils (34.3% with Yugoslavia, 9.4% with Croatia; imports are also significant), live animals (21.2% with Croatia, 34.2% with Bosnia-Herzegovina), and automobiles and vehicles (13.3% with Croatia, 13.5% with FYROM – in 1999, 17.6% with Bosnia-Herzegovina in 1998). - Albania. Exports to Albania increased by 3 times over the last four years, with imports virtually non-existent. Fuels and mineral oils represent 30.2% of exports, and cereals account for 38.1%. 2.2.4. SEE the difference in trade composition The countries analysed here vary a lot in their economic affiliation. Greece is a EU member, Hungary, Slovenia and Bulgaria are CEFTA members, the former Yugoslav republics are in the early stages of the integration and liberalisation process, Turkey has a free trade agreement with Romania. When analysing Romania’s trade with different economic blocks, one can observe that trade with each of these more or less integrated blocks – EU, CEFTA, SEE – has its peculiarities. Table 9.Differences in Romania’s trade with different “blocks” The differences between Romania’s trade with these blocks are clear-cut, but the differences between Romania’s trade with these selected countries, while persisting on a
12
number of issues, are not so large. The rate of growth of Romania’s exports to these economies over the last four years is so much higher than the overall rate of growth of Romanian exports. This can be explained by a better positioning of Romanian exporters on the learning curve, due to the existence of previous knowledge and links, increased adaptability given the short physical and psychical distances, and improved legal framework. In addition, due to the specificity of the traded products, the rise in exports is not import-dependent (and, as we will see later, it is neither FDI-driven) - as it is the case in EU trade. Moreover, excepting Hungary and Slovenia (where coverage ratios are however on an upward trend), the trade balance with these countries is positive, as opposed to an important deficit in Romania’s total foreign trade. In understanding this situation, there can be submitted two kinds of motifs: - motifs valid in individual cases only, such as the favourable development gap (with Albania), the more flexible exchange rate regime (as compared to that functioning in Bulgaria), the post-war import needs (in case of former Yugoslav republics); - a motif generally valid, consisting in the structure of Romania’s trade with these regional economies, which is dominated by natural resource-intensive products and metals, the latter having low R&D expenditure to value added ratio. In these two groups of products, Romania seems to have superior factor endowment against other regional economies. In the case of natural resource-intensive products, this is reflected by the high share of Romania’s regional exports in total exports: 35.8% for live animals, 37.3% for edible fruits, 38.9% for cereals, 41.4% for fuels and mineral oils. In the case of metals , Romania’s regional exports represent, out of total exports, 29% for pig-iron, steel, iron, 20.2% for products thereof, 34.3% for aluminium. When the production structure is different (the cases of Greece and Turkey), the superior endowment with production capacities leads to trade surplus; on the other hand, when the production structure is similar (the cases of former communist countries), the trade with metals is balanced, or even at a deficit. Within the region, Romania does not record significant trade flows in technology-intensive goods. This shows, indirectly, that Romanian technology-intensive exports depend on intra-industry imports, and that the exports go in same direction where the imports came from - subject mainly to subcontracting agreements. Another departure from the “traditional” characteristics of the Romanian foreign trade lies in the almost complete lack of trade in the textile sector (except for raw materials imported from Greece and Turkey); this signals regional economies’ common, low labor cost, feature. Table 10. Exports outside the region - dominated by textiles and footwear The facts revealed by this analysis indicate that the regional trade can act as a complement to the trade with EU. It can promote economic growth, and stimulate the development of certain sectors that would otherwise be at a large disadvantage with more developed economies. Regional trade can not, however, substitute the trade with EU, as there are clear differences in the respective trade structures, compa rative advantages, export and import concentration.
13
2.3. Regional triggers and barriers to trade Regional trade is stimulated by the short psychical distance between Romania and most countries in this region, as reflected by: - better understanding of market demand and higher flexibility in servicing it at local level through cross-border trade. - better understanding of “best practices” applicable in the region, that helps companies set in the region to avoid two major general trade obstacles. Thus, they can avoid difficulties in receiving payment by being more inclined towards barter arrangements; they can also smoothen bureaucratic custom procedures by being more inclined to informal solutions. - the ethnic component of trade, that can ease the access for some products on market segments dominated by the ethnic component. In particular, the use of the same foreign exchange as a reference currency at sub-national, but inter-regional level (e.g. the Deutsche mark has been used as the informal reference currency in the North-West of Romania, replicating the situation in Hungary) can facilitate trade. - the interest to get involved in institutionalized cross-border activities. Selected Romanian counties are currently taking part in four different Euroregions , set up together with counties from neighboring states, as follows: Trans Carpathia Euroregion, including counties from Romania, Hungary, Poland and Ukraine; Lower Danube Euroregion, including three Romanian counties, one county in the Republic of Moldova and one region in Ukraine; Higher Prut Euroregion, including two counties from Romania, two from the Republic of Moldova, and one region from Ukraine; Southern Danube Euroregion, including three municipalities from Romania and four municipalities from Bulgaria. Apart from the psychical distance and its multiple components, there are at least three other triggers for regional trade: - the short physical distance may be determinant in trading goods that are either perishable (e.g. some agricultural produces), or cost-effective only below certain thresholds of the transportation costs (e.g., cement). - the non-compliance - due to the early stage most economies in the region are in the process of adoption of the acquis - with certain EU standards that fall into the category of non-trade barriers, can foster mutual trade as being less quality demanding and less expensive goods. - common regional infrastructure projects can help local companies to get public contracts in the region, enhancing trade especially with construction and transport related materials. There can also be identified specific barriers to Romanian trade in the region, as follows: - current barriers: - lack of free trade agreements with a number of countries in the region (Albania, former Yugoslav republics). The intended bilateral treaties of trade liberalisation and facilitation are deemed insufficient, as the lack of a multilateral SEE agreement will allow the keeping of specific barriers on a case-by-case basis, and will further create segmentation, instead of integration, on the regional market. - the well-rooted Romanian mentality assuming that products and services coming from
14
countries like Bulgaria, Albania or FYROM are of inferior quality. The same idea functions even for Greek or Turkish products, probably because the experience of the early 90’s, when rather low-quality consumer goods were imported from these countries by Romanian individuals in the small cross-border trade. - potential barriers: - potential competitive pressures that might appear from EU producers once the regional SEE market will be open to free competition on sensitive items, such as agricultural produces and products, that represent a large portion of the regional trade flows. - potential loss of advantage of exporters in energy-intensive sectors (such as metallurgical products, that represent another great part of regional trade) once the energy price will be fully liberalized24. 3. Regional FDI analysis 3.1. General facts on FDI Total FDI in Romania is unimpressive, as compared to other transition economies. In relative terms, Romania reached in 1999 the aggregated level of FDI that was recorded in Hungary and Czech Republic as early as in 1994, respectively 1995; and in absolute volume, as of end of 2001, the FDI stock in Romania does not exceed 20% of GDP. At such limited extent, it is no surprise that FDI succeeded in reforming specific markets, but failed to reform the economy as a whole25. On the other hand, all these statistics do not take into account the reinvested profit, which means that FDI volume may be underestimated. Figure 7. FDI stock and private foreign debt stock EU is the main investor in the Romanian economy, with more than 60% of total FDI stock, a figure resembling the share of EU in total Romanian foreign trade. Most of this capital entered the country during 1997-1999, a period characterized by an aggregate 15% fall in GDP accompanied by a severe contraction of domestic consumption. It follows that the bulk of these investments are export-oriented. In addition, the export-oriented FDI attract technology and knowledge transfer from import26, leading to trade deficits “in the mirror”. Since FDI started to accumulate in Romania, the private commercial debt gradually increased its share in total foreign debt, from less than 10% in 1995 to roughly one third in 2000. Small and medium sized enterprises are not responsible for this rise, as only 1%
24 This danger has already started to materialize in 2001. Among aluminum producers, Alro Slatina halved profits, and Alor Oradea was closed down. 25 See also Liviu Voinea, FDI in Romania: Still to Make an Impact on Accession to the EU, EMERGO – Journal of Transforming Economies and Societies, vol.8, no.43, Summer 2001, University of Krakow. 26 On the remarkable level of technology transfer and R&D associated with foreign investment in Romania’s auto industry, see Jochen Lorentzen, Peter Mollgaard, Vertical Restraints and Technology Transfer: Inter-Firm Agreements in Eastern Europe’s Car Component Industry, Copenhagen Business School, Department of International Economics and Management, WP 9/2000.

15
of their financing needs is covered by foreign bank loans27. Instead, large foreign affiliates started or expanded their operations with money borrowed from abroad (EBRD alone granted loans of 677 mil. USD for specific investment projects28). First, this indicates a low willingness of foreign firms to risk their own capital in the Romanian business environment; however, it seems to have been an improvement in this direction since 1998. Second, it changes the foreign investors’ behavior; profit repatriation, as payments due to the lender of the invested capital, might replace profit reinvestment. To summarize, at general level (where EU-originating investments dominate the picture), FDI in Romania are rather export-driven, foreign debt funded, and trade complementing. It is the understanding of the remaining of this section that investments that originate in the SEE region depart significantly from these characteristics. 3.2. Regional FDI 3.2.1. FDI from the region Among regional economies, Greece, Turkey and Hungary are important investors. Should one isolate, from table 11, the acquisition of Romtelecom by the Greek company OTE, then it would become clearer the fact that the preferred entry mode for regional investors is greenfield investment, rather than privatization. Table 11. FDI in the Romanian economy, by country, 1990-2000 The preference for greenfield investments indicate that regional investors are more accustomed to the local market, and more risk-sharing than the average foreign investors’ behavior. The preference for greenfield investments can also be interpreted in conjunction with the scarcity of capital invested, revealed in table 12.; regional investors might have not had the capital needed to compete for privatization of large SOEs. Should one left aside again the acquisition of Romtelecom, then it would be easy to define regional investments as low capital intensive, meaning that the sum invested per company is below the average value of 59,226USD29. Table 12. The “weight” of FDI Actually, it is difficult to discuss about average investments, as long as there are a few large deals, and plenty of small, family firms.
27 According to Francesca Pisarides, Financial structures to promote private sector development in South-Eastern Europe, EBRD WP 64/2001. 28 Total EBRD financing to Romania (June 1991-June 2001) was 1784 mil.USD, of which: 951.6 mil.USD for the public sector (100% loans), and 833.1 mil.USD for the private sector (8.7% equity participation, 91.3% loans). 29 Low investment level is a general problem in the Romanian economy. According to a cross-country study (Wendy Carlin, Saul Estrin, Mark Schaffer, Measuring progress in transition and towards EU accession, Center for Economic Reform and Transformation, Heriott-Watt University, discussion paper no.2/1999), the level of investment in Romanian privatized firms is well below that in the Polish privatized firms. However, as Hunya remarks (2000), the lack of investments may not be a problem, as unutilized capacities abound.
16
- Greek investments. Main Greek investment is the acquisition of Romtelecom by OTE30. Financial sector is also heavily represented, with banking (Alpha Bank31, Piraeus Bank32, EFG Eurobank Ergasias33, Commercial Bank of Greece, National Bank of Greece, Egnatia Bank), and non-banking companies (Interamerican, Garanta). Greek investors are present in the consumer goods production as well (Coca-Cola invested through its Greek affiliate, large milling company Titan was bought by Lulis, Best Foods and Star Foods are competing in Romania). The exception is the chemical plant Copsa Mica. - Hungarian investments. Main Hungarian investment is in the oil business, where MOL34 located its headquarters in Cluj-Napoca, setting the pace for other Hungarian investors to focus particularly in the North-West of Romania. MOL has developed a network of oil stations throughout this region. Other areas for Hungarian investment are retailing and consumer goods production (food, beverages, tobacco). - Turkish investments. Main target of the Turkish companies seems to have been also the financial sector, operating branches or joint-ventures (Turkish-Romanian Bank, Demirbank, Finansbank, UGBI, Romanian International Bank), but, similar to the case of Greek banks, their share in the total assets of the banking sector is very limited (about 5% for Turkish and Greek banks together). Other investments are made in retailing (Bucharest Mall), chocolate and biscuits plants, and in the glass and plastics industry. The exception is the petrochemical plant Azomures. 3.2.2. FDI to the region Regarding Romanian outward investment, the aggregated debit position of the direct investment item of the balance of payments records less than 200 mil. USD invested abroad over the last 11 years; one should then deduct from this sum the investments made by state in order to continue to fulfill investment commitments in certain industrial objectives. Private Romanian investment abroad is scarce, and the information about it is even scarcer. Hungary is maybe the first target of Romanian companies investing abroad. A number of 2000 companies with Romanian capital, concentrated in Szeged area (close to the Romanian border), invested some 30 mil. USD. Petrom (oil products company) has the bulk (USD 15 million) of this investments. For the remaining firms, the average capital endowment is 7,500 USD/company, which reveals low capital intensity. However, Romanian FDI abroad can follow an upward trend, as the saving and investment ratios are expected to recover in the Romanian economy over the next five years35. 30 The state monopoly on fixed telephony was practically transformed into a private monopoly until 2003. Anecdotal evidence shows it is now four times more expensive to call from Romania to Greece, than to call from Greece to Romania. 31 Alpha Bank Romania has 238 mil. USD in assets (2.2% of total assets in the Romanian banking system), 11 subsidiaries and it attracted 111 mil. USD in deposits. Alpha Bank entered the Romanian market by acquiring Bank of Bucharest. It received capital injections from EBRD: 2.4 mil. USD in loans and 1.8 mil. USD in equity. 32 Piraeus Bank Romania has 44.7 mil. Euro in assets and it operates 3 subsidiaries. It entered the market by acquiring Pater Credit Bank. 33 EFG Eurobank Ergasias is the largest shareholder (19.25%) of Banc Post – the 6th bank in Romania by assets size. 34 MOL invested in Romania 74 mil.USD by the end of 2000. 35 Estimations made in the Pre-Accession Economic Program 2001 see saving ratio increasing from 15.2% of GDP in 2000 to 20.6% of GDP in 2005, and investment ratio surging from 18.9% in 2000 to 25.9% in 2005.

17
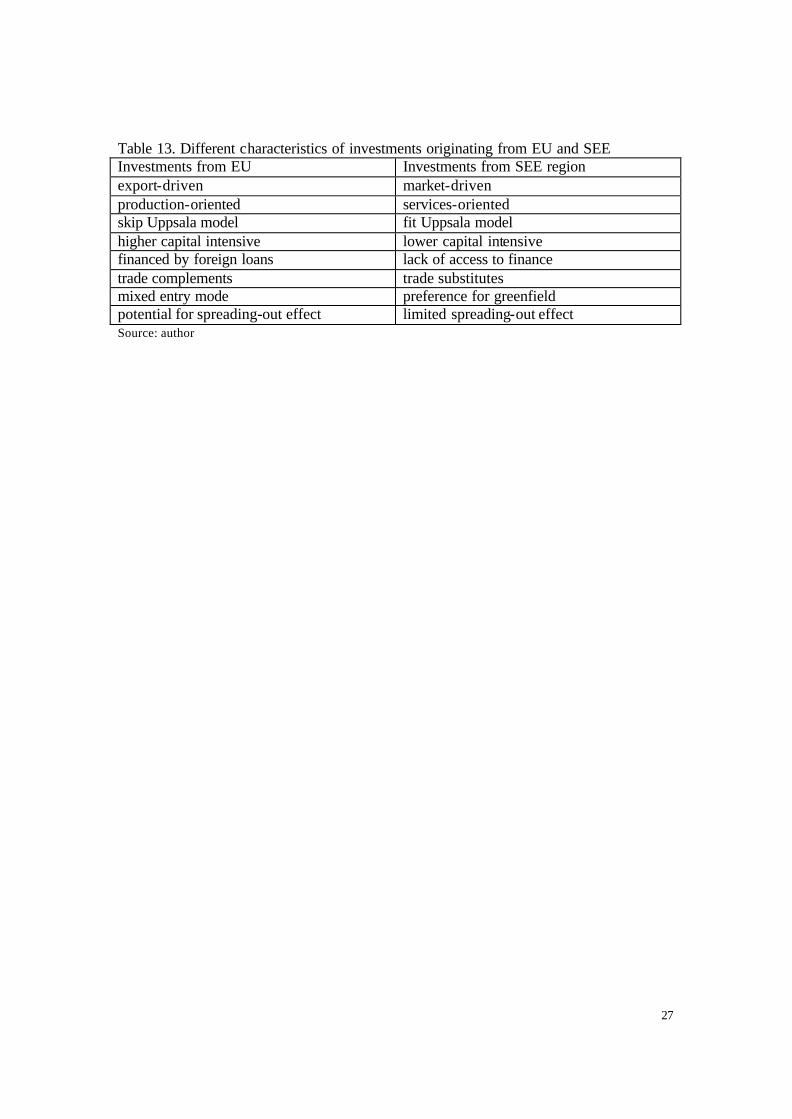
Greenfield investments are preferred, and they tend to increase in areas in which Romanian companies have acquired competitive advantage, primarily in the IT industry. Hardware producers (Flamingo is the most expansive of them36) and cable companies are rapidly expanding to Hungary, Moldavia, Bulgaria, Bosnia-Herzegovina, Yugoslavia. It is also noteworthy that some transnational corporations choose to operate regional divisions for Romania, Bulgaria, some former Yugoslav republics, or Moldavia, with regional headquarters in Bucharest37. The reason behind this mode of operation is to optimize administration costs in the context of limited absorption capacity of individual markets. Indirectly, this mode of operation acknowledges the existence of a short psychical and physical distance between countries. 3.2.3. SEE the difference in FDI flows Similar to the conclusion drawn as commercial links are regarded, despite belonging to different economic groups, investments from the regional economies analyzed here share a number of similarities. All these common features are quite the opposite of the characteristics of EU investments. Table 13. Different characteristics of investments originating from EU and SEE First, they are low capital intensive. On the negative side, this shows the limited financial resources accumulated and disposable in the region. Furthermore, it implies that these regional investments may not have large spreading-out effects in the local economy. On the positive side, the decision to invest despite limited financial resources demonstrates the higher propensity of regional investors to assume risks in another regional economy. The investment decision may be supported by previously overcoming similar risks at home and throughout the region. Consequently, one can speculate that investors that originate in this region have a different assessment of regional risks than Western investors. Second, they are oriented towards services (finance and communication) and retailing activities (food, beverages, tobacco, fuel). They are primarily non-productive investments; as a reflection of this, imports are rather low (consistent with the substitutability feature), and not within the machines and equipment industry, which means that technological imports are not heavily needed to complement FDI. In addition, returns on investment obtained from services and retailing are high. Third, in cases when these investments are nevertheless oriented on production facilities, they are concentrated in current consumption goods, targeting the domestic market. These investments (as well as those in services and retailing) are market-driven. Together with the preference for greenfield investments, one can submit that they tend to comply
36 Flamingo operates affiliates in seven countries in the region, and it recently opened an affiliate in the Netherlands. 37 Among examples: Procter&Gamble (consumer goods) and Colliers (real estate) conduct Balkan operations from their Romanian headquarter; Lafarge and Scania (industrial goods) operate in Moldova through their Bucharest affiliates.
18
with the Uppsala model of firms’ internationalization in that they take advantage of the market knowledge gained due to the short psychical and physical distance. Fourth, regional investments do not complement trade, as imports are scarce in the main areas of investment. Taking structure into account, these investments could act as substitutes for imports. This remark is actually in line with Romania’s large trade surplus with all SEE countries. 3.3. Regional triggers and barriers to FDI There are a number of factors that can be identified as triggers for foreign direct investment originating in the SEE region, as follows: - as described above, the short psychical distance, that permits advanced market knowledge. - some similarities in terms of macroeconomic experience that are shared by regional economies, although at different pace and extent, help regional companies to better adapt themselves to adverse local market conditions - such as high inflation and frequent legislative changes – that otherwise discourage investors originating from outside the region. - regional infrastructure projects sponsored by various international institutions, as well as regional development strategies implemented by transnational corporations. A potential trigger for regional FDI to Romania lies with the high rates of economic growth projected for the next years. Since regional FDI are primarily market driven, the increased absorption capacity can lead to an increase in the consumption and use of goods and services offered by local affiliates of regional companies, therefore providing an incentive for other market-driven FDI. Regionally specific barriers to FDI also exist, and they refer mainly to: - the lack of access to finance especially for SMEs, maintaining the low capital intensity of most regional investments. - the lack of multilateral-based treaties avoiding double taxation. The intention to overcome this obstacle is expressed within the “Investment Compact” initiative of the Stability Pact. 4. Concluding remarks The conceptual framework of this paper is sketched in section 1; sections 2.2.4. and 3.2.3. present conclusions drawn on Romania’s trade and investment flows within the region; specific regional barriers to trade and FDI are addressed in sections 2.3. and 3.3.. These concluding remarks do not aim at reiterating all the points that have already been made; they rather insist on what renders these flows specific, and how should this specificity be interpreted in the enlarged context of European integration. The countries analyzed here, in their trade and investment relations with Romania, belong to distinctive economic groups, even blocks (Greece to EU, Hungary and Slovenia to CEFTA, Bulgaria, former Yugoslav republics, Albania and Turkey to SEE – see the
19
working definitions in section 2.1.). There are clearly cut differences in Romania’s trade and investment flows with each of these groups. Despite this fact, there are many similarities in Romania’s trade and investment flows with each of the countries nominated above. Evidence was given throughout this paper that Romania’s flows with these regional economies depart significantly from Romania’s experience with its largest trade partner and investor, namely EU. With all SEE economies plus Greece, Romania has positive trade balance, as against significant aggregated and with EU trade deficits; even when its foreign trade is still at a disadvantage, or merely balanced, as it is the case with Hungary and Slovenia, Romania has nevertheless increased its coverage ratio. In its trade links with all these regional economies, Romanian exports have expanded much faster than imports, which is exactly the opposite situation as compared to total foreign trade statistics. This leads to another conclusion: in Romania’s regional trade, exports are not import-dependent – as it is the case in the trade with EU (see also import and export concentration indexes in table 4). The reason lies with the very different composition of regional trade flows, as compared to Romania’s trade flows with EU. Within the region Romania trades primarily products of the metallurgical industry (pig-iron, steel, iron, aluminum), as well as natural resource-intensive products (agricultural produces and products, mineral products). There is very limited trade in “machines and equipment” group and in textiles, which make the bulk of Romania’s trade with EU and which are import-dependent exports. Also not largely associated with imports are the regional foreign direct investments. Given the main fields of interest for regional FDI, it can be submitted that regional FDI may act as substitutes for imports, just as opposed to FDI from EU, that act as complements to imports (in the form of technology and knowledge transfer). Furthermore, FDI from countries in the region are mainly low capital intensive, and therefore they have limited spreading-out effect. However, the propensity to invest despite limited financial resources, and the preference for greenfield investment, could indicate a different risk assessment made by regional investors compared to Western investors. Regional FDI are rather market-driven, compared to the export-driven FDI undertaken by EU investors. This motivation is concordant with the higher local market knowledge gained by regional investors due to the short cultural and physical distance between the regional economies. As future developments in the region are regarded, one can remark that Romania’s (and not only) regional trade will have to cope with two challenges. First, regional trade in agricultural produces and products will face competitive pressures from EU producers, once trade in these groups will be liberalized. Second, the comparative advantage of Romanian metallurgical exports might fade away when energy prices – currently subject of subsidies – will be fully liberalized in Romania. On the other hand, metallurgy is identified a potential winner with EU, based on its positive comparative advantage.

20
This study clearly depicts similarities between regional economies and sharp differences in the composition and motivation of regional trade and investment flows as compared to EU-driven flows. What must be said once again is that these differences do not represent an alternative, but only a complement to the region strive towards European integration. Moreover, Romania’s enhanced catching-up process with EU, due to its sustained growth perspectives, does not divert ab initio either trade or FDI within the region. On the contrary, regional trade will probably increase in result of further trade liberalization and facilitation, while regional FDI, market-driven, will likely to rise together with the higher domestic market absorption capacity. The conclusions drawn above help us answer a number of key questions that need to be addressed when regional trade is analyzed. First, is SEE a region in the making? Well, for one, EU itself is still in the making. However, the answer to this question is no, SEE is not a region in the making38, because there are large differences in reform and investment priorities between regional economies. Nevertheless, it might be meaningful to discuss about certain regional features, as trade and investment within SEE share a number of similarities. Furthermore, due to the different composition and concentration of trade flows and different motivation of FDI, these regional economic flows act as complements, not competitors to EU flows of trade and investment. Second, is regional convergence a pre-requisite to EU convergence? Once again, the answer is no, because of the differences that exist in trade and investment flows within the region, as opposed to those with EU; South East Europe is not the playing ground for European Union (just as CEFTA also proved not to be). Third, while it seems to be rising –at least in the case of Romania - and even way above potential39 –as predicted by the gravity model- how volatile is this regional trade? Quite volatile, indeed, as it mainly consists of temporary, “buffer” flows; regional trade in agricultural produces and metallurgy products will soon face EU competition derived from trade liberalization and elimination of energy subsidies. Fourth, and last question, since it is quite volatile, can regional trade by stabilized, and how? The answer is yes, on condition that regional trade takes place and becomes increasingly integrated within European networks of production and distribution.
38 Moreover, regions are not exclusive – see Gligorov Vladimir, The Role of CEFTA in Balkans, “The Further Development of CEFTA: Institutionalization, Deepening, Widening?” (ed. Machowski H.), Warsaw, Friedrich Ebert Stiftung, 1997. 39 See Edward Christie, Potential Trade in South-East Europe: A Gravity Model Approach, WIIW discussion paper, 2001.

21
� Source: computed based on NBR (National Bank of Romania) dat Tabel 1. Romanian foreign trade, by partners, volume Exports, mil.USD 1991 1992 1993 1994 1995 1996 1997 1998 1999 2000 2001 Total 4266 4363 4892 6151 7910 8084 8431 8302 8487 10366 11385 EU15 1576 1535 2023 2965 4283 4569 4768 5358 5562 6618 7720 CEFTA5 242 166 164 276 273 294 343 369 461 557 606 SEE7 387 541 421 415 506 648 595 561 730 1108 862 Imports, mil.USD 1991 1992 1993 1994 1995 1996 1997 1998 1999 2000 2001 Total 5793 6260 6522 7109 10278 11435 11280 11838 10557 13054 15551 EU15 1664 2584 2955 3427 5186 5986 5922 6829 6405 7388 8918 CEFTA5 368 321 270 292 504 541 642 1041 882 1070 1367 SEE7 387 424 256 237 351 345 352 400 363 438 576 Source: based on NIS (National Institute for Statistics) data Table 2. Shares in aggregated Romanian foreign trade, by partners, %
1991 1992 1993 1994 1995 1996 1997 1998 1999 2000 2001 EU 15 32.2 38.7 43.6 48.2 52.0 54.0 54.2 60.5 62.8 59.8 61.8 CEFTA 5 6.0 4.5 3.8 4.2 4.2 4.2 5.0 7.0 7.0 6.9 7.3 SEE 7 7.6 9.0 5.9 4.9 4.7 5.0 4.8 4.7 5.7 6.6 5.3 Source: based on NIS data Table 3. Coverage ratio in Romanian foreign trade, by partners, %
1991 1992 1993 1994 1995 1996 1997 1998 1999 2000 2001 EU 15 94.7 59.4 68.4 86.5 82.5 76.3 80.5 78.4 86.8 89.5 88.8 CEFTA 5 65.7 51.7 60.7 94.5 54.1 54.3 53.4 35.4 52.2 52.0 44.5 SEE 7 100.0 127.5 164.4 175.1 144.1 187.8 169.0 140.2 201.1 252.9 157.1 Source: author’s calculation based on NIS data
Figure 1. Trade openness ratio and real GDP
-20.00%
0.00%
20.00%
40.00%
60.00%
80.00%19
92
1993
1994
1995
1996
1997
1998
1999
2000
2001
Trade/GDPGDP real
22
Table 4. Hirschmann index, export and import concentration of Romanian foreign trade, by partners, % Total EU-15 CEFTA-5
SEE-7
Year 2000 2001 2000 2001 2000 2000 HIx 12.73 13.12 18.10 18.21 12.13 21.35 HIm 12.80 11.96 16.20 14.48 8.24 11.02 Source: author’s calculation Note: data result from multiplying the H-index by 100 Table 5. Shares of product groups in total trade, by partners, 2000, % Total EU CEFTA-5 SEE-7
X 1.22 1.06 1.81 0.78 I. live animals and animal products M 1.13 0.95 4.28 0.06
X 1.15 0.87 1.24 1.73 II. vegetal products M 0.91 0.87 6.71 7.30 X 0.20 0.09 1.56 0.86 III. animal or vegetal oil M 0.27 0.25 0.72 0.11 X 0.69 0.51 3.07 0.71 IV. food, beverages,
tobacco M 3.65 1.93 7.15 4.97 X 7.93 0.66 8.35 31.16 V. mineral products M 14.50 1.67 4.39 11.63 X 5.00 2.04 8.89 15.38 VI. chemical products M 8.25 9.34 13.73 12.68 X 2.21 2.07 2.43 4.51 VII. plastics, rubber M 4.45 4.90 10.11 4.37 X 0.95 1.25 1.27 0.38 VIII. skin, leather, furs M 2.77 4.66 0.44 0.16 X 5.44 3.38 9.30 2.31 IX. wooden products M 0.64 0.55 3.13 0.27 X 0.78 0.45 0.84 1.47 X. paper M 2.23 2.35 7.75 2.05 X 24.17 34.31 11.00 2.29 XI. textiles M 16.32 24.32 5.54 18.80 X 7.61 11.64 11.10 0.00 XII. footwear M 1.70 2.49 1.22 0.00 X 1.56 1.58 1.86 0.38 XIII. plastic, glass, cement M 1.37 1.39 4.26 2.45 X 15.99 12.35 12.27 29.32 XV. basic metals and
articles thereof M 6.82 5.82 9.74 11.38 X 14.00 16.18 21.64 2.13 XVI. machines and
equipment M 24.63 28.25 13.54 10.62 X 4.91 3.94 7.89 5.02 XVII. means of transport M 4.23 4.92 2.97 10.06 X 0.40 0.44 0.28 0.02 XVII. optical, photo
instruments M 2.68 2.54 0.84 0.32 X 5.14 6.50 4.94 0.37 XX. miscellaneous
incl. Furniture M 1.85 2.34 3.08 1.32 Source: author’s calculation base don NIS data
23
Table 6. Revealed comparative advantage (RCA), by partners Total EU CEFTA -5 SEE-7 2000 2001 2000 2001 2000 2000 I.live animals and animal products
0.07 -0.42 0.1 -0.14 -0.85 2.55
II.vegetal products -0.59 -0.44 0 0.32 -1.68 -1.43 III.animal or vegetal oil
-0.27 -0.07 -1.01 -1.98 0.76 2.08
IV.food, beverages, tobacco
-1.66 -1.45 -1.34 -1.01 -0.84 -1.94
V.mineral products -0.6 -0.66 -0.66 0.16 0.64 2.67 VI.chemical products -0.5 -0.55 -1.52 -1.79 -0.43 1.21 VII.plastics, rubber -0.69 -0.85 -0.86 -1.08 -1.42 0.03 VIII.skin, leather, furs
-1.06 -0.94 -1.31 -1.26 1.06 0.84
IX.wooden products 2.14 1.91 1.82 1.7 1.08 2.14 X.paper -1.04 -0.9 -1.64 -1.27 -2.22 -0.33 XI.textiles 0.39 0.64 0.34 0.38 0.68 -2.12 XII.footwear 1.49 1.65 1.54 1.61 2.2 -0.92 XIII.plastic, glass, cement
0.12 -0.00 0.13 -0.66 -0.82 -1.86
XV.basic metals and articles
0.85 0.57 0.75 0.33 0.23 2.57
XVI. machines and equipment
-0.56 -0.43 -0.55 -0.45 0.46 -1.6
XVII.means of transport
0.15 0.009 -0.22 -0.3 0.97 -0.69
XVIII. optical, photo instr.
-1.9 -1.8 -1.76 -1.7 -1.17 -2.75
XX. miscellanousinc. furniture
1.01 1.08 1.02 1.1 0.47 -1.26
Source: author’s calculation
Source: authors’ calculation
Figure 2. Hirschmann index, export concentration of Romanian foreign trade, %, 1991-2001
1011121314151617181920
1991 1992 1993 1994 1995 1996 1997 1998 1999 2000 2001
Total
EU
24
Figure 5. RCA in machines and equipment (group XVI)
-2
-1.5
-1
-0.5
0
0.5
1991
1992
1993
1994
1995
1996
1997
1998
1999
2000
2001
RCAtRCAeu
Figure 3. RCA in textiles
00.20.40.60.8
11.21.41.6
1991
1992
1993
1994
1995
1996
1997
1998
1999
2000
2001
RCAtRCAeu
Figure 4. RCA in furniture industry
0
0.5
1
1.5
2
2.5
3
3.5
1991
1992
1993
1994
1995
1996
1997
1998
1999
2000
2001
RCAtRCAeu

25
Source for Figures 3-6: authors’ calculation Table 7. CEFTA members’ coverage ratio, 1999-2000, % CEFTA-5 plus Romania
Coverage ratio, % 1999 2000
Trade with CEFTA*
Trade with EU Trade with CEFTA*
Trade with EU
Romania 64.3 88.7 73.1 89.5 Czech Republic 126.8 100.7 118 89.5 Hungary 96.8 105.6 94.6 112.5 Poland 72.8 64.7 76.8 73.9 Slovenia 73.0 81.3 75.2 81.3 Slovak Republic 114.9 103.7 130.4 112.2 *trade with Bulgaria also considered Source: NSI and World Bank data Table 8. Trade volume with SEE economies Xsee, mil.USD Msee, mil.USD 1997 1998 1999 2000 2001 1997 1998 1999 2000 2001 alb 3.1 4.3 7.6 10.4 12.3 0.1 0.4 0 0.1 0.8 bos 10.7 14.7 11.1 12.8 10.3 7.6 11.1 6.2 11.4 8.3 bul 57.4 77.9 136.6 289.5 177.6 55.6 47.4 54.9 87.8 124 cro 18.6 15.2 12.7 19.2 12.7 15.5 4 5.6 3.7 4 fyr 11.4 6.9 8.1 14.2 10.6 4.5 4.5 3 1.9 1.4 yug 139.7 118.6 85.9 137.9 123.2 54 61.1 55.5 65.3 28.7 tur 353.8 323 469.4 627.3 395 212.7 271.6 237 271.3 304.9 Source: NSI data Table 9. Differences in Romania’s trade with different “blocks” EU-15 CEFTA-5 SEE-7 coverage ratio 86.56% 44.28% 149.63% % total exports 67.81% 5.32% 7.57% % total imports 57.35% 8.79% 3.70% export concentration
18.21 12.13* 21.35*
Figure 6. Intra-industry index, machines and equipment, trade with EU
0.00%10.00%20.00%30.00%40.00%50.00%60.00%70.00%80.00%
1993 1994 1995 1996 1997 1998 1999 2000 2001

26
import concentration
14.48 8.24* 11.02*
trade intensive in textiles, footwear, machines, furniture
agricultural products, plastics, paper, glass
metals, minerals, cereals, fruits
*year 2000 Source: author Table 10. Exports outside the region - dominated by textiles and footwear Romania Albania Bosnia-Hert. Bulgaria Croatia Yug FYROM Textile and footwear exports in total exports (%)
49.3 64.8 50 31.2 36.4 21.5 43
Source: WB Regional Strategy Paper The Road to Stability and Prosperity in South Eastern Europe, 2000.
Source: based on NBR data Table 11. FDI in the Romanian economy, by country, 1990-2000 Total, mil.USD % Greenfield, mil.USD Privatization, mil. USD 1. France 818.4 11.5 410.7 407.7 6. Greece 500.1 7.0 147.1 353.0 10.Turkey 300.4 4.2 194.7 105.7 12.Hungary 156.6 2.2 162.9 3.7 Source: Romanian-Turkish Chamber of Commerce, published in Capital no.24/2001 Table 12. The “weight” of FDI Number of companies, % of total USD invested / company Turkey 8.8 27,043 Hungary 4.3 49,204 Greece 2.4 86,065 Yugoslavia 0.8 25,833 Bulgaria 0.4 22,208 Source: computed from National Register Office data
Figure 7. FDI stock and foreign private debt stock, mil.USD
0100020003000400050006000700080009000
1991
1992
1993
1994
1995
1996
1997
1998
1999
2000
2001
FDI
Private debt
27
Table 13. Different characteristics of investments originating from EU and SEE Investments from EU Investments from SEE region export-driven market-driven production-oriented services-oriented skip Uppsala model fit Uppsala model higher capital intensive lower capital intensive financed by foreign loans lack of access to finance trade complements trade substitutes mixed entry mode preference for greenfield potential for spreading-out effect limited spreading-out effect Source: author