Embed Size (px)
Citation preview

WIIW INDUSTRY STUDIES 2001/3
Development and Prospects of the Chemicals, Chemical Products and Man-made Fibres Sector in the Central and Eastern European Countries

WIIW INDUSTRY STUDIES In this series, The Vienna Institute for International Economic Studies (WIIW) publishes results which stem from its research on structural developments in CEEC economies. In 1996/97 the WIIW started to build up its Industrial Database Eastern Europe which comprises time series for the Czech Republic, Hungary, Poland, Slovakia, Slovenia, Bulgaria and Romania.
Research results are published in the form of • Structural Reports as well as • Industry Studies
The Industry Studies cover 14 individual branches: • Food products; beverages and tobacco • Textiles and textile products • Leather and leather products • Wood and wood products • Pulp, paper & paper products, publishing & printing • Coke, refined petroleum products & nuclear fuel • Chemicals, chemical products and man-made fibres • Rubber and plastic products • Other non-metallic mineral products • Basic metals and fabricated metal products • Machinery and equipment n.e.c. • Electrical and optical equipment • Transport equipment • Manufacturing n.e.c.
Each of these studies presents a detailed picture of the development and prospects of the particular industry in central and eastern Europe. The first part of each study concentrates on: the patterns of production and employment; international competitiveness and trade performance with the EU (productivity, labour costs, price and quality indicators, revealed comparative advantage, etc.); and foreign direct investment. The second part provides more detailed industry data and valuable information about the leading domestic firms and the foreign investors in the industry.
Michael Landesmann Research Director, WIIW
So far published: – 1999/1 Development and Prospects of the Mechanical Engineering Sector in the Central and Eastern European Countries
(March 1999) – 1999/2 Development and Prospects of the Paper and Printing Sector in the Central and Eastern European Countries (May
1999) – 1999/3 Development and Prospects of the Wood and Wood Products Sector in the Central and Eastern European
Countries (September 1999) – 1999/4 Development and Prospects of the Transport Equipment Sector in the Central and Eastern European Countries
(December 1999) – 2000/1 Development and Prospects of the 'Other Non-metallic Mineral Products' Industry in the Central and Eastern
European Countries (January 2000) – 2000/2 Development and Prospects of the Rubber and Plastic Products Sector in the Central and Eastern European
Countries (March 2000) – 2000/3 Development and Prospects of the Food Products, Beverages and Tobacco Sector in the Central and Eastern
European Countries (October 2000) – 2001/1 Development and Prospects of the Leather and Leather Products Sector in the Central and Eastern European
Countries (February 2001) – 2001/2 Development and Prospects of the Electrical and Optical Equipment Sector in the Central and Eastern European
Countries (July 2001)
– 2001/3 Development and Prospects of the Chemicals, Chemical Products and Man-made Fibres in the Central and Eastern European Countries (November 2001)
For details concerning the WIIW Industrial Database Eastern Europe see the back of this report.

November 2001
Doris Hanzl
Development and Prospects of the Chemicals, Chemical Products and Man-made Fibres Sector in the Central and Eastern European Countries

Contents
Executive summary............................................................................................................i
Part I: INDUSTRY SURVEY............................................................................................ 1
1 Overview: Trends in growth and structure................................................................... 2
2 International competitiveness.................................................................................... 10
3 Trade performance with the EU(15) .......................................................................... 13
4 Foreign direct investment.......................................................................................... 26
5 Prospects.................................................................................................................. 27
PART II: COMPANY PROFILES................................................................................... 29
Bulgaria ......................................................................................................................... 29
Czech Republic.............................................................................................................. 31
Hungary......................................................................................................................... 34
Poland........................................................................................................................... 38
Romania........................................................................................................................ 42
Slovakia......................................................................................................................... 44
Slovenia......................................................................................................................... 46
References .................................................................................................................... 50
Appendix of Tables and Figures..................................................................................... 53
List of Tables and Figures
Table 1 Chemicals, chemical products and man-made fibres: Overview on production and equipment, 2000......................................... 3
Table 2 Production shares of individual industries in total manufacturing (at current prices), 2000, in %................................................................... 4
Table 3 Chemicals, chemical products and man-made fibres: Production shares (at constant prices 1996), in %, Manufacturing = 100............................... 5
Table 4 Chemicals, chemical products and man-made fibres: Production growth (at constant prices 1996)............................................. 7
Table 5 Chemicals, chemical products and man-made fibres: Employment shares in %, Manufacturing = 100....................................... 9
Table 6 Chemicals, chemical products and man-made fibres: Employment, thousand persons............................................................... 9
Table 7 Chemicals, chemical products and man-made fibres: Average annual growth rates, 1993-2000, in %...................................... 11
Table 8 Chemicals, chemical products and man-made fibres: Average monthly gross wages, Manufacturing = 100............................. 13
Table 9 Detailed export structure of the chemical sector, trade with the EU(15), 1999, in %.............................................................................................. 18
Table 10 Detailed import structure of the chemical sector, trade with the EU(15), 1999, in %.............................................................................................. 18
Table 11 Chemicals, chemical products and man-made fibres: Price/Quality gap indicator for CEECs' exports to the EU....................... 19
Table 12 Chemicals, chemical products and man-made fibres: CEECs' exports to the EU(15) in ECU million, market shares in %................................... 21
Table 13 Chemicals, chemical products and man-made fibres: CEECs' exports to Austria in ECU million, market shares in %............................................. 22
Table 14 Chemicals, chemical products and man-made fibres: CEECs' imports from Austria in ECU million, market shares in %.................................... 22
Table 15 Chemical sector RCAs ........................................................................... 24
Table 16 Relative position of chemical sector RCAs ............................................. 24
Table 17 Detailed RCA structure of the chemical sector, 1999.............................. 25
Table 18 Bulgaria: Gross output of the chemical sector, BGL million, distribution in %.................................................................. 30
Table 19 The largest Bulgarian chemical companies, ranked by 2000 net sales....................................................................... 30
Table 20 Czech Republic: Sales revenues of the chemical sector, CZK million, distribution in %...................................................................................... 33
Table 21 The largest Czech chemical companies, ranked by 1999 net sales....................................................................... 33
Table 22 Hungary: Gross output, total sales and export sales in the chemical sector...................................................................................... 35
Table 23 The largest companies of the Hungarian chemical sector, ranked by 2000 net sales....................................................................... 36
Table 24 Poland: Sold production of the chemical sector, PLN million, distribution in %.................................................................. 39
Table 25 Poland: Net profitability in the enterprise sector and real growth rates of investment outlays, in %............................................................ 40
Table 26 The largest companies of the Polish chemical sector, ranked by 2000 revenues....................................................................... 41
Table 27 The largest Romanian chemical companies, ranked by 1999 turnover........................................................................ 43
Table 28 The largest companies of the Slovak chemical sector, ranked by 2000 net revenues................................................................. 45
Table 29 Slovenia: Total revenues of the chemical sector, SIT million, distribution in %.................................................................... 48
Table 30 The largest companies of the Slovenian chemical sector, ranked by 2000 income.......................................................................... 48
Table A1 Key data on total manufacturing............................................................. 54
Table A2 Fertilizers in use, 100% nutrients, kg per ha, 1985=100......................... 56
Table A3 Chemicals, chemical products and man-made fibres: Estimated ranges for Unit Labour Costs in 1999, Austria 1999 = 100..... 56
Table A4 Structure of manufacturing exports to the EU(15), 1999, in %................ 57
Table A5 Developments in GDP and gross industrial production........................... 57

Figure 1 Chemicals, chemical products and man-made fibres: Production shares in total manufacturing (at constant prices 1996) relative to CEEC-average, in percentage points.......................................... 5
Figure 2 Chemicals, chemical products and man-made fibres: Industrial production index (at constant prices 1996, national currency), 1989 = 100................................................................................................. 8
Figure 3 Chemicals, chemical products and man-made fibres: Shares in production (at constant prices 1996) and employment in total manufacturing, in %.................................................................................. 10
Figure 4 Chemicals, chemical products and man-made fibres: Wages (ECU), Austria 1999 = 100............................................................. 12 Productivity (PPP), Austria 1999 = 100...................................................... 12 Unit labour costs (ECU), Austria 1999 = 100............................................. 12
Figure 5 Chemicals, chemical products and man-made fibres: CEECs' exports to and imports from the world.......................................... 14
Figure 6 Chemicals, chemical products and man-made fibres: Export index EU(15), in ECU million, 1995 = 100...................................... 16
Figure 7 Chemicals, chemical products and man-made fibres: A: Position of the sector in the distribution of foreign capital...................... 27 B: Foreign penetration of the sector .......................................................... 27
Figure A1 Chemicals, chemical products and man-made fibres: Shares of CEECs (at constant prices 1996) relative to other countries .................................. 58
Figure A2 Chemicals, chemical products and man-made fibres: Shares in manufacturing exports to the EU(15), in %................................ 59

i
Executive summary
In Central and Eastern Europe, as in most other economies, the chemical sector is a key part of manufacturing, characterized by high concentration and fierce competition. It is considered a capital-, R&D- and skill-intensive industry, producing a wide range of products (e.g. soaps, cosmetics, pharmaceuticals, fertilizers, plastics and synthetic rubber etc.). In Central Europe, the sector has turned from a priority sector during communism into a problematic, declining sector during transition, troubled by the loss of former CMEA markets and strong import competition. The study investigates the development and prospects of the chemical sector in the following countries:
− Bulgaria − Romania − Czech Republic − Slovakia − Hungary − Slovenia − Poland In size, the chemical sector is still of relatively great importance in the Central and Eastern European countries today, contributing between 6% and 8% of manufacturing output; it holds an even more prominent position in Slovenia and Bulgaria (10%). The production structure is dominated by 'basic chemicals'. 'Pharmaceuticals' do play an important role in some countries. In the first phase of transition, which lasted from 1989 to around 1992, a severe transformational recession hit the region, with the output of the chemical sector declining even more than the rest of the economy. After 1993, production started to rise in most countries but growth remained weak. This was possibly due to a slow reorientation of trade to West-European markets, the effects of the Russian crisis in 1998, growing import competition, high input prices, the lack of capital and difficulties in restructuring of large companies. In 2000, the chemical sector slightly surpassed the 1989 level in Poland and the Czech Republic only. As an employer, the chemical sector plays a smaller role than in production due to its capital-intensive nature and today accounts for 4% to 6% of manufacturing employment only. During transition, employment was reduced in all countries and employment shares declined. As is typical for all CEECs and all sectors of manufacturing, wages, productivity and unit labour costs in the chemical sector have generally been much lower than in West European countries, for which we use Austria as a point of reference. During transition, sectoral wages, productivity and unit labour costs rose in all CEECs, the productivity
ii
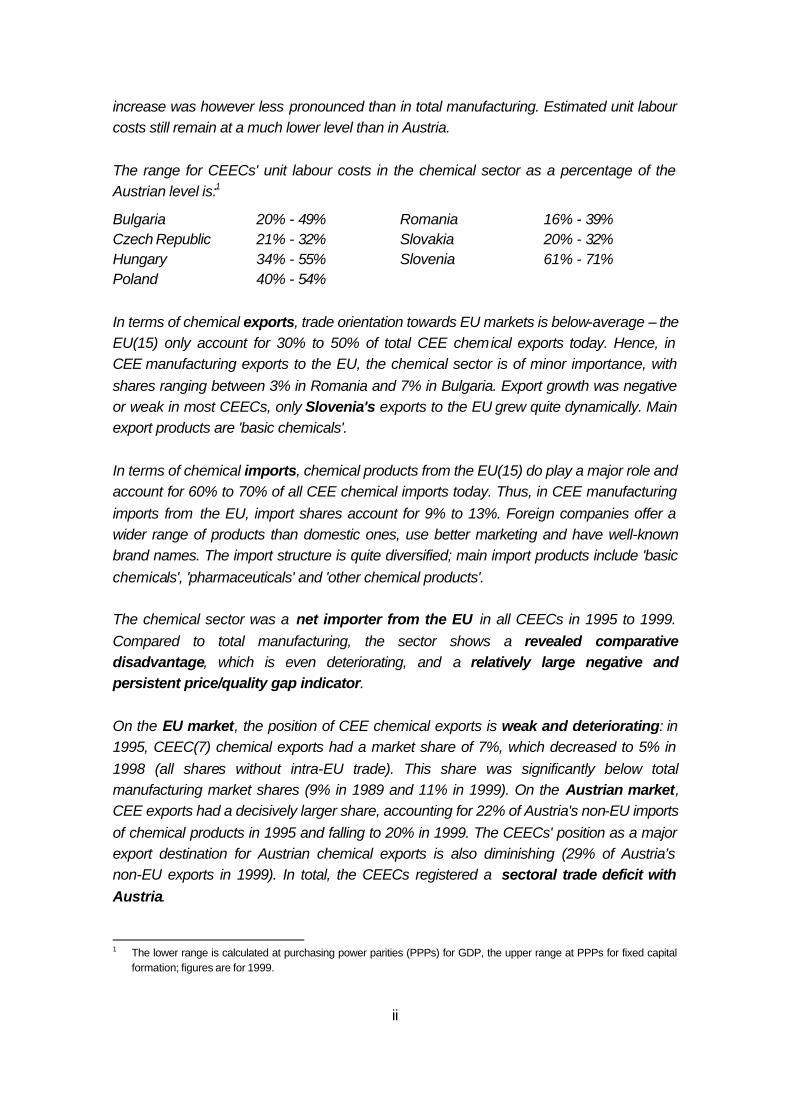
increase was however less pronounced than in total manufacturing. Estimated unit labour costs still remain at a much lower level than in Austria. The range for CEECs' unit labour costs in the chemical sector as a percentage of the Austrian level is:1
Bulgaria 20% - 49% Romania 16% - 39% Czech Republic 21% - 32% Slovakia 20% - 32% Hungary 34% - 55% Slovenia 61% - 71% Poland 40% - 54% In terms of chemical exports, trade orientation towards EU markets is below-average – the EU(15) only account for 30% to 50% of total CEE chemical exports today. Hence, in CEE manufacturing exports to the EU, the chemical sector is of minor importance, with shares ranging between 3% in Romania and 7% in Bulgaria. Export growth was negative or weak in most CEECs, only Slovenia's exports to the EU grew quite dynamically. Main export products are 'basic chemicals'. In terms of chemical imports, chemical products from the EU(15) do play a major role and account for 60% to 70% of all CEE chemical imports today. Thus, in CEE manufacturing imports from the EU, import shares account for 9% to 13%. Foreign companies offer a wider range of products than domestic ones, use better marketing and have well-known brand names. The import structure is quite diversified; main import products include 'basic chemicals', 'pharmaceuticals' and 'other chemical products'. The chemical sector was a net importer from the EU in all CEECs in 1995 to 1999. Compared to total manufacturing, the sector shows a revealed comparative disadvantage, which is even deteriorating, and a relatively large negative and persistent price/quality gap indicator. On the EU market, the position of CEE chemical exports is weak and deteriorating: in 1995, CEEC(7) chemical exports had a market share of 7%, which decreased to 5% in 1998 (all shares without intra-EU trade). This share was significantly below total manufacturing market shares (9% in 1989 and 11% in 1999). On the Austrian market, CEE exports had a decisively larger share, accounting for 22% of Austria's non-EU imports of chemical products in 1995 and falling to 20% in 1999. The CEECs' position as a major export destination for Austrian chemical exports is also diminishing (29% of Austria’s non-EU exports in 1999). In total, the CEECs registered a sectoral trade deficit with Austria.
1 The lower range is calculated at purchasing power parities (PPPs) for GDP, the upper range at PPPs for fixed capital
formation; figures are for 1999.

iii
The chemical sector is a prominent target for foreign direct investment, motivated by market-seeking considerations and follow-the-leader strategies rather than by low labour costs. Nevertheless, the restructuring of the sector is apparently not yet completed. The future prospects of the sector are quite mixed: While export competitiveness on EU markets decreased, better growth potentials exist on the domestic and CEE markets, which are however increasingly challenged by strong import competition from EU companies. For the future, ongoing restructuring, modernization and ecological upgrading have to be pursued in order to meet international demand and to comply with EU regulations. Key words: chemicals, chemical products and man-made fibres sector; pharmaceutical
industry; manufacturing; transition countries JEL classification: L6, L65

1
Doris Hanzl
Development and Prospects of the Chemicals, Chemical Products and Man-made Fibres Sector in the Central and Eastern European Countries
Part I: INDUSTRY SURVEY
The chemical sector is placed among the key manufacturing sectors, characterized by high concentration and fierce competition. It is a very heterogeneous sector, transforming various raw materials (oil and gas from the petrochemical industry, metals and minerals, as well as certain agricultural raw materials such as sugar, starch or fats) into substances with new physical and chemical properties. A large part of chemical products (approximately 33%) is further processed in the sector itself and/or supplied to other manufacturing sectors, to agriculture and to the final consumer. Products range from soaps, cosmetics and pharmaceuticals to fertilizers, plastics and synthetic rubber. The chemical industry is considered a capital-, R&D-, and skill-intensive sector, in some sub-branches it is also characterized by high energy intensity (basic chemicals). In addition, it is defined as a medium-high-technology sector – except for the high-technology pharmaceuticals sector. This study provides a thorough picture in two parts of the chemical sector in the Central and Eastern European countries (CEECs). Part I gives a more macroeconomic survey of the developments and prospects of the sector, while Part II presents further detailed information and selected company profiles. The first part consists of four sections: Section 1 deals with trends in growth and structure of the sector, including characteristics of production and employment. Section 2 analyses indicators of international competitiveness, in particular wage rates, productivity levels and unit labour costs. Section 3 examines various aspects of trade performance with the European Union, while section 4 takes a closer look at foreign direct investment in the sector. A concluding section provides a summary and outlook on future prospects; the appendix presents additional tables and figures. In the NACE rev. 1 classification system (Statistical classification of economic activities in the European Community) the term ‘chemicals, chemical products and man-made fibres’, thereafter called chemical sector, denotes the sub-section ‘DG’, which is identical to division '24'. The chemical sector includes the following sub-branches:

2
− Basic chemicals (24.1)1
− Pesticides and other agro-chemical products (24.2)
− Paints, varnishes and similar coatings, printing ink and mastics (24.3)
− Pharmaceuticals, medicinal and botanical products (24.4)
− Soap and detergents, cleaning and polishing preparations, perfumes and toilet preparations (24.5)
− Other chemical products (24.6)2
− Man-made fibres (24.7)
The following analysis is based on this classification. Data come from the WIIW Industrial Database – Central and Eastern Europe (IDB-CEE), which currently covers Bulgaria, the Czech Republic, Hungary, Poland, Romania, Slovakia and Slovenia (CEEC(7)). Data on foreign direct investment originate from the WIIW Database on Foreign Investment Enterprises (FIEs), data on foreign trade from EUROSTAT.
1 Overview: Trends in growth and structure
The chemical sector in the region
The chemical sector plays an important role in the economies of the CEECs with a total production volume of EUR 15.5 billion and a workforce of 328,900 persons in the CEEC(7). Among the CEEC(7), Poland was the largest producer of chemical products in terms of current production in 2000 (EUR 5.7 billion), followed by Hungary and the Czech Republic (both about EUR 3 billion). In Romania, Slovenia and Slovakia the chemical sector reached a production volume of about EUR 1 billion, in Bulgaria production was relatively small (see Table 1). Regarding employment, Poland took again the lead in the region, followed by Romania. In Poland about 112,000 persons were employed in the chemical sector in 2000, in Romania 77,000. In the Czech Republic, Hungary and Bulgaria between 39,000 and 31,000 employees worked in the chemical sector, while the number was smaller in Slovakia (21,000) and Slovenia (12,000).
1 At the four-digit level 'basic chemicals' inc lude: 'industrial gases' (24.11), 'dyes and pigments' (24.12), 'other inorganic
basic chemicals' (24.13), 'other organic basic chemicals' (24.14), 'fertilizers and nitrogen compounds' (24.15), 'plastics in primary forms' (24.16) and 'synthetic rubber in primary forms' (24.17).
2 At the four-digit level 'other chemical products' include: 'explosives' (24.61), 'glues and gelatine' (24.62), 'essential oils' (24.63), 'photographic chemical material' (24.64), 'prepared unrecorded media' (24.65) and 'other chemical products n.e.c.' (24.66).

3
Comparing the levels of production with the levels of employment in the different CEECs reveals significant differences in output per employee (= labour productivity) in the sector. While in Hungary, for instance, the chemical sector produced an output of EUR 3 billion with 37,000 persons, in Romania the sector produced only EUR 1.4 billion with 77,000 persons. High labour productivity occurs not only in Hungary but also in Slovenia, low productivity is observed in Romania and Bulgaria, pointing to delayed restructuring in the latter two countries (see the analysis of labour productivity below3).
Table 1
Chemicals, chemical products and man-made fibres Overview of production and employment, 2000
Production1) Employment
EUR million % of GDP % of manuf. ths. persons % of manuf.
Bulgaria 739.3 5.68 9.5 31.0 5.9
Czech Republic2) 2624.5 5.13 6.7 39.3 3.8
Hungary3) 2900.0 5.86 7.2 37.2 5.0
Poland2) 5669.5 3.90 6.5 111.9 4.6
Romania2) 1402.4 4.24 7.8 77.0 4.9
Slovak Republic 1064.4 5.11 6.4 20.8 4.3
Slovenia2) 1114.0 5.91 10.0 11.7 5.2
CEEC(7) 15514.1 . . 328.9 .
Notes: 1) At current prices. - 2) Production data 1999. - 3) Employment data 1999.
Source: WIIW Industrial Database.
Declining importance of the sector in production – specialization in Slovenia and Bulgaria
Today, the chemical sector is of relatively great importance in CEECs' total manufacturing; it reached about 10% of total manufacturing production in Slovenia and Bulgaria in 2000 (at current prices). In the other countries, shares were slightly smaller, with only minor variations across countries, and ranged between 6.4% in Slovakia and 7.8% in Romania (see Table 2). The chemical sector was one of the priority sectors with regard to industrial development during the former command economy with its pronounced bias towards heavy industry and towards production of raw materials and intermediate products. It was dominated by heavy
3 However, the analysis of labour productivity in chapter 2 uses production data at constant prices 1996 while here
production figures at current prices are stated. There are marked differences between the Czech Republic and Hungary, with the Czech Republic showing higher productivity in terms of constant prices and Hungary in terms of current prices (price increase since the reference year!).

4
Table 2 Production shares of individual industries
in total manufacturing (at current prices), 2000, in %
Czech Slovak
Bulgaria Republic1) Hungary Poland1) Romania 1) Republic Slovenia1)
D Manufacturing total 100.0 100.0 100.0 100.0 100.0 100.0 100.0 DA Food products; beverages and
tobacco
23.0 17.2 15.2 24.8 21.0 12.5 14.9
DB Textiles and textile products 6.6 4.4 3.3 4.8 7.7 3.6 7.3 DC Leather and leather products 1.1 0.8 0.6 0.9 1.8 1.2 1.5
DD Wood and wood products 1.5 2.7 1.1 3.8 3.4 3.0 3.2 DE Pulp, paper & paper products;
publishing and printing
4.2 4.7 4.3 6.4 3.5 6.3 7.1
DF Coke, refined petroleum products &
nuclear fuel
18.3 2.8 6.3 4.4 10.7 10.1 0.4
DG Chemicals, chemical products &
man-made fibres
9.5 6.7 7.2 6.5 7.8 6.4 10.0
DH Rubber and plastic products 1.9 4.3 3.3 4.6 2.4 3.4 4.5
DI Other non-metallic mineral products 4.2 6.4 2.7 5.4 4.7 4.6 4.8 DJ Basic metals and fabricated metal
products
12.5 15.9 8.1 10.7 15.8 17.0 12.3
DK Machinery and equipment n.e.c. 9.8 8.0 4.1 5.5 5.1 6.8 10.4
DL Electrical and optical equipment 4.3 7.9 27.2 7.2 4.7 7.9 8.6
DM Transport equipment 1.6 14.3 15.4 10.3 7.7 14.5 9.9
DN Manufacturing n.e.c. 1.6 3.9 1.3 4.6 3.7 2.7 5.3
Notes: 1) 1999.
Source: WIIW Industrial Database.
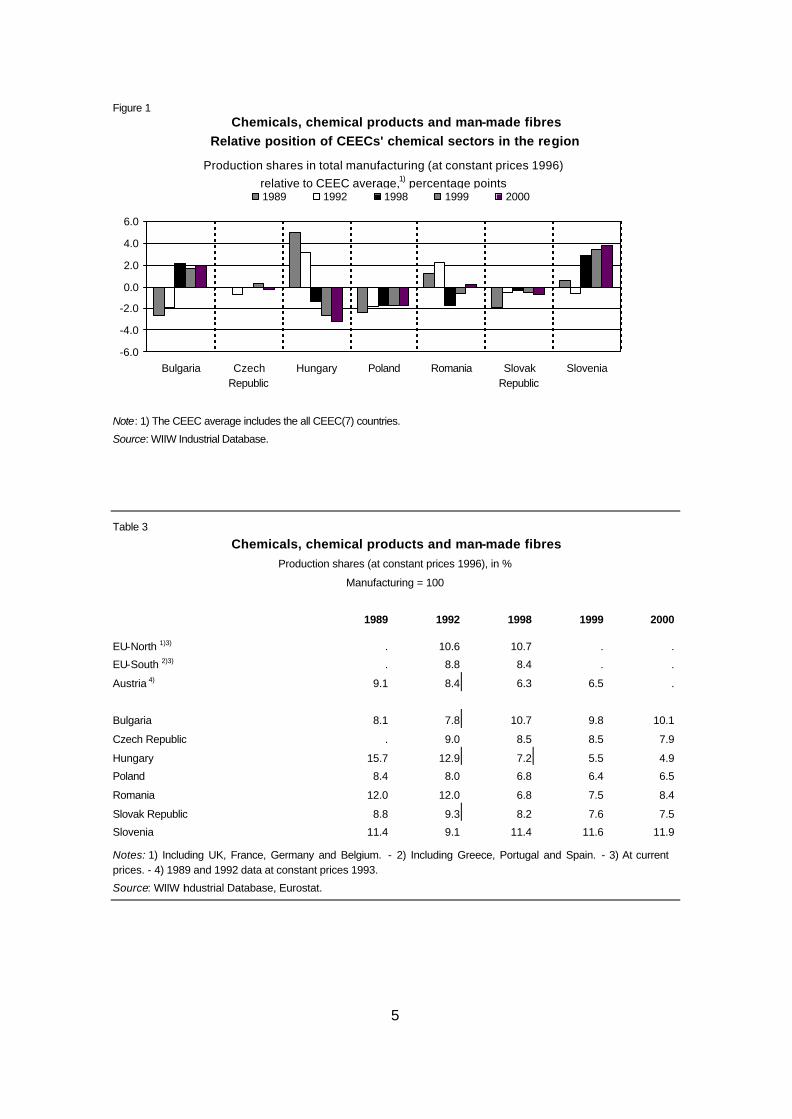
chemicals, with the petrochemical industry playing a major role in the development of the sector. As natural resources were missing in most CEECs, the sector was built on the basis of cheap oil and gas imports from the Soviet Union resulting in high energy intensity. Under the Council for Mutual Economic Assistance (CMEA) division of labour, the chemical sector was promoted in Hungary, which focused on the pharmaceutical industry (16% of production, at constant prices 1996, in 1989!).4 With the collapse of communism, the chemical sector lost its priority position and output shares declined. Import competition and the loss of CMEA market posed a severe threat to the sector. However, it did maintain part of its importance and now lies in the middle-field of manufacturing in terms of production shares. In Hungary, the former specialization on the sector vanished as other segments of manufacturing became more important (transport equipment, electrical and optical equipment). Today, the chemical sector has a prominent position only in Slovenia and Bulgaria (see Figure 1 and Table 3).
4 In Poland, the chemical sector was focused on paints and cosmetics, in the Czech Republic also on paints. See
Wilczynski (1974), p. 279.
5
Figure 1 Chemicals, chemical products and man-made fibres
Relative position of CEECs' chemical sectors in the region
Production shares in total manufacturing (at constant prices 1996) relative to CEEC average,1) percentage points
-6.0
-4.0
-2.0
0.0
2.0
4.0
6.0
Bulgaria CzechRepublic
Hungary Poland Romania SlovakRepublic
Slovenia
1989 1992 1998 1999 2000
Note: 1) The CEEC average includes the all CEEC(7) countries.
Source: WIIW Industrial Database.
Table 3
Chemicals, chemical products and man-made fibres Production shares (at constant prices 1996), in %
Manufacturing = 100
1989 1992 1998 1999 2000
EU-North 1)3) . 10.6 10.7 . .
EU-South 2)3) . 8.8 8.4 . .
Austria 4) 9.1 8.4 6.3 6.5 .
Bulgaria 8.1 7.8 10.7 9.8 10.1
Czech Republic . 9.0 8.5 8.5 7.9
Hungary 15.7 12.9 7.2 5.5 4.9
Poland 8.4 8.0 6.8 6.4 6.5
Romania 12.0 12.0 6.8 7.5 8.4
Slovak Republic 8.8 9.3 8.2 7.6 7.5
Slovenia 11.4 9.1 11.4 11.6 11.9
Notes: 1) Including UK, France, Germany and Belgium. - 2) Including Greece, Portugal and Spain. - 3) At current prices. - 4) 1989 and 1992 data at constant prices 1993.
Source: WIIW Industrial Database, Eurostat.

6
In comparison to the more advanced industrialized countries of the 'EU-North' (see Appendix, Figure A1), the chemical sector of the CEECs was mostly smaller. In Hungary and Romania, the deficit emerged in recent years only. When compared to the countries of the 'EU-South' (low-income countries), the CEECs showed a slightly larger chemical sector, although deficits also emerged in the last few years, with the only exceptions of Bulgaria and Slovenia. Austria has a relatively small chemical sector too, and hence the CEECs exhibited a structural surplus in the chemical sector over the whole period. Weak growth pattern of the chemical sector
During the first period of transformation, from 1989 to about 1992, all CEECs experienced a severe transformational recession, and the production of the chemical sector declined as well (see Table 4). In comparison to total manufacturing, the sector was however much more affected and hence may be called a relative 'loser'5 of this period (except in Slovakia, see Table 4, average annual changes relative to total manufacturing, 1990-1992). This development might be explained by several factors on the demand side: First, the chemical sector produces some consumer goods the purchase of which can be deferred (e.g. cosmetics) and a wide range of products that is highly exposed to western import competition (e.g. soaps, detergents, pharmaceuticals). Second, the chemical sector produces also a variety of intermediate products, so that the downturn in other segments of manufacturing spreads to the chemical sector as well. Third, the chemical sector supplies products to the agricultural sector, such as fertilizers and pesticides, the usage of which fell over-proportionally, in part due to the general decline of this sector and also because of an overall cut of subsidies. In Hungary, for example, farmers utilized 260 kg of fertilizers per one hectare of land in 1986, only 40 kg in 1993 and about 70 kg in 1999. The decline in fertilizer usage hit bottom in most countries in 1993, in Bulgaria and Romania however the fall still continues (see Appendix, Table A2). Fourth, with the collapse of the CMEA market, important export markets for chemical products vanished. On the supply side the transition was characterized by the following processes: the closing-down of plants, the suspension of product lines (e.g. fertilizer production), the creation of new firms, and the restructuring and reorientation, respectively, of old firms. During the second period of transformation, from about 1993 onwards, growth returned to the region and the chemical sector participated in this general upswing as well. Output of the sector started to grow in most countries, except in Hungary and Romania (see Table 4). When compared to total manufacturing, growth was smaller and the sector
5 'Losers' of transition are here defined as industries that performed worse than total manufacturing in terms of
production growth, 'winners' are those that performed better – see Urban (1999), p. 22.

7
remained a 'loser' of this period as well, except in Bulgaria and Slovenia (see Table 4, average annual changes relative to total manufacturing, 1993-1999). This might be due to slow reorientation of trade to Western markets, to Eastern markets hit by the Russian crisis in 1998 and to growing import competition (e.g. in Hungary demand for pharmaceuticals grew significantly but market shares of domestic companies shrank) as well as due to higher input prices and the lack of capital. Restructuring of former large companies in the chemical sector seems to take longer than expected and to be rather difficult, also partly because of environmental requirements with respect to EU accession. Looking at the production index for the chemical sector,6 the decline of production in the first period was offset only in Poland and the Czech Republic, where production surpassed the 1989 level in 1996/1997. In the other countries, production still lay below the 1989 level in 2000 (see Figure 2). Interestingly, although the Hungarian economy in general did very well in comparison to the other CEECs, the development of the chemical sector was relatively weak there.
Table 4
Chemicals, chemical products and man-made fibres Production growth (at constant prices 1996)
Average annual Relative to Index changes in % total manufacturing, 2000 in percentage points
1990-92 1993-2000 1990-92 1993-2000 1989=100
Bulgaria -20.0 9.5 -1.0 1.9 53.1
Czech Republic . 0.7 . -1.7 105.5 1)
Hungary -19.5 -0.8 -4.3 -12.7 48.9
Poland -13.2 6.8 -2.0 -2.8 110.4
Romania -24.1 -6.0 0.0 -4.3 26.7
Slovak Republic -14.7 0.2 1.3 -2.8 63.3
Slovenia -17.6 5.1 -6.3 3.5 83.1
Notes: 1) Data have to be interpreted with caution.
Source: WIIW Industrial Database.
6 Data have to be interpreted with caution, especially for the Czech Republic: in that case data before 1992 can be
compared with later data only to a limited extent.

8
Figure 2
Industrial production index (at constant prices 1996, national currency), 1989 = 100
Source: WIIW Industrial Database.
Chemicals, chemical products and man-made fibres
0.0
20.0
40.0
60.0
80.0
100.0
120.0
1989 1990 1991 1992 1993 1994 1995 1996 1997 1998 1999 2000
Bulgaria Czech Republic Hungary PolandRomania Slovak Republic Slovenia
Minor role in employment
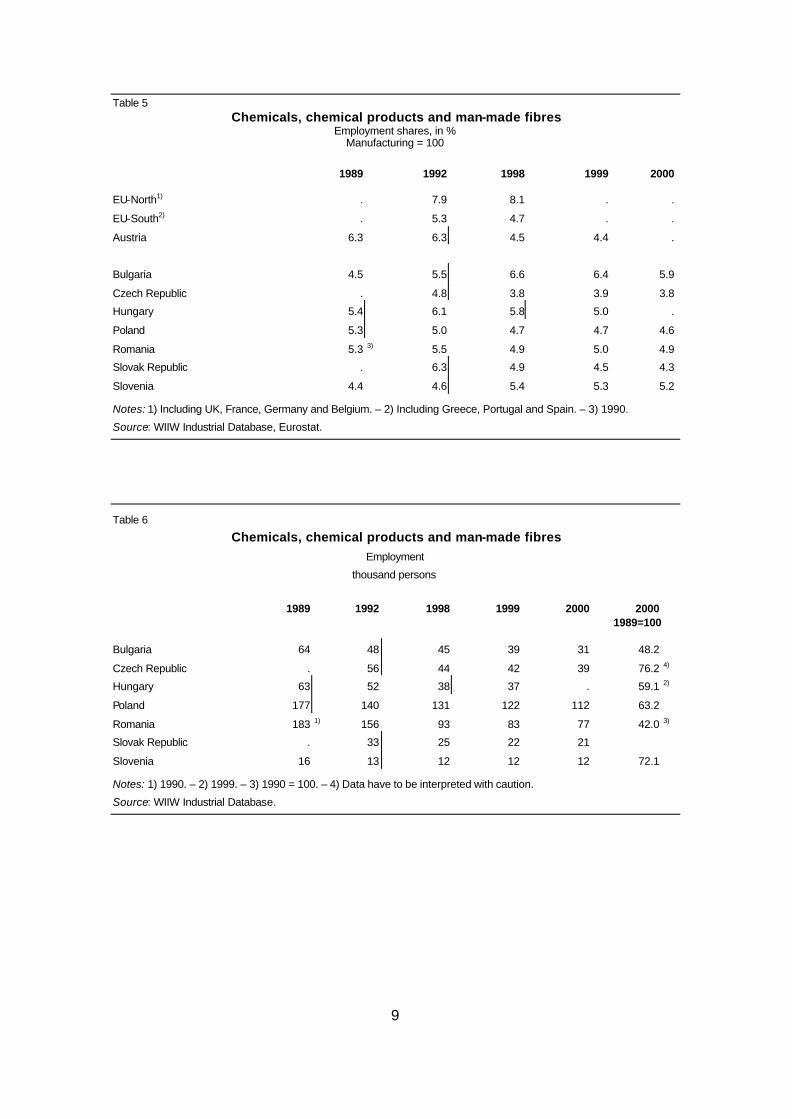
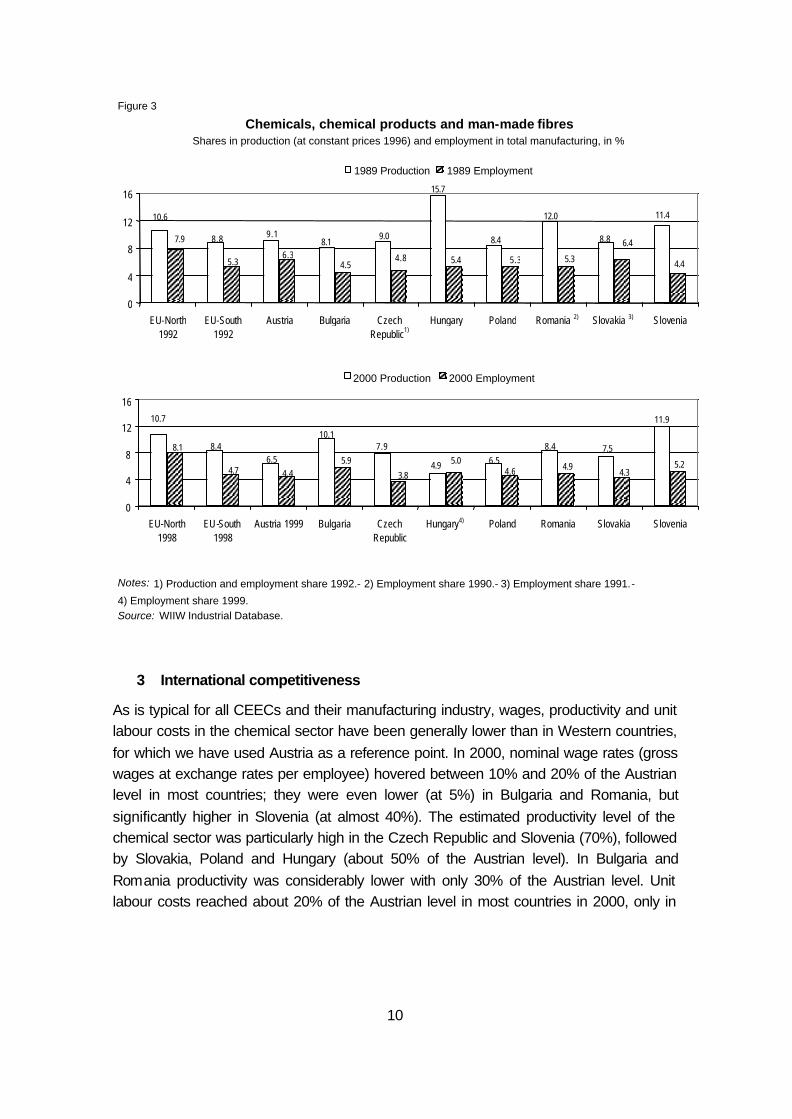
In employment, the chemical sector plays a smaller role than in production because of its capital-intensive nature. In 2000, employment shares in manufacturing only ranged between 4% in the Czech Republic and 6% in Bulgaria (see Table 5). In total numbers, about 112,000 persons were employed in the chemical sector in Poland, and 77,000 in Romania. In the Czech Republic, Hungary and Bulgaria between 39,000 and 31,000 employees worked in the chemical sector, while the number was even smaller in Slovakia (21,000) and Slovenia (12,000; see Table 6). During transition, employment has declined continuously over the whole period in all CEECs. Hence, employment figures were smaller in 2000 than in 1989 (see Table 6). As the decrease was more pronounced than in manufacturing, employment shares were smaller in 2000 than in 1989, again with the exception of Bulgaria and Slovenia. However, in the last few years shares declined in all countries, pointing to enforced restructuring (see Table 5). Comparing the production and employment shares of the chemical sector, the former were markedly larger in all CEECs both in 1989 and 2000, due to the capital-intensive character of the chemical sector (see Figure 3). However, during transition the gap decreased in all countries, except in Bulgaria and Slovakia, with a decline especially pronounced in Hungary.
9
Table 5 Chemicals, chemical products and man-made fibres
Employment shares, in % Manufacturing = 100
1989 1992 1998 1999 2000
EU-North1) . 7.9 8.1 . .
EU-South2) . 5.3 4.7 . .
Austria 6.3 6.3 4.5 4.4 .
Bulgaria 4.5 5.5 6.6 6.4 5.9
Czech Republic . 4.8 3.8 3.9 3.8
Hungary 5.4 6.1 5.8 5.0 .
Poland 5.3 5.0 4.7 4.7 4.6
Romania 5.3 3) 5.5 4.9 5.0 4.9
Slovak Republic . 6.3 4.9 4.5 4.3
Slovenia 4.4 4.6 5.4 5.3 5.2
Notes: 1) Including UK, France, Germany and Belgium. – 2) Including Greece, Portugal and Spain. – 3) 1990.
Source: WIIW Industrial Database, Eurostat.
Table 6
Chemicals, chemical products and man-made fibres
Employment
thousand persons
1989 1992 1998 1999 2000 2000 1989=100
Bulgaria 64 48 45 39 31 48.2
Czech Republic . 56 44 42 39 76.2 4)
Hungary 63 52 38 37 . 59.1 2)
Poland 177 140 131 122 112 63.2
Romania 183 1) 156 93 83 77 42.0 3)
Slovak Republic . 33 25 22 21
Slovenia 16 13 12 12 12 72.1
Notes: 1) 1990. – 2) 1999. – 3) 1990 = 100. – 4) Data have to be interpreted with caution.
Source: WIIW Industrial Database.
10
3 International competitiveness
As is typical for all CEECs and their manufacturing industry, wages, productivity and unit labour costs in the chemical sector have been generally lower than in Western countries, for which we have used Austria as a reference point. In 2000, nominal wage rates (gross wages at exchange rates per employee) hovered between 10% and 20% of the Austrian level in most countries; they were even lower (at 5%) in Bulgaria and Romania, but significantly higher in Slovenia (at almost 40%). The estimated productivity level of the chemical sector was particularly high in the Czech Republic and Slovenia (70%), followed by Slovakia, Poland and Hungary (about 50% of the Austrian level). In Bulgaria and Romania productivity was considerably lower with only 30% of the Austrian level. Unit labour costs reached about 20% of the Austrian level in most countries in 2000, only in
Figure 3
Shares in production (at constant prices 1996) and employment in total manufacturing, in %
Notes: 1) Production and employment share 1992.- 2) Employment share 1990.- 3) Employment share 1991.- 4) Employment share 1999. Source: WIIW Industrial Database.
Chemicals, chemical products and man-made fibres
11.4
8.8
12.0 10.6
8.8 9.1 8.1 9.0 8.4
15.7
4.4 6.4
5.3 7.9
5.3 6.3 4.5 5.4 5.3 4.8
0
4
8
12
16
EU-North 1992
EU-South 1992
Austria Bulgaria Czech Republic1)
Hungary Poland Romania 2) Slovakia 3) Slovenia
1989 Production 1989 Employment
11.9
4.9 6.5 7.9
10.1
6.5 8.4
10.7
8.4 7.5 5.2
3.8 4.6 5.0 5.9
4.4 4.7
8.1 4.9
4.3
0
4
8
12
16
EU-North 1998
EU-South 1998
Austria 1999 Bulgaria Czech Republic
Hungary4) Poland Romania Slovakia Slovenia
2000 Production 2000 Employment

11
Hungary (30%), Poland (40%) and especially Slovenia (60%) they were higher (see Figure 4).7
Table 7
Chemicals, chemical products and man-made fibres Average annual growth rates, 1993-2000
in %
Productivity Unit Labour Output Employment Productivity relative to Wage rates Costs (ECU basis) total manuf. (ECU basis) (ECU basis)
Bulgaria 0.6 -5.9 6.9 0.7 7.6 0.6
Czech Republic 0.7 -4.8 5.1 -0.9 15.3 9.0
Hungary1) -2.4 -5.2 3.0 -11.4 9.0 5.8
Poland 6.8 -2.7 9.8 -1.5 15.3 5.0
Romania -6.0 -8.5 2.7 -3.1 10.3 7.4
Slovak Republic 0.2 -6.5 7.1 0.3 11.6 4.2
Slovenia 5.1 -1.5 6.6 1.1 10.8 1) 4.7 1)
Notes: 1) 1993-1999.
Source: WIIW Industrial Database.
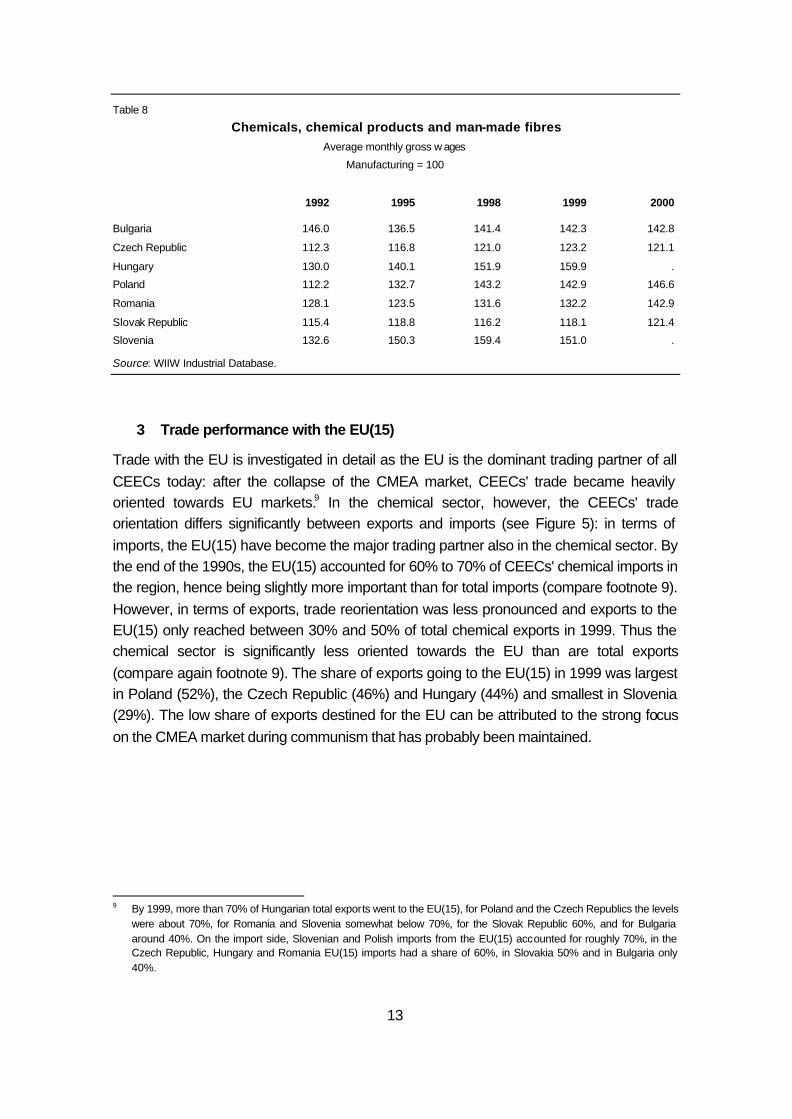
During transition, wages and productivity grew throughout the region. Between 1993 and 2000, the wage rate increased by more than 10% annually in most countries, the productivity increase was relatively smaller (see Table 7). However, when compared to total manufacturing, the productivity increase in the chemical sector was less pronounced, making the sector a relative productivity loser, except in the Slovak Republic, Slovenia, and Bulgaria.8 As the wage increase was higher than the productivity increase, unit labour costs rose in all countries and cost competitiveness of the sector decreased (see Table 7). Both the relatively weak productivity performance and declining cost advantages point to serious problems in the restructuring of the chemical sector in the CEECs. Looking at the wage level in the chemical sector, wages lay significantly above the total manufacturing average in 2000. In Hungary workers received remarkably more than the manufacturing average (160%), in the Czech and Slovak Republic still considerably more (120%). During transition relative wages increased distinctively in most countries (Table 8).
7 These figures are however strongly affected by different productivity measures. Table A3 in the Appendix shows the
lower and upper ranges for estimated unit labour costs in 1999, using alternative measures for productivity. In the text, only the lower range (productivity calculated at PPPs for GDP) is stated. When using the upper range (productivity calculated at PPPs for fixed capital formation) unit labour costs are higher but still below the Austrian level.
8 For an analysis of all manufacturing sectors compare Havlik (2001), p. 10f.

12
Notes: 1) PPP = Purchasing Power Parities for GDP. – 2) Coverage of Czech industrial statistics had a break in 1996/97 due to the size of enterprises included. Source: WIIW Industrial Database.
Figure 4
Wages (ECU), Austria 1999 = 100
Productivity (PPP) 1) , Austria 1999 = 100
Unit labour costs (ECU), Austria 1999 = 100
Chemicals, chemical products and man-made fibres
0
10
20
30
40
Bulgaria Czech Rep. Hungary Poland Romania Slovak Rep. Slovenia
1991 1992 1993 1994 1995 1996 1997 1998 1999 2000
0
20
40
60
Bulgaria Czech Rep.2) Hungary Poland Romania Slovak Rep. Slovenia
1991 1992 1993 1994 1995 1996 1997 1998 1999 2000
0
20
40
60
Bulgaria Czech Rep. Hungary Poland Romania Slovak Rep. Slovenia
1991 1992 1993 1994 1995 1996 1997 1998 1999 2000
13
Table 8
Chemicals, chemical products and man-made fibres Average monthly gross w ages
Manufacturing = 100
1992 1995 1998 1999 2000
Bulgaria 146.0 136.5 141.4 142.3 142.8
Czech Republic 112.3 116.8 121.0 123.2 121.1
Hungary 130.0 140.1 151.9 159.9 .
Poland 112.2 132.7 143.2 142.9 146.6
Romania 128.1 123.5 131.6 132.2 142.9
Slovak Republic 115.4 118.8 116.2 118.1 121.4
Slovenia 132.6 150.3 159.4 151.0 .
Source: WIIW Industrial Database.
3 Trade performance with the EU(15)
Trade with the EU is investigated in detail as the EU is the dominant trading partner of all CEECs today: after the collapse of the CMEA market, CEECs' trade became heavily oriented towards EU markets.9 In the chemical sector, however, the CEECs' trade orientation differs significantly between exports and imports (see Figure 5): in terms of imports, the EU(15) have become the major trading partner also in the chemical sector. By the end of the 1990s, the EU(15) accounted for 60% to 70% of CEECs' chemical imports in the region, hence being slightly more important than for total imports (compare footnote 9). However, in terms of exports, trade reorientation was less pronounced and exports to the EU(15) only reached between 30% and 50% of total chemical exports in 1999. Thus the chemical sector is significantly less oriented towards the EU than are total exports (compare again footnote 9). The share of exports going to the EU(15) in 1999 was largest in Poland (52%), the Czech Republic (46%) and Hungary (44%) and smallest in Slovenia (29%). The low share of exports destined for the EU can be attributed to the strong focus on the CMEA market during communism that has probably been maintained.
9 By 1999, more than 70% of Hungarian total exports went to the EU(15), for Poland and the Czech Republics the levels
were about 70%, for Romania and Slovenia somewhat below 70%, for the Slovak Republic 60%, and for Bulgaria around 40%. On the import side, Slovenian and Polish imports from the EU(15) accounted for roughly 70%, in the Czech Republic, Hungary and Romania EU(15) imports had a share of 60%, in Slovakia 50% and in Bulgaria only 40%.

14
(Figure 5 contd)
Figure 5
CEECs' exports to and imports from the worldChemicals, chemical products and man-made fibres
Exports to the world Imports from the world
BULGARIA 1997
EU35%
OTHER65%
CZECH REPUBLIC 1999
OTHER54%
EU46%
HUNGARY 1999
OTHER56%
EU44%
POLAND 1999
OTHER48%
EU52%
BULGARIA 1997
OTHER42%
EU58%
CZECH REPUBLIC 1999
EU67%
OTHER33%
HUNGARY 1999
EU66%
OTHER34%
POLAND 1999
OTHER28%
EU72%

15
Smaller role in exports than in imports
In total manufacturing exports to the EU(15), the chemical sector is of minor importance today: In 1999, it only accounted for 3% of all manufacturing exports going to the EU(15) in Romania, 4% in Hungary, 5% in the Czech Republic, Poland, Slovakia and Slovenia, and was only slightly more important in Bulgaria with 7% (see Appendix, Table A4 and Figure A2). In general, export shares were smaller than production shares, indicating a below-average export orientation of the chemical sector to the EU(15). The development of exports between 1995 and 1999 differed markedly between Slovenia and the other CEECs: In Slovenia, chemical sector exports grew quite dynamically and export shares remained constant. In the other CEECs, export shares fell, either because
(Figure 5 contd.)
CEECs' exports to and imports from the world
Source: UN-Database.
Exports to the world Imports from the world
Chemicals, chemical products and man-made fibres
ROMANIA 1999
OTHER67%
EU33%
SLOVAK REPUBLIC 1999
EU35%
OTHER65%
SLOVENIA 1999
OTHER71%
EU29%
ROMANIA 1999
EU65%
OTHER35%
SLOVAK REPUBLIC 1999
OTHER44%
EU56%
SLOVENIA 1999
EU69%
OTHER31%
16
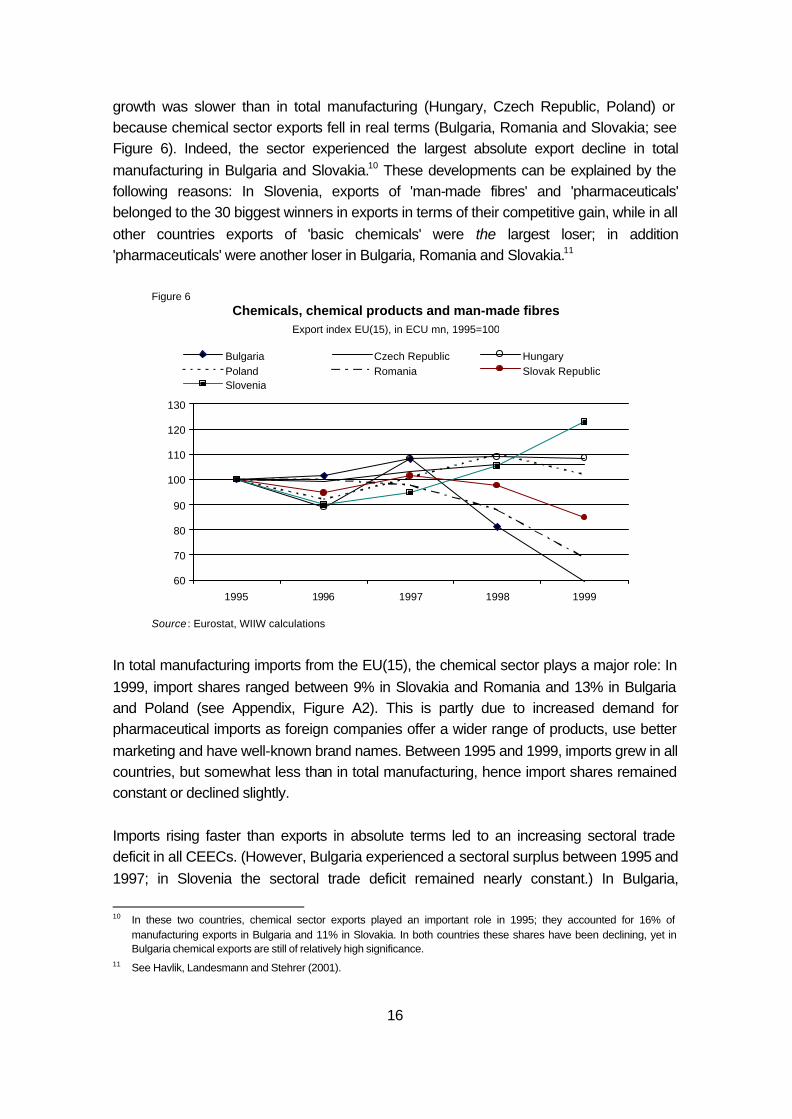
growth was slower than in total manufacturing (Hungary, Czech Republic, Poland) or because chemical sector exports fell in real terms (Bulgaria, Romania and Slovakia; see Figure 6). Indeed, the sector experienced the largest absolute export decline in total manufacturing in Bulgaria and Slovakia.10 These developments can be explained by the following reasons: In Slovenia, exports of 'man-made fibres' and 'pharmaceuticals' belonged to the 30 biggest winners in exports in terms of their competitive gain, while in all other countries exports of 'basic chemicals' were the largest loser; in addition 'pharmaceuticals' were another loser in Bulgaria, Romania and Slovakia.11
In total manufacturing imports from the EU(15), the chemical sector plays a major role: In 1999, import shares ranged between 9% in Slovakia and Romania and 13% in Bulgaria and Poland (see Appendix, Figure A2). This is partly due to increased demand for pharmaceutical imports as foreign companies offer a wider range of products, use better marketing and have well-known brand names. Between 1995 and 1999, imports grew in all countries, but somewhat less than in total manufacturing, hence import shares remained constant or declined slightly. Imports rising faster than exports in absolute terms led to an increasing sectoral trade deficit in all CEECs. (However, Bulgaria experienced a sectoral surplus between 1995 and 1997; in Slovenia the sectoral trade deficit remained nearly constant.) In Bulgaria,
10 In these two countries, chemical sector exports played an important role in 1995; they accounted for 16% of
manufacturing exports in Bulgaria and 11% in Slovakia. In both countries these shares have been declining, yet in Bulgaria chemical exports are still of relatively high significance.
11 See Havlik, Landesmann and Stehrer (2001).
Figure 6
Source : Eurostat, WIIW calculations
Chemicals, chemical products and man-made fibresExport index EU(15), in ECU mn, 1995=100
60
70
80
90
100
110
120
130
1995 1996 1997 1998 1999
Bulgaria Czech Republic HungaryPoland Romania Slovak RepublicSlovenia

17
Romania, Slovakia and Slovenia the sectoral trade deficit was at a moderate level in 1999, whereas in the Czech Republic and Hungary it had already reached ECU 1 billion. In Poland, rapidly growing imports brought the trade deficit in the chemical sector to the highest level of all CEECs, with approximately ECU 3 billion (see Appendix, Figure A2). Export structure concentrated on 'basic chemicals', imports diversified
At the more detailed three-digit NACE level (see Table 9), in 1999 exports of the CEECs to the EU(15) were heavily concentrated on 'basic chemicals' (between 60% and 80% of the sector's exports). The concentration was most pronounced in Bulgaria (80%), followed by Poland, Romania, the Czech Republic and Hungary (75% to 70%), while it was smaller in Slovakia and Slovenia (65% and 60%).12 Apart from this sub-branch, exports of 'man-made fibres' played a relatively important role in Poland and Romania (10%), and especially in Slovenia and Slovakia (about 20%). 'Pharmaceutical' exports were relatively important only in Hungary (14%). Between 1995 and 1999 the dominance of 'basic chemicals' in the export structure weakened due to the absolute decline of exports of this sub-branch (except from Slovenia). Export shares of 'soap, cleaning, polishing, perfumes & toilet articles', 'other chemical products' and 'man-made-fibres' gained slightly in size in most CEECs (on the CEEC-7 average about 2 percentage points), while in absolute terms exports of 'soap, cleaning, polishing, perfumes & toilet articles' as well as 'paints, varnishes and similar coatings' showed the highest growth rates in most CEECs. In contrast to the export structure, the import structure of the chemical sector was very diversified in 1999 (see Table 10): Major import shares were those of 'basic chemicals', 'pharmaceuticals' and 'other chemical products' (between 20% and 30% each!), followed by 'paints, varnishes and similar coatings' and 'soap, cleaning, polishing, perfumes & toilet preparations' (both about 10%). Between 1995 and 1999, the importance of 'basic chemicals' imports in the import structure declined somewhat (but less than in exports); 'pharmaceuticals' and also 'other chemical products' gained in relative size.
12 Although also dominating in the production structures of most CEECs today, 'basic chemicals' are heavily over-
represented in the export structure, representing a major weakness of the chemical sector in the region.

18
Table 9
Detailed export structure of the chemical sector, trade with EU(15), 1999, in %
Czech Slovak
Bulgaria Republic Hungary Poland Romania Republic Slovenia
24.1 Basic chemicals 78.4 73.2 70.9 75.0 74.9 65.0 61.6 24.2 Pesticides and other agro-chemical products 0.8 1.0 1.3 0.6 2.4 0.7 1.3 24.3 Paints, varnishes and similar coatings 0.0 2.1 0.6 0.5 0.1 0.2 1.3 24.4 Pharmaceuticals 9.3 7.6 13.9 2.6 8.4 4.0 9.2 24.5 Soap, cleaning, polishing, perfumes & toilet preparations 2.4 4.8 1.9 6.6 0.6 1.2 2.9 24.6 Other chemical products 5.8 5.5 8.7 4.3 2.4 7.2 5.8 24.7 Man-made fibres 3.2 5.8 2.8 10.4 11.3 21.7 17.8
DG Chemicals, chemical products and man-made fibres 100.0 100.0 100.0 100.0 100.0 100.0 100.0
in ECU mn 7.4 4.6 3.6 4.8 2.6 4.9 4.8
Source: Eurostat, WIIW calculations.
Table 10
Detailed import structure of the chemical sector, trade with EU(15), 1999, in %
Czech Slovak Bulgaria Republic Hungary Poland Romania Republic Slovenia
24.1 Basic chemicals 20.7 25.9 25.5 28.3 22.7 26.8 33.0 24.2 Pesticides and other agro-chemical products 5.1 3.1 4.2 3.9 5.5 2.9 1.8 24.3 Paints, varnishes and similar coatings 7.0 12.0 7.8 11.7 11.5 12.6 10.2 24.4 Pharmaceuticals 24.1 25.5 25.6 25.4 28.6 29.1 20.5 24.5 Soap, cleaning, polishing, perfumes & toilet preparations 15.2 12.8 9.7 11.2 9.7 6.0 14.3 24.6 Other chemical products 27.3 18.8 25.9 18.2 21.0 21.6 17.6 24.7 Man-made fibres 0.7 1.9 1.3 1.4 1.0 1.0 2.6
DG Chemicals, chemical products and man-made fibres 100.0 100.0 100.0 100.0 100.0 100.0 100.0
in ECU mn 318.1 1797.7 1594.5 3490.4 551.1 477.9 636.6
Source: Eurostat, WIIW calculations.
19
Table 11 Chemicals, chemical products and man-made fibres
Price/quality gap indicator for CEECs' exports to the EU1)
Czech Slovak Bulgaria Republic Hungary Poland Romania Republic Slovenia
24.1 Basic chemicals 1999 -0.067 -0.081 -0.079 -0.157 -0.170 -0.233 -0.219
24.2 Pesticides and other agro-chemical products 1999 -0.179 -0.553 0.445 -0.124 -0.342 -0.655 0.487
24.3 Paints, varnishes and similar coatings 1999 -0.285 -0.352 -0.667 -0.023 -0.052 0.656 -0.141
24.4 Pharmaceuticals 1999 -0.644 -0.270 -0.211 -0.244 -0.458 -0.033 1.119
24.5 Soap, cleaning, polishing, perfumes & toilet preparations 1999 -0.151 -0.443 -0.144 -0.281 -0.225 -0.100 -0.245
24.6 Other chemical products 1999 0.713 -0.239 0.156 -0.082 -0.101 -0.063 -0.309
24.7 Man-made fibres 1999 -0.374 -0.228 -0.040 -0.211 -0.209 -0.270 -0.128
DG Chemicals, chemical products and 1995 -0.149 -0.072 -0.086 -0.110 -0.105 -0.149 -0.160
man-made fibres 1996 -0.124 -0.044 -0.102 -0.141 -0.147 -0.193 -0.175
1997 -0.116 -0.065 -0.118 -0.130 -0.135 -0.224 -0.179
1998 -0.133 -0.097 -0.160 -0.166 -0.113 -0.197 -0.145
1999 -0.131 -0.141 -0.077 -0.171 -0.210 -0.227 -0.140
average 1995-1999 -0.131 -0.084 -0.109 -0.144 -0.142 -0.198 -0.160
change in %, 1995-1999 0.3 -2.1 -0.5 -1.7 -2.1 -2.0 0.8
Notes: 1) Defined as the unit value ratio uvr tc of country c, which shows the percentage deviation from the average EU import unit value. For a detailed explanation see Havlik,
Landesmann and (2001), p. 25.
Source: Calculations by R. Stehrer, WIIW.

20
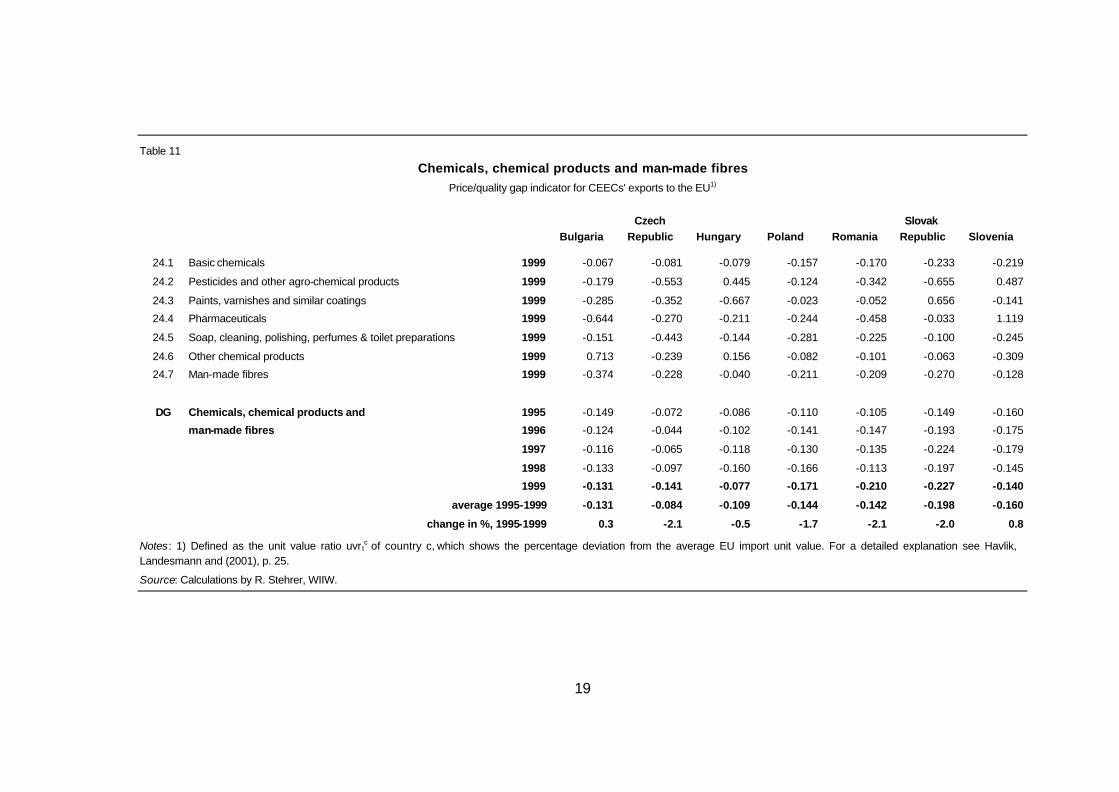
Relatively large and persistent export price gaps
The price/quality gap indicator (measured by export unit values, value per kg) reveals differences in export prices which under certain conditions can be interpreted as differences in product quality. For the average 1995-1999 and the year 1999 as well, the price/quality gap indicator was negative for exports of the chemical sector from all CEECs to the EU(15) and relatively large: values for 1999 ranged between -7% in Hungary and -23% in the Slovak Republic (see Table 11). Compared to total manufacturing, the chemical sector did not show the largest export price/quality gap, but belonged to the middle-field.13 However, between 1995 and 1999 the indicator worsened, or remained nearly constant (in Bulgaria and Slovenia), pointing to a downgrading of exports and declining competitiveness. At a more detailed level, the price/quality gap indicator was mostly negative across sub-branches, with only rare exceptions. Table 11 gives the 1999 values, presenting however a snapshot in time only. Continuous positive indicators (between 1995 and 1999) can be found for 'other chemical products' in Bulgaria (rose oil!), 'paints, varnishes and other coatings' in Slovakia and 'pesticides and other agro-chemicals' in Slovenia. In addition, there were positive indicators for three years in 'paints, varnishes and other coatings' in Poland and 'pharmaceuticals' in Hungary and Slovenia. Price/quality gap indicators were negative across all branches in the Czech Republic and Romania. Weak and deteriorating position on the EU market
In 1995, CEEC(7) chemical sector exports to the EU(15) had a market share of 7%, which declined to 5% in 1999, as export volumes from the CEECs remained nearly constant at EUR 3 billion (all shares without intra-EU trade). Compared to total manufacturing market shares (9% in 1995 and 11% in 1999) the chemical sector shares were lower in both years, but while the gap was relatively small in 1995 it had grown dramatically by 1999, reflecting a weakening position of the sector in foreign trade (see Table 12). In 1999, the largest exporters to the EU were Poland, the Czech Republic and Hungary with market shares of 1.3%, 1.2% and 1% respectively; all other countries held market shares below 1%. 13 See Havlik, Landesmann and Stehrer (2001).

21
Table 12 Chemicals, chemical products and man-made fibres
CEECs' exports to the EU(15) in ECU million, market shares in %
EU(15) extra-EU Bulgaria Czech Republic Hungary Poland imports, ECU mn ECU mn % ECU mn % ECU mn % ECU mn %
1995 44448.7 260.7 0.59 699.0 1.57 559.5 1.26 770.1 1.73
1996 45661.6 264.6 0.58 692.9 1.52 497.0 1.09 709.0 1.55
1997 52287.3 281.9 0.54 722.4 1.38 606.2 1.16 776.7 1.49
1998 56098.0 211.5 0.38 741.4 1.32 609.7 1.09 848.8 1.51
1999 59969.3 154.9 0.26 741.6 1.24 606.4 1.01 785.3 1.31 Total Manufacturing Romania Slovak Republic Slovenia CEEC(7) CEEC(7)1) ECU mn % ECU mn % ECU mn % ECU mn % ECU mn %
1995 212.1 0.48 336.9 0.76 205.4 0.46 3043.6 6.85 38401 8.93
1996 212.2 0.46 318.7 0.70 184.7 0.40 2879.1 6.31 40903 9.05
1997 207.4 0.40 341.7 0.65 194.7 0.37 3131.1 5.99 49447 9.48
1998 186.6 0.33 328.8 0.59 216.5 0.39 3143.2 5.60 59900 10.43
1999 145.7 0.24 286.1 0.48 252.5 0.42 2972.4 4.96 67623 10.71
Notes: 1) CEEC(7) total manufacturing exports to the EU and their market shares.
Source: Eurostat, WIIW calculations.
Trade deficit with Austria in the chemical sector
Imports from the CEEC(7) had a remarkably larger share on Austria's market than on the EU(15) market, accounting for 22% of Austria's non-EU chemical imports in 1995, peaking in 1997 with 25% and falling again to 20% by 1999. Main import items were 'basic chemicals' (accounting for 50% of all chemical imports from Slovenia to 90% from Slovakia). The most important source of chemical imports from the CEECs was Hungary, with 6% of all Austrian extra-EU imports, followed by the Czech Republic, Slovenia, Slovakia and Poland. Romania and Bulgaria held market shares of less than 1% on the Austrian market. While imports from all countries fluctuated, only those from Slovenia grew steadily (see Table 13). Chemical exports from Austria to the CEECs
The CEEC(7) market is a major export destination of Austria's non-EU chemical exports, although its relative importance is declining. In 1995, the CEEC(7) accounted for 36% of all extra-EU(15) chemical exports, climbing to 41% in 1996 but then falling to 29% by 1999. Important export items were 'other chemical products', 'basic chemicals' and 'pharmaceuticals' (28%, 24% and 22% respectively of total exports going to the CEEC (7)),

22
Table 13
Chemicals, chemical products and man-made fibres CEECs' exports to Austria in ECU million, market shares in %
Austria Bulgaria Czech Republic Hungary Poland extra-EU(15) ECU mn % ECU mn % ECU mn % ECU mn % imports, ECU mn
1995 969.1 1.7 0.18 41.2 4.25 65.9 6.80 23.6 2.44
1996 1061.0 2.4 0.23 50.6 4.77 66.2 6.24 22.2 2.09
1997 1170.3 7.5 0.64 63.2 5.40 83.1 7.10 25.0 2.14
1998 1309.9 9.9 0.76 55.8 4.26 77.6 5.92 23.5 1.79
1999 1379.2 4.5 0.33 62.1 4.50 79.0 5.72 24.6 1.79
Romania Slovak Republic Slovenia CEEC(7)1)
ECU mn % ECU mn % ECU mn % ECU mn %
1995 10.3 1.06 42.2 4.36 27.2 2.81 212.1 21.89
1996 14.9 1.41 46.0 4.34 39.4 3.71 241.8 22.79
1997 12.7 1.08 55.9 4.78 41.8 3.57 289.1 24.71
1998 15.8 1.21 49.1 3.75 50.2 3.83 281.9 21.52
1999 11.8 0.85 40.3 2.92 53.9 3.91 276.2 20.02
Note: 1) Including Bulgaria, the Czech Republic, Hungary, Poland, Romania, the Slovak Republic and Slovenia.
Source: Eurostat, WIIW calculations.
Table 14
Chemicals, chemical products and man-made fibres CEECs' imports from Austria in ECU million, market shares in %
Austria Bulgaria Czech Republic Hungary Poland extra-EU(15) ECU mn % ECU mn % ECU mn % ECU mn % exports
1995 1207.9 17.3 1.43 113.9 9.43 114.9 9.51 48.0 3.97
1996 1108.7 14.1 1.27 116.3 10.49 109.6 9.89 54.3 4.89
1997 1787.7 19.9 1.11 144.3 8.07 137.9 7.71 77.8 4.35
1998 1824.0 27.5 1.51 132.7 7.28 144.0 7.90 75.5 4.14
1999 2202.1 30.0 1.36 143.4 6.51 168.8 7.66 86.5 3.93
Romania Slovak Republic Slovenia CEEC(7)1)
ECU mn % ECU mn % ECU mn % ECU mn %
1995 22.8 1.89 49.8 4.13 73.1 6.05 439.7 36.41
1996 27.4 2.47 60.9 5.49 68.7 6.20 451.2 40.70
1997 32.0 1.79 75.7 4.23 103.4 5.78 590.9 33.06
1998 37.2 2.04 73.0 4.00 98.0 5.37 587.9 32.23
1999 33.5 1.52 71.8 3.26 102.4 4.65 636.2 28.89
Note: 1) Including Bulgaria, the Czech Republic, Hungary, Poland, Romania, the Slovak Republic and Slovenia.
Source: Eurostat, WIIW calculations.

23
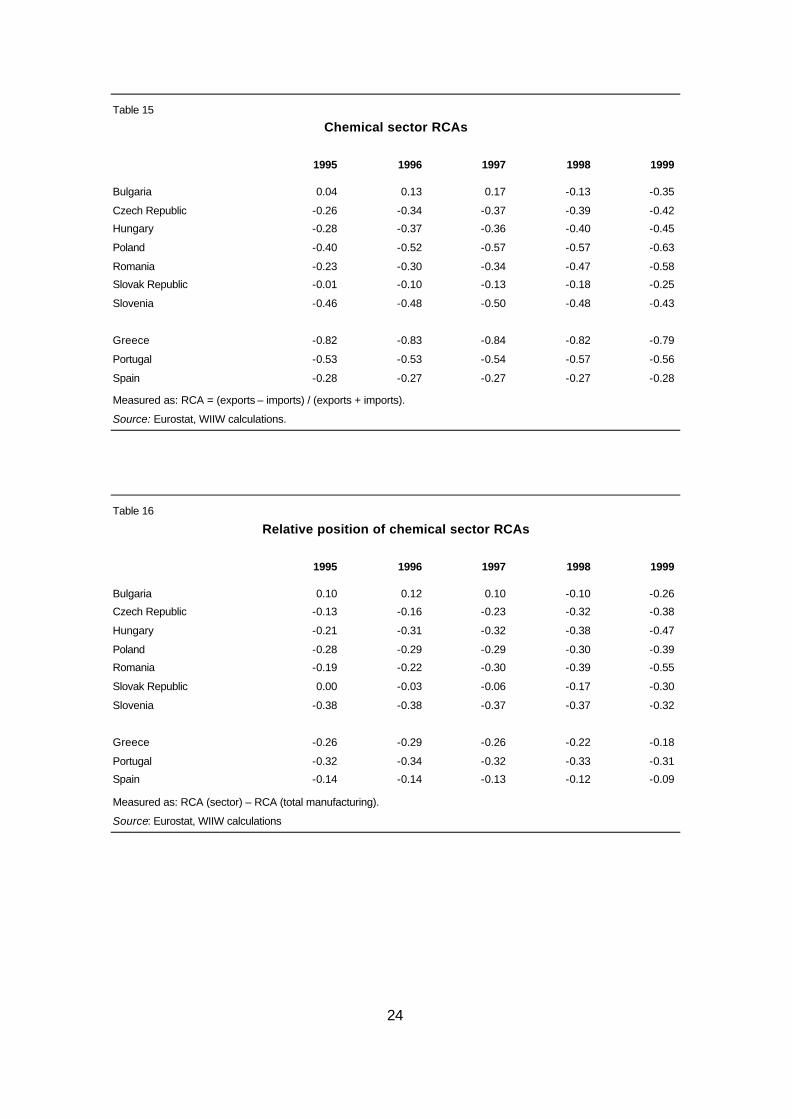
followed by 'paints, varnishes and similar coatings' and 'soap, cleaning, polishing, perfumes & toilet preparations' (16% and 10% respectively). Major export destinations were Hungary and the Czech Republic (8% and 7% respectively of Austrian exports), less important ones were Slovenia, Poland and Slovakia (see Table 14). In fact, chemical exports from Austria to the CEEC(7) had been larger than imports from these countries, leading to a surplus for Austria and a trade deficit for the CEECs in this sector. Austria's total trade surplus in the sector reached ECU 360 million in 1999. The trade deficit in the individual CEECs ranged between EUR 22 million in Romania and EUR 90 million in Hungary. (The trade deficit was prevalent in all years and in all countries.) Deteriorating revealed comparative disadvantage
Revealed comparative advantage values (RCAs)14 in relation to the EU(15) for the chemical sector have been negative in all countries, except for Bulgaria in the first few years, reflecting their negative sectoral trade balances (see Table 15). Also, when compared to manufacturing as a whole,15 data indicate a comparative disadvantage of the chemical sector in all CEECs. In 1999 the disadvantage was largest in Romania and Hungary and smallest in Bulgaria. Relative RCAs deteriorated over time and values were worse in 1999 than in 1995; only in Slovenia did values slightly improve during this period (see Table 16). Within the chemical sector, nearly all sub-branches showed a negative trade balance between 1995 and 1999. Only some were in surplus, including 'man-made fibres' in all countries except Hungary, and 'basic chemicals' except in Poland, Slovenia and Romania (in the latter country the value turned negative in 1999 only, see Table 17).
14 Measured as RCA = (exports – imports) / (exports + imports). 15 Measured as relative RCA = RCA (sector) – RCA (total manufacturing).
24
Table 15
Chemical sector RCAs
1995 1996 1997 1998 1999
Bulgaria 0.04 0.13 0.17 -0.13 -0.35
Czech Republic -0.26 -0.34 -0.37 -0.39 -0.42
Hungary -0.28 -0.37 -0.36 -0.40 -0.45
Poland -0.40 -0.52 -0.57 -0.57 -0.63
Romania -0.23 -0.30 -0.34 -0.47 -0.58
Slovak Republic -0.01 -0.10 -0.13 -0.18 -0.25
Slovenia -0.46 -0.48 -0.50 -0.48 -0.43
Greece -0.82 -0.83 -0.84 -0.82 -0.79
Portugal -0.53 -0.53 -0.54 -0.57 -0.56
Spain -0.28 -0.27 -0.27 -0.27 -0.28
Measured as: RCA = (exports – imports) / (exports + imports).
Source: Eurostat, WIIW calculations.
Table 16
Relative position of chemical sector RCAs
1995 1996 1997 1998 1999
Bulgaria 0.10 0.12 0.10 -0.10 -0.26
Czech Republic -0.13 -0.16 -0.23 -0.32 -0.38
Hungary -0.21 -0.31 -0.32 -0.38 -0.47
Poland -0.28 -0.29 -0.29 -0.30 -0.39
Romania -0.19 -0.22 -0.30 -0.39 -0.55
Slovak Republic 0.00 -0.03 -0.06 -0.17 -0.30
Slovenia -0.38 -0.38 -0.37 -0.37 -0.32
Greece -0.26 -0.29 -0.26 -0.22 -0.18
Portugal -0.32 -0.34 -0.32 -0.33 -0.31
Spain -0.14 -0.14 -0.13 -0.12 -0.09
Measured as: RCA (sector) – RCA (total manufacturing).
Source: Eurostat, WIIW calculations

25
Table 17
Detailed RCA structure of the chemical sector, 1999
Czech Slovak
Bulgaria Republic Hungary Poland Romania Republic Slovenia
24.1 Basic chemicals 0.30 0.08 0.03 -0.25 -0.07 0.18 -0.15
24.2 Pesticides and other agro-chemical products -0.86 -0.76 -0.79 -0.93 -0.79 -0.75 -0.55
24.3 Paints, varnishes and similar coatings -1.00 -0.87 -0.94 -0.98 -1.00 -0.98 -0.90
24.4 Pharmaceuticals -0.68 -0.78 -0.66 -0.95 -0.86 -0.85 -0.70
24.5 Soap, cleaning, polishing, perfumes
& toilet preparations
-0.86 -0.73 -0.86 -0.77 -0.97 -0.79 -0.85
24.6 Other chemical produc ts -0.81 -0.79 -0.77 -0.90 -0.94 -0.67 -0.77
24.7 Man-made fibres 0.37 0.12 -0.10 0.26 0.50 0.86 0.46
DG Chemicals, chemical products and
man-made fibres
-0.35 -0.42 -0.45 -0.63 -0.58 -0.25 -0.43
Source: Eurostat, WIIW calculations.

26
4 Foreign direct investment
In all countries the chemical sector is among the most attractive sectors for foreign investors. The latter have been mainly motivated by market-seeking considerations; in some sub-branches follow-the-leader strategies have been pursued (for instance, in the sub-sector of 'soap, cleaning, polishing, perfumes & toilet preparation', Unilever, Procter & Gamble and Colgate-Palmolive Co. pioneered on the market, other companies followed)16. As labour costs account for less than one-fifth of total costs on average, low labour costs have probably not been a main motive for foreign investors. Foreign direct investment is strong in industrial gases, detergents, paints, and pharmaceuticals. Foreign investors bring in know-how and capital, helping companies move towards compliance with the regulatory requirements of the EU. Nevertheless, the restructuring of the sector is apparently not yet completed (see pp. 5ff). Looking at the shares of the chemical sector in the distribution of nominal capital of foreign investment enterprises (FIEs)17 in total manufacturing, shares were relatively large, ranging between 7% in the Czech Republic and 11% in Hungary in 1999. Compared to other sectors in manufacturing, the chemical sector held a relatively important position in the Czech Republic and in Slovenia and was very important in Hungary and Poland. Shares remained quite constant in most countries during the time period observed, only in the case of Slovakia and Slovenia they were somewhat decreasing in the past few years (see Figure 7).18 Foreign penetration of the chemical sector (as measured by the share of nominal capital of the sector's FIEs in the nominal capital of all chemical companies) was above the levels of foreign penetration for total manufacturing only in Hungary and Poland in the last few years. In most countries it increased slightly between 1997 and 1999 (see Figure 7). In 1999, foreign penetration reached 22% in Slovenia, 26% in the Czech Republic, 51% in Poland and 83% in Hungary.
16 See Alessandrini (2000), p. 54. 17 Firms with any share of foreign ownership, including minority stakes. 18 It should be kept in mind that shares in the Slovak Republic include the coke and petroleum sector and are for the
years 1994, 1995 and 1996. As this sector was owned domestically then, this share may reflect the real percentages for the chemical sector.

27
Figure 7
A. Position of the sector in the distribution of foreign capital Percentage share of the sector in total manufacturing's
Chemicals, chemical products and man-made fibres
Manufacturing = 100
the nominal capital of all leather companies (FIEs + all others)
nominal capital of foreign investment enterprises (FIEs)
B. Foreign penetration of the sector Share of nominal capital of leather FIEs in
14.8
3.7
9.7 11.3
16.5 15.9
9.2
12.2 10.7
19.7
10.5
8.6 11.3 12.1 12.5
9.3 10.0 10.8
7.3
0.0 4.0
8.0 12.0 16.0 20.0
Czech Republic1) Hungary
2) Poland3) Slovak Republic
4) Slovenia5)
1994 1997 1998 1999
83.2
15.0 5.2
52.6
24.6 12.2 22.6 17.5
82.6
37.2 21.8 22.2 19.9
84.6
48.0
15.2 22.0
51.4
25.6
0
20
40
60
80
100
Czech Republic1) Hungary2) Poland3) Slovak Republic4) Slovenia5)
1994 1997 1998 1999
Notes: 1) 1994 own capital, 1997-1999 equity capital. - 2) Nominal capital. - 3) Equity capital. - 4) Output of companies; 1995 data instead of 1997, 1996 data instead of 1998, 23+24 Coke and petroleum + chemicals. - 5) Nominal capital; 1995 data instead of 1994.
Source: WIIW, FIE Database.
5 Prospects
Generally, the chemical sector has turned from a priority sector during communism into a problematic, declining sector during transformation: its importance in the region fell in terms of production and employment shares, growth performance was weak over the whole transformation period, and the sector became a 'productivity loser'. Together with declining cost advantages, these developments point to a less successful restructuring of the chemical sector than of manufacturing in general. Restructuring seems to be hampered by the sector's inherent characteristics: high capital intensity, large companies difficult to privatize, restructure and modernize and often troubled by soaring debts and ecological burdens. Although FDI is important, it reaches only certain sub-branches of the sector.

28
In terms of trade performance, recent developments in the chemical sector are also rather worrying and point to declining competitiveness: exports are less oriented towards the EU(15) markets than total manufacturing exports. Export growth to the EU(15) is less
dynamic than in other branches, and the export structure is dominated by basic chemicals, partly explaining the relatively large negative and persistent export price gap. The position on the EU market is weak and deteriorating, and trade deficits are increasing. There are only two exceptions to this pattern in the CEEC(7) – the chemical sector in Slovenia and to a lesser extent also in Bulgaria. In both countries the chemical sector still holds a prominent position and has displayed a better production performance than total manufacturing in the second transition period. However, major differences exist between these two countries: In Slovenia, production has improved continuously since 1994, favoured by dynamically growing exports to the EU and competitive gains in certain sub-branches (man-made fibres, pharmaceuticals). In Bulgaria, on the other hand, production of the chemical sector peaked in 1996 and fell again thereafter; exports to the EU(15) have declined in real terms, productivity is weak (measured at current prices) and fertilizer consumption is still declining. While restructuring seems to have been completed in the Slovenian chemical sector, it is suffering delays in Bulgaria. The future prospects of the chemical sector are quite mixed. On the export markets, the negative trends on the EU(15) markets in the last few years have persisted, pointing to unfavourable future developments. Quality upgrading of chemical products is essential in order to mitigate a further deterioration and to reach compliance with EU regulations in anticipation of EU accession. On the more important Eastern markets, the growth prospects are better. These are however subject to big uncertainties regarding the overall future economic development of the region. Here too, quality upgrading will be necessary in the long run to withstand competition from West European companies. On the domestic market, growth potentials for the sector still prevail (consumer goods, pharmaceuticals, fertilizer, paints etc.), which are however increasingly challenged by growing imports from the EU(15). Developments in GDP and gross industrial production are currently quite favourable and forecasts are positive for all CEECs in 2001 and 2002 (except Poland). The trends in industrial production are most promising in Hungary, followed by the Czech Republic and Slovakia. The growth rates for Romania, Bulgaria and Slovenia are lower but still pronounced, while those for Poland were markedly scaled down (see most recent WIIW forecasts, Appendix Table A5). For the future, ongoing restructuring, modernization and ecological upgrading has to be pursued – also with the help of FDI – in order to meet international demand and to reach compliance with EU regulations.

29
Part II: COMPANY PROFILES
This second part presents a more detailed micro-analysis of the chemical sector and contains the following information for each country, as far as available: – Detailed structure of the sector (3-digit NACE-level)19 – Number and size structure of companies – Profitability and investment / foreign direct investment – List of major companies20 – Description of selected companies / branches (pharmaceuticals)21 Bulgaria
The Bulgarian chemical sector was traditionally specialized in bulk chemicals and biological pharmaceuticals (herbal medicines), being a leading producer of the latter under the CMEA specialization agreements. Hence it has developed a particular strength in soda ash and pharmaceutical industries; the country also supplies 70% of the world's rose oil. The privatization process of the chemical sector started in 1997 when Solvay from Belgium bought the Sodi soda ash facility in Devnya, which is the second largest synthetic soda ash producer in the world and a major exporter. By the end of 1999, about 80% of companies were covered by privatization projects. However, the privatization of the financially troubled fertilizer plants proved to be difficult. The Bulgarian chemical sector is a strong exporter.22 In the structure of the Bulgarian chemical sector, 'other chemicals' accounted for almost 50% of the sector's gross output in 1998, followed by 'basic chemicals' with 42%. 'Man-made fibres' was only a small sub-branch, with 8% (see Table 18).
19 Special attention should be paid to the definition of production statistics comprising enterprises with differing numbers of
employees. 20 The distinction between the chemical sector and the sector of 'coke, refined petroleum products and nuclear fuel' is
sometimes difficult to make: for example, refineries are often also engaged in down-stream processes, classified in the chemical sector. In the list of major companies, however, the largest refineries were left out on purpose. These include: Lukoil-Neftochim in Bulgaria; Ceská Rafinérská a.s., Litvínov in the Czech Republic; MOL in Hungary; Orlen Polski Koncern Naftowy SA, Plock and Rafineria Gdanska SA, Gdansk in Poland; Rompetrol Rafinarie – Complexul Petromidia SA in Romania; Slofnaft in Slovakia; and Petrol in Slovenia.
In addition, difficulties were encountered in the classification of the companies Procter & Gamble and Unilever, as they produce a wide variety of goods (diapers, tissues and towels, food & beverage, cosmetics, household cleaning, health care etc.) and only some of them are produced in the CEECs. Often the published lists differed in their classification (e.g. as consumer goods).
21 The presentation of companies is restricted to a few company examples and can never be complete. 22 European Commission (2000), p. IV -10.

30
Table 18 Bulgaria: Gross output of the chemical sector
BGL million1), distribution in %
ISIC rev. 3 1997 1998 1998 in %
241 Basic chemicals 858486 585935 42.2
242 Other chemicals 647116 691432 49.8
243 Man-made fibres 127982 110902 8.0
DG Chemicals, chemical products and man-made fibres 1633584 1388269 100.0
Notes: ISIC rev. 3 classification system. 241 includes basic chemicals, except fertilizers (2411), fertilizers and nitrogen compounds (2412), plastics in primary forms, synthetic rubber (2413); 242 includes pesticides and other agro-chemical products (2421), paints, varnishes, printing ink and mastics (2422), pharmaceuticals, medical chemicals etc. (2423), soap, cleaning & cosmetic preparations (2424), other chemical products n.e.c. (2429). - 1) Before denomination 1999. Average exchange rate Bulgarian lev 1997 BGL/EUR 1895.81 and 1998 1972.26.
Source: UNIDO (2001).
Table 19
The largest Bulgarian chemical companies,
ranked by 2000 net sales
Name, location Net sales in ths. BGN
Net sales in ths. EUR1)
Employees Sub-branch
Solvay-Sodi, Devnia* 195,702 100,052 1,286 Inorganic basic chemicals
Agropolihim, Devnia* 159,885 81,741 309 Artificial fertilizers and pesticides
Neohim, Dimitrovgrad* 117,719 60,184 1,600 Artificial fertilizers and pesticides
Balkanpharma-Dupnitsa
(Pharmacy), Dupnitza*
92,850 47,469 1,966 Drugs and chemical
pharmaceutical preparations
Sviloza, Svishtov* 87,701 44,837 2,300 Man-made fibres
Chimco, Vratza* 87,197 44,579 1,318 Artificial fertilizers and pesticides
Sopharma, Sofia 73,507 37,580 1,607 Drugs and chemical
pharmaceutical preparations
Alen mak, Plovdiv 51,617 26,389 1,293 Perfumes and cosmetics
Balkanpharma-Razgrad
(Antibiotic), Razgrad*
49,541 25,328 1,650 Drugs and chemical
pharmaceutical preparations
Biovet, Peshtera 44,802 22,905 1,191 Drugs and chemical
pharmaceutical preparations
Notes: 1) Converted with average exchange rate Bulgarian lev 2000 BGN/EUR 1.956.- *) Companies with foreign investment, see List of Privatization Transactions with Foreign Investors 1993-2000 at www.priv.government.bg/ap/ rograms_and_reports / soldsince93.html.
Source: Bulgarian Enterprises Information System BEIS (www.bia-bg.com).
Today, foreign direct investment in the Bulgarian chemical industry plays an important role: together with the petroleum and the rubber & plastic industry the chemical sector was the largest recipient of FDI in manufacturing between 1998 and 2000. Out of the ten largest companies, seven have received foreign direct investment (see Table 19); a potential

31
investor pulled out of the purchase of Biovet possibly due to the war in the Balkans.23 The largest foreign direct investors include France Arne, Solvay (Belgium) and Whitebeam Holding Ltd. (USA) and in pharmacy Bioland (France) and Deutsche Bank. − Agropolihim: The largest Bulgarian fertilizer plant was one of the biggest lossmakers in
Bulgaria, with massive debts especially to the gas monopoly Bulgargas. At the beginning of 1999, Norsk Hydro from Norway stepped back from a deal to buy the heavily indebted company.24 The company had to stop production and declared insolvency. In October, two of the biggest creditors bought the company (a consortium between Union Minière from Belgium and Hardland Investments from the US) and started an investment and modernization programme in 2000.25
Czech Republic
In 1990, the Czech Republic accounted for about 62% of production of the former Czechoslovak chemical and rubber & plastic products sector. In the structure of the Czech chemical sector in the year 2000, 'basic chemicals' accounted for the largest share of sales revenues, holding 64%. 'Pharmaceuticals', 'soap, cleaning, polishing, perfumes & toilet preparations' and 'man-made fibres' accounted for some 10%, the other sub-branches were relatively smaller (see Table 20). A favourable development over the whole period 1994 to 1999 was registered only for 'soap, cleaning, polishing, perfumes & toilet preparations' and from 1995 on in 'paints, varnishes and similar coatings'. All other sub-branches experienced stagnation or a decline in some period.26 The individual sub-branches can be characterized as follows.27 − The sub-branch of 'basic chemicals' (24.1), which includes the manufacture of industrial
gases, dyes and pigments, other inorganic and organic basic chemicals, fertilizers and plastics and synthetic rubber in primary forms, currently undergoes basic restructuring and modernization and has received some foreign direct investment so far.
− The sub-branch of 'manufacture of pesticides and other agro-chemical products' (24.2) has been selected for phasing down.
− The sub-branch of 'paints, varnishes and similar coatings' (24.3) is less developed and shows a low intensity of foreign trade exchange.
− The sub-branch of 'pharmaceuticals' (24.4) shows a trade deficit and has also received some FDI.
23 See Business Eastern Europe (1999), 10 May. 24 Business Eastern Europe (1999), 28 June. 25 See also the Internet Homepage of the Privatization Agency – Bulgaria www.priv.government.bg/ap/sucess_stories/
acq_rst.html. 26 See Ministry of Industry and Trade (2001), p. 253. 27 ibid.

32
− In the sub-branch of 'soap and detergents, cleaning and polishing preparations, perfumes and toilet preparations' (24.5), foreign investment by Procter & Gamble contributes to high exports.
− The sub-branch of 'man-made fibres' (25.7) has been selected for phasing down; viscose staple production has been terminated. The lack of developed domestic production in this field leads to high import requirements.
In 1999, there were 150 companies with more than 20 employees in the Czech chemical sector, of which 45% employed more than 100 persons (eight companies had more than 1000 employees). A decisive role is played by large companies with more than 1000 employees: they accounted for 56% of the sector's sales and almost 55% of value added in 1999.28 Privatization of the chemical sector is not completed yet, but entered its final stage at the end of 2000. The sector is among the most investment-intensive branches of manufacturing and received a relatively large amount of investment: in 2000, investment outlays totalled about EUR 270 million, representing 8% of total manufacturing investment. While investment increased above average between 1999 and 2000 (by one third due to the construction of petrochemical capacities), it had registered a heavy slide the year before.29 Expenditures need to be channelled mostly into ecological investments (e.g. removal of old ecological burdens, adaptation to strict EU ecological standards) and hence availability is limited for modernization and production restructuring.30 Among the 'Top 50' foreign investors in the chemical sector are Linde AG (Germany, technical gases), E.M. Warburg Pincus & Co. (USA, pharmaceuticals, investment in Léciva), Procter & Gamble (USA, consumer goods), AGA Gas (Austria, industrial gases), Ivax Corporation (USA, pharmaceuticals, stake in Galena), and Cabot International (USA, invested in the carbon black production at the Deza works).31 The chemical sector registered pre-tax profits in the last few years and lay in the middle-field of manufacturing branches, with EUR 92 million in 2000.32
28 Ministry of Industry and Trade (2001), p. 246. 29 Ministry of Industry and Trade (2001a), p. 102. 30 Ministry of Industry and Trade (2000), p. 196. 31 Prague Business Journal (2000), p. 94. 32 Data including firms with 100 or more employees. See Ministry of Industry and Trade (2001a), p. 172.
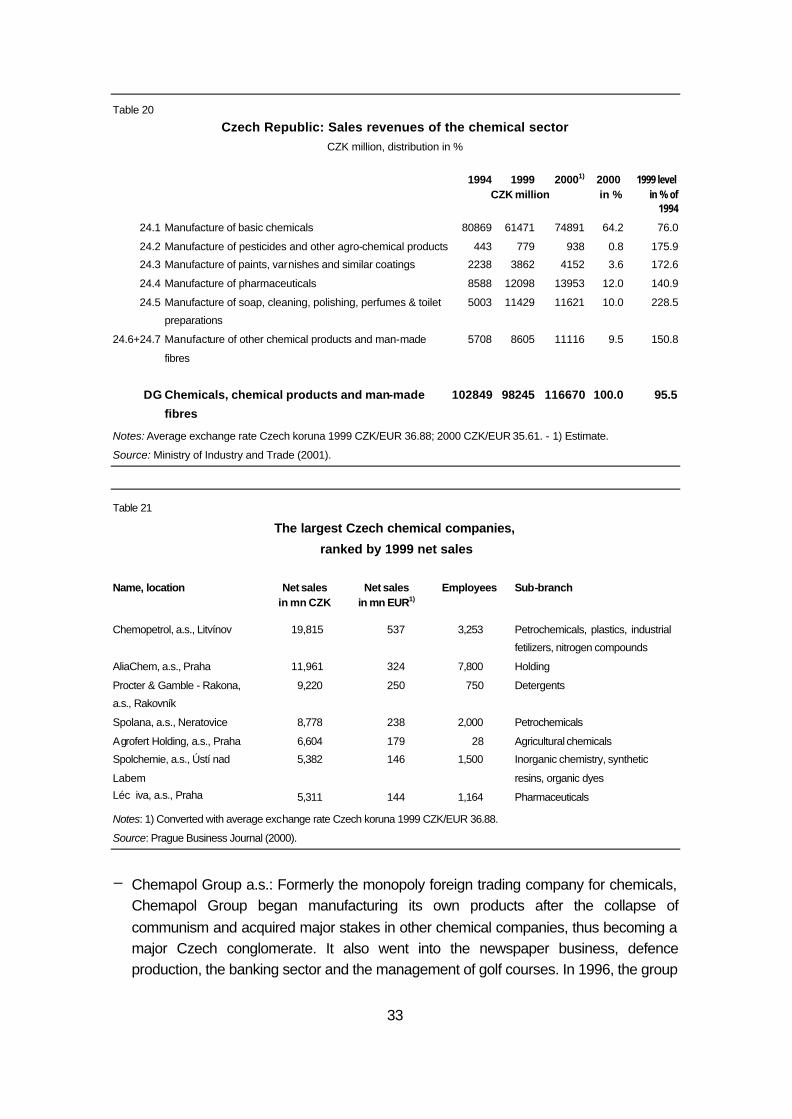
33
Table 20
Czech Republic: Sales revenues of the chemical sector CZK million, distribution in %
1994 1999 20001) 2000 1999 level CZK million in % in % of
1994
24.1 Manufacture of basic chemicals 80869 61471 74891 64.2 76.0
24.2 Manufacture of pesticides and other agro-chemical products 443 779 938 0.8 175.9
24.3 Manufacture of paints, varnishes and similar coatings 2238 3862 4152 3.6 172.6
24.4 Manufacture of pharmaceuticals 8588 12098 13953 12.0 140.9
24.5 Manufacture of soap, cleaning, polishing, perfumes & toilet
preparations
5003 11429 11621 10.0 228.5
24.6+24.7 Manufacture of other chemical products and man-made
fibres
5708 8605 11116 9.5 150.8
DG Chemicals, chemical products and man-made
fibres
102849 98245 116670 100.0 95.5
Notes: Average exchange rate Czech koruna 1999 CZK/EUR 36.88; 2000 CZK/EUR 35.61. - 1) Estimate.
Source: Ministry of Industry and Trade (2001).
Table 21
The largest Czech chemical companies,
ranked by 1999 net sales
Name, location Net sales in mn CZK
Net sales in mn EUR1)
Employees Sub-branch
Chemopetrol, a.s., Litvínov 19,815 537 3,253 Petrochemicals, plastics, industrial
fetilizers, nitrogen compounds
AliaChem, a.s., Praha 11,961 324 7,800 Holding
Procter & Gamble - Rakona,
a.s., Rakovník
9,220 250 750 Detergents
Spolana, a.s., Neratovice 8,778 238 2,000 Petrochemicals
Agrofert Holding, a.s., Praha 6,604 179 28 Agricultural chemicals
Spolchemie, a.s., Ústí nad
Labem
5,382 146 1,500 Inorganic chemistry, synthetic
resins, organic dyes
Léc iva, a.s., Praha 5,311 144 1,164 Pharmaceuticals
Notes: 1) Converted with average exchange rate Czech koruna 1999 CZK/EUR 36.88.
Source: Prague Business Journal (2000).
− Chemapol Group a.s.: Formerly the monopoly foreign trading company for chemicals,
Chemapol Group began manufacturing its own products after the collapse of communism and acquired major stakes in other chemical companies, thus becoming a major Czech conglomerate. It also went into the newspaper business, defence production, the banking sector and the management of golf courses. In 1996, the group

34
employed 25,000 people, registered a turnover of CZK 43 billion (EUR 1.3 billion), and a loss of CZK 1.1 billion (EUR 32 million). At the end of 1997 the Group announced a detailed restructuring programme (guided by Austrian managers under the head of Hugo Michael Sekyra) which included the sale of superfluous subsidiaries and the concentration on the core chemical business. The chemical companies were comprised under a single unit called AliaChem, including Synthesia a.s.33, Spolana a.s.34, Moravské Chemické Závody a.s. (MCHZ)35, Fatra a.s.36 and Technoplast. However, the restructuring plan failed, losses soared, and Chemapol went into bankruptcy in 1999. In the same year, the Croatian Pliva acquired 67% of the pharmaceutical company Lachema, formerly also belonging to the Chemapol Group. In 2000, Hungarian Borsodchem bought MCHZ and in 2001, the government transferred its 82% stake in Spolana to Unipetrol.37
− Unipetrol Holding: Unipetrol was established in 1994, with the state as the major
shareholder. Over time, Kaucuk, Chemopetrol, Benzina, Paramo, Koramo, Ceská Rafinérská and Unipetrol Trade were integrated into the petrochemical holding Unipetrol.38 According to the 1998 ranking of the 'Top 100' companies, Unipetrol ranked third, with revenues of CZK 50 billion (EUR 1.4 billion) and 10,500 employees.39 In 1999, Unipetrol approved investments by Chemopetrol to upgrade ethylene and polyethylene production and to construct a new polypropylene unit. These three projects were said to be the largest investment into the chemical industry since 1989.40 At the beginning of 2001, the government announced the sale of its 63% stake in Unipetrol.
Hungary
In the structure of the Hungarian chemical sector, two sub-branches dominated gross output in 1999: 'basic chemicals' with 46% and 'pharmaceuticals' with 37%. All other sub-branches were rather small and held shares between 1% and 8% (see Table 22). Generally, the export orientation of the chemical sector was slightly lower than that of total
33 Synthesia was the fourth largest Czech chemicals company according to 1997 revenues; it employed 6,200 people
and exported 55% of sales then. See The Prague Post (1998), 18-24 March. 34 Spolana produced fibres and plastics then and was the second largest chemical company in the Czech Republic,
employing 3,500 persons and exporting 74% of sales by 1997. Production of staple fibres were terminated in Spolana later on.
35 MCHZ produced organic chemicals and was the leading European producer of aniline; it exported 78% of sales. 36 Fatra produced plastics. 37 Business Eastern Europe (2001), 21 May. 38 See Unipetrol Internet Homepage www.unipetrol.cz. 39 Prague Business Journal (1999). Total sales reached about CZK 80 billion (EUR 2.2 billion) in 2000, employment stood
at 6,612 at the end of 2000. See Unipetrol Internet Homepage www.unipetrol.cz. 40 NewsBase CEBD (1999(), 19 October.

35
Table 22 Hungary: Gross output, total sales and export sales in the chemical sector
Export
sales/
Code1) Gross output Total sales Export sales Total sales Gross output
1999 1999 1999 1999 1999 1999 level HUF mn in % HUF mn HUF mn EUR mn in % in % of 19932)
24.1 Manufacture of basic chemicals 253830 45.7 252866 131993 522 52.2 371
24.2 Manufacture of pesticides and other agro-chemical products 5634 1.0 5111 2568 10 50.2 38
24.3 Manufacture of paints, varnishes and similar coatings 26194 4.7 26161 1544 6 5.9 285
24.4 Manufacture of pharmaceuticals 203459 36.6 200301 115486 457 57.7 285
24.5 Manufacture of soap, cleaning, polishing, perfumes & toilet preparations 41935 7.5 41580 12095 48 29.1 369
24.6 Manufacture of other chemical products 13912 2.5 13747 5385 21 39.2 176
24.7 Manufacture of man-made fibres 11018 2.0 11027 7046 28 63.9 230
DG Chemicals, chemical products and man-made fibres 555983 100.0 550793 276116 1092 50.1 296
D TOTAL MANUFACTURING 7886728 . 7852234 4478972 17717 57.0 458 Notes: Average exchange rate Hungarian forint 1999 HUF/EUR 252.80. Data of companies with 5 or more employees. 1) TEAOR'98 (Standard Industrial Classification of All Economic Activities) was introduced on 1 January 1998. 2) 1993 data include only companies with 20 or more employees. Source: Yearbook of Industrial and Construction Statistics Hungary (2000).

36
manufacturing, with 50% of total sales being exported in the former sector and 57% in the latter. Above-average export quotas were achieved in 'man-made fibres' and 'pharmaceuticals', while exports were very low in 'paints, varnishes and similar coatings' (see Table 22). Between 1993 and 1999, the chemical sector grew less than total manufacturing, especially due to a decline in the output of 'pesticides and other agro-chemical products' and also 'other chemical products'. Growth in the sector was most vigorous in 'basic chemicals' and 'soap, cleaning, polishing, perfumes & toilet preparations', although it also lay below total manufacturing growth. Foreign direct investment targeted paints and coatings, detergents, fibres and pharmaceuticals. At the end of 1999, there were about 560 companies with legal entity active in the Hungarian chemical sector, representing 2.5% of all manufacturing operations in the country. Of these, 64% had less than 20 employees, 31% employed between 10 and 249 persons, and 5% had more than 250 employees. In terms of legal form, 87% of all active corporations were private limited companies and about 10% were public limited companies.41
Table 23
The largest companies of the Hungarian chemical sector, ranked by 2000 net sales
Name Net sales in HUF mn
Net sales in EUR1) mn
Employees Export Share
Main activity
Tiszai Vegyi Kombinát Rt. (TVK) 156,835 603 2,587 49 .2)
BorsodChem Rt. 110,347 424 4,020 80 .2)
Richter Gedeon Vegyészeti Gyár Rt. 74,656 287 4,798 73 Pharmaceuticals
Unilever Magyarország Kft. 62,582 241 1,492 21 Detergents, food etc.
Egis Gyógyszergyár Rt. 45,516 175 2,729 63 Pharmaceuticals
Chinoin Gyógyszer és Vegyészeti
Termékek Gyárta Rt.
42,735 164 1,608 66 Pharmaceuticals
Henkel Magyarország Kft. 40,968 158 866 33 Detergents
Biogal Gyógyszergyár Rt. 36,233 139 9253) 66 Pharmaceuticals
Dunastyr Polisztirolgyártó Rt. 25,388 98 139 68 Polystyrene
Nitrogénmüvek Rt. 24,616 95 1,366 20 Ammonium nitrate
Notes: 1) Converted with average exchange rate Hungarian forint 2000 HUF/EUR 260.04. - 2) Together with MOL thes e two companies dominate the Hungarian petrochemicals and polymer sector. - 3) 1999.
Source: Figyelö TOP 200 (2001), October.
Important Hungarian chemical companies include: − Tiszai Vegyi Kombinát Rt. (Tisza Chemical Works)/TVK: Founded in 1953 by
governmental decree, TVK today is the largest chemical complex and sole polyolefines producer in Hungary, manufacturing ethylene, propylene, polyethylene and
41 Hungarian Central Statistical Office (2000).

37
polypropylene from naphtha and gas oil. It comprises a group of more than 30 companies.42 Under communism, the company held a privileged position within the Hungarian economy: it was a major exporter to the West, it had up-to-date technologies and a noticeable share of world output. TVK was present in three sub-branches of the industry then, including fertilizers, plastics & chemical fibres, and plastics processing.43 In 1991, it was transformed into a company limited by shares, with the state holding 100%. The company was hit hard by the agricultural crisis, which forced TVK to phase out their fertilizer production line in the mid-1990s. The overall economic recession, tougher competitive pressures from low-cost, small plastics producers, the world-wide depression on petrochemicals and plastics markets and the uncertainty over the delivery of oil imports from Russia also affected the company adversely. In 1994 the management implemented several measures to stabilize the company’s financial situation. In 1995 a thorough organizational restructuring and privatization programme followed. At the end of 1999 another restructuring programme was unveiled destined to shed or outsource non-core and non-profitable business.44 As a result, plastics-units were sold and the focus laid on the petro-chemical business.45 After MOL and Borsodchem acquired stakes in TVK in 1999/2000 (20% and 28.5% respectively), a wrangling over the ownership structure of the Hungarian chemical companies TVK and Borsodchem started, with major participants being MOL, the Russian Gazprom, and recently the Austrian CE Oil & Gas.46
− Borsodchem Rt.: Founded in 1949, Borsodchem is the largest producer of PVC in
Central Europe and the only MDI (Methylene Diphenyl Diisocyanate) producer. In addition to its core business, it has subsidies in plastics processing, technical services, catering and other services for employees. Borsodchem has commercial offices in Vienna, Katowice and Milan. In 1991, the company was transformed into a company limited by shares, in March 1996 it was listed on the Budapest and London stock exchanges. In the meantime, a restructuring process entailed the ceasing of certain activities (production of fertilizers), the transfer of some activities into joint ventures (crop protection agents) and the sale of others (industrial gases).47 Today Borsodchem is a modern, well-arranged and profitable company. Exports accounted for 80% of sales in 2000; Western Europe had a share of 48% of exports, the CEECs together with the domestic market another 48%. In February 1997, Borsodchem formed a joint venture
42 See TVK Internet Homepage www.tvk.hu. 43 See Estrin et al. (1995), p. 174. These sub-branches possessed an oligopolistic and segmented structure. In 1990,
there were twenty domestic fertilizer manufacturers including four big ones; sixteen producers of plastics and chemical fibres, including two big ones; and more than 300 plastics processing companies, including only one big company (defined as having sales above HUF 5 billion).
44 Business Eastern Europe (1999), 15 November. 45 Business Eastern Europe (2001), 12 March and 14 May. 46 See for example Business Eastern Europe (2001), 25 June. 47 Borsodchem Internet Homepage www.borsodchem.hu.

38
with the Austrian Krems Chemie, to build a formaldehyde plant, starting production in 1998.48 In 2000, the acquisition of the Czech Moravské Chemické Závody (MCHZ), subsidiary of Aliachem, secured safe supply of aniline, which is the raw material for MDI. The acquisition of 28.5% in TVK in the same year was in the interest of stable supply of ethylene.
The Hungarian pharmaceutical industry has a tradition of more than 100 years and has been strongest in Central Europe during the communist regime. It is a dominant part of Hungarian chemical industry, accounting for 37% of the sector's gross output in 1999, and one of the most competitive branches of the Hungarian industry. After the collapse of communism, the pharmaceutical industry was hit by the loss of the former CMEA market and by strong import competition. On the export side, successor states of the former Soviet Union and CEECs remain the main export markets, with Russia, Poland, Ukraine, the Czech Republic and Slovakia being the most important ones.49 The Russian crisis in 1998 dealt a heavy blow to the export-oriented pharmaceutical industry. On the import side, strong competition from international companies started with the liberalization of imports. In 1990, the domestic pharmaceutical industry still held a market share of 74%, which decreased to 44% in 1996, 43% in 1997 and 40% in 1998 – although demand was growing significantly. The majority of imports come from EU countries. The privatization of the largest Hungarian pharmaceutical companies took place between 1991 and 1996, with strong participation of foreign investors. Today there are seven main producers (see also Table 23), which are all in majority foreign ownership, except for Richter Gedeon, which is however again 60% owned by foreign financial investors. Sanofi (France) has invested in Chinoin, Servier (France) in Egis, TEVA (Israel) in Biogal, Novopharm (Canada) in Human, ICN Pharmaceuticals (USA) in Alkaloida (now named ICN Hungary) and Bristol-Myers Squibb (USA) in Pharmavit. Three companies, Richter Gedeon, Egis and Human, are listed on the Hungarian stock exchange.50 The Hungarian pharmaceutical industry is well supplied with capital – which is, however, in an international comparison, not sufficient for the innovation needed to market products in the advanced industrial countries. Poland
In the Polish chemical sector, the 'manufacture of basic chemicals' is the largest sub-branch, accounting for 43% of total sold production in 1999, followed by 'soap, cleaning, polishing, perfumes & toilet preparations' (24%) and 'pharmaceuticals' (17%). The other 48 Eastbrokers Company Information (1997), 11 August and New Europe (1998), 11-17 October. 49 These countries accounted for nearly one third of total exports in 1998. See Hungarian Ministry of Economic Affairs
(2000c), p. 3. 50 For detailed information on each company see Hungarian Ministry of Economic Affairs (2000c).

39
branches are relatively small (see Table 24). Growth has been especially pronounced in the sub-branch 'soap, cleaning, polishing, perfumes & toilet preparations' (cleaning preparations, cosmetics), due to strong export expansion. (About 75% of all cosmetics exports and 78% of all cleaning preparations go to the countries of Eastern Europe.) Looking at the company structure, about 3240 chemical companies were operating in Poland. Of these, 71% employed less than 5 persons, about 23% between 6 and 100 employees and 6% more than 100 employees. Despite this dominance of small enterprises, large companies do play a major role in the sector, many employees work in large enterprises (see Table 26) and production concentration is high. About 98% of chemical companies are in private property, only 2% are still in public property.51 (However, these are mostly large companies, compare Table 26, where out of the ten largest companies seven are still in state ownership.)
Table 24
Poland: Sold production of the chemical sector1) PLN million, distribution in %
1994 1996 1999 1999 1999 level PLN million in % in % of 1994
24.1 Manufacture of basic chemicals 5063 8303 9296 42.6 183.6
24.2 Manufacture of pesticides and other agro-chemical products 211 325 .2) .3) .
24.3 Manufacture of paints, varnishes and similar coatings 723 1186 1433 6.6 198.2
24.4 Manufacture of pharmaceuticals 1751 2740 3725 17.1 212.7
24.5
Manufacture of soap, cleaning, polishing, perfumes & toilet
preparations 1242 2795 5136 23.6 413.5
24.6 Manufacture of other chemical products 380 682 .2) .3) .
24.7 Manufacture of man-made fibres 733 1017 933 4.3 127.3
DG Chemicals, chemical products and man-made fibres 10102 17049 21800 100.0 215.8
Notes: Average exchange rate Polish zloty 1996 PLN/EUR 3.38, 1999 PLN/EUR 4.23. - 1) Companies with more than 50 employees. - 2) Not included in official data any more. - 3) 242 and 246 together account for 6% of sold production.
Source: Polish Statistical Yearbook, Polish Industrial Yearbook, various issues.
In the chemical sector, the financial standing of companies is very good: net profitability was higher than of total manufacturing over the whole period observed (1994 to 2000). Investment activity varied over time but was positive, except in 1999 (see Table 25).52 Foreign direct investment is also very important for the sector: according to PAIZ, the chemical sector accounted for 6.6% of all capital investment in manufacturing as of
51 PAIZ (2001), p. 6. 52 Investment was mostly involved in the modernization of technological processes and installations, with the aim of
reducing the energy intensity and material intensity of production, of improving product quality and of reducing environmental hazard. See PAIZ (2001), p. 12.

40
end-2000 (7.5% as of end-1999).53 FDI was mainly attracted by the sub-branches of household chemistry, paints and varnishes, pharmaceuticals, and industrial gases and included the following companies:54 NACE Sub-branch Company
24.11 Industrial gases BOC Group, Linde AG, AGA AB, Liquid Carbonic
24.3 Paints and varnishes Alcro-Beckers AB, Kalon Group BV, Omicron BV, Dyrup
24.4 Pharmaceuticals Glaxo Wellcome, Pliva, ICN Pharmaceuticals, Solco Basel,
Bayer AG, Novartis, Novo Nordis A/S, BASF AG,
Gerresheimer, Lek d.d. Ljubljana, US Pharmacia, L. Molteni &
C. Dai Filli Alitti, Martin Bauer, Schwartz Pharma, Byk Gulden
24.5 Soap & detergents,
cleaning & polishing
preparations
Cussons Group Ltd., Beiersdorf, Unilever, Orifame, Henkel,
L'Oreal, Colgate Palmolive, Benkiser, Catzy
Table 25 Poland: Net profitability in the enterprise 1) sector
and real growth rates of investment outlays in %
Net profitability2) Investment growth 1997 1998 1999 2000 1997 1998 1999 2000
24 Chemicals, chemical products and
man-made fibres
3.4 1.8 1.6 2.7 58.3 23.2 -11,0 16.2
D Total manufacturing 2.3 1.2 0.1 0.7 38.2 30.9 1.2 -4.1
Note: 1) Firms with 50 or more employees. - 2) Ratio of net profits to all revenue.
Source: Podkaminer (1998) and Central Statistical Office (1998, 1999, 2000, 2001).
In mid-1999, a sectoral programme for restructuring and development of the Polish chemical sector was instituted, called the 'Big Chemical Synthesis'. One of the targets is the consolidation of the chemical sector (including the rubber and plastic products sector) in order to increase synergy effects.55
53 PAIZ Homepage www.paiz.gov.pl. 54 Foreign investors as of end of June 2000. PAIZ (2001). 55 PAIZ (2001), p. 14. Even before, a programme was prepared for 21, mainly large companies, focusing on organic and
non-organic half-finished products, fertilizers, sulphur processing and coke-chemistry. The programme envisaged considerable restructuring, modernization and development of the industry by 2005. There was also a project called 'The action programme for the restructuring of the Polish pharmaceutical industry'. See Ministry of Economy (1998), p. 181.

41
Table 26
Largest companies of the Polish chemical sector, ranked by 2000 revenues
NACE Code1
Name, Location
Revenues2)
in PLZ mn Revenues
in EUR3) mn Employees Share of
exports4) Gross profit,
in % Owner-ship5)
6) Polska Grupa Farmaceutyczna SA,
L ódz
2,234 557 694 0.07 -3.65 D
24.51 Unilever Polska SA, Warszawa
1,500 374 2,300 . . E, D
24.15 Police Zakl ady Chemiczne SA, Police
1,404 350 4,410 53 0.79 A
24.15 Zakl ady Azotowe
Pul awy
SA, Pul awy
1,354 338 3,751 40 7.83 A
24.16 Anwil Zakl ady Azotowe,
Wl oclowek
1,200 299 1,682 38 7.26 D, A, B
24.14 Zakl ady Azotowe SA,
Tarnów -Mos cice 1,107 276 3,705 59 1.99 A
24.15 Zakl ady Azotowe
Ke dzierzyn SA,
Ke dzierzyn-Koz le
1,042 260 1,978 53 -4.52 A
24.16 Dwory Firma Chemiczna SA, Os wie cim
1,013 253 . . 0.92 D, A
24.14 Zachem Zakl ady Chemiczne, Bydgoszcz
851 212 2,122 34 1.83 B
24.51 Henkel Polska SA, Warszawa
712 178 706 13 3.28 E, A
Notes: 1) NACE Codes: 24.14 Manufacture of other organic basic chemicals; 24.15 Manufacture of fertilizers and nitrogen compounds; 24.16 Manufacture of plastics in primary forms; 24.51 Manufacture of soap and detergents, cleaning and polishing preparations. - 2) Total revenues. - 3) Preliminary average exchange rate Polish zloty 2000 PLN/EUR 4.01. - 4) As per cent of revenues of main activity. - 5) Ownership defined as State treasury (A), State or state agency (B), communal ownership (C), private ownership (D), foreign ownership (E). - 6) Largest private distributor of pharmaceuticals.
Source: Rzeczpospolita (2001).
Under communism, the Polish pharmaceutical industry consisted of 13 main companies, all belonging to the industrial amalgamation called Polfa (for herbal medicines, Herbapol). On the domestic market, the production was sold by the intermediary distributor CEFARM (Centrala Farmaceutyczna), on the foreign market this was done by the trade organization Ciech.56 After the collapse of the socialist system, the companies were intended to be privatized as one concern. However, a first privatization attempt in 1991 failed and a case-by-case privatization approach was adopted. By 1997, only two companies, Polfa Kutno and Jelfa in Jelenia Góra, had been transformed into joint-stock companies, with the state treasury being their main stockholder, which were later listed on the Warsaw stock exchange. Until the end of 1997, foreigners were deliberately kept aside from
56 Urbanek (1998), p. 84.

42
pharmaceutical companies, as the pharmaceutical branch was assigned particular importance. Since then, some companies have been privatized, also with foreign strategic investors, and some still await privatization. As of the first half of 2000, the pharmaceutical industry comprised 267 companies, of which 199 produced basic pharmaceuticals and 68 pharmaceutical preparations. Small companies with up to 5 persons dominate, in addition 27 large companies with more than 250 employees exist. In the structure of 1999 sold production, pharmaceutical substances account for 3%, herbal pharmaceuticals for 11%, auxiliary preparations and semi-products for 5%, ready-made medicaments for 74% and other for 9%. Generic drugs account for 95% of home production. In foreign trade, 66% of pharmaceutical exports were destined for the countries of Eastern Europe (Russia, Lithuania, Ukraine) and only 19% for the EU, while 73% of imports came from the European Union (France, Germany).57 The largest companies include Pliva Kraków S.A., Polpharma S.A. Starograd Gdanski, Glaxo Wellcome S.A., Polfa Tarchomin S.A., Polfa Kutno S.A., and Jelfa S.A. Jelenia Góra.58 Four companies (Pliva Kraków, Glaxo Wellcome, Polfa Kutno and Jelfa) have improved their marketing strategies and are successful on the OTC (over-the-counter) market, the other producers still struggle to meet Good Manufacturing Practice (GMP) requirements, introduced by the Polish government in 1997.59 Romania
Romania has a historical focus on oil, petrochemicals and basic chemicals due to the availability of indigenous feedstock; a limited range of pharmaceuticals and agro-chemicals is produced as well. In terms of value, fertilizers, petrochemicals/polymers and fibres are important sub-branches.60 During communism, investment in capacities rather than in quality improvements led to obsolete technology in the sector. Privatization of the chemical sector is still proceeding slowly (e.g. SC Antibiotice) with companies troubled by high debts and by the inability to procure feedstock, which stifles much of the industry. The aim of the industrial policy today is to increase the competitiveness of the chemical sector by61: − adapting the production to internal and external market demand
57 The significance of imports can be illustrated by the following figures: Of 12,000 medicines registered in Poland, less
than 3000 are Polish-made. Locally produced drugs account for 30% of the market in terms of value, but 75% in terms of all pharmaceuticals purchased. NewsBase CEBD (2000), 3 April and Business Eastern Europe (2000), 18 December.
58 For detailed information see PAIZ (2001). 59 Business Eastern Europe (2000), 18 December. 60 See European Commission (2000), p. IV-77. 61 Romanian Government (2001), p. 214.

43
− implementing quality assurance systems for products and manufacturing (e.g. upgrading pharmaceutical manufacturers' production to meet the Good Manufacturing Practice standards)
− Stimulating investments for upgrading and environmental protection (e.g. new efficient technology for caustic soda and chloride production; investments into environmental safety technologies for fertilizers and inorganic chemical industries).
Table 27
The largest Romanian chemical companies,
ranked by 1999 turnover
Name, location Turnover in ROL mn
Turnover in EUR1) mn
Employees Sub-branch
Oltchim SA 3137,132 193 7,356 Other basic inorganic chemicals
Azomures SA 1464,284 90 3,628 Fertilizer and nitrogenous products
Procter & Gamble Marketing
Romania SRL
1279,667 79 . Soaps, detergents, cosmetics and
perfumery products
Sicomed SA 615,625 38 2,370 Pharmaceutical products
U.S.G. SA
(Uzinele Sodice Govorna)
560,196 34 1,982 Other basic inorganic chemicals
Chimcomplex Borzesti SA 542,293 33 2,111 Other basic inorganic chemicals
Carom SA 477,167 29 2,412 Synthetic rubber manufacture
Terapia SA 464,350 28 1,477 Pharmaceutical products
Unilever Romania SA 462,154 28 289 Soaps, detergents, maintaining
products
Europharm SA 415,362 25 711 Pharmaceutical products
Antibiotice SA 408,906 25 2,187 Pharmaceutical products
Notes: 1) Converted with average exchange rate Romanian lei 1999 ROL/EUR 16295.3. - Not included were the following companies: Rompetrol Rafinarie – Complexul Petromidia SA (processing of crude oil and derivatives); B.B.G. Alum SA (aluminium production and fabrication of soaps, detergents and maintaining products); Petrotel Lukoil SA (petroleum processing). No 1999 turnover data available for Colgate Palmolive Romania SA (fabrication of soaps, detergents, cosmetics and perfumery products) in this database.
Source: Chamber of Commerce and Industry of Romania and Bucharest (2001).
− Oltchim SA: Founded in 1966, Oltchim is now the largest and most diversified
chemicals producer in Romania. It dominates the domestic inorganic, petrochemicals and agro-chemicals markets and is the only Romanian PVC producer. It also has a leading position in pesticides (near-monopoly), caustic soda, oxo-alcholos and petrol. Since 1994, it has undertaken an intensive restructuring and investment programme; its targets for the future include lowering the cost basis, increasing the proportion of value-added products and diversification into agricultural and food-processing companies.62 Difficulties for the company came from the contraction of the domestic market,
62 ABN AMRO (1998), March, p. 9.

44
especially of agriculture, being one of its largest debtors. About 30% of deliveries were paid in products; this situation made Oltchim purchase companies such as a poultry breeding farm and a tin factory.63 Oltchim is among the largest exporters of the country. In 2000, net profits soared to ROL 33.7 billion (EUR 1.7 million) and turnover increased to ROL 4.6 trillion (EUR 231 million). The company's ownership structure in mid-2000 was as follows: 53.2% State Ownership Fund, 7.9% Financial Investments Company Oltenia, 38.6% small shareholders, and 0.082% company managers.64 In early 2001, the Canadian Exall Resources bought the majority stake from the state, but failed to make the payment on time. Hence in August the privatization deal was cancelled.65 A major task would be the restructuring of the company's current USD 190 million debts.
The Romanian pharmaceutical industry was formerly weak and dominated by seven domestic producers – Sintofarm, Meduman, Terapia, Biofarm, Antibiotice, Sicomed and Armedica – each specialized in manufacturing certain pharmaceuticals for the almost completely closed Romanian market. After the collapse of communism, competition increased as private firms were established (e.g. Sindan or Labormed) and foreign producers entered the market through direct imports, licensing-in agreements and acquisitions. On the Romanian market, companies' operations have been hampered by the low level of health care expenditure by the state (however, private expenditure is growing though prices are rising) and by delays in the reimbursement system, on the export markets by barriers of GMP standards and the Russian crisis. Terapia is listed on the Bucharest stock exchange.66 Slovak Republic
In 1990 Slovakia accounted for about 38% of production of the former Czechoslovak chemical and rubber & plastic products sector. After the collapse of communism, the chemical sector faced strong import competition from foreign firms which offered a wider product range than domestic producers. On the export side, the Czech Republic – as already before the split of Czechoslovakia (1993) – and the EU became the main trading partners. Within the chemical sector, man-made fibres take an important position and appear most competitive.67 The privatization of chemical companies was still in process at the end of 2000, including for example Duslo Šal'a, Chemolak Smolenice, Plastika Nitra
63 Romanian Economic Daily (1999), 30 July -1 August. 64 Romanian Economic Daily (2000), 26 September. 65 Bucharest Business Week (2001), 10 September. 66 Raiffeisen Capital & Investment S.A. (2000). 67 Ministry of Economy of the Slovak Republic (1999), p. 17.
In 1998, the most important sub-branches in terms of employment were basic chemicals, pharmac euticals and man-made fibres (however, no data for pesticides and other agro-chemical products are included), see UNIDO (2001).
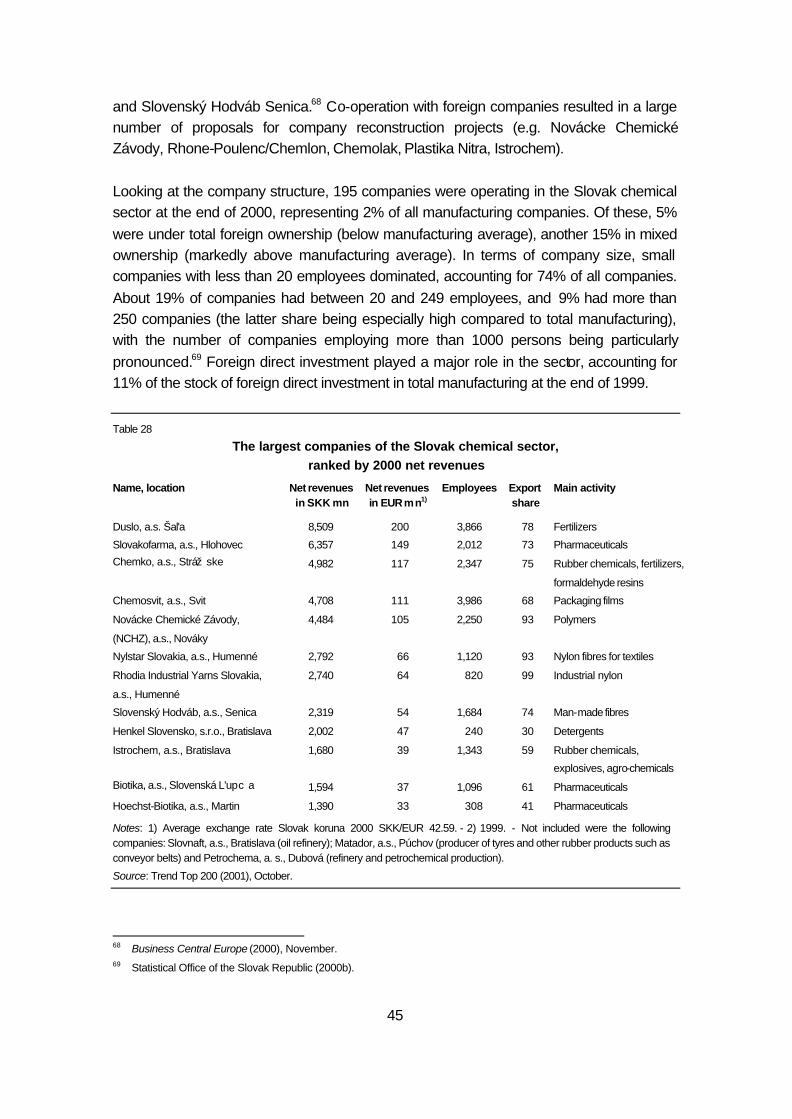
45
and Slovenský Hodváb Senica.68 Co-operation with foreign companies resulted in a large number of proposals for company reconstruction projects (e.g. Novácke Chemické Závody, Rhone-Poulenc/Chemlon, Chemolak, Plastika Nitra, Istrochem). Looking at the company structure, 195 companies were operating in the Slovak chemical sector at the end of 2000, representing 2% of all manufacturing companies. Of these, 5% were under total foreign ownership (below manufacturing average), another 15% in mixed ownership (markedly above manufacturing average). In terms of company size, small companies with less than 20 employees dominated, accounting for 74% of all companies. About 19% of companies had between 20 and 249 employees, and 9% had more than 250 companies (the latter share being especially high compared to total manufacturing), with the number of companies employing more than 1000 persons being particularly pronounced.69 Foreign direct investment played a major role in the sector, accounting for 11% of the stock of foreign direct investment in total manufacturing at the end of 1999.
Table 28
The largest companies of the Slovak chemical sector, ranked by 2000 net revenues
Name, location Net revenues in SKK mn
Net revenues in EUR mn1)
Employees Export share
Main activity
Duslo, a.s. Šal'a 8,509 200 3,866 78 Fertilizers
Slovakofarma, a.s., Hlohovec 6,357 149 2,012 73 Pharmaceuticals
Chemko, a.s., Stráž ske 4,982 117 2,347 75 Rubber chemicals, fertilizers,
formaldehyde resins
Chemosvit, a.s., Svit 4,708 111 3,986 68 Packaging films
Novácke Chemické Závody,
(NCHZ), a.s., Nováky
4,484 105 2,250 93 Polymers
Nylstar Slovakia, a.s., Humenné 2,792 66 1,120 93 Nylon fibres for textiles
Rhodia Industrial Yarns Slovakia,
a.s., Humenné
2,740 64 820 99 Industrial nylon
Slovenský Hodváb, a.s., Senica 2,319 54 1,684 74 Man-made fibres
Henkel Slovensko, s.r.o., Bratislava 2,002 47 240 30 Detergents
Istrochem, a.s., Bratislava 1,680 39 1,343 59 Rubber chemicals,
explosives, agro-chemicals
Biotika, a.s., Slovenská L'upc a 1,594 37 1,096 61 Pharmaceuticals
Hoechst-Biotika, a.s., Martin 1,390 33 308 41 Pharmaceuticals
Notes: 1) Average exchange rate Slovak koruna 2000 SKK/EUR 42.59. - 2) 1999. - Not included were the following companies: Slovnaft, a.s., Bratislava (oil refinery); Matador, a.s., Púchov (producer of tyres and other rubber products such as conveyor belts) and Petrochema, a. s., Dubová (refinery and petrochemical production).
Source: Trend Top 200 (2001), October.
68 Business Central Europe (2000), November. 69 Statistical Office of the Slovak Republic (2000b).

46
Between 1996 and 1999, the chemical sector (including only companies with 20 and more employees) registered a declining profit before taxation (and even a loss in 1998). In 1999, the profit before taxation reached SKK 70 million (EUR 1.6 million).70 − Slovakofarma: Established in 1941, the company is the leading and oldest Slovak
pharmaceutical company. In 1992, it was transformed into a joint-stock company with the National Property Fund (FNM) holding 100%. One year later, the first phase of privatization was completed and 19.1% of shares were privatized. Altogether, 19 investment funds and 19,800 citizens of the Czech and Slovak Republics participated. Privatization was completed in 1994 by selling a majority stake to the senior management. Slovakofarma's main activity is the production and sale of various medicines, pharmaceutical substances, chemicals and cosmetics. About one third of sales are realized on the Slovak market, one half in the Czech Republic, further export destinations include 25 countries, with Russia in particular, Germany and Poland being the most important. Pre-tax profits went down in 1997 to SKK 680 million (EUR 18 million) from SKK 960 million (EUR 25 million) in 1996 due to declining Czech demand. In 2000, pre-tax profits stood at SKK 490 million (EUR 11 million). The company is listed on the Bratislava stock exchange. At the beginning of 2001, Slovakofarma announced to lay off 307 workers, blaming the critical situation of the health sector, and particularly the non-payment of receivables from local health administrations, estimated at SKK 673 million (EUR 15 million).71
Slovenia
The privatization of the Slovenian chemical sector was completed in 1993. Today the chemical sector is one of the most promising sectors in Slovenian manufacturing. In the years 1999 and 2000, it was the most successful manufacturing sector in terms of net profits, with EUR 77 million and EUR 100 million respectively. (In 2000, the sector held 28% of total manufacturing's net profits.)72 Also in 1996 and 1997, it was the best performing sector in terms of several profitability indicators. The chemical sector is very active abroad, with the highest share of direct outward investment in total manufacturing. It is a strong exporter, mainly to the Central and Eastern European countries and the successor states of former Yugoslavia. In the structure of the Slovenian chemical sector, pharmaceuticals play the major role: In 2000, the pharmaceutical industry held around 40% of the chemical sector's total revenues; it also ranked highest in terms of business performance. The pharmaceutical
70 Statistical Office of the Slovak Republic (2000a), p. 99. 71 Slovakofarma Internet Homepage www. skovakofarma.sk and NewsBase CEBD (2001), 18 January. 72 Slovenian Business Report (2001), Fall.

47
industry is internationally competitive and comprises the companies Krka, Lek and Bayer Pharma, a joint venture between Lek and Germany's Bayer (see Table 30). Another important sub-branch of the chemical sector is 'basic chemicals' (19%), followed by the somewhat smaller sub-branches of 'paints, varnishes and similar coatings' (11%), 'other chemical products' (10%), 'soap, cleaning, polishing, perfumes & toilet preparations' (9%), and 'man-made fibres' (7%). The production of 'pesticides and other agro-chemical products' (2%) is the smallest sub-branch (see Table 29). − Krka: Founded in 1954, Krka is among the leading pharmaceutical companies in the
CEECs and the largest one in Slovenia, with an income of EUR 320 million and 2,800 employees in 2000 (see Table 30). The company's main activities are the development, production and marketing of drugs (90%), comprising mainly generics, OTC-products, but also a small amount of veterinary products. This activity is complemented by the production of cosmetics. Krka is a very export-oriented company, with 70% of sales abroad. In 2000, it was the fourth largest Slovenian exporting company, behind Revoz (automobiles), Gorenje (white goods producer) and Prevent (carseat covers). The company's sales strategy is directed towards five equally important geographical markets: Slovenia, CEFTA, former-Yugoslavia successor states, former Soviet Union and the rest of the world. Principle target markets include Russia, Poland and Croatia. Krka's success is due to 35 companies and representative offices abroad. In the Ukrainian market, for example, it ranked third among foreign pharmaceutical companies according to distributors, behind Hungary’s Richter Gedeon and Germany’s Berlin’s Chemie. At the end of 1997, Krka began the construction of a plant in Warsaw, with a value of USD 15 million (EUR 13 million), which will work at full capacity from autumn 2001 onwards. Krka wants to avoid high customs, to benefit from local tax concessions and to use the plant as an export base for Lithuania and Ukraine. In 2001, a new production facility is yet to open in Slovenia, further plants in Croatia and Russia will follow. In 1999, Krka enjoyed the second largest net profits in Slovenia, behind Telekom, measuring EUR 19 million. In 2000, it was already the largest Slovenian profit-making company (EUR 35 million), followed by Lek (EUR 27 million) and Telekom Slovenije (EUR 25 million). Krka is listed on the Ljubljana stock exchange.73
73 Eastbrokers Company Information (1998), 22 January; Slovenian Business Report (1997), Autumn; Krka Internet
Homepage www.krka.si; Slovenia Business Week (2001), 5 February; Ost-West-Contact (2001), no. 4; Slovenian Business Report (2001), Fall.

48
Table 29 Slovenia: Total revenues of the chemical sector
SIT million, distribution in % 2000 2000 in %
24.1 Manufacture of basic chemicals 63243 19.2
24.2 Manufacture of pesticides and other agro-chemical products 6343 1.9
24.3 Manufacture of paints, varnishes and similar coatings 36990 11.2
24.4 Manufacture of pharmaceuticals 138592 42.1
24.5 Manufacture of soap, cleaning, polishing, perfumes & toilet
preparations 28304 8.6
24.6 Manufacture of other chemical products 33348 10.1
24.7 Manufacture of man-made fibres 22117 6.7
DGChemicals, chemical products and man-made fibres 328937 100.0
Notes: Average exchange rate Slovenian tolar 2000 SIT/EUR 205.03.
Source: Chemical and Rubber Industry Association http://www.gzs.si/eng/ccis/branch/chemical/chem4.htm.
Table 30
The largest companies of the Slovenian chemical sector, ranked by 2000 income
Name, location Total income in SIT mn
Total income in EUR mn1)
Employees Export Share
Main activity2)
Krka, d.d., Novo Mesto 65,629 320 2,775 70 Pharmaceuticals
Lek, d.d., Ljubljana 60,611 296 2,489 60 Pharmaceuticals
Henkel Slovenija, d.o.o., Maribor 18,813 92 579 40-60 24.51
Sava, d.d., Kranj 16,401 80 890 60-80 25.11; 24.66 (second.)
Helios Tovarna Barv, d.o.o., Domž ale 14,935 73 410 60-80 24.30
Color, d.d., Medvode 8,550 42 431 60-80 24.30
Jub, d.d., Dol pri Ljubljani 6,776 33 184 50 24.30
Bayer Pharma, d.o.o, Ljubljana 6,362 31 162 20-40 Pharmaceuticals
Kemiplas, d.o.o., Koper 6,360 31 174 80+ 24.14
Belinka Perkemija, d.o.o., Ljubljana 4,527 22 110 80+ 24.13
Notes: Julon, d.d., Ljubljana, manufacturer of man-made fibres, was missing from the list of largest companies ranked by2000 income.- 1) Converted with average exchange rate Slovenian tolar 2000 SIT/EUR 205.03. - 2) 24.13 Manufacture of other inorganic basic chemicals; 24.14 Manufacture of other organic basic chemicals; 24.30 Manufacture of paints, varnishes and similar coatings, printing ink and mastics; 24.51 Manufacture of soap and detergents, cleaning and polishing preparations; 24.66 Manufacture of other chemical products n.e.c.; 25.11 Manufacture of rubber tyres and tubes.
Source: Slovenian Business Report (2001), Fall; SLO Export Internet Homepage www..gzs.si/sloexporta/default.htm.
− Lek: Formed in 1946, Lek is the second largest Slovenian pharmaceutical company,
after Krka, in terms of income, net profits, employees and exports. The company's main activity is the development, production and marketing of drugs, complemented by self-medication products, animal health products, cosmetics and medical devices. Production of active substances and finished products takes place in four branches in Slovenia and a subsidiary in Poland. Slovenia is still the company's largest market,

49
followed by Poland and Russia, with Croatia and the USA also belonging to its target markets. In 1999, Lek and Sanofi-Synthelabo, the second largest French pharmaceutical company, formed a joint venture in order to market Sanofi's products in the Balkans. One year later, Lek started the construction of a development centre in Ljubljana and in 2001 it acquired 90% of the local antibiotics maker PharmaTech. Lek is listed on the Ljubljana stock exchange and lately considered a London listing, making it easier for foreign investors to buy shares.74
74 Lek Internet Homepage www.lek.si; Business Eastern Europe (1999), 20 September; Business Eastern Europe (2000),
9 October; Business Eastern Europe (2001), 15/22 January.

50
References
ABN-AMRO, Report on Central & Eastern Europe and Central Asia, various issues.
Alessandrini, S. (ed.) (2000), The EU Foreign Direct Investments in Central and Eastern Europe, Milan.
ANEIR – Foreign Trade Promotion Center S.A. (2000), Romania Your Business Partner 1999/2000 Edition, CD-ROM.
Bucharest Business Week, various issues.
Bulgarian Enterprises Information System BEIS, Internet Homepage www.bia-bg.com.
Bulgarian Privatization Agency, Internet Homepage www.priv.government.bg.
Business Central Europe, various issues.
Business Eastern Europe, various issues.
Chamber of Commerce and Industry of Romania and Bucharest (2001), Pro Business Romania 2001, CD-ROM, Internet Homepage www.ccir.ro/pro 2001.
Eastbrokers Company Information, various issues.
Estrin, S. et al. (eds.) (1995), Restructuring and Privatization in Central and Eastern Europe: Case Studies of Firms in Transition, M. E. Sharpe.
European Commission (1997), Panorama der EU-Industrie 97, Luxemburg.
European Commission (2000), Competitiveness of the Chemical Industry Sector in the CEE Candidate Countries, a study prepared by Chem Systems, October, available on the DG III Internet Homepage http://europa.eu.int/comm/enterprise/chemicals/enlargement/competcand/competcand.htm.
Fath, J. et al. (1993), ‘Die Industrien Tschechiens und der Slowakei: Profile, Trends, Bezug zu Österreichs Industrie’, WIIW Research Reports, no. 201, The Vienna Institute for International Economic Studies, September.
Figyelö TOP 200 (2001), Special number, October.
Havlik, P. et al. (2001), ‘Transition Countries in 2001: Robust Domestic Demand, Concerns About External Fragility Reappear', WIIW Research Reports, no. 277, The Vienna Institute for International Economic Studies, July.
Havlik, P., M. Landesmann and R. Stehrer (2001), ‘Competitiveness of CEE Industries: Evidence from Foreign Trade Specialization and Quality Indicators', WIIW Research Reports, no. 278, The Vienna Institute for International Economic Studies, July.
Havlik, P. (2001), 'Patterns of Catching-Up in Candidate Countries' Manufacturing Industry', WIIW Research Reports, no. 279, The Vienna Institute for International Economic Studies, August.
Hungarian Central Statistical Office (2000), Statistical Yearbook of Industry and Construction 1999, Budapest.
Hungarian Ministry of Economic Affairs (2000a), Plastic Base Materials Production and Plastic Processing, on the Internet Homepage www.ikm.iif.hu/english/economy/industr/muanyag.htm, January.
Hungarian Ministry of Economic Affairs (2000b), Pesticide Production, on the Internet Homepage www. ikm.iif.hu/english/economy/industr/novszer.htm, February.
Hungarian Ministry of Economic Affairs (2000c), Pharmaceutical Industry, on the Internet Homepage www.ikm.iif.hu/english/economy/industr/gyogyszer.htm, April.
Hungarian Ministry of Economic Affairs (2000d), Cosmetics and Household Chemicals Market, on the Internet Homepage www.ikm.iif.hu/english/economy/industr/kozmetik.htm, April.
Ministry of Economy (1998), Poland’s Report – Industry in 1997, Warsaw.
Ministry of Economy (1999), Poland’s Report – Industry in 1998, Warsaw.
Ministry of Economy of the Slovak Republic (1999), Elaboration of the principles of the European Union’s Industrial Policy for conditions of th e Slovak Republic, including a Review of Branch Profiles, Bratislava.
51
Ministry of Industry and Trade (2000), Panorama of Czech Industry 1998/99, Prague.
Ministry of Industry and Trade (2001), Panorama of Czech Industry 2000, Prague.
Ministry of Industry and Trade (2001a), Analysis of the Czech Economy and MIT Sectors, Prague.
New Europe, various issues.
NewsBase CEBD, various issues.
Ost-West-Contact, various issues.
Podkaminer, L. (1998), ‘POLAND: Medium- and Long-term Economic Prospects’, WIIW Analytical Forecasts, The Vienna Institute for International Economic Studies, April.
Polish Agency for Foreign Investment (PAIZ) (2001), Chemical Industry in Poland, Warsaw, January.
Prague Business Journal (1999), Book of Lists 2000, Prague.
Prague Business Journal (2000), Book of Lists 2001, Prague.
Raiffeisen Capital & Investment S.A. (2000), 'Pharmaceutical Industry Overview', in: Kompass Romania (2000), Major Companies of Romania 2000, Bucharest.
Rzeczpospolita (2001), Lista 500.
Romanian Economic Daily, various issues.
Romanian Government (2001), National Programme for Accession of Romania to the European Union, vol. I, June.
Slovenian Business Report, various issues.
Slovenian Business Week , various issues.
Statistical Office of the Slovak Republic (2000a), Yearbook of Industry, August.
Statistical Office of the Slovak Republic (2000b), Bulletin, no. 12.
Trend Top 200 (2001), October.
The Prague Post (1998), no. 11, 18-24 March.
United Nations Industrial Development Organization (UNIDO) (2001), International Yearbook of Industrial Statistics 2001, Vienna.
Universita’ Commerciale Luigi Bocconi (1997), EU Foreign Direct Investment in Central and Eastern Europe, Research Project with the Financial Assistance of the Commission of the European Communities, Directorate-General III, Ref. SUB/96/83328/U.B., Milan, November.
Urban, W. (1999), ‘Patterns of Structural Change in CEEC Manufacturing’, in: Structural Developments in Central and Eastern Europe, WIIW Report 1999, The Vienna Institute for International Economic Studies, Vienna, August.
Urbanek, P. (1998), 'Polfa', in: Eastern European Economics, vol. 35, no. 5, September-October 1997, pp. 84-95.
Wilczynski, J. (1974), Technology in Comecon, The Macmillan Press Ltd.
Wolf, G. (2000), 'Alles Leben ist Chemie: Österreichs chemische Industrie im Strukturwandel', Bank Austria Report, 1/2000.

52
53
APPENDIX OF TABLES AND FIGURES

54
Table A1Key data on total manufacturing
Average annualgrowth in %
1989 1992 1993 1997 1998 1999 2000 1993-2000 1995-1999
BULGARIA
Industrial production (at current prices) in BGN mn 59 177 201870 13511 13501 12529 15170 . .Industrial growth (at constant prices) in % . -17.2 -12.7 -12.0 -12.0 -9.2 5.3 . .Employment in 1000 1420 883 767 720 690 616 526 . .Employment growth in % . -16.3 -13.2 -2.7 -4.2 -10.7 -14.6 . .Wage growth (ECU basis) in % . 46.0 44.5 -1.6 25.9 5.0 11.8 . .Productivity growth in % . -1.0 0.6 -9.5 -8.1 1.7 23.3 . .ULC growth (ECU basis) in % . 47.5 47.5 8.7 37.0 3.2 -9.3 . .Total exports to EU in ECU mn 445 809 855 1940 2095 2099 . 13.8 1) 5.7Total imports from EU in ECU mn 1275 1029 1240 1674 2225 2480 . 11.5 1) 7.0Trade balance with EU in ECU mn -830 -220 -385 266 -130 -381 . . .Exports to the EU: Market shares in % 0.13 0.21 0.23 0.37 0.36 0.33 . . .
CZECH REPUBLIC
Industrial production (at current prices) in CZK mn 558351 652893 655289 1330877 1442259 1438096 . . .Industrial growth (at constant prices) in % . -8.0 -8.4 7.6 4.4 -1.5 4.9 2.4 .Employment in 1000 1658 1181 1098 1173 1143 1078 1038 . .Employment growth in % . -13.2 -7.0 -2.6 -2.6 -5.7 -3.7 -4.1 .Wage growth (ECU basis) in % . 20.0 33.7 8.1 9.3 4.5 11.2 14.5 .Productivity growth in % . 6.0 -1.5 10.4 7.1 4.5 3.5 6.0 .ULC growth (ECU basis) in % . 13.2 35.7 -2.0 2.0 0.0 2.1 7.3 .Total exports to EU in ECU mn . . 4460 10989 13899 16023 . 21.2 2) 17.8Total imports from EU in ECU mn . . 5612 14617 15854 17177 . 17.8 2) 12.2Trade balance with EU in ECU mn . . -1152 -3628 -1955 -1154 . . .Exports to the EU: Market shares in % . . 1.18 2.11 2.42 2.54 . . .
HUNGARY
Industrial production (at current prices) in HUF mn 1461100 1497321 1721479 5197367 6615642 7886728 1.1E+07 . .Industrial growth (at constant prices) in % . -17.5 3.0 15.9 17.4 18.6 23.4 11.9 .Employment in 1000 1171 857 747 637 659 743 . . .Employment growth in % . -14.5 -12.9 0.7 3.4 1.2 . -3.5 1) .Wage growth (ECU basis) in % . 14.5 18.4 10.8 2.3 10.4 . 6.2 1) .Productivity growth in % . -3.5 18.2 15.2 13.6 17.2 . 14.4 1) .ULC growth (ECU basis) in % . 18.6 0.2 -3.8 -9.9 -5.8 . -7.1 1) .Total exports to EU in ECU mn 2245 3620 3616 11007 13791 16710 . 21.5 1) 23.9Total imports from EU in ECU mn 2713 3785 4621 11819 14317 16022 . 19.1 1) 18.3Trade balance with EU in ECU mn -468 -165 -1004 -812 -527 688 . . .Exports to the EU: Market shares in % 0.67 0.96 0.96 2.11 2.40 2.65 . . .
POLAND
Industrial production (at current prices) in PLN mn . 78975 104441 299825 334887 367025 . . .Industrial growth (at constant prices) in % . 4.9 10.2 13.3 5.3 5.6 7.1 9.6 .Employment in 1000 3326 2767 2700 2821 2801 2611 2455 . .Employment growth in % . -13.1 -2.4 0.7 -0.7 -6.8 -6.0 -1.5 .Wage growth (ECU basis) in % . 2.6 13.8 11.1 8.5 3.8 16.7 11.8 .Productivity growth in % . 20.7 12.9 12.5 6.1 13.2 14.0 11.2 .ULC growth (ECU basis) in % . -15.0 0.0 -1.3 2.3 -8.4 2.4 0.5 .Total exports to EU in ECU mn 2924 6070 6616 12772 14763 16239 . 13.9 1) 10.5Total imports from EU in ECU mn 3308 7103 8785 22634 25527 26642 . 18.8 1) 17.6Trade balance with EU in ECU mn -384 -1033 -2169 -9863 -10764 -10403 . . .Exports to the EU: Market shares in % 0.87 1.61 1.75 2.45 2.57 2.57 . . .
Table A1 (continued)
EU(15)EU(12)

55
Table A1 (continued)Average annual
growth in %1989 1992 1993 1997 1998 1999 2000 1993-2000 1995-1999
ROMANIA
Industrial production (at current prices) in ROL bn . 5484 15302 171363 205445 341484 376414 . .Industrial growth (at constant prices) in % . -23.1 -1.2 -6.6 -11.4 -14.5 -1.4 -1.7 .Employment in 1000 . 2811 2590 2032 1907 1684 1566 . .Employment growth in % . -12.5 -7.9 -5.4 -6.2 -11.7 -5.7 -7.1 .Wage growth (ECU basis) in % . -37.0 35.5 -7.1 24.7 -9.9 8.5 8.8 .Productivity growth in % . -12.1 -12.1 -1.4 -5.6 7.3 4.5 5.8 .ULC growth (ECU basis) in % . -28.3 -28.3 -5.8 32.0 -18.1 3.8 2.8 .Total exports to EU in ECU mn 2502 1355 1625 4297 4991 5534 . 21.3 1) 14.1Total imports from EU in ECU mn 603 1592 2003 4709 5956 5950 . 19.2 1) 13.7Trade balance with EU in ECU mn 1898 -237 -378 -412 -965 -416 . . .Exports to the EU: Market shares in % 0.74 0.36 0.43 0.82 0.87 0.88 . . .
SLOVAK REPUBLIC
Industrial production (at current prices) in SKK mn . . 266525 419028 545700 599075 708367 . .Industrial growth (at constant prices) in % . -15.7 -11.9 2.6 7.5 3.4 10.4 3.0 .Employment in 1000 . 527 472 439 516 501 486 . .Employment growth in % . -12.6 -10.4 -3.6 -4.4 -2.9 -2.9 -3.7 .Wage growth (ECU basis) in % . 11.3 23.6 13.0 3.9 -3.2 12.9 11.2 .Productivity growth in % . -3.6 -1.6 6.5 11.1 6.5 13.7 6.8 .ULC growth (ECU basis) in % . 15.4 15.4 6.1 -6.5 -9.2 -0.7 4.1 .Total exports to EU in ECU mn . . 1092 3846 5230 5797 . 28.7 2) 18.1Total imports from EU in ECU mn . . 1089 4446 5347 5217 . 26.1 2) 14.8Trade balance with EU in ECU mn . . 3 -601 -117 581 . . .Exports to the EU: Market shares in % . . 0.28 0.74 0.91 0.92 . . .
SLOVENIA
Industrial production (at current prices) in SIT mn . 809602 998161 1868671 2077927 2165820 . . .Industrial growth (at constant prices) in % . -13.9 -4.0 -2.6 4.5 0.2 7.1 1.6 .Employment in 1000 370 282 257 229 227 224 225 . .Employment growth in % -1.4 -10.1 -9.0 -3.2 -0.8 -1.4 0.1 -3.7 .Wage growth (ECU basis) in % . -4.8 14.6 5.3 7.5 5.0 . 8.8 1) .Productivity growth in % . -4.2 5.5 0.7 5.3 1.6 7.0 5.5 .ULC growth (ECU basis) in % . -0.6 8.6 4.6 2.1 3.3 . 3.3 1) .Total exports to EU in ECU mn . 1549 2798 4596 5132 5222 . 16.0 1) 5.7Total imports from EU in ECU mn . 1323 2902 5922 6318 6499 . 22.1 1) 7.3Trade balance with EU in ECU mn . 226 -104 -1326 -1186 -1277 . . .Exports to the EU: Market shares in % . . 0.74 0.88 0.89 0.83 . . .
Notes: 1) 1993-1999. - 2) 1994-1999.EU: European Union (12), from 1997 European Union (15).Bulgaria: 1989-1995: Total manufacturing excluding petroleum refineries.Czech Republic: Up to 1996 enterprises with 100 employees or more, from 1997 enterprises with 20 employees or more. Industrial production at constant prices: 1997 and 1998 industrial output index calculated from production statistics of businesses with 20 employees or more.Hungary: Industrial production: Enterprises with more than 20, from 1996 enterprises with more than 10 employees, from 1999 enterprises with more than 5 persons. Employment and wages: Enterprises with more than 20 employees, from 1999 enterprises with more than 5 persons.Poland: Industrial production at current prices: From 1993 excluding VAT; including import duties; from 1996 basic prices, the years before producer prices. Average monthly gross wages: Enterprises with more than 5 employees, from 1999 including mandatory premium for social security and all enterprises.Romania: Net wages.Slovak Republic: Enterprises with 25 and more employees, 1997 enterprises with 20 and more employees, from 1998 all enterprises.Slovenia: Employment in enterprises, companies and organizations: 1989-1996 private enterprises are included only if they have 3 or more persons in paid employment and armed forces staff, from 1997 all enterprises. Wages in enterprises, companies and organizations.Source : WIIW Industrial Database
EU(12) EU(15)

56
Table A2
Fertilizers in use100% nutrients
1986 1990 1993 1998 1999 1986 1990 1993 1998 1999Bulgaria 182.3 172.1 52.4 30.2 26.0 91.9 86.8 26.4 15.2 13.1Czech Republic 301.4 152.3 91.5 85.8 . 85.2 43.1 25.9 24.3 .Hungary 261.4 126.9 41.6 65.0 68.6 103.4 50.2 16.5 25.7 27.1Poland 243.0 119.5 87.8 108.2 106.0 106.1 52.2 38.3 47.2 46.3Romania 121.8 109.8 54.1 38.7 33.4 108.0 97.3 48.0 34.3 29.6Slovak Republic 346.2 174.8 61.5 55.8 63.8 92.9 46.9 16.5 15.0 17.1Slovenia 212.7 190.0 319.5 376.6 388.7 104.3 93.1 156.6 184.6 190.5
Austria 151.6 121.4 106.4 98.9 93.4 99.3 79.6 69.7 64.8 61.2
Notes: 1) Hectare of cultivated agricultural land.Source: WIIW Handbook of Statistics (2001) and Präsidentenkonferenz der Landwirtschaftskammern Österreichs (1998).
1985=100kg per ha1)
Table A3
Chemicals, chemical products and man-made fibresEstimated ranges for Unit Labour Costs in 1999, Austria 1999 = 1001)
Czech SlovakBulgaria Republic Hungary Poland Romania Republic Slovenia
PPP for GDP(lower range) 20 21 34 40 16 20 61
PPP for fixedcapital formation(upper range) 49 32 55 54 39 32 71
Notes: 1) Defined as wages in ECU divided by productivity (measured as output at constant prices1996 converted with ECU-based purchasing power parities (PPPs) divided by employees);gross wages used for calculation.Source: WIIW

57
Table A5
1999 20001)
2001 2002 1999 20001)
2001 2002 20001989=100
Czech Republic -0.4 2.9 3.7 3 -3.1 5.1 7 6 81.3Hungary 4.2 5.2 4.3 4.5 10.4 18.6 8 9 136.4Poland2)
4.1 4.0 1 0 3.6 6.8 1 0 129.7Slovak Republic 1.9 2.2 3 3 -3.6 9.1 6 6 89.0Slovenia 5.2 4.6 3.4 4 -0.5 6.2 3 4 80.3
Bulgaria 2.4 5.8 4 4 -9.3 5.8 4 4 49.6Romania -2.3 1.6 4 2 -2.2 8.2 5 2 50.3
Notes: 1) Preliminary.- 2) Sales.Source: WIIW (October 2001).
Developments in GDP and gross industrial production
forecast
Gross industrial production
forecast
Gross domestic product
real change in % against preceding year
Table A4
Exports of individual industries in total manufacturing exports to the EU(15), 1999, in %
Czech SlovakBulgaria Republic Hungary Poland Romania Republic Slovenia
D Manufacturing total 100.0 100.0 100.0 100.0 100.0 100.0 100.0DA Food products; beverages and tobacco 8.4 1.3 4.3 5.8 1.3 0.8 1.5DB Textiles and textile products 30.4 7.3 7.6 13.9 40.0 9.0 9.9DC Leather and leather products 5.7 1.2 2.1 1.4 12.6 3.6 1.7DD Wood and wood products 2.6 3.2 1.3 5.8 3.6 2.4 4.5DE Pulp, paper & paper products; publishing and printing 1.1 2.6 1.0 2.6 0.3 2.6 3.9DF Coke, refined petroleum products & nuclear fuel 1)
0.7 1.1 1.2 1.4 0.5 2.0 0.0DG Chemicals, chemical products & man-made fibres 7.4 4.6 3.6 4.8 2.6 4.9 4.8DH Rubber and plastic products 1.2 5.0 2.4 3.1 1.1 2.5 3.8DI Other non-metallic mineral products 2.4 4.5 1.3 3.0 2.1 2.9 3.1DJ Basic metals and fabricated metal products 24.4 13.6 5.8 14.3 12.0 11.8 12.9DK Machinery and equipment n.e.c. 7.3 13.0 6.5 6.4 5.7 9.0 14.6DL Electrical and optical equipment 4.2 16.4 34.7 13.3 7.2 13.0 11.3DM Transport equipment 2.2 20.8 26.0 14.1 4.0 33.1 18.9DN Manufacturing n.e.c. 2.2 5.4 2.3 10.1 6.9 2.5 9.2
Source : Eurostat, WIIW calculations

58
Figure A1
Notes: 1) Including UK, France, Germany and Belgium.- 2) Including Greece, Portugal, Spain.Source : WIIW Industrial Database, Eurostat.
Shares of CEECs (at constant prices 1996) relative to other countriesChemicals, chemical products and man-made fibres
Shares in total production relative to Austria (1998)
-2.0
0.0
2.0
4.0
6.0
8.0
10.0
Bulgaria Czech Rep. Hungary Poland Romania Slovak Rep. Slovenia
1989
1990
1991
1992
19931994
1995
1996
1997
19981999
2000
Shares in total production relative to EU-North (1998)1)
-6.0
-4.0
-2.0
0.0
2.0
4.0
6.0
Bulgaria Czech Rep. Hungary Poland Romania Slovak Rep. Slovenia
19891990
1991
1992
1993
19941995
1996
1997
1998
19992000.0
Shares in total production relative to EU-South (1998)2)
-4.0
-2.0
0.0
2.0
4.0
6.0
8.0
Bulgaria Czech Rep. Hungary Poland Romania Slovak Rep. Slovenia
1989
1990
1991
1992
19931994
1995
1996
1997
19981999
2000.0

59
Figure A2
Share in manufacturing exports to the EU(15), in %
Share in manufacturing imports from the EU(15), in %
CEECs trade balance with the EU(15), ECU mn
Source: Eurostat, WIIW calculations
Chemicals, chemical products and man-made fibres
02468
1012141618
Bulgaria Czech Republic Hungary Poland Romania SlovakRepublic
Slovenia
1995 1996 1997 1998 1999
02468
101214
Bulgaria Czech Republic Hungary Poland Romania SlovakRepublic
Slovenia
1995 1996 1997 1998 1999
-3000-2500-2000-1500-1000
-5000
500
Bulgaria CzechRepublic
Hungary Poland Romania SlovakRepublic
Slovenia
1995 1996 1997 1998 1999
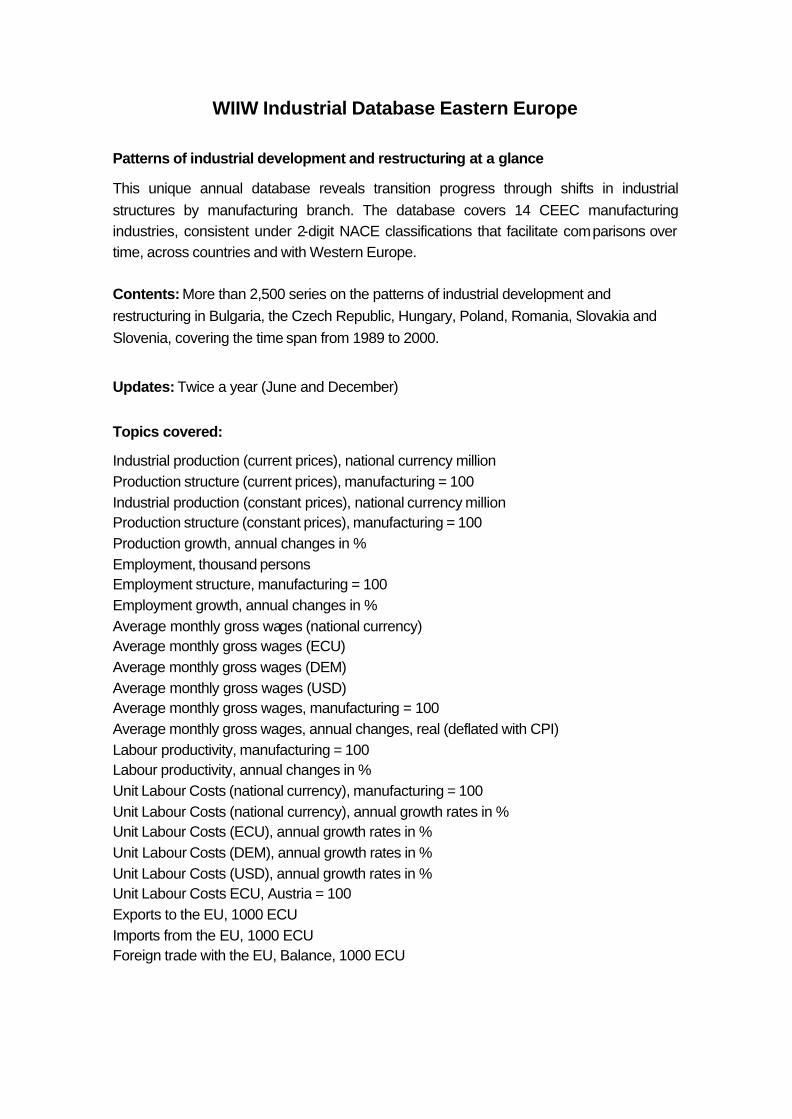
WIIW Industrial Database Eastern Europe
Patterns of industrial development and restructuring at a glance
This unique annual database reveals transition progress through shifts in industrial structures by manufacturing branch. The database covers 14 CEEC manufacturing industries, consistent under 2-digit NACE classifications that facilitate comparisons over time, across countries and with Western Europe. Contents: More than 2,500 series on the patterns of industrial development and restructuring in Bulgaria, the Czech Republic, Hungary, Poland, Romania, Slovakia and Slovenia, covering the time span from 1989 to 2000.
Updates: Twice a year (June and December)
Topics covered:
Industrial production (current prices), national currency million Production structure (current prices), manufacturing = 100 Industrial production (constant prices), national currency million Production structure (constant prices), manufacturing = 100 Production growth, annual changes in % Employment, thousand persons Employment structure, manufacturing = 100 Employment growth, annual changes in % Average monthly gross wages (national currency) Average monthly gross wages (ECU) Average monthly gross wages (DEM) Average monthly gross wages (USD) Average monthly gross wages, manufacturing = 100 Average monthly gross wages, annual changes, real (deflated with CPI) Labour productivity, manufacturing = 100 Labour productivity, annual changes in % Unit Labour Costs (national currency), manufacturing = 100 Unit Labour Costs (national currency), annual growth rates in % Unit Labour Costs (ECU), annual growth rates in % Unit Labour Costs (DEM), annual growth rates in % Unit Labour Costs (USD), annual growth rates in % Unit Labour Costs ECU, Austria = 100 Exports to the EU, 1000 ECU Imports from the EU, 1000 ECU Foreign trade with the EU, Balance, 1000 ECU

WIIW Industrial Database Eastern Europe
Tables contained in the database:
By NACE industries Dimension
D Manufacturing total Countries X 1989-00 DA Food products; beverages and tobacco Countries X 1989-00 DB Textiles and textile products Countries X 1989-00 DC Leather and leather products Countries X 1989-00 DD Wood and wood products Countries X 1989-00 DE Pulp, paper & paper products, publishing & printing Countries X 1989-00 DF Coke, refined petroleum products & nuclear fuel Countries X 1989-00 DG Chemicals, chemical products and man-made fibres Countries X 1989-00 DH Rubber and plastic products Countries X 1989-00 DI Other non-metallic mineral products Countries X 1989-00 DJ Basic metals and fabricated metal products Countries X 1989-00 DK Machinery and equipment n.e.c Countries X 1989-00 DL Electrical and optical equipment Countries X 1989-00 DM Transport Equipment Countries X 1989-00 DN Manufacturing n.e.c. Countries X 1989-00
By country Dimension
Czech Republic NACE X 1989-2000 Hungary NACE X 1989-2000 Poland NACE X 1989-2000 Romania NACE X 1989-2000 Slovak Republic NACE X 1989-2000 Slovenia NACE X 1989-2000 Bulgaria NACE X 1989-2000
By year Dimension
1989 NACE X Countries 1990 NACE X Countries 1991 NACE X Countries 1992 NACE X Countries 1993 NACE X Countries 1994 NACE X Countries 1995 NACE X Countries 1996 NACE X Countries 1997 NACE X Countries 1998 NACE X Countries 1999 NACE X Countries 2000 NACE X Countries
The WIIW Industrial Database Eastern Europe is available on diskette (MS Excel format; two updates a year) at a price of ATS 9,000 (€ 654.06). Reduced rate for Member companies: ATS 6,000 (€ 436.04)

Herausgeber, Verleger, Eigentümer und Hersteller: Verein "Wiener Institut für Internationale Wirtschaftsvergleiche" (WIIW), Wien 1, Oppolzergasse 6
Postanschrift: A-1010 Wien, Oppolzergasse 6, Tel: [+431] 533 66 10, Telefax: [+431] 533 66 10 50
Internet Homepage: http://www.wiiw.ac.at/
Nachdruck nur auszugsweise und mit genauer Quellenangabe gestattet.
P.b.b. Verlagspostamt 1010 Wien
Chemicals (Industry Study 2001-3)