Embed Size (px)
Citation preview
SEPTEMBER 2016
Working Paper 129
Estimating Importer-Specific Ad Valorem Equivalents of Non-Tariff Measures Mahdi Ghodsi, Julia Gruebler and Robert Stehrer
The Vienna Institute for International Economic Studies Wiener Institut für Internationale Wirtschaftsvergleiche

Estimating Importer-Specific Ad Valorem Equivalents of Non-Tariff Measures MAHDI GHODSI JULIA GRÜBLER ROBERT STEHRER
Mahdi Ghodsi and Julia Grübler are Research Economists at the Vienna Institute for International Economic Studies (wiiw). Robert Stehrer is Scientific Director of wiiw. This paper was produced as part of the PRONTO (Productivity, Non-Tariff Measures and Openness) project funded by the European Commission under the 7th Framework Programme. We are grateful to participants at the 8th FIW Research Conference 2015, the PRONTO Annual Conference 2016, and the Workshop on the Task Force on Global Trade 2016 for their comments.


Abstract
In this paper, we examine the relevance of non-tariff measures (NTMs) at the 6-digit level of the
Harmonised System over the period 2002-2011 by estimating ad valorem equivalents. We draw on
information of NTMs notified to the WTO from the Integrated Trade Intelligence Portal (I-TIP),
distinguishing various NTM types, such as technical barriers to trade and sanitary and phytosanitary
measures. To assess whether NTMs facilitate or impede trade across countries we apply a gravity
approach, which allows calculating implied ad valorem equivalents of NTMs for about 100 WTO member
countries. Evidence of these AVEs is provided differentiated by NTM types, income groups, industries
and product categories.
Keywords: non-tariff measures, trade barriers, ad valorem equivalent, gravity model, I-TIP
JEL classification: F13, F14

CONTENTS
1. Introduction ...................................................................................................................................................... 1
2. The structure and evolution of non-tariff measures .................................................................... 3
3. Literature review ............................................................................................................................................ 7
4. Data and methodology ................................................................................................................................ 9
5. Empirical results ........................................................................................................................................... 12
5.1. AVEs by type of NTM .....................................................................................................................13
5.2. AVEs by importer ...........................................................................................................................14
5.3. AVEs by product ............................................................................................................................21
6. Robustness of our findings ..................................................................................................................... 24
6.1. The NTM sample ...........................................................................................................................24
6.2. Heckman results ............................................................................................................................25
7. Conclusion ...................................................................................................................................................... 27
References ................................................................................................................................................................... 28
Appendix ....................................................................................................................................................................... 31

TABLES AND FIGURES
Table 1 / Simple average AVEs and tariffs over all importer-product pairs .............................................. 13
Table 2 / Binding AVEs by EU Member State – extra-EU trade .............................................................. 16
Table 3 / Binding AVEs by region ............................................................................................................ 18
Table 4 / Binding AVEs by income level .................................................................................................. 19
Table 5 / Binding AVEs by BEC/WIOD classification ............................................................................... 23
Table 6 / Average AVEs over importers resulting from different NTM samples ....................................... 25
Table 7 / Average AVEs over importers resulting from Poisson and Heckman estimation ...................... 26
Figure 1 / NTM stock in 2011, by NTM type and product group ................................................................ 4
Figure 2 / NTM stock in 2011, by NTM type and income of imposing and affected countries ................... 5
Figure 3 / Evolution of annual notified NTMs entering into force by NTM type .......................................... 6
Figure 4 / Import-weighted binding AVEs of SPS measures, TBTs and STCs ........................................ 15
Figure 5 / NTMs and binding AVEs of imported products for SPS and TBT over income ....................... 21
Figure 6 / Simple average by section over country-specific import-weighted binding AVEs .................... 22
Appendix 1 / Distribution of AVEs over importer-product pairs by NTM type ........................................... 31
Appendix 2 / Binding AVEs of NTMs by importer and NTM type (simple averages) ............................... 32
Appendix 3 / Binding AVEs of NTMs by importer and NTM type (import-weighted averages) ................ 34
Appendix 4 / Simple average NTMs over income by NTM type ............................................................... 36
Appendix 5 / Simple average binding AVEs over income by NTM type ................................................... 37
Appendix 6 / Binding AVEs of NTMs by HS-2-digit product group (import-weighted) .............................. 38
Appendix 7 / Country sample by region ................................................................................................... 40
Appendix 8 / Country sample by income group ....................................................................................... 41
Appendix 9 / Description of HS sections .................................................................................................. 42
Appendix 10 / Procedure for the estimation of import demand elasticities .............................................. 43
Appendix Figure 1 / Import demand elasticity estimates over importer-product pairs ............................. 44
INTRODUCTION
1 Working Paper 129
1. Introduction
At least four developments have stimulated discussions on the use of non-tariff measures (NTMs) as
trade policy tools. First, while global average tariff rates have decreased by about half since the mid-
1990s, there is a general trend towards an increasing use of NTMs, provoking the question whether
NTMs might be implemented as substitutes for tariffs (e.g. Moore and Zanardi, 2011; Aisbett and
Pearson, 2012; Beverelli et al., 2014).
Second, particularly during the recent global economic and financial crisis, one observes an abrupt
increase in the number of NTMs notified to the World Trade Organisation (WTO), as is shown in
Section 2. Global trade expanded rapidly in the years before the crisis but has more or less stagnated in
the years since 2011, after having picked up again after the ‘great trade collapse’ in 2009. The sluggish
growth of world trade since then is spreading the fear of a rise of new protectionist schemes
(e.g. Baldwin and Evenett, 2009; UNCTAD, 2010; Kee et al., 2013) that dampen investment activities
and trade, thereby indirectly decelerating the economic recovery from the crisis.
Third, the number of trade agreements having been negotiated since the early 1990s – predominantly
bilateral free trade agreements – has increased tremendously. Yet, not only their number but also the
depth of their agendas has increased considerably (Dür et al., 2014) – shifting the focus away from
tariffs to issues of investment, dispute settlement and non-tariff measures.
Finally, standard setting and non-tariff measures feature prominently in negotiations of and public
discussion around the ‘Big 3’ megaregional deals: the Transatlantic Trade and Investment Partnership
(TTIP) between the EU and the US, the Transpacific Partnership (TPP) centred around the US, and the
Regional Comprehensive Economic Partnership (RCEP) including China (e.g. Egger et al., 2015;
Berden and Francois, 2015). As the negotiating trading partners account for about 80% of world GDP,
75% of world trade and more than 60% of the world population1, debates on global standard setting
(e.g. Hamilton and Pelkmans, 2015), the political economy of trade policy (e.g. Moore and Zanardi,
2011) and the risk of politics undermining multilateralism (e.g. Winters, 2015) are spurred.
Yet, non-tariff measures need not be non-tariff barriers. The impact of NTMs on trade can be negative or
positive. If NTMs increase fixed or variable costs along the production and supply chain, everything else
equal, they result in higher prices and potentially in a fall in import demand. For some NTM types, such
as quotas and prohibitions, the effect on trade is negative by design. However, for other NTM types,
such as sanitary and phytosanitary (SPS) measures and technical barriers to trade (TBTs), also a trade-
promoting effect can be expected. In particular, it is widely agreed that in the presence of information
asymmetries, the imposition of NTMs (e.g. labelling) can increase consumer trust, decrease transaction
costs and promote trade. Furthermore, some NTM types bear the potential of increasing product quality,
e.g. through a minimum quality standard, thereby positively affecting trade. Finally, the imposition of a
new NTM might contribute to a regional harmonisation of NTMs, fostering trade relations. To summarise,
1 The World Bank, ‘World Development Indicators’: http://databank.worldbank.org/data/home.aspx, wiiw calculation.

2 INTRODUCTION Working Paper 129
‘trade will increase or fall depending on whether the positive effect on demand is greater than the
negative effect on supply’ (WTO, 2012, p. 136).
Recently, a new research field has developed, trying to compare trade effects of NTMs with the impact
of tariffs by computing ad valorem equivalents of non-tariff measures. Many studies focus on the trade
effects for specific products, resulting from the imposition of a specific NTM for a group of countries
(e.g. Rickard and Lei, 2011; Nimenya, 2012; Arita et al., 2015). A few studies cover a wide range of
products and trading partners (e.g. Dean et al., 2009; Kee et al., 2009; Cadot and Gourdon, 2015).
However, to the best of our knowledge, none of the latest studies allows for a differentiation of importer-
specific effects across different NTM types.
NTMs differ greatly by their purpose and design. For example, measures targeting subsidised exports
differ strongly from measures establishing maximum residue limits of pesticides on agricultural products.
Likewise, the labelling requirement on the energy consumption level of manufactured goods cannot be
directly compared to import quotas. Given that about 40% of all imported products targeted by NTMs in
our sample are facing multiple NTM types, it seems to be particularly important to make a distinction
between the trade effects of different NTM types. Depending on the economic structure of the NTM
imposing country, we also expect the effects to differ by country. Goldberg and Pavcnik (2016) make the
point that the inability to measure different forms of non-tariff barriers that are replacing traditional trade
policy tools such as tariffs has contributed to the perception that trade policy does no longer matter.
This paper contributes to filling these gaps in the literature by using a rich data compilation of WTO
notifications. The WTO provides comprehensive data on NTM notifications via the Integrated Trade
Intelligence Portal (I-TIP). Ghodsi et al. (2016c) enhanced the value of this database for economic
analysis by matching missing product codes to these notifications. Drawing on this information, this
paper distinguishes between several categories of NTMs, with special attention given to the analysis of
sanitary and phytosanitary (SPS) measures and technical barriers to trade (TBTs), which account for
more than 80% of all NTM notifications to the WTO. Furthermore, working with this unique dataset
allows evaluating the trade effects of NTMs by means of an intensity measure, i.e. by counting how
many NTMs a specific importing country imposed against a trading partner for each product at the 6-digit
level of the Harmonised System (HS). Using this intensity measure, we estimate the impact of NTMs on
imports to the NTM-imposing country by means of a gravity framework. Allowing for both import-
promoting and import-impeding effects of NTMs, we calculate the ad valorem equivalent (AVE) of each
NTM type for each imposing country at the 6-digit product level of the Harmonised System over a
sample of 118 importers and 5,221 products for the period 2002-2011.
The remainder of this paper is structured as follows. Before delving into the literature and subsequent
analysis, Section 2 describes the NTM types entering our analysis as well as their evolution over time.
This shall give a better understanding of why effects of NTMs differ across studies depending on the
types of NTMs analysed. Sections 3 gives a brief overview of the literature. Section 4 describes the data
and methodology to estimate AVEs. Section 5 presents empirical results while section 6 discusses the
robustness of the findings. The final section concludes.
THE STRUCTURE AND EVOLUTION OF NON-TARIFF MEASURES
3 Working Paper 129
2. The structure and evolution of non-tariff measures
To capture the effects of NTMs, we make use of a rich data compilation of NTM notifications provided by
the WTO I-TIP covering 136 NTM imposing WTO members targeting 179 countries or territories. For our
analysis, we employ count variables, i.e. the number of NTMs in force per importing country, exporting
country, year and HS 6-digit product, for the following set of NTM types2:
(a) Sanitary and phytosanitary (SPS) measures aim at protecting human or animal life and include
e.g. regulations on maximum residue limits of substances such as insecticides and pesticides,
measures addressing the assessment of food safety regulations or labelling requirements. For
example, a bilateral SPS measure of the EU entered into force in June 2015, suspending imports of
dried beans from Nigeria due to pesticide residues at levels largely exceeding the reference dose
established by the European Food Safety Authority.3 However, one single notification may also
apply to all trading partners, such as the SPS measure of the EU that entered into force in January
2015, defining import rules for ovine embryos to prevent transmissible spongiform
encephalopathies.4 SPS measures mainly target product groups of the agri-food sector, i.e. live
animals, vegetables, prepared foodstuff and beverages.
(b) Technical barriers to trade (TBTs) are standards and regulations not covered by SPS measures,
such as standards on technical specifications of products and quality requirements. An example is
a TBT of the EU, in force since January 2016, that regulates the energy labelling of storage
cabinets including those used for refrigeration, with the stated aim of pulling the market towards
more environmentally friendly products by providing more information to end-users.5 TBTs also
apply to the agri-food sector, but largely to the manufacturing sector, especially to machinery and
electrical equipment. As we are going to show below, the number of notified SPS measures and
TBTs increased dramatically during the period under investigation.
(c) Antidumping measures (ADP), countervailing duties (CVD) and (special) safeguard ((S)SG)
measures are counteracting measures. By definition, they are only temporarily implemented to
counteract the negative effects resulting from increasing imports, associated with trade policies
considered as unfair. ADP is the most prominent counteracting measure, aiming at combating
(predatory) dumping practices that cause injury to the domestic industry of the importing country.
Countervailing duties target subsidised exports. Safeguard measures apply for a specific product
but for all exporters in order to facilitate the adjustment to the increased import influx for the
2 A detailed classification of types of NTMs, including examples, is provided by UNCTAD (2013): http://unctad.org/en/PublicationsLibrary/ditctab20122_en.pdf
3 WTO Document: G/SPS/N/EU/131, 29 June 2015 4 WTO Document: G/SPS/N/EU/67, 4 March 2014 5 WTO Document: G/TBT/N/EU/178, 28 January 2014
4 THE STRUCTURE AND EVOLUTION OF NON-TARIFF MEASURES Working Paper 129
importing country. In the following figures, we summarise countervailing duties and (special)
safeguards under the category of other counteracting measures (OCA) due to their small number.
(d) The last group of NTMs consists of the traditional ‘hard’ trade policy tools of quantitative
restrictions (QRS) such as licencing, quotas or prohibitions.
In addition, we look at specific trade concerns (STCs) raised by WTO members at the SPS and TBT
committees. These committees serve as platforms to discuss SPS measures and TBTs employed by
other WTO members. Questions usually relate to proposed measures notified to the WTO or to the
implementation of existing measures. If the reporting of NTMs to the WTO were complete, then we
would observe one SPS (or TBT) notification by the importing country for every STC relating to a SPS
measure (or TBT) raised by an exporting country and discussed in the SPS (or TBT) committee. These
SPS measures and TBTs could then be interpreted as the most stringent and probably most trade-
impeding NTMs. However, reporting is not complete, meaning that we find specific trade concerns
without matching measures reported by the importer, such that we include STCs as separate NTM
categories in our empirical analysis.
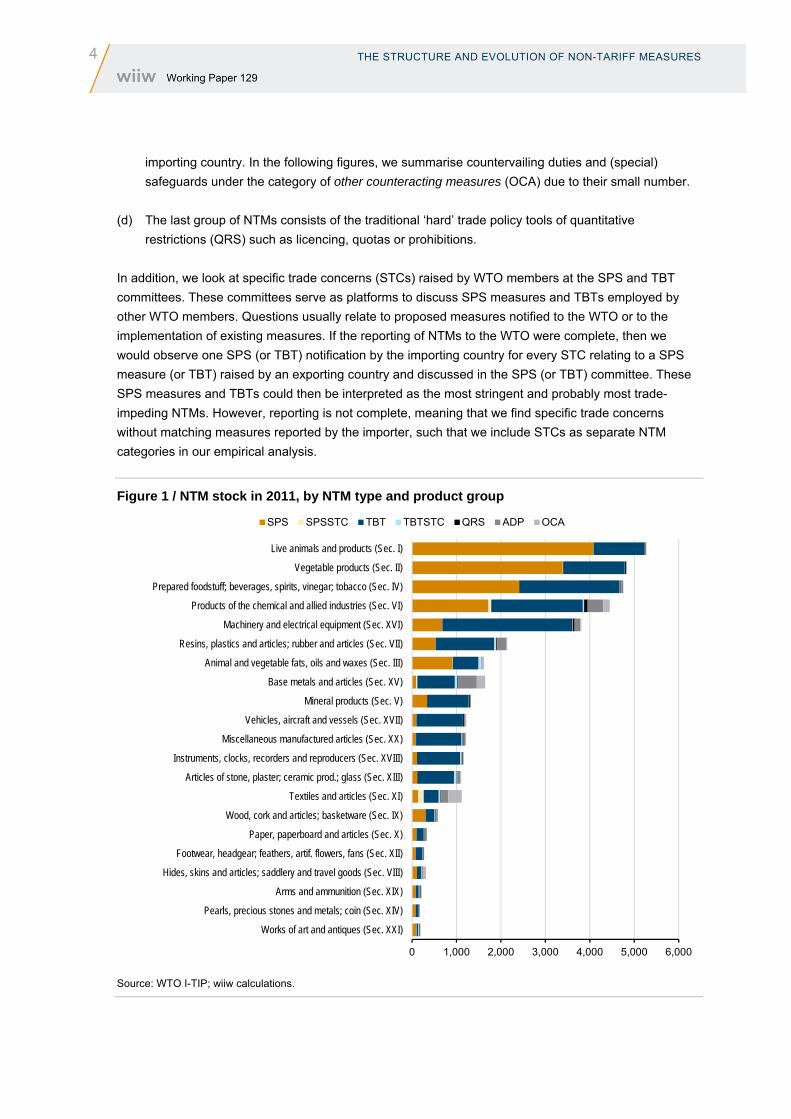
Figure 1 / NTM stock in 2011, by NTM type and product group
Source: WTO I-TIP; wiiw calculations.
0 1,000 2,000 3,000 4,000 5,000 6,000
Works of art and antiques (Sec. XXI)
Pearls, precious stones and metals; coin (Sec. XIV)
Arms and ammunition (Sec. XIX)
Hides, skins and articles; saddlery and travel goods (Sec. VIII)
Footwear, headgear; feathers, artif. flowers, fans (Sec. XII)
Paper, paperboard and articles (Sec. X)
Wood, cork and articles; basketware (Sec. IX)
Textiles and articles (Sec. XI)
Articles of stone, plaster; ceramic prod.; glass (Sec. XIII)
Instruments, clocks, recorders and reproducers (Sec. XVIII)
Miscellaneous manufactured articles (Sec. XX)
Vehicles, aircraft and vessels (Sec. XVII)
Mineral products (Sec. V)
Base metals and articles (Sec. XV)
Animal and vegetable fats, oils and waxes (Sec. III)
Resins, plastics and articles; rubber and articles (Sec. VII)
Machinery and electrical equipment (Sec. XVI)
Products of the chemical and allied industries (Sec. VI)
Prepared foodstuff; beverages, spirits, vinegar; tobacco (Sec. IV)
Vegetable products (Sec. II)
Live animals and products (Sec. I)
SPS SPSSTC TBT TBTSTC QRS ADP OCA
THE STRUCTURE AND EVOLUTION OF NON-TARIFF MEASURES
5 Working Paper 129
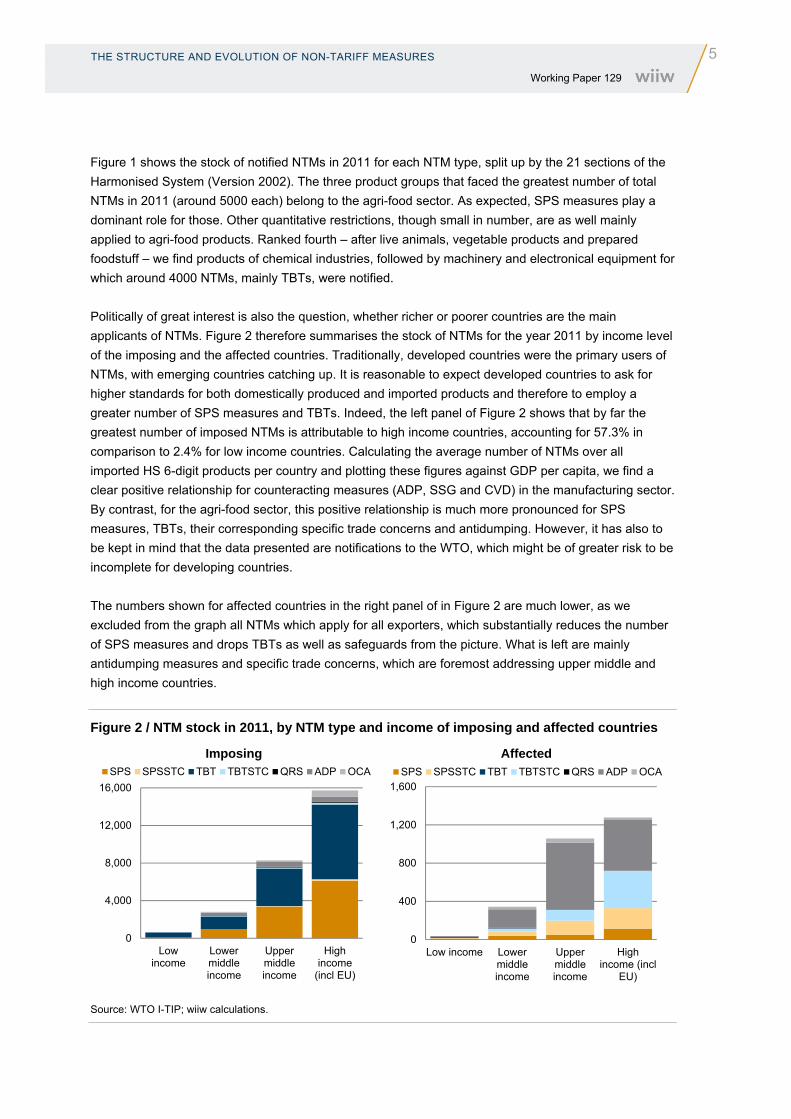
Figure 1 shows the stock of notified NTMs in 2011 for each NTM type, split up by the 21 sections of the
Harmonised System (Version 2002). The three product groups that faced the greatest number of total
NTMs in 2011 (around 5000 each) belong to the agri-food sector. As expected, SPS measures play a
dominant role for those. Other quantitative restrictions, though small in number, are as well mainly
applied to agri-food products. Ranked fourth – after live animals, vegetable products and prepared
foodstuff – we find products of chemical industries, followed by machinery and electronical equipment for
which around 4000 NTMs, mainly TBTs, were notified.
Politically of great interest is also the question, whether richer or poorer countries are the main
applicants of NTMs. Figure 2 therefore summarises the stock of NTMs for the year 2011 by income level
of the imposing and the affected countries. Traditionally, developed countries were the primary users of
NTMs, with emerging countries catching up. It is reasonable to expect developed countries to ask for
higher standards for both domestically produced and imported products and therefore to employ a
greater number of SPS measures and TBTs. Indeed, the left panel of Figure 2 shows that by far the
greatest number of imposed NTMs is attributable to high income countries, accounting for 57.3% in
comparison to 2.4% for low income countries. Calculating the average number of NTMs over all
imported HS 6-digit products per country and plotting these figures against GDP per capita, we find a
clear positive relationship for counteracting measures (ADP, SSG and CVD) in the manufacturing sector.
By contrast, for the agri-food sector, this positive relationship is much more pronounced for SPS
measures, TBTs, their corresponding specific trade concerns and antidumping. However, it has also to
be kept in mind that the data presented are notifications to the WTO, which might be of greater risk to be
incomplete for developing countries.
The numbers shown for affected countries in the right panel of in Figure 2 are much lower, as we
excluded from the graph all NTMs which apply for all exporters, which substantially reduces the number
of SPS measures and drops TBTs as well as safeguards from the picture. What is left are mainly
antidumping measures and specific trade concerns, which are foremost addressing upper middle and
high income countries.
Figure 2 / NTM stock in 2011, by NTM type and income of imposing and affected countries
Source: WTO I-TIP; wiiw calculations.
0
4,000
8,000
12,000
16,000
Lowincome
Lowermiddleincome
Uppermiddleincome
Highincome
(incl EU)
ImposingSPS SPSSTC TBT TBTSTC QRS ADP OCA
0
400
800
1,200
1,600
Low income Lowermiddleincome
Uppermiddleincome
Highincome (incl
EU)
AffectedSPS SPSSTC TBT TBTSTC QRS ADP OCA
6 THE STRUCTURE AND EVOLUTION OF NON-TARIFF MEASURES Working Paper 129
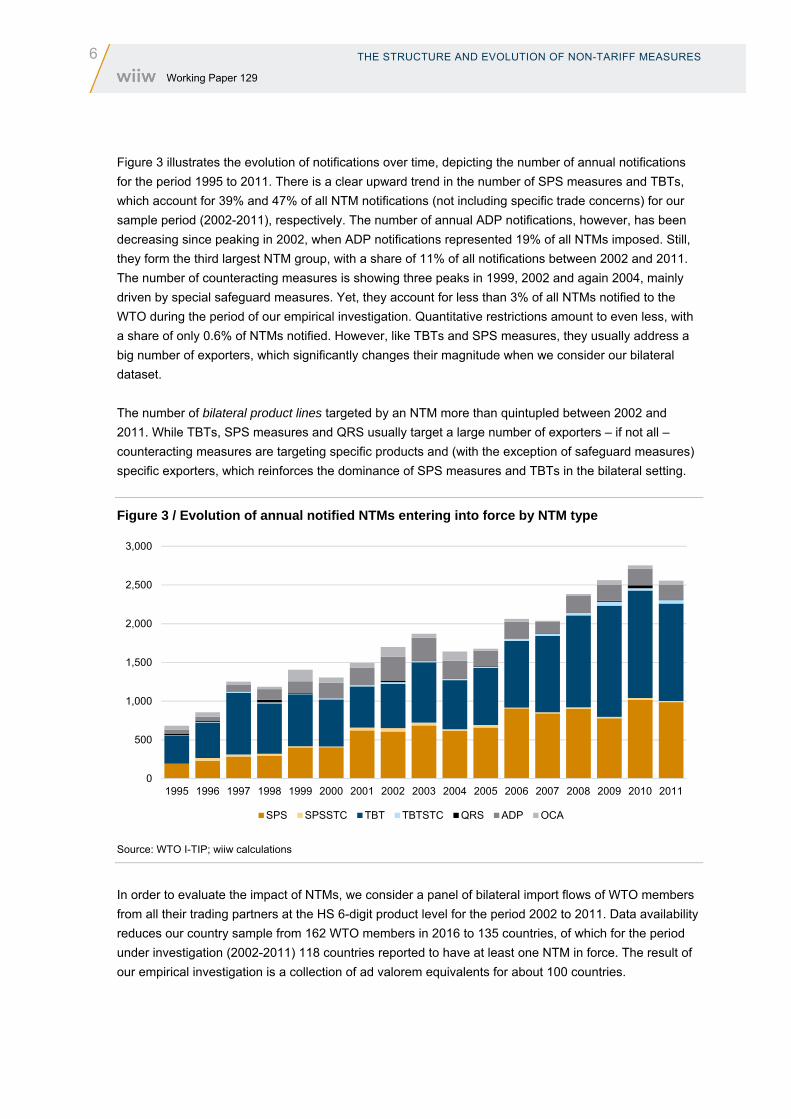
Figure 3 illustrates the evolution of notifications over time, depicting the number of annual notifications
for the period 1995 to 2011. There is a clear upward trend in the number of SPS measures and TBTs,
which account for 39% and 47% of all NTM notifications (not including specific trade concerns) for our
sample period (2002-2011), respectively. The number of annual ADP notifications, however, has been
decreasing since peaking in 2002, when ADP notifications represented 19% of all NTMs imposed. Still,
they form the third largest NTM group, with a share of 11% of all notifications between 2002 and 2011.
The number of counteracting measures is showing three peaks in 1999, 2002 and again 2004, mainly
driven by special safeguard measures. Yet, they account for less than 3% of all NTMs notified to the
WTO during the period of our empirical investigation. Quantitative restrictions amount to even less, with
a share of only 0.6% of NTMs notified. However, like TBTs and SPS measures, they usually address a
big number of exporters, which significantly changes their magnitude when we consider our bilateral
dataset.
The number of bilateral product lines targeted by an NTM more than quintupled between 2002 and
2011. While TBTs, SPS measures and QRS usually target a large number of exporters – if not all –
counteracting measures are targeting specific products and (with the exception of safeguard measures)
specific exporters, which reinforces the dominance of SPS measures and TBTs in the bilateral setting.
Figure 3 / Evolution of annual notified NTMs entering into force by NTM type
Source: WTO I-TIP; wiiw calculations
In order to evaluate the impact of NTMs, we consider a panel of bilateral import flows of WTO members
from all their trading partners at the HS 6-digit product level for the period 2002 to 2011. Data availability
reduces our country sample from 162 WTO members in 2016 to 135 countries, of which for the period
under investigation (2002-2011) 118 countries reported to have at least one NTM in force. The result of
our empirical investigation is a collection of ad valorem equivalents for about 100 countries.
0
500
1,000
1,500
2,000
2,500
3,000
1995 1996 1997 1998 1999 2000 2001 2002 2003 2004 2005 2006 2007 2008 2009 2010 2011
SPS SPSSTC TBT TBTSTC QRS ADP OCA
LITERATURE REVIEW
7 Working Paper 129
3. Literature review
The enormous speed with which NTMs spread as trade policy instruments is reflected in the fast
growing literature on their economic effects. Van Tongeren et al. (2009), Beghin et al. (2012) and Ghodsi
(2015b), for example, applied a partial equilibrium framework for analysing the impact of NTMs, but also
computable general equilibrium models have been recently used e.g. by Francois et al. (2011) for this
purpose. In order to assess the impact of NTMs on international trade, often a gravity estimation
approach is followed, e.g. by Essaji (2008), Disdier et al. (2008) and Ghodsi (2015a). Some authors
have analysed the substitutability of tariffs with NTMs and other trade policy instruments (Moore and
Zanardi, 2011; Aisbett and Pearson, 2013; and Ghodsi, 2016). However, NTMs are complex in nature
cannot be easily compared with tariffs.
A way to contrast the effects of NTMs on trade with the impact of tariffs on trade but also to render the
effects of different types of NTMs more comparable is to compute the ad valorem equivalents (AVEs) of
NTMs, capturing the impact of non-tariff measures on prices. Dean et al. (2009), Kee et al. (2009),
Beghin et al. (2014), Bratt (2014), or Cadot and Gourdon (2015) contributed to this branch of literature.
Ferrantino (2006) offers a detailed description of methods frequently used to quantify the effects of
NTMs on trade flows and prices by NTM type.
One method to calculate AVEs is to analyse the price wedge resulting from the implementation of NTMs,
applied e.g. by Dean et al. (2009), Rickard and Lei (2011), Nimenya et al. (2012) or Cadot and Gourdon
(2015). The amount of information necessary for this analysis restricts most of the papers to the analysis
of very few – mainly agricultural – products for a small set of countries. The papers by Dean et al. (2009)
and Cadot and Gourdon (2015) are rather rare exceptions. Another drawback of this method is that
domestic prices in the absence of NTMs are not observable. Therefore, domestic prices affected by
NTMs are often directly compared to international prices, neglecting the possible impact of differences in
product quality. Furthermore, NTMs occur at different stages along the supply chain, which makes a
comparison of different prices along the production and distribution chain (e.g. Cost, Insurance and
Freight (CIF), Delivered Duty Paid (DDP)) for a single product necessary. In the case of prohibitive
NTMs, no prices are observable at all.
The other branch of literature has been triggered by a contribution of Kee et al. (2009), who infer the
AVEs of NTMs indirectly in a two-step approach. They assess the impact of NTMs on the imports with a
gravity model. The results are then converted to AVEs using import demand elasticities, which are
estimated beforehand. The main advantage of the gravity approach in comparison to the price wedge
approach is that the former relies on trade data, which are more abundant at the disaggregated product
level than price data. In addition, it can be used for broad panel analysis, i.e. for a big set of countries
and products, with different NTMs evolving over time. Yet, the indirect approach has drawbacks too. Like
the price gap method, this approach does not distinguish the quality of domestic from foreign goods,
influencing the impact of NTMs. In addition, AVE calculations are based on import demand elasticities,
which are themselves estimates. Acknowledging the advantages and drawbacks of either approach, we
aim at contributing to the latter branch of literature.
8 LITERATURE REVIEW Working Paper 129
Kee et al. (2009) find that the average AVE of all products affected by NTMs is 45%, and 32% when
weighted by import values. Furthermore, they report a great variation of AVEs across products and
countries, with highest AVEs found for agricultural products and for low income countries in Africa.
Importantly, Kee et al. (2009) restricted their AVEs to be positive, i.e. by employing parameter
restrictions they forced all NTMs to have only import-restricting effects comparable to tariffs. However,
given market imperfections, NTMs can also serve to facilitate trade. Beghin et al. (2014) therefore, re-
estimate the gravity approach proposed by Kee et al. (2009) for standard-like NTMs for the years 2001
to 2003, allowing for positive and negative values of AVEs of NTMs. In their analysis, 12% of all
products at the HS 6-digit level were affected by technical regulations. Out of these, 39% exhibited
negative AVEs – i.e. an import-facilitating effect. Bratt (2014) concludes, that overall, NTMs impede
rather than facilitate trade, with a median AVE of 15.7%. However, 46.1% of all AVEs computed show a
positive effect on trade. Furthermore, he finds that the effects of NTMs are primarily driven by the NTM
imposing importing countries, where AVEs of NTMs are highest for low income countries for both
sectors. In addition, Bratt (2014) highlights that NTMs targeting the food sector are more import
restricting than NTMs in the manufacturing sector.
Previous calculations of AVEs of NTMs (Kee et al., 2009; Beghin et al., 2014 and Bratt, 2014) were
conducted on cross sectional data due to lack of information on and variation of NTMs. Having a rich
database on NTMs obtained from WTO I-TIP we are extending their approach to a panel analysis.
Moreover, and maybe most importantly, previous calculations were not distinguishing NTM types whose
diverse attributes by motives would bring various trade consequences. In this article, we differentiate
major categories of NTMs, which can provide better insights on the implications of the use of different
NTMs. In addition, the amount of applied NTMs was not considered in previous studies. Rather, the
existence of NTMs was captured by employing dummy variables. Our analysis is based on the intensity
of use of NTM types by counting the number of reported NTMs. Finally, we allow the effects of NTMs to
differ by the NTM imposing, i.e. importing, country.
DATA AND METHODOLOGY
9 Working Paper 129
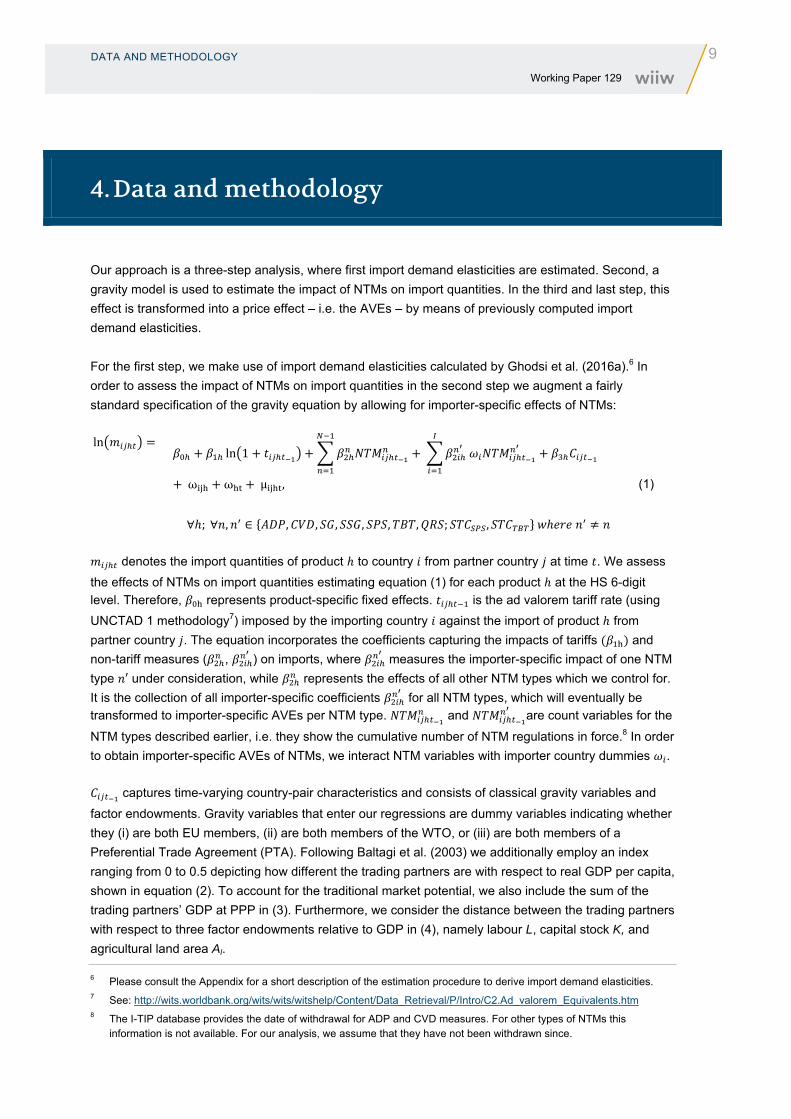
4. Data and methodology
Our approach is a three-step analysis, where first import demand elasticities are estimated. Second, a
gravity model is used to estimate the impact of NTMs on import quantities. In the third and last step, this
effect is transformed into a price effect – i.e. the AVEs – by means of previously computed import
demand elasticities.
For the first step, we make use of import demand elasticities calculated by Ghodsi et al. (2016a).6 In
order to assess the impact of NTMs on import quantities in the second step we augment a fairly
standard specification of the gravity equation by allowing for importer-specific effects of NTMs:
ln ln 1
ω ω μ ,
∀ ;∀ , ∈ , , , , , , ; ,
(1)
denotes the import quantities of product to country from partner country at time . We assess
the effects of NTMs on import quantities estimating equation (1) for each product at the HS 6-digit
level. Therefore, represents product-specific fixed effects. is the ad valorem tariff rate (using
UNCTAD 1 methodology7) imposed by the importing country against the import of product from
partner country . The equation incorporates the coefficients capturing the impacts of tariffs and
non-tariff measures ( , ) on imports, where measures the importer-specific impact of one NTM
type ′ under consideration, while represents the effects of all other NTM types which we control for.
It is the collection of all importer-specific coefficients for all NTM types, which will eventually be
transformed to importer-specific AVEs per NTM type. and are count variables for the
NTM types described earlier, i.e. they show the cumulative number of NTM regulations in force.8 In order
to obtain importer-specific AVEs of NTMs, we interact NTM variables with importer country dummies .
captures time-varying country-pair characteristics and consists of classical gravity variables and
factor endowments. Gravity variables that enter our regressions are dummy variables indicating whether
they (i) are both EU members, (ii) are both members of the WTO, or (iii) are both members of a
Preferential Trade Agreement (PTA). Following Baltagi et al. (2003) we additionally employ an index
ranging from 0 to 0.5 depicting how different the trading partners are with respect to real GDP per capita,
shown in equation (2). To account for the traditional market potential, we also include the sum of the
trading partners’ GDP at PPP in (3). Furthermore, we consider the distance between the trading partners
with respect to three factor endowments relative to GDP in (4), namely labour L, capital stock K, and
agricultural land area Al.
6 Please consult the Appendix for a short description of the estimation procedure to derive import demand elasticities. 7 See: http://wits.worldbank.org/wits/wits/witshelp/Content/Data_Retrieval/P/Intro/C2.Ad_valorem_Equivalents.htm 8 The I-TIP database provides the date of withdrawal for ADP and CVD measures. For other types of NTMs this
information is not available. For our analysis, we assume that they have not been withdrawn since.
10 DATA AND METHODOLOGY Working Paper 129
, ∈ 0, 0.5 (2)
ln (3)
, ∈ , , (4)
Instead of employing time-invariant country-pair variables (e.g. indicating distance, whether countries
are adjacent, share a common language, or exhibit a common colonial history) we make use of country-
pair fixed effects . Finally, we include time fixed effects to abstract the effects of large-scale
economic shocks that influence all trading partners, such as the global financial and economic crisis.
Moreover, robust estimator clustering by country-pair-product is used to control for the shocks resulting
in a heteroskedastic error term .
Explanatory variables are lagged by one period for two reasons: First, we expect that it takes time for
demand to react to policy changes, which seems particularly reasonable for intermediate products.
Second, some NTM types such as antidumping or countervailing duties are by nature counteractive,
i.e. they only apply when imports are already strongly increasing. Therefore, not accounting for a lag
would result in a strong endogeneity bias by measuring the import-increasing effect (e.g. associated with
dumping or export subsidies) rather than the effect of the counteracting NTM. In general, if imports react
to the imposition of NTMs, but also NTMs are imposed in response to changes in imports, we are facing
an endogeneity problem. By lagging the policy variables by one period we expect the endogeneity bias
to be substantially reduced.
We make use of the Poisson maximum likelihood estimator suggested by Santos Silva and Tenreyro
(2006), which can be applied to import levels and is a robust approach in the presence of
heteroscedasticity. Results obtained from a two-step Heckman procedure to account for the possibility
that zero trade flows in our data are the result of firm’s decisions not to export for reasons we do not
observe are reported in Section 6.
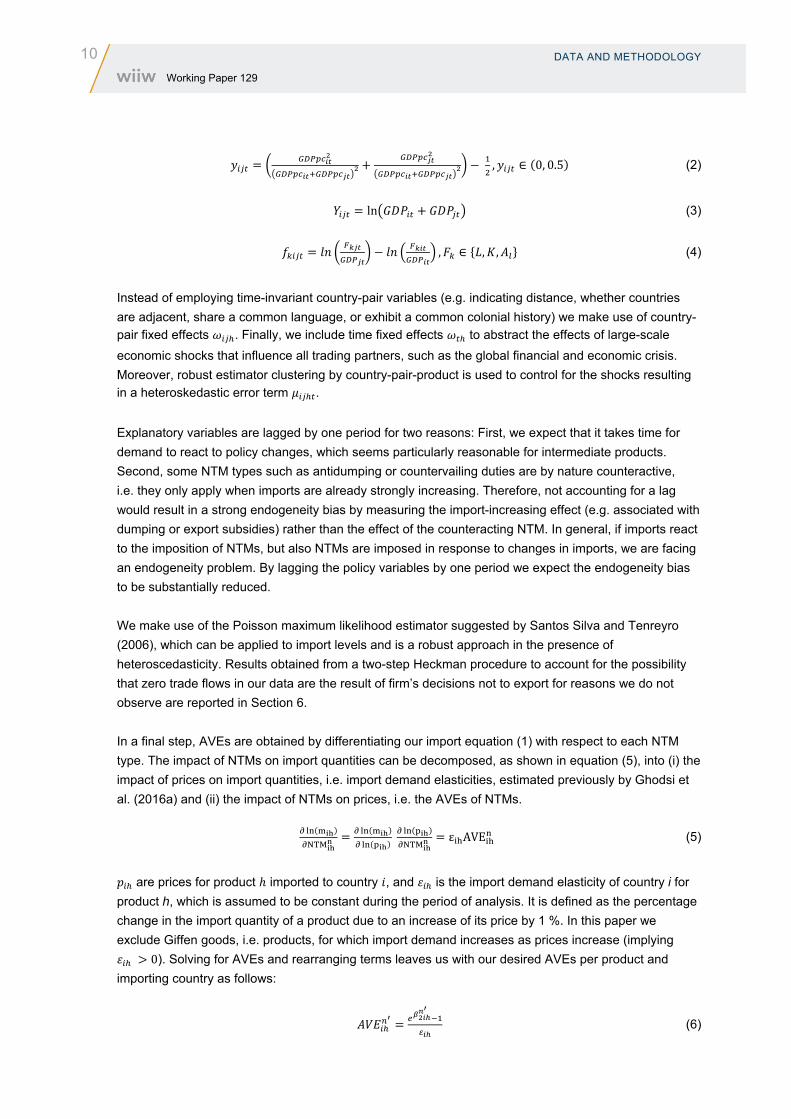
In a final step, AVEs are obtained by differentiating our import equation (1) with respect to each NTM
type. The impact of NTMs on import quantities can be decomposed, as shown in equation (5), into (i) the
impact of prices on import quantities, i.e. import demand elasticities, estimated previously by Ghodsi et
al. (2016a) and (ii) the impact of NTMs on prices, i.e. the AVEs of NTMs.
ε AVE (5)
are prices for product imported to country , and is the import demand elasticity of country i for
product h, which is assumed to be constant during the period of analysis. It is defined as the percentage
change in the import quantity of a product due to an increase of its price by 1 %. In this paper we
exclude Giffen goods, i.e. products, for which import demand increases as prices increase (implying
0). Solving for AVEs and rearranging terms leaves us with our desired AVEs per product and
importing country as follows:
(6)

DATA AND METHODOLOGY
11 Working Paper 129
At the heart of our dataset are the NTM notifications to the WTO provided via the WTO I-TIP database,
complemented by Ghodsi et al. (2016c) by imputing a large number of HS 6-digit product codes for two
thirds of the notifications with missing HS codes (see description in Section 2). Import data were taken
from the Commodity Trade Statistics Database (COMTRADE) and complemented by the Trade Analysis
Information System (TRAINS) database. We consider ad valorem tariffs at the HS 6-digit level from
TRAINS and the WTO Integrated Data Base (IDB) provided by the World Integrated Trade Solutions
(WITS) platform. The data gathering on tariffs followed a three-step choice rule: Whenever available,
preferential rates were considered. When this information was not given or not applicable, the most-
favoured-nation tariff rates entered our set. Lastly, we used data on the effectively applied tariff rates.
Data on factor endowments (labour force and capital stock) as well as GDP were retrieved from the
Penn World Tables (PWT 8.0); see Feenstra et al. (2013 and 2015). The last update of the PWT 8.0
included data up to 2011, which constrained our analysis to the period 2002 to 2011. Information on
agricultural land was taken from the World Development Indicators (WDI) database of the World Bank.
CEPII provides data on commonly used gravity variables as mentioned above. Finally, we borrow a data
compilation for Preferential Trade Agreements (PTAs) as reported by the WTO.
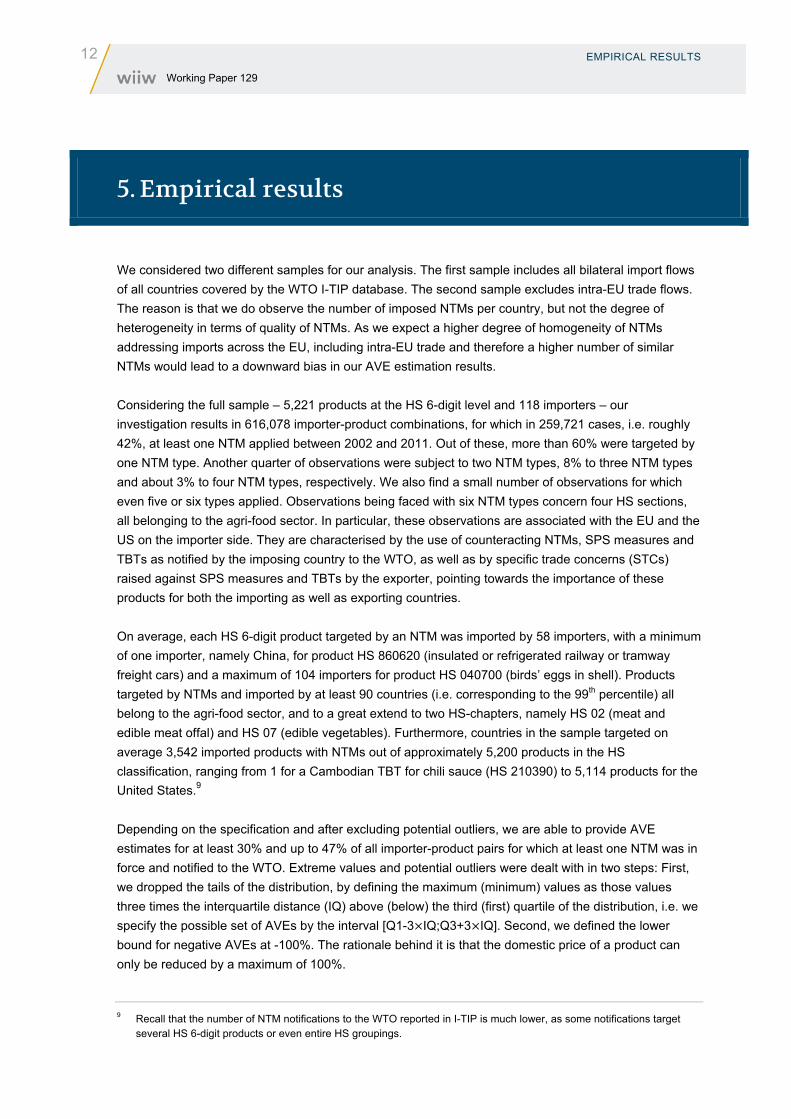
12 EMPIRICAL RESULTS Working Paper 129
5. Empirical results
We considered two different samples for our analysis. The first sample includes all bilateral import flows
of all countries covered by the WTO I-TIP database. The second sample excludes intra-EU trade flows.
The reason is that we do observe the number of imposed NTMs per country, but not the degree of
heterogeneity in terms of quality of NTMs. As we expect a higher degree of homogeneity of NTMs
addressing imports across the EU, including intra-EU trade and therefore a higher number of similar
NTMs would lead to a downward bias in our AVE estimation results.
Considering the full sample – 5,221 products at the HS 6-digit level and 118 importers – our
investigation results in 616,078 importer-product combinations, for which in 259,721 cases, i.e. roughly
42%, at least one NTM applied between 2002 and 2011. Out of these, more than 60% were targeted by
one NTM type. Another quarter of observations were subject to two NTM types, 8% to three NTM types
and about 3% to four NTM types, respectively. We also find a small number of observations for which
even five or six types applied. Observations being faced with six NTM types concern four HS sections,
all belonging to the agri-food sector. In particular, these observations are associated with the EU and the
US on the importer side. They are characterised by the use of counteracting NTMs, SPS measures and
TBTs as notified by the imposing country to the WTO, as well as by specific trade concerns (STCs)
raised against SPS measures and TBTs by the exporter, pointing towards the importance of these
products for both the importing as well as exporting countries.
On average, each HS 6-digit product targeted by an NTM was imported by 58 importers, with a minimum
of one importer, namely China, for product HS 860620 (insulated or refrigerated railway or tramway
freight cars) and a maximum of 104 importers for product HS 040700 (birds’ eggs in shell). Products
targeted by NTMs and imported by at least 90 countries (i.e. corresponding to the 99th percentile) all
belong to the agri-food sector, and to a great extend to two HS-chapters, namely HS 02 (meat and
edible meat offal) and HS 07 (edible vegetables). Furthermore, countries in the sample targeted on
average 3,542 imported products with NTMs out of approximately 5,200 products in the HS
classification, ranging from 1 for a Cambodian TBT for chili sauce (HS 210390) to 5,114 products for the
United States.9
Depending on the specification and after excluding potential outliers, we are able to provide AVE
estimates for at least 30% and up to 47% of all importer-product pairs for which at least one NTM was in
force and notified to the WTO. Extreme values and potential outliers were dealt with in two steps: First,
we dropped the tails of the distribution, by defining the maximum (minimum) values as those values
three times the interquartile distance (IQ) above (below) the third (first) quartile of the distribution, i.e. we
specify the possible set of AVEs by the interval [Q1-3 IQ;Q3+3 IQ]. Second, we defined the lower
bound for negative AVEs at -100%. The rationale behind it is that the domestic price of a product can
only be reduced by a maximum of 100%.
9 Recall that the number of NTM notifications to the WTO reported in I-TIP is much lower, as some notifications target several HS 6-digit products or even entire HS groupings.
EMPIRICAL RESULTS
13 Working Paper 129
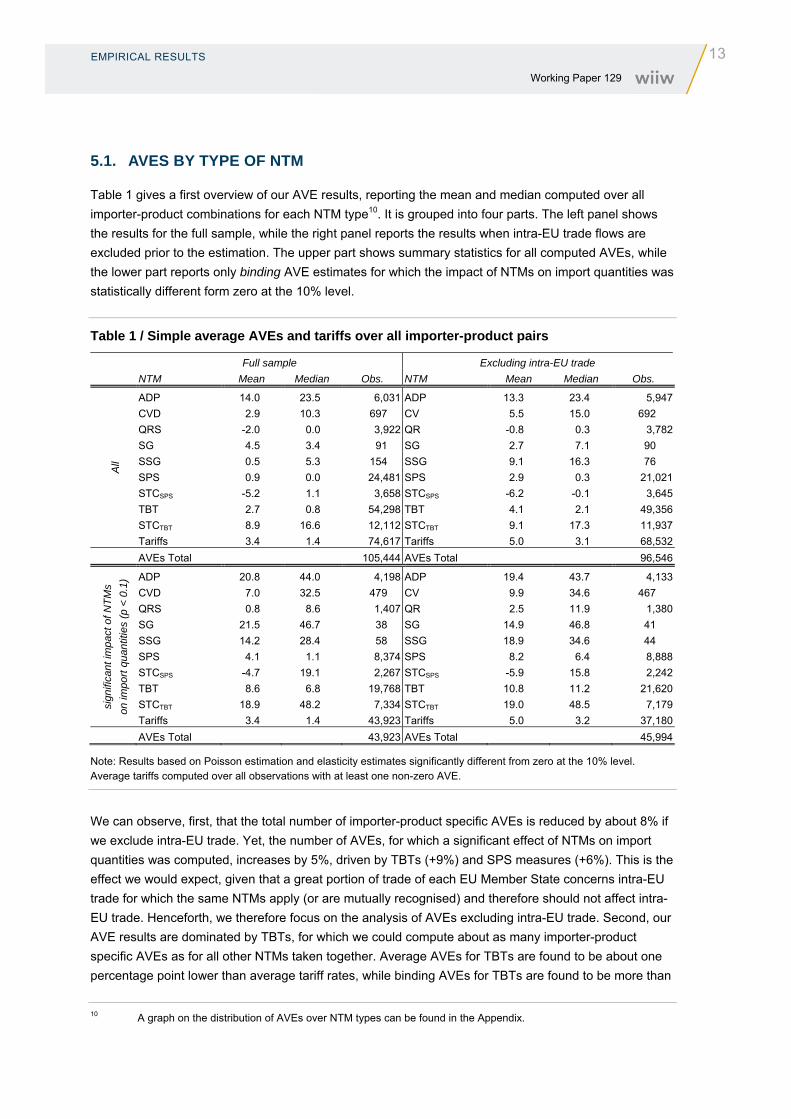
5.1. AVES BY TYPE OF NTM
Table 1 gives a first overview of our AVE results, reporting the mean and median computed over all
importer-product combinations for each NTM type10. It is grouped into four parts. The left panel shows
the results for the full sample, while the right panel reports the results when intra-EU trade flows are
excluded prior to the estimation. The upper part shows summary statistics for all computed AVEs, while
the lower part reports only binding AVE estimates for which the impact of NTMs on import quantities was
statistically different form zero at the 10% level.
Table 1 / Simple average AVEs and tariffs over all importer-product pairs
Full sample Excluding intra-EU trade
NTM Mean Median Obs. NTM Mean Median Obs.
All
ADP 14.0 23.5 6,031 ADP 13.3 23.4 5,947
CVD 2.9 10.3 697 CV 5.5 15.0 692
QRS -2.0 0.0 3,922 QR -0.8 0.3 3,782
SG 4.5 3.4 91 SG 2.7 7.1 90
SSG 0.5 5.3 154 SSG 9.1 16.3 76
SPS 0.9 0.0 24,481 SPS 2.9 0.3 21,021
STCSPS -5.2 1.1 3,658 STCSPS -6.2 -0.1 3,645
TBT 2.7 0.8 54,298 TBT 4.1 2.1 49,356
STCTBT 8.9 16.6 12,112 STCTBT 9.1 17.3 11,937
Tariffs 3.4 1.4 74,617 Tariffs 5.0 3.1 68,532
AVEs Total 105,444 AVEs Total 96,546
sign
ifica
nt im
pact
of N
TM
s
on im
port
qua
ntiti
es (
p <
0.1
) ADP 20.8 44.0 4,198 ADP 19.4 43.7 4,133
CVD 7.0 32.5 479 CV 9.9 34.6 467
QRS 0.8 8.6 1,407 QR 2.5 11.9 1,380
SG 21.5 46.7 38 SG 14.9 46.8 41
SSG 14.2 28.4 58 SSG 18.9 34.6 44
SPS 4.1 1.1 8,374 SPS 8.2 6.4 8,888
STCSPS -4.7 19.1 2,267 STCSPS -5.9 15.8 2,242
TBT 8.6 6.8 19,768 TBT 10.8 11.2 21,620
STCTBT 18.9 48.2 7,334 STCTBT 19.0 48.5 7,179
Tariffs 3.4 1.4 43,923 Tariffs 5.0 3.2 37,180
AVEs Total 43,923 AVEs Total 45,994
Note: Results based on Poisson estimation and elasticity estimates significantly different from zero at the 10% level. Average tariffs computed over all observations with at least one non-zero AVE.
We can observe, first, that the total number of importer-product specific AVEs is reduced by about 8% if
we exclude intra-EU trade. Yet, the number of AVEs, for which a significant effect of NTMs on import
quantities was computed, increases by 5%, driven by TBTs (+9%) and SPS measures (+6%). This is the
effect we would expect, given that a great portion of trade of each EU Member State concerns intra-EU
trade for which the same NTMs apply (or are mutually recognised) and therefore should not affect intra-
EU trade. Henceforth, we therefore focus on the analysis of AVEs excluding intra-EU trade. Second, our
AVE results are dominated by TBTs, for which we could compute about as many importer-product
specific AVEs as for all other NTMs taken together. Average AVEs for TBTs are found to be about one
percentage point lower than average tariff rates, while binding AVEs for TBTs are found to be more than
10 A graph on the distribution of AVEs over NTM types can be found in the Appendix.
14 EMPIRICAL RESULTS Working Paper 129
twice as large as average tariffs. Third, AVEs differ greatly between NTM types, with the highest
average AVEs found for antidumping measures, followed – with some distance – by TBTs for which
specific trade concerns were raised (STCTBT) and safeguard measures. Fourth, overall AVEs show
positive mean and median values, pointing towards an overall import-impeding effect of NTMs. It has to
be kept in mind, though, that counteracting measures are designed to reduce imports. By contrast, SPS
measures and TBTs might be (mis-)used as (discriminatory) trade policy tools but primarily aim at
improving the quality of products, packaging or the information provided to consumers. Positive AVEs for
SPS measures and TBTs therefore not only indicate import-restricting effects but in addition point
towards possible quality-increasing effects of NTMs.
A split up in positive and negative AVEs reveals that we find 27% more positive AVEs than negative
ones, i.e. the share of negative AVEs is roughly 45%. Restricting our view to only binding AVEs, the
share of negative AVEs reduces to below 40%. This finding is in line with recent literature allowing for
positive and negative AVEs. Beghin et al. (2014) and Bratt (2014), who amended the approach of Kee et
al. (2009), find trade-facilitating effects for 39% and 46% of all product lines affected by NTMs,
respectively.
In order to derive policy relevant implications we continue our analysis by exploring AVEs by importer,
location and income as well as by product according to the Harmonised System (HS) and broad
economic categories (BEC).
5.2. AVES BY IMPORTER
Different countries apply different types of NTMs. Even the same NTM type can have an import-
promoting effect for one country and an import-impeding effect for another. On the one hand, the
average AVE per NTM for one specific importer can be influenced by the purpose and quality of the
NTM measure imposed. On the other hand, it is influenced by the structure of imports, i.e. the product
mix and the trading partners: First, depending on the structure of the domestic industry, imports of a
specific product can be substitutes or complements to domestic production, which influences the impact
of NTMs. Second, not every country imports every product. For example, as we shall later show, our
analysis reveals high AVEs for arms and ammunition. If some countries do not import arms and
ammunition, their average AVEs are, ceteris paribus, lower than those of countries that do import arms
and ammunition.
In the following, we often summarise AVEs for countervailing duties and (special) safeguards under the
heading ‘other counteracting measures’ (OCA) as they are all measures reacting to a high import influx
and – as reported Table 1 – are small in numbers. In addition, we aggregate AVEs for specific trade
concerns on SPS measures and TBTs under the terms STC for reasons of readability.
As SPS measures and TBTs are the predominant NTMs in our data and form the heart of ongoing
political discussions, specifically with respect to the formation of deep mega-regional trade agreements
such as the Transatlantic Trade and Investment Partnership (TTIP) and the Trans-Pacific Partnership
(TPP), we first restrict our attention to the analysis of AVEs computed for these measures. Figure 4
EMPIRICAL RESULTS
15 Working Paper 129
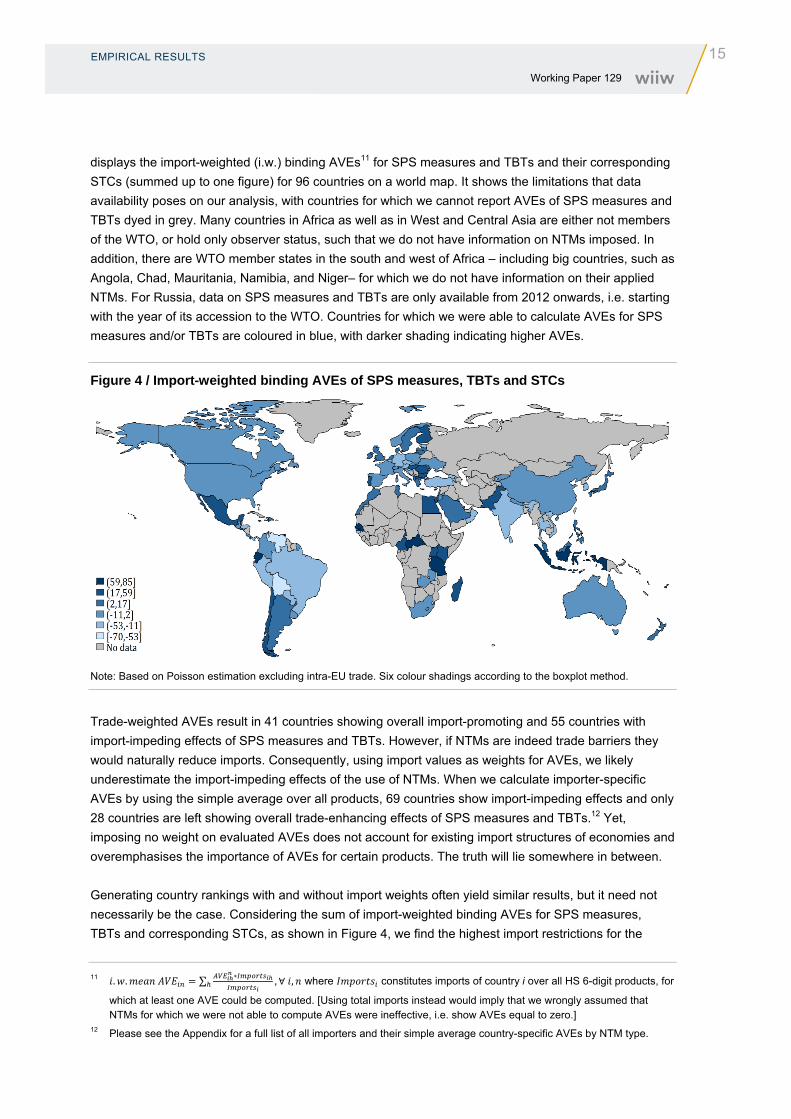
displays the import-weighted (i.w.) binding AVEs11 for SPS measures and TBTs and their corresponding
STCs (summed up to one figure) for 96 countries on a world map. It shows the limitations that data
availability poses on our analysis, with countries for which we cannot report AVEs of SPS measures and
TBTs dyed in grey. Many countries in Africa as well as in West and Central Asia are either not members
of the WTO, or hold only observer status, such that we do not have information on NTMs imposed. In
addition, there are WTO member states in the south and west of Africa – including big countries, such as
Angola, Chad, Mauritania, Namibia, and Niger– for which we do not have information on their applied
NTMs. For Russia, data on SPS measures and TBTs are only available from 2012 onwards, i.e. starting
with the year of its accession to the WTO. Countries for which we were able to calculate AVEs for SPS
measures and/or TBTs are coloured in blue, with darker shading indicating higher AVEs.
Figure 4 / Import-weighted binding AVEs of SPS measures, TBTs and STCs
Note: Based on Poisson estimation excluding intra-EU trade. Six colour shadings according to the boxplot method.
Trade-weighted AVEs result in 41 countries showing overall import-promoting and 55 countries with
import-impeding effects of SPS measures and TBTs. However, if NTMs are indeed trade barriers they
would naturally reduce imports. Consequently, using import values as weights for AVEs, we likely
underestimate the import-impeding effects of the use of NTMs. When we calculate importer-specific
AVEs by using the simple average over all products, 69 countries show import-impeding effects and only
28 countries are left showing overall trade-enhancing effects of SPS measures and TBTs.12 Yet,
imposing no weight on evaluated AVEs does not account for existing import structures of economies and
overemphasises the importance of AVEs for certain products. The truth will lie somewhere in between.
Generating country rankings with and without import weights often yield similar results, but it need not
necessarily be the case. Considering the sum of import-weighted binding AVEs for SPS measures,
TBTs and corresponding STCs, as shown in Figure 4, we find the highest import restrictions for the
11 . . ∑ ∗, ∀ , where constitutes imports of country i over all HS 6-digit products, for
which at least one AVE could be computed. [Using total imports instead would imply that we wrongly assumed that NTMs for which we were not able to compute AVEs were ineffective, i.e. show AVEs equal to zero.]
12 Please see the Appendix for a full list of all importers and their simple average country-specific AVEs by NTM type.

16 EMPIRICAL RESULTS Working Paper 129
Central African Republic, Ecuador and Indonesia. Romania, Bulgaria and Finland are the EU Member
States that can be found within the top 20. Yet, the majority of EU members is found halfway down the
list. We find the lowest average AVE for SPS measures, TBTs and their corresponding STCs for Bolivia,
Barbados and Venezuela. Germany is ranked 5th after Turkey. Also Croatia13, the Czech Republic and
Estonia can be found among the top 20.
Table 2 / Binding AVEs by EU Member State – extra-EU trade
Simple Averages Import-weighted Avg.
Rk. Importer ISO2 Accession SPS TBT STC SPS TBT STC
16 Austria AT 1995 0.9 2.8 14.5 1.0 -8.1 -5.5
20 Belgium BE 1958 0.3 3.4 11.3 -3.1 -3.8 -5.6
9 Bulgaria BG 2007 7.3 11.9 19.4 -1.1 6.9 20.6
3 Cyprus CY 2004 7.8 16.5 40.9 1.2 14.9 1.2
12 Czech Republic CZ 2004 6.9 7.0 12.0 0.3 -0.1 -16.3
10 Denmark DK 1973 1.6 8.2 26.3 0.9 5.9 8.5
17 Estonia EE 2004 6.6 8.8 2.6 3.3 1.7 -18.2
6 Finland FI 1995 6.8 14.5 26.7 1.2 12.0 10.4
25 France FR 1958 -0.6 0.6 5.7 -0.4 -5.1 -2.7
27 Germany DE 1958 -2.9 -1.4 -1.3 -1.7 -12.2 -19.3
4 Greece EL 1981 9.3 11.4 42.5 0.7 5.4 7.0
7 Hungary HU 2004 7.1 10.3 29.0 0.9 12.7 6.9
21 Ireland IE 1973 3.1 8.2 3.2 0.9 2.7 7.4
14 Italy IT 1958 1.0 4.5 15.8 0.4 3.0 -10.0
5 Latvia LV 2004 9.6 12.0 31.3 0.2 2.5 2.5
8 Lithuania LT 2004 8.7 12.1 21.6 1.5 2.6 2.0
13 Luxembourg LU 1958 10.1 3.8 11.2 -1.2 -3.0 -7.5
1 Malta MT 2004 9.5 16.4 59.0 0.9 2.2 19.2
23 Netherlands NL 1958 -1.3 2.0 11.5 -0.8 -0.8 5.3
24 Poland PL 2004 2.4 3.9 5.3 -1.2 -0.1 -4.5
26 Portugal PT 1986 2.1 2.8 -0.3 -0.2 9.1 11.4
2 Romania RO 2007 14.8 8.9 52.5 2.2 10.4 29.3
11 Slovakia SK 2004 14.7 10.0 10.6 0.8 -2.2 -7.1
19 Slovenia SI 2004 8.8 3.4 3.8 0.8 -1.5 -5.3
15 Spain ES 1986 0.2 4.2 14.8 0.5 5.5 -4.9
22 Sweden SE 1995 0.8 2.3 11.4 -0.6 -1.2 4.1
18 United Kingdom UK 1973 4.6 5.1 6.7 2.0 2.8 8.6
Note: Excludes Croatia from the list, as the analysis refers to pre-Croatian accession to the EU. Results based on Poisson estimation excluding intra-EU trade. The ranking (Rk.) is based on simple averages over binding AVEs for SPS and TBT. i.w. refers to import-weighted averages.
In light of ongoing trade negotiations at the European level, it is worth exploring how heterogeneous EU
members are with respect to NTMs. If we rank EU members from 1 to 27, with 1 indicating the highest
AVEs and 27 representing the lowest AVEs, we find that the rankings are very similar when using simple
averages over all products, or when computing simple averages only over products significantly affected
by AVEs. In these two cases, the ‘new’ EU-12 Member States that acceded to the EU in 2004 and 2007
13 Croatia does not feature as an EU member country within our analysis (as it acceded to the EU in 2013 while our analysis is restricted to 2011). Therefore, trade between Croatia and the EU is not excluded from our econometric analysis. In the run up to accession and specifically after signing the Stabilisation and Association Agreement in late 2001, Croatia’s NTMs might have adapted to standards of the EU, which in 2012 was Croatia’s main trading partner absorbing more than 60% of its exports.
EMPIRICAL RESULTS
17 Working Paper 129
appear more trade restrictive than the ‘old’ EU-15 Member States, with Malta, Romania and Cyprus
representing the Top 3, while the Bottom 3 is formed by EU-15 Member States, namely Germany,
Portugal and France. If we impose import weights, we still find Malta and Romania among the Top 5, but
also Finland with relatively high AVEs for TBTs. At the end of the list, we again find Germany, this time
followed by the Czech Republic and Estonia. When employing import weights, quite some EU-15
members drift towards the centre, e.g. Ireland and the UK, with Slovenia and Slovakia instead taking
their place.
Why can AVEs among EU member countries differ? The reasons can be manifold. First, EU Member
States indeed differ by the NTMs they employ. Looking at the number of notifications to the WTO in
force by 31 May 2015, we find that the share of the sum of notifications of individual EU Member States
in per cent of NTMs notified by the EU is close to 5% for SPS measures and 62% for TBTs. EU-12
countries account for 17% and 40%, respectively. There are no national NTMs notified for quantitative
restrictions, antidumping and countervailing duties. However, there are more than eight times as many
national safeguard measures in place, compared to safeguards notified by the EU. All these notifications
by individual EU Member States are attributable to EU-12 members.
Second, countries differ by their economic structure and trade relations, i.e. by the product mix that they
import and their trading partners, which can be driven among other reasons by historical ties, the
integration in global value chains or heterogeneous preferences of consumers across the EU. In this
paper, we are not going to unravel the Pandora box of intra-EU differences in AVEs. However, we will
shed light on how AVEs differ by products, product groups and the use of products as intermediates,
consumption goods or gross fixed capital goods in Section 5.3.
In order to evaluate the global impact of NTMs, we aggregate our country-based AVE results according
to their regional affiliation as laid out in the list of economies provided by the World Bank14, which
comprises 215 countries. The share of each region, in terms of number of countries according to the
World Bank’s list, resembles the shares of our country sample composition – with the exception that we
include a greater proportion of countries in Europe and Central Asia and fewer countries from Sub-
Saharan Africa due to data limitations in our NTM data as previously mentioned. Our sample of 118
countries is composed of 39 countries in Europe and Central Asia, Canada and the United States in
North America and 26 countries in Latin America and the Caribbean. Seventeen countries belong to the
region East Asia and Pacific and another four –including India – to South Asia. From the Middle East
and North Africa, our sample includes 12 countries and 18 countries from Sub-Saharan Africa. Out of
118 countries in total, we were able to compute binding importer-specific AVEs for 98 countries.
Unfortunately, 8 out of the remaining 20 countries belong to Sub-Saharan Africa, reducing the region as
reported in Table 3 to 10 countries. Keeping the over-representation of European and Central Asian
economies and under-representation of Sub-Saharan African countries in mind, we continue to
elaborate patterns of the effects of NTMs by region.
Let us refer to the upper panel of Table 3 as the ‘product panel’. It shows results if we calculate the
simple average over all country-specific AVEs, which by themselves constitute simple averages over all
traded HS 6-digit products per country. That is, within each country, every product has equal weight,
independent from its actual economic importance. It might therefore be regarded as the upper bound of
14 Please refer to Appendix 7 and Appendix 8 for the categorisation of our country sample according to the World Bank List of Economies (July 2015).
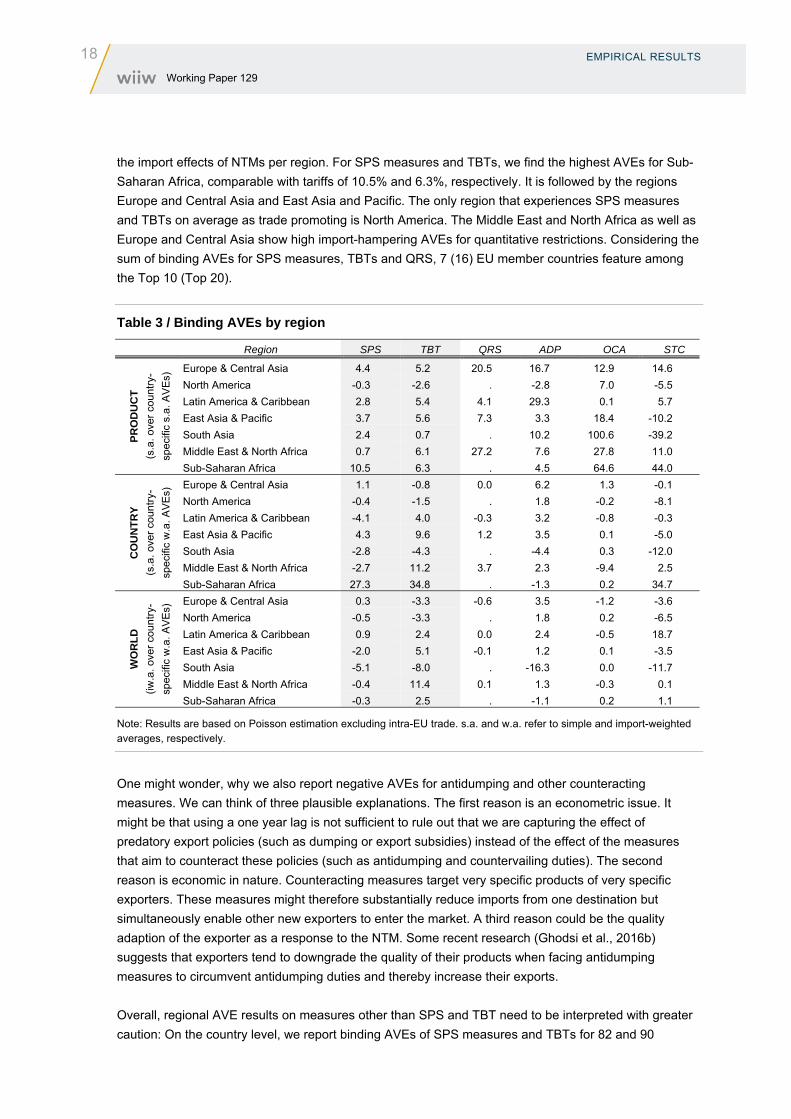
18 EMPIRICAL RESULTS Working Paper 129
the import effects of NTMs per region. For SPS measures and TBTs, we find the highest AVEs for Sub-
Saharan Africa, comparable with tariffs of 10.5% and 6.3%, respectively. It is followed by the regions
Europe and Central Asia and East Asia and Pacific. The only region that experiences SPS measures
and TBTs on average as trade promoting is North America. The Middle East and North Africa as well as
Europe and Central Asia show high import-hampering AVEs for quantitative restrictions. Considering the
sum of binding AVEs for SPS measures, TBTs and QRS, 7 (16) EU member countries feature among
the Top 10 (Top 20).
Table 3 / Binding AVEs by region
Region SPS TBT QRS ADP OCA STC
PR
OD
UC
T
(s.a
. ove
r co
untr
y-
spec
ific
s.a.
AV
Es)
Europe & Central Asia 4.4 5.2 20.5 16.7 12.9 14.6
North America -0.3 -2.6 . -2.8 7.0 -5.5
Latin America & Caribbean 2.8 5.4 4.1 29.3 0.1 5.7
East Asia & Pacific 3.7 5.6 7.3 3.3 18.4 -10.2
South Asia 2.4 0.7 . 10.2 100.6 -39.2
Middle East & North Africa 0.7 6.1 27.2 7.6 27.8 11.0
Sub-Saharan Africa 10.5 6.3 . 4.5 64.6 44.0
CO
UN
TR
Y
(s.a
. ove
r co
untr
y-
spec
ific
w.a
. AV
Es)
Europe & Central Asia 1.1 -0.8 0.0 6.2 1.3 -0.1
North America -0.4 -1.5 . 1.8 -0.2 -8.1
Latin America & Caribbean -4.1 4.0 -0.3 3.2 -0.8 -0.3
East Asia & Pacific 4.3 9.6 1.2 3.5 0.1 -5.0
South Asia -2.8 -4.3 . -4.4 0.3 -12.0
Middle East & North Africa -2.7 11.2 3.7 2.3 -9.4 2.5
Sub-Saharan Africa 27.3 34.8 . -1.3 0.2 34.7
WO
RL
D
(iw.a
. ove
r co
untr
y-
spec
ific
w.a
. AV
Es)
Europe & Central Asia 0.3 -3.3 -0.6 3.5 -1.2 -3.6
North America -0.5 -3.3 . 1.8 0.2 -6.5
Latin America & Caribbean 0.9 2.4 0.0 2.4 -0.5 18.7
East Asia & Pacific -2.0 5.1 -0.1 1.2 0.1 -3.5
South Asia -5.1 -8.0 . -16.3 0.0 -11.7
Middle East & North Africa -0.4 11.4 0.1 1.3 -0.3 0.1
Sub-Saharan Africa -0.3 2.5 . -1.1 0.2 1.1
Note: Results are based on Poisson estimation excluding intra-EU trade. s.a. and w.a. refer to simple and import-weighted averages, respectively.
One might wonder, why we also report negative AVEs for antidumping and other counteracting
measures. We can think of three plausible explanations. The first reason is an econometric issue. It
might be that using a one year lag is not sufficient to rule out that we are capturing the effect of
predatory export policies (such as dumping or export subsidies) instead of the effect of the measures
that aim to counteract these policies (such as antidumping and countervailing duties). The second
reason is economic in nature. Counteracting measures target very specific products of very specific
exporters. These measures might therefore substantially reduce imports from one destination but
simultaneously enable other new exporters to enter the market. A third reason could be the quality
adaption of the exporter as a response to the NTM. Some recent research (Ghodsi et al., 2016b)
suggests that exporters tend to downgrade the quality of their products when facing antidumping
measures to circumvent antidumping duties and thereby increase their exports.
Overall, regional AVE results on measures other than SPS and TBT need to be interpreted with greater
caution: On the country level, we report binding AVEs of SPS measures and TBTs for 82 and 90
EMPIRICAL RESULTS
19 Working Paper 129
countries, respectively. Other measures are very much limited to North America, Europe and East Asia.
We find binding AVEs for antidumping and other counteracting measures for 56 and 51 countries,
respectively and in addition binding AVEs for QRS for 36 countries.
The second panel of Table 3 puts import weights on every product within each country, accounting for
economic structures of each importer. Yet, the regional figure is the simple average over all importing
countries, i.e. puts equal weight to each importing country. We therefore label this panel the ‘country
panel’. In comparison to the product panel, we observe a shift towards import-promoting effects. Yet, the
import-impeding effects of SPS measures and TBTs prevail for Sub-Saharan Africa as well as for the
East Asia and Pacific region. Average AVEs for quantitative restrictions and counteracting measures are
drastically scaled down, which is what we expect, given the very nature of these NTM types.
As countries within regions are of different sizes and economic powers, we calculated a third panel,
which we refer to as the ‘world panel’, in which we apply import weights for each country within a region.
That is, more emphasis is given to global players within each region, such as Brazil in Latin America,
South Africa in Sub-Saharan Africa, India in South Asia or China and Japan in East Asia, in order to
better grasp the current impact of NTMs on a global scale. Even in this case, TBTs appear to be
lowering imports in four out of seven world regions on average.
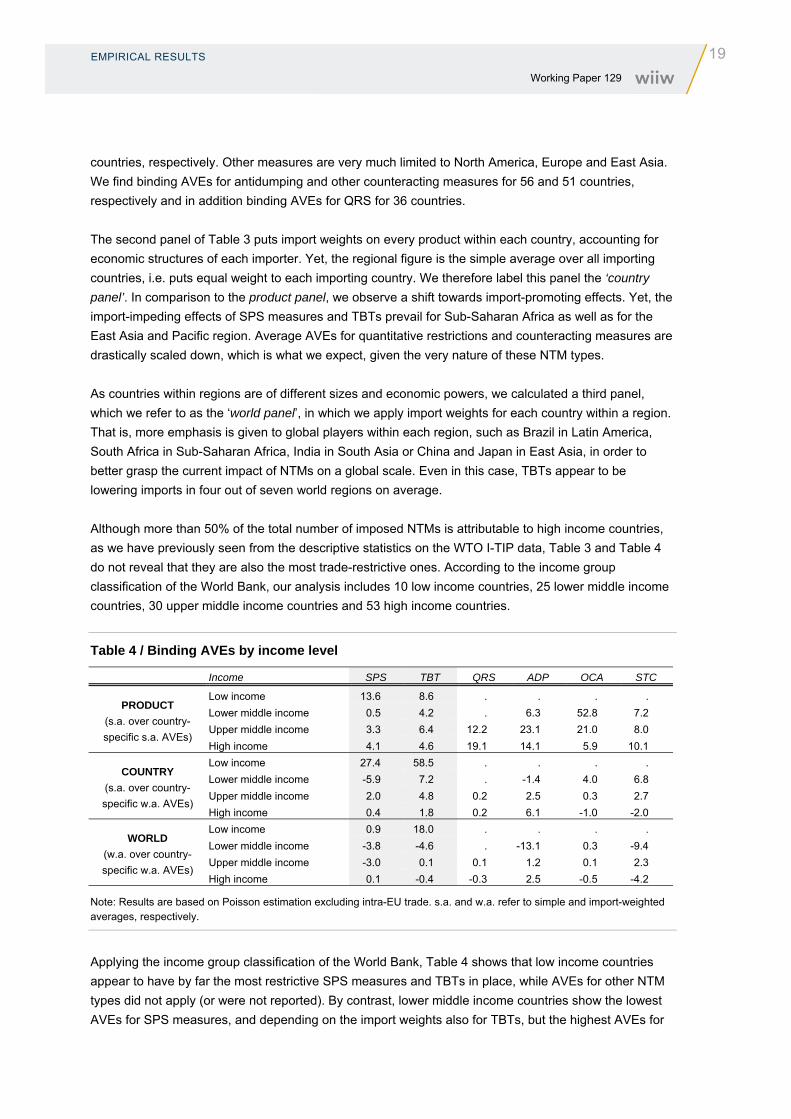
Although more than 50% of the total number of imposed NTMs is attributable to high income countries,
as we have previously seen from the descriptive statistics on the WTO I-TIP data, Table 3 and Table 4
do not reveal that they are also the most trade-restrictive ones. According to the income group
classification of the World Bank, our analysis includes 10 low income countries, 25 lower middle income
countries, 30 upper middle income countries and 53 high income countries.
Table 4 / Binding AVEs by income level
Income SPS TBT QRS ADP OCA STC
PRODUCT
(s.a. over country-
specific s.a. AVEs)
Low income 13.6 8.6 . . . .
Lower middle income 0.5 4.2 . 6.3 52.8 7.2
Upper middle income 3.3 6.4 12.2 23.1 21.0 8.0
High income 4.1 4.6 19.1 14.1 5.9 10.1
COUNTRY
(s.a. over country-
specific w.a. AVEs)
Low income 27.4 58.5 . . . .
Lower middle income -5.9 7.2 . -1.4 4.0 6.8
Upper middle income 2.0 4.8 0.2 2.5 0.3 2.7
High income 0.4 1.8 0.2 6.1 -1.0 -2.0
WORLD
(w.a. over country-
specific w.a. AVEs)
Low income 0.9 18.0 . . . .
Lower middle income -3.8 -4.6 . -13.1 0.3 -9.4
Upper middle income -3.0 0.1 0.1 1.2 0.1 2.3
High income 0.1 -0.4 -0.3 2.5 -0.5 -4.2
Note: Results are based on Poisson estimation excluding intra-EU trade. s.a. and w.a. refer to simple and import-weighted averages, respectively.
Applying the income group classification of the World Bank, Table 4 shows that low income countries
appear to have by far the most restrictive SPS measures and TBTs in place, while AVEs for other NTM
types did not apply (or were not reported). By contrast, lower middle income countries show the lowest
AVEs for SPS measures, and depending on the import weights also for TBTs, but the highest AVEs for
20 EMPIRICAL RESULTS Working Paper 129
other counteracting measures. Upper middle and high income countries indeed show lower AVEs for
SPS measures and TBTs, but also apply a wider range of different trade policy instruments. Although
many ‘hard’ NTMs such as quotas are phasing out due to the regulations of the WTO, quantitative
restrictions still seem to be trade restrictive, particularly for upper middle income countries, while
antidumping deserves special attention in high income countries.
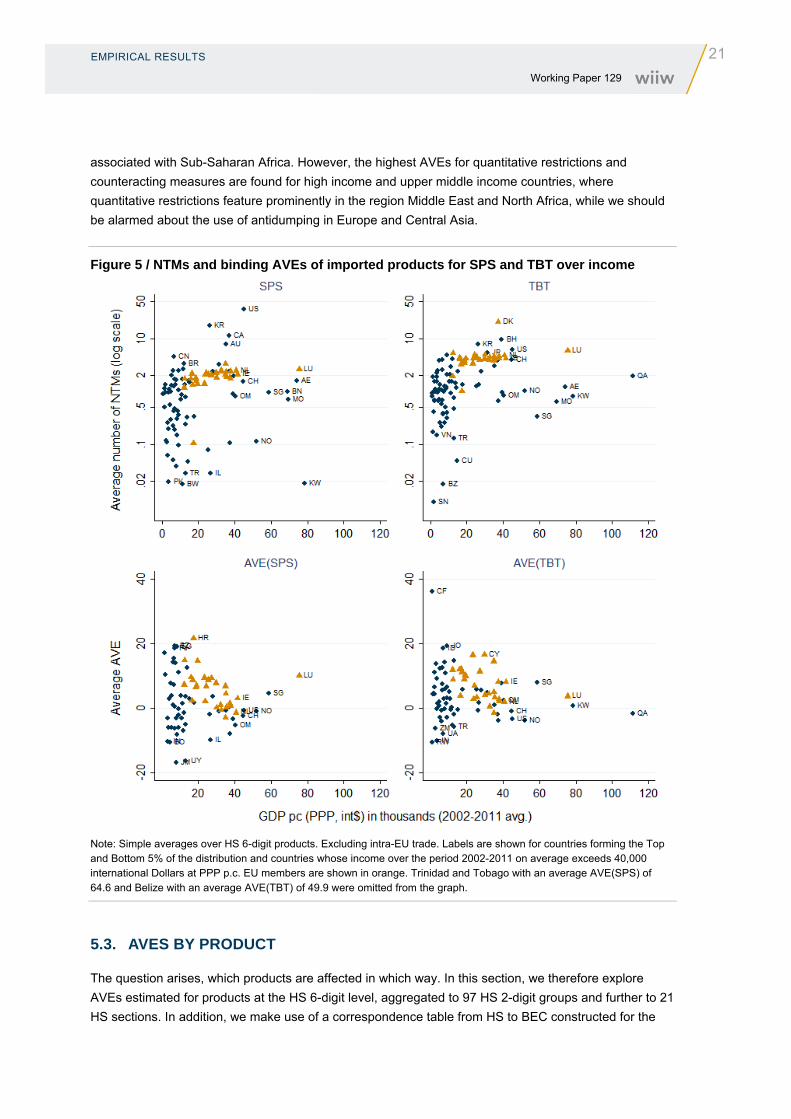
Given its political importance, specifically with respect to multilateral negotiations, we illustrate the
linkages between income and (the effect of) NTMs by plotting the number of SPS measures and TBTs
imposed as well as their corresponding average AVEs against GDP per capita in purchasing power
parities (PPP) in Figure 5. The upper panel summarises the number of NTMs per importer, calculated as
the simple average over all imported HS 6-digit products, while the lower panel plots the simple average
AVEs.
Looking at the average number of NTMs imposed on imported products, the impression is that it first
increases with income and at some threshold starts to fall again. Note that we make use of log scaling in
order to better see the dynamics among countries making little use of NTMs so far. This means that
jumps from one horizontal line to the next, e.g. from Pakistan to Norway, or from Australia to the United
States, indicate a quintupling of NTMs applying to imported products. For EU member countries
(highlighted in orange), a clear tendency towards a higher number of NTMs for richer countries is
observable. Extracting the number of notifications to the WTO of NTMs in force by 31 December 2015
(not broken down to country-product lines), we find for eight ‘old’ EU-15 Member States and one ‘new’
EU-12 country that no national NTM is notified in addition to those reported by the European Union. The
share of NTMs issued by EU-12 states in total national SPS and TBT notifications is 17% and 40%,
respectively. The lower number of NTMs for EU-12 countries can therefore be explained by (i) a higher
number of national NTMs imposed by EU-15 members in addition to NTMs notified by the EU, (ii) the
fact that a wide range of EU SPS measures and TBTs applied to EU-12 countries only from 2004 or
2007 onwards, respectively, and (iii) by the composition of products that are actually imported.
Turning to the lower panel of the graph, showing simple average AVEs by country, one might argue for a
trend towards zero AVEs of NTMs. Poorer countries show a wide range of AVEs from strongly negative
to strongly positive. Yet, with increasing income, the range of AVEs decreases. For EU members, we do
observe a clear downward trend, yet, with most countries showing on average positive AVEs.
Summing up, we find that using simple averages over all products and excluding intra-EU trade,
62 countries show import-hampering effects of SPS measures, TBTs and corresponding STCs
compared to 37 countries for which an import-promoting effect was computed. Focusing on binding
AVEs increases the import-restricting effect, which is, however, scaled down to a great extent when
employing import weights. The latter can either be the result of import-impeding NTMs imposed on
products that are relatively unimportant for international trade or of the effectiveness of NTMs in
reducing trade. We therefore argue for looking at simple as well as import-weighted averages of AVEs
for broad cross-country comparisons and elaborating policy-relevant differences on a case-by-case
basis.
In addition, we observe that richer countries employ a greater variety of NTM types and make more
frequently use of these tools, while simultaneously we see diminishing AVEs along increasing incomes.
The highest AVEs for SPS measures and TBTs are found among low income countries and are
EMPIRICAL RESULTS
21 Working Paper 129
associated with Sub-Saharan Africa. However, the highest AVEs for quantitative restrictions and
counteracting measures are found for high income and upper middle income countries, where
quantitative restrictions feature prominently in the region Middle East and North Africa, while we should
be alarmed about the use of antidumping in Europe and Central Asia.
Figure 5 / NTMs and binding AVEs of imported products for SPS and TBT over income
Note: Simple averages over HS 6-digit products. Excluding intra-EU trade. Labels are shown for countries forming the Top and Bottom 5% of the distribution and countries whose income over the period 2002-2011 on average exceeds 40,000 international Dollars at PPP p.c. EU members are shown in orange. Trinidad and Tobago with an average AVE(SPS) of 64.6 and Belize with an average AVE(TBT) of 49.9 were omitted from the graph.
5.3. AVES BY PRODUCT
The question arises, which products are affected in which way. In this section, we therefore explore
AVEs estimated for products at the HS 6-digit level, aggregated to 97 HS 2-digit groups and further to 21
HS sections. In addition, we make use of a correspondence table from HS to BEC constructed for the

22 EMPIRICAL RESULTS Working Paper 129
World Input-Output Database (WIOD15) to explore patterns along the types of products with respect to
their use as final consumption goods, intermediate goods or goods contributing to gross fixed capital
formation.
A table with all import-weighted AVEs by NTM type and HS-2-digit product group can be found in the
Appendix. The highest import-weighted binding AVEs for SPS measures are computed for aircraft and
spacecraft (115, HS 88), works of art (71, HS 97) and musical instruments (49, HS 92), and the lowest
for railway or tramway locomotives (-100, HS 86), cork and articles thereof (-57, HS 45), and wool (-27,
HS 51). On the side of TBTs, arms and ammunition (67, HS 93) face the highest AVEs, followed by
aircraft and spacecraft (63, HS 88) as well as printed books and newspapers (58, HS 49), while the
lowest AVEs are found for prepared feathers (-80, HS 67), tin and articles thereof (-40.1, HS 80) and
headgear (-30, HS 65).
Agricultural products appear neither among the products with the highest nor among those with the
lowest AVEs. It can be noted however, that with the exception of tobacco, sugar, animal fats and edible
vegetables, all agricultural products show on average positive AVEs for SPS measures. For TBTs we
find positive effects for half of all agricultural product groups. Live animals face the highest AVEs
computed for TBTs and quantitative restrictions. Sugar and dairy products are particularly affected by
antidumping. The highest AVEs of specific trade concerns in the agri-food sector are found for tobacco
and cereals.
Figure 6 / Simple average by section over country-specific import-weighted binding AVEs
Note: Results based on Poisson estimation excluding intra-EU trade.
15 See www.wiod.org
-20 0 20 40 60 80
Hides, skins and articles; saddlery and travel goods
Arms and ammunition
Paper, paperboard and articles
Pearls, precious stones and metals; coin
Vehicles, aircraft and vessels
Base metals and articles
Articles of stone, plaster; ceramic prod.; glass
Mineral products
Resins, plastics and articles; rubber and articles
Machinery and electrical equipment
Products of the chemical and allied industries
Animal and vegetable fats, oils and waxes
Live animals and products
Miscellaneous manufactured articles
Instruments, clocks, recorders and reproducers
Prepared foodstuff; beverages, spirits, vinegar; tobacco
Vegetable products
Footwear, headgear; feathers, artif. flowers, fans
Wood, cork and articles; basketware
Textiles and articles
AVE(SPS) AVE(TBT) AVE(ADP)
EMPIRICAL RESULTS
23 Working Paper 129
Figure 6 shows our results for binding AVEs by HS section. We first apply import weights by section for
each importer and then take the simple average over all importers. We opted for plotting the three most
often applied NTM types. Figure 6 strongly points towards import-restricting effects of NTMs, especially
for antidumping measures, showing that although notifications of SPS measures and TBTs dominated in
our database, less frequently used and more traditional policy instruments still appear to be of great
concern.
In order to observe the impact of AVEs along the production and supply chains, we further break down
our product level results into the broad economic categories (BEC). We make use of a correspondence
table from HS 6-digit products to three broad categories: (i) intermediate goods, (ii) final consumption
goods, and (iii) goods contributing to gross fixed capital formation (GFCF). It was constructed from the
UN Broad Economic Categories (BEC revision3) classification and their correspondence to broader
groups as defined by the OECD. About 700 out of around 5000 products were reclassified for the WIOD
project in order to account for the fact that they might qualify for several categories. Take the example
from our sample of HS code 940540 comprising electric lamps and lighting fittings. Our correspondence
table suggests a 50% use as intermediate product, a 25% use for final consumption and a 25%
contribution to gross capital formation.
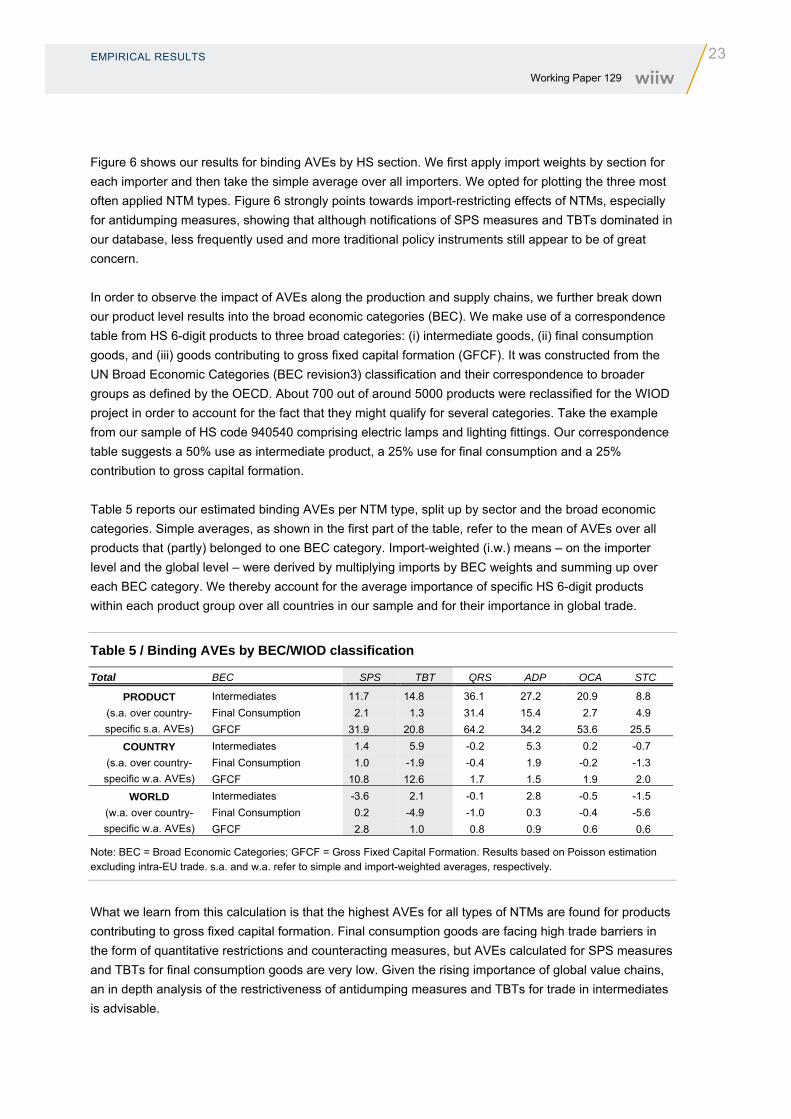
Table 5 reports our estimated binding AVEs per NTM type, split up by sector and the broad economic
categories. Simple averages, as shown in the first part of the table, refer to the mean of AVEs over all
products that (partly) belonged to one BEC category. Import-weighted (i.w.) means – on the importer
level and the global level – were derived by multiplying imports by BEC weights and summing up over
each BEC category. We thereby account for the average importance of specific HS 6-digit products
within each product group over all countries in our sample and for their importance in global trade.
Table 5 / Binding AVEs by BEC/WIOD classification
Total BEC SPS TBT QRS ADP OCA STC
PRODUCT
(s.a. over country-
specific s.a. AVEs)
Intermediates 11.7 14.8 36.1 27.2 20.9 8.8
Final Consumption 2.1 1.3 31.4 15.4 2.7 4.9
GFCF 31.9 20.8 64.2 34.2 53.6 25.5
COUNTRY
(s.a. over country-
specific w.a. AVEs)
Intermediates 1.4 5.9 -0.2 5.3 0.2 -0.7
Final Consumption 1.0 -1.9 -0.4 1.9 -0.2 -1.3
GFCF 10.8 12.6 1.7 1.5 1.9 2.0
WORLD
(w.a. over country-
specific w.a. AVEs)
Intermediates -3.6 2.1 -0.1 2.8 -0.5 -1.5
Final Consumption 0.2 -4.9 -1.0 0.3 -0.4 -5.6
GFCF 2.8 1.0 0.8 0.9 0.6 0.6
Note: BEC = Broad Economic Categories; GFCF = Gross Fixed Capital Formation. Results based on Poisson estimation excluding intra-EU trade. s.a. and w.a. refer to simple and import-weighted averages, respectively.
What we learn from this calculation is that the highest AVEs for all types of NTMs are found for products
contributing to gross fixed capital formation. Final consumption goods are facing high trade barriers in
the form of quantitative restrictions and counteracting measures, but AVEs calculated for SPS measures
and TBTs for final consumption goods are very low. Given the rising importance of global value chains,
an in depth analysis of the restrictiveness of antidumping measures and TBTs for trade in intermediates
is advisable.
24 ROBUSTNESS OF OUR FINDINGS Working Paper 129
6. Robustness of our findings
In the following we briefly discuss our findings with respect to different NTM samples and estimation
procedures.
Our main specification concerned international trade excluding intra-EU trade flows. In addition, we
repeated the regression analysis for the full sample, i.e. including intra-EU trade flows and therefore
ignoring mutual recognition rules within the European common market. As an alternative to excluding
intra-EU trade flows, we re-estimated AVEs by setting NTMs equal to zero if both the importing and the
exporting country belonged to the EU.
As we look at trade flows at a very disaggregated level, our dataset contains a large number of zero
trade flows. Due to the possibility that zero trade flows in our data are the result of firms’ decisions not to
export for reasons we do not observe we also discuss results obtained when following the Heckman
two-stage estimation procedure.
6.1. THE NTM SAMPLE
We find that for all three specifications, mean and median AVEs show the same signs. Magnitudes,
however, differ. While average AVEs computed for specific trade concerns on SPS measures and TBTs
are very similar for all three samples, AVEs on SPS measures and TBTs themselves are found to be
lowest for the full sample with a mean of 0.9% and 3.7% over all countries, respectively. Excluding intra-
EU trade reduces the number of AVEs of SPS measures by 14% and for TBTs by 9%, resulting in
average AVEs for SPS measures of 1.5% and for TBTs of 4.1%. If we alternatively assume zero NTMs
for EU trading partners, results for TBTs remain more or less unchanged, while the average AVE of SPS
measures increases significantly. The general observation that AVEs for antidumping measures are
found to be highest holds throughout.
For all three samples under investigation, we find that only 42% to 48% of all NTMs have a significant
impact on import quantities at the 10% level. Binding AVEs appear more trade impeding (or less trade
promoting) for every NTM type.
The main messages formulated based on regional and income aggregates do not change much: Highest
AVEs for counteracting measures are found for richer countries, particularly in Europe and Central Asia,
while highest AVEs for SPS measures and TBTs were calculated for low income countries. Yet, despite
showing lower AVEs for SPS measures and TBTs, we found the highest AVEs for specific trade
concerns for lower middle income countries.

ROBUSTNESS OF OUR FINDINGS
25 Working Paper 129
Table 6 / Average AVEs over importers resulting from different NTM samples
Full WTO sample SPS TBT QRS ADP OCA STC
All AVEs Simple avg. 0.9 3.7 7.3 15.5 1.4 3.1
i.w. avg. -0.1 2.2 -0.9 1.7 -0.3 0.2
Binding AVEs Simple avg. 1.5 4.8 8.8 17.4 12.1 10.6
i.w. avg. 1.0 6.2 -1.2 4.0 -0.2 1.1
Excluding intra-EU trade SPS TBT QRS ADP OCA STC
All AVEs Simple avg. 1.5 4.1 17.6 14.3 2.5 2.3
i.w. avg. -0.4 0.7 -1.0 1.7 -0.4 0.0
Binding AVEs Simple avg. 3.5 5.2 18.0 15.7 15.5 9.3
i.w. avg. 0.4 5.6 0.2 4.3 -0.1 0.2
Setting intra-EU NTMs to zero SPS TBT QRS ADP OCA STC
All AVEs Simple avg. 6.8 4.6 17.5 15.0 3.9 2.6
i.w. avg. 0.4 0.0 -0.9 1.5 -0.4 1.9
Binding AVEs Simple avg. 6.1 5.5 16.4 15.7 14.3 9.0
i.w. avg. 2.4 2.5 -1.0 3.6 -0.1 3.4
Note: Simple averages over importer-specific AVEs. Results based on Poisson estimations. i.w. avg. refers to import-weighted average.
6.2. HECKMAN RESULTS
In the first step of the Heckman two-stage estimation procedure, the selection equation (7) evaluates the
probability of non-zero trade flows for specific country pairs. From this first step, the inverse Mills ratio
) is obtained, which enters the outcome equation (8) in the second step as an explanatory variable,
which should solve the omitted variable bias in the presence of sample selection.
A main advantage of the Heckman selection procedure is that it allows for a data-generating process for
zero and non-zero trade flows, while for the Poisson estimation it is assumed that all observations are
drawn from the same distribution. Nonetheless, we decided to refer to the Poisson estimation as our
preferred specification, as it deals well with heteroscedasticity and does not suffer from the incidental
parameters problem. The latter means that as we are using a huge panel data set incorporating many
fixed effects, probit models are more likely to render biased and inconsistent estimates, as they do not
converge to their true value as the number of parameters (i.e. fixed effects) increases with sample size.
0 ln 1 ,
∀ ; ∈ , , , , , , ; ,
(7)
ln 0 ln 1
,
∀ ; ∀ , ∈ , , , , , , ; ,
(8)
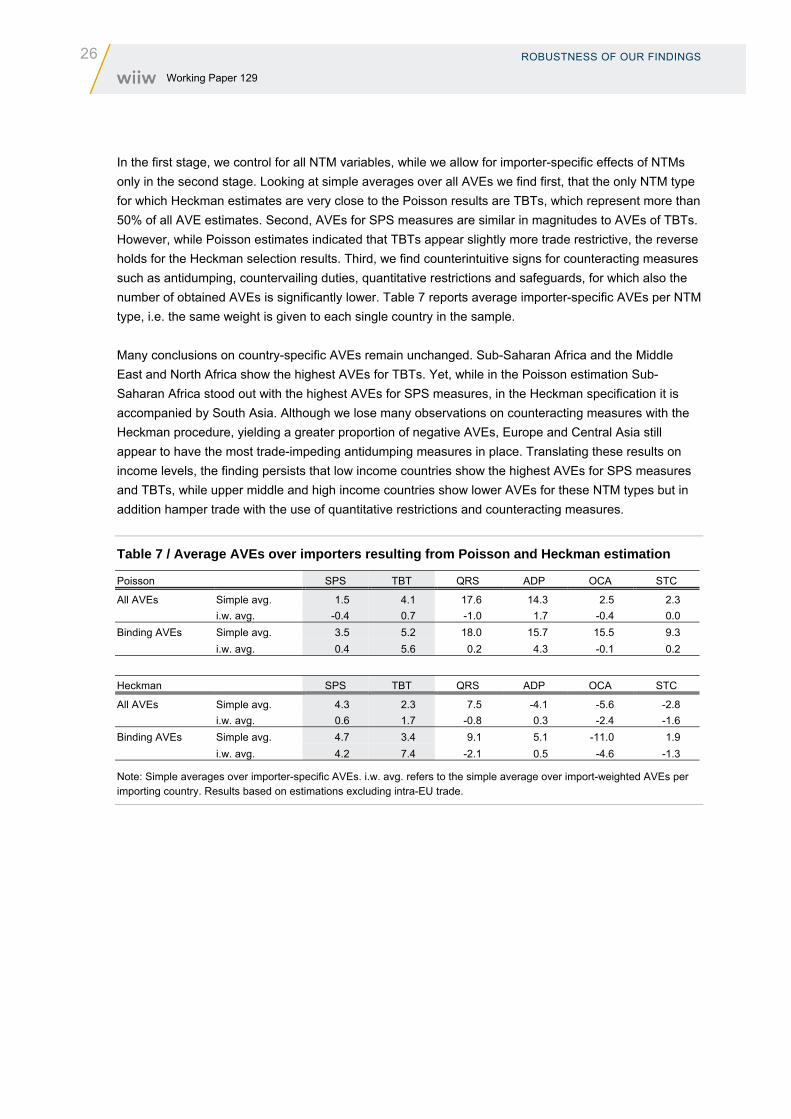
26 ROBUSTNESS OF OUR FINDINGS Working Paper 129
In the first stage, we control for all NTM variables, while we allow for importer-specific effects of NTMs
only in the second stage. Looking at simple averages over all AVEs we find first, that the only NTM type
for which Heckman estimates are very close to the Poisson results are TBTs, which represent more than
50% of all AVE estimates. Second, AVEs for SPS measures are similar in magnitudes to AVEs of TBTs.
However, while Poisson estimates indicated that TBTs appear slightly more trade restrictive, the reverse
holds for the Heckman selection results. Third, we find counterintuitive signs for counteracting measures
such as antidumping, countervailing duties, quantitative restrictions and safeguards, for which also the
number of obtained AVEs is significantly lower. Table 7 reports average importer-specific AVEs per NTM
type, i.e. the same weight is given to each single country in the sample.
Many conclusions on country-specific AVEs remain unchanged. Sub-Saharan Africa and the Middle
East and North Africa show the highest AVEs for TBTs. Yet, while in the Poisson estimation Sub-
Saharan Africa stood out with the highest AVEs for SPS measures, in the Heckman specification it is
accompanied by South Asia. Although we lose many observations on counteracting measures with the
Heckman procedure, yielding a greater proportion of negative AVEs, Europe and Central Asia still
appear to have the most trade-impeding antidumping measures in place. Translating these results on
income levels, the finding persists that low income countries show the highest AVEs for SPS measures
and TBTs, while upper middle and high income countries show lower AVEs for these NTM types but in
addition hamper trade with the use of quantitative restrictions and counteracting measures.
Table 7 / Average AVEs over importers resulting from Poisson and Heckman estimation
Poisson SPS TBT QRS ADP OCA STC
All AVEs Simple avg. 1.5 4.1 17.6 14.3 2.5 2.3
i.w. avg. -0.4 0.7 -1.0 1.7 -0.4 0.0
Binding AVEs Simple avg. 3.5 5.2 18.0 15.7 15.5 9.3
i.w. avg. 0.4 5.6 0.2 4.3 -0.1 0.2
Heckman SPS TBT QRS ADP OCA STC
All AVEs Simple avg. 4.3 2.3 7.5 -4.1 -5.6 -2.8
i.w. avg. 0.6 1.7 -0.8 0.3 -2.4 -1.6
Binding AVEs Simple avg. 4.7 3.4 9.1 5.1 -11.0 1.9
i.w. avg. 4.2 7.4 -2.1 0.5 -4.6 -1.3
Note: Simple averages over importer-specific AVEs. i.w. avg. refers to the simple average over import-weighted AVEs per importing country. Results based on estimations excluding intra-EU trade.

CONCLUSION
27 Working Paper 129
7. Conclusion
In this paper we calculate ad valorem equivalents (AVE) for different types of non-tariff measures
(NTMs) at the 6-digit product level of the Harmonised System for about 100 importing countries over the
period 2002-2011. For this purpose, we make use of information on NTM notifications to the WTO
provided via the WTO I-TIP database, enhanced by Ghodsi et al. (2016c) through matching of missing
HS codes.
We contribute to the existing literature by distinguishing the effects of NTMs for several types of NTMs,
with specific attention given to technical barriers to trade (TBTs) and sanitary and phytosanitary (SPS)
measures. Working with this unique dataset allows evaluating the trade effects of NTMs by means of an
intensity measure, i.e. by counting how many NTMs a specific importing country imposed against a
trading partner for each product.
Recent literature has started to acknowledge that non-tariff measures need not necessarily be non-tariff
barriers. Especially SPS measures and TBTs bear the potential to increase trade. Our analysis confirms
that SPS measures and TBTs are found to both impede as well as promote trade, depending on the
NTM imposing country and product under consideration.
While we find richer countries to apply more NTMs than poorer countries, we also observe smaller
effects of NTMs for richer countries compared to poorer countries. At the product level, we cannot
confirm findings of previous studies which indicated that especially trade in agri-food products is
negatively affected by NTMs. Splitting up products according to their purpose of use we find the highest
AVEs of NTMs for products contributing to gross fixed capital formation. Given the slowdown of global
trade growth and the increasing importance of global value chains, a further in-depth analysis of the
restrictiveness of antidumping measures and TBTs for trade in intermediates is advisable.
Finally, positive AVEs for SPS measures and TBTs might point towards the quality-increasing effects of
these measures, as they aim at the protection of human, animal and plant life and at guaranteeing
quality of packaging and information provided and therefore have implications which are reaching far
beyond the impact on international trade.
28 REFERENCES Working Paper 129
References
Aisbett, E. and L.M. Pearson (2012), ‘Environmental and Health Protections, or New Protectionism?
Determinants of SPS Notifications by WTO Members’, Crawford School Research Paper, No. 12-13,
December.
Arita, S., L. Mitchell and J. Beckman (2015), ‘Estimating the Effects of Selected Sanitary and Phytosanitary
Measures and Technical Barriers to Trade on U.S.-EU Agricultural Trade’, Economic Research Report,
No. 199, USDA, November.
Baldwin, R. and S. Evenett (eds) (2009). ‘The collapse of global trade, murky protectionism, and the crisis:
Recommendations for the G20’, A VoxEU.org Publication, CEPR, London.
Baltagi, B. H., P. Egger and M. Pfaffermayr (2003), ‘A generalized design for bilateral trade flow models’,
Economics Letters, Vol. 80, No. 3, pp. 391-397.
Beghin, J., A.-C. Disdier, S. Marette and F. van Tongeren (2012), ‘Welfare costs and benefits of non-tariff
measures in trade: a conceptual framework and application’, World Trade Review, Vol. 11, No. 3, pp. 356-375.
Beghin, J., A.-C. Disdier and S. Marette (2014), ‘Trade Restrictiveness Indices in Presence of Externalities:
An Application to Non-Tariff Measures’, CESifo Working Paper, No. 4968, September.
Berden, K. and J. Francois (2015), ‘Quantifying Non-Tariff Measures for TTIP’, in: D. Hamilton and
J. Pelkmans (eds), Rule-Makers or Rule-Takers? Exploring the Transatlantic Trade and Investment
Partnership, Chapter 4, CTR/CEPS, Washington/Brussels, pp. 97-137.
Beverelli, C, M. Boffa and A. Keck (2014), ‘Trade policy substitution: Theory and evidence from Specific Trade
Concerns’, WTO Staff Working Paper, No. ERSD-2014-18.
Bratt, M. (2014), ‘Estimating the bilateral impact of non-tariff measures (NTMs)’, Working Paper WPS 14-01-1,
Université de Genève.
Cadot, O. and J. Gourdon (2015), ‘NTMs, Preferential Trade Agreements, and Prices: New Evidence’,
Working Papers 2015-01, CEPII Research Center.
Dean, J.M., J. Signoret, R.M. Feinberg, R.D. Ludema and M.J. Ferrantino (2009), ‘Estimating the Price Effects
of Non-Tariff Barriers’, The B.E. Journal of Economic Analysis & Policy, Vol. 9, No. 1.
Dietzenbacher, E., B. Los, R. Stehrer, M. Timmer and G. de Vries (2013), ‘The construction of World Input-
Output Tables in the WIOD Project’, Economic Systems Research, Vol. 25, No. 1, pp 71-98.
Disdier, A.-C., L. Fontagné and M. Mimouni (2008), ‘The Impact of regulations on Agricultural Trade: Evidence
from the SPS and TBT Agreements’, American Journal of Agricultural Economics, Vol. 90, No. 2, May,
pp. 336-350.
Dür, A., L. Baccini and M. Elsig (2014), ‘The Design of International Trade Agreements: Introducing a New
Database’, Review of International Organizations, Vol. 9, No. 3, pp. 353-375.
Egger, P., J. Francois, M. Manchin and D. Nelson (2015), ‘Non-tariff barriers, integration and the transatlantic
economy’, Economic Policy, Vol. 30, No. 83, pp. 539-584.
Essaji, A. (2008), ‘Technical regulations and specialization in international trade’, Journal of International
Economics, Vol. 76, No. 2, pp.166-176.
Feenstra, R.C., R. Inklaar and M.P. Timmer (2015), ‘The Next Generation of the Penn World Table’, American
Economic Review, Vol. 105, No. 10, pp. 3150-3182.

REFERENCES
29 Working Paper 129
Feenstra, R.C, R. Inklaar and M.P. Timmer (2013), ‘PWT 8.0 – a user guide’, downloadable at
http://www.rug.nl/research/ggdc/data/pwt/pwt-8.0.
Ferrantino, M. (2006), ‘Quantifying the Trade and Economic Effects of Non-Tariff Measures’, OECD Trade
Policy Papers, No. 28, OECD Publishing.
Francois, J., M. Manchin and H. Norberg (2011), ‘European perspectives on NTM and tariff liberalization’,
ESRI Discussion Paper, No. 265.
Ghodsi, M. (2015a), ‘The Role of Specific Trade Concerns on TBT in the import of products to EU, USA, and
China’, wiiw Working Paper, No. 116, Vienna, June.
Ghodsi, M. (2015b), ‘Distinguishing Between Genuine and Non-Genuine Reasons for Imposing TBTs:
A Proposal Based on Cost Benefit Analysis’, wiiw Working Paper, No. 117, Vienna, July.
Ghodsi, M. (2016), ‘Determinants of specific trade concerns raised on technical barriers to trade. EU versus
non-EU’, forthcoming in Empirica.
Ghodsi, M., J. Grübler and R. Stehrer (2016a), ‘Bilateral Import Elasticities of Demand’, wiiw, Vienna, mimeo.
Ghodsi, M., S. Jokubauskaitė and R. Stehrer (2016b), ‘Non-Tariff Measures and the Quality of Imported
Products’, wiiw, Vienna, mimeo.
Ghodsi, M., O. Reiter and R. Stehrer (2016c), ‘Compilation of a Database for Non-Tariff Measures from the
WTO Integrated Trade Intelligence Portal (WTO I-TIP)’, wiiw, Vienna, mimeo.
Goldberg, P. and N. Pavcnik (2016), ‘The Effects of Trade Policy’, NBER Working Paper, No. 21957,
Cambridge, February.
Hamilton, D.S. and J. Pelkmans (eds) (2015), Rule-Makers or Rule-Takers? Exploring the Transatlantic Trade
and Investment Partnership, CTR/CEPS, Washington/Brussels.
Kee, H.L., A. Nicita and M. Olarreaga (2008), ‘Import demand elasticities and trade distortions’, The Review of
Economics and Statistics, Vol. 90, No. 4, pp. 666-682.
Kee, H.L., A. Nicita and M. Olarreaga (2009), ‘Estimating Trade Restrictiveness Indices’, The Economic
Journal, Vol. 119, pp. 172-199.
Kee, H.L., C. Neagu and A. Nicita (2013), ‘Is Protectionism on the Rise? Assessing National Trade Policies
during the Crisis of 2008’, The Review of Economics and Statistics, Vol. 95, No. 1, pp. 342-346.
Kohli, U. (1991), Technology, Duality, and Foreign Trade: The GNP Function Approach to Modeling Imports
and Exports, The University of Michigan Press, Ann Arbor.
Moore, M.O. and M. Zanardi (2011), ‘Trade Liberalization and Antidumping: Is There a Substitution Effect?’,
Review of Development Economics, Vol. 15, No. 4, pp. 601-619.
Nimenya, N., P.-F. Ndimira and B. H. de Frahan (2012), ‘Tariff equivalents of nontariff measures: the case of
European horticultural and fish imports from African countries’, Agricultural Economics, Vol. 43, pp. 635-653.
Rickard B.J. and L. Lei (2011), ‘How important are tariffs and nontariff barriers in international markets for
fresh fruit?’, Agricultural Economics, Vol. 42, pp. 19-31.
Santos Silva, J.M.C. and S. Tenreyro (2006), ‘The Log of Gravity’, The Review of Economics and Statistics,
Vol. 88, No. 4, pp. 641-658.
UNCTAD (2010), Non-Tariff Measures: Evidence from Selected Developing Countries and Future Research
Agenda, Developing Countries in International Trade Studies, UNCTAD/DITC/TAB/2009/3, United Nations,
New York and Geneva.
30 REFERENCES Working Paper 129
UNCTAD (2013), International Classification of Non-Tariff Measures (2012 Version),
UNCTAD/DITC/TAB/2012/2/Rev. 1, United Nations, New York and Geneva;
http://unctad.org/en/PublicationsLibrary/ditctab20122_en.pdf.
Van Tongeren, F., J. Beghin and S. Marette (2009), ‘A Cost-Benefit Framework for the Assessment of Non-
Tariff Measures in Agro-Food Trade,’ OECD Food, Agriculture and Fisheries Working Papers, No. 21,
OECD Publishing.
Winters, A.L. (2015), ‘Regionalism and the WTO: Political Economy on a World Scale?’, FIW/CER Workshop,
BMWFW, Vienna, 22 September;
http://wiiw.ac.at/winters-regionalism-and-the-wto-political-economy-on-a-world-scale--dlp-3650.pdf.
WTO (2012), World Trade Report 2012: Trade and public policies: A closer look at non-tariff measures in the
21st century, World Trade Organisation, Geneva.
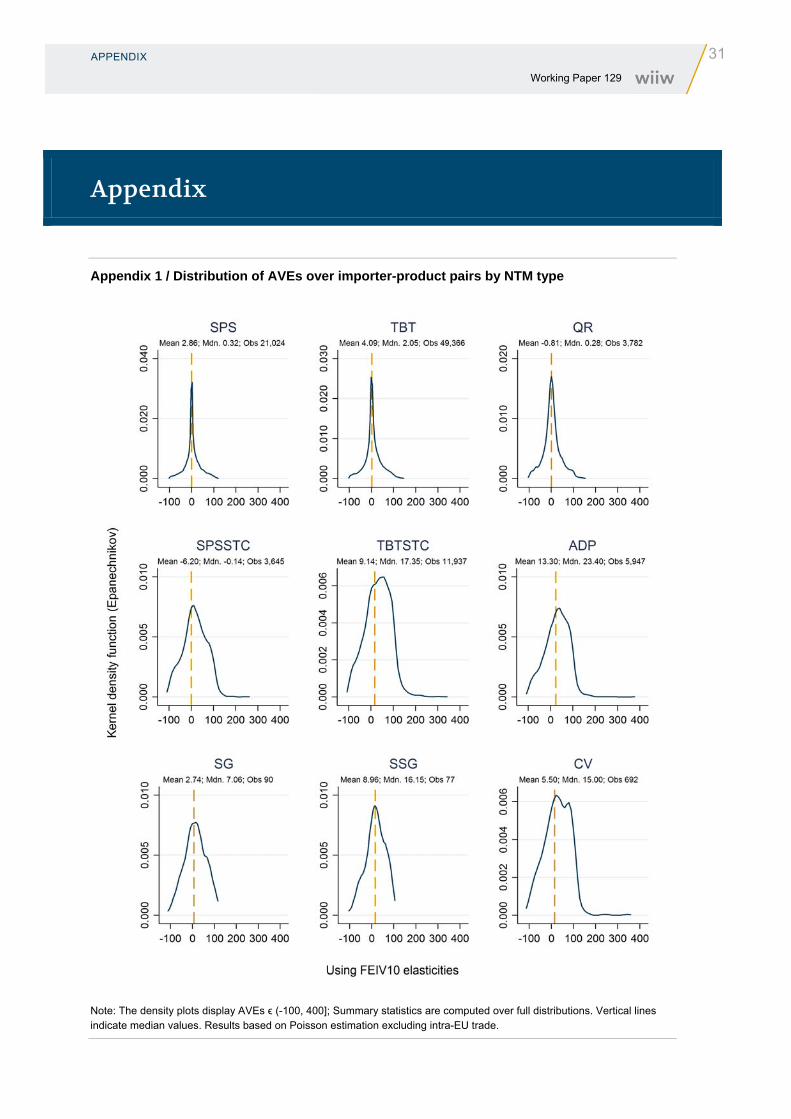
APPENDIX
31 Working Paper 129
Appendix
Appendix 1 / Distribution of AVEs over importer-product pairs by NTM type
Note: The density plots display AVEs ϵ (-100, 400]; Summary statistics are computed over full distributions. Vertical lines indicate median values. Results based on Poisson estimation excluding intra-EU trade.
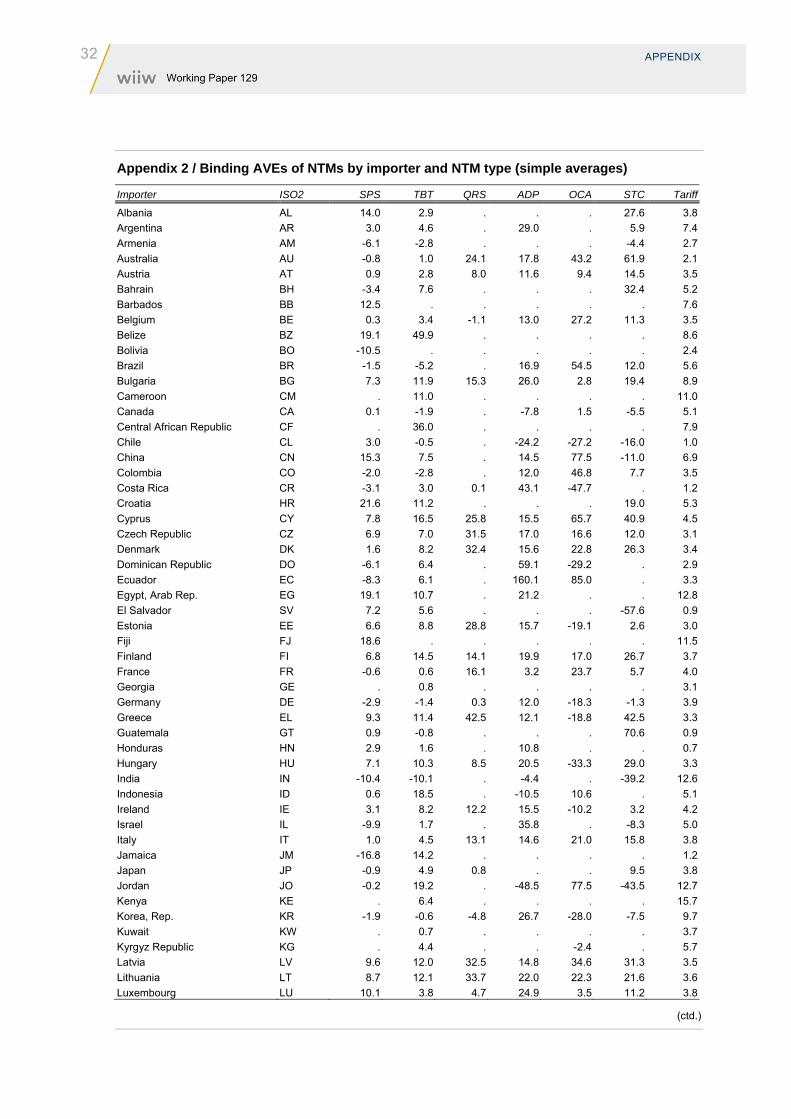
32 APPENDIX Working Paper 129
Appendix 2 / Binding AVEs of NTMs by importer and NTM type (simple averages)
Importer ISO2 SPS TBT QRS ADP OCA STC Tariff
Albania AL 14.0 2.9 . . . 27.6 3.8
Argentina AR 3.0 4.6 . 29.0 . 5.9 7.4
Armenia AM -6.1 -2.8 . . . -4.4 2.7
Australia AU -0.8 1.0 24.1 17.8 43.2 61.9 2.1
Austria AT 0.9 2.8 8.0 11.6 9.4 14.5 3.5
Bahrain BH -3.4 7.6 . . . 32.4 5.2
Barbados BB 12.5 . . . . . 7.6
Belgium BE 0.3 3.4 -1.1 13.0 27.2 11.3 3.5
Belize BZ 19.1 49.9 . . . . 8.6
Bolivia BO -10.5 . . . . . 2.4
Brazil BR -1.5 -5.2 . 16.9 54.5 12.0 5.6
Bulgaria BG 7.3 11.9 15.3 26.0 2.8 19.4 8.9
Cameroon CM . 11.0 . . . . 11.0
Canada CA 0.1 -1.9 . -7.8 1.5 -5.5 5.1
Central African Republic CF . 36.0 . . . . 7.9
Chile CL 3.0 -0.5 . -24.2 -27.2 -16.0 1.0
China CN 15.3 7.5 . 14.5 77.5 -11.0 6.9
Colombia CO -2.0 -2.8 . 12.0 46.8 7.7 3.5
Costa Rica CR -3.1 3.0 0.1 43.1 -47.7 . 1.2
Croatia HR 21.6 11.2 . . . 19.0 5.3
Cyprus CY 7.8 16.5 25.8 15.5 65.7 40.9 4.5
Czech Republic CZ 6.9 7.0 31.5 17.0 16.6 12.0 3.1
Denmark DK 1.6 8.2 32.4 15.6 22.8 26.3 3.4
Dominican Republic DO -6.1 6.4 . 59.1 -29.2 . 2.9
Ecuador EC -8.3 6.1 . 160.1 85.0 . 3.3
Egypt, Arab Rep. EG 19.1 10.7 . 21.2 . . 12.8
El Salvador SV 7.2 5.6 . . . -57.6 0.9
Estonia EE 6.6 8.8 28.8 15.7 -19.1 2.6 3.0
Fiji FJ 18.6 . . . . . 11.5
Finland FI 6.8 14.5 14.1 19.9 17.0 26.7 3.7
France FR -0.6 0.6 16.1 3.2 23.7 5.7 4.0
Georgia GE . 0.8 . . . . 3.1
Germany DE -2.9 -1.4 0.3 12.0 -18.3 -1.3 3.9
Greece EL 9.3 11.4 42.5 12.1 -18.8 42.5 3.3
Guatemala GT 0.9 -0.8 . . . 70.6 0.9
Honduras HN 2.9 1.6 . 10.8 . . 0.7
Hungary HU 7.1 10.3 8.5 20.5 -33.3 29.0 3.3
India IN -10.4 -10.1 . -4.4 . -39.2 12.6
Indonesia ID 0.6 18.5 . -10.5 10.6 . 5.1
Ireland IE 3.1 8.2 12.2 15.5 -10.2 3.2 4.2
Israel IL -9.9 1.7 . 35.8 . -8.3 5.0
Italy IT 1.0 4.5 13.1 14.6 21.0 15.8 3.8
Jamaica JM -16.8 14.2 . . . . 1.2
Japan JP -0.9 4.9 0.8 . . 9.5 3.8
Jordan JO -0.2 19.2 . -48.5 77.5 -43.5 12.7
Kenya KE . 6.4 . . . . 15.7
Korea, Rep. KR -1.9 -0.6 -4.8 26.7 -28.0 -7.5 9.7
Kuwait KW . 0.7 . . . . 3.7
Kyrgyz Republic KG . 4.4 . . -2.4 . 5.7
Latvia LV 9.6 12.0 32.5 14.8 34.6 31.3 3.5
Lithuania LT 8.7 12.1 33.7 22.0 22.3 21.6 3.6
Luxembourg LU 10.1 3.8 4.7 24.9 3.5 11.2 3.8
(ctd.)
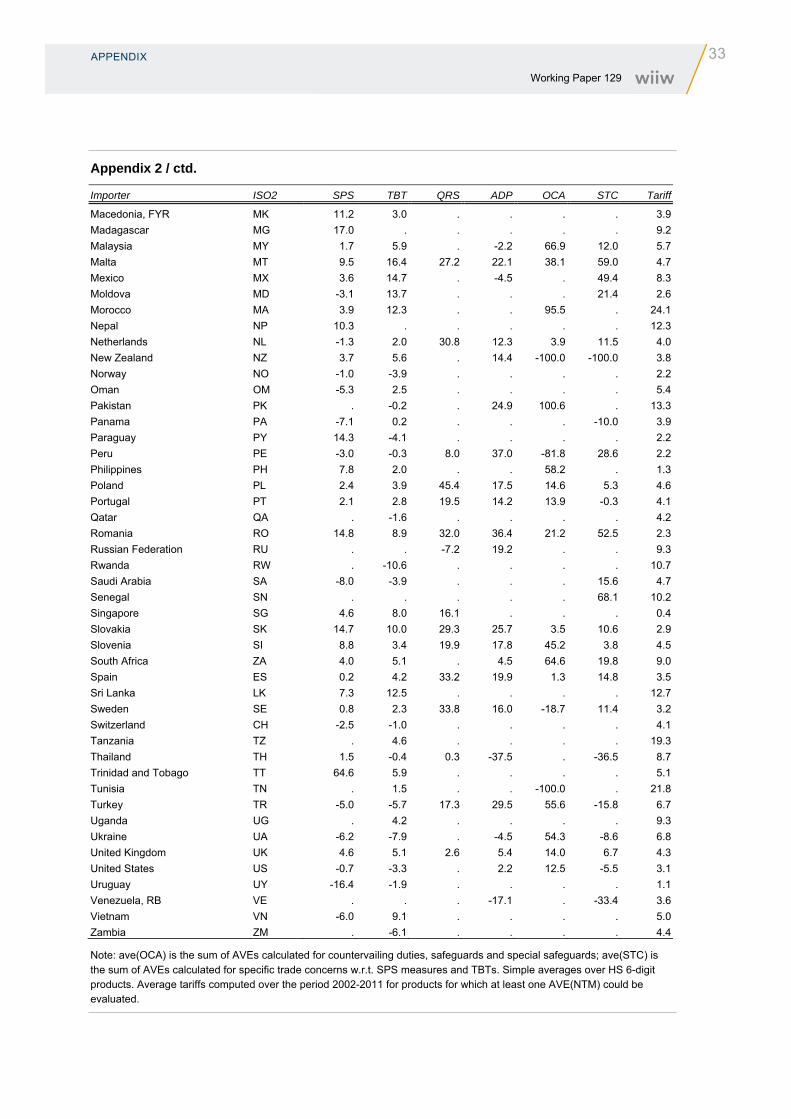
APPENDIX
33 Working Paper 129
Appendix 2 / ctd.
Importer ISO2 SPS TBT QRS ADP OCA STC Tariff
Macedonia, FYR MK 11.2 3.0 . . . . 3.9
Madagascar MG 17.0 . . . . . 9.2
Malaysia MY 1.7 5.9 . -2.2 66.9 12.0 5.7
Malta MT 9.5 16.4 27.2 22.1 38.1 59.0 4.7
Mexico MX 3.6 14.7 . -4.5 . 49.4 8.3
Moldova MD -3.1 13.7 . . . 21.4 2.6
Morocco MA 3.9 12.3 . . 95.5 . 24.1
Nepal NP 10.3 . . . . . 12.3
Netherlands NL -1.3 2.0 30.8 12.3 3.9 11.5 4.0
New Zealand NZ 3.7 5.6 . 14.4 -100.0 -100.0 3.8
Norway NO -1.0 -3.9 . . . . 2.2
Oman OM -5.3 2.5 . . . . 5.4
Pakistan PK . -0.2 . 24.9 100.6 . 13.3
Panama PA -7.1 0.2 . . . -10.0 3.9
Paraguay PY 14.3 -4.1 . . . . 2.2
Peru PE -3.0 -0.3 8.0 37.0 -81.8 28.6 2.2
Philippines PH 7.8 2.0 . . 58.2 . 1.3
Poland PL 2.4 3.9 45.4 17.5 14.6 5.3 4.6
Portugal PT 2.1 2.8 19.5 14.2 13.9 -0.3 4.1
Qatar QA . -1.6 . . . . 4.2
Romania RO 14.8 8.9 32.0 36.4 21.2 52.5 2.3
Russian Federation RU . . -7.2 19.2 . . 9.3
Rwanda RW . -10.6 . . . . 10.7
Saudi Arabia SA -8.0 -3.9 . . . 15.6 4.7
Senegal SN . . . . . 68.1 10.2
Singapore SG 4.6 8.0 16.1 . . . 0.4
Slovakia SK 14.7 10.0 29.3 25.7 3.5 10.6 2.9
Slovenia SI 8.8 3.4 19.9 17.8 45.2 3.8 4.5
South Africa ZA 4.0 5.1 . 4.5 64.6 19.8 9.0
Spain ES 0.2 4.2 33.2 19.9 1.3 14.8 3.5
Sri Lanka LK 7.3 12.5 . . . . 12.7
Sweden SE 0.8 2.3 33.8 16.0 -18.7 11.4 3.2
Switzerland CH -2.5 -1.0 . . . . 4.1
Tanzania TZ . 4.6 . . . . 19.3
Thailand TH 1.5 -0.4 0.3 -37.5 . -36.5 8.7
Trinidad and Tobago TT 64.6 5.9 . . . . 5.1
Tunisia TN . 1.5 . . -100.0 . 21.8
Turkey TR -5.0 -5.7 17.3 29.5 55.6 -15.8 6.7
Uganda UG . 4.2 . . . . 9.3
Ukraine UA -6.2 -7.9 . -4.5 54.3 -8.6 6.8
United Kingdom UK 4.6 5.1 2.6 5.4 14.0 6.7 4.3
United States US -0.7 -3.3 . 2.2 12.5 -5.5 3.1
Uruguay UY -16.4 -1.9 . . . . 1.1
Venezuela, RB VE . . . -17.1 . -33.4 3.6
Vietnam VN -6.0 9.1 . . . . 5.0
Zambia ZM . -6.1 . . . . 4.4
Note: ave(OCA) is the sum of AVEs calculated for countervailing duties, safeguards and special safeguards; ave(STC) is the sum of AVEs calculated for specific trade concerns w.r.t. SPS measures and TBTs. Simple averages over HS 6-digit products. Average tariffs computed over the period 2002-2011 for products for which at least one AVE(NTM) could be evaluated.

34 APPENDIX Working Paper 129
Appendix 3 / Binding AVEs of NTMs by importer and NTM type (import-weighted averages)
Importer ISO3 SPS TBT QRS ADP OCA STC Tariff
Albania AL 17.2 -2.8 . . . 1.1 4.3
Argentina AR 1.2 -0.7 . 15.3 . 6.3 7.8
Armenia AM -2.7 -6.4 . . . -3.9 3.3
Australia AU -0.2 0.2 5.7 24.8 1.2 1.2 3.3
Austria AT 1.0 -8.1 0.1 2.6 0.1 -5.5 3.7
Bahrain BH -2.1 38.2 . . . 8.7 7.6
Barbados BB -62.3 . . . . . 12.8
Belgium BE -3.1 -3.8 -10.6 3.4 0.9 -5.6 3.7
Belize BZ 12.3 2.5 . . . . 6.5
Bolivia BO -70.0 . . . . . 3.3
Brazil BR -5.1 -14.1 . 2.2 0.2 -0.3 3.6
Bulgaria BG -1.1 6.9 0.1 11.8 6.0 20.6 7.9
Cameroon CM . 50.3 . . . . 7.2
Canada CA -0.4 0.9 . 1.7 -0.6 -10.3 4.7
Central African Republic CF . 85.4 . . . . 5.3
Chile CL 27.9 3.9 . 1.8 -8.1 0.5 0.8
China CN -5.4 3.1 . 1.0 0.2 -3.8 2.5
Colombia CO -0.5 -5.6 . 2.1 0.1 6.6 3.2
Costa Rica CR -1.7 -0.5 -2.0 0.5 -0.2 . 1.4
Croatia HR 0.0 -29.3 . . . 4.2 6.6
Cyprus CY 1.2 14.9 0.0 1.0 -30.6 1.2 3.1
Czech Republic CZ 0.3 -0.1 1.9 2.9 0.9 -16.3 2.1
Denmark DK 0.9 5.9 0.2 11.1 5.4 8.5 2.9
Dominican Republic DO -0.9 17.5 . 0.7 -1.9 . 2.7
Ecuador EC -0.5 71.1 . 2.3 9.0 . 2.7
Egypt, Arab Rep. EG 4.1 27.8 . 4.0 . . 3.1
El Salvador SV 7.9 0.6 . . . 3.3 2.2
Estonia EE 3.3 1.7 0.2 2.1 -0.8 -18.2 2.5
Fiji FJ 48.2 . . . . . 13.9
Finland FI 1.2 12.0 0.9 14.9 11.6 10.4 3.0
France FR -0.4 -5.1 5.0 1.6 -12.5 -2.7 3.4
Georgia GE . -21.8 . . . . 2.6
Germany DE -1.7 -12.2 0.5 0.1 -1.1 -19.3 3.1
Greece EL 0.7 5.4 5.0 14.9 -0.3 7.0 2.3
Guatemala GT -8.5 10.0 . . . 0.1 1.3
Honduras HN -2.1 -11.2 . 0.9 . . 1.0
Hungary HU 0.9 12.7 5.3 14.8 12.2 6.9 2.0
India IN -5.2 -8.3 . -16.9 . -12.0 11.5
Indonesia ID 0.0 68.5 . -3.5 0.2 . 5.0
Ireland IE 0.9 2.7 -1.2 3.6 -0.1 7.4 3.9
Israel IL -0.4 1.1 . 4.2 . 0.1 3.8
Italy IT 0.4 3.0 -0.1 5.1 0.9 -10.0 2.8
Jamaica JM -0.2 28.0 . . . . 0.9
Japan JP 0.0 7.8 -1.0 . . -0.5 5.1
Jordan JO -6.8 14.3 . -0.5 3.8 -15.6 12.8
Kenya KE . 23.0 . . . . 16.9
Korea, Rep. KR -4.1 0.0 -1.3 1.1 -0.1 -9.1 7.1
Kuwait KW . 3.4 . . . . 3.8
Kyrgyz Republic KG . -9.0 . . 3.8 . 5.7
Latvia LV 0.2 2.5 6.5 41.1 39.9 2.5 2.1
Lithuania LT 1.5 2.6 0.8 10.9 8.6 2.0 2.8
Luxembourg LU -1.2 -3.0 0.0 1.7 0.0 -7.5 3.6
(ctd.)
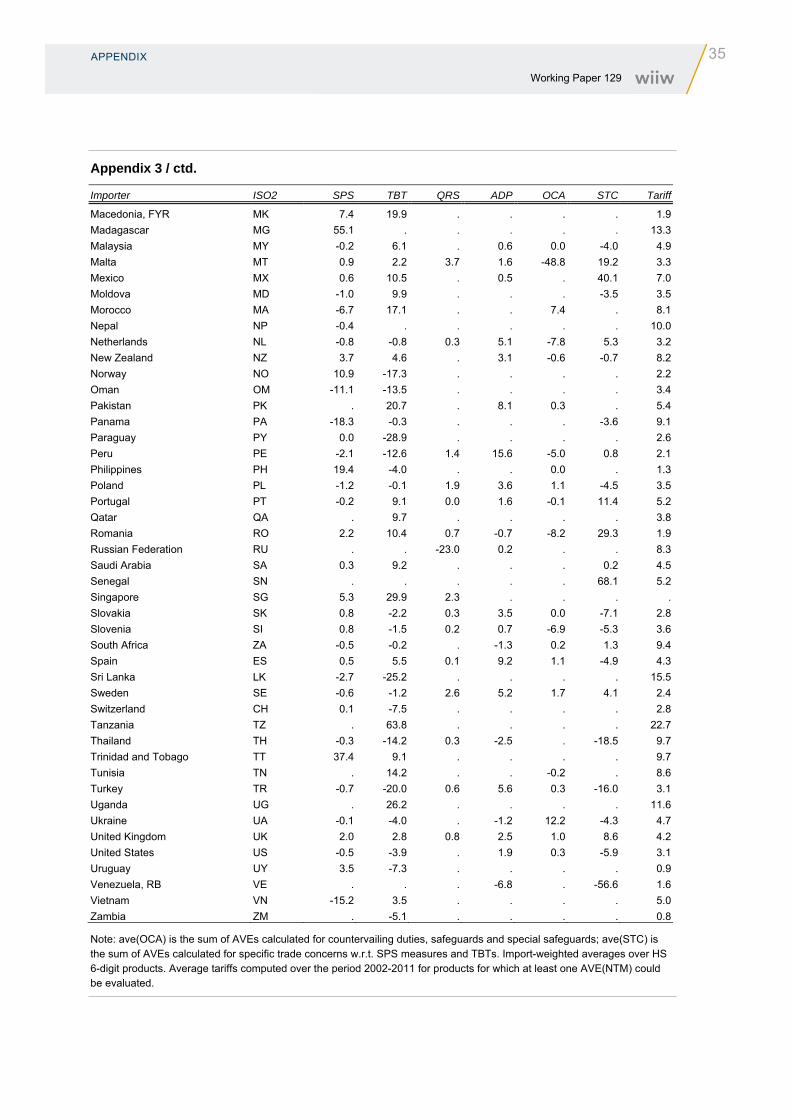
APPENDIX
35 Working Paper 129
Appendix 3 / ctd.
Importer ISO2 SPS TBT QRS ADP OCA STC Tariff
Macedonia, FYR MK 7.4 19.9 . . . . 1.9
Madagascar MG 55.1 . . . . . 13.3
Malaysia MY -0.2 6.1 . 0.6 0.0 -4.0 4.9
Malta MT 0.9 2.2 3.7 1.6 -48.8 19.2 3.3
Mexico MX 0.6 10.5 . 0.5 . 40.1 7.0
Moldova MD -1.0 9.9 . . . -3.5 3.5
Morocco MA -6.7 17.1 . . 7.4 . 8.1
Nepal NP -0.4 . . . . . 10.0
Netherlands NL -0.8 -0.8 0.3 5.1 -7.8 5.3 3.2
New Zealand NZ 3.7 4.6 . 3.1 -0.6 -0.7 8.2
Norway NO 10.9 -17.3 . . . . 2.2
Oman OM -11.1 -13.5 . . . . 3.4
Pakistan PK . 20.7 . 8.1 0.3 . 5.4
Panama PA -18.3 -0.3 . . . -3.6 9.1
Paraguay PY 0.0 -28.9 . . . . 2.6
Peru PE -2.1 -12.6 1.4 15.6 -5.0 0.8 2.1
Philippines PH 19.4 -4.0 . . 0.0 . 1.3
Poland PL -1.2 -0.1 1.9 3.6 1.1 -4.5 3.5
Portugal PT -0.2 9.1 0.0 1.6 -0.1 11.4 5.2
Qatar QA . 9.7 . . . . 3.8
Romania RO 2.2 10.4 0.7 -0.7 -8.2 29.3 1.9
Russian Federation RU . . -23.0 0.2 . . 8.3
Saudi Arabia SA 0.3 9.2 . . . 0.2 4.5
Senegal SN . . . . . 68.1 5.2
Singapore SG 5.3 29.9 2.3 . . . .
Slovakia SK 0.8 -2.2 0.3 3.5 0.0 -7.1 2.8
Slovenia SI 0.8 -1.5 0.2 0.7 -6.9 -5.3 3.6
South Africa ZA -0.5 -0.2 . -1.3 0.2 1.3 9.4
Spain ES 0.5 5.5 0.1 9.2 1.1 -4.9 4.3
Sri Lanka LK -2.7 -25.2 . . . . 15.5
Sweden SE -0.6 -1.2 2.6 5.2 1.7 4.1 2.4
Switzerland CH 0.1 -7.5 . . . . 2.8
Tanzania TZ . 63.8 . . . . 22.7
Thailand TH -0.3 -14.2 0.3 -2.5 . -18.5 9.7
Trinidad and Tobago TT 37.4 9.1 . . . . 9.7
Tunisia TN . 14.2 . . -0.2 . 8.6
Turkey TR -0.7 -20.0 0.6 5.6 0.3 -16.0 3.1
Uganda UG . 26.2 . . . . 11.6
Ukraine UA -0.1 -4.0 . -1.2 12.2 -4.3 4.7
United Kingdom UK 2.0 2.8 0.8 2.5 1.0 8.6 4.2
United States US -0.5 -3.9 . 1.9 0.3 -5.9 3.1
Uruguay UY 3.5 -7.3 . . . . 0.9
Venezuela, RB VE . . . -6.8 . -56.6 1.6
Vietnam VN -15.2 3.5 . . . . 5.0
Zambia ZM . -5.1 . . . . 0.8
Note: ave(OCA) is the sum of AVEs calculated for countervailing duties, safeguards and special safeguards; ave(STC) is the sum of AVEs calculated for specific trade concerns w.r.t. SPS measures and TBTs. Import-weighted averages over HS 6-digit products. Average tariffs computed over the period 2002-2011 for products for which at least one AVE(NTM) could be evaluated.
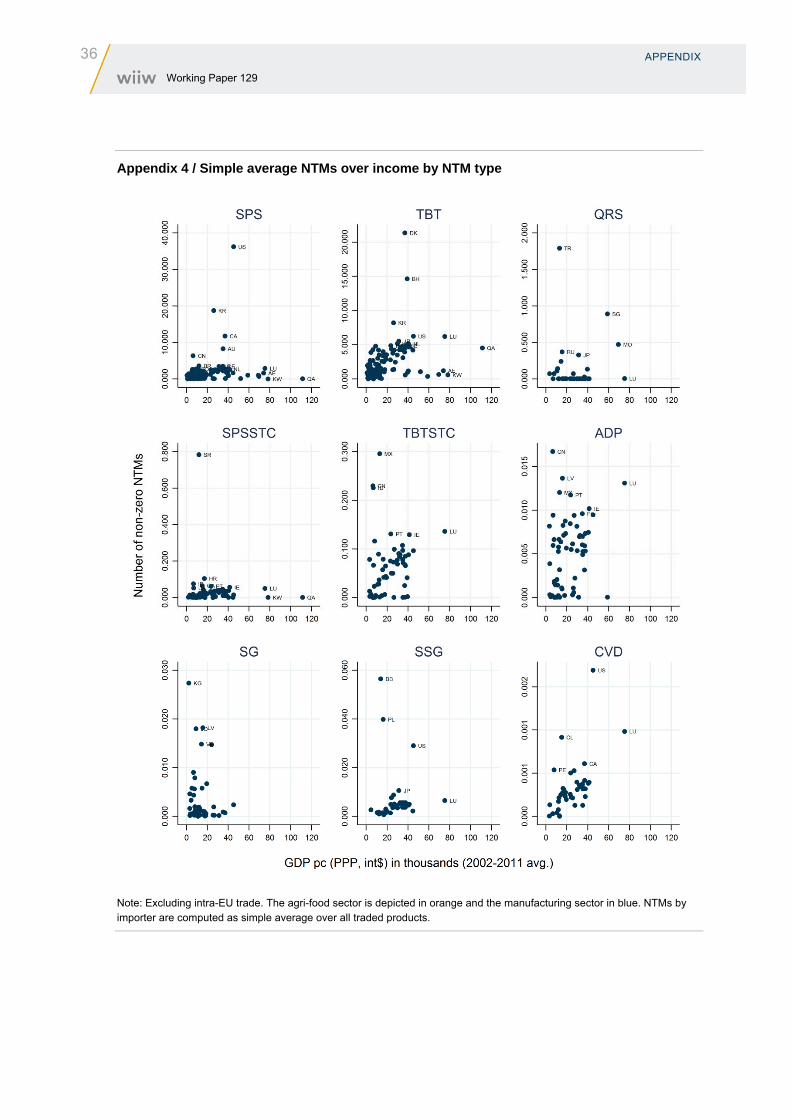
36 APPENDIX Working Paper 129
Appendix 4 / Simple average NTMs over income by NTM type
Note: Excluding intra-EU trade. The agri-food sector is depicted in orange and the manufacturing sector in blue. NTMs by importer are computed as simple average over all traded products.
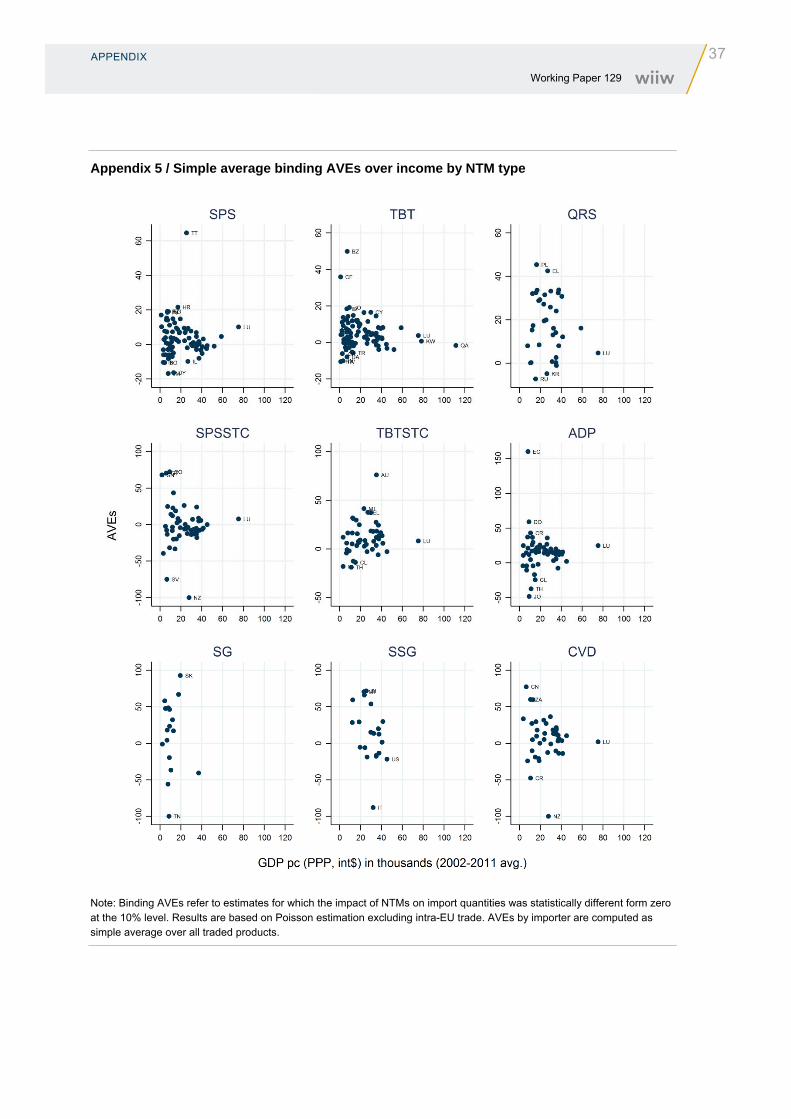
APPENDIX
37 Working Paper 129
Appendix 5 / Simple average binding AVEs over income by NTM type
Note: Binding AVEs refer to estimates for which the impact of NTMs on import quantities was statistically different form zero at the 10% level. Results are based on Poisson estimation excluding intra-EU trade. AVEs by importer are computed as simple average over all traded products.

38 APPENDIX Working Paper 129
Appendix 6 / Binding AVEs of NTMs by HS-2-digit product group (import-weighted)
HS2 Product description SPS TBT QRS ADP OCA STC
1 Live animals. 9.3 19.9 28.9 . . 6.8
2 Meat and edible meat offal. 1.8 -3.8 -6.6 -7.4 9.5 -1.7
3 Fish and crustaceans, molluscs […] 3.7 5.5 9.9 14.8 0.7 -7.3
4 Dairy produce; birds' eggs; […] 4.7 3.5 -12.8 28.5 1.6 0.5
5 Products of animal origin, […] 9.3 -2.8 -33.7 . . 21.3
6 Live trees and other plants; […] 5.7 16.3 12.9 . . 5.9
7 Edible vegetables and certain […] -1.3 -0.7 -22.1 6.2 . 0.3
8 Edible fruit and nuts; peel […] 1.2 -2.6 7.6 0.6 . 4.7
9 Coffee, tea, mate and spices. 8.9 -3.1 5.2 7.8 . 6.9
10 Cereals. 8.6 10.5 23.4 -5.6 -3.0 51.4
11 Products of the milling industry; […] 1.7 5.8 -7.6 6.7 -5.8 6.5
12 Oil seeds and oleaginous fruits; […] 3.2 -1.6 -27.3 -3.8 -0.1 7.4
13 Lac; gums, resins and other […] 3.9 -14.1 1.9 . -39.7 .
14 Vegetable plaiting materials; […] 16.9 12.8 -9.6 . . .
15 Animal or vegetable fats and […] -0.2 0.0 -5.7 8.7 -9.9 -3.9
16 Preparations of meat, of fish […] 4.4 0.1 6.1 7.5 4.4 12.3
17 Sugars and sugar confectionery -0.2 -1.1 13.5 22.0 -9.5 11.8
18 Cocoa and cocoa preparations. 6.5 5.1 . 7.5 -23.0 -10.6
19 Preparations of cereals, flour, […] 5.1 -3.6 . 0.9 -16.9 9.7
20 Preparations of vegetables, […] 1.1 -2.1 26.8 0.6 -10.0 -0.9
21 Miscellaneous edible preparations -8.2 -2.7 . -0.6 . -12.0
22 Beverages, spirits and vinegar 0.6 0.4 -1.0 -3.9 4.6 7.0
23 Residues and waste from the […] 0.1 -6.6 . 2.1 -17.3 -7.4
24 Tobacco and manufactured tobacco […] -1.7 12.2 -29.5 . . 79.9
25 Salt; sulphur; earths and stone; […] -0.5 8.0 4.6 -41.4 95.4 8.0
26 Ores, slag and ash. -20.6 -4.6 11.8 1.0 . 59.0
27 Mineral fuels, mineral oils […] -6.4 23.9 6.3 28.4 -0.9 -24.2
28 Inorganic chemicals; organic […] -0.6 1.7 -4.9 -2.0 0.0 4.8
29 Organic chemicals. 0.1 5.4 9.6 7.0 21.7 4.2
30 Pharmaceutical products. 7.6 -3.5 15.0 34.1 . -10.5
31 Fertilisers. -11.7 -0.2 14.4 30.6 3.7 -56.6
32 Tanning or dyeing extracts; […] -0.4 7.2 10.3 29.1 5.0 22.6
33 Essential oils and resinoids; […] 9.0 1.1 1.9 -9.2 . 5.8
34 Soap, organic surface-active […] -5.5 -1.9 0.8 10.9 . 1.5
35 Albuminoidal substances; modified […] 15.7 0.1 12.9 16.7 -0.5 .
36 Explosives; pyrotechnic products; […] -6.1 3.3 15.5 6.0 74.2 -7.5
37 Photographic or cinematographic […] 35.5 47.1 -14.3 46.5 . .
38 Miscellaneous chemical product 8.3 -6.3 9.1 30.1 10.1 -7.2
39 Plastics and articles thereof -4.6 4.6 1.7 9.1 5.8 2.8
40 Rubber and articles thereof 9.8 26.1 -35.3 14.0 36.2 -0.1
41 Raw hides and skins (other […] 44.9 22.5 53.7 96.3 . .
42 Articles of leather; saddlery […] -14.3 -24.8 -3.5 55.3 42.8 56.1
43 Furskins and artificial fur; […] -14.8 21.0 -46.4 . . -53.7
44 Wood and articles of wood; […] 11.2 -8.6 20.1 -3.6 3.3 -25.3
45 Cork and articles of cork. -57.3 . 23.0 -36.9 . .
46 Manufactures of straw, of esparto […] -13.2 . . . . .
47 Pulp of wood or of other fibrous […] 35.6 40.1 -13.2 . . .
48 Paper and paperboard; articles […] 1.3 1.4 48.1 46.4 53.9 100.6
49 Printed books, newspapers, […] 40.8 58.3 -16.9 -75.3 . 120.5
(ctd.)

APPENDIX
39 Working Paper 129
Appendix 6 / ctd.
HS2 Product description SPS TBT QRS ADP OCA STC
50 Silk. . 41.0 . -100.0 . -95.9
51 Wool, fine or coarse animal […] -26.7 7.7 11.7 . . -10.5
52 Cotton, -15.4 33.3 -4.1 23.1 -42.3 29.1
53 Other vegetable textile fibres; […] -16.8 22.5 19.9 -100.0 . -20.3
54 Man-made filaments. 14.3 15.1 -26.0 21.2 -15.3 -17.3
55 Man-made staple fibres. 18.1 28.4 -33.7 29.3 47.2 -14.2
56 Wadding, felt and nonwovens; […] 32.0 24.9 28.3 -21.5 . 47.7
57 Carpets and other textile floor […] -1.2 17.0 41.4 . . 80.9
58 Special woven fabrics; tufted […] 26.2 47.7 -34.9 9.2 . -4.1
59 Impregnated, coated, covered […] 19.0 41.9 . 46.5 . -44.9
60 Knitted or crocheted fabrics. 19.1 40.9 -1.1 56.8 . 31.7
61 Articles of apparel and clothing […] 21.0 -8.3 -26.8 4.1 . -18.1
62 Articles of apparel and clothing […] -1.0 -3.4 7.9 . . -2.6
63 Other made up textile articles; […] -4.5 8.7 -18.1 -6.5 -13.2 4.6
64 Footwear, gaiters and the like; […] 0.0 18.9 -23.2 14.3 . -23.9
65 Headgear and parts thereof 2.9 -30.3 29.7 . . 114.9
66 Umbrellas, sun umbrellas, […] -0.4 . 10.0 . . .
67 Prepared feathers and down […] -18.8 -80.3 43.6 . . .
68 Articles of stone, plaster, […] 16.4 5.8 8.7 2.2 . -6.3
69 Ceramic products. -7.7 4.8 36.0 52.9 62.4 -7.1
70 Glass and glassware. 6.3 7.4 19.5 30.2 -100.0 -1.9
71 Natural or cultured pearls, […] 15.0 33.9 -16.7 . . 18.6
72 Iron and steel. 5.3 3.4 7.0 35.6 -0.1 21.4
73 Articles of iron or steel. 0.9 11.3 16.5 17.7 -15.2 -24.1
74 Copper and articles thereof -0.1 52.7 25.1 14.3 8.1 101.0
75 Nickel and articles thereof. 3.5 41.3 -33.4 . . -4.9
76 Aluminium and articles thereof 2.5 9.5 45.7 -3.1 42.0 9.9
78 Lead and articles thereof 7.1 -13.4 -20.0 . . 56.0
79 Zinc and articles thereof. 4.6 -16.8 -30.2 11.5 . .
80 Tin and articles thereof. 11.0 -40.1 9.0 . . .
81 Other base metals; cermets; […] 21.8 20.6 5.6 32.5 . 98.0
82 Tools, implements, cutlery, […] 21.9 15.5 3.9 12.0 . -11.3
83 Miscellaneous articles of base […] 37.1 -7.8 -11.6 47.2 -43.9 68.3
84 Nuclear reactors, boilers, […] 8.4 5.5 1.0 2.3 2.3 15.9
85 Electrical machinery and equipment […] 16.3 8.6 10.0 -0.8 2.6 7.0
86 Railway or tramway locomotives, […] -100.0 19.6 74.6 . . .
87 Vehicles other than railway […] 27.0 5.5 8.2 3.4 0.0 -6.5
88 Aircraft, spacecraft, and parts […] 114.8 63.3 . . . .
89 Ships, boats and floating structures . 45.6 . . . .
90 Optical, photographic, […] 2.5 3.4 -15.3 -8.1 . -12.9
91 Clocks and watches and parts […] 11.4 10.0 22.7 . . -100.0
92 Musical instruments; parts […] 49.1 21.0 -7.1 . . 26.7
93 Arms and ammunition; parts […] -7.5 66.5 45.5 . . .
94 Furniture; bedding, mattresses, […] -25.2 0.6 -6.9 12.7 . -5.8
95 Toys, games and sports requisites; […] -19.5 4.3 -7.7 5.9 . 12.5
96 Miscellaneous manufactured […] 31.7 3.0 5.8 3.5 . 6.1
97 Works of art, collectors' pieces […] 71.3 . . . . .
Note: Binding AVEs refer to estimates for which the impact of NTMs on import quantities was statistically different from zero at the 10% level. Results are based on Poisson estimation excluding intra-EU trade. Import-weighted averages computed over HS 6-digit products by importer.
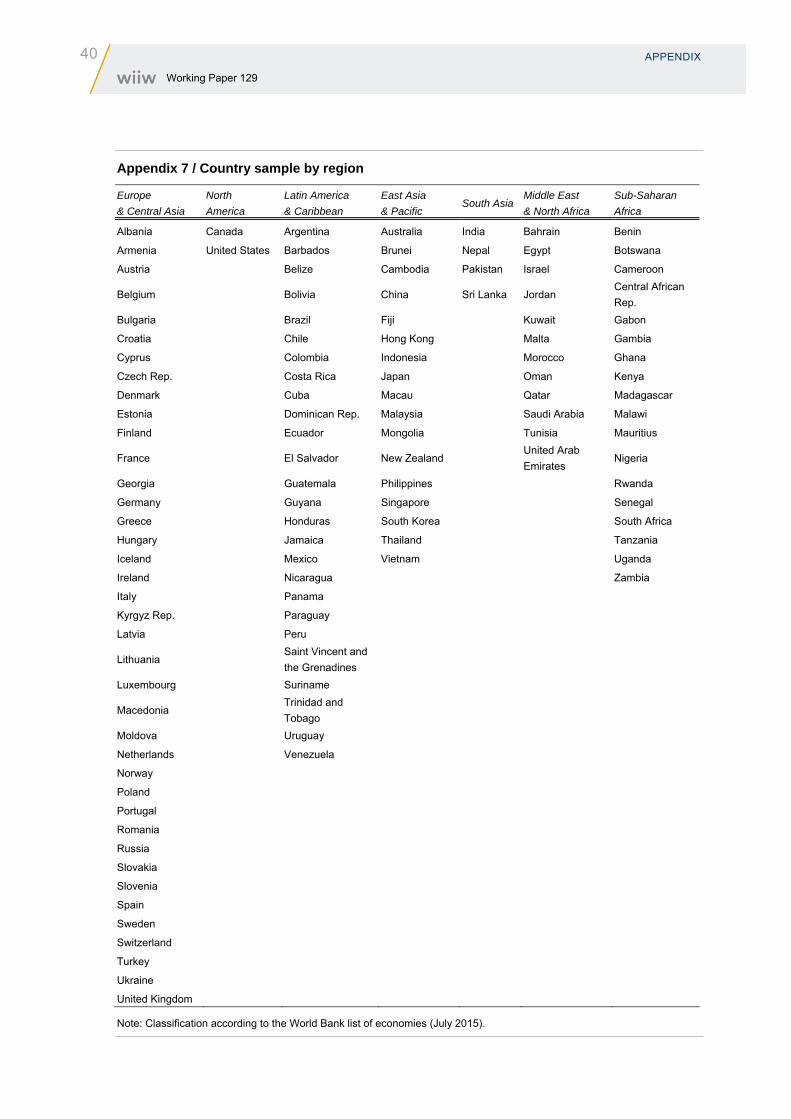
40 APPENDIX Working Paper 129
Appendix 7 / Country sample by region
Europe
& Central Asia
North
America
Latin America
& Caribbean
East Asia
& Pacific South Asia
Middle East
& North Africa
Sub-Saharan
Africa
Albania Canada Argentina Australia India Bahrain Benin
Armenia United States Barbados Brunei Nepal Egypt Botswana
Austria Belize Cambodia Pakistan Israel Cameroon
Belgium
Bolivia China Sri Lanka Jordan Central African
Rep.
Bulgaria Brazil Fiji Kuwait Gabon
Croatia Chile Hong Kong Malta Gambia
Cyprus Colombia Indonesia Morocco Ghana
Czech Rep. Costa Rica Japan Oman Kenya
Denmark Cuba Macau Qatar Madagascar
Estonia Dominican Rep. Malaysia Saudi Arabia Malawi
Finland Ecuador Mongolia Tunisia Mauritius
France
El Salvador New Zealand
United Arab
Emirates Nigeria
Georgia Guatemala Philippines Rwanda
Germany Guyana Singapore Senegal
Greece Honduras South Korea South Africa
Hungary Jamaica Thailand Tanzania
Iceland Mexico Vietnam Uganda
Ireland Nicaragua Zambia
Italy Panama
Kyrgyz Rep. Paraguay
Latvia Peru
Lithuania
Saint Vincent and
the Grenadines
Luxembourg Suriname
Macedonia
Trinidad and
Tobago
Moldova Uruguay
Netherlands Venezuela
Norway
Poland
Portugal
Romania
Russia
Slovakia
Slovenia
Spain
Sweden
Switzerland
Turkey
Ukraine
United Kingdom
Note: Classification according to the World Bank list of economies (July 2015).
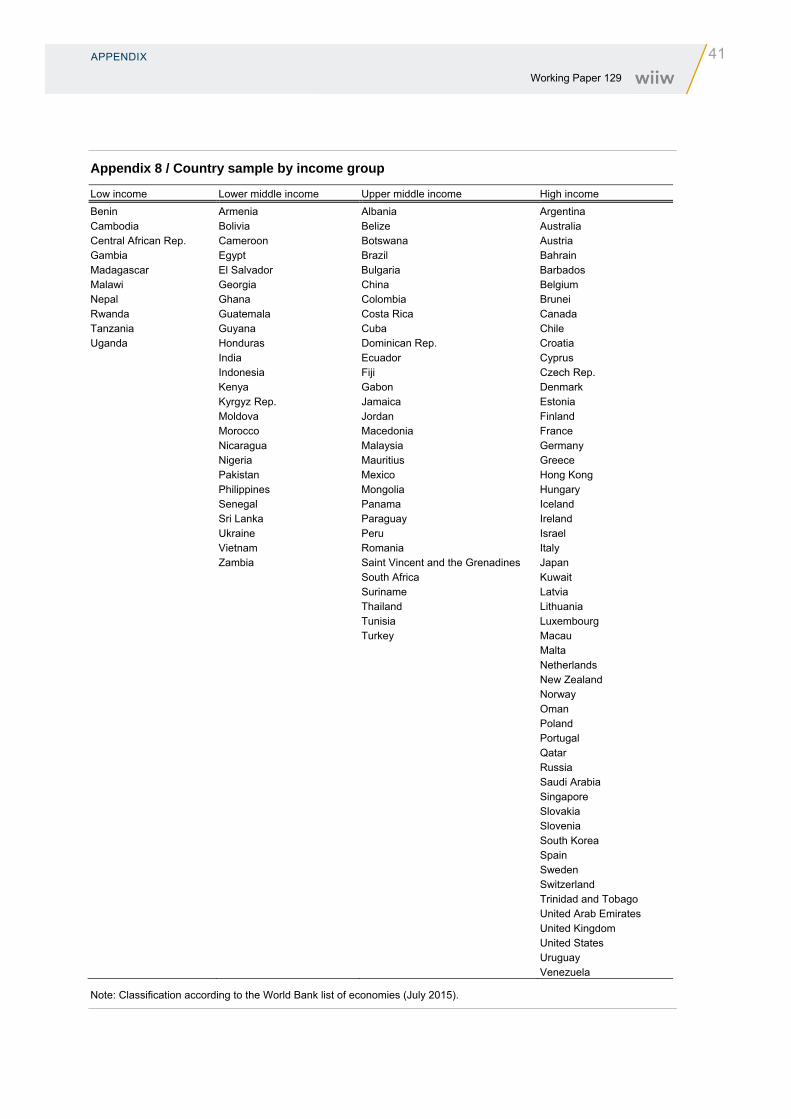
APPENDIX
41 Working Paper 129
Appendix 8 / Country sample by income group
Low income Lower middle income Upper middle income High income
Benin Armenia Albania Argentina Cambodia Bolivia Belize Australia Central African Rep. Cameroon Botswana Austria Gambia Egypt Brazil Bahrain Madagascar El Salvador Bulgaria Barbados Malawi Georgia China Belgium Nepal Ghana Colombia Brunei Rwanda Guatemala Costa Rica Canada Tanzania Guyana Cuba Chile Uganda Honduras Dominican Rep. Croatia India Ecuador Cyprus Indonesia Fiji Czech Rep. Kenya Gabon Denmark Kyrgyz Rep. Jamaica Estonia Moldova Jordan Finland Morocco Macedonia France Nicaragua Malaysia Germany Nigeria Mauritius Greece Pakistan Mexico Hong Kong Philippines Mongolia Hungary Senegal Panama Iceland Sri Lanka Paraguay Ireland Ukraine Peru Israel Vietnam Romania Italy Zambia Saint Vincent and the Grenadines Japan South Africa Kuwait Suriname Latvia Thailand Lithuania Tunisia Luxembourg Turkey Macau Malta Netherlands New Zealand Norway Oman Poland Portugal Qatar Russia Saudi Arabia Singapore Slovakia Slovenia South Korea Spain Sweden Switzerland Trinidad and Tobago United Arab Emirates United Kingdom United States Uruguay Venezuela
Note: Classification according to the World Bank list of economies (July 2015).
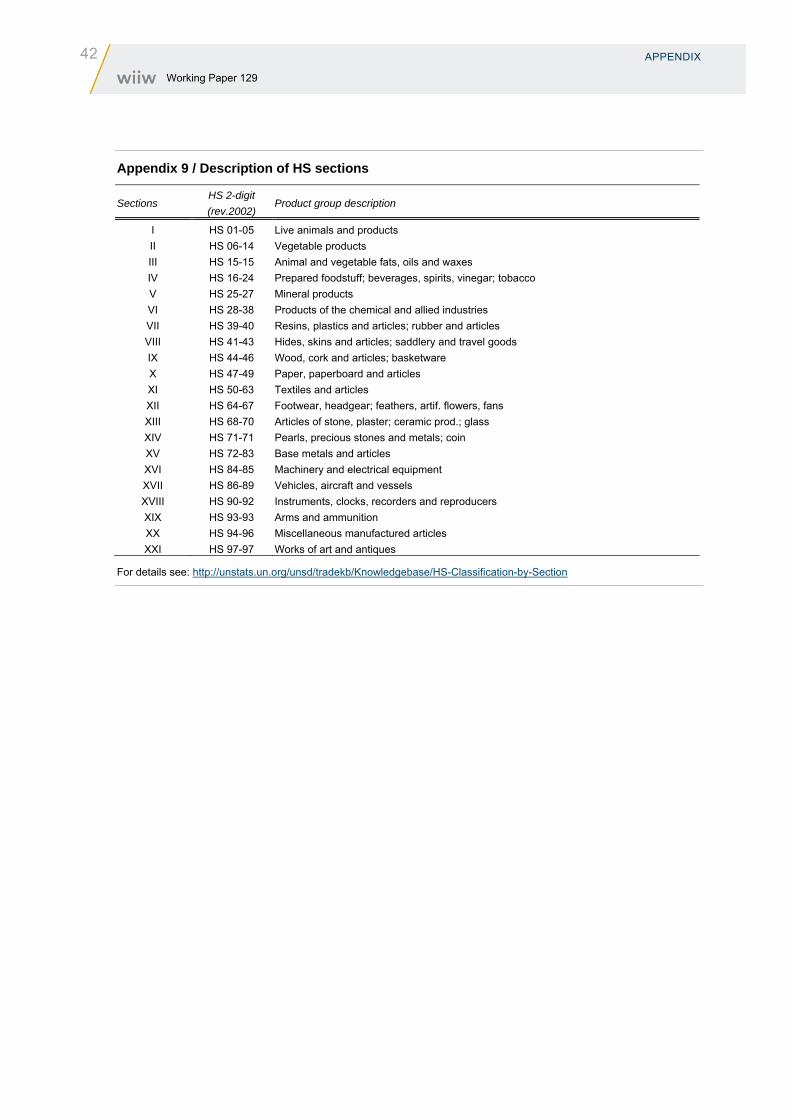
42 APPENDIX Working Paper 129
Appendix 9 / Description of HS sections
Sections HS 2-digit
(rev.2002) Product group description
I HS 01-05 Live animals and products
II HS 06-14 Vegetable products
III HS 15-15 Animal and vegetable fats, oils and waxes
IV HS 16-24 Prepared foodstuff; beverages, spirits, vinegar; tobacco
V HS 25-27 Mineral products
VI HS 28-38 Products of the chemical and allied industries
VII HS 39-40 Resins, plastics and articles; rubber and articles
VIII HS 41-43 Hides, skins and articles; saddlery and travel goods
IX HS 44-46 Wood, cork and articles; basketware
X HS 47-49 Paper, paperboard and articles
XI HS 50-63 Textiles and articles
XII HS 64-67 Footwear, headgear; feathers, artif. flowers, fans
XIII HS 68-70 Articles of stone, plaster; ceramic prod.; glass
XIV HS 71-71 Pearls, precious stones and metals; coin
XV HS 72-83 Base metals and articles
XVI HS 84-85 Machinery and electrical equipment
XVII HS 86-89 Vehicles, aircraft and vessels
XVIII HS 90-92 Instruments, clocks, recorders and reproducers
XIX HS 93-93 Arms and ammunition
XX HS 94-96 Miscellaneous manufactured articles
XXI HS 97-97 Works of art and antiques
For details see: http://unstats.un.org/unsd/tradekb/Knowledgebase/HS-Classification-by-Section
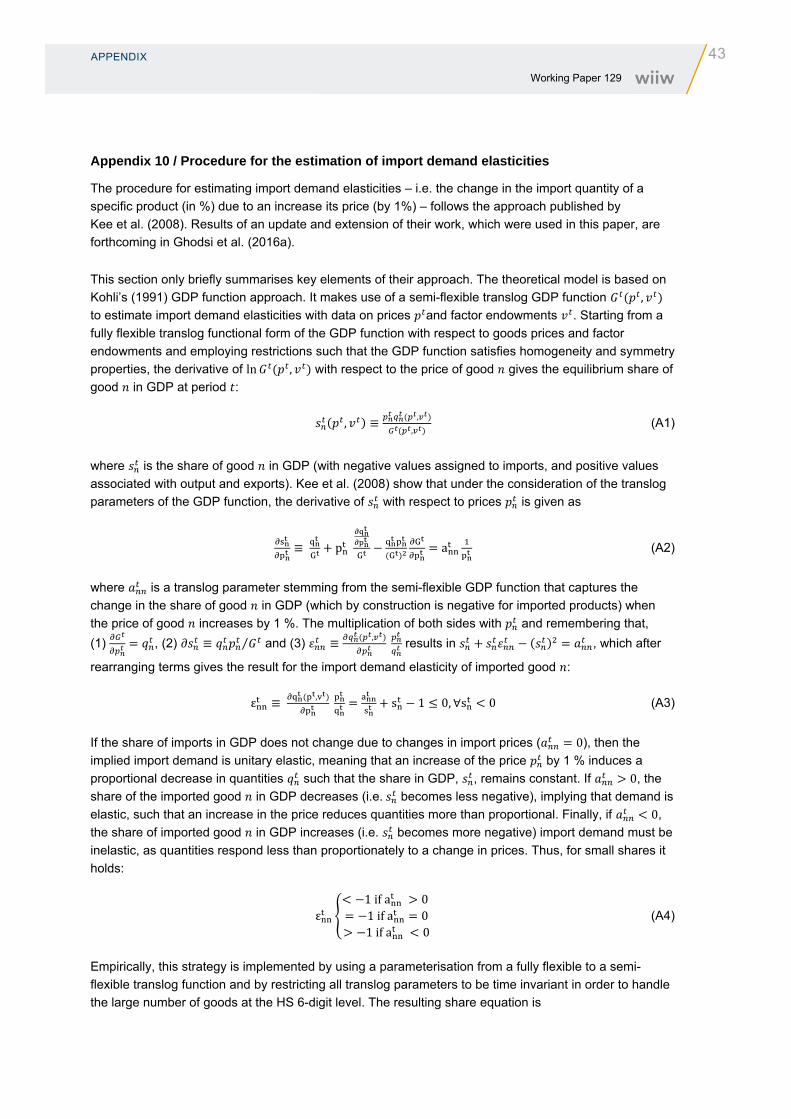
APPENDIX
43 Working Paper 129
Appendix 10 / Procedure for the estimation of import demand elasticities
The procedure for estimating import demand elasticities – i.e. the change in the import quantity of a
specific product (in %) due to an increase its price (by 1%) – follows the approach published by
Kee et al. (2008). Results of an update and extension of their work, which were used in this paper, are
forthcoming in Ghodsi et al. (2016a).
This section only briefly summarises key elements of their approach. The theoretical model is based on
Kohli’s (1991) GDP function approach. It makes use of a semi-flexible translog GDP function ,
to estimate import demand elasticities with data on prices and factor endowments . Starting from a
fully flexible translog functional form of the GDP function with respect to goods prices and factor
endowments and employing restrictions such that the GDP function satisfies homogeneity and symmetry
properties, the derivative of ln , with respect to the price of good gives the equilibrium share of
good in GDP at period :
, ≡,
, (A1)
where is the share of good in GDP (with negative values assigned to imports, and positive values
associated with output and exports). Kee et al. (2008) show that under the consideration of the translog
parameters of the GDP function, the derivative of with respect to prices is given as
≡ p a (A2)
where is a translog parameter stemming from the semi-flexible GDP function that captures the
change in the share of good in GDP (which by construction is negative for imported products) when
the price of good increases by 1 %. The multiplication of both sides with and remembering that,
(1) , (2) ≡ ⁄ and (3) ≡, results in , which after
rearranging terms gives the result for the import demand elasticity of imported good :
ε ≡ , s 1 0, ∀s 0 (A3)
If the share of imports in GDP does not change due to changes in import prices ( 0), then the
implied import demand is unitary elastic, meaning that an increase of the price by 1 % induces a
proportional decrease in quantities such that the share in GDP, , remains constant. If 0, the
share of the imported good in GDP decreases (i.e. becomes less negative), implying that demand is
elastic, such that an increase in the price reduces quantities more than proportional. Finally, if 0,
the share of imported good in GDP increases (i.e. becomes more negative) import demand must be
inelastic, as quantities respond less than proportionately to a change in prices. Thus, for small shares it
holds:
ε1ifa 01ifa 01ifa 0
(A4)
Empirically, this strategy is implemented by using a parameterisation from a fully flexible to a semi-
flexible translog function and by restricting all translog parameters to be time invariant in order to handle
the large number of goods at the HS 6-digit level. The resulting share equation is

44 APPENDIX Working Paper 129
s p , v a a ln c ln v (A5)
where is measured using unit values and is a weighted average of the log prices of all non-
goods, which is approximated with the observed Tornqvist price index of all non- goods. is the
translog parameter associated with factor endowment . Equation A5 is pooled across countries and
years, allowing for country and year fixed effects.
In order to reduce the bias due to endogeneity or measurement errors, we further instrument unit values
using the simple averages of the unit values of the rest of the world in addition to the trade-weighted
average distance of the importing country to all exporting countries of good .
We dealt with extreme values and potential outliers in three steps: First, we dropped the tails of the
distribution (0.5% of either side). Second, we dropped elasticities greater than zero, i.e. we abstained
from analysing goods for which demand increases with higher prices. Finally, we set the minimum
elasticity level at -100, as any price increase cannot decrease quantities by more than 100%.
The density plots in Elasticity Figure 1 show the distribution of elasticities over all country-product pairs,
where the left panel corresponds to the fixed effects estimation, while the right panel shows fixed effects
estimation results when instruments for unit values are implemented. The upper part reports all elasticity
estimation results, while the lower part presents only elasticities significantly different from zero16.
Import-weighted averages (not shown) point towards higher elasticities (closer to -1) for the
manufacturing sector and lower elasticities (closer to 0) for the agri-food sector, especially for richer
countries, including members of the EU.
Appendix Figure 1 / Import demand elasticity estimates over importer-product pairs
Note: FE refers to fixed effects estimation. FEIV refers to fixed-effects estimation with instrumental variables.
16 where . . | . . ⁄ |
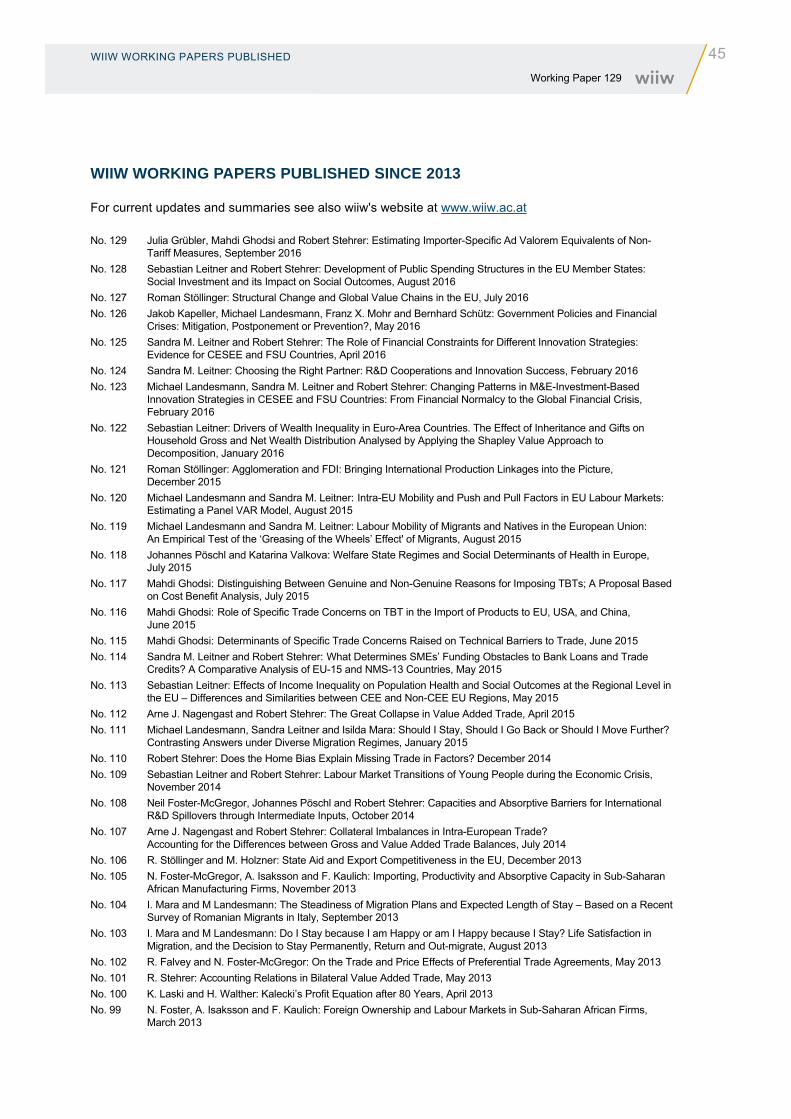
WIIW WORKING PAPERS PUBLISHED
45 Working Paper 129
WIIW WORKING PAPERS PUBLISHED SINCE 2013
For current updates and summaries see also wiiw's website at www.wiiw.ac.at
No. 129 Julia Grübler, Mahdi Ghodsi and Robert Stehrer: Estimating Importer-Specific Ad Valorem Equivalents of Non-Tariff Measures, September 2016
No. 128 Sebastian Leitner and Robert Stehrer: Development of Public Spending Structures in the EU Member States: Social Investment and its Impact on Social Outcomes, August 2016
No. 127 Roman Stöllinger: Structural Change and Global Value Chains in the EU, July 2016
No. 126 Jakob Kapeller, Michael Landesmann, Franz X. Mohr and Bernhard Schütz: Government Policies and Financial Crises: Mitigation, Postponement or Prevention?, May 2016
No. 125 Sandra M. Leitner and Robert Stehrer: The Role of Financial Constraints for Different Innovation Strategies: Evidence for CESEE and FSU Countries, April 2016
No. 124 Sandra M. Leitner: Choosing the Right Partner: R&D Cooperations and Innovation Success, February 2016
No. 123 Michael Landesmann, Sandra M. Leitner and Robert Stehrer: Changing Patterns in M&E-Investment-Based Innovation Strategies in CESEE and FSU Countries: From Financial Normalcy to the Global Financial Crisis, February 2016
No. 122 Sebastian Leitner: Drivers of Wealth Inequality in Euro-Area Countries. The Effect of Inheritance and Gifts on Household Gross and Net Wealth Distribution Analysed by Applying the Shapley Value Approach to Decomposition, January 2016
No. 121 Roman Stöllinger: Agglomeration and FDI: Bringing International Production Linkages into the Picture, December 2015
No. 120 Michael Landesmann and Sandra M. Leitner: Intra-EU Mobility and Push and Pull Factors in EU Labour Markets: Estimating a Panel VAR Model, August 2015
No. 119 Michael Landesmann and Sandra M. Leitner: Labour Mobility of Migrants and Natives in the European Union: An Empirical Test of the ‘Greasing of the Wheels’ Effect' of Migrants, August 2015
No. 118 Johannes Pöschl and Katarina Valkova: Welfare State Regimes and Social Determinants of Health in Europe, July 2015
No. 117 Mahdi Ghodsi: Distinguishing Between Genuine and Non-Genuine Reasons for Imposing TBTs; A Proposal Based on Cost Benefit Analysis, July 2015
No. 116 Mahdi Ghodsi: Role of Specific Trade Concerns on TBT in the Import of Products to EU, USA, and China, June 2015
No. 115 Mahdi Ghodsi: Determinants of Specific Trade Concerns Raised on Technical Barriers to Trade, June 2015
No. 114 Sandra M. Leitner and Robert Stehrer: What Determines SMEs’ Funding Obstacles to Bank Loans and Trade Credits? A Comparative Analysis of EU-15 and NMS-13 Countries, May 2015
No. 113 Sebastian Leitner: Effects of Income Inequality on Population Health and Social Outcomes at the Regional Level in the EU – Differences and Similarities between CEE and Non-CEE EU Regions, May 2015
No. 112 Arne J. Nagengast and Robert Stehrer: The Great Collapse in Value Added Trade, April 2015
No. 111 Michael Landesmann, Sandra Leitner and Isilda Mara: Should I Stay, Should I Go Back or Should I Move Further? Contrasting Answers under Diverse Migration Regimes, January 2015
No. 110 Robert Stehrer: Does the Home Bias Explain Missing Trade in Factors? December 2014
No. 109 Sebastian Leitner and Robert Stehrer: Labour Market Transitions of Young People during the Economic Crisis, November 2014
No. 108 Neil Foster-McGregor, Johannes Pöschl and Robert Stehrer: Capacities and Absorptive Barriers for International R&D Spillovers through Intermediate Inputs, October 2014
No. 107 Arne J. Nagengast and Robert Stehrer: Collateral Imbalances in Intra-European Trade? Accounting for the Differences between Gross and Value Added Trade Balances, July 2014
No. 106 R. Stöllinger and M. Holzner: State Aid and Export Competitiveness in the EU, December 2013
No. 105 N. Foster-McGregor, A. Isaksson and F. Kaulich: Importing, Productivity and Absorptive Capacity in Sub-Saharan African Manufacturing Firms, November 2013
No. 104 I. Mara and M Landesmann: The Steadiness of Migration Plans and Expected Length of Stay – Based on a Recent Survey of Romanian Migrants in Italy, September 2013
No. 103 I. Mara and M Landesmann: Do I Stay because I am Happy or am I Happy because I Stay? Life Satisfaction in Migration, and the Decision to Stay Permanently, Return and Out-migrate, August 2013
No. 102 R. Falvey and N. Foster-McGregor: On the Trade and Price Effects of Preferential Trade Agreements, May 2013
No. 101 R. Stehrer: Accounting Relations in Bilateral Value Added Trade, May 2013
No. 100 K. Laski and H. Walther: Kalecki’s Profit Equation after 80 Years, April 2013
No. 99 N. Foster, A. Isaksson and F. Kaulich: Foreign Ownership and Labour Markets in Sub-Saharan African Firms, March 2013


IMPRESSUM
Herausgeber, Verleger, Eigentümer und Hersteller:
Verein „Wiener Institut für Internationale Wirtschaftsvergleiche“ (wiiw),
Wien 6, Rahlgasse 3
ZVR-Zahl: 329995655
Postanschrift: A 1060 Wien, Rahlgasse 3, Tel: [+431] 533 66 10, Telefax: [+431] 533 66 10 50
Internet Homepage: www.wiiw.ac.at
Nachdruck nur auszugsweise und mit genauer Quellenangabe gestattet.
Offenlegung nach § 25 Mediengesetz: Medieninhaber (Verleger): Verein "Wiener Institut für
Internationale Wirtschaftsvergleiche", A 1060 Wien, Rahlgasse 3. Vereinszweck: Analyse der
wirtschaftlichen Entwicklung der zentral- und osteuropäischen Länder sowie anderer
Transformationswirtschaften sowohl mittels empirischer als auch theoretischer Studien und ihre
Veröffentlichung; Erbringung von Beratungsleistungen für Regierungs- und Verwaltungsstellen,
Firmen und Institutionen.

wiiw.ac.at