Embed Size (px)
Citation preview
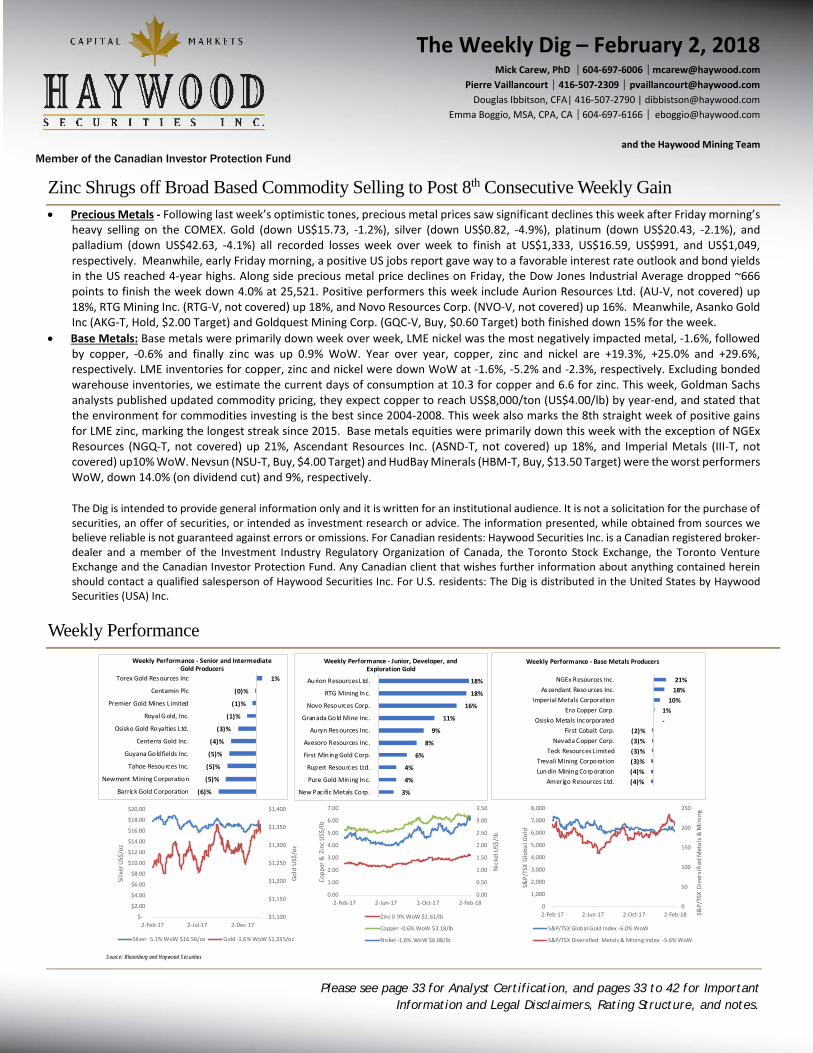
The Weekly Dig – February 2, 2018 Mick Carew, PhD [email protected]
Pierre [email protected] Douglas Ibbitson, CFA| 416-507-2790 | [email protected]
Emma Boggio, MSA, CPA, CA604-697-6166 [email protected]
and the Haywood Mining Team Member of the Canadian Investor Protection Fund
Please see page 33 for Analyst Certification, and pages 33 to 42 for Important Information and Legal Disclaimers, Rating Structure, and notes.
Zinc Shrugs off Broad Based Commodity Selling to Post 8th Consecutive Weekly Gain • Precious Metals - Following last week’s optimistic tones, precious metal prices saw significant declines this week after Friday morning’s
heavy selling on the COMEX. Gold (down US$15.73, -1.2%), silver (down US$0.82, -4.9%), platinum (down US$20.43, -2.1%), and palladium (down US$42.63, -4.1%) all recorded losses week over week to finish at US$1,333, US$16.59, US$991, and US$1,049, respectively. Meanwhile, early Friday morning, a positive US jobs report gave way to a favorable interest rate outlook and bond yields in the US reached 4-year highs. Along side precious metal price declines on Friday, the Dow Jones Industrial Average dropped ~666 points to finish the week down 4.0% at 25,521. Positive performers this week include Aurion Resources Ltd. (AU-V, not covered) up 18%, RTG Mining Inc. (RTG-V, not covered) up 18%, and Novo Resources Corp. (NVO-V, not covered) up 16%. Meanwhile, Asanko Gold Inc (AKG-T, Hold, $2.00 Target) and Goldquest Mining Corp. (GQC-V, Buy, $0.60 Target) both finished down 15% for the week.
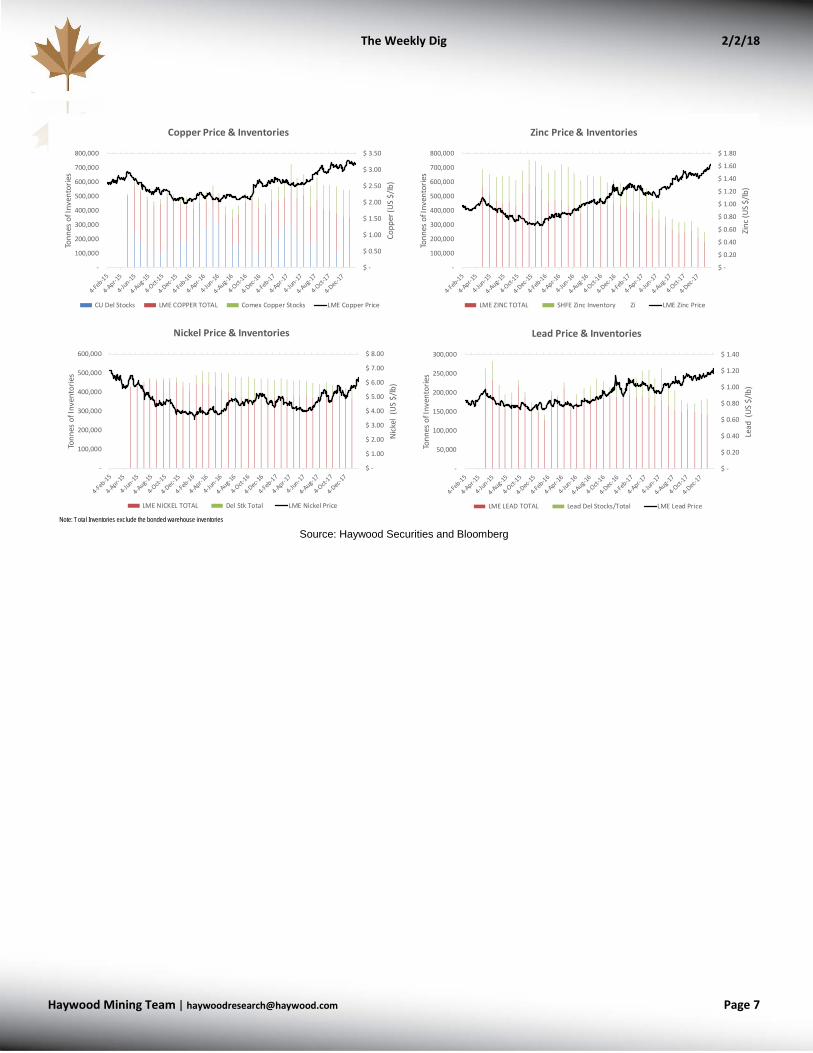
• Base Metals: Base metals were primarily down week over week, LME nickel was the most negatively impacted metal, -1.6%, followed by copper, -0.6% and finally zinc was up 0.9% WoW. Year over year, copper, zinc and nickel are +19.3%, +25.0% and +29.6%, respectively. LME inventories for copper, zinc and nickel were down WoW at -1.6%, -5.2% and -2.3%, respectively. Excluding bonded warehouse inventories, we estimate the current days of consumption at 10.3 for copper and 6.6 for zinc. This week, Goldman Sachs analysts published updated commodity pricing, they expect copper to reach US$8,000/ton (US$4.00/lb) by year-end, and stated that the environment for commodities investing is the best since 2004-2008. This week also marks the 8th straight week of positive gains for LME zinc, marking the longest streak since 2015. Base metals equities were primarily down this week with the exception of NGEx Resources (NGQ-T, not covered) up 21%, Ascendant Resources Inc. (ASND-T, not covered) up 18%, and Imperial Metals (III-T, not covered) up10% WoW. Nevsun (NSU-T, Buy, $4.00 Target) and HudBay Minerals (HBM-T, Buy, $13.50 Target) were the worst performers WoW, down 14.0% (on dividend cut) and 9%, respectively. The Dig is intended to provide general information only and it is written for an institutional audience. It is not a solicitation for the purchase of securities, an offer of securities, or intended as investment research or advice. The information presented, while obtained from sources we believe reliable is not guaranteed against errors or omissions. For Canadian residents: Haywood Securities Inc. is a Canadian registered broker-dealer and a member of the Investment Industry Regulatory Organization of Canada, the Toronto Stock Exchange, the Toronto Venture Exchange and the Canadian Investor Protection Fund. Any Canadian client that wishes further information about anything contained herein should contact a qualified salesperson of Haywood Securities Inc. For U.S. residents: The Dig is distributed in the United States by Haywood Securities (USA) Inc.
Weekly Performance
21% 18%
10% 1% -
(2)%(3)%(3)%(3)%(4)%(4)%
NGEx Resources Inc. Ascendant Resources Inc.
Imperial Metals Corporation Ero Copper Corp.
Osisko Metals Incorporated First Cobalt Corp.
Nevada Copper Corp. Teck Resources Limited
Trevali Mining Corporation Lundin Mining Corporation
Amerigo Resources Ltd.
Weekly Performance - Base Metals Producers
1%
(0)%
(1)%
(1)%
(3)%
(4)%
(5)%
(5)%
(5)%
(6)%
Torex Gold Resources Inc
Centamin Plc
Premier Gold Mines Limited
Royal G old, Inc.
Osisko Gold Royalties Ltd.
Centerra Gold Inc.
Guyana Goldfields Inc.
Tahoe Resources Inc.
Newmont Mining Corporation
Barrick Gold Corporation
Weekly Performance - Senior and Intermediate Gold Producers
18%
18%
16%
11%
9%
8%
6%
4%
4%
3%
Aurion Resources Ltd.
RTG Mining Inc.
Novo Resources Corp.
Granada Gold Mine Inc.
Auryn Resources Inc.
Avesoro Resources Inc.
First Mining Gold Corp.
Rupert Resources Ltd.
Pure Gold Mining Inc.
New Pacific Metals Corp.
Weekly Performance - Junior, Developer, and Exploration Gold
1
Source: Bloomberg and Haywood Securities
$1,100
$1,150
$1,200
$1,250
$1,300
$1,350
$1,400
$-
$2.00
$4.00
$6.00
$8.00
$10.00
$12.00
$14.00
$16.00
$18.00
$20.00
2-Feb-17 2-Jul-17 2-Dec-17
Gold
US$
/oz
Silv
er U
S$/o
z
Silver -5.1% WoW $16.56/oz Gold -1.6% WoW $1,335/oz
0.00
1.00
2.00
3.00
4.00
5.00
6.00
7.00
2-Feb-17 2-Jun-17 2-Oct-17 2-Feb-180.00
0.50
1.00
1.50
2.00
2.50
3.00
3.50
Copp
er &
Zin
c US$
/lb
Nick
el U
S$/l
b
Zinc 0.9% WoW $1.61/lb
Copper -0.6% WoW $3.18/lb
Nickel -1.6% WoW $6.08/lb
0
1,000
2,000
3,000
4,000
5,000
6,000
7,000
8,000
2-Feb-17 2-Jun-17 2-Oct-17 2-Feb-180
50
100
150
200
250
S&P/
TSX
Glob
al G
old
S&P/
TSX
Dive
rsifi
ed M
etal
s & M
inin
g
S&P/TSX Global Gold Index -6.0% WoW
S&P/TSX Diversified Metals & Mining Index -5.6% WoW
The Weekly Dig 2/2/18
Haywood Mining [email protected] Page 2
Contents Haywood Research: The Week in Review ............................................................................................................. 3
Weekly Commodities ............................................................................................................................................ 4
Commodities Prices and Inventories .................................................................................................................... 5
Commodities and ETFs ......................................................................................................................................... 8
Upcoming Macroeconomic News .......................................................................................................................10
Weekly Indices .....................................................................................................................................................11
Weekly Equities ....................................................................................................................................................12
Precious Metals Companies ...............................................................................................................................12
Base Metals Companies ......................................................................................................................................15
Major International Miners ................................................................................................................................16
Tables Comparables Tables: Consensus and Haywood Forecasts/Multiples, Plus Market Valuations for In Situ Resources .............................................................................................................................................................17
Precious Metals Companies ...............................................................................................................................17
Base Metals Companies ......................................................................................................................................25
Other Companies (Uranium, Diamond, Cobalt, Uranium, Coal, Iron) ................................................................28
Junior Exploration Companies Review: Performance of Companies Included in Junior X and Upcoming Catalysts ..............................................................................................................................................................................31

The Weekly Dig 2/2/18
Haywood Mining [email protected] Page 3
Haywood Research: The Week in Review – Covered Companies Publications from the Haywood Research team for the week included the following for covered companies:
• Nevsun Resources Ltd. (NSU-T, C$2.57): 2018 outlook and guidance
• Pure Gold Mining Inc. (PGM-V, $0.59): Drilling results
• OceanaGold Corporation (OGC-T, OGC-AU; C$3.39): 2018 outlook and guidance • Denison Mines Corp. (DML-T, C$0.58; DNN-US, US$0.47): Resource upgrade
Nevsun Resources Ltd. (NSU-T, C$2.57 [Buy Rating, $4.00 Target Price]) – 2018 Guidance As Expected
Pierre Vaillancourt, [email protected]; Douglas Ibbitson, CFA, [email protected] Nevsun provided 2018 outlook and guidance. Overall, the Company guided to a 10% increase in zinc production at Bisha relative to 2017, but otherwise was in line with our estimates. The dividend cut may have a near-term impact on the stock.
See Haywood Securities for the full report
Pure Gold Mining Inc. (PGM-V, $0.59 [Buy Rating, $1.00 Target Price]) – Discovery of New Target South of Madsen Mine Mick Carew, PhD, [email protected]; Emma Boggio, MSA, CPA, CA, [email protected]
Pure Gold announced the discovery of another zone of high-grade gold mineralization located to the southwest of the Fork Zone. This new discovery, named the Wedge Zone, extends the overall strike length of the Madsen Mine Trend to ~4 kilometres, with numerous zones of untested ground along the 4-kilometre strike length. The new discovery is located approximately 3 kilometres south (by road) from the Madsen processing plant.
See Haywood Securities for the full report
OceanaGold Corporation (OGC-T, OGC-AU; C$3.39 [Hold Rating, $4.20 Target Price]) – 2018 Guidance in Line, Drop in Year-on-Year Production Anticipated Geordie Mark, PhD, FAusIMM, [email protected]; Alvin Islam, GIT, [email protected]
Corporate level 2018 guidance was broadly in line with our expectations, with our gold production estimate near the top of the range of guidance, and copper production below the lower end of the range. However, lower output from Didipio and Waihi is anticipated to culminate in negative year-on-year production.
See Haywood Securities for the full report
Denison Mines Corp. (DML-T, C$0.58; DNN-US, US$0.47 [Buy Rating, $1.80 Target Price]) – Gryphon ‘all-categories’ Resource Increases >48%, Lifts Wheeler ‘Indicated’ by 88% Colin Healey, MBA, [email protected]; Aazan Habib, [email protected]
Earlier this week Denison announced a resource update for Gryphon Zone at its 63.3%-owned Wheeler River Project. The latest update to the Gryphon Zone resource brings combined Wheeler River Project resources to just over 135 Mlb U3O8 (at ~3.3% U3O8), slightly better than our pre-announcement estimate of 130 Mlb U3O8, with expected positive implications for economics at the Wheeler River project. With the new update Denison has increased total “indicated” resources at the Wheeler River project (Phoenix + Gryphon deposits) by 88% to >132 million lb U3O8, with a large conversion of ‘inferred’ resources at the Gryphon zone to the higher confidence ‘indicated’ category.
See Haywood Securities for the full report
The Weekly Dig 2/2/18
Haywood Mining [email protected] Page 4
Weekly Commodities
Source: Haywood Securities and Bloomberg
.
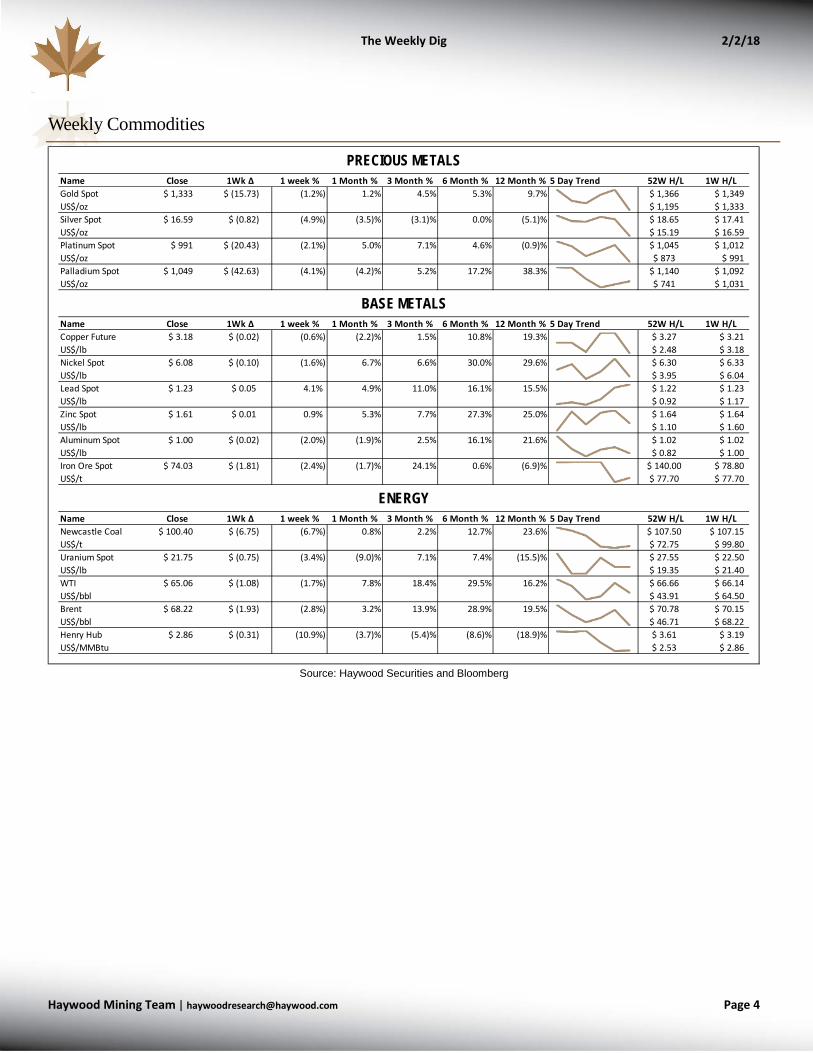
Name Close 1Wk Δ 1 week % 1 Month % 3 Month % 6 Month % 12 Month % 5 Day Trend 52W H/L 1W H/LGold Spot $ 1,333 $ (15.73) (1.2%) 1.2% 4.5% 5.3% 9.7% $ 1,366 $ 1,349US$/oz $ 1,195 $ 1,333Silver Spot $ 16.59 $ (0.82) (4.9%) (3.5)% (3.1)% 0.0% (5.1)% $ 18.65 $ 17.41US$/oz $ 15.19 $ 16.59Platinum Spot $ 991 $ (20.43) (2.1%) 5.0% 7.1% 4.6% (0.9)% $ 1,045 $ 1,012US$/oz $ 873 $ 991Palladium Spot $ 1,049 $ (42.63) (4.1%) (4.2)% 5.2% 17.2% 38.3% $ 1,140 $ 1,092US$/oz $ 741 $ 1,031
Name Close 1Wk Δ 1 week % 1 Month % 3 Month % 6 Month % 12 Month % 5 Day Trend 52W H/L 1W H/LCopper Future $ 3.18 $ (0.02) (0.6%) (2.2)% 1.5% 10.8% 19.3% $ 3.27 $ 3.21US$/lb $ 2.48 $ 3.18Nickel Spot $ 6.08 $ (0.10) (1.6%) 6.7% 6.6% 30.0% 29.6% $ 6.30 $ 6.33US$/lb $ 3.95 $ 6.04Lead Spot $ 1.23 $ 0.05 4.1% 4.9% 11.0% 16.1% 15.5% $ 1.22 $ 1.23US$/lb $ 0.92 $ 1.17Zinc Spot $ 1.61 $ 0.01 0.9% 5.3% 7.7% 27.3% 25.0% $ 1.64 $ 1.64US$/lb $ 1.10 $ 1.60Aluminum Spot $ 1.00 $ (0.02) (2.0%) (1.9)% 2.5% 16.1% 21.6% $ 1.02 $ 1.02US$/lb $ 0.82 $ 1.00Iron Ore Spot $ 74.03 $ (1.81) (2.4%) (1.7)% 24.1% 0.6% (6.9)% $ 140.00 $ 78.80US$/t $ 77.70 $ 77.70
Name Close 1Wk Δ 1 week % 1 Month % 3 Month % 6 Month % 12 Month % 5 Day Trend 52W H/L 1W H/LNewcastle Coal $ 100.40 $ (6.75) (6.7%) 0.8% 2.2% 12.7% 23.6% $ 107.50 $ 107.15US$/t $ 72.75 $ 99.80Uranium Spot $ 21.75 $ (0.75) (3.4%) (9.0)% 7.1% 7.4% (15.5)% $ 27.55 $ 22.50US$/lb $ 19.35 $ 21.40WTI $ 65.06 $ (1.08) (1.7%) 7.8% 18.4% 29.5% 16.2% $ 66.66 $ 66.14US$/bbl $ 43.91 $ 64.50Brent $ 68.22 $ (1.93) (2.8%) 3.2% 13.9% 28.9% 19.5% $ 70.78 $ 70.15US$/bbl $ 46.71 $ 68.22Henry Hub $ 2.86 $ (0.31) (10.9%) (3.7)% (5.4)% (8.6)% (18.9)% $ 3.61 $ 3.19US$/MMBtu $ 2.53 $ 2.86
.
PRECIOUS METALS
BASE METALS
ENERGY

The Weekly Dig 2/2/18
Haywood Mining [email protected] Page 5
Commodities Prices and Inventories
Precious Metals
Source: Haywood Securities and Bloomberg
Commodities LME Spot Price Weekly Δ YTD Δ 1 Year ΔGold US$ 1,333 /oz -1.2% -0.6% -0.6%Silver US$ 16.60 /oz -4.6% -2.1% -5.0%
Platinum US$ 992 /oz -2.0% 6.6% -0.9%
Spot Price
(6.0%)
(4.0%)
(2.0%)
-
2.0%
4.0%
6.0%
Precious Metals Weekly Change (12 weeks)Gold Spot Silver Spot Platinum Spot

The Weekly Dig 2/2/18
Haywood Mining [email protected] Page 6
Base Metals
Source: Haywood Securities and Bloomberg
Commodities LME Spot Price Weekly Δ YTD Δ 1 Year ΔCopper US$ 3.18 /lb -0.6% -2.8% 19.3%
Zinc US$ 1.61 /lb 0.9% 6.4% 25.0%Nickel US$ 6.08 /lb -1.6% 5.5% 29.6%
Commodities LME Inventory Weekly Δ Total (t) YTD Δ 1 Year Δ Days of Consumption
Copper 304,325 -1.6% 680,855 24% 19% 10.3 Zinc 168,800 -5.2% 263,569 5% -53% 6.6
Nickel 353,592 -2.3% 409,786 -1% -13% 74.1
.
LME Inventory Total Inventory Excluding Bonded Warehouse Inventory
Spot Price
(8.0%)
(6.0%)
(4.0%)
(2.0%)
-
2.0%
4.0%
6.0%
8.0%
10.0%
12.0%
Base Metals Weekly Change (12 weeks)LME Copper Spot LME Zinc Spot LME Nickel Spot
The Weekly Dig 2/2/18
Haywood Mining [email protected] Page 7
Source: Haywood Securities and Bloomberg
1
Note: Total Inventories exclude the bonded warehouse inventories
24-Nov-1424-Dec-1424-Jan-1524-Feb-1524-Mar-1524-Apr-1524-May-1524-Jun-1524-Jul-1524-Aug-1524-Sep-1524-Oct-1524-Nov-1524-Dec-1524-Jan-1624-Feb-1624-Mar-1624-Apr-1624-May-1624-Jun-1624-Jul-1624-Aug-1624-Sep-1624-Oct-1624-Nov-1624-Dec-1624-Jan-1724-Feb-1724-Mar-1724-Apr-1724-May-1724-Jun-1724-Jul-1724-Aug-1724-Sep-1724-Oct-1724-Nov-1724-Dec-1724-Jan-18
-
100,000
200,000
300,000
400,000
500,000
600,000
700,000
800,000
$ -
$ 0.50
$ 1.00
$ 1.50
$ 2.00
$ 2.50
$ 3.00
$ 3.50
Tonn
es o
f Inv
ento
ries
Copp
er (U
S $/
lb)
Copper Price & Inventories
CU Del Stocks LME COPPER TOTAL Comex Copper Stocks LME Copper Price
24-Nov-1424-Dec-1424-Jan-1524-Feb-1524-Mar-1524-Apr-1524-May-1524-Jun-1524-Jul-1524-Aug-1524-Sep-1524-Oct-1524-Nov-1524-Dec-1524-Jan-1624-Feb-1624-Mar-1624-Apr-1624-May-1624-Jun-1624-Jul-1624-Aug-1624-Sep-1624-Oct-1624-Nov-1624-Dec-1624-Jan-1724-Feb-1724-Mar-1724-Apr-1724-May-1724-Jun-1724-Jul-1724-Aug-1724-Sep-1724-Oct-1724-Nov-1724-Dec-1724-Jan-18
-
100,000
200,000
300,000
400,000
500,000
600,000
700,000
800,000
$ -
$ 0.20
$ 0.40
$ 0.60
$ 0.80
$ 1.00
$ 1.20
$ 1.40
$ 1.60
$ 1.80
Tonn
es o
f Inv
ento
ries
Zinc
(US $
/lb)
Zinc Price & Inventories
LME ZINC TOTAL SHFE Zinc Inventory Zi LME Zinc Price
24-Nov-1424-Dec-1424-Jan-1524-Feb-1524-Mar-1524-Apr-1524-May-1524-Jun-1524-Jul-1524-Aug-1524-Sep-1524-Oct-1524-Nov-1524-Dec-1524-Jan-1624-Feb-1624-Mar-1624-Apr-1624-May-1624-Jun-1624-Jul-1624-Aug-1624-Sep-1624-Oct-1624-Nov-1624-Dec-1624-Jan-1724-Feb-1724-Mar-1724-Apr-1724-May-1724-Jun-1724-Jul-1724-Aug-1724-Sep-1724-Oct-1724-Nov-1724-Dec-1724-Jan-18
-
100,000
200,000
300,000
400,000
500,000
600,000
$ -
$ 1.00
$ 2.00
$ 3.00
$ 4.00
$ 5.00
$ 6.00
$ 7.00
$ 8.00
Tonn
es o
f Inv
ento
ries
Nick
el (
US $
/lb)
Nickel Price & Inventories
LME NICKEL TOTAL Del Stk Total LME Nickel Price
24-Nov-1424-Dec-1424-Jan-1524-Feb-1524-Mar-1524-Apr-1524-May-1524-Jun-1524-Jul-1524-Aug-1524-Sep-1524-Oct-1524-Nov-1524-Dec-1524-Jan-1624-Feb-1624-Mar-1624-Apr-1624-May-1624-Jun-1624-Jul-1624-Aug-1624-Sep-1624-Oct-1624-Nov-1624-Dec-1624-Jan-1724-Feb-1724-Mar-1724-Apr-1724-May-1724-Jun-1724-Jul-1724-Aug-1724-Sep-1724-Oct-1724-Nov-1724-Dec-1724-Jan-18
-
50,000
100,000
150,000
200,000
250,000
300,000
$ -
$ 0.20
$ 0.40
$ 0.60
$ 0.80
$ 1.00
$ 1.20
$ 1.40
Tonn
es o
f Inv
ento
ries
Lead
(US
$/lb
)
Lead Price & Inventories
LME LEAD TOTAL Lead Del Stocks/Total LME Lead Price

The Weekly Dig 2/2/18
Haywood Mining [email protected] Page 8
Commodities and ETFs: A Week in Action
Gold – 1-Year US$/oz (left) and Total ETF Holdings (right)
• Spot: Loss (-1.2%) for the week • ETF Holdings: 72,486,157 ounces, up
34,497 ounces for the week
Silver – 1-Year US$/oz (left) and Total ETF Holdings (right)
• Spot: Loss (-4.7%) for the week • ETF Holdings: 645,431,656 ounces, down
1,705,995 ounces for the week
Platinum – 1-Year US$/oz (left) and Total ETF Holdings (right)
• Spot: Loss (-2.0%) for the week • ETF Holdings: 2,504,540 ounces, up 7,591
ounces for the week
Palladium – 1-Year US$/oz (left) and Total ETF Holdings (right)
• Spot: Loss (-3.9%) for the week • ETF Holdings: 1,240,495 ounces, down
16,103 ounces for the week
Copper – 1-Year US$/lb (left) and LME Inventory (right)
• Futures: Loss (-0.6%) for the week • LME Copper: 304,325 tonnes, down
4,800 tonnes for the week
$1,000
$1,100
$1,200
$1,300
$1,400
Feb-17 Jan-18Gold ($/oz)
Price100D MA
58
63
68
73
Feb-17 Jan-18Gold ETF Holdings (Moz)
$13.00
$16.00
$19.00
Feb-17 Jan-18Silver ($/oz)
Price
100D MA
630
650
670
690
Feb-17 Jan-18Silver ETF Holdings (Moz)
$800
$1,000
$1,200
Feb-17 Jan-18Platinum ($/oz)
Price
100D MA
2.2
2.4
2.6
Feb-17 Jan-18Platinum ETF Holdings (Moz)
$460
$960
$1,460
Feb-17 Jan-18Palladium ($/oz)
Price
100D MA
1.3
1.5
1.7
Feb-17 Jan-18Palladium ETF Holdings (Moz)
$2.00
$2.50
$3.00
$3.50
Feb-17 Jan-18Copper ($/lb)
Price
100D MA
130,000
230,000
330,000
Feb-17 Jan-18LME Copper Inventories (t)
The Weekly Dig 2/2/18
Haywood Mining [email protected] Page 9
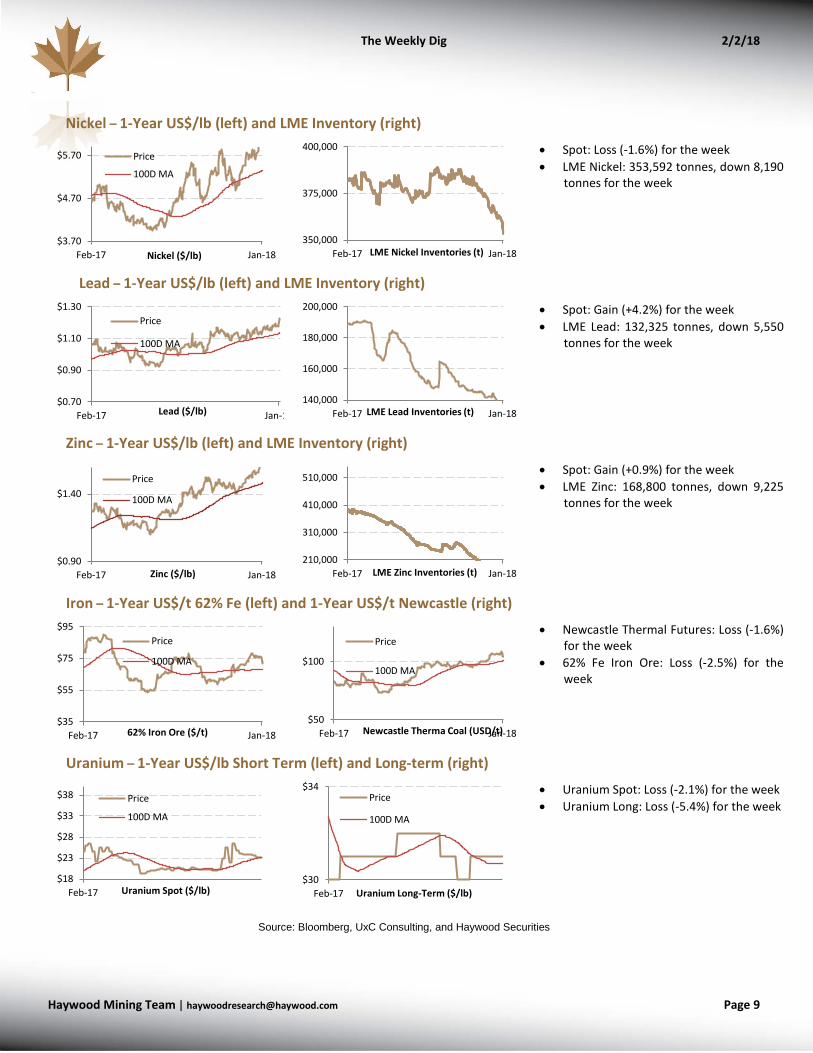
Nickel – 1-Year US$/lb (left) and LME Inventory (right)
• Spot: Loss (-1.6%) for the week • LME Nickel: 353,592 tonnes, down 8,190
tonnes for the week
Lead – 1-Year US$/lb (left) and LME Inventory (right)
• Spot: Gain (+4.2%) for the week • LME Lead: 132,325 tonnes, down 5,550
tonnes for the week
Zinc – 1-Year US$/lb (left) and LME Inventory (right)
• Spot: Gain (+0.9%) for the week • LME Zinc: 168,800 tonnes, down 9,225
tonnes for the week
Iron – 1-Year US$/t 62% Fe (left) and 1-Year US$/t Newcastle (right)
• Newcastle Thermal Futures: Loss (-1.6%) for the week
• 62% Fe Iron Ore: Loss (-2.5%) for the week
Uranium – 1-Year US$/lb Short Term (left) and Long-term (right)
• Uranium Spot: Loss (-2.1%) for the week • Uranium Long: Loss (-5.4%) for the week
Source: Bloomberg, UxC Consulting, and Haywood Securities
$3.70
$4.70
$5.70
Feb-17 Jan-18Nickel ($/lb)
Price
100D MA
350,000
375,000
400,000
Feb-17 Jan-18LME Nickel Inventories (t)
$0.70
$0.90
$1.10
$1.30
Feb-17 Jan-1Lead ($/lb)
Price
100D MA
140,000
160,000
180,000
200,000
Feb-17 Jan-18LME Lead Inventories (t)
$0.90
$1.40
Feb-17 Jan-18Zinc ($/lb)
Price
100D MA
210,000
310,000
410,000
510,000
Feb-17 Jan-18LME Zinc Inventories (t)
$35
$55
$75
$95
Feb-17 Jan-1862% Iron Ore ($/t)
Price
100D MA
$50
$100
Feb-17 Jan-18Newcastle Therma Coal (USD/t)
Price
100D MA
$18
$23
$28
$33
$38
Feb-17 Uranium Spot ($/lb)
Price
100D MA
$30
$34
Feb-17 Uranium Long-Term ($/lb)
Price
100D MA

The Weekly Dig 2/2/18
Haywood Mining [email protected] Page 10
Upcoming Macroeconomic News and Events
Source: Bloomberg
Date Event Period Survey Prior Relevance
United States02/05/2018 Markit US Services PMI Jan F 53.3 53.3 7002/05/2018 Markit US Composite PMI Jan F -- 53.8 7002/05/2018 ISM Non-Manf. Composite Jan 56.7 55.9 7802/06/2018 Trade Balance Dec -$52.0b -$50.5b 8402/07/2018 MBA Mortgage Applications 2-Feb -- -2.60% 9202/08/2018 Initial Jobless Claims 3-Feb 233k 230k 9802/08/2018 Continuing Claims 27-Jan 1940k 1953k 6902/08/2018 Bloomberg Consumer Comfort 4-Feb -- 54.6 6802/09/2018 Wholesale Inventories MoM Dec F 0.20% 0.20% 81
Date Event Period Survey Prior Relevance
Canada02/06/2018 Int'l Merchandise Trade Dec -2.25b -2.54b 6402/07/2018 Building Permits MoM Dec 2.00% -7.70% 7602/08/2018 Housing Starts Jan 210.0k 217.0k 8102/08/2018 New Housing Price Index MoM Dec -- 0.10% 7102/09/2018 Net Change in Employment Jan 11.5k 78.6k 8602/09/2018 Unemployment Rate Jan 5.80% 5.70% 90
Date Event Period Survey Prior Relevance
China02/06/2018 Foreign Reserves Jan $3170.0b $3139.9b 6102/07/2018 Trade Balance Jan $54.70b $54.69b 7602/07/2018 Imports YoY Jan 11.20% 4.50% 6702/07/2018 Exports YoY Jan 11.30% 10.90% 7302/08/2018 PPI YoY Jan 4.20% 4.90% 9102/08/2018 CPI YoY Jan 1.50% 1.80% 97

The Weekly Dig 2/2/18
Haywood Mining [email protected] Page 11
Weekly Indices
Source: Bloomberg and Haywood Securities
.
.
182184186188190192194196198200202
15,30015,40015,50015,60015,70015,80015,90016,00016,10016,20016,300
Gold
Inde
x
Com
posi
te In
dex
S&P/TSX Composite Index -3.9% WoW
S&P/TSX Global Gold Index -6.0% WoW
126
128
130
132
134
136
138
140
142
15,30015,40015,50015,60015,70015,80015,90016,00016,10016,20016,300
Base
Met
als
Inde
x
Com
posi
te In
dex
S&P/TSX Composite Index -3.9% WoW
S&P/TSX Global Base Metals Index -5.9% WoW
760
780
800
820
840
860
880
900
1,5101,5201,5301,5401,5501,5601,5701,5801,5901,6001,6101,620
S&P/
TSX
Vent
ure
Com
p In
dex
Russ
ell 2
000
Inde
x
Russell 2000 Index -3.8% WoW
S&P/TSX Venture Comp Index -8.9% WoW
2,700
2,720
2,740
2,760
2,780
2,800
2,820
2,840
2,860
2,880S&
P 50
0 In
dex
S&P 500 Index -3.9% WoW
180
185
190
195
200
205
NYSE
ARC
A Ex
chan
ge G
old
BUGS
Ind
ex
NYSE ARCA Exchange Gold BUGS Index -7.5% WoW
620
630
640
650
660
670
680
690
NYSE
Arc
a Go
ld M
iner
s Ind
ex
NYSE Arca Gold Miners Index -5.9% WoW
The Weekly Dig 2/2/18
Haywood Mining [email protected] Page 12
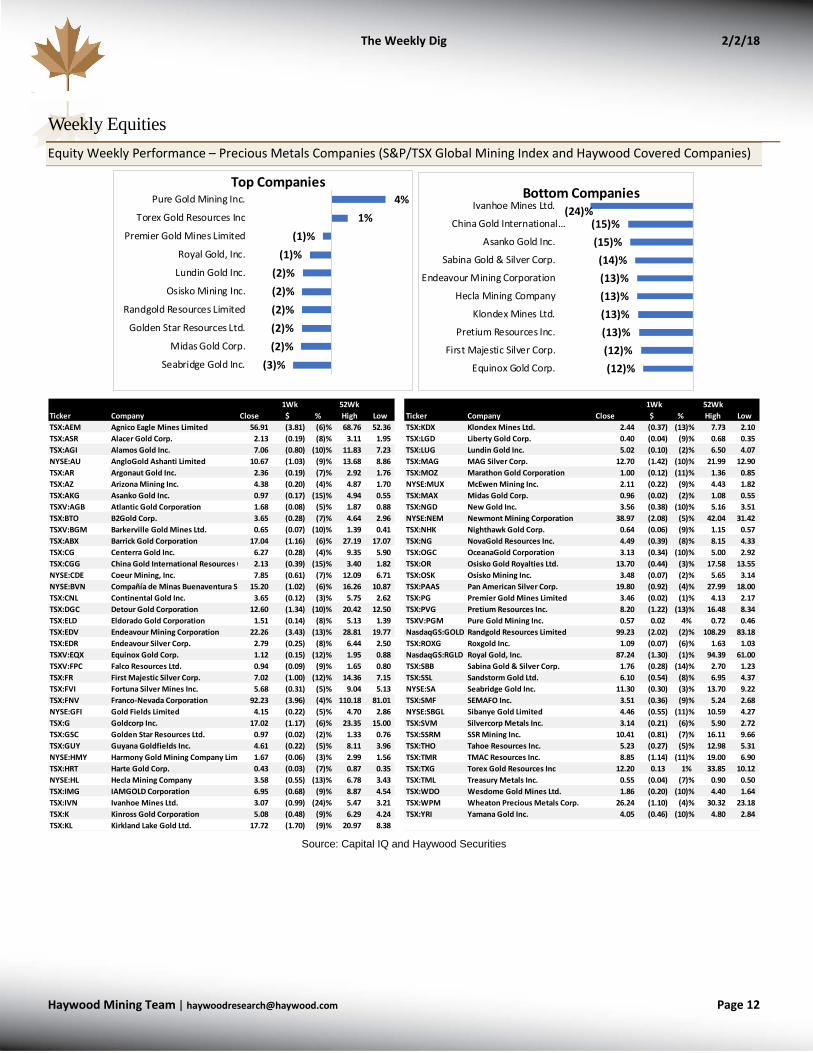
Weekly Equities Equity Weekly Performance – Precious Metals Companies (S&P/TSX Global Mining Index and Haywood Covered Companies)
Source: Capital IQ and Haywood Securities
4% 1%
(1)%(1)%
(2)%(2)%(2)%(2)%(2)%
(3)%
Pure Gold Mining Inc.
Torex Gold Resources Inc
Premier Gold Mines Limited
Royal Gold, Inc.
Lundin Gold Inc.
Osisko Mining Inc.
Randgold Resources Limited
Golden Star Resources Ltd.
Midas Gold Corp.
Seabridge Gold Inc.
Top Companies
(24)%(15)%(15)%(14)%(13)%(13)%(13)%(13)%(12)%(12)%
Ivanhoe Mines Ltd.
China Gold International…
Asanko Gold Inc.
Sabina Gold & Silver Corp.
Endeavour Mining Corporation
Hecla Mining Company
Klondex Mines Ltd.
Pretium Resources Inc.
First Majestic Silver Corp.
Equinox Gold Corp.
Bottom Companies
1Wk 52Wk 1Wk 52WkTicker Company Close $∆ %∆ High Low Ticker Company Close $∆ %∆ High LowTSX:AEM Agnico Eagle Mines Limited 56.91 (3.81) (6)% 68.76 52.36 TSX:KDX Klondex Mines Ltd. 2.44 (0.37) (13)% 7.73 2.10 TSX:ASR Alacer Gold Corp. 2.13 (0.19) (8)% 3.11 1.95 TSX:LGD Liberty Gold Corp. 0.40 (0.04) (9)% 0.68 0.35 TSX:AGI Alamos Gold Inc. 7.06 (0.80) (10)% 11.83 7.23 TSX:LUG Lundin Gold Inc. 5.02 (0.10) (2)% 6.50 4.07 NYSE:AU AngloGold Ashanti Limited 10.67 (1.03) (9)% 13.68 8.86 TSX:MAG MAG Silver Corp. 12.70 (1.42) (10)% 21.99 12.90 TSX:AR Argonaut Gold Inc. 2.36 (0.19) (7)% 2.92 1.76 TSX:MOZ Marathon Gold Corporation 1.00 (0.12) (11)% 1.36 0.85 TSX:AZ Arizona Mining Inc. 4.38 (0.20) (4)% 4.87 1.70 NYSE:MUX McEwen Mining Inc. 2.11 (0.22) (9)% 4.43 1.82 TSX:AKG Asanko Gold Inc. 0.97 (0.17) (15)% 4.94 0.55 TSX:MAX Midas Gold Corp. 0.96 (0.02) (2)% 1.08 0.55 TSXV:AGB Atlantic Gold Corporation 1.68 (0.08) (5)% 1.87 0.88 TSX:NGD New Gold Inc. 3.56 (0.38) (10)% 5.16 3.51 TSX:BTO B2Gold Corp. 3.65 (0.28) (7)% 4.64 2.96 NYSE:NEM Newmont Mining Corporation 38.97 (2.08) (5)% 42.04 31.42 TSXV:BGM Barkerville Gold Mines Ltd. 0.65 (0.07) (10)% 1.39 0.41 TSX:NHK Nighthawk Gold Corp. 0.64 (0.06) (9)% 1.15 0.57 TSX:ABX Barrick Gold Corporation 17.04 (1.16) (6)% 27.19 17.07 TSX:NG NovaGold Resources Inc. 4.49 (0.39) (8)% 8.15 4.33 TSX:CG Centerra Gold Inc. 6.27 (0.28) (4)% 9.35 5.90 TSX:OGC OceanaGold Corporation 3.13 (0.34) (10)% 5.00 2.92 TSX:CGG China Gold International Resources C 2.13 (0.39) (15)% 3.40 1.82 TSX:OR Osisko Gold Royalties Ltd. 13.70 (0.44) (3)% 17.58 13.55 NYSE:CDE Coeur Mining, Inc. 7.85 (0.61) (7)% 12.09 6.71 TSX:OSK Osisko Mining Inc. 3.48 (0.07) (2)% 5.65 3.14 NYSE:BVN Compañía de Minas Buenaventura S. 15.20 (1.02) (6)% 16.26 10.87 TSX:PAAS Pan American Silver Corp. 19.80 (0.92) (4)% 27.99 18.00 TSX:CNL Continental Gold Inc. 3.65 (0.12) (3)% 5.75 2.62 TSX:PG Premier Gold Mines Limited 3.46 (0.02) (1)% 4.13 2.17 TSX:DGC Detour Gold Corporation 12.60 (1.34) (10)% 20.42 12.50 TSX:PVG Pretium Resources Inc. 8.20 (1.22) (13)% 16.48 8.34 TSX:ELD Eldorado Gold Corporation 1.51 (0.14) (8)% 5.13 1.39 TSXV:PGM Pure Gold Mining Inc. 0.57 0.02 4% 0.72 0.46 TSX:EDV Endeavour Mining Corporation 22.26 (3.43) (13)% 28.81 19.77 NasdaqGS:GOLD Randgold Resources Limited 99.23 (2.02) (2)% 108.29 83.18 TSX:EDR Endeavour Silver Corp. 2.79 (0.25) (8)% 6.44 2.50 TSX:ROXG Roxgold Inc. 1.09 (0.07) (6)% 1.63 1.03 TSXV:EQX Equinox Gold Corp. 1.12 (0.15) (12)% 1.95 0.88 NasdaqGS:RGLD Royal Gold, Inc. 87.24 (1.30) (1)% 94.39 61.00 TSXV:FPC Falco Resources Ltd. 0.94 (0.09) (9)% 1.65 0.80 TSX:SBB Sabina Gold & Silver Corp. 1.76 (0.28) (14)% 2.70 1.23 TSX:FR First Majestic Silver Corp. 7.02 (1.00) (12)% 14.36 7.15 TSX:SSL Sandstorm Gold Ltd. 6.10 (0.54) (8)% 6.95 4.37 TSX:FVI Fortuna Silver Mines Inc. 5.68 (0.31) (5)% 9.04 5.13 NYSE:SA Seabridge Gold Inc. 11.30 (0.30) (3)% 13.70 9.22 TSX:FNV Franco-Nevada Corporation 92.23 (3.96) (4)% 110.18 81.01 TSX:SMF SEMAFO Inc. 3.51 (0.36) (9)% 5.24 2.68 NYSE:GFI Gold Fields Limited 4.15 (0.22) (5)% 4.70 2.86 NYSE:SBGL Sibanye Gold Limited 4.46 (0.55) (11)% 10.59 4.27 TSX:G Goldcorp Inc. 17.02 (1.17) (6)% 23.35 15.00 TSX:SVM Silvercorp Metals Inc. 3.14 (0.21) (6)% 5.90 2.72 TSX:GSC Golden Star Resources Ltd. 0.97 (0.02) (2)% 1.33 0.76 TSX:SSRM SSR Mining Inc. 10.41 (0.81) (7)% 16.11 9.66 TSX:GUY Guyana Goldfields Inc. 4.61 (0.22) (5)% 8.11 3.96 TSX:THO Tahoe Resources Inc. 5.23 (0.27) (5)% 12.98 5.31 NYSE:HMY Harmony Gold Mining Company Limi 1.67 (0.06) (3)% 2.99 1.56 TSX:TMR TMAC Resources Inc. 8.85 (1.14) (11)% 19.00 6.90 TSX:HRT Harte Gold Corp. 0.43 (0.03) (7)% 0.87 0.35 TSX:TXG Torex Gold Resources Inc 12.20 0.13 1% 33.85 10.12 NYSE:HL Hecla Mining Company 3.58 (0.55) (13)% 6.78 3.43 TSX:TML Treasury Metals Inc. 0.55 (0.04) (7)% 0.90 0.50 TSX:IMG IAMGOLD Corporation 6.95 (0.68) (9)% 8.87 4.54 TSX:WDO Wesdome Gold Mines Ltd. 1.86 (0.20) (10)% 4.40 1.64 TSX:IVN Ivanhoe Mines Ltd. 3.07 (0.99) (24)% 5.47 3.21 TSX:WPM Wheaton Precious Metals Corp. 26.24 (1.10) (4)% 30.32 23.18 TSX:K Kinross Gold Corporation 5.08 (0.48) (9)% 6.29 4.24 TSX:YRI Yamana Gold Inc. 4.05 (0.46) (10)% 4.80 2.84 TSX:KL Kirkland Lake Gold Ltd. 17.72 (1.70) (9)% 20.97 8.38
The Weekly Dig 2/2/18
Haywood Mining [email protected] Page 13
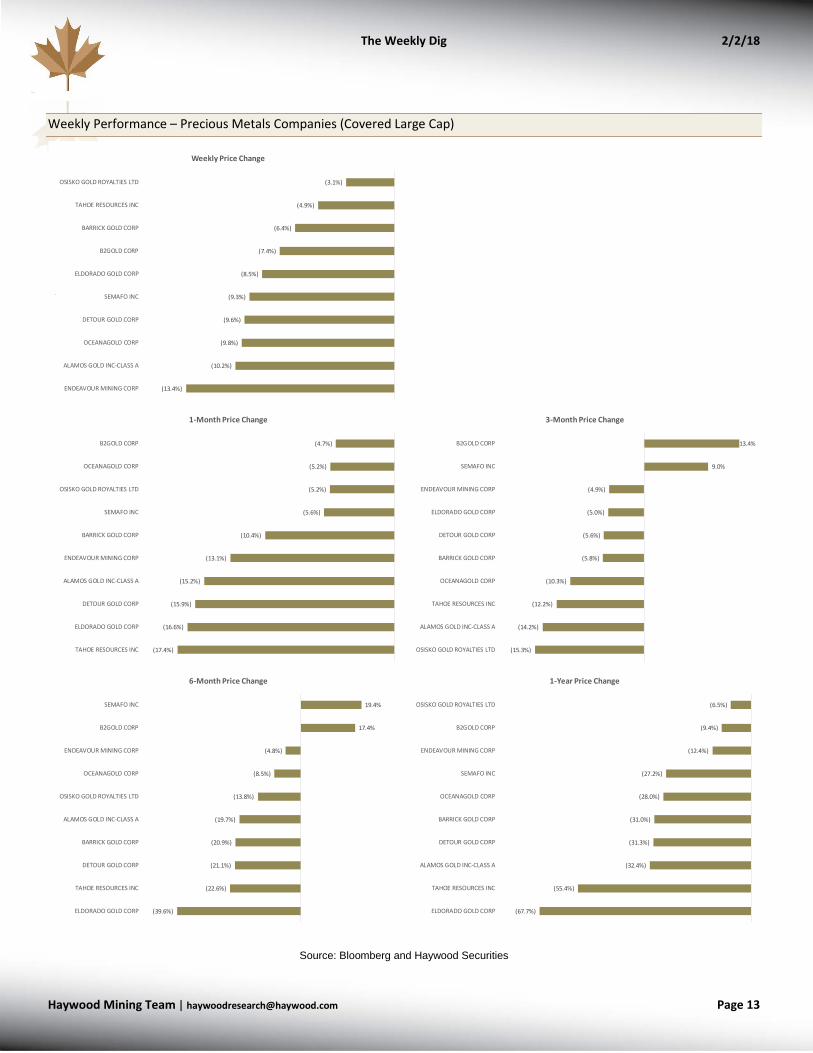
Weekly Performance – Precious Metals Companies (Covered Large Cap)
Source: Bloomberg and Haywood Securities
.
.
(3.1%)
(4.9%)
(6.4%)
(7.4%)
(8.5%)
(9.3%)
(9.6%)
(9.8%)
(10.2%)
(13.4%)
OSISKO GOLD ROYALTIES LTD
TAHOE RESOURCES INC
BARRICK GOLD CORP
B2GOLD CORP
ELDORADO GOLD CORP
SEMAFO INC
DETOUR GOLD CORP
OCEANAGOLD CORP
ALAMOS GOLD INC-CLASS A
ENDEAVOUR MINING CORP
Weekly Price Change
(4.7%)
(5.2%)
(5.2%)
(5.6%)
(10.4%)
(13.1%)
(15.2%)
(15.9%)
(16.6%)
(17.4%)
B2GOLD CORP
OCEANAGOLD CORP
OSISKO GOLD ROYALTIES LTD
SEMAFO INC
BARRICK GOLD CORP
ENDEAVOUR MINING CORP
ALAMOS GOLD INC-CLASS A
DETOUR GOLD CORP
ELDORADO GOLD CORP
TAHOE RESOURCES INC
1-Month Price Change
13.4%
9.0%
(4.9%)
(5.0%)
(5.6%)
(5.8%)
(10.3%)
(12.2%)
(14.2%)
(15.3%)
B2GOLD CORP
SEMAFO INC
ENDEAVOUR MINING CORP
ELDORADO GOLD CORP
DETOUR GOLD CORP
BARRICK GOLD CORP
OCEANAGOLD CORP
TAHOE RESOURCES INC
ALAMOS GOLD INC-CLASS A
OSISKO GOLD ROYALTIES LTD
3-Month Price Change
19.4%
17.4%
(4.8%)
(8.5%)
(13.8%)
(19.7%)
(20.9%)
(21.1%)
(22.6%)
(39.6%)
SEMAFO INC
B2GOLD CORP
ENDEAVOUR MINING CORP
OCEANAGOLD CORP
OSISKO GOLD ROYALTIES LTD
ALAMOS GOLD INC-CLASS A
BARRICK GOLD CORP
DETOUR GOLD CORP
TAHOE RESOURCES INC
ELDORADO GOLD CORP
6-Month Price Change
(6.5%)
(9.4%)
(12.4%)
(27.2%)
(28.0%)
(31.0%)
(31.3%)
(32.4%)
(55.4%)
(67.7%)
OSISKO GOLD ROYALTIES LTD
B2GOLD CORP
ENDEAVOUR MINING CORP
SEMAFO INC
OCEANAGOLD CORP
BARRICK GOLD CORP
DETOUR GOLD CORP
ALAMOS GOLD INC-CLASS A
TAHOE RESOURCES INC
ELDORADO GOLD CORP
1-Year Price Change

The Weekly Dig 2/2/18
Haywood Mining [email protected] Page 14
Weekly Performance – Precious Metals Companies (Covered Small Cap)
Source: Bloomberg and Haywood Securities
.
.
3.6%
(2.0%)
(2.0%)
(4.1%)
(4.5%)
(6.0%)
(6.8%)
(7.6%)
(8.6%)
(8.7%)
(9.3%)
(10.1%)
(10.7%)
(11.0%)
(13.7%)
(14.9%)
(15.0%)
(16.1%)
PURE GOLD MINING INC
LUNDIN GOLD INC
OSISKO MINING INC
MIDAS GOLD CORP
ATLANTIC GOLD CORP
ROXGOLD INC
TREASURY METALS INC
HARTE GOLD CORP
NIGHTHAWK GOLD CORP
FALCO RESOURCES LTD
SEMAFO INC
LIBERTY GOLD CORP
MARATHON GOLD CORP
BARKERVILLE GOLD MINES LTD
SABINA GOLD & SILVER CORP
ASANKO GOLD INC
GOLDQUEST MINING CORP
ROYAL NICKEL CORP
Weekly Price Change
57.6%
54.1%
12.8%
10.1%
7.8%
4.8%
1.8%
1.1%
(5.6%)
(5.6%)
(10.1%)
(11.0%)
(12.3%)
(14.1%)
(16.7%)
(19.4%)
(20.4%)
(21.8%)
ROYAL NICKEL CORP
MIDAS GOLD CORP
ATLANTIC GOLD CORP
LUNDIN GOLD INC
ASANKO GOLD INC
OSISKO MINING INC
PURE GOLD MINING INC
FALCO RESOURCES LTD
GOLDQUEST MINING CORP
SEMAFO INC
LIBERTY GOLD CORP
BARKERVILLE GOLD MINES LTD
NIGHTHAWK GOLD CORP
TREASURY METALS INC
HARTE GOLD CORP
MARATHON GOLD CORP
ROXGOLD INC
SABINA GOLD & SILVER CORP
1-Month Price Change
44.4%
19.3%
19.0%
17.5%
14.0%
9.0%
1.2%
(1.8%)
(5.7%)
(7.8%)
(8.6%)
(10.5%)
(12.1%)
(14.1%)
(14.5%)
(16.7%)
(23.5%)
(23.6%)
ROYAL NICKEL CORP
GOLDQUEST MINING CORP
MIDAS GOLD CORP
ATLANTIC GOLD CORP
PURE GOLD MINING INC
SEMAFO INC
LUNDIN GOLD INC
ROXGOLD INC
MARATHON GOLD CORP
FALCO RESOURCES LTD
NIGHTHAWK GOLD CORP
HARTE GOLD CORP
OSISKO MINING INC
TREASURY METALS INC
BARKERVILLE GOLD MINES LTD
LIBERTY GOLD CORP
SABINA GOLD & SILVER CORP
ASANKO GOLD INC
3-Month Price Change
40.5%
27.0%
19.4%
13.5%
4.4%
3.6%
(0.9%)
(6.9%)
(9.1%)
(10.7%)
(19.1%)
(24.2%)
(25.4%)
(26.1%)
(28.4%)
(30.2%)
(30.4%)
(35.6%)
ROYAL NICKEL CORP
MIDAS GOLD CORP
SEMAFO INC
ATLANTIC GOLD CORP
LUNDIN GOLD INC
PURE GOLD MINING INC
ROXGOLD INC
FALCO RESOURCES LTD
LIBERTY GOLD CORP
MARATHON GOLD CORP
TREASURY METALS INC
OSISKO MINING INC
SABINA GOLD & SILVER CORP
BARKERVILLE GOLD MINES LTD
GOLDQUEST MINING CORP
ASANKO GOLD INC
NIGHTHAWK GOLD CORP
HARTE GOLD CORP
6-Month Price Change
76.8%
32.7%
28.5%
17.6%
14.9%
8.0%
(0.6%)
(1.7%)
(4.1%)
(10.4%)
(11.7%)
(12.3%)
(12.7%)
(20.0%)
(27.2%)
(30.1%)
(32.2%)
(80.0%)
ATLANTIC GOLD CORP
BARKERVILLE GOLD MINES LTD
SABINA GOLD & SILVER CORP
MARATHON GOLD CORP
HARTE GOLD CORP
MIDAS GOLD CORP
OSISKO MINING INC
PURE GOLD MINING INC
FALCO RESOURCES LTD
LUNDIN GOLD INC
GOLDQUEST MINING CORP
NIGHTHAWK GOLD CORP
TREASURY METALS INC
ROYAL NICKEL CORP
SEMAFO INC
ROXGOLD INC
LIBERTY GOLD CORP
ASANKO GOLD INC
1-Year Price Change

The Weekly Dig 2/2/18
Haywood Mining [email protected] Page 15
Equity Weekly Performance – Base Metals Companies
Source: Bloomberg and Haywood Securities
.
.
10.4%
0.9%
(0.3%)
(0.5%)
(1.6%)
(2.6%)
(3.1%)
(3.7%)
(3.9%)
(4.6%)
(5.6%)
(6.2%)
(7.9%)
(7.9%)
(8.3%)
(8.9%)
(14.0%)
IMPERIAL METALS CORP
LME ZINC SPOT ($)
ATALAYA MINING PLC
LME COPPER SPOT ($)
LME NICKEL SPOT ($)
TECK RESOURCES LTD-CLS B
TREVALI MINING CORP
LUNDIN MINING CORP
S&P/TSX COMPOSITE INDEX
COPPER MOUNTAIN MINING CORP
S&P/TSX DIV MTLS&MIN IDX
FIRST QUANTUM MINERALS LTD
CAPSTONE MINING CORP
TASEKO MINES LTD
SHERRITT INTERNATIONAL CORP
HUDBAY MINERALS INC
NEVSUN RESOURCES LTD
Weekly Price Change
34.5%
6.7%
5.3%
4.4%
1.9%
0.6%
(1.4%)
(2.2%)
(3.6%)
(4.3%)
(10.9%)
(12.8%)
(17.8%)
(19.0%)
(20.6%)
(23.6%)
(33.0%)
ATALAYA MINING PLC
LME NICKEL SPOT ($)
LME ZINC SPOT ($)
TECK RESOURCES LTD-CLS B
TREVALI MINING CORP
LUNDIN MINING CORP
FIRST QUANTUM MINERALS LTD
LME COPPER SPOT ($)
S&P/TSX DIV MTLS&MIN IDX
S&P/TSX COMPOSITE INDEX
HUDBAY MINERALS INC
CAPSTONE MINING CORP
COPPER MOUNTAIN MINING CORP
NEVSUN RESOURCES LTD
IMPERIAL METALS CORP
TASEKO MINES LTD
SHERRITT INTERNATIONAL CORP
1-Month Price Change
35.6%
32.6%
19.5%
14.2%
7.7%
7.5%
6.6%
3.5%
1.5%
(2.6%)
(4.9%)
(7.6%)
(13.4%)
(14.1%)
(17.4%)
(24.2%)
(25.8%)
ATALAYA MINING PLC
TECK RESOURCES LTD-CLS B
FIRST QUANTUM MINERALS LTD
S&P/TSX DIV MTLS&MIN IDX
LME ZINC SPOT ($)
TREVALI MINING CORP
LME NICKEL SPOT ($)
HUDBAY MINERALS INC
LME COPPER SPOT ($)
S&P/TSX COMPOSITE INDEX
IMPERIAL METALS CORP
SHERRITT INTERNATIONAL CORP
CAPSTONE MINING CORP
LUNDIN MINING CORP
NEVSUN RESOURCES LTD
COPPER MOUNTAIN MINING CORP
TASEKO MINES LTD
3-Month Price Change
70.4%
45.2%
34.7%
30.0%
29.1%
27.3%
25.0%
24.6%
11.4%
11.2%
10.8%
10.5%
6.0%
2.2%
(4.2%)
(23.3%)
(24.6%)
ATALAYA MINING PLC
SHERRITT INTERNATIONAL CORP
FIRST QUANTUM MINERALS LTD
LME NICKEL SPOT ($)
TECK RESOURCES LTD-CLS B
LME ZINC SPOT ($)
COPPER MOUNTAIN MINING CORP
TREVALI MINING CORP
S&P/TSX DIV MTLS&MIN IDX
CAPSTONE MINING CORP
LME COPPER SPOT ($)
TASEKO MINES LTD
HUDBAY MINERALS INC
S&P/TSX COMPOSITE INDEX
LUNDIN MINING CORP
IMPERIAL METALS CORP
NEVSUN RESOURCES LTD
6-Month Price Change
29.6%
27.0%
25.0%
19.8%
19.3%
11.7%
8.4%
8.1%
7.2%
1.3%
(2.0%)
(2.3%)
(3.1%)
(14.0%)
(14.1%)
(37.9%)
(59.6%)
LME NICKEL SPOT ($)
ATALAYA MINING PLC
LME ZINC SPOT ($)
TREVALI MINING CORP
LME COPPER SPOT ($)
TASEKO MINES LTD
TECK RESOURCES LTD-CLS B
LUNDIN MINING CORP
FIRST QUANTUM MINERALS LTD
S&P/TSX COMPOSITE INDEX
S&P/TSX DIV MTLS&MIN IDX
HUDBAY MINERALS INC
COPPER MOUNTAIN MINING CORP
CAPSTONE MINING CORP
SHERRITT INTERNATIONAL CORP
NEVSUN RESOURCES LTD
IMPERIAL METALS CORP
1-Year Price Change
The Weekly Dig 2/2/18
Haywood Mining [email protected] Page 16
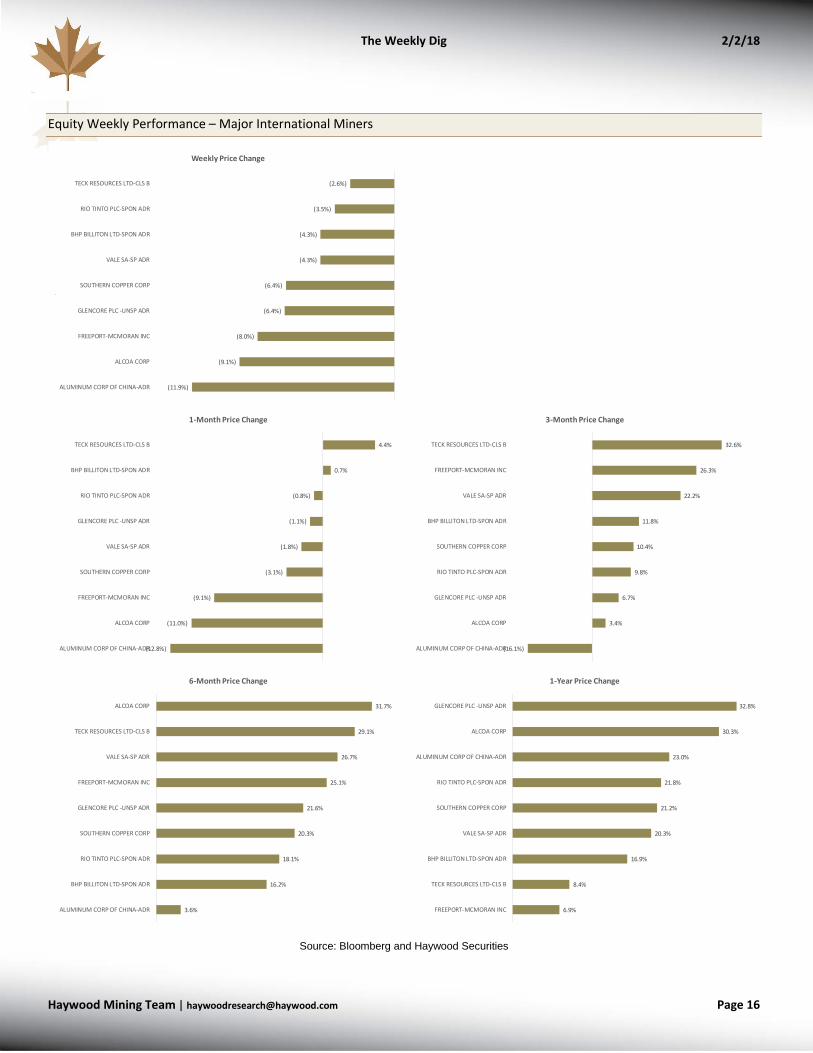
Equity Weekly Performance – Major International Miners
Source: Bloomberg and Haywood Securities
.
.
(2.6%)
(3.5%)
(4.3%)
(4.3%)
(6.4%)
(6.4%)
(8.0%)
(9.1%)
(11.9%)
TECK RESOURCES LTD-CLS B
RIO TINTO PLC-SPON ADR
BHP BILLITON LTD-SPON ADR
VALE SA-SP ADR
SOUTHERN COPPER CORP
GLENCORE PLC -UNSP ADR
FREEPORT-MCMORAN INC
ALCOA CORP
ALUMINUM CORP OF CHINA-ADR
Weekly Price Change
4.4%
0.7%
(0.8%)
(1.1%)
(1.8%)
(3.1%)
(9.1%)
(11.0%)
(12.8%)
TECK RESOURCES LTD-CLS B
BHP BILLITON LTD-SPON ADR
RIO TINTO PLC-SPON ADR
GLENCORE PLC -UNSP ADR
VALE SA-SP ADR
SOUTHERN COPPER CORP
FREEPORT-MCMORAN INC
ALCOA CORP
ALUMINUM CORP OF CHINA-ADR
1-Month Price Change
32.6%
26.3%
22.2%
11.8%
10.4%
9.8%
6.7%
3.4%
(16.1%)
TECK RESOURCES LTD-CLS B
FREEPORT-MCMORAN INC
VALE SA-SP ADR
BHP BILLITON LTD-SPON ADR
SOUTHERN COPPER CORP
RIO TINTO PLC-SPON ADR
GLENCORE PLC -UNSP ADR
ALCOA CORP
ALUMINUM CORP OF CHINA-ADR
3-Month Price Change
31.7%
29.1%
26.7%
25.1%
21.6%
20.3%
18.1%
16.2%
3.6%
ALCOA CORP
TECK RESOURCES LTD-CLS B
VALE SA-SP ADR
FREEPORT-MCMORAN INC
GLENCORE PLC -UNSP ADR
SOUTHERN COPPER CORP
RIO TINTO PLC-SPON ADR
BHP BILLITON LTD-SPON ADR
ALUMINUM CORP OF CHINA-ADR
6-Month Price Change
32.8%
30.3%
23.0%
21.8%
21.2%
20.3%
16.9%
8.4%
6.9%
GLENCORE PLC -UNSP ADR
ALCOA CORP
ALUMINUM CORP OF CHINA-ADR
RIO TINTO PLC-SPON ADR
SOUTHERN COPPER CORP
VALE SA-SP ADR
BHP BILLITON LTD-SPON ADR
TECK RESOURCES LTD-CLS B
FREEPORT-MCMORAN INC
1-Year Price Change
The Weekly Dig 2/2/18
Haywood Mining [email protected] Page 17
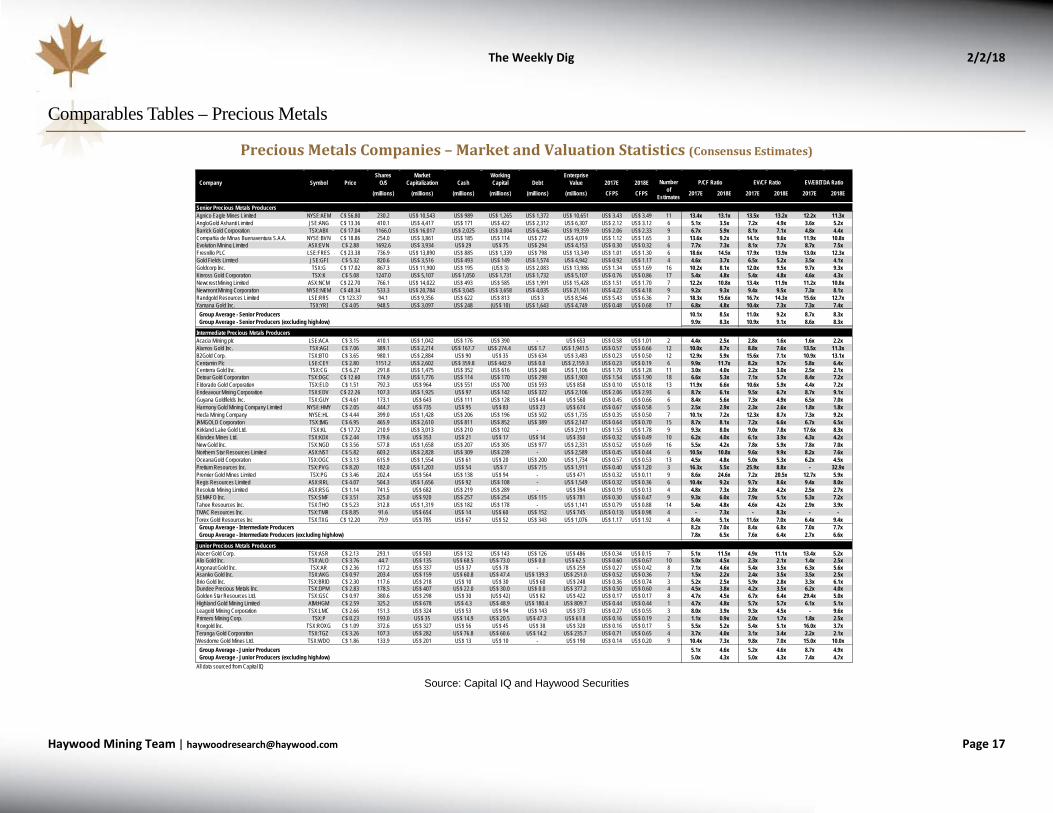
Comparables Tables – Precious Metals
Precious Metals Companies – Market and Valuation Statistics (Consensus Estimates)
Source: Capital IQ and Haywood Securities
Shares Market Working EnterpriseCompany Symbol Price O/S Capitalization Cash Capital Debt Value 2017E 2018E
(millions) (millions) (millions) (millions) (millions) (millions) CFPS CFPS 2017E 2018E 2017E 2018E 2017E 2018E
Senior Precious Metals ProducersAgnico Eagle Mines Limited NYSE:AEM C$ 56.80 230.2 US$ 10,543 US$ 989 US$ 1,265 US$ 1,372 US$ 10,651 US$ 3.43 US$ 3.49 11 13.4x 13.1x 13.5x 13.2x 12.2x 11.3xAngloGold Ashanti Limited JSE:ANG C$ 13.36 410.1 US$ 4,417 US$ 171 US$ 422 US$ 2,312 US$ 6,307 US$ 2.12 US$ 3.12 6 5.1x 3.5x 7.2x 4.9x 3.6x 5.2xBarrick Gold Corporation TSX:ABX C$ 17.04 1166.0 US$ 16,017 US$ 2,025 US$ 3,004 US$ 6,346 US$ 19,359 US$ 2.06 US$ 2.33 9 6.7x 5.9x 8.1x 7.1x 4.8x 4.4xCompañía de Minas Buenaventura S.A.A. NYSE:BVN C$ 18.86 254.0 US$ 3,861 US$ 185 US$ 114 US$ 272 US$ 4,019 US$ 1.12 US$ 1.65 3 13.6x 9.2x 14.1x 9.6x 11.9x 10.8xEvolution Mining Limited ASX:EVN C$ 2.88 1692.6 US$ 3,934 US$ 29 US$ 75 US$ 294 US$ 4,153 US$ 0.30 US$ 0.32 6 7.7x 7.3x 8.1x 7.7x 8.7x 7.5xFresnillo PLC LSE:FRES C$ 23.38 736.9 US$ 13,890 US$ 885 US$ 1,339 US$ 798 US$ 13,349 US$ 1.01 US$ 1.30 6 18.6x 14.5x 17.9x 13.9x 13.0x 12.3xGold Fields Limited JSE:GFI C$ 5.32 820.6 US$ 3,516 US$ 493 US$ 149 US$ 1,574 US$ 4,942 US$ 0.92 US$ 1.17 4 4.6x 3.7x 6.5x 5.2x 3.5x 4.1xGoldcorp Inc. TSX:G C$ 17.02 867.3 US$ 11,900 US$ 195 (US$ 3) US$ 2,083 US$ 13,986 US$ 1.34 US$ 1.69 16 10.2x 8.1x 12.0x 9.5x 9.7x 9.3xKinross Gold Corporation TSX:K C$ 5.08 1247.0 US$ 5,107 US$ 1,050 US$ 1,731 US$ 1,732 US$ 5,107 US$ 0.76 US$ 0.86 17 5.4x 4.8x 5.4x 4.8x 4.6x 4.3xNewcrest Mining Limited ASX:NCM C$ 22.70 766.1 US$ 14,022 US$ 493 US$ 585 US$ 1,991 US$ 15,428 US$ 1.51 US$ 1.70 7 12.2x 10.8x 13.4x 11.9x 11.2x 10.8xNewmont Mining Corporation NYSE:NEM C$ 48.34 533.3 US$ 20,784 US$ 3,045 US$ 3,658 US$ 4,035 US$ 21,161 US$ 4.22 US$ 4.18 9 9.2x 9.3x 9.4x 9.5x 7.3x 8.1xRandgold Resources Limited LSE:RRS C$ 123.37 94.1 US$ 9,356 US$ 622 US$ 813 US$ 3 US$ 8,546 US$ 5.43 US$ 6.36 7 18.3x 15.6x 16.7x 14.3x 15.6x 12.7xYamana Gold Inc. TSX:YRI C$ 4.05 948.5 US$ 3,097 US$ 248 (US$ 10) US$ 1,643 US$ 4,749 US$ 0.48 US$ 0.68 17 6.8x 4.8x 10.4x 7.3x 7.3x 7.4x
Group Average - Senior Producers 10.1x 8.5x 11.0x 9.2x 8.7x 8.3xGroup Average - Senior Producers (excluding high/low) 9.9x 8.3x 10.9x 9.1x 8.6x 8.3x
Intermediate Precious Metals ProducersAcacia Mining plc LSE:ACA C$ 3.15 410.1 US$ 1,042 US$ 176 US$ 390 - US$ 653 US$ 0.58 US$ 1.01 2 4.4x 2.5x 2.8x 1.6x 1.6x 2.2xAlamos Gold Inc. TSX:AGI C$ 7.06 389.1 US$ 2,214 US$ 167.7 US$ 274.4 US$ 1.7 US$ 1,941.5 US$ 0.57 US$ 0.66 12 10.0x 8.7x 8.8x 7.6x 13.5x 11.3xB2Gold Corp. TSX:BTO C$ 3.65 980.1 US$ 2,884 US$ 90 US$ 35 US$ 634 US$ 3,483 US$ 0.23 US$ 0.50 12 12.9x 5.9x 15.6x 7.1x 10.9x 13.1xCentamin Plc LSE:CEY C$ 2.80 1151.2 US$ 2,602 US$ 359.8 US$ 442.9 US$ 0.0 US$ 2,159.3 US$ 0.23 US$ 0.19 6 9.9x 11.7x 8.2x 9.7x 5.8x 6.4xCenterra Gold Inc. TSX:CG C$ 6.27 291.8 US$ 1,475 US$ 352 US$ 616 US$ 248 US$ 1,106 US$ 1.70 US$ 1.28 11 3.0x 4.0x 2.2x 3.0x 2.5x 2.1xDetour Gold Corporation TSX:DGC C$ 12.60 174.9 US$ 1,776 US$ 114 US$ 170 US$ 298 US$ 1,903 US$ 1.54 US$ 1.90 18 6.6x 5.3x 7.1x 5.7x 8.4x 7.2xEldorado Gold Corporation TSX:ELD C$ 1.51 792.3 US$ 964 US$ 551 US$ 700 US$ 593 US$ 858 US$ 0.10 US$ 0.18 13 11.9x 6.6x 10.6x 5.9x 4.4x 7.2xEndeavour Mining Corporation TSX:EDV C$ 22.26 107.3 US$ 1,925 US$ 97 US$ 142 US$ 322 US$ 2,106 US$ 2.06 US$ 2.93 6 8.7x 6.1x 9.5x 6.7x 8.7x 9.1xGuyana Goldfields Inc. TSX:GUY C$ 4.61 173.1 US$ 643 US$ 111 US$ 128 US$ 44 US$ 560 US$ 0.45 US$ 0.66 6 8.4x 5.6x 7.3x 4.9x 6.5x 7.0xHarmony Gold Mining Company Limited NYSE:HMY C$ 2.05 444.7 US$ 735 US$ 95 US$ 83 US$ 23 US$ 674 US$ 0.67 US$ 0.58 5 2.5x 2.9x 2.3x 2.6x 1.8x 1.8xHecla Mining Company NYSE:HL C$ 4.44 399.0 US$ 1,428 US$ 206 US$ 196 US$ 502 US$ 1,735 US$ 0.35 US$ 0.50 7 10.1x 7.2x 12.3x 8.7x 7.3x 9.2xIAMGOLD Corporation TSX:IMG C$ 6.95 465.9 US$ 2,610 US$ 811 US$ 852 US$ 389 US$ 2,147 US$ 0.64 US$ 0.70 15 8.7x 8.1x 7.2x 6.6x 6.7x 6.5xKirkland Lake Gold Ltd. TSX:KL C$ 17.72 210.9 US$ 3,013 US$ 210 US$ 102 - US$ 2,911 US$ 1.53 US$ 1.78 9 9.3x 8.0x 9.0x 7.8x 17.6x 8.3xKlondex Mines Ltd. TSX:KDX C$ 2.44 179.6 US$ 353 US$ 21 US$ 17 US$ 14 US$ 350 US$ 0.32 US$ 0.49 10 6.2x 4.0x 6.1x 3.9x 4.3x 4.2xNew Gold Inc. TSX:NGD C$ 3.56 577.8 US$ 1,658 US$ 207 US$ 305 US$ 977 US$ 2,331 US$ 0.52 US$ 0.69 16 5.5x 4.2x 7.8x 5.9x 7.8x 7.0xNorthern Star Resources Limited ASX:NST C$ 5.82 603.2 US$ 2,828 US$ 309 US$ 239 - US$ 2,589 US$ 0.45 US$ 0.44 6 10.5x 10.8x 9.6x 9.9x 8.2x 7.6xOceanaGold Corporation TSX:OGC C$ 3.13 615.9 US$ 1,554 US$ 61 US$ 20 US$ 200 US$ 1,734 US$ 0.57 US$ 0.53 13 4.5x 4.8x 5.0x 5.3x 6.2x 4.5xPretium Resources Inc. TSX:PVG C$ 8.20 182.0 US$ 1,203 US$ 54 US$ 7 US$ 715 US$ 1,911 US$ 0.40 US$ 1.20 3 16.3x 5.5x 25.9x 8.8x - 32.9xPremier Gold Mines Limited TSX:PG C$ 3.46 202.4 US$ 564 US$ 138 US$ 94 - US$ 471 US$ 0.32 US$ 0.11 9 8.6x 24.6x 7.2x 20.5x 12.7x 5.9xRegis Resources Limited ASX:RRL C$ 4.07 504.3 US$ 1,656 US$ 92 US$ 108 - US$ 1,549 US$ 0.32 US$ 0.36 6 10.4x 9.2x 9.7x 8.6x 9.4x 8.0xResolute Mining Limited ASX:RSG C$ 1.14 741.5 US$ 682 US$ 219 US$ 289 - US$ 394 US$ 0.19 US$ 0.13 4 4.8x 7.3x 2.8x 4.2x 2.5x 2.7xSEMAFO Inc. TSX:SMF C$ 3.51 325.0 US$ 920 US$ 257 US$ 254 US$ 115 US$ 781 US$ 0.30 US$ 0.47 9 9.3x 6.0x 7.9x 5.1x 5.3x 7.2xTahoe Resources Inc. TSX:THO C$ 5.23 312.8 US$ 1,319 US$ 182 US$ 178 - US$ 1,141 US$ 0.79 US$ 0.88 14 5.4x 4.8x 4.6x 4.2x 2.9x 3.9xTMAC Resources Inc. TSX:TMR C$ 8.85 91.6 US$ 654 US$ 14 US$ 60 US$ 152 US$ 745 (US$ 0.13) US$ 0.98 4 - 7.3x - 8.3x - -Torex Gold Resources Inc TSX:TXG C$ 12.20 79.9 US$ 785 US$ 67 US$ 52 US$ 343 US$ 1,076 US$ 1.17 US$ 1.92 4 8.4x 5.1x 11.6x 7.0x 6.4x 9.4x
Group Average - Intermediate Producers 8.2x 7.0x 8.4x 6.8x 7.0x 7.7xGroup Average - Intermediate Producers (excluding high/low) 7.8x 6.5x 7.6x 6.4x 2.7x 6.6x
Junior Precious Metals ProducersAlacer Gold Corp. TSX:ASR C$ 2.13 293.1 US$ 503 US$ 132 US$ 143 US$ 126 US$ 486 US$ 0.34 US$ 0.15 7 5.1x 11.5x 4.9x 11.1x 13.4x 5.2xAlio Gold Inc. TSX:ALO C$ 3.76 44.7 US$ 135 US$ 68.5 US$ 73.0 US$ 0.0 US$ 62.5 US$ 0.60 US$ 0.67 10 5.0x 4.5x 2.3x 2.1x 1.4x 2.5xArgonaut Gold Inc. TSX:AR C$ 2.36 177.2 US$ 337 US$ 37 US$ 78 - US$ 259 US$ 0.27 US$ 0.42 8 7.1x 4.6x 5.4x 3.5x 6.3x 5.6xAsanko Gold Inc. TSX:AKG C$ 0.97 203.4 US$ 159 US$ 60.8 US$ 47.4 US$ 139.3 US$ 251.0 US$ 0.52 US$ 0.36 7 1.5x 2.2x 2.4x 3.5x 3.5x 2.5xBrio Gold Inc. TSX:BRIO C$ 2.30 117.6 US$ 218 US$ 10 US$ 30 US$ 60 US$ 248 US$ 0.36 US$ 0.74 3 5.2x 2.5x 5.9x 2.8x 3.3x 6.1xDundee Precious Metals Inc. TSX:DPM C$ 2.83 178.5 US$ 407 US$ 22.0 US$ 30.0 US$ 0.0 US$ 377.2 US$ 0.50 US$ 0.60 4 4.5x 3.8x 4.2x 3.5x 6.2x 4.0xGolden Star Resources Ltd. TSX:GSC C$ 0.97 380.6 US$ 298 US$ 30 (US$ 42) US$ 82 US$ 422 US$ 0.17 US$ 0.17 8 4.7x 4.5x 6.7x 6.4x 29.4x 5.0xHighland Gold Mining Limited AIM:HGM C$ 2.59 325.2 US$ 678 US$ 4.3 US$ 48.9 US$ 180.4 US$ 809.7 US$ 0.44 US$ 0.44 1 4.7x 4.8x 5.7x 5.7x 6.1x 5.1xLeagold Mining Corporation TSX:LMC C$ 2.66 151.3 US$ 324 US$ 53 US$ 94 US$ 143 US$ 373 US$ 0.27 US$ 0.55 3 8.0x 3.9x 9.3x 4.5x - 9.6xPrimero Mining Corp. TSX:P C$ 0.23 193.0 US$ 35 US$ 14.9 US$ 20.5 US$ 47.3 US$ 61.8 US$ 0.16 US$ 0.19 2 1.1x 0.9x 2.0x 1.7x 1.8x 2.5xRoxgold Inc. TSX:ROXG C$ 1.09 372.6 US$ 327 US$ 56 US$ 45 US$ 38 US$ 320 US$ 0.16 US$ 0.17 5 5.5x 5.2x 5.4x 5.1x 16.0x 3.7xTeranga Gold Corporation TSX:TGZ C$ 3.26 107.3 US$ 282 US$ 76.8 US$ 60.6 US$ 14.2 US$ 235.7 US$ 0.71 US$ 0.65 4 3.7x 4.0x 3.1x 3.4x 2.2x 2.1xWesdome Gold Mines Ltd. TSX:WDO C$ 1.86 133.9 US$ 201 US$ 13 US$ 10 - US$ 190 US$ 0.14 US$ 0.20 9 10.4x 7.3x 9.8x 7.0x 15.0x 10.0x
Group Average - Junior Producers 5.1x 4.6x 5.2x 4.6x 8.7x 4.9xGroup Average - Junior Producers (excluding high/low) 5.0x 4.3x 5.0x 4.3x 7.4x 4.7x
All data sourced from Capital IQ
Number of
Estimates
P/CF Ratio EV/CF Ratio EV/EBITDA Ratio
The Weekly Dig 2/2/18
Haywood Mining [email protected] Page 18
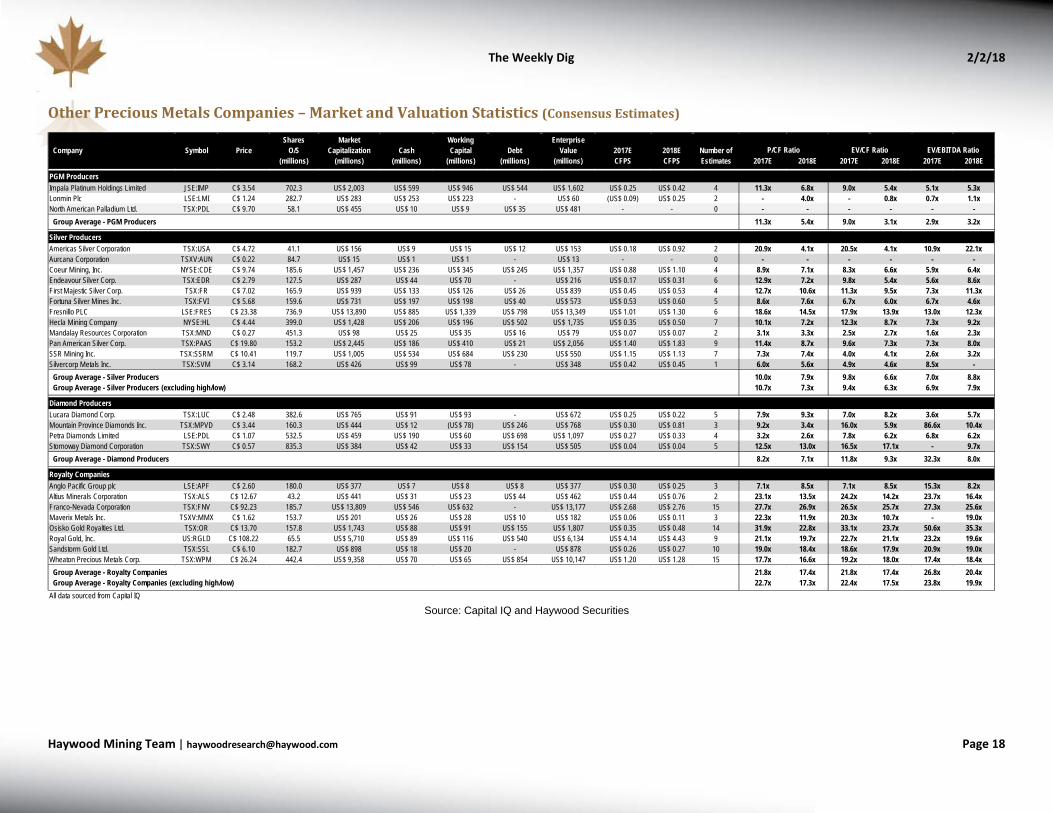
Other Precious Metals Companies – Market and Valuation Statistics (Consensus Estimates)
Source: Capital IQ and Haywood Securities
Shares Market Working EnterpriseCompany Symbol Price O/S Capitalization Cash Capital Debt Value 2017E 2018E Number of
(millions) (millions) (millions) (millions) (millions) (millions) CFPS CFPS Estimates 2017E 2018E 2017E 2018E 2017E 2018E
PGM ProducersImpala Platinum Holdings Limited JSE:IMP C$ 3.54 702.3 US$ 2,003 US$ 599 US$ 946 US$ 544 US$ 1,602 US$ 0.25 US$ 0.42 4 11.3x 6.8x 9.0x 5.4x 5.1x 5.3xLonmin Plc LSE:LMI C$ 1.24 282.7 US$ 283 US$ 253 US$ 223 - US$ 60 (US$ 0.09) US$ 0.25 2 - 4.0x - 0.8x 0.7x 1.1xNorth American Palladium Ltd. TSX:PDL C$ 9.70 58.1 US$ 455 US$ 10 US$ 9 US$ 35 US$ 481 - - 0 - - - - - -
Group Average - PGM Producers 11.3x 5.4x 9.0x 3.1x 2.9x 3.2x
Silver ProducersAmericas Silver Corporation TSX:USA C$ 4.72 41.1 US$ 156 US$ 9 US$ 15 US$ 12 US$ 153 US$ 0.18 US$ 0.92 2 20.9x 4.1x 20.5x 4.1x 10.9x 22.1xAurcana Corporation TSXV:AUN C$ 0.22 84.7 US$ 15 US$ 1 US$ 1 - US$ 13 - - 0 - - - - - -Coeur Mining, Inc. NYSE:CDE C$ 9.74 185.6 US$ 1,457 US$ 236 US$ 345 US$ 245 US$ 1,357 US$ 0.88 US$ 1.10 4 8.9x 7.1x 8.3x 6.6x 5.9x 6.4xEndeavour Silver Corp. TSX:EDR C$ 2.79 127.5 US$ 287 US$ 44 US$ 70 - US$ 216 US$ 0.17 US$ 0.31 6 12.9x 7.2x 9.8x 5.4x 5.6x 8.6xFirst Majestic Silver Corp. TSX:FR C$ 7.02 165.9 US$ 939 US$ 133 US$ 126 US$ 26 US$ 839 US$ 0.45 US$ 0.53 4 12.7x 10.6x 11.3x 9.5x 7.3x 11.3xFortuna Silver Mines Inc. TSX:FVI C$ 5.68 159.6 US$ 731 US$ 197 US$ 198 US$ 40 US$ 573 US$ 0.53 US$ 0.60 5 8.6x 7.6x 6.7x 6.0x 6.7x 4.6xFresnillo PLC LSE:FRES C$ 23.38 736.9 US$ 13,890 US$ 885 US$ 1,339 US$ 798 US$ 13,349 US$ 1.01 US$ 1.30 6 18.6x 14.5x 17.9x 13.9x 13.0x 12.3xHecla Mining Company NYSE:HL C$ 4.44 399.0 US$ 1,428 US$ 206 US$ 196 US$ 502 US$ 1,735 US$ 0.35 US$ 0.50 7 10.1x 7.2x 12.3x 8.7x 7.3x 9.2xMandalay Resources Corporation TSX:MND C$ 0.27 451.3 US$ 98 US$ 25 US$ 35 US$ 16 US$ 79 US$ 0.07 US$ 0.07 2 3.1x 3.3x 2.5x 2.7x 1.6x 2.3xPan American Silver Corp. TSX:PAAS C$ 19.80 153.2 US$ 2,445 US$ 186 US$ 410 US$ 21 US$ 2,056 US$ 1.40 US$ 1.83 9 11.4x 8.7x 9.6x 7.3x 7.3x 8.0xSSR Mining Inc. TSX:SSRM C$ 10.41 119.7 US$ 1,005 US$ 534 US$ 684 US$ 230 US$ 550 US$ 1.15 US$ 1.13 7 7.3x 7.4x 4.0x 4.1x 2.6x 3.2xSilvercorp Metals Inc. TSX:SVM C$ 3.14 168.2 US$ 426 US$ 99 US$ 78 - US$ 348 US$ 0.42 US$ 0.45 1 6.0x 5.6x 4.9x 4.6x 8.5x -
Group Average - Silver Producers 10.0x 7.9x 9.8x 6.6x 7.0x 8.8xGroup Average - Silver Producers (excluding high/low) 10.7x 7.3x 9.4x 6.3x 6.9x 7.9x
Diamond ProducersLucara Diamond Corp. TSX:LUC C$ 2.48 382.6 US$ 765 US$ 91 US$ 93 - US$ 672 US$ 0.25 US$ 0.22 5 7.9x 9.3x 7.0x 8.2x 3.6x 5.7xMountain Province Diamonds Inc. TSX:MPVD C$ 3.44 160.3 US$ 444 US$ 12 (US$ 78) US$ 246 US$ 768 US$ 0.30 US$ 0.81 3 9.2x 3.4x 16.0x 5.9x 86.6x 10.4xPetra Diamonds Limited LSE:PDL C$ 1.07 532.5 US$ 459 US$ 190 US$ 60 US$ 698 US$ 1,097 US$ 0.27 US$ 0.33 4 3.2x 2.6x 7.8x 6.2x 6.8x 6.2xStornoway Diamond Corporation TSX:SWY C$ 0.57 835.3 US$ 384 US$ 42 US$ 33 US$ 154 US$ 505 US$ 0.04 US$ 0.04 5 12.5x 13.0x 16.5x 17.1x - 9.7x
Group Average - Diamond Producers 8.2x 7.1x 11.8x 9.3x 32.3x 8.0x
Royalty CompaniesAnglo Pacific Group plc LSE:APF C$ 2.60 180.0 US$ 377 US$ 7 US$ 8 US$ 8 US$ 377 US$ 0.30 US$ 0.25 3 7.1x 8.5x 7.1x 8.5x 15.3x 8.2xAltius Minerals Corporation TSX:ALS C$ 12.67 43.2 US$ 441 US$ 31 US$ 23 US$ 44 US$ 462 US$ 0.44 US$ 0.76 2 23.1x 13.5x 24.2x 14.2x 23.7x 16.4xFranco-Nevada Corporation TSX:FNV C$ 92.23 185.7 US$ 13,809 US$ 546 US$ 632 - US$ 13,177 US$ 2.68 US$ 2.76 15 27.7x 26.9x 26.5x 25.7x 27.3x 25.6xMaverix Metals Inc. TSXV:MMX C$ 1.62 153.7 US$ 201 US$ 26 US$ 28 US$ 10 US$ 182 US$ 0.06 US$ 0.11 3 22.3x 11.9x 20.3x 10.7x - 19.0xOsisko Gold Royalties Ltd. TSX:OR C$ 13.70 157.8 US$ 1,743 US$ 88 US$ 91 US$ 155 US$ 1,807 US$ 0.35 US$ 0.48 14 31.9x 22.8x 33.1x 23.7x 50.6x 35.3xRoyal Gold, Inc. US:RGLD C$ 108.22 65.5 US$ 5,710 US$ 89 US$ 116 US$ 540 US$ 6,134 US$ 4.14 US$ 4.43 9 21.1x 19.7x 22.7x 21.1x 23.2x 19.6xSandstorm Gold Ltd. TSX:SSL C$ 6.10 182.7 US$ 898 US$ 18 US$ 20 - US$ 878 US$ 0.26 US$ 0.27 10 19.0x 18.4x 18.6x 17.9x 20.9x 19.0xWheaton Precious Metals Corp. TSX:WPM C$ 26.24 442.4 US$ 9,358 US$ 70 US$ 65 US$ 854 US$ 10,147 US$ 1.20 US$ 1.28 15 17.7x 16.6x 19.2x 18.0x 17.4x 18.4x
Group Average - Royalty Companies 21.8x 17.4x 21.8x 17.4x 26.8x 20.4xGroup Average - Royalty Companies (excluding high/low) 22.7x 17.3x 22.4x 17.5x 23.8x 19.9x
All data sourced from Capital IQ
P/CF Ratio EV/CF Ratio EV/EBITDA Ratio

The Weekly Dig 2/2/18
Haywood Mining [email protected] Page 19
Senior Gold Producers – Reserves and Resources
Symbol Reserves
Agnico Eagle Mines Limited NYSE:AEM US $10,543 US $1,265 US $10,654 54.9 1.92 61.0 2.13 90% 19.9 2.31 21.4 2.48 93% US $534 35.0 1.75 39.5 1.98 88% 50% 54% US $194 US $175AngloGold Ashanti Limited JSE:ANG US $4,417 US $422 US $6,307 214.4 1.34 240.9 1.50 89% 50.2 0.91 52.6 0.95 95% US $126 164.1 1.56 188.2 1.80 87% 30% 35% US $29 US $26B2Gold Corp. TSX:BTO US $2,884 US $35 US $3,483 22.6 0.75 28.9 0.95 78% 6.9 1.34 6.9 1.34 100% US $504 15.7 0.63 22.0 0.88 71% 46% 58% US $154 US $120Barrick Gold Corporation TSX:ABX US $16,017 US $3,004 US $19,428 199.3 0.76 330.3 1.26 60% 89.6 1.22 122.0 1.66 73% US $217 109.7 0.58 208.3 1.10 53% 31% 31% US $97 US $59Compañía de Minas Buenaventura S.A.A. NYSE:BVN US $3,861 US $114 US $4,444 22.1 0.21 110.0 1.04 20% 3.6 0.11 26.6 0.84 13% US $1,242 15.7 0.26 74.4 1.21 21% 30% 24% US $201 US $40Detour Gold Corporation TSX:DGC US $1,776 US $170 US $1,903 21.5 0.96 21.5 0.96 100% 16.5 0.97 16.5 0.97 100% US $116 5.1 0.96 5.1 0.96 100% 23% 23% US $88 US $88Eldorado Gold Corporation TSX:ELD US $964 US $700 US $858 42.1 0.91 58.9 1.27 71% 18.4 1.23 27.0 1.80 68% US $47 23.7 0.75 31.9 1.02 74% 55% 55% US $20 US $15Evolution Mining Limited ASX:EVN US $3,934 US $78 US $4,157 14.6 0.84 19.9 1.14 73% 6.5 1.12 6.7 1.16 97% US $642 8.2 0.70 13.2 1.13 62% 34% 31% US $284 US $209Fresnillo PLC LSE:FRES US $13,890 US $1,339 US $13,349 38.3 0.79 85.8 1.78 45% 9.6 0.76 21.8 1.74 44% US $1,398 28.4 0.80 63.7 1.79 45% 34% 50% US $349 US $156Gold Fields Limited JSE:GFI US $3,516 US $149 US $4,942 105.5 2.00 126.6 2.40 83% 47.6 2.81 48.7 2.87 98% US $104 57.9 1.62 78.0 2.18 74% 48% 56% US $47 US $39Goldcorp Inc. TSX:G US $11,900 US ($3) US $14,230 117.7 0.65 206.4 1.14 57% 53.6 0.68 103.0 1.31 52% US $266 64.1 0.63 103.3 1.01 62% 39% 41% US $121 US $69IAMGOLD Corporation TSX:IMG US $2,610 US $852 US $2,147 36.1 1.22 37.0 1.25 98% 14.3 1.22 14.3 1.22 100% US $150 21.8 1.21 22.7 1.26 96% 45% 46% US $59 US $58Kinross Gold Corporation TSX:K US $5,107 US $1,731 US $5,107 63.3 0.71 64.5 0.72 98% 26.8 0.74 27.1 0.74 99% US $191 36.5 0.69 37.5 0.70 98% 15% 15% US $81 US $79Newcrest Mining Limited ASX:NCM US $14,022 US $585 US $15,428 129.2 0.60 233.1 1.08 55% 65.0 0.60 121.7 1.13 53% US $237 64.2 0.59 110.6 1.01 58% 22% 22% US $119 US $66Newmont Mining Corporation NYSE:NEM US $20,784 US $3,658 US $21,173 124.8 0.80 167.2 1.07 75% 69.0 0.96 76.1 1.06 91% US $307 55.7 0.66 90.9 1.08 61% 29% 20% US $170 US $127Randgold Resources Limited LSE:RRS US $9,356 US $813 US $8,546 25.6 3.35 25.6 3.35 100% 14.5 3.85 14.5 3.85 100% US $590 11.1 2.86 11.1 2.86 100% 53% 53% US $333 US $333Yamana Gold Inc. TSX:YRI US $3,097 US ($10) US $4,749 59.0 0.54 120.2 1.09 49% 20.6 0.39 56.9 1.07 36% US $231 38.5 0.67 63.3 1.11 61% 42% 52% US $80 US $39Group Average - Total # Companies: 17 US $406 US $143 US $100Equivalency assumptions (US$ / 02-02-18): $1,333/oz Au, $16.59/oz Ag, $991/oz Pt, $1,049/oz Pd, $3.18/lb Cu, $1.61/lb Zn, $1.23/lb Pb, $6.08/lb Ni, $8.80/lb Mo, $36.46/lb Co, $8,150/t Sb, $23.38/lb U3O8, $0.20/lb Sn, $93.00/t HCC, $72.94/t 62% FeSource: SNL Financial retrieved on February 2, 2018
EV/ozAu
Resources (M&I and Inferred) GlobalAu
(Moz)Au(g/t)
AuEq(Moz)
AuEq(g/t)
% Au % AuInferred
% AuEqInferred
EV/ozAu
EV/ozAuEq
ReservesAu
(Moz)Au(g/t)
AuEq(Moz)
AuEq(g/t)
% Au
MarketCapitalization
(millions)
WorkingCapital
(millions)
EnterpriseValue
(millions)
Global Reserves & ResourcesAu
(Moz)Au(g/t)
AuEq(Moz)
AuEq(g/t)
% Au

The Weekly Dig 2/2/18
Haywood Mining [email protected] Page 20
Intermediate Gold Producers – Reserves and Resources
Reserves
Acacia Mining plc LSE:ACA US $1,042 US $0 US $1,128 27.9 4.02 30.3 4.37 92% 7.6 3.91 8.2 4.21 93% US $148 20.3 4.07 22.1 4.43 92% 58% US $40 US $37Alamos Gold Inc. TSX:AGI US $2,214 US $274 US $1,942 22.3 1.26 23.0 1.30 97% 10.1 1.47 10.4 1.52 96% US $193 12.2 1.14 12.6 1.17 97% 41% US $87 US $84B2Gold Corp. TSX:BTO US $2,884 US $35 US $3,483 22.6 0.75 28.9 0.95 78% 6.9 1.34 6.9 1.34 100% US $504 15.7 0.63 22.0 0.88 71% 46% US $154 US $120Centamin Plc LSE:CEY US $2,602 US $443 US $2,159 11.3 1.19 11.3 1.19 100% 4.4 1.08 4.4 1.08 100% US $491 6.9 1.28 6.9 1.28 100% 40% US $191 US $191Centerra Gold Inc. TSX:CG US $1,475 US $616 US $1,138 28.4 0.49 50.0 0.87 57% 15.8 0.73 20.7 0.96 76% US $72 12.5 0.35 29.3 0.82 43% 45% US $40 US $23China Gold International Resources Corp. Ltd. TSX:CGG US $681 US $131 US $1,707 9.7 0.15 65.7 1.00 15% 5.0 0.28 24.9 1.41 20% US $343 4.7 0.10 40.7 0.85 12% 28% US $176 US $26Endeavour Mining Corporation TSX:EDV US $1,925 US $142 US $2,114 15.5 1.85 15.5 1.85 100% 8.2 1.79 8.2 1.79 100% US $259 7.3 1.92 7.3 1.92 100% 35% US $137 US $137Guyana Goldfields Inc. TSX:GUY US $643 US $128 US $560 8.6 2.94 8.6 2.94 100% 3.5 2.99 3.5 2.99 100% US $158 5.1 2.91 5.1 2.91 100% 41% US $65 US $65Harmony Gold Mining Company Limited JSE:HAR US $735 US $91 US $667 93.4 1.19 126.0 1.60 74% 24.8 0.70 37.7 1.06 66% US $27 68.7 1.59 87.5 2.02 78% 43% US $7 US $5Kirkland Lake Gold Ltd. TSX:KL US $3,013 US $102 US $2,945 17.3 4.22 17.3 4.22 100% 4.2 8.55 4.2 8.55 100% US $694 13.1 3.62 13.1 3.62 100% 41% US $170 US $170Klondex Mines Ltd. TSX:KDX US $353 US $17 US $352 6.3 1.47 6.5 1.52 97% 0.7 7.22 0.7 7.65 94% US $510 5.6 1.34 5.8 1.38 97% 54% US $56 US $54New Gold Inc. TSX:NGD US $1,658 US $305 US $2,331 23.3 0.75 31.9 1.02 73% 14.7 0.78 18.3 0.98 80% US $159 8.6 0.69 13.6 1.09 63% 24% US $100 US $73Northern Star Resources Limited ASX:NST US $2,828 US $247 US $2,590 11.7 3.43 23.6 6.92 50% 3.5 4.18 3.5 4.18 100% US $744 8.2 3.31 20.1 8.10 41% 56% US $221 US $110OceanaGold Corporation TSX:OGC US $1,554 US $20 US $1,778 14.9 1.58 16.3 1.72 92% 6.4 1.46 7.3 1.67 87% US $279 8.5 1.68 9.0 1.77 95% 46% US $119 US $109Premier Gold Mines Limited TSX:PG US $564 US $95 US $470 10.8 1.67 10.9 1.69 99% 2.8 1.17 2.8 1.19 99% US $167 8.0 1.97 8.0 1.99 99% 50% US $44 US $43Pretium Resources Inc. TSX:PVG US $1,203 US $7 US $1,911 48.8 0.68 63.5 0.88 77% 8.7 14.63 9.1 15.29 96% US $220 40.1 0.56 54.4 0.76 74% 32% US $39 US $30Regis Resources Limited ASX:RRL US $1,656 US $111 US $1,547 9.2 0.91 9.2 0.91 100% 4.2 1.10 4.2 1.10 100% US $367 5.0 0.80 5.0 0.80 100% 38% US $167 US $167Resolute Mining Limited ASX:RSG US $682 US $298 US $411 12.6 1.55 12.6 1.55 100% 4.1 1.33 4.1 1.33 100% US $100 8.5 1.68 8.5 1.68 100% 38% US $32 US $32SEMAFO Inc. TSX:SMF US $920 US $254 US $805 7.8 2.76 7.8 2.76 100% 2.7 3.31 2.7 3.31 100% US $298 5.1 2.54 5.1 2.54 100% 47% US $103 US $103Tahoe Resources Inc. TSX:THO US $1,319 US $178 US $1,150 18.2 0.68 30.5 1.14 60% 4.5 0.53 10.6 1.27 42% US $258 13.7 0.75 19.9 1.09 69% 57% US $63 US $38TMAC Resources Inc. TSX:TMR US $654 US $60 US $745 6.6 8.12 6.6 8.12 100% 3.6 7.72 3.6 7.72 100% US $207 3.0 8.66 3.0 8.66 100% 57% US $113 US $113Torex Gold Resources Inc TSX:TXG US $785 US $52 US $1,076 8.6 2.65 12.0 3.69 72% 3.3 2.57 3.4 2.62 98% US $326 5.3 2.69 8.6 4.38 61% 85% US $125 US $90Group Average - Total # Companies: 22 US $296 US $102 US $83Equivalency assumptions (US$ / 02-02-18): $1,333/oz Au, $16.59/oz Ag, $991/oz Pt, $1,049/oz Pd, $3.18/lb Cu, $1.61/lb Zn, $1.23/lb Pb, $6.08/lb Ni, $8.80/lb Mo, $36.46/lb Co, $8,150/t Sb, $23.38/lb U3O8, $0.20/lb Sn, $93.00/t HCC, $72.94/t 62% FeSource: SNL Financial retrieved on February 2, 2018
EnterpriseValue
(millions)Company Symbol
MarketCapitalization
(millions)
WorkingCapital
(millions)
Global Reserves & Resources Reserves Resources (M&I and Inferred)Au
(Moz)Au(g/t)
AuEq(Moz)
AuEq(g/t)
% Au
GlobalEV/oz
Au% Au Au
(Moz)Au(g/t)
AuEq(Moz)
AuEq(g/t)
EV/ozAu
EV/ozAuEq
Au(Moz)
Au(g/t)
AuEq(Moz)
AuEq(g/t)
% Au % AuInferred
The Weekly Dig 2/2/18
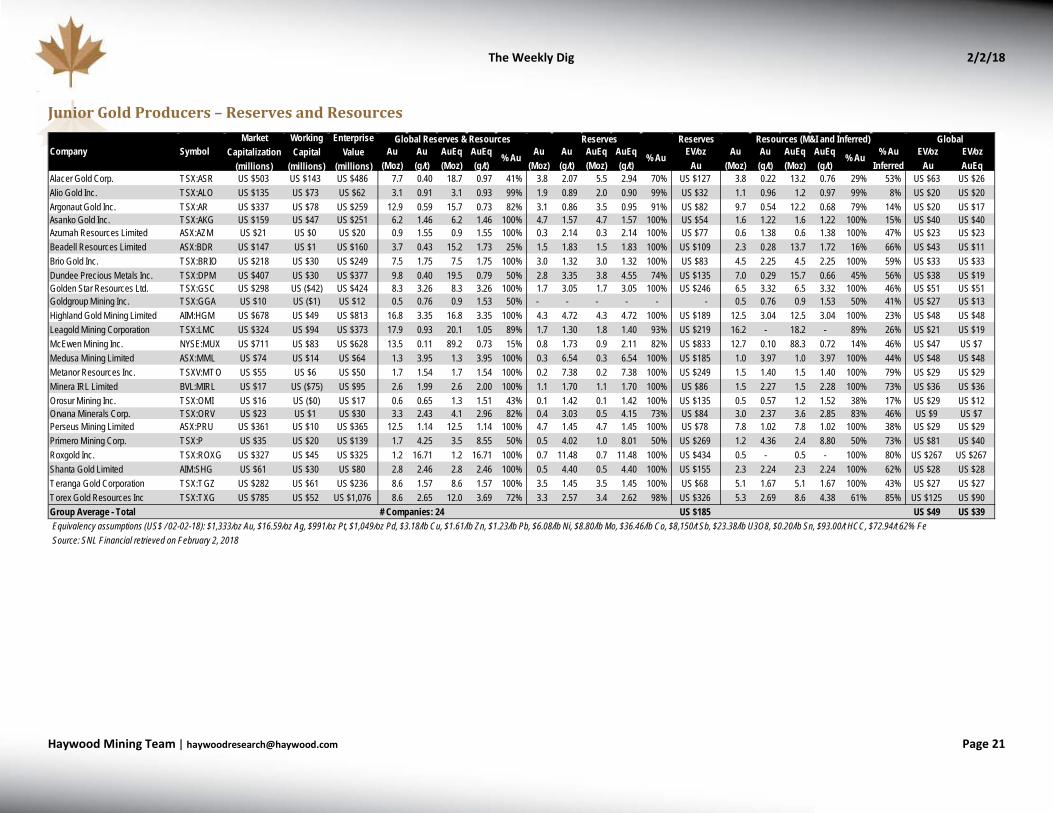
Haywood Mining [email protected] Page 21
Junior Gold Producers – Reserves and Resources
Reserves
Alacer Gold Corp. TSX:ASR US $503 US $143 US $486 7.7 0.40 18.7 0.97 41% 3.8 2.07 5.5 2.94 70% US $127 3.8 0.22 13.2 0.76 29% 53% US $63 US $26Alio Gold Inc. TSX:ALO US $135 US $73 US $62 3.1 0.91 3.1 0.93 99% 1.9 0.89 2.0 0.90 99% US $32 1.1 0.96 1.2 0.97 99% 8% US $20 US $20Argonaut Gold Inc. TSX:AR US $337 US $78 US $259 12.9 0.59 15.7 0.73 82% 3.1 0.86 3.5 0.95 91% US $82 9.7 0.54 12.2 0.68 79% 14% US $20 US $17Asanko Gold Inc. TSX:AKG US $159 US $47 US $251 6.2 1.46 6.2 1.46 100% 4.7 1.57 4.7 1.57 100% US $54 1.6 1.22 1.6 1.22 100% 15% US $40 US $40Azumah Resources Limited ASX:AZM US $21 US $0 US $20 0.9 1.55 0.9 1.55 100% 0.3 2.14 0.3 2.14 100% US $77 0.6 1.38 0.6 1.38 100% 47% US $23 US $23Beadell Resources Limited ASX:BDR US $147 US $1 US $160 3.7 0.43 15.2 1.73 25% 1.5 1.83 1.5 1.83 100% US $109 2.3 0.28 13.7 1.72 16% 66% US $43 US $11Brio Gold Inc. TSX:BRIO US $218 US $30 US $249 7.5 1.75 7.5 1.75 100% 3.0 1.32 3.0 1.32 100% US $83 4.5 2.25 4.5 2.25 100% 59% US $33 US $33Dundee Precious Metals Inc. TSX:DPM US $407 US $30 US $377 9.8 0.40 19.5 0.79 50% 2.8 3.35 3.8 4.55 74% US $135 7.0 0.29 15.7 0.66 45% 56% US $38 US $19Golden Star Resources Ltd. TSX:GSC US $298 US ($42) US $424 8.3 3.26 8.3 3.26 100% 1.7 3.05 1.7 3.05 100% US $246 6.5 3.32 6.5 3.32 100% 46% US $51 US $51Goldgroup Mining Inc. TSX:GGA US $10 US ($1) US $12 0.5 0.76 0.9 1.53 50% - - - - - - 0.5 0.76 0.9 1.53 50% 41% US $27 US $13Highland Gold Mining Limited AIM:HGM US $678 US $49 US $813 16.8 3.35 16.8 3.35 100% 4.3 4.72 4.3 4.72 100% US $189 12.5 3.04 12.5 3.04 100% 23% US $48 US $48Leagold Mining Corporation TSX:LMC US $324 US $94 US $373 17.9 0.93 20.1 1.05 89% 1.7 1.30 1.8 1.40 93% US $219 16.2 - 18.2 - 89% 26% US $21 US $19McEwen Mining Inc. NYSE:MUX US $711 US $83 US $628 13.5 0.11 89.2 0.73 15% 0.8 1.73 0.9 2.11 82% US $833 12.7 0.10 88.3 0.72 14% 46% US $47 US $7Medusa Mining Limited ASX:MML US $74 US $14 US $64 1.3 3.95 1.3 3.95 100% 0.3 6.54 0.3 6.54 100% US $185 1.0 3.97 1.0 3.97 100% 44% US $48 US $48Metanor Resources Inc. TSXV:MTO US $55 US $6 US $50 1.7 1.54 1.7 1.54 100% 0.2 7.38 0.2 7.38 100% US $249 1.5 1.40 1.5 1.40 100% 79% US $29 US $29Minera IRL Limited BVL:MIRL US $17 US ($75) US $95 2.6 1.99 2.6 2.00 100% 1.1 1.70 1.1 1.70 100% US $86 1.5 2.27 1.5 2.28 100% 73% US $36 US $36Orosur Mining Inc. TSX:OMI US $16 US ($0) US $17 0.6 0.65 1.3 1.51 43% 0.1 1.42 0.1 1.42 100% US $135 0.5 0.57 1.2 1.52 38% 17% US $29 US $12Orvana Minerals Corp. TSX:ORV US $23 US $1 US $30 3.3 2.43 4.1 2.96 82% 0.4 3.03 0.5 4.15 73% US $84 3.0 2.37 3.6 2.85 83% 46% US $9 US $7Perseus Mining Limited ASX:PRU US $361 US $10 US $365 12.5 1.14 12.5 1.14 100% 4.7 1.45 4.7 1.45 100% US $78 7.8 1.02 7.8 1.02 100% 38% US $29 US $29Primero Mining Corp. TSX:P US $35 US $20 US $139 1.7 4.25 3.5 8.55 50% 0.5 4.02 1.0 8.01 50% US $269 1.2 4.36 2.4 8.80 50% 73% US $81 US $40Roxgold Inc. TSX:ROXG US $327 US $45 US $325 1.2 16.71 1.2 16.71 100% 0.7 11.48 0.7 11.48 100% US $434 0.5 - 0.5 - 100% 80% US $267 US $267Shanta Gold Limited AIM:SHG US $61 US $30 US $80 2.8 2.46 2.8 2.46 100% 0.5 4.40 0.5 4.40 100% US $155 2.3 2.24 2.3 2.24 100% 62% US $28 US $28Teranga Gold Corporation TSX:TGZ US $282 US $61 US $236 8.6 1.57 8.6 1.57 100% 3.5 1.45 3.5 1.45 100% US $68 5.1 1.67 5.1 1.67 100% 43% US $27 US $27Torex Gold Resources Inc TSX:TXG US $785 US $52 US $1,076 8.6 2.65 12.0 3.69 72% 3.3 2.57 3.4 2.62 98% US $326 5.3 2.69 8.6 4.38 61% 85% US $125 US $90Group Average - Total # Companies: 24 US $185 US $49 US $39Equivalency assumptions (US$ / 02-02-18): $1,333/oz Au, $16.59/oz Ag, $991/oz Pt, $1,049/oz Pd, $3.18/lb Cu, $1.61/lb Zn, $1.23/lb Pb, $6.08/lb Ni, $8.80/lb Mo, $36.46/lb Co, $8,150/t Sb, $23.38/lb U3O8, $0.20/lb Sn, $93.00/t HCC, $72.94/t 62% FeSource: SNL Financial retrieved on February 2, 2018
EnterpriseValue
(millions)Company Symbol
MarketCapitalization
(millions)
WorkingCapital
(millions)
Global Reserves & Resources Reserves Resources (M&I and Inferred)Au
(Moz)Au(g/t)
AuEq(Moz)
AuEq(g/t)
% Au
Global
% Au Au(Moz)
Au(g/t)
AuEq(Moz)
AuEq(g/t)
EV/ozAu
EV/ozAuEq
Au(Moz)
Au(g/t)
AuEq(Moz)
AuEq(g/t)
% Au % AuInferred
EV/ozAu

The Weekly Dig 2/2/18
Haywood Mining [email protected] Page 22
Gold Development-Stage Companies (Engineering Study Complete) – Enterprise Value per Ounce
Company Reserves
African Gold Group, Inc. TSXV:AGG US $12 US $2 US $10 2.0 1.01 2.0 1.01 100% 0.5 1.25 0.5 1.25 100% US $22 1.5 0.96 1.5 0.96 100% 59% US $5 US $5Almaden Minerals Ltd. TSX:AMM US $95 US $14 US $81 2.4 0.42 4.9 0.86 50% 1.3 0.62 2.3 1.09 57% US $63 1.1 0.31 2.6 0.73 43% 40% US $33 US $17Amarillo Gold Corporation TSXV:AGC US $20 US ($1) US $30 2.1 1.22 2.1 1.22 100% 1.0 1.63 1.0 1.63 100% US $30 1.1 0.99 1.1 0.99 100% 57% US $14 US $14ATAC Resources Ltd. TSXV:ATC US $56 US $13 US $43 0.7 2.35 0.7 2.39 99% - - - - - - 0.7 2.35 0.7 2.39 99% 28% US $64 US $63Atlantic Gold Corporation TSXV:AGB US $247 US ($13) US $354 2.0 1.31 2.0 1.31 100% 0.6 1.43 0.6 1.43 100% US $586 1.4 1.26 1.4 1.26 100% 31% US $175 US $175Avesoro Resources Inc. TSX:ASO US $250 US $4 US $356 3.8 1.98 3.8 1.98 100% 1.1 2.30 1.1 2.30 100% US $319 2.6 1.88 2.6 1.88 100% 67% US $95 US $95Barkerville Gold Mines Ltd. TSXV:BGM US $228 US $41 US $187 3.9* 3.9 100% - 3.9* 3.9 100% US $48 US $48Belo Sun Mining Corp TSX:BSX US $135 US $47 US $88 6.8 1.04 6.8 1.04 100% 3.8 1.02 3.8 1.02 100% US $23 3.0 1.07 3.0 1.07 100% 52% US $13 US $13Bluestone Resources Inc. TSXV:BSR US $70 US $35 US $35 1.3 10.09 1.3 10.53 96% - - - - - - 1.3 10.09 1.3 10.53 96% 4% US $27 US $26California Gold Mining Inc. TSXV:CGM US $9 US $1 US $8 1.3 1.31 1.3 1.31 100% - - - - - - 1.3 1.31 1.3 1.31 100% 32% US $6 US $6Chaarat Gold Holdings Limited AIM:CGH US $108 US $14 US $109 7.1 2.53 7.2 2.58 98% - - - - - - 7.1 2.53 7.2 2.58 98% 15% US $15 US $15Chalice Gold Mines Limited ASX:CHN US $37 US $41 US ($3) 0.5 1.21 1.1 3.02 40% - - - - - - 0.5 1.21 1.1 3.02 40% 38% - - Chesapeake Gold Corp. TSXV:CKG US $110 US $17 US $93 19.8 0.49 31.8 0.79 62% 18.3 0.52 29.3 0.83 62% US $5 1.5 0.33 2.4 0.52 64% 53% US $5 US $3Continental Gold Inc. TSX:CNL US $554 US $117 US $483 9.1 9.91 9.7 10.59 94% 3.7 8.41 3.8 8.72 97% US $130 5.4 - 5.9 - 92% 86% US $53 US $50Dacian Gold Limited ASX:DCN US $457 US $60 US $398 3.3 2.31 3.3 2.31 100% 1.2 2.01 1.2 2.01 100% US $332 2.1 2.52 2.1 2.52 100% 53% US $120 US $120Dalradian Resources Inc. TSX:DNA US $321 US $35 US $286 4.4 10.74 4.4 10.76 100% 1.4 8.54 1.4 8.59 99% US $199 3.0 12.28 3.0 12.28 100% 78% US $65 US $65Equinox Gold Corp. TSXV:EQX US $382 US $51 US $346 8.5 0.24 26.7 0.77 32% 1.0 1.52 1.0 1.52 100% US $356 7.5 0.22 25.8 0.75 29% 34% US $41 US $13Euro Sun Mining Inc. TSX:ESM US $53 US $1 US $53 7.5 0.54 11.2 0.80 67% - - - - - - 7.5 0.54 11.2 0.80 67% 5% US $7 US $5Falco Resources Ltd. TSXV:FPC US $143 US $19 US $132 5.6 1.53 10.0 2.76 55% 3.7 1.44 6.6 2.53 57% US $35 1.8 1.75 3.4 3.31 53% 55% US $24 US $13First Mining Gold Corp. TSX:FF US $245 US $19 US $226 12.2 1.49 12.6 1.53 97% - - - - - - 12.2 1.49 12.6 1.53 97% 38% US $19 US $18Gabriel Resources Ltd. TSXV:GBU US $112 US $37 US $124 16.4 1.05 17.3 1.11 95% 8.1 1.46 8.6 1.55 94% US $15 8.3 0.83 8.7 0.87 95% 27% US $8 US $7Gold Road Resources Limited ASX:GOR US $560 US $236 US $324 3.4 1.11 3.5 1.15 97% 1.8 1.20 1.8 1.20 100% US $184 1.6 1.03 1.7 1.10 94% 60% US $96 US $93Golden Queen Mining Co. Ltd. TSX:GQM US $17 US ($9) US $55 0.9 0.53 1.1 0.64 82% 0.5 0.66 0.6 0.80 83% US $112 0.4 0.43 0.5 0.52 82% 30% US $62 US $51Goldquest Mining Corp. TSXV:GQC US $70 US $19 US $51 2.2 2.60 3.5 4.09 64% 0.8 3.72 1.2 5.20 71% US $61 1.4 2.19 2.1 3.38 65% 16% US $23 US $15Harte Gold Corp. TSX:HRT US $196 US $5 US $192 0.5 9.47 0.5 9.47 100% - - - - - - 0.5 9.47 0.5 9.47 100% 33% US $403 US $403Hummingbird Resources PLC AIM:HUM US $166 US $67 US $174 6.3 1.63 6.3 1.63 100% 0.6 3.14 0.6 3.14 100% US $306 5.8 1.56 5.8 1.56 100% 53% US $28 US $28IDM Mining Ltd. TSXV:IDM US $30 US $6 US $24 0.6 8.41 0.7 8.69 97% 0.5 7.53 0.5 7.81 97% US $52 0.2 12.23 0.2 12.56 97% 37% US $38 US $37International Tower Hill Mines Ltd. TSX:ITH US $79 US $3 US $76 12.6 0.68 12.6 0.68 100% 9.0 0.71 9.0 0.71 100% US $8 3.6 0.60 3.6 0.60 100% 31% US $6 US $6INV Metals Inc. TSX:INV US $54 US $18 US $36 3.1 3.34 3.9 4.21 79% 1.9 4.98 2.2 5.79 86% US $19 1.2 2.23 1.7 3.14 71% 44% US $12 US $9K92 Mining Inc. TSXV:KNT US $59 US ($5) US $67 1.5 8.24 2.1 11.62 71% - - - - - - 1.5 8.24 2.1 11.62 71% 82% US $46 US $32KEFI Minerals Plc AIM:KEFI US $17 US $3 US $15 0.4 3.56 0.4 3.56 100% - - - - - - 0.4 3.56 0.4 3.56 100% 92% US $39 US $39Lumina Gold Corp. TSXV:LUM US $131 US $3 US $128 18.5 0.50 26.7 0.72 70% - - - - - - 18.5 0.50 26.7 0.72 70% 61% US $7 US $5Lundin Gold Inc. TSX:LUG US $484 US $66 US $582 9.5 8.33 9.7 8.48 98% 4.8 9.67 4.9 9.83 98% US $121 4.7 7.29 4.8 7.43 98% 46% US $61 US $60Lupaka Gold Corp. TSXV:LPK US $18 US ($2) US $20 0.7 2.01 1.2 3.28 61% - - - - - - 0.7 2.01 1.2 3.28 61% 18% US $28 US $17Lydian International Limited TSX:LYD US $276 US $43 US $381 4.8 0.69 5.1 0.73 94% 2.6 0.79 2.8 0.84 94% US $146 2.1 0.60 2.3 0.64 93% 60% US $80 US $75Metals Exploration Plc AIM:MTL US $95 US ($46) US $189 1.7 1.62 2.0 1.90 85% 0.9 1.86 1.0 2.11 88% US $211 0.8 1.43 1.0 1.73 82% 82% US $109 US $93Midas Gold Corp. TSX:MAX US $144 US $24 US $143 6.5 1.57 7.2 1.72 91% 4.6 1.60 5.0 1.76 91% US $31 2.0 1.49 2.1 1.62 92% 55% US $22 US $20Minera Alamos Inc. TSXV:MAI US $19 US $5 US $14 0.8 1.64 1.0 1.99 82% - - - - - - 0.8 1.64 1.0 1.99 82% 18% US $17 US $14Moneta Porcupine Mines Inc. TSX:ME US $30 US $5 US $25 4.3 1.17 4.3 1.17 100% - - - - - - 4.3 1.17 4.3 1.17 100% 75% US $6 US $6NovaGold Resources Inc. TSX:NG US $1,167 US $81 US $1,175 28.7 0.96 45.4 1.51 63% 19.6 1.18 28.4 1.71 69% US $60 9.1 0.67 17.0 1.27 53% 58% US $41 US $26Orca Gold Inc. TSXV:ORG US $70 US $7 US $64 1.6 1.80 1.6 1.80 100% - - - - - - 1.6 1.80 1.6 1.80 100% 23% US $39 US $39Orezone Gold Corporation TSXV:ORE US $106 US $13 US $93 5.2 0.67 5.2 0.67 100% - - - - - - 5.2 0.67 5.2 0.67 100% 17% US $18 US $18Orla Mining Ltd. TSXV:OLA US $207 US $11 US $196 10.6 0.93 13.5 1.19 78% 2.2 0.71 2.7 0.87 82% US $89 8.1 1.05 10.4 1.34 78% 6% US $19 US $15Red Eagle Mining Corporation TSX:R US $90 US ($13) US $161 0.6 3.35 0.6 3.35 100% 0.4 5.19 0.4 5.19 100% US $397 0.2 1.98 0.2 1.98 100% 64% US $263 US $263RTG Mining Inc. TSX:RTG US $27 US $6 US $21 0.4 1.64 0.9 3.83 43% 0.2 2.04 0.5 5.33 38% US $102 0.2 1.34 0.3 2.65 50% 84% US $55 US $24Rubicon Minerals Corporation TSX:RMX US $68 US $21 US $58 0.4 6.39 0.4 6.39 100% - - - - - - 0.4 6.39 0.4 6.39 100% 74% US $139 US $139Sabina Gold & Silver Corp. TSX:SBB US $357 US $29 US $329 7.2 6.21 7.2 6.21 100% 2.5 6.30 2.5 6.30 100% US $131 4.7 6.16 4.7 6.16 100% 40% US $46 US $46Sandspring Resources Ltd. TSXV:SSP US $34 US ($1) US $35 10.4 0.85 11.8 0.96 88% 4.1 1.00 4.6 1.13 89% US $8 6.3 0.77 7.2 0.87 88% 53% US $3 US $3Seabridge Gold Inc. TSX:SEA US $656 US $16 US $639 98.2 0.49 191.9 0.95 51% 45.3 0.61 73.1 0.99 62% US $14 53.0 0.41 118.8 0.92 45% 71% US $7 US $3Sihayo Gold Limited ASX:SIH US $28 US ($0) US $28 1.1 2.62 1.1 2.62 100% 0.4 2.41 0.4 2.41 100% US $68 0.7 2.77 0.7 2.77 100% 42% US $26 US $26Solitario Zinc Corp. AMEX:XPL US $32 US $15 US $17 - - 6.6 9.22 - - - - - - - - - 6.6 9.22 - - US $3 US $3Terraco Gold Corp. TSXV:TEN US $11 US $1 US $18 1.0 0.70 1.0 0.70 100% - - - - - - 1.0 0.70 1.0 0.70 100% 8% US $17 US $17Vast Resources plc AIM:VAST US $44 US ($5) US $74 2.1 1.55 2.9 2.11 73% 0.6 1.83 1.1 3.36 54% US $129 1.6 1.58 1.8 1.84 86% 56% US $35 US $26Victoria Gold Corp. TSXV:VIT US $175 US $11 US $164 4.5 0.65 4.6 0.66 98% 2.7 0.67 2.7 0.67 100% US $62 1.9 0.61 1.9 0.63 97% 30% US $36 US $36Group Average - Total # Companies: 53 US $130 US $50 US $45Group Average - 0 - 20 million ounces # Companies: 51 US $51 US $49Group Average - 20 - 50 million ounces # Companies: 1 US $41 US $12Group Average - +50 million ounces # Companies: 1 US $7 US $3Equivalency assumptions (US$ / 02-02-18): $1,333/oz Au, $16.59/oz Ag, $991/oz Pt, $1,049/oz Pd, $3.18/lb Cu, $1.61/lb Zn, $1.23/lb Pb, $6.08/lb Ni, $8.80/lb Mo, $36.46/lb Co, $8,150/t Sb, $23.38/lb U3O8, $0.20/lb Sn, $93.00/t HCC, $72.94/t 62% FeSource: SNL Financial retrieved on February 2, 2018
SymbolMarket
Capitalization(millions)
WorkingCapital
(millions)
EnterpriseValue
(millions)
Global Reserves & ResourcesAu
(Moz)Au
(g/t)AuEq(Moz)
AuEq(g/t) % Au
GlobalEV/oz
AuEV/ozAuEq
Resources (M&I and Inferred)Au
(Moz)Au
(g/t)AuEq(Moz) % AuAuEq
(g/t)% Au
InferredEV/oz
Au
ReservesAu
(Moz)Au
(g/t)AuEq(Moz) % AuAuEq
(g/t)
The Weekly Dig 2/2/18
Haywood Mining [email protected] Page 23
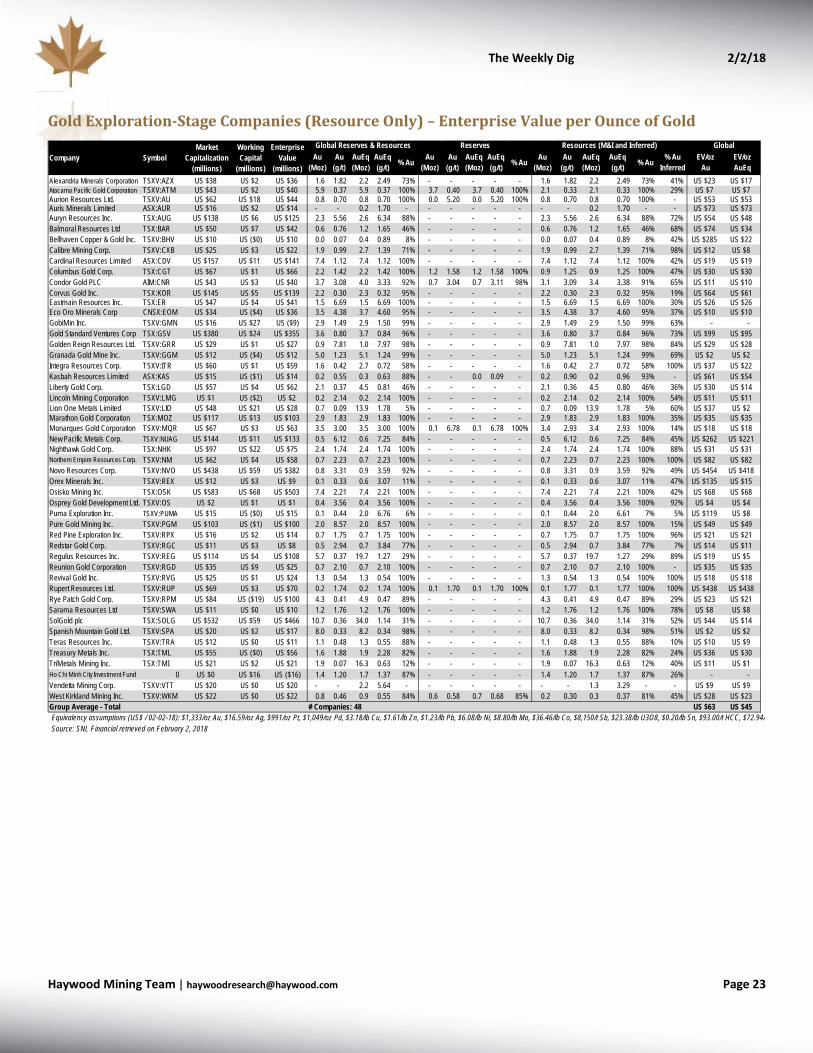
Gold Exploration-Stage Companies (Resource Only) – Enterprise Value per Ounce of Gold
Alexandria Minerals Corporation TSXV:AZX US $38 US $2 US $36 1.6 1.82 2.2 2.49 73% - - - - - 1.6 1.82 2.2 2.49 73% 41% US $23 US $17Atacama Pacific Gold Corporation TSXV:ATM US $43 US $2 US $40 5.9 0.37 5.9 0.37 100% 3.7 0.40 3.7 0.40 100% 2.1 0.33 2.1 0.33 100% 29% US $7 US $7Aurion Resources Ltd. TSXV:AU US $62 US $18 US $44 0.8 0.70 0.8 0.70 100% 0.0 5.20 0.0 5.20 100% 0.8 0.70 0.8 0.70 100% - US $53 US $53Auris Minerals Limited ASX:AUR US $16 US $2 US $14 - - 0.2 1.70 - - - - - - - - 0.2 1.70 - - US $73 US $73Auryn Resources Inc. TSX:AUG US $138 US $6 US $125 2.3 5.56 2.6 6.34 88% - - - - - 2.3 5.56 2.6 6.34 88% 72% US $54 US $48Balmoral Resources Ltd TSX:BAR US $50 US $7 US $42 0.6 0.76 1.2 1.65 46% - - - - - 0.6 0.76 1.2 1.65 46% 68% US $74 US $34Bellhaven Copper & Gold Inc. TSXV:BHV US $10 US ($0) US $10 0.0 0.07 0.4 0.89 8% - - - - - 0.0 0.07 0.4 0.89 8% 42% US $285 US $22Calibre Mining Corp. TSXV:CXB US $25 US $3 US $22 1.9 0.99 2.7 1.39 71% - - - - - 1.9 0.99 2.7 1.39 71% 98% US $12 US $8Cardinal Resources Limited ASX:CDV US $157 US $11 US $141 7.4 1.12 7.4 1.12 100% - - - - - 7.4 1.12 7.4 1.12 100% 42% US $19 US $19Columbus Gold Corp. TSX:CGT US $67 US $1 US $66 2.2 1.42 2.2 1.42 100% 1.2 1.58 1.2 1.58 100% 0.9 1.25 0.9 1.25 100% 47% US $30 US $30Condor Gold PLC AIM:CNR US $43 US $3 US $40 3.7 3.08 4.0 3.33 92% 0.7 3.04 0.7 3.11 98% 3.1 3.09 3.4 3.38 91% 65% US $11 US $10Corvus Gold Inc. TSX:KOR US $145 US $5 US $139 2.2 0.30 2.3 0.32 95% - - - - - 2.2 0.30 2.3 0.32 95% 19% US $64 US $61Eastmain Resources Inc. TSX:ER US $47 US $4 US $41 1.5 6.69 1.5 6.69 100% - - - - - 1.5 6.69 1.5 6.69 100% 30% US $26 US $26Eco Oro Minerals Corp CNSX:EOM US $34 US ($4) US $36 3.5 4.38 3.7 4.60 95% - - - - - 3.5 4.38 3.7 4.60 95% 37% US $10 US $10GobiMin Inc. TSXV:GMN US $16 US $27 US ($9) 2.9 1.49 2.9 1.50 99% - - - - - 2.9 1.49 2.9 1.50 99% 63% - - Gold Standard Ventures Corp TSX:GSV US $380 US $24 US $355 3.6 0.80 3.7 0.84 96% - - - - - 3.6 0.80 3.7 0.84 96% 73% US $99 US $95Golden Reign Resources Ltd. TSXV:GRR US $29 US $1 US $27 0.9 7.81 1.0 7.97 98% - - - - - 0.9 7.81 1.0 7.97 98% 84% US $29 US $28Granada Gold Mine Inc. TSXV:GGM US $12 US ($4) US $12 5.0 1.23 5.1 1.24 99% - - - - - 5.0 1.23 5.1 1.24 99% 69% US $2 US $2Integra Resources Corp. TSXV:ITR US $60 US $1 US $59 1.6 0.42 2.7 0.72 58% - - - - - 1.6 0.42 2.7 0.72 58% 100% US $37 US $22Kasbah Resources Limited ASX:KAS US $15 US ($1) US $14 0.2 0.55 0.3 0.63 88% - - 0.0 0.09 - 0.2 0.90 0.2 0.96 93% - US $61 US $54Liberty Gold Corp. TSX:LGD US $57 US $4 US $62 2.1 0.37 4.5 0.81 46% - - - - - 2.1 0.36 4.5 0.80 46% 36% US $30 US $14Lincoln Mining Corporation TSXV:LMG US $1 US ($2) US $2 0.2 2.14 0.2 2.14 100% - - - - - 0.2 2.14 0.2 2.14 100% 54% US $11 US $11Lion One Metals Limited TSXV:LIO US $48 US $21 US $28 0.7 0.09 13.9 1.78 5% - - - - - 0.7 0.09 13.9 1.78 5% 60% US $37 US $2Marathon Gold Corporation TSX:MOZ US $117 US $13 US $103 2.9 1.83 2.9 1.83 100% - - - - - 2.9 1.83 2.9 1.83 100% 35% US $35 US $35Monarques Gold Corporation TSXV:MQR US $67 US $3 US $63 3.5 3.00 3.5 3.00 100% 0.1 6.78 0.1 6.78 100% 3.4 2.93 3.4 2.93 100% 14% US $18 US $18New Pacific Metals Corp. TSXV:NUAG US $144 US $11 US $133 0.5 6.12 0.6 7.25 84% - - - - - 0.5 6.12 0.6 7.25 84% 45% US $262 US $221Nighthawk Gold Corp. TSX:NHK US $97 US $22 US $75 2.4 1.74 2.4 1.74 100% - - - - - 2.4 1.74 2.4 1.74 100% 88% US $31 US $31Northern Empire Resources Corp. TSXV:NM US $62 US $4 US $58 0.7 2.23 0.7 2.23 100% - - - - - 0.7 2.23 0.7 2.23 100% 100% US $82 US $82Novo Resources Corp. TSXV:NVO US $438 US $59 US $382 0.8 3.31 0.9 3.59 92% - - - - - 0.8 3.31 0.9 3.59 92% 49% US $454 US $418Orex Minerals Inc. TSXV:REX US $12 US $3 US $9 0.1 0.33 0.6 3.07 11% - - - - - 0.1 0.33 0.6 3.07 11% 47% US $135 US $15Osisko Mining Inc. TSX:OSK US $583 US $68 US $503 7.4 2.21 7.4 2.21 100% - - - - - 7.4 2.21 7.4 2.21 100% 42% US $68 US $68Osprey Gold Development Ltd. TSXV:OS US $2 US $1 US $1 0.4 3.56 0.4 3.56 100% - - - - - 0.4 3.56 0.4 3.56 100% 92% US $4 US $4Puma Exploration Inc. TSXV:PUMA US $15 US ($0) US $15 0.1 0.44 2.0 6.76 6% - - - - - 0.1 0.44 2.0 6.61 7% 5% US $119 US $8Pure Gold Mining Inc. TSXV:PGM US $103 US ($1) US $100 2.0 8.57 2.0 8.57 100% - - - - - 2.0 8.57 2.0 8.57 100% 15% US $49 US $49Red Pine Exploration Inc. TSXV:RPX US $16 US $2 US $14 0.7 1.75 0.7 1.75 100% - - - - - 0.7 1.75 0.7 1.75 100% 96% US $21 US $21Redstar Gold Corp. TSXV:RGC US $11 US $3 US $8 0.5 2.94 0.7 3.84 77% - - - - - 0.5 2.94 0.7 3.84 77% 7% US $14 US $11Regulus Resources Inc. TSXV:REG US $114 US $4 US $108 5.7 0.37 19.7 1.27 29% - - - - - 5.7 0.37 19.7 1.27 29% 89% US $19 US $5Reunion Gold Corporation TSXV:RGD US $35 US $9 US $25 0.7 2.10 0.7 2.10 100% - - - - - 0.7 2.10 0.7 2.10 100% - US $35 US $35Revival Gold Inc. TSXV:RVG US $25 US $1 US $24 1.3 0.54 1.3 0.54 100% - - - - - 1.3 0.54 1.3 0.54 100% 100% US $18 US $18Rupert Resources Ltd. TSXV:RUP US $69 US $3 US $70 0.2 1.74 0.2 1.74 100% 0.1 1.70 0.1 1.70 100% 0.1 1.77 0.1 1.77 100% 100% US $438 US $438Rye Patch Gold Corp. TSXV:RPM US $84 US ($19) US $100 4.3 0.41 4.9 0.47 89% - - - - - 4.3 0.41 4.9 0.47 89% 29% US $23 US $21Sarama Resources Ltd TSXV:SWA US $11 US $0 US $10 1.2 1.76 1.2 1.76 100% - - - - - 1.2 1.76 1.2 1.76 100% 78% US $8 US $8SolGold plc TSX:SOLG US $532 US $59 US $466 10.7 0.36 34.0 1.14 31% - - - - - 10.7 0.36 34.0 1.14 31% 52% US $44 US $14Spanish Mountain Gold Ltd. TSXV:SPA US $20 US $2 US $17 8.0 0.33 8.2 0.34 98% - - - - - 8.0 0.33 8.2 0.34 98% 51% US $2 US $2Teras Resources Inc. TSXV:TRA US $12 US $0 US $11 1.1 0.48 1.3 0.55 88% - - - - - 1.1 0.48 1.3 0.55 88% 10% US $10 US $9Treasury Metals Inc. TSX:TML US $55 US ($0) US $56 1.6 1.88 1.9 2.28 82% - - - - - 1.6 1.88 1.9 2.28 82% 24% US $36 US $30TriMetals Mining Inc. TSX:TMI US $21 US $2 US $21 1.9 0.07 16.3 0.63 12% - - - - - 1.9 0.07 16.3 0.63 12% 40% US $11 US $1Ho Chi Minh City Investment Fund 0 US $0 US $16 US ($16) 1.4 1.20 1.7 1.37 87% - - - - - 1.4 1.20 1.7 1.37 87% 26% - - Vendetta Mining Corp. TSXV:VTT US $20 US $0 US $20 - - 2.2 5.64 - - - - - - - - 1.3 3.29 - - US $9 US $9West Kirkland Mining Inc. TSXV:WKM US $22 US $0 US $22 0.8 0.46 0.9 0.55 84% 0.6 0.58 0.7 0.68 85% 0.2 0.30 0.3 0.37 81% 45% US $28 US $23Group Average - Total # Companies: 48 US $63 US $45Equivalency assumptions (US$ / 02-02-18): $1,333/oz Au, $16.59/oz Ag, $991/oz Pt, $1,049/oz Pd, $3.18/lb Cu, $1.61/lb Zn, $1.23/lb Pb, $6.08/lb Ni, $8.80/lb Mo, $36.46/lb Co, $8,150/t Sb, $23.38/lb U3O8, $0.20/lb Sn, $93.00/t HCC, $72.94/t Source: SNL Financial retrieved on February 2, 2018
EV/ozAu
EV/ozAuEq
Au(Moz)
Au(g/t)
AuEq(Moz)
AuEq(g/t) % Au
Global
% Au% Au Au(Moz)
Au(g/t)
AuEq(Moz)
Global Reserves & Resources Reserves Resources (M&I and Inferred)Au
(Moz)Au
(g/t)AuEq(Moz)
AuEq(g/t)
AuEq(g/t)
% AuInferred
Company SymbolMarket
Capitalization(millions)
WorkingCapital
(millions)
EnterpriseValue
(millions)

The Weekly Dig 2/2/18
Haywood Mining [email protected] Page 24
Silver – Enterprise Value per Ounce of Silver
Reserves
Alexco Resource Corp. TSX:AXR US $134 US $18 US $115 76 475 152 944 50% - - - - - - 76 475 152 944 50% 24% US $1.51 US $0.76Americas Silver Corporation TSX:USA US $156 US $15 US $153 133 161 356 431 37% 28 164 87 504 33% US $5.42 105 161 269 412 39% 42% US $1.15 US $0.43Arizona Mining Inc. TSX:AZ US $1,102 US $70 US $1,032 435 82 2,439 459 18% - - - - - - 435 82 2,439 459 18% 28% US $2.37 US $0.42Athena Silver Corp OTCPK:AHNR US $2 US ($2) US $4 43 67 43 67 100% - - - - - - 43 67 43 67 100% - US $0.10 US $0.10Aurcana Corporation TSXV:AUN US $15 US $1 US $13 18 290 18 290 100% - - - - - - 18 290 18 290 100% 37% US $0.77 US $0.77Bear Creek Mining Corporation TSXV:BCM US $171 US $21 US $150 496 42 1,261 107 39% 288 51 733 129 39% US $0.52 208 34 528 87 39% 33% US $0.30 US $0.12Coeur Mining, Inc. NYSE:CDE US $1,457 US $345 US $1,401 591 32 1,285 70 46% 174 21 377 45 46% US $8.05 417 42 907 91 46% 25% US $2.37 US $1.09Defiance Silver Corp. TSXV:DEF US $26 US $1 US $25 17 182 18 192 95% - - - - - - 17 182 18 192 95% 100% US $1.48 US $1.40Dolly Varden Silver Corporation TSXV:DV US $31 US $5 US $26 43 333 43 333 100% - - - - - - 43 333 43 333 100% 25% US $0.61 US $0.61Endeavour Silver Corp. TSX:EDR US $287 US $70 US $218 158 198 288 362 55% 38 198 65 344 58% US $5.80 120 198 223 368 54% 57% US $1.38 US $0.76First Majestic Silver Corp. TSX:FR US $939 US $126 US $842 338 137 593 240 57% 90 152 146 247 62% US $9.37 248 132 447 238 56% 66% US $2.49 US $1.42Fortuna Silver Mines Inc. TSX:FVI US $731 US $198 US $575 91 16 477 82 19% 46 15 268 88 17% US $12.55 45 16 209 76 22% 83% US $6.32 US $1.20Golden Arrow Resources Corporation TSXV:GRG US $49 US $15 US $34 - - - - - - - - - - - - - - - - - - - Golden Minerals Company AMEX:AUMN US $38 US $5 US $34 82 159 117 227 70% - - - - - - 82 159 117 227 70% 40% US $0.41 US $0.29Hecla Mining Company NYSE:HL US $1,428 US $196 US $1,748 808 72 2,821 251 29% 172 256 577 857 30% US $10.15 635 60 2,244 213 28% 73% US $2.16 US $0.62Investigator Resources Limited ASX:IVR US $12 US $2 US $10 42 140 51 170 82% - - - - - - 42 140 51 170 82% 45% US $0.25 US $0.21Kootenay Silver Inc TSXV:KTN US $30 US $2 US $28 76 62 130 106 59% - - - - - - 76 62 130 106 59% 19% US $0.36 US $0.21Levon Resources Ltd. TSX:LVN US $32 US $7 US $26 - - - - - - - - - - - - - - - - - - - MacPhersons Resources Limited ASX:MRP US $39 US $3 US $36 20 35 67 116 30% 8 178 18 388 46% US $4.33 12 22 49 93 24% 29% US $1.77 US $0.53MAG Silver Corp. TSX:MAG US $874 US $125 US $749 170 70 714 293 24% - - - - - - 170 70 714 293 24% 55% US $4.40 US $1.05Mandalay Resources Corporation TSX:MND US $98 US $35 US $79 65 33 320 162 20% 9 23 80 203 11% US $8.93 56 36 240 152 23% 19% US $1.22 US $0.25Minco Silver Corporation TSX:MSV US $37 US $38 US ($2) 162 158 275 268 59% 50 189 65 248 76% - 112 148 209 276 54% 52% - - Mineworx Technologies Ltd. TSXV:MWX US $66 US $1 US $65 22 9 392 156 6% - - - - - - 22 9 392 156 6% - US $2.90 US $0.17MK2 Ventures Ltd. TSXV:MK.H US $4 US $1 US $3 - - - - - - - - - - - - - - - - - - - Pan American Silver Corp. TSX:PAAS US $2,445 US $410 US $2,064 1,459 90 2,724 168 54% 300 85 711 203 42% US $6.88 1,159 92 2,012 159 58% 24% US $1.41 US $0.76Silver Bear Resources Plc TSX:SBR US $148 US $8 US $212 61 709 61 715 99% - - - - - - 61 709 61 715 99% 40% US $3.49 US $3.46Silver Bull Resources, Inc. OTCPK:SVBL US $35 US $0 US $35 91 48 590 310 15% - - - - - - 91 48 590 310 15% 0% US $0.38 US $0.06Silvercorp Metals Inc. TSX:SVM US $426 US $78 US $348 228 126 691 383 33% 91 202 215 476 42% US $3.82 137 101 476 352 29% 66% US $1.53 US $0.50SSR Mining Inc. TSX:SSRM US $1,005 US $684 US $550 839 34 2,224 89 38% 58 9 353 56 16% US $9.52 732 40 1,822 100 40% 17% US $0.66 US $0.25Group Average - Total # Companies: 26 US $7.11 US $1.67 US $0.70Equivalency assumptions (US$ / 02-02-18): $1,333/oz Au, $16.59/oz Ag, $991/oz Pt, $1,049/oz Pd, $3.18/lb Cu, $1.61/lb Zn, $1.23/lb Pb, $6.08/lb Ni, $8.80/lb Mo, $36.46/lb Co, $8,150/t Sb, $23.38/lb U3O8, $0.20/lb Sn, $93.00/t HCC, $72.94/t 62% FeSource: SNL Financial retrieved on February 2, 2018
EV/ozAg
EV/ozAgEq
Ag(Moz)
Ag(g/t)
AgEq(Moz)
AgEq(g/t)
% Ag
Global
% Ag% Ag Ag(Moz)
Ag(g/t)
AgEq(Moz)
Global Reserves & Resources Reserves Resources (M&I and Inferred)Ag
(Moz)Ag(g/t)
AgEq(Moz)
AgEq(g/t)
AgEq(g/t)
% AgInferred
EV/ozAg
Company SymbolMarket
Capitalization(millions)
WorkingCapital
(millions)
EnterpriseValue
(millions)

The Weekly Dig 2/2/18
Haywood Mining [email protected] Page 25
Comparables Tables – Base Metals
Source: Bloomberg and Haywood Securities
As of February 2, 2018 Shares Market Working EnterpriseCompany Symbol Price 1-Day 7-Day YTD O/S Capitalization Cash Capital Debt Value 2016 2017E 2018 E
% % (%) (millions) (US$ millions) (US$ millions) (US$ millions) (US$millions) (US$millions) CFPS CFPS CFPS 2017E 2018E 2017E 2018E 2017E 2018E
Large-Cap Base Metals ProducersANGLO AMERICAN PLC LSE:AAL GBp 1648 (2.5) (5.0) 6.4 1292 $30,149 $6,051 $5,924 $13,169 $41,113 $3.67 $4.90 $5.02 4.8x 4.7x 6.5x 6.3x 4.8x 4.9xANTOFAGASTA PLC LSE:ANTO GBp 901.4 (2.2) (4.2) (10.3) 986 $12,580 $716 $1,881 $3,120 $15,175 $1.18 $1.76 $1.68 7.2x 7.6x 8.7x 9.2x 6.1x 6.2xBHP BILLITON LIMITED ASX:BHP AUD 30.81 0.5 (0.1) 4.2 3212 $124,634 $14,153 $9,690 $30,474 $146,175 $3.16 $2.89 $3.24 8.5x 7.6x 15.8x 14.0x 7.1x 6.1xFIRST QUANTUM MINERALS LTD TSX:FM CAD 17.81 (3.4) (6.2) 1.1 689 $9,906 $1,463 $849 $5,844 $16,082 $1.35 $1.48 $2.29 9.7x 6.3x 15.7x 10.2x 14.3x 8.3xFREEPORT-MCMORAN INC NYSE:FCX USD 17.97 (7.6) (8.0) (5.2) 1448 $26,013 $4,447 $5,741 $13,117 $38,002 $3.24 $2.75 $3.58 6.5x 5.0x 9.5x 7.3x 6.6x 4.9xGLENCORE PLC LSE:GLEN GBp 382.75 (4.3) (4.8) (1.9) 14425 $78,156 $2,508 $45 $33,218 $104,819 $0.40 $0.68 $0.83 8.0x 6.5x 10.7x 8.8x 7.0x 6.3xKGHM POLSKA MIEDZ SA WSE:KGH PLN 108.5 (2.7) (3.5) (2.4) 200 $6,494 $206 $90 $1,939 $8,376 $5.16 $6.43 $7.81 5.1x 4.2x 6.5x 5.4x 5.1x 4.4xRIO TINTO PLC LSE:RIO GBp 3901.5 (0.7) (1.0) (1.0) 1339 $99,603 $8,201 $5,686 $17,630 $113,703 $4.71 $7.65 $7.57 7.2x 7.3x 11.1x 11.2x 6.0x 6.4xTECK RESOURCES LTD-CLS B TSX:TCK.B CAD 35.19 (4.2) (2.6) 7.1 566 $16,276 $1,046 $1,905 $6,203 $20,532 $3.26 $6.83 $6.37 4.2x 4.5x 5.3x 5.7x 4.5x 4.6xTURQUOISE HILL RESOURCES LTD TSX:TRQ CAD 3.66 (1.6) (6.9) (14.7) 2012 $5,942 $1,418 $2,434 $4,139 $7,715 $0.11 $0.06 $0.15 50.1x 20.4x 65.0x 26.4x 33.3x 19.4xVALE SA-SP ADR NYSE:VALE USD 12.54 (4.9) (4.3) 2.5 5284 $66,267 $4,268 $11,349 $29,363 $88,844 - $2.16 $2.01 5.9x 6.4x 7.8x 8.4x 5.9x 6.2xBOLIDEN AB SSE:BOL SEK 280.5 (2.8) (1.9) (0.0) 274 $9,717 $165 $591 $1,112 $10,332 $2.99 $4.97 $5.22 7.0x 6.7x 7.6x 7.2x 6.4x 5.9xSOUTHERN COPPER CORP NYXE:SCCO USD 47.4 (3.6) (6.4) (0.1) 773 $36,642 $1,005 $2,002 $5,957 $41,585 $2.56 $2.62 $3.26 18.1x 14.5x 20.6x 16.5x 13.0x 10.2x
Group Average - Large-Cap Producers 10.7x 7.3x 14.8x 10.3x 9.1x 7.1xGroup Average - Large-Cap Producers (excluding high/low) 7.0x 6.2x 10.3x 9.0x 7.0x 6.0x
Mid Tier Base Metals ProducersHUDBAY MINERALS INC TSX:HBM CAD 10.23 (5.2) (8.9) (8.1) 261 $2,157 $147 $122 $1,232 $2,886 $1.48 $2.05 $1.92 4.0x 4.3x 5.4x 5.8x 4.7x 4.3xKAZ MINERALS PLC LSE:KAZ GBp 797.6 (3.9) (4.2) (10.8) 447 $5,045 $1,108 $866 $3,777 $7,481 ($0.20) $1.40 $1.67 8.1x 6.8x 12.0x 10.0x 7.2x 5.9xLUNDIN MINING CORP TSX: LUN CAD 8.5 (4.6) (3.7) 1.7 728 $4,996 $715 $2,052 $983 $4,225 $0.40 $1.12 $0.87 6.1x 7.9x 5.2x 6.7x 4.0x 5.5xMMG LTD SEHK:1208 HKD 6.18 9.4 16.6 59.3 7963 $6,292 $553 $422 $10,253 $16,785 $0.05 $0.19 $0.22 4.3x 3.6x 11.4x 9.6x 8.4x 7.0xOZ MINERALS LTD ASX:OZL AUD 9.38 0.3 1.4 2.4 299 $2,227 $473 $555 $0 $1,743 $0.80 $0.97 $0.84 7.8x 9.0x 6.0x 7.0x 4.1x 4.5xVEDANTA RESOURCES PLC LSE:VED GBp 790.2 (5.1) (8.5) (1.8) 273 $3,051 $2,565 ($1,588) $18,229 $18,890 $5.76 - $11.96 - 0.9x - 5.8x 5.9x 4.5x
Group Average - Mid Tier Producers 6.1x 5.4x 8.0x 7.5x 5.7x 5.3xGroup Average - Mid Tier Producers (excluding high/low) 6.1x 5.6x 7.6x 7.3x 5.5x 5.1x
Small Cap Base Metals ProducersAMERIGO RESOURCES LTD TSX:ARG CAD 1.01 (1.0) (3.8) (8.2) 176 $144 $16 $1 $70 $187 $0.11 $0.11 $0.17 7.8x 4.8x 10.1x 6.2x - -ATALAYA MINING PLC TSX:AYM CAD 3.39 0.0 (0.3) 34.5 135 $370 $1 ($27) $0 $363 - $0.39 $0.41 6.9x 6.7x 7.0x 6.6x 6.7x 4.3xCAPSTONE MINING CORP TSX:CS CAD 1.29 (3.7) (7.9) (10.4) 398 $415 $130 $171 $325 $705 $0.29 $0.31 $0.40 3.3x 2.6x 5.7x 4.5x 4.8x 3.7xCOPPER MOUNTAIN MINING CORP TSX:CMMC CAD 1.25 0.0 (4.6) (18.3) 132 $134 $23 ($1) $272 $409 $0.18 $0.45 $0.50 2.2x 2.0x 6.9x 6.2x 5.6x 4.5xIMPERIAL METALS CORP TSX:III CAD 2.66 3.5 10.4 (21.3) 117 $251 $11 ($66) $645 $959 $0.69 $0.43 $0.46 5.0x 4.7x 18.9x 17.7x 14.0x 11.9xWESTERN AREAS LTD AU:WSA AUD 3.35 (0.9) 0.3 3.4 273 $727 $108 $116 $0 $618 $0.18 $0.21 $0.20 12.7x 13.6x 10.9x 11.4x 12.2x 9.3xSHERRITT INTERNATIONAL CORP TSX:S CAD 1.22 (3.9) (8.3) (29.1) 396 $390 $200 $368 $1,657 $1,880 ($0.01) ($0.15) $0.04 - 24.4x - 115.8x 17.7x 14.4xNEVSUN RESOURCES LTD TSX:NSU CAD 2.51 (4.9) (14.0) (18.0) 302 $612 $199 $201 $0 $618 $0.18 $0.22 $0.41 9.3x 5.0x 9.4x 5.0x 8.9x 4.1xTASEKO MINES LTD TSX:TKO CAD 2.1 (4.1) (7.9) (28.6) 227 $385 $66 $82 $289 $572 $0.12 $0.62 $0.50 2.7x 3.4x 4.0x 5.1x 3.9x 4.1xTREVALI MINING CORP TSX:TV CAD 1.57 (3.1) (3.1) 3.3 826 $1,046 $11 $8 $80 $1,192 $0.09 $0.18 $0.30 7.1x 4.3x 8.1x 4.9x 9.0x 3.8x
Group Average - Small Cap Producers 6.3x 7.2x 4.9x 18.3x 9.2x 6.7xGroup Average - Small Cap Producers (excluding high/low) 6.0x 5.6x 7.8x 7.9x 8.7x 6.0x
. C$/US$ FX Rate: $1.24
P/CF Ratio EV/CF Ratio EV/EBITDA Ratio

The Weekly Dig 2/2/18
Haywood Mining [email protected] Page 26
Copper Non-Producers – Enterprise Value per Pound of Copper Equivalent
Shares Market Working LTD Enterprise CopperCompany Symbol Price O/S Capitalization Capital Value Value Ratio*** Reserve R&R (Total)
(million) (million) (million) (million) (million) (% Contained) (CuEq** Mlb) (CuEq** Mlb) Reserve TotalAbacus Mining & Exploration Corporation TSXV:AME C$ 0.22 39.2 US$ 7 US$ 0.7 US$ 10.9 US$ 17 Cu / Au 68% 782 977 $0.022 $0.017Candente Copper Corp. TSX:DNT C$ 0.12 178.2 US$ 17 US$ (1.1) US$ 0.0 US$ 18 Cu / Au 88% - 12,661 - $0.001Capstone Mining Corp TSX:CS C$ 1.29 398.4 US$ 414 US$ 178.2 US$ 294.4 US$ 530 Cu / Zn 85% 6,677 17,536 $0.079 $0.030Copper Fox Metals Inc. TSXV:CUU C$ 0.13 437.0 US$ 44 US$ 0.5 US$ 0.0 US$ 43 Cu / Au 68% 2,391 5,631 $0.018 $0.008Coro Mining Corp. TSX:COP C$ 0.14 651.3 US$ 71 US$ (0.6) US$ 0.3 US$ 72 Cu / - 100% - 590 - $0.122Excelsior Mining Corp. TSX:MIN C$ 1.09 206.2 US$ 181 US$ 2.5 US$ 0.0 US$ 179 Cu / - 100% 5,128 8,016 $0.035 $0.022Filo Mining Corp. TSXV:FIL C$ 2.60 62.3 US$ 131 US$ 4.4 US$ 0.0 US$ 126 Cu / Au 51% - 8,204 - $0.015Foran Mining Corporation TSXV:FOM C$ 0.54 109.9 US$ 48 US$ 0.4 US$ 0.0 US$ 47 Cu / Zn 44% - 1,861 - $0.026Getty Copper Inc. TSXV:GTC C$ 0.03 108.4 US$ 3 US$ (0.4) US$ 0.8 US$ 4 Cu / Mo 98% 777 1,219 $0.005 $0.003Gold Reach Resources Ltd. TSXV:GRV C$ 0.24 55.0 US$ 11 US$ (0.1) US$ 0.0 US$ 11 Cu / Au 56% - 2,029 - $0.005Highland Copper Company Inc. TSXV:HI C$ 0.14 467.5 US$ 51 US$ 8.3 US$ 7.8 US$ 50 Cu / Ag 99% 1,680 4,493 $0.030 $0.011Indico Resources Ltd. TSXV:IDI C$ 0.02 147.0 US$ 2 US$ (4.0) US$ 0.0 US$ 6 Cu / - 100% - 122 - $0.047Los Andes Copper Ltd. TSXV:LA C$ 0.35 244.9 US$ 69 US$ 0.8 US$ 0.0 US$ 68 Cu / Mo 92% - 11,928 - $0.006Nevada Copper Corp. TSX:NCU C$ 0.77 188.7 US$ 117 US$ (2.7) US$ 162.7 US$ 283 Cu / Au 91% 5,566 7,795 $0.051 $0.036NGEx Resources Inc. TSX:NGQ C$ 1.33 226.3 US$ 243 US$ 3.6 US$ 0.0 US$ 239 Cu / Au 74% - 26,997 - $0.009Northern Dynasty Minerals Ltd. TSX:NDM C$ 1.16 304.7 US$ 285 US$ 20.3 US$ 0.0 US$ 265 Cu / Au 55% - 148,142 - $0.002NorthIsle Copper and Gold Inc. TSXV:NCX C$ 0.12 114.5 US$ 11 US$ 0.4 US$ 0.0 US$ 10 Cu / Au 51% - 4,827 - $0.002Osisko Metals Incorporated TSXV:OM C$ 0.79 70.7 US$ 45 US$ 25.1 US$ 0.0 US$ 20 Zn / Pb 3% - 147 - $0.135Panoro Minerals Ltd. TSXV:PML C$ 0.35 260.6 US$ 74 US$ (1.7) US$ 2.0 US$ 77 Cu / Au 76% - 10,507 - $0.007Philippine Metals Inc. TSXV:PHI C$ 0.13 10.4 US$ 1 US$ (0.1) US$ 0.0 US$ 1 Cu / - 100% - 331 - $0.004Polymet Mining Corp. TSX:POM C$ 1.47 319.4 US$ 378 US$ (130.2) US$ 0.0 US$ 509 Cu / Ni 45% 3,499 11,057 $0.145 $0.046Quaterra Resources Inc. TSXV:QTA C$ 0.08 201.0 US$ 13 US$ 2.0 US$ 0.0 US$ 11 Cu / - 100% - 3,894 - $0.003Redhawk Resources, Inc. TSX:RDK C$ 0.04 166.4 US$ 5 US$ (1.4) US$ 1.4 US$ 8 Cu / - 100% - 3,167 - $0.003Regulus Resources Inc. TSXV:REG C$ 1.90 74.2 US$ 114 US$ 3.7 US$ 0.0 US$ 110 Cu / Au 49% - 8,564 - $0.013Serengeti Resources Inc. TSXV:SIR C$ 0.15 86.4 US$ 10 US$ 0.4 US$ 0.0 US$ 10 Cu / Au 61% - 1,352 - $0.007St. Augustine Gold and Copper Limited TSX:SAU C$ 0.03 726.8 US$ 15 US$ (2.7) US$ 0.0 US$ 17 Cu / Au 54% 4,603 7,096 $0.004 $0.002Trilogy Metals Inc. AMEX:TMQ C$ 1.54 105.7 US$ 131 US$ 0.0 US$ 0.0 US$ 131 Cu / Zn 77% - 5,803 - $0.023Western Copper and Gold Corporation TSX:WRN C$ 1.13 96.7 US$ 88 US$ 3.9 US$ 0.0 US$ 84 Cu / Au 55% 8,545 18,236 $0.010 $0.005Group Average - Total $0.040 $0.022*All reserve and resource data sourced from SNL, additional data sourced from Capital IQ.**CuEq = copper equivalent. Calculated based on Haywood's formal long-term metal price forecasts.***Copper Ratio = value of in situ copper / total value of in situ metals.
Primary / Secondary
Metal
Reserves & Resources* - AttributableEV/lb CuEq** (US$)
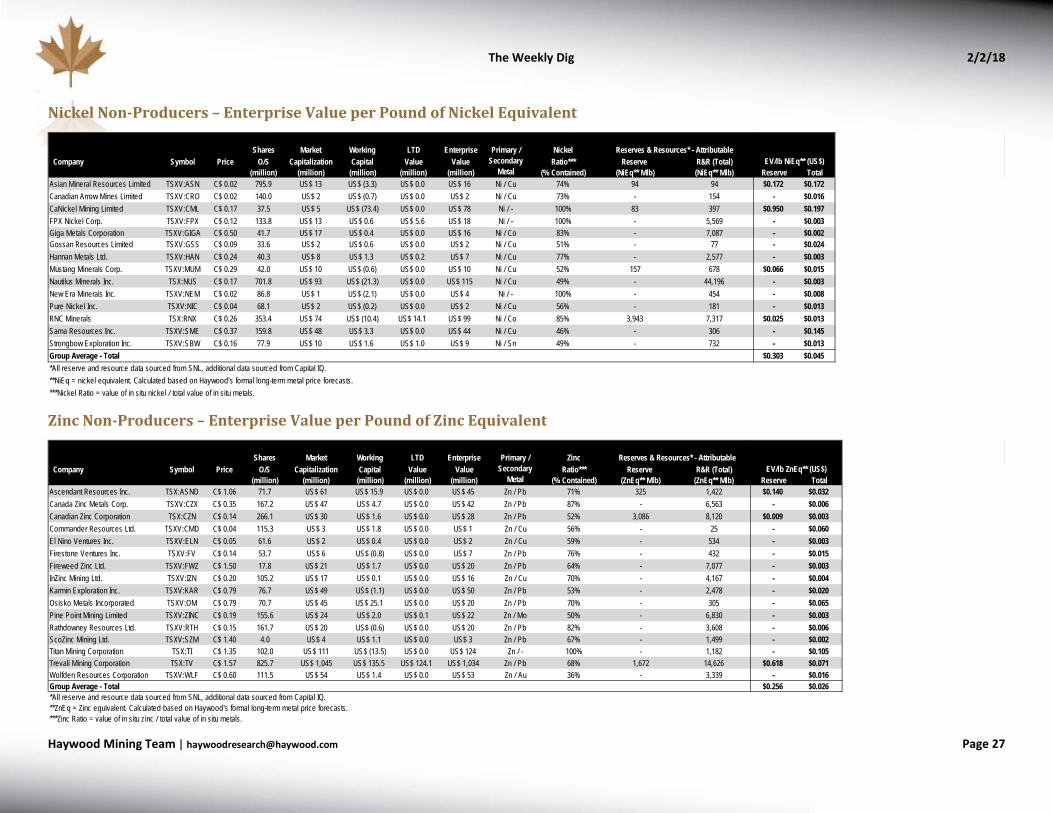
The Weekly Dig 2/2/18
Haywood Mining [email protected] Page 27
Nickel Non-Producers – Enterprise Value per Pound of Nickel Equivalent
Zinc Non-Producers – Enterprise Value per Pound of Zinc Equivalent
Shares Market Working LTD Enterprise NickelCompany Symbol Price O/S Capitalization Capital Value Value Ratio*** Reserve R&R (Total)
(million) (million) (million) (million) (million) (% Contained) (NiEq** Mlb) (NiEq** Mlb) Reserve TotalAsian Mineral Resources Limited TSXV:ASN C$ 0.02 795.9 US$ 13 US$ (3.3) US$ 0.0 US$ 16 Ni / Cu 74% 94 94 $0.172 $0.172Canadian Arrow Mines Limited TSXV:CRO C$ 0.02 140.0 US$ 2 US$ (0.7) US$ 0.0 US$ 2 Ni / Cu 73% - 154 - $0.016CaNickel Mining Limited TSXV:CML C$ 0.17 37.5 US$ 5 US$ (73.4) US$ 0.0 US$ 78 Ni / - 100% 83 397 $0.950 $0.197FPX Nickel Corp. TSXV:FPX C$ 0.12 133.8 US$ 13 US$ 0.6 US$ 5.6 US$ 18 Ni / - 100% - 5,569 - $0.003Giga Metals Corporation TSXV:GIGA C$ 0.50 41.7 US$ 17 US$ 0.4 US$ 0.0 US$ 16 Ni / Co 83% - 7,087 - $0.002Gossan Resources Limited TSXV:GSS C$ 0.09 33.6 US$ 2 US$ 0.6 US$ 0.0 US$ 2 Ni / Cu 51% - 77 - $0.024Hannan Metals Ltd. TSXV:HAN C$ 0.24 40.3 US$ 8 US$ 1.3 US$ 0.2 US$ 7 Ni / Cu 77% - 2,577 - $0.003Mustang Minerals Corp. TSXV:MUM C$ 0.29 42.0 US$ 10 US$ (0.6) US$ 0.0 US$ 10 Ni / Cu 52% 157 678 $0.066 $0.015Nautilus Minerals Inc. TSX:NUS C$ 0.17 701.8 US$ 93 US$ (21.3) US$ 0.0 US$ 115 Ni / Cu 49% - 44,196 - $0.003New Era Minerals Inc. TSXV:NEM C$ 0.02 86.8 US$ 1 US$ (2.1) US$ 0.0 US$ 4 Ni / - 100% - 454 - $0.008Pure Nickel Inc. TSXV:NIC C$ 0.04 68.1 US$ 2 US$ (0.2) US$ 0.0 US$ 2 Ni / Cu 56% - 181 - $0.013RNC Minerals TSX:RNX C$ 0.26 353.4 US$ 74 US$ (10.4) US$ 14.1 US$ 99 Ni / Co 85% 3,943 7,317 $0.025 $0.013Sama Resources Inc. TSXV:SME C$ 0.37 159.8 US$ 48 US$ 3.3 US$ 0.0 US$ 44 Ni / Cu 46% - 306 - $0.145Strongbow Exploration Inc. TSXV:SBW C$ 0.16 77.9 US$ 10 US$ 1.6 US$ 1.0 US$ 9 Ni / Sn 49% - 732 - $0.013Group Average - Total $0.303 $0.045*All reserve and resource data sourced from SNL, additional data sourced from Capital IQ.**NiEq = nickel equivalent. Calculated based on Haywood's formal long-term metal price forecasts.***Nickel Ratio = value of in situ nickel / total value of in situ metals.
EV/lb NiEq** (US$)Primary /
SecondaryMetal
Reserves & Resources* - Attributable
Shares Market Working LTD Enterprise ZincCompany Symbol Price O/S Capitalization Capital Value Value Ratio*** Reserve R&R (Total)
(million) (million) (million) (million) (million) (% Contained) (ZnEq** Mlb) (ZnEq** Mlb) Reserve TotalAscendant Resources Inc. TSX:ASND C$ 1.06 71.7 US$ 61 US$ 15.9 US$ 0.0 US$ 45 Zn / Pb 71% 325 1,422 $0.140 $0.032Canada Zinc Metals Corp. TSXV:CZX C$ 0.35 167.2 US$ 47 US$ 4.7 US$ 0.0 US$ 42 Zn / Pb 87% - 6,563 - $0.006Canadian Zinc Corporation TSX:CZN C$ 0.14 266.1 US$ 30 US$ 1.6 US$ 0.0 US$ 28 Zn / Pb 52% 3,086 8,120 $0.009 $0.003Commander Resources Ltd. TSXV:CMD C$ 0.04 115.3 US$ 3 US$ 1.8 US$ 0.0 US$ 1 Zn / Cu 56% - 25 - $0.060El Nino Ventures Inc. TSXV:ELN C$ 0.05 61.6 US$ 2 US$ 0.4 US$ 0.0 US$ 2 Zn / Cu 59% - 534 - $0.003Firestone Ventures Inc. TSXV:FV C$ 0.14 53.7 US$ 6 US$ (0.8) US$ 0.0 US$ 7 Zn / Pb 76% - 432 - $0.015Fireweed Zinc Ltd. TSXV:FWZ C$ 1.50 17.8 US$ 21 US$ 1.7 US$ 0.0 US$ 20 Zn / Pb 64% - 7,077 - $0.003InZinc Mining Ltd. TSXV:IZN C$ 0.20 105.2 US$ 17 US$ 0.1 US$ 0.0 US$ 16 Zn / Cu 70% - 4,167 - $0.004Karmin Exploration Inc. TSXV:KAR C$ 0.79 76.7 US$ 49 US$ (1.1) US$ 0.0 US$ 50 Zn / Pb 53% - 2,478 - $0.020Osisko Metals Incorporated TSXV:OM C$ 0.79 70.7 US$ 45 US$ 25.1 US$ 0.0 US$ 20 Zn / Pb 70% - 305 - $0.065Pine Point Mining Limited TSXV:ZINC C$ 0.19 155.6 US$ 24 US$ 2.0 US$ 0.1 US$ 22 Zn / Mo 50% - 6,830 - $0.003Rathdowney Resources Ltd. TSXV:RTH C$ 0.15 161.7 US$ 20 US$ (0.6) US$ 0.0 US$ 20 Zn / Pb 82% - 3,608 - $0.006ScoZinc Mining Ltd. TSXV:SZM C$ 1.40 4.0 US$ 4 US$ 1.1 US$ 0.0 US$ 3 Zn / Pb 67% - 1,499 - $0.002Titan Mining Corporation TSX:TI C$ 1.35 102.0 US$ 111 US$ (13.5) US$ 0.0 US$ 124 Zn / - 100% - 1,182 - $0.105Trevali Mining Corporation TSX:TV C$ 1.57 825.7 US$ 1,045 US$ 135.5 US$ 124.1 US$ 1,034 Zn / Pb 68% 1,672 14,626 $0.618 $0.071Wolfden Resources Corporation TSXV:WLF C$ 0.60 111.5 US$ 54 US$ 1.4 US$ 0.0 US$ 53 Zn / Au 36% - 3,339 - $0.016Group Average - Total $0.256 $0.026*All reserve and resource data sourced from SNL, additional data sourced from Capital IQ.**ZnEq = Zinc equivalent. Calculated based on Haywood's formal long-term metal price forecasts.***Zinc Ratio = value of in situ zinc / total value of in situ metals.
Primary / Secondary
Metal
Reserves & Resources* - AttributableEV/lb ZnEq** (US$)
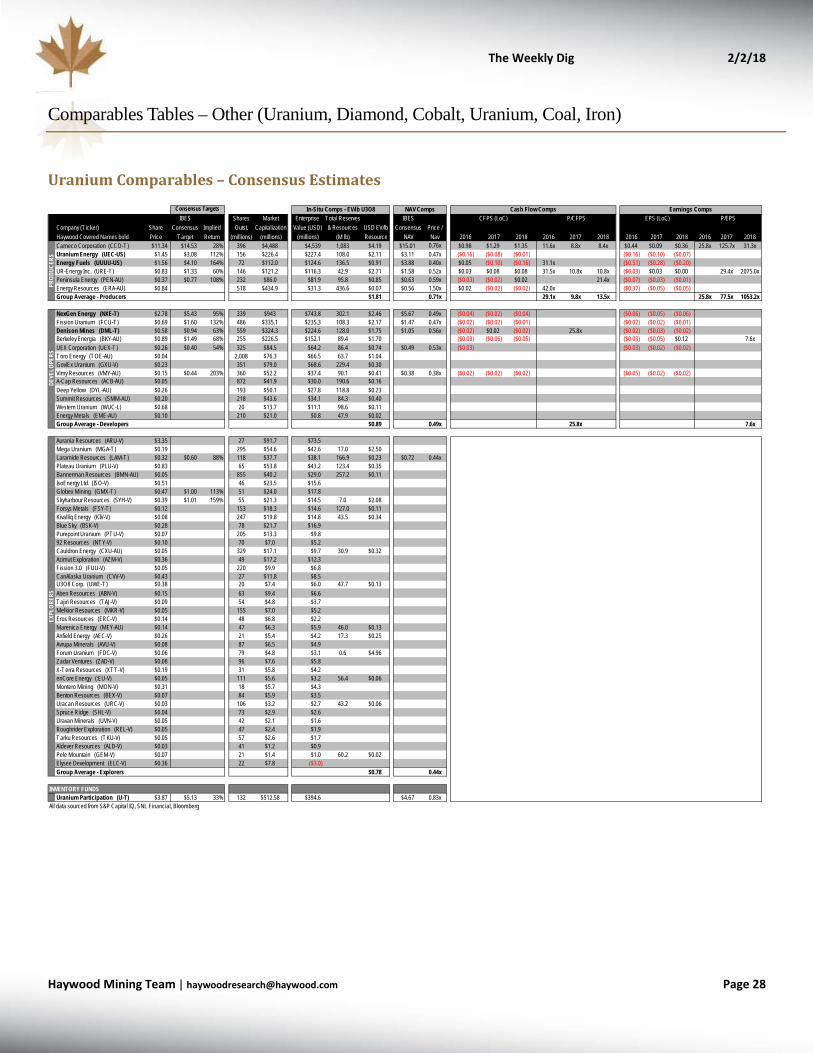
The Weekly Dig 2/2/18
Haywood Mining [email protected] Page 28
Comparables Tables – Other (Uranium, Diamond, Cobalt, Uranium, Coal, Iron)
Uranium Comparables – Consensus Estimates
IBES Shares Market Enterprise Total Reserves IBESCompany (T icker)Haywood Covered Names bold
Share Price
Consensus Target
Implied Return
Outst. (millions)
Capitalization (millions)
Value (USD)(millions)
& Resources (M lb)
USD EV/lb Resource
Consensus NAV
Price / Nav 2016 2017 2018 2016 2017 2018 2016 2017 2018 2016 2017 2018
Cameco Corporation (CCO-T) $11.34 $14.53 28% 396 $4,488 $4,539 1,083 $4.19 $15.01 0.76x $0.98 $1.29 $1.35 11.6x 8.8x 8.4x $0.44 $0.09 $0.36 25.8x 125.7x 31.3xUranium Energy (UEC-US) $1.45 $3.08 112% 156 $226.4 $227.4 108.0 $2.11 $3.11 0.47x ($0.16) ($0.08) ($0.01) ($0.16) ($0.10) ($0.07)Energy Fuels (UUUU-US) $1.56 $4.10 164% 72 $112.0 $124.6 136.5 $0.91 $3.88 0.40x $0.05 ($0.10) ($0.16) 31.1x ($0.51) ($0.28) ($0.20)UR-Energy Inc. (URE-T) $0.83 $1.33 60% 146 $121.2 $116.3 42.9 $2.71 $1.58 0.52x $0.03 $0.08 $0.08 31.5x 10.8x 10.8x ($0.03) $0.03 $0.00 29.4x 2075.0xPeninsula Energy (PEN-AU) $0.37 $0.77 108% 232 $86.0 $81.9 95.8 $0.85 $0.63 0.59x ($0.03) ($0.02) $0.02 21.4x ($0.07) ($0.03) ($0.01)Energy Resources (ERA-AU) $0.84 518 $434.9 $31.3 436.6 $0.07 $0.56 1.50x $0.02 ($0.02) ($0.02) 42.0x ($0.37) ($0.05) ($0.05)Group Average - Producers $1.81 0.71x 29.1x 9.8x 13.5x 25.8x 77.5x 1053.2x
NexGen Energy (NXE-T) $2.78 $5.43 95% 339 $943 $743.8 302.1 $2.46 $5.67 0.49x ($0.04) ($0.02) ($0.04) ($0.06) ($0.05) ($0.06)Fission Uranium (FCU-T) $0.69 $1.60 132% 486 $335.1 $235.3 108.3 $2.17 $1.47 0.47x ($0.02) ($0.02) ($0.01) ($0.02) ($0.02) ($0.01)Denison Mines (DML-T) $0.58 $0.94 63% 559 $324.3 $224.6 128.0 $1.75 $1.05 0.56x ($0.02) $0.02 ($0.02) 25.8x ($0.02) ($0.03) ($0.02)Berkeley Energia (BKY-AU) $0.89 $1.49 68% 255 $226.5 $152.1 89.4 $1.70 ($0.03) ($0.06) ($0.05) ($0.03) ($0.05) $0.12 7.6xUEX Corporation (UEX-T) $0.26 $0.40 54% 325 $84.5 $64.2 86.4 $0.74 $0.49 0.53x ($0.03) ($0.03) ($0.02) ($0.02)Toro Energy (TOE-AU) $0.04 2,008 $76.3 $66.5 63.7 $1.04GoviEx Uranium (GXU-V) $0.23 351 $79.0 $68.6 229.4 $0.30Vimy Resources (VMY-AU) $0.15 $0.44 203% 360 $52.2 $37.4 90.1 $0.41 $0.38 0.38x ($0.02) ($0.02) ($0.02) ($0.05) ($0.02) ($0.02)A-Cap Resources (ACB-AU) $0.05 872 $41.9 $30.0 190.6 $0.16Deep Yellow (DYL-AU) $0.26 193 $50.1 $27.8 118.8 $0.23Summit Resources (SMM-AU) $0.20 218 $43.6 $34.1 84.3 $0.40Western Uranium (WUC-L) $0.68 20 $13.7 $11.1 98.6 $0.11Energy Metals (EME-AU) $0.10 210 $21.0 $0.8 47.9 $0.02Group Average - Developers $0.89 0.49x 25.8x 7.6x
Aurania Resources (ARU-V) $3.35 27 $91.7 $73.5Mega Uranium (MGA-T) $0.19 295 $54.6 $42.6 17.0 $2.50Laramide Resources (LAM-T) $0.32 $0.60 88% 118 $37.7 $38.1 166.9 $0.23 $0.72 0.44xPlateau Uranium (PLU-V) $0.83 65 $53.8 $43.2 123.4 $0.35Bannerman Resources (BMN-AU) $0.05 855 $40.2 $29.0 257.2 $0.11IsoEnergy Ltd. (ISO-V) $0.51 46 $23.5 $15.6Globex Mining (GMX-T) $0.47 $1.00 113% 51 $24.0 $17.8Skyharbour Resources (SYH-V) $0.39 $1.01 159% 55 $21.3 $14.5 7.0 $2.08Forsys Metals (FSY-T) $0.12 153 $18.3 $14.6 127.0 $0.11Kivalliq Energy (KIV-V) $0.08 247 $19.8 $14.8 43.5 $0.34Blue Sky (BSK-V) $0.28 78 $21.7 $16.9Purepoint Uranium (PTU-V) $0.07 205 $13.3 $9.892 Resources (NTY-V) $0.10 70 $7.0 $5.2Cauldron Energy (CXU-AU) $0.05 329 $17.1 $9.7 30.9 $0.32Azimut Exploration (AZM-V) $0.36 49 $17.2 $12.3Fission 3.0 (FUU-V) $0.05 220 $9.9 $6.8CanAlaska Uranium (CVV-V) $0.43 27 $11.8 $8.5U3O8 Corp. (UWE-T) $0.38 20 $7.4 $6.0 47.7 $0.13Aben Resources (ABN-V) $0.15 63 $9.4 $6.6Tajiri Resources (TAJ-V) $0.09 54 $4.8 $3.7Melkior Resources (MKR-V) $0.05 155 $7.0 $5.2Eros Resources (ERC-V) $0.14 48 $6.8 $2.2Marenica Energy (MEY-AU) $0.14 47 $6.3 $5.9 46.0 $0.13Anfield Energy (AEC-V) $0.26 21 $5.4 $4.2 17.3 $0.25Avrupa Minerals (AVU-V) $0.08 87 $6.5 $4.9Forum Uranium (FDC-V) $0.06 79 $4.8 $3.1 0.6 $4.96Zadar Ventures (ZAD-V) $0.08 96 $7.6 $5.8X-Terra Resources (XTT-V) $0.19 31 $5.8 $4.2enCore Energy (:EU-V) $0.05 111 $5.6 $3.2 56.4 $0.06Montero Mining (MON-V) $0.31 18 $5.7 $4.3Benton Resources (BEX-V) $0.07 84 $5.9 $3.5Uracan Resources (URC-V) $0.03 106 $3.2 $2.7 43.2 $0.06Spruce Ridge (SHL-V) $0.04 73 $2.9 $2.6Uravan Minerals (UVN-V) $0.05 42 $2.1 $1.6Roughrider Exploration (REL-V) $0.05 47 $2.4 $1.9Tarku Resources (TKU-V) $0.05 57 $2.6 $1.7Aldever Resources (ALD-V) $0.03 41 $1.2 $0.9Pele Mountain (GEM-V) $0.07 21 $1.4 $1.0 60.2 $0.02Elysee Development (ELC-V) $0.36 22 $7.8 ($3.0)Group Average - Explorers $0.78 0.44x
INVENTORY FUNDSUranium Participation (U-T) $3.87 $5.13 33% 132 $512.58 $394.6 $4.67 0.83x
All data sourced from S&P Capital IQ, SNL Financial, Bloomberg
Earnings CompsConsensus Targets In-Situ Comps - EV/lb U3O8 NAV Comps Cash Flow CompsEPS (LoC) P/EPS
DEVE
LOPE
RSEX
PLOR
ERS
CFPS (LoC) P/CFPS
PROD
UCER
S

The Weekly Dig 2/2/18
Haywood Mining [email protected] Page 29
Coal Comparables – Consensus Estimates
Large Cap USA Bloomberg Shares Market Daily Enterprise
Company (T icker) Share PriceConsensus
TargetImplied Return β
Outstanding (millions)
Capitalization (millions)
Volume (millions)
Weekly Liquidity WACC
Debt (millions)
Value (millions) 2015 2016 2017 2015 2016 2017 2015 2016 2017 2015 2016 2017
Large Cap USACNX RESOURCES (CNX-US) US$ 12.97 US$ 17.03 31.3% 1.53 230 US$ 2,984 3.5 9.8% 9.9% US$ 2,774 US$ 5,381 3.06 3.40 4.42 4.2x 3.8x 2.9x 30.9x 31.3x 16.6x 6.5x 6.1x 4.7xFORESIGHT ENERGY (FELP-US) US$ 4.09 US$ 5.00 22.2% 1.07 78 US$ 583 0.0 0.1% 6.7% US$ 1,391 US$ 1,894 6.6x 5.9x 5.6xCORSA COAL (CSO-V) C$ 1.90 2.36 95 C$ 180 0.0 0.1% 18.9% C$ 43 C$ 197WESTMORELAND COAL (WLB-US) C$ 1.03 C$ 3.50 239.8% 1.19 19 C$ 19 0.3 4.5% 5.5% C$ 1,109 C$ 1,043 4.6x 5.2x 5.3xWALTER ENERGY (WLT-US) US$ 0.01 3.91 81 US$ 1 0.1 0.3% 30.6% US$ 3,136 US$- 181CLOUD PEAK (CLD-US) US$ 4.45 US$ 5.13 15.2% 1.62 75 US$ 334 1.1 5.4% 8.2% US$ 483 US$ 626 0.92 0.76 0.65 4.8x 5.9x 6.8x 5.7x 5.8x 6.2xGroup Average - Large Cap USA Avg. -> 3.7x 3.8x 4.2x 30.9x 20.3x 17.9x 5.6x 5.6x 5.7x
Limitied PartnershipsALLIANCE RESOURCE (ARLP-US) US$ 20.40 US$ 24.80 21.6% 1.11 131 US$ 2,666 0.3 1.6% 9.7% US$ 574 US$ 3,239 9.0x 9.4x 9.0x 5.2x 5.3x 5.1xNATURAL RESOURCE (NRP-US) US$ 29.45 US$ 33.00 12.1% 0.80 12 US$ 360 0.0 1.5% 4.4% US$ 1,126 US$ 1,555 6.6x 5.4x 5.3x 6.9x 7.0x 7.1xGroup Average - Limited Partnerships Avg. -> 7.8x 7.4x 7.2x 6.1x 6.2x 6.1x
Large Cap Non-North AmericaNEW HOPE (NHC-AU) A$ 2.62 A$ 2.24 (14.5)% 0.75 831 A$ 2,178 1.6 0.3% 7.3% A$ 13 A$ 1,953 0.36 0.27 0.22 7.3x 9.7x 12.2x 10.4x 12.8x 20.6x 4.9x 5.9x 9.2xWHITEHAVEN COAL (WHC-AU) A$ 4.91 A$ 4.27 (13.1)% 1.68 1,026 A$ 5,038 6.9 3.6% 11.8% A$ 398 A$ 5,349 0.82 0.70 0.55 6.0x 7.0x 9.0x 9.5x 12.4x 15.2x 5.8x 7.3x 8.7xBANPU PUBLIC (BANPU-SET) ฿ 21.80 ฿ 24.40 11.9% 1.40 5,162 ฿ 112,530 95.0 13.9% 6.8% ฿ 114,111 ฿ 230,991 2.65 3.46 3.70 8.2x 6.3x 5.9x 10.0x 10.3x 10.6x 9.1x 8.8x 9.0xCHINA COAL (1898-HK) HK$ 4.07 HK$ 4.25 4.4% 1.38 4,107 HK$ 86,547 24.7 5.6% 8.0% HK$ 98,178 HK$ 163,518 1.09 1.11 1.19 3.0x 2.9x 2.8x 10.0x 10.8x 10.2x 8.7x 8.9x 8.6xCHINA SHENHUA (1088-HK) HK$ 25.55 HK$ 24.57 (3.8)% 1.34 3,399 HK$ 673,025 23.4 6.7% 10.8% HK$ 105,981 HK$ 641,993 4.27 3.82 3.81 4.8x 5.4x 5.4x 8.8x 9.5x 9.9x 6.4x 6.6x 6.8xNINE ENTERTAINMENT (NEC-AU) A$ 1.70 A$ 1.47 (13.7)% 1.17 871 A$ 1,481 4.2 2.6% 8.5% A$ 291 A$ 1,706 0.18 0.15 0.17 9.5x 11.2x 9.8x 11.3x 12.7x 13.5x 7.4x 8.0x 8.4xYANZHOU COAL (1171-HK) HK$ 14.66 HK$ 11.90 (18.8)% 1.43 1,952 HK$ 99,312 28.9 13.9% 7.5% HK$ 65,578 HK$ 142,338 2.12 2.22 2.39 5.6x 5.3x 4.9x 9.0x 8.9x 9.2x 9.2x 8.5x 9.2xGroup Average - Large Cap Non-North-America Avg. -> 6.3x 6.8x 7.1x 9.8x 11.1x 12.7x 6.6x 7.7x 8.6x
Developer/ExplorersFORTUNE MINERALS (FT -T) C$ 0.25 C$ 0.40 60.0% 2.62 333 C$ 83.4 2.3 1.4% 24.9% C$ 5 C$ 85JAMESON RESOURCES (JAL-AU) A$ 0.16 0.91 257 A$ 41.1 0.2 0.0% 8.3% A$ 0 A$ 37Group Average - Developers / Explorers Avg. ->
Sundry CompaniesADARO ENERGY (ADRO-JKSE) ¥ 2,470 ¥ 2,694 9.1% 1.08 31,986 ¥ 79,005,326 50.4 1.2% 10.4% ¥ 1,434 ¥ 6,300 0.03 0.03 0.03 7.0x 6.3x 6.8x 11.4x 10.2x 10.8x 4.7x 4.3x 4.5xNLC INDIA (NEYVELILIG-NSEI) रू 102.20 0.80 1,529 रू 156,220 1.2 0.2% 10.9% रू 86,674 रू 244,484SOUTHGOBI RESOURCES (SGQ-T) C$ 0.18 (0.57) 273 C$ 48 0.0 0.0% 5.2% C$ 118 C$ 150BUKIT ASAM (PTBA-JKSE) ¥ 3,300 ¥ 3,392 2.8% 1.27 11,521 ¥ 38,018,176 27.5 2.4% 12.6% ¥ 2,368,524 ¥ 35,339,821 338.25 378.44 362.50 9.8x 8.7x 9.1x 9.9x 9.5x 9.7x 6.8x 6.4x 6.5xGroup Average - Sundry Companies Avg. -> 8.4x 7.5x 7.9x 10.7x 9.8x 10.2x 5.4x 5.0x 5.2xAll data sourced from Bloomberg
EV/EBITDAP/EPSCFPS (LoC) P/CFPS
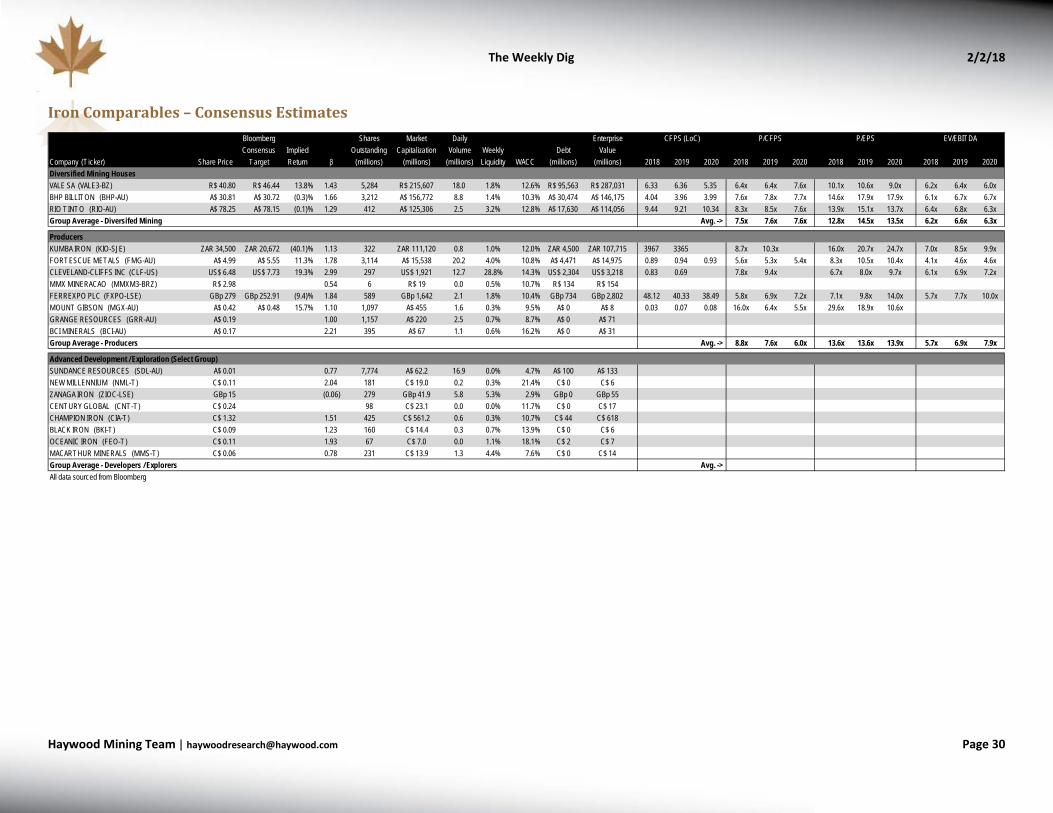
The Weekly Dig 2/2/18
Haywood Mining [email protected] Page 30
Iron Comparables – Consensus Estimates
Bloomberg Shares Market Daily Enterprise
Company (T icker) Share PriceConsensus
TargetImplied Return β
Outstanding (millions)
Capitalization (millions)
Volume (millions)
Weekly Liquidity WACC
Debt (millions)
Value (millions) 2018 2019 2020 2018 2019 2020 2018 2019 2020 2018 2019 2020
Diversified Mining HousesVALE SA (VALE3-BZ) R$ 40.80 R$ 46.44 13.8% 1.43 5,284 R$ 215,607 18.0 1.8% 12.6% R$ 95,563 R$ 287,031 6.33 6.36 5.35 6.4x 6.4x 7.6x 10.1x 10.6x 9.0x 6.2x 6.4x 6.0xBHP BILLITON (BHP-AU) A$ 30.81 A$ 30.72 (0.3)% 1.66 3,212 A$ 156,772 8.8 1.4% 10.3% A$ 30,474 A$ 146,175 4.04 3.96 3.99 7.6x 7.8x 7.7x 14.6x 17.9x 17.9x 6.1x 6.7x 6.7xRIO TINTO (RIO-AU) A$ 78.25 A$ 78.15 (0.1)% 1.29 412 A$ 125,306 2.5 3.2% 12.8% A$ 17,630 A$ 114,056 9.44 9.21 10.34 8.3x 8.5x 7.6x 13.9x 15.1x 13.7x 6.4x 6.8x 6.3xGroup Average - Diversifed Mining Avg. -> 7.5x 7.6x 7.6x 12.8x 14.5x 13.5x 6.2x 6.6x 6.3x
ProducersKUMBA IRON (KIO-SJE) ZAR 34,500 ZAR 20,672 (40.1)% 1.13 322 ZAR 111,120 0.8 1.0% 12.0% ZAR 4,500 ZAR 107,715 3967 3365 8.7x 10.3x 16.0x 20.7x 24.7x 7.0x 8.5x 9.9xFORTESCUE METALS (FMG-AU) A$ 4.99 A$ 5.55 11.3% 1.78 3,114 A$ 15,538 20.2 4.0% 10.8% A$ 4,471 A$ 14,975 0.89 0.94 0.93 5.6x 5.3x 5.4x 8.3x 10.5x 10.4x 4.1x 4.6x 4.6xCLEVELAND-CLIFFS INC (CLF-US) US$ 6.48 US$ 7.73 19.3% 2.99 297 US$ 1,921 12.7 28.8% 14.3% US$ 2,304 US$ 3,218 0.83 0.69 7.8x 9.4x 6.7x 8.0x 9.7x 6.1x 6.9x 7.2xMMX MINERACAO (MMXM3-BRZ) R$ 2.98 0.54 6 R$ 19 0.0 0.5% 10.7% R$ 134 R$ 154 FERREXPO PLC (FXPO-LSE) GBp 279 GBp 252.91 (9.4)% 1.84 589 GBp 1,642 2.1 1.8% 10.4% GBp 734 GBp 2,802 48.12 40.33 38.49 5.8x 6.9x 7.2x 7.1x 9.8x 14.0x 5.7x 7.7x 10.0xMOUNT GIBSON (MGX-AU) A$ 0.42 A$ 0.48 15.7% 1.10 1,097 A$ 455 1.6 0.3% 9.5% A$ 0 A$ 8 0.03 0.07 0.08 16.0x 6.4x 5.5x 29.6x 18.9x 10.6xGRANGE RESOURCES (GRR-AU) A$ 0.19 1.00 1,157 A$ 220 2.5 0.7% 8.7% A$ 0 A$ 71 BCI MINERALS (BCI-AU) A$ 0.17 2.21 395 A$ 67 1.1 0.6% 16.2% A$ 0 A$ 31 Group Average - Producers Avg. -> 8.8x 7.6x 6.0x 13.6x 13.6x 13.9x 5.7x 6.9x 7.9x
Advanced Development / Exploration (Select Group)SUNDANCE RESOURCES (SDL-AU) A$ 0.01 0.77 7,774 A$ 62.2 16.9 0.0% 4.7% A$ 100 A$ 133 NEW MILLENNIUM (NML-T) C$ 0.11 2.04 181 C$ 19.0 0.2 0.3% 21.4% C$ 0 C$ 6 ZANAGA IRON (ZIOC-LSE) GBp 15 (0.06) 279 GBp 41.9 5.8 5.3% 2.9% GBp 0 GBp 55 CENTURY GLOBAL (CNT-T) C$ 0.24 98 C$ 23.1 0.0 0.0% 11.7% C$ 0 C$ 17 CHAMPION IRON (CIA-T) C$ 1.32 1.51 425 C$ 561.2 0.6 0.3% 10.7% C$ 44 C$ 618 BLACK IRON (BKI-T) C$ 0.09 1.23 160 C$ 14.4 0.3 0.7% 13.9% C$ 0 C$ 6 OCEANIC IRON (FEO-T) C$ 0.11 1.93 67 C$ 7.0 0.0 1.1% 18.1% C$ 2 C$ 7 MACARTHUR MINERALS (MMS-T) C$ 0.06 0.78 231 C$ 13.9 1.3 4.4% 7.6% C$ 0 C$ 14 Group Average - Developers / Explorers Avg. ->All data sourced from Bloomberg
EV/EBITDAP/EPSCFPS (LoC) P/CFPS

The Weekly Dig 2/2/18
Haywood Mining [email protected] Page 31
Performance of Companies Included in Junior X
Source: Haywood Securities
Close Price Market Capitalization
Cash at Quarter End Weekly Performance QTD Performance
Company Ticker (C$) (C$M) (C$M)Junior Exploration Names Algold Resources Ltd. TSXV:ALG 0.16 32.14 2.00 0.0% 28.0% 28.8%Ascot Resources Ltd. TSXV:AOT 1.47 205.49 28.00 2.8% (3.3)% (2.5)%Aurion Resources Ltd. TSXV:AU 1.11 86.15 23.00 18.1% (48.8)% (48.0)%Fireweed Zinc Ltd. TSXV:FWZ 1.50 28.77 1.50 (9.1)% 26.1% 26.9%GT Gold Corp. TSXV:GTT 0.60 52.63 4.50 0.0% (18.9)% (18.1)%Hannan Metals Ltd. TSXV:HAN 0.24 10.07 3.50 (7.7)% 2.1% 3.0%IDM Mining Ltd. TSXV:IDM 0.10 39.78 6.00 (9.5)% (9.5)% (8.7)%K92 Mining Inc. TSXV:KNT 0.45 69.55 3.00 0.0% (16.7)% (15.8)%Kootenay Silver Inc TSXV:KTN 0.19 37.98 4.40 (11.6)% (7.3)% (6.5)%Mawson Resources Limited TSX:MAW 0.43 56.39 3.50 (14.0)% (4.4)% (3.6)%Novo Resources Corp. TSXV:NVO 3.55 561.61 72.00 16.8% (3.8)% (3.0)%Oklo Resources Limited ASX:OKU 0.45 134.19 13.00 4.7% 9.9% 10.7%Orford M ining Corporation TSXV:ORM 0.29 13.38 6.40 (14.7)% (15.9)% (15.1)%Probe Metals Inc. TSXV:PRB 1.35 129.60 30.00 (4.9)% (10.0)% (9.2)%QMX Gold Corporation TSXV:QMX 0.27 44.31 7.50 (8.6)% 1.9% 2.7%Regulus Resources Inc. TSXV:REG 1.90 145.48 7.00 (7.8)% 2.7% 3.5%Reunion Gold Corporation TSXV:RGD 0.14 43.19 12.00 (10.0)% (12.9)% (12.1)%Rupert Resources Ltd. TSXV:RUP 0.85 85.95 11.00 3.7% (9.6)% (8.8)%Xanadu Mines Limited ASX:XAM 0.28 159.32 11.20 1.9% (1.8)% (1.0)%Other Companies in the News No other news for the week
QTD Performance
vs. TSXV Index
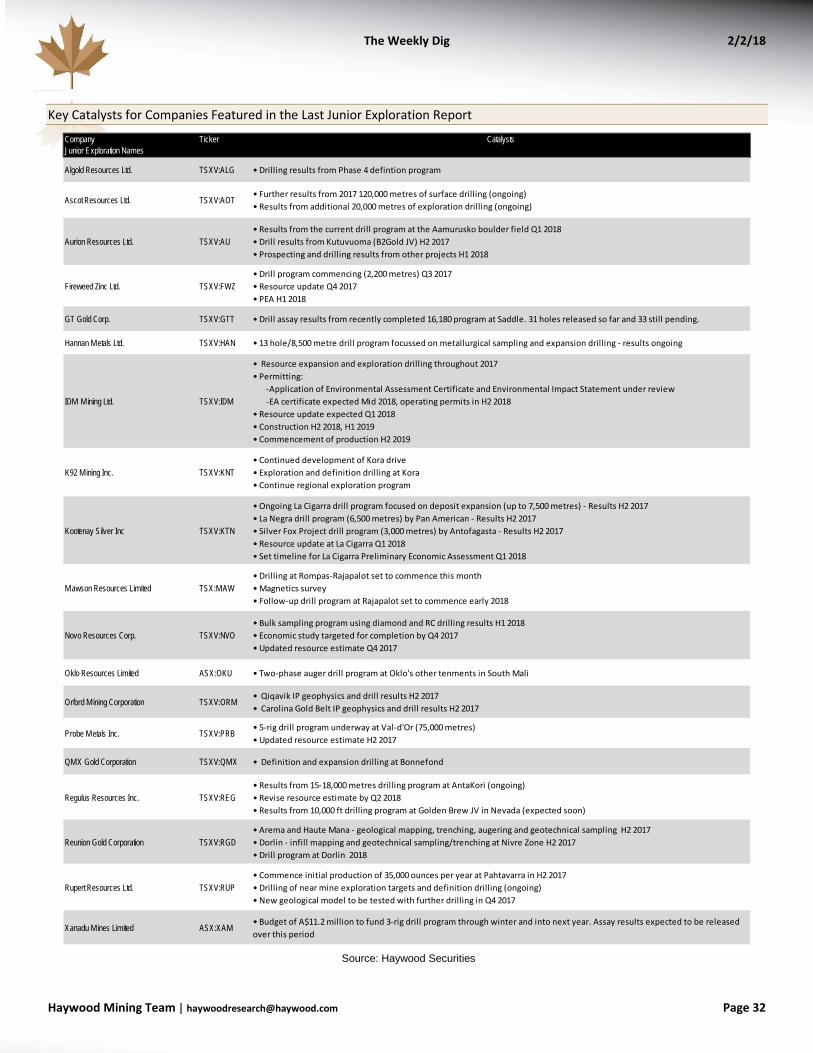
The Weekly Dig 2/2/18
Haywood Mining [email protected] Page 32
Key Catalysts for Companies Featured in the Last Junior Exploration Report
Source: Haywood Securities
Company Ticker CatalystsJunior Exploration Names
Algold Resources Ltd. TSXV:ALG • Drilling results from Phase 4 defintion program
Ascot Resources Ltd. TSXV:AOT• Further results from 2017 120,000 metres of surface drilling (ongoing)• Results from additional 20,000 metres of exploration drilling (ongoing)
Aurion Resources Ltd. TSXV:AU• Results from the current drill program at the Aamurusko boulder field Q1 2018 • Drill results from Kutuvuoma (B2Gold JV) H2 2017• Prospecting and drilling results from other projects H1 2018
Fireweed Zinc Ltd. TSXV:FWZ• Drill program commencing (2,200 metres) Q3 2017• Resource update Q4 2017• PEA H1 2018
GT Gold Corp. TSXV:GTT • Drill assay results from recently completed 16,180 program at Saddle. 31 holes released so far and 33 still pending.
Hannan Metals Ltd. TSXV:HAN • 13 hole/8,500 metre drill program focussed on metallurgical sampling and expansion drilling - results ongoing
IDM Mining Ltd. TSXV:IDM
• Resource expansion and exploration drilling throughout 2017• Permitting: -Application of Environmental Assessment Certificate and Environmental Impact Statement under review -EA certificate expected Mid 2018, operating permits in H2 2018• Resource update expected Q1 2018• Construction H2 2018, H1 2019• Commencement of production H2 2019
K92 Mining Inc. TSXV:KNT• Continued development of Kora drive• Exploration and definition drilling at Kora• Continue regional exploration program
Kootenay Silver Inc TSXV:KTN
• Ongoing La Cigarra drill program focused on deposit expansion (up to 7,500 metres) - Results H2 2017• La Negra drill program (6,500 metres) by Pan American - Results H2 2017• Silver Fox Project drill program (3,000 metres) by Antofagasta - Results H2 2017• Resource update at La Cigarra Q1 2018• Set timeline for La Cigarra Preliminary Economic Assessment Q1 2018
Mawson Resources Limited TSX:MAW• Drilling at Rompas-Rajapalot set to commence this month• Magnetics survey• Follow-up drill program at Rajapalot set to commence early 2018
Novo Resources Corp. TSXV:NVO• Bulk sampling program using diamond and RC drilling results H1 2018• Economic study targeted for completion by Q4 2017• Updated resource estimate Q4 2017
Oklo Resources Limited ASX:OKU • Two-phase auger drill program at Oklo's other tenments in South Mali
Orford M ining Corporation TSXV:ORM• Qiqavik IP geophysics and drill results H2 2017• Carolina Gold Belt IP geophysics and drill results H2 2017
Probe Metals Inc. TSXV:PRB• 5-rig drill program underway at Val-d'Or (75,000 metres)• Updated resource estimate H2 2017
QMX Gold Corporation TSXV:QMX • Definition and expansion drilling at Bonnefond
Regulus Resources Inc. TSXV:REG• Results from 15-18,000 metres drilling program at AntaKori (ongoing)• Revise resource estimate by Q2 2018• Results from 10,000 ft drilling program at Golden Brew JV in Nevada (expected soon)
Reunion Gold Corporation TSXV:RGD• Arema and Haute Mana - geological mapping, trenching, augering and geotechnical sampling H2 2017• Dorlin - infill mapping and geotechnical sampling/trenching at Nivre Zone H2 2017• Drill program at Dorlin 2018
Rupert Resources Ltd. TSXV:RUP• Commence initial production of 35,000 ounces per year at Pahtavarra in H2 2017• Drilling of near mine exploration targets and definition drilling (ongoing)• New geological model to be tested with further drilling in Q4 2017
Xanadu Mines Limited ASX:XAM• Budget of A$11.2 million to fund 3-rig drill program through winter and into next year. Assay results expected to be released over this period
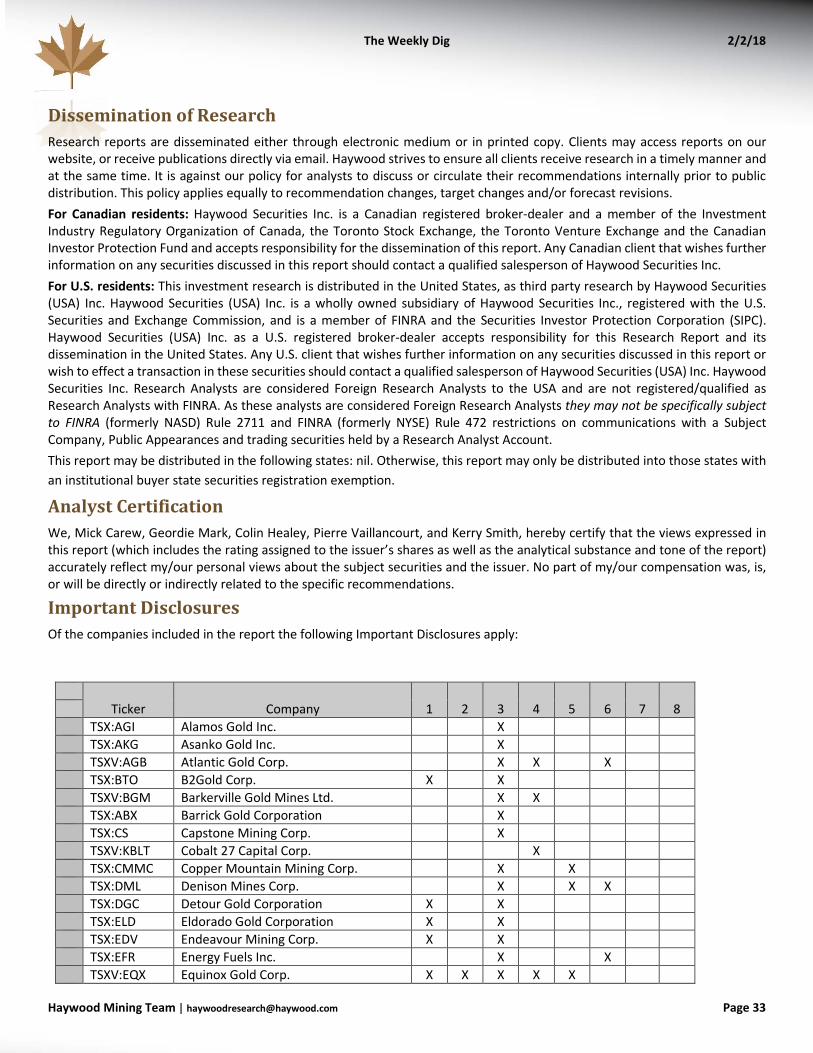
The Weekly Dig 2/2/18
Haywood Mining [email protected] Page 33
Dissemination of Research Research reports are disseminated either through electronic medium or in printed copy. Clients may access reports on our website, or receive publications directly via email. Haywood strives to ensure all clients receive research in a timely manner and at the same time. It is against our policy for analysts to discuss or circulate their recommendations internally prior to public distribution. This policy applies equally to recommendation changes, target changes and/or forecast revisions. For Canadian residents: Haywood Securities Inc. is a Canadian registered broker-dealer and a member of the Investment Industry Regulatory Organization of Canada, the Toronto Stock Exchange, the Toronto Venture Exchange and the Canadian Investor Protection Fund and accepts responsibility for the dissemination of this report. Any Canadian client that wishes further information on any securities discussed in this report should contact a qualified salesperson of Haywood Securities Inc. For U.S. residents: This investment research is distributed in the United States, as third party research by Haywood Securities (USA) Inc. Haywood Securities (USA) Inc. is a wholly owned subsidiary of Haywood Securities Inc., registered with the U.S. Securities and Exchange Commission, and is a member of FINRA and the Securities Investor Protection Corporation (SIPC). Haywood Securities (USA) Inc. as a U.S. registered broker-dealer accepts responsibility for this Research Report and its dissemination in the United States. Any U.S. client that wishes further information on any securities discussed in this report or wish to effect a transaction in these securities should contact a qualified salesperson of Haywood Securities (USA) Inc. Haywood Securities Inc. Research Analysts are considered Foreign Research Analysts to the USA and are not registered/qualified as Research Analysts with FINRA. As these analysts are considered Foreign Research Analysts they may not be specifically subject to FINRA (formerly NASD) Rule 2711 and FINRA (formerly NYSE) Rule 472 restrictions on communications with a Subject Company, Public Appearances and trading securities held by a Research Analyst Account. This report may be distributed in the following states: nil. Otherwise, this report may only be distributed into those states with an institutional buyer state securities registration exemption.
Analyst Certification We, Mick Carew, Geordie Mark, Colin Healey, Pierre Vaillancourt, and Kerry Smith, hereby certify that the views expressed in this report (which includes the rating assigned to the issuer’s shares as well as the analytical substance and tone of the report) accurately reflect my/our personal views about the subject securities and the issuer. No part of my/our compensation was, is, or will be directly or indirectly related to the specific recommendations.
Important Disclosures Of the companies included in the report the following Important Disclosures apply:
Ticker Company 1 2 3 4 5 6 7 8
TSX:AGI Alamos Gold Inc. X TSX:AKG Asanko Gold Inc. X TSXV:AGB Atlantic Gold Corp. X X X TSX:BTO B2Gold Corp. X X TSXV:BGM Barkerville Gold Mines Ltd. X X TSX:ABX Barrick Gold Corporation X TSX:CS Capstone Mining Corp. X TSXV:KBLT Cobalt 27 Capital Corp. X TSX:CMMC Copper Mountain Mining Corp. X X TSX:DML Denison Mines Corp. X X X TSX:DGC Detour Gold Corporation X X TSX:ELD Eldorado Gold Corporation X X TSX:EDV Endeavour Mining Corp. X X TSX:EFR Energy Fuels Inc. X X TSXV:EQX Equinox Gold Corp. X X X X X

The Weekly Dig 2/2/18
Haywood Mining [email protected] Page 34
TSXV:FPC Falco Resources Ltd. X X TSXV:GQC GoldQuest Mining Corp. X ASX:GOR Gold Road Resources Limited X TSX:HRT Harte Gold Corp. X X TSX:HBM Hudbay Minerals, Inc. X X TSX:LGD Liberty Gold Corp. X X X TSX:LUC Lucara Diamond Corp. X X TSX:LUG Lundin Gold Inc. X TSX:LUN Lundin Mining Corporation X TSX:MOZ Marathon Gold Corp. X X X X TSX:MAX Midas Gold Corp. X X X TSX:MPVD Mountain Province Diamonds Inc. X X X TSX:NXE NexGen Energy Ltd. X X X TSX:NSU Nevsun Resources Ltd. X X TSX:NHK Nighthawk Gold Corp. X X TSX:OGC OceanaGold Corporation X TSX:OR Osisko Gold Royalties Ltd. X X TSX:OSK Osisko Mining Corp. X X TSXV:PGM Pure Gold Mining Inc. X X X X TSXV:ROG Roxgold Inc. X X TSX:RNX RNC Minerals X X X TSX:SBB Sabina Gold and Silver Corp. X X TSXV:SGI Superior Gold Inc. TSX:SMF SEMAFO Inc. X TSX:THO Tahoe Resources Inc. X TSX:TML Treasury Metals Inc. X X TSX:TV Trevali Mining Corp. X X X AMEX:UEC Uranium Energy Corp. X X X TSX:U Uranium Participation Corporation X X
1 The Analyst(s) preparing this report (or a member of the Analysts’ households) have a financial interest in this company.
2 As of the end of the month immediately preceding this publication either Haywood Securities, Inc., one of its subsidiaries, its officers or directors beneficially owned 1% or more of this company.
3 Haywood Securities, Inc. has reviewed lead projects of this company and a portion of the expenses for this travel have been reimbursed by the issuer.
4 Haywood Securities Inc. or one of its subsidiaries has managed or co-managed or participated as selling group in a public offering of securities for this company in the past 12 months.
5 Haywood Securities, Inc. or one of its subsidiaries has received compensation for investment banking services from this company in the past 12 months
6 Haywood Securities, Inc. or one of its subsidiaries has received compensation for investment banking services from this company in the past 24 months
7 Haywood Securities, Inc. or one of its subsidiaries is restricted on this company at the time of publication
8 Haywood Securities, Inc. or one of its subsidiaries expects to receive or intends to seek compensation for investment banking services from this company in the next three months
Other material conflict of interest of the research analyst of which the research analyst or Haywood Securities Inc. knows or has reason to know at the time of publication or at the time of public appearance:
n/a
The Weekly Dig 2/2/18
Haywood Mining [email protected] Page 35
Rating Structure Each company within an analyst’s universe, or group of companies covered, is assigned: (i) a recommendation or rating, usually BUY, HOLD, or SELL; (ii) a 12 month target price, which represents an analyst’s current assessment of a company’s potential stock price over the next year; (iii) an overall risk rating which represents an analyst’s assessment of the company’s overall investment risk; and (iv) specific risk ratings or risk profile parameters which in their aggregate support an analyst’s overall risk rating. These ratings are more fully explained below. Before acting on our recommendation we caution you to confer with your Haywood investment advisor to determine the suitability of our recommendation for your specific investment objectives, risk tolerance and investment time horizon.
Recommendation Rating BUY –The analyst believes that the security will outperform other companies in their sector on a risk adjusted basis or for the reasons stated in the research report the analyst believes that the security is deserving of a (continued) BUY rating. HOLD – The analyst believes that the security is expected to perform in line with other companies in their sector on a risk adjusted basis or for the reasons stated in the research report the analyst believes that the security is deserving of a (continued) HOLD rating. SELL – Investors are advised to sell the security or hold alternative securities within the sector. Stocks in this category are expected to under-perform other companies on a risk adjusted basis or for the reasons stated in the research report the analyst believes that the security is deserving of a (continued) SELL rating. TENDER – The analyst is recommending that investors tender to a specific offering for the company’s stock. RESEARCH COMMENT – An analyst comment about an issuer event that does not include a rating or recommendation. UNDER REVIEW – Placing a stock Under Review does not revise the current rating or recommendation of the analyst. A stock will be placed Under Review when the relevant company has a significant material event with further information pending or to be announced. An analyst will place a stock Under Review while he/she awaits sufficient information to re-evaluate the company’s financial situation. COVERAGE DROPPED – Haywood Securities will no longer cover the issuer. Haywood will provide notice to clients whenever coverage of an issuer is discontinued. Haywood’s focus is to search for undervalued companies which analysts believe may achieve attractive risk-adjusted returns. This research coverage on potentially undervalued companies may result in an outweighed percentage of companies rated as BUY. Management regularly reviews rating and targets in all sectors to ensure fairness and accuracy. For further information on Haywood Securities’ research dissemination policies, please visit: http://haywood.com/what-we-offer/research/research-policy
Overall Risk Rating Very High Risk: Venture type companies or more established micro, small, mid or large cap companies whose risk profile parameters and/or lack of liquidity warrant such a designation. These companies are only appropriate for investors who have a very high tolerance for risk and volatility and who are capable of incurring temporary or permanent loss of a very significant portion of their investment capital. High Risk: Typically micro or small cap companies which have an above average investment risk relative to more established or mid to large cap companies. These companies will generally not form part of the broad senior stock market indices and often will have less liquidity than more established mid and large cap companies. These companies are only appropriate for investors who have a high tolerance for risk and volatility and who are capable of incurring a temporary or permanent loss of a significant loss of their investment capital. Medium-High Risk: Typically mid to large cap companies that have a medium to high investment risk. These companies will often form part of the broader senior stock market indices or sector specific indices. These companies are only appropriate for investors who have a medium to high tolerance for risk and volatility and who are prepared to accept general stock market risk including the risk of a temporary or permanent loss of some of their investment capital. Moderate Risk: Large to very large cap companies with established earnings who have a track record of lower volatility when compared against the broad senior stock market indices. These companies are only appropriate for investors who have a

The Weekly Dig 2/2/18
Haywood Mining [email protected] Page 36
medium tolerance for risk and volatility and who are prepared to accept general stock market risk including the risk of a temporary or permanent loss of some of their investment capital.
Distribution of Ratings (as of February 2, 2018) IB Clients
% # (TTM) Buy 72.4% 71 93.8% Hold 11.2% 11 6.3% Sell 0.0% 0 0.0% Tender 1.0% 1 0.0% UR (Buy) 0.0% 0 0.0% UR (Hold) 0.0% 0 0.0% UR (Sell) 0.0% 0 0.0% Dropped (TTM) 15.3% 15 0.0%
Price Chart, Rating and Target Price History (as of February 2, 2018)
Alamos Gold Inc. (AGI-T) Date Target(C$) Rating7/20/17 $10.00 Buy7/19/17 $11.50 Buy
11/11/16 $13.00 Buy7/7/16 $14.75 Buy
5/30/16 $10.25 Buy5/13/16 $9.50 Buy3/28/16 $7.75 Buy1/12/16 $7.00 Buy
11/13/15 $8.00 Buy7/15/15 $9.00 Buy1/27/15 $9.25 Buy
02468
1012141618
Feb15
May15
Aug15
Nov15
Feb16
May16
Aug16
Nov16
Feb17
May17
Aug17
Nov17
Price History (C$) Target/Rating/Coverage Change
Asanko Gold Inc. (AKG-T) Date Target(C$) Rating8/4/17 $2.00 Hold
7/20/17 $4.50 Buy2/28/17 $5.20 Buy2/22/17 $5.50 Buy1/25/17 $5.50 Hold7/11/16 $6.50 Buy5/31/16 $5.25 Buy5/3/16 $5.00 Buy4/7/16 $3.50 Buy
3/24/16 $3.25 Hold1/12/16 $3.25 Buy7/15/15 $3.60 Buy1/21/15 $3.20 Buy
Initiated Coverage 12/11/13
0
1
2
3
4
5
6
7
Jan15
Apr15
Jul15
Oct15
Jan16
Apr16
Jul16
Oct16
Jan17
Apr17
Jul17
Oct17
Price History (C$) Target/Rating/Coverage Change
Atlantic Gold Corporation (AGB-V) Date Target(C$) Rating7/20/17 $1.80 Buy5/16/17 $1.75 Buy1/25/17 $1.30 Buy10/6/16 $1.35 Buy12/9/15 $1.25 Buy5/19/16 $1.10 Buy3/7/16 $1.00 Buy3/1/16 $0.85 Buy
1/12/16 $0.55 Buy12/10/15 $0.50 Buy
Initiated Coverage 12/9/15
00.20.40.60.8
11.21.41.61.8
2
Jan15
Apr15
Jul15
Oct15
Jan16
Apr16
Jul16
Oct16
Jan17
Apr17
Jul17
Oct17
Price History (C$) Target/Rating/Coverage Change
B2Gold Corp. (BTO-T) Date Target(C$) Rating7/20/17 $5.00 Buy1/25/17 $5.50 Buy8/5/16 $6.00 Buy8/3/16 $5.00 Buy
7/11/16 $4.50 Buy5/31/16 $2.80 Buy5/13/16 $2.75 Hold3/18/16 $2.10 Hold
11/16/15 $2.10 Buy3/17/15 $2.75 Buy1/27/15 $3.25 Buy
Transferred Coverage 09/12/12; Re-Initiated Coverage 02/05/14
0
1
2
3
4
5
6
7
Jan15
Apr15
Jul15
Oct15
Jan16
Apr16
Jul16
Oct16
Jan17
Apr17
Jul17
Oct17
Price History (C$) Target/Rating/Coverage Change
Barkerville Gold Mines Ltd. (BGM-V) Date Target(C$) Rating4/20/17 $1.60 Buy3/30/17 $1.00 Buy
Initiated Coverage: 3/30/2017
00.20.40.60.8
11.21.41.61.8
2
Jan15
Apr15
Jul15
Oct15
Jan16
Apr16
Jul16
Oct16
Jan17
Apr17
Jul17
Oct17
Price History (C$) Target/Rating/Coverage Change
Barrick Gold Corporation (ABX-T) Date Target(C$) Rating10/17/17 $28.00 Buy7/20/17 $30.50 Buy4/26/17 $37.00 Buy2/17/17 $38.50 Buy1/25/17 $33.00 Buy7/11/16 $37.50 Buy5/31/16 $25.25 Buy4/27/16 $25.00 Buy4/18/16 $20.50 Buy2/19/16 $19.50 Buy1/12/16 $14.50 Buy8/7/15 $11.00 Buy
7/15/15 $15.65 Hold4/29/15 $15.75 Hold2/20/15 $15.00 Hold1/27/15 $14.25 Hold0
51015202530354045
Jan15
Apr15
Jul15
Oct15
Jan16
Apr16
Jul16
Oct16
Jan17
Apr17
Jul17
Oct17
Price History (C$) Target/Rating/Coverage Change
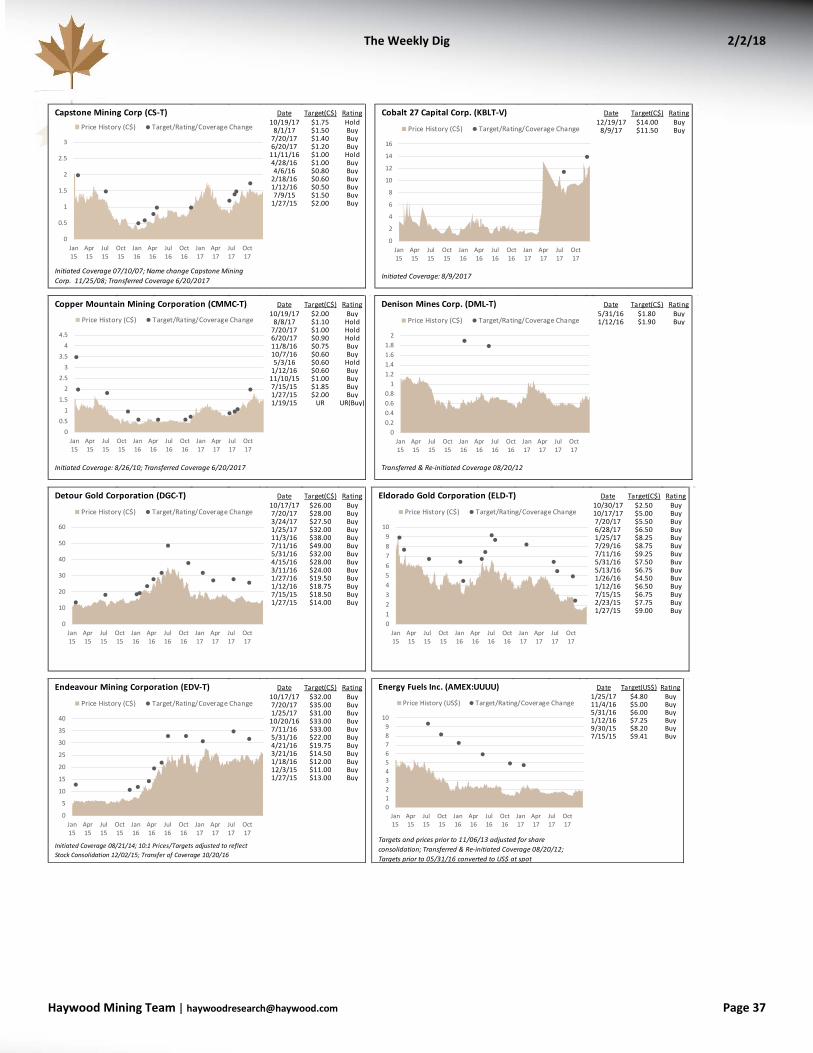
The Weekly Dig 2/2/18
Haywood Mining [email protected] Page 37
Capstone Mining Corp (CS-T) Date Target(C$) Rating10/19/17 $1.75 Hold
8/1/17 $1.50 Buy7/20/17 $1.40 Buy6/20/17 $1.20 Buy
11/11/16 $1.00 Hold4/28/16 $1.00 Buy4/6/16 $0.80 Buy
2/18/16 $0.60 Buy1/12/16 $0.50 Buy7/9/15 $1.50 Buy
1/27/15 $2.00 Buy
Initiated Coverage 07/10/07; Name change Capstone Mining Corp. 11/25/08; Transferred Coverage 6/20/2017
0
0.5
1
1.5
2
2.5
3
Jan15
Apr15
Jul15
Oct15
Jan16
Apr16
Jul16
Oct16
Jan17
Apr17
Jul17
Oct17
Price History (C$) Target/Rating/Coverage Change
Cobalt 27 Capital Corp. (KBLT-V) Date Target(C$) Rating12/19/17 $14.00 Buy
8/9/17 $11.50 Buy
Initiated Coverage: 8/9/2017
0
2
4
6
8
10
12
14
16
Jan15
Apr15
Jul15
Oct15
Jan16
Apr16
Jul16
Oct16
Jan17
Apr17
Jul17
Oct17
Price History (C$) Target/Rating/Coverage Change
Copper Mountain Mining Corporation (CMMC-T) Date Target(C$) Rating10/19/17 $2.00 Buy
8/8/17 $1.10 Hold7/20/17 $1.00 Hold6/20/17 $0.90 Hold11/8/16 $0.75 Buy10/7/16 $0.60 Buy5/3/16 $0.60 Hold
1/12/16 $0.60 Buy11/10/15 $1.00 Buy7/15/15 $1.85 Buy1/27/15 $2.00 Buy1/19/15 UR UR(Buy)
Initiated Coverage: 8/26/10; Transferred Coverage 6/20/2017
00.5
11.5
22.5
33.5
44.5
Jan15
Apr15
Jul15
Oct15
Jan16
Apr16
Jul16
Oct16
Jan17
Apr17
Jul17
Oct17
Price History (C$) Target/Rating/Coverage Change
Denison Mines Corp. (DML-T) Date Target(C$) Rating5/31/16 $1.80 Buy1/12/16 $1.90 Buy
Transferred & Re-initiated Coverage 08/20/12
00.20.40.60.8
11.21.41.61.8
2
Jan15
Apr15
Jul15
Oct15
Jan16
Apr16
Jul16
Oct16
Jan17
Apr17
Jul17
Oct17
Price History (C$) Target/Rating/Coverage Change
Detour Gold Corporation (DGC-T) Date Target(C$) Rating10/17/17 $26.00 Buy7/20/17 $28.00 Buy3/24/17 $27.50 Buy1/25/17 $32.00 Buy11/3/16 $38.00 Buy7/11/16 $49.00 Buy5/31/16 $32.00 Buy4/15/16 $28.00 Buy3/11/16 $24.00 Buy1/27/16 $19.50 Buy1/12/16 $18.75 Buy7/15/15 $18.50 Buy1/27/15 $14.00 Buy
0
10
20
30
40
50
60
Jan15
Apr15
Jul15
Oct15
Jan16
Apr16
Jul16
Oct16
Jan17
Apr17
Jul17
Oct17
Price History (C$) Target/Rating/Coverage Change
Eldorado Gold Corporation (ELD-T) Date Target(C$) Rating10/30/17 $2.50 Buy10/17/17 $5.00 Buy7/20/17 $5.50 Buy6/28/17 $6.50 Buy1/25/17 $8.25 Buy7/29/16 $8.75 Buy7/11/16 $9.25 Buy5/31/16 $7.50 Buy5/13/16 $6.75 Buy1/26/16 $4.50 Buy1/12/16 $6.50 Buy7/15/15 $6.75 Buy2/23/15 $7.75 Buy1/27/15 $9.00 Buy
0123456789
10
Jan15
Apr15
Jul15
Oct15
Jan16
Apr16
Jul16
Oct16
Jan17
Apr17
Jul17
Oct17
Price History (C$) Target/Rating/Coverage Change
Endeavour Mining Corporation (EDV-T) Date Target(C$) Rating10/17/17 $32.00 Buy7/20/17 $35.00 Buy1/25/17 $31.00 Buy
10/20/16 $33.00 Buy7/11/16 $33.00 Buy5/31/16 $22.00 Buy4/21/16 $19.75 Buy3/21/16 $14.50 Buy1/18/16 $12.00 Buy12/3/15 $11.00 Buy1/27/15 $13.00 Buy
Initiated Coverage 08/21/14; 10:1 Prices/Targets adjusted to reflect Stock Consolidation 12/02/15; Transfer of Coverage 10/20/16
0
5
10
15
20
25
30
35
40
Jan15
Apr15
Jul15
Oct15
Jan16
Apr16
Jul16
Oct16
Jan17
Apr17
Jul17
Oct17
Price History (C$) Target/Rating/Coverage Change
Energy Fuels Inc. (AMEX:UUUU) Date Target(US$) Rating1/25/17 $4.80 Buy11/4/16 $5.00 Buy5/31/16 $6.00 Buy1/12/16 $7.25 Buy9/30/15 $8.20 Buy7/15/15 $9.41 Buy
Targets and prices prior to 11/06/13 adjusted for share consolidation; Transferred & Re-initiated Coverage 08/20/12; Targets prior to 05/31/16 converted to US$ at spot
0123456789
10
Jan15
Apr15
Jul15
Oct15
Jan16
Apr16
Jul16
Oct16
Jan17
Apr17
Jul17
Oct17
Price History (US$) Target/Rating/Coverage Change

The Weekly Dig 2/2/18
Haywood Mining [email protected] Page 38
Equinox Gold Corp. (EQX-V) Date Target(C$) Rating10/17/17 $2.80 Buy
4/4/17 $3.00 Buy
Initiated Coverage: 4/4/2017
0
1
2
3
4
5
6
Jan15
Apr15
Jul15
Oct15
Jan16
Apr16
Jul16
Oct16
Jan17
Apr17
Jul17
Oct17
Price History (C$) Target/Rating/Coverage Change
Falco Resources Ltd. (FPC-V) Date Target(C$) Rating5/11/17 $2.00 Buy
Initiated Coverage: 5/11/2017
0
0.5
1
1.5
2
2.5
Jan15
Apr15
Jul15
Oct15
Jan16
Apr16
Jul16
Oct16
Jan17
Apr17
Jul17
Oct17
Price History (C$) Target/Rating/Coverage Change
Gold Road Resources Limited (GOR-A) Date Target(C$) Rating10/17/17 $0.90 Buy10/20/16 $1.00 Buy9/13/16 $1.00 Buy
Initiated Coverage 9/13/2016; Transfer of Coverage 10/20/16
0
0.5
1
1.5
2
2.5
3
Jan15
Apr15
Jul15
Oct15
Jan16
Apr16
Jul16
Oct16
Jan17
Apr17
Jul17
Oct17
Price History (C$) Target/Rating/Coverage Change
Goldquest Mining Corp. (GQC-V) Date Target(C$) Rating10/11/17 $0.60 Buy
Initiated Coverage: 10/11/2017
00.10.20.30.40.50.60.70.80.9
Jan15
Apr15
Jul15
Oct15
Jan16
Apr16
Jul16
Oct16
Jan17
Apr17
Jul17
Oct17
Price History (C$) Target/Rating/Coverage Change
Harte Gold Corp. (HRT-T) Date Target(C$) Rating12/13/17 $0.90 Buy4/12/17 $1.00 Buy
Initiated Coverage: 4/12/2017
0
0.2
0.4
0.6
0.8
1
1.2
Jan15
Apr15
Jul15
Oct15
Jan16
Apr16
Jul16
Oct16
Jan17
Apr17
Jul17
Oct17
Price History (C$) Target/Rating/Coverage Change
Hudbay Minerals Inc. (HBM-T) Date Target(C$) Rating1/12/18 $13.50 Buy
10/19/17 $12.50 Buy8/4/17 $12.00 Buy
7/20/17 $11.00 Buy6/20/17 $9.00 Buy
11/29/16 $10.00 Buy11/14/16 $8.25 Buy11/9/16 $7.25 Hold3/1/16 $7.25 Buy
1/18/16 $6.75 Buy1/12/16 $8.50 Buy7/15/15 $12.00 Buy5/11/15 $12.00 Hold2/23/15 $11.00 Hold
Initiated Coverage: 12/19/13; Transferred Coverage 6/20/2017
0
2
4
6
8
10
12
14
Jan15
Apr15
Jul15
Oct15
Jan16
Apr16
Jul16
Oct16
Jan17
Apr17
Jul17
Oct17
Price History (C$) Target/Rating/Coverage Change

The Weekly Dig 2/2/18
Haywood Mining [email protected] Page 39
Liberty Gold Corp. (LGD-T) Date Target(C$) Rating10/20/16 $1.00 Buy7/11/16 $1.20 Buy5/31/16 $1.00 Buy1/12/16 $0.70 Buy7/15/15 $1.50 Buy1/29/15 $1.90 Buy
Initiated Coverage 10/09/12; Transfer of Coverage 10/20/2016
00.20.40.60.8
11.21.41.61.8
2
Jan15
Apr15
Jul15
Oct15
Jan16
Apr16
Jul16
Oct16
Jan17
Apr17
Jul17
Oct17
Price History (C$) Target/Rating/Coverage Change
Lucara Diamond Corp. (LUC-T) Date Target(C$) Rating11/3/17 $3.20 Buy1/25/17 $3.50 Buy12/1/16 $3.00 Hold
11/10/16 $3.25 Hold8/8/16 $3.70 Hold8/2/16 $3.90 Hold
6/30/16 $3.90 Buy5/31/16 $4.40 Hold5/4/16 $4.10 Buy
3/15/16 $3.40 Buy1/12/16 $3.15 Buy12/3/15 $2.80 Buy8/13/15 $2.50 Buy4/28/15 $2.80 Buy
Initiated Coverage 04/28/15
00.5
11.5
22.5
33.5
44.5
5
Jan15
Apr15
Jul15
Oct15
Jan16
Apr16
Jul16
Oct16
Jan17
Apr17
Jul17
Oct17
Price History (C$) Target/Rating/Coverage Change
Lundin Mining Corporation (LUN-T) Date Target(C$) Rating1/12/18 $9.50 Hold12/1/17 $9.00 Buy
10/19/17 $11.50 Buy7/27/17 $11.00 Buy6/20/17 $10.00 Buy12/1/16 $8.50 Buy
11/16/16 $7.50 Buy7/28/16 $6.00 Buy4/29/16 $5.50 Buy3/15/16 $5.00 Buy11/2/15 $7.75 UR (Buy)7/15/15 $7.75 Buy1/27/15 $6.75 Buy
Transferred Coverage: 11/02/15; Transferred Coverage 6/20/2017
0
2
4
6
8
10
12
Jan15
Apr15
Jul15
Oct15
Jan16
Apr16
Jul16
Oct16
Jan17
Apr17
Jul17
Oct17
Price History (C$) Target/Rating/Coverage Change
Lundin Gold Inc. (LUG-T) Date Target(C$) Rating10/17/17 $7.75 Buy1/25/17 $8.25 Buy7/11/16 $8.75 Buy5/31/16 $7.25 Buy12/8/15 $5.00 Buy
Initiated Coverage: 12/08/15
0123456789
10
Jan15
Apr15
Jul15
Oct15
Jan16
Apr16
Jul16
Oct16
Jan17
Apr17
Jul17
Oct17
Price History (C$) Target/Rating/Coverage Change
Marathon Gold Corporation (MOZ-T) Date Target(C$) Rating1/11/18 $1.80 Buy2/27/17 $1.50 Buy1/17/17 $1.10 Buy
Initiated Coverage: 1/17/2017
00.20.40.60.8
11.21.41.61.8
2
Jan15
Apr15
Jul15
Oct15
Jan16
Apr16
Jul16
Oct16
Jan17
Apr17
Jul17
Oct17
Price History (C$) Target/Rating/Coverage Change
Midas Gold Corp. (MAX-T) Date Target(C$) Rating7/20/17 $1.50 Buy1/25/17 $1.75 Buy7/11/16 $1.90 Buy5/31/16 $0.95 Buy4/21/16 $0.85 Buy3/11/16 $0.65 Buy1/12/16 $0.45 Hold7/15/15 $0.50 Hold1/27/15 $0.80 Buy1/9/15 $0.85 Buy
Transferred and Re-initiated Coverage 11/05/13
00.20.40.60.8
11.21.41.61.8
2
Jan15
Apr15
Jul15
Oct15
Jan16
Apr16
Jul16
Oct16
Jan17
Apr17
Jul17
Oct17
Price History (C$) Target/Rating/Coverage Change

The Weekly Dig 2/2/18
Haywood Mining [email protected] Page 40
Mountain Province Diamonds Inc. (MPVD-T) Date Target(C$) Rating4/26/17 $6.30 Buy3/30/17 $7.00 Buy
10/17/16 $10.00 Buy3/31/16 $7.60 Buy1/12/16 $8.00 Buy7/15/15 $8.50 Buy2/19/15 $7.40 Buy2/5/15 $7.70 Buy
Initiated Coverage 02/05/15
0
2
4
6
8
10
12
Jan15
Apr15
Jul15
Oct15
Jan16
Apr16
Jul16
Oct16
Jan17
Apr17
Jul17
Oct17
Price History (C$) Target/Rating/Coverage Change
Nevsun Resources Ltd. (NSU-T) Date Target(C$) Rating11/1/17 $4.00 Buy7/20/17 $3.70 Hold6/20/17 $3.50 Hold6/30/16 $6.00 Buy4/26/16 $5.00 Buy7/15/15 $5.00 Buy4/29/15 $5.50 Buy
Initiated Coverage: 08/27/04; Transferred Coverage 6/20/2017
0
1
2
3
4
5
6
7
8
Jan15
Apr15
Jul15
Oct15
Jan16
Apr16
Jul16
Oct16
Jan17
Apr17
Jul17
Oct17
Price History (C$) Target/Rating/Coverage Change
NexGen Energy Ltd. (NXE-T) Date Target(C$) Rating2/27/17 $6.00 Buy1/25/17 $4.50 Buy4/14/16 $4.00 Buy3/30/16 $3.20 Buy1/12/16 $2.00 Buy11/5/15 $2.10 Buy
Initiated Coverage 11/05/15
0
1
2
3
4
5
6
7
Jan15
Apr15
Jul15
Oct15
Jan16
Apr16
Jul16
Oct16
Jan17
Apr17
Jul17
Oct17
Price History (C$) Target/Rating/Coverage Change
Nighthawk Gold Corp. (NHK-T) Date Target(C$) Rating10/20/17 $1.30 Buy
Initiated Coverage: 10/20/2017
00.20.40.60.8
11.21.41.61.8
Jan15
Apr15
Jul15
Oct15
Jan16
Apr16
Jul16
Oct16
Jan17
Apr17
Jul17
Oct17
Price History (C$) Target/Rating/Coverage Change
OceanaGold Corporation (OGC-T) Date Target(C$) Rating10/17/17 $4.20 Hold7/20/17 $4.40 Hold6/28/17 $5.10 Buy1/25/17 $5.75 Buy7/11/16 $6.50 Buy5/31/16 $4.40 Hold4/29/16 $4.35 Hold3/1/16 $3.80 Hold
2/19/16 $4.00 Hold10/2/15 $4.00 Buy7/15/15 $4.10 Buy4/30/15 $3.80 Buy2/20/15 $3.60 Buy1/27/15 $3.20 Buy
Initiated Coverage 09/22/14
0
1
2
3
4
5
6
7
Jan15
Apr15
Jul15
Oct15
Jan16
Apr16
Jul16
Oct16
Jan17
Apr17
Jul17
Oct17
Price History (C$) Target/Rating/Coverage Change
Osisko Gold Royalties Ltd. (OR-T) Date Target(C$) Rating10/17/17 $19.00 Buy7/20/17 $19.50 Buy1/25/17 $18.25 Buy
10/20/16 $19.00 Buy7/11/16 $20.25 Buy3/2/16 $19.00 Buy
12/16/15 $18.75 Buy
Initiated Coverage 12/16/2015; Transfer of Coverage 10/20/2016
0
5
10
15
20
25
Jan15
Apr15
Jul15
Oct15
Jan16
Apr16
Jul16
Oct16
Jan17
Apr17
Jul17
Oct17
Price History (C$) Target/Rating/Coverage Change
Osisko Mining Inc. (OSK-T) Date Target(C$) Rating4/6/17 $6.50 Buy
3/17/17 $5.00 Buy10/20/16 $4.00 Buy7/11/16 $4.00 Buy5/31/16 $3.00 Buy2/4/16 $2.00 Buy
12/10/15 $2.50 Buy
Initiated Coverage 12/10/2016; Transfer of Coverage 10/20/2016
0
1
2
3
4
5
6
7
Jan15
Apr15
Jul15
Oct15
Jan16
Apr16
Jul16
Oct16
Jan17
Apr17
Jul17
Oct17
Price History (C$) Target/Rating/Coverage Change
Pure Gold Mining Inc. (PGM-V) Date Target(C$) Rating6/28/17 $1.00 Buy
Initiated Coverage: 6/28/2017
0
0.2
0.4
0.6
0.8
1
1.2
Jan15
Apr15
Jul15
Oct15
Jan16
Apr16
Jul16
Oct16
Jan17
Apr17
Jul17
Oct17
Price History (C$) Target/Rating/Coverage Change

The Weekly Dig 2/2/18
Haywood Mining [email protected] Page 41
RNC Minerals (RNX-T) Date Target(C$) Rating9/26/17 $0.25 Hold
11/15/16 $0.65 Buy4/27/16 $0.75 Buy1/12/16 $0.35 Buy7/15/15 $0.50 Buy1/27/15 $0.60 Buy
Initiated Coverage: 07/05/11; Name Change to RNC Minerals 9/13/2016; Transferred Coverage 9/26/2017
0
0.1
0.2
0.3
0.4
0.5
0.6
0.7
0.8
Jan15
Apr15
Jul15
Oct15
Jan16
Apr16
Jul16
Oct16
Jan17
Apr17
Jul17
Oct17
Price History (C$) Target/Rating/Coverage Change
Roxgold Inc. (ROXG-T) Date Target(C$) Rating1/3/18 $1.90 Buy
11/1/17 $1.70 Buy7/20/17 $1.80 Buy1/25/17 $2.00 Buy
10/20/16 $2.10 Buy7/11/16 $2.15 Buy5/31/16 $1.60 Buy4/28/16 $1.50 Buy7/15/15 $1.10 Buy
Initiated Coverage 01/27/14; Transfer of Coverage 10/20/2016
0
0.5
1
1.5
2
2.5
Jan15
Apr15
Jul15
Oct15
Jan16
Apr16
Jul16
Oct16
Jan17
Apr17
Jul17
Oct17
Price History (C$) Target/Rating/Coverage Change
Sabina Gold & Silver Corp. (SBB-T) Date Target(C$) Rating12/20/17 $2.60 Hold10/19/17 $2.50 Hold10/17/17 $2.70 Buy
9/5/17 $2.75 Buy7/19/17 $2.50 Buy1/25/17 $1.70 Buy6/16/16 $1.65 UR (Buy)5/31/16 $1.65 Buy1/12/16 $1.00 Buy
12/15/15 $0.90 Buy
Initiated Coverage 12-15-15
0
0.5
1
1.5
2
2.5
3
Jan15
Apr15
Jul15
Oct15
Jan16
Apr16
Jul16
Oct16
Jan17
Apr17
Jul17
Oct17
Price History (C$) Target/Rating/Coverage Change
SEMAFO Inc. (SMF-T) Date Target(C$) Rating4/25/17 $4.50 Buy3/9/17 $5.50 Buy
1/25/17 $7.00 Buy11/10/16 $7.50 Buy7/11/16 $8.25 Buy5/12/16 $6.50 Buy2/26/16 $6.00 Buy7/15/15 $5.00 Buy1/27/15 $5.75 Buy
0123456789
Jan15
Apr15
Jul15
Oct15
Jan16
Apr16
Jul16
Oct16
Jan17
Apr17
Jul17
Oct17
Price History (C$) Target/Rating/Coverage Change
Superior Gold Inc. (SGI-V) Date Target(C$) Rating12/12/17 $1.50 Buy
Initiated Coverage: 12/12/2017
00.20.40.60.8
11.21.41.61.8
2
Feb17
May17
Aug17
Nov17
Price History (C$) Target/Rating/Coverage Change
Tahoe Resources Inc. (THO-T) Date Target(C$) Rating1/15/18 $7.00 Hold
10/17/17 $7.25 Hold9/11/17 $7.75 Hold8/9/17 $6.75 Hold
7/19/17 $7.25 Hold7/6/17 $9.00 Sell5/3/17 $13.00 Hold
3/13/17 $12.00 Hold1/25/17 $14.00 Hold11/4/16 $25.00 Buy8/11/16 $28.00 Buy7/11/16 $25.00 Buy5/9/16 $20.00 Buy
7/15/15 $16.50 Buy4/29/15 $19.25 Buy4/2/15 $16.00 Hold
1/27/15 $14.50 Sell
Initiated Coverage 11/05/13
0
5
10
15
20
25
30
Jan15
Apr15
Jul15
Oct15
Jan16
Apr16
Jul16
Oct16
Jan17
Apr17
Jul17
Oct17
Price History (C$) Target/Rating/Coverage Change
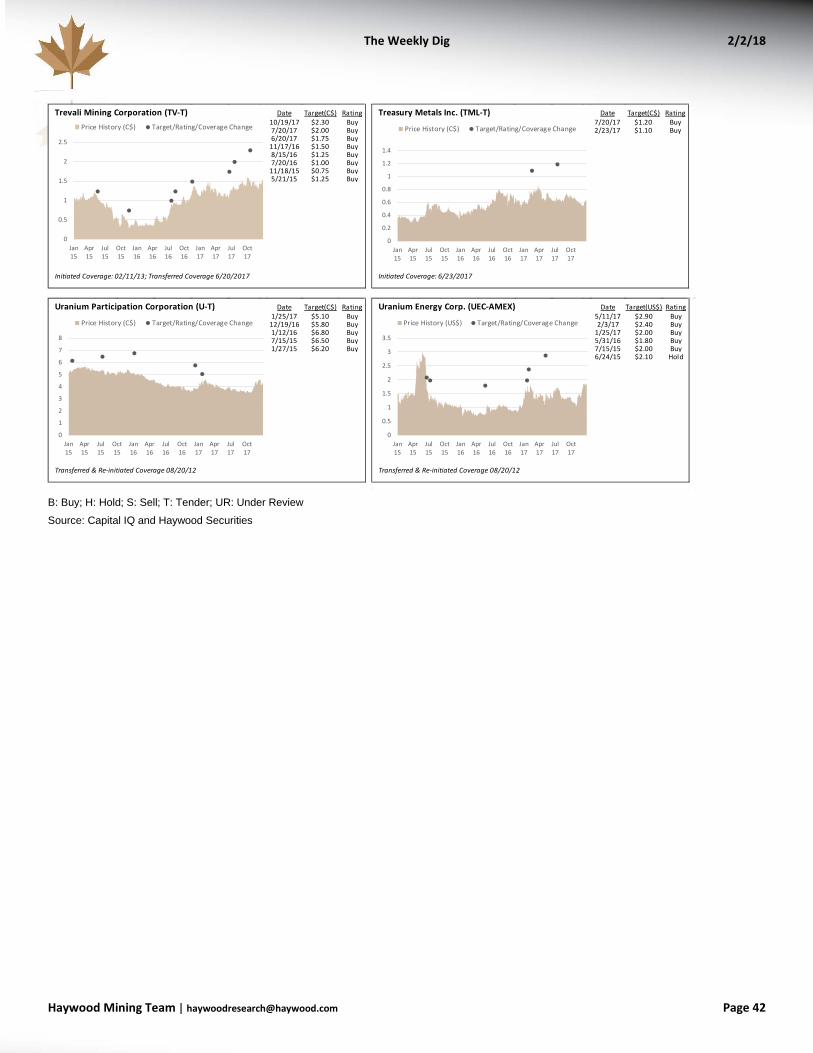
The Weekly Dig 2/2/18
Haywood Mining [email protected] Page 42
B: Buy; H: Hold; S: Sell; T: Tender; UR: Under Review
Source: Capital IQ and Haywood Securities
Trevali Mining Corporation (TV-T) Date Target(C$) Rating10/19/17 $2.30 Buy7/20/17 $2.00 Buy6/20/17 $1.75 Buy
11/17/16 $1.50 Buy8/15/16 $1.25 Buy7/20/16 $1.00 Buy
11/18/15 $0.75 Buy5/21/15 $1.25 Buy
Initiated Coverage: 02/11/13; Transferred Coverage 6/20/2017
0
0.5
1
1.5
2
2.5
Jan15
Apr15
Jul15
Oct15
Jan16
Apr16
Jul16
Oct16
Jan17
Apr17
Jul17
Oct17
Price History (C$) Target/Rating/Coverage Change
Treasury Metals Inc. (TML-T) Date Target(C$) Rating7/20/17 $1.20 Buy2/23/17 $1.10 Buy
Initiated Coverage: 6/23/2017
0
0.2
0.4
0.6
0.8
1
1.2
1.4
Jan15
Apr15
Jul15
Oct15
Jan16
Apr16
Jul16
Oct16
Jan17
Apr17
Jul17
Oct17
Price History (C$) Target/Rating/Coverage Change
Uranium Participation Corporation (U-T) Date Target(C$) Rating1/25/17 $5.10 Buy
12/19/16 $5.80 Buy1/12/16 $6.80 Buy7/15/15 $6.50 Buy1/27/15 $6.20 Buy
Transferred & Re-initiated Coverage 08/20/12
0
1
2
3
4
5
6
7
8
Jan15
Apr15
Jul15
Oct15
Jan16
Apr16
Jul16
Oct16
Jan17
Apr17
Jul17
Oct17
Price History (C$) Target/Rating/Coverage Change
Uranium Energy Corp. (UEC-AMEX) Date Target(US$) Rating5/11/17 $2.90 Buy2/3/17 $2.40 Buy
1/25/17 $2.00 Buy5/31/16 $1.80 Buy7/15/15 $2.00 Buy6/24/15 $2.10 Hold
Transferred & Re-initiated Coverage 08/20/12
0
0.5
1
1.5
2
2.5
3
3.5
Jan15
Apr15
Jul15
Oct15
Jan16
Apr16
Jul16
Oct16
Jan17
Apr17
Jul17
Oct17
Price History (US$) Target/Rating/Coverage Change