Embed Size (px)
Citation preview
The Relationships between Urban Form and TravelPatterns. An International Review and Evaluation
Dominic Stead and Stephen MarshallBartlett School of PlanningUniversity College LondonLondonUnited KingdomE-mail: [email protected]
EJTIR, 1, no. 2 (2001), pp. 113 - 141
Received: October 2000Accepted: February 2001
There is a growing body of research concerned with the relationship between urban formand travel patterns. Studies originate from a diversity of sources, and encompass a variety ofgeographic scales and locations. To add to this diversity, many different characteristics ofurban form to have been examined in these studies, and travel patterns have been measuredin a number of different ways. This paper brings together in a systematic way the results ofmany recent studies on urban form and travel patterns over the last 20 years. As well as thissystematic approach, other key aspects of this review paper include the identification ofwhere research has been concentrated (and where there are gaps in research), and in thecritique of the studies, which includes issues of data accuracy, reliability and quality, theapplicability of research methods and data interpretation. The critique focuses in somedetail on the interaction of socio-economic factors with urban form and travel patterns.
1. Introduction
The search for sustainable transport policies has witnessed increasing attention to patterns ofmobility, in the interests of reducing the adverse environmental impacts of increasing travel.In recent years there has been much interest in tackling travel growth by promoting forms ofsustainable urban development in which the design and layout of urban areas can assist inreducing travel (see for example Barton et al., 1995; Banister and Marshall, 2000; ECOTEC,1993). In particular, advocacy for various forms of neo-traditional urbanism, compact cities,urban villages and public transport oriented development all aim explicitly to use land usepolicy and urban design to assist in promoting more sustainable patterns of travel (see forexample Aldous, 1992; Calthorpe, 1993; Ryan and McNally, 1995; Urban Task Force,1999).

114 The Relationships between Urban Form and Travel Patterns
Accordingly, there is a growing body of research concerned with the relationship betweenurban form and travel patterns. Studies originate from a diversity of sources, and encompassa variety of geographic scales and locations. To add to this diversity, many differentcharacteristics of urban form to have been examined in these studies, and travel patterns havebeen measured in a number of different ways. This paper brings together the results of recentstudies on urban form and travel patterns over the last 20 years (from 1980 onwards).Research has examined the relationships between a number of urban form characteristics,ranging from regional to local in scale, and travel patterns. At the strategic level, urban formconcerns the location of new development in relation to existing towns, cities and otherinfrastructure, and the size and shape of new development and the type of land use (whetherfor example it is used for housing, commercial and industrial purposes or a mixture of thesepurposes). At the local level, urban form concerns the level and scale of land use mixing andthe extent to which development is clustered or concentrated into nodes (Figure 1).
STRATEGIC
LOCATION with respect to existingtowns, cities and infrastructure.
STRUCTURE of development - size andshape.
LAND USE TYPE and overall mix.
CLUSTERING/CONCENTRATION ofdevelopment.
LAND USE MIX - level and scale of mix.
DENSITY of development (populationand employment density).
LAYOUT of development (movementnetworks, neighbourhood type).
LOCAL
NEIGHBOURHOOD
Adapted from Owens, 1986
Figure 1. Land use characteristics that can affect travel patterns

Dominic Stead and Stephen Marshall 115
2. Approach
The paper focuses on nine aspects of urban form, ranging from regional strategic planninglevel (at the top of the list) down to specific local planning issues at the neighbourhood scale(at the bottom of the list)1:
i. distance of residence from the urban centreii. settlement sizeiii. mixing of land usesiv. provision of local facilitiesv. density of developmentvi. proximity to transport networksvii. availability of residential parkingviii. road network typeix. neighbourhood type
This paper reviews evidence for the influence of land use on travel patterns from empiricalstudies only2. In looking at travel patterns, the focus is individual travel as a whole, ratherthan individual modes (such as car or public transport) or certain types of journeys (such ascommuting). The review is international although most of the studies reported in this paperoriginate from either Western Europe or the United States.This review has necessitated a certain amount of compartmentalism into discrete categoriesof urban form and it is recognised that there is no definitive way of deciding the categories.Definitions may be overlapping or nested within each other. For example, the term‘concentration’ implies density but may also imply a nodal or ‘focal’ element which relatesto layout; the term ‘urban structure’ is often related to the layout of transportation networks(e.g. ‘grid structure’), of which street pattern may be regarded as a local subset. As shall beseen, neighbourhood type can be regarded as a composite measure which may incorporatenetwork type. Furthermore, the significance of each variable is likely to depend on context.For example, the significance a variable such as ‘distance to urban centre’ will varyaccording to how monocentric or dispersed a settlement is, both in terms of overall layoutand in terms of location of employment relative to residences.There are a number of reasons for the focus on empirical studies. First, empirical studies arefundamental and often provide data for use in the construction or testing of models. Second,empirical studies illustrate real examples and rely on fewer assumptions than modellingstudies. Third, they are often more understandable and transparent in approach thanmodelling studies and allow a wide variety of land use characteristics to be examined,whereas modelling studies are often seen as ‘black box’ exercises which lack transparencyabout the complexity, subjectivity and assumptions of the model. They rely on mathematicalformulations that are often incomprehensible to most people, including many land usepolicy-makers. It would be unfair however to point to the weaknesses of modelling studieswithout also recognising that there are weaknesses of empirical studies. Empirical studies do
1 It is recognised, however, that putting these nine elements in order of scale is difficult since some are relevant
to more than one scale. For example, road networks can be local or regional, density can apply at the city-scale or at the neighbourhood level.
2 For literature on land use and transport modelling studies and their application to land use planning, see forexample Webster et al (1988), Wegener (1994) or Wilson (1998).

116 The Relationships between Urban Form and Travel Patterns
not easily lend themselves to establishing the causality of relationships or conclusive results.The empirical investigation of relationships between selected land use characteristics andtravel patterns relies on examples of land use characteristics being found in the ‘field’. Thereare often confounding factors (such as socio-economic characteristics) which makecomparisons between different areas difficult in empirical studies. Certain land usecharacteristics are difficult to classify in the ‘real world’ since they often lie betweendifferent classification systems (centralised or dispersed employment, mixed or segregatedland uses for example). These issues are discussed in more detail later in the critique.
3. Review
There is a large amount of literature on the relationships between land use and travelcharacteristics. A summary of the review is presented in tabular form (Table 1) in which landuse characteristics form one axis and travel characteristics form the other axis. Differentstudies have examined different travel patterns and five measures of travel patterns aredistinguished in this review:
i. travel distanceii. journey frequencyiii. modal splitiv. travel timev. transport energy consumption
Using this tabular approach it is possible to identify where research has been concentratedand where there are gaps in the research. It is also possible to examine where findings aresimilar and where they differ.

Table 1. Studies Classified According to Land Use Characteristics and Travel Patterns
Land usecharacteristics→Travel patterns↓
Distance ofresidence fromthe urbancentre
Settlementsize
Mixing ofland uses
Provision oflocal facilities
Density of development Proximityto maintransportnetworks
Availabilityofresidentialparking
Roadnetworktype
Neighbourhood type
Averagejourneydistance
Gordon et al.,1989aJohnston-Anumonwo,1992Spence andFrost, 1995
Orfeuil andSalomon,1993
Cervero andLandis, 1992Hanson, 1982Winter andFarthing, 1997
ECOTEC, 1993
Averagejourneydistanceby car
Hillman andWhalley,1983
Cervero andLandis, 1992Farthing et al.,1997
ECOTEC, 1993Hillman and Whalley,1983Levinson and Kumar,1997
LevinsonandKumar,1997
MarshallandBanister,2000
Crane and Crepeau, 1998
DIS
TA
NC
E
Traveldistance(all modes)
Næss et al.,1995Curtis, 1995Stead, 1999
ECOTEC,1993Hillman andWhalley,1983Stead, 1999
Stead,1999
Stead, 1999 Dunphy and Fisher, 1996ECOTEC, 1993Hillman and Whalley,1983Kenworthy and Laube,1999Stead, 1999
Headicarand Curtis,1994Stead,1999
Stead, 1999 Crane and Crepeau, 1998Rutherford et al.,1996
FRE
QU
EN
CY
Journeyfrequency
Curtis, 1995 Ewing etal., 1996
Hanson, 1982;ECOTEC,1993
Dunphy and Fisher, 1996ECOTEC, 1993Ewing et al., 1996
Berman, 1996Cervero and Gorham,1995Crane and Crepeau, 1998Friedman et al., 1994McNally and Kulkarni,1997

Land usecharacteristics→Travel patterns↓
Distance ofresidence fromthe urbancentre
Settlementsize
Mixing ofland uses
Provision oflocal facilities
Density of development Proximityto maintransportnetworks
Availabilityofresidentialparking
Roadnetworktype
Neighbourhood type
Proportionof carjourneys
Curtis, 1995Næss andSandberg,1996
Gordon etal., 1989a
Cervero andLandis, 1992
ECOTEC, 1993Gordon et al., 1989aLevinson and Kumar,1997
Headicarand Curtis,1994Kitamuraet al., 1997
Kitamura etal., 1997
Cervero and Gorham,1995Crane and Crepeau, 1998Friedman et al., 1994McNally and Kulkarni,1997
Proportionof publictransportjourneys
Cervero andLandis, 1992
ECOTEC, 1993Frank and Pivo, 1994Levinson and Kumar,1997Baker, 1995Kenworthy and Laube,1999
Cervero,1994
Ewing,1996Flemingand Pund,1994MessengerandEwing,1996TRB,1996
Cervero and Gorham,1995Crane and Crepeau, 1998Ewing, 1996Fleming and Pund, 1994Friedman et al., 1994McNally and Kulkarni,1997TRB, 1996
MO
DE
Proportionof journeysby foot orcycle
Cervero,1989 and1996a
Winter andFarthing, 1997
ECOTEC, 1993Kitamura et al., 1997Baker, 1995Frank and Pivo, 1994
Balcombeand York,1993
Ewing,1996Handy,1992
Crane and Crepeau, 1998Ewing, 1996Friedman et al., 1994Handy, 1992 and 1996McNally and Kulkarni,1997
TIM
E
Traveltime
Gordon etal., 1989a
Giulianoand Small,1993
Cervero andLandis, 1992
Gordon et al., 1989aGordon et al., 1991Levinson and Kumar,1997
LevinsonandKumar,1997

Land usecharacteristics→Travel patterns↓
Distance ofresidence fromthe urbancentre
Settlementsize
Mixing ofland uses
Provision oflocal facilities
Density of development Proximityto maintransportnetworks
Availabilityofresidentialparking
Roadnetworktype
Neighbourhood type
EN
ER
GY
Transportenergycon-sumption
Næss et al.,1995Mogridge,1985Newman andKenworthy,1988
Banister etal., 1997
Næss, 1993Newman and Kenworthy,1989Kenworthy and Laube,1999

120 The Relationships between Urban Form and Travel Patterns
3.1 Distance of residence from the Urban Centre
Spence and Frost (1995) describe the changes in commuting distance between 1971 and1981 in the three largest cities in Great Britain, London, Manchester and Birmingham andshow how commuting distance changes with increasing distance between home and theurban centre. In London commuting distance increases almost linearly with distance betweenhome and urban centre. At a distance of 20 kilometres from the centre of London commutingdistance continues to increase with increasing distance from the centre of the city. InManchester and Birmingham however the relationship is different. Commuting distance inBirmingham first increases with increasing distance between home and the urban centre butat a distance of around 7 kilometres from the urban centre commuting distance reaches aplateau. At a distance of around 9 kilometres from the centre commuting distance begins todecrease as distance from the urban centre increases. Commuting distance in Manchesterfirst increases with increasing distance from the urban centre. At a distance of around 5kilometres from the centre commuting distance reaches a plateau and does not change withfurther increases from the city centre unlike the trend in commuting distance in Birminghamwhich begins to decrease at a distance of 9 kilometres from the city centre. The trends incommuting distance by distance from home to the urban centre in the three cities between1971 and 1981 are similar. Gordon et al. (1989a) describe the changes in average traveldistance in the United States between 1977 and 1983 of people residing inside and outsidecities. In various sizes of city journey distances for both work and non-work journeys in 1977and 1983 were almost always lower for residents inside cities than for residents outsidecities.Næss et al. (1995) identify a statistical relationship between the distance from the urbancentre and travel distance per person in Oslo in which total distance increases with increasesbetween home and the urban centre. It is claimed that the distance between home and theurban centre is an important determinant of travel distance in addition to factors such as carownership and the proximity to local facilities from the home. In a study of travel patterns invarious locations in and around Oxford, Curtis (1995) shows that average work journeydistance may be linked to the distance between home and urban centre. A link betweenaverage non-work journey distance and the distance from home to urban centre is much lessapparent. Average work journey distance is lowest in the two locations closest to the centreof Oxford (Botley and Kiddlington) and highest in the two locations furthest from the centreof Oxford (Bicester and Witney). As for non-work journeys, average travel distance ishighest in Witney, Bicester and Botley, the first two locations being most distant from thecity centre and the latter being closest to the centre of Oxford. The lowest average non-worktravel distance was recorded in Kiddlington, a location close to the centre of Oxford.According to the data collected by Curtis (1995) the frequency of work and non-workjourneys does not vary significantly according to the distance between home and the urbancentre. The proportion of journeys by car may be related to some extent to the distancebetween home and city centre. The proportion of car journeys is lowest in the two locationsclosest to the centre of Oxford and highest in the two locations furthest from the city centre.Stead (1999) examines the relationship between the proximity of homes to high street shopsas a proxy for the distance between home and the urban centre (recognising that this measuremay not accurately reflect the proximity to the nearest urban centre, since high street shops

Dominic Stead and Stephen Marshall 121
are not always found in central urban areas – they can also be found in out of town shoppingcentres and along the radial routes of larger cities for example) but finds no relationshipbetween the distance between home and high street shops.Næss et al. (1995) examine the effect of distance from the home to the urban centre ontransport energy consumption. Transport energy consumption increases as the distancebetween home and the urban centre increases. A causal model containing a variety of landuse and socio-economic variables is constructed. It is claimed car ownership has the greatestinfluence on transport energy consumption, followed by the distance between home and theurban centre, the proximity to local facilities from the home, income per capita and variousother socio-economic factors. Mogridge (1985) demonstrates a near linear relationshipbetween distance from home to the centre and transport energy consumption. Therelationship is shown to be very similar in both London and Paris. On average, residentsliving at a distance of 15 kilometres from the urban centre consume more than twice thetransport energy consumed by residents living 5 kilometres from the urban centre. Similarly,Newman and Kenworthy (1988) identify the relationship between transport energyconsumption and the distance from the central business district in Perth. Like Mogridge(1985), Newman and Kenworthy demonstrate a linear relationship although the latter is notas steep. It is reported that residents living at a distance of 15 kilometres from the centralbusiness district consume approximately 20 per cent more transport energy than residentsliving 5 kilometres from the central business district.In summary, in many studies, increasing distance from home to the urban centre is associatedwith increasing travel distance, an increasing proportion of car journeys and increasingtransport energy consumption. Trip frequency however does not vary significantly accordingto the distance between home and the urban centre. It is recognised here that urban areas arenot monocentric and there are often urban locations outside of the centre where majoremployment, services and facilities can also be found. Thus the distance between home andurban centre may only be a rough indicator of the remoteness of development.
3.2 Settlement Size
The size of settlements affects the range of local jobs and services that can be supported andinfluences the range of public transport services which can be provided. Thus smallsettlements that are unable to support a large range of services and facilities may force localresidents to travel longer distances in order to access the services and facilities that theyrequire. Very large, centralised settlements may on the other hand lead to longer traveldistances as the separation between homes and the urban centre becomes large. Largesettlements with a very large range of jobs and services may also attract people living longdistances away to travel to them. These factors may all influence travel patterns. Accordingto Owens (1986 p.29) and ECOTEC (1993 p.39) it is unlikely that there is a simplerelationship between settlement size and travel patterns. Banister (1996) argues that adiversity of services and facilities requires a population size of at least 10,000. Barton et al.(1995) share similar views on settlement size thresholds.Orfeuil and Salomon (1993) conclude from their study of French cities that the size of theurban area is associated with a U-shaped distribution of trip lengths. Long trip distances areobserved in rural areas and the largest conurbations, while short distances are observed inmedium-sized cities. In Great Britain, ECOTEC (1993) report that travel distance is highest

122 The Relationships between Urban Form and Travel Patterns
in the smallest category of settlements (containing fewer than 3,000 residents) and traveldistance is lowest in large metropolitan areas (excluding London), according to analysis ofnational travel data. Residents of London travel larger distances on average than the residentsof the six next largest metropolitan areas (West Midlands, Greater Manchester, WestYorkshire, Glasgow, Liverpool and Tyneside). Hillman and Whalley (1983) report similarfindings in their analysis of data from 1978/79 National Travel Survey of Great Britain. Theyalso report that the total distance travelled per person by car is lowest in conurbations(metropolitan areas) and highest in rural areas. The average journey distance by car is alsolowest in conurbations and highest in rural areas. Research by Stead (1999) suggests thattravel distance is often lower in large urban areas containing more than 250,000 residents,after socio-economic differences are taken into account.Figures from research by Gordon et al. (1989a) show no easily identifiable relationshipbetween urban population size and modal choice. In a study of commuting patterns in the tenlargest urbanised areas in the United States, the proportion of car journeys was found to beleast in New York (which has the largest population of the areas studied) and highest inDetroit (which has the sixth largest population of the areas studied).Breheny (1995) uses estimates of typical specific energy consumption by mode and datafrom the 1985/86 National Travel Survey of Great Britain to calculate transport energyconsumption by population size. He reports that transport energy consumption is lowest inmetropolitan areas (excluding London) and highest in the smallest category of settlements(containing fewer than 3,000 residents). Transport energy consumption is one third lowerthan average in the metropolitan areas (excluding London) and more than one third higherthan average in the smallest settlements. Breheny’s work shows that the trends in transportenergy consumption and travel distance trends by settlement size are very similar despitesignificant variations in modal split across different sizes of settlement. Although there aresignificant differences in energy consumption across different sizes of settlement, Brehenyestimates that counter-urbanisation trends between 1961 and 1991 have only beenresponsible for a small increase (approximately 2 per cent) in passenger transport energyconsumption.In summary, there has been a relatively large amount of research concerning the relationshipbetween settlement size and travel patterns. The relationship between settlement size andtravel patterns is unlikely to be simple due to the interplay of competing factors. Evidencefrom Great Britain shows that large metropolitan settlements are associated with low traveldistance and transport energy consumption. Evidence from the ten largest urban areas in theUnited States however shows no easily identifiable relationship between urban populationsize and modal choice.
3.3 The Mixing of Land Uses
The mixing of land uses affects the physical separation of activities and is therefore adeterminant of travel demand. Some evidence suggests that the mixing of land uses is not asimportant as density in influencing travel demand (Owens, 1986; ECOTEC, 1993).Nevertheless the level of mixed use may contribute to travel demand particularly through thedecentralisation of less specialised employment (ECOTEC, 1993). The mixing of land usesis commonly measured using job ratio, the ratio of jobs in the area to workers resident in thatarea.

Dominic Stead and Stephen Marshall 123
Ewing et al. (1996) have investigated the effect of the various land use mix characteristics ontrip generation including the balance of homes and jobs. They report that there is nostatistically significant relationship between the balance of homes and jobs and journeyfrequency. In a study of commuting patterns in San Francisco, Cervero (1989) reports anegative relationship between job ratio and the proportion of journeys undertaken by footand cycle: where there are many more jobs than houses the proportion of journeys by foot orcycle falls. Cervero concedes that the statistical relationship is not very strong but suggeststhat the encouragement of balancing houses and jobs may encourage walking and cycling.Giuliano and Small (1993) question the importance of job ratio on travel patterns and presentthe results of a commuting study in the Los Angeles region to show that job ratio has astatistically significant but relatively small influence on commuting time. They conclude thatattempts to alter the metropolitan structure of land use are likely to have small impacts oncommuting patterns even if jobs and housing became more balanced. Stead (1999) reportsthat higher job ratios are associated with lower travel distance but recognises that is notpossible to achieve high job ratios in all areas (since this would require a surplus of jobs or adeficit of employable residents). In a study of transport energy consumption in variouslocations in Great Britain, Banister et al. (1997) identify a relationship between job ratio andenergy use per trip in one of their case studies (Oxford). An aggregate measure of land usemix (termed ‘diversity’) is examined by Cervero and Kockelman (1997), who report a linkbetween land use mix and total non-work travel distance but no link between land use mixand total distance travelled.To summarise, there are relatively few studies concerning the effect of job ratio on travelpatterns. On first examination evidence from existing research may appear contradictory butthis is not necessarily the case. The three studies summarised above use different measures oftravel patterns in their analysis. Thus it is quite consistent that the relationship between jobratio and modal share (examined by Cervero, 1989) is not the same as the relationshipbetween job ratio and travel time (examined by Giuliano and Small, 1993), job ratio andtravel distance (Stead, 1999) or the relationship between job ratio and transport energy useper trip (examined by Banister et al., 1997).
3.4 The Provision of Local Facilities
The provision of local facilities and services may clearly reduce travel distance and increasethe proportion of short journeys capable of being travelled by non-motorised modes. Littleevidence has been collected on this subject however and some of the precise impacts of localfacilities and services on travel patterns are unknown.Winter and Farthing (1997) report that the provision of local facilities in new residentialdevelopments reduces average trip distances but does not significantly affect the proportionof journeys by foot. Evidence from the same study reported elsewhere indicates that theprovision of local facilities reduces the average journey distance by car (Farthing et al.,1997). ECOTEC (1993, p.47) report from neighbourhood case studies that a clearrelationship emerges between the distance from a local centre, the frequency of its use andaverage journey distance. Hanson (1982) and Stead (1999) report similar findings, showingthat the proximity to local facilities is positively associated with average distance after takinginto account the effects of various socio-economic differences of the areas studied. Hansonalso shows that the provision of local facilities is associated with increased journey

124 The Relationships between Urban Form and Travel Patterns
frequency although the effect of increasing journey frequency is not as strong as the effect ofreducing trip length.Thus, there is broad consensus from these studies about the effects of local facilities andservices on travel patterns. The provision of local facilities may overall contribute to lesstravel overall but might not contribute to any more travel by less energy intensive modes,namely walking and cycling.
3.5 The Density of Development
The density of development is commonly measured in terms of population density and to alesser extent employment density. Much of the research into land use and travel patterns hasfocused on the relationship between population density and travel patterns. ECOTEC (1993p.33) put forward four reasons why population density may be linked to travel patterns.Firstly, higher population densities widen the range of opportunities for the development oflocal personal contacts and activities that can be maintained without resort to motorisedtravel. Secondly, higher population densities widen the range of services that can besupported in the local area, reducing the need to travel long distances. Thirdly, higher densitypatterns of development tend to reduce average distances between homes, services,employment and other opportunities which reduces travel distance. Fourthly, high densitiesmay be more amenable to public transport operation and use and less amenable to carownership and use which have implications for modal choice.Figures derived from ECOTEC (1993, pp.33-34) indicate that average journey distance bycar, bus and rail decreases with increasing population density, whilst the average journeydistance by foot is more or less constant regardless of population density. Hillman andWhalley (1983) report similar findings from their analysis of data from the 1978/79 NationalTravel Survey of Great Britain. They show that the total distance by all modes decreases withincreasing population density and show that residents of very low-density areas (less than 5persons per hectare) travel by car more than twice the distance of residents of high-densityareas (more than 60 persons per hectare). Stead (1999) also reports that low populationdensities are often associated with high travel distances.According to ECOTEC (1993), total journey frequency does not show a clear gradation withpopulation density and there is little variation in trip frequency according to populationdensity. The average journey frequency is reported to be close to 14 journeys per person perweek. The highest trip frequency is 14.8 journeys per person per week in areas wherepopulation density is between 1 and 5 persons per hectare. The lowest trip frequency is 13.0journeys per person per week in areas where population density is more than 50 persons perhectare. Ewing et al. (1996) report that there is a weak significant statistical link between tripfrequency and population density.Figures from ECOTEC (1993) show how modal choice is associated with populationdensity. The proportion of trips by car decreases with increasing population density whilstthe proportion of trips by public transport and foot both increase. Car trips account for 71 percent of journeys in low-density areas (more than 50 persons per hectare) but only 51 per centof trips in high-density areas (less than 1 persons per hectare). There is a fourfold differencein public transport trips and almost a twofold difference in walk trips between very lowdensity areas and very high density areas. Frank and Pivo (1994) show how the proportion ofshopping trips by public transport and the proportion of commuting trips by foot are both

Dominic Stead and Stephen Marshall 125
positively linked with population density. Kitamura et al. (1997) show how populationdensity is linked to the proportion of public transport trips after accounting for socio-economic differences. Gordon et al. (1989a) however produce evidence which shows thatthere is no clear relationship between the proportion of car trips and population density.There are a number of reasons for the apparently contradictory findings of these studies.First, the definitions of density are different in the work of Gordon et al. than in most of theother studies. Second, Gordon et al. (1989a) only focus on journeys to work whereasECOTEC (1993) and Kitamura et al. (1997) examine all journey purposes.Newman and Kenworthy (1989) illustrate the correlation between urban population densityand transport energy consumption in a study of 32 cities from around the world. UsingSwedish data, Næss (1993) also identifies a link between population density and transportenergy consumption.There is much less evidence concerning the relationship between travel patterns andemployment density, a second measure of the intensity of land use and activities. It ispossible that similar relationships between population density and travel patterns existbetween employment density and travel patterns. Frank and Pivo (1994) for example showthat employment density, like population density, is connected to the proportion of publictransport trips for both shopping and work journeys after controlling for socio-economicvariations.In summary, there is a growing body of research that suggests a link between populationdensity and many measures of travel patterns. There is little evidence however of muchvariation in journey frequency by population density. In contrast to the amount of researchinto the relationship between population density and travel patterns, there has been littlerecent research concerning the relationships between employment density and travel patterns.
3.6 Proximity to Main Transport Networks
The proximity to transport networks also influences travel patterns and consequentlytransport energy consumption. Better access to major transport networks, particularly roadand rail networks, increases travel speeds and extends the distance which can be covered in afixed time. Major transport networks can be a powerful influence on the dispersal ofdevelopment – both residential and employment development. The proximity to majortransport networks may lead to travel patterns characterised by long travel distances and hightransport energy consumption.Headicar and Curtis (1994) report that the proximity to major transport networks has asubstantial effect on work travel distance. They conclude that the proximity to either amotorway or a main road is associated with longer travel distances and a higher proportion ofcar journeys. They also report that the proximity to a railway station is associated with longdistance commuting but fewer car journeys. Kitamura et al. (1997) report that the distancefrom home to the nearest bus stop and railway station affects the modal share. Theproportion of car journeys increases and the proportion of non-motorised journeys decreaseswith increasing distance from the nearest bus stop; the proportion of rail journeys increaseswith increasing distance from the nearest railway station. Cervero (1994) shows how theproportion of rail journeys decreases with increasing distance from the railway station.Residents living within 500 feet (approximately 150 metres) of a railway station in Californiatypically use rail for approximately 30 per cent of all journeys. The further the distance from

126 The Relationships between Urban Form and Travel Patterns
the railway station, the lower the proportion of rail journeys is made. Residents living at adistance of around 3,000 feet (approximately 900 metres) from the nearest railway station arelikely to make only about half the number of rail journeys than residents living within 500feet of a railway station. Cervero reports that this pattern of rail use is similar in Washington,Toronto, Edmonton and California. However, Stead (1999) finds little evidence in Britain ofa link between the proximity of homes to a railway station and travel distance.Thus, the proximity to transport networks influences travel patterns and consequentlytransport energy consumption. Better access to major transport networks, particularly roadand rail networks, increases travel speeds and extends the distance which can be covered in afixed time. Major transport networks can be a powerful influence on the dispersal ofdevelopment – both residential and employment development. The proximity to majortransport networks may lead to travel patterns characterised by long travel distances and hightransport energy consumption. The availability of residential car parking is linked to both tripfrequency and modal choice. As the availability of residential car parking increase, theproportion of car journeys increases.
3.7 The Availability of Residential Parking
Evidence from Kitamura et al. (1997) shows that the availability of residential car parking islinked to both trip frequency and modal choice. As the availability of residential car parkingincreases the average number of trips per person decreases: an observation that is perhapscounter-intuitive. Kitamura et al. suggest that residents with more parking spaces makefewer, longer journeys, whilst residents with fewer parking spaces make more journeys butthese tend to be short. It is also reported that as the availability of residential car parkingincreases the proportion of car journeys increases. This would imply that residents with moreparking spaces not only make fewer, longer journeys but also that these journeys are morecar-based. Conversely, the research implies that residents with fewer parking spaces makemore journeys but which are short and less car-based.Balcombe and York (1993) identify a correlation between the availability of residentialparking (expressed as the ratio of vehicles to spaces) and the proportion of car ownersmaking short journeys by foot (in order to retain their parking space). The research indicatesa greater tendency to walk in areas where residential parking is limited. Similarly, Valleley etal. (1997) suggest a relationship between the modal split of commuting and parkingprovision at work. Stead (1999) reports that limited residential parking is associated withlower travel distance and suggests that the limited availability of parking may lead to more‘rational’ car use as residents seek to reduce the number of journeys and hence the number oftimes they have to search for a parking space on their return home. Limited residentialparking may also indirectly contribute to less travel by suppressing car ownership which thestudy identifies as a strong determinant of travel distance. However, Balcombe and York(1993) report that difficulties in finding a parking space may not necessarily deter carownership or intentions to acquire additional vehicles even with increasing parkingproblems.
3.8 Road network type
The form or structure of an urban area may be characterised to some extent by the pattern ofits road network. Road networks may be described using qualitative labels for their overall

Dominic Stead and Stephen Marshall 127
pattern or by descriptions based on some component properties. Qualitative labels can give areasonable intuitive impression of network shape (e.g. grid, radial, and so on), whilecomponent properties are more easily quantified and hence used as the basis for systematiccomparison (e.g. the composition of the network in terms of route type or junction type—seeMarshall, 2001a).Maat (2000) reports the case of Houten, a Dutch town laid out with permeable pedestrian andcycle routes but with deliberately impermeable, circuitous routes for motor traffic. Here,peak period car trip generation was found to be 10 per cent less than the national average,despite car ownership being amongst the highest in the Netherlands. Use of the car forshopping trips was also found to be between 8 and 13 per cent less than in comparable urbanareas (with similar characteristics but different network structure). However, trip distancesfor those (shopping) trips that are made by car are longer than in the comparator cases(Marshall and Banister, 2000).Fleming and Pund (1994) report higher bus occupancy (implying a higher proportion of bususe) in networks which allow more direct access to public transport. However, Messengerand Ewing (1996) report that road network design had no apparent effect on bus use.Elsewhere, Ewing (1996) reports finding no relationship between transit use and streetnetwork design ‘after controlling for other variables such as urban density and servicefrequency’. Ewing also notes that grid-like patterns can be more transit friendly to the extentthat they may allow greater penetration of an area by transit services.Ewing’s study considered to what extent various urban features might be regarded as being‘essential’ or ‘highly desirable’ in terms of contributing to pedestrian and transit friendlydesign. Among the ‘essential’ characteristics were short to medium length blocks (relating tonetwork permeability) and continuous sidewalks (relating to the connectivity of thepedestrian network), while having a grid-like street network was considered highly desirable.Crane and Crepeau (1998) cast doubt on whether the grid pattern has any significant effecton car or pedestrian travel. Indeed, Crane (2000) points out that, to the extent that grids’greater connectivity offers shorter trips, trip frequency may be expected to increase - afinding echoing results of modelling work by McNally and Ryan (1993).The examples here suggest that the ability to single out the effects of road network type perse on travel behaviour may not be straightforward. However, underlying the many contingentfactors, there seems to be a basic inverse relationship between the attractiveness of a modeand the distance travelled by that mode. This means, for example, that a grid layout may beassociated with sustainable travel insofar as it promotes short and direct routes forpedestrians, including pedestrian access to public transport. But, by the same token, a gridmay promote ‘unsustainable’ travel insofar as it allows short, direct routes for car traffic.
3.9 Neighbourhood type
Neighbourhood type is effectively a composite variable that is used to characterise areas ofcities that are relatively homogeneous according to a range of attributes. These attributestypically include the age of development (such as pre-war or post-war), the style ofdevelopment (traditional, conventional or neo-traditional for example) and the street networktype (such as grid or loop and cul-de-sac), as illustrated in Table 2.

128 The Relationships between Urban Form and Travel Patterns
Table 2. A selection of neighbourhood types and their component attributes
Source Neighbourhood types and attributes‘traditional neighborhood development’ ‘conventional suburban development’Kulash (1990)
mixed use connected/gridded streets reduced street hierarchy
segregated uses partially connected streets and cul-de-sacs hierarchical street networks
‘traditional communities’ ‘suburban communities’Friedman et al.(1994) mostly developed before 1940
mixed-use downtown commercialdistrict with significant on-streetparking interconnecting street grid residential neighbourhoods in closeproximity to non-residential landuses
developed since the early 1950’swith segregated land uses well-defined hierarchy of roads access concentrated at a few keypoints relatively little transit service
‘transit neighborhoods’ ‘auto neighborhoods’Cervero andGorham (1995) initially built along a streetcar line or
around a rail station primarily gridded (over 50 per centof intersections four-way or ‘X’intersections) laid out and largely built up before1945
laid out without regard to transit,generally in areas without transitlines, either present or past primarily random street patterns(over 50 per cent of intersectionseither 3-way, ‘T’ intersections or cul-de-sacs) laid out and built up after 1945
‘traditional neighborhood design’ (TND) ‘planned unit development’ (PUD)McNally andKulkarni(1997)1
gridlike transportation networks withfew or no access cul-de-sacs a large number of access points intothe neighbourhood high population densities
circuitous transportation networkswith many cul-de-sacs a very limited number of accesspoints in the neighbourhood very segregated land uses low residential densities
Evidence from Friedman et al. (1994) demonstrated trip frequencies in ‘suburban’neighbourhoods to be some 25 per cent higher than in ‘traditional’ neighbourhoods.Similarly, McNally and Kulkarni (1997) found overall trip rates to be over 30 per cent higherin PUD’s compared with TND’s.Both studies also found the traditional neighbourhoods generating a lower proportion of cartrips. Similarly, Cervero and Gorham (1995) found that for commute trips, ‘transit’neighbourhoods had lower drive-alone modal shares and trip generation rates compared with‘auto’ neighbourhoods. Meanwhile Cervero and Kockelman (1997) found thatneighbourhoods with a high proportion of four-way intersections and limited on-streetparking abutting commercial establishments tended to have on average less drive-alonetravel for non-work purposes.Conversely, TRB (1996) report that transit use may be between 10 and 45 per cent higher in‘transit oriented’ traditional neighbourhoods than in newer ‘auto-oriented’ developments;Friedman et al. (1994) found transit use in ‘traditional’ neighbourhoods to be more than
1 McNally and Kulkarni also identify a third, hybrid category of neighbourhood. The list of attributes given is a
summary of a longer list of network, land use and design variables.

Dominic Stead and Stephen Marshall 129
double that in ‘suburban’ neighbourhoods. Meanwhile, Handy (1992), Friedman et al. (1994)and Cervero and Gorham (1995) all report higher proportions of journeys by foot intraditional or ‘transit’ neighbourhoods compared with suburban or ‘auto’ neighbourhoods.Although these findings may tend to support the commonly recognised association of‘traditional’ neighbourhoods with pedestrian and transit orientation, and ‘conventionalsuburban’ neighbourhoods with car orientation, this does not necessarily imply causalitybetween travel behaviour and either the land use or layout components of theneighbourhoods. This is not least due to the influence of socio-economic factors (a pointexpressly evaluated by McNally and Kulkarni, 1997).
4. Critique
The critique of the literature reviewed is divided into three main sections. The first sectionconcerns issues of data accuracy, reliability and quality. The applicability of various researchmethods is addressed in the second section and the third section concerns issues of datainterpretation.
4.1 Data accuracy, reliability and quality
The question of whether the data is accurate and reliable is fundamental to all research. Thispaper does not attempt to examine the accuracy and reliability of all the studies whose resultsare summarised above. Instead, a number of more general issues concerning data accuracy,reliability and quality, which have been directed to these type of empirical studies, aresummarised.In setting out his critique of two studies authored by Newman and Kenworthy (Newman etal., 1985; Newman and Kenworthy, 1989), Troy (1992) raises a number of issues that arealso applicable to many other studies of land use and travel patterns. The first issue concernsdata accuracy. A number of studies to have examined the effect of land use and travelpatterns have involved the calculation of travel distance from trip zone data. Troy (1992)questions the accuracy of travel distance calculations from trip zone data, where trip lengthsare calculated from average distances between zone centroids. Studies by Spence and Frost(1995) and Banister et al. (1997) also rely on trip zone data to calculate travel distance. Thedistance of each journey is calculated according to the distances between the origin anddestination zone centroids. Depending on the size of zones, the actual travel distance may besignificantly different to the figure calculated using average centroid distances. Thecalculations also do not account for the configuration of the transport network in order toestablish actual route distances, rather than straight-line distances between origin anddestination zones. Since most studies are comparative, however, precise distances are not asimportant as relative distances. Thus, precise calculations of travel are less important thancomparable travel distances that have a similar degree of accuracy for each area.Second, Troy (1992) questions the applicability of average fuel consumption figures tocalculate transport energy consumption, without accounting for factors that affect transportenergy consumption such driving conditions or the time of day. These sort of assumptionsare made in studies by Banister et al. (1997), Breheny (1995) and Næss et al. (1995). Theaverage energy consumption of vehicles is influenced by a number of vehicle, journey and

130 The Relationships between Urban Form and Travel Patterns
passenger characteristics, such as vehicle age, fuel type, engine size, engine temperature,vehicle speed and passenger loading (or occupancy). To account for each of these factors forevery journey would add much complexity to the calculation of energy consumption. Itwould be necessary to establish information about the vehicle age, fuel type, engine size,engine temperature, vehicle speed, and passenger occupancy for every journey. Evidencefrom the National Travel Survey data for Great Britain suggests that factors such as drivingspeed at different times of the day do not show large variations (see section 4.3). Althoughthe use of typical energy consumption values for each mode does not accurately account forthe variation in the vehicle, journey and passenger characteristics of each journey, it doesrepresent a reasonable estimate of transport energy consumption under typical conditions.Third, the issue of the reliability of data from self-completed questionnaires is questioned.Troy (1992 p49) states that there is evidence from several (unspecified) reports to suggestthat this kind of travel diary systematically overstates household travel and understates shorttrips. It is not clear how travel diaries tend to overstate household travel, but it is obvious tosee that short journeys may be under-recorded. Studies based on data from self-completedtravel diaries include Cervero (1994), Cervero and Landis (1992); Curtis (1995), Kitamura etal. (1997), Næss and Sandberg (1996), Næss et al. (1995), Prevedouros and Schofer (1991),Winter and Farthing (1997). Clearly, the issue of under-recorded short journeys is importantwhen considering travel patterns such as trip frequency or the modal share of non-motorisedjourneys, since short journeys may be a significant component. The under-recording of shortjourneys is perhaps of less importance when considering total travel distance or transportenergy consumption, since short trips do not often substantially contribute to these twomeasures of travel.The representativeness of travel data is related to the sample size, the type of journeysrecorded and the time period over which the data is collected. Troy (1992) expresses concernabout the representativeness of travel data collected over a short time, questioning whetherthe typical weekday travel data collected by Newman et al. (1985) provide sufficient travelinformation to calculate annual transport energy consumption. Similar concerns might beexpressed about a number of other studies summarised above. Concerns may also beexpressed about the extent to which studies of single journey purposes (work travel, forexample) can be used to represent all purposes of travel. Commuting in Great Britain, forexample, now accounts for fewer than a quarter of all trips and a similar proportion of totaltravel distance (Department of Environment, Transport and the Regions, 1999). The searchfor more sustainable land use patterns, which is the focus of many recent studies of land useand travel patterns, clearly depends on identifying areas which promote fewer journeys,shorter journeys and non-motorised journeys. These characteristics clearly do not just applyto one type of journey but all types. Thus, the extent to which studies of commuting or othersingle types of journey purpose can identify sustainable land use patterns is only partial.
4.2 Methods of analysis
There are limitations to all methods of analysis and the limitations of empirical studies ofland use and travel patterns have been outlined earlier in the paper. Two issues related to thelimitations of empirical studies are discussed in this section. The first issue concerns thedifficulty in establishing the causality of relationships. The second issue concerns socio-economic factors and the difficulty they pose in making comparisons between different areas.

Dominic Stead and Stephen Marshall 131
Cross-sectional analyses of land use and travel patterns, like the ones contained in the studiesreviewed above, do not easily lend themselves to establishing causal links. Several studiesdemonstrate strong correlations between various measures of land use characteristics andtravel patterns. Such analysis, however, cannot prove a causal relationship, even where highcorrelation is demonstrated. Correlation may identify a link between variables, but this linkmay or may not be direct. It could be that the link is in response to another variable. Even ifthe link is direct, it is not possible to establish the direction of causality. Therefore, a strongcorrelation between transport energy consumption and population density, for example, doesnot imply a direct link between the two variables. The two variables could be linked by oneor more intermediate variables, such as car ownership or income. Similarly, the results ofregression analyses may identify statistical dependence between variables but do not identifya physical relationship between variables. As with correlation analysis, regression analysismay identify a link between variables but this link may or may not be direct.In identifying a link between land use characteristics and travel patterns, it is necessary tohold all other variables constant. This is not easy in empirical research, since different landuse characteristics are often associated with different socio-economic factors, which alsohave an effect on travel patterns. The variation in socio-economic factors increases thedifficulty in establishing the effect of land use characteristics on travel patterns, and addscomplication to the comparison of travel patterns in different areas.A large number of socio-economic factors may influence travel patterns. There is asubstantial amount of literature on this subject. This paper does not present a comprehensivereview of the effects of all socio-economic factors on travel patterns. Instead, it identifies themain types of socio-economic factors and illustrates how each of these main types of factorsmay affect travel patterns. Eleven types of socio-economic factors are identified in this studyfrom the review of literature on travel patterns and socio-economic factors. These eleventypes comprise: income; car ownership and availability; possession of drivers’ licence;working status; employment type; gender; age; household size and composition; level ofeducation; attitudes; personality type. The effects of these factors on travel patterns aresummarised in Figure 2. For a more comprehensive review of the effect of socio-economicfactors on travel patterns, see Damm (1981) or Hanson (1982).These eleven types of socio-economic factors are interconnected, and it is often difficult toseparate the effect of one from another (i.e. they are often multicollinear). Householdincome, for example, is linked to employment type and working status (whether full-time orpart-time; how many members of the household are employed). This may influence carownership and use. Car ownership and use is also influenced by the possession of a driver’slicence, age and gender (Figure 3).Several studies summarised in this review do not explicitly recognise that different land usecharacteristics are associated with different socio-economic factors, which also have aneffect on travel patterns. Consequently, they do not attempt to differentiate between theeffects of land use characteristics and socio-economic factors. Other studies recognise theeffect that socio-economic factors may have on travel patterns but employ a research methodthat does not differentiate between the effects of land use characteristics and socio-economicfactors. ECOTEC (1993), for example, recognise the relationship between populationdensity, lifestyles, income and car ownership but do not attempt to identify the separateeffects of socio-economic factors and land use patterns. They report that:

132 The Relationships between Urban Form and Travel Patterns
Hanson (1982) reports that trip frequency is linked to household income: people in higher income households make more journeysthan in lower income households. Cervero (1996a) shows how commuting distance increases with increasing income. Næss andSandberg (1996) identify a positive link between household income and the total distance travelled per person. Transport energyconsumption is reported to increase as household income increases (Næss, 1993; Næss et al., 1995). Flannelly and McLeod (1989)show how income is linked to the choice of mode for commuting. Income is also linked to land use patterns, which may explainsome of the variation in travel patterns in different locations. Mogridge (1985), for example, shows how average incomes in Parisand London increase with increasing distance from the city centre, with the exception of residents in very central locations (withinapproximately 4 kilometres of the city centre). Kockelman (1997) also reports a positive correlation between travel distance andincome.
Hanson (1982) reports that trip frequency increases with car ownership, whereas Prevedouros and Schofer (1991) contend that caravailability does not explain the variation in trip frequency. Total travel distance is reported to increase with car ownership (Næssand Sandberg, 1996; Kockelman, 1997), as is transport energy consumption (op. cit.) and the proportion of car journeys (Næss,1993). Flannelly and McLeod (1989) show that the number of cars per household is linked to the choice of mode for commuting.Ewing (1995) reports that travel time increases as car ownership levels increase. Like income, car ownership is also linked to landuse patterns, and may explain some of the variation in travel patterns in different locations. Gordon et al. (1989a), Levinson andKumar (1997) and Næss et al. (1995) identify links between car ownership and population density. Higher density areas tend tohave lower levels of car ownership. According to evidence from the United States presented by Gordon et al. (1989a), carownership tends to be lower in larger cities. Other studies show that car ownership increases as the distance from the city centreincreases (Mogridge, 1985; Næss and Sandberg, 1996).
Flannelly and McLeod (1989) show how the possession of a driver’s licence is linked to the choice of mode for commuting. Peoplewho use the bus are likely to come from households where fewer members have a driver’s licence. Interestingly, it is reported thatpeople who share cars to work are likely to come from households with more drivers’ licences than average (op. cit.)
Prevedouros and Schofer (1991) report that work status does not explain the variation in trip frequency. Ewing et al. (1996) reportthat journey frequency increases as the number of workers per household increases. Ewing (1995) reports that average travel timeper person increases as the number of workers per household increases, reflecting the fact that where there is more than one workerin household, home location may not be near to the workplace of each worker
Hanson (1982) reports no difference in total trip frequency according to gender in Sweden. Gordon et al. (1989b) report that thefrequency of non-work trips is higher for women than men in the United States, and that women have shorter work trips than men,regardless of income, occupation, marital and family status.
Hanson (1982) reports no difference between trip frequency and age, whilst Prevedouros and Schofer (1991) report that ageexplains some of the variation in trip frequency. Evidence from Flannelly and McLeod (1989) suggests that age has no significanteffect on the choice of mode for commuting. Næss et al. (1995) report that transport energy consumption increases with increasingage. Banister et al. (1997) report a negative correlation between transport energy consumption and the proportion of childrenwithin each survey group.
According to Hanson (1982), journey frequency increases as household size increases. Evidence from Ewing et al. (1996), Dunphyand Fisher (1996) and Kockelman (1997) supports this finding. Ewing (1995) reports that travel time per person increases ashousehold size increases. Banister et al. (1997) report that household size is negatively correlated with transport energyconsumption.
Evidence from Flannelly and McLeod (1989) suggests that the level of education has no significant effect on the choice of modefor commuting.
Some significant differences in travel patterns are reported according to attitudes to various aspects of urban life (Kitamura et al.,1997). It is reported that higher than average trip frequency is associated not just with pro-car attitudes but also ratherinconsistently with attitudes which are either pro-environment or pro-public transport/ridesharing. Perhaps unsurprisingly, peoplewith pro-public transport attitudes make more journeys by public transport than other people. People with pro-car attitudes tend tomake fewest journeys by public transport and the most journeys by car. People with pro-environment and pro-public transportattitudes make the most non-motorised journeys, whereas people with pro-car attitudes make the fewest non-motorised journeys.Other attitudes to urban life (termed time pressure, urban villager, suburbanite and workaholic) were also investigated by Kitamuraet al. but there were few large differences in travel patterns according to these other attitudes. Flannelly and McLeod (1989)suggest that the choice of mode for commuting is affected by attitudes to travel, such as convenience, reliability, comfort, speed,pleasantness, safety and expense.
Prevedouros (1992) examines the differences in travel patterns according to personality types and reports that trip frequency andtotal distance travelled increases with increasing sociability. Different personality characteristics are associated with differenttypes of home location. The proportion of ‘sociable’ personalities was higher in urban areas and lower in suburban areas. Urbandwellers were therefore more likely to make more trips and travel further than suburban dwellers.
Figure 2. Examples of how socio-economic factors affect travel patterns

Dominic Stead and Stephen Marshall 133
EMPLOYMENTTYPE
EDUCATION
AGE
GENDER DRIVER’SLICENCE
PERSONALITYTYPE
ATTITUDES
HOUSEHOLDSIZE & TYPE
CAROWNERSHIP
WORK STATUS
INCOME
Figure 3. Interactions between socio-economic factors
"...in Britain, there is a strong relationship between the population density ofresidential areas and the average income levels of the residents. Lower income levelsin high density areas will have implications for both lifestyles and levels of carownership. This... warns against making simple conclusions about the independentnature of density and, in particular, on the extent to which a policy favouring higherdensity in new suburban developments will have beneficial effects on travel behaviour.In principle, the effects of density, location and income levels could be separated by astatistical analysis which controls for the latter two variables. However, the necessarydata for this analysis are not available. Some of the data which are available suggeststhat socio-economic factors - and in particular car ownership - are more significantthan density per se in explaining inter-personal and inter-area variations in travelbehaviour."
Several other studies recognise the effect of socio-economic factors and employ researchmethods that attempt to hold socio-economic variables constant in order to observe theeffects of land use and characteristics. These studies tend to have been carried out within thelast decade. Two methods have been employed to hold socio-economic variables constant.The first and more popular approach uses multiple regression analysis, in which socio-economic variables and land use characteristics are treated as explanatory variables(examples include: Cervero, 1989; Ewing, 1995; Ewing et al., 1996; Frank and Pivo, 1994;Kitamura et al., 1997; Næss, 1993; Næss et al., 1995; Næss and Sandberg, 1996;Prevedouros and Schofer, 1991). The method allows identification of the main socio-economic and land use characteristics that are associated with certain travel patterns. Themethod does not, however, allow the identification of causal relationships (as discussedearlier). The second and less popular method employed to hold socio-economic variablesconstant involves the selection of case study areas which have similar socio-economicprofiles but different land use characteristics. In this way, socio-economic differences are

134 The Relationships between Urban Form and Travel Patterns
minimised and the variation in travel patterns is assumed to be the result of land usecharacteristics (examples include Handy, 1992 and Curtis, 1995).Like the interconnection of socio-economic factors, it is also likely that a number of land usecharacteristics are also interrelated. Settlement size, for example, may be linked topopulation density (large cities are denser than small villages), the distance to the urbancentre or the availability of residential parking (Figure 4). Establishing the individual effectsof these characteristics is therefore difficult.
ROADNETWORK
PEDESTRIANNETWORK
P. T.ACCESSIBILITY
AVAILABILITYOF PARKING
DISTANCE TOURBAN CENTRE
JOBRATIO
EMPLOYMENTDENSITY
POPULATIONDENSITY
LOCALFACILITIES
NEIGHBOUR-HOOD TYPE
POPULATIONSIZE
Figure 4. Interactions between land use characteristics
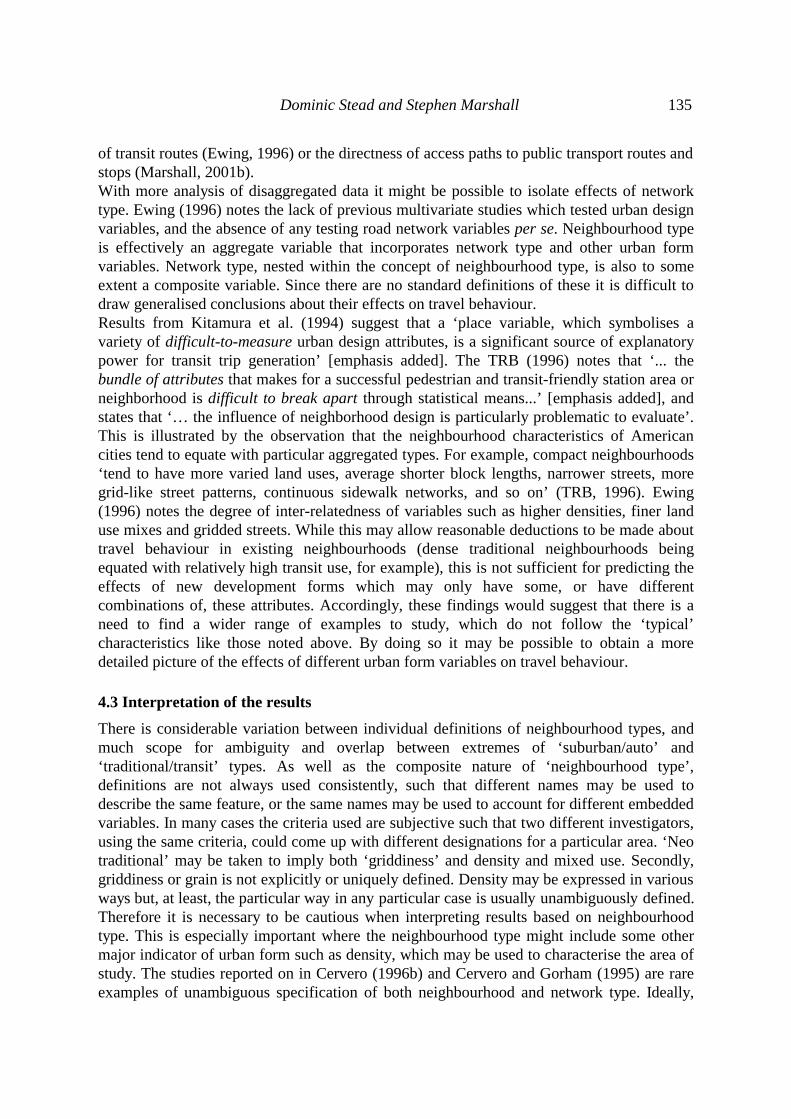
The ability to relate travel behaviour with particular neighbourhood or network types isproblematic. For a start, the terminology used is not standard, leading to use of descriptionsof neighbourhoods or street patterns which may be ambiguous or otherwise not easilyinterpretable. Terms such as ‘clear’ or ‘coherent’ or ‘connected street networks’ are used tocharacterise street pattern, but their precise meaning is not always clear (Marshall, 1998).The Transport Research Board (TRB) Report on Transit and Urban Form notes that it is‘difficult to sort out the effects of land use mix and urban design because they are stronglycorrelated with density’, stating that density has the ‘dominant influence on transit use’(TRB, 1996). The TRB findings suggest that once density is taken into account, urban designmeasures generally do not add much explanatory power. This is attributed to the way inwhich density is characterised as a metric scale ranging over large values, and therefore has a‘natural predictive advantage’ over other variables of urban design which use a nominal scaleor ranking scale.Ewing (1996) sums up the problem: ‘Urban design characteristics may appear insignificantwhen tested individually, but quite significant when combined into an overall ‘pedestrian-friendliness’ measure. Conversely, urban design characteristics may appear significant whenthey are tested alone, but insignificant when tested in combination’. While network type maynot influence travel behaviour per se, network form can affect other factors such as coverage
Dominic Stead and Stephen Marshall 135
of transit routes (Ewing, 1996) or the directness of access paths to public transport routes andstops (Marshall, 2001b).With more analysis of disaggregated data it might be possible to isolate effects of networktype. Ewing (1996) notes the lack of previous multivariate studies which tested urban designvariables, and the absence of any testing road network variables per se. Neighbourhood typeis effectively an aggregate variable that incorporates network type and other urban formvariables. Network type, nested within the concept of neighbourhood type, is also to someextent a composite variable. Since there are no standard definitions of these it is difficult todraw generalised conclusions about their effects on travel behaviour.Results from Kitamura et al. (1994) suggest that a ‘place variable, which symbolises avariety of difficult-to-measure urban design attributes, is a significant source of explanatorypower for transit trip generation’ [emphasis added]. The TRB (1996) notes that ‘... thebundle of attributes that makes for a successful pedestrian and transit-friendly station area orneighborhood is difficult to break apart through statistical means...’ [emphasis added], andstates that ‘… the influence of neighborhood design is particularly problematic to evaluate’.This is illustrated by the observation that the neighbourhood characteristics of Americancities tend to equate with particular aggregated types. For example, compact neighbourhoods‘tend to have more varied land uses, average shorter block lengths, narrower streets, moregrid-like street patterns, continuous sidewalk networks, and so on’ (TRB, 1996). Ewing(1996) notes the degree of inter-relatedness of variables such as higher densities, finer landuse mixes and gridded streets. While this may allow reasonable deductions to be made abouttravel behaviour in existing neighbourhoods (dense traditional neighbourhoods beingequated with relatively high transit use, for example), this is not sufficient for predicting theeffects of new development forms which may only have some, or have differentcombinations of, these attributes. Accordingly, these findings would suggest that there is aneed to find a wider range of examples to study, which do not follow the ‘typical’characteristics like those noted above. By doing so it may be possible to obtain a moredetailed picture of the effects of different urban form variables on travel behaviour.
4.3 Interpretation of the results
There is considerable variation between individual definitions of neighbourhood types, andmuch scope for ambiguity and overlap between extremes of ‘suburban/auto’ and‘traditional/transit’ types. As well as the composite nature of ‘neighbourhood type’,definitions are not always used consistently, such that different names may be used todescribe the same feature, or the same names may be used to account for different embeddedvariables. In many cases the criteria used are subjective such that two different investigators,using the same criteria, could come up with different designations for a particular area. ‘Neotraditional’ may be taken to imply both ‘griddiness’ and density and mixed use. Secondly,griddiness or grain is not explicitly or uniquely defined. Density may be expressed in variousways but, at least, the particular way in any particular case is usually unambiguously defined.Therefore it is necessary to be cautious when interpreting results based on neighbourhoodtype. This is especially important where the neighbourhood type might include some othermajor indicator of urban form such as density, which may be used to characterise the area ofstudy. The studies reported on in Cervero (1996b) and Cervero and Gorham (1995) are rareexamples of unambiguous specification of both neighbourhood and network type. Ideally,

136 The Relationships between Urban Form and Travel Patterns
more detailed investigations into network type need to be undertaken in order to clarify itsrelationship with travel behaviour.It has been shown that there are links between socio-economic characteristics and travelpatterns, as well as between land use characteristics and travel patterns. It is clearly importantthat the effect of land use and socio-economic characteristics are differentiated in theinterpretation of results. Kitamura et al. (1997) conclude that attitudes may be more stronglyassociated with travel patterns than land use characteristics, and suggest that land usepolicies associated with more sustainable travel patterns may not significantly alter traveldemand unless attitudes are also changed.
5. Conclusions
The review has shown that there is a large amount of literature from around the world on therelationships between urban form and travel characteristics. Much of the evidence containedin the review originates in either Western Europe or the United States. Many of these studiesfind that urban form characteristics, ranging from regional to local in scale, have an influenceon travel patterns and consequently the environmental impacts of transport.This review has explicitly categorised the literature according to discrete aspects of urbanform and travel patterns (albeit at the risk of debate over the choice of categories), whichallows for clearer identification of the similarities and differences between studies. However,it is recognised that there is no definitive way of deciding the categories: definitions may beoverlapping or nested within each other and the significance of each variable is likely todepend on context.The critique of these studies has suggested that a number of issues must be taken intoaccount when drawing any conclusions for policy. These issues include the strength of theevidence, the transferability of findings (whether findings in one country apply to another forexample), the scale of analysis (regional, urban or neighbourhood and so on) and thecausality of relationships. The interactions between socio-economic factors, urban form andtravel patterns add further complication to the analysis of relationships between land use andtravel characteristics. This issue has not been well explored to date, although more studiesare now recognising interactions between socio-economic factors, urban form and travelpatterns in their design (see also Stead et al., 2000; Stead, 2001).So the extent to which urban form might influence travel patterns may be lower thanprevious studies have indicated (where they have not taken socio-economic characteristicsinto account). However, this does not mean that urban planning does not have an importantrole to play in helping to achieve more sustainable travel patterns. Planning policies caninfluence transport supply and parking as well as the distribution of land uses, and henceprovide a way of influencing travel demand and/or modal choice ‘at source’. Furthermore,combinations of several land use measures may have significant effects on travel by creatingsynergies between measures, and land use policies may be complemented by the effects ofother, non-land use measures (see Stead, 1999; Stead, 2000). In other words, urban planningis well placed to co-ordinate the variety of factors which individually and collectively areable to influence more sustainable travel patterns.

Dominic Stead and Stephen Marshall 137
Acknowledgments
The authors wish to thank the UK Engineering and Physical Sciences Research Council(EPSRC) who funded the studies that form the basis of this paper.
References
Aldous, T. (1992) Urban Villages. Urban Villages Group, London.
Baker, B. (1995) The role of neighbourhood land use design in influencing transportationactivity. Transportation Planning Systems,Vol. 3, No. 1, pp. 53-74.
Balcombe, R.J. and York, I.O. (1993) The Future of Residential Parking. Transport ResearchLaboratory Report, Crowthorne.
Banister, D. (1996) Energy, quality of life and the environment: the role of transport.Transport Reviews, Vol. 16, No. 1, pp. 23-35.
Banister, D. and Marshall, S. (2000) Encouraging Transport Alternatives: Good Practice inReducing Travel. The Stationery Office, London.
Banister, D.; Watson, S. and Wood C. (1997) Sustainable cities, transport, energy, and urbanform. Environment and Planning B: Planning and Design, Vol. 24, No. 1, pp. 125-143.
Barton, H.; Davies, G. and Guise, R, (1995) Sustainable Settlements – A Guide for Planners,Designers and Developers. Local Government Management Board, Luton.
Berman, M.A. (1996) The transportation effects of neo-traditional development. Journal ofPlanning Literature,Vol. 10, No. 4, pp. 347-363.
Breheny, M. (1995) Counterurbanisation and sustainable urban forms. In: Brotchie, J.; Batty,M.; Blakely, E.; Hall, P. and Newton, P. (eds.). Cities in Competition. Productive andsustainable cities for the 21st century. Longman Australia Pty Ltd., Melbourne. pp. 402-429.
Calthorpe, P. (1993). The Next American Metropolis: Ecology, Community and the AmericanDream. New York: Princeton Architectural Press.
Cervero, R. (1989) Jobs-housing balancing and regional mobility. Journal of the AmericanPlanning Association, Vol. 55, No. 2, pp. 136-150.
Cervero, R. (1994) Transit-based housing in California: evidence on ridership impacts.Transport Policy, Vol. 1, No. 3, pp. 174-183.
Cervero, R. (1996a) Jobs-housing balancing revisited. Journal of the American PlanningAssociation, Vol. 62, No. 4, pp.492-511.
Cervero, R. (1996b) Traditional neighborhoods and commuting in the San Francisco Bayarea. Transportation, Vol. 23, pp. 373-394.
Cervero, R. and Gorham, R (1995) Commuting in transit versus automobile neighborhoods.Journal of the American Planning Association, Vol. 61, No. 2.
Cervero, R. and Kockelman, K (1997) Travel demand and the 3Ds. Transportation ResearchPart D – Transport and Environment, Vol. 2, No. 3, pp. 199-219.

138 The Relationships between Urban Form and Travel Patterns
Cervero, R. and Landis, J. (1992) Suburbanisation of jobs and the journey to work: asubmarket analysis of commuting in the San Francisco Bay area. Journal of AdvancedTransportation, Vol. 26, No. 3, pp.275-297.
Crane, R. (2000) The Influence of Urban Form on Travel: An Interpretive Review. Journalof Planning Literature, Vol. 15, No. 1, pp. 3-23.
Crane, R. and Crepeau, R. (1998) Does neighborhood design influence travel? A behavioralanalysis of travel diary and GIS data. Transportation Research Part D – Transport andEnvironment, Vol. 3, No. 4, pp. 225-238.
Curtis, C. (1995) Reducing the need to travel: strategic housing location and travelbehaviour. In: Earp, J.H.; Headicar, P.; Banister, D. and Curtis, C. Reducing the need totravel: some thoughts on PPG13. Oxford Planning Monographs, Vol. 1, No. 2, pp. 29-47.
Damm, D. (1981) Theory and empirical results: a comparison of recent activity-basedresearch. In: Jones, P. and Carpenter, S. (eds.). Recent Advances in Travel Demand Analysis.Gower, Aldershot. pp. 3-33.
Department of Environment, Transport and the Regions (1999) National Travel Survey1996/98. The Stationery Office, London.
Dunphy, R.T. and Fisher, K. (1996) Transportation, congestion, and density: new insights.Transportation Research Record, Vol. 1552, pp. 89-96.
ECOTEC (1993) Reducing transport emissions through land use planning. HMSO, London.
Ewing, R. (1995) Beyond density, mode choice, and single trips. Transportation Quarterly,Vol. 49, No. 4, pp. 15-24.
Ewing, R. (1996) Pedestrian- and Transit-Friendly Design. Report prepared for the PublicTransit Office, Florida Department of Transportation.
Ewing, R.; DeAnna, M. and Li, S-C. (1996) Land use impacts on trip generation rates.Transportation Research Record, Vol. 1518, pp. 1-6.
Farthing, S.; Winter, J. and Coombes, T. (1997) Travel behaviour and local accessibility toservices and facilities. In: Jenks, M.; Burton, E. and Williams, K. (eds.). The compact city. Asustainable urban form? E. and F.N. Spon, London. pp. 181-189.
Flannelly, K.J. and McLeod, M.S. (1989) A multivariate analysis of socioeconomic andattitudinal factors predicting commuters’ mode of travel. Bulletin of the PsychonomicSociety, Vol. 27, No. 1, pp. 64-66.
Fleming, R. and Pund, G. (1994) The impact of the planning of urban areas on the use andattractiveness of local bus services. Proceedings 17th ARRB Conference, Part 7.
Frank, L. and Pivo, G. (1994) Impacts of mixed use and density on utilization of three modesof travel: single-occupant vehicle, transit, and walking. Transportation Research Record,Vol. 1466, pp. 44-52.
Friedman, B.; Gordon, S. and Peers, J. (1994) Effect of neotraditional neighborhood designon travel characteristics. Transportation Research Record, Vol. 1466, pp. 63-70.

Dominic Stead and Stephen Marshall 139
Giuliano, G. and Small, K. (1993) Is the journey to work explained by urban structure?Urban Studies, Vol. 30, No. 9, pp. 1485-1500.
Gordon, P.; Kumar, A. and Richardson, H.W. (1989a) Congestion, changing metropolitanstructure and city size in the United States. International Regional Science Review, Vol. 12,No. 1, pp. 45-56.
Gordon, P.; Kumar, A. and Richardson, H.W. (1989b) Gender differences in metropolitantravel behaviour. Regional Studies, Vol. 23, No. 6, pp. 499-510.
Gordon, P.; Richardson, H.W. and Jun, M-J. (1991) The commuting paradox: evidence fromthe top twenty. Journal of the American Planning Association, Vol. 57, No. 4, pp. 416-420.
Handy, S. (1992) Regional versus local accessibility. Neotraditional development and itsimplications for non-work travel. Built Environment, Vol. 18, No. 4, pp. 253-267.
Handy, S. (1996) Urban form and pedestrian choices: study of Austin neighborhoods.Transportation Research Record, Vol. 1552, pp. 135-144.
Hanson, S. (1982) The determinants of daily travel-activity patterns: relative location andsociodemographic factors. Urban Geography, Vol. 3, No. 3, pp. 179-202.
Headicar, P. and Curtis, C. (1994) Residential development and car-based travel: doeslocation make a difference? Proceedings of Seminar C – Environmental Issues, 22nd PTRCEuropean Transport Forum, Warwick, September. pp. 117-130.
Hillman M. and Whalley, A. (1983) Energy and personal travel: obstacles to conservation.Policy Studies Institute, London.
Johnston-Anumonwo, I. (1992) The influence of household type on gender differences inwork trip distance. Professional Geographer, Vol. 44, No. 2, pp. 161-169.
Kenworthy, J. and Laube, F. (1999) A global review of energy use in urban transportationsystems and its implications for urban transport and land use policy. TransportationQuarterly, Vol. 53, No. 4, pp. 23-48.
Kitamura, R.; Laidet, L.; Mokhtarian, P.; Buckinger, C. and Gianelli, F. (1994) Mobility andLivable Communities. State of California Air Resource Board.
Kitamura, R.; Mokhtarian, P. and Laidet, L. (1997) A micro-analysis of land use and travelin five neighbourhoods in the San Francisco Bay area. Transportation, Vol. 24, pp. 125-158.
Kockelman, K. (1997) Travel behavior as a function of accessibility, land use mixing, andland use balance – evidence from the San Francisco Bay area. Transportation ResearchRecord, Vol. 1607, pp. 116-125.
Kulash, W. M. (1990) Traditional neighbourhood development: Will traffic work? Paperpresented at the Eleventh International Pedestrian Conference, Bellevue, WA.
Levinson, D.M. and Kumar, A. (1997) Density and the journey to work. Growth andChange, Vol. 28, pp. 147-172.
Maat, C. (2000) Travel reduction ‘built in’: the role of land use planning. In: Banister, D. andMarshall, S., Encouraging Transport Alternatives: Good Practice in Reducing Travel. TheStationery Office, London, pp. 42-51.

140 The Relationships between Urban Form and Travel Patterns
Marshall, S. (1998) Towards the integration of urban transport networks and urban design,Paper presented at the 8th World Conference on Transport Research, Antwerp, Belgium, July1998.
Marshall, S. (2001a) Transport and the design of urban structure, Unpublished PhD Thesis.Bartlett School of Planning, University College London.
Marshall, S. (2001b) Public transport oriented urban design. In: Verhoef, E. and Feitelson, E.(eds.) Transport and Environment: Towards Sustainable Solutions. Edward Elgar,Cheltenham (forthcoming).
Marshall, S. and Banister, D. (2000) Travel reduction strategies: intentions and outcomes.Transportation Research Part A – Policy and Practice. Vol. 34, No. 3, pp. 321-338.
McNally, M. G. and Kulkarni, A. (1997) Assessment of influence of land use–transportationsystem on travel behavior. Transportation Research Record, Vol. 1607, pp. 105-115.
McNally, M. G. and Ryan, S. (1993) A comparative assessment of travel characteristics forneotraditional developments. Transportation Research Record, Vol. 1400, pp. 67-77.
Messenger, T. and Ewing, R. (1996) Transit-oriented development in the sun belt.Transportation Research Record, Vol. 1552, pp. 145-153.
Mogridge, M.J.H. (1985) Transport, land use and energy interaction. Urban Studies, Vol. 22,No. 6, pp. 481-492.
Næss, P. (1993) Transportation energy in Swedish towns and regions. Scandinavian Housingand Planning Research, Vol. 10, No. 4, pp. 187-206.
Næss, P. and Sandberg, S.L. (1996) Workplace location, modal split and energy use forcommuting trips. Urban Studies, Vol. 33, No. 3, pp. 557-580.
Næss, P.; Røe, P.G. and Larsen, S. (1995) Travelling distances, modal split andtransportation energy in thirty residential areas in Oslo. Journal of Environmental Planningand Management, Vol. 38, No. 3, pp. 349-370.
Newman P.W.G. and Kenworthy, J.R. (1989) Cities and automobile dependence. Aninternational sourcebook. Gower Technical, Aldershot.
Newman, P.W.G. and Kenworthy, J.R. (1988) The transport energy trade-off: fuel efficienttraffic versus fuel-efficient cities. Transportation Research, Vol. 22A, No. 3, pp. 163-174.
Newman, P.W.G.; Kenworthy, J.R. and Lyons, T.J. (1985) Transport energy use in the Perthmetropolitan region: some urban policy implications. Urban Policy and Research, Vol. 3,No. 2, pp. 4-15.
Orfeuil, J. and Salomon, I. (1993) Travel patterns of Europeans in everyday life. In:Salomon, I., Bovy, P. and Orfeuil, J. (eds.) A Billion Trips per Day – Tradition andTransition in European Travel Patterns. Kluwer Academic Press, Dordrecht.
Owens, S. (1986) Energy Planning and Urban Form. Pion, London.
Prevedouros, P.D. (1992) Associations of personality characteristics with transport behaviorand residence location decisions. Transportation Research Part A – Policy and Practice,Vol. 26, No. 5, pp. 381-391.
Dominic Stead and Stephen Marshall 141
Prevedouros, P.D. and Schofer, J. (1991) Trip characteristics and travel patterns of suburbanresidents. Transportation Research Record, Vol. 1328, pp. 49-57.
Rutherford, G. S.; McCormack, E. and Wilkinson, M. (1996) Travel Impacts of Urban Form:Implications from an Analysis of Two Seattle Area Travel Diaries. Paper presented at theTravel Improvement Program Conference on Urban Design, Telecommuting and TravelBehavior, Williamsburg VA.
Ryan, S. and McNally, M. G. (1995) Accessibility of neotraditional neighborhoods: a reviewof design concepts, policies, and recent literature. Transportation Research Part A – Policyand Practice, Vol. 29, No. 2, pp. 87-105.
Spence, N. and Frost, M. (1995) Work travel responses to changing workplaces andchanging residences. In: Brotchie, J.; Batty, M.; Blakely, E.; Hall, P. and Newton, P. (eds.)Cities in Competition. Productive and sustainable cities for the 21st century. LongmanAustralia Pty Ltd., Melbourne. pp. 359-381.
Stead, D. (1999) Planning for less travel – identifying land use characteristics associatedwith more sustainable travel patterns. Unpublished PhD Thesis, Bartlett School of Planning,University College London, London.
Stead, D. (2000) Unsustainable Settlements. In: Barton, H. (ed.). Sustainable Communities.The Potential for Eco-Neighbourhoods. Earthscan, London, pp.29-45.
Stead, D. (2001) Relationships between land use, socio-economic factors and travel patternsin Britain. Environment and Planning B, Vol. 28, No 4, pp. 499-528.
Stead, D.; Titheridge, H. and Williams, J. (2000) Land use, transport and people –identifying the connections. In: Jenks, M.; Burton, E. and Williams, K. (eds.). AchievingSustainable Urban Form. E. and F.N. Spon, London, pp.174-186.
Transportation Research Board (1996) TCRP Report 16: Transit and Urban Form. NationalAcademy Press, Washington DC.
Troy, P.N. (1992) Let’s look at that again. Urban Policy and Research, Vol. 10, No. 1, pp.41-49.
Valleley, M.; Jones, P.; Wofinden, D. and Flack, S. (1997) The role of parking standards insustainable development. Proceedings of Seminar C – Policy, Planning and Sustainability,25th PTRC European Transport Forum, Uxbridge, September. pp. 393-411.
Webster, F.V.; Bly, P.H. and Paulley, N.J. (1988) Urban Land-Use and TransportInteraction: Policies and Models. Gower, Aldershot.
Wegener, M. (1994) Operational urban models: state of the art. Journal of the AmericanPlanning Association, Vol. 60, No. 1, pp. 17-29.
Wilson, A.G. (1998) Land-use/transport interaction models: past and future. Journal ofTransport Economics and Policy, Vol. 32, No. 1, pp. 3-27.
Winter, J. and Farthing, S. (1997) Coordinating facility provision and new housingdevelopment: impacts on car and local facility use. In: Farthing, S.M. (ed.) Evaluating LocalEnvironmental Policy. Avebury, Aldershot, pp. 159-179.