Embed Size (px)
Citation preview


EXPLANATORY NOTES
The Major Fruit Crops Quarterly Bulletin provides updates on production, area and bearing trees statistics of four (4) major fruits, namely, banana, mango, pineapple and calamansi. These crops are highlighted in the report on the Performance of Agriculture which is released quarterly by the Bureau of Agricultural Statistics (BAS). This 2nd quarter 2011 issue of the Bulletin final estimates of production in January-March 2011, preliminary estimates of production in April-June 2011, preliminary estimates of production, area planted and number of bearing trees in January-June 2011. The source of data is the quarterly Crops Production Survey (CrPS) of the BAS.
April-June 2011
Banana. Total production for the 2nd quarter of 2011 declined by 0.32 percent
to 2,512 thousand mt from the level of 2,520 thousand mt in the same period
of 2010 (Table 1). This was mainly due to damages brought by typhoons in
Luzon. The production loss was largely contributed by Cagayan Valley which
recorded a 22.29 percent contraction in output, equivalent to about 40
thousand mt (Table 3). A large number of bearing hills in this region were
destroyed by Typhoon Juan last November and have not yet fully recovered.
Bicol Region also suffered production losses of 4.86 percent due to Typhoon
Bebeng. In Mindanao, Caraga’s production fell by 9.34 percent due to low yield
and cutting of less productive while in Northern Mindanao, production went
down by 2.17 percent because some farmers in Lanao del Norte joined the
coconut planting program of the Philippine Coconut Authority (PCA).
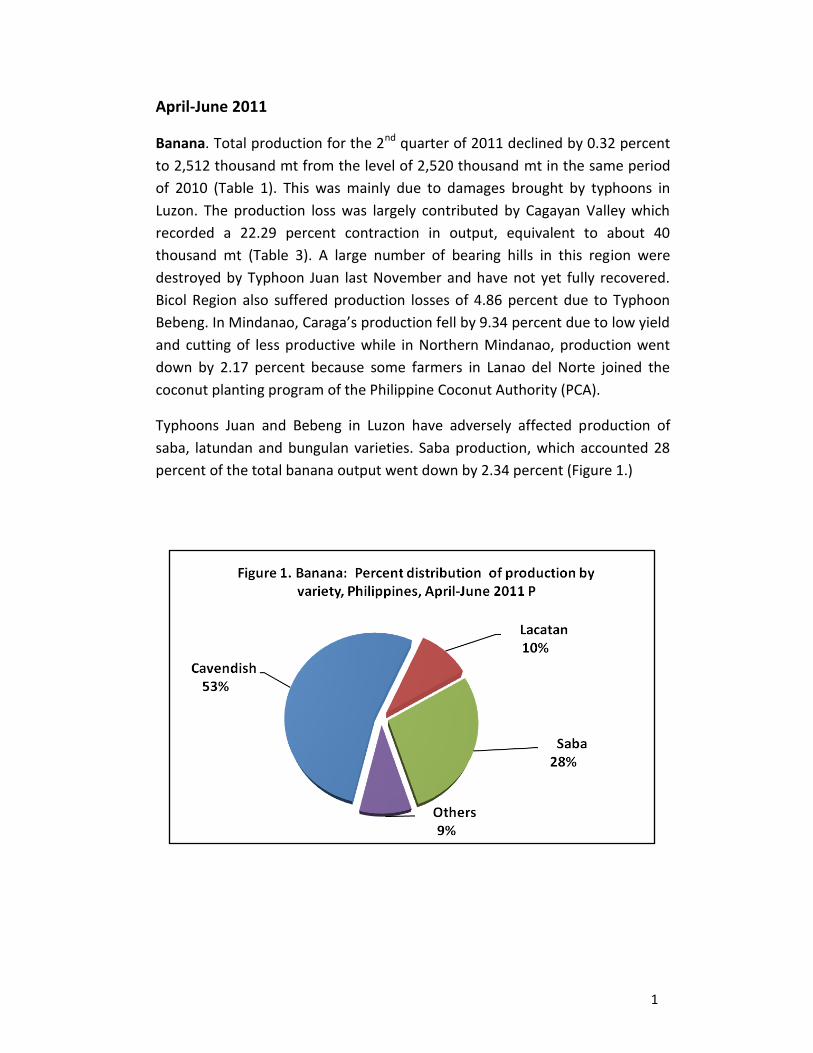
Typhoons Juan and Bebeng in Luzon have adversely affected production of
saba, latundan and bungulan varieties. Saba production, which accounted 28
percent of the total banana output went down by 2.34 percent (Figure 1.)
1

Figure 2. Banana production by region, Philippines, April-June 2011P
Source of Base Map: Bureau of Animal Industry (BAI)
2

Cavendish and lacatan variety with respective shares of 53 percent and 10
percent in total banana production, increased by 0.90 percent and 0.56
percent, respectively. The increases were attributed to increased number of
bearing hills and harvest area in Davao Region, additional area in plantation
farms of STANFILCO in SOCCSKSARGEN and higher yield in ARMM.
Banana production by region for the 2nd quarter of 2011 was shown in Figure 2.
Most of the big banana producers were located in Mindanao, namely, Davao
Region, Northern Mindanao, SOCCSKSARGEN, and ARMM. Cagayan Valley was the
only top producing region from Luzon during the 2nd quarter. CAR, Ilocos Region,
Central Luzon and Bicol Region produced less than 20,000 mt each during the
quarter.
Calamansi. Production in the 2nd quarter of 2011 was recorded at 23,515 mt. This
was lower by 0.27 percent compared to last year’s output of 23,579 mt (Table 1).
The early onset of the rainy season adversely affected the calamansi trees in
MIMAROPA, Caraga and other regions. In Davao Region, production was 8.57
lower than last year’s output of 2,160 mt due to land conversion. The
increased mining activities in this region also affected the availability of hired
labor for the maintenance of calamansi farms (Table 4).
MIMAROPA recorded the highest calamansi output in the 2nd quarter of 2011
(Figure 3). More than 4,000 mt of calamansi were produced in this region,
accounting for 45 percent of the national production. Other major producing
regions were Central Luzon and Zamboang Peninsula with production ranging
from 2,001 mt to 3,000 mt during the 2nd quarter of 2011. In the Visayas
regions, production was less than 1,000 mt. CAR, Ilocos Region, CALABARZON,
Bicol Region, Northern Mindanao, Caraga and ARMM also recorded production
of below 1,000 mt each during the 2nd quarter of 2011.
3

Figure 3. Calamansi production by region, Philippines, April-June 2011P
Source of Base Map: Bureau of Animal Industry (BAI)
4

Mango. Total mango production fell by 4.87 percent to 687,469 mt in the 2nd
quarter of 2011 (Table 1). Carabao variety which comprised 81 percent of the
total production went down by 5.27 percent to 423, 853 mt (figure 4). Flower
induction was observed to have slowed down during the cropping season due
to unpredictable weather and high costs of inputs. Zamboanga Peninsula,
CALABARZON, MIMAROPA and Central Luzon managed to post increases but
these were not sufficient to offset the production losses in other regions.
The bulk of the country’s mango production came from Luzon, specifically, in
Ilocos Region which produced more than 100,000 mt of mangoes. However,
the production levels in Mindanao especially in Zamboanga Peninsula and
SOCCSKSARGEN were not far behind the performance in Central Luzon and
CALABARZON (Figure 5).
5

Figure 5. Mango production, by region, Philippines, April-June 2011P
Source of Base Map: Bureau of Animal Industry (BAI)
6
Source of Base Map: Bureau of Animal Industry (BAI)
Pineapple. Total production of pineapple during the 2nd quarter of 2011
was estimated at 614,146 mt, up by 8.55 percent from 2010 (Table 1). The
increase was attributed to larger area harvested in corporate farms such as
Del Monte, Lapanday, Mt. Kitanglad Agri-Development Corp (MKDC), Asian
Hybrid, Davao Ventures Corporation (DAVCO) and Dole in Northern
Mindanao.
Production in Northern Mindanao during the 2nd quarter of 2011 reached
293,551 mt, 19.60 percent higher than the 245,442 mt posted a year ago
(table 6). It recorded the highest pineapple production during the reporting
period, sharing 48 percent of the national production (Figure 6). In Davao
Region, pineapple production also increased significantly by 31.47 percent
because of higher yield in replanted areas in Davao City. Bigger fruits were
harvested in Western and Central Visayas as a result of sufficient soil
moisture. Pineapple production in Bicol Region improved by 4.89 percent
due to recovery from dry spell.
7

Figure 6. Pineapple production, by region, Philippines, April-June 2011P
Source of Base Map: Bureau of Animal Industry (BAI)
Source of Base Map: Bureau of Animal Industry (BAI)
8

January-June 2011
Banana. Production in the first half of 2011 was 4,619 thousand mt, 1.04
percent above than its year ago level. Production of cavendish and lacatan
varieties increased by 2.20 percent and 1.88 percent, respectively. The growth
in cavendish production was attributed to the continues expansion of
commercial farms in Mindanao.
Area planted to banana during the first half of 2011 was 446,662 hectares, 0.47
percent over the 444,580 hectares in 2010. Number of bearing hills went up by
1.45 percent, from 270.507 million hills in 2010 to 274.435 million hills in 2011.
Calamansi. The January-June production was reported at 44,233 mt, lower by
0.84 percent compared to the previous year’s recordd of 44,608 mt. Land
conversions in Davao Region as well as the unfavourable weather in
MIMAROPA caused the decrease in production. Area planted to calamansi
grew by 0.86 percent to 21,006 hectares in 2011. The number of bearing trees
also increased by 2.41 percent to 9.246 million trees from 9.029 million trees
the previous year.
Mango. Total production for the first six(6) months of the year was down by
5.26 percent. From 725,642 mt recorded in 2010, it went down to 687,469 mt
in 2011. Fewer harvests were reported during the period due to the
unpredictable weather and the early onset of the rainy season which
prevented farmers to induced trees.
Area planted to mango decreased by 0.33 percent, to 186,671 hectares. On the
other hand, the number of bearing trees increased by 1.33 percent, to 8.443
million trees.
Pineapple. Production improved by 3.17 percent during the first half of 2011
as a result of area expansion last year in Northern Mindanao and recovery
from dry spell of pineapple areas in Bicol Region. The total national production
was 1,098 thousand mt in 2011 while it was 1,064 thousand mt last year. Area
planted to pineapple was 57,375 hectares in 2011, 1.34 percent lower than the
58,153 hectares in the previous year.
9

T A B L E S

Table 1. Fruit Crops: Production, Philippines, 2010, January-March, April-June, and January-June, 2010-2011P
Table 2. Fruit Crops: Area Planted and Bearing Trees/Hills, Philippines, 2010, January-June 2010-2011P
11
Jan-Mar Apr-Jun Jan-Jun
2010 2011F 2010 2011P 2010 2011P 2011F/2010 2011P/2010 2011P/2010
Banana 9,101,341 2,051,387 2,107,161 2,519,968 2,511,842 4,571,355 4,619,003 2.72 (0.32) 1.04
Cavendish 4,600,617 1,043,535 1,083,634 1,321,017 1,332,906 2,364,552 2,416,539 3.84 0.90 2.20
Lacatan 921,602 198,633 205,583 242,967 244,324 441,600 449,906 3.50 0.56 1.88
Saba 2,632,692 587,717 594,232 723,043 706,152 1,310,760 1,300,384 1.11 (2.34) (0.79)
Calamansi 188,340 21,029 20,718 23,579 23,515 44,608 44,233 (1.48) (0.27) (0.84)
Mango 825,676 175,479 164,118 550,164 523,351 725,642 687,469 (6.47) (4.87) (5.26)
Carabao 669,520 147,437 137,189 447,434 423,853 594,870 561,042 (6.95) (5.27) (5.69)
Pineapple 2,169,233 497,988 483,303 565,783 614,146 1,063,771 1,097,449 (2.95) 8.55 3.17
P - Preliminary, F - Final
January-March April-June
% Change
CROP 2010
Production (mt)
January-June
% ChangeJan-Jun
2010 2011P 2011P/2010
Area (Ha)Banana 449,443 444,580 446,662 0.47 Cavendish 79,642 78,783 79,888 1.40 Lacatan 56,579 54,688 56,348 3.03 Saba 185,800 184,766 184,713 (0.03)
Calamansi 20,987 20,828 21,006 0.86Mango 189,437 187,286 186,671 (0.33) Carabao 147,026 144,986 145,226 0.17Pineapple 58,547 58,153 57,375 (1.34)
Bearing Trees/Hills
Banana 276,405,963 270,507,136 274,435,118 1.45
Cavendish 112,902,991 110,555,417 112,980,722 2.19
Lacatan 31,804,423 30,422,598 31,395,421 3.20
Saba 78,584,660 77,103,142 77,395,287 0.38
Calamansi 9,163,050 9,028,859 9,246,012 2.41
Mango 8,526,816 8,332,798 8,443,822 1.33
Carabao 6,228,015 6,044,136 6,179,638 2.24
P - Preliminary
2009 and July-December 2009-2010FCrop January-June
Area planted/Bearing Trees
2010

Table 3. Banana Volume of production in metric tons by region, Philippines, 2010, January-March, April-June, and January-June, 2010-2011P
Jan-Mar Apr-Jun Jan-Jun
2010 2011 2010 2011P 2010 2011P 2011F/2010 2011P/2010 2011P/2010
PHILIPPINES 9,101,341 2,051,387 2,107,161 2,519,968 2,511,842 4,571,355 4,619,003 2.72 (0.32) 1.04
CAR 25,669 5,760 5,682 6,430 6,512 12,190 12,195 (1.35) 1.28 0.04
Ilocos Region (I) 41,220 10,358 10,896 10,161 10,134 20,520 21,031 5.19 (0.26) 2.49
Cagayan Valley (II) 368,074 46,222 33,456 181,399 140,968 227,621 174,424 (27.62) (22.29) (23.37)
Central Luzon (III) 58,216 14,402 14,275 15,393 15,502 29,795 29,777 (0.88) 0.71 (0.06)
CALABARZON (IV-A) 105,842 11,929 12,739 44,052 44,750 55,981 57,489 6.79 1.58 2.69
MIMAROPA (IV-B) 210,383 46,645 49,402 45,221 47,161 91,866 96,563 5.91 4.29 5.11
Bicol Region (V) 77,892 16,961 17,319 15,516 14,761 32,476 32,080 2.11 (4.86) (1.22)
Western Visayas (VI) 332,178 104,790 107,581 72,462 75,153 177,252 182,733 2.66 3.71 3.09
Central Visayas (VII) 182,323 62,375 65,311 42,066 47,071 104,441 112,382 4.71 11.90 7.60
Eastern Visayas (VIII) 278,306 69,630 68,895 67,679 67,919 137,309 136,813 (1.06) 0.35 (0.36)
Zamboanga Peninsula (IX) 263,643 39,846 38,450 53,858 54,707 93,704 93,157 (3.50) 1.58 (0.58)
Northern Mindanao (X) 1,702,392 420,813 450,105 389,686 381,227 810,499 831,332 6.96 (2.17) 2.57
Davao Region (XI) 3,804,460 793,118 805,746 1,171,625 1,191,683 1,964,743 1,997,429 1.59 1.71 1.66
SOCCSKSARGEN (XII) 1,043,811 257,556 271,297 248,639 262,906 506,195 534,203 5.34 5.74 5.53
ARMM 396,539 101,456 109,539 101,196 101,899 202,652 211,437 7.97 0.69 4.34
Caraga 210,393 49,526 46,470 54,586 49,488 104,112 95,957 (6.17) (9.34) (7.83)
P - Preliminary, F - Final
% Change
April-JuneJanuary-MarchRegion2010
Production (mt)
January-June
12

Table 4. Calamansi: Volume of production in metric tons by region, Philippines, 2010, January-March, April-June, and January-June, 2010-2011P
13
Jan-Mar Apr-Jun Jan-Jun
2010 2011 2010 2011P 2010 2011P 2010F/2009 2011P/2010 2011P/2010
PHILIPPINES 188,340 21,029 20,718 23,579 23,515 44,608 44,233 (1.48) (0.27) (0.84)
CAR 421 120 121 90 89 211 211 0.95 (1.10) 0.07
Ilocos Region (I) 3,312 709 728 835 854 1,544 1,583 2.79 2.29 2.52
Cagayan Valley (II) 7,253 634 676 1,877 1,866 2,511 2,542 6.58 (0.60) 1.21
Central Luzon (III) 10,301 2,519 2,540 2,237 2,219 4,756 4,759 0.83 (0.81) 0.06
CALABARZON (IV-A) 15,328 3,767 3,853 417 544 4,184 4,396 2.26 30.44 5.07
MIMAROPA (IV-B) 109,612 5,271 5,213 10,746 10,581 16,017 15,794 (1.10) (1.54) (1.39)
Bicol Region (V) 2,287 299 286 247 241 546 527 (4.54) (2.48) (3.61)
Western Visayas (VI) 6,162 1,741 1,609 796 685 2,537 2,294 (7.58) (13.96) (9.58)
Central Visayas (VII) 1,159 205 198 345 353 550 552 (3.50) 2.49 0.26
Eastern Visayas (VIII) 2,467 571 564 167 165 738 730 (1.23) (0.98) (1.17)
Zamboanga Peninsula (IX) 5,748 459 461 1,731 2,037 2,190 2,499 0.51 17.70 14.10
Northern Mindanao (X) 1,295 193 190 290 283 482 473 (1.55) (2.20) (1.94)
Davao Region (XI) 10,062 2,309 2,085 2,160 1,975 4,468 4,060 (9.67) (8.57) (9.14)
SOCCSKSARGEN (XII) 6,777 1,396 1,390 1,092 1,106 2,488 2,496 (0.43) 1.23 0.30
ARMM 1,213 162 170 117 127 279 297 5.01 8.31 6.39
Caraga 4,943 671 631 432 390 1,103 1,022 (5.91) (9.70) (7.40)
P - Preliminary, F - Final
Region
% Change
2010January-March April-June January-June
Production (mt)
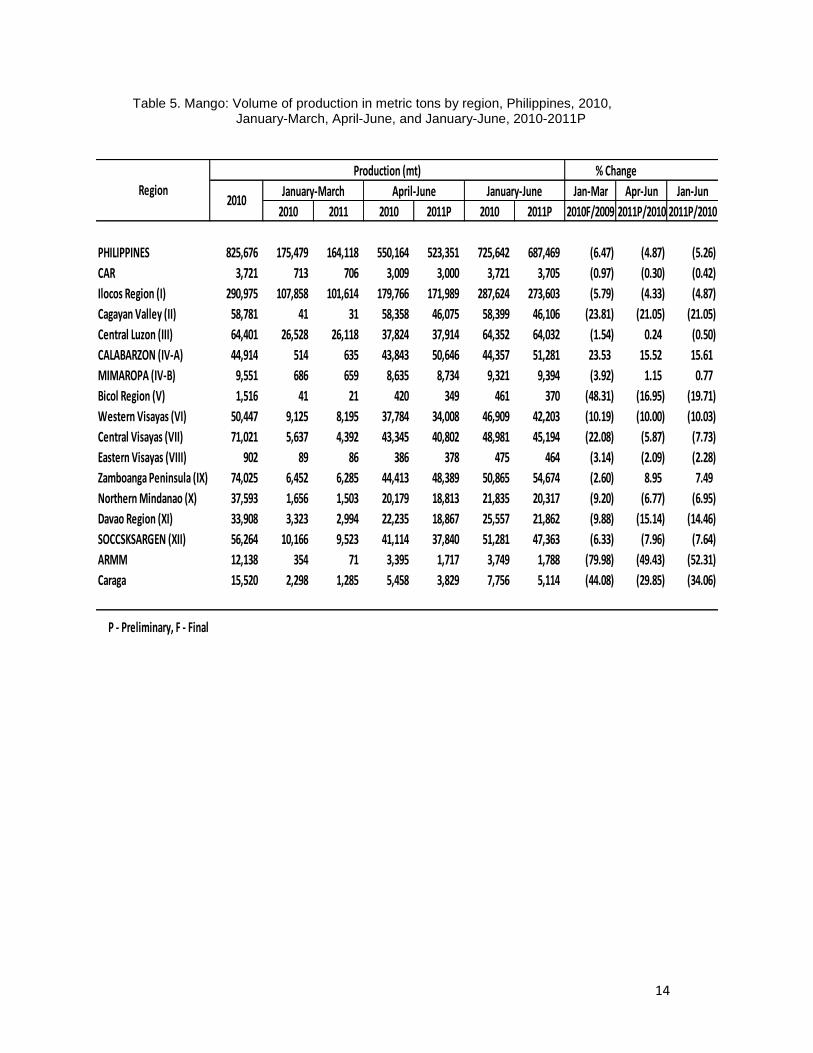
Table 5. Mango: Volume of production in metric tons by region, Philippines, 2010, January-March, April-June, and January-June, 2010-2011P
14
Jan-Mar Apr-Jun Jan-Jun
2010 2011 2010 2011P 2010 2011P 2010F/2009 2011P/2010 2011P/2010
PHILIPPINES 825,676 175,479 164,118 550,164 523,351 725,642 687,469 (6.47) (4.87) (5.26)
CAR 3,721 713 706 3,009 3,000 3,721 3,705 (0.97) (0.30) (0.42)
Ilocos Region (I) 290,975 107,858 101,614 179,766 171,989 287,624 273,603 (5.79) (4.33) (4.87)
Cagayan Valley (II) 58,781 41 31 58,358 46,075 58,399 46,106 (23.81) (21.05) (21.05)
Central Luzon (III) 64,401 26,528 26,118 37,824 37,914 64,352 64,032 (1.54) 0.24 (0.50)
CALABARZON (IV-A) 44,914 514 635 43,843 50,646 44,357 51,281 23.53 15.52 15.61
MIMAROPA (IV-B) 9,551 686 659 8,635 8,734 9,321 9,394 (3.92) 1.15 0.77
Bicol Region (V) 1,516 41 21 420 349 461 370 (48.31) (16.95) (19.71)
Western Visayas (VI) 50,447 9,125 8,195 37,784 34,008 46,909 42,203 (10.19) (10.00) (10.03)
Central Visayas (VII) 71,021 5,637 4,392 43,345 40,802 48,981 45,194 (22.08) (5.87) (7.73)
Eastern Visayas (VIII) 902 89 86 386 378 475 464 (3.14) (2.09) (2.28)
Zamboanga Peninsula (IX) 74,025 6,452 6,285 44,413 48,389 50,865 54,674 (2.60) 8.95 7.49
Northern Mindanao (X) 37,593 1,656 1,503 20,179 18,813 21,835 20,317 (9.20) (6.77) (6.95)
Davao Region (XI) 33,908 3,323 2,994 22,235 18,867 25,557 21,862 (9.88) (15.14) (14.46)
SOCCSKSARGEN (XII) 56,264 10,166 9,523 41,114 37,840 51,281 47,363 (6.33) (7.96) (7.64)
ARMM 12,138 354 71 3,395 1,717 3,749 1,788 (79.98) (49.43) (52.31)
Caraga 15,520 2,298 1,285 5,458 3,829 7,756 5,114 (44.08) (29.85) (34.06)
P - Preliminary, F - Final
Region
% Change
2010January-March April-June January-June
Production (mt)

Table 6. Pineapple: Volume of production in metric tons by region, Philippines, 2010, January-March, April-June, and January-June, 2010-2011P
15
Jan-Mar Apr-Jun Apr-Jun
2010 2011 2010 2011P 2010 2011P 2010F/2009 2011P/2010 2011P/2010
PHILIPPINES 2,169,233 497,988 483,303 565,783 614,146 1,063,771 1,097,449 (2.95) 8.55 3.17
CAR 683 76 77 401 404 477 481 1.05 0.66 0.72
Ilocos Region (I) 195 16 15 102 101 118 116 (4.82) (1.12) (1.61)
Cagayan Valley (II) 29,375 900 800 18,815 14,677 19,715 15,477 (11.11) (21.99) (21.50)
Central Luzon (III) 1,452 18 13 1,181 1,172 1,199 1,184 (28.57) (0.80) (1.20)
CALABARZON (IV-A) 87,561 11,845 11,323 57,528 56,515 69,373 67,838 (4.41) (1.76) (2.21)
MIMAROPA (IV-B) 252 63 81 121 139 184 219 28.82 14.12 19.12
Bicol Region (V) 112,205 25,602 26,514 33,163 34,786 58,764 61,300 3.56 4.89 4.31
Western Visayas (VI) 14,317 2,258 2,113 6,215 7,058 8,473 9,172 (6.41) 13.57 8.25
Central Visayas (VII) 4,173 499 618 2,110 2,455 2,609 3,073 23.67 16.37 17.77
Eastern Visayas (VIII) 7,468 1,413 1,339 4,675 4,675 6,088 6,014 (5.25) 0.01 (1.21)
Zamboanga Peninsula (IX) 1,992 236 218 947 798 1,183 1,016 (7.56) (15.68) (14.06)
Northern Mindanao (X) 1,067,608 219,479 225,180 245,442 293,551 464,921 518,730 2.60 19.60 11.57
Davao Region (XI) 22,840 6,981 6,062 8,353 10,982 15,334 17,043 (13.17) 31.47 11.15
SOCCSKSARGEN (XII) 813,251 228,304 208,682 183,837 184,507 412,141 393,189 (8.59) 0.36 (4.60)
ARMM 1,135 142 139 307 306 450 444 (2.60) (0.59) (1.22)
Caraga 4,725 156 133 2,586 2,020 2,742 2,153 (15.01) (21.89) (21.50)
P - Preliminary, F - Final
Region
% Change
2010January-March April-June January-June
Production (mt)

Department of Agriculture
Bureau of Agricultural Statistics
1184 Ben-Lor Bldg., Quezon Avenue,
Quezon City
Crops Statistics Division
371-20-67
http:/www.bas.gov.ph