Embed Size (px)
Citation preview
Unclassified ECO/WKP(2000)38
Organisation de Coopération et de Développement Economiques OLIS : 12-Oct-2000Organisation for Economic Co-operation and Development Dist. : 20-Oct-2000__________________________________________________________________________________________
English text onlyECONOMICS DEPARTMENT
THE GREAT REVERSALS: THE POLITICS OF FINANCIAL DEVELOPMENTIN THE 20th CENTURY
ECONOMICS DEPARTMENT WORKING PAPERS NO. 265
byRaghuram G. Rajan and Luigi Zingales
Unclassified
EC
O/W
KP
(2000)38E
nglish text only
Most Economics Department Working Papers beginning with No. 144 are now availablethrough OECD’s Internet Web site at http://ww.oecd.org/eco/eco.
96618
Document complet disponible sur OLIS dans son format d’origine
Complete document available on OLIS in its original format
ECO/WKP(2000)38
2
ABSTRACT/RÉSUMÉ
We attempt to identify and explain the broad patterns of financial development in developedcountries over the twentieth century. We find that, contrary to the predictions of most existing theories,indicators of financial development do not seem monotonic over time. In particular, we find that by mostmeasures, countries were more financially developed in 1913 than in 1980 and that a major reversal tookplace between 1913 and 1950. To explain this we outline a simple theory of the political economy offinancial development. Empirically, our analysis suggests that the forces opposing financial developmentwill be weaker when a country is open to international trade and capital flows. We find this to be true bothin the cross-section and over time. In periods of free capital movement world-wide, a country’s level offinancial development is directly related to its openness to trade. Similarly, the low frequency movementsof financial development over time appear to be correlated with the degree to which capital is mobileworld-wide.
JEL classification: G15, G18, G28, N20
Keywords: financial development, financial systems.
* * * * *
Nous essayons d’identifier et d’expliquer les tendances générales dans le domaine dudéveloppement financier dans les pays développés au vingtième siècle. Nous trouvons qu’à l’encontre detoutes les prédictions des théories existantes, les indicateurs de développement financier ne varient pas defaçon monotone dans le temps. En particulier, nous trouvons que d’après la plupart des indicateurs, lespays étaient financièrement plus développés en 1913 qu’en 1980 et qu’un revirement majeur a eu lieuentre 1913 et 1950. Afin d’expliquer ceci, nous décrivons une théorie simple de l’économie politique dudéveloppement financier. Empiriquement notre analyse suggère que les forces qui s’opposent audéveloppement financier seraient plus faibles lorsqu’un pays est ouvert au commerce international et auxmouvements de capitaux. Ceci est vrai à la fois en coupe internationale et dans le temps. Dans les périodesoù les mouvements internationaux de capitaux sont libres, le niveau de développement financier d’un paysest lié directement à son ouverture commerciale. De même, les mouvements de faible fréquence dudéveloppement financier dans le temps semblent être corrélés selon le degré de la mobilité du capital auniveau international.
Classification JEL : .G15, G18, G28, N20
Mots-clés : développement financier, systèmes financiers
Copyright: OECD 2000Applications for permission to reproduce or translate all, or part of, this material should be made to:Head of Publications Service, OECD, 2 rue André Pascal, 75775 PARIS CEDEX 16, France.
ECO/WKP(2000)38
3
TABLE OF CONTENTS
THE GREAT REVERSALS: THE POLITICS OF FINANCIAL DEVELOPMENTIN THE 20TH CENTURY................................................................................................................................ 5
1. Introduction............................................................................................................................................. 51. Evolution of financial development over the twentieth century ............................................................. 9
1.1. Historical differences in reporting data ............................................................................................ 91.2. Various measures of financial development................................................................................... 101.3. Data sources.................................................................................................................................... 121.4. Stylised facts................................................................................................................................... 12
2. The political economy of financial development.................................................................................. 162.1. The necessity for government intervention .................................................................................... 162.2. The political economy of financial development ........................................................................... 162.3. Why is financial repression a better way to protect incumbents’ rents? ........................................ 172.4. What determines outcomes?........................................................................................................... 182.5. Financial development and openness ............................................................................................. 19
3. A test of the political theory of financial development......................................................................... 203.1. Preliminary concerns ...................................................................................................................... 203.2. Issues in 1912 ................................................................................................................................. 223.3. Equity issues in 1999...................................................................................................................... 233.3. Issues in intermediate years............................................................................................................ 23
4. Political backlash .................................................................................................................................. 244.1. Competitive markets and insurance................................................................................................ 244.2. The turmoil caused by wars and depression................................................................................... 254.3. The political response..................................................................................................................... 274.4. Autarky and its effect on the financial sector ................................................................................. 284.5. Intervention in the financial sector ................................................................................................. 294.6. The demise of financial markets in Japan ...................................................................................... 294.7. Sweden ........................................................................................................................................... 314.8. Summary ........................................................................................................................................ 32
5. The aftermath of World War II and the resilience of financial markets in Europe............................... 325.1. Bretton Woods and restrictions on capital movements .................................................................. 325.2. The breakdown of the Bretton Woods system................................................................................ 33
6. Discussion and conclusion .................................................................................................................... 34
BIBLIOGRAPHY......................................................................................................................................... 47

ECO/WKP(2000)38
4
Tables
1. Evolution of the different indicators of financial development2. Evolution of the ratio of deposits to GDP3. Evolution of fraction of gross fixed capital formation raised via equity4. Evolution of stock market capitalisation over GDP5. Evolution of number of listed companies per million people6. Issues to GDP in 19127. OLS regression for cross-section of countries in 1998-99
Figures
1. Issues in 1913 vs. industrialisation2. Issues in 1913 vs. industrialisation * openness3. Capitalisation in 1913 vs. interaction4. Listed companies per M in 1913 vs. interaction5. Equity issues vs. per capita GDP * openness, 1913
ECO/WKP(2000)38
5
THE GREAT REVERSALS: THE POLITICS OF FINANCIAL DEVELOPMENTIN THE 20TH CENTURY
Raghuram G. Rajan and Luigi Zingales1
1. Introduction
1. It has long been observed that a country’s state of development is strongly positively correlatedwith the state of development of its financial sector. For example, on the basis of data from 35 countriesbetween 1860 and 1963, Goldsmith (1969, p. 48) concludes that “a rough parallelism can be observedbetween economic and financial development if periods of several decades are considered” and “there areeven indications in the few countries for which data are available that periods of more rapid economicgrowth have been accompanied, though not without exception, by an above-average rate of financialdevelopment”.
2. Recent studies suggest this association is more than simply correlation, and financialdevelopment does, in fact, advance economic growth. In a study of 80 countries over the period 1960-1989, King and Levine (1993) find that beginning-of-decade measures of a country’s financialdevelopment are strongly related to the country’s economic growth, capital accumulation, and productivitygrowth over the subsequent decade. Using the de-regulation of banking in different states of the UnitedStates between 1972 and 1991 as a proxy for a quantum jump in financial development, Jayaratne andStrahan (1996) find that annual growth rates in a state increased by 0.51 to 1.19 percentage points a yearafter de-regulation. Rajan and Zingales (1998a) find that the development of a country’s financial marketsand institutions dramatically increases the growth of industries, such as Computers or Pharmaceuticals,which need long-term external finance. With all these studies indicating that financial development doesindeed facilitate growth, one is compelled to ask why so many countries score so low on measures offinancial sector health?
3. The simple answer, and one favoured by many economists, is the absence of demand. Accordingto this view, when opportunities arise in an economy that require financing, the economy will develop thenecessary markets and institutions to finance these opportunities; In other words (those of Joan Robinson,1952, p. 86) “where enterprise leads, finance follows”. For example, the enormous financing requirementsof railroads in the United States (1 billion dollars up to 1867 and 10 billion up to 1890) lead to thedevelopment of public markets for corporate debt and later for stock, with 40 per cent of this capitalcoming from Europe.2 Financial institutions such as investment banks, including the famous Morgan bank,emerged to underwrite and distribute these securities and to reassure European investors that the moneywas properly invested. Thus the financing needs of the railroads lead to the creation of financial
1. University of Chicago and NBER. This paper is a development of some ideas in a previous working paper
entitled “The Politics of Financial Development”. We thank the Bradley Foundation, the Centre for Studyof the State and the Economy, the Centre for Research on Securities Prices, and the World Bank forfunding support. Rajan also thanks the National Science Foundation. We benefited from comments byLucian Bebchuk, Peter Hogfeldt, Mark Roe and Andrei Shleifer.
2. See Engelbourg and Bushkoff (1996) and Chandler (1990).

ECO/WKP(2000)38
6
infrastructure in the United States that was then available to finance other industries that came later. Whatwe have just described is nothing but the reverse of Say’s Law -- demand creates its own supply.
4. This argument is probably an oversimplification because it cannot explain why countries atsimilar levels of economic development differ so much in the level of their financial development. Forinstance, why was France’s stock market much bigger as a fraction of its GDP than markets in the UnitedStates in 1913, even though the per capita GDP in the United States was not any lower than France’s. It ishard to imagine that the demand for financing in the United States at this time was inadequate -- thedemand for more, and cheaper, credit was a recurrent theme in political debates in the United States at thattime.
5. An alternative explanation is there may be impediments to supply rising to meet demand. Thefixed costs of setting up financial institutions and market infrastructure will not be met until there is anadequate demand for financing. Moreover, the financial sector needs time: to gain experience, buildreputations, and develop appropriate financial technology. It also needs an enabling infrastructure -- forexample, a legal environment that allows a wide variety of contracts to be written, enforces them at lowcost, and speedily imposes punishment when they are breached.
6. These impediments, however, may not be enough to explain why France and the United Statesdiffered so much. Presumably, both countries were big enough that fixed costs were relatively smallcompared to the demand for finance. Moreover, the countries had experienced a significant demand forfinance for a long enough period that the time to build is unlikely to have been a constraint. While theseminal work of La Porta et al. (1997, 1998) suggests a country’s legal tradition (in particular, whether ithas a civil code or common law) may have a causal effect on its financial development -- presumablybecause the ease of creating the enabling infrastructure is affected by legal tradition -- the arguments in thatliterature would predict a relatively underdeveloped financial sector in civil code France and not the otherway around.
7. The greater intellectual problem with relying on the impediments described above to explaindifferences in financial development is that they suggest financial development will either take-offpermanently (for example, once fixed costs are overcome or minimum reputational levels attained), orremain permanently constrained (for example, if the French civil code is hostile to financial markets assuggested by La Porta et al.). Yet the historical evidence suggests measures of financial development waxand wane. In 1913, France’s stock market capitalisation as a fraction of GDP was almost twice the UnitedStates (0.78 vs. 0.41). By 1980, roles had reversed dramatically -- it was now barely one fourth thecapitalisation in the United States (0.09 vs. 0.46). And in 1999, the two countries seem to have converged(1.17 vs. 1.52).
8. Similarly, Tilly (1992, p. 103-104) finds both the volume of total market issues, and theproportion of issuance consisting of equity were greater in Germany in the beginning of the 20th centurythan they were in the United Kingdom. He concludes that in Germany “…banks and shareholdersgenerally were well informed as to the financial status of most listed industrial companies…” while“British investor preferences in favour of fixed-interest securities reflected the paucity of information andrelatively weak financial controls on the operations of company founders and insiders”. Yet La Porta et al.(1998) find that in the middle of the 1990s, the United Kingdom (and other Common Law countries)scores very high on shareholder rights while Germany fares miserably. Moreover the United Kingdom hasa score of 78 on accounting standards (a measure of disclosure) while Germany comes in with a score ofonly 62. It is no wonder that they claim the United Kingdom is more equity friendly than Germany, andthis certainly is reflected in the relative stock market capitalisation of the two countries at the time of theirstudy. But Tilly suggests the greater equity friendliness was not true historically, nor is it necessarily truetoday with the Deutsche Bourse being the chosen location for high technology IPOs in the failed mergerwith the London Stock Exchange.
ECO/WKP(2000)38
7
9. Before we attempt an answer to these questions, let us outline the facts more systematically. Wegather a time series of the main indicators of financial development for a large cross section of countries.We find, using a variety of measures of financial development, that the average level of financialdevelopment in 1913 for a number of countries was quite high, comparable to that in 1990. Much as today,there was substantial variation even then among countries. By most indicators, the main continentalEuropean countries were more developed financially than the United States. It fact, contrary to the findingsof La Porta et al. (1997) for the 1990s, we find that Common Law countries were not more financiallydeveloped in 1913. Indicators of financial development fell in all countries between 1913 and 1980. Sincethen, there has been a revival of financial markets.
10. We want to understand both what explains cross-sectional differences in financial developmentas well as what can explain the observed time series variation. The observed low frequency reversals infinancial development cannot be explained with fixed costs or time invariant institutional factors (such astype of legal system). In our view they are best explained by shifting political coalitions. Of course, it isnot surprising that politics has influence -- there are few areas of economic activity that are immune topolitics. Nevertheless, it is useful to identify which groups may actively oppose something that seems sobeneficial as the development of financial markets, and when they would most do so.
11. Our main argument for when anti-market forces may become strong has two parts. The first isthat incumbents -- whether in industry, agriculture, or finance -- can be hostile to arm’s length marketsbecause anonymous markets do not respect the value of incumbency, and instead can give birth tocompetition. Nevertheless, it is possible for the forces of incumbency to be muted. One such situation iswhen opportunities outside the economy explode. Incumbents then have a reason to allow the economy toopen up, especially if access to other markets requires a quid-pro-quo response. The resulting competitionfrom external sources in both the product and financial markets make it both hard and unprofitable fordomestic incumbents to continue to keep the domestic financial sector repressed. We believe that theincreasing openness of the world economy both in the decades before 1913 and the decades before theclose of the millennium led to the observed world-wide increase in financial development.
12. But what then explains the reversal? We will argue that the competitive forces unleashed by openmarkets can destroy some forms of relationships and associated insurance provided by social and economicinstitutions.3 These forces also reduced the ability of the political authorities in each country to intervene toprovide the insurance. The consequences were not particularly troubling when economies were doing well.But as the world slid into depression towards the end of the 1920s, the severe and widespread shocksenabled the public to overcome collective action problems, and the popular clamour from the masses forpolitical action to reverse the effects of the market strengthened. The initial response of many countrieswas to depart from the Gold Standard and retreat into autarky. Protected from outside competition,incumbents rode on the coattails of the popular demand for insurance to initiate actions to restrain themarket.
13. The post World War II Bretton Woods consensus recognised both the havoc caused by autarky,as well as the political need for insurance. The compromise was that financial development was sacrificedat the altar of free trade. The attempt for the next quarter century was to encourage the free flow of goodsand services across borders while heavily restricting the flow of capital. The capital controls that were inplace over this time, we believe, hampered the revival of financial markets. With the break down inBretton Woods in the mid 1970s, and the increasingly free flow of capital across borders, domestic
3. Polanyi (1944) is an early, and powerful articulation of this argument. Since then it has been formalized by
Diamond and Dybvig (1983) in the context of banking, and explored in a variety of ways by Mayer (1988),and Petersen and Rajan (1995). Allen and Gale (2000) is an excellent treatment of the relative benefits ofmarkets and intermediaries.

ECO/WKP(2000)38
8
financial systems could no longer stay immune from foreign competition, and financial development againtook off.
14. We are, of course, not the first to point the influence of politics on financial development, thoughour focus is somewhat different from previous work. For example, in their excellent study of Englishpublic finance after the Glorious Revolution, North and Weingast (1989) argue that the Englishgovernment had to build credibility it would not expropriate, before public debt markets could develop inEngland. Roe (1994) suggests that the popular fear of financial monopolies in the United States lead tolegislation like the Glass Steagall Act, limiting the activities and size of financial institutions in the UnitedStates. Jensen (1993) argues that legislation crimped the market for corporate control even while it washaving salutary effects on US industry. Our paper is related to these, especially the last in that we alsoemphasise the power of incumbents in retarding financial development, but our focus is across countries.
15. Others have attempted to explain the patterns of financial development across countries.Foremost in this is the seminal work of La Porta, Lopez de Silanes, Shleifer, and Vishny (1997, 1998) whoargue that countries with a Common Law origin seem more friendly to the development of marketsperhaps because it protects investors better. However, our work indicates that financial markets inCommon Law countries in the historic past, or even today, are not necessarily superior to those in CivilLaw countries. The relative market friendliness of Common Law countries uncovered by La Porta et al.seems a fluctuating phenomenon, and is unlikely to be explained by something as permanent as the originof the legal system. We conjecture that the Common Law indicator may proxy for the kind of politicaltradition a country has, which then serves to moderate fluctuations in the political power of interest groups.
16. Finally, a number of recent papers attempt, like us, to explain cross-country patterns in financialdevelopment. Verdier (1999) argues that political structure may explain the origins of universal banking inthe 19th century, while Fohlin (2000) surveys the existing literature on legal and political forces affectingfinancial development to derive testable implications. Neither paper emphasises the reversals, which areour focus. Roe (1999) suggests that corporations in Continental Europe are more closely held because ofthe potential for higher agency costs there as a result of pro-labour legislation passed in the 1920s and1930s. There is a commonality between our work and his in that he describes specifically how legislationintended to protect workers against the vagaries of market forces may eventually curtail certain forms offinancing. There are differences. For example, given the worker empowerment that is in place, he seeslittle incentive for firms to press for laws protecting minority investors. By contrast, we believe that workerempowerment and the protection of incumbent management is part of a wider pact mediated bygovernments that comes under pressure as an economy opens up.
17. Pagano and Volpin (1999) develop a model in which entrepreneurs, who have already raisedfinance, want low investor protection (so as to indulge in private benefits), and get the support of workersby promising them high employment protection. Thus low investor protection and high employmentprotection go together, a prediction they verify empirically. Our model differs in the details in thatincumbents settle for low financial development (cartelised banks, poorly developed financialinfrastructure) if it keeps out competition, and workers may, or may not, be part of this consensus (theywere not in Germany and Italy during the Fascist era). Our most important contribution is, however, to tryand understand when this consensus develops and when it breaks down.
18. Since our theory is based on public choice, it owes much to the work in that literature. Inparticular, we rely on Olson’s (1965) and Stigler’s (1970) idea that small interest groups havedisproportionate power. However, because our focus is on financial development, we have to tease out thespecific interests of various groups. The idea that foreign competition through free trade will lead to areduction in the power of domestic interest groups is also contained elsewhere (e.g. Olson, 1982).However, the details of the process are important. Foreign competition does not just expose theinefficiencies of restrictions imposed in the interests of incumbents, it also reduces the value of those

ECO/WKP(2000)38
9
restrictions, as well as strengthens suppressed interest groups. Consequently, we will argue that free tradeand the free flow of capital are mutually reinforcing for the cause of financial development, and thathaving just free trade may not be sufficient.
19. The rest of the paper is as follows. In Section 1 we describe how we collected the data, then wepresent measures of financial sector development in different countries at various points in the 20th century.What is particularly interesting is that countries like France that had moribund capital markets untilrecently had flourishing ones in the early part of the century. By contrast, Anglo-American economies didnot seem to have a particular advantage in financing domestic firms through capital markets at that time. InSection 2, we present a political theory of why some countries develop their financial systems and othersnot. In Section 3, we test some of the implications of this theory. In Section 4 we explore how the politicaleconomy of financial development can explain reversals, and in Section 5 we explain why financialmarkets took time to re-emerge after World War II. Section 6 concludes.
1. Evolution of financial development over the twentieth century
20. We face two challenges in documenting the changing levels of financial development over thecourse of the twentieth century. One, common to any attempt to compare financial development, bothacross countries and over time, is how to measure financial development. There is no consensus on thecorrect method. Theoretically, the right measure would be the ease with which companies in need ofexternal funds can access them, and the ease with which investors can get an adequate return. Presumably,the right measure also reflects the sophistication and competitiveness of, and transaction costs embeddedin, the financial system. Unfortunately, these are not measures that can be easily computed even in themost developed countries today, let alone in the past for countries that have not been as fastidious aboutstatistics.
21. The common practice in the literature (e.g. King and Levine, 1993; Demirguc-Kunt andMaksimovic, 1998; Levine and Zervos, 1998; Rajan and Zingales, 1998a) is to compute ratios of differentaspects of the financial system (such as deposits, equity market capitalisation) to measures of the size ofthe economy. While not strongly motivated by theory, these ratios broadly capture a country’s level offinancial sophistication and they are standard in the literature. Thus, for ease of comparison we will try, asbest as the available data allow us, to use these measures.
22. The second more formidable challenge, specific to the historical nature of our analysis, is thedifficulty in gathering reliable sources for historical information about financial markets. Primary sourcesare often lost or inaccessible, while secondary sources are contradictory, or repeat uncritically the sameprimary sources. To further complicate our task, the type of information statisticians and governing bodiesof stock exchanges were interested in at the beginning of the twentieth century seems quite different fromthe ones we are interested in today (this seems a topic worthy of a separate study). We discuss some ofthese differences because they help shed some light on the different perceptions of the nature and role offinancial instruments at that time.
1.1. Historical differences in reporting data
23. A number that is often reported is the total nominal value of securities outstanding in a country.This clubs together not only stocks and corporate bonds, but also Government bonds, making the numberdifficult to interpret. The clubbing of information on corporate bonds and stocks, which is pervasive evenin the United Kingdom, probably the most sophisticated financial market at that time, reflects the similarityof these two instruments at that time. There was good reason for this. The use of preferred stock paying afixed dividend was widespread. Also, common stock paid very high dividends, making them more similar

ECO/WKP(2000)38
10
to bonds. One consequence of the high dividend payout ratio was that most stocks traded fairly closely totheir nominal value. In fact, in many countries stock prices were quoted as a percentage of their nominalvalue. Thus, even from an investor’s point of view, bonds and stocks were perceived as very closesubstitutes, a fact that can be appreciated by reading through the investment advice contained in the Reviewof Financial Reviews (a British analogue to Barrons).
24. A second problem is that the official statistics at the beginning of the twentieth century report thetotal universe of corporations existing at that time, rather then the subset of those publicly traded. This isnot surprising if one remembers that in most countries free incorporation was introduced only late in thenineteenth century. As a result, most registered corporations were newly formed and they had to appeal inone way or another to the public to raise the capital necessary to get started. Nevertheless, to make thenumbers more comparable across time we classify companies as publicly traded only if the firm is quoted.Even with this requirement, we may still have very infrequently traded stock.
25. A final problem comes from the existence of regional exchanges. At the beginning of the century,not only was trading more fragmented across exchanges, but so was listing. For example, the Banco doBrazil is listed in Rio but not in San Paulo. Companies listed only in Osaka represent a not inconsiderableportion of the total companies listed in Japan. The most extreme case is Germany, probably as aconsequence of the delayed political reunification. In 1913 Germany had nine major stock exchanges andBerlin, the main one, represented only about 50 per cent of the total capitalisation.
26. Regional (or secondary) stock exchanges represent a challenge from a data collection point ofview. Since many have disappeared or have been absorbed by the main exchange, they tend not to be welldocumented. We try, as much as possible, to reconstruct a measure that includes all the stock exchanges,eliminating double listing. When this is not possible, we compute the ratio of the capitalisation of thesecondary exchange to main exchange at the earliest day available and then use this ratio to extrapolatebackwards the value of these exchanges. Since the importance of regional exchanges has gone down overtime, this procedure clearly biases downwards the estimate of the total stock market capitalisation incountries with fragmented stock markets. This should be kept in mind in the analysis.
1.2. Various measures of financial development
27. Let us now describe the various indicators of financial development we use.
Banking sector
28. As a measure of the development of the banking sector we use the ratio of deposits (commercialbanks plus savings banks) to GDP. This measure captures only the liability side of banks, ignoringdifferences in the composition of bank’s assets. This may matter. For example, German banks had a biggerfraction of their assets invested in commercial loans than British banks. The ratio of deposits to GDP, thus,will underestimate the importance of German banks in the credit market. Despite this shortcoming, themeasure has the virtue that it is available for a long time series and for a large cross section of countries.
Equity issues
29. One measure of the importance of equity markets is the amount of investments that are fundedthrough equity issues. The proxy we use is the ratio of equity issues to Gross Fixed Capital Formation(GFCF) during the year. Ideally, we would have liked to normalise corporate equity issues by the amountof corporate investments, but this datum is not consistently available. In interpreting the results, therefore,it is important to realise that our measure will tend to underestimate the level of financial development of
ECO/WKP(2000)38
11
countries where agriculture (which does not enter in corporate investments but does enter in totalinvestments) is more important. It will also tend to underestimate the level of financial development in theearlier part of the century, when corporate investments were a smaller fraction of total investments.
30. Another drawback of this measure stems from the well-known cyclicality of equity issues. Adisproportionate amount of equity issues are concentrated during boom years (Choe, Masulis and Nanda,1993). This can bias the cross sectional comparison to the extent stock market booms are notcontemporaneous across countries. It also biases the time series comparisons if one of the reference yearswas a boom year (most notably 1929).
Capitalisation
31. A more stable measure of the importance of the equity market is the total stock marketcapitalisation. Theoretically, one drawback of this measure is that it captures the amount of equity listed,not the amount of equity raised. Thus, the presence of few companies that have greatly appreciated in valuecan give the impression of an important equity market even when the amount of funds raised in the marketis tiny. On the positive side, however, this measure is less cyclical than the previous one, and thus is betterfor making comparisons across countries and across time periods.
32. In measuring both equity issues and stock market capitalisation we restrict ourselves, wheneverpossible, to domestic companies. This is not uncontroversial. London and Paris at the beginning of thetwentieth century, and New York more recently, have attracted many foreign listings. We are especiallyinterested, however, in how a country’s financial and legal institutions help domestic industries raise funds,and as some have argued (see Kennedy (1989) for example), the financial sector’s ability to fundforeigners may not imply an ability to fund domestics. This is the reason why we limit ourselves todomestic companies.
Number of companies listed
33. Another indicator of the importance of equity markets is the number of publicly traded domesticcompanies per million population. The advantage of this indicator is that it provides a measure that is nottainted by fluctuations in stock market valuations and possible mis-measurement of the level of GDP.Thus, it is very useful as a complement to the previous ones. One drawback is that it is affected by theprocess of consolidation as well as by the fragmentation of the industrial structure. Countries with a moreconcentrated industrial structure will have fewer larger companies and thus might score low according tothis measure.
34. In sum, any indicator has its own drawbacks. This is the reason why they should be looked attogether to get a better sense of the development of a country’s financial structure.
35. One indicator that is missing from our list is the volume of securities traded (see Levine andZervos, 1998). Unfortunately, the way volume is recorded (even today) is quite controversial. TheFederation Internationale Bourses Valeurs (FIBV) classifies today’s trading reporting systems into twogroups: trading system view (TSV) and regulated environment view (REV). The TSV system counts asturnover only those transactions which pass through the exchange’s trading floor or which take place onthe exchange’s trading floor. The REV system includes in turnover figures all the transactions subject tosupervision by the market authority, with no distinction between on- and off-market. As the FIBV warns,comparisons are not valid between stock exchanges belonging to different groups, because they deliversubstantially different results. For example, Paris reports the volume of trading according to both methods.Using the TSV method the volume of equity traded in 1999 was $770 076 million, while the REV methodindicates it is four times as much ($2 892 301 million). Given the magnitude of the difference and the

ECO/WKP(2000)38
12
impossibility of obtaining consistent data both across countries and over time, we chose to disregard thisindicator.
1.3. Data sources
Stock market capitalisation and number of companies listed
36. Our starting point was the official publication of the stock exchanges as well as those of theFederation Internationale Bourses Valeurs (FIBV). These provide extensive information only starting in1980. Official publications of individual stock exchanges often go back to WWII. When these are notavailable, we use information contained in private guides to stock exchanges. Only for Japan and theUnited States did we find official publications before WWII.
37. To assess the importance of the equity market in 1913 we mainly rely on two approaches.Whenever possible we secured a copy of a stock exchange handbook in 1913 (or the closest year before1913). Using the handbook we identify the number of domestic companies listed, the number of shares ofeach company, and the price per share. We then compute the total stock market capitalisation as the sum ofthe product of price times the number of shares. We are able to do this for Australia, Brazil, Cuba,Denmark, Germany, Italy, Netherlands, Russia, Sweden, Switzerland, and the United Kingdom.
38. A second source was various issues of the Bulletin of the International Institute of Statistics (IIS).Starting in the late nineteenth century, statisticians from all over the world met every year for a conference.This association formed a special group to compute the importance of security markets in differentcountries. Several issues of the ISS Bulletin between 1900 and 1914 are dedicated to this. Unfortunately,many of these reports club together stocks and bonds but we do obtain some dis-aggregated informationfor some countries.
Data on equity issues
39. Data on equity issues are relatively easier to get for the pre WWII period than for the periodimmediately after the war. For example, the League of Nations statistics include this information, eventhough it is not contained in more modern publications like the United Nations Statistics, or the FinancialStatistics of the International Monetary Fund. This may be a reflection of the greater importance that wasattributed to this information before World War II. When not available from official statistics, we gatherthis information from financial newspapers of that time such as the Economist, Commercial and FinancialChronicle, Deutsche Oekonomiste, etc.
Data on deposits and national accounts data
40. Pre WWI data on deposits, national income, and gross fixed capital formation come fromMitchell (various issues). Whenever available, however, we prefer the data from the NBER web site,which combines several different sources. In a few cases we had to use specific national sources. PostWWII data come from the IMF’s International Financial Statistics.
1.4. Stylised facts
41. In Table 1, we report the average value of our four indicators of financial development for theperiod 1913 to 1999. Because there are missing observations, for every indicator we report both the

ECO/WKP(2000)38
13
average across all available observations and the average for the countries with continuous observationsthroughout the sample period. In Tables 2 to 5, we report the value of each indicator for each country. Ananalysis of these tables suggests the following facts:
Financial systems were highly developed in 1913
42. Regardless of the way we measure it, the average level of financial development in 1913 wasquite high, comparable to that in 1990 if not that in 1999. The average level of deposits relative to GDP in1913 is very similar to that in 1980. This is not only true on average (Table 1), but also is true for mostcountries (Table 2). One exception is Japan, where deposits were only 19 per cent of GDP in 1913 and are111 per cent of GDP in 1999.
43. Equity issues were a relatively more important source of funds for corporate investments in 1913than in 1990 for almost every country we have data for. This is particularly noteworthy when we recognisethat the 1913 figures are biased downwards relative to the 1990 ones, because we normalise by GFCF andcorporate investments represent a much smaller proportion of GFCF in 1913 than in 1990.
44. Most countries had more listed companies per million people in 1913 than in 1980. Again, onlywith the explosion of markets during the late 1990s has the 1913 level been surpassed. In few cases thedifference is astonishing. In 1980 Germany had only half the publicly traded companies per million peoplethat it had in 1913, Italy one-third, Austria one-fifth.
45. The data on the capitalisation of the stock market in Table 4 support our inferences from the dataon equity issues. In most countries, equity markets were bigger relative to GDP in 1913 than in 1980. Onlyby the end of the 1990s do they seem to have exceeded their 1913 level.
46. While, in general, the richest countries were highly financially developed in 1913, the degree ofdevelopment does vary widely. Differences in the level of economic development are only partiallyresponsible for that: the level of per capital income explains only 20 per cent of the cross-country variationin the deposit-to-GDP ratio and it is not even statistically significant in explaining the level of equitymarket capitalisation. Argentina, for instance, had about the same per capita GDP as Germany and France,but its level of deposits is only about two thirds that of France and Germany. Similarly, in 1913Argentina’s per capita GDP was three times as big as Japan’s, but the relative size of its equity market wasonly one-third of Japan’s.
The pattern of financial development in 1913 was quite different from what it was until recently
47. Measures of financial development in 1913 do not strongly track measures of financialdevelopment used in recent studies. In 1913, equity issues appear to be more important in France, Belgiumand Russia, than they are in the United States. Thus, by this measure, some Continental European marketsseem to be at least as developed as the US market at that time. The data on market capitalisation in Table 4confirm this impression. While the United Kingdom has high capitalisation, Belgium, France, Germany,and Sweden come close, ahead of the United States. Once again the distinction between ContinentalEurope and Anglo-American countries does not seem to hold. In fact, this distinction seems to be a post-WWII phenomenon.
48. Another way of seeing this is to compute the correlation between indicators of financialdevelopment at different points in time. Using the Spearman rank correlation test, we find a correlation of0.4 between capitalisation to GDP in 1913 and capitalisation to GDP in 1999. We reject the hypothesis thatthe two distributions across countries are independent at the 10 per cent level (19 observations). The cross-country pattern of financial development in 1999 seems similar to that in 1913! This is not true a decade
ECO/WKP(2000)38
14
earlier. The correlation of the 1913 data with 1990 and 1980 data is lower (0.18 in 1990, -0.05 in 1980) andwe cannot reject the hypothesis that the distributions are independent.
49. By way of comparison, consider the cross-country correlation of per capita GDP measured at twodifferent points in time. Using the Spearman rank correlation test, we find a correlation of 0.63 betweenper capita GDP in 1913 and per capita GDP in 1999 (independence rejected at the 1 per cent level with23 observations). The correlation of the 1913 data with 1990 and 1980 data is equally high (0.61 for 1990,0.75 for 1980). Thus over long periods, the relative ranking of countries according to financialdevelopment seems to be more volatile than their ranking according to development.
50. Recently, La Porta et al. (1997, 1998) have argued that differences in the level of financialdevelopment can be explained by the type of legal system a country adopted. Common law countries-- they argue -- are more likely to protect investors, thus enabling financial development. Indeed, they finda very strong correlation between various measures of financial development in 1990 and the presence of alegal system based on common law. One of the appealing features of this interpretation is that it tracesfinancial development back to a factor (type of legal system) that is very stable over time and, as such,immune to the risk of reverse causation. One corollary of this argument, however, is that the origin of thelegal system should have some explanatory power not only in 1990, but also at any previous date. The lackof correlation between financial development in 1913 and 1990 suggests this may not be true. The moredirect test of regressing measures of financial development in 1913 against an indicator if the country hascommon law. Common law countries are not significantly more developed on any of the four measures offinancial development, even after we control for the level of per capita income. In fact, in most of the casesthe coefficient of the common law indicator variable is negative, albeit not statistically significant. Thus,the pattern of financial development in 1913 cannot be easily explained by the existing theories andwarrants a new explanation.
Financial development regresses between 1913 and 1980
51. The most striking fact that emerges from Table 1 is that financial development regressed between1913 and 1980. The average level of bank deposit to GDP ratio was 41 per cent in 1913 and 40 per cent in1980. Similarly, the stock market-to-GDP ratio was 56 per cent in 1913 and only 25 per cent in 1980. Thisremarkable drop is present even if we restrict attention to the countries for which we have data throughoutthe period. The number of domestic companies listed per million population drops from 27 in 1913 to 23 in1980 (21 to 19 for countries for which we have all the observations). Finally, the ratio of equity issues toGFCF drops from 12 per cent in 1913 to 3 per cent in 1980 (15 per cent to 3 per cent if we restrict tocountries for which we have all the observations).
52. One important explanation for why some countries fail to develop their financial systems hingesupon set-up costs (Bencivenga and Smith, 1991 and Greenwood and Jovanovic. 1990). But once thesecosts are paid and the financial system reaches a certain level of development, there is no reason why itshould retrench. And financial infrastructure is not more reliant on bricks and mortar than the level ofeconomic development itself, so war should not affect it disproportionately. So the most financiallydeveloped countries in 1913 should have had a head start and should have been ahead throughout thecentury. This roll-back in financial development cannot be explained by theories of financial developmentbased on high initial fixed costs.
53. The second striking fact is when this reversal took place. With the usual caveat about poor data,we find that indicators of financial development were not severely affected by World War I. By 1929 mostindicators were close to their pre WWI level. In fact, the relative quantities of equity issues were muchlarger in 1929, but this is probably a peculiarity of that year. Equity issues are highly cyclical and in mostcountries the stock market was booming at that time. More surprising is that the Great Depression did nothave an immediate effect on the level of financial development. The level of deposits to GDP was slightly

ECO/WKP(2000)38
15
higher in 1938 than it was in 1929 (44 per cent vs. 39 per cent) and so was the ratio of stock marketcapitalisation to GDP (48 per cent vs. 46 per cent). Given the above-mentioned cyclicality, equity issueswere lower in 1938 than in 1929, but they were at the same level as in 1913 and the number of listedcompanies per million population was actually higher in 1938 than both 1929 and 1913.
54. Thus, the data suggests that indicators of financial development fell around World War II. In1950 (five years after the end of the war) all the indicators of financial development are well below theirlevel before the beginning of the war. Deposits are only 32 per cent of GDP, equity market capitalisation29 per cent, and equity issues represents only 6 per cent of GFCF. The decline is not limited to thecountries that lost the war, although it is obviously more pronounced there. It is not even restricted to thecountries involved in the war, since we see it present also in Sweden, Argentina, and Brazil. Finally, itcannot be attributed to a decline in the standard of living, since during the same period the per capita GDPin 1990 dollars increased from $4 476 to $4 935. This post war reversal, thus, it is a fact that needsexplanation.
55. After WWII, the various indicators show a different temporal dynamic. The relative level ofdeposits is flat during the fifties and then steadily increases during the subsequent decades. The stockmarket capitalisation increases steeply in the fifties and sixties, to drop back at the end of the seventies toits 1950 level. The number of companies to population, by contrast, is high in 1950 and declines steadily to1980. This phenomenon is probably the reflection of the high number of firms started immediately after thewar and of the subsequent process of consolidation. Finally, equity issues as a fraction of GFCF remainsteady between 1950 and 1970, only to drop in 1980.
The degree of reversal is not homogeneous across countries
56. While, on average, indicators of financial development seems to have reversed between 1913 and1980, the degree to which this occurred is not homogenous across countries. In the United States, forinstance, the equity market capitalisation in 1980 was roughly the same proportion of GDP as in 1913, sowere deposits and the level of equity raised as a fraction of GFCF. Only the number of publicly tradedcompanies was four times as high in 1980 as in 1913. Thus, at the beginning of the 1980s the U.S.financial system did not appear to be any worse than it was in 1913. Compare this with France. Whiledeposits to GDP and number of listed domestic companies per million population are roughly equal in thetwo reference years, the level of stock market capitalisation relative to GDP in France in 1980 was onlyone tenth what it was in 1913 and the amount of equity raised relative to GFCF only 40 per cent of its 1913level. The same is true for Sweden, which did not participate in World War II.
Financial development explodes in the 1980s and 1990s, especially in Europe
57. Another striking fact that emerges from Table 1 is the explosion of all the indicators of financialdevelopment during the 1980s and 1990s. During this period the average ratio of deposits to GDPincreased by 50 per cent, the average ratio of stock market capitalisation to GDP increased four times, andso did the fraction of GFCF raised via equity. The number of listed domestic companies shows a moremodest increase (30 per cent). Interestingly, for deposits, the leap forward seems to be entirelyconcentrated in the 1980s, while for the other three indicators the growth is fairly evenly distributed acrossthe two decades.
58. What triggered such impressive growth? Obviously, set-up costs cannot explain these facts,neither can any time invariant factor such as the type of legal system prevailing in each country.

ECO/WKP(2000)38
16
2. The political economy of financial development
59. We will describe a parsimonious theory that will explain the broad patterns we have noted in thedata. In essence, it will suggest why financial development can differ so much between countries at similarlevels of economic and industrial development. It will then explain why the same forces that lead tofinancial development can also cause its reversal.
60. The argument will be developed as follows. First, we will argue that government support isneeded for financial development. Second, powerful incumbents, who have a disproportionate say ingovernment even in well-functioning democracies, have some incentive to oppose financial development.This opposition is most muted when the economy is open to outside forces of competition, both in theproduct market and in the financial market, whether openness arises naturally, or endogenously. Finally,the development of markets, while in general beneficial, may destroy traditional sources of relationshipsand insurance, and this can be particularly onerous for the general public during downturns. If the economyis not prepared, a downturn can bring popular demands for political action to suppress markets. We willargue that the political compromises that were achieved after World War II to accommodate the populardemand for insurance led to capital controls and a suppression of financial markets the world over. It isonly with the break down, and the subsequent elimination, of capital controls in recent years that we see arevival of markets. Let us now detail the argument.
2.1. The necessity for government intervention
61. To function properly a financial system requires clear laws and rapid enforcement, an accountingand disclosure system that promotes transparency, and a regulatory infrastructure that protects consumersand controls risk. While private contracting could achieve some of this, the government has the ability toco-ordinate standards and monitor, as well as enforce certain punishments, that give it some advantage.Given that government action is needed for financial development, the focus of our inquiry then shifts towhen there is a political will to undertake these actions.
2.2. The political economy of financial development
62. Why would anyone oppose financial development? The answer we believe has to do with thechallenges financial development poses to incumbents. Rich incumbents are likely to receiveproportionately fewer benefits from financial developments. One of the benefits of being an incumbent isthe ability to finance new projects out of retained cash, without accessing external capital markets. Evenwhen their businesses do not generate sufficient cash to fund desired projects, incumbents can use theircollateral and their reputation to borrow. Whatever surplus capital there is in an underdeveloped markettends to flow towards incumbents because only they have the collateral or reputations to ensure that theywill repay money invested in them, and only they have the power to secure the repayment of moneyinvested in the projects of others (see Lamoureaux (1994) for an excellent study of such lending patterns inthe early New England economy of the nineteenth century). In sum, incumbents can satisfy many of theirfinancing needs even in a very underdeveloped financial market.
63. On the other hand, incumbents are likely to suffer indirectly from financial development. Thebetter disclosure rules and enforcement in a developed financial market reduce the relative importance ofthe incumbents’ collateral and reputation, while permitting newcomers to enter and compete awayincumbent rents. For example, before the introduction of the Neuer Markt in Germany, very fewcompanies raised funds by listing on its Stock Exchange and the few that did were companies with a longtrack record (50 years) and an established reputation. The Neuer Markt, with its better disclosure standards,made it possible for young high-tech companies, with no track record and no reputation, to raise equity. Infact, the average age of a Neuer Markt IPO is only 12 years, and a majority of them are in the high tech
ECO/WKP(2000)38
17
sector, with little or no history of profitability.4 According to Kukies (2000), the primary differencebetween the Neuer Markt and the existing German exchanges was the greater disclosure requirement in theformer, and its willingness to de-list firms quickly if the requirement was not met. Better disclosurestandards, thus, reduced the difficulty new entrants faced in getting finance because of their lack of trackrecord and reputation. In doing so, however, these standards reduced the value of reputation and collateralfor incumbents who had it, and subjected them to competition.
64. Financial development not only levels the playing field between industrial incumbents andentrants, it also hurts traditional ways of doing business. Better public disclosure reduces the informationaladvantage incumbents typically have because they are better connected. Prompt and unbiased enforcementsubjects them to the same rules as everybody else, removing their ability to influence the executive and thejudiciary with appropriate threats and favours. Regulation further limits their ability to take advantage oftheir controlling position. In sum, the process of financial development brings along with it the disinfectantof transparency, which tends to exterminate cosy practices from the body economic.
65. While incumbent financiers may sometimes be at odds with incumbent industrialists overfinancial development, they could also join in opposing it. In the absence of good disclosure and properenforcement, financing can only be relationship-based. Relationship-based systems ensure a return tofinanciers by granting them some form of power over the firm being financed. The simplest form of poweris when the financier has (implicit or explicit) ownership of the firm. Alternatively, the financier can serveas the sole or main lender, supplier, or customer. In all of these forms, the financier secures her return oninvestment by retaining some kind of monopoly over the firm she finances. As with every monopoly, thisrequires some barriers to entry. These barriers may be due to regulation, or to lack of transparency -- or“opacity” -- of the system, which substantially raises the costs of entry to new intermediaries. Thus, theopacity and collusive practices that sustain a relationship-based system entrench incumbents at the expenseof potential new entrants.
66. In sum, a more efficient financial system facilitates entry by newcomers with ideas but littleresources. More entry will lead to more competition and thus lower profits for incumbent firms. Moreover,markets tend to be democratic, equalising access, and therefore particularly jeopardising ways of doingbusiness that rely on unequal access. Thus, not only are incumbents likely to benefit less from financialdevelopment, they might actually lose. This would imply that if rich incumbents control the lever of power,they might collectively have a vested interest in preventing financial development.
2.3. Why is financial repression a better way to protect incumbents’ rents?
67. Rich incumbents have other ways to protect their rents. Why chose to leave financial marketsunderdeveloped to do so? This could end up hurting the incumbents, who might occasionally need externalfinance. Why not ban entry into industry or finance outright? After, all, this could be better targeted atoutsiders, leaving insiders to enjoy the benefits of a more developed system. On closer scrutiny, however,we see that leaving finance underdeveloped presents several advantages over banning entry.
68. First, direct entry restrictions often require very costly enforcement. Enforcement becomesparticularly costly, if not impossible, when the product whose market is restricted has many closesubstitutes. This is further complicated by the possibility that entrants innovate around banned items. Eachnew threatening innovation has to be identified, categorised and then banned. The bureaucracy thatimplements this “License Raj” absorbs substantial rents of its own, and may compete for power with richincumbents. By contrast, leaving finance underdeveloped is an act of omission with few of the costsentailed by an act of commission like using the apparatus of the state to stamp out entry.
4. See Kukies (2000).
ECO/WKP(2000)38
18
69. Second, the active enforcement of restrictions on entry is a very public, and therefore, politicallytransparent process. In a democracy, citizens have to be convinced that restrictions on entry benefit them,and this is a hard sell when they are faced with the poor service and extortionate prices of the localmonopoly. By contrast, the malign neglect that leads to financial underdevelopment is less noticeable -- itgoes with the grain to have comatose bureaucrats who do not act rather than have overly active ones -- andcan be disguised under more noble motives. For example, the requirements that firms that list have to beprofitable for a number of years before listing can be sold to the public as a way of protecting them fromcharlatans, rather than as a way of preventing young unprofitable entrants from raising finance. Moreover,an underdeveloped financial market tends to be very effective in favouring precisely those who have themost power in an unequal society; the wealthy, the reputable, and the connected.
70. Finally, the problem with entry restrictions is that it does not give a clear rule about which of theincumbents will get the right to monopolise new areas of the economy that emerge as a result of innovationor expansion. The fight over the right to enter these areas, especially when outsiders join in, can be messy,costly, and very public. It also will take rents from incumbents and give it to the bureaucracy thatadministers the system. By contrast, when the financial market is underdeveloped, the set of potentialcompetitors for any new business is well defined and small -- restricted to those incumbents who currentlyhave financial slack. This leads to a “fair” allocation based on who is more profitable, and who has hadtime to digest the last expansion. Whatever cannot be allocated in this manner can be negotiated in smoke-filled backrooms in a more “civilised” manner by the incumbents who know each other.
71. This is not to say that direct entry restrictions are not used. Djankov et al. (2000) document that,across countries, to start a generic business an entrepreneur needs to follow an average of 10 bureaucraticprocedures, requiring 63 days, with a cost equal to one third of the average per capita income. In somecountries, however, the restrictions are more severe. In Bolivia the number of procedures is 20, with a costequal to 2.6 times the average per capital income. These regulations -- the study finds -- do not seem to beused to screen out bad producers or protect the environment, but rather to restrict entry. If the trueobjective it is to limit entry, then it is efficient to use multiple instruments, including financial repression.
2.4. What determines outcomes?
72. Now that we have specified motives, what determines outcomes? The major beneficiaries of adeveloped financial system, new entrepreneurs in businesses with high initial investment requirements andlong cash cycles, are by far the weakest group politically. In the absence of well-functioning financialmarkets, they may not even exist precisely because they cannot even get the finance to start up. Thus, theyare unlikely to drive the political agenda in any country.
73. The other major beneficiaries of financial development, ordinary people, can only providelukewarm support. Their benefit from financial development is too indirect, and often clouded by mis-information about risks, for them to overcome co-ordination costs and organise to demand it.
74. Thus the fate of financial development will rest on the interest of wealthy incumbents, the groupwith the lowest co-ordination cost and, thus, the group most likely to influence political outcomes. Wealready argued that, in general, incumbents do not receive big benefits from financial development.Occasionally, though, they may see benefits. Their position, then, will depend upon the relative size of thecosts and benefits.
75. Industrial incumbents benefit from financial development when their investment opportunitiesare high relative to their ability to finance them. A sudden expansion in required scale, perhaps because ofan opening of new markets, increases their demand for financing. The increased scale may also serve as anatural barrier to new entrants, reducing the need for financial underdevelopment as an entry barrier.

ECO/WKP(2000)38
19
Alternatively, a sustained period of poor economic conditions may deplete the reserves of incumbents,allowing them to be more amenable to financial development when the economy turns up.5
2.5. Financial development and openness
76. One such period when opportunities expand disproportionately compared to resources is when aneconomy opens up to foreign trade. It is not surprising that the periods of expansion in world trade -- thelatter halves of both the nineteenth and twentieth centuries -- have been, broadly speaking, associated withincreasing financial development. But we believe that openness promotes financial development, not justbecause it expands opportunities, but because it increases competition.
77. Periods of increasing openness have typically been ones where countries have opened theirmarkets on a quid-pro-quo basis. While foreign markets bring opportunity, openness also brings foreigncompetition in domestic markets which reduces the incumbents’ rents. This reduces the incumbents’incentive to keep out domestic entrants. The presence of foreigners, who may be less amenable to enteringinto cosy domestic arrangements cemented through traditional and familial ties, forces domestic businesspractices to change. Incumbents no longer have traditional practices to protect through restrictions ondomestic entry. Furthermore, foreigners may have added strength as a result of support from sophisticatedfinancial institutions and markets in their own countries, putting pressure on domestic incumbents to matchthem by allowing the domestic sector to develop.
78. The salubrious effect of product market competition from foreigners on domestic financialdevelopment is especially enhanced when it is accompanied by the free flow of capital across borders. Onepossible channel is that foreign capital finances new domestic entrants, thus making domestic financialunderdevelopment irrelevant as an entry barrier. We do not think this channel is particularly importantbecause informational frictions, fixed costs, etc., often make access to international markets prohibitivelyexpensive for small young firms. The firms with the best access to international markets tend to be thewell-established incumbent firms. But even this promotes financial development.
79. While collectively incumbents are better off repressing financial development, individually theyare better off with more access to funds. When their only alternative to the limited funds provided by theirown underdeveloped domestic financial system is to lobby for the creation of the infrastructure necessaryto develop a financial market that everyone has free access to, we have argued incumbents prefer to makedo with the limited funds. But incumbents have access to foreign financial markets that they can tapwithout opening the way for new entrants, they have no incentives to restrain themselves. If all the largefirms, however, raise finance outside, domestic financial institutions lose rents and feel compelled to pushfor financial development. As we will argue, this is what happened in Japan in the beginning of the 1980s,when the major industrial firms turned to the Euromarket to borrow and Japanese banks became bigsupporters of deregulation.
80. Pressure on domestic financial institutions also comes from individual investors. Once offeredthe choice, investors in a country that is financially repressed will rush to move their funds to moredeveloped markets, where they can be better diversified and earn higher returns. The loss of a captivesource of funds will push domestic financial institutions to improve their returns to compete with foreigninvestment opportunities. The result will be a strong pressure towards deregulation and financialdevelopment by the incumbents.
5. We have not considered the government as an interest group in its own right. But it is one, and it has the
incentive to support financial development when it sees, for example, that doing so will alleviate its budgetconstraint. Thus the government may support opening up if it finds that it can borrow resources frominternational markets, i.e. when the world economy is healthy.

ECO/WKP(2000)38
20
81. A final source of pressure for financial development comes from the foreigners themselves. Sincethey are not part of the domestic social and political networks, they prefer transparent arm’s lengthcontracts and enforcement procedures to opaque negotiated arrangements. It is not a coincidence that theseare the very requirements of potential domestic entrepreneurs who are also outsiders to the domestic clubs.Thus foreigners are a force for financial development, who add a powerful established voice to the weakervoice of would-be entrepreneurs when the economy opens up.
3. A test of the political theory of financial development
82. It is hard to test directly the claim that the absence of financial development, in countries thatseem to have the capability of creating the necessary institutions, is essentially caused by politicalopposition. Our theory, however, does lead to some indirect tests. Whatever the configuration of domesticpolitical power -- a subject of much debate among political economists -- both the incentive of domesticincumbents, and their ability, to hold back domestic financial development is likely to be the least when thecountry’s product and financial markets are open. This suggests a testable hypothesis: a country’s financialdevelopment should be positively correlated with its degree of openness to product and capital flows.
3.1. Preliminary concerns
83. There are three immediate issues to deal with before we proceed to tests. First, what is therelevant measure of financial development from the perspective of our theory? Second, could there bemore mechanical channels for the link between openness and financial development? Third, is opennessnot endogenous?
The relevant measure of financial development
84. As we have argued, the amount of funds raised from arm’s length financial markets or theamount of credit offered by competitive banking systems could be measures (albeit crude) of financialdevelopment. Unfortunately, we do not know how competitive the banking system is -- we only havemeasures of the quantity of deposits. The banking system could be concentrated and captive to incumbentinterests, dominated by state owned banks, or just plain inefficient. Therefore, we prefer to use the size ofthe arm’s length financial markets as our measure of development. This also accords well with the viewthat arm’s length markets will emerge only when financial infrastructure such as disclosure requirements(see Sylla and Smith, 1995) and investor protection is reasonably developed (see La Porta et al., 1998),while banks can exist even when it is primitive (see also Rajan and Zingales, 1998b).
85. We will use the ratio of the sum of exports and imports of goods to GDP as our measure ofopenness (we will shortly explain why we do not use capital flows). We will need a proxy for the demandfor financing. Bairoch (1982) calculates an index of industrialisation across a group of countries for anumber of years. The index number in a year reflects a country’s absolute level of industrialisation in thatyear, with England in 1900 set at 100. There are measurement issues with any index, but this one seemswell accepted among economic historians. Bairoch’s index will be our preferred control for the demand forfinancing whenever it is available. We will use per capita GDP when Bairoch’s numbers are not available.
Problems of reverse causality
86. We must also be cautious about the problem of reverse causality. Foreigners may choose toinvest in a country, or raise financing from it, when its financial infrastructure is highly developed. This is

ECO/WKP(2000)38
21
why we cannot use cross-border capital flows as a measure of openness because it may be directlyconnected with financial development. In practice, there were few impediments to cross-border capitalflows before 1929, and there are few today. On the other hand, cross-border flows were heavily restrictedin the Bretton Woods era, and negligible in the 1970s. Therefore, our hypothesis has the strongestlikelihood of holding in both the early and late part of the 20th century.
87. Even trade in goods may generate transactions on the capital market. In the early part of thiscentury, other countries financed their imports of goods from England by raising money in London.Therefore, there may be a mechanical link between the volume of transactions on the capital market andtrade. For this reason, we only use issues or capitalisation of domestic companies as our measure offinancial development. This should not be mechanically linked to the volume of trade.
88. A less compelling argument is that financial transactions generated by trade in goods could spurdomestic financial development (at the very least by increasing liquidity in financial markets). While thismay have been important in the past, we are sceptical that it is of immense importance in the modernindustrial economy. Moreover, if trade drives financial development directly, it should also do so duringthe Bretton Woods era. We will check for this. However, to directly address this issue, we will use analternative measure of openness that is not directly related to volume, the tariff levels in a country.
Problems of endogeneity
89. There is a large literature (see, for example, Gourevitch, 1986; Rogowski, 1989; O’Rourke andWilliamson, 1999) suggesting that the decision to open up or close down an economy to trade is a politicalone, based on the relative strengths of the sectors that stand to gain or lose from openness. Our point isrelated in that we examine the incentives of incumbents, both in the financial sector and in the industrialsector, to press for financial development. But implicit in our argument is that there may be commonfactors determining both the degree of openness and the degree of financial development.
90. For example, if incumbents in the industrial sector are very efficient (perhaps because of anabundance of capital), they may welcome the opportunity to trade. Also, because they are so efficient, theymay not fear domestic competition. As a result, they may welcome financial development. The point hereis that trade openness and financial sector development are both politically determined, but the former neednot directly influence the latter.
91. The correlation stemming from a common causal variable is certainly consistent with ourpolitical view of financial development, but we are also interested in the direct effect of openness onfinancial development, because evidence of such an effect would give greater credence to the details of ourtheory. One way to partially correct for the omitted variable is to include it -- in this case include a measureof the efficiency of the industrial sector. Bairoch’s measure of per capita industrialisation is a reasonableproxy.
92. A second method is to use a pre-determined measure of openness or to use an instrument foropenness that is correlated with openness but not with financial development. We will do both in theanalysis.
93. We will start by analysing the effect of openness on financial development in 1913, the earliestdate for which we have data for a sizeable number of countries and also a period were international tradeand capital flows were relatively free. We then repeat the exercise for the most recent data we have (1999),which are also taken from a period when international trade and capital flows are relatively free. We willfinally repeat the exercise for the intermediate years, when international trade was first shut down (after the1929 crisis) and then slowly built up again (in the post WWII period) and when international capitalmovements were relatively restricted.
ECO/WKP(2000)38
22
3.2. Issues in 1912
94. We obtained data on total public issues by domestic firms in a set of countries in 1912 from the1915 Bulletin of the International Statistical Institute (IIS) in Vienna. There are more countries in this IISsample than we have in our 1913 sample (which we have put together from individual sources in eachcountry), so we start with these data. We have checked that the data in the IIS sample seem accurate bycomparing with independent sources, and they do seem to represent net rather than gross issues. Ourdependent variable is total issues to GDP in 1912.
95. Our explanatory variables are the index of industrialisation, and the index of industrialisationinteracted with the degree of openness in the economy. Intuitively, more openness implies more of thedemand should be financed through arm’s length markets, hence we expect the coefficient on theinteraction term to be positive.
96. We first present summary statistics and pair-wise correlations between the various variables inTable 6a and b. The ratio of issues to GDP is positively correlated with the index for industrialisation(0.43, p = 0.07), the per capita GDP in dollars (0.04, p = 0.87), and with openness (0.33, p = 0.17), andnegatively correlated with tariffs on manufacturing (-0.28, p = 0.28). The correlation with the interactionbetween the index of industrialisation and openness is both high and very significant (0.69, p = 0.002).
97. In Table 6c, we present coefficient estimates of regressions in which the dependent variable isissues to GDP in 1912. When we include only the index of industrialisation as an explanatory variable[column (i)], it has a positive estimate but is significant at only the 10 per cent level. When we include boththe index of industrialisation and the interaction between industrialisation and openness in column (ii), thecoefficient of the interaction term is highly statistically significant (p = 0.011). The magnitude of the effectis also large. A 1 standard deviation increase in the interaction term increases the ratio of issues to GDP by58 per cent of its standard deviation. Interestingly, the estimated direct effect of the index ofindustrialisation falls to a sixth of its value in the previous column, and now is statistically insignificant.
98. Since we have so few observations, we plot issues against the index of industrialisation inFigure 1, and against the interaction variable in Figure 2 to show that the results are not driven by outliers.In particular, the reason the index of industrialisation does not explain issues so well is because someheavily industrialised countries were relatively closed and issued little (e.g. the United States) at this time.
99. Recall that the endogeneity of openness may be a concern. One way to address this is to findsome variable that is correlated with openness, but not with financial development. One such variable maybe the size of the country. Small countries typically have to be more open since it is difficult tomanufacture everything internally. So we include the interaction between the index of industrial productionand the country’s population in 1913 as an instrument. The resulting two-stage least squares estimate incolumn (iii) is about 25 per cent larger in magnitude and still statistically significant at the 5 per cent level.
100. Another concern may be that we proxy for openness with the volume of goods traded, and theremay be a disguised link between the volume of trade and the volume of financing. One measure ofopenness that is not directly a measure of volume is the tariff on manufactured goods. We use this as aproxy for the extent of openness in column (iv), and the two-stage least squares estimate (using the sameinstrument as in the previous column) is negative and significant.
101. Finally, one might think that anything interacted with the index of industrialisation will produce astrong positive coefficient on the interaction term. This is not the case. For example, if we interact adummy indicating whether a country has a common law origin with the index of industrialisation andinclude it in the regression we find a negative and highly significant coefficient [column (v)]. The directpair-wise correlation between the common law indicator and issues to GDP is also negative (-0.24,p = 0.32) suggesting this finding is not simply an artefact of the interaction. Finally, including the Common

ECO/WKP(2000)38
23
Law indicator as a separate variable instead of as an interaction also produces a negative coefficient. Atleast in our sub sample, Common Law countries use markets relatively less for financing for any givenamount of industrialisation.
102. To confirm the findings from this data set, we plot graphs of three other measures of marketdevelopment in 1913 vs. the interaction variable. The three measures are the market capitalisation ofdomestic stocks (Figure 3) and the number of listed companies per million of population (Figure 4). Bothconfirm the relationship we document earlier, and even though we have a embarrassingly small number ofobservations, the coefficient is significant at conventional levels (regressions not reported).
3.3. Equity issues in 1999
103. We repeat the same exercise with data at the end of the sample period, using the ratio of equityissues by domestic firms to gross fixed capital formation, as reported by FIBV, averaged over 1998 and1999. Since we do not have Bairoch’s measure of per capita industrialisation for any country in 1999, weuse the log of 1+ 1999 per capita GDP in thousands of dollars instead, both as a stand alone explanatoryvariable and in the interaction with openness (as measured in 1913). As Table 7 column (i) shows, theinteraction is strongly positive and significant at the 1 per cent level. Thus the effect of openness onfinancial development is also present at the end of the sample period.
104. To check this is nothing specific to the small sample of countries for which we could get date in1913, we re-estimate the same regression including all the countries reported by FIBV. Since manycountries today were not free or did not exist in 1913, we measure openness in 1998. Again the coefficientestimate [see Table 7, column (ii)] on the interaction variable is positive and statistically significant at the1 per cent level. We graph in Figure 5 the relationship between equity issues and the interaction to showthat the estimated relationship is representative. The interaction continues to be statistically andeconomically significant if we use as dependent variable the number of companies per million population,or the market capitalisation to GDP ratio in 1999.
105. Finally, when we replace the interaction variable with the Common Law indicator [see Table 7,column (iii)], or with its interaction with log per capita GDP (not reported), the coefficient estimate ispositive but no longer significant when the dependent variable is equity issues or market capitalisation, andis strongly significant only for the number of listed companies.
3.3. Issues in intermediate years
106. We do not have enough data points for the years 1929-1980 to be confident of our estimates.Nevertheless, the trend we observe seem to be the following. Using the measure of openness calculated in1913 in all subsequent years as a “natural” measure of a country’s propensity to be open to trade, we re-estimate a regression similar to the one in column (ii) of Table 6c, except that the dependent variable is theratio of equity issues to gross fixed capital formation that year, and the explanatory variables are the indexof per capita industrialisation estimated by Bairoch for that year, and the interaction between the index andopenness.6 It turns out that the coefficient estimate for the interaction is positive but not significant in 1929(its magnitude is similar to that in 1913) and the magnitude is much smaller in 1938. In the post WorldWar II years, it turns negative but not significant in 1950, 1960 and 1970, and is negative and significant in1980. Thus over the period that trade expanded but cross-border capital flows were still discouraged,countries that had historically been more open were not financially more developed.
6. We do not use total issues because it is very hard to obtain a consistent treatment of debt across countries.

ECO/WKP(2000)38
24
107. In sum, our political economy explanation seems to be important in explaining the cross-countrylevel of financial development in 1913 and in 1999, but is less successful, especially in the period afterWorld War II until 1980. Thus, to explain the reversal of financial development in the middle of the 20th
century and its resurgence in the last two decades we need to add another leg to the political economy storywe have presented so far.
4. Political backlash
108. In our attempt to explain the political resistance to the development of financial markets we havefocused on their role in reducing or eliminating incumbents’ rents. In doing so, however, we haveimplicitly assumed that these rents have no positive economic role. This is indeed the correct assumption ina standard neo-classical economic model. But in the imperfect real world, where detailed long-termcontracts are hard to write and even more difficult to enforce, the existence of rents can sometimes play awelfare-enhancing role. The possibility of earning a rent facilitates the formation of long-termrelationships, which can provide a form of insurance against bad times that the market cannot easilyprovide. The rise of competitive arm’s length markets destroys these relationships and thus destroystraditional social and economic sources of insurance.
109. In such a case, political authority has to step in to provide the necessary insurance, especially inbad times. But open, competitive, markets make it hard for any political authority to raise the necessarytaxes and provide the demanded cross-subsidies without causing worry to investors and outsiders about itsfuture intentions. Thus, openness, which was so good for the expansion of markets, also indirectly destroystraditional sources of insurance. Moreover, open markets limit the ability of the political authority tomitigate suffering in bad times. Of course, better markets can provide some insurance in their own right.But, empirically (see Rodrik, 1997, 1998), it appears that the effect of greater openness is to i) increase therisk an economy is subject to ii) increase the demand for government supplied insurance, and iii) reducethe ability of governments to supply this insurance.
110. With the government unable to provide insurance when the economy was open, despite severe,and widespread hardship caused by the beginnings of the Great Depression, there was a popular demand torestrict openness, especially to foreign trade and capital flows. Moreover, with the world sinking intodepression, foreign markets were shrinking. With little outside opportunity, incumbents had little desire tomaintain openness. Moreover, it was convenient for incumbents to piggy-back on the popular demand forprotection to shut down not just trade and capital flows, but also reverse financial development in order torestore their protected positions in the domestic economies. We think that a political coalition betweenthese two interest groups can account, not just for the growing financial repression before World War II,but also the Bretton Woods consensus, which emphasised trade but not financial flows.
4.1. Competitive markets and insurance
111. Let us illustrate the link between competition, long –term relationships, and insurance, with bank-firm relationships, though these could well be employer-employee relationships, or relationships between acommunity and its members. Within such relationships a bank provides help -- in the form of credit,advice, and guarantees to third parties -- to a borrowing firm that no one else will touch. This assistance isnot committed up front in an explicit contract. Instead, the financier helps because he has confidence thatthe continued relationship will be beneficial. These future benefits, however, stem from the existence of animperfectly competitive market going forward. The financier can recover the cost of the rescue by chargingan above-market rate to the rescued firm after it emerges from financial distress. In a competitive system,however, after being rescued a firm would face a horde of eager bankers competing for its financialbusiness. Since these bankers show up only when the rescue effort is successful, they cannot be forced to
ECO/WKP(2000)38
25
pay for the cost of the rescue, which at that time is sunk. This sort of dynamic free-riding that competitionbrings destroys the financier’s ex-ante incentives to rescue a distress firm.
112. The advent of competitive arm’s length markets, thus, makes it harder for long term bank-firmrelationships to form, and increases the risks to firms of being shut off from credit in a downturn. Moregenerally, the increase in competition stemming from a development of financial markets puts great stresson long-term relationships because opportunities outside the relationship become more attractive. In sodoing, it makes it harder for parties to form relationships within which they can provide each othermutually beneficial insurance.
113. Not only do competitive markets make it harder to give-and-take over time, they also make itharder for economic organisations like firms to cross-subsidise the inefficient (and the unskilled, or theuntalented) with the produce of the efficient. While competition between economic organisations inproduct markets mercilessly exposes those who do not pull their weight, competition in the input marketfor those who are efficient pushes up their wages, leaving less surplus to subsidise the inefficient. Whendetailed long-term contracts are hard to write or hard to commit to, the introduction of markets can destroyold sources of social insurance without creating new ones (see Polanyi, 1944; Diamond and Dybvig, 1983).
114. This reduction in the opportunities for insurance would not be a concern if similar insurancecould be obtained in the marketplace. But markets find it difficult to provide insurance to people and firmsagainst large changes -- such as the destruction of entire industries, the disappearance of entire classes ofjobs, or long term economic downturns. In sum, up to a point, the better the market works on somedimensions, the less the insurance available against calamitous downturns, since traditional sources ofinsurance such as bank relationships, employment relationships, relationships within the community, etc.,are destroyed by the market. This is the Achilles heel of competitive markets, for the lack of insuranceprovides a focal point for hitherto dispersed, disaffected, parties to overcome free-rider problems andorganise, and try and attack the entire market system. Let us now provide more details.
4.2. The turmoil caused by wars and depression
115. There were four reasons why before World War I the inability of the market, broadly speaking, toprovide insurance did not matter much. The first is that the economic upheavals that people had to facewere less important than the ones that were to come. The second reason is that the Gold Standard simplydid not allow governments to dislocate their budgets by providing social security and welfare support tothe needy. Third, the liberal belief in the relentless logic of the market made it unwise for governments tointerfere in the Darwinian winnowing unleashed by market forces. Intervention, it was thought, would onlyprolong the pain. Last but not least, the poorer sections of society -- the workers, the small farmers, and theunemployed -- were not organised, and had little political voice.
116. The two World Wars and the Great Depression overturned all four reasons. Even apart from itseffect on the map of Europe, the political and social effects of the First World War cannot be understated.For one, the exigencies of co-ordinated war production had created all manners of hierarchicalorganisations throughout the economies of Continental Europe. For example, McNeill (1982, p. 339)describes the control of the war effort in Germany after 1916 thus:
“…the generals in charge often became impatient with the financial claims andcontroversies that continually embroiled and sometimes obstructed prompt and deferentialobedience to their demands. As shortages rose, one after another, the generals relied moreand more on big labour and big business to remodel the economy according to militaryneeds. Each party got more or less what it wanted: more munitions for the army, more

ECO/WKP(2000)38
26
profits for the industrialists, and consolidation of their authority over the work force forunion officials.”
117. In other words, the economy was being run like a centralised hierarchy, modelled along the linesof the army. Centralisation was aided by the cartelisation of industry, of the banking sector, and of thework force because this reduced the number of parties the central authority had to negotiate with.Moreover, the “corporatisation” of the economy seemed to work, at least in delivering the necessarymunitions, even though distortions built up elsewhere. As we will argue later, many saw this as anattractive template to return to during the years of the Depression.
118. Once the war ended, significant adjustment had to be made to return to civilian production. Butlabour was now organised. Moreover, it was disillusioned with the status quo. The senseless carnage of awar that left all its main protagonists worse off led many to doubt the calibre and motives of their politicalleaders, and discredited the pre-war liberal consensus. The trenches during the war served as classroomswhere the working class absorbed radical ideas. With labour’s newly found ideas and organisation, it wasclear that it would no longer continue unquestioningly to absorb the costs of adjustment to macro-economic imbalances. And there were significant imbalances. Prices and wages had to adjust, especially ifa country were to go back to the Gold Standard, industries that had prospered during war-time autarkywould have adjust to international competition, financial institutions would no longer have governmentguarantees, and would have to learn how to evaluate credit again. Moreover, some of the victors weresaddled with enormous war debts, and the vanquished with reparations, and extraordinary surpluses had tobe generated to make these payments.
119. The consequence was industrial strife in country after country. The very concept of privateownership was questioned, and for a while revolutionary change seemed a possibility. Yet for a variety ofreasons that we will not enter into here, the immediate post-war radical worker movements collapsed (seeMaier, 1987 for a detailed analysis). Industry and the more moderate labour organisations reached a modusvivendi (see Roe, 1999).
120. Despite the difficulties of adjustment, however, the pre-war liberal consensus was strong enough,as well as the prospects of international trade attractive enough for virtually the entire industrialised worldto be on the Gold Standard again by 1927.7 But there was no longer a group which would bear the cost ofadjustment to imbalances silently. Strong interest groups ranging from labour to import-substitutingindustries were unwilling to bear the risks the market imposed and demanded government subsidies if notoutright protection. Subsidies increased, as did deficits. These deficits could be sustained under the GoldStandard without painful domestic deflation only if some country were willing to finance them by lending.The United States performed this role only until 1928.
121. The stock market crash of 1929 in the United States and the ensuing Great Depression was theproverbial straw. With the single biggest consumer in the world contracting, exports plunged all around theworld, further aggravating balance of payment problems in Europe, Japan, and Latin America. Domesticprice deflation was necessary to stay on the Gold Standard, and to generate the surpluses to repay debt, butone country’s deflation was simply a contraction of the export markets for another country.
122. Moreover, as prices fell, with domestic debt largely nominal, defaults increased. Losses atfinancial institutions increased, and the threat of a financial crisis put pressure on central banks to interveneand bail out the system. Again, under the Gold Standard, central banks could simply not lend freely to bailout the banking system without jeopardising the exchange rate.
7. Eichengreen (1996, p. 48).
ECO/WKP(2000)38
27
123. With domestic demands for insurance against these severe economic conditions increasing, therewas pressure for governments to do something, and not simply wait for the markets to return eventually toequilibrium. As Keynes famously wrote, “In the long run we are all dead”. Moreover, the benefits ofbelonging to the Gold Standard seemed less and less clear. For example, one of its most attractive featuresfor governments had been the ease with which they could finance their deficits by borrowing abroad. Infact, for significant periods in the decades preceding 1913, current account deficits exceeded 10 per cent ofGDP in Australia, Canada, and Argentina, while in the surplus countries of Britain, France, Germany andNetherlands, net capital outflows touched 9 per cent.8 With international lending virtually at zero,governments saw little direct reward in paying a political price to adhere to the Gold Standard.
4.3. The political response
124. Clearly, the response in each country to the common shock of the depression emerged fromcomplex interactions between its historical experience, its political institutions, and the strength of its keyplayers. But in general, unbridled competition in the 1920s was held to blame for what, from the vantagepoint of the Depression years, seemed like excessive investment by industry, excessive credit creation bybanks, and excessive speculation in the stock market by all and sundry. To restore people’s faith,politicians promised to curb the forces unleashed by the market.
125. These sentiments were reflected in statements made by politicians from very differentpersuasions. As Charles Maier argues, fascism was appealing because it promised ordinary people thatthey would not be powerless against a soulless and merciless market. Hitler felt that economic problemscould be overcome by political will. He wrote (cited in Maier, 1987, p. 65):
“The Volk does not live on behalf of the economy, its economic leadership, or economic andfinancial theories, but rather, finance and economy, economic leadership, and even theoryexist only to serve in the struggle for our people’s self determination.”
Of course, finance and the economy (i.e. the market) would be tamed under his leadership. The tyranny ofthe market weighed equally on Franklin Roosevelt. In his acceptance of the Democratic Party’spresidential nomination in 1936, he alleged that before the New Deal a:
“small group had concentrated into their own hands an almost complete control over otherpeople’s property, other people’s money, other people’s labour – other people’s lives. Fortoo many of us life was no longer free; liberty was no longer real; men could no longerfollow the pursuit of happiness”
Since the market seemed to be inflicting pain on the many for the profit of a few, Roosevelt concluded:
…Against economic tyranny such as this, the American citizen could appeal only to theorganised power of Government.” (Kennedy (1999, p280)
The response of governments to the problems of the depression varied in their details but typically hadthree common themes. The first was to depart from the Gold Standard. As Roosevelt declared in hismessage to the World Economic Congress in July 1933:
“The sound internal economic system of a Nation is a greater factor in its well-being thanthe price of its currency in changing terms of the currencies of other Nations.” (Kennedy,1999, p. 157)
8. Bordo, Eichengreen and Irwin (1999, p. 28).

ECO/WKP(2000)38
28
126. With no external discipline on the extent to which governments could intervene, they were nowfree finally to remedy what they saw as obvious defects of the market. So the second theme was to curbcompetition, both from external sources and from internal sources. Finally, if prices were no longer set in acompetitive market, something had to take the place of the market in channelling resources. Instead ofusing the market to channel resources, the command and control structure only recently disbanded after thewar provided an attractive alternative. So the third common theme was a return to the corporatisthierarchical management of the economy, which had been “first explored during World War 1 [and]became unmistakable in many countries by the mid 1930s.”9 We now explore the second theme, that ofcurbing competition, in greater detail for that will lead directly to our explanation of the first great reversalin financial markets.
4.4. Autarky and its effect on the financial sector
127. Competition had to be curbed. As we argued earlier, foreigners had access in the past becausedomestic elites saw opportunities in trade. With export markets no longer proving attractive, there was noreason to allow foreigners into the domestic market. They were the easiest targets because they had nopolitical voice. Imports of goods and people were curbed through prohibitive tariffs and restrictiveimmigration policies (see O’Rourke and Williamson, 1999 for an excellent recent survey).
128. Domestic competition was also problematic. The head of the National Recovery Administrationin the United States, Hugh Johnson, argued that employers were forced into layoffs during the Depressionas a result of “the murderous doctrine of savage and wolfish competition, [of] dog-eat-dog and devil takethe hindmost”. By contrast, “the very heart of the New Deal is the principle of concerted action in industryand agriculture under government supervision”.10 The NRA sought to set prices, control overproduction byallocating production quotas, and would thus stabilise wages. Its model was the War Industries Board of1917-18.11 While the NRA itself was declared unconstitutional by the United States Supreme Court in1935, hierarchical control of industry became firmly entrenched in other countries, especially Germany,Italy, and Japan.
129. The government’s desire to curb competition left no place for new entrants. This was mostwelcome to domestic incumbent firms, who freed from external competition were happy to reachagreements with other incumbents, and do away with new entry into domestic product markets, especiallyif the government was agreeable. Since control over financing was the easiest way to establish control overentry, it was natural that political attention would shift towards the financial markets and institutions.Because the financial sector was in disarray, political intervention could be effectively disguised as anattempt to introduce stability into the system.
130. Clearly, elements in the domestic financial sector would be opposed to controls that wouldreduce their profitability. If foreign capital had been flowing freely, the possibility of seeing business go toforeign financial institutions or foreign markets would have made the domestic financial sector extremelyreluctant to accept constraints on its activities. Since cross border flows had virtually stopped, this was nota concern. Moreover, government controls brought with them the prospect of government enforced cartels,which could enhance rather than reduce profitability. With little prospect of foreign competition in thefinancial sector, and with financial markets moribund, domestic financial institutions were willing toaccept curbs, especially on their market oriented activities, if other activities were consequently renderedmore profitable.
9. McNeill, p. 346
10. Kennedy (1999, p. 179-180)
11. Kennedy (1999, p. 177)
ECO/WKP(2000)38
29
4.5. Intervention in the financial sector
131. The interventions in the financial sector typically took two forms. The first was, of course, arestructuring of the banking sector in a way that promoted fewer, larger banks, and limited inter-bankcompetition. This fed into a bank consolidation movement that had started early in the century in manycountries. Since better-diversified, more profitable, banks are more stable, it is hard to argue that thesemoves were not motivated by concerns about stability. But it is as difficult to be a little pregnant as it is tobe a little interventionist. For instance, the opening up of the public purse to rescue failed banks sends asignal to healthy banks that poor business decisions will not be severely penalised. The only way toprevent their taking advantage of these public subsidies is to regulate carefully their private activities.
132. In the absence of political checks and balances, it is all too easy for the government and thebankers to enter into a Faustian pact, with the government restricting entry and inter-bank competition,ostensibly in the interest of the stability of the system, and bankers obeying government diktats aboutwhom to lend to in return for being allowed to be part of the privileged pack. Since incumbents in industrywere likely to get the directed loans, they were willing to go along and the outcome in many countries,whether conscious or not, was a banking system that was more conservative in financing newcomers, andmore accepting of government direction.
133. A co-operative, conservative, banking sector is all for naught if the arm’s length stock and bondmarkets continue to finance entry and compete with the banking system. This is where the second form ofintervention took place. In addition to being concerned about the ruinous effects of financial competitionon the health of the banking system, the government also wanted private investment to flow through thebanking sector because these flows could be more easily directed to preferred activities than if they wentthrough the arm’s length markets where the government had little control. In a number of countries,measures were put in place restricting the ability of corporations to issue securities in the market, andreducing the attractiveness of certain securities. These ranged from stiffer listing requirements (e.g. theUnited States) to outright prohibitions on issue (e.g. Japan) to prohibitions on paying high dividends(e.g. Germany). Even though banks often had market related activities such as underwriting, they were notaverse to the restriction on arm’s length financial markets for they recaptured even greater profits in thenow-cartelised lending business.
134. Interestingly, the ideology under which these anti-market forces coalesced differed from countryto country. But the basic outcome no: the working of financial markets was severely impaired by theintervention of the Government, which assumed a greater direct and indirect role in allocating funds toindustry. To illustrate how such policies were approved and implemented we chose two examples at theopposite ends of the political spectrum: Japan and Sweden.
4.6. The demise of financial markets in Japan
135. Japan, as our data suggest, was making rapid strides to developing strong financial marketsbefore World War I. Japan benefited during the war because it did not participate in it, and managed toexport to other Asian countries that had been cut off from European producers. Japan’s banking systemwas competitive and kept pace with the demands of industry. Until 1918, there were no restrictions onentry into banking, provided minimum capital requirements were met. While there were over one thousandbanks when World War I began, by 1920 there were over two thousand banks. The five large Zaibatsu(translated as “financial cliques”) banks accounted for only 20.5 per cent of the deposits before the war,and there were many small banks.12
12. Aoki, Patrick and Sheard (1994), and Hoshi and Kashyap (1998).
ECO/WKP(2000)38
30
136. The end of the war brought renewed competition in the markets that Japan’s exporters hadmonopolised during the war. Compounding the pressure on profits, the Great Tokyo Earthquake in 1923caused damage estimated at an incredible 38 per cent of GDP. Many banks had to be bailed out by thegovernment through medium term loans. However, when the loans came due many could not pay, and theloans were extended until 1927. In the Spring of 1927, the Finance Minister, Kataoka, precipitated afurther crisis by announcing in the Diet that the Tokyo Watanabe Bank had been closed that day. While infact the bank had not been closed, and his ostensible intent was to goad the Diet in to increasing reliefmeasures, the outcome was a run on the Tokyo Watanabe Bank and a full-fledged banking crisis. The BankAct of 1927, enacted in response to the crisis, made clear the preferences of the authorities for aconcentrated and stable banking system by requiring banks to reach a minimum capital level of 1 millionyen within five years. By 1932, at the end of this five-year period, there were only 538 banks.13 Throughoutthe 1930s, bank mergers were promoted by the Ministry of Finance so that by 1945, there were only65 banks, and the share of Zaibatsu banks in total deposits had increased to 45.7 per cent.14
137. At the same time as the banking system was becoming more concentrated, the government’scontrol over it was increasing. This became especially pronounced as the government sought to directfunds towards supplying the war against China in 1937. With the Temporary Fund Adjustment Act in 1937and the Corporate Profits Distribution and Fund Raising Act in 1939, the government, through theIndustrial Bank of Japan, assumed control of financing. All security issuances and lending decisions abovea certain amount had to be approved by the government, and those that were not related to the war effortwere typically not approved. Further Acts simply strengthened the government’s control and thisculminated in the designated lending system by which each munitions company was designated a majorbank which would take care of all its credit needs. By the end of the war, the banking system was not onlyconcentrated, but well and truly under the control of the government.
138. While it seems undeniable that the transformation of competitive Japanese banking into whatbecame the post-war main bank system was orchestrated by the government, the demise of the arm’slength financial markets also had the active participation of the banks. In 1929, 26 per cent of the liabilityside of large Japanese firm balance sheets consisted of bonds while only 17 per cent was bank debt. Asbond defaults increased, a group of banks together with trust and insurance companies seized on the pooreconomic conditions to agree in 1931 to make all subsequent bond issues secured in principle. Thisimmediately made it harder for their clients to issue public debt. With the acquiescence of the Ministry ofFinance, the agreement was formalised in 1933 through the formation of a Bond Committee. TheCommittee determined which firms could issue bonds, on what terms, and when. All bonds were requiredto be collateralised, and banks were to serve as “trustees” for the collateral in exchange for a substantialfee. Giving banks the responsibility for determining firms’ right to access the public bond markets was likegiving a fox who resided in a chicken coop the right to determine which chickens could leave.15 Theobvious outcome was that a flourishing bond market was killed off. By 1936, bonds were down to 14 percent while bank debt was up to 24 per cent of the liability side. By 1943, 47 per cent of liabilities werebank debt while only 6 per cent were bonds.16
13. This paragraph is drawn from Hoshi and Kashyap (1998).
14. Aoki, Patrick and Sheard (1994).
15. That this was a cartel is further reinforced by Hoshi and Kashyap’s observation that security houses thatwere not part of the 1931 agreement started competing fiercely for underwriting business and continued tounderwrite unsecured bonds. Thus the market itself did not appear to develop a distaste for unsecuredbonds.
16. These figures are from Teranishi (1994).

ECO/WKP(2000)38
31
139. The equity markets were similarly choked through fiat. The attitude of the government towardsshareholders is illustrated by the following statement by a bureaucrat17:
"The majority of shareholders take profits by selling appreciated stocks, sell in times whenthe price is expected to fall, and often seek dividend increases without doing anything todeserve them. If these shareholders control the directors of companies, influence strategies,and seize a substantial amount of profits, then the system of joint stock companies hasserious flaws."
The Temporary Funds Adjustment Law crimped equity issues in 1937 by mandating that companies seekpermission before issuing. The Corporate Profits Distribution and Fund Raising Order required firms toseek government approval for increases in dividends if the level of payout was greater than 10 per cent,thus making equity unattractive. Still later, the Munitions Companies Act brought companies under thecontrol of government bureaucrats, and they were allowed independence from the shareholders so long asthey worked in the interests of the nation. Thus new stock issues, which accounted for 60-75 per cent of netindustrial funding in 1935 and 1936 fell to 20 per cent of funding by 1944-45.
140. Japan illustrates yet another point. Once a country walls itself off, the outside world has to bevery attractive before it opens up again. Entrenched hierarchies have the power to defend themselves. Oncethe banks had power, they were unlikely to give it up easily. For example, despite their best efforts to breakup the bank firm combines established during the period of militarisation, the post-war Americanoccupying forces could not prevent them re-emerging as the Keiretsu or main bank system. Hoshi andKashyap (1998) find that the effects of the government enforced bank-firm pairing under the designatedbank system towards the end of the war persisted long after World War II. Of the 112 companies in 1974that they found had descended from wartime munitions companies, the financial institution designated bythe government during the war was still the largest lender and one of the top 10 shareholders in 61 of thefirms. They found that 88 of the 112 companies still had close ties to their designated institution over30 years after the war!
141. Similarly, the Bond Committee, set up ostensibly to improve the quality of bond issuance duringthe Depression, survived until the 1980s. Even as Japanese industrial firms invaded the rest of the world inthe 1970s, their bond markets remained minuscule. It was only in the early 1980s, as Japanese firmsdecided to borrow abroad rather than depend on their antiquated financial system that Japanese banks hadto loosen their stranglehold. The powers of the bond committee were curtailed. The markets had theirrevenge as the banks paid the price for years of being shielded from competition, made terrible creditdecisions and drove Japan into an economic crisis that still persists.18
4.7. Sweden
142. While beset by many of the same forces as the other European countries, Sweden (andScandinavia in general) arrived at a different solution. While autarky was a possibility for larger economieslike France, Germany, and Italy, firms in Sweden had become big while servicing export markets. TheSwedish market, by itself, was too small. So the Liberal coalition resisted a move to autarky and theassociated intervention in the markets (see Gourevitch, 1986).
143. However, there were powerful forces against the liberals. The proverbial straw was when theSwedish Workers party (later the Social Democrats) and the Agrarian party came together in 1932 in what 17. Okazi, 1991, p. 382, cited in Hoshi and Kashyap (1998).
18. Bebchuk and Roe (1999) develop a theory of path dependence of governance to account for phenomenasuch as these.
ECO/WKP(2000)38
32
has been termed the cow trade. The Social Democrats accepted higher food prices and price supports inreturn for stable wages, policies for full employment, and social services. The business interests,dominated by the large internationally oriented firms first opposed this coalition, but became moreaccommodating when the Social Democrats became stronger in the election of 1936. In 1938, in the townof Saltsjobaden, labour, business, farming, and the government hammered out a pact by which thedemands of parties to the cow trade were respected by business in return for assurances about labour peace,continued private control over property and capital markets, and external openness. A similar consensuswas also reached in Norway in 1935 and Denmark in 1933 (see Gourevitch, 1986).
144. Thus Scandinavia adopted a middle path in the inter-war years, between the relatively marketoriented internationalism of the United Kingdom, and the autarkic, interventionist, policies of Germany.The continued openness at least in product markets ensured that there was competition in those markets,and reduced the incentive to mute domestic competition by repressing the financial markets. Nevertheless,since the consensus was between incumbents, it inevitably translated into actions that reduced the role ofthe financial markets, especially because international capital flows were moribund. Interestingly, the postwar consensus in much of Western Europe resembled the Scandinavian one.
4.8. Summary
145. It is useful to summarise our analysis so far. In our view, economic crisis, whatever its origin, ledthe retreat of financial markets and the concentration of the banking systems around the world. Thechannel we have argued for is the following: Crisis created a popular groundswell for insurance. The onlyway for governments to meet this demand was to escape from international discipline -- the fetters of goldin Eichengreen’s felicitous terminology. But the barriers erected to international competition, and thedwindling of international capital flows, made it much easier, and more attractive, to erect barriers tointernal competition both in the industrial and financial sectors.
146. Government were willing accomplices in this process of concentration because it made it easierto pursue their own agenda, which was now reinforced by popular legitimacy. The most destructiveagendas were those of governments with grievances carried over from the last war. These chose to focusresources on rearmament. Neighbours who were not actively militaristic had to respond because they weredirectly threatened by those who were arming. Regardless of why governments chose to co-ordinateresource allocation, the course of action was clear; since markets dance to the tune of profits and prices,and therefore are not responsive to the dictates of government, the sphere of markets had to be narrowed infavour of the sphere of hierarchies.
5. The aftermath of World War II and the resilience of financial markets in Europe
147. Two of the stylised facts identified in Section 1 remain unexplained thus far. Why didn’tfinancial development resume immediately after WWII and why did it resume in the last two decades ofthe 20th century. We will now try to address them.
5.1. Bretton Woods and restrictions on capital movements
148. The disruption to international trade caused by the two wars and the Great Depression wassignificant. While the average degree of openness (merchandise export as a percentage of GDP) was 8.2 in1913, it was only 5.2 in 1950 (O’Rourke and Williamson, 1999, p. 30). It was only in the 1970s thatinternational trade regained its pre WWI level. This delay, by itself, can explain the slow advancements offinancial markets after WWII. But an even more important reason is the restrictions on free capitalmovements imposed by the Bretton Woods agreement.
ECO/WKP(2000)38
33
149. The Bretton Woods agreement in 1944 advocated movement towards free trade in goods, butseverely restricted international capital flows. As Keynes, its architect, said (cited in Helleiner (1994,p164):
“Not merely as a feature of the transition but as a permanent arrangement, the plan accordsevery member government the explicit right to control all capital movements. What used tobe heresy is now endorsed as orthodoxy.”
The rationale was clear. Fixed exchange rates would facilitate trade in the same way as did the GoldStandard. But if capital was allowed to flow freely, it would hamper the ability of governments to providethe various sorts of insurance that was demanded of them by the new welfare states. Thus the argument forcapital controls and the second class status accorded to finance in the post-war economic order.
150. What lowers the political opposition to financial development is not just openness in trade, but acombination of foreign competition in the product markets and free access to foreign financing. With freecapital movements, institutions in the domestic financial sector have no way of protecting their industrialclients if foreign capital chooses to finance insurgents. At the same time, domestic financial institutionswill not allow the financial sector to remain repressed if domestic firms can escape to foreign financialmarkets.
151. If openness to trade is, by itself, insufficient to force financial development, then the restrictionson capital movements after WWII can explain why financial development did not take off after WWII,even though trade expanded. It can also explain why the trade openness does not have power in explainingfinancial development in the 1950-1990 period (see Section 3.3), while it has substantial power in 1913and in 1999, both periods when international capital flows were relatively unrestricted.
5.2. The breakdown of the Bretton Woods system
152. The story of the eventual breakdown of the Bretton Woods system has been told many times andelsewhere (see Eichengreen, 1996 for a comprehensive and accessible treatment). But the role played byconcerted political action has been under-emphasised. As Helleiner (1994) argues, even though in the early1970s Europe and Japan were interested in perpetuating the system of controls, the United States wasopposed. For one, the United States with its strong domestic financial institutions eyed the profits to bemade in the protected and underdeveloped foreign financial markets. Equally important, the United Stateshoped its well developed financial markets would attract foreign investors, an especially attractive prospectgiven the large US fiscal and trade deficits. Britain was also interested in doing away with capital controlsbecause it wanted London to re-emerge as a financial centre even though the United Kingdom had longceased to be the primary exporter of capital in the world. Therefore even in the 1960s, Britain encouragedthe growth of the Eurodollar market in London.
153. The United States removed capital controls in 1974, and this was followed soon after by thederegulation of broker fees on the NYSE in 1975. The United Kingdom responded to the competitivepressure form the United States by following suit on capital controls in 1979, and subsequently deregulatedits exchange with the Big Bang in 1986.
154. By the end of the 1980s, controls had effectively been removed throughout Western Europe,Scandinavia, and Japan. We believe that this has spurred the enormous amount of financial development inthe 1990s. In particular, we believe the formation of the European Monetary Union has opened updomestic financial systems to immense competition and has been instrumental in the creation of newmarkets around Continental Europe. As Kukies (1999) points out, the main distinguishing feature of thesuccessful new markets like the Neuer Markt or Nouveau marché is not so much that they have functionunder new laws, let alone new legal regimes, but that they have better disclosure requirements. What is

ECO/WKP(2000)38
34
also interesting is that these fledglings have been typically supported by the main financial markets andinstitutions in the country. While we believe that mandating better disclosure is an important aspect offinancial development (see La Porta et al., 1998; Rajan and Zingales, 1998a), we have to believe that itwas not the inherent difficulty of setting disclosure rules that prevented these exchanges from being bornearlier. Instead, we believe it was the support of the patrons that was lacking, and it required the threat offoreign competition to make the exchanges a reality.
155. In our view, thus, the resurgence of markets in the last two decades of the 20th century is stronglyassociated with the expansion of international capital movements and the consequent difficulty of financialrepression. That the recent resurgence of financial markets is particularly pronounced in ContinentalEurope (see Tables 2-5) should not come as a surprise. Thanks to European monetary integration, this isthe region of the world where capital has gained the most mobility, even though it was here that the post-war consensus emphasising domestic policy autonomy at the expense of financial development was,hitherto, strongest.
156. This last example seems to suggest the virtues of supra-national organisations in reducing the roleof private interests, like those of incumbents, in determining policy. But unlike Olson (1982), we are notconfidant that what he calls “jurisdictional integration”, the joining together of two distinct political entitiesinto one, will reduce the power of private interests. Olson suggests that, after integration, each entity’sprivate interests may be too small to influence policy in the merged entity. We are less optimistic. For one,before integration some private interests may be large enough to take the national interest into account ininfluencing policy. After integration, they may simply refocus on their private interests. Even if they aresmall enough to not worry about the national interest but large enough to influence policy beforeintegration, they may seek out and merge with similar organised interests after integration and continueinfluencing policy in the merged entity. We therefore believe that while “jurisdictional integration” maywork initially, eventually private interests will reassert themselves and capture the governance of themerged entity. Better yet to have jurisdictional separation, but free competition between the constituententities of these jurisdictions. This will result in competition in regulation between jurisdictions, whichalmost invariably reduces the possibility of capture.
6. Discussion and conclusion
157. This paper started with the ambitious attempt of attempt to make some sense of the broad patternsof financial development in the most developed economies over the twentieth century. We find that,contrary to the predictions of most existing theories, indicators of financial development do not seemmonotonic over time. In particular, we find that by most measures, countries were more financiallydeveloped in 1913 than in 1980 and that a major reversal took place between 1913 and 1950.
158. To explain this we outline a political economy explanation of the causes of financial development(or lack of thereof). Financial development breeds competition, which, in turn, eliminates rents. While thiselimination is, in general, welfare-enhancing, it makes incumbents worse off. Hence their opposition tofinancial development, which is likely to be successful given incumbents’ political clout. In good times,however, when trading and investment opportunities outside the economy look attractive, financialdevelopment can take place, because the incentives and abilities of domestic incumbents to oppose it ismuted. But openness and the competitive markets it engenders create a new source of potential opposition.The elimination of rents make long-term relationships harder to sustain, reducing the ability of parties inthe economy to insure each other. This generates another source of opposition to financial development:groups in need of insurance. A coalition between these interests in bad times can reverse the financialdevelopment that may have taken place in good times.
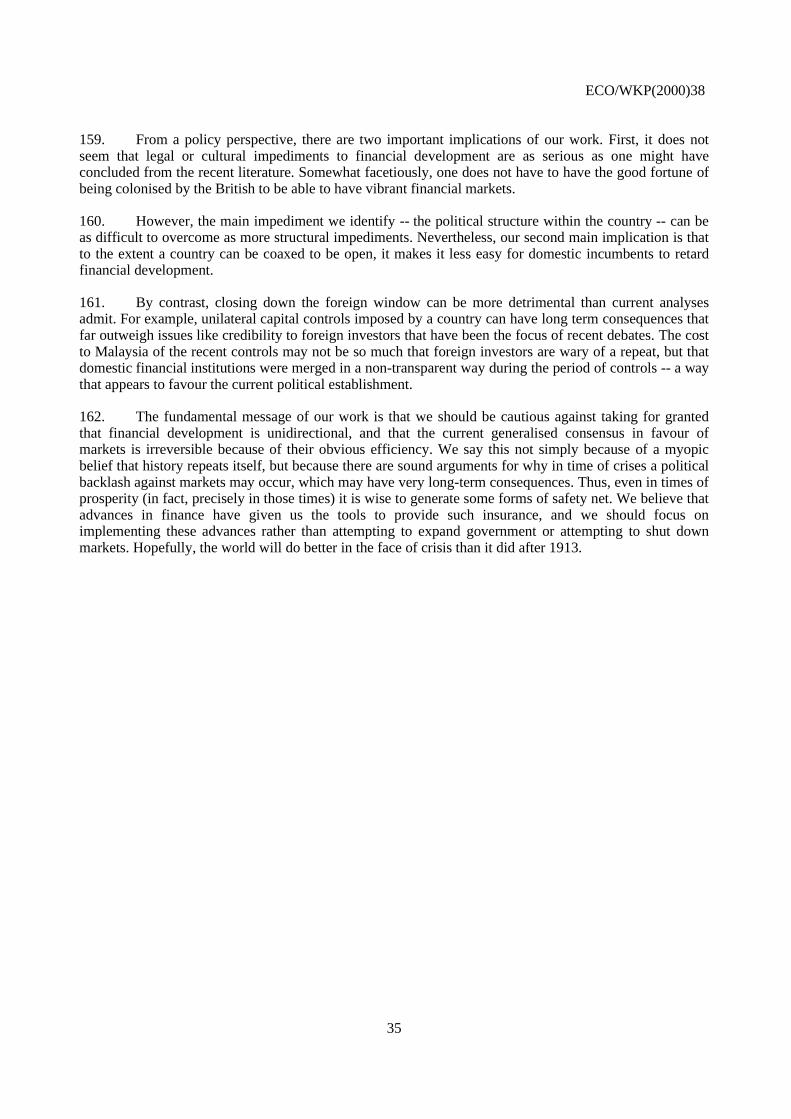
ECO/WKP(2000)38
35
159. From a policy perspective, there are two important implications of our work. First, it does notseem that legal or cultural impediments to financial development are as serious as one might haveconcluded from the recent literature. Somewhat facetiously, one does not have to have the good fortune ofbeing colonised by the British to be able to have vibrant financial markets.
160. However, the main impediment we identify -- the political structure within the country -- can beas difficult to overcome as more structural impediments. Nevertheless, our second main implication is thatto the extent a country can be coaxed to be open, it makes it less easy for domestic incumbents to retardfinancial development.
161. By contrast, closing down the foreign window can be more detrimental than current analysesadmit. For example, unilateral capital controls imposed by a country can have long term consequences thatfar outweigh issues like credibility to foreign investors that have been the focus of recent debates. The costto Malaysia of the recent controls may not be so much that foreign investors are wary of a repeat, but thatdomestic financial institutions were merged in a non-transparent way during the period of controls -- a waythat appears to favour the current political establishment.
162. The fundamental message of our work is that we should be cautious against taking for grantedthat financial development is unidirectional, and that the current generalised consensus in favour ofmarkets is irreversible because of their obvious efficiency. We say this not simply because of a myopicbelief that history repeats itself, but because there are sound arguments for why in time of crises a politicalbacklash against markets may occur, which may have very long-term consequences. Thus, even in times ofprosperity (in fact, precisely in those times) it is wise to generate some forms of safety net. We believe thatadvances in finance have given us the tools to provide such insurance, and we should focus onimplementing these advances rather than attempting to expand government or attempting to shut downmarkets. Hopefully, the world will do better in the face of crisis than it did after 1913.

ECO/WKP(2000)38
36
Table 1. Evolution of the different indicators of financial development
Deposits to GDP Stock market to GDP # companies to pop. Equity issues toGFCF
Wholesample
Constantsample
Wholesample
Constantsample
Wholesample
Constantsample
Wholesample
Constantsample
N N=19 N N=7 N N=9 N N=9
1913 0.41 22 0.46 0.56 20 0.34 27.10 21 20.99 0.12 12 0.151929 0.39 21 0.41 0.60 9 0.46 25.19 13 25.05 0.35 15 0.331938 0.44 21 0.47 0.65 11 0.48 28.01 13 27.44 0.13 12 0.121950 0.32 22 0.34 0.29 13 0.14 37.59 15 24.36 0.06 10 0.031960 0.30 22 0.32 0.46 17 0.31 32.56 18 22.53 0.06 17 0.051970 0.35 22 0.38 0.55 17 0.22 22.74 18 19.00 0.06 16 0.011980 0.40 22 0.43 0.25 21 0.17 23.12 22 18.90 0.03 19 0.031990 0.59 21 0.58 0.57 21 0.53 21.13 22 22.94 0.05 17 0.051999 0.58 22 0.62 0.97 23 0.96 25.31 23 27.08 0.13 21 0.19
Note: The first two columns are cross-country averages of the ratio of commercial and savings bank deposits toGDP. The first column is an average across all the observations available, the second only across thecountries for which we have observations throughout. Similarly, the third and fourth columns are cross-country averages of the ratio of the amount of funds raised through public equity offerings (both initial publicofferings and seasoned equity issues) by domestic companies to gross fixed capital formation. Columns fiveand six are cross-country averages of the ratio of the amount of funds raised to gross domestic product.Columns seven and eight are cross-country averages of the ratio of number of domestic companies whoseequity is publicly traded in a domestic stock exchange to million inhabitants.
Source: See Appendix (to be provided).
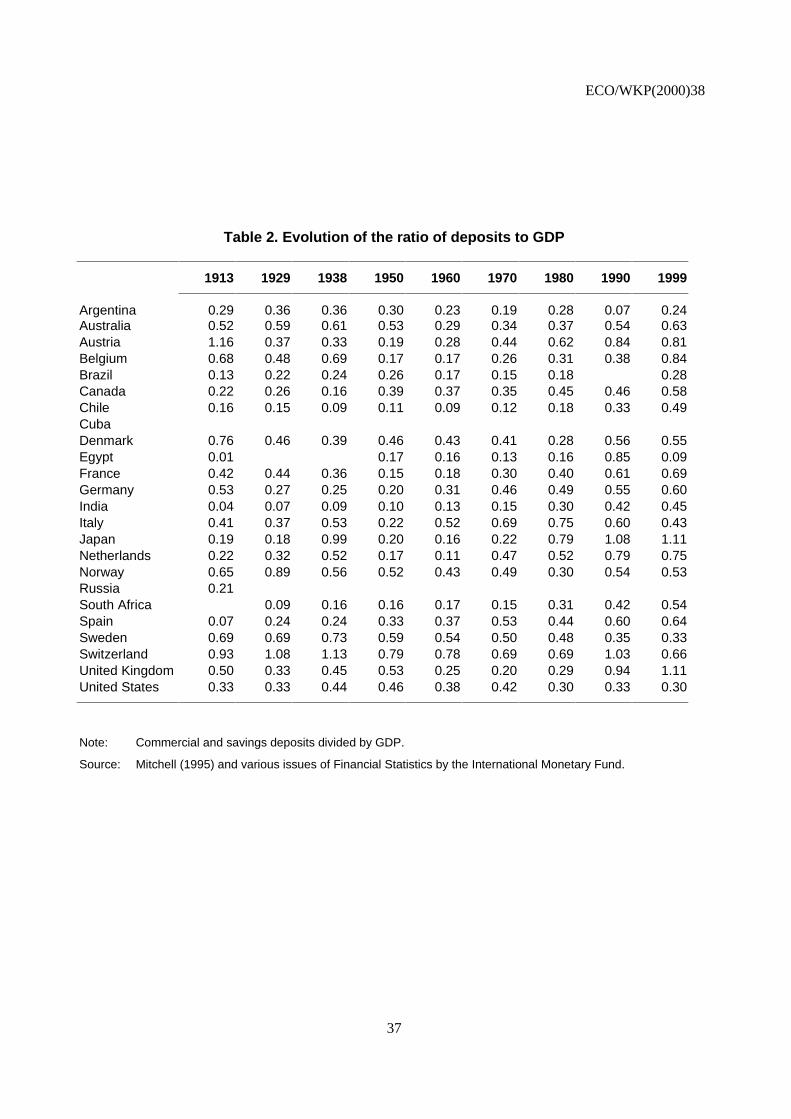
ECO/WKP(2000)38
37
Table 2. Evolution of the ratio of deposits to GDP
1913 1929 1938 1950 1960 1970 1980 1990 1999
Argentina 0.29 0.36 0.36 0.30 0.23 0.19 0.28 0.07 0.24Australia 0.52 0.59 0.61 0.53 0.29 0.34 0.37 0.54 0.63Austria 1.16 0.37 0.33 0.19 0.28 0.44 0.62 0.84 0.81Belgium 0.68 0.48 0.69 0.17 0.17 0.26 0.31 0.38 0.84Brazil 0.13 0.22 0.24 0.26 0.17 0.15 0.18 0.28Canada 0.22 0.26 0.16 0.39 0.37 0.35 0.45 0.46 0.58Chile 0.16 0.15 0.09 0.11 0.09 0.12 0.18 0.33 0.49CubaDenmark 0.76 0.46 0.39 0.46 0.43 0.41 0.28 0.56 0.55Egypt 0.01 0.17 0.16 0.13 0.16 0.85 0.09France 0.42 0.44 0.36 0.15 0.18 0.30 0.40 0.61 0.69Germany 0.53 0.27 0.25 0.20 0.31 0.46 0.49 0.55 0.60India 0.04 0.07 0.09 0.10 0.13 0.15 0.30 0.42 0.45Italy 0.41 0.37 0.53 0.22 0.52 0.69 0.75 0.60 0.43Japan 0.19 0.18 0.99 0.20 0.16 0.22 0.79 1.08 1.11Netherlands 0.22 0.32 0.52 0.17 0.11 0.47 0.52 0.79 0.75Norway 0.65 0.89 0.56 0.52 0.43 0.49 0.30 0.54 0.53Russia 0.21South Africa 0.09 0.16 0.16 0.17 0.15 0.31 0.42 0.54Spain 0.07 0.24 0.24 0.33 0.37 0.53 0.44 0.60 0.64Sweden 0.69 0.69 0.73 0.59 0.54 0.50 0.48 0.35 0.33Switzerland 0.93 1.08 1.13 0.79 0.78 0.69 0.69 1.03 0.66United Kingdom 0.50 0.33 0.45 0.53 0.25 0.20 0.29 0.94 1.11United States 0.33 0.33 0.44 0.46 0.38 0.42 0.30 0.33 0.30
Note: Commercial and savings deposits divided by GDP.
Source: Mitchell (1995) and various issues of Financial Statistics by the International Monetary Fund.

ECO/WKP(2000)38
38
Table 3. Evolution of Fraction of Gross Fixed Capital Formation Raised via Equity
1913 1929 1938 1950 1960 1970 1980 1990 1999
Argentina 0.01 0.01 100.39 0.02Australia 0.13 0.09 0.04 0.05 0.05 0.08 0.15Austria 0.07 0.03 0.07 0.00 0.07 0.03Belgium 0.23 0.85 0.03 0.09 0.08 0.03 0.01 0.06Brazil 0.20 0.19 0.19 0.06 0.01 0.27Canada 1.34 0.02 0.03 0.03 0.01 0.04 0.01 0.07Chile 0.00 0.01CubaDenmark 0.03 0.01 0.01 0.07 0.09Egypt 0.31France 0.14 0.26 0.03 0.05 0.05 0.04 0.06 0.02 0.12Germany 0.07 0.17 0.06 0.00 0.04 0.02 0.01 0.04 0.06India 0.00 0.00 0.08Italy 0.07 0.26 0.03 0.02 0.08 0.02 0.04 0.04 0.12Japan 0.08 0.13 0.75 0.15 0.03 0.01 24.78 0.08Netherlands 0.38 0.61 0.45 0.02 0.02 0.00 0.01 0.10 0.67Norway 0.00 0.05 0.01 0.04 0.06Russia 0.17South Africa 0.33 0.08 0.10 0.14Spain 0.01 0.33 0.08 0.11 0.07 0.03 0.06 0.10Sweden 0.08 0.34 0.06 0.01 0.03 0.00 0.00 0.03 0.10Switzerland 0.03 0.02 0.02United Kingdom 0.14 0.35 0.09 0.08 0.09 0.01 0.04 0.06 0.09United States 0.04 0.38 0.01 0.02 0.07 0.04 0.04 0.12
Note: Amount of funds raised through public equity offerings (both initial public offerings and seasoned equityissues) by domestic companies divided by gross fixed capital formation.
Source: See Appendix (to be provided).
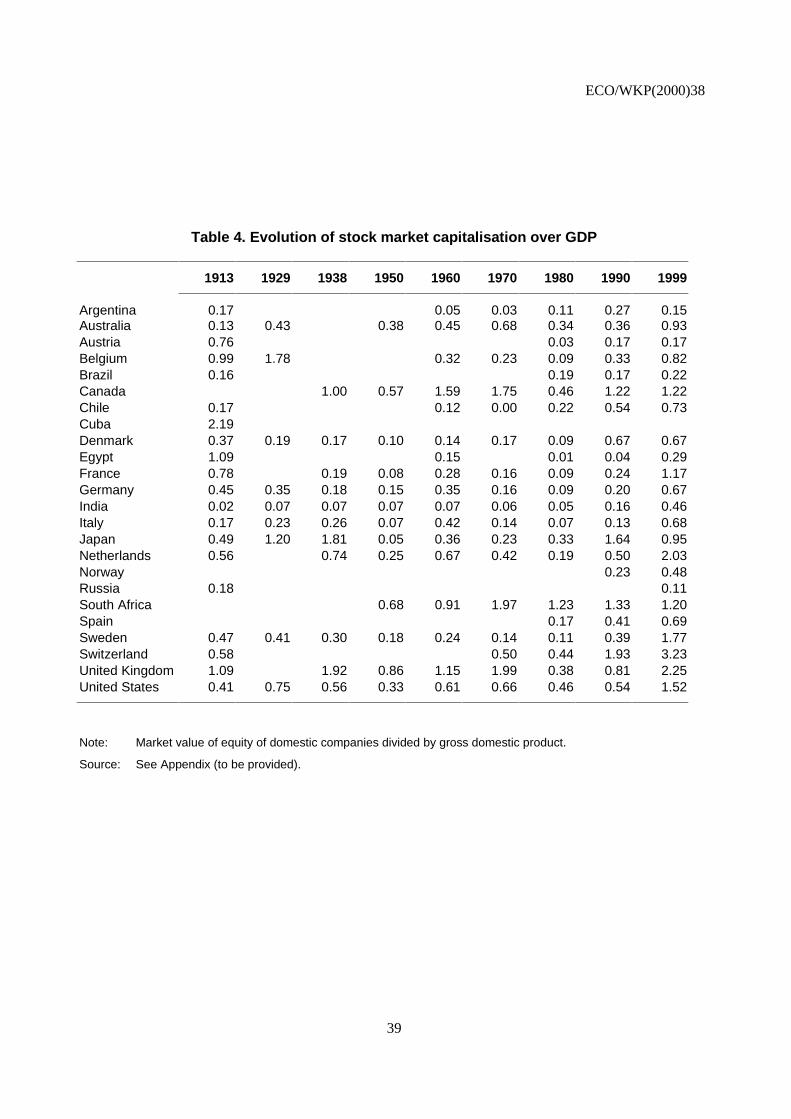
ECO/WKP(2000)38
39
Table 4. Evolution of stock market capitalisation over GDP
1913 1929 1938 1950 1960 1970 1980 1990 1999
Argentina 0.17 0.05 0.03 0.11 0.27 0.15Australia 0.13 0.43 0.38 0.45 0.68 0.34 0.36 0.93Austria 0.76 0.03 0.17 0.17Belgium 0.99 1.78 0.32 0.23 0.09 0.33 0.82Brazil 0.16 0.19 0.17 0.22Canada 1.00 0.57 1.59 1.75 0.46 1.22 1.22Chile 0.17 0.12 0.00 0.22 0.54 0.73Cuba 2.19Denmark 0.37 0.19 0.17 0.10 0.14 0.17 0.09 0.67 0.67Egypt 1.09 0.15 0.01 0.04 0.29France 0.78 0.19 0.08 0.28 0.16 0.09 0.24 1.17Germany 0.45 0.35 0.18 0.15 0.35 0.16 0.09 0.20 0.67India 0.02 0.07 0.07 0.07 0.07 0.06 0.05 0.16 0.46Italy 0.17 0.23 0.26 0.07 0.42 0.14 0.07 0.13 0.68Japan 0.49 1.20 1.81 0.05 0.36 0.23 0.33 1.64 0.95Netherlands 0.56 0.74 0.25 0.67 0.42 0.19 0.50 2.03Norway 0.23 0.48Russia 0.18 0.11South Africa 0.68 0.91 1.97 1.23 1.33 1.20Spain 0.17 0.41 0.69Sweden 0.47 0.41 0.30 0.18 0.24 0.14 0.11 0.39 1.77Switzerland 0.58 0.50 0.44 1.93 3.23United Kingdom 1.09 1.92 0.86 1.15 1.99 0.38 0.81 2.25United States 0.41 0.75 0.56 0.33 0.61 0.66 0.46 0.54 1.52
Note: Market value of equity of domestic companies divided by gross domestic product.
Source: See Appendix (to be provided).

ECO/WKP(2000)38
40
Table 5. Evolution of number of listed companies per million people
1913 1929 1938 1950 1960 1970 1980 1990 1999
Argentina 15.29 26.78 15.58 9.85 5.54 3.63Australia 67.62 76.92 84.88 122.15 93.68 68.50 63.72 65.17Austria 39.10 42.64 30.30 16.38 13.43 12.16 8.80 12.58 12.13Belgium 108.66 55.09 42.60 38.39 22.85 18.50 14.33Brazil 12.43 9.85 5.17 4.32 4.06 3.86 3.60Canada 66.61 62.43 55.20 50.51 43.14 111.32Chile 20.78 44.52 38.72 20.82 16.32 19.37Cuba 12.69Denmark 38.22 54.86 85.25 81.28 75.75 52.14 42.54 50.18 44.80Egypt 16.58 13.44 10.58 1.76 14.02 11.01 13.71France 13.22 0.00 24.57 28.61 20.36 16.98 14.74 10.19 15.75Germany 15.80 12.52 10.91 13.22 11.33 9.07 7.46 6.53 11.09India 0.82 1.81 2.59 3.13 3.11 7.31 6.48Italy 6.32 6.40 3.11 2.70 2.79 2.46 2.36 3.82 4.54Japan 7.53 16.65 19.48 9.15 8.35 15.19 14.80 16.76 20.00Netherlands 63.11 21.42 15.95 15.12 17.39 15.14Norway 33.10 49.02 54.50 58.19 52.44 39.44 31.07 26.41 56.77Russia 2.02 0.81South Africa 69.05 60.93 51.39 42.48 20.75 15.86Spain 25.20 10.96 22.25Sweden 20.64 16.36 14.93 12.83 14.04 13.18 12.39 14.14 31.46Switzerland 24.35 20.06 21.95 18.53 18.28 20.74 27.56 49.61 34.01United Kingdom 47.06 47.22 29.63 31.11United States 3.84 6.92 6.52 6.94 6.33 6.59 23.11 26.41 28.88
Note: Number of domestic companies whose equity is publicly traded in a domestic stock exchange divided bymillion inhabitants.
Source: See Appendix (to be provided).
ECO/WKP(2000)38
41
Table 6. Issues to GDP in 1912
a. Summary statistics
Mean StandardDeviation
Minimum Maximum Observations
Issues to GDP in 1912 0.022 0.017 0.002 0.055 19
Per capitaIndustrialisation
50 36.44 6 126 18
Openness (Tradevolume/GDP)
0.60 0.58 0.006 2.6 19
Tariffs 11.48 7.07 0.4 29.5 17
Interaction of percapita industrialisationand openness
30.5 32.5 0.06 118.67 18
b. Pair-wise correlations between variables (significance in parentheses)
Issues to GDPin 1912
Per capitaindustrialisation
Openness(Trade
volume/GDP)
Tariffs
Per capitaindustrialisation
0.43
(0.07)
Openness (Tradevolume/GDP)
0.33
(0.17)
0.04
(0.87)
Tariffs -0.28
(0.28)
-0.05
(0.85)
-0.52
(0.03)
Interaction of percapita industrialisationand openness
0.69
(0.00)
0.55
(0.02)
0.71
(0.001)
-0.37
(0.15)

ECO/WKP(2000)38
42
c. OLS regression for cross-section of 18 countries in 1912-13:dependent variable issues to GDP
(i) (ii) (iii) (iv) (v)
Per capitaindustrialisation
0.184*
(0.096)
0.03
(0.09)
-0.006
(0.11)
0.51**
(0.22)
0.41***
(0.1)
Interaction of percapita industrialisationand openness
0.3***
(0.1)
0.39**
(0.15)
Interaction of percapita industrialisationand tariffs
-0.026*
(0.014)
Interaction of percapita industrialisationand common lawindicator
-0.3***
(0.09)
Adjusted R2 0.14 0.41 0.39 -0.07 0.46
Observations 18 18 18 17 18
Note: Issues to GDP is the sum of equity and bond issues by domestic firms in 1912. Per capita industrialisation isthe index of industrialisation for that country in 1913 as computed by Bairoch (1982). Openness is the sumof exports and imports of goods in 1913 obtained from the League of Nations Yearbook divided by GDP in1913. Tariffs are import duties as a percentage of special total imports (1909-1913) obtained from Bairoch(1989). Common Law indicator is 1 if the country is classified as having a Common Law system. Allcoefficient estimates and standard errors are multiplied by 1000. Standard errors are in parentheses.Columns (iii) and (iv) contain two-stage least squares estimates. (*) indicates significance at the 10 per centlevel, (**) at the 5 per cent level and (***) at the 1 per cent level.

ECO/WKP(2000)38
43
Table 7. OLS regression for cross-section of countries in 1998-99
(i) (ii) (iii)
Log per capita GDP -0.067*
(0.037)
-0.04
(0.030)
0.011
(0.030)
Interaction of log percapita GDP andopenness in 1913
0.019***
(0.04)
Interaction of log percapita GDP andopenness in 1998
0.100***
(0.029)
Common law indicator 0.01
(0.07)
Adjusted R2 0.58 0.21 -0.05
Observations 16 39 38
Note: The dependent variable is the ratio of equity issues to gross fixed capital formation averaged over 1997-99.Log per capita gross domestic product is in dollars. Openness in 1913 is the sum of exports and imports ofgoods in 1913 obtained from the League of Nations Yearbook divided by GDP in 1913. Openness in 1998 isthe sum of exports and imports of goods in 1998 divided by GDP in 1998. Common Law indicator is 1 if thecountry is classified as having a Common Law system. Standard errors are in parentheses. (*) indicatessignificance at the 10 per cent level, (**) at the 5 per cent level and (***) at the 1 per cent level.

ECO/WKP(2000)38
44
Issu
es to G
DP
in 1
912
Figure 1: Issues in 1913 vs industrializationPer capita Industrialization
0 50 100 150
0
.02
.04
.06
Austria
Belgium
Bulgaria
CanadaDenmark
France
Germany
Italy
Japan
NetherlaNorway
Russia
SouthAfrSpain
Sweden
Switzerl
UK
USA
Issu
es to G
DP
in 1
912
Figure 2: Issues in 1913 vs industrialization * opennessInteraction Ind*Open
0 50 100 150
0
.02
.04
.06
Austria
Belgium
Bulgaria
CanadaDenmark
France
Germany
Italy
Japan
NetherlaNorway
Russia
SouthAfrSpain
Sweden
Switzerl
UK
USA
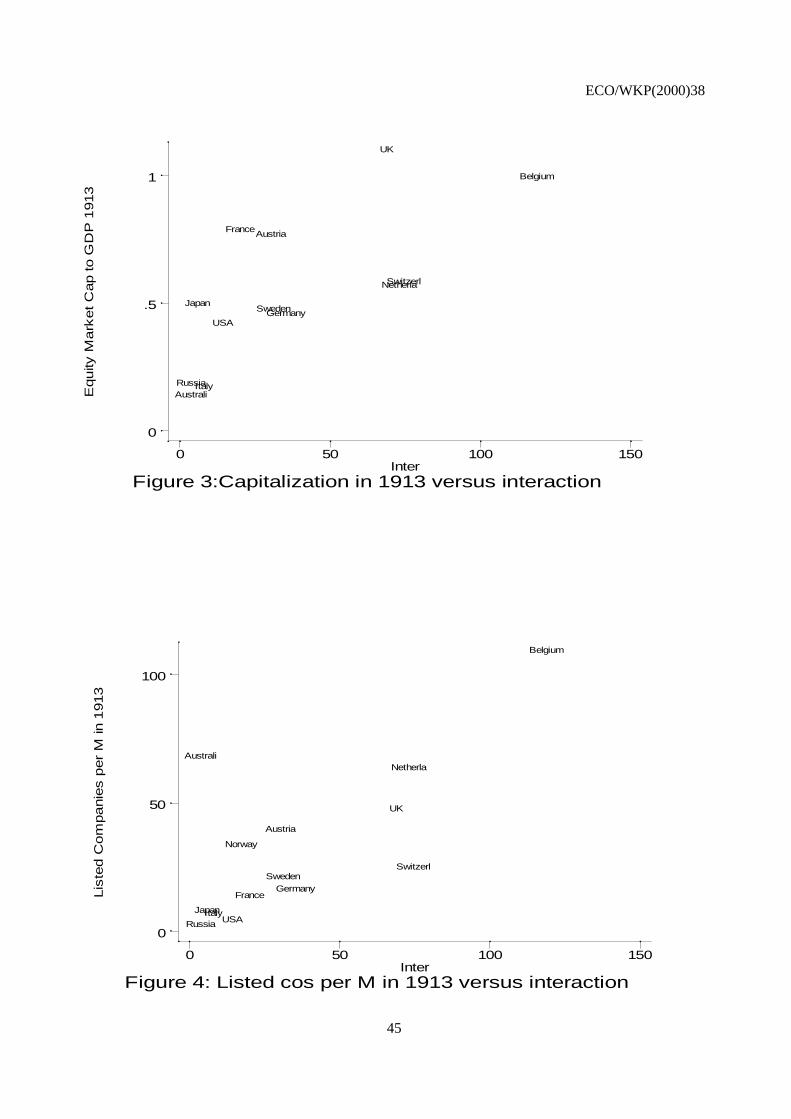
ECO/WKP(2000)38
45
Equity
Mark
et C
ap to G
DP
1913
Figure 3:Capitalization in 1913 versus interactionInter
0 50 100 150
0
.5
1
Australi
Austria
Belgium
France
Germany
Italy
Japan
Netherla
Russia
Sweden
Switzerl
UK
USA
Lis
ted C
om
panie
s p
er
M in
1913
Figure 4: Listed cos per M in 1913 versus interactionInter
0 50 100 150
0
50
100
Australi
Austria
Belgium
FranceGermany
ItalyJapan
Netherla
Norway
Russia
SwedenSwitzerl
UK
USA

ECO/WKP(2000)38
46
issu
ce
ove
r G
FC
F 9
7-9
9
Figure 5: Equity Issues vs. percap gdp*openness 1913Per Cap GDP 1998 * Openness 1998
0 2 4
0
.5
1
Argentin
Australi
Austria Belgium
BrazilCanada
ChileDenmark
FranceGermany
Greece
ItalyJapan
Netherla
NorwayPortugal
SouthAfr
SpainSweden
SwitzerlTurkey
UK
USA
Finland
Indonesi
Iran
Ireland
IsraelKorea
Luxembou
Malaysia
Malta
MexicoNewZealaPeru PhilippiSriLanka
Thailand
Philippi
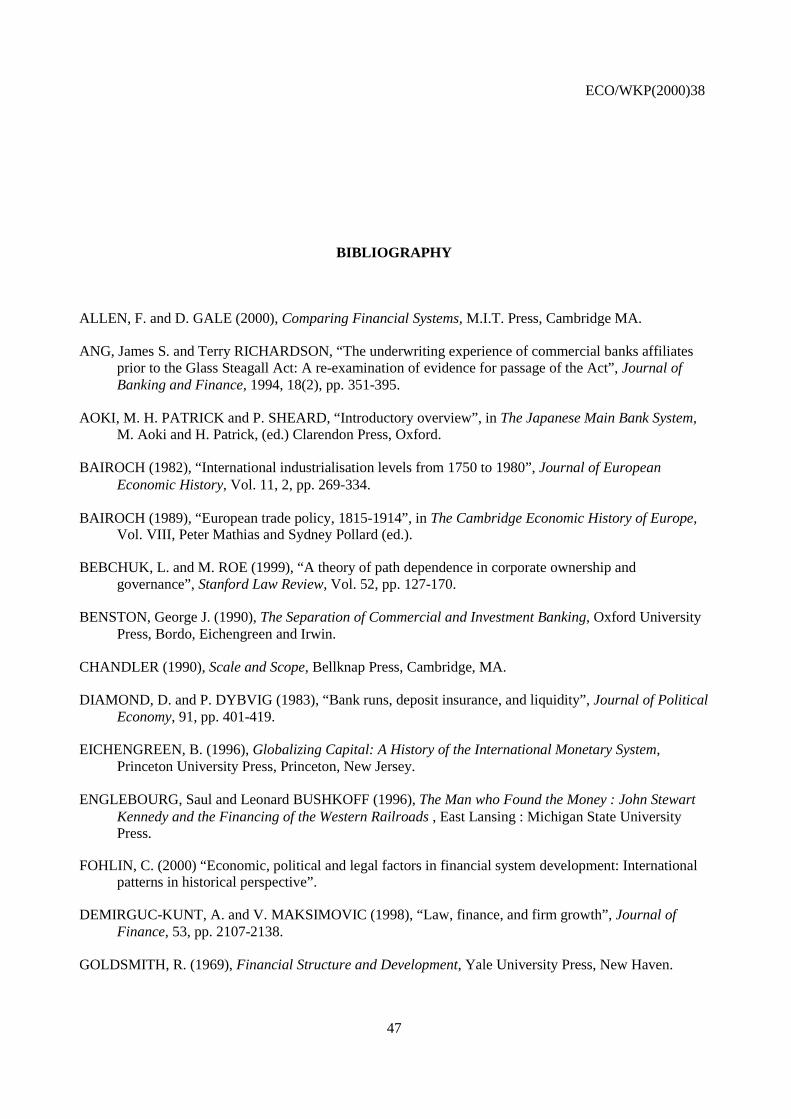
ECO/WKP(2000)38
47
BIBLIOGRAPHY
ALLEN, F. and D. GALE (2000), Comparing Financial Systems, M.I.T. Press, Cambridge MA.
ANG, James S. and Terry RICHARDSON, “The underwriting experience of commercial banks affiliatesprior to the Glass Steagall Act: A re-examination of evidence for passage of the Act”, Journal ofBanking and Finance, 1994, 18(2), pp. 351-395.
AOKI, M. H. PATRICK and P. SHEARD, “Introductory overview”, in The Japanese Main Bank System,M. Aoki and H. Patrick, (ed.) Clarendon Press, Oxford.
BAIROCH (1982), “International industrialisation levels from 1750 to 1980”, Journal of EuropeanEconomic History, Vol. 11, 2, pp. 269-334.
BAIROCH (1989), “European trade policy, 1815-1914”, in The Cambridge Economic History of Europe,Vol. VIII, Peter Mathias and Sydney Pollard (ed.).
BEBCHUK, L. and M. ROE (1999), “A theory of path dependence in corporate ownership andgovernance”, Stanford Law Review, Vol. 52, pp. 127-170.
BENSTON, George J. (1990), The Separation of Commercial and Investment Banking, Oxford UniversityPress, Bordo, Eichengreen and Irwin.
CHANDLER (1990), Scale and Scope, Bellknap Press, Cambridge, MA.
DIAMOND, D. and P. DYBVIG (1983), “Bank runs, deposit insurance, and liquidity”, Journal of PoliticalEconomy, 91, pp. 401-419.
EICHENGREEN, B. (1996), Globalizing Capital: A History of the International Monetary System,Princeton University Press, Princeton, New Jersey.
ENGLEBOURG, Saul and Leonard BUSHKOFF (1996), The Man who Found the Money : John StewartKennedy and the Financing of the Western Railroads , East Lansing : Michigan State UniversityPress.
FOHLIN, C. (2000) “Economic, political and legal factors in financial system development: Internationalpatterns in historical perspective”.
DEMIRGUC-KUNT, A. and V. MAKSIMOVIC (1998), “Law, finance, and firm growth”, Journal ofFinance, 53, pp. 2107-2138.
GOLDSMITH, R. (1969), Financial Structure and Development, Yale University Press, New Haven.
ECO/WKP(2000)38
48
GOUREVITCH, Peter (1986), Politics in Hard Times: Comparative Responses to International EconomicCrises, Cornell University Press, Ithaca.
GREEN, E. (1992), “The influence of the city over British economic policy: 1880-1960”, in Finance andFinanciers in European History, 1880-1960, Youssef Cassis (ed.), Cambridge University Press,New York.
HELLEINER, E. (1994), “From Bretton Woods to global finance: A world turned upside down” inR. Stubbs and G. Underhill (ed.), Political Economy and the Changing Global Order, Toronto.
HOSHI, T. and A. KASHYAP (1998), “The genesis of the Japanese financial system”, Chapter 2 inforthcoming book.
JAYARATNE, Jith and Philip E. STRAHAN (1996), “The finance-growth nexus: Evidence from bankbranch deregulation”, Quarterly Journal of Economics, CXI, pp. 639-671.
JENSEN, M. (1991), “Corporate control and the politics of finance”, Continental Bank Journal of AppliedCorporate Finance.
KENNEDY, David (1999), Freedom from Fear: The American People in Depression and War, 1929-1945,The Oxford History of the United States, Oxford University Press, New York.
KING, R. and R. LEVINE (1993), “Finance and growth: Schumpeter might be right”, The QuarterlyJournal of Economics, Vol. CVIII, No. 3, pp. 681-737.
KROSZNER, R. and R. RAJAN (19..), “Is the Glass Steagall Act justified? A study of the US experiencewith universal banking before 1933”, American Economic Review 84, pp. 810-832.
KUKIES, Jorg (2000), “The effect of introducing a new stock exchange on the IPO process”, mimeo,University of Chicago.
LA PORTA, R, Florencio LOPEZ-DE-SILANES, Andrei SHLEIFER, and Robert VISHNY (1997), “Thelegal determinants of external finance”, Journal of Finance, 52.
LA PORTA, R., F. LOPEZ-DE-SILANES, A. SHLEIFER and R. VISHNY (1998), “Law and finance”,Journal of Political Economy, 106, pp. 1113-1155.
LAMOUREAUX, N. (1994), Insider Lending, National Bureau of Economic Research.
LEVINE, R. and S. ZERVOS (1998), “Stock markets, banks, and economic growth”, American EconomicReview, Vol. 88, no 3, pp. 537-558.
MAIER, Charles (1987), In Search of Stability, Cambridge University Press, Cambridge, England.
MAYER, Colin (1988), “New issues in corporate finance”, European Economic Review 32,pp. 1167-1189.
McNEILL, William (1982), The Pursuit of Power: Technology, Armed Force and Society since AD 1000,University of Chicago Press, Chicago.
ECO/WKP(2000)38
49
NORTH, D. and B. WEINGAST (1989), “The constitution of commitment: The evolution of institutionsgoverning public choice in seventeenth century England”, Journal of Economic History, Vol. 49, 4,pp. 803-831.
OLSON, M. (1965), The Logic of Collective Action, Harvard University Press, Cambridge, MA.
OLSON, M. (1982), The Rise and the Decline of Nations, Yale University Press, New Haven, CT.
O’ROURKE, Kevin and Jeffrey WILLIAMSON (1999), Globalization and History: The Evolution of aNineteenth Century Atlantic Economy, M.I.T. Press, Cambridge, MA.
PETERSEN, M. and R. RAJAN (1995), “The effect of credit market competition on lendingrelationships”, Quarterly Journal of Economics, Vol. 110, pp. 407-443.
POLANYI, K. (1944), The Great Transformation: The Political and Economic Origins of Our Time,Beacon Press, Boston.
PURI, M. (1993), “The long-term performance of bank underwritten security issues”, Journal of Bankingand Finance, 18, pp. 397-418.
RAJAN, R. and L. ZINGALES (1998a), “Financial dependence and growth”, The American EconomicReview, 88: pp. 559-586.
RAJAN, R. and L. ZINGALES (1998b), “Which capitalism? Lessons from the East Asia crisis”, Journalof Applied Corporate Finance.
RAJAN, R. and L. ZINGALES (1999), “The politics of financial fevelopment”, mimeo, University ofChicago.
ROBINSON, Joan (1952), “The generalization of the general theory”, in The Rate of Interest and OtherEssays, London, Macmillan, pp. 67-142.
RODRIK, D. (1997), Has Globalization Gone Too Far?, Institute for International Economics,Washington, DC.
RODRIK, D. (1998), “Why do more open economies have bigger governments? Journal of PoliticalEconomy, October.
ROE, M. (1994), Strong Managers and Weak Owners: The Political Roots of American CorporateFinance, Princeton University Press, Princeton, N.J.
ROE, M. (1999), “Political preconditions to separating ownership from corporate control”, mimeo,Columbia Law School.
ROGOWSKI, R. (1989), Commerce and Coalitions: How Trade Affects Domestic Political Arrangements,Princeton University Press, Princeton, N.J.
STIGLER, G. (1971), “The theory of economic regulation”, Bell Journal of Economics and ManagementScience, 2: pp. 3-21.
ECO/WKP(2000)38
50
SYLLA, Richard and George SMITH (1995), “Information and capital market regulation in Anglo-American finance”, in Anglo-American Financial Institutions, Bordo, Michael and Richard Sylla(eds.), Irwin Publishers, New York.
TERANISHI, Juro, “Loan syndication in war time Japan and the origins of the main bank system”, in TheJapanese Main Bank System, M. Aoki and H. Patrick, (eds.) Clarendon Press, Oxford.
TILLY, R. (1992), “An overview on the role of the large German banks up to 1914”, in Finance andFinanciers in European History, 1880-1960, Youssef Cassis (ed.), Cambridge University Press,New York.
VERDIER, Daniel (1999), “The origins of universal banking in the 19th century”, mimeo, EuropeanUniversity Institute.
WHITE, E. (1986), “Before the Glass-Steagall Act: An analysis of the investment banking activities ofnational banks”, Explorations in Economic History, 23, pp. 33-55.
ECO/WKP(2000)38
51
ECONOMICS DEPARTMENT
WORKING PAPERS
264. Trade and Growth: Still Disagreement about the Relationships(October 2000) Robert E. Baldwin
263. Growth Effects of Education and Social Capital in the OECD Countries(October) Jonathan Temple
262. Human Capital in Growth Regressions: How Much Difference Does Data Quality Make?(October 2000) Angel de la Fuente and Rafael Doménech
261. Raising the Speed Limit: US Economic Growth in the Information Age(October 2000) Dale W. Jorgenson and Kevin J. Stiroh
260. Summary of an Informal Workshop on the Causes of Economic Growth(October 2000) Jonathan Temple
259. Knowledge, Technology and Economic Growth: Recent Evidence from OECD Countries(October 2000) Andrea Bassanini, Stefano Scarpetta and Ignazio Visco
258. Average Effective Tax Rates on Capital, Labour and Consumption(October 2000) David Carey and Harry Tchilinguirian
257. The Health Care System in Poland(September 2000) Nathalie Girouard and Yutaka Imai
256. Public Expenditure Reform: The Health Care Sector in the United Kingdom(August 2000) Vincent Koen
255. Regulatory Reform in Road Freight and Retail Distribution(August 2000) Olivier Boylaud
254. Regulation, Market Structure and Performance in Air Passenger Transportation(August 2000) Rauf Gonenc and Giuseppe Nicoletti
253. Policy Interdependence during Economic Transition: the Case of Slovakia 1999-2000(June 2000) Joaquim Oliveira Martins and Tristan Price
252. E-Commerce: Impacts and Policy Challenges(June 2000) Jonathan Coppel
251. The Implementation and the Effects of Regulatory Reform: Past Experience and Current Issues(June 2000) Rauf Gonenc, Maria Maher and Giuseppe Nicoletti
250. The Concept, Policy Use and Measurement of Structural Unemployment: Estimating a Time Varying NAIRUacross 21 OECD Countries(June 2000) Pete Richardson, Laurence Boone, Claude Giorno, Mara Meacci, David Rae and David Turner
249. Options for Reforming the Spanish Tax System

ECO/WKP(2000)38
52
(June 2000) Isabelle Joumard and Aristomène Varoudakis
248. Economic Growth in the OECD Area: Recent Trends at the Aggregate and Sectoral Level(June 2000) Stefano Scarpetta, Andrea Bassanini, Dirk Pilat and Paul Schreyer
247. Economic Effects on the 1999 Turkish Earthquakes: an Interim Report(June 2000) Alexandra Bibbee, Rauf Gonenc, Scott Jacobs, Josef Konvitz and Robert Price
246. Policy Influences on Economic Growth in OECD Countries: an Evaluation of the Evidence(June 2000) Sanghoon Ahn and Philip Hemmings
245. The Tax System in the Czech Republic(May 2000) Chiara Bronchi and Andrew Burns
244. The Tax System in Norway: Past Reforms and Future Challenges(May 2000) Paul van den Noord
243. A Changing Financial Environment and the Implications for Monetary Policy(May 2000) Paul Mylonas, Sebastian Schich, Gert Wehinger
242. Carbon Emission Leakages: a General Equilibrium View(May 2000) Jean-Marc Burniaux and Joaquim Oliveira Martins
241. The Healthcare System in Hungary(April 2000) Eva Orosz and Andrew Burns
240. Comparing Semi-Structural Methods to Estimate Unobserved Variables: the HPMV and Kalman FiltersApproaches(April 2000) Laurence Boone
239. New Issues in Public Debt Management: Government Surpluses in Several OECD Countries, the CommonCurrency in Europe and Rapidly Rising Debt in Japan(April 2000) Paul Mylonas, Sebastian Schich, Thorsteinn Thorgeirsson and Gert Wehinger
238. Regulation, Industry Structure and Performance in the Electricity Supply Industry(April 2000) Faye Steiner
237. Regulation, Market Structure and Performance in Telecommunications(April 2000) Olivier Boylaud and Giuseppe Nicoletti
236. Predicting the Evolution and Effects of the Asia Crisis from the OECD Perspective(April 2000) Pete Richardson, Ignazio Visco and Claude Giorno
235. Modelling Manufacturing Export Volumes EquationsA System Estimation Approach(April 2000) Keiko Murata, David Turner, David Rae and Laurence Le Fouler
234. The Polish Tax Reform(March 2000) Patrick Lenain and Leszek Bartoszuk
233. The Tax System in Mexico: a Need for Strengthening the Revenue Raising Capacity(March 2000) Thomas Dalsgaard
232. EMU, the Euro and the European Policy Mix(February 2000) Jonathan Coppel, Martine Durand and Ignazio Visco